10,000 Matching Annotations
- Last 7 days
-
www.google.com www.google.com
-
-
www.technologyreview.com www.technologyreview.com
-
OpenClaw, like many other open-source tools, allows users to connect to different AI models via an application programming interface, or API. Within days of OpenClaw’s release, the team revealed that Kimi’s K2.5 had surpassed Claude Opus and became the most used AI model—by token count, meaning it was handling more total text processed across user prompts and model responses.
Wow, I had no idea that Kimi 2.5 had subbed in for Claude Opus so quickly.
-
-
www-jstor-org.libproxy.washu.edu www-jstor-org.libproxy.washu.edu
-
Sincemost US cities depended on property and income tax revenues to providemunicipal services and maintain infrastructure, this eroded municipalrevenues
And then people went out of work, white flight is a real bitch ya know.
-
The economic shockwaves created by these events helped producetwo recessions and the worst economic downturn since the Great De-pression.
Which the midwest felt disproportionately as their industry was outsourced
-
the demise of the New Deal order and rise of anew conservative/neoliberal order.1
Party realignment in black and black
-
-
-
people11 make things (texts, baskets, performances), people make relationships, people make culture.
very simple way of explaining how culture is constructed
-
constellation
use of word is discussed in class
term
-
It's interesting how you chose De Certeau to talk about rhetoric—not a lot ofpeople really think of him as a "rhetorician.
I didn't know this about De Certeau
-
as always-already rhetorical
term
-
to understand how the making of culture occurs through everyday practice instead of through official,sanctioned dominant acts of cultural installation (xiv).
i like this line
-
is to surface, recognize, extend and intervene in how rhetoric scholars think about culture
Objective/aim/motive
-
scholars in rhet/comp rely on this object-oriented approach to cultures because itallows us to select "exemplars" from specific oppressed cultural traditions as a way of feeling good about howinclusive our discipline has become.
this feels like a call out
-
"object-oriented,"8 we mean scholarship that identifies "culture" as an object of inquiry, one that can be isolated fromother human, economic, political, geographical, historical frameworks that exist around and within it.
Object Oriented Definition
-
anthropology, sociology, cultural studies andfrom the borrowings that folks in rhet/comp studies have initiated from these inter/disciplines.
I like that they highlight the particular areas
-
as a static object. T
I can agree with this. Comes from my past reading on culture
-
a partialconstruction of our definition of the practice of cultural rhetorics.
their aim/objective
-
is an important one for the discipline ofrhet/comp, it is not the model that guides us.
them making clear distinctions
-
r several reasons.
reasoning behind the style of the piece
-
the kind of place where the audience is asked to participate inthe performance
LOVE!
-
as themselves, representing their ownexperiences with cultural rhetorics practice/methodology apart from the collective
Its good to establish this early
-
, the questions that s/he asks have helped us think more deeply, more persistently, and more broadlyabout our collective work and its relationship to the discipline of rhetoric and composition.
I wonder if this is a fictional character. someone they have created.
-
name using one of the original languages of the place6 where much of this article waswritten,
a way of (kinda) honoring the space that they are in
-
—the kindAristotle liked best
nice
-
working through ideas for the article, yes, but also working throughour relationships with one another; renewing familiar patterns, starting new ones.
This paints a nice collaborative picture
-
and sage theentire house before I head into town to bring back local supplies—smoked whitefish and pasties.
cultural practices
-
This is Odawa territory
?
-
a writing retreat to finish this article.
I wonder how much they had written at the point MALEA wrote this prolouge
-
-
openclassrooms.com openclassrooms.com
-
liens
a { color: black; }
-
-
bookshelf.vitalsource.com bookshelf.vitalsource.com
-
Lasting relationships with diverse individuals in a learning community—peers, faculty, and staff
My leadership qualities are more of resilience and team appreciation which relate to Lightning Mcqueen’s leadership qualities because he learns to work in a team and keep pushing through even when he just wants to get the end result and not do the work.
To develop my leadership qualities I should talk to new people, maybe even join a group with the same interests as me, and keep pushing to ask for help with the struggles of college.
The greatest barrier I have in accomplishing this is fear. I get scared to fail, so I hold back and don’t let opportunities succeed as well as I could which is something I am trying to work on.
-
-
-
“Fordism”–that was distinc-tive to the mid-twentieth century upper Midwest, but which was widely mim-icked around the world (Gramsci 1989).
Work, stability.
-
butdue to disconnection between communities and their party representatives
Media mobilizes real grievences
-
More importantly, the inevitable transformation and decline of place will shapethe values of those living there, just as the initial development of industrial soci-ety once did
Getting ignored dismantled the institutions that kept the midwest democratic and now they are revolting
-
kleptocracy
System where powerful steal resources
-
Organizations, institutions, networks and associations, in turn, poten-tially shape these into political subjectivities and moral values which can beinstrumentalized and expressed in politics, development strategies, and culture,which we can summarize as a ‘communal ethos’
Individuals feeling is shaped by the institutions in their community
-
Americans and from mostAmerican communities.
Which are really situated in the homogeneous midwest
-
not the economic protections that would facilitatebroader social inclusion.
Which is in part a coastal elitist thing
-
In Detroit alone the decline in black voter turnout wasseveral times the margin of Clinton’s loss in Michigan.
Not inspired/ felt supported by clinton
-
thefew rural counties that were not already solidly Republican and (2) post-industrial counties (see Figure II)
Post-industrial is the midwest
-
. For the first time in the history of thetwo parties, Republicans did better among poor white voters than among afflu-ent whites
Saying this was a long time coming but I have trouble buying that it was not also connected to trump
-
this is a notable contrast to the ethnona-tionalist and protectionist candidates who preceded him
who lost
-
Today, the Democratic Party is a party of professionals, minoritiesand the New Economy
As opposed to the once blue collar worker
-
The counties Trump won – over 2,000 more in number –accounted for a much smaller share of GDP
Left behind
-
but what is more recent isthe collapse of the institutions that had been built to incorporate industrialworkers and their communities into the mainstream political life of the country,including governance arrangements, work and consumption arrangements, civicassociations, social policies, party organizations, and labour unions
Why now?
-
to explain the largely enthusiastic support for Obama in thesesame counties
How did it shift so quickly in Obamas term though
-
This way of thinkinghas set up an unproductive discussion of the relative explanatory power ofrace and class.
Which matters much more at the individual level
-
But the collapse of the regional economy has alsoresulted in the collapse of the institutions and organizations that provided thoseconnections.
But the dems might have been oblivious
-
with the plight ofthe industrial Midwes
What is that plight I hope we learn
-
Clinton lost the election because of radicaldeclines in support from within the Democratic coalitio
Same with Harris
-
Due to this, the party pursued poli-cies that would magnify the region’s difficulties rather than alleviate its cir-cumstances
Which pushed them towards republicans
-
From thisperspective we can see that the active dismantling of the Fordist social orderset the region on a divergent path from the rest of the country
what is that
-
revanchism
Seeking to retaliate
-
This paper argues that the election of Donald Trump is the product of a con-fluence of historical factors rather than the distinctive appeal of the victorhimself. B
Ready to buy that
-
-
Local file Local file
-
the first six cholera pandemics
cholera HAS been a troubling thing worldwide
-
the conflicts that arise over competing theoretical interpretations.
conflicts between therohetical perspectives arise from the parts of theory that are left out or what is considered irrelevant
-
-
www.purepen.com www.purepen.com
-
赍发
sponsor
-
小二
a common way to call an inn or restaurant servant
-
-
www.tomshardware.com www.tomshardware.com
-
Meanwhile, under China's 'Eastern Data, Western Computing' initiative in the early 2020s, numerous startups constructed large AI and cloud data centers across western regions of China, where electricity costs are lower, with the goal of serving demand from economically stronger eastern provinces. While the strategy reduced power expenses, it turned out that longer distances increased latency and made these facilities less attractive for many latency-sensitive applications, which limited actual usage
Is this what happened with them? They got,built and weren’t used as much in the end?
-
-
www.jstor.org www.jstor.org
-
highly centralized communistor workers' party;
One party system sustained communism
-
-
www.americanyawp.com www.americanyawp.com
-
Abigail and John Adams Converse on Women’s Rights, 1776
- It Is an Early Call for Women’s Rights Abigail’s request to “remember the ladies” is one of the earliest and clearest arguments for women’s legal protections in American history. She challenges male authority in marriage and government.
- It Shows Women’s Political Awareness. Her letter shows that women were thinking critically about government and justice even if they were excluded from formal power.
- It Exposes Gender Roles in the 18th Century John’s joking tone reflects common attitudes of the time, that women’s demands were not to be taken seriously. His response helps historians understand how deeply rooted patriarchal systems were.
-
-
elgatoylacaja.com elgatoylacaja.com
-
Roganovich, R. C. (2025). Prefacio | El archipiélago. https://elgatoylacaja.com/libros/el-archipielago/prefacio
-
-
www.americanyawp.com www.americanyawp.com
-
Fifthly, They are to have a Governor and Council appointed from among themselves, to see the Laws of the Assembly put in due execution; but the Governor is to rule but 3 years, and then learn to obey; also he hath no power to lay any Tax, or make or abrogate any Law, without the Consent of the Colony in their Assembly
Talking about freedom of choosing their government
-
-
www.washingtonpost.com www.washingtonpost.com
-
Without further federal commitments, 70,000 programs might close, wiping out 3.2 million slots and $9 billion in annual parent earnings,
Establishing what's at stake, showing that not passing the funding isn't a neutral act, it's harmful.
-
come up with a lot of money.
The main focus of the article will be about how much money can be put forward towards childcare
-
-
www.youtube.com www.youtube.com
-
Synthèse du Séminaire sur l'Enseignement Explicite : Des Coulisses à la Classe
Ce document de breffage synthétise les interventions du séminaire organisé par l'Université de Mons (UMons) et l'Institut d'administration scolaire.
Il détaille les fondements théoriques, les modalités pratiques et les outils de recherche liés à l'enseignement explicite, une approche pédagogique éprouvée pour favoriser l'équité et l'efficacité des systèmes éducatifs.
Résumé Exécutif
L'enseignement explicite (EE) est une approche pédagogique issue de l'observation de pratiques de classe efficaces, particulièrement dans les milieux défavorisés.
Son principe central est de « rendre visible » ce qui est invisible : les démarches cognitives de l'enseignant et les processus d'apprentissage des élèves.
Fondée sur le modèle PIC (Préparation, Interaction, Consolidation), cette méthode suit une progression rigoureuse : ouverture, modelage (« Je fais »), pratique guidée (« Nous faisons »), pratique autonome (« Tu fais ») et clôture.
Au-delà de la transmission des savoirs, l'EE s'applique également à la gestion des comportements et s'appuie sur une « vision professionnelle » que les outils technologiques, comme le suivi oculaire (eye-tracking), permettent désormais d'objectiver.
La formation des enseignants repose sur une collaboration étroite au sein d'une triade (stagiaire, maître de stage, superviseur) visant à transformer le novice en un praticien réflexif capable d'ajuster ses gestes professionnels aux besoins de ses élèves.
--------------------------------------------------------------------------------
1. Cadre de Référence et Principes Fondamentaux
L'intérêt de l'Université de Mons pour l'enseignement explicite s'inscrit dans une réflexion de vingt ans sur l'amélioration des systèmes éducatifs.
Objectifs de l'Éducation
• Équité et Efficacité : L'objectif est de réduire les écarts entre les élèves et d'élever la moyenne des résultats, tant sur le plan cognitif (instruction) que comportemental (éducation).
• Liberté et Responsabilité : Si la liberté d'enseignement est garantie, elle doit s'appuyer sur des choix documentés et éclairés par la recherche pour éviter les modes passagères.
• Libération du Déterminisme : L'école doit permettre à chaque individu de se libérer des déterminismes sociaux dont il n'est pas responsable.
Le Modèle de l'Enseignant Efficace
L'enseignement est comparé à la médecine ou au sport de haut niveau : c'est un métier complexe qui repose sur des savoir-faire qui ne sont pas innés, mais qui s'apprennent et se développent par l'accumulation de connaissances et la pratique.
--------------------------------------------------------------------------------
2. Le Modèle de l'Enseignement Explicite
L'enseignement explicite n'est pas une théorie abstraite mais une approche issue de recherches corrélationnelles débutées dans les années 70.
La Structure PIC (Préparation, Interaction, Consolidation)
• Préparation (Planification) : Travail de l'enseignant en amont de la classe.
• Interaction : Le cœur de la leçon, décomposé en cinq étapes chronologiques.
• Consolidation : Automatisation des acquis et évaluation.
Les 5 Étapes de l'Interaction en Classe
| Étape | Rôle de l'Enseignant | Description Clé | | --- | --- | --- | | Ouverture | Présenter | Annonce des objectifs, du plan de cours et réactivation des connaissances préalables. | | Modelage | « Je fais » | L'enseignant met un « haut-parleur sur sa pensée » pour expliciter ses démarches à voix haute. | | Pratique Guidée | « Nous faisons » | Vérification constante de la compréhension. L'enseignant questionne les élèves jusqu'à obtenir 80 % de réussite. | | Pratique Autonome | « Tu fais » | L'élève travaille seul. L'enseignant circule pour apporter un support individualisé. | | Clôture | Objectiver | Synthèse de la leçon, métacognition et lien avec la leçon suivante. |
Caractère Itératif : Cette démarche n'est pas figée. Si la pratique guidée échoue, l'enseignant doit revenir au modelage. Elle permet ainsi une différenciation pédagogique réelle en fonction des besoins des élèves.
--------------------------------------------------------------------------------
3. Gestion de Classe et des Comportements
L'enseignement explicite considère que la gestion des apprentissages et la gestion de classe sont deux rouages indissociables : l'un ne peut fonctionner sans l'autre.
L'Objectivation de la Compréhension
L'enseignant doit rendre observable le cheminement de pensée des élèves. On distingue plusieurs types d'objectivations :
• Stéréotypée : « Ça va ? Vous avez compris ? » (Peu efficace car l'élève répond souvent par l'affirmative sans preuve).
• Spécifique : « Peux-tu reformuler avec tes propres mots ? » ou « Cite les caractéristiques de... ».
• Métacognitive : Questionner les étapes par lesquelles l'élève est passé pour trouver une réponse.
L'Enseignement Explicite des Comportements
Plutôt que de punir l'élève qui ne sait pas se comporter, on lui enseigne les attentes sociales.
1. Définir les valeurs : (ex: Respect, Responsabilité, Sécurité).
2. Traduire en comportements observables : Utiliser des formulations positives (ex: « Je marche calmement » au lieu de « Ne pas courir »).
3. Appliquer la démarche EE : Modelage du comportement attendu, pratique guidée et renforcement en contexte réel (classe, couloirs, réfectoire).
--------------------------------------------------------------------------------
4. Vision Professionnelle et Observation des Pratiques
L'expertise enseignante réside dans la capacité à balayer l'environnement, repérer les indices pertinents et raisonner avant d'agir.
Différences entre Novices et Experts (Apports de l'Eye-Tracking)
Grâce au suivi oculaire, la recherche à l'UMons a identifié des différences marquées dans l'observation d'une classe :
• Enseignants Experts / Formateurs :
◦ Focus prioritaire sur les élèves, notamment ceux à risque ou discrets.
◦ Balayage visuel dynamique et itératif (stratégies de « coup d'œil »).
◦ Raisonnement basé sur l'anticipation des conséquences et les cadres théoriques.
• Enseignants Novices / Futurs Enseignants :
◦ Focus excessif sur l'enseignant ou les éléments visuels saillants (bruit, mouvement).
◦ Attention portée uniquement aux élèves « hyper-participatifs » ou très perturbateurs.
◦ Difficulté à se détacher de la gestion disciplinaire immédiate.
Outils de Formation
• Micro-enseignement : Entraînement en milieu sécurisé devant ses pairs avant de faire face à de vrais élèves.
• Grille Miroir : Outil de codage des gestes professionnels permettant un feedback objectif basé sur la vidéo.
• Vidéos enrichies : Utilisation de prompts (indices visuels) pour orienter le regard du novice vers les zones importantes.
--------------------------------------------------------------------------------
5. La Triade de l'Accompagnement en Stage
Le développement du futur enseignant repose sur une interaction entre trois acteurs clés : le stagiaire, le maître de stage (terrain) et le superviseur (institution).
Le Dialogue Collaboratif
La recherche souligne l'importance de dépasser le simple échange « question-réponse » pour viser la co-construction.
• Style de Supervision : Les superviseurs doivent être capables de moduler leur style (directif ou non-directif) comme un musicien change de registre.
• Défis de la Collaboration : Le dialogue peut être freiné par la peur de l'évaluation ou par des visions discordantes entre l'université et le terrain.
• Objectif : Transformer le stage en un espace de réflexion où le stagiaire n'est pas un simple exécutant, mais un praticien capable d'analyser ses propres erreurs comme des leviers d'apprentissage.
--------------------------------------------------------------------------------
Conclusion
L'enseignement explicite est une approche pragmatique qui refuse l'opposition entre instruction et éducation.
En outillant les enseignants avec des gestes professionnels documentés et en développant leur vision professionnelle, ce modèle vise à instaurer une culture de la réussite où l'enseignant est pleinement responsable de la progression de chaque élève, tout en conservant sa liberté pédagogique au sein d'un cadre scientifique rigoureux.
Tags
Annotators
URL
-
-
www.biorxiv.org www.biorxiv.org
-
eLife Assessment
Stearns and Poletti present a technically impressive study that aims to uncover a deeper understanding of microsaccade function: their role in perceptual modulation and the associated temporal dynamics. The question is useful, and advances prior work by adding temporal granularity. However, the strength of the evidence is currently incomplete. Additional analysis is needed to control for the effects of endogenous attention and to demonstrate changes in perceptual performance.
-
Reviewer #1 (Public review):
Summary:
Using high-precision eyetracking, the authors measure foveolar sensitivity modulations before, during, and after instructed microsaccades to a centrally cued orientation stimulus.
Strengths:
The article is clearly written, and the stimulus presentation method is sophisticated and well-established. The data provide interesting insights that will be useful for comparisons between trans-saccadic and trans-microsaccadic sensitivity modulations.
Weaknesses:
Nonetheless, I have major concerns regarding the interpretation of the measured time courses (in particular, inconsistencies in distinguishing enhancement from suppression), the attempt to disentangle these effects from endogenous attention shifts, and the overstatement of the findings' novelty.
(1) Overstatement of novelty
The authors motivate their study by stating that "the temporal dynamics of these pre-microsaccadic modulations remain unknown" (l. 55-56). However, Shelchkova & Poletti (2020) already report a microsaccade-aligned sensitivity time course. I understand that the present study uses shorter target durations and thus provides a more resolved estimate. Nonetheless, a fairer characterization of the study's novelty would be that observers' discrimination performance is continuously measured across the pre-, intra-, and post-movement interval, within the same observers and experimental design. Relatedly, the authors state that it is unclear whether pre-microsaccadic sensitivity modulations reflect "suppression at the non-foveated location, enhancement at the microsaccade target, or both" (l. 70). Guzhang et al. (2024) examined the spatial spread of pre-microsaccadic sensitivity modulations by measuring performance at the PRL, the movement target, and several other equidistant locations. They report that "whereas fine spatial vision is enhanced at the microsaccade goal location, it drops at the very center of gaze". The current authors' reasoning seems to be that performances at locations that are neither the target nor the PRL may behave differently. Why would that be the case? If my understanding is correct, I would recommend incorporating these clarifications into the motivation paragraph, so that readers less familiar with the literature do not overestimate the novelty of the findings. Moreover, and related to point 3, I am unsure if the current analyses provide decisive evidence to distinguish enhancement from suppression, as claimed by the authors.
(2) Distinction from endogenous attention
To "rule out the possible influence of covert attention" (l. 232), the authors compute a cue-aligned in addition to the movement-aligned performance time course. A difference in alignment cannot rule out the influence of a certain mechanism; it can only dilute it. Just like endogenous attention may contribute to the movement-aligned time course, movement preparation will necessarily contribute to the cue-aligned time course, since these timelines are intrinsically correlated: as the trial progresses, observers will be in later and later stages of saccade preparation. For this and several additional reasons, an effect in the cue-aligned time course is in fact expected-and, in my view, clearly present (see below). As the authors themselves note, endogenous attention has been shown to operate within the foveola and should therefore be engaged in the present experiment in addition to movement-related attentional shifts (unless the authors believe that specific design features, e.g., stimulus timing, preclude its involvement?). Regardless of the theoretical considerations, the empirical data show a pronounced, near-linear increase in performance at the target location, with d′ doubling from approximately 1 to 2. Although the interaction between condition and time does not reach significance (p = 0.09), this result should not be taken as conclusive evidence against a plausible and perhaps expected contribution of endogenous attention. I suggest an additional analysis that could more directly address these issues. In previous work (Rolfs & Carrasco, 2012; Kroell & Rolfs, 2025; see Figure 3), the relative contributions of cue-alinged influences and pre-saccadic attention were disentangled by reweighting each data point according to its position on both the cue-locked and saccade-locked timelines. Applied to the present study, the authors could compute, for each cue-to-target offset bin, its proportional contribution to each pre-movement time bin. Microsaccade-locked sensitivities could then be reweighted based on these proportions. As a result, each movement-locked time bin would contain equal contributions from all cue-locked time bins, effectively isolating the effect of microsaccade preparation.
(3) Interpretation and analysis of the time course
(3.1) Discrimination before microsaccade onset<br /> In lines 151-153, the author state "While the enhancement at the target location did not reach significance relative to baseline, the impairment at the non-target location did", suggesting that pre-movement sensitivity advantages for information presented at the target location are due to a decrease in performance at the non-target location and not an enhancement at the target location per se. After analyzing the difference between the two locations, the authors state, "These results show that approximately 100 milliseconds before microsaccade onset, discrimination rapidly improved at the intended target location while decreasing at the non-target location." (l. 159-161). How is the statement that discrimination performance rapidly improved (which is repeated throughout the manuscript) justified by the results?
More generally, the authors may benefit from applying bootstrapping or permutation-based analyses to their data. Such approaches would, for example, allow direct comparisons between congruent and incongruent conditions at every individual time point in Figure 3B and may be more sensitive to temporally confined sensitivity variations while requiring fewer assumptions than analyses based on manually segregated temporal bins and aggregate measures. If enhancement at the target location does not reach significance even in these analyses, all corresponding statements should be removed throughout the manuscript. The term "enhancement" should then be rephrased as "detection advantage" or "relative performance benefit" to emphasize the contrast to enhancement effects classically associated with pre-saccadic attention shifts.
Relatedly, the authors state that pre-microsaccadic enhancement peaks around 70 ms before microsaccade onset, which is earlier than sensitivity enhancements preceding large-scale saccades that often increase monotonically up until movement onset. The authors suggest potential reasons for this in the Discussion, yet an additional one seems conceivable based on Figure 3B. Performances at both the cue-congruent and incongruent location decrease leading up to the movement, reaching values even below their early baselines around 100 ms and 25 ms before movement onset for the incongruent and congruent location, respectively. A spatially non-specific decline that drives sensitivities toward a common absolute minimum may thus dictate the time course of detection advantages. In other words, a spatially widespread decrease in foveolar sensitivity likely contributes to both "suppression" at the non-target location and the decrease in "enhancement" at the target location. If this general decrease is due to saccadic suppression, as the authors suggest, it appears to exert a much more pronounced influence on sensitivity modulations than it does before large-scale saccades (which is interesting). Are there other findings suggesting an increased magnitude of micro-saccadic (as compared to saccadic) suppression? Another potentially related phenomenon is the decrease in pre-saccadic foveal detection performances reported twice before (Hanning & Deubel, 2022; Kroell & Rolfs, 2022). It is possible that whatever mechanism triggers this decrease is engaged by the preparation of microsaccadic and saccadic motor programs alike. In any case, I would ask the authors to acknowledge this general decrease early on to clarify that any currently significant advantage for the target location relies on varied degrees of suppression, and not on true enhancement similar to pre-saccadic attention shifts.
Moreover, in Figure 3C, the final 25 ms before microsaccade onset are excluded from the aggregate measure, presumably since including this interval substantially reduces the effect size. Since the last 25 ms before movement onset is the interval most commonly associated with saccadic suppression, I think that this choice can be justified. Nonetheless, it should be mentioned explicitly in the main text. On a minor note, the authors state that "Performance (evaluated as percent of correct responses) was averaged within a 50 millisecond sliding window, advancing in 1 ms steps (with 24 ms overlap)". Why is the overlap not 49 ms?
(3.2) Discrimination during the microsaccade:<br /> The authors state that "in the "during" trials the target must be presented during the peak speed of the microsaccade." Since the target was presented for 50 ms and the average microsaccade duration was around 60 ms, this implies that the intra-microsaccadic condition includes many trials in which the target overlapped with the pre- or post-movement fixation interval. Were there not enough trials to isolate purely intra-microsaccadic presentations? Are the results descriptively comparable?
(4) Additional analyses
Several additional analyses could strengthen the authors' conclusions. If there are enough trials in which observers erroneously saccaded to the uncued (i.e., wrong) location, these trials could experimentally isolate the influence of pre-microsaccadic attention, assuming that endogenous attention went to the cued location. In addition, the authors speculate whether differences in saccadic and microsaccadic movement latencies may underlie the differences in perceptual time courses. The latency distributions provided in the manuscript look sufficiently broad, such that intra-individual variation could be harnessed to explore this question. Do sensitivity time courses differ before microsaccades with shorter vs. longer latencies?
(5) Clarifications regarding the design
At 50 ms, the duration of the to-be discriminated stimulus, although shorter than in previous investigations, is still rather long. What is the reason for this? I would encourage the authors to state in the main text that the duration of the analyzed/plotted time bins is often shorter than the stimulus duration (i.e., there is some overlap between bins that likely introduces smoothing). In Figure 3A, it would be helpful to plot raw data points computed from non-overlapping bins on top of the moving-window estimates, to allow readers to assess the degree of smoothing and potential temporal delays introduced by this analysis. Moreover, I wonder whether the abrupt onset of the target unmasked by flickering noise masks might induce saccadic inhibition, which would manifest as a transient dip in saccade execution probability. The distributions shown in Figure 2B appear too smoothed or fitted to clearly reveal such a dip. How exactly are all distributions in the manuscript computed (e.g., binning, smoothing, fitting procedures)? Finally, on a minor note, explicitly stating on line 105 that two different orientations can be presented at the cued and non-cued location would help avoid potential confusion.
-
Reviewer #2 (Public review):
Summary and overall evaluation:
The authors assessed how visual discrimination of stimuli in the foveola changes before, during, and after small instructed eye movements (in the "micro" range). Consistent with (and advancing) related prior work, their main finding regards a pre-saccadic modulation of visual performance at the saccade target vs. the opposite location. This pre-saccadic modulation in foveal vision peaks ~70 ms prior to the instructed small saccade.
Strengths:
The study uses an impressive, technically advanced set-up and zooms in on peri-saccadic modulations in visual acuity at the micro scale. The findings build on related prior findings from the literature on smaller and larger eye movements and add temporal granularity over prior work from the same lab. The writing is easy to follow, and the figures are clear.
Weaknesses:
At the same time, the findings remain relatively empirical in nature and do not profoundly advance theoretical understanding beyond adding valuable granularity to existing knowledge. Relevant prior literature could be better introduced and acknowledged. In addition, there remain concerns regarding potential cue-driven attentional influences that may confound the reported effects (leaving the possibility that the reported effects may be related to cue-driven attention, rather than saccade planning/execution per se). There are also some issues regarding specific statistical inferences. I detail these points below.
Major Points:
(1) Novelty framing and introduction of relevant prior literature
At times, this study is introduced as if no prior study explored the time course of changes in visual perception surrounding small (micro) saccades. Yet, it appears that a prior study from the same lab, using a very similar task, already showed a time course (Figure 5 in Shelchkova & Poletti, 2020). While this study is discussed in the introduction, it is not mentioned that at least some pre-saccade time course was already reported there, albeit a more crude one than the one in the current article. Moreover, the 2013 study by Hafed also specifically looked at "peri-microsaccade modulation in visual perception" and also already showed a temporal modulation that peaked ~50 ms before microsaccade onset. I appreciate how the current study differs in a number of ways (focusing on visual acuity in the foveola), but I was nevertheless surprised to see the first reference to this relevant prior finding in the discussion (and without any elaboration). Though more recent, the same could be argued for the 2025 study by Bouhnik et al. on pre-microsaccade modulations in visual processing in V1, which, like the Hafed study, is first mentioned only in the discussion. Perhaps these studies could be introduced in the paragraph starting at line 48, or in the next paragraph, to do better justice to the existing literature on this topic when motivating the study. This would likely also help to better point out the major advances provided by the current study.
Relatedly, in Shelchkova & Poletti (PNAS, 2020), an apparently similar congruency effect on performance was reported >200 ms milliseconds before saccade onset, as evident from Fig 5 in that article. How should readers rhyme this with the current findings? Ideally, the authors would not only acknowledge that such a time course was already reported previously, but also discuss the discrepancies between these findings further: why may the performance effects appear much earlier in this prior study compared to in the current study, where the congruency effect emerges only ~100 ms prior to the instructed small saccade?
(2) Saccade- or cue-driven? (assumption that attention is unaltered in failed saccade trials)
Because the authors used a cue to instruct saccade direction, it remains a possibility that the reported modulations in visual performance may be driven directly by the spatial cue (cue-related attentional allocation), rather than the instructed small saccade per se. While the authors are clearly aware of this potential confound, questions remain regarding the convincingness of the presented control analyses. In my view, a more compelling control would require an additional experiment.
The central argument against a cue-locked (purely attentional) modulation is the absence of a performance modulation in so-called "failed" saccade trials. However, a key assumption here is that putative cue-driven attention was unaltered in these trials. This is never verified and, in my opinion, highly unlikely. Rather, trials with failed microsaccades could very well be the result of failing to process the cue in the first place (indeed, if the task is to make a saccade to the cue, failure to make a saccade equates failure to perform the task). In such trials, any putative cue-driven influences over spatial attention would also be expected to be substantially reduced. Accordingly, just because failed saccade trials show little performance modulation does not rule out cue-driven attention effects, because attention may also have "failed" in these failed saccade trials. The control for potential cue-driven attention effects would be more convincing if the authors included a condition with the same cues, where participants are simply not instructed to make any saccades to the cues. Unfortunately, such an experimental condition appears not to have been included here. The author may still consider adding such a control experiment.
Another argument against a cue-driven effect is that the authors found no interaction with time in the cue-locked data, whereas they did find such an interaction in the saccade-locked data. However, the lack of significance in the cue-locked data but significance in the saccade-locked data is not strong evidence against a cue-driven influence. Statistically, there is no direct comparison here, and more importantly, with longer delays, the cue-locked data may also start to show a dip (this could potentially be tested by the authors if they have enough trials available to extend their cue-locked analysis further in time). Indeed, exogenous attention, that may have been automatically evoked by the spatial cue, is known to be transient and to eventually even reverse after a brief initial facilitation (see e.g., Klein TiCS, 2000).
Finally, the authors consistently refer to "endogenous" attention (starting at line 221) when addressing potential cue-driven attention confounds. However, because the cue is not predictive, but is a spatial cue that differs in a bottom-up manner between left and right cues, "exogenous" attention is a more likely confound here in my view. Specifically, the spatial cue may automatically trigger attention in the direction of the target location it points to (and such exogenous effects would be expected even for unpredictive cues).
(3) Benefit and cost, or just cost?
Line 151 states that no statistically significant benefit for the saccade target was found compared to the neutral baseline. Yet, the claim throughout the article is distinct, such as in line 159: "These results show that approximately 100 milliseconds before microsaccade onset, discrimination rapidly improved at the intended target location". I do not question the robustness of the congruency effect, but the authors should be more careful when inferring "improved" perception at the target location because, as far as I could tell (as well as in the authors' own writing in line 151), this is not substantiated statistically when compared to the neutral baseline.
Related to this point, in Figure 3B, it would be informative to also see the average performance in the neutral cue condition (for example, as a straight line as in some other figures). This would help to better appreciate the relative benefits and/or costs compared to the neutral condition, also in the time-resolved data.
(4) Statistical inference for the comparison between failed and non-failed trials
Currently, the lack of modulation in the failed saccade trials hinges on a null effect. It would be stronger to support the claims with a significant difference in the congruency effect between failed and non-failed trials. Indeed, lack of significance in failed saccade trials does by itself not constitute valid evidence that the congruency effect is larger in saccade compared to failed saccade trials. For this, a significant interaction between saccade-trial-type (failed/non-failed) and congruency (congruent/incongruent) should be established (see e.g., Nieuwenhuis et al., Nat Neurosci, 2011).
(5) Time window justification
While the authors nicely depict their data across the full time axis, all statistics are currently performed on data extracted from specific time windows. How exactly were these time windows determined and justified? Likewise, how were the specific times picked for visualizing and statistically quantifying the data in e.g., Figures 3D and E? It would be reassuring to add justification for these specific time windows and/or to verify (using follow-up analyses) that the presented results are robust when different time windows are chosen.
(6) Microsaccade definition
Microsaccades are explicitly defined as being below half a degree. This appears rather arbitrary and rigid. Does the size of saccades not ultimately depend on the task and stimulus (e.g., Otero-Millan et al., PNAS, 2013) rather than being a fixed biological property? Perhaps this could be stated less rigidly, such as by stating how microsaccades are often observed below 0.5 degrees.
(Relatedly, one may wonder whether the type of instructed saccades that the authors studied here involves the same type of eye movements as the type of fixational microsaccades that have been the focus of ample prior studies. However, I recognize that this specific reflection may open a debate that is beyond the scope of this article.
-
-
www.uproot.space www.uproot.space
-
Who owns the order of Black memory? The person who brought it to the White institution
Archives shift power and ownership of Black history to the White institutions and collectors, rather than the Black individuals and communities who originally lived and created those memories.
-
archives are institutions defining documentary history: the things within the archive are the facts and the things without are suspect
This shows how archives have the power to determine what is considered true. If something is included in an archive, it is treated as fact, but if it is not archived, people may questions its legitimacy even if it is real.
-
Here is a photo of a baptism, in a river a few minutes walk from my family homestead, cataloged: date, unknown; individuals, unknown; creator, unknown
Shows that archives lose important contextual knowledge, even when the originating community knows exactly who and what is represented.
-
“The neighborhood is an archive, the woman was an archive, this land is an archive.”
An archive records the context of time and particular experience
-
-
adatosystems.com adatosystems.com
-
BLOG: How NOT to Answer the Salary Question
- The article argues that answering the "What is your current/expected salary?" question with a single number is a strategic mistake that limits your earning potential.
- Giving a specific number early in the process creates an "anchor" that recruiters will use to keep the offer as low as possible.
- Instead of providing a number, the author suggests pivoting the conversation toward the value you bring to the role and the total compensation package.
- A key strategy is to ask for the company's budgeted range for the position first, which puts the onus on the employer to disclose their limits.
- If forced to give a range, ensure the bottom of your range is the minimum you would actually accept, while the top represents your "dream" scenario.
- The goal of salary discussions in early interviews should be to establish "alignment" rather than a final price tag.
- Delaying the specific salary talk until after you have "wowed" the team gives you more leverage, as they are now invested in hiring you specifically.
Hacker News Discussion
- Many commenters emphasize that while "not answering" is a common piece of advice, it can be impractical for those who lack extreme leverage or are in urgent need of work.
- A popular counter-strategy mentioned is to confirm the salary range during the very first recruiter call to avoid wasting hours on interviews for a role that cannot meet your financial requirements.
- Users suggested that if you do provide a number first, you should always include a disclaimer that you "look at the entire package holistically" (benefits, equity, PTO) to maintain flexibility for later negotiation.
- There is a consensus that once a final offer is made, you should almost always ask, "Is there any way you can come up a little bit from that?" as this simple question frequently results in a 5-10% bump with minimal risk.
- Some participants shared "pleasant surprise" stories where refusing to name a price led to offers significantly higher (+50% or more) than what they would have asked for.
- The discussion highlights a shift toward transparency, with many noting that asking for the "salary band" is becoming a standard and respected practice in tech hiring.
-
-
library.oapen.org library.oapen.org
-
What about engaging in a virtual game world where you can have a conversation with a character that knows you and your backstory?
Hmmm intriguing and somewhat creepy at the same time.
-
spending time engaging in popular games such as Minecraft or Fortnitemay foster an appreciation of exciting experiences in high-fidelity immersive
Note to self.
-
Online reading needs to be supported by other cognitive skills such as cyber-safe skills and relatedly, internet cognition: that is, accurate conceptions of the internet (Edwards et al., 2018).
When collecting COTR data students didn't have an accurate conception of the internet.
-
-
www.americanyawp.com www.americanyawp.com
-
Are burst, and Freedom rules the rescued land, —
used in a weird way
-
the fear of man which bringeth a snare,
unfamiliar
-
-
socialsci.libretexts.org socialsci.libretexts.org
-
Anthropologists are quick to put dates on our existence in North America because of their colonized mindset to attempt to "prove" we have no history or "not enough" history in our homelands to lay claim to it. By trying to date our existence closer to the invasion of the Americas, they are attempting to dismiss our connection to our place of origin and our creation.
after reading this paragraph it remain me of the history they told us in elementary about Europeans being tht goos guys in the stories.
-
-
-
tags: [] source: https://www.nytimes.com/2026/02/16/movies/robert-duvall-dead.html author: Clyde Haberman
Robert Duvall, ‘Godfather’ and ‘Apocalypse Now’ Actor, Dies at 95<br /> by [[Clyde Haberman]] in The New York Times<br /> accessed on 2026-02-17T08:25:34
-
From early on, Mr. Duvall enjoyed the life of a supporting actor. “Somebody once said that the best life in the world is the life of a second leading man,” Mr. Duvall told The Times. “You travel, you get a per diem, and you’ve probably got a better part anyway. And you don’t have the weight of the entire movie on your shoulders.”
-
Even as a boy, in a Navy family that moved around the country, he had an ear for people’s speech patterns and an eye for their mannerisms. “I hang around a guy’s memories,” he once said. Insights that he gleaned were routinely tucked away in his head for potential future use.
-
-
human.libretexts.org human.libretexts.org
-
Based on the reading above, what does “tener” mean?
to have
-
ellos/ellas/ustedes:
tienen
-
nosotros:
tenemos
-
él/ella/usted:
tiene
-
Tú:
tienes
-
Yo
tengo
-
-
human.libretexts.org human.libretexts.org
-
Compro (I buy) un libro en ____________.
Compro un libro en la librería.
-
El fútbol de mesa está en ____________.
El fútbol de mesa está en la sala de juegos.
-
El escenario está en ____________.
El escenario está en el teatro.
-
La comida está en ____________.
Una cama está en el dormitorio.
-
Una cama está en ____________.
Una cama está en el dormitorio.
-
Los libros antiguos están en ____________.
Los libros antiguos están en la biblioteca.
-
Las pesas están en ____________.
Las pesas están en el gimnasio.
-
El vaso de precipitado está en ____________.
El vaso de precipitado está en el laboratorio.
-
-
www.biorxiv.org www.biorxiv.org
-
eLife Assessment
This important study identifies a novel role for Hes5+ astrocytes in modulating the activity of descending pain-inhibitory noradrenergic neurons from the locus coeruleus during stress-induced pain facilitation. The role of glia in modulating neurological circuits including pain is poorly understood, and in that light, the role of Hes5+ astrocytes in this circuit is a key finding with broader potential impacts. This work is supported by convincing evidence, albeit somewhat limited by the indirect nature of the evidence linking adenosine to nearby neuronal modulation, and possible questions on the population specificity of the transgenic approach.
-
Reviewer #1 (Public review):
Review of the revised submission:
I thank the authors for their detailed consideration of my comments and for the additional data, analyses, and clarifications they have incorporated. The new behavioral experiments, quantification of targeted manipulations, and expanded methodological details strengthen the manuscript and address many of my initial concerns. While some questions remain for future work, the authors' careful responses and the additional evidence provided help resolve the main issues I raised, and I am generally satisfied with the revisions.
Review of original submission:
Summary
In this article, Kawanabe-Kobayashi et al., aim to examine the mechanisms by which stress can modulate pain in mice. They focus on the contribution of noradrenergic neurons (NA) of the locus coeruleus (LC). The authors use acute restraint stress as a stress paradigm and found that following one hour of restraint stress mice display mechanical hypersensitivity. They show that restraint stress causes the activation of LC NA neurons and the release of NA in the spinal cord dorsal horn (SDH). They then examine the spinal mechanisms by which LC→SDH NA produces mechanical hypersensitivity. The authors provide evidence that NA can act on alphaA1Rs expressed by a class of astrocytes defined by the expression of Hes (Hes+). Furthermore, they found that NA, presumably through astrocytic release of ATP following NA action on alphaA1Rs Hes+ astrocytes, can cause an adenosine-mediated inhibition of SDH inhibitory interneurons. They propose that this disinhibition mechanism could explain how restraint stress can cause the mechanical hypersensitivity they measured in their behavioral experiments.
Strengths:
(1) Significance. Stress profoundly influences pain perception; resolving the mechanisms by which stress alters nociception in rodents may explain the well-known phenomenon of stress-induced analgesia and/or facilitate the development of therapies to mitigate the negative consequences of chronic stress on chronic pain.
(2) Novelty. The authors' findings reveal a crucial contribution of Hes+ spinal astrocytes in the modulation of pain thresholds during stress.
(3) Techniques. This study combines multiple approaches to dissect circuit, cellular, and molecular mechanisms including optical recordings of neural and astrocytic Ca2+ activity in behaving mice, intersectional genetic strategies, cell ablation, optogenetics, chemogenetics, CRISPR-based gene knockdown, slice electrophysiology, and behavior.
Weaknesses:
(1) Mouse model of stress. Although chronic stress can increase sensitivity to somatosensory stimuli and contribute to hyperalgesia and anhedonia, particularly in the context of chronic pain states, acute stress is well known to produce analgesia in humans and rodents. The experimental design used by the authors consists of a single one-hour session of restraint stress followed by 30 min to one hour of habituation and measurement of cutaneous mechanical sensitivity with von Frey filaments. This acute stress behavioral paradigm corresponds to the conditions in which the clinical phenomenon of stress-induced analgesia is observed in humans, as well as in animal models. Surprisingly, however, the authors measured that this acute stressor produced hypersensitivity rather than antinociception. This discrepancy is significant and requires further investigation.
(2) Specifically, is the hypersensitivity to mechanical stimulation also observed in response to heat or cold on a hotplate or coldplate?
(3) Using other stress models, such as a forced swim, do the authors also observe acute stress-induced hypersensitivity instead of stress-induced antinociception?
(4) Measurement of stress hormones in blood would provide an objective measure of the stress of the animals.
(5) Results:
(a) Optical recordings of Ca2+ activity in behaving rodents are particularly useful to investigate the relationship between Ca2+ dynamics and the behaviors displayed by rodents.
(b) The authors report an increase in Ca2+ events in LC NA neurons during restraint stress: Did mice display specific behaviors at the time these Ca2+ events were observed such as movements to escape or orofacial behaviors including head movements or whisking?
(c) Additionally, are similar increases in Ca2+ events in LC NA neurons observed during other stressful behavioral paradigms versus non-stressful paradigms?
(d) Neuronal ablation to reveal the function of a cell population.
(e) The proportion of LC NA neurons and LC→SDH NA neurons expressing DTR-GFP and ablated should be quantified (Figures 1G and J) to validate the methods and permit interpretation of the behavioral data (Figures 1H and K). Importantly, the nocifensive responses and behavior of these mice in other pain assays in the absence of stress (e.g., hotplate) and a few standard assays (open field, rotarod, elevated plus maze) would help determine the consequences of cell ablation on processing of nociceptive information and general behavior.
(f) Confirmation of LC NA neuron function with other methods that alter neuronal excitability or neurotransmission instead of destroying the circuit investigated, such as chemogenetics or chemogenetics, would greatly strengthen the findings. Optogenetics is used in Figure 1M, N but excitation of LC→SDH NA neuron terminals is tested instead of inhibition (to mimic ablation), and in naïve mice instead of stressed mice.
(g) Alpha1Ars. The authors noted that "Adra1a mRNA is also expressed in INs in the SDH".
(h) The authors should comprehensively indicate what other cell types present in the spinal cord and neurons projecting to the spinal cord express alpha1Ars and what is the relative expression level of alpha1Ars in these different cell types.
(i) The conditional KO of alpha1Ars specifically in Hes5+ astrocytes and not in other cell types expressing alpha1Ars should be quantified and validated (Figure 2H).
(j) Depolarization of SDH inhibitory interneurons by NA (Figure 3). The authors' bath applied NA, which presumably activates all NA receptors present in the preparation.
k) The authors' model (Figure 4H) implies that NA released by LC→SDH NA neurons leads to the inhibition of SDH inhibitory interneurons by NA. In other experiments (Figure 1L, Figure 2A), the authors used optogenetics to promote the release of endogenous NA in SDH by LC→SDH NA neurons. This approach would investigate the function of NA endogenously released by LC NA neurons at presynaptic terminals in the SDH and at physiological concentrations and would test the model more convincingly compared to the bath application of NA.
(l) As for other experiments, the proportion of Hes+ astrocytes that express hM3Dq, and the absence of expression in other cells, should be quantified and validated to interpret behavioral data.
(m) Showing that the effect of CNO is dose-dependent would strengthen the authors' findings.
(n) The proportion of SG neurons for which CNO bath application resulted in a reduction in recorded sIPSCs is not clear.
(o) A1Rs. The specific expression of Cas9 and guide RNAs, and the specific KD of A1Rs, in inhibitory interneurons but not in other cell types expressing A1Rs should be quantified and validated.
(6) Methods:
It is unclear how fiber photometry is performed using "optic cannula" during restraint stress while mice are in a 50ml falcon tube (as shown in Figure 1A).
-
Reviewer #2 (Public review):
Summary:
This study investigates the role of spinal astrocytes in mediating stress-induced pain hypersensitivity, focusing on the LC (locus coeruleus)-to-SDH (spinal dorsal horn) circuit and its mechanisms. The authors aimed to delineate how LC activity contributes to spinal astrocytic activation under stress conditions, explore the role of noradrenaline (NA) signaling in this process, and identify the downstream astrocytic mechanisms that influence pain hypersensitivity.
The authors provide strong evidence that 1-hour restraint stress-induced pain hypersensitivity involves the LC-to-SDH circuit, where NA triggers astrocytic calcium activity via alpha1a adrenoceptors (alpha1aRs). Blockade of alpha1aRs on astrocytes-but not on Vgat-positive SDH neurons-reduced stress-induced pain hypersensitivity. These findings are rigorously supported by well-established behavioral models and advanced genetic techniques, uncovering the critical role of spinal astrocytes in modulating stress-induced pain.
However, the study's third aim-to establish a pathway from astrocyte alpha1aRs to adenosine-mediated inhibition of SDH-Vgat neurons-is less compelling. While pharmacological and behavioral evidence is intriguing, the ex vivo findings are indirect and lack a clear connection to the stress-induced pain model. Despite these limitations, the study advances our understanding of astrocyte-neuron interactions in stress-pain contexts and provides a strong foundation for future research into glial mechanisms in pain hypersensitivity.
Strengths:
The study is built on a robust experimental design using a validated 1-hour restraint stress model, providing a reliable framework to investigate stress-induced pain hypersensitivity. The authors utilized advanced genetic tools, including retrograde AAVs, optogenetics, chemogenetics, and subpopulation-specific knockouts, allowing precise manipulation and interrogation of the LC-SDH circuit and astrocytic roles in pain modulation. Clear evidence demonstrates that NA triggers astrocytic calcium activity via alpha1aRs, and blocking these receptors effectively reduces stress-induced pain hypersensitivity.
Weaknesses:
The study offers mainly indirect evidence for astrocyte-released adenosine acting on SDH-VGAT neurons. The potential contributions of astrocyte-derived D-serine and adenosine to different spinal neuron subtypes, as well as the transient "dip" in astrocytic calcium following LC optostimulation, merit further clarification in future work once appropriate tools become available.
Comments on revisions:
The authors have thoroughly addressed my previous comments, resolving most of the points I raised except those noted in the "Weaknesses" section above. I understand that some of these aspects will require future tool development.
-
Reviewer #3 (Public review):
Summary
This is an exciting and timely study addressing the role of descending noradrenergic systems in nocifensive responses. While it is well-established that spinally released noradrenaline (aka norepinephrine) generally acts as an inhibitory factor in spinal sensory processing, this system is highly complex. Descending projections from the A6 (locus coeruleus, LC) and the A5 regions typically modulate spinal sensory processing and reduce pain behaviours, but certain subpopulations of LC neurons have been shown to mediate pronociceptive effects, such as those projecting to the prefrontal cortex (Hirshberg et al., PMID: 29027903).
The study proposes that descending cerulean noradrenergic neurons potentiate touch sensation via alpha-1 adrenoceptors on Hes5+ spinal astrocytes, contributing to mechanical hyperalgesia. This finding is consistent with prior work from the same group (dd et al., PMID:). However, caution is needed when generalising about LC projections, as the locus coeruleus is functionally diverse, with differences in targets, neurotransmitter co-release, and behavioural effects. Specifying the subpopulations of LC neurons involved would significantly enhance the impact and interpretability of the findings.
Strengths
The study employs state-of-the-art molecular, genetic, and neurophysiological methods, including precise CRISPR and optogenetic targeting, to investigate the role of Hes5+ astrocytes. This approach is elegant and highlights the often-overlooked contribution of astrocytes in spinal sensory gating. The data convincingly support the role of Hes5+ astrocytes as regulators of touch sensation, coordinated by brain-derived noradrenaline in the spinal dorsal horn, opening new avenues for research into pain and touch modulation.
Furthermore, the data support a model in which superficial dorsal horn (SDH) Hes5+ astrocytes act as non-neuronal gating cells for brain-derived noradrenergic (NA) signalling through their interaction with substantia gelatinosa inhibitory interneurons. Locally released adenosine from NA-stimulated Hes5+ astrocytes, following acute restraint stress, may suppress the function of SDH-Vgat+ inhibitory interneurons, resulting in mechanical pain hypersensitivity. However, the spatially restricted neuron-astrocyte communication underlying this mechanism requires further investigation in future studies.
Comments on revisions:
One important point remains insufficiently resolved. In Figure S4C, two of the three visible neurons in the A5 example appear to show a white "halo" at the cell border, suggesting a merge of eGFP (green) and TH (magenta) and therefore possible transgene positivity. To draw a confident conclusion about the specificity of the approach for the A6 (LC) population, the authors are kindly asked to provide high-resolution images of several representative A5 sections, presented both as merged and as separate colour channels. Ideally, quantification across multiple rostrocaudal sections of A5, A6 and A7 should be provided. This is essential for determining whether any transgene expression occurs within the A5 nucleus, particularly given its several-millimetre rostrocaudal extent. As the behavioural phenotype arises from manipulation of only a small subset of A6 neurons, ruling out any contribution from A5 (or A7) is critical for validating pathway specificity, especially in light of prior reports showing that similar approaches can label A5 fibres.
-
Author response:
The following is the authors’ response to the original reviews.
Public reviews:
Reviewer #1 (Public review):
Summary:
In this article, Kawanabe-Kobayashi et al., aim to examine the mechanisms by which stress can modulate pain in mice. They focus on the contribution of noradrenergic neurons (NA) of the locus coeruleus (LC). The authors use acute restraint stress as a stress paradigm and found that following one hour of restraint stress mice display mechanical hypersensitivity. They show that restraint stress causes the activation of LC NA neurons and the release of NA in the spinal cord dorsal horn (SDH). They then examine the spinal mechanisms by which LC→SDH NA produces mechanical hypersensitivity. The authors provide evidence that NA can act on alphaA1Rs expressed by a class of astrocytes defined by the expression of Hes (Hes+). Furthermore, they found that NA, presumably through astrocytic release of ATP following NA action on alphaA1Rs Hes+ astrocytes, can cause an adenosine-mediated inhibition of SDH inhibitory interneurons. They propose that this disinhibition mechanism could explain how restraint stress can cause the mechanical hypersensitivity they measured in their behavioral experiments.
Strengths:
(1) Significance. Stress profoundly influences pain perception; resolving the mechanisms by which stress alters nociception in rodents may explain the well-known phenomenon of stress-induced analgesia and/or facilitate the development of therapies to mitigate the negative consequences of chronic stress on chronic pain.
(2) Novelty. The authors' findings reveal a crucial contribution of Hes+ spinal astrocytes in the modulation of pain thresholds during stress.
(3) Techniques. This study combines multiple approaches to dissect circuit, cellular, and molecular mechanisms including optical recordings of neural and astrocytic Ca2+ activity in behaving mice, intersectional genetic strategies, cell ablation, optogenetics, chemogenetics, CRISPR-based gene knockdown, slice electrophysiology, and behavior.
Weaknesses:
(1) Mouse model of stress. Although chronic stress can increase sensitivity to somatosensory stimuli and contribute to hyperalgesia and anhedonia, particularly in the context of chronic pain states, acute stress is well known to produce analgesia in humans and rodents. The experimental design used by the authors consists of a single one-hour session of restraint stress followed by 30 min to one hour of habituation and measurement of cutaneous mechanical sensitivity with von Frey filaments. This acute stress behavioral paradigm corresponds to the conditions in which the clinical phenomenon of stress-induced analgesia is observed in humans, as well as in animal models. Surprisingly, however, the authors measured that this acute stressor produced hypersensitivity rather than antinociception. This discrepancy is significant and requires further investigation.
We thank the reviewer for evaluating our work and for highlighting both its strengths and weaknesses. As stated by the reviewer, numerous studies have reported acute stress-induced antinociception. However, as shown in a new additional table (Table S1) in which we have summarized previously published data using the acute restraint stress model employed in our present study, most studies reporting antinociceptive effects of acute restraint stress assessed behavioral responses to heat stimuli or formalin. This observation is consistent with the findings from our previous study (Uchiyama et al., Mol Brain, 2022 (PMID: 34980215)). The present study also confirms that acute restraint stress reduces behavioral responses to noxious heat (see also our response to Comment #2 below). In contrast to the robust and consistent antinociceptive effects observed with thermal stimuli, some studies evaluating behavioral responses to mechanical stimuli have reported stress-induced hypersensitivity (see Table S1), which aligns with our current findings. Taken together, these data support our original notion that the effects of acute stress on pain-related behaviors depend on several factors, including the nature, duration, and intensity of the stressor, as well as the sensory modality assessed in behavioral tests. We have incorporated this discussion and Table S1 into the revised manuscript (lines 344-353). Furthermore, we have slightly modified the text including the title, replacing "pain facilitation" with "mechanical pain hypersensitivity" to more accurately reflect our research focus and the conclusion of this study that LC<sup>→SDH</sup> NAergic signaling to spinal astrocytes is required for stress-induced mechanical pain hypersensitivity. Finally, while mouse models of stress could provide valuable insights, the clinical relevance of stress-induced mechanical pain hypersensitivity remains to be elucidated and requires further investigation. We hope these clarifications address your concerns.
(2) Specifically, is the hypersensitivity to mechanical stimulation also observed in response to heat or cold on a hotplate or coldplate?
Thank you for your important comment. We have now conducted additional behavioral experiments to assess responses to heat using the hot-plate test. We found that mice subjected to restraint stress did not exhibit behavioral hypersensitivity to heat stimuli; instead, they displayed antinociceptive responses (Figure S2; lines 95-98). These results are consistent with our previous findings (Uchiyama et al., Mol Brain, 2022 (PMID: 34980215)) as well as numerous other reports (Table S1).
(3) Using other stress models, such as a forced swim, do the authors also observe acute stress-induced hypersensitivity instead of stress-induced antinociception?
As suggested by the reviewer, we conducted a forced swim test. We found that mice subjected to forced swimming, which has been reported to produce analgesic effects on thermal stimuli (Contet et al., Neuropsychopharmacology, 2006 (PMID: 16237385)), did not exhibit any changes in mechanical pain hypersensitivity (Figure S2; lines 98-99). Furthermore, a previous study demonstrated that mechanical pain sensitivity is enhanced by other stress models, such as exposure to an elevated open platform for 30 min (Kawabata et al., Neuroscience, 2023 (PMID: 37211084)). However, considering our data showing that changes in mechanosensory behavior induced by restraint stress depend on the duration of exposure (Figure S1), and that restraint stress also produced an antinociceptive effect on heat stimuli (Figure S2), stress-induced modulation of pain is a complex phenomenon influenced by multiple factors, including the stress model, intensity, and duration, as well as the sensory modality used for behavioral testing (lines 100-103).
(4) Measurement of stress hormones in blood would provide an objective measure of the stress of the animals.
A previous study has demonstrated that plasma corticosterone levels—a stress hormone—are elevated following a 1-hour exposure to restraint stress in mice (Kim et al., Sci Rep, 2018 (PMID: 30104581)), using a stress protocol similar to that employed in our current study. We have included this information with citing this paper (lines 104-105).
(5) Results:
(a) Optical recordings of Ca2+ activity in behaving rodents are particularly useful to investigate the relationship between Ca2+ dynamics and the behaviors displayed by rodents.
In the optical recordings of Ca<sup>2+</sup> activity in LC neurons, we monitored mouse behavior during stress exposure. We have now included a video of this in the revised manuscript (video; lines 111-114).
(b) The authors report an increase in Ca2+ events in LC NA neurons during restraint stress: Did mice display specific behaviors at the time these Ca2+ events were observed such as movements to escape or orofacial behaviors including head movements or whisking?
By reanalyzing the temporal relationship between Ca<sup>2+</sup> events and mouse behavior during stress exposure, we found that the Ca<sup>2+</sup> transients and escape behaviors (struggling) occurred almost simultaneously (video). A similar temporal correlation is also observed in Ca<sup>2+</sup> responses in the bed nucleus of the stria terminalis (Luchsinger et al., Nat Commun, 2021 (PMID: 34117229)). The video file has been included in the revised manuscript (video; lines 111-113, 552-553, 573-575).
Additionally, as described in the Methods section and shown in Figure S2 of the initial version (now Figure S3), non-specific signals or artifacts—such as those caused by head movements—were corrected (although such responses were minimal in our recordings).
(c) Additionally, are similar increases in Ca2+ events in LC NA neurons observed during other stressful behavioral paradigms versus non-stressful paradigms?
We appreciate the reviewer's valuable suggestion. Since the present, initial version of our manuscript focused on acute restraint stress, we did not measure Ca<sup>2+</sup> events in LC-NA neurons in other stress models, but a recent study has shown an increase in Ca<sup>2+</sup> responses in LC-NA neurons by social defeat stress (Seiriki et al., BioRxiv, https://www.biorxiv.org/content/10.1101/2025.03.07.641347v1).
(d) Neuronal ablation to reveal the function of a cell population.
This method has been widely used in numerous previous studies as an effective experimental approach to investigate the role of specific neuronal populations—including SDH-projecting LC-NA neurons (Ma et al., Brain Res, 2022 (PMID: 34929182); Kawanabe et al., Mol Brain, 2021 (PMID: 33971918))—in CNS function.
(e) The proportion of LC NA neurons and LC→SDH NA neurons expressing DTR-GFP and ablated should be quantified (Figures 1G and J) to validate the methods and permit interpretation of the behavioral data (Figures 1H and K). Importantly, the nocifensive responses and behavior of these mice in other pain assays in the absence of stress (e.g., hotplate) and a few standard assays (open field, rotarod, elevated plus maze) would help determine the consequences of cell ablation on processing of nociceptive information and general behavior.
As suggested, we conducted additional experiments to quantitatively analyze the number of LC<sup>→SDH</sup>-NA neurons. We used WT mice injected with AAVretro-Cre into the SDH (L4 segment) and AAV-FLEx[DTR-EGFP] into the LC. In these mice, 4.4% of total LC-NA neurons [positive for tyrosine hydroxylase (TH)] expressed DTR-GFP, representing the LC<sup>→SDH</sup>-NA neuronal population (Figure S4; lines 126-127). Furthermore, treatment with DTX successfully ablated the DTR-expressing LC<sup>→SDH</sup>-NA neurons. Importantly, the neurons quantified in this analysis were specifically those projecting to the L4 segment of the SDH; therefore, the total number of SDH-projecting LC-NA neurons across all spinal segments is expected to be much higher.
We also performed the rotarod and paw-flick tests to assess motor function and thermal sensitivity following ablation of LC<sup>→SDH</sup>-NA neurons. No significant differences were observed between the ablated and control groups (Figure S5; lines 131-134), indicating that ablation of these neurons does not produce non-specific behavioral deficits in motor function or other sensory modalities.
(f) Confirmation of LC NA neuron function with other methods that alter neuronal excitability or neurotransmission instead of destroying the circuit investigated, such as chemogenetics or chemogenetics, would greatly strengthen the findings. Optogenetics is used in Figure 1M, N but excitation of LCLC<sup>→SDH</sup> NA neuron terminals is tested instead of inhibition (to mimic ablation), and in naïve mice instead of stressed mice.
We appreciate the reviewer’s comment. The optogenetic approach is useful for manipulating neuronal excitability; however, prolonged light illumination (> tens of seconds) can lead to undesirable tissue heating, ionic imbalance, and rebound spikes (Wiegert et al., Neuron, 2017 (PMID: 28772120)), making it difficult to apply in our experiments, in which mice are exposed to stress for 60 min. For this reason, we decided to employ the cell-ablation approach in stress experiments, as it is more suitable than optogenetic inhibition. In addition, as described in our response to weakness (1)-a) by Reviewer 3 (Public review), we have now demonstrated the specific expression of DTRs in NA neurons in the LC, but not in A5 or A7 (Figure S4; lines 127-128), confirming the specificity of LCLC<sup>→SDH</sup>-NAergic pathway targeting in our study. Chemogenetics represent another promising approach to further strengthen our findings on the role of LCLC<sup>→SDH</sup>-NA neurons, but this will be an important subject for future studies, as it will require extensive experiments to assess, for example, the effectiveness of chemogenetic inhibition of these neurons during 60 min of restraint stress, as well as optimization of key parameters (e.g., systemic DCZ doses).
(g) Alpha1Ars. The authors noted that "Adra1a mRNA is also expressed in INs in the SDH".
The expression of α<sub>1A</sub>Rs in inhibitory interneurons in the SDH is consistent with our previous findings (Uchiyama et al., Mol Brain, 2022 (PMID: 34980215)) as well as with scRNA-seq data (http://linnarssonlab.org/dorsalhorn/, Häring et al., Nat Neurosci, 2018 (PMID: 29686262)).
(h) The authors should comprehensively indicate what other cell types present in the spinal cord and neurons projecting to the spinal cord express alpha1Ars and what is the relative expression level of alpha1Ars in these different cell types.
According to the scRNA-seq data (https://seqseek.ninds.nih.gov/genes, Russ et al., Nat Commun, 2021 (PMID: 34588430); http://linnarssonlab.org/dorsalhorn/, Häring et al., Nat Neurosci, 2018 (PMID: 29686262)), we confirmed that α<sub>1A</sub>Rs are predominantly expressed in astrocytes and inhibitory interneurons in the spinal cord. Also, an α<sub>1A</sub>R-expressing excitatory neuron population (Glut14) expresses Tacr1, GPR83, and Tac1 mRNAs, markers that are known to be enriched in projection neurons of the SDH. This raises the possibility that α<sub>1A</sub> Rs may also be expressed in a subset of projection neurons, although further experiments are required to confirm this. In DRG neurons, α<sub>1A</sub>R expression was detected to some extent, but its level seems to be much lower than in the spinal cord (http://linnarssonlab.org/drg/ Usoskin et al., Nat Neurosci, 2015 (PMID: 25420068)). Consistent with this, primary afferent glutamatergic synaptic transmission has been shown to be unaffected by α<sub>1A</sub>R agonists (Kawasaki et al., Anesthesiology, 2003 (PMID: 12606912); Li and Eisenach, JPET, 2001 (PMID: 11714880)). This information has been incorporated into the Discussion section (lines 317-319).
(i) The conditional KO of alpha1Ars specifically in Hes5+ astrocytes and not in other cell types expressing alpha1Ars should be quantified and validated (Figure 2H).
We have previously shown a selective KO of α<sub>1A</sub>R in Hes5<sup>+</sup> astrocytes in the same mouse line (Kohro et al., Nat Neurosci, 2020 (PMID: 33020652)). This information has been included in the revised text (line 166-167).
(j) Depolarization of SDH inhibitory interneurons by NA (Figure 3). The authors' bath applied NA, which presumably activates all NA receptors present in the preparation.
We believe that the reviewer’s concern may pertain to the possibility that NA acts on non-Vgat<sup>+</sup> neurons, thereby indirectly causing depolarization of Vgat<sup>+</sup> neurons. As described in the Method section of the initial version, in our electrophysiological experiments, we added four antagonists for excitatory and inhibitory neurotransmitter receptors—CNQX (AMPA receptor), MK-801 (NMDA receptor), bicuculline (GABA<sub>A</sub> receptor), and strychnine (glycine receptor)—to the artificial cerebrospinal fluid to block synaptic inputs from other neurons to the recorded Vgat<sup>+</sup> neurons. Since this method is widely used for this purpose in many previous studies (Wu et al., J Neurosci, 2004 (PMID: 15140934); Liu et al., Nat Neurosci, 2010 (PMID: 20835251)), it is reasonable to conclude that NA directly acts on the recorded SDH Vgat<sup>+</sup> interneurons to produce excitation (lines 193-196).
(k) The authors' model (Figure 4H) implies that NA released by LC→SDH NA neurons leads to the inhibition of SDH inhibitory interneurons by NA. In other experiments (Figure 1L, Figure 2A), the authors used optogenetics to promote the release of endogenous NA in SDH by LC→SDH NA neurons. This approach would investigate the function of NA endogenously released by LC NA neurons at presynaptic terminals in the SDH and at physiological concentrations and would test the model more convincingly compared to the bath application of NA.
We appreciate the reviewer’s valuable comment. As noted, optogenetic stimulation of LC<sup>→SDH</sup>-NA neurons would indeed be useful to test this model. However, in our case, it is technically difficult to investigate the responses of Vgat<sup>+</sup> inhibitory neurons and Hes5<sup>+</sup> astrocytes to NA endogenously released from LC<sup>→SDH</sup>-NA neurons. This would require the use of Vgat-Cre or Hes5-CreERT2 mice, but employing these lines precludes the use of NET-Cre mice, which are necessary for specific and efficient expression of ChrimsonR in LC<sup>→SDH</sup>-NA neurons. Nevertheless, all of our experimental data consistently support the proposed model, and we believe that the reviewer will agree with this, without additional experiments that is difficult to conduct because of technical limitations (lines 382-388).
(l) As for other experiments, the proportion of Hes+ astrocytes that express hM3Dq, and the absence of expression in other cells, should be quantified and validated to interpret behavioral data.
We thank the reviewer for raising this point. In our experiments, we used an HA-tag (fused with hM3Dq) to confirm hM3Dq expression. However, it is difficult to precisely analyze individual astrocytes because, as shown in Figure 3J, the boundaries of many HA-tag<sup>+</sup> astrocytes are indistinguishable. This seems to be due to the membrane localization of HA-tag, the complex morphology of astrocytes, and their tile-like distribution pattern (Baldwin et al., Trends Cell Biol, 2024 (PMID: 38180380)). Nevertheless, our previous study demonstrated that ~90% of astrocytes in the superficial laminae are Hes5<sup>+</sup> (Kohro et al., Nat Neurosci, 2020 (PMID: 33020652)), and intra-SDH injection of AAV-hM3Dq labeled the majority of superficial astrocytes (Figure 3J). Thus, AAV-FLEx[hM3Dq] injection into Hes5-CreERT2 mice allows efficient expression of hM3Dq in Hes5<sup>+</sup> astrocytes in the SDH. Importantly, our previous studies using Hes5-CreERT2 mice have confirmed that hM3Dq is not expressed in other cell types (neurons, oligodendrocytes, or microglia) (Kohro et al., Nat Neurosci, 2020 (PMID: 33020652); Kagiyama et al., Mol Brain, 2025 (PMID: 40289116)). This information regarding the cell-type specificity has now been briefly described in the revised version (lines 218-219).
(m) Showing that the effect of CNO is dose-dependent would strengthen the authors' findings.
Thank you for your comment. We have now demonstrated a dose-dependent effect of CNO on Ca<sup>2+</sup> responses in SDH astrocytes (please see our response to Major Point (4) from Reviewer #2 (Recommendations for the Authors) (Figure S7; lines 225-228). In addition, we also confirmed that the effect of CNO is not nonspecific, as CNO application did not alter sIPSCs in spinal cord slices prepared from mice lacking hM3Dq expression in astrocytes (Figure S7; lines 225-228).
(n) The proportion of SG neurons for which CNO bath application resulted in a reduction in recorded sIPSCs is not clear.
We have included individual data points in each bar graph to more clearly illustrate the effect of CNO on each neuron (Figure 3L, N).
(o) A1Rs. The specific expression of Cas9 and guide RNAs, and the specific KD of A1Rs, in inhibitory interneurons but not in other cell types expressing A1Rs should be quantified and validated.
In addition to the data demonstrating the specific expression of SaCas9 and sgAdora1 in Vgat<sup>+</sup> inhibitory neurons shown in Figure 3G of the initial version, we have now conducted the same experiments with a different sample and confirmed this specificity: SaCas9 (detected via HA-tag) and sgAdora1 (detected via mCherry) were expressed in PAX2<sup>+</sup> inhibitory neurons (Author response image 1). Furthermore, as shown in Figure 3H and I in the initial version, the functional reduction of A<sub>1</sub>Rs in inhibitory neurons was validated by electrophysiological recordings. Together, these results support the successful deletion of A<sub>1</sub>Rs in inhibitory neurons.
Author response image 1.
Expression of HA-tag and mCherry in inhibitory neurons (a different sample from Figure 3G) SaCas9 (yellow, detected by HA-tag) and mCherry (magenta) expression in the PAX2<sup>+</sup> inhibitory neurons (cyan) at 3 weeks after intra-SDH injection of AAV-FLEx[SaCas9-HA] and AAV-FLEx[mCherry]-U6-sgAdora1 in Vgat-Cre mice. Arrowheads indicate genome-editing Vgat<sup>+</sup> cells. Scale bar, 25 µm.
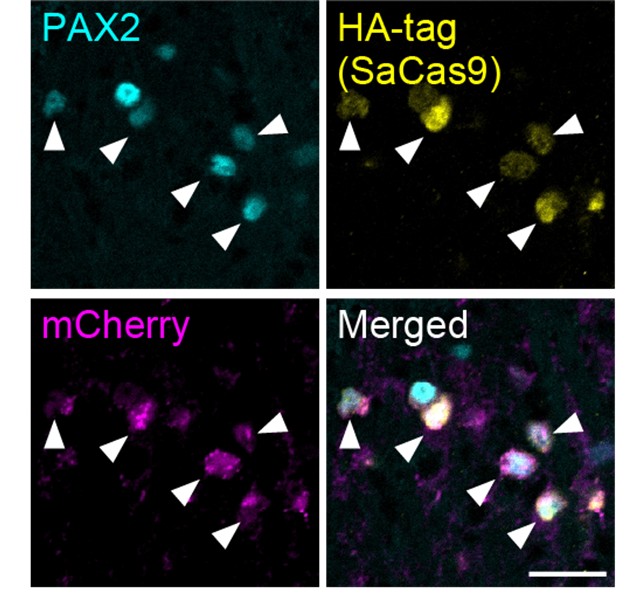
(6) Methods:
It is unclear how fiber photometry is performed using "optic cannula" during restraint stress while mice are in a 50ml falcon tube (as shown in Figure 1A).
We apologize for the omission of this detail in the Methods section. To monitor Ca<sup>2+</sup> events in LC-NA neurons during restraint stress, we created a narrow slit on the top of the conical tube, allowing mice to undergo restraint stress while connected to the optic fiber (see video). This information has now been added to the Methods section (lines 552-553).
Recommendations for the authors:
Reviewer #1 (Recommendations for the authors):
(1) Scientific rigor:
It is unclear if the normal distribution of the data was determined before selecting statistical tests.
We apologize for omitting this description. For all statistical analyses in this study, we first assessed the normality of the data and then selected appropriate statistical tests accordingly. We have added this information to the revised manuscript (lines 711-712).
(2) Nomenclature:
(a) Mouse Genome Informatics (MGI) nomenclature should be used to describe mouse genotypes (i.e., gene name in italic, only first letter is capitalized, alleles in superscript).
(b) FLEx should be used instead of flex.
Thank you for the suggestion. We have corrected these terms (including FLEx) according to MGI nomenclature.
Reviewer #2 (Public review):
Summary:
This study investigates the role of spinal astrocytes in mediating stress-induced pain hypersensitivity, focusing on the LC (locus coeruleus)-to-SDH (spinal dorsal horn) circuit and its mechanisms. The authors aimed to delineate how LC activity contributes to spinal astrocytic activation under stress conditions, explore the role of noradrenaline (NA) signaling in this process, and identify the downstream astrocytic mechanisms that influence pain hypersensitivity.
The authors provide strong evidence that 1-hour restraint stress-induced pain hypersensitivity involves the LC-to-SDH circuit, where NA triggers astrocytic calcium activity via alpha1a adrenoceptors (alpha1aRs). Blockade of alpha1aRs on astrocytes - but not on Vgat-positive SDH neurons - reduced stress-induced pain hypersensitivity. These findings are rigorously supported by well-established behavioral models and advanced genetic techniques, uncovering the critical role of spinal astrocytes in modulating stress-induced pain.
However, the study's third aim - to establish a pathway from astrocyte alpha1aRs to adenosine-mediated inhibition of SDH-Vgat neurons - is less compelling. While pharmacological and behavioral evidence is intriguing, the ex vivo findings are indirect and lack a clear connection to the stress-induced pain model. Despite these limitations, the study advances our understanding of astrocyte-neuron interactions in stress-pain contexts and provides a strong foundation for future research into glial mechanisms in pain hypersensitivity.
Strengths:
The study is built on a robust experimental design using a validated 1-hour restraint stress model, providing a reliable framework to investigate stress-induced pain hypersensitivity. The authors utilized advanced genetic tools, including retrograde AAVs, optogenetics, chemogenetics, and subpopulation-specific knockouts, allowing precise manipulation and interrogation of the LC-SDH circuit and astrocytic roles in pain modulation. Clear evidence demonstrates that NA triggers astrocytic calcium activity via alpha1aRs, and blocking these receptors effectively reduces stress-induced pain hypersensitivity.
Weaknesses:
Despite its strengths, the study presents indirect evidence for the proposed NA-to-astrocyte(alpha1aRs)-to-adenosine-to-SDH-Vgat neurons pathway, as the link between astrocytic adenosine release and stress-induced pain remains unclear. The ex vivo experiments, including NA-induced depolarization of Vgat neurons and chemogenetic stimulation of astrocytes, are challenging to interpret in the stress context, with the high CNO concentration raising concerns about specificity. Additionally, the role of astrocyte-derived D-serine is tangential and lacks clarity regarding its effects on SDH Vgat neurons. The astrocyte calcium signal "dip" after LC optostimulation-induced elevation are presented without any interpretation.
We appreciate the reviewer's careful reading of our paper. According to the reviewer's comments, we have performed new additional experiments and added some discussion in the revised manuscript (please see the point-by-point responses below).
Reviewer #2 (Recommendations for the authors):
The astrocyte-mediated pathway of NA-to-astrocyte (alpha1aRs)-to-adenosine-to-SDH Vgat neurons (A1R) in the context of stress-induced pain hypersensitivity requires more direct evidence. While the data showing that the A1R agonist CPT inhibits stress-induced hypersensitivity and that stress combined with Aβ fiber stimulation increases pERK in the SDH are intriguing, these findings primarily support the involvement of A1R on Vgat neurons and are only behaviorally consistent with SDH-Vgat neuronal A1R knockdown. The role of astrocytes in this pathway in vivo remains indirect. The ex vivo chemogenetic Gq-DREADD stimulation of SDH astrocytes, which reduced sIPSCs in Vgat neurons in a CPT-dependent manner, needs revision with non-DREADD+CNO controls to validate specificity. Furthermore, the ex vivo bath application of NA causing depolarization in Vgat neurons, blocked by CPT, adds complexity to the data leaving me wondering how astrocytes are involved in such processes, and it does not directly connect to stress-induced pain hypersensitivity. These findings are potentially useful but require additional refinement to establish their relevance to the stress model.
We thank the reviewer for the insightful feedback. First, regarding the role of astrocytes in this pathway in vivo, we showed in the initial version that mechanical pain hypersensitivities induced by intrathecal NA injection and by acute restraint stress were attenuated by both pharmacological blockade and Vgat<sup>+</sup> neuron-specific knockdown of A<sub>1</sub>Rs (Figure 4A, B). Given that NA- and stress-induced pain hypersensitivity is mediated by α<sub>1A</sub>R-dependent signaling in Hes5<sup>+</sup> astrocytes (Kohro et al., Nat Neurosci, 2020 (PMID: 33020652); this study), these findings provide in vivo evidence supporting the involvement of the NA → Hes5<sup>+</sup> astrocyte (via α<sub>1A</sub>Rs) → adenosine → Vgat<sup>+</sup> neuron (via A<sub>1</sub>Rs) pathway. As noted in the reviewer’s major comment (2), in vivo monitoring of adenosine dynamics in the SDH during stress exposure would further substantiate the astrocyte-to-neuron signaling pathway. However, we did not detect clear signals, potentially due to several technical limitations (see our response below). Acknowledging this limitation, we have now added a new paragraph in the end of Discussion section to address this issue. Second, the specificity of the effect of CNO has now been validated by additional experiments (see our response to major point (4)). Third, the reviewer’s concern regarding the action of NA on Vgat<sup>+</sup> neurons has also been addressed (see our response to major point (3) below).
Major points:
(1) The in vivo pharmacology using DCK to antagonize D-serine signaling from alpha1a-activated astrocytes is tangential, as there is limited evidence on how Vgat neurons (among many others) respond to D-serine. This aspect requires more focused exploration to substantiate its relevance.
We propose that the site of action of D-serine in our neural circuit model is the NMDA receptors (NMDARs) on excitatory neurons, a notion supported by our previous findings (Kohro et al., Nat Neurosci, 2020 (PMID: 33020652); Kagiyama et al., Mol Brain, 2025 (PMID: 40289116)). However, we cannot exclude the possibility that D-serine also acts on NMDARs expressed by Vgat<sup>+</sup> inhibitory neurons. Nevertheless, given that intrathecal injection of D-serine in naïve mice induces mechanical pain hypersensitivity (Kohro et al., Nat Neurosci, 2020 (PMID: 33020652)), it appears that the pronociceptive effect of D-serine in the SDH is primarily associated with enhanced pain processing and transmission, presumably via NMDARs on excitatory neurons. We have added this point to the Discussion section in the revised manuscript (lines 325-330).
(2) Additionally, employing GRAB-Ado sensors to monitor adenosine dynamics in SDH astrocytes during NA signaling would significantly strengthen conclusions about astrocyte-derived adenosine's role in the stress model.
We agree with the reviewer’s comment. Following this suggestion, we attempted to visualize NA-induced adenosine (and ATP) dynamics using GRAB-ATP and GRAB-Ado sensors (Wu et al., Neuron, 2022 (PMID: 34942116); Peng et al., Science, 2020 (PMID: 32883833)) in acutely isolated spinal cord slices from mice after intra-SDH injection of AAV-hSyn-GRABATP<sub>1.0</sub> and -GRABAdo<sub>1.0</sub>. We confirmed expression of these sensors in the SDH (Author response image 2a) and observed increased signals after bath application of ATP (0.1 or 1 µM) or adenosine (1 µM) (Author response image 2b, c). However, we were unable to detect clear signals following NA stimulation (Author response image 2b, c). The reason for this lack of detectable changes remains unclear. If the release of adenosine from astrocytes is a highly localized phenomenon, it may be measurable using high-resolution microscopy capable of detecting adenosine levels at the synaptic level and more sensitive sensors. Further investigation will therefore be required (lines 340-341).
Author response image 2.
Ex vivo imaging of GRAB-ATP and GRAB-Ado sensors.(a) Representative images of GRAB<sub>ATP1.0</sub> (left, green) or GRAB<sub>Ado1.0</sub> (right, green) expression in the SDH at 3 weeks after SDH injection of AAV-hSyn-GRAB<sub>Ado1.0</sub> or AAV-hSyn-GRAB<sub>Ado1.0</sub> in Hes5-CreERT2 mice. Scale bar, 200 µm. (b) Left: Representative fluorescence images showing GRAB<sub>ATP1.0</sub> responses before and after perfusion with NA or ATP. Right: Representative traces showing responses to ATP (0.1 and 1 µM) or NA (10 µM). (c) Left: Representative fluorescence images showing GRABAdo1.0 responses before and after perfusion with NA or adenosine (Ado). Right: Representative traces showing responses to Ado (0.01, 0.1, and 1 µM), NA (10 µM), or no application (negative control).
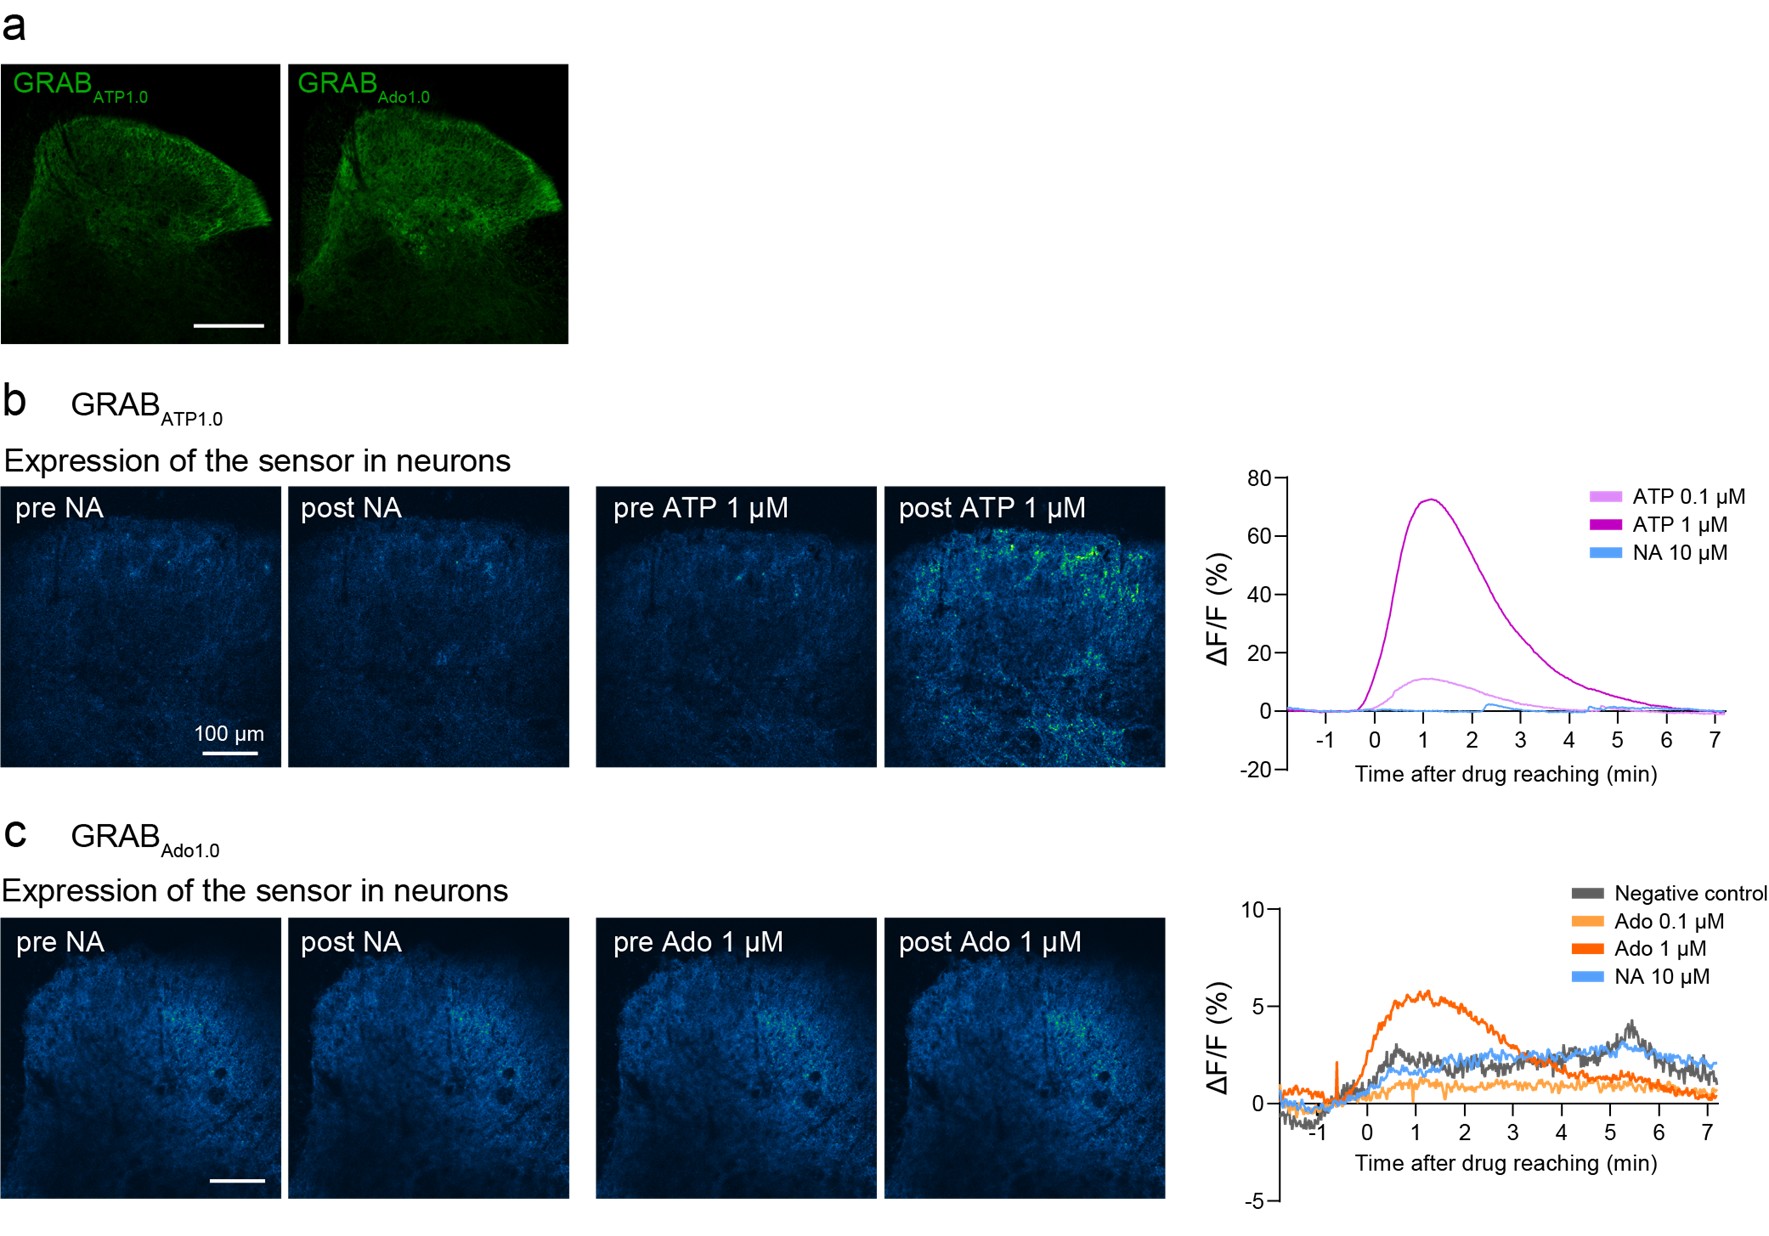
(3) The interpretation of Figure 3D is challenging. The manuscript implies that 20 μM NA acts on Adra1a receptors on Vgat neurons to depolarize them, but this concentration should also activate Adra1a on astrocytes, leading to adenosine release and potential inhibition of depolarization. The observation of depolarization despite these opposing mechanisms requires explanation, as does the inhibition of depolarization by bath-applied A1R agonist. Of note, 20 μM NA is a high concentration for Adra1a activation, typically responsive at nanomolar levels. The discussion should reconcile this with prior studies indicating dose-dependent effects of NA on pain sensitivity (e.g., Reference 22).
Like the reviewer, we also considered that bath-applied NA could activate α<sub>1A</sub>Rs expressed on Hes5<sup>+</sup> astrocytes. To clarify this point, we have performed additional patch-clamp recordings and found that knockdown of A<sub>1</sub>Rs in Vgat<sup>+</sup> neurons tended to increase the proportion of Vgat<sup>+</sup> neurons with NA-induced depolarizing responses (Figure S8). Therefore, it is conceivable that NA-induced excitation of Vgat<sup>+</sup> neurons may involve both a direct effect of NA activating α<sub>1A</sub>Rs in Vgat<sup>+</sup> neurons and an indirect inhibitory signaling from NA-stimulated Hes5<sup>+</sup> astrocytes via adenosine (lines 298-300).
The concentration of NA used in our ex vivo experiments is higher than that typically used in vitro with αR-<sub>1A</sub>expressing cell lines or primary culture cells, but is comparable to concentrations used in other studies employing spinal cord slices (Kohro et al., Nat Neurosci, 2020 (PMID: 33020652); Baba et al., Anesthesiology, 2000 (PMID: 10691236); Lefton et al., Science, 2025 (PMID: 40373122)). In slice experiments, drugs must diffuse through the tissue to reach target cells, resulting in a concentration gradient. Therefore, higher drug concentrations are generally necessary in slice experiments, in contrast to cultured cell experiments, where drugs are directly applied to target cells. Importantly, we have previously shown that the pharmacological effects of 20 μM NA on Vgat<sup>+</sup> neurons and Hes5<sup>+</sup> astrocytes are abolished by loss of α<sub>1A</sub>Rs in these cells (Uchiyama et al., Mol Brain, 2022 (PMID: 34980215); Kohro et al., Nat Neurosci, 2020 (PMID: 33020652)), confirming the specificity of these NA actions.
Regarding the dose-dependent effect of NA on pain sensitivity, NA-induced pain hypersensitivity is abolished in Hes5<sup>+</sup> astrocyte-specific α<sub>1A</sub>R-KO mice (Kohro et al., Nat Neurosci, 2020 (PMID: 33020652)), indicating that this behavior is mediated by α<sub>1A</sub>Rs expressed on Hes5<sup>+</sup> astrocytes. In contrast, the suppression of pain sensitivity by high doses of NA was unaffected in the KO mice (Kohro et al., Nat Neurosci, 2020 (PMID: 33020652)), suggesting that other adrenergic receptors may contribute to this phenomenon. Clarifying the responsible receptors will require future investigation.
(4) In Figure 3K-M, the CNO concentration used (100 μM) is unusually high compared to standard doses (1 to a few μM), raising concerns about potential off-target effects. Including non-hM3Dq controls and using lower CNO concentrations are essential to validate the specificity of the observed effects. Similarly, the study should clarify whether astrocyte hM3Dq stimulation alone (without NA) would induce hyperpolarization in Vgat neurons and how this interacts with NA-induced depolarization.
We acknowledge that the concentration of CNO used in our experiments is relatively high compared to that used in other reports. However, in our experiments, application of CNO at 1, 10, and 100 μM induced Ca<sup>2+</sup> increases in GCaMP6-expressing astrocytes in spinal cord slices in a concentration-dependent manner (Figure S7). Among these, 100 μM CNO most effectively replicated the NA-induced Ca<sup>2+</sup> signals in astrocytes. Based on these findings, we selected this concentration for use in both the current and previous studies (Kohro et al., Nat Neurosci., 2020 (PMID: 33020652)). Importantly, to rule out non-specific effects, we conducted control experiments using spinal cord slices from mice that did not express hM3Dq in astrocytes and confirmed that CNO had no effect on Ca<sup>2+</sup> responses in astrocytes and sIPSCs in substantial gelatinosa (SG) neurons (Figure S7; lines 223-228). Thus, although the CNO concentration used is relatively high, the observed effects of CNO are not non-specific but result from the chemogenetic activation of hM3Dq-expressing astrocytes.
In this study, we used Hes5-CreERT2 and Vgat-Cre mice to manipulate gene expression in Hes5<sup>+</sup> astrocytes and Vgat<sup>+</sup> neurons, respectively. In order to fully address the reviewer’s comment, the use of both Cre lines is necessary. However, simultaneous and independent genetic manipulation in each cell type using Cre activity alone is not feasible with the current genetic tools. We have mentioned this as a technical limitation in the Discussion section (lines 382-388).
(5) The role of D-serine released by hM3Dq-stimulated astrocytes in (separately) modulating sub-types of neurons including excitatory neurons and Vgat positives needs more detailed discussion. If no effect of D-serine on Vgat neurons is observed, this should be explicitly stated, and the discussion should address why this might be the case.
As mentioned in our response to Major Point (1) above, we have added a discussion of this point in the revised manuscript (lines 325-330).
(6) Finally, the observed "dip" in astrocyte calcium signals below baseline following the large peaks with LC optostimulation should be discussed further, as understanding this phenomenon could provide valuable insights into astrocytic signaling dynamics in the context of single acute or repetitive chronic stress.
Thank you for your comment. We found that this phenomenon was not affected by pretreatment with the α<sub>1A</sub>R-specific antagonist silodosin (Author response image 3), which effectively suppressed Ca<sup>2+</sup> elevations evoked by stimulation of LC-NA neurons (Figure 2F). This implies that the phenomenon is independent of α<sub>1A</sub>R signaling. Elucidating the detailed underlying mechanism remains an important direction for future investigation.
Author response image 3.
The observed "dip" in astrocyte Ca<sup>2+</sup> signals was not affected by pretreatment with the α<sub>1A</sub>R-specific antagonist silodosin. Representative traces of astrocytic GCaMP6m signals in response to optogenetic stimulation of LC-NAe<sup>→SDH</sup>rgic axons/terminals in a spinal cord slice. Each trace shows the GCaMP6m signal before and after optogenetic stimulation (625 nm, 1 mW, 10 Hz, 5 ms pulse duration, 10 s). Slices were pretreated with silodosin (40 nM) for 5 min prior to stimulation.
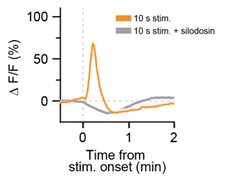
Reviewer #3 (Public review):
Summary:
This is an exciting and timely study addressing the role of descending noradrenergic systems in nocifensive responses. While it is well-established that spinally released noradrenaline (aka norepinephrine) generally acts as an inhibitory factor in spinal sensory processing, this system is highly complex. Descending projections from the A6 (locus coeruleus, LC) and the A5 regions typically modulate spinal sensory processing and reduce pain behaviours, but certain subpopulations of LC neurons have been shown to mediate pronociceptive effects, such as those projecting to the prefrontal cortex (Hirshberg et al., PMID: 29027903).
The study proposes that descending cerulean noradrenergic neurons potentiate touch sensation via alpha-1 adrenoceptors on Hes5+ spinal astrocytes, contributing to mechanical hyperalgesia. This finding is consistent with prior work from the same group (dd et al., PMID:). However, caution is needed when generalising about LC projections, as the locus coeruleus is functionally diverse, with differences in targets, neurotransmitter co-release, and behavioural effects. Specifying the subpopulations of LC neurons involved would significantly enhance the impact and interpretability of the findings.
Strengths:
The study employs state-of-the-art molecular, genetic, and neurophysiological methods, including precise CRISPR and optogenetic targeting, to investigate the role of Hes5+ astrocytes. This approach is elegant and highlights the often-overlooked contribution of astrocytes in spinal sensory gating. The data convincingly support the role of Hes5+ astrocytes as regulators of touch sensation, coordinated by brain-derived noradrenaline in the spinal dorsal horn, opening new avenues for research into pain and touch modulation.
Furthermore, the data support a model in which superficial dorsal horn (SDH) Hes5+ astrocytes act as non-neuronal gating cells for brain-derived noradrenergic (NA) signalling through their interaction with substantia gelatinosa inhibitory interneurons. Locally released adenosine from NA-stimulated Hes5+ astrocytes, following acute restraint stress, may suppress the function of SDH-Vgat+ inhibitory interneurons, resulting in mechanical pain hypersensitivity. However, the spatially restricted neuron-astrocyte communication underlying this mechanism requires further investigation in future studies.
Weaknesses
(1) Specificity of the LC Pathway targeting
The main concern lies with how definitively the LC pathway was targeted. Were other descending noradrenergic nuclei, such as A5 or A7, also labelled in the experiments? The authors must convincingly demonstrate that the observed effects are mediated exclusively by LC noradrenergic terminals to substantiate their claims (i.e. "we identified a circuit, the descending LC→SDH-NA neurons").
(a) For instance, the direct vector injection into the LC likely results in unspecific effects due to the extreme heterogeneity of this nucleus and retrograde labelling of the A5 and A7 nuclei from the LC (i.e., Li et al., PMID: 26903420).
We appreciate the reviewer's valuable comments. To address this point, we performed additional experiments and demonstrated that intra-SDH injection of AAVretro-Cre followed by intra-LC injection of AAV2/9-EF1α-FLEx[DTR-EGFP] specifically results in DTR expression in NA neurons of the LC, but not of the A5 or A7 regions (Figure S4; lines 127-128). These results confirm the specificity of targeting the LC<sup>→SDH</sup>-NAergic pathway in our study.
(b) It is difficult to believe that the intersectional approach described in the study successfully targeted LC→SDH-NA neurons using AAVrg vectors. Previous studies (e.g., PMID: 34344259 or PMID: 36625030) demonstrated that similar strategies were ineffective for spinal-LC projections. The authors should provide detailed quantification of the efficiency of retrograde labelling and specificity of transgene expression in LC neurons projecting to the SDH.
Thank you for your comment. As we described in our response to the weakness (5)-e) of Reviewer #1 (Public review), our additional analysis showed that, under our experimental conditions, expression of genes (for example DTR) was observed in 4.4% of NA (TH<sup>+</sup>) neurons in the LC (Figure S4; lines 126-127).
The reasons for this difference between the previous studies and our current study is unclear; however, it is likely attributed to methodological differences, including the type of viral vectors employed, species differences (mouse (PMID: 34344259, our study) vs. rat (PMID: 36625030)), the amount of AAV injected into the SDH (300 nL at three sites (PMID: 34344259), and 300 nL at a single site (our study)) and LC (500 nL at a single site (PMID: 34344259), and 300 nL at a single site (our study)), as well as the depth of AAV injection in the SDH (200–300 µm from the dorsal surface of the spinal cord (PMID: 34344259), and 120–150 µm in depth from the surface of the dorsal root entry zone (our study)).
(c) Furthermore, it is striking that the authors observed a comparably strong phenotypical change in Figure 1K despite fewer neurons being labelled, compared to Figure 1H and 1N with substantially more neurons being targeted. Interestingly, the effect in Figure 1K appears more pronounced but shorter-lasting than in the comparable experiment shown in Figure 1H. This discrepancy requires further explanation.
Although only a representative section of the LC was shown in the initial version, LC<sup>→SDH</sup>-NA neurons are distributed rostrocaudally throughout the LC, as previously reported (Llorca-Torralba et al., Brain, 2022 (PMID: 34373893)). Our additional experiments analyzing multiple sections of the anterior and posterior regions of the LC have now revealed that approximately sixty LC<sup>→SDH</sup>-NA neurons express DTR, and these neurons are eliminated following DTX treatment (Figure S4; lines 126-128) (it should be noted that these neurons specifically project to the L4 segment of the SDH, and the total number of LC<sup>→SDH</sup>-NA neurons is likely much higher). Considering the specificity of LC<sup>→SDH</sup>-NAergic pathway targeting demonstrated in our study (as described above), together with the fact that primary afferent sensory fibers from the plantar skin of the hindpaw predominantly project to the L4 segment of the SDH, these data suggest that the observed behavioral changes are attributable to the loss of these neurons and that ablation of even a relatively small number of NA neurons in the LC can have a significant impact on behavior. We have added this hypothesis in the Discussion section (lines 373-382).
Regarding the data in Figures 1H and 1K, as the reviewer pointed out, a statistically significant difference was observed at 90 min in mice with ablation of LC-NA neurons, but not in those with LC<sup>→SDH</sup>-NA neuron ablation. This is likely due to a slightly higher threshold in the control group at this time point (Figure 1K), and it remains unclear whether there is a mechanistic difference between the two groups at this specific time point.
(d) A valuable addition would be staining for noradrenergic terminals in the spinal cord for the intersectional approach (Figure 1J), as done in Figures 1F/G. LC projections terminate preferentially in the SDH, whereas A5 projections terminate in the deep dorsal horn (DDH). Staining could clarify whether circuits beyond the LC are being ablated.
As suggested, we performed DTR immunostaining in the SDH; however, we did not detect any DTR immunofluorescence there. A similar result was also observed in the spinal terminals of DTR-expressing primary afferent fibers (our unpublished data). The reason for this is unclear, but to the best of our knowledge, no studies have clearly shown DTR expression at presynaptic terminals, which may be because the action of DTX on the neuronal cell body is necessary for cell ablation. Nevertheless, as described in our response to the weakness (5)-f) by Reviewer 1 (Public review), we have now confirmed the specific expression of DTR in the LC, but not in the A5 and A7 regions (Figure S4; lines 127-128).
(e) Furthermore, different LC neurons often mediate opposite physiological outcomes depending on their projection targets-for example, dorsal LC neurons projecting to the prefrontal cortex PFCx are pronociceptive, while ventral LC neurons projecting to the SC are antinociceptive (PMIDs: 29027903, 34344259, 36625030). Given this functional diversity, direct injection into the LC is likely to result in nonspecific effects.
To avoid behavioral outcomes resulting from a mixture of facilitatory and inhibitory effects caused by activating the entire population of LC-NA neurons, we employed a specific manipulation targeting LC<sup>→SDH</sup>-NA neurons using AAV vectors. The specificity of this manipulation was confirmed in our previous study (Kohro et al., Nat Neurosci, 2020 (PMID: 33020652)) and in the current study (Figure S4). Using this approach, we previously demonstrated that LC neurons can exert pronociceptive effects via astrocytes in the SDH (Kohro et al., Nat Neurosci, 2020 (PMID: 33020652)). This pronociceptive role is further supported by the current study, which uses a more selective manipulation of LC<sup>→SDH</sup>-NA neurons through a NET-Cre mouse line. In addition, intrathecal administration of relatively low doses of NA in naïve mice clearly induces mechanical pain hypersensitivity. Nevertheless, we have also acknowledged that several recent studies have reported an inhibitory role of LC<sup>→SDH</sup>-NA neurons in spinal nociceptive signaling. The reason for these differing behavioral outcomes remains unclear, but several methodological differences may underlie the discrepancy. First, the degree of LC<sup>→SDH</sup>-NA neuronal activity may play a role. Although direct comparisons between studies reporting pro- and anti-nociceptive effects are difficult, our previous studies demonstrated that intrathecal administration of high doses of NA in naïve mice does not induce mechanical pain hypersensitivity (Kohro et al., Nat Neurosci, 2020 (PMID: 33020652)). Second, the sensory modality used in behavioral testing may be a contributing factor as the pronociceptive effect of NA appears to be selectively observed in responses to mechanical, but not thermal, stimuli (Kohro et al., Nat Neurosci, 2020 (PMID: 33020652)). This sensory modality-selective effect is also evident in mice subjected to acute restraint stress (Table S1). Therefore, the role of LC<sup>→SDH</sup>-NA neurons in modulating nociceptive signaling in the SDH is more complex than previously appreciated, and their contribution to pain regulation should be reconsidered in light of factors such as NA levels, sensory modality, and experimental context. In revising the manuscript, we have included some points described above in the Discussion (lines 282-291).
Conclusion on Specificity: The authors are strongly encouraged to address these limitations directly, as they significantly affect the validity of the conclusions regarding the LC pathway. Providing more robust evidence, acknowledging experimental limitations, and incorporating complementary analyses would greatly strengthen the manuscript.
We appreciate the reviewer’s comments. We fully acknowledge the limitations raised and agree that addressing them directly is important for the rigor of our conclusions on the LC pathway. To this end, we have performed additional experiments (e.g., Figure A and S4), which are now included in the revised manuscript. Furthermore, we have also newly added a new paragraph for experimental limitations in the end of Discussion section (lines 373-408). We believe these new data substantially strengthen the validity of our findings and have clarified these points in the Discussion section.
(2) Discrepancies in Data
(a) Figures 1B and 1E: The behavioural effect of stress on PWT (Figure 1E) persists for 120 minutes, whereas Ca2+ imaging changes (Figure 1B) are only observed in the first 20 minutes, with signal attenuation starting at 30 minutes. This discrepancy requires clarification, as it impacts the proposed mechanism.
Thank you for your important comment. As pointed out by the reviewer, there is a difference between the duration of behavioral responses and Ca<sup>2+</sup> events, although the exact time point at which the PWT begins to decline remains undetermined (as behavioral testing cannot be conducted during stress exposure). A similar temporal difference was also observed following intraplantar injection of capsaicin (Kohro et al., Nat Neurosci, 2020 (PMID: 33020652)); while LC<sup>→SDH</sup>-NA neuron-mediated astrocytic Ca<sup>2+</sup> responses in SDH astrocytes last for 5–10 min after injection, behavioral hypersensitivity peaks around 60 min post-injection and gradually returns to baseline over the subsequent 60–120 min. These findings raise the possibility that astrocyte-mediated pain hypersensitivity in the SDH may involve a sustained alteration in spinal neural function, such as central sensitization. We have added this hypothesis to the Discussion section of the revised manuscript (lines 399-408), as it represents an important direction for future investigation.
(b) Figure 4E: The effect is barely visible, and the tissue resembles "Swiss cheese," suggesting poor staining quality. This is insufficient for such an important conclusion. Improved staining and/or complementary staining (e.g., cFOS) are needed. Additionally, no clear difference is observed between Stress+Ab stim. and Stress+Ab stim.+CPT, raising doubts about the robustness of the data.
As suggested, we performed c-FOS immunostaining and obtained clearer results (Figure 4E,F; lines 243-252). We also quantitatively analyzed the number of c-FOS<sup>+</sup> cells in the superficial laminae, and the results are consistent with those obtained from the pERK experiments.
(c) Discrepancy with Existing Evidence: The claim regarding the pronociceptive effect of LC→SDH-NAergic signalling on mechanical hypersensitivity contrasts with findings by Kucharczyk et al. (PMID: 35245374), who reported no facilitation of spinal convergent (wide-dynamic range) neuron responses to tactile mechanical stimuli, but potent inhibition to noxious mechanical von Frey stimulation. This discrepancy suggests alternative mechanisms may be at play and raises the question of why noxious stimuli were not tested.
In our experiments, ChrimsonR expression was observed in the superficial and deeper laminae of the spinal cord (Figure S6). Due to the technical limitations of the optical fibers used for optogenetics, the light stimulation could only reach the superficial laminae; therefore, it may not have affected the activity of neurons (including WDR neurons) located in the deeper laminae. Furthermore, the study by Kucharczyk et al. (Brain, 2022 (PMID: 35245374)) employed a stimulation protocol that differed from ours, applying continuous stimulation over several minutes. Given that the levels of NA released from LC<sup>→SDH</sup>-NAergic terminals in the SDH increase with the duration of terminal stimulation (as shown in Figure 2B), longer stimulation may result in higher levels of NA in the SDH. Considering also our data indicating that the pro- and anti-nociceptive effects of NA are dose dependent (Kohro et al., Nat Neurosci, 2020 (PMID: 33020652)), these differences may be related to LC<sup>→SDH</sup>-NA neuron activity, NA levels in the SDH, and the differential responses of SDH neurons in the superficial versus deeper laminae (lines 388-395).
(3) Sole reliance on Von Frey testing
The exclusive use of von Frey as a behavioural readout for mechanical sensitisation is a significant limitation. This assay is highly variable, and without additional supporting measures, the conclusions lack robustness. Incorporating other behavioural measures, such as the adhesive tape removal test to evaluate tactile discomfort, the needle floor walk corridor to assess sensitivity to uneven or noxious surfaces, or the kinetic weight-bearing test to measure changes in limb loading during movement, could provide complementary insights. Physiological tests, such as the Randall-Selitto test for noxious pressure thresholds or CatWalk gait analysis to evaluate changes in weight distribution and gait dynamics, would further strengthen the findings and allow for a more comprehensive assessment of mechanical sensitisation.
Thank you for your suggestion. Based on our previous findings that Hes5<sup>+</sup> astrocytes in the SDH selectively modulate mechanosensory signaling (Kohro et al., Nat Neurosci, 2020 (PMID: 33020652)), the present study focused on behavioral responses to mechanical stimuli using von Frey filaments. As we have not previously conducted most of the behavioral tests suggested by the reviewers, and as we currently lack the necessary equipments for these tests (e.g., Randall–Selitto test, CatWalk gait analysis, and weight-bearing test), we were unable to include them in this study. However, it will be of great interest in future research to investigate whether activation of the LC<sup>→SDH</sup>-NA neuron-to-SDH Hes5<sup>+</sup> astrocyte signaling pathway similarly sensitizes behavioral responses to other types of mechanical stimuli and also to investigate the sensory modality-selective pro- and antinociceptive role of LC<sup>→SDH</sup>-NAergic signaling in the SDH (lines 396-399).
Overall Conclusion
This study addresses an important and complex topic with innovative methods and compelling data. However, the conclusions rely on several assumptions that require more robust evidence. Specificity of the LC pathway, experimental discrepancies, and methodological limitations (e.g., sole reliance on von Frey) must be addressed to substantiate the claims. With these issues resolved, this work could significantly advance our understanding of astrocytic and noradrenergic contributions to pain modulation.
We have made every effort to address the reviewer’s concerns through additional experiments and analyses. Based on the new control data presented, we believe that our explanation is reasonable and acceptable. Although additional data cannot be provided on some points due to methodological constraints and limitations of the techniques currently available in our laboratory, we respectfully submit that the evidence presented sufficiently supports our conclusions.
Reviewer #3 (Recommendations for the authors):
A lot of beautiful and challenging-to-collect data is presented. Sincere congratulations to all the authors on this achievement!
Notwithstanding, please carefully reconsider the conclusions regarding the LC pathway, as additional evidence is required to ensure their specificity and robustness.
We thank the reviewer for the kind comments and for raising an important point regarding the LC pathway. The reviewer’s feedback prompted us to conduct additional investigations to further strengthen the validity of our conclusions. We have incorporated these new data and analyses into the revised manuscript, and we believe that these revisions substantially enhance the robustness and reliability of our findings.
-
-
s3.amazonaws.com s3.amazonaws.com
-
The two judgessaid that archivists have a duty to boththe government and the public. Unfor-tunately, archival dogma can lead ar-chivists to consider the needs of govern-ment first.
I agree with the judges final decision that the archivists do have a duty to the public. I think the wording is interesting, government and the public. The two are separate here. But the government is suppose to serve the people. The "immediate operational needs" I think is a way that it is serving the government and how it operates, but again, it is suppose to be in service of the people. I think the case is interesting overall because it exposed multiple ways in which a part of the government does not, particularly with destroying of documents pertaining to its citizens.
-
-
open.lib.umn.edu open.lib.umn.edu
-
whether
If useful for editing...correct word appears to be "where"
-
-
assets.uscannenberg.org assets.uscannenberg.org
-
I
This report is about women in the music industry and the percentages of the feminine gender participating in musical projects across 1,300 songs from 2012-2024. Also, they are analyzing the Billboard Hot 100 Year-End Charts and how "a total of 130 artists appeared on the Hot 100 Year-End chart of 2024 and men account[ed] for 62.3% of performers and women account[ed] for 37.7% " (Prior 1). Overall, this source claims that there is progress for women in the industry, but not as much as society wants or is expecting. They show categories and percentages of total women artists, songwriters, producers, Grammy award winners, and more that participate in the industry. The report also mentions that "women artists were relegated almost exclusively to Pop and R&B genres" (1). which means they are usually confided into certain music styles. The authors also discuss about marginalized groups that struggle in the industry, but I am focusing on women and their main obstacles for now. This study was conducted by USC Annenberg. They conducted a survey that directly correlated with Spotify. Spotify is a well-known music streaming platform for artists. The study includes percentages, graphs, ratios, and visuals that help the readers understand the data that is shown about women and men. This source is important to my research because it highlights specific percentages and data for women across 1,300 of the most popular songs from 2012-2024, which is a practical timeline to analyze. Also, the report gives me multiple categories of data on females, specifically on songwriters, artists, producers, Grammy awards, and more which are my main focus points for my research.
-
-
hsigstad.github.io hsigstad.github.io
-
A large detection literature
I wonder whether we should motivate the paper with a big picture policy question (how to fight corruption) that requires understanding how it works and is organized. Knowing that we can better understand how the organizing responds to enforcement, what are signatures to look for (and which signatures are easily circumvented). Not sure exactly. But point is we must start with a very clear policy question. Then argue that existing literature comes short. Not just start with literature gap.
-
-
www.reddit.com www.reddit.com
-
Yup. When I was in college, they assigned everyone with a task to design and develop a website for a local business founded by the elderly and for the elderly. Worked super hard (was just getting into web design and dev) and created, what I and my friends thought, was a beautiful site form scratch. I thought I had a good shot at winning but they ended up picking a website that was covered in one color and used a very basic free pre-built bootstrap theme. It even had a little footer that said ‘theme from xyz’ at the bottom of the page when they presented it to the client. Old people and their taste can be surprising.
The complainants' comments here are pure occupational psychosis.
See also: déformation professionnelle.
-
-
butler.instructure.com butler.instructure.com
-
Kuntillet Ajrud inscriptions
BiblicalArchaeology.org confirms that the Kuntillet Ajrud inscriptons mention Asherah. These inscriptions were found on large storage containers, but according to this website, some scholars have interpreted both figures as male. Furthermore, another article from this website says that there is a plural term for Ashera, Asherim, which may mean that this term refers to a type of deity. It is also mentioned that there are both masculine and feminine forms of this word "asherim" in Hebrew.
-
Today, the scholarly consensus holds that Asherah was indeed worshipped alongside Yahweh in ancient Israel, particularly during the monarchic period
The Jewish Women's Archive backs up this claim, saying that "YHWH and Asherah were appropriately worshipped as a pair."
-
The evidence that the God of Israel had a wife is substantial and multifaceted
I feel like a lot of the evidence that this article is trying to use is almost taken out of context. I found myself asking more questions than finding answers.
-
Thus, references to Asherah remain, now framed as negative examples of Israel's repeated "unfaithfulness" to God.
Did find that to be true in references to the worshiping of the golden calf in Exodus.
-
The most famous discovery comes from Kuntillet Ajrud, a site in the Sinai Peninsula dating to around 800 BCE.
Found some differing information regarding time and location, but nothing so crazy that it feels all wrong yet. And some is the same. (epic arcaeology)
-
Proverbs 8 personifies Wisdom (Hokmah in Hebrew) as a female figure who was with God from the beginning of creation.
I read Proverbs 8 and even without having the word "her" at the beginning to tell us that this is a woman's voice, it sounds like a mother talking to her children.
-
For example, Proverbs 8 personifies Wisdom (Hokmah in Hebrew) as a female figure who was with God from the beginning of creation. Several scholars have argued that this personified Wisdom is actually a sanitized version of Asherah, transformed by later editors from a goddess into an abstract concept while retaining feminine qualities and language that suggest an intimate relationship with God.
I searched up this idea of the feminine idea of "Wisdom." I first looked into Proverbs 8. Proverbs 8 does have Wisdom in a feminine lens as Proverbs 8:1 states "Does not wisdom call out? Does not understanding raise her voice?" https://www.biblegateway.com/passage/?search=Proverbs%208&version=NIV
When searching up who Wisdom was, I read more about who this figure is. Jewish Women's' Archive has an article about why Wisdom is portrayed as a feminine figure. The article states the idea of the word "wisdom" is a feminine noun in Hebrew. The site also gives the idea that this can be the case to be a counterpoint to a negative form of a woman, referred to as "loose woman." https://jwa.org/encyclopedia/article/woman-wisdom-bible
-
Since many scholars believe that Yahweh and El were originally distinct deities who became merged in Israelite tradition, it makes perfect sense that Asherah, El's consort, would have been adopted as Yahweh's consort as well. The transfer of divine attributes and relationships from El to Yahweh would naturally have included El's wife.
Looked up and thought it was interesting what I found. Many ancient gods were known to have many wives or consorts, but the Israelite God only thought of or known to have one. Even though it was common to see in the Bible men having many wives, it does not say that God did. Does this 1. reinforce the idea of monotheism or 2. that marriage is stated clearly by God for two people?
-
They embarked on an aggressive campaign to purge Asherah worship and to rewrite Israelite religious history as having always been monotheistic.
It seems like one of the articles that this Chatbot referenced was https://www.thegospelcoalition.org/themelios/review/did-god-have-a-wife/ , a review on a book written by William Dever about wether or not God had a wife. The Chatbot seems to forget though, at the bottom of the review, the author gives contrasting information and disagreements with Dever's argument. Notably this quote I have attached here. "While archaeological data does testify that, at various points in its history, ancient Israel largely failed to be monolatrous or monotheistic, this is in accord with the biblical text.Thus, Israel did not have a polytheistic history in the sense that it embraced polytheism as one stage in its religious evolution. We should not confuse the history of Israel’s failures with the history of monotheism."
-
The prophet Jeremiah (7:18 and 44:15-25) describes how entire families participated in making offerings to the "Queen of Heaven"—men gathered wood, women kneaded dough, and children helped prepare cakes for this female deity
Sounds like what ancient Greeks did to worship their gods. That is where this idea was first brought up in a class for me, talking about ancient Greece.
-
Notably, in Jeremiah 44, the women defend their worship of the Queen of Heaven, arguing that they prospered when they honored her and suffered only when they stopped—suggesting this practice was both longstanding and widely accepted.
Jeremiah 44 is titled as "Disaster Because of Idolatry." The passage discusses how it people were worshipping a "Queen of Heaven." But, this was a form of idolatry as Jeremiah questioned them that the Lord provides for them and asked if they remember that. This text from the Bible is rejecting the idea of people worshipping another god. https://www.biblegateway.com/passage/?search=Jeremiah%2044&version=NIV
-
from the 8th and 7th centuries BCE.
Much more narrowed down timeline than I first found.
-
he evidence overwhelmingly suggests that for much of ancient Israelite history, ordinary Israelites believed their God had a divine wife, and this belief was likely reflected in both popular and official religious practices.
Fact checked and found that it is believed but sources differ between Israelites and Canaanites. (Jewish Women's Archive and Catholic Answers)
-
Most scholars now agree that Yahweh, the God of ancient Israel, was originally worshipped alongside a female consort named Asherah.
Did look up, found that it is true according to Jewish Women's Archive.
-
strongly suggests that at least some segments of Israelite society, including perhaps the royal court, saw no contradiction between monotheistic Yahweh worship and the veneration of his consort
2 Kings 21:6 mentions that King Manasseh, did "much evil in the sight of the LORD, provoking him to anger"
-
overwhelmingly
This is a word of bias. Usually in works like these, there should be an unbiased tone.
-
2 Kings 21:7 mentions that King Manasseh placed an image of Asherah in the Temple,
It does say this yes, however how I am reading this passage in context, the portrait of Asherah is a portrait of a foreign god, because the King had been placing portraits and idols in the temple which was upsetting a lot of people.
-
Most scholars now agree that Yahweh, the God of ancient Israel, was originally worshipped alongside a female consort named Asherah.
I am wondering how many scholars agree about this statement. When searching this up broadly on Google, this topic is still a wide debate with many still saying no. Especially looking into the Google platform, there are sites like https://versebyverseministry.org/bible-answers/does-god-have-a-wife and https://www.biblegateway.com/blog/2011/03/did-god-have-a-wife/ that state that the answer is no to this question. This idea of the chatbot wording this sentence adds a hint of bias for the reader to believe the information the bot is going to spit out below, by trying to gain their trust in the introduction.
-
-
publications.parliament.uk publications.parliament.uk
-
Women
This source is about women in the music industry that continue to face misogyny and how society wants to change this issue. Misogyny is a problem in the music industry, and it happens worldwide every day. Women still struggle with "discrimination, misogyny, and sexual abuse in an industry that is still routinely described as a 'boys’ club." Women are taken advantage of usually when working with other men--especially when drugs, money, and threats of fame come into play. Even though women are being credited more for their creative works and performing in front of large audiences, they still do not get treated the same as their male counterparts. The UK is developing the Creative Industries Independent Standards Authority (CIISA) to help prevent harassment and injustice in the music industry for women and others who experience inappropriate scenarios. There are also more organizations that are helping women face gender biases and harassment, "including the F-List, Black Lives in Music, Cactus City, and Women in CTRL, to more local schemes such as Girls Rock London, Yorkshire Sound Women Network and Manchester-based Brighter Sound, just to name a few." This source is important to my research because it shares the issues that women are currently facing within the music industry but also showcasing how we can improve the industry to make it a better place for everyone. This article also provides many reliable quotes that can be added in the paper from leaders or institutions in the music industry.
-
-
www.biorxiv.org www.biorxiv.org
-
eLife Assessment
This important study provides evidence for dynamic coupling between translation initiation and elongation that can help maintain low ribosome density and translational homeostasis. The authors combine single-molecule imaging with a new approach to analyze mRNA translation kinetics using Bayesian modeling. This work is overall solid and will be of interest to those studying translational regulation.
-
Reviewer #1 (Public review):
Summary:
In this study, Lamberti et al. investigate how translation initiation and elongation are coordinated at the single-mRNA level in mammalian cells. The authors aim to uncover whether and how cells dynamically adjust initiation rates in response to elongation dynamics, with the overarching goal of understanding how translational homeostasis is maintained. To this end, the study combines single-molecule live-cell imaging using the SunTag system with a kinetic modeling framework grounded in the Totally Asymmetric Simple Exclusion Process (TASEP). By applying this approach to custom reporter constructs with different coding sequences, and under perturbations of the initiation/elongation factor eIF5A, the authors infer initiation and elongation rates from individual mRNAs and examine how these rates covary.
The central finding is that initiation and elongation rates are strongly correlated across a range of coding sequences, resulting in consistently low ribosome density ({less than or equal to}12% of the coding sequence occupied). This coupling is preserved under partial pharmacological inhibition of eIF5A, which slows elongation but is matched by a proportional decrease in initiation, thereby maintaining ribosome density. However, a complete genetic knockout of eIF5A disrupts this coordination, leading to reduced ribosome density, potentially due to changes in ribosome stalling resolution or degradation.
Strengths:
A key strength of this work is its methodological innovation. The authors develop and validate a TASEP-based Hidden Markov Model (HMM) to infer translation kinetics at single-mRNA resolution. This approach provides a substantial advance over previous population-level or averaged models and enables dynamic reconstruction of ribosome behavior from experimental traces. The model is carefully benchmarked against simulated data and appropriately applied. The experimental design is also strong. The authors construct matched SunTag reporters differing only in codon composition in a defined region of the coding sequence, allowing them to isolate the effects of elongation-related features while controlling for other regulatory elements. The use of both pharmacological and genetic perturbations of eIF5A adds robustness and depth to the biological conclusions. The results are compelling: across all constructs and conditions, ribosome density remains low, and initiation and elongation appear tightly coordinated, suggesting an intrinsic feedback mechanism in translational regulation. These findings challenge the classical view of translation initiation as the sole rate-limiting step and provide new insights into how cells may dynamically maintain translation efficiency and avoid ribosome collisions.
Assessment of Goals and Conclusions:
The authors successfully achieve their stated aims: they quantify translation initiation and elongation at the single-mRNA level and show that these processes are dynamically coupled to maintain low ribosome density. The modeling framework is well suited to this task, and the conclusions are supported by multiple lines of evidence, including inferred kinetic parameters, independent ribosome counts, and consistent behavior under perturbation.
Impact and Utility:
This work makes a significant conceptual and technical contribution to the field of translation biology. The modeling framework developed here opens the door to more detailed and quantitative studies of ribosome dynamics on single mRNAs and could be adapted to other imaging systems or perturbations. The discovery of initiation-elongation coupling as a general feature of translation in mammalian cells will likely influence how researchers think about translational regulation under homeostatic and stress conditions.
The data, models, and tools developed in this study will be of broad utility to the community, particularly for researchers studying translation dynamics, ribosome behavior, or the effects of codon usage and mRNA structure on protein synthesis.
Context and Interpretation:
This study contributes to a growing body of evidence that translation is not merely controlled at initiation but involves feedback between elongation and initiation. It supports the emerging view that ribosome collisions, stalling, and quality control pathways play active roles in regulating initiation rates in cis. The findings are consistent with recent studies in yeast and metazoans showing translation initiation repression following stalling events. However, the mechanistic details of this feedback remain incompletely understood and merit further investigation, particularly in physiological or stress contexts.
In summary, this is a thoughtfully executed and timely study that provides valuable insights into the dynamic regulation of translation and introduces a modeling framework with broad applicability. It will be of interest to a wide audience in molecular biology, systems biology, and quantitative imaging.
-
Reviewer #2 (Public review):
Summary:
This manuscript uses single-molecule run-off experiments and TASEP/HMM models to estimate biophysical parameters, i.e., ribosomal initiation and elongation rates. Combining inferred initiation and elongation rates, the authors quantify ribosomal density. TASEP modeling was used to simulate the mechanistic dynamics of ribosomal translation, and the HMM is used to link ribosomal dynamics to microscope intensity measurements. The authors' main conclusions and findings are:
- Ribosomal elongation rates and initiation rates are strongly coordinated.
- Elongation rates were estimated between 1 and 4.5 aa/sec. Initiation rates were estimated between 1 and 2 ribosomes/min. These values agree with previously reported ones.
- Ribosomal density was determined to be below 12% for all constructs and conditions.
- eIF5A-perturbations (GC7 inhibition) resulted in non-significant changes in translational bursting and ribosome density.
- eIF5A perturbations affected both elongation and initiation rates.
Strengths:
This manuscript presents an interesting scientific hypothesis to study ribosome initiation and elongation concurrently. This topic is relevant for the field. The manuscript presents a novel quantitative methodology to estimate ribosomal initiation rates from Harringtonine run-off assays. This is relevant because run-off assays have been used to estimate, exclusively, elongation rates.
Comments on revisions:
The authors have addressed my concerns. Specifically, they have expanded the discussion on unexpected eIF5A perturbation results, calculated CAI values for all constructs, and made code and data publicly available via GitHub and Zenodo. The mathematical notation is now consistent, and all variables are properly defined.
-
Reviewer #3 (Public review):
Disclaimer:
My expertise is in live single-molecule imaging of RNA and transcription, as well as associated data analysis and modeling. While this aligns well with the technical aspects of the manuscript, my background in translation is more limited, and I am not best positioned to assess the novelty of the biological conclusions.
Summary:
This study combines live-cell imaging of nascent proteins on single mRNAs with time-series analysis to investigate the kinetics of mRNA translation.<br /> The authors (i) used a calibration method for estimating absolute ribosome counts, and (ii) developed a new Bayesian approach to infer ribosome counts over time from run-off experiments, enabling estimation of elongation rates and ribosome density across conditions.
They report (i) translational bursting at the single-mRNA level, (ii) low ribosome density (~10% occupancy {plus minus} a few percents), (iii) that ribosome density is minimally affected by perturbations of elongation (using a drug and/or different coding sequences in the reporter), suggesting a homeostatic mechanism potentially involving a feedback of elongation onto initiation, although (iv) this coupling breaks down upon knockout of elongation factor eIF5A.
Strengths:
(1) The manuscript is well written and the conclusions are in general appropriately cautious (besides the few improvements I suggest below).
(2) The time-series inference method is interesting and promising for broader application.
(3) Simulations provide convincing support for the modeling (though some improvements are possible).
(4) The reported homeostatic effect on ribosome density is surprising and carefully validated with multiple perturbations.
(5) Imaging quality and corrections (e.g., flat-fielding, laser power measurements) are robust.
(6) Mathematical modeling is clearly described and precise; a few clarifications could improve it further.
Weaknesses:
(1) The absolute quantification of ribosome numbers (via the measurement of $i_{MP}$) should be improved. This only affects the finding that ribosome density is low, not that it appears to be under homeostatic control. However, if $i_{MP}$ turns out to be substantially overestimated (hence ribosome density underestimated), then "ribosomes queuing up to the initiation site and physically blocking initiation" could become a relevant hypothesis. In my first review of this work, I made recommendations, which the authors did not follow. In my view, the robustness of this particular aspect of this study remains moderate.
(2) The proposed initiation-elongation coupling is plausible, but alternative explanations such as changes in abortive elongation frequency should be considered. In their response to my previous comments, the authors indicate that this is "beyond the scope of the present work".
(3) More an opportunity for improvement than a weakness: It is unclear what the single-mRNA nature of the inference method is bringing since it is only used here to report _average_ ribosome elongation rate and density (averaged across mRNAs and across time during the run-off experiments -although the method, in principle, has the power to resolve these two aspects). In response to my previous comment, the authors note that such analyses could be incorporated in future work.
-
Author response:
The following is the authors’ response to the original reviews.
Public Reviews:
Reviewer #1 (Public review):
Summary:
In this study, Lamberti et al. investigate how translation initiation and elongation are coordinated at the single-mRNA level in mammalian cells. The authors aim to uncover whether and how cells dynamically adjust initiation rates in response to elongation dynamics, with the overarching goal of understanding how translational homeostasis is maintained. To this end, the study combines single-molecule live-cell imaging using the SunTag system with a kinetic modeling framework grounded in the Totally Asymmetric Simple Exclusion Process (TASEP). By applying this approach to custom reporter constructs with different coding sequences, and under perturbations of the initiation/elongation factor eIF5A, the authors infer initiation and elongation rates from individual mRNAs and examine how these rates covary.
The central finding is that initiation and elongation rates are strongly correlated across a range of coding sequences, resulting in consistently low ribosome density ({less than or equal to}12% of the coding sequence occupied). This coupling is preserved under partial pharmacological inhibition of eIF5A, which slows elongation but is matched by a proportional decrease in initiation, thereby maintaining ribosome density. However, a complete genetic knockout of eIF5A disrupts this coordination, leading to reduced ribosome density, potentially due to changes in ribosome stalling resolution or degradation.
Strengths:
A key strength of this work is its methodological innovation. The authors develop and validate a TASEP-based Hidden Markov Model (HMM) to infer translation kinetics at single-mRNA resolution. This approach provides a substantial advance over previous population-level or averaged models and enables dynamic reconstruction of ribosome behavior from experimental traces. The model is carefully benchmarked against simulated data and appropriately applied. The experimental design is also strong. The authors construct matched SunTag reporters differing only in codon composition in a defined region of the coding sequence, allowing them to isolate the effects of elongation-related features while controlling for other regulatory elements. The use of both pharmacological and genetic perturbations of eIF5A adds robustness and depth to the biological conclusions. The results are compelling: across all constructs and conditions, ribosome density remains low, and initiation and elongation appear tightly coordinated, suggesting an intrinsic feedback mechanism in translational regulation. These findings challenge the classical view of translation initiation as the sole rate-limiting step and provide new insights into how cells may dynamically maintain translation efficiency and avoid ribosome collisions.
We thank the reviewer for their constructive assessment of our work, and for recognizing the methodological innovation and experimental rigor of our study.
Weaknesses:
A limitation of the study is its reliance on exogenous reporter mRNAs in HeLa cells, which may not fully capture the complexity of endogenous translation regulation. While the authors acknowledge this, it remains unclear how generalizable the observed coupling is to native mRNAs or in different cellular contexts.
We agree that the use of exogenous reporters is a limitation inherent to the SunTag system, for which there is currently no simple alternative for single-mRNA translation imaging. However, we believe our findings are likely generalizable for several reasons.
As discussed in our introduction and discussion, there is growing mechanistic evidence in the literature for coupling between elongation (ribosome collisions) and initiation via pathways such as the GIGYF2-4EHP axis (Amaya et al. 2018, Hickey et al. 2020, Juszkiewicz et al. 2020), which might operate on both exogenous and endogenous mRNAs.
As already acknowledged in our limitations section, our exogenous reporters may not fully recapitulate certain aspects of endogenous translation (e.g., ER-coupled collagen processing), yet the observed initiation-elongation coupling was robust across all tested constructs and conditions.
We have now expanded the Discussion (L393-395) to cite complementary evidence from Dufourt et al. (2021), who used a CRISPR-based approach in Drosophila embryos to measure translation of endogenous genes. We also added a reference to Choi et al. 2025, who uses a ER-specific SunTag reporter to visualize translation at the ER (L395-397).
Additionally, the model assumes homogeneous elongation rates and does not explicitly account for ribosome pausing or collisions, which could affect inference accuracy, particularly in constructs designed to induce stalling. While the model is validated under low-density assumptions, more work may be needed to understand how deviations from these assumptions affect parameter estimates in real data.
We agree with the reviewer that the assumption of homogeneous elongation rates is a simplification, and that our work represents a first step towards rigorous single-trace analysis of translation dynamics. We have explicitly tested the robustness of our model to violations of the low-density assumption through simulations (Figure 2 - figure supplement 2). These show that while parameter inference remains accurate at low ribosome densities, accuracy slightly deteriorates at higher densities, as expected. In fact, our experimental data do provide evidence for heterogeneous elongation: the waiting times between termination events deviate significantly from an exponential distribution (Figure 3 - figure supplement 2C), indicating the presence of ribosome stalling and/or bursting, consistent with the reviewer's concern. We acknowledge in the Limitations section (L402-406) that extending the model to explicitly capture transcript-dependent elongation rates and ribosome interactions remains challenging. The TASEP is difficult to solve analytically under these conditions, but we note that simulation-based inference approaches, such as particle filters to replace HMMs, could provide a path forward for future work to capture this complexity at the single-trace level.
Furthermore, although the study observes translation "bursting" behavior, this is not explicitly modeled. Given the growing recognition of translational bursting as a regulatory feature, incorporating or quantifying this behavior more rigorously could strengthen the work's impact.
While we do not explicitly model the bursting dynamics in the HMM framework, we have quantified bursting behavior directly from the data. Specifically, we measure the duration of translated (ON) and untranslated (OFF) periods across all reporters and conditions (Figure 1G for control conditions and Figure 4G-H for perturbed conditions), finding that active translation typically lasts 10-15 minutes interspersed with shorter silent periods of 5-10 minutes. This empirical characterization demonstrates that bursting is a consistent feature of translation across our experimental conditions. The average duration of silent periods is similar to what was inferred by Livingston et al. 2023 for a similar SunTag reporter; while the average duration of active periods is substantially shorter (~15 min instead of ~40 min), which is consistent with the shorter trace duration in our system compared to theirs (~15 min compared to ~80 min, on average). Incorporating an explicit two-state or multi-state bursting model into the TASEP-HMM framework would indeed be computationally intensive and represents an important direction for future work, as it would enable inference of switching rates alongside initiation and elongation parameters. We have added this point to the Discussion (L415-417).
Assessment of Goals and Conclusions:
The authors successfully achieve their stated aims: they quantify translation initiation and elongation at the single-mRNA level and show that these processes are dynamically coupled to maintain low ribosome density. The modeling framework is well suited to this task, and the conclusions are supported by multiple lines of evidence, including inferred kinetic parameters, independent ribosome counts, and consistent behavior under perturbation.
Impact and Utility:
This work makes a significant conceptual and technical contribution to the field of translation biology. The modeling framework developed here opens the door to more detailed and quantitative studies of ribosome dynamics on single mRNAs and could be adapted to other imaging systems or perturbations. The discovery of initiation-elongation coupling as a general feature of translation in mammalian cells will likely influence how researchers think about translational regulation under homeostatic and stress conditions.
The data, models, and tools developed in this study will be of broad utility to the community, particularly for researchers studying translation dynamics, ribosome behavior, or the effects of codon usage and mRNA structure on protein synthesis.
Context and Interpretation:
This study contributes to a growing body of evidence that translation is not merely controlled at initiation but involves feedback between elongation and initiation. It supports the emerging view that ribosome collisions, stalling, and quality control pathways play active roles in regulating initiation rates in cis. The findings are consistent with recent studies in yeast and metazoans showing translation initiation repression following stalling events. However, the mechanistic details of this feedback remain incompletely understood and merit further investigation, particularly in physiological or stress contexts.
In summary, this is a thoughtfully executed and timely study that provides valuable insights into the dynamic regulation of translation and introduces a modeling framework with broad applicability. It will be of interest to a wide audience in molecular biology, systems biology, and quantitative imaging.
We appreciate the reviewer's thorough and positive assessment of our work, and that they recognize both the technical innovation of our modeling framework and its potential broad utility to the translation biology community. We agree that further mechanistic investigation of initiation-elongation feedback under various physiological contexts represents an important direction for future research.
Reviewer #2 (Public review):
Summary:
This manuscript uses single-molecule run-off experiments and TASEP/HMM models to estimate biophysical parameters, i.e., ribosomal initiation and elongation rates. Combining inferred initiation and elongation rates, the authors quantify ribosomal density. TASEP modeling was used to simulate the mechanistic dynamics of ribosomal translation, and the HMM is used to link ribosomal dynamics to microscope intensity measurements. The authors' main conclusions and findings are:
(1) Ribosomal elongation rates and initiation rates are strongly coordinated.
(2) Elongation rates were estimated between 1-4.5 aa/sec. Initiation rates were estimated between 0.5-2.5 events/min. These values agree with previously reported values.
(3) Ribosomal density was determined below 12% for all constructs and conditions.
(4) eIF5A-perturbations (KO and GC7 inhibition) resulted in non-significant changes in translational bursting and ribosome density.
(5) eIF5A perturbations resulted in increases in elongation and decreases in initiation rates.
Strengths:
This manuscript presents an interesting scientific hypothesis to study ribosome initiation and elongation concurrently. This topic is highly relevant for the field. The manuscript presents a novel quantitative methodology to estimate ribosomal initiation rates from Harringtonine run-off assays. This is relevant because run-off assays have been used to estimate, exclusively, elongation rates.
We thank the reviewer for their careful evaluation of our work and for recognizing the novelty of our quantitative methodology to extract both initiation and elongation rates from harringtonine run-off assays, extending beyond the traditional use of these experiments.
Weaknesses:
The conclusion of the strong coordination between initiation and elongation rates is interesting, but some results are unexpected, and further experimental validation is needed to ensure this coordination is valid.
We agree that some of our findings need further experimental investigation in future studies. However, we believe that the coordination between initiation and elongation is supported by multiple results in our current work: (1) the strong correlation observed across all reporters and conditions (Figure 3E), and (2) the consistent maintenance of low ribosome density despite varying elongation rates. While additional experimental validation would be valuable, we note that directly manipulating initiation or elongation independently in mammalian cells remains technically challenging. Nevertheless, our findings are consistent with emerging mechanistic understanding of collision-sensing pathways (GIGYF2-4EHP) that could mediate such coupling, as discussed in our manuscript.
(1) eIF5a perturbations resulted in a non-significant effect on the fraction of translating mRNA, translation duration, and bursting periods. Given the central role of eIF5a, I would have expected a different outcome. I would recommend that the authors expand the discussion and review more literature to justify these findings.
We appreciate this comment. This finding is indeed discussed in detail in our manuscript (Discussion, paragraphs 6-7). As we note there, while eIF5A plays a critical role in elongation, the maintenance of bursting dynamics and ribosome density upon perturbation can be explained by compensatory feedback mechanisms. Specifically, the coordinated decrease in initiation rates that counterbalances slower elongation to maintain homeostatic ribosome density. We also discuss several factors that complicate interpretation: (1) potential RQC-mediated degradation masking stronger effects in proline-rich constructs, (2) differences between GC7 treatment and genetic knockout suggesting altered stalling resolution kinetics, and (3) the limitations of using exogenous reporters that lack ER-coupled processing, which may be critical for eIF5A function in endogenous collagen translation (as suggested by Rossi et al., 2014; Mandal et al., 2016; Barba-Aliaga et al., 2021). The mechanistic complexity and tissue-specific nature of eIF5A function in mammals, which differs substantially from the better-characterized yeast system, likely contributes to the nuanced phenotype we observe. We believe our Discussion adequately addresses these points.
(2) The AAG construct leading to slow elongation is very surprising. It is the opposite of the field consensus, where codon-optimized gene sequences are expected to elongate faster. More information about each construct should be provided. I would recommend more bioinformatic analysis on this, for example, calculating CAI for all constructs, or predicting the structures of the proteins.
We agree that the slow elongation of the AAG construct is counterintuitive and indeed surprising. Following the reviewer's suggestion, we have now calculated the Codon Adaptation Index (CAI) for all constructs (Renilla 0.89, Col1a1 0.78, Col1a1 mutated 0.74). It is therefore unlikely that codon bias explains the slow translation, particularly since we designed the mutated Col1a1 construct with alanine codons selected to respect human codon usage bias, thereby minimizing changes in codon optimality. As we discuss in the manuscript, we hypothesize that the proline-to-alanine substitutions disrupted co-translational folding of the collagen-derived sequence. Prolines are critical for collagen triple-helix formation (Shoulders and Raines, 2009), and their replacement with alanines likely generates misfolded intermediates that cause ribosome stalling (Barba-Aliaga et al., 2021; Komar et al., 2024). This interpretation is supported by the high frequency (>30%) of incomplete run-off traces for AAG, suggesting persistent stalling events. Our findings thus illustrate an important potential caveat: "optimizing" a sequence based solely on codon usage can be detrimental when it disrupts functionally important structural features or co-translational folding pathways.
This highlights that elongation rates depend not only on codon optimality but also on the interplay between nascent chain properties and ribosome progression.
(3) The authors should consider using their methodology to study the effects of modifying the 5'UTR, resulting in changes in initiation rate and bursting, such as previously shown in reference Livingston et al., 2023. This may be outside of the scope of this project, but the authors could add this as a future direction and discuss if this may corroborate their conclusions.
We thank the reviewer for this excellent suggestion. We agree that applying our methodology to 5'-UTR variants would provide a complementary test of initiation-elongation coupling, and we have now added this as a future direction in the Discussion (L417-420).
(4) The mathematical model and parameter inference routines are central to the conclusions of this manuscript. In order to support reproducibility, the computational code should be made available and well-documented, with a requirements file indicating the dependencies and their versions.
We have added the Github link in the manuscript (https://github.com/naef-lab/suntag-analysis) and have also deposited the data (.ome.tif) on Zenodo (https://zenodo.org/records/17669332).
Reviewer #3 (Public review):
Disclaimer:
My expertise is in live single-molecule imaging of RNA and transcription, as well as associated data analysis and modeling. While this aligns well with the technical aspects of the manuscript, my background in translation is more limited, and I am not best positioned to assess the novelty of the biological conclusions.
Summary:
This study combines live-cell imaging of nascent proteins on single mRNAs with time-series analysis to investigate the kinetics of mRNA translation.
The authors (i) used a calibration method for estimating absolute ribosome counts, and (ii) developed a new Bayesian approach to infer ribosome counts over time from run-off experiments, enabling estimation of elongation rates and ribosome density across conditions.
They report (i) translational bursting at the single-mRNA level, (ii) low ribosome density (~10% occupancy
{plus minus} a few percents), (iii) that ribosome density is minimally affected by perturbations of elongation (using a drug and/or different coding sequences in the reporter), suggesting a homeostatic mechanism potentially involving a feedback of elongation onto initiation, although (iv) this coupling breaks down upon knockout of elongation factor eIF5A.
Strengths:
(1) The manuscript is well written, and the conclusions are, in general, appropriately cautious (besides the few improvements I suggest below).
(2) The time-series inference method is interesting and promising for broader applications.
(3) Simulations provide convincing support for the modeling (though some improvements are possible).
(4) The reported homeostatic effect on ribosome density is surprising and carefully validated with multiple perturbations.
(5) Imaging quality and corrections (e.g., flat-fielding, laser power measurements) are robust.
(6) Mathematical modeling is clearly described and precise; a few clarifications could improve it further.
We thank the reviewer for recognizing the novelty of the approach and its rigour, and for providing suggestions to improve it further.
Weaknesses:
(1) The absolute quantification of ribosome numbers (via the measurement of $i_{MP}$ ) should be improved.This only affects the finding that ribosome density is low, not that it appears to be under homeostatic control. However, if $i_{MP}$ turns out to be substantially overestimated (hence ribosome density underestimated), then "ribosomes queuing up to the initiation site and physically blocking initiation" could become a relevant hypothesis. In my detailed recommendations to the authors, I list points that need clarification in their quantifications and suggest an independent validation experiment (measuring the intensity of an object with a known number of GFP molecules, e.g., MS2-GFP MS2-GFP-labeled RNAs, or individual GEMs).
We agree with the reviewer that the estimation of the number of ribosomes is central to our finding that translation happens at low density on our reporters. This result derives from our measurement of the intensity of one mature protein (i<sub>MP</sub>), that we have achieved by using a SunTag reporter with a RH1 domain in the C terminus of the mature protein, allowing us to stabilise mature proteins via actin-tethering. In addition, as suggested by the reviewer, we already validated this result with an independent estimate of the mature protein intensity (Figure 5 - figure supplement 2B), which was obtained by adding the mature protein intensity directly as a free parameter of the HMM. The inferred value of mature protein intensity for each construct (10-15 a.u) was remarkably close to the experimental calibration result (14 ± 2 a.u.). Therefore, we have confidence that our absolute quantification of ribosome numbers is accurate.
(2) The proposed initiation-elongation coupling is plausible, but alternative explanations, such as changes in abortive elongation frequency, should be considered more carefully. The authors mention this possibility, but should test or rule it out quantitatively.
We thank the reviewer for the comment, but we consider that ruling out alternative explanations through new perturbation experiments is beyond the scope of the present work.
(3) The observation of translational bursting is presented as novel, but similar findings were reported by Livingston et al. (2023) using a similar SunTag-MS2 system. This prior work should be acknowledged, and the added value of the current approach clarified.
We did cite Livingston et al. (2023) in several places, but we recognized that we could add a few citations in key places, to make clear that the observation of bursting is not novel but is in agreement with previous results. We now did so in the Results and Discussion sections.
(4) It is unclear what the single-mRNA nature of the inference method is bringing since it is only used here to report _average_ ribosome elongation rate and density (averaged across mRNAs and across time during the run-off experiments - although the method, in principle, has the power to resolve these two aspects).
While decoding individual traces, our model infers shared (population-level) rates. Inferring transcript-specific parameters would be more informative, but it is highly challenging due to the uncertainty on the initial ribosome distribution on single transcripts. Pooling multiple transcripts together allows us to use some assumptions on the initial distribution and infer average elongation and initiation-rate parameters, while revealing substantial mRNA-to-mRNA variability in the posterior decoding (e.g. Figure 3 - figure Supplement 2C). Indeed, the inference still informs on the single-trace run-off time distribution (Figure 3 A) and the waiting time between termination events (Figure 3 - figure supplement 2C), suggesting the presence of stalling and bursting. In addition, the transcript-to-transcript heterogeneity is likely accounted for by our model better than previous methods (linear fit of the average run-off intensity), as suggested by their comparison (Figure 3 - figure supplement 2 A). In the future the model could be refined by introducing transcript-specific parameters, possibly in a hierarchical way, alongside shared parameters.
(5) I did not find any statement about data availability. The data should be made available. Their absence limits the ability to fully assess and reproduce the findings.
We have added the Github link in the manuscript (https://github.com/naef-lab/suntag-analysis) and have also deposited the data (.ome.tif) on Zenodo (https://zenodo.org/records/17669332).
Recommendations for the authors:
Reviewer #1 (Recommendations for the authors):
Major Comments:
(1) Lack of Explicit Bursting Model
Although translation "bursts" are observed, the current framework does not explicitly model initiation as a stochastic ON/OFF process. This limits insight into regulatory mechanisms controlling burst frequency or duration. The authors should either incorporate a two-state/more-state (bursting) model of initiation or perform statistical analysis (e.g., dwell-time distributions) to quantify bursting dynamics. They should clarify how bursting influences the interpretation of initiation rate estimates.
We agree with the reviewer that an explicit bursting model (e.g., a two-state telegraph model) would be the ideal theoretical framework. However, integrating such a model into the TASEP-HMM inference framework is computationally intensive and complex. As a robust first step, we have opted to quantify bursting empirically based on the decoded single-mRNA traces. As shown in Figure 1G (control) and Figure 4G (perturbed conditions), we explicitly measured the duration of "ON" (translated) and "OFF" (untranslated) periods. This statistical analysis provides a quantitative description of the bursting dynamics without relying on the specific assumptions of a telegraph model. We have clarified this in the text (L123-125) and, as suggested, added a discussion (L415-417) on the potential extensions of the model to include explicit switching kinetics in the Outlook section.
(2) Assumption of Uniform Elongation Rates
The model assumes homogeneous elongation across coding sequences, which may not hold for stalling-prone inserts (e.g., PPG). This simplification could bias inference, particularly in cases of sequence-specific pausing. Adding simulations or sensitivity analysis to assess how non-uniform elongation affects the accuracy of inferred parameters. The authors should explicitly discuss how ribosome stalling, collisions, or heterogeneity might skew model outputs (see point 4).
A strong stalling sequence that affects all ribosomes equally should not deteriorate the inference of the initiation rate, provided that the low-density assumption holds. The scenario where stalling events lead to higher density, and thus increased ribosome-ribosome interactions, is comparable to the conditions explored in Figure 2E. In those simulations, we tested the inference on data generated with varying initiation and elongation rates, resulting in ribosome densities ranging from low to high. We demonstrated that the inference remains robust at low ribosome densities (<10%). At higher densities, the accuracy of the initiation rate estimate decreases, whereas the elongation rate estimate remains comparatively robust. Additionally, the model tends to overestimate ribosome density under high-density conditions, likely because it neglects ribosome interference at the initiation site (Figure 2 figure supplement 2C). We agree that a deeper investigation into the consequences of stochastic stalling and bursting would be beneficial, and we have explicitly acknowledged this in the Limitations section.
(3) Interpretation of eIF5A Knockout Phenotype
The observation that eIF5A KO reduces initiation more than elongation, leading to decreased ribosome density, is biologically intriguing. However, the explanation invoking altered RQC kinetics is speculative and not directly tested. The authors should consider validating the RQC hypothesis by monitoring reporter mRNA stability, ribosome collision markers, or translation termination intermediates.
We thank the reviewer for the comment, but we consider that ruling out alternative explanations through new experiments is beyond the scope of the present work.
(4) To strengthen the manuscript, the authors should incorporate insights from three studies.
- Livingston et al. (PMC10330622) found that translation occurs in bursts, influenced by mRNA features and initiation factors, supporting the coupling of initiation and elongation.
- Madern et al. (PMID: 39892379) demonstrated that ribosome cooperativity enhances translational efficiency, highlighting coordinated ribosome behavior.
- Dufourt et al. (PMID: 33927056) observed that high initiation rates correlate with high elongation rates, suggesting a conserved mechanism across cell cultures and organisms.
Integrating these studies could enrich the manuscript's interpretation and stimulate new avenues of thought.
We thank the reviewer for the valuable comment. We added citations of Livingston et al. in the context of translational bursting. We already cited Madern et al. in multiple places and, although its observations of ribosome cooperativity are very compelling, they cannot be linked with our observations of a feedback between initiation and elongation, and it would be very challenging to see a similar effect on our reporters. This is why we did not expressly discuss cooperativity. We also integrated Dufourt et al. in the Discussion about the possibility of designing genetically-encoded reporter. We also added a sentence about the possibility of using an ER-specific SunTag reporter, as done recently in Choi et al., Nature (2025) (https://doi.org/10.1038/s41586-025-09718-0).
Minor Comments:
(1) Use consistent naming for SunTag reporters (e.g., "PPG" vs "proline-rich") throughout.
Thank you for the comment. However, the term proline-rich always appears together with PPG, so we believe that the naming is clear and consistent.
(2) Consider a schematic overview of the experimental design and modeling pipeline for accessibility.
Thank you for the suggestion. We consider that experimental design and modeling is now sufficiently clearly described and does not justify an additional scheme.
(3) Clarify how incomplete run-off traces are handled in the HMM inference.
Incomplete run-off traces are treated identically to complete traces in our HMM inference. This is possible because our model relies on the probability of transitions occurring per time step to infer rates. It does not require observing the final "empty" state to estimate the kinetic parameters ɑ and λ. The loss of signal (e.g., mRNA moving out of the focal volume or photobleaching) does not invalidate the kinetic information contained in the portion of the trace that was observed. We have clarified this in the Methods section.
Reviewer #2 (Recommendations for the authors):
(1) Reproducibility:
(1.1) The authors should use a GitHub repository with a timestamp for the release version.
The code is available on GitHub (https://github.com/naef-lab/suntag-analysis).
(1.2) Make raw images and data available in a figure repository like Figshare.
The raw images (.ome.tif) are now available on Zenodo (https://zenodo.org/records/17669332).
(2) Paper reorganization and expansion of the intensity and ribosome quantification:
(2.1) Given the relevance of the initiation and elongation rates for the conclusions of this study, and the fact that the authors inferred these rates from the spot intensities. I recommend that the authors move Figure 1 Supplement 2 to the main text and expand the description of the process to relate spot intensity and number of ribosomes. Please also expand the figure caption for this image.
We agree with the importance of this validation. We have expanded the description of the calibration experiment in the main text and in the figure caption.
(2.2) I suggest the authors explicitly mention the use of HMM in the abstract.
We have now explicitly mentioned the TASEP-based HMM in the abstract.
(2.3) In line 492, please add the frame rate used to acquire the images for the run-off assays.
We have added the specific frame rate (one frame every 20 seconds) to the relevant section.
(3) Figures and captions:
(3.1) Figure 1, Supplement 2. Please add a description of the colors used in plots B, C.
We have expanded the caption and added the color description.
(3.2) In the Figure 2 caption. It is not clear what the authors mean by "traceseLife". Please ensure it is not a typo.
Thank you for spotting this. We have corrected the typo.
(3.3) Figure 1 A, in the cartoon N(alpha)->N-1, shouldn't the transition also depend on lambda?
The transition probability was explicitly derived in the “Bayesian modeling of run-off traces” section (Eqs. 17-18), and does not depend on λ, but only on the initiation rate under the low-density assumption.
(3.4) Figure 3, Supplement 2. "presence of bursting and stalling.." has a typo.
Corrected.
(3.5) Figure 5, panel C, the y-axis label should be "run-off time (min)."
Corrected.
(3.6) For most figures, add significance bars.
(3.7) In the figure captions, please add the total number of cells used for each condition.
We have systematically indicated the number of traces (n<sub>t</sub>) and the number of independent experiments (n<sub>e</sub>) in the captions in this format (n<sub>t</sub>, n<sub>e</sub>).
(4) Mathematical Methods:
We greatly thank the reviewer for their detailed attention to the mathematical notation. We have addressed all points below.
(4.1) In lines 555, Materials and Methods, subsection, Quantification of Intensity Traces, multiple equations are not numbered. For example, after Equation (4), no numbers are provided for the rest of the equations. Please keep consistency throughout the whole document.
We have ensured that all equations are now consistently numbered throughout the document.
(4.2) In line 588, the authors mention "$X$ is a standard normal random variable with mean $\mu$ and standard deviation $s_0$". Please ensure this is correct. A standard normal random variable has a 0 mean and std 1.
Thank you for the suggestion, we have corrected the text (L678).
(4.3) Line 546, Equation 2. The authors use mu(x,y) to describe a 2d Gaussian function. But later in line 587, the authors reuse the same variable name in equation 5 to redefine the intensity as mu = b_0 + I.
We have renamed the 2D Gaussian function to \mu_{2D}(x,y) in the spot tracking section
(4.4) For the complete document, it could be beneficial to the reader if the authors expand the definition of the relationship between the signal "y" and the spot intensity "I". Please note how the paragraph in lines 582-587 does not properly introduce "y".
We have added an explicit definition of y and its relationship to the underlying spot intensity I in the text to improve readability and clarity.
(4.5) Please ensure consistency in variable names. For example, "I" is used in line 587 for the experimental spot intensity, then line 763 redefines I(t) as the total intensity obtained from the TASEP model; please use "I_sim(t)" for simulated intensities. Please note that reusing the variable "I" for different contexts makes it hard for the reader to follow the text.
We agree that this was confusing. We have implemented the suggestion and now distinguish simulated intensities using the notation I<sub>S</sub> .
(4.6) Line 555 "The prior on the total intensity I is an "uninformative" prior" I ~ half_normal(1000). Please ensure it is not "I_0 ~ half_normal(1000)."?
We confirm that “I” is the correct variable representing the total intensity in this context; we do not use an “I<sub>0</sub>” variable here.
(4.7) In lines 595, equation 6. Ensure that the equation is correct. Shouldn't it be: s_0^2 = ln ( 1 + (sigma_meas^2 / ⟨y⟩^2) )? Please ensure that this is correct and it is not affecting the calculated values given in lines 598.
Thank you for catching this typo. We have corrected the equation in the manuscript. We confirm that the calculations performed in the code used the correct formula, so the reported values remain unchanged.
(4.8) In line 597, "the mean intensity square ^2". Please ensure it is not "the square of the temporal mean intensity."
We have corrected the text to "the square of the temporal mean intensity."
(4.9) In lines 602-619, Bayesian modeling of run-off traces, please ensure to introduce the constant "\ell". Used to define the ribosomal footprint?
We have added the explicit definition of 𝓁 as the ribosome footprint size (length of transcript occupied by one ribosome) in the "Bayesian modeling of run-off traces" section.
(4.10) Line 687 has a minor typo "[...] ribosome distribution.. Then, [...]"
We have corrected the punctuation.
(4.11) In line 678, Equation 19 introduces the constant "L_S", Please ensure that it is defined in the text.
We have added the explicit definition of L<sub>S</sub> (the length of the SunTag) to the text surrounding Equation 19.
(4.12) In line 695, Equation 22, please consider using a subscript to differentiate the variance due to ribosome configuration. For example, instead of "sigma (...)^2" use something like "sigma_c ^2 (...)". Ensure that this change is correctly applied to Equation 24 and all other affected equations.
Thank you, we have implemented the suggestions.
(4.13) In line 696, please double-check equations 26 and 27. Specifically, the denominator ^2. Given the previous text, it is hard to follow the meaning of this variable.
We have revised the notation in Equations 26 and 27 to ensure the denominator is consistent with the definitions provided in the text.
(4.14) In lines 726, the authors mention "[...], but for the purposes of this dissertation [...]", it should be "[...], but for the purposes of this study [...]"
Thank you for spotting this. We have replaced "dissertation" with "study."
(4.15) Equations 5, 28, 37, and the unnumbered equation between Equations 16 and 17 are similar, but in some, "y" does not explicitly depend on time. Please ensure this is correct.
We have verified these equations and believe they are correct.
(4.16) Please review the complete document and ensure that variables and constants used in the equations are defined in the text. Please ensure that the same variable names are not reused for different concepts. To improve readability and flow in the text, please review the complete Materials and Methods sections and evaluate if the modeling section can be written more clearly and concisely. For example, Equation 28 is repeated in the text.
We have performed a comprehensive review of the Materials and Methods section. To improve conciseness and flow, we have merged the subsection “Observation model and estimation of observation parameters” with the “Bayesian modeling of run-off traces” section. This allowed us to remove redundant definitions and repeated equations (such as the previous Equation 28). We have also checked that all variables and constants are defined upon first use and that variable names remain consistent throughout the manuscript.
Reviewer #3 (Recommendations for the authors):
(1) Data Presentation
(1.1) In main Figures 1D and 4E, the traces appear to show frequent on-off-on transitions ("bursting"), but in supplementary figures (1-S1A and 4-S1A), this behavior is seen in only ~8 of 54 traces. Are the main figure examples truly representative?
We acknowledge the reviewer's point. In Figure 1D, we selected some of the longest and most illustrative traces to highlight the bursting dynamics. We agree that the term "representative" might be misleading if interpreted as "average." We have updated the text to state "we show bursting traces" to more accurately reflect the selection.
(1.2) There are 8 videos, but I could not identify which is which.
Thank you for pointing this out. We have renamed the video files to clearly correspond to the figures and conditions they represent.
(2) Data Availability:
As noted above, the data should be shared. This is in accordance with eLife's policy: "Authors must make all original data used to support the claims of the paper, or that are required to reproduce them, available in the manuscript text, tables, figures or supplementary materials, or at a trusted digital repository (the latter is recommended). [...] eLife considers works to be published when they are posted as preprints, and expects preprints we review to meet the standards outlined here." Access to the time traces would have been helpful for reviewers.
We have now added the Github link for the code (https://github.com/naef-lab/suntag-analysis) and deposited the raw data (.ome.tif files) on Zenodo (10.5281/zenodo.17669332).
(3) Model Assumptions:
(3.1) The broad range of run-off times (Figure 3A) suggests stalling, which may be incompatible with the 'low-density' assumption used on the TASEP model, which essentially assumes that ribosomes do not bump into each other. This could impact the validity of the assumptions that ribosomes behave independently, elongate at constant speed (necessary for the continuum-limit approximation), and that the rate-limiting step is the initiation. How robust are the inferences to this assumption?
We agree that the deviation of waiting times from an exponential distribution (Figure 3 - figure supplement 2C) suggests the presence of stalling, which challenges the strict low-density assumption and constant elongation speed. We explicitly explored the robustness of our model to higher ribosome densities in simulations. As shown in Figure 2 - figure supplement 2, while the model accuracy for single parameters deteriorates at very high densities (overestimating density due to neglected interference), it remains robust for estimating global rates in the regime relevant to our data. We have expanded the discussion on the limitations of the low density and homogeneous elongation rate assumptions in the text (L404-408).
(3.2) Since all constructs share the same SunTag region, elongation rates should be identical there and diverge only in the variable region. This would affect $\gamma (t)$ and hence possibly affect the results. A brief discussion would be helpful.
This is a valid point. Currently, our model infers a single average elongation rate that effectively averages the behavior over the SunTag and the variable CDS regions. Modeling distinct rates for these regions would be a valuable extension but adds significant complexity. While our current "effective rate" approach might underestimate the magnitude of differences between reporters, it captures the global kinetic trend. We have added a brief discussion acknowledging this simplification (L408-412).
(3.3) A similar point applies to the Gillespie simulations: modeling the SunTag region with a shared elongation rate would be more accurate.
We agree. Simulating distinct rates for the SunTag and CDS would increase realism, though our current homogeneous simulations serve primarily to benchmark the inference framework itself. We have noted this as a potential future improvement (L413-414).
(3.4) Equation (13) assumes that switching between bursting and non-bursting states is much slower than the elongation time. First, this should be made explicit. Second, this is not quite true (~5 min elongation time on Figure 3-s2A vs ~5-15min switching times on Figure 1). It would be useful to show the intensity distribution at t=0 and compare it to the expected mixture distribution (i.e., a Poisson distribution + some extra 'N=0' cells).
We thank the reviewer for this insightful comment. We have added a sentence to the text explicitly stating the assumption that switching dynamics are slower than the translation time. While the timescales are indeed closer than ideal (5 min vs. 5-15 min), this assumption allows for a tractable approximation of the initial conditions for the run-off inference. Comparing the intensity distribution at t=0 to a zero-inflated Poisson distribution is an excellent suggestion for validation, which we will consider for future iterations of the model.
(4) Microscopy Quantifications:
(4.1) Figure 1-S2A shows variable scFv-GFP expression across cells. Were cells selected for uniform expression in the analysis? Or is the SunTag assumed saturated? which would then need to be demonstrated.
All cell lines used are monoclonal, and cells were selected via FACS for consistent average cytoplasmic GFP signal. We assume the SunTag is saturated based on the established characterization of the system by Tanenbaum et al. (2014), where the high affinity of the scFv-GFP ensures saturation at expression levels similar to ours.
(4.2) As translation proceeds, free scFv-GFP may become limiting due to the accumulation of mature SunTag-containing proteins. This would be difficult to detect (since mature proteins stay in the cytoplasm) and could affect intensity measurements (newly synthesized SunTag proteins getting dimmer over time).
This effect can occur with very long induction times. To mitigate this, we optimized the Doxycycline (Dox) incubation time for our harringtonine experiments to prevent excessive accumulation of mature protein. We also monitor the cytoplasmic background for granularity, which would indicate aggregation or accumulation.
(4.3) The statements "for some traces, the mRNA signal was lost before the run-off completion" (line 195) and "we observed relatively consistent fractions of translated transcripts and trace duration distributions across reporters" (line 340) should be supported by a supplementary figure.
The first statement is supported by Figure 2 - figure supplement 1, which shows representative run-off traces for all constructs, including incomplete ones.
The second statement regarding consistency is supported by the quantitative data in Figure 1E and G, which summarize the fraction of translated transcripts and trace durations across conditions.
(4.4) Measurements of single mature protein intensity $i_{MP}$:
(4.4.1) Since puromycin is used to disassemble elongating ribosomes, calibration may be biased by incomplete translation products (likely a substantial fraction, since the Dox induction is only 20min and RNAs need several minutes to be transcribed, exported, and then fully translated).
As mentioned in the “Live-cell imaging” paragraph, the imaging takes place 40 min after the end of Dox incubation. This provides ample time for mRNA export and full translation of the synthesized proteins. Consequently, the fraction of incomplete products generated by the final puromycin addition is negligible compared to the pool of fully synthesized mature proteins accumulated during the preceding hour.
(4.4.2) Line 519: "The intensity of each spot is averaged over the 100 frames". Do I understand correctly that you are looking at immobile proteins? What immobilizes these proteins? Are these small aggregates? It would be surprising that these aggregates have really only 1, 2, or 3 proteins, as suggested by Figure 1-S2A.
We are visualizing mature proteins that are specifically tethered to the actin cytoskeleton. This is achieved using a reporter where the RH1 domain is fused directly to the C-terminus of the Renilla protein (SunTag-Renilla-RH1). The RH1 domain recruits the endogenous Myosin Va motor, which anchors the protein to actin filaments, rendering it immobile. Since each Myosin Va motor interacts with one RH1 domain (and thus one mature protein), the resulting spots represent individual immobilized proteins rather than aggregates. We have now revised the text and Methods section to make this calibration strategy and the construct design clearer (L130-140).
(4.4.3) Estimating the average intensity $i_{MP}$ of single proteins all resides in the seeing discrete modes in the histogram of Figure 1-S2B, which is not very convincing. A complementary experiment, measuring *on the same microscope* the intensity of an object with a known number of GFP molecules (e.g., MS2-GFP labeled RNAs, or individual GEMs https://doi.org/10.1016/j.cell.2018.05.042 (only requiring a single transfection)) would be reassuring to convince the reader that we are not off by an order of magnitude.
While a complementary calibration experiment would be valuable, we believe our current estimate is robust because it is independently validated by our model. When we inferred i<sub>MP</sub> as a free parameter in the HMM (Figure 5 - figure supplement 2B), the resulting value (10-15 a.u.) was remarkably consistent with our experimental calibration (14 ± 2 a.u.). We have clarified this independent validation in the text to strengthen the confidence in our quantification (L264-272).
(4.4.4) Further on the histogram in Figure 1-S2B:
- The gap between the first two modes is unexpectedly sharp. Can you double-check? It means that we have a completely empty bin between two of the most populated bins.
We have double-checked the data; the plot is correct, though the sharp gap is likely due to the small sample size (n=29).
- I am surprised not to see 3 modes or more, given that panel A shows three levels of intensity (the three colors of the arrows).
As noted below, brighter foci exist but fall outside the displayed range of the histogram.
- It is unclear what the statistical test is and what it is supposed to demonstrate.
The Student's t-test compares the means of the two identified populations to confirm they are statistically distinct intensity groups.
- I count n = 29, not 31. (The sample is small enough that the bars of the histogram show clear discrete heights, proportional to 1, 2, 3, 4, and 5 --adding up all the counts, I get 29). Is there a mistake somewhere? Or are some points falling outside of the displayed x-range?
You are correct. Two brighter data points fell outside the displayed range. The total number of foci in the histogram is 29. We have corrected the figure caption and the text accordingly.
(5) Miscellaneous Points:
(5.1) Panel B in Figure 2-s1 appears to be missing.
The figure contains only one panel.
(5.2) In Equation (7), $l$ is not defined (presumably ribosome footprint length?). Instead, $J$ is defined right after eq (7), as if it were used in this equation.
Thank you for pointing this out, we have corrected it.
(5.3) Line 703, did you mean to write something else than "Equation 26" (since equation 26 is defined after)?
Yes, this was a typo. We have corrected the cross-reference.
-
-
www.youtube.com www.youtube.com
-
Stratégies d’apaisement et d’autorégulation en milieu scolaire : Analyse et mise en œuvre
Résumé exécutif
Ce document synthétise les perspectives de Madame Claudia Verrette, docteure en sciences de l’activité physique et professeure à l’UQAM, sur le déploiement des mesures d'apaisement en milieu scolaire.
Initialement issues du domaine de la santé mentale et de l'ergothérapie pour des besoins spécifiques (autisme, troubles sensoriels), ces mesures sont désormais utilisées plus largement pour favoriser l'autorégulation de tous les élèves.
L'objectif central est de maintenir ou de restaurer la « disponibilité pour l’apprentissage » de l’élève.
L'analyse identifie quatre catégories majeures d'outils : l'aménagement de l'espace, les techniques physiques, les stratégies de diversion ou d'ancrage, et l'activité physique.
La réussite de ces interventions ne repose pas sur l'objet lui-même, mais sur un processus d'accompagnement réflexif mené par l'adulte.
Pour être efficaces, ces stratégies doivent s'inscrire dans un changement de paradigme au sein de l'équipe-école, passant d'une approche punitive à une gestion bienveillante et proactive des comportements.
--------------------------------------------------------------------------------
Définition et fondements des mesures d'apaisement
Les mesures d'apaisement constituent une famille d'outils et d'activités visant à aider l'élève à s'autocontrôler.
Bien que le terme « apaisement » suggère principalement le calme (référant aux calming tools en anglais), il est plus juste de parler de mesures d'autorégulation.
Objectifs clés
• Disponibilité : Permettre à l'élève de rester dans une zone propice à l'apprentissage.
• Modulation : Selon le besoin, activer l'élève (vigilance) ou le calmer.
• Alternative : Offrir une option aux mesures coercitives traditionnelles pour gérer les comportements.
Origines et évolution
Ces outils proviennent initialement de la psychiatrie et de l'ergothérapie, conçus pour des élèves présentant des troubles du spectre de l'autisme ou des troubles d'intégration sensorielle.
Par la médiation sensorielle (pression profonde, stimulation des récepteurs musculaires), ils envoient des signaux d'apaisement au cerveau.
Aujourd'hui, leur usage s'est généralisé, notamment au primaire, pour pallier l'hyperactivité ou l'inattention.
--------------------------------------------------------------------------------
Typologie des mesures d'autorégulation
Les interventions se divisent en quatre grandes catégories distinctes, chacune répondant à des besoins spécifiques de l'élève.
| Catégorie | Exemples d'outils et d'activités | Objectifs visés | | --- | --- | --- | | Aménagement de la salle | Coins calmes, coins « zen », chaises berçantes, coussins, musique douce, écouteurs. | Offrir un espace de retrait volontaire (non punitif) loin des stimulus de la classe. | | Mesures physiques | Respiration lente et profonde (yoga, méditation), automassage (balles, rouleaux), technique de Jacobson (contraction/relâchement). | Envoyer un signal physiologique de sécurité au cerveau par la voie sensorielle et musculaire. | | Diversion et Ancrage | Ancrage : Objets lourds (animaux lestés), musique, autocollants texturés, Fidget spinners. Diversion : Puzzles, démontage d'objets, tri de blocs. | Réorienter l'attention ou se « sortir » d'une situation difficile par l'imagerie positive ou la concentration sur un objet. | | Activité physique | Corridors actifs, pauses actives, séances de 20 min d'intensité élevée, décharge motrice. | Améliorer la concentration post-effort et utiliser le mouvement comme outil de gestion comportementale. |
--------------------------------------------------------------------------------
L'activité physique comme levier d'intervention multiniveau
L'activité physique occupe une place prépondérante dans les stratégies d'apaisement, structurée selon un modèle de réponse à l'intervention :
1. Niveau Universel : Éducation physique, récréations et corridors actifs accessibles à tous les élèves pour favoriser la santé et le calme général.
2. Niveau Ciblé : Périodes supplémentaires d'activité pour des sous-groupes d'élèves, parfois utilisées comme récompense pour un comportement attendu.
3. Niveau Individualisé (Le cas du « Ring ») :
◦ Concept : Salle de décharge motrice pour élèves avec troubles graves du comportement.
◦ Fonctionnement : Séquences contrôlées (ex: 10 Jumping Jacks, poussées au mur, saut à la corde) entrecoupées de respirations profondes.
◦ Accompagnement : Un adulte guide la réflexion de l'élève sur son état émotionnel (ex: passage de la colère à une zone de retour en classe).
◦ Résultat : Ce dispositif est identifié par les élèves comme la mesure la plus efficace et appréciée.
--------------------------------------------------------------------------------
Conditions de réussite et mise en œuvre efficace
L'efficacité d'une mesure d'apaisement ne réside pas dans l'objet lui-même, qui peut sinon devenir une simple source de distraction.
Le processus d'autorégulation assistée
Pour que l'élève devienne autonome, l'adulte doit l'accompagner dans un processus cognitif en trois étapes :
• Reconnaissance : Aider l'élève à nommer son état (colère, agitation, envahissement par les pensées).
• Choix : Sélectionner l'outil approprié dans un répertoire personnel préalablement pratiqué (est-ce un besoin d'activation ou de calme ?).
• Retour réflexif : Évaluer après coup si l'outil a été efficace et s'il peut être réutilisé.
Facteurs de succès organisationnels
• Habituation : Permettre à tous les élèves d'explorer les outils au début pour dissiper l'effet de nouveauté (« lune de miel »).
• Cohérence de l'équipe-école : Les stratégies doivent être communes à tous les intervenants entourant l'élève pour assurer une prévisibilité et une efficacité accrue.
• Vision bienveillante : Abandonner le présupposé que l'élève « devrait être capable » de s'autoréguler seul, surtout au secondaire où les besoins persistent.
--------------------------------------------------------------------------------
Conclusion : Le changement de paradigme
Le passage aux mesures d'apaisement exige une réflexion profonde sur la discipline.
Un même objet (comme un banc) peut servir de punition ou d'outil d'autorégulation selon l'intention de l'adulte.
Le succès de ces mesures dépend de la volonté de l'équipe-école de s'engager vers des pratiques axées sur l'autodétermination et la bienveillance, plutôt que sur la coercition.
Sans cette concertation et cet accompagnement humain, les outils d'apaisement risquent d'être délaissés après quelques mois d'utilisation inefficace.
-
-
butler.instructure.com butler.instructure.com
-
"Queen of Heaven"
The phrase "queen of heaven" appears in two passages of the Bible. Jeremiah 7:18 and Jeremiah 44:17-25. The website I found explains that this "queen of heaven" was referring to the wife of the false god Baal not Yahweh. Then the second passage Jeremiah 44:17-25 is where Jeremiah warns people that are worshiping false gods that greater punishments await if they do not repent. They reply that they have no intentions of giving up their worship of idols, promising to continue pouring out drink offerings to the queen of heaven, Ashtoreth. So, the phrase "queen of heaven" is mainly tied up to the idea of false Gods. Therefore, I would have to say that it was taken out of contents and need to be relooked at.
Sources: https://www.gotquestions.org/Queen-of-Heaven.html https://www.christianity.com/wiki/bible/who-is-baal-in-the-bible.html
-
While the Hebrew Bible underwent extensive editing by monotheistic reformers
Happened between 1500 and 500 BCE, and there is evidence the bible has been edited although it does not explicitly say it was done by monotheistic reformers it could be inferred as reasonably true.
-
Some estimates suggest that virtually every household would have possessed such a figurine, pointing to Asherah worship as a fundamental aspect of popular Israelite religion.
While it is true that almost all household possessed the figurine I do not think this directly points to Asherah worship since most scholars mentioned were hesitant to put a name to them.
-
"pillar figurines,
I found a reputable source that dives into meaning of these pillar figurines. https://www.worldhistory.org/Judean_Pillar_Figurines/ It lists multiple reputable scholars instead of just broadly saying "some people think" or "scholars theorize" like in this essay. The main consensus I gathered seems to be that they were cultish objects that women used specifically for fertility. They were said to be earlier plaque representations of females or other goddesses that were more commonly found in Canaanite mythology.
-
ordinary Israelites
What exactly does it mean by "ordinary Israelites" and what factors contribute to someone being ordinary? What were non-ordinary people saying about the fact that God may have had a wife? This essay also feels very biased as for example most argumentative essays would have a counter paragraph to help argue against their point and make their opinion seem fairer and more contextual. This essay writes like there is no doubt about Asherah being real, but says it's one of the most intriguing debates today without mentioning view from the other side?? Seems a little sus to me tbh.
-
Most scholars
"most scholars" is a very encompassing term however it gives no statistic or specification on what kind of scholars are agreeing with this statement. Not sure this is true without more evidence :/.
-
Khirbet el-Qom, near Hebron,
Looks to be true but the websites depicting this are kinda sketchy. Only has .com websites with info. https://goddessasherah.com/ https://larshaukeland.com/bits-pieces/archeology/2-chronicles/devotion-to-asherah-in-the-khirbet-el-qom-inscription-2-chronicles-15/
-
Kuntillet Ajrud
It might depict God and Bes as two male Gods instead of God and his "wife".
-
-
butler.instructure.com butler.instructure.com
-
A key strategy of the biblical authors was the semantic demotion of Asherah. By consistently using the term asherah to refer to the wooden object ("pole," "tree") rather than the person, they depersonalized her.
Found sources backing up this claim of Asherah being "demoted", seems it started with uncapitalizing the A.
-
Asherah is the "Wet Nurse of the Gods" in Ugaritic texts
BYU's Archives confirm this and say that Asherah was seen as the mother of the other gods.
-
The Pithoi Inscriptions: Textual Evidence
https://www.biblicalarchaeology.org/daily/biblical-artifacts/puzzling-finds-from-kuntillet-ajrud-a-drawing-of-god-labeled-yahweh-and-his-asherah-or-the-egyptian-god-bes/ An article on what the drawings on the pithoi looked like with theories on what they are.
-
Hebrew Bible Goddesses and Modern Feminist Scholarship - Eternal Haunted Summer, accessed January 8, 2026,
A review of Dr. Peggy Day's book.
-
Judean Pillar Figurine
Potential resolution between Asherah as Yahweh's spouse and as his "pillar"? It is very likely both, as there are mentions of a pillar being set up in the temple.
-
Psalm 82
Psalm 82 is about God condemning other "gods." Psalm 82 also puts "gods" as lower case and in quotations. This could mean that these others were not gods but human beings. When searching up the meaning of Psalm 82, there were sites saying these "gods" could have been humans who wanted power.
-
"Queen of Heaven" (Meleket HaShamayim)
https://biblehub.com/q/Why_blame_troubles_on_stopping_offerings.htm Breakdown of Queen of Heaven in Jeremiah 44
-
etailed art-historical analysis by Pirhiya Beck and others
https://www.academia.edu/30226534/The_Identity_of_the_Standing_Figures_on_Pithos_A_from_Kuntillet_%CA%BFAjrud_A_Reassessment this also talks about the figures
-
In 1975, excavations
There is a picture of the findings they found in the excavation
-
2 Kings 23:7
https://www.biblegateway.com/passage/?search=2%20Kings%2023%3A6%2D8&version=NRSVUE Here is the NRSVUE edition. It talks about removing Asherah from the temple.
-
5.1 Anatomy of an Idol
https://www.researchgate.net/figure/Judean-pillar-figurine-from-the-National-Maritime-Museum-at-Haifa-Courtesy-of-Avshalom_fig9_331320663 This is a picture of what they look like. It gives an accurate description.
-
The Tomb Inscription
https://digital.library.villanova.edu/Record/vudl:176679/Description#tabnav They have a description of the inscription and what it looks like.
-
El
El's full name is Elohim, meaning 'strong one' https://followingjesus.org/how-yahweh-met-elohim-and-created-the-world/
-
As William Dever famously argued, "A symbol is a symbol of something."
This might be a quote from his book Symbiosis, Symbolism, and the Power of the Past. I could not find the direct quote though.
-
he number of the sons of El (Deuteronomy 32:8-9,
Neither "Seventy sons of Athirat" or the number "seventy" appear in Deuteronomy 32: 8-9. In NRSVUE the only name mentioned is Jacob, and it talks about some sort of division of people and the gods they worship.
-
Genesis 49
Jacob's last words and burial
-
Exodus 6:3
NRSVUE says "God Almighty" and the footnote says "Traditional rendering of Heb El Shaddai"
-
-
www.youtube.com www.youtube.com
-
Synthèse de la Matinale Associations : Fiscalité, Mécénat et Fonds de Dotation
Résumé Exécutif
Ce document synthétise les interventions de la Direction Régionale des Finances Publiques (DRFIP) d’Île-de-France lors d'un webinaire consacré à l'actualité fiscale des organismes sans but lucratif (OSBL).
La gestion fiscale des associations et fonds de dotation est marquée par une recherche accrue de sécurité juridique, illustrée par une hausse constante des demandes de rescrit fiscal (près de 50 % des demandes totales concernent le secteur associatif).
Les points critiques à retenir sont le renforcement des contrôles sur l'émission des reçus fiscaux suite à la loi du 24 août 2021, l'application rigoureuse des critères de non-lucrativité (règle des « 4P » et gestion désintéressée), et la distinction impérative entre le mécénat et le parrainage commercial.
Enfin, le cadre des fonds de dotation, bien que plus souple, impose des obligations déclaratives et de dotation minimale (15 000 €) strictes.
--------------------------------------------------------------------------------
I. Le Cadre d'Action de la DRFIP et la Sécurité Juridique
La Direction Régionale des Finances Publiques d'Île-de-France, et plus particulièrement son pôle de contrôle fiscal et des affaires juridiques, assure une mission de sécurisation de la dépense fiscale.
1. La montée en puissance du rescrit fiscal
Le rescrit est une procédure volontaire permettant à un organisme d'obtenir une prise de position formelle de l'administration sur son régime fiscal.
• Statistiques : En 2025, la DRFIP prévoit de traiter environ 1 140 demandes de rescrits, dont 493 concernent spécifiquement les associations (soit environ 45 %).
• Objectif : Sécuriser l'émission des reçus fiscaux pour les donateurs afin d'éviter des remises en cause ultérieures lors de contrôles.
• Limites : Le rescrit ne protège l'organisme que si les informations fournies sont exhaustives et conformes à la réalité. Il n'empêche pas un contrôle fiscal ultérieur.
2. Le renforcement des contrôles (Loi du 24 août 2021)
La loi confortant le respect des principes de la République a transformé la nature des contrôles :
• Avant 2021 : Simple contrôle de concordance des montants.
• Depuis 2021 : Contrôle de validité sur le fond. L'administration vérifie si l'organisme est réellement fondé à émettre des reçus fiscaux au regard des critères d'intérêt général.
--------------------------------------------------------------------------------
II. Analyse de la Lucrativité : Critères et Méthodologie
Le régime par défaut d'une association est l'exonération des impôts commerciaux, basée sur une présomption simple de non-lucrativité.
L'administration peut toutefois apporter la preuve contraire en suivant une analyse par étapes.
1. La gestion désintéressée
C’est la condition préalable indispensable. Elle repose sur trois piliers :
• Absence de rémunération des dirigeants : Les dirigeants doivent être bénévoles.
Une tolérance existe pour une rémunération ne dépassant pas les 3/4 du SMIC, appréciée annuellement.
• Absence de distribution de ressources : Aucun bénéfice ne doit être reversé aux membres.
• Absence d'attribution de parts d'actif : Les membres ne peuvent pas s'approprier les biens de l'association, même lors de sa dissolution.
2. L'examen de la concurrence et la règle des « 4P »
Si une association intervient dans un secteur concurrentiel, l'administration évalue ses modalités de gestion par rapport aux entreprises commerciales selon le faisceau d'indices dit des « 4P » (par ordre d'importance décroissante) :
| Critère | Analyse | | --- | --- | | Produit | L'utilité sociale du service rendu (ex: méthodes adaptées pour les troubles dys). | | Public | Le service s'adresse-t-il à des personnes ne pouvant normalement pas y accéder (critères sociaux) ? | | Prix | Les tarifs sont-ils nettement inférieurs au marché ou modulés selon les revenus ? | | Publicité | L'association utilise-t-elle des méthodes commerciales de promotion ou une simple information ? |
3. La notion de communauté d'intérêt
Une association peut être jugée lucrative si elle constitue le prolongement d'une entreprise commerciale ou lui offre des débouchés.
• Jurisprudence "Audace" (2016) : Une association servant de « capteur de clientèle » pour une société d'assistance juridique dirigée par la même personne a été requalifiée en organisme lucratif.
• Relations privilégiées : Cette notion s'applique lorsque l'association permet à des entreprises membres de réduire leurs dépenses (ex: études de marché à moindre coût), leur offrant ainsi un avantage concurrentiel.
--------------------------------------------------------------------------------
III. Le Régime du Mécénat et du Parrainage
Le dispositif du mécénat a été libéralisé par la loi de décembre 2023 (entrée en vigueur en janvier 2024), mais reste soumis à des définitions strictes.
1. L'intérêt général fiscal
L'intérêt général au sens fiscal (articles 200 et 238 bis du CGI) diffère du sens commun. Il exige :
• Une gestion désintéressée.
• Une activité non lucrative.
• L'absence de bénéfice pour un « cercle restreint » de personnes.
2. Distinction Mécénat vs Parrainage (Sponsoring)
La distinction repose sur la valorisation des contreparties :
• Mécénat : Il doit exister une disproportion marquée entre le don et les contreparties reçues par le donateur (ex: simple mention du nom du donateur).
• Parrainage (Sponsoring) : Si les contreparties (publicité, logos sur maillots, cocktails premium, places réservées) ont une valeur proche du montant versé, il s'agit d'une prestation de service commerciale taxable.
3. Cas particulier du spectacle vivant
Le législateur autorise certains organismes lucratifs (ex: sociétés commerciales détenues par des entités publiques) à bénéficier du mécénat pour des activités de spectacle vivant, de cinéma ou d'expositions d'art contemporain, à condition que la gestion reste désintéressée.
--------------------------------------------------------------------------------
IV. Les Fonds de Dotation : Un Outil Spécifique
Créés par la loi de 2008, les fonds de dotation visent à favoriser le mécénat pour le financement de missions d'intérêt général.
1. Modes de fonctionnement
• Fonds opérateur : Réalise lui-même des activités d'intérêt général.
• Fonds redistributeur : Collecte des fonds pour les reverser à d'autres organismes d'intérêt général.
• Mixte : Combine les deux activités.
2. Obligations et fiscalité
• Dotation minimale : 15 000 €.
• Obligations déclaratives : Déclaration annuelle en préfecture précisant le montant de la collecte et des redistributions.
• Consomptibilité : Si les statuts prévoient que la dotation peut être consommée, le fonds perd certains avantages fiscaux sur ses revenus patrimoniaux (soumission à l'IS à taux réduit).
• Taxe sur les salaires : Les fonds de dotation y sont soumis sans l'abattement dont bénéficient les associations (2 144 €), sauf pour les salaires liés à l'organisation de six manifestations de bienfaisance annuelles.
--------------------------------------------------------------------------------
V. Jurisprudences et Exemples de Contrôle
L'administration s'appuie sur des cas concrets pour illustrer l'application des règles :
• École de voile de Carantec : Requalification lucrative car la zone de chalandise (touristes venant de toute la France) et les tarifs étaient comparables aux écoles de voile commerciales de la région.
• Arrêt "Piou-Piou" (2022) : Une association de ski pour enfants entretenait des relations privilégiées avec les moniteurs de l'ESF (membres de l'association), car elle leur fournissait un débouché économique direct.
• Défense de la mémoire (Affaire Maréchal Pétain) : Le mécénat est refusé si l'activité éligible (ex: un musée) est accessoire par rapport à l'objet principal de l'association qui, lui, ne rentre pas dans les critères de la loi.
VI. Secteur Lucratif Accessoire et Sectorisation
Une association non lucrative peut exercer des activités commerciales accessoires.
• Franchise d'impôts : Jusqu'à un seuil de 90 011 € (chiffre cité pour 2023/2024), ces revenus ne sont pas imposés si l'activité non lucrative reste prépondérante.
• Au-delà du seuil : L'association doit sectoriser ses activités. Elle paie des impôts commerciaux sur le secteur lucratif dès le premier euro.
• Critère de prépondérance : L'administration ne regarde pas seulement les recettes, mais aussi la mobilisation des ressources (temps de bénévolat, occupation des locaux, salaires) pour déterminer si l'activité non lucrative reste dominante.
Tags
Annotators
URL
-
-
substack.com substack.com
-
Squats help you get off the toilet when you're older.Deadlifting will help you pick up your grandkids.Lunges will help you take the stairs.Jumping and running will keep you playing.It's not just exercises.It's training to live well so you can love life.4681551
-
-
blbw2.github.io blbw2.github.io
-
popweight
autre var de ponderation ? (eg pop => urbain, or + urbain - de PAC)
idéalement un bon prédicteur de la demande de PAC. voir eg dans RP la % d'utilisation de fioul pour chauffage. heating degree days re: saisonnalité ou pop au sens pop éligible à MPR (ici <quartile 1)
pour approximer qualité, on peut aussi regarder les DPE ---> ne sont pas renseignés. NB : sur notre dataset, on n'a pas les dossiers "MPR Sérénité" (ajd "Rénovation d'ampleur") = "Travaux de rénovation globale, qui garantissent une amélioration significative du confort et de la performance énergétique du logement (35 % minimum de gain énergétique)"
-
-
journals-sagepub-com.proxy.uba.uva.nl journals-sagepub-com.proxy.uba.uva.nl
-
‘winners-take-all-markets’
That also means people's hope is connected tightly with actual materials, either money or fames(which can be understand as a kind of social relations), hope is powerful than just a kind of virtual concept.
-
-
docs-staging.docs.admlabs.aws.swinfra.net docs-staging.docs.admlabs.aws.swinfra.net
-
start_time
creation_time
-
end_time
creation_time
-
start_time
creation_time
-
Filtering
example for filtering by the user ID: api/shared_spaces/<space_ID>/sessions?fields=session_identifier,client_type,user,creation_time,access_type,license_edition,end_time,client_ip,id&query="(creation_time>'2026-01-28T20:59:59.427Z';creation_time<'2025-11-27T20:59:59Z';(user={id=220001}))"
-
./api/shared_spaces/1001/sessions?fields=end_time,user,client_type&query="(end_time=null)"&order_by=start_time
api/shared_spaces/<space_ID>/sessions?fields=creation_time,end_time,user,client_type&query="(creation_time GE ^2026-01-01T00:00:00Z^);(creation_time LE ^2026-01-30T23:59:59Z^)"
-
-
www.biorxiv.org www.biorxiv.org
-
eLife Assessment
This manuscript reports important findings indicating that cell cycle progression and cytokinesis both contribute to the transition from early to late neural stem cell fates. Loss-of-function experimental evidence convincingly shows that disrupting the cell cycle or cytokinesis can alter cell fate. This work sets the stage for future investigations into the underlying mechanisms linking the cell cycle to the expression of temporal factors controlling cell fate.
-
Reviewer #1 (Public review):
Summary:
Drosophila larval type II neuroblasts generate diverse types of neurons by sequentially expressing different temporal identity genes during development. Previous studies have shown that transition from early temporal identity genes (such as Chinmo and Imp) to late temporal identity genes (such as Syp and Broad) depends on the activation of the expression of EcR by Seven-up (Svp) and progression through the G1/S transition of the cell cycle. In this study, Chaya and Syed examined if the expression of Syp and EcR is regulated by cell cycle and cytokinesis by knocking down CDK1 or Pav, respectively, throughout development or at specific developmental stages. They find that knocking down CDK1 or Pav either in all type II neuroblasts throughout the development or in single type neuroblast clones after larval hatching consistently leads to failure to activate late temporal identity genes Syp and EcR. To determine whether the failure of the activation of Syp and EcR is due to impaired Svp expression, they also examined Svp expression using a Svp-lacZ reporter line. They find that Svp is expressed normally in CDK1 RNAi neuroblasts. Further, knocking down CDK1 or Pav after Svp activation still leads to loss of Syp and EcR expression. Finally, they also extended their analysis to type I neuroblasts. They find that knocking down CDK1 or Pav, either at 0 hours or at 42 hours after larval hatching, also results in loss of Syp and EcR expression in type I neuroblasts. Based on these findings, the authors conclude that cycle and cytokinesis are required for the transition from early to late late temporal identity genes in both types of neuroblasts. These findings add mechanistic details to our understanding of the temporal patterning of Drosophila larval neuroblasts.
Strengths:
The data presented in the paper are solid and largely support their conclusion. Images are of high quality. The manuscript is well-written and clear.
Weaknesses:
The authors have addressed all the weaknesses in this revision.
-
Reviewer #2 (Public review):
Summary:
Neural stem cells produce a wide variety of neurons during development. The regulatory mechanisms of neural diversity are based on the spatial and temporal patterning of neural stem cells. Although the molecular basis of spatial patterning is well-understood, the temporal patterning mechanism remains unclear. In this manuscript, the authors focused on the roles of cell cycle progression and cytokinesis in temporal patterning and found that both are involved in this process.
Strengths:
They conducted RNAi-mediated disruption on cell cycle progression and cytokinesis. As they expected, both disruptions affected temporal patterning in NSCs.
Weaknesses:
Although the authors showed clear results, they needed to provide additional data to support their conclusion sufficiently.
For example, they can examine the effects of cell cycle acceleration on the temporal patterning.
-
Reviewer #3 (Public review):
Summary:
The manuscript by Chaya and Syed focuses on understanding the link between cell cycle and temporal patterning in central brain type II neural stem cells (NSCs). To investigate this, the authors perturb the progression of the cell cycle by delaying the entry into M phase and preventing cytokinesis. Their results convincingly show that temporal factor expression requires progression of the cell cycle in both Type 1 and Type 2 NSCs in the Drosophila central brain. Overall, this study establishes an important link between the two timing mechanisms of neurogenesis.
Strengths:
The authors provide solid experimental evidence for the coupling of cell cycle and temporal factor progression in Type 2 NSCs. The quantified phenotype shows an all-or-none effect of cell cycle block on the emergence of subsequent temporal factors in the NSCs, strongly suggesting that both nuclear division and cytokinesis are required for temporal progression. The authors also extend this phenotype to Type 1 NSCs in the central brain, providing a generalizable characterization of the relationship between cell cycle and temporal patterning.
Weaknesses:
One major weakness of the study is that the authors do not explore the mechanistic relationship between cell cycle and temporal factor expression. Although their results are quite convincing, they do not provide an explanation as to why Cdk1 depletion affects Syp and EcR expression but not the onset of svp. This result suggests that at least a part of the temporal cascade in NSCs is cell-cycle independent which isn't addressed or sufficiently discussed.
-
Author response:
The following is the authors’ response to the original reviews.
Public Reviews:
Reviewer #1 (Public review):
Summary:
Drosophila larval type II neuroblasts generate diverse types of neurons by sequentially expressing different temporal identity genes during development. Previous studies have shown that the transition from early temporal identity genes (such as Chinmo and Imp) to late temporal identity genes (such as Syp and Broad) depends on the activation of the expression of EcR by Seven-up (Svp) and progression through the G1/S transition of the cell cycle. In this study, Chaya and Syed examined whether the expression of Syp and EcR is regulated by cell cycle and cytokinesis by knocking down CDK1 or Pav, respectively, throughout development or at specific developmental stages. They find that knocking down CDK1 or Pav either in all type II neuroblasts throughout development or in single-type neuroblast clones after larval hatching consistently leads to failure to activate late temporal identity genes Syp and EcR. To determine whether the failure of the activation of Syp and EcR is due to impaired Svp expression, they also examined Svp expression using a Svp-lacZ reporter line. They find that Svp is expressed normally in CDK1 RNAi neuroblasts. Further, knocking down CDK1 or Pav after Svp activation still leads to loss of Syp and EcR expression. Finally, they also extended their analysis to type I neuroblasts. They find that knocking down CDK1 or Pav, either at 0 hours or at 42 hours after larval hatching, also results in loss of Syp and EcR expression in type I neuroblasts. Based on these findings, the authors conclude that cycle and cytokinesis are required for the transition from early to late temporal identity genes in both types of neuroblasts. These findings add mechanistic details to our understanding of the temporal patterning of Drosophila larval neuroblasts.
Strengths:
The data presented in the paper are solid and largely support their conclusion. Images are of high quality. The manuscript is well-written and clear.
We appreciate the reviewer’s detailed summary and recognition of the study’s strengths.
Weaknesses:
The quantifications of the expression of temporal identity genes and the interpretation of some of the data could be more rigorous.
(1) Expression of temporal identity genes may not be just positive or negative. Therefore, it would be more rigorous to quantify the expression of Imp, Syp, and EcR based on the staining intensity rather than simply counting the number of neuroblasts that are positive for these genes, which can be very subjective. Or the authors should define clearly what qualifies as "positive" (e.g., a staining intensity at least 2x background).
We thank the reviewer for this helpful suggestion. In the new version, we have now clarified how positive expression was defined and added more details of our quantification strategy to the Methods section (page 11, lines 380-388; lines 426-434 in tracked changes file). Fluorescence intensity for each neuroblast was normalized to the mean intensity of neighboring wild-type neuroblasts imaged in the same field. A neuroblast was considered positive for a given factor when its normalized nuclear intensity was at least 2× the local background. This scoring criterion was applied uniformly across all genotypes and time points. All quantifications were performed on the raw LSM files in Fiji prior to assembling the figure panels.
(2) The finding that inhibiting cytokinesis without affecting nuclear divisions by knocking down Pav leads to the loss of expression of Syp and EcR does not support their conclusion that nuclear division is also essential for the early-late gene expression switch in type II NSCs (at the bottom of the left column on page 5). No experiments were done to specifically block the nuclear division in this study specifically. This conclusion should be revised.
We blocked both cell cycle progression and cytokinesis, and both these manipulations affected temporal gene transitions, suggesting that both cell cycle and cytokinesis are essential. To our knowledge, no mechanism/tool exists that selectively blocks nuclear division while leaving cell cycle progression intact. We have added more clarification on page 4, line 123 onwards (lines 126 onwards in tracked changes file).
(3) Knocking down CDK1 in single random neuroblast clones does not make the CDK1 knockdown neuroblast develop in the same environment (except still in the same brain) as wild-type neuroblast lineages. It does not help address the concern whether "type 2 NSCS with cell cycle arrest failed to undergo normal temporal progression is indirectly due to a lack of feedback signaling from their progeny", as discussed (from the bottom of the right column on page 9 to the top of the left column on page 10). The CDK1 knockdown neuroblasts do not divide to produce progeny and thus do not receive a feedback signal from their progeny as wild-type neuroblasts do. Therefore, it cannot be ruled out that the loss of Syp and EcR expression in CDK1 knockdown neuroblasts is due to the lack of the feedback signal from their progeny. This part of the discussion needs to be clarification.
Thanks to the reviewer for raising this critical point. We agree and have added more clarification of our interpretations and limitations to our studies in the revised text on page 8, line 278-282 (lines 296-300 in tracked changes file)
(4) In Figure 2I, there is a clear EcR staining signal in the clone, which contradicts the quantification data in Figure 2J that EcR is absent in Pav RNAi neuroblasts. The authors should verify that the image and quantification data are consistent and correct.
When cytokinesis is blocked using pav-RNAi, the neuroblasts become extremely large and multinucleated. In some large pav RNAi clones, we observed a weak EcR signal near the cell membrane. However, more importantly, none of the nuclear compartments showed detectable EcR staining, where EcR is typically localized. We selected a representative nuclear image for the figure panel. To clarify this observation, we have now added an explanatory note to the discussion section on page 8, lines 283-291 (lines 301-309 in tracked changes file).
Reviewer #2 (Public review):
Summary:
Neural stem cells produce a wide variety of neurons during development. The regulatory mechanisms of neural diversity are based on the spatial and temporal patterning of neural stem cells. Although the molecular basis of spatial patterning is well-understood, the temporal patterning mechanism remains unclear. In this manuscript, the authors focused on the roles of cell cycle progression and cytokinesis in temporal patterning and found that both are involved in this process.
Strengths:
They conducted RNAi-mediated disruption on cell cycle progression and cytokinesis. As they expected, both disruptions affected temporal patterning in NSCs.
We appreciate the reviewer’s positive assessment of our experimental results.
Weaknesses:
Although the authors showed clear results, they needed to provide additional data to support their conclusion sufficiently.
For example, they need to identify type II NSCs using molecular markers (Ase/Dpn).The authors are encouraged to provide a more detailed explanation of each experiment. The current version of the manuscript is difficult for non-expert readers to understand.
Thanks for your feedback. We have now included a detailed description of how we identify type II NSCs in both wild-type and mutant clones. We have also added a representative Asense staining to clearly distinguish type 1 (Ase<sup>+</sup>) from type 2 (Ase<sup>-</sup>) NSCs see Figure S1. We have also added a resources table explaining the genotypes associated with each figure, which was omitted due to an error in the previous version of the manuscript.
Reviewer #3 (Public review):
Summary:
The manuscript by Chaya and Syed focuses on understanding the link between cell cycle and temporal patterning in central brain type II neural stem cells (NSCs). To investigate this, the authors perturb the progression of the cell cycle by delaying the entry into M phase and preventing cytokinesis. Their results convincingly show that temporal factor expression requires progression of the cell cycle in both Type 1 and Type 2 NSCs in the Drosophila central brain. Overall, this study establishes an important link between the two timing mechanisms of neurogenesis.
Strengths:
The authors provide solid experimental evidence for the coupling of cell cycle and temporal factor progression in Type 2 NSCs. The quantified phenotype shows an all-ornone effect of cell cycle block on the emergence of subsequent temporal factors in the NSCs, strongly suggesting that both nuclear division and cytokinesis are required for temporal progression. The authors also extend this phenotype to Type 1 NSCs in the central brain, providing a generalizable characterization of the relationship between cell cycle and temporal patterning.
We thank the reviewer for recognizing the robustness of our data linking the cell cycle to temporal progression.
Weaknesses:
One major weakness of the study is that the authors do not explore the mechanistic relationship between the cell cycle and temporal factor expression. Although their results are quite convincing, they do not provide an explanation as to why Cdk1 depletion affects Syp and EcR expression but not the onset of svp. This result suggests that at least a part of the temporal cascade in NSCs is cell-cycle independent, which isn't addressed or sufficiently discussed.
Thank you for bringing up this important point. We are equally interested in uncovering the mechanism by which the cell cycle regulates temporal gene transitions; however, such mechanistic exploration is beyond the scope of the present study. Interestingly, while the temporal switching factor Svp is expressed independently of the cell cycle, the subsequent temporal transitions are not. We have expanded our discussion on this intriguing finding (page 9, line 307-315; lines 345-355 in tracked changes file). Specifically, we propose that svp activation marks a cell-cycle–independent phase, whereas EcR/Syp induction likely depends on cell-cycle–coupled mechanisms, such as mitosis-dependent chromatin remodeling or daughter-cell feedback. Although further dissection of this mechanism lies beyond the current study, our findings establish a foundation for future work aimed at identifying how developmental timekeeping is molecularly coupled to cell-cycle progression.
Recommendations for the authors:
Reviewer #1 (Recommendations for the authors):
(1) Figure 1 C and D, it would be better to put a question mark to indicate that these are hypotheses to be tested.
We appreciate this suggestion and have added question marks in Figure 1C and 1D to clearly indicate that these panels represent hypotheses under investigation clearly.
(2) Figure 2A-I, Figure 4A-I, Figure 5A-I and K-S, in addition to enlarged views of single type II neuroblasts, it would be more convincing to include zoomed-out images of the entire larval brain or at least a portion of the brain to include neighboring wild-type type II neuroblasts as internal controls. Also, it would be ideal to show EcR staining from the same neuroblasts as IMP and Syp staining.
We thank the reviewer for this valuable input. In our imaging setup, the number of available antibody channels was limited to four (anti-Ase, anti-GFP, anti-Syp, and antiImp). Adding EcR in the same sample was therefore not technically possible, we performed EcR staining separately.
(3) The authors cited "Syed et al., 2024" (in the middle of the right column on page 5), but this reference is missing in the "References" section and should be added.
The missing citation has been added to the reference section.
(4) It would be better to include Ase staining in the relevant figure to indicate neuroblast identity as type I or type II.
We agree and now include representative Ase staining for both type 1 and type 2 NSC clones in Figure S1, along with corresponding text updates that describe these markers.
Reviewer #2 (Recommendations for the authors):
Major comments
(1) The present conclusion relies on the results using Cdk1 RNAi and pav RNAi. It is still possible that Cdk1 and Pav are involved in the regulation of temporal patterning independent of the regulation of cell cycle or cytokinesis, respectively. To avoid this possibility, the authors need to inhibit cell cycle progression or cytokinesis in another alternative manner.
We thank the reviewer for raising this important point. While we cannot completely exclude gene-specific, cell-cycle-independent roles for Cdk1 or Pav, we observe consistent phenotypes across several independent manipulations that slow or block the cell cycle. Also, earlier studies using orthogonal approaches that delay G1/S (Dacapo/Rbf) or impair mitochondrial OxPhos (which lengthens G1/S; van den Ameele & Brand, 2019) produce similar temporal delays. These concordant phenotypes strongly support the interpretation that altered cell-cycle progression—rather than specific roles of a single gene—is the primary cause of the defect. While we cannot exclude additional, gene-specific effects of Cdk1 or Pav, the concordant phenotypes across independent perturbations make the cell-cycle disruption model the most parsimonious interpretation. We have clarified this reasoning in the discussion section on pages 8-9, lines 293-305 (lines 311-343 in tracked changes file).
(2) To reach the present conclusion, the authors need to address the effects of acceleration of cell cycle progression or cytokinesis on temporal patterning.
We thank the reviewer for this insightful suggestion. To our knowledge, there are currently no established genetic tools that can specifically accelerate cell-cycle progression in Drosophila neuroblasts. However, our results demonstrate that blocking the cell cycle impairs the transition from early to late temporal gene expression. These findings suggest that proper cell-cycle progression is essential for the transition from early to late temporal identity in neuroblasts.
Minor comments
(3) P3L2 (right), ... we blocked the NSC cell cycle...
How did they do it?
Which fly lines were used?
Why did they use the line?
These details are now included in the Materials and Methods and the Resource Table (pages 11-13). We used Wor-Gal4, Ase-Gal80 to drive UAS-Cdk1RNAi and UASpavRNAi in type 2 NSCs
(4) P5L1(left), ... we used the flip-out approach...
Why did they conduct it?
Probably, the authors have reasons other than "to further ensure."
We have clarified in the text on page 4, lines 137-139, that the flip-out approach was used to generate random single-cell clones, enabling quantitative analysis of type 2 NSCs within an otherwise wild-type brain.
(5) P5L8(left), ... type 2 hits were confirmed by lack of the type 1 Asense... The authors must examine Deadpan (Dpn) expression as well. Because there are a lot of Asense (Ase) negative cells in the brain (neurons, glial cell, and neuroepithelial cells).
Type II NSCs can be identified as Dpn+/Ase- cells.
We agree that Dpn is a helpful marker. However, we reliably distinguished type II NSCs by their lack of Ase and larger cell size relative to surrounding neurons and glia, which are smaller in size and located deeper within the clone. These differences, together with established lineage patterns, allow unambiguous identification of type 2 NSCs across all genotypes. We have now added representative type I and type 2 NSC clones to the supplemental figure S1 (E-G’) with Asense stains to demonstrate how we differentiate type I from type II NSCs.
(6) P5L32(left), To do this, we induced...
This sentence should be made more concise.
Please rephrase it.
The sentence has been rewritten for clarity and concision.
(7) P5L42(left), ...lack of EcR/Syp expression (Figure 2). However, EcR expression is still present (Figure 2I).
In some large pavRNAi clones, a weak EcR signal can be observed near the cell membrane; however, none of the nuclear compartments—where EcR is typically localized—show detectable staining. We selected a representative nuclear image for the figure and addressed this observation on page 8, lines 283-291 (lines 301-309 in tracked changes file).
(8) P7L29(left), ......had persistent Imp expression...
Imp expression is faint compared to that in Figure 2G.
The differences between Figures 2G and 3G should be discussed.
We thank the reviewer for this comment. We have added a note in the Methods section clarifying that brightness and contrast were adjusted per panel for optimal visualization; thus, apparent differences in signal intensity do not reflect biological variation. Fluorescence intensity for each neuroblast was normalized to the mean intensity of neighboring wild-type neuroblasts imaged in the same field. A neuroblast was considered Imp-positive when its normalized nuclear intensity was at least 2× the local background. This scoring criterion was applied uniformly across all genotypes and time points. All quantifications were performed on the raw LSM files in Fiji prior to assembling the figure panels.
(9) P8 (Figure 5)
The Imp expression is faint compared to that in Figure 5Q.
The difference between Figure 5G and 5Q should be discussed further.
As mentioned above, we have clarified our image processing approach in the Methods section to explain any differences in signal appearance between these figures.
(10) P10 Materials and Methods
The authors did not mention the fly lines used. This is very important for the readers.
We thank the reviewer for bringing this oversight to our attention. The Resource Table was inadvertently omitted from the initial submission. The complete list of fly lines and reagents used in this study is now provided in the updated Resource Table.
Reviewer #3 (Recommendations for the authors):
Major points
(1) The authors mention that the heat-shock induction at 42ALH is well after svp temporal window and therefore the cell cycle block independently affects Syp and EcR expression. However, Figure 3 shows svp-LacZ expression at 48ALH. If svp expression is indeed transient in Type 2 NSCs, then this must be validated using an immunostaining of the svp-LacZ line with svp antibody. This is crucial as the authors claim that cell cycle block doesn't affect does affect svp expression and is required independently.
We thank the reviewer for bringing this important issue to our attention. As noted, Svp protein is expressed transiently and stochastically in type 2 NSCs (Syed et al., 2017), making direct antibody quantification challenging upon cell cycle block. Consistent with previous work (Syed et al., 2017), we used the svp-LacZ reporter line to visualize stabilized Svp expression, which reliably captures Svp expression in type 2 NSCs (Syed et al., 2017 https://doi.org/10.7554/eLife.26287, and Dhilon et al., 2024 https://doi.org/10.1242/dev.202504).
(2) The authors have successfully slowed down the cell cycle and showed that it affects temporal progression. However, a converse experiment where the cell cycle is sped up in NSCs would be an important test for the direct coupling of temporal factor expression and cell cycle, wherein the expectation would be the precocious expression of late temporal factors in faster cycle NSCs.
We agree that such an experiment would be ideal. However, as noted above (Reviewer #2 comment 2), to our knowledge, no suitable tools currently exist to accelerate neuroblast cell-cycle progression without pleiotropic effects.
Minor point
The authors must include Ray and Li (https://doi.org/10.7554/eLife.75879) in the references when describing that "...cell cycle has been shown to influence temporal patterning in some systems,...".
We thank the reviewer for this helpful suggestion. The cited reference (Ray and Li, eLife, 2022) has now been included and appropriately referenced in the revised manuscript.
-
-
www.youtube.com www.youtube.com
-
Réforme de l'éducation : Enjeux, modèles et perspectives systémiques
Résumé analytique
Le système éducatif européen, et particulièrement le modèle allemand, fait face à une remise en question fondamentale de ses structures centenaires.
Le débat oppose deux visions : une approche neuroscientifique et réformatrice, prônant l'abolition des notes et l'autonomie, et une approche sociologique et réaliste, soulignant les fonctions de sélection et de cohésion sociale de l'école.
Les points critiques incluent l'impact délétère de l'évaluation chiffrée sur le développement cérébral des jeunes enfants, la persistance des inégalités sociales à travers le tri précoce des élèves, et la nécessité de passer d'une motivation extrinsèque (notes) à une motivation intrinsèque.
Toutefois, les recherches convergent vers un constat central : au-delà de la structure du système, la qualité et l'investissement de l'enseignant demeurent le facteur le plus déterminant de la réussite scolaire.
--------------------------------------------------------------------------------
I. La problématique de l'évaluation : L'impact des notes
Le système de notation est au cœur des tensions entre partisans de la tradition et réformateurs.
L'analyse des sources révèle des conséquences divergentes selon le profil des élèves.
A. Perspectives neuroscientifiques
La professeure Michaela Brohm-Badri souligne que les notes modifient la chimie cérébrale des élèves :
• Pour les bons élèves : La réussite déclenche la libération de dopamine (motivation) et d'ocytocine.
Cependant, cela remplace la motivation intrinsèque (curiosité naturelle) par une motivation extrinsèque de récompense.
• Pour les élèves en difficulté : L'échec libère de l'adrénaline et du cortisol (hormones du stress).
L'amygdale bloque alors le cortex préfrontal, empêchant toute réflexion correcte et créant un cercle vicieux de contre-performance.
• Immaturité cérébrale : Le cortex préfrontal n'atteint sa maturité qu'entre 21 et 23 ans.
Noter et orienter les enfants dès 9 ou 10 ans revient à figer leur destin social avant la fin de leur développement biologique.
B. Biais cognitifs et subjectivité
L'évaluation est critiquée pour son manque d'objectivité, influencée par plusieurs phénomènes :
• La constante macabre : Tendance inconsciente des enseignants à reproduire une courbe de répartition (bons, moyens, faibles) quel que soit le niveau réel de la classe.
• L'effet d'ordre : Un devoir moyen semble meilleur s'il suit une copie très médiocre.
• Facteurs exogènes : L'apparence physique (lunettes, coiffure), l'origine sociale, le sexe ou l'humeur de l'enseignant interfèrent avec la note.
--------------------------------------------------------------------------------
II. Les fonctions sociales et politiques de l'école
Selon le professeur Roland Reichenbach, l'école ne peut être réduite à un simple lieu d'apprentissage ; elle remplit une dizaine de fonctions essentielles à la société.
• Instruction et intégration : Transmission des savoirs et apprentissage de la vie en communauté.
• Sélection : Bien que critiquée, la sélection prépare à la réalité du marché du travail et de l'économie.
• Gardiennage : Une fonction logistique fondamentale permettant le fonctionnement de la société.
• Éducation démocratique : L'école apprend à l'individu à s'autocorriger, à viser l'objectivité et à dépasser ses désirs individuels.
• Protection contre l'arbitraire privé : Si l'école publique renonçait à l'évaluation, cette mission incomberait au secteur privé, favorisant alors exclusivement les plus riches ou les plus puissants.
--------------------------------------------------------------------------------
III. Modèles pédagogiques et expérimentations
A. Comparaison des systèmes européens
Le document met en évidence des disparités majeures dans l'organisation scolaire en Europe :
| Pays | Caractéristiques du système | | --- | --- | | Allemagne | Système conservateur. Orientation précoce (10 ans) vers trois filières (professionnelle, technique, générale). | | France | État centralisé, programmes nationaux, style d'enseignement plutôt autoritaire et hiérarchisé. | | Finlande | Relation d'égalité prof-élève. Pas de notes avant la 3ème. Très haut niveau de performance. | | Royaume-Uni | Forte présence du privé. Innovation technologique précoce (programmation obligatoire dès le secondaire). |
B. L'exemple de l'Alemanon Schule (Wutöschingen)
Cette école allemande propose une alternative radicale au modèle frontal :
• Apprentissage autonome : Les élèves sont des "partenaires d'apprentissage". Les cours classiques ("inputs") sont réduits au profit d'ateliers libres.
• Responsabilisation : L'élève décide du moment où il passe ses tests de compétences.
• Mixité sociale et tutorat : L'entraide entre élèves de différentes filières est encouragée.
• Résultats : En 2022, les résultats au baccalauréat y étaient supérieurs à la moyenne régionale, avec une augmentation du nombre d'élèves brillants.
--------------------------------------------------------------------------------
IV. Le facteur humain : La centralité de l'enseignant
La méta-analyse "Visible Learning" de John Hattie, portant sur plus de 2 100 études, apporte des conclusions nuancées qui bousculent les idéologies :
1. L'enseignant est la variable clé : La réussite scolaire dépend avant tout de la clarté de l'enseignant, de sa gestion de classe et de son investissement individuel auprès des élèves.
2. Dépassement du clivage traditionnel/moderne : Si Hattie valide certains aspects de l'enseignement traditionnel (consignes directes), il soutient également des réformes comme le feedback individualisé et l'abolition des étiquettes (notes).
3. Valorisation de la profession : Dans les pays performants (Finlande, Suède), seuls les 10 % des meilleurs diplômés peuvent devenir enseignants, et la profession bénéficie d'une haute reconnaissance sociale.
--------------------------------------------------------------------------------
V. Synthèse des risques et perspectives
A. Le piège de la "pédagogie des privilégiés"
Une mise en garde est formulée concernant l'autonomie totale : certains élèves, issus de milieux éloignés de la culture scolaire, ont besoin d'un encadrement strict et d'un guidage direct.
L'apprentissage autonome peut, paradoxalement, accroître les inégalités s'il n'est pas accompagné d'un renforcement de l'affirmation de soi pour les élèves les plus fragiles.
B. L'objectif d'équité
L'égalité des chances ne signifie pas que tous les élèves doivent être identiques ou avancer au même rythme. Le défi moderne de l'école est de concilier :
• Le développement du goût du risque et de l'expérimentation.
• La nécessité d'un feedback pour grandir.
• Le maintien de la motivation intrinsèque face à un monde concurrentiel.
En conclusion, si le système de performance semble inévitable pour la structure sociale et économique, l'enjeu majeur reste de transformer l'autorité autoritaire en une autorité inspirante, capable de valoriser la différence sans la stigmatiser par l'échec.
Tags
Annotators
URL
-
-
www.youtube.com www.youtube.com
-
Comprendre la Contre-volonté : Analyse de l'Opposition Instinctive chez l'Enfant
Résumé Exécutif
Ce document propose une analyse approfondie du concept de « contre-volonté », un phénomène souvent confondu avec l'opposition ou l'impolitesse dans le cadre de l'éducation et du développement de l'enfant.
Contrairement aux perceptions populaires qui valorisent l'obéissance immédiate, la recherche développementale démontre que la contre-volonté est une réaction instinctive, saine et nécessaire.
Elle assure la protection de l'individu contre les influences extérieures non sécurisées et constitue le socle de l'affirmation de soi et de l'esprit critique à l'âge adulte.
Le document souligne que les interventions basées sur la pression, les ultimatums ou la punition sont contre-productives, car elles alimentent la résistance au lieu de favoriser la coopération.
La clé d'une collaboration harmonieuse réside dans la réactivation intentionnelle du lien d'attachement.
En privilégiant la connexion émotionnelle, l'humour et la créativité, les adultes peuvent transformer une dynamique de confrontation en une adhésion naturelle, permettant à l'enfant de se développer sans sacrifier son intégrité personnelle.
--------------------------------------------------------------------------------
1. Définition et Origines de la Contre-volonté
La contre-volonté se distingue de la simple « opposition » par sa nature structurelle et instinctive dans le développement humain.
• Un être autodéterminé : L'humain est, par essence, un être doté d'une volonté propre. La contre-volonté émerge lorsque la volonté de l'adulte entre en conflit direct avec celle de l'enfant.
• Opposition vs Contre-volonté : Alors que le terme « opposition » est souvent utilisé de manière péjorative dans le jargon populaire pour décrire un manque de respect, la « contre-volonté » décrit plus précisément le processus biologique et psychologique de résistance à une consigne externe perçue comme intrusive.
• Le mythe de l'enfant « bien élevé » : Le modèle traditionnel valorise l'obéissance au doigt et à l'œil.
Or, une obéissance totale et immédiate s'apparente davantage au fonctionnement d'un robot ou d'une marionnette qu'à celui d'un être humain en développement.
2. La Valeur Développementale et Sécuritaire
Loin d'être un défaut de comportement, la contre-volonté remplit des fonctions vitales pour l'individu.
Protection et Survie
• Résistance instinctive : Les humains sont programmés pour résister aux directives de personnes avec lesquelles ils n'ont pas de lien d'attachement solide.
• Sécurité physique : Cette résistance est un mécanisme de protection essentiel (par exemple, refuser de suivre un inconnu dans la rue).
L'enfant fait alors preuve de contre-volonté pour préserver son intégrité.
Affirmation de Soi et Esprit Critique
• Préparation à l'âge adulte : L'affirmation de soi ne commence pas à 18 ou 22 ans.
Elle se cultive dès l'enfance. Un adulte capable de négocier son salaire ou de poser des limites dans son couple est un enfant qui a pu exercer sa contre-volonté.
• Développement du jugement : La capacité de remettre en question, d'argumenter et de ne pas tout accepter « pour argent comptant » est le fondement de l'esprit critique.
Sans contre-volonté, l'enfant devient un adolescent et un adulte vulnérable à l'influence d'autrui.
3. Les Causes de la Résistance au Quotidien
L'analyse identifie plusieurs facteurs exacerbant la contre-volonté dans les interactions quotidiennes :
| Facteur | Description | | --- | --- | | Immaturité cérébrale | Le cerveau de l'enfant traite souvent une seule information à la fois. S'il est absorbé par le jeu, il n'ignore pas l'adulte par mépris, mais par incapacité neurologique à basculer instantanément sa volonté. | | Pression extérieure | L'usage de l'autorité brute, des menaces, des punitions ou des ultimatums augmente la contre-volonté au lieu de susciter la collaboration. | | Déconnexion relationnelle | Donner une consigne à distance ou sans avoir préalablement établi un contact visuel ou émotionnel crée un fossé qui déclenche la résistance. |
4. Stratégies de Collaboration : De la Pression à la Connexion
Pour réduire la contre-volonté, l'adulte doit chercher à « augmenter la volonté » de l'enfant de collaborer par des leviers relationnels.
Le Concept de la « Bulle » et du « Velcro »
• La Bulle d'attachement : L'adulte doit inviter l'enfant à entrer dans sa « bulle » de sécurité. Lorsque l'enfant est connecté à l'adulte, il a naturellement tendance à suivre la direction de ce dernier.
• L'effet Velcro : Plutôt que d'être une « balle de ping-pong » (donner un ordre et repartir), l'adulte doit devenir « velcro » : s'approcher physiquement, s'intéresser à l'activité de l'enfant et établir un lien avant de formuler une demande.
Leviers d'Intervention Efficaces
• La Connexion avant la Consigne : Prendre quelques secondes pour saluer l'enfant, le flatter ou exprimer son plaisir de le retrouver.
• La Créativité et l'Humour : Utiliser le jeu pour contourner la résistance (ex: faire parler un jouet pour inviter au lavage des mains). La créativité est présentée comme une alternative supérieure à l'autorité pure.
• L'Empathie : Reconnaître que la volonté de l'enfant est légitime, même si elle diffère de la nôtre. L'objectif n'est pas de céder sur tout, mais d'imposer une structure dans le respect du stade développemental de l'enfant.
5. Perspectives Systémiques : Adolescence et Milieu Scolaire
La dynamique de la contre-volonté s'étend au-delà de la petite enfance et touche toutes les sphères sociales.
• Adolescence : C'est une période de contre-volonté intense.
Les interventions basées sur la déconnexion et les attentes irréalistes de soumission ne font qu'empirer la situation.
• Milieu Scolaire : Les enfants ayant les besoins relationnels les plus importants sont souvent ceux qui résistent le plus.
Le système tend malheureusement à les exclure ou à les punir (systèmes de couleurs, retrait de privilèges), ce qui rompt davantage le lien d'attachement et renforce leur comportement d'opposition.
• Vie Adulte : La contre-volonté persiste chez l'adulte.
Un employé réagira par la résistance face à un supérieur qui impose une directive sans considération pour son travail en cours ou sans politesse élémentaire.
Conclusion
La contre-volonté n'est pas un problème de comportement à éradiquer, mais un signal de besoin de connexion ou d'affirmation.
En changeant de perspective — en passant de la gestion de l'opposition à la culture de l'attachement — les éducateurs et parents favorisent le développement d'individus autonomes, critiques et capables de respecter leurs propres limites tout en collaborant avec la structure sociale.
Comprendre ce mécanisme permet de passer d'une éducation basée sur la force à une éducation basée sur la relation.
-
-
www.biorxiv.org www.biorxiv.org
-
eLife Assessment
This valuable study investigates the computational role of top-down feedback - a property found in biological circuits - in artificial neural network (ANN) models of the neocortex. Using hierarchical recurrent ANNs in an audiovisual integration task, the authors show that an anatomically inspired feedback motif induces a stable visual bias consistent with human perception and yields modest but meaningful benefits for learning dynamics and robustness. The strength of evidence is solid: the modeling, analyses, and controls mostly support the central claim that top-down feedback motifs impose persistent inductive biases that shape functional specialization and behavior. But the evidence for a broad, general framework that predicts behavior remains only partially supported, and the Methods would benefit from a compact, reproducible summary of hyperparameters and architectural details.
-
Reviewer #1 (Public review):
Summary:
Here, the authors aim to investigate the potential improvements of ANNs when used to explain brain data using top-down feedback connections found in the neocortex. To do so, they use a retinotopic and tonotopic organization to model each subregion of the ventral visual (V1, V2, V4, and IT) and ventral auditory (A1, Belt, A4) regions using Convolutional Gated Recurrent Units. The top-down feedback connections are inspired by the apical tree of pyramidal neurons, modeled either with a multiplicative effect (change of gain of the activation function) or a composite effect (change of gain and threshold of the activation function).
To assess the functional impact of the top-down connections, the authors compare three architectures: a brain-like architecture derived directly from brain data analysis, a reversed architecture where all feedforward connections become feedback connections and vice versa, and a random connectivity architecture. More specifically, in the brain-like model the visual regions provide feedforward input to all auditory areas, whereas auditory areas provide feedback to visual regions.
First, the authors found that top-down feedback influences audiovisual processing and that the brain-like model exhibits a visual bias in multimodal visual and auditory tasks. Second, they discovered that in the brain-like model, the composite integration of top-down feedback, similar to that found in the neocortex, leads to an inductive bias toward visual stimuli, which is not observed in the feedforward-only model. Furthermore, the authors found that the brain-like model learns to utilize relevant stimuli more quickly while ignoring distractors. Finally, by analyzing the activations of all hidden layers (brain regions), they found that the feedforward and feedback connectivity of a region could determine its functional specializations during the given tasks.
Strengths:
The study introduces a novel methodology for designing connectivity between regions in deep learning models. The authors also employ several tasks based on audiovisual stimuli to support their conclusions. Additionally, the model utilizes backpropagation of error as a learning algorithm, making it applicable across a range of tasks, from various supervised learning scenarios to reinforcement learning agents. Conversely, the presented framework offers a valuable tool for studying top-down feedback connections in cortical models. Thus, it is a very nice study that can also give inspiration to other fields (machine learning) to start exploring new architectures.
-
Reviewer #2 (Public review):
Summary:
This work addresses the question whether artificial deep neural network models of the brain could be improved by incorporating top-down feedback, inspired by the architecture of neocortex.
In line with known biological features of cortical top-down feedback, the authors model such feedback connections with both, a typical driving effect and a purely modulatory effect on the activation of units in the network.
To asses the functional impact of these top-down connections, they compare different architectures of feedforward and feedback connections in a model that mimics the ventral visual and auditory pathways in cortex on an audiovisual integration task.
Notably, one architecture is inspired by human anatomical data, where higher visual and auditory layers possess modulatory top-down connections to all lower-level layers of the same modality, and visual areas provide feedforward input to auditory layers, whereas auditory areas provide modulatory feedback to visual areas.
First, the authors find that this brain-like architecture imparts the models with a light visual bias similar to what is seen in human data, which is the opposite in a reversed architecture, where auditory areas provide feedforward drive to the visual areas.
Second, they find that, in their model, modulatory feedback should be complemented by a driving component to enable effective audiovisual integration, similar to what is observed in neural data.
Overall, the study shows some possible functional implications when adding feedback connections in a deep artificial neural network that mimic some functional aspects of visual perception in humans.
Strengths:
The study contains innovative ideas, such as incorporating an anatomically inspired architecture into a deep ANN, and comparing its impact on a relevant task to alternative architectures.
Moreover, the simplicity of the model allows it to draw conclusions on how features of the architecture and functional aspects of the top-down feedback affects performance of the network.
This could be a helpful resource for future studies of the impact of top-down connections in deep artificial neural network models of neocortex.
Weaknesses:
Some claims not yet supported.
The problem is that results are phrased quite generally in the abstract and discussion, while the actual results shown in the paper are very specific to certain implementations of top-down feedback and architectures. This could lead to misunderstanding and requires some revisions of the claims in the abstract and discussion (see below).
"Altogether our findings demonstrate that modulatory top-down feedback is a computationally relevant feature of biological brain..."
This claim is not supported, since no performance increase is demonstrated for modulatory feedback. So far, only the second half of the sentence is supported: "...and that incorporating it into ANNs affects their behavior and constrains the solutions it's likely to discover."
"This bias does not impair performance on the audiovisual tasks."
This is only true for the composite top-down feedback that combines driving and modulatory effects, whereas modulatory feedback alone can impair the performance (e.g., in the visual tasks VS1 and VS2). The fact that modulatory feedback alone is insufficient in ANNs to enable effective cross-modal integration and requires some driving component is actually very interesting, but it is not stressed enough in the abstract. This is hinted at in the following sentence, but should be made more explicitly:
"The results further suggest that different configurations of top-down feedback make otherwise identically connected models functionally distinct from each other, and from traditional feedforward and laterally recurrent models."
"Here we develop a deep neural network model that captures the core functional properties of top-down feedback in the neocortex" -> this is too strong, take out "the", because very likely there are other important properties that are not yet incorporated.
"Altogether, our results demonstrate that the distinction between feedforward and feedback inputs has clear computational implications, and that ANN models of the brain should therefore consider top-down feedback as an important biological feature."
This claim is still not substantiated by evidence provided in the paper. First, the wording is a bit imprecise, because mechanistically, it is not really the feedforward versus feedback (a purely feedforward model is not considered at all in the paper), but modulatory versus driving. Moreover, the second part of the sentence is problematic: The results imply that, computationally/functionally, driving connections are doing the job, while modulatory feedback does not really seem to improve performance (best case, it does not do any harm). It is true that it is a feature that is inspired by biology, but I don't see why the results imply that (modulatory) top-down feedback should be considered in ANN models of the brain. This would require to show that such models either improve performance, or do improve the ability to fit neural data, both which are beyond the scope of the paper.
The same argument holds for the following sentence, which is not supported by the results of the paper:
"More broadly, our work supports the conclusion that both the cellular neurophysiology and structure of feed-back inputs have critical functional implications that need to be considered by computational models of brain function."
Additional supplementary material required
Although the second version checked the influence of processing time, this was not done for the most important figure of the paper, Figure 4. A central claim in the abstract "This bias does not impair performance on the audiovisual tasks" relies on this figure, because only with composite feedback the performance is comparable between the the "drive-only" and "brain-like" models. Thus, the supplementary Figure 3 should also include the composite networks and drive only network to check the robustness of the claim with respect to process time. This robustness analysis should then also be mentioned in the text. For example, it should be mentioned whether results in these networks are robust or not with respect to process time, whether there are differences between network architectures or types of feedback in general etc.
Moreover, the current analysis for networks with modulatory feedback is a bit confusing. Why is the performance so low for the reverse model for a process time of 3 and 10? This is a very strong effect that warrants explanation. More details should be added in the caption as well. For example, are the models separately trained for the output after 3 and 10 processing steps for the comparison, or just evaluated at these times? Not training these networks separately might explain the low performance for some networks, so ideally networks are trained for each choice of processing steps.
-
Reviewer #3 (Public review):
Summary:
This study investigates the computational role of top-down feedback in artificial neural networks (ANNs), a feature that is prevalent in the brain but largely absent in standard ANN architectures. The authors construct hierarchical recurrent ANN models that incorporate key properties of top-down feedback in the neocortex. Using these models in an audiovisual integration task, they find that hierarchical structures introduce a mild visual bias, akin to that observed in human perception, not always compromising task performance.
Strengths:
The study investigates a relevant and current topic of considering top-down feedback in deep neural networks. In designing their brain-like model, they use neurophysiological data, such as externopyramidisation and hierarchical connectivity. Their brain-like model exhibits a visual bias that qualitatively matches human perception.
Weaknesses:
While the model is brain-inspired, it has limited bioplausibility. The model assumes a simplified and fixed hierarchy. The authors acknowledge this limitation in the discussion.
While the brain-like model showed an advantage in ignoring distracting auditory inputs, it struggled when visual information had to be ignored. This suggests that its rigid bias toward visual processing could make it less adaptive in tasks requiring flexible multimodal integration. It hence does not necessarily constitute an improvement over existing ANNs. The study does not evaluate whether the top-down feedback architecture scales well to more complex problems or larger datasets. A valuable future contribution would be to evaluate how the network's behaviour fits to human data.
-
Author response:
The following is the authors’ response to the original reviews.
Public Reviews:
Reviewer #1 (Public review):
Summary:
Here, the authors aim to investigate the potential improvements of ANNs when used to explain brain data using top-down feedback connections found in the neocortex. To do so, they use a retinotopic and tonotopic organization to model each subregion of the ventral visual (V1, V2, V4, and IT) and ventral auditory (A1, Belt, A4) regions using Convolutional Gated Recurrent Units. The top-down feedback connections are inspired by the apical tree of pyramidal neurons, modeled either with a multiplicative effect (change of gain of the activation function) or a composite effect (change of gain and threshold of the activation function).
To assess the functional impact of the top-down connections, the authors compare three architectures: a brain-like architecture derived directly from brain data analysis, a reversed architecture where all feedforward connections become feedback connections and vice versa, and a random connectivity architecture. More specifically, in the brain-like model the visual regions provide feedforward input to all auditory areas, whereas auditory areas provide feedback to visual regions.
First, the authors found that top-down feedback influences audiovisual processing and that the brain-like model exhibits a visual bias in multimodal visual and auditory tasks. Second, they discovered that in the brain-like model, the composite integration of top-down feedback, similar to that found in the neocortex, leads to an inductive bias toward visual stimuli, which is not observed in the feedforward-only model. Furthermore, the authors found that the brain-like model learns to utilize relevant stimuli more quickly while ignoring distractors. Finally, by analyzing the activations of all hidden layers (brain regions), they found that the feedforward and feedback connectivity of a region could determine its functional specializations during the given tasks.
Strengths:
The study introduces a novel methodology for designing connectivity between regions in deep learning models. The authors also employ several tasks based on audiovisual stimuli to support their conclusions. Additionally, the model utilizes backpropagation of error as a learning algorithm, making it applicable across a range of tasks, from various supervised learning scenarios to reinforcement learning agents. Conversely, the presented framework offers a valuable tool for studying top-down feedback connections in cortical models. Thus, it is a very nice study that also can give inspiration to other fields (machine learning) to start exploring new architectures.
We thank the reviewer for their accurate summary of our work and their kind assessment of its strengths.
Weaknesses:
Although the study explores some novel ideas on how to study the feedback connections of the neocortex, the data presented here are not complete in order to propose a concrete theory of the role of top-down feedback inputs in such models of the brain.
(1) The gap in the literature that the paper tries to fill in the ability of DL algorithms to predict behavior: "However, there are still significant gaps in most deep neural networks' ability to predict behavior, particularly when presented with ambiguous, challenging stimuli." and "[...] to accurately model the brain."
It is unclear to me how the presented work addresses this gap, as the only facts provided are derived from a simple categorization task that could also be solved by the feedforward-only model (see Figures 4 and 5). In my opinion, this statement is somewhat far-fetched, and there is insufficient data throughout the manuscript to support this claim.
We can see now that the way the introduction was initially written led to some confusion about our goal in this study. Our goal here was not to demonstrate that top-down feedback can enable superior matches to human behaviour. Rather, our goal was to determine if top-down feedback had any real implications for processing ambiguous stimuli. The sentence that the reviewer has highlighted was intended as an explanation for why top-down feedback, and its impact on ambiguous stimuli, might be something one would want to examine for deep neural networks. But, here, we simply wanted to (1) provide an overview of the code base we have created, (2) demonstrate that top-down feedback does impact the processing of ambiguous stimuli.
We agree with the reviewer that if our goal was to improve our ability to predict behaviour, then there was a big gap in the evidence we provided here. But, this was not our goal, and we believe that the data we provide here does convincingly show that top-down feedback has an impact on processing of ambiguous stimuli. We have updated the text in the introduction to make our goals more clear for the reader and avoid this misunderstanding of what we were trying to accomplish here. Specifically, the end of the introduction is changed to:
“To study the effect of top-down feedback on such tasks, we built a freely available code base for creating deep neural networks with an algorithmic approximation of top-down feedback. Specifically, top-down feedback was designed to modulate ongoing activity in recurrent, convolutional neural networks. We explored different architectural configurations of connectivity, including a configuration based on the human brain, where all visual areas send feedforward inputs to, and receive top-down feedback from, the auditory areas. The human brain-based model performed well on all audiovisual tasks, but displayed a unique and persistent visual bias compared to models with only driving connectivity and models with different hierarchies. This qualitatively matches the reported visual bias of humans engaged in audio-visual tasks. Our results confirm that distinct configurations of feedforward/feedback connectivity have an important functional impact on a model's behavior. Therefore, top-down feedback captures behaviors and perceptual preferences that do not manifest reliably in feedforward-only networks. Further experiments are needed to clarify whether top-down feedback helps an ANN fit better to neural data, but the results show that top-down feedback affects the processing of stimuli and is thus a relevant feature that should be considered for deep ANN models in computational neuroscience more broadly.”
(2) It is not clear what the advantages are between the brain-like model and a feedforward-only model in terms of performance in solving the task. Given Figures 4 and 5, it is evident that the feedforward-only model reaches almost the same performance as the brain-like model (when the latter uses the modulatory feedback with the composite function) on almost all tasks tested. The speed of learning is nearly the same: for some tested tasks the brain-like model learns faster, while for others it learns slower. Thus, it is hard to attribute a functional implication to the feedback connections given the presented figures and therefore the strong claims in the Discussion should be rephrased or toned down.
Again, we believe that there has been a misunderstanding regarding the goals of this study, as we are not trying to claim here that there are performance advantages conferred by top-down feedback in this case. Indeed, we share the reviewer’s assessment that the feedforward only model seems to be capable of solving this task well. To reiterate: our goal here was to demonstrate that top-down feedback alters the computations in the network and, thus, has distinct effects on behaviour that need to be considered by researchers who use deep networks to model the brain. But we make no claims of “superiority” of the brain-like model.
In-line with this, we’re not completely sure which claims in the discussion the reviewer is referring to. We note that we were quite careful in our claims. For example, in the first section of the discussion we say:
“Altogether, our results demonstrate that the distinction between feedforward and feedback inputs has clear computational implications, and that ANN models of the brain should therefore consider top-down feedback as an important biological feature.”
And later on:
“In summary, our study shows that modulatory top-down feedback and the architectural diversity enabled by it can have important functional implications for computational models of the brain. We believe that future work examining brain function with deep neural networks should therefore consider incorporating top-down modulatory feedback into model architectures when appropriate.”
If we have missed a claim in the discussion that implies superiority of the brain-like model in terms of task performance we would be happy to change it.
(3) The Methods section lacks sufficient detail. There is no explanation provided for the choice of hyperparameters nor for the structure of the networks (number of trainable parameters, number of nodes per layer, etc). Clarifying the rationale behind these decisions would enhance understanding. Moreover, since the authors draw conclusions based on the performance of the networks on specific tasks, it is unclear whether the comparisons are fair, particularly concerning the number of trainable parameters. Furthermore, it is not clear if the visual bias observed in the brain-like model is an emerging property of the network or has been created because of the asymmetries in the visual vs. auditory pathway (size of the layer, number of layers, etc).
We thank the reviewer for raising this issue, and want to provide some clarifications: First, the number of trainable parameters are roughly equal, since we were only switching the direction of connectivity (top-down versus bottom-up), not the number of connections. We confirmed the biggest difference in size is between models with composite and multiplicative feedback; models with composite feedback have roughly ~1K more parameters, and all models are within the 280K parameter range. We now state this in the methods.
Second, because superior performance was not the goal of this study, as stated above, we conducted limited hyperparameter tuning. Given the reviewer’s comment, we wondered whether this may have impacted our results. Therefore, we explored different hyperparameters for the model during the multimodal auditory tasks, which show the clearest example of the visual dominance in the brainlike model (Figure 3).
We explored different hidden state sizes, learning rates and processing times, and examined whether the core results were different. We found that extremely high learning rates (0.1) destabilize all models and that some models perform poorly under different processing times. But overall, the core results are evident across all hyperparameters where the models learn i.e the different behaviors of models with different connectivities and the visual dominance observed in the brainlike model. We now provide these results in a supplementary figure (Fig. S2, showing larger models trained with different learning rates, and Fig S3, which shows the effect of processing time on AS task performance).
Reviewer #2 (Public review):
Summary:
This work addresses the question of whether artificial deep neural network models of the brain could be improved by incorporating top-down feedback, inspired by the architecture of the neocortex.
In line with known biological features of cortical top-down feedback, the authors model such feedback connections with both, a typical driving effect and a purely modulatory effect on the activation of units in the network.
To assess the functional impact of these top-down connections, they compare different architectures of feedforward and feedback connections in a model that mimics the ventral visual and auditory pathways in the cortex on an audiovisual integration task.
Notably, one architecture is inspired by human anatomical data, where higher visual and auditory layers possess modulatory top-down connections to all lower-level layers of the same modality, and visual areas provide feedforward input to auditory layers, whereas auditory areas provide modulatory feedback to visual areas.
First, the authors find that this brain-like architecture imparts the models with a light visual bias similar to what is seen in human data, which is the opposite in a reversed architecture, where auditory areas provide a feedforward drive to the visual areas.
Second, they find that, in their model, modulatory feedback should be complemented by a driving component to enable effective audiovisual integration, similar to what is observed in neural data.
Last, they find that the brain-like architecture with modulatory feedback learns a bit faster in some audiovisual switching tasks compared to a feedforward-only model.
Overall, the study shows some possible functional implications when adding feedback connections in a deep artificial neural network that mimics some functional aspects of visual perception in humans.
Strengths:
The study contains innovative ideas, such as incorporating an anatomically inspired architecture into a deep ANN, and comparing its impact on a relevant task to alternative architectures.
Moreover, the simplicity of the model allows it to draw conclusions on how features of the architecture and functional aspects of the top-down feedback affect the performance of the network.
This could be a helpful resource for future studies of the impact of top-down connections in deep artificial neural network models of the neocortex.
We thank the reviewer for their summary and their recognition of the innovative components and helpful resources therein.
Weaknesses:
Overall, the study appears to be a bit premature, as several parts need to be worked out more to support the claims of the paper and to increase its impact.
First, the functional implication of modulatory feedback is not really clear. The "only feedforward" model (is a drive-only model meant?) attains the same performance as the composite model (with modulatory feedback) on virtually all tasks tested, it just takes a bit longer to learn for some tasks, but then is also faster at others. It even reproduces the visual bias on the audiovisual switching task. Therefore, the claims "Altogether, our results demonstrate that the distinction between feedforward and feedback inputs has clear computational implications, and that ANN models of the brain should therefore consider top-down feedback as an important biological feature." and "More broadly, our work supports the conclusion that both the cellular neurophysiology and structure of feed-back inputs have critical functional implications that need to be considered by computational models of brain function" are not sufficiently supported by the results of the study. Moreover, the latter points would require showing that this model describes neural data better, e.g., by comparing representations in the model with and without top-down feedback to recorded neural activity.
To emphasize again our specific claims, we believe that our data shows that top-down feedback has functional implications for deep neural network behaviour, not increased performance or neural alignment. Indeed, our results demonstrate that top-down feedback alters the behaviour of the networks, as shown by the differences in responses to various combinations of ambiguous stimuli. We agree with the reviewer that if our goal was to claim either superior performance on these tasks, or better fit to neural data, we would need to actually provide data supporting that claim.
Given the comments from the reviewer, we have tried to provide more clarity in the introduction and discussion regarding our claims. In particular, we now highlight that we are not trying to demonstrate that the models with top-down feedback exhibit superior performance or better fit to neural data.
As one final note, yes, the reviewer understood correctly that the “only feedforward” model is a model with only driving inputs. We have renamed the feedforward-only models to drive only models and added additional emphasis in the text to ensure that the distinction is clear for all readers.
Second, the analyses are not supported by supplementary material, hence it is difficult to evaluate parts of the claims. For example, it would be helpful to investigate the impact of the process time after which the output is taken for evaluation of the model. This is especially important because in recurrent and feedback models the convergence should be checked, and if the network does not converge, then it should be discussed why at which point in time the network is evaluated.
This is an excellent point, and we thank the reviewer for raising it. We allowed the network to process the stimuli for seven time-steps, which was enough for information from any one region to be transmitted to any other. We found in some initial investigations that if we shortened the processing time some seeds would fail to solve the task. But, based on the reviewer’s comment, we have now also run additional tests with longer processing times for the auditory tasks where we see the clearest visual bias (Figure 3). We find that different process times do not change the behavioral biases observed in our models, but may introduce difficulties ignoring visual stimuli for some models. Thus, while process time is an important hyperparameter for optimal performance of the model, the central claim of the paper remains. We include this new data in a supplementary figure S3.
Third, the descriptions of the models in the methods are hard to understand, i.e., parameters are not described and equations are explained by referring to multiple other studies. Since the implications of the results heavily rely on the model, a more detailed description of the model seems necessary.
We agree with the reviewer that the methods could have been more thorough. Therefore, we have greatly expanded the methods section. We hope the model details are now more clear.
Lastly, the discussion and testable predictions are not very well worked out and need more details. For example, the point "This represents another testable prediction flowing from our study, which could be studied in humans by examining the optical flow (Pines et al., 2023) between auditory and visual regions during an audiovisual task" needs to be made more precise to be useful as a prediction. What did the model predict in terms of "optic flow", how can modulatory from simple driving effect be distinguished, etc.
We see that the original wording of this prediction was ambiguous, thank you for pointing this out. In the study highlighted (Pines et al., 2023) the authors use an analysis technique for measuring information flow between brain regions, which is related to analysis of optical flow in images, but applied to fMRI scans. This is confusing given the current study, though. Therefore, we have changed this sentence to make clear that we are speaking of information flow here.
Reviewer #3 (Public review):
Summary:
This study investigates the computational role of top-down feedback in artificial neural networks (ANNs), a feature that is prevalent in the brain but largely absent in standard ANN architectures. The authors construct hierarchical recurrent ANN models that incorporate key properties of top-down feedback in the neocortex. Using these models in an audiovisual integration task, they find that hierarchical structures introduce a mild visual bias, akin to that observed in human perception, not always compromising task performance.
Strengths:
The study investigates a relevant and current topic of considering top-down feedback in deep neural networks. In designing their brain-like model, they use neurophysiological data, such as externopyramidisation and hierarchical connectivity. Their brain-like model exhibits a visual bias that qualitatively matches human perception.
We thank the reviewer for their summary and evaluation of our paper’s strengths.
Weaknesses:
While the model is brain-inspired, it has limited bioplausibility. The model assumes a simplified and fixed hierarchy. In the brain with additional neuromodulation, the hierarchy could be more flexible and more task-dependent.
We agree, there are still many facets of top-down feedback that we have not captured here, and the modulation of hierarchy is an interesting example. We have added some consideration of this point to the limitations section of the discussion.
While the brain-like model showed an advantage in ignoring distracting auditory inputs, it struggled when visual information had to be ignored. This suggests that its rigid bias toward visual processing could make it less adaptive in tasks requiring flexible multimodal integration. It hence does not necessarily constitute an improvement over existing ANNs. It is unclear, whether this aspect of the model also matches human data. In general, there is no direct comparison to human data. The study does not evaluate whether the top-down feedback architecture scales well to more complex problems or larger datasets. The model is not well enough specified in the methods and some definitions are missing.
We agree with the reviewer that we have not demonstrated anything like superior performance (since the brain-like network is quite rigid, as noted) nor have we shown better match to human data with the brain-like network. This was not our intended claim. Rather, we demonstrated here simply that top-down feedback impacts behavior of the networks in response to ambiguous stimuli. We have now added statements to the introduction and discussion to make our specific claims (which are supported by our data, we believe) clear.
Recommendations for the authors:
Reviewer #1 (Recommendations for the authors):
I believe that the work is very nice but not so mature at this stage. Below, you can find some comments that eventually could improve your manuscript.
(1) Intro, last sentence: "Therefore, top-down feedback is a relevant feature that should be considered for deep ANN models in computational neuroscience more broadly." I don't understand what the authors refer to with this sentence. There are numerous models (deep ANNs) that have been used to model the neural activity and are much simpler than the one proposed here which contains very complex models and connectivity. Although I do agree that the top-down connections are very important there is no data to support their importance for modeling the brain.
Respectfully, we disagree with the reviewer that we don’t provide data to demonstrate the importance of top-down feedback for modelling. Indeed, we provided a great deal of data to show that top-down feedback in the networks has real functional implications for behaviour, e.g., it can induce a human-like visual bias. Thus, top-down feedback is a factor that one should care about when modelling the brain. But, we agree with the reviewer that more demonstration of the utility of using top-down feedback for achieving better fits to neural data would be an important next step.
(2) I suggest adding some extra supplementary simulations where, for example, the number of data for visual and auditory pathways is equal in size (i.e., the same number of examples), the number of layers is identical (3 per pathway), and also the number of parameters. Doing this would help strengthen the claims presented in the paper.
In fact, all of the hyperparameters the reviewer mentions here were identical for the different networks, so the experiments the reviewer is requesting here were already part of the paper. We now clarify this in the text.
(3) Results: I suggest adding Tables with quantifications of the presented results. For example, best performance, epochs to converge, etc. As it is now, it is very hard to follow the evidence shown in Figures.
This is a good suggestion, we have now added this table to the start of the supplemental figures.
(4) Figure 2e, 3e: Although VS3, and AS3 have been used only for testing, the plot shows alignments with respect to training epochs. The authors should clarify in the Methods if they tested the network with all intermediate weights during VS1/VS2 or AS1/AS2 training.
Testing scenarios in this context meant that the model was never shown the scenario/task during training, but the models were indeed evaluated on the VS3 and AS3 after each training epoch. We have added clarifications to the figure legends.
(5) Methods: It would be beneficial to discuss how specific hyperparameters were selected based on prior research, empirical testing, or theoretical considerations. Also, it is not clear how the alignment (visual or audio) is calculated. Do the authors use the examples that have been classified correctly for both stimuli or do they exclude those from the analysis (maybe I have missed it).
As noted above, because superior performance was not the goal of this study, we conducted limited hyperparameter tuning. But we have extended the results with additional hyperparameter tuning in a supplementary figure, and describe the hyperparameter choices more thoroughly in the methods. As well, all data includes all model responses, regardless of whether they were correct or not. We now clarify this in the methods.
(6) Code: The code repository lacks straightforward examples demonstrating how to utilize the modeling approach. Given that it is referred to as a "framework", one would expect it to facilitate easy integration into various models and tasks. Including detailed instructions or clear examples would significantly improve usability and help users effectively apply the proposed methodology.
We agree with the reviewer, this would be beneficial. We have revised the README of the codebase to explain the model and its usage more clearly and included an interactive jupyter notebook with example training on MNIST.
Some minor comments are given below. Generally speaking, the Figures need to be more carefully checked for consistent labels, colors, etc.
(1) Page 4, 1st paragraph - grammar correction: "a larger infragranular layer" or "larger infragranular layers"
Thank you for catching this, we have fixed the text.
(2) Page 4, 2nd para - rephrase: "In three additional control ANNs" → "In the third additional control ANN"
In fact, we did mean three additional control ANNs, each one representing a different randomized connectivity profile. We now clarify this in the text and provide the connectivity of the two other random graphs in the supplemental figures.
(3) Page 4, VAE acronym needs to be defined before its first use
The variational autoencoder is introduced by its full name in the text now.
(4) Page 4: Fig. 2c reference should be Fig. 2b, Fig. 2d should be Fig. 2c, Fig. 2b should be Fig. 2d, VS4; Fig. 2b, bottom should be VS4; Fig. 2f, Fig. 2f to Fig. 2g. Double check the Figure references in the text. Here is very confusing for the reader.
We have now fixed this, thank you for catching it.
(5) Page 5, 1st para: "Altogether, our results demonstrated both" → "Altogether, our results demonstrated that both"
This has been updated.
(6) Figure 2: In the e and g panels the x label is missing.
This was actually because the x-axis were the same across the panels, but we see how this was unclear, so we have updated the figure.
(7) Figure 3: There is no panel g (the title is missing); In panels b, c, e, and g the y label is missing, and in panels e and g the x label is missing. Also, the Feedforward model is shown in panel g but it is introduced later in the text. Please remove it from Figure 3. Also in legend: "AV Reverse graph" → "Reverse graph". Also, "Accuracy" and "Alignment" should be presented as percentages (as in Figure 2).
This has been corrected.
(8) Figure 4; x labels are missing.
As with point (6), this was actually because the x-axis were the same across the panels, but we see how this was unclear, so we have updated the figure.
(9) Page 7; I can’t find the cited Figure S1.
Apologies, we have added the supplemental figure (now as S4). It shows the results of models with multiplicative feedback on the task in Fig 5 (as opposed to models with composite feedback shown in the main figure).
Reviewer #2 (Recommendations for the authors):
(1) Discussion Section 3.1 is only a literature review, and does not really add any value.
Respectfully, we think it is important to relate our work to other computational work on the role of top-down feedback, and to make clear what our specific contribution is. But, we have updated the text to try to place additional emphasis on our study’s contribution, so that this section is more than just a literature review.
“Our study adds to this previous work by incorporating modulatory top-down feedback into deep, convolutional, recurrent networks that can be matched to real brain anatomy. Importantly, using this framework we could demonstrate that the specific architecture of top-down feedback in a neural network has important computational implications, endowing networks with different inductive biases.”
(2) Including ipython notebooks and some examples would be great to make it easier to use the code.
We now provide a demo of how to use the code base in a jupyter notebook.
(3) The description of the model is hard to comprehend. Please name and describe all parameters. Also, a figure would be great to understand the different model equations.
We have added definitions of all model terms and parameters.
(4) The terminology is not really clear to me. For example "The results further suggest that different configurations of top-down feedback make otherwise identically connected models functionally distinct from each other and from traditional feedforward only recurrent models." The feedforward and only recurrent seem to contradict each other. Would maybe driving and modulatory be a better term here? I also saw in the code that you differentiate between three types of inputs, modulatory, threshold offset and basal (like feedforward). How about you only classify connections based on these three type? I was also confused about the feedforward only model, because I was unsure whether it is still feedback connections but with "basal" quality, or whether feedback connections between modalities and higher-to-lower level layers were omitted altogether.
We take the reviewer’s point here. To clarify this, we have updated the text to refer to “driving only” rather than “feedforward only”, to make it obvious that what we change in these models is simply whether the connection has any modulatory impact on the activity.
(5) "incorporating it into ANNs can affect their behavior and help determine the solutions that the network can discover." -> Do you mean constrain? Overall, I did not really get this point.
Yes, we mean that it constrains the solutions that the network is likely to discover.
(6) "ignore the auditory inputs when they visual inputs were unambiguous" -> the not they
This has been fixed. Thank you for catching it.
(7) xlabel in Figure 4 is missing.
This has been fixed, thank you for catching it.
Reviewer #3 (Recommendations for the authors):
Major:
(1) How alignment is computed is not defined. In addition to a proper definition in the methods section, it would be nice to briefly define it when it first appears in the results section.
We’ve added an explicit definition of how alignment is calculated in the methods and emphasized the calculation when its first explained in the results
(2) A connectivity matrix for the feedforward-only model is missing and could be added.
We have added this to Figure 1.
(3) The connectivity matrix for each random model should also be shown.
We’ve shown each of the random model configurations in the new supplemental figure S1.
(4) Initial parameters are not defined, such as W, b etc. A table with all model parameters would be great.
We have added a table to the methods listing all of the parameters.
(5) Would be nice to show the t-sne plots (not just the NH score) for each model and each task in the appendix.
We can provide these figures on request. They massively increase the file size of the paper pdf, as there’s 49 of them for each task and each model, 980 in total. An example t-SNE plot is provided in figure 6.
Minor:
(1) Page 4:
"we refer to this as Visual-dominant Stimulus case 1, or VS1; Fig. 1a, top)." This should be Fig. 2a.
(2) "In stimulus condition VS1, all of the models were able to learn to use the auditory clues to disambiguate the images (Fig. 2c)."
This should be Fig. 2b.
(3) "In comparison, in VS2, we found that the brainlike model learned to ignore distracting audio inputs quickly and consistently compared to the random models, and a bit more rapidly than the auditory information (Fig 2d)."
This should be Fig. 2c.
(4) "VS3; Fig. 2b, top"
This should be Fig. 2d
(5) "while all other models had to learn to do so further along in training (Fig. 2e)."
It is not stated explicitly, but this suggests that the image-aligned target was considered correct, and that weight updates were happening.
(6) "VS4; Fig. 2b, bottom"
This should be Fig. 2f
(7) "adept at learning (Fig. 2f)."
This should be Fig. 2g
(8) Figure 3:b,c,e y-labels are missing
3f: both x and y labels are missing
(9) Figure labeling in the text is not consistent (Fig. 1A versus Fig. 2a)
(10) Doubled "the" in ""This shows that the inductive bias towards vision in the brainlike model depended on the presence of the multiplicative component of the the feedback"
(11) Page 9 Figure 6: The caption says b shows the latent spaces for the VS2 task, whereas the main text refers to 6b as showing the latent space for the AS2 task. Please correct which task it is.
(12) Methods 4.1 page 13
"which is derived from the feedback input (h_{l−1})"
This should be h_{l+1}
(13) r_l, u_l, u and c are not defined to which aspects of the model they refer to
Even though this is based on a previous model, the methods section should completely describe the model.
Equations 1,2,3: the notation [x;y] is unclear and should be defined.
Equation 5: u should probably be u_l.
(14) Page 14 typo: externopyrmidisation.
(15) It is confusing to use different names for the same thing: the all-feedforward model, the all feedforward network, the feedforward network, and the feedforward-only model are probably all the same? Consistent naming would help here.
Thank you for the detailed comments! We’ve fixed the minor errors and renamed the feedforward models to drive-only models.
-
-
www.bilibili.com www.bilibili.com
-
有意思
-
-
www.youtube.com www.youtube.com
-
Qu’est-ce qu’on va faire de toi ? : Synthèse des perspectives enfantines sur le monde
Ce document de synthèse analyse les échanges et les réflexions de jeunes enfants au sein d'un cadre scolaire, tels que rapportés dans le documentaire d'ARTE.
Il explore la manière dont ces enfants perçoivent, interprètent et s'approprient des concepts complexes tels que l'identité, la politique, la justice sociale et les relations humaines.
Résumé Exécutif
L'analyse du contexte source révèle une porosité frappante entre le monde des adultes et l'univers enfantin.
Les enfants ne sont pas de simples observateurs passifs ; ils intègrent les discours médiatiques, politiques et familiaux pour construire leur propre compréhension de la société.
Les thématiques centrales incluent la remise en question des normes de genre, une conscience aiguë des inégalités socio-économiques et une appréhension palpable des tensions géopolitiques mondiales (guerre en Ukraine, immigration).
Le document souligne également l'importance de la vie démocratique à l'échelle de l'école (élections de délégués) comme laboratoire de la citoyenneté, tout en mettant en lumière les peurs existentielles des enfants face à la violence et au changement.
--------------------------------------------------------------------------------
I. Identité, Genre et Structures Familiales
Les discussions enfantines révèlent une phase de déconstruction et de négociation des normes sociales traditionnelles.
La perception de la diversité et de l'altérité
• Représentation physique : À travers des jeux comme le "Qui est-ce ?", les enfants interrogent la représentation des couleurs de peau et des caractéristiques physiques, notant parfois l'absence de diversité dans les supports de jeu ("Tout le monde est blanc").
• Identité divine : Une distinction est opérée entre les humains et les figures divines ou mythologiques (Athéna, Cerbère), avec des débats sur l'existence physique de Dieu, confrontée à la réalité scientifique (l'astronaute Neil Armstrong ne l'a pas vu).
Évolution des rôles de genre
• Répartition des tâches ménagères : Les enfants contestent l'idée que la cuisine est réservée aux femmes, citant des exemples paternels faisant la vaisselle ou l'aspirateur.
• Expression de soi : La distinction entre filles et garçons est remise en question par l'usage du vernis à ongles ou des paillettes par les garçons, certains affirmant que "les hommes peuvent se vernir".
• Force et autorité : Les enfants discutent de la brutalité ou de la force, parfois attribuée aux sœurs ou aux filles, brisant les stéréotypes de douceur féminine.
Schémas familiaux et procréation
• Homoparentalité : Le concept de deux mères est abordé.
Les enfants débattent de la nécessité biologique d'un homme (spermatozoïdes) pour concevoir un enfant, tout en reconnaissant la possibilité pour deux femmes d'élever un bébé ensemble grâce à une aide extérieure.
II. Conscience Politique et Enjeux Sociaux
Les enfants manifestent une connaissance surprenante de l'actualité et des structures de pouvoir.
Manifestations et figures politiques
• Le droit de grève : Les enfants associent la grève à une colère contre le Président et à l'utilisation d'affiches pour manifester dans la rue.
• Perception des dirigeants : Les noms d'Emmanuel Macron, de Marine Le Pen et de Vladimir Poutine apparaissent dans les discussions.
Les avis sont partagés sur la "méchanceté" ou le rôle de ces figures, certains suggérant même un mariage (erroné) entre Macron et Le Pen.
Géopolitique et conflits
• Guerre en Ukraine : Le conflit est perçu comme une lutte pour le territoire et le pouvoir.
Les enfants critiquent l'absurdité de détruire un pays que l'on souhaite récupérer ("Ils sont un peu bêtes parce que s'ils veulent récupérer un pays, ils cassent tout").
• Immigration et frontières : La question des réfugiés et des contrôles aux frontières (notamment en Italie) est évoquée, liée à la nécessité de parler la langue et de travailler pour être accueilli.
Inégalités économiques
• Pauvreté vs Richesse : Les enfants expriment le désir d'être "blindés d'argent" pour mieux soigner leurs proches ou accéder à de meilleures écoles.
• Écoles privées : Certains perçoivent l'école privée comme une injustice ou un moyen de "voler de l'argent", créant une séparation entre amis.
III. La Vie Scolaire comme Micro-Société
L'école est le lieu où s'expérimentent la démocratie, la justice et les émotions liées à la collectivité.
L'expérience démocratique : Les élections de délégués
Les enfants organisent des élections et proposent des programmes électoraux centrés sur l'amélioration du quotidien et la justice sociale :
| Candidat / Thème | Propositions et Idées | | --- | --- | | Protection | Protéger la planète, protéger les filles. | | Partage | Partager l'argent avec ceux qui n'en ont pas. | | Règlement | Arrêter les bêtises, interdire les punitions. | | Bien-être | Plus de fêtes, plus de glace à la cantine. |
Instabilité et attachement
• Transience : Le départ de camarades en cours d'année (dû à des déménagements ou des changements de situation sociale comme l'hébergement en hôtel) suscite une tristesse profonde et une peur de la solitude pour ceux qui partent.
• Valeurs républicaines : La devise "Liberté, Égalité, Fraternité" est citée comme un idéal de droits communs et de lien fraternel.
IV. Imaginaires, Peurs et Violences
L'univers mental des enfants est peuplé de références culturelles et de craintes liées à la violence réelle ou fictive.
• Peurs médiatiques : Les informations télévisées ("Le malheur du monde") et certains clips (comme Thriller de Michael Jackson) génèrent des cauchemars impliquant des monstres électroniques ou des morts-vivants.
• Terrorisme et sécurité : La notion d'attentat est comprise comme une attaque surprise.
Les enfants imaginent des systèmes d'alerte pour se protéger des "méchants" qui s'introduiraient dans l'école.
• Définition de la torture : Les enfants débattent de la cruauté, citant la guillotine ou l'arrachage d'organes comme exemples de torture, tout en distinguant la méchanceté pure de la violence physique extrême.
V. Verbatim : Paroles d'Enfants
« Si j'étais président, je dirais que les gens ils peuvent faire ce qu'ils veulent sauf voler de l'argent. »
« Marine Le Pen... elle veut pas qu'on accueille des gens du tout en France... moi je pense qu'elle va être présidente, elle est méchante. »
« Ce qui est important dans la vie c'est d'être heureux. »
« La devise de la France c'est liberté, égalité, fraternité. Ça veut dire nous sommes tous frères, nous avons les mêmes droits. »
« Ils sont un peu bêtes parce que s'ils veulent récupérer un pays, ils cassent tout le pays, du coup quand ils vont le récupérer ils vont devoir tout reconstruire. »
Tags
Annotators
URL
-
-
drive.google.com drive.google.com13yost.pmd12
-
The mission of the combined ESE program is to produce graduates whoare able to understand the unique attributes of each student without focusing solelyon established special education or other labels.
This is an amazing goal to teach new educators. Provide them with the attributes and tools to provide differentiated instruction for all students! This is a great way to meet their needs.
-
In a combined program teacher candidates learn about thewide variation of the human condition, including students with disabilities, incourses in which the content for elementary and special education is integrated.
I think this is good because these students got to learn about how to lead a classroom with students that have certain disabilities. I bet this helped teachers learn how to deal with all different types of students, learning styles, and much more.
-
The interviews wereplanned to allow teachers sufficient time to reflect on their first year with moreobjectivity.
I really like how they are reflected in an objective manner. It is best to look through the lens in a non-bias way.
-
Research on successful novice teachers stresses the importance of praxis inteacher education
I have taken many Praxis exams, and they have given me knowledge that has aided me in my early years as a teacher.
-
An important aspect related to the development of critical reflection, is therole that theory plays in a novice teacherís ability to enact meaningful change inthe classroom or school setting
Reflection is a key tool for teacher growth. If we do not reflect, then how can we improve, as professionals?
-
Teacher education programs strongly influence the extent towhich novice teachers are able to think and problem-solve
I have learned so much from my 4 year college, and I continue to learn and grow through work and my graduate studies!
-
In order for novice teachers to become successful, they require the toolsnecessary for coping with challenges they encounter.
I believe this is done with the communication and collaboration from veteran teachers.
-
if theenvironment is conducive to positive growth and provides the novice teacher withopportunities for success, then the likelihood is that his/her self-efficacy willincrease
I agree with this statement completely. If our work environment is positive and uplifting, it will result in positive growth from all teachers!
-
Teacher education research has focused on various ways programs havepositively impacted confidence levels through successful participation in fieldexperiences that are connected to course work
I have to say my confidence grows when I receive positive feedback from peers, and when I attend county meetings. It gives me a sense of improvement and gives new ideas.
-
Personal as opposed to collective self-efficacyhas to do with the amount of confidence individuals have in their ability to completetasks successfully; therefore judgments of efficacy forecast how much effort oneexpends and how long he or she persists on a task
I agree with this statement. Confidence builds with how well a lesson goes!
-
novice teachers revealed that they are expected toengage in activities that result in the development of shared meaning and a sense ofcommunity in their schools. This involves an alignment between the philosophy ofthe new teacher and the context in which he or she is teaching. The notion of collectiveefficacy means that greater confidence is attained when its constituents have sharedvisions and goals
This sticks out to me because I am still a new teacher. I believe that it is best to collaborate with veteran teachers to see what progress has been made.
-
The school culture literature points out that teacher retention decreases whenteachers are confronted with inadequate support by administrators
In order for teachers to be their best, they must have support from their peers, especially their administrator.
-
-
search.brave.com search.brave.com
-
Slavoj Žižek noted, Hegel’s dialectic can be seen as a form of autopoiesis—order emerging from contingency through self-referential negation
hegel
-
-
-
eLife Assessment
This study investigates the temporal dynamics of neural activity preceding self-initiated movements and makes a valuable contribution to this field. The authors identify key methodological and analytical limitations in previous work and introduce a novel approach to overcome the shortcomings in assessing how predictive neural activity is of an upcoming event. Applying generally solid methods and analyses, they show that a late-stage neural event, ~100 ms before movement execution, is most predictive of upcoming movements, whereas earlier neural activity is less informative. Although interesting, additional analyses are needed to strengthen confidence in this central claim.
-
Reviewer #1 (Public review):
Summary:
Jeay-Bizot and colleagues investigate the neural correlates of the preparation of, and commitment to, a self-initiated motor action. In their introduction, they differentiate between theoretical proposals relating to the timing of such neural correlates relative to the time of a recorded motor action (e.g., a keypress). These are categorised into 'early' and 'late' timing accounts. The authors advocate for 'late' accounts based on several arguments that align well with contemporary models of decision-making in other domains (for example, evidence accumulation models applied to perceptual decisions). They also clearly describe prevalent methodological issues related to the measurement of event-related potentials (ERPs) and time-frequency power to gauge the timing of the commitment to making a motor action. These methodological insights are communicated clearly and denote potentially important limitations on the inferences that can be drawn from a large body of existing work.
To attempt to account for such methodological concerns, the authors devise an innovative experiment that includes an experimental condition whereby participants make a motor action (a right-hand keypress) to make an image disappear. They also include a condition whereby the stimulus presentation program automatically proceeds at a set time that is matched to the response timing in a previous trial. In this latter condition, no motor action is required by the participant. The authors then attempt to determine the times at which they can differentiate between these two conditions (motor action vs no motor action) based on EEG and MEG data, using event-related potential analyses, time-frequency analyses, and multivariate classifiers. They also apply analysis techniques based on comparing M/EEG amplitudes at different time windows (as used in previous work) to compare these results to those of their key analyses.
When using multivariate classifiers to discriminate between conditions, they observed very high classification performance at around -100ms from the time of the motor response or computer-initiated image transition, but lower classification performance and a lack of statistically significant effects across analyses for earlier time points. Based on this, they make the key claim that measured M/EEG responses at the earlier time points (i.e., earlier than around -100ms from the motor action) do not reliably correlate with the execution of a motor action (as opposed to no such action being prepared or made). This is argued to favour 'late' accounts of motor action commitment, aligning with the well-made theoretical arguments in favour of these accounts in the introduction. Although the exact time window related to 'late' accounts is not concretely specified, an effect that occurs around -100ms from response onset is assumed here to fall within that window.
Importantly, this claim relies on accepting the null hypothesis of zero effect for the time points preceding around -100ms based on a somewhat small sample of n=15 and some additional analyses of individual participant datasets. Although the authors argue that their classifiers are sensitive to detecting relevant effects, and the study appears well-powered to detect the (likely to be large magnitude) M/EEG signal differences occurring around the time of the response or computer-initiated image transition, there is no guarantee that the study is adequately sensitive to detect earlier differences in M/EEG signals. These earlier effects are likely to be more subtle and exhibit lower signal-to-noise ratios, but would still be relevant to the 'early' vs 'late' debate framed in the manuscript. This, along with some observed patterns in the data, may substantially reduce the confidence one may have in the key claim about the onset timing of M/EEG signal differences.
Notably, there is some indication of above-chance (above 0.5 AUC) classification performance at time points earlier than -100ms from the response, as visible in Figure 3A for the task-based EEG analyses (EEG OC dataset, blue line). While this was not statistically significantly above chance for their n=15 sample, these results do not appear to be clear evidence in favour of a zero-effect null-hypothesis. In Figures 2A-B, there are also visible differences in the ERPs across conditions, from around the time that motor action-related components have been previously observed (around -500ms from the response). The plotted standard errors in the data are large enough to indicate that the study may not have been adequately powered to differentiate between the conditions.
Although the authors acknowledge this limitation in the discussion section of their manuscript, their counter-argument is that the classifiers could reliably differentiate between conditions at time points very close to the motor response, and in the time-based analyses where substantive confounds are likely to be present, as demonstrated in a set of analyses. Based on this data, the authors imply that the study is sufficiently powered to detect effects across the range of time points used in the analyses. While it's commendable that these extra analyses were run, they do not provide convincing evidence that the study is necessarily sensitive to detecting more subtle effects that may occur at earlier time points. In other words, the ability of classifiers (or other analysis methods) to detect what are likely to be very prominent, large effects around the time of the motor response does not guarantee that such analyses will detect smaller magnitude effects at other time points.
In summary, the authors develop some very important lines of argument for why existing work may have misestimated the timing of neural signals that precede motor actions. This in itself is an important contribution to the field. However, their attempt to better estimate the timing of such signals is limited by a reliance on accepting the null hypothesis based on non-statistically significant results, and arguably a limited degree of sensitivity to detect subtle but meaningful effects.
Strengths:
This manuscript provides compelling reasons why existing studies may have misestimated the timing of the neural correlates of motor action preparation and execution. They provide additional analyses as evidence of the relevant confounds and provide simulations to back up their claims. This will be important to consider for many in the field. They also endeavoured to collect large numbers of trials per participant to also examine effects in individuals, which is commendable and arguably better aligned with contemporary theory (which pertains to how individuals make decisions to act, rather than groups of people).
The innovative control condition in their experiment may also be very useful for providing complementary evidence that can better characterise the neural correlates of motor action preparation and commitment. The method for matching image durations across active and passive conditions is particularly well thought-out and provides a nice control for a range of potential confounding factors.
Weaknesses:
There is a mismatch between the stated theoretical phenomenon of interest (commitment to making a motor action) and what is actually tested in the study (differences in neural responses when an action is prepared and made compared to when no action is required). The assumed link between these concepts could be made more explicit for readers, particularly because it is argued in the manuscript that neural correlates of motor action preparation are not necessarily correlates of motor action commitment.
As mentioned in the summary, the main issue is the strong reliance on accepting the null hypothesis of no differences between motor action and computer initiation conditions based on a lack of statistically significant results from the modest (n=15) sample. Although a larger sample will increase measurement precision at the group level, there are some EEG data processing changes that could increase the signal-to-noise ratio of the analysed data and produce more precise estimates of effects, which may improve the ability to detect more subtle effects, or at least provide more confidence in the claims of null effects.
First, it is stated in the EEG acquisition and preprocessing section that the 64-channel Biosemi EEG data were recorded with a common average reference applied. Unless some non-standard acquisition software was used (of which we are not aware exists), Biosemi systems do not actually apply this reference at recording (it is for display purposes only, but often mistaken to be the actual reference applied). As stated in the Biosemi online documentation, a reference should be subsequently applied offline; otherwise, there is a substantial decrease in the signal-to-noise ratio of the EEG data, and a large portion of ambient alternating current noise is retained in the recordings. This can be easily fixed by applying a referencing scheme (e.g., the common average reference) offline as one of the first steps of data processing. If this was, in fact, done offline, it should be clearly communicated in the manuscript.
In addition, the data is downsampled using a non-integer divisor of the original sampling rate (a 2,048 Hz dataset is downsampled to 500 Hz rather than 512 Hz). Downsampling using a non-integer divisor is not recommended and can lead to substantial artefacts in raw data as a result, as personally observed by this Reviewer in Biosemi data. Finally, although a 30 Hz low-pass filter is applied for visualisation purposes of ERPs, no such filter is applied prior to analyses, and no method is used to account for alternating current noise that is likely to be in the data. As noted above, much of the alternating current noise will be retained when an offline reference is not applied, and this is likely to further degrade the quality of the data and reduce one's ability to identify subtle patterns in EEG signals. Changes in data processing to address these issues would likely lead to more precise estimates of EEG signals (and by extension differences across conditions).
With regard to possible effects extending hundreds of milliseconds before the response, it would be helpful for the authors to more precisely clarify the time windows associated with 'early' and 'late' theories in this case. The EEG data that would be required to support 'early' theories is also not made sufficiently clear. For example, even quite early neural correlates of motor actions in this task (e.g., around -500ms from the response, or earlier) could still be taken as evidence for the 'late' theories if these correlates simply reflect the accumulation of evidence toward making a decision and associated motor action, as implied by the Leaky Stochastic Accumulator model described by the authors. In other words, even observations of neural correlates of motor action preparation that occur much earlier than the response would not constitute clear evidence against the 'late' account if this neural activity represents an antecedent to a decision and action (rather than commitment to the action), as the authors point out in the introduction.
In addition, there is some discrepancy regarding the data that is used by the classifiers to differentiate between the conditions in the EEG data and the claims about the timing of neural responses that differentiate between conditions. Unless we reviewers are mistaken, the Sliding Window section of the methods states that the AUC scores in Figure 3 are based on windows of EEG data that extend from the plotted time point until 0.5 seconds into the past. In other words, an AUC value at -100ms from the response is based on classifiers applied to data ranging from -600 to -100 milliseconds relative to the response. In this case, the range of data used by the classifiers extends much earlier than the time points indicated by Figure 3, and it is difficult to know whether the data at these earlier time points may have contributed (even in subtle ways) to the success of the classifiers. This may undermine the claim that neural responses only become differentiable from around -100ms from response onset. The spans of these windows used for classification could be made more explicit in Figure 3, and classification windows that are narrower could be included in a subset of analyses to ensure that classifiers only using data in a narrow window around the response show the high degree of classification performance in the dataset. If we are mistaken, then perhaps these details could be clarified in the method and results sections.
-
Reviewer #2 (Public review):
Summary:
The authors set out to investigate how well the onset of a self-initiated movement could be predicted at different times prior to action onset. To do so, they collected EEG and MEG data across 15 human participants who watched natural landscape images on a screen. These participants performed active self-initiated movements or observed passive actions to have a new image appear. By comparing the neural activity prior to active and time-matched passive actions, the authors found that even though a build-up of neural activity is visible close to 1s prior to action, action onset could only be reliably predicted around 100ms prior to action. These results confirm what was already suggested in previous literature: the commitment to action is only clear from the late stages in the visible neural ramp-up to action onset.
Strengths:
(1) The paper presents a well-thought-out methodology to assess the predictive value of neural activity prior to a self-initiated movement and passively observed action, while keeping all other experimental factors identical. This methodology can be applied outside the specific scope of this paper as well, in efforts to assess the correspondence of a neural signature with an observed behavior.
(2) The results are a strong confirmation of what was suggested less clearly in previous research (Trevena & Miller, 2010, Consciousness & Cognition; Schmidt et al., 2016, Neuroscience & Biobehavioral Reviews; Travers et al., 2020, NeuroImage).
Weaknesses:
(1) Although the authors conducted a solid confirmatory study, the importance of this confirmation is less clear to me. How do the current results change our interpretation of the relation between conscious intention and neural preparation for action? Do these results affect our interpretation of free will? Why does it matter at all whether we see neural preparatory activity prior to the report of a conscious intention to act, or prior to action observation? This study does not clarify the relationship between the observed neural phenomenon, the action or the experienced intention. It does not explain whether this relation is causal, correlational or something else.
(2) Whereas Derchi et al. (2023, Scientific Reports) were able to keep the entire experimental context similar across intended and unintended conditions, Jeay-Bizot et al. have one big difference between their passive and active conditions: the presence of a movement. Therefore, the present results explain the presence or absence of a movement rather than the presence or absence of an intention to act.
Tags
Annotators
URL
-
-
search.brave.com search.brave.com
-
Patrik Schumacher applies autopoiesis to describe self-referential design processes in digital architecture.
yep
-
-
search.brave.com search.brave.com
-
a network of processes that continuously generate and realize the components that produce them, thereby sustaining the system’s identity and boundaries.
-
-
www.researchsquare.com www.researchsquare.com
-
eLife Assessment
This fundamental study reports the effects of the psychedelic drug psilocin on iPSC-derived human cortical neurons, analyzing different aspects of structural and functional neuronal plasticity. The evidence is convincing and supports the value of using iPSC-derived human cortical neurons for testing the potentially translational effects of psilocin and other psychedelic-related compounds.
-
Reviewer #1 (Public review):
Summary:
This study reports the effects of psilocin on iPSC-derived human cortical neurons.
Strengths:
The characterization was comprehensive, involving immunohistochemistry of various markers, 5-HT2A receptors, BDNF, and TrkB, transcriptomics analyses, morphological determination, electrophysiology, and finally synaptic protein measurements. The results are in close agreement with prior work (PMID 29898390) on rat cultured cortical neurons. Nevertheless, there is value in confirming those earlier findings and furthermore to demonstrate the effects in human neurons, which are important for translation. The genetic, proteomics, and cell structure analyses used in this paper are its major strength. The study supports the value of using iPSC-derived human cortical neurons for drug development involving psychedelics-related compounds.
Weaknesses:
(1) Line 140: 5-HT2A receptor expression was found via immunocytochemistry to reside in the somatodendritic and axonal compartments. However, prior work from ex vivo tissue using electron microscopy has found predominantly 5-HT2A receptor expression in the somatodendritic compartment (PMID: 12535944). Was this antibody validated to be 5-HT2A receptor-specific? Can the authors reason why the discrepancy may arise, and if the axonal expression is specific to the cultured neurons?
(2) Line 143: It would be helpful to specify the dose of psilocin tested, and describe how this dose was chosen.
(3) Figure 1: The interpretation is that the differential internalization in the axonal and somatodendritic compartments is time-dependent. However, given that only one dose is tested, it is also possible that this reflects dose dependence, with the longer time exposure leading to higher dose exposure, so these variables are related. That is, if a higher dose is given, internalization may also be observed after 10 minutes in the dendritic compartment.
(4) Figure 3 & 4: What is the 'control' here? A more appropriate control for the 24 hours after psilocin application would be 24 hours after vehicle application. Here the authors are looking at before and after, but the factor of time elapsed and perturbation via application is not controlled for.
(5) The sample size was not clearly described. In the figure legend, N = the number of neurites is provided, but it is unclear how many cells have been analyzed, and then how many of those cells belong to the same culture. These are important sample size information that should be provided. Relatedly, statistical analyses should consider that the neurites from the same cells are not independent. If the neurites indeed come from the same cells, then the sample size is much smaller and a statistical analysis considering the nested nature of the data should be used.
Comments on revisions:
The authors performed substantial experiments to check validity of the HTR2A antibody for the revision. Briefly, they found that western blot shows a single band, abolished by a blocking peptide, in neural progenitors and iPSC-derived neurons, suggesting positive results. However, they also detected immunofluorescence signals in HEK293 and HeLa cells, which do not express 5-HT2A receptors as scRNAseq analysis of these cells show complete absence of the transcript. Therefore the antibody has epitope-selective binding but also has some non-specific binding, precluding its use. The authors rightfully removed the data related to the antibody in the revised manuscript. The account is repeated here to highlight to anyone who may find the information helpful. Overall, the additional results added rigor to the study.
-
Reviewer #2 (Public review):
In this article, Schmidt et al use iPSC-derived human cortical neurons to test the effects the psychedelic psilocin in different models of neuroplasticity.
Using human iPSC-derived cortical neurons, the authors test the expression of 5-HT2A and subcellular distribution, as well as the effect of different times of exposure to psilocin on 5-HT2A expression. The authors evaluated the effect of the 5-HT2 antagonist ketanserin, as well as the inhibition of dynamin-dependent endocytic pathways with dynasore. Gene expression and plasticity (structural and functional) was also evaluated after different times of exposure to psilocin.
In general, results are interesting since they use the iPSC to evaluate the potentially translationally relevant effects of psilocin (the active metabolite of the psychedelic psilocybin).
Comments on revisions:
The authors have addressed all of my previous concerns. A particular strength of the rebuttal is that the authors corroborated the lack of selectivity/specificity of the anti-5-HT2A antibody used in earlier versions of the manuscript.
-
Author response:
The following is the authors’ response to the original reviews.
Reviewer #1:
Comment 1: 5-HT2A Antibody Specificity
Was this antibody validated to be 5-HT2A receptor-specific? Can the authors reason why the discrepancy may arise, and if the axonal expression is specific to the cultured neurons?
We performed extensive validation of the anti-5-HT2A receptor antibody (Alomone #ASR-033), which is summarized in the accompanying Author response images:
Positive findings (Author response image 1c-e, Author response image 2a): (1) Western blot showed a single band at the expected molecular weight (~50 kDa) in neural progenitors and iPSCderived neurons. (2) The blocking peptide (#BLP-SR033) abolished Western blot bands and markedly reduced immunofluorescence signals in neurons, confirming epitope-specific binding.
Negative findings (Author response image 1a-b, Author response image 2a-b, Author response image 3): (1) We detected positive immunofluorescence signals in HEK293 and HeLa cells (Author response image 1a-b), which do not express 5-HT2AR. (2) Western blot also showed bands in HEK293 and HeLa cells (Author response image 2a-b). (3) Single-cell RNA-seq analysis of HEK293T cells confirmed complete absence of HTR2A expression (Author response image 3a). (4) qPCR showed no detectable HTR2A transcripts in iPSCs or HeLa cells (Ct > 36), while neural progenitors and neurons showed clear expression (Author response image 3b). (5) siRNA knockdown experiments failed to produce a corresponding decrease in immunofluorescence or Western blot signals, despite reduced HTR2A transcript levels (data not shown).
BLAST analysis: Protein BLAST analysis of the 13-amino acid immunogenic peptide sequence identified the human 5-HT2A receptor as the top hit (9/13 amino acids overlap). However, shorter sequence similarities were also found with other proteins, including APPBP1 (6/9 amino acids), Immunoglobulin Heavy Chain (6/7 amino acids), and Interleukin31 receptor (6/8 amino acids). While these partial homologies do not provide a definitive mechanistic explanation for the observed off-target binding, they illustrate that the epitope sequence is not entirely unique to the 5-HT2A receptor.
Conclusion: While our validation confirmed epitope-specific binding (blocking peptide effective in neurons), the antibody clearly detects something in cells that demonstrably lack HTR2A gene expression. This indicates off-target binding to other proteins sharing the epitope sequence. We have therefore removed all antibody-based 5-HT2A receptor experiments from the revised manuscript. This includes the receptor internalization data from Figure 1. The remaining findings (BDNF upregulation, gene expression changes, morphological effects, electrophysiology) are supported by independent methods including pharmacological blockade with ketanserin.
Comment 2: Psilocin Dose Selection
It would be helpful to specify the dose of psilocin tested, and describe how this dose was chosen.
We used 10 µM psilocin based on: (1) The seminal study by Ly et al. (2018), which demonstrated neuroplasticity effects at this concentration in rat cortical neurons. (2) Our own dose-response experiments (Figure S2B) showing maximal BDNF increase at 10 µM compared to lower concentrations (10 nM, 100 nM, 1 µM). We have clarified this in the revised Methods section.
Comment 3: Dose vs. Time Dependence
Given that only one dose is tested, it is also possible that this reflects dose dependence, with the longer time exposure leading to higher dose exposure.
We agree that dose dependence cannot be excluded with our current experimental design. This point is now moot as we have removed the 5-HT2A receptor internalization experiments from the manuscript. Future studies in our group will address dose-dependent effects on other readouts.
Comment 4: Control Conditions
What is the 'control' here? A more appropriate control would be 24 hours after vehicle application.
The control condition is indeed a vehicle (DMSO) control collected at the same time point as the experimental condition (i.e., 24 hrs post-treatment). We have clarified this in the revised figure legends and Methods section to avoid confusion.
Comment 5: Sample Size Description
The sample size was not clearly described. Statistical analyses should consider that neurites from the same cells are not independent.
We have expanded the sample size descriptions in the figure legends. Analyses were performed using 5-10 microscope images per condition, with 15 ROIs per image, across at least two independent differentiations from two genetic backgrounds. Regarding independence: each neurite segment exists within a distinct microenvironment and can be considered an independent measurement unit, consistent with established practices in the field (Paul et al., 2021, CNS Neurosci Ther). We acknowledge this increases statistical power and have noted this in the Methods.
Reviewer #2:
Comment 1: 5-HT2A Antibody Validation
Without validation (using for example knockdown techniques to decrease expression of 5HT2A), the experiments using this antibody should be excluded from the manuscript.
We agree with this assessment. As detailed in our response to Reviewer 1 (Comment 1) and documented in the Response to Reviewer Figure, our extensive validation attempts—including siRNA knockdown—could not conclusively demonstrate antibody specificity. We have removed all antibody-based 5-HT2A receptor experiments from the revised manuscript.
Comment 2: Serotonin in Cell Media
Did the authors evaluate whether 5-HT is present in the cell media?
The cell culture media used in our experiments does not contain serotonin. We have explicitly stated this in the revised Methods section.
Comment 3: Statistical Analysis of Figure S1F
Some of the datasets are not statistically analyzed, such as Figure S1F.
Figure S1F related to the 5-HT2A receptor experiments and has been removed from the revised manuscript along with the associated data.
Comment 4: Translational Validity of Prolonged Exposure
The authors continuously exposed cells to psilocin for hours or days. Since this is not the model of what occurs in vivo, the findings lack translational validity.
We acknowledge this limitation. Most experiments (BDNF, gene expression, branching) were conducted 24–48 hrs after a brief 10-minute exposure, which better reflects the in vivo situation. Prolonged exposures (96 hrs) were used specifically for synaptogenesis experiments based on literature showing that repeated LSD administration enhances spine density (Inserra et al., 2022; De Gregorio et al., 2022). Our in vitro system lacks metabolizing enzymes and glial cells, which may introduce temporal biases. We have added a discussion of these limitations in the revised manuscript.
Comment 5: Ketanserin Effect on BDNF
In Figure 2E, ketanserin by itself seems to reduce BDNF density. How do the authors conclude that ketanserin blocks psi-induced effects?
We identified that one cell line (Ctrl 1) with inherently higher BDNF density was inadvertently excluded from the ketanserin-only condition. After removing Ctrl 1 from all conditions and reanalyzing, the difference between Ctrl and Ket alone is no longer significant. The significant difference between Psi+Ket and Ket alone demonstrate that psilocin exerts effects that ketanserin can block, consistent with 5-HT2A receptor mediation. The revised figure and statistical analysis are included in the updated manuscript.
Comment 6: mCherry Localization mCherry (Fig 4A) seems to be retained in the nucleus.
The CamKII promoter drives expression of cytoplasmic mCherry, which fills the entire neuron including soma, dendrites, and axons. The apparent nuclear signal reflects mCherry accumulation in the soma, which surrounds the nucleus. The images clearly show mCherry extending into neurites, which was essential for our Sholl analysis of neuronal complexity.
Comment 7: Reference 36
Reference 36 is a review article that does not mention psilocin.
Our statement refers broadly to serotonergic psychedelics increasing neurotrophic factors. Reference 36 (Colaço et al., 2020) examines ayahuasca, which contains the serotonergic psychedelic DMT. We have revised the text to clarify this point.
Summary of Major Revisions
(1) Removed all 5-HT2A receptor antibody-based experiments from Figure 1 and supplementary figures due to inconclusive specificity validation. An Author response image documenting our validation attempts is provided.
(2) Clarified control conditions (vehicle controls at matched time points) in figure legends.
(3) Expanded sample size descriptions in Methods and figure legends.
(4) Re-analyzed ketanserin experiments with consistent cell line inclusion.
(5) Added discussion of translational limitations.
(6) Added new Figure S5 summarizing proposed signaling pathways.
(7) Expanded discussion on the relevance of iPSC-derived neurons for drug development.
Author response image 1.
Immunostaining for 5-HT2A receptor across cell types and peptide-blocking control. (a) HEK293 cells display a positive immunofluorescent signal despite not endogenously expressing 5-HT2AR, indicating nonspecific antibody reactivity. (b) HeLa cells also exhibit a positive signal despite lacking endogenous 5-HT2AR expression, further demonstrating nonspecific antibody binding in non-expressing cell types. (c) Neural progenitor cells show clear positive 5-HT2AR staining. (d) iPSC-derived neurons exhibit robust and well-defined 5-HT2AR staining. (e) Application of the Alomone 5-HT2AR blocking peptide (#BLP-SR033) markedly reduces neuronal signal intensity, supporting epitope-specific binding.
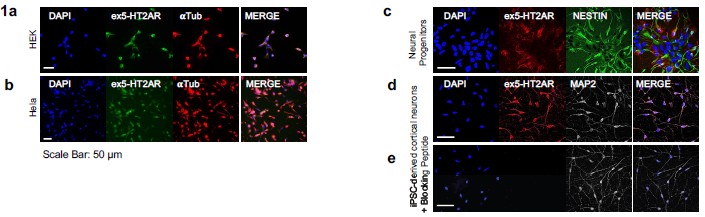
Author response image 2.
Western blot analysis of 5-HT2A receptor abundance and peptide-blocking control. (a-b) In line with the immunofluorescence a single band is detected in iPSCs, HEK cells, neural progenitors, iPSC-derived neurons and (b) HeLa cells. (a) Preincubation of the primary antibody with the corresponding blocking peptide abolishes this band across all samples, consistent with specific binding of the antibody to its intended epitope.
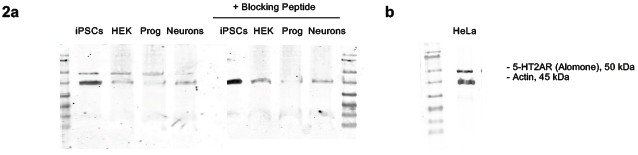
Author response image 3.
Lack of detectable 5-HT2AR expression in HEK and HeLa cells. (a) Analysis of a human-only HEK293T single-cell RNA-seq dataset (10x Genomics; https://www.10xgenomics.com/datasets/293-t-cells-1-standard-1-1-0, accessed 2025-11-25) shows no meaningful HTR2A expression, whereas other genes such as GAPDH, TP53, MYC, and ACTB are robustly detected. Consistently, evaluation of a “Barnyard” dataset - an equal mixture of human HEK293T and mouse NIH3T3 cells (10x Genomics; https://www.10xgenomics.com/datasets/20-k-1-1mixture-of-human-hek-293-t-and-mouse-nih-3-t-3-cells-3-ht-v-3-1-3-1-high-6-1-0, accessed 2025-1125) reveals only ~4 of ~10,000 droplets with minimal HTR2A signal, confirming the absence of meaningful expression.(b) (b) qPCR analysis further demonstrates no detectable HTR2A transcripts in iPSCs or HeLa cells (Ct > 36), while neural progenitors and iPSC-derived cortical neurons show expression when normalized to housekeeping genes GAPDH and TBP.
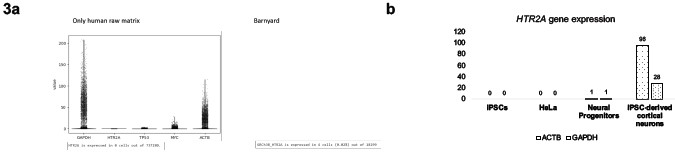
-