432 Matching Annotations
  1. Jan 2018
    1. Post-analysis of the corrected breakpoints has shown that the standard deviation of the correction amounts is around 0.95 °C for TX and 1.05 °C for TN.

      In the HOME benchmark the inserted inhomogeneities had a standard deviation of 0.8°C, while the detected inhomogeneities had a standard deviation of 0.94°C. Thus this difference between actual and detected inhomogeneities is important. In Peru, when only the largest inhomogeneities could be detected the difference may be even larger.

    2. The station density in Switzerland corresponds to one station per 475 km2 for temperature and one per 100 km2 for precipitation.

      Compared to Peru this is a factor 20 (40) higher station density for temperature (precipitation).

    3. They found that a reduction of the Slovenian station network from 60 to 44 (i.e. a reduction from one station per 307 km2 to one station per 461 km2) does not substantially influence the homogenization results.

      The distance dependence of the spatial correlations are also not that high. So you do need a clear difference in station density to get an effect. The number of stations and thus sometimes references may have some influence as well.

    4. Additionally, data quality in such regions can be low (e.g. measurement errors and missing data), leading to a substantial fraction of stations which is not suitable for climate studies.

      Also important is that this by itself also reduces the correlations between the stations and thus makes homogenisation and QC harder.

    1. V. K. C. Venema

      I am the first author of this paper.

      For some weaknesses of this study and how to improve the benchmarking, see this blogpost of mine. http://variable-variability.blogspot.de/2014/06/problems-with-home-benchmark.html

  2. Dec 2017
    1. joint detection and joint correction of multiple inhomogeneities, namely PRODIGE, ACMANT and MASH

      I would call these methods multiple-breakpoint methods. PRODIGE and ACMANT use joint correction, MASH does not.

    2. a semi-empirical algorithm for the determination of the number of breaks

      Which Lindau and Venema (2013) showed could be improved.

    3. providing the theoretically possible best approach for the characterisation of the inhomogeneities in time series with pre-set number of breaks.

      It finds the optimal solution with respect to the explained break variance for a given number of breaks. Whether this is also the optimal solution for homogenisation is under debate; see Lindau and Venema (submitted, 2017).

    4. joint detection

      At least in climatology, joint detection is more recent. HOMER in 2013 was the first implementation.

      At least I would define joint detection as the detection of break on multiple series simultaneously, which can be distinguished from multiple-breakpoint methods, which detect multiple breaks in one series simultaneously.

    5. The interactive method HOMER, one representative of this method family, became the principally recommended method of HOME

      In my view HOMER is not HOME recommended. We made these recommendations in part based on the performance in the HOMER benchmark. HOMER did not participate in the HOME benchmarking, it did not exist yet.

      One could argue that when HOMER is operated like PRODIGE it is a HOME recommended method. Operated automatically with joint detection it regularly produces problems; see for example Gubler et al. (2017).

    1. manipulating climate computer models

      No evidence. One government would not be enough. There are climate scientists in many countries all over the world.

      Also without computer models we would know it is warming and that the warming is due to human activities. For example, we see the influence of CO2 in the climatic changes in the deep past. We measured how the global temperature responds to volcanic eruptions.

    2. fake scientists to lie to them

      One of the most bizarre conspiracy theories ever created. A conspiracy over decades on the central tenets of a natural science spanning thousands of scientists in many countries and universities would be impossible to pull off.

      Other conspiracy theories at least try to provide some evidence, suggestive material. This piece just makes an empty claim.

    3. There’s been less than one degree temperature change since 1978 and no warming to speak of since 1998.
    4. TAA reports: In a series of tweets and emails Coleman sent to Al Gore and various Democratic supporters and organizations, he called out climate alarmists with a barrage of facts based on actual science and not wishful thinking. As it turns out, if you chart global temperatures back into the ’70s, there are absolutely no signs of global warming.

      "Truth And Action" (TAA) does not report on these mentioned tweets and emails, that purportedly would provide some evidence for the claims in this article and in the TAA article.

      P.S. TAA also "reported": FBI Publishes Report Stating Nobody Died At Sandy Hook.

    1. they don’t have any choice.

      One of the most bizarre conspiracy theories ever created. A conspiracy over decades on the central tenets of a natural science would be impossible to pull off.

      I do. I do not work in America. (And naturally my American colleagues also follow the evidence.) I would not be in science if the evidence would not decide what it true.

    2. Obama’s government

      This is wrong. This is not how decisions on science funding are made. It would be impossible for any American to do this, even if they pervert the process, because a large part of climate research is performed outside of the USA. Under left, right and whatever governments.

      Trump is in power now, where are all the credible scientific papers that John Coleman myths are right?

    3. But the science is on my side

      Let him write a scientific article and explain in detail where all the other scientists went wrong for all the different independent lines of evidence that the climate is changing and all the different independent lines of evidence that CO2 emissions are the main reason.

    4. Coleman said climate change has become part of the Democratic Party platform

      It used to be part of the Republican party platform. Conservatives parties all over the world accept that climate change is a problem. Scientists from all countries work on it. All countries are part of the Paris Climate Agreement, only the Trump administration has pledged to leave the agreement.

    5. there’s no reason to expect any in the future

      John Coleman may not agree with it, but there are reasons to expect warming. In fact, nearly all scientists do.

    6. any in the past

      His friends like to talk about the (little) ice age and that the climate is always changing. That is at least factually true, while no argument that this time the warming cannot be due to human activities.

      I guess there were also no tropical forest on the Arctic island Svalbart.

    7. man-made global warming
    8. Climate change is not happening
    9. science is about facts

      Science is a process to understand reality better and better.

      If there is a clear consensus understanding of something one can call it a "fact" and it is an acceptable term in daily live, but not really well suited to describe science where knowledge is always provisional.

      It is an ironic that in the same paragraph Coleman claims consensus does not exist in science, he does claim facts exist. Which is a more wide-ranging claim.

    10. there is no consensus in science

      There is no consensus on the theory of gravity? Of course that exists.

    1. 400,000 Hiroshima atomic bombs exploding across the planet every day

      The Earth is big. Time matters for an explosion. This is comparable to 0.000,000,01 bombs per meter per second.

    2. Fear has erupted within the agencies about whether their data will now be subject to political manipulation.
    3. only one other instance when global temperature records were set three years in a row: in 1939, 1940 and 1941.

      The start of the second world war also changed the composition of the fleet making the sea surface temperature observations and with it the measurement methods used changed quickly. Climatologists have made adjustments to account for this problem, but it is well possible that this was incomplete. Uncertainties in this period are larger than in the decades before and after.

      Thus it could well be that these three records in a row are due to remaining problems. I would not have emphasised it.

    4. some of them fear an accelerated era of global warming could be at hand over the next few years.

      I do not recall any climate scientist making that claim. It may happen, but I am unaware of reasons why it should be more likely than otherwise to happen.

    5. The heat extremes were especially pervasive in the Arctic, with temperatures in the fall running 20 to 30 degrees Fahrenheit above normal across large stretches of the Arctic Ocean.

      Where the Arctic ocean freezes the air can get very cold because the ice blocks the heat transport from the relatively warm ocean water. The temperature variability is naturally larger in the Arctic than in the mid-latitudes (USA, Europe).

      Thus it was very warm in the Arctic. As Gavin Schmidt said:

      “What’s going on in the Arctic is really very impressive; this year was ridiculously off the chart”

      But 20 to 30 degrees Fahrenheit may not be as exceptional as it sounds to our ears.

  3. Sep 2017
    1. poor people will be hit first and hardest.

      If people refuse to solve the problem and civilization goes down, it should be noted that the rich have most to lose.

    2. Mostly because of ideology.

      And this mostly just in the USA. In the rest of the world conservative parties accept the the science of climate change.

    3. Nope

      We are sure that natural factors alone could not have caused the observed warming, without the increase of greenhouse gasses there would not be so much warming, but they could have contributed.

      For the period 1951 to 2010 our best estimate is that all of the warming was due to human activities. But natural factors could have warmed or cooled the Earth a bit. In the period around 1900 part of the warming was probably natural due to less volcanoes and a stronger sun.

    4. radioactivity

      It would have been more accurate to say that we can see that the CO2 increase is from burning fossil fuels by measuring isotopes, differences in the number of nuclear particles of atoms. Not all relevant isotopes are radioactive and the ones that are only a little.

    5. Hard evidence

      Also important is that we have good estimates of how much fossil fuels we have burned, from which one can estimate the CO2 emissions. The increase in CO2 concentration in the atmosphere is about half of those emissions (the rest was taken up by the vegetation and the oceans).

    6. an average over the surface of an entire planet, it is actually high

      Note that the warming over land is about twice as large as the warming over the ocean. Over the ocean more of the additional heat goes into evaporation of water rather than warming of the air. It furthermore takes time to heat up the oceans, just like a water kettle takes time to boil.

      Because there is more land in the Northern Hemisphere it will warm more than the Southern Hemisphere.

      A way to see how different two degrees are is to look at a region more towards the equator that is two degrees warmer. Nature will look very different.

  4. Jul 2017
    1. from 1981–2010 average

      In that case the 1981-2010 average should be zero, which it clearly is not. Likely, like the other NOAA figures on this page, the values are the departures from the 20th century average.

    2. “Extremely remarkable” 2017 heads toward record for hottest year without an El Niño episode.

      At the moment it is more likely than not that 2017 will become the second warmest year of the instrumental period. The warmest was 2016 with El Nino. So this claim is correct.

    3. So it’s been a surprise to climate scientists that 2017 has been so remarkably warm — because the last El Niño ended a year ago.

      2016 would most likely also have been a record warm year without El Nino. Given the long-term warming trend due to global warming it was to be expected that 2017 would also be warm.

    4. that is a sign the underlying global warming trend is stronger than ever

      The rate of warming has been about the same since 1980.

      The warming is only exceptionally strong if you were deceived by people claiming that global warming had/has stopped.

    5. The latest NOAA report is “a reminder that climate change has not, despite the insistence of climate contrarians ‘paused’ or even slowed down,” Mann said.

      Right.

    6. I was expecting the values to drop a bit

      The temperature has dropped a bit.

    1. carbon emissions from energy and industry, which are still rising

      It may be too early to say the industrial emission have peaked, but the last three years they were more or less stable. This was in large part due to strong emission reductions in China.

    2. Like most of those who first raised the alarm, he believes that no amount of emissions reduction alone can meaningfully help avoid disaster.

      Most early scientists?

      I would expect most see emission reductions as important and other options, like massive carbon capture, as quite unrealistic. My impression is that most are hoping geo-engineering will not be necessary.

    3. grounding of flights out of heat-stricken Phoenix last month seem like pathetically small economic potatoes.

      I hope the author is not suggesting that aircrafts will not be able to fly in 2100. They also fly in hotter countries.

    4. After we’ve burned all the fossil fuels, these scholars suggest, perhaps we will return to a “steady state” global economy.

      Why not simply use another energy source? The energy sector is about 6% of the economy. Even if alternative energy sources would be more expensive (and the difference is no large any more), I fail to see how that would be a major problem. Especially if with "steady state" these scholars are thinking of subsistence living.

    5. blanketed much of the country’s north in an unbreathable smog.

      The main problem is burning coal.

    6. the presumed result of dehydration from working the fields they were able to comfortably harvest as recently as two decades ago.

      If this author already writes "presumed result", I would love to see a reference to the scientific literature. It would be quite surprising if the 1-1.5 °C warming we have seen up now makes such a differences.

      Data Berkeley Earth

    7. the coolest months in tropical South America, Africa, and the Pacific are likely to be warmer than the warmest months at the end of the 20th century.

      For context the reader needs to know that the seasonal cycle in temperature is much smaller in tropical countries than in the USA/mid-latitudes.

    8. dehydration from working the fields

      That also illustrates that many climate impacts are not about climate change alone. In this case people so poor that they are forced to work when it is too hot.

    9. climate system that will now go to war with us for many centuries,

      The climate just is.

      Mitigation sceptics give the impression they are annoyed the climate does not negotiate with them, that is similar anthropomorphizing the climate as thinking it will make war on us.

    10. No plausible program of emissions reductions alone can prevent climate disaster.

      Not knowing who the author talked to, selected to talk to, I cannot be sure, I would be highly surprised about this and it does not fit to what I and the colleagues I know are thinking.

    11. This is what Stephen Hawking had in mind when he said, this spring, that the species needs to colonize other planets in the next century to survive

      It is easier to keep our climate habitable than to make the climate of another planet fit for human habitation.

    12. more cloud cover (which traps heat);

      It also reflects sun light. Clouds are the largest uncertainty in climate projections. Their effect will depend on cloud height, type, droplet concentration, region and the time of day.

      Uncertainty goes both ways, mitigation sceptics are wrong to assume it will always be better, this article is wrong to assume it will be worse.

    13. the most recent one projects us to hit four degrees of warming by the beginning of the next century

      That is for the RCP8.5 scenario, the one mitigation sceptics are fighting to realise. In the light of the Paris agreement and recent price drops of renewable energy production and storage, this scenario has become less likely.

    14. absent aggressive action.

      Absent aggressive action or absent action? Does the author mean the world we would get if the mitigation sceptics win politically and we burn as much fossil fuels as possible ignoring the costs?

      Does the author see the pledges of the Paris Agreement as "aggressive" action? Or does the author think of a WWII mobilization as "aggressive" action and the outcomes described here also valid for a Paris world?

      What "aggressive" action is makes a huge difference. Hopefully every reader has the same idea of this term than the author.

    15. dozens of interviews and exchanges

      If carefully selected this can produce a wide range of outcomes the author would like and does not have to give a fair overview of the scientific state of the art.

    16. since 1998, more than twice as fast as scientists had thought.

      Agree with the comment of pneff/Michael Mann.

      Would like to add that this twice as fast is just for a cherry picked period. That is about as bad as mitigation sceptical claiming that global warming has stopped by cherry picking a specific period.

      The real message was that satellite upper air warming estimates are unreliable (still are), but seem to confirm what we know from the surface warming.

      This story was thus not alarming. If anything is was good news, it reduces uncertainties and as this uninhabitable-article already suggests: uncertainty is not our friend.

    17. permafrost was not a major concern of climate scientists, because, as the name suggests, it was soil that stayed permanently frozen

      Does the author really want to suggest scientists expected the permafrost to stay frozen because it is called permafrost? Scientists are generally not stupid and a lot of work is done on permafrost. Work from which the numbers in the rest of the paragraph come from.

    18. a string of days 60 and 70 degrees warmer than normal baked the North Pole

      Regions with open water will stay relative warm due to the relatively warm water. As soon as ice limits heat flows from the ocean to the atmosphere it can get very cold. Also in general variability is much stronger in the Arctic, what sounds like a really big warm anomaly to an innocent reader in the USA is thus exceptional, but less so than the numbers suggest. That is context a reader would need to know.

    19. appeared to have been flooded by climate change less than ten years after being built.

      That would be a design or construction error of the seed vault. That the Arctic would warm faster has always been known.

    20. close to uninhabitable

      Depending on how you define "uninhabitable", parts of the Earth are already uninhabitable. Conveniently, they are the parts where nearly no one lives.

    1. UAH and RSS

      It is a pity the report only showed the average of UAH and RSS. Seeing both datasets, including some previous ones, had shown how large the differences are.

    2. logically it would be expected that such historical temperature data adjustments would sometimes raise these temperatures, andsometimes lowerthem.

      Armchair logic.

      No idea why one would think this. Climate "sceptics" like to claim the raw data shows too much warming due to urbanization. (Detailed studies show this effect to be small for the global average warming.) If that had been the main problem, the adjustments should have had to reduce the warming and not " sometimes get warming and sometimes get cooling".

    3. Source:

      Why did you not show the new RSSv4? The large adjustments made to the satellite temperature could be seen if you have not only shown UAHv6, but also UAHv5.

    4. analysis

      I fail to find any analysis of the sort.

      It is kind of ironic you like the upper air satellite temperatures so much. They are the dataset with the most adjustments.

      Details about this graph can be found on the homepage of RSS.

    5. only one can be correct

      Remember you wrote something in the beginning about a "tropical hotspot". That means that the upper air temperature and the surface temperature should not be the same. A hint is that they have different names.

    6. Given the non-scientific nature of the surface temperature data adjustment process that hasbeen documented above

      You did no such thing. You did not even explain how the data adjustments were made, just complained you did not like the outcome.

    7. The significant cyclical pattern in theearlier reported data has very nearlybeen “adjusted”out.

      That you personally would prefer the world to have more cyclical patterns is no reason why the world should have more cyclical patterns.

      If you worry about the outcome, show where the methods are wrong. Just like scientists do.

    8. An example of this is illustrated in FigureV-19 below.

      The weather service of New Zealand made such a beautiful webpage explaining the reasons for the adjustments in so much detail. A pity you do not cite them.

    9. SeeKarletal,1986and1988.

      Nice to see a citation of the scientific literature. Even if indirect and 30 years old.

      That urban station have additional warming when the city around them develops is not disputed. The question is whether it matters for the global mean temperature. While many people live in cities only a small part of the Earth is urban. Furthermore, urban stations also tend to be relocated often to newer less urban locations. The empirical question is thus whether the original location was more urban than the current one.

      There have been many studies, looking at the problem in many different ways. They show that the effect is small when it comes to the global mean temperature. Regionally, for example China, it does make a difference.

    10. Some feel

      :-)

    11. NOAA GHCN

      No way. NOAA does not make such unprofessional messy graphs.

      Source: some blog of people making claims I like.

    12. note the 1930s and 40s warming

      Ever heard of the Dust Bowl in America? (America is just 2% of the Earth's surface.) Hopefully the Dust Bowl is not cyclical.

    13. Note also why the targeted reduction around 1940 might have been made to the reported February 2008 data.

      No the reduction is not "targeted" to the WWII. It is a consequence of the different measurement methods for the sea surface temperature used during the war.

      The methods are the same everywhere, the war caused a data problem.

    14. Figure IV-4

      A nicely red graph. That color is determined by the arbitrary zero point and only suggestive, not informative.

      The difference between the two datasets is about constant, does not affect the trend much.

    15. Figure IV-3

      The difference in the trend is very small. The green line is similarly above the red line for most of the period.

    16. Such changes would serve to increase theslope of the linear trend in NASA’s GAST data over entire period.

      The graph is about as red in the beginning as at the end. The long-term trends is just not affected much. Also look at the y-axis and compare this to the warming over this period of about 1 °C.

    17. IV.ADJUSTMENTS TO HISTORICAL GAST DATA

      If the reason are adjustments, a likely reason would be the adjustments of the sea surface temperature that make global warming smaller. Older bucket measurements are cooler than modern buoy measurements because the water cools by evaporation between taking the bucket out of the water than reading the thermometer. In the past these adjustments were thought to be larger than modern estimates.

      This could also be due to increases in the amount of data used and thus also increases in coverage. Data is especially scarce in the Arctic where the warming is strongest.

      So the "scandal" here would be that scientists were conservative in their early estimate of global warming.

    18. GAST

      Hansen wrote about the absolute temperature: The "Elusive Absolute Surface Air Temperature (SAT)" is the title of the page.

      The figures in the rest of this report are temperature anomalies used to study whether the temperature at a certain location is increasing.

      Estimating the absolute temperature is difficult because it changes quickly in space, is very different on a mountain than in a valley. In a hot year both the mountain top and the valley are warm. The anomalies vary much less in space. Warming is thus easier to estimate than the absolute temperature.

    19. Moreover, even assomeefforts increased to more accurately calculate GAST so as to better ascertain the degree of climate change, thegeographic distribution and “reliability”of the data inexplicably worsened. There was a major station dropout (75% of the stations), which occurred suddenly around 1990. And, the remaining stations are disproportionally urban with 49% at airports

      Has been studied by the climate "sceptics" of BEST. Does not make a difference, as expected.

      For the percentage of airport stations a scientific reference would be nice. The value is likely much too high. Airport stations actually show less warming. These stations were previously often in cities or villages and the airports have less urban heat island than cities.

      Airports are also mostly very small and good places to measure, the ones everyone knows are the big ones.

    20. contamination

      These potential problems have all been studied. Studies the authors apparently did not read, did not engage with or at least did not cite.

    21. evidence

      It is evidence. If the three datasets would be hugely different, such as the two upper air temperature satellite datasets, I am sure this report would use that to claim there are large uncertainties.

      And yes, it does not preclude that there are problems that are not taken into account in any of the three datasets. The difference is not an estimate of the uncertainty.

      Uncertainties can go both ways. The uncertainty monster is not our friend.

    22. Each of the three surface temperature analysis suffer from unresolved uncertainties and biases

      Those are platitudes that can be written about any piece of science. Science keeps on making progress in understanding the world around us.

      Feel invited to do it better. Everyone is.

    23. unadjusted data of the Global Historical Climatology Network

      That is no longer current. For its land data, GISS now uses the adjusted data of NOAA. As a consequence the adjustments GISS made for urbanization nowadays are no longer needed and hardly make any change any more. The main difference is thus the way the global mean is computed.

    24. Almost all the station data we have in the CRU archive is exactly the same as in the GHCN archive used by the NOAA National Climatic Data Center

      CRU gathers data themselves. This should be know among "sceptics". There was an action of the mitigation sceptics to harass Phil Jones of the UK Climate Research Unit (CRU) by asking for the data and contracts with the weather services for five random countries.

      Naturally these are to a large extend the same stations and the data from the same stations is naturally largely the same.

    25. data supplied by surface stations administered and data disseminated by NOAA under the management of the National Climatic Data Center(NCDC)in Asheville, North Carolina.

      GISS depends on NOAA data (and a few other sources). The other groups gather data themselves and naturally also include NOAA data for stations they do not obtain otherwise.

      BEST analyzed over 30 thousand stations, The ISTI has a similar number. NOAA's GHCNv3 only has about 8 thousand.

    26. NOAA’s National Climatic Data Center (NCDC), NASA’s Goddard Institute for Space Studies (GISS/ GISTEMP), and the University of East Anglia’s Climatic Research Unit (CRU)/Hadley Center

      The report ignores the monthly datasets by BEST, the ISTI, JMA and the University of Delaware. Plus all the other climatic changes that can be used to estimate warming.

    27. three terrestrial datasets

      Monthly temperature datasets. There are many more for daily and sub-daily data.

    28. est the hypothesis that

      A hypothesis must be formulated clearly so that it could be falsified. "Sufficiently credible" "for policy analysis purposes" are much too vague terms.

    29. Clearly, if GAST data is not valid, neither is the Endangerment Finding.

      No, the evidence is not that fragile. There are many ways to estimate how much the Earth has warmed.

    30. climate models are said to be valid for policy analysis purposes

      Also without climate models we would understand the greenhouse effect, observe the increases in CO2 and methane and observe warming. Also without climate models we would notice that we can only explain past changes in the climate by considering the influence of CO2.

      Climate models are helpful in reducing the uncertainties, adding regional details, but are not necessary to make the basic case that global warming exists and is due to us.

      More uncertainty increases risks of global warming. There are bound to be surprises when we take the global climate outside of known territories. The uncertainty monster is not our friend.

    31. the TropicalHot Spot (THS)is claimed to be a fingerprint or signature of atmospheric and Global Average Surface Temperatures (GAST) warming caused by increasing GHG/CO2concentrations1.

      Wrong. The tropical hotspot (faster warming in the upper air than near the surface) is expect for warming of any cause, not just for warming due to greenhouse gasses.

    32. GAST data set validity

      Also without any thermometer it would be clear that the Earth is warming. Just look at sea ice, sea level rise, melting glaciers, later river freezing, earlier ice breakup, earlier spring and animal migration, movement of animals, plants, insects and ecosystems towards to poles and up mountains, etc.

      These chances can be used for independent warming estimates. See for example this one for glaciers or this study estimating warming via the time rivers and lakes freeze up.

    33. theirhistorical data adjustments
      1. The adjustments are scientifically important, but rather modest for the global mean temperature.
      2. The adjustments make the estimated warming smaller, not larger.

      These are for example the raw and adjusted warming signals of the NASA GISS dataset. The how and why is discussed in this post.

    34. totally inconsistent with published and credible U.S. and other temperature data

      Global warming is not US warming or New Zealand warming. Surface warming is not upper air warming.

    35. NOAA, NASA and Hadley CRU

      The most important dataset this report forgets to mention is the one of Berkeley Earth (BEST project). A Red Team project partially funded by the Koch Brothers led by conservative physics professor Richard Muller.

      This was a group of outside scientists who looked at the same objections of this report:

      We carefully studied issues raised by skeptics: biases from urban heating (we duplicated our results using rural data alone), from data selection (prior groups selected fewer than 20 percent of the available temperature stations; we used virtually 100 percent), from poor station quality (we separately analyzed good stations and poor ones) and from human intervention and data adjustment (our work is completely automated and hands-off). In our papers we demonstrate that none of these potentially troublesome effects unduly biased our conclusions.

      And found the main datasets to be accurate:

      Our results turned out to be close to those published by prior groups. We think that means that those groups had truly been very careful in their work, despite their inability to convince some skeptics of that. They managed to avoid bias in their data selection, homogenization and other corrections.

      The main problem of this report is that is just repeats decade old claims, but does not engage with the arguments in the scientific literature, for example those of the BEST Red Team.

    1. cyclical temperature patterns

      The report wants to see the summer heat waves of the Dust Bowl in America in the 1930s in the global average annual mean temperature.

      The figure shows the summer temperature difference between the Dust Bowl year 1936 and now. The affected area, which was warmer in 1936 than now (blue), is about 2% of the Earth's surface.

      Hopefully the Dust Bowl is not a cyclical pattern.

    2. ‘Nearly All’ Recent Global Warming Is Fabricated, Study Finds

      The entire study could not have been more wrong in three clear ways.

      1 The adjustments are scientifically important, but rather modest for the global mean temperature.

      2 The adjustments make the estimated warming smaller, not larger.

      These are for example the raw and adjusted warming signals of the NASA GISS dataset. The how and why is discussed in this post.

      3 Also without any thermometer it would be clear that the Earth is warming. Just look at sea ice, sea level rise, melting glaciers, later river freezing, earlier ice breakup, earlier spring and animal migration, movement of animals, plants, insects and ecosystems towards to poles and up mountains, etc.

    3. You would think that when you make adjustments you’d sometimes get warming and sometimes get cooling

      No idea why one would think this. Climate "sceptics" like to claim the raw data shows too much warming due to urbanization. (Detailed studies show this effect to be small for the global average warming.) If that had been the main problem, the adjustments should have had to reduce the warming and not " sometimes get warming and sometimes get cooling".

    4. Each dataset pushed down the 1940s warming

      The second world war increased the percentage of American navy vessels, which make engine intake measurements, and decreased the percentage of merchant ships, which make bucket measurements.

      SST metadata (Figure from UK MetOffice)

      Engine intake observations are typically warmer than bucket measurements because the water cools due to evaporation before the thermometer is read. That produces a spurious warm peak in the raw data.

    5. “Nearly all of the warming they are now showing are in the adjustments.”

      That amounts to the claim that the Earth is not really warming. Even without looking at any thermometer data, even if we would not have invented the thermometer we would know it is warming

      Glaciers are melting, from the tropical Kilimanjaro</a> glaciers, to the ones in the Alps and Greenland. Arctic sea ice is shrinking. The growing season in the mid-latitudes has become weeks longer. Trees bud and blossom earlier. Wine can be harvested earlier. Animals migrate earlier. The habitat of plants, animals and insects is shifting poleward and up the mountains. Lakes and rivers freeze later and break-up the ice earlier. The oceans are rising.

    6. of the adjustments.

      This chart does not show the adjustments. It shows an unsourced graph with the difference between two datasets. This is also due to increases in the amount of data used and thus also increases in coverage.

      In as far as the reason are adjustments, a likely reason would be the adjustments of the sea surface temperature that make global warming smaller. Older bucket measurements are cooler than modern buoy measurements because the water cools by evaporation between taking the bucket out of the water than reading the thermometer. In the past these adjustments were thought to be larger than modern estimates.

      So the "scandal" here would be that scientists were conservative in their early estimate of global warming.

    7. alarmist organizations like NASA, NOAA, and the UK Met Office differs so markedly from the original raw data that it cannot be trusted.

      The differences between the raw and the adjusted data are small for the global mean temperature. The warming estimated from adjusted data is smaller than it would have been without taking changes in the way observations were made into account.

    8. What they found is that these readings are “totally inconsistent with published and credible U.S. and other temperature data.”

      Global warming is something else as US warming or New Zealand warming.

  5. May 2017
    1. The late twentieth century warm peak was of no greater magnitude than previous peaks caused entirely by natural forcings and feedbacks.

      The temperature increase is not a peak. The warming will continue if we do not do more to solve the problem. We determine how much further. Without geo-engineering the CO2 concentrations, the warming and sea level rise will stay will us for millennia.

    2. IPCC, created to find and disseminate research finding a human impact on global climate, is not a credible source. It is agenda-driven, a political rather than scientific body, and some allege it is corrupt.

      This is wrong. The IPCC reviews the scientific literature. In my field, station temperature data, the review accurately represents the scientific literature. Several of my colleagues reported the same. These feedbacks suggest that if anything the IPCC has a tendency to present a too rosy picture of climate change.

  6. Apr 2017
    1. the models are simply too sensitive to the extra GHGs that are being added to both the model and the real world.

      John Christy provides no evidence that the discrepancy is due to the models and not due to errors in his dataset; see below. Or due to errors in the comparison.

      Even if the reason were the climate models themselves, his claim that models are thus too sensitive to greenhouse gases is a second step into evidence-less territory. Without given any evidence for it, Christy seems to assume that the reason cannot be any other factor such as the historical increases in small airborne particles (aerosols) or historical land-use changes or how much the ocean delays warming.

    2. “The idea of warmer oceans translating into more snowfall seems to be a real one but then there is glacier dynamics, it’s a very complex situation.”… “It’s really only the last decades or so that have had really really good measurements of glacier topography and we can really track the mass balance so we do need the observations from satellites and also field experiments to sort out this issue.”… “There is uncertainty but you are seeing  the accumulation over East Antarctic whereas on the West Antarctic Ice shelves you are seeing net melting so there is some spatial variability. And there is significant uncertainties in our estimates of all this particularly the further back you go.”

      For all the details provided, it is unfortunate that Judith Curry does not simply state that a warmer world will mean higher sea levels.

    3. they added that if there was a slight or modest global warming that the sea levels would fall not rise.

      I would encourage Mr. Brooks to at least mention the name of his information and preferably add a scientific article to the Congressional record that would make the adventurous claim that sea level would go down when the Earth is warming. That goes against what we have observed in the past and against our understanding of the physical processes responsible for sea level changes.

    4. [Asked to explain reason for model-observation temperature mismatch he showed] “the models tend to be too sensitive to greenhouse gases, likely related to the fact the models tend to shrink clouds more than in reality, so that more sunlight gets in and heats up the Earth more. … The Earth has a way to release the heat that greenhouse gases try to build up.”

      Like I mentioned in more detail above, Christy provides no evidence that the discrepancy is due to the models and not due to problems with his dataset. If it were due to the models, he also provides no evidence that the reason is the sensitivity due to greenhouse gases.

    5. There is little scientific basis in support of claims that extreme weather events – specifically, hurricanes, floods, drought, tornadoes

      There is clear evidence that weather extremes are getting worse. Especially heat waves and severe precipitation.

      Roger Pielke has chosen to focus on four particular ones. For the evidence on hurricanes see James Elsner below.

      Floods are not just influenced be precipitation, but also be changes in land-use upstream, in settlement in flooding areas and in flood defences. It is clear that severe precipitation is increasing in many areas and flood defences will thus have to become stronger and more expensive to keep the risks the same.

      Droughts are rare and hard to measure, we do not have much high-quality long-term measurements of soil moisture. That the evidence is thus not as strong as one would like is no reason not to plan for increases in droughts especially in Mediterranean climates.

      I am unaware of a consensus on changes in tornadoes due to climate change having ever existed. Thus I do not understand why Roger Pielke mentions this.

    6. That human activities have led to changes in the earth system is broadly accepted.

      This sentence is correct.

    7. That pattern matches the observed pattern of warming that has ensued remarkably well.”

      This pattern is a fingerprint, it is unique for every possible cause of warming. That good match thus shows that we understood the warming due to greenhouse gases already quite well in 1989.

    8. “human activity is substantially or entirely responsible for the large-scale warming we have seen over the past century”

      Exactly, it is sad that this needs to be stated in the US of America in 2017.

    9. the scientific conclusion is that the consensus of the climate models fails to represent the reality of the actual changes in the bulk atmosphere.

      John Christy just made an update of his upper air temperature dataset, which changed the warming enormously.

      https://twitter.com/klimaatVeranda/status/817121281267077121

      The updated UAHv6 dataset of John Christy is quite an outlier. https://twitter.com/hausfath/status/846799655321067520

      Originally he was even claiming that the upper air temperatures were cooling, which was due to large consequential errors in how he computed the warming.

      In the light of the continual large changes John Christy makes to his dataset, it should be noted that he provided no evidence that the difference between models and his estimate of the warming is due to the models. I would argue that the "scientific method" indicates that one should first understand the problem before making strong claims.

    10. But don’t overlook the wide spread in the dashed lines

      The temperature of the upper air shows much more weather noise (due to, for example, El Nino) than the surface temperature, which has less spread.

      Uncertainty is not our friend, it makes the risks of climate change larger.

      The surface temperatures are expected to be more reliable, also by scientists who produce a satellite upper air temperatures dataset such as Carl Mears of RSS. The comparison of models and surface observations are very good, especially considering that these climate models are not made for decadal climate prediction, but for long-term projections.

      https://www.climate-lab-book.ac.uk/comparing-cmip5-observations/

    11. I demonstrate that the consensus of the models fails the test to match the real-world observations by a significant margin

      John Cristy has shown this plot for many years on his blog and in Congressional hearings. If it were a robust result, it would be scientifically interesting, however in all these years Christy has not published a scientific article on his claims and colleagues have had to reverse engineer how it was made.

      One think that is clear is that due the 5-year averages the strong warming in the last 3 years is strongly suppressed in this plot. Due to the averaging of the balloon datasets and the satellite datasets, the large uncertainty in the observations is no longer visible. It is not good practise to align measurements and models by selecting only one year that happened to have been warm; to reduce the influence of such an arbitrary choice scientists normally use a longer period to align different datasets. Several of these problems have been discussed at RealClimate, but unfortunately Christy has not updated his graph.

      A more honest graph would look like this (peak warming in 2016 not shown): http://www.realclimate.org/index.php/archives/2016/05/comparing-models-to-the-satellite-datasets/

      Climate models inform us about long-term warming and have not been developed for short-term predictions, which are strongly influenced by fluctuations from, for example, El Nino. The timing of El Nino is not predictable more than a year in advance. This problem is even more the case for the upper air temperatures shown here by John Christy than for the surface temperature. The uncertainty of climate models results for short-term prediction is expected to be about twice the model spread of the CMIP models.

    12. …”

      The scientific consensus on climate change is due the evidence that has been gathered. This was gathered over a period of much more than two decades.

      There is nothing more beautiful for a scientists that to have strong arguments against a consensus. In the light of the overwhelming evidence that man is changing the climate and the multiple independent lines of evidence toppling the consensus will be hard and woudl thus be rewarding. Please, note that Judith Curry does not provide any such evidence.

    13. Failure of climate models to provide a consistent explanation of the early 20th century warming and the mid-century cooling.

      Judith Curry provides no evidence that the larger uncertainties in this period are due to climate models.

      Uncertainty is not our friend, it increases the risks of climate change.

    14. Predictions of the impact of increasing CO2 on climate cannot be rigorously evaluated for order of a century.

      Climate models can be validated by looking at how they perform for the state of the climate, recent changes and changes observed in the deep past.

      The real world is complicated and one can claim for any personal plan and government policy that its future impacts cannot be "rigorously evaluated". That normally is not seen as a reason for inaction; people still get out of bed and do the hard work to make their future better.

    15. “Current global climate models are not fit for the purpose of attributing the causes of recent warming or for predicting global or regional climate change on timescales of  decades to centuries, with any high level of confidence.

      Also without climate models it would be clear that global warming exists. There would be more uncertainty and uncertainty goes both ways, it could be better, but also worse. Thus without climate models, the risk of climate change would be larger and stronger action would be necessary to keep the risk the same.

      Without climate change we would know less about the changes in the water cycle and in regional climatic changes. This would thus need more funding for adaptation measures to protect communities because a larger range of possible outcomes would have to be planned for.

    16. there is disagreement among scientists as to whether human-caused emissions of greenhouse gases is the dominant cause of recent warming, relative to natural causes”

      To members of the scientific community it should be obvious that there is a clear agreement in the scientific community that greenhouse gases are the dominant cause of global warming.

      This kind of evidence-free statements that there is no such agreements has led to consensus studies that consistently find large agreements on such basics among scientists and scientific articles.

    17. It is an empirical fact that the Earth’s climate has warmed overall for at least the past century

      This first sentence is still correct. The Earth has warmed by about 1°C since the end of the 19th century.

      http://globalwarmingindex.org/

  7. Feb 2017
    1. Since then, the Committee has attempted to obtain information that would shed further light on these allegations, but was obstructed at every turn by the previous administration’s officials.

      Lamar Smith kept on asking about data and software that were on the internet and given to them.

      Lamar Smith abused his personal subpoena power to also ask for nearly any email ever written. Producing this is a lot of work and seems to have been mainly intended to try to get text snippets that could be misquoted and misinterpreted like in case of Climatgate. This was clearly seen as harassing scientists as punishment for science that is inconvenient to the donors of Lamar Smith.

    2. so-called Clean Power Plan and upcoming Paris climate conference

      You should know better, Lamar Smith, politics does not make large decisions based on single scientific articles. It is the large body of scientific evidence on man-made climate change that underlies these policies and treaties.

    3. which retroactively altered historical climate change data

      Scientists are always working on improving the quality of climate data to be able to estimate more accurate trends. This is called homogenization.http://variable-variability.blogspot.com/p/homogenization.html

      Also Dr Bates, much praised by the so-called Science Committee, homogenized his satellite datasets. http://orcid.org/0000-0002-8124-0406

    4. Dr. John Bates

      Bates has the skills to write a scientific article. He opts not to do so but goes to a UK tabloid the Daily Mail. This should be a warning flag in itself. This has happened over and over again. If any of his complaints would hold up and be consequential he could have written a scientific article.

    5. Former NOAA Scientist Confirms Colleagues Manipulated Climate Records

      Lamar Smith nor Bates show that the temperature analysis is wrong. Much ado about nothing.

    6. to discredit the notion of a global warming hiatus and rush to time the publication of the paper to influence national and international deliberations on climate policy

      This is one of the parts he clearly did not understand. The update only brought the NOAA dataset more in line with the other global temperature datasets.

      Later analysis with other datasets showed that the update was indeed an improvement. https://www.carbonbrief.org/factcheck-mail-sundays-astonishing-evidence-global-temperature-rise

    7. hat the Karl study used flawed data

      A recent paper showed that the new sea surface temperature data was an improvement and fitted better to other datasets. http://advances.sciencemag.org/content/3/1/e1601207

    8. rushed for publication to support President Obama’s climate change agenda.

      One someone calls rushed. The update of the sea surface dataset, which was the main change for the period Lamar Smith finds politically interesting was done in 2013. Then no one complained, only after the Karl et al. paper in 2015. http://icarus-maynooth.blogspot.de/2017/02/on-mail-on-sunday-article-on-karl-et-al.html

    9. This culminated in the issuance of a congressional subpoena

      This is nowadays just a personal subpoena of Lamar Smith. When this kind of harassment is done on the political friends of Smith, he does recognize that it is harassment and suppression of the freedom of science and freedom of speech to have Congress about its Washington power for its donors. Scientists have complained about this no matter which "side" was harassed by politicians. http://variable-variability.blogspot.com/2015/02/stop-all-harassment-of-all-scientists.html

    10. The hiatus was a period between 1998 and 2013 during which the rate of global temperature growth slowed.

      The "hiatus" political hacks like so much is mostly well-understood year-to-year fluctuations in El Nino. If the influence of El Nino is removed, this apparent so-called "hiatus" disappears. For details, see this article. https://archive.is/nVqgk

    11. Andy Biggs

      Only 4% of Andy Biggs donations come from small donors.https://www.opensecrets.org/races/candidates.php?id=AZ05&cycle=2016

    12. Darin LaHood

      Darin LaHood is funded by the Koch Industries and ExxonMobile. This may have influenced his opinion. https://www.opensecrets.org/politicians/contrib.php?cid=N00037031&cycle=2016&type=I&newMem=N&recs=100

    13. n order to meet a politically predetermined conclusion. 

      You are misinterpreting his claims. He wanted NOAA to follow his newer procedures, which he used for his satellite datasets. There was nothing wrong with the procedures NOAA followed. Normal science. http://icarus-maynooth.blogspot.de/2017/02/on-mail-on-sunday-article-on-karl-et-al.html

    14. retired principal scientist at NOAA’s National Climatic Data Center

      Who was not involved in the science of the surface dataset and clearly did not understand much of it. http://icarus-maynooth.blogspot.com/2017/02/on-mail-on-sunday-article-on-karl-et-al.html

    15. U.S. House of Representatives Committee on Science, Space, and Technology

      The largest donor of chair Lamar Smith is the oil and gas industry. https://www.opensecrets.org/politicians/summary.php?cid=N00001811

      For details on Smith war against science: https://www.desmogblog.com/2016/06/21/exxon-koch-lamar-smith-exxon-knew

  8. Jan 2017
    1. many scientists have concluded the impacts of climate change will be unacceptably dangerous

      "Unacceptably dangerous" is an opinion. If paraphrased right by Bob Ward they were thus expressing their personal opinion. For opinions I prefer to know who said it.

    2. “This El Niño might have contributed about a quarter or a third” of the record in 2016

      I agree with Chris Colose. If you mention a fraction (a quarter or a third) you need to mention relative to what. The total warming since 1900 is about 1°C. The influence of El Nino on the 2016 temperature was small compared to that.

    3. In contrast, NOAA gave a 62 percent confidence in the broken record.

      The difference between NOAA and NASA-GISS is because of the way the Arctic is treated, where much of the warming was in 2016, but where we do not have much measurements. NOAA excludes much of the Arctic, which gives it a cool bias in 2016, which is accounted for by a larger uncertainty.

      NOAA. The gray areas are where NOAA's methods do not have enough observations to compute the temperature. Not computing a temperature is similar to assuming these regions warm like the global average, but the Arctic warmed more.

      NOAA

      GISTEMP of NASA-GISS uses other mathematical methods and does compute temperatures for the Arctic, which results in a more accurate global average. NASA-GISS

  9. Dec 2016
    1. Policy

      Policy Foundation.

    2. Big El Ninos always have an immense impact on world weather, triggering higher than normal temperatures over huge swathes of the world.

      Not only warming. El Nino is associated with droughts in some regions and severe rain in others. It thus has strong impacts and is a large focus of climate research.

      As far as i know it is not clear yet whether the El Nino / La Nina variations become stronger with climate change? Does anyone else know literature on this question?

    3. ‘According to the satellites, the late 2016 temperatures are returning to the levels they were at after the 1998 El Nino

      Not based on any evidence. Just like the warming peak due to El Nino was higher in 2016 than in 1998, the period after 2016 will be warming than the years after 1998 due to the progress of global warming.

    4. climate research budget.

      Earth science budget. It could be that Mr Walker also does not know the difference.

    5. Global average temperatures over land have plummeted by more than 1C since the middle of this year – their biggest and steepest fall on record

      This image is deceptive as it only shows part of the data. With all the problems of this dataset, it also shows long-term warming if you look at the full period.

    6. Dr Schmidt also denied that there was any ‘pause’ or ‘hiatus’ in global warming between the 1998 and 2015 El Ninos.

      If you want to cherry pick 1998 as begin year, a year in which the temperature was high due to El Nino, it would at least be fair to stop in 2016, not 2015, because 2016 is the year that the temperatures were high due to El Nino. if you do so, there is clearly no "slowdown".

      Better would be not to cherry pick a specific period. The long-term trend is clearly warming and statistics does not indicate any decline in the warming rate. Since 2016, I would argue you no longer need statistics to see this. Jus look at the complete graph.

    7. Last year, Dr Schmidt said 2015 would have been a record hot year even without El Nino. 

      Note Dr Schmidt said 2015. El Nino did start in the ocean that year, but 2016 is the year where the air temperature is most influenced by El Nino. That takes some time.

    8. Some scientists, including Dr Gavin Schmidt, head of Nasa’s climate division, have claimed that the recent highs were mainly the result of long-term global warming.

      Dr Gavin Smith, who is head of NASA's Goddard Institute for Space Studies and not any of the NASA divisions, is right. The long-term warming of about 1°C globally and more over land and more in Northern Hemisphere is much larger than the El Nino fluctuations. See graph of the Global Warming Index above.

    9. Global average temperatures over land have plummeted by more than 1C since the middle of this year – their biggest and steepest fall on record.

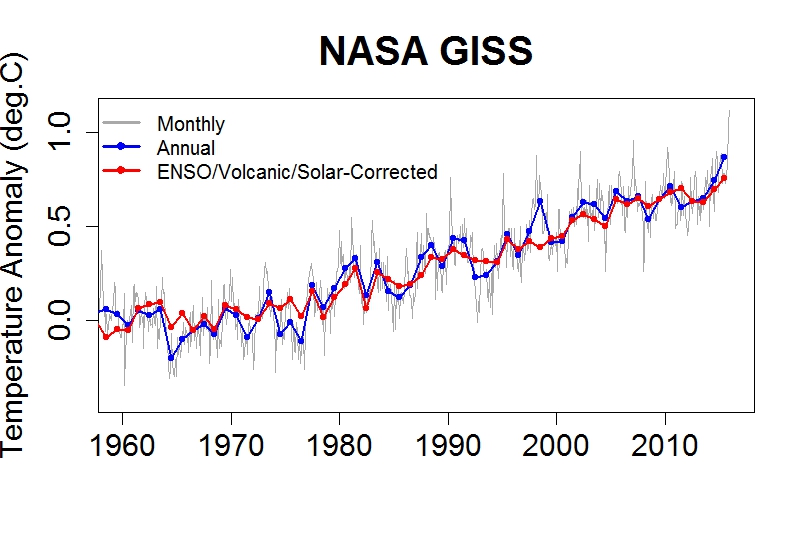
      It is known that El Nino, an osculation in the tropical Pacific is a cause of short-term fluctuations of the temperature and precipitation. This should not be confused with long-term warming. This is clearly illustrated by this graph below that shows the warming of El Nino years, La Nina years (the opposite of El Nino) and neutral years individually.

      global temperature, indicating El Nino and La Nina years

      The graph also takes out volcanoes, which is another source of short-term fluctuations. The graph is from the Texas State climatologist John Nielsen-Gammon.

      Thus going from an El Nino to a La Nina some cooling is expected. To make the mislead claim that this is 1°C of cooling David Rose had to ignore a large part of the evidence and select only what suits his narrative.

      1.He selects monthly temperature data, which is more noisy than annual average temperatures.

      2.In this noisy data he selects the highest and the lowest value. If you do this you amplify the noise, the highest value is more likely than not high in part due to the noise and the low value low due to the noise.

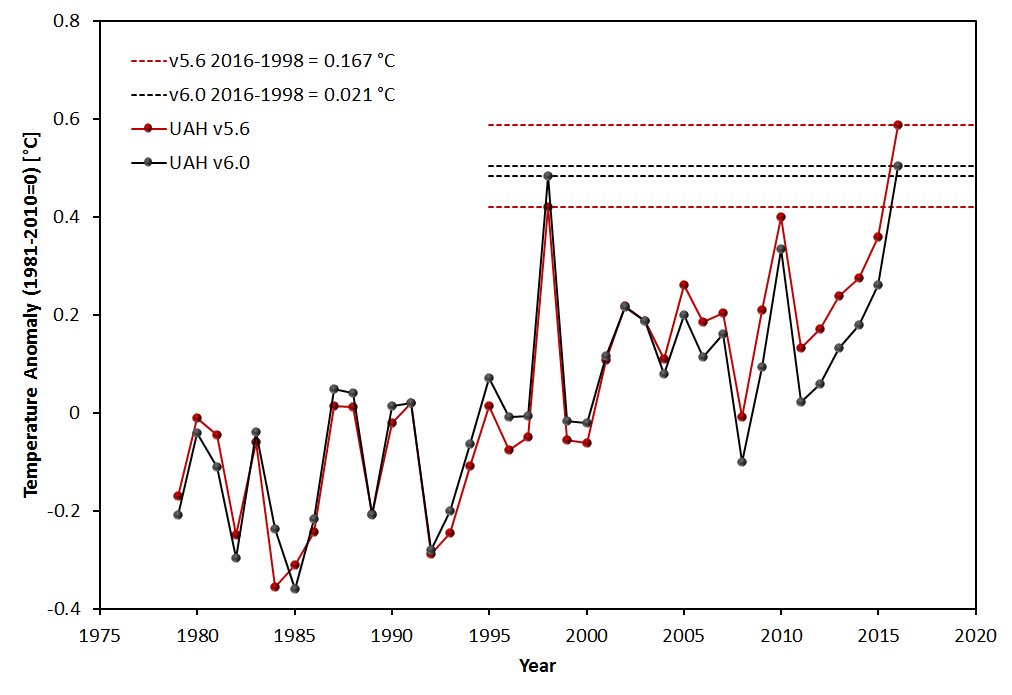
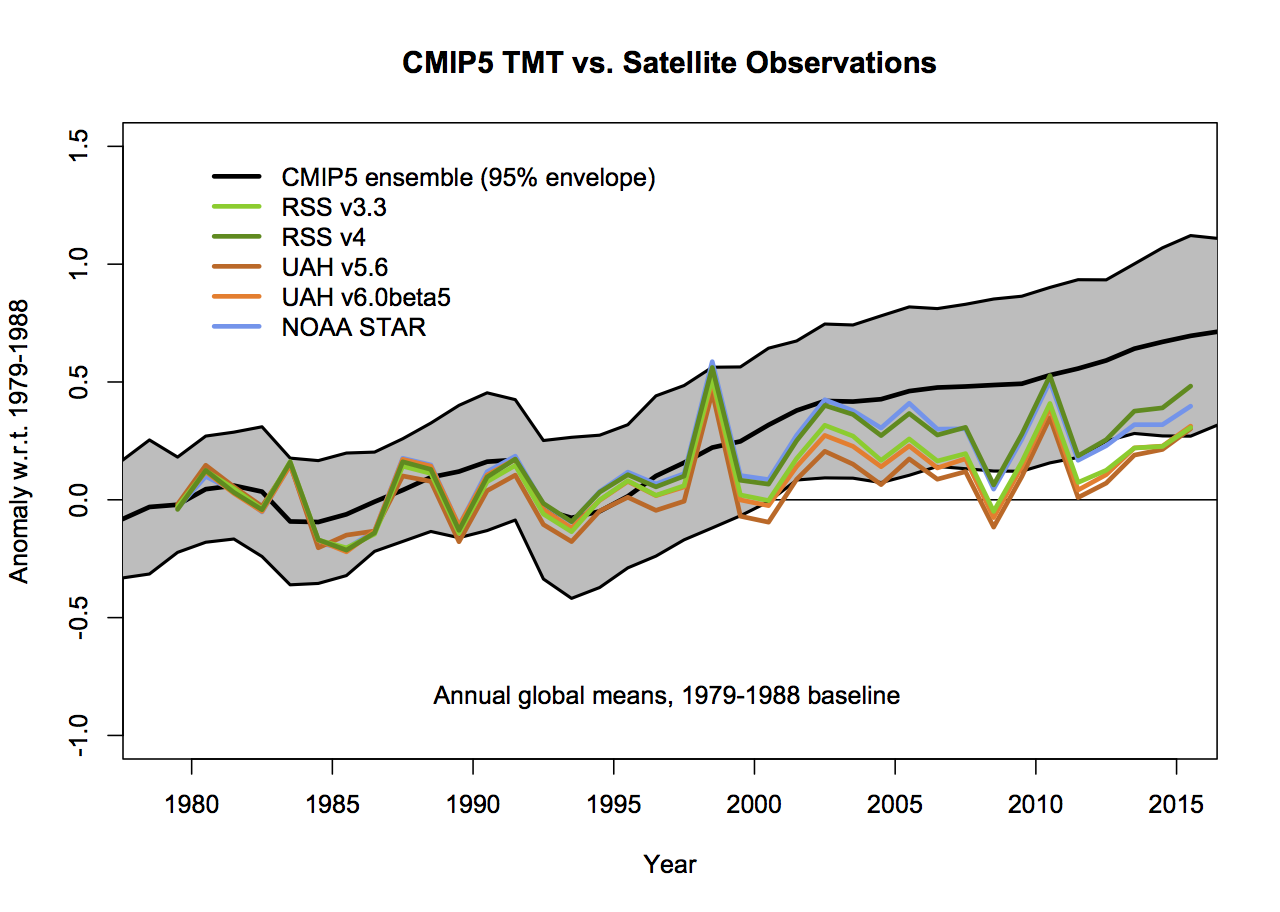
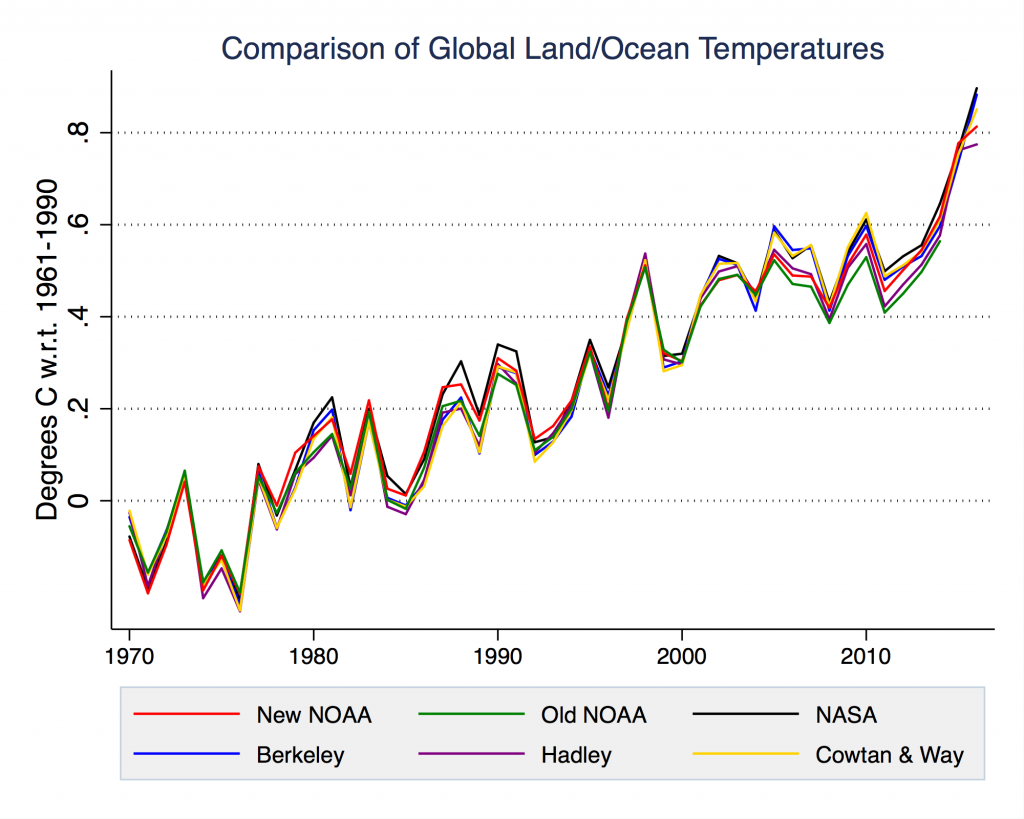
      3.Rose not only selected specific months, but also specific variables and datasets. He shows the temperature of the troposphere, several km up in the air, not the temperature at the surface. He shows one specific dataset (out of a dozen) of the tropospheric temperatures, while all other datasets show a smaller temperature drop.

      4.The temperature of the troposphere is influenced more strongly by El Nino, that the surface temperature, where we live. This dataset is thus more noisy. It shows about the same long-term trend in warming, but this trend is harder to see due to all the noise.

      5.Rose selected only the land temperature, which is only 1/3 of the Earth's surface and thus more noisy than the global temperature itself. And the land temperature is by its nature more noisy. While the temperature in the Arctic is extremely high, the land temperature in Siberia was very cold in October.

      6.The dataset Rose selected has known problems. To quote its producer Carl Mears:

      The lower tropospheric (TLT) temperatures have not yet been updated at this time and remain V3.3. The V3.3 TLT data suffer from the same problems with the adjustment for drifting measurement times that led us to update the TMT dataset. V3.3 TLT data should be used with caution.

    10. Comes amid mounting evidence run of record temperatures about to end

      We had 3 record warm years, 2014, 2015 and likely 2016. Also when Bayern Munchen loses a game, they are still be best team in Germany. Also when 2017 is not again a record year, global warming will continue.

      The temperature increase can be seen in this graph of the Global Warming Index with data up to September.

      Global warming index

    11. This means it is possible that by some yardsticks, 2016 will be declared as hot as 2015 or even slightly hotter – because El Nino did not vanish until the middle of the year.
    12. Nasa satellites

      The temperature estimates come from passive microwave radiometers. These instruments prime task is estimating air humidity for meteorology, weather prediction. Thus most of the these instruments actually flew on NOAA satellites. It should be noted that they were not designed to be used for long-term climate monitoring.

  10. Nov 2016
    1. Tony Heller

      Tony Heller is a blogger who is best known by his pen name Steven Goddard and known for fabrication climate data. Some of these cases are listed on his Wikipedia page. https://en.wikipedia.org/wiki/Steven_Goddard

      His claim that NASA fudged US temperature data was assessed by PunditFact as [Pants on Fiire].(http://www.politifact.com/punditfact/statements/2014/jun/25/steve-doocy/foxs-doocy-nasa-fudged-data-make-case-global-warmi/)

      He has no scientific publications on his name.

    2. Tim Ball

      Tim Ball not only denies that humans amplify the greenhouse effect due to our CO2 emissions, he denies the fact that CO2 is a greenhouse gas. A position that even most people who call themselves "climate sceptics" find to be extreme. https://en.wikipedia.org/wiki/Timothy_Ball

    3. evidence-the measured data,physical observations, hard facts-proving that carbon dioxide from human activitydetrimentally affects climate.

      There is a report that provides the evidence, by a large international body of scientists called the IPCC. It is quite informative.

    4. ON CLIMATE,CSIROLACKS EMPIRICAL PROOF

      Science is consists of both understanding (theory) and observations (measurements). Both cannot do without each other.

      Proof is for mathematics and alcohol. Science is not religion, nothing is ever proven. There is a wealth of (empirical) evidence for climate change.

    1. pollutants, carbon dioxide (CO2) is an odorless, colorless gas

      There are many toxic gasses that are odorless and colorless. The best known one is like CO2 also related to combustion: Carbon Monoxide.

    2. CO2 is nontoxic to people and animals

      Strange side-argument that is unrelated to global warming, but actually, CO2 is toxic, that is why we exhale it to get rid of it. https://en.wikipedia.org/wiki/Carbon_dioxide#Toxicity

      Global warming due to the amplifying of the greenhouse effect is, however, the more immediate problem.

    3. CO2 Coalition website,

      This link, expectedly, does not show any observations for the future or anything else that could be seen as explaining what this claim was intended to mean.

    4. But observations, such as those on our CO2 Coalition website, show that increased CO2 levels over the next century will cause modest and beneficial warming

      There are no observations for the future century.

  11. Oct 2016
    1. “a fraud really, a fake.”

      For the people who do not click on the link, James Hansen's problem is the reverse of Roy Spencer's. For Hansen the Paris climate treaty as strong enough: "no action, just promises". Since then many of these promises have already resulted in political changes.

    2. But the observed warming as monitored by satellites (our only truly global monitoring system) has been only about half of what computerized climate models say should be happening.

      The satellite record is climatologically very short, which is one of the reasons its trend has a large uncertainty. Furthermore, upper air temperatures are more noisy, because of the larger influence of El Nino. If you see the figure below, the "half" no longer looks that impressive. (The peak in 1998 is El Nino; the figure stops before the current peak due to a strong El Nino in 2015.)

      Comparison CMIP5 ensemble with the RSS upper air temperature estimates

      Here it should be remembered that the spread of a large number of climate models (the yellow area) is an underestimate of the actual uncertainty. In case of decadal variation in the surface temperature, the uncertainty is about twice are large as the model spread.

      Also the observations have large uncertainties (the blue area). The satellites were launched to measure humidity for meteorology. They were not designed to be used to estimate temperature, and certainly not to do so for climate change research, which places much stronger demands on temporal stability. Changes in the orbit and design of the satellites and sensors make it difficult to compare temperature estimates in time.

      The article by Peter Thone and colleagues (2011) thus states:

      "Overall, there is now no longer reasonable evidence of a fundamental disagreement between models and observations with regard to the vertical structure of temperature change from the surface through the troposphere"

      As a scientists who works on observational data, I would like to stress that even if there were significant differences, that could just as well be due to the observations. The reasons for the differences need to be understood before one can blame the models, the observations or the comparison method.

      Different from the global picture, the differences in the tropics are larger may be significant, they may also not be. That is a real ongoing debate.

      Nitpick: Also satellites are not global.

    3. the promised actions will have no measurable effect on future global temperatures.

      The current promises of governments around the world (INDCs) are not enough to stay below a warming of 2°C, but they do make a difference. In the article "Paris Agreement climate proposals need a boost to keep warming well below 2 °C" , Joeri Rogelj and colleagues wrote in Nature this June they state:

      "The INDCs collectively lower greenhouse gas emissions compared to where current policies stand, but still imply a median warming of 2.6–3.1 degrees Celsius by 2100"

    4. Sea level rise, which was occurring long before humans could be blamed, has not accelerated and still amounts to only 1 inch every ten years.

      Sea level rise started before we had good instrumental observations, which makes it harder to see the acceleration. If you look sea level rise for longer periods based on indirect (proxy) evidence, it is clear that the current sea level rise is much faster than it was the last 1000 years

      See for example this article on RealClimate on a recent study for the last 2000 years.

      It will depend on our actions whether sea level rise will accelerate much more.

      This is an article on the expected sea level rise for the coming century.

  12. Sep 2016
    1. inspired new respect for natural climate variability relative to greenhouse-gas forcing.

      Natural variability has been studied by science since the beginning. That El Nino fluctuations can give the appearance of a "hiatus" is something scientists have warned about since the likes of Robert Bradley Jr. have started their "hiatus" meme, ignoring all those warnings. Without any need for statistical expertise, this can be seen in the plot below from the Texas State Climatologist. http://blog.chron.com/climateabyss/2012/04/about-the-lack-of-warming/ http://blog.chron.com/climateabyss/2012/04/about-the-lack-of-warming/

    2. “We have at most ten years—not ten years to decide upon action, but ten years to alter fundamentally the trajectory of global greenhouse emissions.”

      The classical because-x-did-not-happen-yet-thus-x-will-not-happen fallacy. A fallacy that is especially problematic in case of a problem like man changing the climate, which goes slowly, like an oil tanker slowly changes direction. In addition: We did something. Most of the new installed power generation capacity is free of CO2 emissions nowadays, we are now paying the price for past too slow actions and the consequences of past inaction will still become larger.

    3. Peter Wadhams, professor of ocean physics at the University of Cambridge, predicted “global disaster” from the demise of Arctic sea ice—in four years. He too, is eating crow.

      These predictions of Peter Wadhams have been opposed by all climate scientists I know of. This picking quotes that are convenient for Robert Bradley Jr.'s narrative while ignoring what most climate scientists say is one of his most used rhetorical tools.

    4. understating the uncertainties associated with the climate problem.

      The uncertainty monster is a reason to act faster. Uncertainties how strongly the climate will respond makes the risks of climate change larger. The surprises are what I fear the most. http://variable-variability.blogspot.com/2015/12/judith-curry-uncertainty-monster-high-risk.html

    5. I cover energy issues from a private property

      Climate change is the abstract equivalence of dumping your garbage on your neighbours laws and violating your neighbours property rights.

    6. The discrepancy between model-predicted warming and (lower) real-world observations

      Robert Bradley Jr. probably makes the typical mistake of equating the model ensemble spread with the model uncertainty. If climate models are used for decadal climate prediction, like Robert Bradley Jr. does here, the uncertainty is twice as large as the model spread. For details and explanations see: http://variable-variability.blogspot.com/2015/09/model-spread-is-not-uncertainty-nwp.html

  13. Aug 2016
    1. 50% of its surface.

      Note 50% of the surface was melting, not 50% of the ice mass. Melting in summer is naturally normal.

    2. with sharp spikes in the El Niño-dominated eastern Pacific, which was 2C warmer than the long-term average

      The sea surface was 2°C warmer, not the complete ocean (where the 90% of extra heat from the beginning of the sentence was about).

    3. a hefty El Niño climatic event

      The influence of El Nino was likely not as large as it was in 1998. A large part of the warming was also in the Arctic, as lenae101 also argues below.

    4. This means that the world is now 1C warmer than it was in pre-industrial times

      The temperature is 1°C warmer than in the beginning of the instrumental temperature record (1880). The 19th century was likely a little colder than the pre-industrial period. This difference is not large and currently being studied, but likely we did not cross the 1°C warming relative to pre-industrial yet.

  14. Jul 2016
    1. That event killed hundreds of people in Paris and London

      Only mentioning the deaths in two cities understates the danger of heat waves. The number of people who died in the 2003 heat wave is estimated to be in the tenths of thousands. This article estimates it was 70 thousand additional deaths.

    2. In other words, when a planet warms, the odds shift in favor of more intense or long lasting heat waves. That’s just plain logic.

      Heat waves are rare hot periods. This does not only depend on the mean temperature ("when a planet warms"), but also on the variability around the mean.

      It is theoretically possible that the mean temperature increases, but that the variability decreases so much that heat waves become less common. Thus, if I may nitpick, it is not "just plain logic", but an empirical question. This comment is nitpicking because the evidence suggests that heat waves are indeed increasing.

  15. May 2016
    1. There has been asignificant change in land use over most of theSoutheast since about 1930 (McNider and Christy2007).

      This reference goes to a New York Times article by the authors of this scientific article. I feel that is not appropriate for this scientific claim.

  16. Jan 2016
    1. free atmosphere (technically, the lower troposphere)

      Normally I would not nitpick, but Michaels calls himself a "climatologist". The (lower) troposphere is not the same as the free atmosphere.

      The troposphere is the layer between the surface and the tropopause. Near the surface it has a boundary layer, which is typically about 1 to 2 km thick during the day. The free atmosphere is above the boundary layer.

    2. John J. Kennedy’s “A review of uncertainty in in situ measurements and data sets of sea surface temperature,” published Jan. 24, 2014, by the journal Reviews of Geophysics.

      Scientists always aim to quantify how accurately we know what we know by computing uncertainties. I hope the reader will read the article by John Kennedy of the UK MetOffice one of the most respected scientists in this field. The article does not support the claim of Michaels that there was a "hiatus".

      In fact, if Michaels would like to make a big thing out of the small deviations that caused him to see a "hiatus" he should actually claim that the temperature measurements are extremely accurate. Uncertainties make it harder to determine with confidence that a minimal deviation exists.

    3. It is therefore probably prudent to cut by 50% the modeled temperature forecasts for the rest of this century.

      Lakes and rivers are warming faster than the regional air temperatures.

      The Arctic sea ice is disappearing faster than modelled. As well as snow cover.

      Precipitation is getting stronger faster than models predict.

      Would Michaels conclude from that that it would be prudent to increase the "modeled temperature forecasts" (actually projections)? I would personally argue that we should first understand the reasons before we would do that, but maybe I am too much of a scientist.

    4. barely a third of what it was supposed to have been

      One wonders where this number, "a third", comes from. The global mean temperature trend of the tropospheric temperatures (estimated by satellite) is very similar to that of the surface temperature over the short period for which we have satellite data.

      It is expected that the tropospheric temperature would rise a bit faster than the surface temperature, but this is a small deviation. Far from the completely false claim of Michaels that the warming is only a third of what it should be.

      As in any case, this deviation could be due to the models, the measurements, their data processing or the comparison. One would need to understand the reasons for this small deviation before one can claim that the models would need to be a little less sensitive.

    5. Before carbon dioxide from economic activity could have warmed us up, temperatures rose three-quarters of a degree Fahrenheit between 1910 and World War II.

      Also before 1950 there was warming due to greenhouse gasses. Part of this warming was compensated by increases air pollution that also comes from burning fossil fuels. However, CO2 builds up, while air polution has a short life time. In the end, CO2 dominates. Before 1950 there was also warming due to natural causes due to less volcanoes and a stronger sun.

      After 1950 we can say that our best estimate is that all warming was man-made, but also before 1950 part of the warming was man-made. All forcings (physical causes that change the temperature) are shown in this graph from the latest IPCC report.

      Climate forcings that cause temperatures to change

    6. fits and starts

      In fits and starts

      There are also other reasons why the global mean temperature changes from one year to the next, such as volcanoes and El Nino. You see these changes on top of the long-term trend due to increases in greenhouse gases.

      It is strange that Michaels emphasises this, because that is exactly the main reason why his idea that there was a "hiatus" in man-made global warming due to greenhouse gasses is so terribly wrong. Does anyone see a "hiatus" in the graph below? You no longer need statistics to tell you that this meme was wrong. Global mean temperature of NASA GISS

    7. Surface temperatures are indeed increasing slightly

      I would not call the temperature increase "slightly". But am happy to let the reader decided on this matter of taste by simply showing the graph rather than Michaels' complicated description. Global mean temperature according to NASA/GISS

    1. But we do have other reliable indicators of temperatures before the late 1800s,

      It is heart warming to hear Mr Taylor describe the temperature reconstructions of scientists such as Michael Mann as a "reliable indicator".

    2. Satellite temperature measurements show 1998 and 2010 were warmer than 2015. Image courtesy of drroyspencer.com.

      The UAH6.0 dataset has not been published yet and scientists have thus not had the opportunity to check these results. UAH6 used very different methods to estimate the temperatures and having a much smaller recent trend than the previous UAH5 dataset.

      An awkward choice to use UAH6.0 to contrast to the well vetted and more reliable trend estimates of the surface temperature by six different groups world wide. A balanced journalist would at least also show these results.

    3. With a record El Nino, we should have experienced record high temperatures. Yet we didn’t.

      The last record of the satellite tropospheric temperatures in 1998 was in the year after an El Nino. This may well be the case again. Climate predictions on the short-term are difficult, but it is expected that 2016 will again be a record year.

    4. Satellite temperature readings

      One wonders if James Taylor has his mansion 4 km up in the air, which is where this satellite estimate comes from. It is a pity that the author does not indicate why this temperature should be the arbiter of everything, while it has no impact on human society.

    5. Forget what global warming activists would lead you to believe – 2015 was not even close to the hottest year on record.

      Wrong, 2015 was the hottest year in the global instrumental record.

      When "journalists" think the understand science better than scientists and feel the need to call them names that does not bode well for the quality of the information coming.

    1. Meteorological agencies in Britain and Japan do so, as well.

      Next to these four groups, there is also the privately funded Berkeley Earth dataset and the Cowtan & Way dataset. They all show similar results.

    2. Exactly, before you may have needed good statistics to protect yourself against the human tendency of being a greedy pattern recognizer. Now it is hopefully seen by eye for everyone that there never was any trend change and that it is a good idea to use objective statistics.

    3. Selecting to start your period at a peak is a terrible way to compute a trend and will by definition bias your result.

      There was no change in trend, just variability around a long-term trend.

  17. Nov 2015
    1. a new study

      It is a good idea to check the source. In this case the link goes to an unpublished manuscript.

      The manuscript only cites one study with positive impacts. The one of Mr. Tol himself for a 1°C temperature rise, which is a point we have just reached. That impacts for this study become statistically significant only at 3.5°C is because the economic uncertainties are so large. Uncertainties go both ways.

      The introduction gives another impression as this op-ed:

      For such a fractious discipline, there has been remarkable agreement amongst economists on first-best climate policy. Ever since the writings of Nordhaus (1977), d'Arge (1979) and Schelling (1992) , it has been widely accepted that climate change is, on balance, a negative externality and that greenhouse gas emissions should be priced, preferably taxed.

    2. based on actual observations

      It is deceiving to call these estimates "based on actual observations". Also comprehensive physical climate models reproduce the warming in the last century.

      The real difference is that these estimates are based on simple statistical models rather than on comprehensive physical models.

      This is beyond the literature I normally read, I hope the others are able to provide references, but I have the impression that we are starting to understand why these simple statistical models are biased too low and that the uncertainty of these estimates is very large because the estimates depend strongly on the assumptions made and the datasets used.

      It should be noted that the estimates of the climate sensitivity are not only based on comprehensive physical climate models, but also on our physical understanding of the climate system (radiative transfer, the water vapour feedback and the albedo/snow feedback). And the climate sensitivity estimates are also based on the past behaviour of the climate system, the magnitude of the temperature changes during ice ages and the fact that Earth has recovered from being an ice ball. (I wanted to remind the others of these arguments and hope that they have references to back this up.)

    3. 1.5 to 4.5 degrees Celsius

      This is the range for the Equilibrium Climate Sensitivity, not for the temperature in 2100. This temperature depends on how much we will mitigate climate change for which there are no predictions.

      This is a wide range of climate sensitivities, but not a sign of disagreement in the scientific community as the op-ed suggests. This range is a fair summary of the evidence for most scientists.

    4. found

      That clouds and aerosols are an important reason for the large confidence interval for the climate sensitivity is generally accepted. However, it is an exaggeration to claim that Bjorn Stevens found this. He presented limited evidence that makes a case for future research into this topic. more in general, one should never judge the state of the art based on single papers, especially new papers.

    1. I don’t think the science is clear of what percentage is man-made and what percentage is natural,”

      It would have been nice to get an argument why the best estimate that all warming since 1951 is man-made is wrong.

    2. 2015 is on track to be the hottest year on record. Climate change is not only real, it’s already present.

      I do not like focussing on single years, but 2015 will indeed likely become very hot.

      The second sentence is also true, climate change is real and ongoing.

      The implied link between sentence one and two is okay, without global warming a temperature record this year would be much less likely.

    3. catastrophic

      Catastrophic is a political category. Thus by definition there is no "convincing scientific evidence" for it. But the impacts and adaptation will be costly.