428 Matching Annotations
  1. Last 7 days
    1. Author Response

      We thank the editors and the reviewers for a number of useful criticisms and suggestions, and for the opportunity given to us, as authors, to publicly reply to the comments. This is a useful exercise, which brings to the attention of the reader lights, but also shadows of the reviewing process, and that we hope will lead in future to develop a better approach to it. Here, we will reply to a number of selected issues which appear to us to be of particular relevance.

      Reviewer 1

      Reviewer 1 disqualifies our work altogether, based on her/his statement that: “In the paper by Mercurio et al, the authors examine the role of SOX2 in the development of mouse hippocampal dentate gyrus. Using conditionally mutant SOX2 mice the authors show that early, but not late, deletion of SOX2 leads to developmental impairments of the dentate gyrus. A drawback of their study is that these findings have been reported previously by the group (Favaro et al. 2009; Ferri et al. 2013).

      The statement reported in bold is simply not true. In Favaro et al. 2009 (Nat Neurosci 12:1248), we demonstrated that nes-Cre-mediated Sox2 deletion leads to defects in postnatal, but not embryonic, hippocampal neurogenesis. In Ferri et al. 2013 (Development 140:1250), we demonstrated that FoxG1Cre-mediated Sox2 deletion leads to defective development of the VENTRAL forebrain. The presence, at the end of gestation, of hippocampal defects was just mentioned in one sentence: - “the hippocampus, at E18.5, was severely underdeveloped (not shown)” (line 1, page 1253)-, and not analyzed any further. In the present work, we describe in detail, starting from E12.5, up to E18.5, how the hippocampal defect develops, and undertake a detailed study of downstream gene expression and cellular defects arising in mutants.

      It is unfortunate that the reviewer further insists on the same misleading, and unfounded statement – see her/his comment 3, highlighted in bold character: “the authors state "...remarkably, in the FoxG1-Cre cKO, the DG appears to be almost absent (Figure 2A).". The question is why this finding is remarkable as it already was published in (Ferri et al. 2013)”. As mentioned above, we only remark, in Ferri et al., that the hippocampus was severely underdeveloped (not shown).

      Reviewer 2

      Reviewer 2 states, already at the beginning: “I am concerned about a major confounding issue (see below).” ... “The authors rely on Foxg1-Cre for their main evidence that very early deletion of Sox2 leads to near loss of the dentate. However, it doesn't appear that the authors are aware that Foxg1 het mice have a fairly significant dentate phenotype (see this paper).”

      The reviewer refers to the fact that, to delete Sox2, we need to express a Cre gene “knocked-in” into the Foxg1 gene; hence, heterozygous and homozygous Sox2 deletions will be accompanied by heterozygous loss of Foxg1. If Foxg1 is important for hippocampus development, the absence of a Foxg1 allele will affect the phenotype.

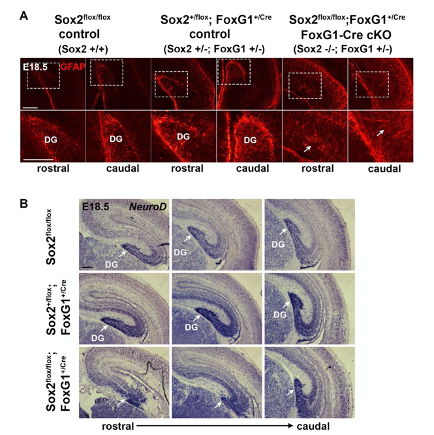
      Unfortunately, the statement of the reviewer is subtly misleading, and leads the reader who has not checked the data reported in the cited paper (Shen et al., 2006) to erroneously believe that heterozygous loss of Foxg1 may be responsible for the effects that we report upon homozygous Sox2 deletion. In contrast to the statement made by the reviewer, the paper cited by the reviewer documents that, while heterozygous loss of Foxg1 leads to important POSTNATAL dentate gyrus abnormalities, the PRENATAL development of the dentate gyrus is essentially normal (Figure 6) (“a subtle and inconsistent defect” of the ventral blade observed in about 50% of the mice at E18.5, according to the authors of that paper). Compare “subtle and inconsistent defect” by Shen et al. with “fairly significant dentate phenotype”, as stated by the reviewer. As our paper is entirely focused on defects seen in PRENATAL development in Foxg1Cre; Sox2 mutants, the subtle and inconsistent defects seen by Shen et al. are in sharp contrast with the deep defects seen in embryonic development in our Foxg1Cre;Sox2-/- mutants, and in agreement with the similarity we observe between wild type and heterozygous Foxg1Cre;Sox2+/- embryos (page 5, lines 140-145, of the version of the Full Submission for publication on August 30). An example showing the comparison between a Wild type, a FoxG1 +/- heterozygote;Sox2+/- heterozygote and a FoxG1 heterozygote;Sox2-/- homozygote is now shown in the accompanying figure.

      Obviously the incorrect statement kills our paper by itself. If the reviewer had doubts, we could have provided plenty of additional data demonstrating the lack of significant differences between Foxg1CRE Sox2+/- and wild type (Sox2+/+) embryos, as we stated in our paper.

      There is an additional interesting comment by Reviewer 2 (see points 2 and 6). The reviewer argues that “The only two direct targets they find don't seem likely to be important players in the phenotypes they describe”. The Reviewer excludes the Gli3 gene (a direct Sox2 target, see Fig. 6), as a possible important player, in spite of the observation that Gli3 is decreased, at early developmental stages, in the cortical hem (Figure 5). The reviewer says “The Gli3 [mutation] phenotypes that have been published are quite distinct from this”. We object that the Gli3 phenotypes are indeed more severe than the phenotype of our mutant, and include failure to develop a dentate gyrus. However, this observation does not preclude the hypothesis that the decreased expression of Gli3 in our mutant is directly responsible for the phenotype we observe. The more severe phenotype of the Gli3 mutants is in fact due to a germ-line null mutation, whereas, in our Foxg1-Cre Sox2 mutants, we observe only a reduction of Gli3 expression, around E12.5 (Fig. 5), that is compatible with a less severe dentate gyrus phenotype. The Reviewer adds that Wnt3A, based on the phenotype of the knock-out mice, similar to that of our Sox2 deleted mice, is a more relevant gene, but it is not a direct target of Sox2. However, the fact that Wnt3A is apparently not directly regulated by Sox2 is not necessarily to be considered a “minus”; Sox2, being a transcription factor, is expected to directly regulate a multiplicity of genes, whose expression will affect the expression of other genes. Indeed, we presented in Fig 6D the hypothesis that decreased expression of Gli3 may contribute to decreased expression of Wnt3A, as already proposed by Grove et al. (1998) based on the observation that Gli3 null mutants lose the expression of Wnt3A (and other Wnt factors) from the cortical hem. The additional suggestion made by the Reviewer, in the context of the Wnt3A hypothesis, to investigate LEF1, as a potential direct Sox2 target, and its expression, is certainly interesting, but, as stated by the reviewer, LEF1 is downstream to Wnt3A, and, by itself, its hypothetical regulation by Sox2 would not explain the downregulation of Wnt3A. Moreover, we already have evidence that Sox2 does not directly regulate Wnt3A (unpublished).

      Reviewer 1 and 2

      Both Reviewer 1 and 2 have questions about the timing of Sox2 ablation in the Sox2 mutants obtained with the three different Cre deleters. As we state in the text (pages 4, 6), Foxg1-Cre deletes at E.9.5 (Ferri et al., 2013; Hébert and McConnell, 2000); Emx1-Cre deletes from E10.5 onwards, but not at E9.5 (Gorski et al., 2002; see also Shetty AS et al., PNAS 2013, E4913); Nestin-Cre deletes at later stages, around E12.5 (Favaro et al. 2009).

      Reviewer 3

      We thank Reviewer 3 for the useful considerations and suggestions, which constructively help to improve the paper.

      Evidence that Sox2+/-;FoxG1+/- hippocampi at E18.5 do not significantly differ from wild type (Sox2+/+, FoxG1+/+) controls. In contrast, Sox2-/-;FoxG1+/- hippocampi are severely defective. (A) GFAP immunofluorescence at E18.5 on coronal sections of control and FoxG1-Cre cKO hippocampi (controls n=6, mutants n=4). (B) In situ hybridization at E18.5 for NeuroD (controls n=4, mutants n=3) on coronal sections of control and FoxG1-Cre cKO hippocampi. Arrows indicate dentate gyrus (DG); note the strong decrease of the dentate gyrus, and the radial glia (GFAP) disorganization in cKO.<br /> The Sox2flox/flox genotype corresponds to wild type mice (Sox2+/+). The Sox2+/flox ; FoxG1Cre genotype corresponds to Sox2+/-; FoxG1+/- controls. The Sox2flox/flox ; FoxG1Cre genotype corresponds to Sox2-/-; FoxG1+/- mutants.

    1. Author Response

      Reviewer #1:

      Hutchings et al. report an updated cryo-electron tomography study of the yeast COP-II coat assembled around model membranes. The improved overall resolution and additional compositional states enabled the authors to identify new domains and interfaces--including what the authors hypothesize is a previously overlooked structural role for the SEC31 C-Terminal Domain (CTD). By perturbing a subset of these new features with mutants, the authors uncover some functional consequences pertaining to the flexibility or stability of COP-II assemblies.

      Overall, the structural and functional work appears reliable, but certain questions and comments should be addressed prior to publication. However, this reviewer failed to appreciate the conceptual advance that warrants publication in a general biology journal like eLIFE. Rather, this study provides a valuable refinement of our understanding of COP-II that I believe is better suited to a more specialized, structure-focused journal.

      We agree that in our original submission our description of the experimental setup, indeed similar to previous work, did not fully capture the novel findings of this paper. Rather than being simply a higher resolution structure of the COPII coat, in fact we have discovered new interactions in the COPII assembly network, and we have probed their functional roles, significantly changing our understanding of the mechanisms of COPII-mediated membrane curvature. In the revised submission we have included additional genetic data that further illuminate this mechanism, and have rewritten the text to better communicate the novel aspects of our work.

      Our combination of structural, functional and genetic analyses goes beyond refining our textbook understanding of the COPII coat as a simple ‘adaptor and cage’, but rather it provides a completely new picture of how dynamic regulation of assembly and disassembly of a complex network leads to membrane remodelling.

      These new insights have important implications for how coat assembly provides structural force to bend a membrane but is still able to adapt to distinct morphologies. These questions are at the forefront of protein secretion, where there is debate about how different types of carriers might be generated that can accommodate cargoes of different size.

      Major Comments: 1) The authors belabor what this reviewer thinks is an unimportant comparison between the yeast reconstruction of the outer coat vertex with prior work on the human outer coat vertex. Considering the modest resolution of both the yeast and human reconstructions, the transformative changes in cryo-EM camera technology since the publication of the human complex, and the differences in sample preparation (inclusion of the membrane, cylindrical versus spherical assemblies, presence of inner coat components), I did not find this comparison informative. The speculations about a changing interface over evolutionary time are unwarranted and would require a detailed comparison of co-evolutionary changes at this interface. The simpler explanation is that this is a flexible vertex, observed at low resolution in both studies, plus the samples are very different.

      We do agree that our proposal that the vertex interface changes over evolutionary time is speculative and we have removed this discussion. We agree that a co-evolutionary analysis will be enlightening here, but is beyond the scope of the current work.

      We respectfully disagree with the reviewer’s interpretation that the difference between the two vertices is due to low resolution. The interfaces are clearly different, and the resolutions of the reconstructions are sufficient to state this. The reviewer’s suggestion that the difference in vertex orientation might be simply attributable to differences in sample, such as inclusion of the membrane, cylindrical versus spherical morphology, or presence of inner coat components were ruled out in our original submission: we resolved yeast vertices on spherical vesicles (in addition to those on tubes) and on membrane-less cages. These analyses clearly showed that neither the presence of a membrane, nor the change in geometry (tubular vs. spherical) affect vertex interactions. These experiments are presented in Supplementary Fig 4 (Supplementary Fig. 3 in the original version). Similarly, we discount that differences might be due to the presence or absence of inner coat components, since membrane-less cages were previously solved in both conditions and are no different in terms of their vertex structure (Stagg et al. Nature 2006 and Cell 2008).

      We believe it is important to report on the differences between the two vertex structures. Nevertheless, we have shifted our emphasis on the functional aspects of vertex formation and moved the comparison between the two vertices to the supplement.

      2) As one of the major take home messages of the paper, the presentation and discussion of the modeling and assignment of the SEC31-CTD could be clarified. First, it isn't clear from the figures or the movies if the connectivity makes sense. Where is the C-terminal end of the alpha-solenoid compared to this new domain? Can the authors plausibly account for the connectivity in terms of primary sequence? Please also include a side-by-side comparison of the SRA1 structure and the CTD homology model, along with some explanation of the quality of the model as measured by Modeller. Finally, even if the new density is the CTD, it isn't clear from the structure how this sub-stoichiometric and apparently flexible interaction enhances stability. Hence, when the authors wrote "when the [CTD] truncated form was the sole copy of Sec31 in yeast, cells were not viable, indicating that the novel interaction we detect is essential for COPII coat function." Maybe, but could this statement be a leap to far? Is it the putative interaction essential, or is the CTD itself essential for reasons that remain to be fully determined?

      The CTD is separated from the C-terminus of the alpha solenoid domain by an extended domain (~350 amino acids) that is predicted to be disordered, and contains the PPP motifs and catalytic fragment that contact the inner coat. This is depicted in cartoon form in Figures 3A and 7, and discussed at length in the text. This arrangement explains why no connectivity is seen, or expected. We could highlight the C-terminus of the alpha-solenoid domain to emphasize where the disordered region should emerge from the rod, but connectivity of the disordered domain to the CTD could arise from multiple positions, including from an adjacent rod.

      The reviewer’s point about the essentiality of the CTD being independent of its interaction with the Sec31 rod, is an important one. The basis for our model that the CTD enhances stability or rigidity of the coat is the yeast phenotype of Sec31-deltaCTD, which resembles that of a sec13 null. Both mutants are lethal, but rescued by deletion of emp24, which leads to more easily deformable membranes (Čopič et al. Science 2012). We agree that even if this model is true, the interaction of the CTD with Sec31 that our new structure reveals is not proven to drive rigidity or essentiality. We have tempered this hypothesis and added alternative possibilities to the discussion.

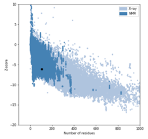
      We have included the SRA1 structure in Supplementary Fig 5, as requested, and the model z-score in the Methods. The Z-score, as calculated by the proSA-web server is -6.07 (see figure below, black dot), and falls in line with experimentally determined structures including that of the template (PDB 2mgx, z-score = -5.38).
      img

      3) Are extra rods discussed in Fig. 4 are a curiosity of unclear functional significance? This reviewer is concerned that these extra rods could be an in vitro stoichiometry problem, rather than a functional property of COP-II.

      This is an important point, that, as we state in the paper, cannot be answered at the moment: the resolution is too low to identify the residues involved in the interaction. Therefore we are hampered in our ability to assess the physiological importance of this interaction. We still believe the ‘extra’ rods are an important observation, as they clearly show that another mode of outer coat interaction, different from what was reported before, is possible.

      The concern that interactions visualised in vitro might not be physiologically relevant is broadly applicable to structural biology approaches. However, our experimental approach uses samples that result from active membrane remodelling under near-physiological conditions, and we therefore expect these to be less prone to artefacts than most in vitro reconstitution approaches, where proteins are used at high concentrations and in high salt buffer conditions.

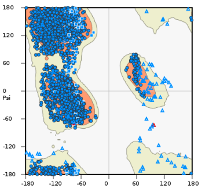
      4) The clashsccore for the PDB is quite high--and I am dubious about the reliability of refining sidechain positions with maps at this resolution. In addition to the Ramchandran stats, I would like to see the Ramachandran plot as well as, for any residue-level claims, the density surrounding the modeled side chain (e.g. S742).

      The clashscore is 13.2, which, according to molprobity, is in the 57th percentile for all structures and in the 97th for structures of similar resolutions. We would argue therefore that the clashscore is rather low. In fact, the model was refined from crystal structures previously obtained by other groups, which had worse clashscore (17), despite being at higher resolution. Our refinement has therefore improved the clashscore. During refinement we have chosen restraint levels appropriate to the resolution of our map (Afonine et al., Acta Cryst D 2018)

      The Ramachandran plot is copied here and could be included in a supplemental figure if required. We make only one residue-level claim (S742), the density for which is indeed not visible at our resolution. We claim that S742 is close to the Sec23-23 interface, and do not propose any specific interactions. Nevertheless we have removed reference to S742 from the manuscript. We included this specific information because of the potential importance of this residue as a site of phosphorylation, thereby putting this interface in broader context for the general eLife reader.
      img

      Minor Comments:

      1) The authors wrote "To assess the relative positioning of the two coat layers, we analysed the localisation of inner coat subunits with respect to each outer coat vertex: for each aligned vertex particle, we superimposed the positions of all inner coat particles at close range, obtaining the average distribution of neighbouring inner coat subunits. From this 'neighbour plot' we did not detect any pattern, indicating random relative positions. This is consistent with a flexible linkage between the two layers that allows adaptation of the two lattices to different curvatures (Supplementary Fig 1E)." I do not understand this claim, since the pattern both looks far from random and the interactions depend on molecular interactions that are not random. Please clarify.

      We apologize for the confusion: the pattern of each of the two coats are not random. Our sentence refers to the positions of inner and outer coats relative to each other. The two lattices have different parameters and the two layers are linked by flexible linkers (the 350 amino acids referred to above). We have now clarified the sentence.

      2) Related to major point #1, the author wrote "We manually picked vertices and performed carefully controlled alignments." I do now know what it means to carefully control alignments, and fear this suggests human model bias.

      We used different starting references for the alignments, with the precise aim to avoid model bias. For both vesicle and cage vertex datasets, we have aligned the subtomograms against either the vertex obtained from tubules, or the vertex from previously published membrane-less cages. In all cases, we retrieved a structure that resembles the one on tubules, suggesting that the vertex arrangement we observe isn’t simply the result of reference bias. This procedure is depicted in Supplementary Fig 4 (Supplementary Fig. 3 in the original manuscript), but we have now clarified it also in the methods section.

      3) Why do some experiments use EDTA? I may be confused, but I was surprised to see the budding reaction employed 1mM GMPPNP, and 2.5mM EDTA (but no Magnesium?). Also, for the budding reaction, please replace or expand upon the "the 10% GUV (v/v)" with a mass or molar lipid-to-protein ratio.

      We regret the confusion. As stated in the methods, all our budding reactions are performed in the presence of EDTA and Magnesium, which is present in the buffer (at 1.2 mM). The reason is to facilitate nucleotide exchange, as reported and validated in Bacia et al., Scientific Reports 2011.

      Lipids in GUV preparations are difficult to quantify. We report the stock concentrations used, but in each preparation the amount of dry lipid that forms GUVs might be different, as is the concentration of GUVs after hydration. However since we analyse reactions where COPII proteins have bound and remodelled individual GUVs, we do not believe the protein/lipid ratio influences our structures.

      4) Please cite the AnchorMap procedure.

      We cite the SerialEM software, and are not aware of other citations specifically for the anchor map procedure.

      5) Please edit for typos (focussing, functionl, others)

      Done

      Reviewer #2:

      The manuscript describes new cryo-EM, biochemistry, and genetic data on the structure and function of the COPII coat. Several new discoveries are reported including the discovery of an extra density near the dimerization region of Sec13/31, and "extra rods" of Sec13/31 that also bind near the dimerization region. Additionally, they showed new interactions between the Sec31 C-terminal unstructured region and Sec23 that appear to bridge multiple Sec23 molecules. Finally, they increased the resolution of the Sec23/24 region of their structure compared to their previous studies and were able to resolve a previously unresolved L-loop in Sec23 that makes contact with Sar1. Most of their structural observations were nicely backed up with biochemical and genetic experiments which give confidence in their structural observations. Overall the paper is well-written and the conclusions justified.

      However, this is the third iteration of structure determination of the COPII coat on membrane with essentially the same preparation and methods. Each time, there has been an incremental increase in resolution and new discoveries, but the impact of the present study is deemed to be modest. The science is good, but it may be more appropriate for a more specialized journal. Areas of specific concern are described below.

      As described above, we respectfully disagree with this interpretation of the advance made by the current work. This work improves on previous work in many aspects. The resolution of the outer coat increases from over 40A to 10-12A, allowing visualisation of features that were not previously resolved, including a novel vertex arrangement, the Sec31 CTD, and the outer coat ‘extra rods’. An improved map of the inner coat also allows us to resolve the Sec23 ‘L-loop’. We would argue that these are not just extra details, but correspond to a suite of novel interactions that expand our understanding of the complex COPII assembly network. Moreover, we include biochemical and genetic experiments that not only back up our structural observations but bring new insights into COPII function. As pointed out in response to reviewer 1, we believe our work contributes a significant conceptual advance, and have modified the manuscript to convey this more effectively.

      1) The abstract is vague and should be re-written with a better description of the work.

      We have modified the abstract to specifically outline what we have done and the major new discoveries of this paper.

      2) Line 166 - "Surprisingly, this mutant was capable of tubulating GUVs". This experiment gets to one of the fundamental unknown questions in COPII vesiculation. It is not clear what components are driving the membrane remodeling and at what stages during vesicle formation. Isn't it possible that the tubulation activity the authors observe in vitro is not being driven at all by Sec13/31 but rather Sec23/24-Sar1? Their Sec31ΔCTD data supports this idea because it lacks a clear ordered outer coat despite making tubules. An interesting experiment would be to see if tubules form in the absence of all of Sec13/31 except the disordered domain of Sec31 that the authors suggest crosslinks adjacent Sec23/24s.

      This is an astute observation, and we agree with the reviewer that the source of membrane deformation is not fully understood. We favour the model that budding is driven significantly by the Sec23-24 array. To further support this, we have performed a new experiment, where we expressed Sec31ΔN in yeast cells lacking Emp24, which have more deformable membranes and are tolerant to the otherwise lethal deletion of Sec13. While Sec31ΔN in a wild type background did not support cell viability, this was rescued in a Δemp24 yeast strain, strongly supporting the hypothesis that a major contributor to membrane remodelling is the inner coat, with the outer coat becoming necessary to overcome membrane bending resistance that ensues from the presence of cargo. We now include these results in Figure 1.

      However, we must also take into account the results presented in Fig. 6, where we show that weakening the Sec23-24 interface still leads to budding, but only if Sec13-31 is fully functional, and that in this case budding leads to connected pseudo-spherical vesicles rather than tubes. When Sec13-31 assembly is also impaired, tubes appear unstructured. We believe this strongly supports our conclusions that both inner and outer coat interactions are fundamental for membrane remodelling, and it is the interplay between the two that determines membrane morphology (i.e. tubes vs. spheres).

      To dissect the roles of inner and outer coats even further, we have done the experiment that the reviewer suggests: we expressed Sec31768-1114, but the protein was not well-behaved and co-purified with chaperones. We believe the disordered domain aggregates when not scaffolded by the structured elements of the rod. Nonetheless, we used this fragment in a budding reaction, and could not see any budding. We did not include this experiment as it was inconclusive: the lack of functionality of the purified Sec31 fragment could be attributed to the inability of the disordered region to bind its inner coat partner in the absence of the scaffolding Sec13-31 rod. As an alternative approach, we have used a version of Sec31 that lacks the CTD, and harbours a His tag at the N-terminus (known from previous studies to partially disrupt vertex assembly). We think this construct is more likely to be near native, since both modifications on their own lead to functional protein. We could detect no tubulation with this construct by negative stain, while both control constructs (Sec31ΔCTD and Nhis-Sec31) gave tubulation. This suggests that the cross-linking function of Sec31 is not sufficient to tubulate GUV membranes, but some degree of functional outer coat organisation (either mediated by N- or C-terminal interactions) is needed. It is also possible that the lack of outer coat organisation might lead to less efficient recruitment to the inner coat and cross-linking activity. We have added this new observation to the manuscript.

      3) Line 191 - "Inspecting cryo-tomograms of these tubules revealed no lozenge pattern for the outer 192 coat" - this phrasing is vague. The reviewer thinks that what they mean is that there is a lack of order for the Sec13/31 layer. Please clarify.

      The reviewer is correct, we have changed the sentence.

      4) Line 198 - "unambiguously confirming this density corresponds to 199 the CTD." This only confirms that it is the CTD if that were the only change and the Sec13/31 lattice still formed. Another possibility is that it is density from other Sec13/31 that only appears when the lattice is formed such as the "extra rods". One possibility is that the density is from the extra rods. The reviewer agrees that their interpretation is indeed the most likely, but it is not unambiguous. The authors should consider cross-linking mass spectrometry.

      We have removed the word ‘unambiguously’, and changed to ‘confirming that this density most likely corresponds to the CTD’. Nonetheless, we believe that our interpretation is correct: the extra rods bind to a different position, and themselves also show the CTD appendage. In this experiment, the lack of the CTD was the only biochemical change.

      5) In the Sec31ΔCTD section, the authors should comment on why ΔCTD is so deleterious to oligomer organization in yeast when cages form so abundantly in preparations of human Sec13/31 ΔC (Paraan et al 2018).

      We have added a comment to address this. “Interestingly, human Sec31 proteins lacking the CTD assemble in cages, indicating that either the vertex is more stable for human proteins and sufficient for assembly, or that the CTD is important in the context of membrane budding but not for cage formation in high salt conditions.”

      6) The data is good for the existence of the "extra rods", but significance and importance of them is not clear. How can these extra densities be distinguished from packing artifacts due to imperfections in the helical symmetry.

      Please also see our response to point 3 from reviewer 1. Regarding the specific concern that artefacts might be a consequence of imperfection in the helical symmetry, we would argue such imperfections are indeed expected in physiological conditions, and to a much higher extent. For this reason interactions seen in the context of helical imperfections are likely to be relevant. In fact, in normal GTP hydrolysis conditions, we expect long tubes would not be able to form, and the outer coat to be present on a wide range of continuously changing membrane curvatures. We think that the ability of the coat to form many interactions when the symmetry is imperfect might be exactly what confers the coat its flexibility and adaptability.

      7) Figure 5 is very hard to interpret and should be redone. Panels B and C are particularly hard to interpret.

      We have made a new figure where we think clarity is improved.

      8) The features present in Sec23/24 structure do not reflect the reported resolution of 4.7 Å. It seems that the resolution is overestimated.

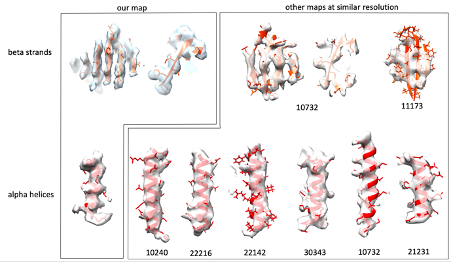
      We report an average resolution of 4.6 Å. In most of our map we can clearly distinguish beta strands, follow the twist of alpha helices and see bulky side chains. These features typically become visible at 4.5-5A resolution. We agree that some areas are worse than 4.6 Å, as typically expected for such a flexible assembly, but we believe that the average resolution value reported is accurate. We obtained the same resolution estimate using different software including relion, phenix and dynamo, so that is really the best value we can provide. To further convince ourselves that we have the resolution we claim, we sampled EM maps from the EMDB with the same stated resolution (we just took the 7 most recent ones which had an associated atomic model), and visualised their features at arbitrary positions. For both beta strands and alpha helices, we do not feel our map looks any worse than the others we have examined. We include a figure here.
      img

      9) Lines 315/316 - "We have combined cryo-tomography with biochemical and genetic assays to obtain a complete picture of the assembled COPII coat at unprecedented resolution (Fig. 7)"

      10) Figure 7. is a schematic model/picture the authors should reference a different figure or rephrase the sentence.

      We now refer to Fig 7 in a more appropriate place.

      Reviewer #3:

      The manuscript by Hutchings et al. describes several previously uncharacterised molecular interactions in the coats of COP-II vesicles by using a reconstituted coats of yeast COPI-II. They have improved the resolution of the inner coat to 4.7A by tomography and subtomogram averaging, revealing detailed interactions, including those made by the so-called L-loop not observed before. Analysis of the outer layer also led to new interesting discoveries. The sec 31 CTD was assigned in the map by comparing the WT and deletion mutant STA-generated density maps. It seems to stabilise the COP-II coats and further evidence from yeast deletion mutants and microsome budding reconstitution experiments suggests that this stabilisation is required in vitro. Furthermore, COP-II rods that cover the membrane tubules in right-handed manner revealed sometimes an extra rod, which is not part of the canonical lattice, bound to them. The binding mode of these extra rods (which I refer to here a Y-shape) is different from the canonical two-fold symmetric vertex (X-shape). When the same binding mode is utilized on both sides of the extra rod (Y-Y) the rod seems to simply insert in the canonical lattice. However, when the Y-binding mode is utilized on one side of the rod and the X-binding mode on the other side, this leads to bridging different lattices together. This potentially contributes to increased flexibility in the outer coat, which maybe be required to adopt different membrane curvatures and shapes with different cargos. These observations build a picture where stabilising elements in both COP-II layers contribute to functional cargo transport. The paper makes significant novel findings that are described well. Technically the paper is excellent and the figures nicely support the text. I have only minor suggestions that I think would improve the text and figure.

      We thank the reviewer for helpful suggestions which we agree improve the manuscript.

      Minor Comments:

      L 108: "We collected .... tomograms". While the meaning is clear to a specialist, this may sound somewhat odd to a generic reader. Perhaps you could say "We acquired cryo-EM data of COP-II induced tubules as tilt series that were subsequently used to reconstruct 3D tomograms of the tubules."

      We have changed this as suggested

      L 114: "we developed an unbiased, localisation-based approach". What is the part that was developed here? It seems that the inner layer particle coordinates where simply shifted to get starting points in the outer layer. Developing an approach sounds more substantial than this. Also, it's unclear what is unbiased about this approach. The whole point is that it's biased to certain regions (which is a good thing as it incorporates prior knowledge on the location of the structures).

      We have modified the sentence to “To target the sparser outer coat lattice for STA, we used the refined coordinates of the inner coat to locate the outer coat tetrameric vertices”, and explain the approach in detail in the methods.

      L 124: "The outer coat vertex was refined to a resolution of approximately ~12 A, revealing unprecedented detail of the molecular interactions between Sec31 molecules (Supplementary Fig 2A)". The map alone does not reveal molecular interactions; the main understanding comes from fitting of X-ray structures to the low-resolution map. Also "unprecedented detail" itself is somewhat problematic as the map of Noble et al (2013) of the Sec31 vertex is also at nominal resolution of 12 A. Furthermore, Supplementary Fig 2A does not reveal this "unprecedented detail", it shows the resolution estimation by FSC. To clarify, these points you could say: "Fitting of the Sec31 atomic model to our reconstruction vertex at 12-A resolution (Supplementary Fig 2A) revealed the molecular interactions between different copies of Sec31 in the membrane-assembled coat.

      We have changed the sentence as suggested.

      L 150: Can the authors exclude the possibility that the difference is due to differences in data processing? E.g. how the maps amplitudes have been adjusted?

      Yes, we can exclude this scenario by measuring distances between vertices in the right and left handed direction. These measurements are only compatible with our vertex arrangement, and cannot be explained by the big deviation from 4-fold symmetry seen in the membrane-less cage vertices.

      L 172: "that wrap tubules either in a left- or right-handed manner". Don't they do always both on each tubule? Now this sentence could be interpreted to mean that some tubules have a left-handed coat and some a right-handed coat.

      We have changed this sentence to clarify. “Outer coat vertices are connected by Sec13-31 rods that wrap tubules both in a left- and right-handed manner.”

      L276: "The difference map" hasn't been introduced earlier but is referred to here as if it has been.

      We now introduce the difference map.

      L299: Can "Secondary structure predictions" denote a protein region "highly prone to protein binding"?

      Yes, this is done through DISOPRED3, a feature include in the PSIPRED server we used for our predictions. The reference is: Jones D.T., Cozzetto D. DISOPRED3: precise disordered region predictions with annotated protein-binding activity Bioinformatics. 2015; 31:857–863. We have now added this reference to the manuscript.

      L316: It's true that the detail in the map of the inner coat is unprecedented and the model presented in Figure 7 is partially based on that. But here "unprecedented resolution" sounds strange as this sentence refers to a schematic model and not a map.

      We have changed this by moving the reference to Fig 7 to a more appropriate place

      L325: "have 'compacted' during evolution" -> remove. It's enough to say it's more compact in humans and less compact in yeast as there could have been different adaptations in different organisms at this interface.

      We have changed as requested. See also our response to reviewer 1, point 1.

      L327: What's exactly meant by "sequence diversity or variability at this density".

      We have now clarified: “Since multiple charge clusters in yeast Sec31 may contribute to this interaction interface (Stancheva et al., 2020), the low resolution could be explained by the fact that the density is an average of different sequences.”

      L606-607: The description of this custom data processing approach is difficult to follow. Why is in-plane flip needed and how is it used here?

      Initially particles are picked ignoring tube directionality (as this cannot be assessed easily from the tomograms due to the pseudo-twofold symmetry of the Sec23/24/Sar1 trimer). So the in plane rotation of inner coat subunit could be near 0 or 180°. For each tube, both angles are sampled (in-plane flip). Most tubes result in the majority of particles being assigned one of the two orientations (which is then assumed as the tube directionality). Particles that do not conform are removed, and rare tubes where directionality cannot be determined are also removed. We have re-written the description to clarify these points: “Initial alignments were conducted on a tube-by-tube basis using the Dynamo in-plane flip setting to search in-plane rotation angles 180° apart. This allowed to assign directionality to each tube, and particles that were not conforming to it were discarded by using the Dynamo dtgrep_direction command in custom MATLAB scripts”

      L627: "Z" here refers to the coordinate system of aligned particles not that of the original tomogram. Perhaps just say "shifted 8 pixels further away from the membrane".

      Changed as requested.

      L642-643: How can the "left-handed" and "right-handed" rods be separated here? These terms refer to the long-range organisation of the rods in the lattice it's not clear how they were separated in the early alignments.

      They are separated by picking only one subset using the dynamo sub-boxing feature. This extracts boxes from the tomogram which are in set positions and orientation relative to the average of previously aligned subtomograms. From the average vertex structure, we sub-box rods at 4 different positions that correspond to the centre of the rods, and the 2-fold symmetric pairs are combined into the same dataset. We have clarified this in the text: “The refined positions of vertices were used to extract two distinct datasets of left and right-handed rods respectively using the dynamo sub-boxing feature.”

      Figure 2B. It's difficult to see the difference between dark and light pink colours.

      We have changed colours to enhance the difference.

      Figure 3C. These panels report the relative frequency of neighbouring vertices at each position; "intensity" does not seem to be the right measure for this. You could say that the colour bar indicates the "relative frequency of neighbouring vertices at each position" and add detail how the values were scaled between 0 and 1. The same applies to SFigure 1E.

      Changed as requested.

      Figure 4. The COP-II rods themselves are relatively straight, and they are not left-handed or right-handed. Here, more accurate would be "architecture of COPII rods organised in a left-handed manner". (In the text the authors may of course define and then use this shorter expression if they so wish.) Panel 4B top panel could have the title "left-handed" and the lower panel should have the title "right-handed" (for consistency and clarity).

      We have now defined left- and right-handed rods in the text, and have changed the figure and panel titles as requested.
    1. Author Response

      We thank the reviewers for their comments, which will improve the quality of our manuscript.

      Our study describes a novel approach to the identification of GTPase binding-partners. We recapitulated and augmented previous protein-protein interaction data for RAB18 and presented data validating some of our findings. In aggregate, our dataset suggested that RAB18 modulates the establishment of membrane contact sites and the transfer of lipid between closely apposed membranes.

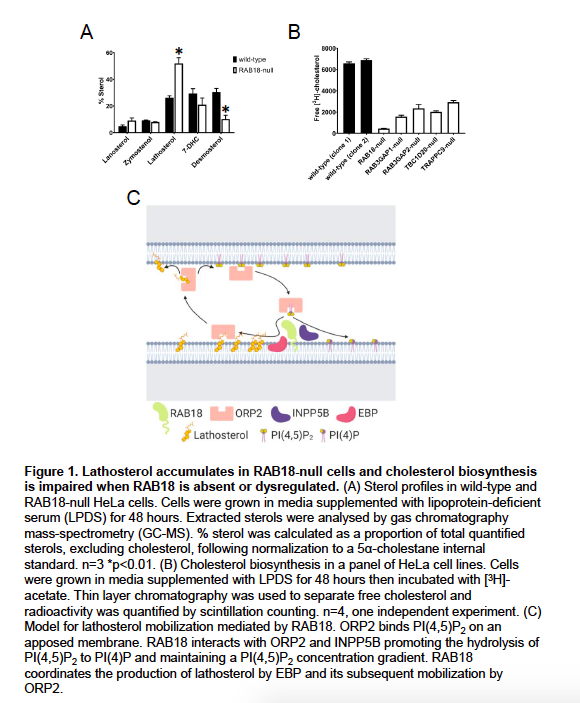
      In the original version of our manuscript, we stated that we were exploring the possibility that RAB18 contributes to cholesterol biosynthesis by mobilizing substrates or products of the Δ8-Δ7 sterol isomerase emopamil binding protein (EBP). While our manuscript was under review, we profiled sterols in wild-type and RAB18-null cells and assayed cholesterol biosynthesis in a panel of cell lines (Figure 1).

      Figure 1

      Our new data show that an EBP-product, lathosterol, accumulates in RAB18-null cells (p<0.01). Levels of a downstream cholesterol intermediate, desmosterol, are reduced in these cells (p<0.01) consistent with impaired delivery of substrates to post-EBP biosynthetic enzymes (Figure 1A). Further, our preliminary data suggests that cholesterol biosynthesis is substantially reduced when RAB18 is absent or dysregulated (4 technical replicates, one independent experiment) (Figure 1B).

      Because of the clinical overlap between Micro syndrome and cholesterol biosynthesis disorders including Smith-Lemli-Opitz syndrome (SLOS; MIM 270400) and lathosterolosis (MIM 607330), our new findings suggest that impaired cholesterol biosynthesis may partly underlie Warburg Micro syndrome pathology. Therapeutic strategies have been developed for the treatment of SLOS and lathosterolosis, and so confirmation of our findings may spur development of similar strategies for Micro syndrome.

      Our new findings provide further functional validation of our methodology and support our interpretation of our protein interaction data.

      Response to Reviewer #1

      Reply to point 1)

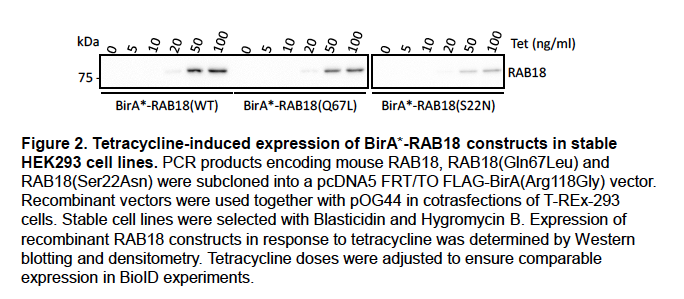
      Tetracycline-induced expression of wild-type and mutant BirA*-RAB18 fusion proteins in the stable HEK293 cell lines was quantified by densitometry (Figure 2).

      Figure 2

      For the HEK293 BioID experiments, tetracycline dosage was adjusted to ensure comparable expression levels. We will include these data in supplemental material in an updated version of our manuscript.

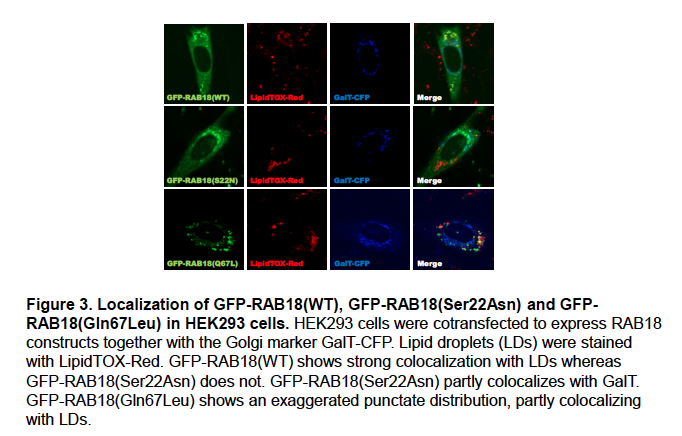
      The localization of wild-type and mutant forms of RAB18 in HEK293 cells is somewhat different consistent with previous reports (Ozeki et al. 2005)(Figure 3).

      Figure 3

      We feel that this may reflect the differential localization of ‘active’ and ‘inactive’ RAB18, with wild-type RAB18 corresponding to a mixture of the two. We will include these data in supplemental material in an updated version of our manuscript.

      We acknowledge that the differential localization of wild-type and mutant BirA*-RAB18 might influence the compliment of proteins labeled by these constructs. Nevertheless, we feel that the RAB18(S22N):RAB18(WT) ratios are useful since they distinguish a number of previously-identified RAB18-interactors (manuscript, Figure 1B).

      Reply to point 2)

      For the HEK293 dataset, spectral counts are provided and for the HeLa dataset LFQ intensities were provided in the manuscript (manuscript, Tables S1 and S2 respectively). However, we did not find that these were useful classifiers for ranking functional interactions when used in isolation.

      The extent of labelling produced in a BioID experiment is not wholly determined by the kinetics of protein-protein associations. It is also influenced by, for example, protein abundance, the number and location of exposed surface lysine residues, and protein stability over the timcourse of labelling. We feel that RAB18(S22N):RAB18(WT) and GEF-null:wild-type ratios were helpful in controlling for these factors. Further, that our comparative approach was effective in highlighting known RAB18-interactors and in identifying novel ones.

      We acknowledge that our approach may omit some bona fide functional RAB18-interactions, but would argue that our aims were to augment existing functional RAB18-interaction data and avoid false-positives, rather than to emphasise completeness.

      Reply to point 3)

      We will include representative fluorescence images for the SEC22A, NBAS and ZW10 knockdown experiments in an updated version of our manuscript.

      Unfortunately, a suitable antibody for determining knockdown efficiency of SEC22A at the protein level is not commercially available. We will determine SEC22A knockdown efficiency at the mRNA level using qPCR.

      Reply to point 4)

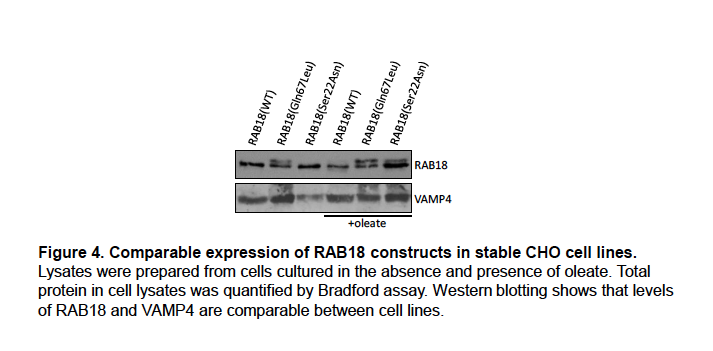
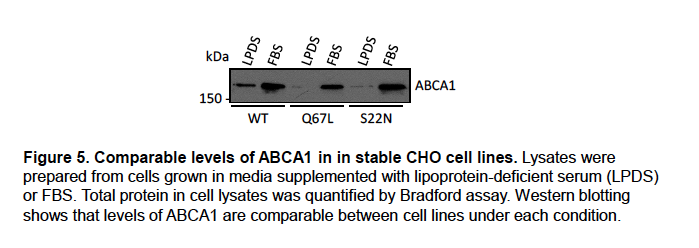
      Expression levels of wild-type and mutant RAB18 in the stable CHO cell lines generated for this study were determined by Western blotting and found to be comparable (Figure 4).

      Figure 4

      We will include these data in supplemental material in an updated version of our manuscript.

      The levels of [14C]-CE were higher in RAB18(Gln67Leu) cells than in the other cell lines following loading with [14C]-oleate for 24 hours. We will amend the text to make this explicit. Our interpretation of the data is that ‘active’ RAB18 facilitates the mobilization of cholesterol. When cells are loaded with oleate, this promotes generation and storage of CE. Conversely, when cells are treated with HDL, it promotes more rapid efflux.

      Our new data implicating RAB18 in the mobilization of lathosterol supports our interpretation of our loading and efflux experiments. In the light of our new data showing that de novo cholesterol biosynthesis is impaired when RAB18 is absent or dysregulated, it will be interesting to determine whether cholesterol synthesis is increased in the RAB18(Gln67Leu) cells.

      Response to Reviewer #2

      Reply to point 1)

      We anticipate that the approach of comparative proximity biotinylation in GEF-null and wild-type cell lines will be broadly useful in small GTPase research.

      While RAB18 has previously been implicated in regulating membrane contacts, the identification of SEC22A as a RAB18-interactor adds to the previous model for their assembly.

      While ORP2 and INPP5B have previously been shown to mediate cholesterol mobilization, the novel finding that they both interact with RAB18 adds to this work. We argue that RAB18-ORP2-INPP5B functions in an analogous manner to ARF1-OSBP-SAC1 in mediating sterol exchange. The broad Rab-binding specificity of multiple OSBP-homologs, and that of multiple phosphoinositide phosphatase enzymes, suggests that this may be a common conserved relationship.

      Our new data indicating that RAB18 coordinates generation of sterol intermediates by EBP and their delivery to post-EBP biosynthetic enzymes reveals a new role for Rab proteins in lipid biogenesis. Most importantly, our new findings that RAB18 deficiency is associated with impaired cholesterol biogenesis suggest that Warburg Micro syndrome is a cholesterol biogenesis disorder. Further, that it may be amenable to therapeutic intervention.

      Reply to point 2)

      Recognising that the effect of RAB18 on cholesterol esterification and efflux could arise from various causes, we previously carried out Western blotting of the CHO cell lines for ABCA1 to determine whether this protein was involved (Figure 5).

      Figure 5

      Similar levels of ABCA1 expression in these lines suggests it is not. We will include these data in supplemental material in an updated version of our manuscript.

      We feel that our new data implicating RAB18 in lathosterol mobilization provides important insight into its role in cholesterol biogenesis. Further, it supports our previous suggestion that RAB18 mediates cholesterol mobilization.

      Reply to point 3)

      We agree that the established roles for ORP2, TMEM24/C2CD2L and PIP2 at the plasma membrane make this an extremely interesting area for future research; it is one we are actively investigating. However, we respectfully feel that to comprehensively explore the subcellular locations of RAB18-mediated sterol/PIP2 exchange requires another study and is beyond the scope of the present report.

      Response to Reviewer #3

      Reply to point 1)

      The RAB18-SPG20 interaction has already been validated with a co-immunoprecipitation experiment (Gillingham et al. 2014). We will update the text of our manuscript to make this more explicit, but do not feel it is necessary to recapitulate this work.

      We argue in the manuscript that RAB18 may coordinate the assembly of a non-canonical SNARE complex incorporating SEC22A, STX18, BNIP1 and USE1. However, this role may be mediated through prior interaction with the NBAS-RINT1-ZW10 (NRZ) tethering complex and the SM-protein SCFD2 rather than through a direct interaction. We therefore feel that a RAB18-SEC22A interaction may be difficult to validate by conventional means.

      The reciprocal experiments with BioID2(Gly40S)-SEC22A did provide tentative confirmation of the interaction together with evidence that a subset of SEC22A-interactions are attenuated when RAB18 is absent or dysregulated. In the light of our new findings reinforcing a role for RAB18 in sterol mobilization at membrane contact sites, it is interesting that one of these is DHRS7, an enzyme with steroids among its putative substrates.

      Reply to point 2)

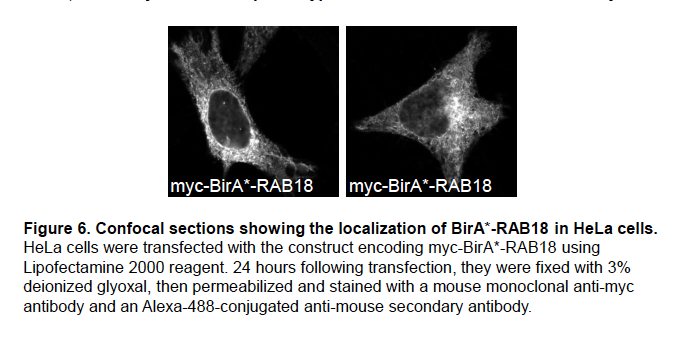
      We previously analysed the localization of the BirA*-RAB18 fusion protein in HeLa cells (Figure 6).

      Figure 6

      It shows a reticular staining pattern consistent with the reported localization of RAB18 to the ER (Gerondopoulos et al. 2014; Ozeki et al. 2005). We will include these data in supplemental material in an updated version of our manuscript.

      Heterologous expression of the BirA*-RAB18 fusion protein in HeLa cells identified the interactions between RAB18 and EBP, ORP2 and INPP5B, for which we now have supportive functional evidence. Since the evidence for impaired lathosterol mobilization and cholesterol biosynthesis was derived from experiments on null-cells, in which endogenous protein expression is absent, we feel that rescue experiments are not necessary in the present study. However, such experiments could be highly useful in future studies.

      Reply to point 3)

      Our screening approach did use both a RAB3GAP-null:wild-type comparison (manuscript, Figure 2, Table S2) and also a RAB18(S22N):RAB18(WT) comparison (manuscript, Figure 1, Table S1). Differences should be expected between these datasets, since they used different cell lines and slightly different methodologies. Nevertheless, proteins identified in both datasets included the known RAB18 effectors NBAS, RINT1, ZW10 and SCFD2, and the novel potential effectors CAMSAP1 and FAM134B.

      There is prior evidence for 12 of the 25 RAB3GAP-dependent RAB18 interactions we identified (manuscript, Figure 2D). Among the 6 lipid modifying/mobilizing proteins found exclusively in our HeLa dataset, we previously presented direct evidence for the interaction of RAB18 with TMCO4. We now also have strong functional evidence for its interaction with EBP, ORP2 and INPP5B.

      Reply to point 4)

      It has been reported that knockdown of SEC22B does not affect the size distribution of lipid droplets (Xu et al. 2018) Figure 8H). Nevertheless, we will carry out qPCR experiments to determine whether the SEC22A siRNAs used in our study affect SEC22B expression. We have found that exogenous expression of SEC22A can cause cellular toxicity. Rescue experiments would therefore be difficult to perform.

      Reply to point 5)

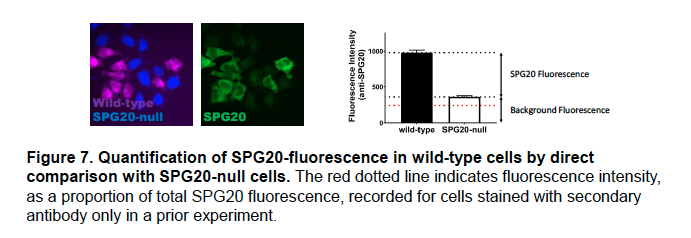
      The background fluorescence measured in SPG20-null cells and presented in Figure 4B in the manuscript does not imply that the SPG20 antibody shows significant cross-reactivity. Rather, it reflects the fact that fluorescence intensity is recorded by our Operetta microscope in arbitrary units.

      Figure 7

      Above (Figure 7), is a version of the panel in which fluorescence from staining cells with only the secondary antibody is included (recorded in a previous experiment and expressed as a proportion of total SPG20 fluorescence in this experiment).

      We have found that comparative fluorescence microscopy is more sensitive than immunoblotting. The SPG20 antibody we used to stain the HeLa cells has previously been used in quantitative fluorescence microscopy (Nicholson et al. 2015).

      Furthermore, we showed corresponding, significantly reduced, expression of SPG20 in RAB18- and TBC1D20-null RPE1 cells, using quantitative proteomics (manuscript, Table S3).

      We acknowledge that quantification of SPG20 transcript levels would clarify the level at which it is downregulated and will carry out qPCR experiments accordingly.

      Reply to point 6)

      We interpret both the enhanced CE-synthesis following oleate-loading and the rapid efflux upon incubation with HDL (manuscript, Figure 7A) as resulting from increased cholesterol mobilization. Our new data implicating RAB18 in the mobilization of lathosterol support this interpretation.

      In the [3H]-cholesterol efflux assay (manuscript, Figure 7B) total [3H]-cholesterol loading at t=0 was 156392±8271 for RAB18(WT) cells, 168425±9103 for RAB18(Gln67Leu) cells and 148867±7609 (cpm determined through scintillation counting). Normalizing to total cellular radioactivity assured that differences in loading between replicates did not skew the results.

      The candidate effector likely to directly mediate cholesterol mobilization is ORP2. It has been shown that ORP2 overexpression drives cholesterol to the plasma membrane (Wang et al. 2019). Further, there is evidence for reduced plasma membrane cholesterol in ORP2-null cells (Wang et al. 2019).

      We previously carried out Western blotting of the CHO cell lines for ABCA1 to determine whether this protein was involved in altered efflux (Figure 5, above). Similar levels of ABCA1 expression in these lines suggests it is not. We will include these data in supplemental material in an updated version of our manuscript.

      References

      Gerondopoulos, A., R. N. Bastos, S. Yoshimura, R. Anderson, S. Carpanini, I. Aligianis, M. T. Handley, and F. A. Barr. 2014. 'Rab18 and a Rab18 GEF complex are required for normal ER structure', J Cell Biol, 205: 707-20.

      Gillingham, A. K., R. Sinka, I. L. Torres, K. S. Lilley, and S. Munro. 2014. 'Toward a comprehensive map of the effectors of rab GTPases', Dev Cell, 31: 358-73.

      Nicholson, J. M., J. C. Macedo, A. J. Mattingly, D. Wangsa, J. Camps, V. Lima, A. M. Gomes, S. Doria, T. Ried, E. Logarinho, and D. Cimini. 2015. 'Chromosome mis-segregation and cytokinesis failure in trisomic human cells', eLife, 4.

      Ozeki, S., J. Cheng, K. Tauchi-Sato, N. Hatano, H. Taniguchi, and T. Fujimoto. 2005. 'Rab18 localizes to lipid droplets and induces their close apposition to the endoplasmic reticulum-derived membrane', J Cell Sci, 118: 2601-11.

      Wang, H., Q. Ma, Y. Qi, J. Dong, X. Du, J. Rae, J. Wang, W. F. Wu, A. J. Brown, R. G. Parton, J. W. Wu, and H. Yang. 2019. 'ORP2 Delivers Cholesterol to the Plasma Membrane in Exchange for Phosphatidylinositol 4, 5-Bisphosphate (PI(4,5)P2)', Mol Cell, 73: 458-73 e7.

      Xu, D., Y. Li, L. Wu, Y. Li, D. Zhao, J. Yu, T. Huang, C. Ferguson, R. G. Parton, H. Yang, and P. Li. 2018. 'Rab18 promotes lipid droplet (LD) growth by tethering the ER to LDs through SNARE and NRZ interactions', J Cell Biol, 217: 975-95.

    1. Author Response

      Reviewer #1:

      This paper addresses the very interesting topic of genome evolution in asexual animals. While the topic and questions are of interest, and I applaud the general goal of a large-scale comparative approach to the questions, there are limitations in the data analyzed. Most importantly, as the authors raise numerous times in the paper, questions about genome evolution following transitions to asexuality inherently require lineage-specific controls, i.e. paired sexual species to compare with the asexual lineages. Yet such data are currently lacking for most of the taxa examined, leaving a major gap in the ability to draw important conclusions here. I also do not think the main positive results, such as the role of hybridization and ploidy on the retention and amount of heterozygosity, are novel or surprising.

      We agree with the reviewer that having the sexual outgroups would improve the interpretations; this is one of the points we make in our manuscript. Importantly however, all previous genome studies of asexual species focus on individual asexual lineages, generally without sexual species for comparison. Yet reported genome features have been interpreted as consequences of asexuality (e.g., Flot et al. 2013). By analysing and comparing these genomes, we can show that these features are in fact lineage-specific rather than general consequences of asexuality. Unexpectedly, we find that asexuals that are not of hybrid origin are largely homozygous, independently of the cellular mechanism underlying asexuality. This contrasts with the general view that cellular mechanisms such as central fusion (which facilitates heterozygosity retention between generation) promotes the evolutionary success of asexual lineages relative to mechanisms such as gamete duplication (which generate complete homozygosity) by delaying the expression of the recessive load. We also do not observe the expected relationship between cellular mechanism of asexuality and heterozygosity retention in species of hybrid origin. Thus we respectfully disagree that our results are not surprising. Reviewer #2 found our results “interesting” and a “potentially important contribution”, and reviewer #3 wrote that we “call into question the generality of the theoretical expectations, and suggest that the genomic impacts of asexuality may be more complicated than previously thought”.

      We also make it very clear that some of the patterns we uncover (e.g. low TE loads in asexual species) cannot be clearly evaluated with asexuals alone. Our study emphasizes the importance of the fact that asexuality is a lineage-level trait and that comparative analyses using asexuals requires lineage-level replication in addition to comparisons to sexual species.

      References

      Flot, Jean-François, et al. "Genomic evidence for ameiotic evolution in the bdelloid rotifer Adineta vaga." Nature 500.7463 (2013): 453-457.

      Reviewer #2:

      [...] Major Issues and Questions:

      1) The authors choose to refer to asexuality when describing thelytokous parthenogenesis. Asexuality is a very general term that can be confusing: fission, vegetative reproduction could also be considered asexuality. I suggest using parthenogenesis throughout the manuscript for the different animal clades studied here. Moreover, in thelytokous parthenogenesis meiosis can still occur to form the gametes, it is therefore not correct to write that "gamete production via meiosis... no longer take place" (lines 57-58). Fertilization by sperm indeed does not seem to take place (except during hybridogenesis, a special form of parthenogenesis).

      We will clarify more explicitly what asexuality refers to in our manuscript. Notably our study does not include species that produce gametes which are fertilized (which is the case under hybridogenesis, which sensu stricto is not a form of parthenogenesis). Even though many forms of parthenogenesis do indeed involve meiosis (something we explain in much detail in box 2), there is no production of gametes.

      2) The cellular mechanisms of asexuality in many asexual lineages are known through only a few, old cytological studies and could be inaccurate or incomplete (for example Triantaphyllou paper of 1981 of Meloidogyne nematodes or Hsu, 1956 for bdelloid rotifers). The authors should therefore mention in the introduction the lack of detailed and accurate cellular and genetic studies to describe the mode of reproduction because it may change the final conclusion.

      For example, for bdelloid rotifers the literature is scarce. However the authors refer in Supp Table 1 to two articles that did not contain any cytological data on oogenesis in bdelloid rotifers to indicate that A. vaga and A. ricciae use apomixis as reproductive mode. Welch and Meselson studied the karyotypes of bdelloid rotifers, including A. vaga, and did not conclude anything about absence or presence of chromosome homology and therefore nothing can be said about their reproduction mode. In the article of Welch and Meselson the nuclear DNA content of bdelloid species is measured but without any link with the reproduction mode. The only paper referring to apomixis in bdelloids is from Hsu (1956) but it is old and new cytological data with modern technology should be obtained.

      We will correct the rotifer citations and thank the reviewer for picking up the error. We agree that there are uncertainties in some cytological studies, but the same is true for genomic studies (which is why we base our analyses as much as possible on raw reads rather than assemblies because the latter may be incorrect). We in fact excluded cytological studies where the findings could not be corroborated. For example, we discarded the evidence for meiosis and diploidy by Handoo at al. 2004 for its incompatibility with genomic data because this study does not provide any verifiable evidence (there are no data or images, only descriptions of observations). We provide all the references in the supplementary material concerning the cytological evidence used.

      3) In the section on Heterozygosity, the authors compute heterozygosity from kmer spectra analysis from reads to "avoid biases from variable genome assembly qualities" (page 16). But such kmer analysis can be biased by the quality and coverage of sequencing reads. While such analyses are a legitimate tool for heterozygosity measurements, this argument (the bias of genome quality) is not convincing and the authors should describe the potential limits of using kmer spectra analyses.

      We excluded all the samples with unsuitable quality of data (e.g. one tardigrade species with excessive contamination or the water flea samples for insufficient coverage), and T. Rhyker Ranallo Benavidez, the author of the method we used, collaborated with us on the heterozygosity analyzes. However, we will clarify the limitations of the method for species with extremely low or high heterozygosity (see also comment 5 of this reviewer).

      4) The authors state that heterozygosity levels “should decay over time for most forms of meiotic asexuality". This is incorrect, as this is not expected with "central fusion" or with "central fusion automixis equivalent" where there is no cytokinesis at meiosis I.

      Our statement is correct. Note that we say “most” and not “all” because certain forms of endoduplication in F1 hybrids result in the maintenance of heterozygosity. Central fusion is expected to fully retain heterozygosity only if recombination is completely suppressed (see for example Suomalainen et al. 1987 or Engelstädter 2017).

      5) I do not fully agree with the authors’ statement that: "In spite of the prediction that the cellular mechanism of asexuality should affect heterozygosity, it appears to have no detectable effect on heterozygosity levels once we control for the effect of hybrid origins (Figure 2)." (page 17)

      The scaling on Figure 2 is emphasizing high values, while low values are not clearly separated. By zooming in on the smaller heterozygosity % values we may observe a bigger difference between the "asexuality mechanisms". I do not see how asexuality mechanism was controlled for, and if you look closely at intra group heterozygosity, variability is sometimes high.

      It is expected that hybrid origin leads to higher heterozygosity levels but saying that asexuality mechanism is not important is surprising: on Figure 2 the orange (central fusion) is always higher than yellow (gamete duplication).

      As we explain in detail in the text, the three comparatively high heterozygosity values under spontaneous origins of asexuality (“orange” points in the bottom left corner of the figure) are found in an only 40-year old clone of the Cape bee. Among species of hybrid origin, we see no correlation between asexuality mechanism and heterozygosity. These observations suggest that the asexuality mechanism may have an impact on genome-wide heterozygosity in recent incipient asexual lineages, but not in established asexual lineages.

      Also, the variability found within rotifers could be an argument against a strong importance of asexuality origin on heterozygosity levels: the four bdelloid species likely share the same origin but their allelic heterozygosity levels appears to range from almost 0 to almost 6% (Fig 2 and 3, however the heterozygosity data on Rotaria should be confirmed, see below).

      We prefer not using the data from rotifers for making such arguments, given the large uncertainty with respect to genome features in this group (including the possibility of octoploidy in some species which we describe in the supplemental information). One could even argue that the highly variable genome structure among rotifer species could indicate repeated transitions to asexuality and/or different hybridization events, but the available genome data would make all these arguments highly speculative.

      The authors’ main idea (i.e. asexuality origin is key) seems mostly true when using homoeolog heterozygosity and/or composite heterozygosity which is not what most readers will usually think as "heterozygosity". This should be made clear by the authors mostly because this kind of heterozygosity does not necessarily undergo the same mechanism as the one described in Box 2 for allelic heterozygosity. If homoeolog heterozygosity is sometimes not distinguishable from allelic heterozygosity, then it would be nice to have another box showing the mechanisms and evolution pattern for such cases (like a true tetraploid, in which all copies exist).

      The heterozygosity between homoeologs is always high in this study while it appears low between alleles, but since the heterozygosity between homeologs can only be measured when there is a hybrid origin, the only heterozygosity that can be compared between ALL the asexual groups is the one between alleles.

      By definition, homoeologs have diverged between species, while alleles have diverged within species. So indeed divergence between homoeologs will generally exceed divergence between alleles. We will consider adding expected patterns in perfect tetraploid species for Box 2.

      Both in the results and the conclusion the authors should not over interpret the results on heterozygosity. The variation in allelic heterozygosity could be small (although not in all asexuals studied) also due to the age of the asexual lineages. This is not mentioned here in the result/discussion section..

      We explain in section Overview of species and genomes studied that age effects are important but that we do not consider them quantitatively because age estimates are not available for the majority of asexual species in our paper.

      6) Regarding the section on Heterozygosity structure in polyploids

      There is inconsistency in many of the numbers. For example, A. vaga heterozygosity is estimated at 1.42% in Figure 1, but then appears to show up around 2% in Figure 2, and then becomes 2.4% on page 20. It is unclear is this is an error or the result of different methods.

      It is also unclear how homologs were distinguished from homeologs. How are 21 bp k-mers considered homologous? In the method section. the authors describe extracting unique k-mer pairs differing by one SNP, so does this mean that no more than one SNP was allowed to define heterozygous homologous regions? Does this mean that homologues (and certainly homoeologs) differing by more than 5% would not be retrieved by this method. If so, then It is not surprising that for A.vaga is classified as a diploid.

      Figure 1 a presents the values reported in the original genome studies, not our results. This is explained in the corresponding figure legend. Hence, 1.42 is the value reported by Flot at al. 2013. 2.4 is the value we measure and it is consistent in Figures 2 and 3.

      We used k-mer pairs differing by one SNP to estimate ploidy (smudgeplot). The heterozygosity estimates were estimated from kmer spectra (GenomeScope 2.0). The kmers that are found in 1n must be heterozygous between homologs, as the homoeolog heterozygosity would produce 2n kmers, We used the kmer approach to estimate heterozygosity in all other cases than homoeologs of rotifers, which were directly derived from the assemblies. We explain this in the legend to Figure 3, but we will add the information also to the Methods section for clarification.

      The result for A. ricciae is surprising and I am still not convinced by the octoploid hypothesis. In Fig S2. there is a first peak at 71x coverage that still could be mostly contaminants. It would be helpful to check the GC distribution of k-mers in the first haploid peak of A. ricciae to check whether there are contaminants. The karyotypes of 12 chromosomes indeed do not fit the octoploid hypothesis. I am also surprised by the 5.5% divergence calculated for A. ricciae, this value should be checked when eliminating potential contaminants (if any). In general, these kind of ambiguities will not be resolved without long-read sequencing technology to improve the genome assemblies of asexual lineages.

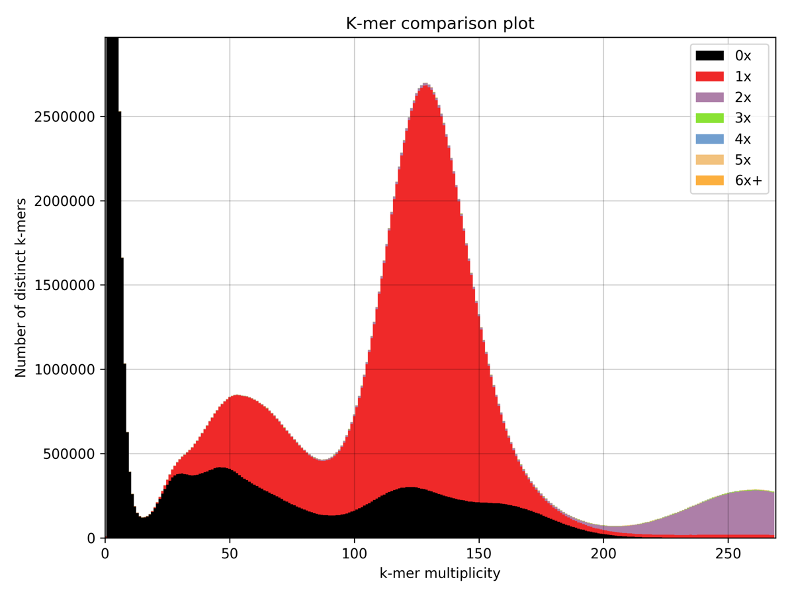
      We understand the scepticism of the reviewer regarding the octoploidy hypothesis, but it is important to note that we clearly present it as a possible explanation for the data that needs to be corroborated, i.e., we state that the data are better consistent with octo- than tetraploidy. Contamination seems quite unlikely, as the 71.1x peak represents nearly exactly half the coverage of the otherwise haploid peak (142x). Furthermore, the Smudgeplot analysis shows that some of the kmers from the 71x peak pair with genomic kmers of the main peaks. We also performed KAT analysis (not presented in the manuscript) showing that these kmers are also represented in the decontaminated assembly. We will add this clarification regarding possible contamination to the supplementary materials.

      7) Regarding the section on palindromes and gene conversion

      The authors screened all the published genomes for palindromes, including small blocks, to provide a more robust unbiased view. However, the result will be unbiased and robust if all the genomes compared were assembled using the same sequencing data (quality, coverage) and assembly program. While palindromes appear not to play a major role in the genome evolution of parthenogenetic animals since only few palindromes were detected among all lineages, mitotic (and meiotic) gene conversion is likely to take place in parthenogens and should indeed be studied among all the clades.

      We agree with the reviewer that gene conversion might be one of the key aspects of asexual genome evolution. Our study merely pointed out that genomes of asexual animals do not show organisation in palindromes, indicating that palindromes might not be of general importance in asexual genome evolution. Note also that we clearly point out that these analyses are biased by the quality of the available genome assemblies.

      8) Regarding the section on transposable elements

      The authors are aware that the approach used may underestimate the TEs present in low copy numbers, therefore the comparison might underestimate the TE numbers in certain asexual groups.

      Yes. We clearly explain this limitation in the manuscript. The currently available alternatives are based on assembled genomes, so the results are biased by the quality of the assemblies (and similarities to TEs in public databases) and our aim was to broadly compare genomes in the absence of assembly-generated biases.

      9) Regarding the section on horizontal gene transfer. For the HGTc analysis, annotated genes were compared to the UniRef90 database to identify non-metazoan genes and HGT candidates were confirmed if they were on a scaffold containing at least one gene of metazoan origin. While this method is indeed interesting, it is also biased by the annotation quality and the length of the scaffolds which vary strongly between studies.

      Yes, this is true and we explain many limitations in the supplemental information, but re-assembling and re-annotating all these genomes would be beyond reasonable computational possibilities.

      10) Regarding the use of GenomeScope2.0

      When homologues are very divergent (as observed in bdelloid rotifers) GenomeScope probably considers these distinct haplotypes as errors, making it difficult to model the haploid genome size and giving a high peak of errors in the GenomeScope profile. Moreover, due to the very divergent copies in A. vaga, GenomeScope indeed provides a diploid genome (instead of tetraploid).

      For A. vaga, the heterozygosity estimated par GenomeScope2.0. on our new sequencing dataset is 2% (as shown in this paper). This % corresponds to the heterozygosity between k-mers but does not provide any information on the heterogeneity in heterozygosity measurements along the genome. A limitation of GenomeScope2.0. (which the authors should mention here) is that it is assuming that the entire genome is following the same theoretical k-mer distribution.

      The model of estimating genome wide heterozygosity indeed assumes a random distribution of heterozygous loci and indeed is unable to estimate divergence over a certain threshold, which is the reason why we used genome assemblies for the estimation of divergence of homoeologs. Regarding estimates in all other genomes, the assumptions are unlikely to fundamentally change the output of the analysis. GenomeScope2 is described in detail in a recent paper (Ranallo-Benavidez et al. 2019), where the assumption that heterozygosity rates are constant across the genome is explicitly mentioned.

      References

      Engelstädter, Jan. "Asexual but not clonal: evolutionary processes in automictic populations." Genetics 206.2 (2017): 993-1009.

      Flot, Jean-François, et al. "Genomic evidence for ameiotic evolution in the bdelloid rotifer Adineta vaga." Nature 500.7463 (2013): 453-457.

      Handoo, Z. A., et al. "Morphological, molecular, and differential-host characterization of Meloidogyne floridensis n. sp.(Nematoda: Meloidogynidae), a root-knot nematode parasitizing peach in Florida." Journal of nematology 36.1 (2004): 20.

      Suomalainen, Esko, Anssi Saura, and Juhani Lokki. Cytology and evolution in parthenogenesis. CRC Press, 1987.

      Ranallo-Benavidez, Timothy Rhyker, Kamil S. Jaron, and Michael C. Schatz. "GenomeScope 2.0 and Smudgeplots: Reference-free profiling of polyploid genomes." BioRxiv (2019): 747568. 

      Reviewer #3:

      Jaron and collaborators provide a large-scale comparative work on the genomic impact of asexuality in animals. By analysing 26 published genomes with a unique bioinformatic pipeline, they conclude that none of the expected features due to the transition to asexuality is replicated across a majority of the species. Their findings call into question the generality of the theoretical expectations, and suggest that the genomic impacts of asexuality may be more complicated than previously thought.

      The major strengths of this work is (i) the comparison among various modes and origins of asexuality across 18 independent transitions; and (ii) the development of a bioinformatic pipeline directly based on raw reads, which limits the biases associated with genome assembly. Moreover, I would like to acknowledge the effort made by the authors to provide on public servers detailed methods which allow the analyses to be reproduced. That being said, I also have a series of concerns, listed below:

      We thank this reviewer for the relevant comments and for providing many constructive suggestions in the points below. We will take them into account for our final version of the manuscript.

      1) Theoretical expectations

      As far as I understand, the aim of this work is to test whether 4 classical predictions associated with the transition to asexuality and 5 additional features observed in individual asexual lineages hold at a large phylogenetic scale. However, I think that these predictions are poorly presented, and so they may be hardly understood by non-expert readers. Some of them are briefly mentioned in a descriptive way in the Introduction (L56 - 61), and with a little more details in the Boxes 1 and 2. However, the evolutive reasons why one should expect these features to occur (and under which assumptions) is not clearly stated anywhere in the Introduction (but only briefly in the Results & Discussion). I think it is important that the authors provide clear-cut quantitative expectations for each genomic feature analysed and under each asexuality origin and mode (Box 1 and 2). Also highlighting the assumptions behind these expectations will help for a better interpretation of the observed patterns.

      We will clarify the expectations for non expert readers.

      2) Mutation accumulation & positive selection

      A subtlety which is not sufficiently emphasized to my mind is that the different modes of asexuality encompass reproduction with or without recombination (Box 2), which can lead to very different genetic outcomes. For example, it has been shown that the Muller's ratchet (the accumulation of deleterious mutations in asexual populations) can be stopped by small amounts of recombination in large-sized populations (Charlesworth et al. 1993; 10.1017/S0016672300031086). Similarly a new recessive beneficial mutation can only segregate at a heterozygous state in a clonal lineage (unless a second mutation hits the same locus); whereas in the presence of recombination, these mutations will rapidly fix in the population by the formation of homozygous mutants (Haldane's Sieve, Haldane 1927; 10.1017/S0305004100015644). Therefore, depending on whether recombination occurs or not during asexual reproduction, the expectations may be quite different; and so they could deviate from the "classical predictions". In this regard, I would like to see the authors adjust their conclusions. Moreover, it is also not very clear whether the species analysed here are 100% asexuals or if they sometimes go through transitory sexual phases, which could reset some of the genomic effects of asexuality.

      Yes, the predictions regarding the efficiency of selection are indeed influenced by cellular modes of asexuality. Adding some details or at least a good reference would certainly increase the readability of the section. We thank the reviewer for this suggestion.

      3) Transposable elements

      I found the predictions regarding the amount of TEs expected under asexuality quite ambiguous. From one side, TEs are expected not to spread because they cannot colonize new genomes (Hickey 1982); but on the other side TEs can be viewed as any deleterious mutation that will accumulate in asexual genome due to the Muller's ratchet. The argument provided by the authors to justify the expectation of low TE load in asexual lineages is that "Only asexual lineages without active TEs, or with efficient TE suppression mechanisms, would be able to persist over evolutionary timescales". But this argument should then equally be applied to any other type of deleterious mutations, and so we won't be able to see Muller's ratchet in the first place. Therefore, not observing the expected pattern for TEs in the genomic data is not so surprising as the expectation itself does not seem to be very robust. I would like the authors to better acknowledge this issue, which actually goes into their general idea that the genomic consequences of asexuality are not so simple.

      Indeed, the survivorship bias should affect all genomic features. Nothing that is incompatible with the viability of the species will ever be observed in nature. Perhaps the difference between Muller’s ratchet and the dynamics of accumulation of transposable elements (TEs) is that TEs are expected to either propagate very fast or not at all (Dolgin and Charlesworth 2006), while the effects of Muller’s ratchet are expected to vary among different populations and cellular mechanisms of asexuality. We will rephrase the text to better reflect the complexity of the predicted consequences of TE dynamics.

      4) Heterozygosity

      Due to the absence of recombination, asexual populations are expected to maintain a high level of diversity at each single locus (heterozygosity), but a low number of different haplotypes. However, as presented by the authors in the Box 2, there are different modes of parthenogenesis with different outcomes regarding heterozygosity: (1) preservation at all loci; (2) reduction or loss at all loci; (3) reduction depending on the chromosomal position relative to the centromere (distal or proximal). Therefore, the authors could benefit from their genome-based dataset to explore in more detail the distribution of heterozygosity along the chromosomes, and further test whether it fits with the above predictions. If the differing quality of the genome assemblies is an issue, the authors could at least provide the variance of the heterozygosity across the genome. The mode #3 (i.e. central fusions and terminal fusions) would be particularly interesting as one would then be able to compare, within the same genome, regions with large excess vs. deficit of heterozygosity and assess their evolutive impacts.

      Moreover, the authors should put more emphasis on the fact that using a single genome per species is a limitation to test the subtle effects of asexuality on heterozygosity (and also on "mutation accumulation & positive selection"). These effects are better detected using population-based methods (i.e. with many individuals, but not necessarily many loci). For example, the FIS value of a given locus is negative when its heterozygosity is higher than expected under random mating, and positive when the reverse is true (Wright 1951; 10.1111/j.1469-1809.1949.tb02451.x).

      We agree with the reviewer that the analysis of the distribution of heterozygosity along the chromosomes would be very interesting. However, the necessary data is available only for the Cape honey bee, and its analysis has been published by Smith et al. 2018. Calculating the probability distribution of heterozygosities would be possible, but it would require SNP calling for each of the datasets. Such an analysis would be computationally intensive and prone to biases by the quality of the genome assemblies.

      5) Absence of sexual lineages

      A second limit of this work is the absence of sexual lineages to use as references in order to control for lineage-specific effects. I do not agree with the authors when they say that "the theoretical predictions pertaining to mutation accumulation, positive selection, gene family expansions, and gene loss are always relative to sexual species [...] and cannot be independently quantified in asexuals." I think that this is true for all the genomic features analysed, because the transition to asexuality is going to affect the genome of asexual lineages relative to their sexual ancestors. This is actually acknowledged at the end of the Conclusion by the authors.

      To give an example, the authors say that "Species with an intraspecific origin of asexuality show low heterozygosity levels (0.03% - 0.83%), while all of the asexual species with a known hybrid origin display high heterozygosity levels (1.73% - 8.5%)". Interpreting these low vs. high heterozygosity values is difficult without having sexual references, because the level of genetic diversity is also heavily influenced by the long term life history strategies of each species (e.g. Romiguier et al. 2014; 10.1038/nature13685).

      I understand that the genome of related sexual species are not available, which precludes direct comparisons with the asexual species. However, I think that the results could be strengthened if the authors provided for each genomic feature that they tested some estimates from related sexual species. Actually, they partially do so along the Result & Discussion section for the palindromes, transposable elements and horizontal gene transfers. I think that these expectations for sexual species (and others) could be added to Table 1 to facilitate the comparisons.

      Our statement "the theoretical predictions pertaining to mutation accumulation, positive selection, gene family expansions, and gene loss are always relative to sexual species [...] and cannot be independently quantified in asexuals." specifically refers to methodology: analyses to address these predictions require orthologs between sexual and asexual species. We fully agree that in addition to methodological constraints, comparisons to sexual species are also conceptually relevant - which is in fact one of the major points of our paper. We will clarify these points.

      6) Regarding statistics, I acknowledge that the number of species analysed is relatively low (n=26), which may preclude getting any significant results if the effects are weak. However, the authors should then clearly state in the text (and not only in the reporting form) that their analyses are descriptive. Also, their position regarding this issue is not entirely clear as they still performed a statistical test for the effect of asexuality mode / origin on TE load (Figure 2 - supplement 1). Therefore, I would like to see the same statistical test performed on heterozygosity (Figure 2).

      We will unify the sections and add an appropriate test everywhere where suited.

      7) As you used 31 individuals from 26 asexual species, I was wondering whether you make profit of the multi-sample species. For example, were the kmer-based analyses congruent between individuals of the same species?

      Unfortunately, some of the 31 individuals do not have publicly available reads (some of the root-knot nematode datasets are missing), others do not have sufficient quality (the coverage for some water flea samples is very low). Our analyses were consistent for the few cases where we have multiple datasets available.

      References

      Dolgin, Elie S., and Brian Charlesworth. "The fate of transposable elements in asexual populations." Genetics 174.2 (2006): 817-827.

      Smith, Nicholas MA, et al. "Strikingly high levels of heterozygosity despite 20 years of inbreeding in a clonal honey bee." Journal of evolutionary biology 32.2 (2019): 144-152.

  2. Mar 2021
    1. Reviewer #4 (Public Review):

      This article describes the results of an impressive meta-analysis based on a high number of published effects investigating the relationship between sexual dimorphism in men and their mating and reproductive success.

      The article is very well written and covers a vast amount of literature.

      Most of my comments are not corrections, but rather subjective ideas on how the text could be restructured. In my opinion, the article is clearly written and the rationale behind research questions and methodology is well explained. I appreciate how the authors present the entire analysis, adding multiple robustness tests and presenting their results in an easy to follow manner (which was not easy, due to the complexity of the methodology implemented).

      I cannot criticise any major issues in this manuscript.

      The main outcomes of the article not only present a robust test of previously mixed results, but also provide a strong recommendation of how future studies should be conducted (i.e. how to use mating success proxies, and what samples to include).

    2. Reviewer #3 (Public Review):

      As the authors lay out, there are a number of theoretical perspectives that expect that male features that are sexually dimorphic and, hence, vary in their levels of "masculinity" (or perhaps less sex-anchored, vary along a male-female dimension) within human males, to have been under sexual selection historically (if not now), which may in part explain their sexual dimorphism. The target article examines associations between a number of such traits that have been examined-bodily strength and muscularity, facial masculinity, vocal pitch, 2nd to 4th digit ratio (2D:4D), height, and testosterone levels-with measures of mating "success" (e.g., sexual partner number) and reproductive outcomes (e.g., reproductive success). With traits keyed such that more positive values reflect greater "maleness," virtually all associations with putative fitness components were found to be positive, though not all associations had confidence intervals that do not cross the zero-point (i.e., not all are "significant").

      The strongest associations were with body masculinity. Specific measures included strength, body shape, and muscle or non-fat body mass (though the associations are not broken down by indicator type). In the mating domain, the overall correlation was .13 (.14 in the behavior domain, perhaps most related to mating "success"). In the reproductive domain, the mean correlation was .14, and .16 in high fertility samples (a subset of which may represent natural fertility populations). Especially when strength (e.g., grip strength) was used as the measure of body masculinity, these associations are likely underestimated, due to imperfect validity of the masculinity/muscularity indicator.

      Associations with voice pitch were, on average, nearly identical to those involving body masculinity: .13 overall in the mating domain and .14 overall in the reproductive domain. But due to smaller sample size, the confidence interval around the correlation in the reproductive domain included zero.

      The next grouping of traits, in terms of strength of association, contains facial masculinity and testosterone levels. There, associations were .09 and .08 in the mating domain and .09 and .04 in the reproductive domain, respectively. Once again, not all confidence intervals were exclusively above zero.

      Associations with both 2D:4D and height were weaker: .03 and .06 in the mating domain and .07 and .01 in the reproductive domain, respectively.

      I offer a few observations.

      First, the meta-analysis, to my mind, offers some interesting data. We need to be aware of its limitations. Many samples are drawn from WEIRD populations (Henrich et al., 2010). It remains unclear to what extent fertility and reproductive success in these samples, even when drawn from high fertility populations, reflect processes that would have operated in ancestral human groups. It makes sense that some of these features may well have been variably associated with fitness components in ancestral populations, but potential key moderator variables (e.g., pathogen prevalence, level of paternal provisioning, level of intergroup violence, degree of female choice [vs. arranged marriages]) may not be available to examination here. To the extent moderation exists, mean levels in this meta-analysis are less meaningful (though not meaningless), as we do not know whether the distribution of moderators in this sample of samples is representative of populations of interest. (E.g., due to advances in modern medicine, these samples may be much healthier than ancestral populations in which these features were subject to selection.) And that is just a partial list of caveats we need to keep in mind. Nonetheless, with those limitations kept in mind, these findings are interesting to reflect upon.

      Second, the associations of course do not tell us what processes drive them. They are correlations. Indeed, we do not know whether the traits themselves were directly implicated in the processes leading to their associations with fitness outcomes. (2D:4D surely wasn't-it's a marker of other causal variables-but its associations are among the weakest seen here.) It makes some sense that the stronger the associations, the more likely the trait in question was directly causally implicated in these processes. And again, that may be particularly true of body masculinity, as associations with it may be underestimated due to fallible indicator validity. But even then, we cannot rule out other mediating traits. Perhaps more muscular men exhibit greater confidence and gain leadership roles more readily than less muscular men, giving them an edge in intrasexual competition or intersexual choice due to associated behavior or status. Or maybe they ultimately gain greater control of resources, giving them advantages in competition for mates or provisioning of offspring. This is not to deny that muscularity may well have been (and be) under sexual selection; but it may have been selected along with other traits rather than the direct target of selection itself.

      Third, then, we do not know what intrasexual or intersexual selection processes may have been involved historically, even if these traits have directly been under sexual selection. To what extent are these associations due to advantages in intrasexual competition? To what extent might they be due to female preferences and choice? Naturally, as the authors note, these processes are not mutually exclusive. After all, in lekking species, males compete with one another for a symbolic spatial position, which, because it represents the outcome of the competition, leads to mating success via female choice. Still, we might be interested in knowing what processes led to the associations found, and how they speak to sexual selection and mating processes in humans.

      Once again, however, the associations reported are interesting to reflect upon. And they could, either directly or indirectly (by stimulating additional research), lead to better answers to issues raised above. One key outcome that relatively little data currently speak to, for instance, is mortality rate of offspring. As the authors note, men who are more successful with respect to mating effort may invest lower amounts of parental investment in offspring. In theory, then, their greater offspring number could be offset to an extent by lower survival rates. In the relatively few data the authors aggregated from the literature, that was not clearly the case. But more data may be needed, especially with respect to the strongest predictors of mating success, and especially in more traditional societies.

      Paternal investment in offspring, however, need not pay off just in terms of offspring survival rates; paternal provisioning may permit greater rates of reproduction via shortening of interbirth intervals in traditional societies. The data here show that, at least with respect to body masculinity, more masculine men have greater mating success and greater reproductive success. Yet the data do not necessarily tell us that the female partners of these men have greater reproductive success. More masculine men's rates of offspring production could be spread over more female mates than that of less masculine men. Knowing whether female partners of more masculine men benefit reproductively by mating with masculine men is pertinent to addressing whether the reproductive success of masculine men has been mediated, in part, by female mate choice.

    3. Reviewer #2 (Public Review):

      In this manuscript, the authors set out to provide a comprehensive meta-analysis of associations between masculinized phenotypes and fitness-relevant outcomes (mating, reproduction, and offspring viability), so as to assess the current state of evidence for hypotheses of sexual selection on human males across high- and low-fertility populations. I enjoyed reading this manuscript, which is well organized and very clearly written. I also appreciated the depth of the analyses reported by the authors. Overall, I am pleased with this research and think it will make a valuable contribution to the literature on human sexual selection and masculinity more generally.

      I do not have any major concerns regarding the methods and results. However, I think the paper would greatly benefit from introducing greater nuance into the theoretical framework and conclusions, which I believe will meaningfully change some of the takeaways presented in the discussion. I have provided references throughout to aid the authors in this effort during revision, though they should certainly not feel compelled to cite each reference provided. I would also appreciate that the authors provide some estimates of (a priori) statistical power when they make claims regarding statistical power in the interpretation of results.

      Major comments:

      The authors have done a very nice job of efficiently introducing the reader to mainstream hypotheses regarding sexual selection on human male phenotypes, particularly those emphasized within evolutionary psychology. I recognize that the authors' primary contribution is empirical and that they have in large part followed the typical presentation of these hypotheses in previous literature. However, given that this paper may be an important point of reference for future research in this area, I would like to encourage the authors to address some important nuances in greater detail that are frequently overlooked.

      (i) The authors argue that "Sexual selection is commonly argued to have acted more strongly on male traits as a consequence of greater variance in males' reproductive output (3) and male-biased operational sex ratio, i.e. a surplus of reproductively available males relative to fertile females (e.g. 4)". This argument then leads to a discussion of why formidability as indexed by strength and other potential indicators of physical dominance are expected to be under selection in males. However, recent work in sexual selection theory has begun to emphasize the importance of the co-evolution of male offspring care and reproductive competition, leading in many cases to opposite predictions compared to classical models of OSR. In particular, more recent models predict that males should often increase rather than decrease offspring care relative to mating effort when men are in relative abundance. These predictions have received support in recent empirical studies in human populations, and help to explain otherwise puzzling patterns such as e.g. the association between male-biased sex ratios and monogamy + low reproductive skew across many taxa. Please see

      Kokko, H., & Jennions, M. D. (2008). Parental investment, sexual selection and sex ratios. Journal of evolutionary biology, 21(4), 919-948. Schacht, R., Rauch, K. L., & Mulder, M. B. (2014). Too many men: the violence problem?. Trends in Ecology & Evolution, 29(4), 214-222. Schacht, R., & Borgerhoff Mulder, M. (2015). Sex ratio effects on reproductive strategies in humans. Royal Society open science, 2(1), 140402.

      Considering these models, one might expect that a variety of behavioral and psychological phenotypes would be under male-specific sexual selection that are simply not considered in the present study. One might also expect that appropriate proxies of male fitness will also vary across populations, independently of the presence/absence of contraception. The authors argue that they selected mating-based proxies of reproductive behaviors and attitudes under the assumption that "preferences for casual sex, number of sexual partners, and age at first sexual intercourse (earlier sexual activity allows for a greater lifetime number of sexual partners)... correlated with reproductive success in men under ancestral conditions". Yet, in large-scale industrialized societies that have undergone a demographic transition, high status males are often observed to invest more in offspring care and the production of intergenerationally transferable wealth at the expense of greater fertility, which may be an adaptive response to shifting demands in relation to competition for status.

      Shenk, M. K., Kaplan, H. S., & Hooper, P. L. (2016). Status competition, inequality, and fertility: implications for the demographic transition. Philosophical Transactions of the Royal Society B: Biological Sciences, 371(1692), 20150150.

      In general, long-run fitness may often not map so simply onto promiscuous sexual behavior in such a straightforward way. Measures such as age at first intercourse may also be confounded with environmental heterogeneity among participants, which could instead indicate environmentally induced plasticity within individuals' lifetimes toward a faster pace of life.

      (ii) Related to this point, the authors discussion of the relationship between testosterone and male phenotypes is somewhat over-simplified, although again in keeping with much of the previous literature in evolutionary psychology. While it was long emphasized that testosterone is a mechanism of aggression per se, recent work has shown that testosterone is better understood as a mechanism for increasing status-seeking, competitive behavior, which can greatly vary in form across socioecological contexts.

      Eisenegger, C., Haushofer, J., & Fehr, E. (2011). The role of testosterone in social interaction. Trends in cognitive sciences, 15(6), 263-271.

      Unfortunately, most of the fWHR and 2D:4D literature has ignored these findings and continues to focus solely on aggression even in WEIRD student samples, where we can be certain that aggression is generally not a viable strategy for attaining and maintaining social status. To my knowledge, only a few studies have explicitly tested this more nuanced hypothesis regarding associations between masculinized phenotypes and differing forms of status-seeking behavior, both of which have found support for ecologically contingent effects in regards to fWHR. Martin et al. (2019) predicted and found support in bonobos for higher fWHR predicting higher scores on an affiliative measure of social rank among both males and females, consistent with the importance of relationship strength and social network centrality for competitive advantage among bonobos. Similarly, Hahn et al. (2017) found that fWHR in human males consistently predicts prosocial behavior and leadership in large-scale institutions. This is consistent with the fact that leadership traits, rather than aggression and formidability per se, are often important predictors of status in human societies (and in contexts of relatively higher SES within those societies).

      Hahn, T., Winter, N. R., Anderl, C., Notebaert, K., Wuttke, A. M., Clément, C. C., & Windmann, S. (2017). Facial width-to-height ratio differs by social rank across organizations, countries, and value systems. PLoS One, 12(11), e0187957. Martin, J. S., Staes, N., Weiss, A., Stevens, J. M. G., & Jaeggi, A. V. (2019). Facial width-to-height ratio is associated with agonistic and affiliative dominance in bonobos (Pan paniscus). Biology Letters, 15(8), 20190232.

      In regard to the male-male competition hypothesis, as noted in the previous comment, we might therefore expect sexual selection to occur on a variety of male traits other than formidability related measures, as well as to be highly population-specific-rather than there being some universal optimum for "masculine" traits-given that what constitutes an adaptive male phenotype likely varies across populations in regard to both male-male competition and female choice. Finally, it should be noted that testosterone is by no means the only sex hormone relevant to considering patterns of human sexual dimorphism. Please see Dunsworth (2020) for a discussion of the centrality of estrogen in proximally explaining sexual dimorphism in body size

      Dunsworth, H. M. (2020). Expanding the evolutionary explanations for sex differences in the human skeleton. Evolutionary Anthropology, 29, 108-116.

      (iii) The authors should provide more references to (and brief discussion of) mixed results regarding the degree of sexual dimorphism in facial and digit ratio metrics. While they cite a few studies in the introduction, one might leave the text with the impression that there is clear enough evidence for 2D:4D being influenced by (pre-natal) sex hormones and being a sexually dimorphic phenotype. However, these results have been strongly challenged, not only be ref 14 and 20 in the main text, but also various other studies e.g.

      Barrett, E., Thurston, S. W., Harrington, D., Bush, N. R., Sathyanarayana, S., Nguyen, R., ... & Swan, S. (2020). Digit ratio, a proposed marker of the prenatal hormone environment, is not associated with prenatal sex steroids, anogenital distance, or gender-typed play behavior in preschool age children. Journal of Developmental Origins of Health and Disease, 1-10. Richards, G. (2017). What is the evidence for a link between digit ratio (2D: 4D) and direct measures of prenatal sex hormones?. Early Human Development. Richards, G., Browne, W. V., Aydin, E., Constantinescu, M., Nave, G., Kim, M. S., & Watson, S. J. (2020). Digit ratio (2D: 4D) and congenital adrenal hyperplasia (CAH): Systematic literature review and meta-analysis. Hormones and Behavior, 126, 104867. Richards, G., Browne, W. V., & Constantinescu, M. (2021). Digit ratio (2D: 4D) and amniotic testosterone and estradiol: An attempted replication of Lutchmaya et al.(2004). Journal of Developmental Origins of Health and Disease.

      Similarly, not all metrics of facial masculinity are equally valid given current empirical evidence. In a recent longitudinal study, only cheekbone prominence was found to show consistent evidence of sexual dimorphism across age groups.

      Robertson, J. M., Kingsley, B. E., & Ford, G. C. (2017). Sexually dimorphic faciometrics in humans from early adulthood to late middle age: Dynamic, declining, and differentiated. Evolutionary Psychology, 15(3), 1474704917730640.

      Overall, I found the authors' discussion of how they selected the specific facial metrics lumped together in their analyses to be underspecified. Please note in the discussion as well that BMI is a well-known confound in studies of facial masculinity and may be a cause of null results in the present study (unless I happened to miss this in the regard to the moderation results - if so, my apologies!).

      Geniole, S. N., Denson, T. F., Dixson, B. J., Carré, J. M., & McCormick, C. M. (2015). Evidence from meta-analyses of the facial width-to-height ratio as an evolved cue of threat. PloS one, 10(7), e0132726.

      (iv) Finally, please provide reference to and potentially brief discussion of the current state of the literature as regards "good genes" hypotheses of female choice, which is relevant for determining how useful previous studies are for directly addressing this hypothesis. Please see:

      Achorn, A. M., & Rosenthal, G. G. (2020). It's not about him: Mismeasuring 'good genes' in sexual selection. Trends in Ecology & Evolution, 35, 206-219.

    4. Reviewer #1 (Public Review):

      This manuscript is a meta-analysis of literature, predominantly that from evolutionary psychology. The background seems well-explained, and the discussion and literature review well-written. The authors have done an impressive job of collating and synthesising a truly vast amount of literature that (as they demonstrate) is often pretty ambiguous in its results. The results are well-presented and well-reasoned, without overstating the evidence. The entire manuscript is clear and easy to read and follow. Table 1 makes it particularly easy to follow. I appreciate their emphasis that the various hypotheses about sexual dimorphism are not mutually exclusive, and that this study does not seek to explicitly test either one of them.

      There is enough evolutionary anthropology inserted here to see that the authors have a passing familiarity with it, although I would encourage them to dig much more deeply into this literature in framing their work. In short, there is a tension between evolutionary psychology and evolutionary anthropology that can be very fruitfully explored with the results of this analysis, and the authors only scratch the surface of this at the end of the manuscript.

      Something that seems crucial here, and in this literature more generally, is the likelihood that men have a number of different effective strategies. The background and discussion do a good job of discussing the various possibilities, and how combinations of possibilities that include both female choice or male-male competition could explain human mating behavior. However, it does not really dig into what the implications might be for how multiple, distinct strategies could impact different aspects of the data. What comes to mind is orangutans, in which the large, masculine males appear to obtain mating opportunities primarily through female choice, while the smaller males that have not developed the large body sizes and facial flanges may obtain additional mating opportunities through sexual coercion. In a large sample or meta-analysis like this, a combination of strategies in human males that are at odds with one another, yet both highly effective, may have results that tend to cancel one another out - is there any evidence of this? Getting more into the primate literature here could be useful.

      The authors point out that there could be a strong confounding effect with the way testosterone operates developmentally. Testosterone during adolescence translates well to the development of masculine characteristics, but does not necessarily predict testosterone later in life (hence, the expression of masculine features may not actually relate well to circulating testosterone that could be at least partially drive male-male competition). The authors did an excellent job of discussing these potential confounding effects, but I would have found potential issues like this (and like the one above) to be presented usefully in a table that lays out the different potential confounding issues, and then discusses what the predictions should be in the meta-analysis results for each one.

      The meta-analysis seems well-designed, and the methods appropriate. However, it did feel a bit like data mining with so many different variables run against one another. I do not think this is actually the case, and the authors do justify each of their decisions. In fact, one of the main outcomes of this work is that they show how few of these parameters actually relate strongly to one another. However, the authors might want to be aware that this study could be read as data-mining because of the search for significance amongst so many different variables, and offset this with explicit discussion and framing up front that they intend to examine how effective the various study parameters actually are at uncovering the relationships they seek to uncover. This is something the authors discuss very articulately at the end, but I would appreciate seeing this up front as one of the goals of the paper.

    5. Evaluation Summary:

      This work evaluates the strength of the evidence that human sexual dimorphism is the product of sexual selection. As a meta-analysis of studies that connect various measures of masculinity to various measures of reproductive success, this paper represents a synthesis of what this vast literature can show thus far. The work will be of general interest to evolutionary social scientists from a variety of disciplines, and it does a good job of clearly and concisely presenting the current state of sexual selection research on human males. The data are well presented, but the interpretation of the results is currently limited by some gaps in the theoretical framework guiding the manuscript.

      (This preprint has been reviewed by eLife. We include the public reviews from the reviewers here; the authors also receive private feedback with suggested changes to the manuscript. Reviewers #1-4 agreed to share their names with the authors.)

    1. Reviewer #3 (Public Review):

      In this study, the authors use a combination of fluorescent and electron microscopy to visualize the trafficking of HIV-1 viral particles during infection. The goal was to determine the components of nuclear HIV-1 virions during infection, and specifically to determine the degree to which reverse transcribed DNA in the nucleus associates with capsid protein and other fluorescent markers of infectious virions, such as fluorescently labeled integrase, which is increasingly used by many labs to track HIV-1 particles in the nucleus. The strengths of the manuscript lie in the imaging approaches used to quantitatively measure colocalization between viral DNA, CA and IN during infection, which are rigorous and well executed. Tomograms of high pressure frozen/plastic substituted samples showing apparently intact capsid cores at and within the nucleus are the most significant outcomes of the study and represent a significant technical achievement. These images provide some of the most compelling evidence to date that cores an enter the nucleus intact, despite previous studies suggesting that capsid disassembly occurs in the cytoplasm or at the nuclear pore.

      The weaknesses of the manuscript lie in the use of HeLa based target cells in all but one of the figures. Although the results in primary cells are generally consistent with the results observed in HeLa cells, differences between HeLa and primary cells have been noted in other studies, and the manuscript would have been significantly improved with more extensive use of primary cells throughout. Additionally, the numerous other recent recent studies that have demonstrated that reverse transcription and uncoating complete in the nucleus, including works from the Pathak, Diaz-Griffero, Di Nunzio, Dash and Campbell labs, among others, reduce the potential impact of these studies. The Di Nunzio lab, in particular, has recently published a nearly identical system for labeling the reverse transcribed HIV-1 genome during infection. However, differences in approach prevented that study from being able to conclude that intact capsids exist in the nucleus (or made such conclusions open to alternative interpretations). In contrast, the CLEM-ET studies in this manuscript unambiguously show intact cores in the nucleus, and this is an advance for the field, in addition to being a substantial technical achievement. Nevertheless, the prior studies in this area, published last year, do impact the novelty of the observations made in this manuscript.

      In the aggregate, this manuscript adds to a growing body of work suggesting that models of HIV-1 infection that have dominated the field for years should be reconsidered. As recently as 2 years ago, the idea that even a small amount of CA protein remained associated with the viral replication complex in the nucleus was somewhat heretical. While old models die hard, and some in the field are likely to debate how "intact" the capsid cores observed in this manuscript actually are, the idea that intact or nearly intact cores can enter the nucleus is increasingly difficult to deny in light of data provided here. This raises questions regarding how the HIV-1 core, which exceeds the generally accepted size limitation of nuclear pore complexes by 50%, based on the width of a capsid core, can enter the nuclear environment in an intact or nearly intact state (an issue that is addressed in the recent (and cited) Zila et al. bioRxiv paper, but not here).

    2. Reviewer #2 (Public Review):

      Despite the fact that reverse transcription was discovered 50 years ago, there are still some black boxes regarding RT spatiotemporal activity. Recent studies elsewhere and here indicate that RT can occur in the nucleus, revising the "dogma" that RT occurs exclusively in the cytoplasm of infected cells. However, it is still debated whether this concept can be extended to all HIV target cells and which RT processes can start and finish in the nucleus. The authors also performed several experiments designed to show that uncoating (loss of capsid) occurs in the nucleus. The authors deserve credit for developing and applying complicated imaging technologies. However, live imaging data comes from pseudo-viruses, which have low infectivity, so high amounts of virus have been used to obtain some of the results. This is a limitation, and I have some reservations about the conclusions and the generalization of the results, and also about the lack of statistics for the CLEM-ET studies, probably owing to the complexity of the technique (detailed below). In addition, despite using state-of-the-art CLEM-ET, it is possible to visualize only structures with strong fluorescence and recognizable structures. I therefore wonder how can the authors can conclude that only the forms that still have a conical or partial conical shape are the most important to follow? It is possible that more flexible CA structures can access the nucleus and that the authors neglect them owing to limitations of the technology. Immuno-gold CA labeling could solve this issue, and the authors have the technologies required to perform these experiments.

    3. Reviewer #1 (Public Review):

      The authors of this paper seek to understand how HIV infects cells. HIV is a retrovirus that harbors a core of RNA nucleic acid in complex with important replication enzymes such as reverse transcriptase. After infection, reverse transcriptase converts the RNA into DNA, which is then integrated into the chromosome. The authors used advanced imaging techniques to visualize the DNA that is made by reverse transcription. They used fluorescent readout markers of proteins to also look at the viral proteins that are brought into the cell and track with the viral DNA during the virus infection.

      From this work the authors conclude that reverse transcription is completed in the cell nucleus, that intact or nearly intact cores are the substrate for nuclear import, and that virus core uncoating likely occurs in the nucleus, immediately preceding the integration step. Moreover, by using electron tomography, they drill down to the sub-micron level to glean an ultrastructural view of the viral complexes that are performing these important HIV infection steps. Some of these complexes appear to be novel, and thus the work will be of interest to other scientists in this field.

      Weaknesses of the study include insufficient control samples for some of the experiments and also clarifying some of the approaches used and some of their interpretations of the data (detailed below). The authors of this paper could have also done a better job of citing papers published by other scientists who came up with very similar conclusions and/or used very similar techniques.

    4. Evaluation Summary:

      The authors use a variety of complementary approaches to visualize and characterize events in the first half of the HIV life cycle, with some overlap between the latter studies and the recent (and cited) Zila et al. bioRxiv paper from some of the same authors. The data are generally of high quality, and many findings are in line with recent field advances indicating that reverse transcription completes in the nucleus, that intact/nearly intact cores are imported into the nucleus, and that nuclear uncoating likely occurs immediately prior to integration. The results provide the best evidence to date that intact capsids can enter the nucleus of target cells during infection, and will generally be of interest to the field, although the impact is diminished somewhat by similar recent publications from a number of other groups (including one case that used nearly identical labeling methods to follow viral complexes during infection). Issues that should be addressed include missing controls in some cases, some examples of over-interpretation and uneven citation, and the need for additional images to help bolster some of the claims. Strengths of the study include the rigorous characterization of infection using sophisticated imaging methods and, most importantly, the use of CLEM-ET to visualize viral capsids in the nucleus.

      (This preprint has been reviewed by eLife. We include the public reviews from the reviewers here; the authors also receive private feedback with suggested changes to the manuscript. Reviewer #3 agreed to share their name with the authors.)

    1. Author Response to Public Reviews

      Public comment #1: “The mRNA data are interpreted as evidence for changes in protein expression and Ras signalling activity - there is no formal evidence that this is the case.

      Response: As requested, while increase mRNA is a strong indication of elevated expression, we completely agree with this comment and added the caveat that protein analysis was not performed.

      Public comment #2: “It is also intriguing how there wasn't a more complete switch to Q61 in the high KRAS tumours when p53 was deleted.”

      Response: As requested, we now bring up this point in the discussion.

      Public comment #3: “Whilst the Ras signalling dosing/oncogenic stress nexus are a reasonable explanation, the model/methods are a snapshot in time and don't have the resolution to fully understand the detail of what is going on here.”

      Response: As requested, while we have a different take on the degree by which this study informs RAS mutation tropism, we appreciate the position of this reviewer, particularly the point that using genetics to modulate oncoprotein levels and the stress response thereof at the endogenous levels in vivo with Kras<sup>ex3op</sup> and Trp53<sup>fl</sup> alleles coupled with measuring the expression of three established downstream RAS target genes is no substitute for following signaling at the protein level at the moment Ras mutations are induced and thereafter throughout tumorigenesis, and hence note this caveat in the discussion.

    2. Reviewer #2 (Public Review):

      This manuscript builds upon some important thought-leading work within the Ras field that the authors have published in recent years. They have previously demonstrated how changing the protein expression levels of KRAS can modulate the number of Ras-driven tumours that are observed and posited that this suggests an optimal level of Ras signalling that is neither too stressing nor too insufficient to promote tumourigenesis.

      In this manuscript they use urethane to induce lung tumours in mouse models that have either normal or high levels of KRAS expression (also higher oncogenic stress). They are also able to modulate the associated oncogenic stress levels by the presence (higher stress) or deletion (lower stress) of p53. Urethane normally generates Q61 KRAS mutations, biochemical analysis by other groups has previously shown that these mutations are more active than G12 mutations. Following urethane induction, they observe an improved competence to support tumorigenesis in the high KRAS model when p53 is removed. They also observe a shift towards G12 mutants under genetic conditions where oncogenic stress is higher (higher KRAS expression, presence of p53). ie. stress compensators (p53 loss or weaker activating mutation) permit promotion of tumourigenesis in the high KRAS model. The converse was also observed. Loss of p53 (lower stress) resulted in higher mRNA levels of G12 mutants - suggesting that the weaker mutant increases protein expression/cancer signalling to occupy the new oncogenic stress headroom that has been created. Some support for the hypothesis that these effects are mediated by differences in Ras signalling amplitude between the different mutants was provided by analysing the expression of three key Ras gene targets. As predicted, higher expression (signalling output) was seen in Q61 vs Q12 mutants and when p53 was deleted.

      Strengths:

      The mouse model conditions provide a suitable range of options to allow the hypothesis to be tested. The data are all internally consistent and broadly support the general conclusions.

      Weaknesses:

      The mRNA data are interpreted as evidence for changes in protein expression and Ras signalling activity - there is no formal evidence that this is the case.

      The similarity in G12/13 mutations between the KRAS normal and high KRAS mice in Figure 2C is unexpected. The authors focussed on the potential for higher G12/13 mutant expression in the KRAS normal mice to explain this. It is also intriguing how there wasn't a more complete switch to Q61 in the high KRAS tumours when p53 was deleted. Whilst the Ras signalling dosing/oncogenic stress nexus are a reasonable explanation, the model/methods are a snapshot in time and don't have the resolution to fully understand the detail of what is going on here.

      This study represents a solid contribution supporting an important model and will stimulate future work to understand Ras variant cancer contributions.

    3. Reviewer #1 (Public Review):

      The centrality of RAS proteins in human malignancies has long been established, but many issues regarding their regulation and functions remain unresolved. The results of this paper provide strong supporting evidence for an emerging model that posits that activated KRAS can only be tolerated by cells up to a certain point, after which the stress it imposes outweigh its transforming potential. These restrictions impose limits on the amount of KRAS expressed in tumor cells and are also consistent with the frequent coupling of KRAS mutations with loss of the tumor suppressor p53, as the latter relieves the stress signals induced by KRAS.

    4. Evaluation Summary:

      This work helps explain some enduring mysteries about why certain activating mutations appear in the KRAS gene more frequently than others. This paper provides experimental support for an emerging concept within the Ras field that there is a sweet-spot of Ras signal strength that promotes tumorigenesis and that this explains why different mutations are observed in different contexts. The experiments are sound and the conclusions are fair. Given that certain KRAS mutations may be more amenable to therapeutic interventions than others, it is important to understand the basis for mutational tropism, and this work provides strong in vivo evidence that addresses this issue.

      (This preprint has been reviewed by eLife. We include the public reviews from the reviewers here; the authors also receive private feedback with suggested changes to the manuscript. Reviewer #1 and Reviewer #2 agreed to share their names with the authors.)

    1. Author Response to Public Reviews

      Reviewer #1 (Public Review):

      [...] The deficiencies of this study are:

      1) This is a very specific cohort, largely urban, with - presumably - relatively higher levels of education. It is hard to see how this might translate into a general statement about the population

      We agree with the reviewer that this is a very specific cohort, largely urban, and with higher levels of education than average. We further agree that the utility of this cohort is not in making general statements about the population, but rather in deriving specific insights for which the cohort is best suited. We enumerate some of them that are present in this manuscript:

      a) It is as important to understand the relative degree of spread between Indian cities, where a combination of denser population and indoor lives has led to the greatest spread of disease. Since pandemics are typically self-limiting, regions with greater spread are further along the course and can expect declines faster. This provides useful insight for public health strategy. While our cohort does not necessarily represent the average population, it is similar between cities, something that is not true for any other survey. The ICMR national serosurvey is a random selection of districts and is heavily rural biased.1 While that is important, that is not where fast growing outbreaks are likely based on a very outdoor life and lower density. Other city-wise serosurveys are variable in target population as well as methodology and cannot be easily compared.2-5 Thus our data is the first that permits comparison between many important urban regions of India, showing which regions were more advanced along the course and where future outbreaks were still likely. We note here that some of the regions identified by this survey as high risk such as Kerala, interior Maharashtra, amongst others, are where the outbreaks continued until much later.

      b) The CSIR cohort has the added advantage of greater baseline data and repeated access, we are able to determine antibody stability, as shown, and possible correlates.

      c) The cohort is well suited to understanding clinical associations of SARS CoV2 infections such as symptom rate and severity amongst its participants as well as associations of infection risks (using seropositivity as an imperfect surrogate).

      2) The presentation of Figure 1 was quite confusing, especially the colour coding

      Figure 1 was made to represent cities with CSIR labs where the sero-survey was carried out in different colour coding formats to have a quick understanding of prevalence. The cities with sero-prevalence greater than 10 percent were coded as green, while cities with seroprevalence between 5-10 percent values were coded as yellow. Cities with less than 5 percent sero-positivity were depicted as red for these may turn up into hotspots or rise of cases may be higher in these cities later when sero-positivity is used as an indirect surrogate of infection. Though, these cities while truly may not represent the state population, the state colour were coded as a gradient blue in respective format to reflect increased sero-positivity in a darker shade according to city sero-positivity. We realize that colour coding of states may have created a confusion and have removed this in the revised manuscript.

      3) It is surprising that the state of Maharashtra shows only intermediate to low levels of seropositivity, given that the impact of the pandemic was largest there and especially in the city of Pune. There have been alternative serosurveys for Pune which found much higher levels of seropositivity from about the same period.

      The Pune city sero-surveillance which has been pointed out by the reviewer was a survey of Pune’s five most affected sub-wards and not the Pune population in general. 6 Despite all the limitations, which we accept in the prior comment, our overall crude positivity rate of 10% is very similar to that of the ICMR national serosurvey, and in general the patterns we see are along the lines of what is known about severity of outbreaks. Thus, there is no real evidence to the contrary that would establish inaccuracy of the trends seen by us, and we respectfully note that surprising findings may be the most valuable ones. In fact, seeing current trends of rising cases in Maharashtra, including in Pune, when compared to other cities, our survey values may have been more correct.

      4) The statement "Seropositivity of 10% or more was associated with reductions in TPR which may mean declining transmission": For a disease with R of about 2, this would actually be somewhat early in the epidemic, so you wouldn't expect to see this in an indicator such as TPR. TPR is also strongly correlated with amounts of testing which isn't accounted for.

      We agree that for R of about 2, one would not expect a decline at sero-positivity of about 10%. However, it is worth noting that general seropositivity during the declining phase of the outbreak has been in this range for not just India, but also in major western European cities, New York, amongst other. This has three explanations. First, the highly exposed community containing the high-contact spreaders gets infected first, with higher seropositivity, thus effectively shortening or blocking transmission chains. We too note a much higher seropositivity amongst public transport users who may better represent this sub-population. Second, R0 of 2-3 is the potential of this virus. R-effective after measures are put in place may be much lower. Better compliance with masking in India may have been important. Last, the fraction of population immune at baseline is unknown but has been variably estimated at 20-30% from T cell reactivity studies as well as closed area breakouts such as ships. This is a speculative area but may help understand the results.

      We agree that we do not directly account for testing rate, which is difficult to adjust for and can affect TPR despite that fact that TPR already is one way of adjusting for different levels of testing. Since our data is a trend across different geographies, but for 30 days bracketing the sample collection, different testing rate would not in itself explain the very strong inverse association of seropositivity with TPR. Given that high seropositivity areas are likely more advanced in the course of the pandemic, we favour that as the explanation. This is after noting the issues with overall seropositivity as a surrogate of population immunity as above.

      5) The correlation with vegetarianism is unusual - you might have argued that this could potentially protect against disease but that it might protect against infection is hard to credit. Much of South Asia is not particularly vegetarian but has seen significantly less impact

      We very well agree with the statement that much of South-Asia is particularly non-vegetarian and when we started analyzing our data, it was observed that our cohort had a 70:30 ratio for non-vegetarian population to vegetarian population which was in agreement with what nationwide surveys have concluded in the past and hence our cohort was not biased in terms of sampling for this variable. We hereby in this work have tried to demonstrate seropositivity as an indirect surrogate of infection and the data was not analyzed in respected of zonal distribution and was analyzed for the entire cohort where we obtained the said observation. At this stage, we cannot speculate on the role a vegetarian diet may play in decrease sero-positivity amongst vegetarian individuals but could possibly relate it to antiinflammatory effects and effect of high fibre diet in protecting gut mucosa against viral invasion. Existing studies have only speculated on the role diet could play and there are no affirmative or largely biochemical studies to provide further evidence on this cause effect relationship. We also did a multi-collinearity analysis to study if diet was related to any other variable being studied but we didn’t find any such association.

      6) On the same point above, it is possible that social stratification associated with diet - direct employees being more likely to be vegetarian than contract workers - might be a confounder here, since outsourced staff seem to be at higher risk.

      When we analyzed the data, we also hypothesized for the above stated bias; a person’s occupation or job reflecting indirectly the socio-economic status can have an influence on diet preferences, but we didn’t obtain such a finding. In our cohort also, outsourced staff had higher non-vegetarianism than staff. Against 70:30 ratio of non-vegetarianism to vegetarianism, for the entre cohort, outsourced staff had 83 percent non-vegetarianism while staff had 66 percent, but sero-positivity amongst non-vegetarians in both the groups had higher sero-positivity of 17.25 and 8.77 percent respectively against sero-positivity of 11.89 and 6.05 percent amongst vegetarian people. We also did a logistic regression and collinearity assessment through VIF score but did not observe any such association and hence this was not acting as a confounder. For females, we rather didn’t found this association and only found transport and occupation to be significant, hence to a certain extent it is the crowding environment and occupational exposure which stand as major exposure variables when both the genders are taken into consideration.

      7) There may be correlations to places of residence that again act as confounders. If direct employees are provided official accommodation, they may simply have had less exposure, being more protected.

      We agree with this statement and have stated that outsourced personnel and staff who have to travel and specifically utilize public means of transport are exposed to a higher risk. We regret if this was not clear. The subgroup of people who use public transport reflect a more generalizable sub-population from within the cohort, with all associated risks and confounders. While we attempt a regression to separate a few of them, that is not the primary focus of this work.

      8) The correlations with blood group don't seem to match what is known from elsewhere

      We are unsure of what the reviewer is matching our data with, but have tried to explain why we consider our results to be broadly concordant. As advised elsewhere, this has not been detailed in the revised manuscript. Data for 7496 individuals was available for their Blood Group type and serological status. Blood Group (BG) distribution amongst total samples collected was similar to national reference based on a recent systematic review. Hence the sample characteristics of our cohort were similar to the national population reference. Through the literature available, it has been observed that ‘O’ BG type has less risk of getting infected which was observed in our study also. In our study, BG type O was associated with a lower sero-positivity rate, with an OR of 0∙76 (95 % CI 0∙64 -0∙91, p=0∙018) vs Non O blood group types with a overall sero-positivity of 7.09 percent which was less than the cohort wide sero-seropositivity. BG type AB and B had higher chances of testing sero-positive is what has been observed by available literature which was corroborated in our findings too. In regard to available literature; BG A has a higher risk of getting infection and this was contrary to our finding where we obtained a favourable OR in favour BG type A albeit it was not significant on statistical testing.

      9) The statement that "declining cases may reflect persisting humeral immunity among sub-communities with higher exposure" is unsupported. What sub-communities?

      We regret the lack of clarity. The wording has now been corrected, it just refers to subgroups of population with high levels of exposure.

      Reviewer #2 (Public Review):

      1) The extrapolation of the study results to the country may not be completely acceptable with the basic difference from the country's urban rural divide and a largely agricultural economy. The female gender is underrepresented in the study cohort, and no children have been included.

      We agree with the reviewer that this is a specific cohort, largely urban. We also agree that a cohort of people utilizing public transport would be better representative and we are following the individuals as the cohort enables to follow them and get further insights. We further agree that the utility of this cohort is not in making general statements about the population, but rather in deriving specific insights for which the cohort is best suited. We enumerate some of them that are present in this manuscript. (See also response to Reviewer #1.)

      2) The observations regarding corelates of sero-positivity such as diet smoking etc would need specifically designed adequately powered studies to confirm the same. The sample size for the three and six months follow up to conclude stability of the humoral immunity, is small and requires further follow-up of the cohort. The role of migration of labour helping the spread of the pandemic simultaneously to all parts of the country though attractive may not explain lower rates in states like UP and Bihar where maximum migrants moved to.

      We agree that the observations in regard to diet and smoking are only hypothesis generating and need specifically designed studies to confirm the findings. We have also mentioned in the manuscript that associations found between seropositivity and some of the parameters should be confirmed with studies specifically designed for this purpose. We are following up more individuals at three and six months to ascertain the stability of the antibodies. Maximum migrants in the early phase moved to UP and Bihar and it would indeed be expected that seeding would be higher there. While known cases were low for these states, the seropositivity data supports that seeding did occur but may have gone undetected. The ICMR Aug-Sept serosurvey data, for example, shows seropositivity in districts of these states to be higher than those Gujarat or Rajasthan.

      3) A large chunk of seropositive data set has been removed representing the big cities of Delhi and Bengaluru while correlating Test Positivity Rate citing duration as the reason. However, these cities also had different testing strategies and health infrastructure and hence are important.

      We agree that some data was removed. This was because the sample collection was extended over a longer interval, making point estimates meaningless for some labs, especially CSIR-IGIB which conducted many mini-surveys. For Delhi, only IGIB has been removed and other labs are still kept in the analysis. The graph directionality and trends remain same when analyzed with the excluded data. On keeping Bengaluru data, R square doesn’t change to second decimal place and remains same. When adding back the data from CSIR-IGIB, the R square is 0.32, maintaining the directionality and trend.

      4) Test positivity rate depends on testing strategy and type of test used; whether RTPCR or the Rapid Antigen Test and the ratio of the two tests was different in different parts of the country.

      This is a very well taken point, but the data was taken as a surrogate from a third party website and the further breakup of positivity rate was not available. It should of course be done ideally with one type of test only but this was not possible. Our larger point is that for a given part of the country TPR went down when seropositivity went up. This is relevant even if different parts of the country used different ratios of the test.

      Reviewer #3 (Public Review):

      [...] Weaknesses: While it is a pan-India survey, the population is not quite representative of general population of the country. CSIR labs are mostly in cities, and most of the employees use private transport. So the results cannot be generalized to the country as a whole. Restricting to people using public transport would be a better representation, although it still would not be fully representative.

      We agree with the reviewer that this is a specific cohort, largely urban. We also agree that a cohort of people utilizing public transport would be better representative and we are following the individuals as the cohort enables to follow them and get further insights. We further agree that the utility of this cohort is not in making general statements about the population, but rather in deriving specific insights for which the cohort is best suited. We enumerate some of them that are present in this manuscript. (See also response to Reviewer #1.)

    1. Author Response to Public Reviews

      Reviewer #1 (Public Review):

      [...] What is left unclear is what is unique about the fibrotic substrate in ESUS patients in comparison to AFib patients in the future.

      We thank the reviewer for these reasonable and accurate critiques. In the revised version of our manuscript, we offer a more in-depth analysis of potential cohort-scale differences in the spatial distribution of fibrosis between ESUS and AFib patients and how that might affect the overall arrhythmogenicity of fibrotic remodeling between the two populations. We further acknowledge comprehensive understanding of pathophysiological consequences of fibrosis in ESUS will require much more research in the future. Our plans include analysis of how fibrosis might affect LA hemodynamic properties and the likelihood of clot formation. Future work (both clinical and computational) will also be needed to test the hypothesis generated by the present study that ESUS patients lack the triggers needed to initiate AFib. We have added clarifying text to the Discussion section of our manuscript to acknowledge these two points (see lines 286-289, 367-368).

      Reviewer #2 (Public Review):

      [...] 1) As the authors point out, clinical studies have revealed that the fibrotic burden in ESUS patients is similar to those with aFib. The question is why then, do so few ESUS patients exhibit clinically detectable arrhythmias with long-term monitoring. The authors hypothesize and their data support the notion that while the substrate is prime for pro-arrhythmia in ESUS patients, a lack of triggering events may explain the differences between the two groups.

      We thank the reviewer for their kind comment about the level of anatomical and structural variability in our study. We concur that additional analysis of fibrosis spatial pattern properties (local fibrosis density and entropy, as calculated in our previous work) on a region-wise basis between AFib/ESUS and inducible/non-inducible models would add significant value to our work. Accordingly, we have made significant additions to the text including a completely new figure.

      2) I think the authors could go further in describing why this is surprising. Generally, severe fibrosis is thought to potentially serve as a means or mechanism for pro-arrhythmic triggers. This is because damage to cardiac tissue typically results in calcium dysregulation. When calcium overload occurs in isolated fibrotic tissue areas, or depolarization of the resting membrane potential due to localized ischemia allows for ectopic peacemaking, we might expect that the diseased/fibrotic tissue is itself the source of arrhythmia generation. I think the novel finding here is that this notion may be a simplification, and the sources of arrhythmia generation may be more complex and may need to come from outside the areas of fibrosis. I think this is a big deal.

      Patients with stroke were excluded from the AFib cohort because the etiology of stroke in our AFib cohort was not explicitly adjudicated to be cardioembolic, other ischemic such as atherosclerotic, or haemorrhagic and therefore would not allow us to draw reliable conclusions regarding the role of the atrial substrate in stroke in this population. A separate issue is the fact that the cell- and tissue-scale electrophysiology in models reconstructed from ESUS patients was based on the same representation as those used in AFib models. In fact, this was a deliberate design choice to ensure that our modeling results represented a “worst case scenario” for the potential impact of fibrosis in patients with ESUS. Given the fact that our aim is to determine whether there are any differences in the pro-arrhythmic capacity of fibrotic substrate in ESUS and AFib groups, we believe that this is a suitable and justifiable modeling choice – modeling fibrosis differently in the two populations would be difficult to justify due to a lack of good experimental data and would introduce more confounding factors.

      Nevertheless, we agree this is a relevant limitation of our study and we have added an acknowledgement of that fact to our revised manuscript (see lines 361-365).

      3) An acknowledged limitation of the study is the assumption of fixed conduction velocity and action potential duration/effective refractory period. Bifulco et al. base this assumption on previous studies by the group (e.g. L312), which, however, concluded that reentrant driver locations and inducibility are sensitive to changes of action potential and conduction velocity (Deng et al.). For conduction velocity, wider ranges have been reported since the publication of the supporting reference (35) in 1994, e.g. Verma et al.; Roney et al.

      The reviewer’s point is well taken. Accordingly, we have added qualifying language pertaining to RD localization analysis in our Discussion (see lines 323-326). Having said that, we do not think this issue stands to fundamentally change our top-line interpretation of the findings from simulations, as it pertains to the idea that fibrosis in ESUS might plausibly be latent proarrhythmic substrate. The point of the paper by Deng et al. was to analyze sensitivity of reentrant driver localization to altered cell- and tissue-scale electrophysiological properties, not the concept of inducibility per se. It is thus likely that if our entire study were repeated with ±10% CV or APD (both within normal physiological range for average fibrotic atrial tissue) the take-home message would be the same.

      4) The number of pacing sites is rather low for a comprehensive in silico arrhythmia inducibility test but likely a good balance of coverage and computational feasibility considering that the primary goal of this research was to check whether the two groups of models show differences when undergoing the same (but not necessarily exhaustive) protocol.

      We would argue that 15 sites in the LA alone is comparable in coverage to prior studies in biatrial models (e.g., 30 LA/RA sites in Zahid et al. [2016] Cardiovasc Res; 40 LA/RA sites in Boyle et al. [2019] Nat Biomed Eng). We would further stress that our decision to use these specific sites was based on our motivation to simulate triggered activity (i.e., rapid pacing) exclusively from sites identified as common clinically relevant trigger locations documented in AFib patients (see ref. [14] by Santangeli et al. [2016] Heart Rhythm). If we were to instead pace from randomly distributed atrial sites as in prior work, we would jeopardize our ability to draw conclusions on the potential relevance of our simulations to the real-world susceptibility of atrial fibrotic substrate in ESUS patients to ectopic beats originating from realistic locations.

      5) The discussion does a good job in putting the results into context. Two interesting observations that deserve more attention are that i) the Inducibility Score was always higher for AFib vs. ESUS (Figure 6A, no statistical test performed). However, this did not translate to a difference in silico arrhythmia burden (inducibility). ii) Reentrant drivers were about twice as likely to localize to the left pulmonary veins than the right pulmonary veins in the AFib models (Figure 6D).

      Regarding the first point (i), with corrections made to the fiber mapping process, the statement regarding uniformly higher IdS values in AFib models is no longer true. Moreover, with our revised analysis there is no significant difference in the region-wise inducibility rates (P=0.45). The reviewer’s second point (ii) still stands and is even more pronounced with a ~3x higher rate of localization to the LPV vs. RPV areas in AFib models. Notably, our new region-wise analysis of fibrosis spatial pattern (see new Fig. 6 and our response to major points 4 and 5 above) shows that LPV regions in AFib models in this cohort were much more likely to have the combination of high fibrosis density and entropy previously shown to be highly favorable to reentrant driver localization. However, we recognize that a more fulsome analysis will be required to draw truly meaningful conclusions on this subject in the context of either AFib or ESUS patients; this has been briefly noted in our Limitations section (see lines 332-335).

      6) The study succeeded in answering the question it posed in the sense that no marked difference was found between the ESUS and AFib models. This leads to the question what the stroke-inducing mechanism is in the ESUS patients. A hypothesis for future work could be that the fibrotic infiltrations in the ESUS patients reduce the hemodynamic efficacy of the left atrium and render clot formation (e.g. in the atrial appendage) more likely in this way.

      The reviewer’s comment is duly noted and entirely consistent with our plans for future work. In fact, we recently published a white paper (Boyle et al. [2021] Heart) outlining a vision to combine electrophysiological models of the left atrium with biomechanics and hemodynamics simulation to comprehensively understand how fibrosis might influence clot formation. Our revised Discussion emphasizes this exciting trajectory for future work (see lines 370-372).

      7) The negative finding in this study (no difference between groups) does not naturally allow us to draw clinical implications for diagnosis or stratification. Additional ways to put the hypothesis proposed by the authors (fewer arrhythmogenic triggers in the ESUS patients) to test could be to consider readouts/surrogate measures of the autonomic nervous system.

      We have noted in our Discussion (see lines 286-289) that future work could test the hypothesis arising from this project via electrocardiographic monitoring in ESUS patients with different levels of fibrosis. Concerning the idea of using direct readouts of autonomic tone, we chose to leave this out since we are unaware of any clinically available systems. The usefulness of surrogate measurements (e.g., heart rate variability) in this context also remains unclear.

      Reviewer #3 (Public Review):

      [...] 1) As the authors point out, clinical studies have revealed that the fibrotic burden in ESUS patients is similar to those with aFib. The question is why then, do so few ESUS patients exhibit clinically detectable arrhythmias with long-term monitoring. The authors hypothesize and their data support the notion that while the substrate is prime for pro-arrhythmia in ESUS patients, a lack of triggering events may explain the differences between the two groups.

      We thank the reviewer for these kind remarks. It is encouraging to have our results interpreted so elegantly and accurately. We are excited to test this new hypothesis (and others prompted by the peer review process for this manuscript) in future studies.

      2) I think the authors could go further in describing why this is surprising. Generally, severe fibrosis is thought to potentially serve as a means or mechanism for pro-arrhythmic triggers. This is because damage to cardiac tissue typically results in calcium dysregulation. When calcium overload occurs in isolated fibrotic tissue areas, or depolarization of the resting membrane potential due to localized ischemia allows for ectopic peacemaking, we might expect that the diseased/fibrotic tissue is itself the source of arrhythmia generation. I think the novel finding here is that this notion may be a simplification, and the sources of arrhythmia generation may be more complex and may need to come from outside the areas of fibrosis. I think this is a big deal.

      This is an excellent point and we strongly concur that the “trigger-centric” interpretation of the pathophysiological consequences of fibrotic remodeling should be reconsidered. To further reinforce this fact, we ran additional simulations to rule out the possibility that there might be exaggerated resting membrane potential depolarization in AFib but not in ESUS, which might provide an alternative explanation for the clinical manifestation of arrhythmia in the former but not the latter. Our new results support the point raised by the reviewer and, in our opinion, increase the overall impact of the work.

    1. Reviewer #3 (Public Review):

      This study provides a concept of circuit organization of a pathway from the brainstem to the primary somatosensory (S1) and motor (M1) cortices through the thalamus to control the hand/forelimb movements. Previous studies reveal detailed circuit organization of ascending somatosensory pathways in the whisker system. In contrast, much less is known about circuit organization of another ascending pathway controlling the hand/forelimb movements, although it is known that there are some similarities and differences between two different somatosensory systems.

      This paper revealed detailed circuit organization of the ascending pathways including the lemnisco-cortical and corticocortical pathways to control the hand/forelimb movements. The strength of this study is to use a variety of sophisticated techniques, such as optogenetics, trans-synaptic viruses, both anterograde and retrograde viruses, mouse genetics, and electrophysiology, to map the neural circuits in details. The circuit was revealed by electrophysiology together with optogenetics, which is very convincing. In addition, the detailed circuit organization revealed by this study will provide an important information for future behavioral studies. The weakness is the limitation of trans-synaptic viruses. For example, pseudorabies viruses move between multiple neurons, so to interpret the results may be complicated. Although behavioral analyses have not been performed in this study, it is beyond the scope of this study and future study will follow up the behavioral analyses.

    2. Reviewer #2 (Public Review):

      This study traces the detailed excitatory connections of mouse forepaw sensorimotor circuits from the spinal cord, through brainstem, thalamus, sensory and motor cortical areas, and their motor outputs. This is a welcome and important contribution, considering the technical advantages of mice for circuit cracking and the increasing number of labs studying the functions of their limbs. Although the structure and function of forelimb sensorimotor circuits have been extensively studied in primates, they have been relatively neglected in the rodent, especially compared to the enormous scope of research that has been done on the rodent vibrissae system over the past 50 years. This study uses a variety of contemporary methods to reveal important similarities and differences between the forelimb and vibrissae sensorimotor circuits.

      Overall, the results do not hold major surprises, although this is itself a noteworthy result. The authors did identify a few qualitative and quantitative differences between the forelimb circuit and the parallel vibrissae-related circuit; the functional significance of these differences is as yet unclear.

      The weaknesses of the manuscript are few and minor. The study would have been stronger if it had performed comparable, parallel experiments on the hand and vibrissae circuits, however the scope of the study is already ambitious and strong enough as it stands. I do have a question about the identity of the cortical L4 neurons that were recorded, and this issue should be discussed.

    3. Reviewer #1 (Public Review):

      Sensorimotor integration is required for the accurate execution of volitional movements, but the neural circuits underlying sensorimotor integration are still not fully understood. The whisker system of the rodent has emerged as one model of sensorimotor integration with many recent studies focused on the synaptic organization of the underlying circuitry. Here, Yamawaki et al report results regarding the synaptic organization of the ascending sensory pathways related to mouse forelimb somatosensory and motor cortex. Using anatomical and functional approaches, they elucidate the circuitry from the cuneate nucleus through thalamus to forelimb S1 and M1. This work complements recent studies in the mouse of other aspects of the forelimb sensorimotor pathways and leads to informative comparisons to the circuit organization of the whisker system. The studies are well executed and well explained. The use of multiple approaches compensates for the limitations of each individual technique, although some limitations such as any effects of viral tropism are difficult to overcome. Overall, this work contributes to a better understanding of the wiring diagram of sensorimotor circuits in the mouse.

    4. Evaluation Summary:

      This paper will be of interest to those studying the sensorimotor functions of the hand and forelimb. It traces the anatomy and strength of excitatory pathways from the spinal cord, through the brainstem, thalamus, somatosensory and motor cortex, and descending outputs. The methods are contemporary, and include multiple viral tracing, genetic targeting, and transsynaptic strategies, optogenetic and electrophysiological methods; the data are compelling; and the paper is clear and concise.

      (This preprint has been reviewed by eLife. We include the public reviews from the reviewers here; the authors also receive private feedback with suggested changes to the manuscript. Reviewer #2 and Reviewer #3 agreed to share their names with the authors.)

    1. Joint Public Review:

      Worker bees perform specialised tasks: young workers nurse larvae, older ones forage for either nectar or pollen. Behaviours - including these specialist ones - arise when a stimulus (nectar, pollen or larvae) exceeds a certain 'response threshold' of the organism. This threshold can be modulated by neuropeptides to alter behaviour.

      The study first shows that response thresholds to task-related stimuli differ among nurse bees, nectar and pollen foragers. Pollen foragers are most responsive to sucrose and pollen, and nurse bees most responsive to chemical stimuli of larvae. Then, taking a proteomic approach, they identify a neuropeptide, Tachykinin related protein (TRP), to be expressed in a task-specific pattern: low in nurse bees and highest in the nectar foragers.

      This work provides valuable resource information on the abundance of brain neuropeptides in two species of bees. The study is exceptional in its breath of techniques used and the addition of manipulative experiments which are difficult to do in honey bees. Through their studies the authors identify a neuropeptide that modulates response thresholds of bees.

      The study would have been exceptional if the authors had included studies on the expression of the tachykinin receptor. The level of tachykinin expression increases between nurse bees and foragers, but does not involve changes in spatial expression (Takeuchi et al., 2004 ref. 56). So, it is likely that the specificity of the effects of tachykinin are due to differences in the spatial expression of the receptor.

    2. Evaluation Summary:

      The authors provide convincing evidence that tachykinin signaling is involved in regulating response thresholds of task-specific stimuli only in the respective behavioral specialist. For example tachykinin signaling affects responses to pollen in pollen foragers and responses to larval chemical cues only in nurse bees. The study highlights the importance of peptide signaling in social behaviors in insects for the first time.

      (This preprint has been reviewed by eLife. We include the public reviews from the reviewers here; the authors also receive private feedback with suggested changes to the manuscript. Reviewer #1 and Reviewer #3 agreed to share their names with the authors.)

    1. Response to Public Reviews

      Response to Reviewer #1 (Public Review):

      We thank the reviewer for their kind comments and were glad to learn that the reviewer felt the manuscript significantly contributed to body of knowledge on COVID-19.

      Response to Reviewer #2 (Public Review):

      We thank the reviewer for their dedication to a detailed review, and we greatly appreciated the constructive suggestions given that have helped strengthen the overall manuscript.

      We agree with the reviewer that the loss of power for detecting a loss of sensitivity by the ID NOW PCR assay was hindered by the overall low population frequency of COVID-19 disease; this resulted in a low number of positive patients and ultimately led to early study termination as a result. Because of the reviewer’s helpful observation, we have now re-estimated the power of this study without reference to the observed results, but with consideration for the sample size and proportion of RT-PCR positive tests that were observed when the study was terminated. This new re-estimation suggests that the study retained 80% power to find a difference of 15% or more in sensitivity between ID NOW isothermal PCR and conventional RT-PCR; this analysis also demonstrated over 95% power to find a difference in specificity of more than 5%. Indeed, the significant drop in population prevalence that led to a loss of power for detecting loss of sensitivity expectedly resulted in an increase in power for detecting loss of specificity. We have expanded the Methodssection of the paper to better expose these issues, and we have expanded our statement of strengths and limitations in the Discussion for the same reason.

      The Methods section of the manuscript now reads as follows:

      "The original study design called for enrolling 2000 symptomatic and 500 asymptomatic subjects, which would have provided, in the symptomatic population, power of 80 % for finding a difference (at α = 0.05) of 5% in the sensitivity of ID NOW compared with the RTPCR reference standard; inclusion of at least 1350 negative patients would have provided 95% power (at α =0.025) for finding a 5% difference in specificity. The study design assumed a population prevalence of 10%, and the study was terminated early when the population prevalence dropped to such a low level as to make the study unaffordable. We have re-estimated the power of this study without reference to the observed results but considering the sample size and proportion of RT-PCR positive tests that were observed when the study was terminated. This re-estimation suggests that the study retained 80% power to find a difference of 15% or more in sensitivity between ID NOW and RTPCR, and well over 95% power to find a difference in specificity of more than 5%. Indeed, the significant drop in population prevalence that led to a loss of power for detecting loss of sensitivity resulted, as expected (Bujang and Adnan, 2016), in an increase in power for detecting loss of specificity.

      The revised section of the Discussion regarding strengths and weaknesses now reads as follows:

      "Our clinical study also suffered a significant loss of power to assess ID NOW sensitivity as a result of the low number of positive results, and the reduction of sample size caused by the decision to terminate the study as a result. The meta-analysis is also limited by the small number of studies meeting inclusion criteria, and the fact that positive cases are heavily concentrated in only a single study. Strengths of the clinical study include pretrial power analysis with sample size estimation, precise adherence to the ID NOW specimen acquisition protocol, and extremely high power for assessing assay specificity. Taken together with the focus on initial diagnosis of disease in the studies included in the meta-analysis, we believe the combination of trial and meta-analysis provides useful information for clinicians for whom point-of-care testing is helpful."

      We thank the reviewer for noting the unique findings from the current cohort study in comparison to existing literature. The current cohort study was done with meticulous care to identify apparent “false positives” returned by ID NOW PCR assay. This is also reflected in some of the high-quality studies available in the literature. In the supplementary data, we have provided confusion matrices for all the studies included in the meta-analysis. We have identified four such cases out of 1,942 total ID NOW tests. Cell sizes of 0 (from our study) and 4 are two small to allow use of Chi-squared for assessment of heterogeneity, and unfortunately the total number of tests is too large to allow computation of Fisher’s exact test; however, with such small numbers it is reasonable to treat them as samples drawn from Poisson distributions. The confidence interval around a Poisson estimate of 4 is 1.08987 ≤ μ ≤ 10.24159, and that around a Poisson estimate of 0 is 0.00000 ≤ μ ≤ 3.68888. The overlap is such that the estimates, 0 and 4, are consistent with having sampled the same distribution. While this does not allow us to conclude that no difference exists between our results and those of the other studies, it does not provide any evidence that there is a difference from the current cohort study and those previously published.

    2. Reviewer #2 (Public Review):

      Tu et al. submit a manuscript that evaluates the performance of the Abbott ID NOW SARS-CoV-2 test in an ambulatory cohort relative to RT-PCR tests. They enrolled 785 symptomatic patients, 21 tested positive for SARS-CoV-2 by ID NOW and PCR (Hologic) while 2 tested positive only via PCR. They also tested 189 asymptomatic individuals, none of whom tested positive by either ID NOW or PCR. The positive agreement between ID NOW and PCR was 91.3%, and the negative percent agreement was 100%. The authors also provide a review and meta-analysis of ID NOW performance across at least a dozen other named studies which is thorough and interesting. The cohort assessed in this study is small and localized. The data is undermined by sample size, with the most glaring example being the 100% negative percent agreement, which doesn't compare with the known performance of the test in broader populations.

    3. Reviewer #1 (Public Review):

      The study presents relatively high and robust sensitivity of Abbott ID NOW for the detection of SARS-CoV-2 (COVID-19) in an ambulatory population, utilizing the RT-PCR methodology as a comparative correlation. The study was well designed and enrolled both symptomatic and asymptomatic populations to provide sufficient statistical power for the comparative analysis of the methodologies, as well as to represent accurately the patient populations. This is a useful and timely study that has a great impact in clinical setting for the rapid detection of COVID-19.

    4. Evaluation Summary:

      The authors evaluate the performance of the Abbott ID NOW SARS-CoV-2 test in a group of non-hospitalized individuals being tested for COVID-19 and compared that performance to an RT-PCR test. The authors also provide an interesting review and meta-analysis of ID NOW performance across the literature. The cohort assessed in this study, however, was small and localized, which currently undermines its comparison with the known performance of the test in broader applications.

      (This preprint has been reviewed by eLife. We include the public reviews from the reviewers here; the authors also receive private feedback with suggested changes to the manuscript. Reviewer #1 agreed to share their name with the authors.)

    1. Reviewer #2 (Public Review):

      In this manuscript, Xue et al. assessed many AAV vectors and demonstrated that Thioredoxin-interacting protein (TXNIP) saves RP cones by enhancing their lactate catabolism. The results of this study were based on cone counting, IHC and reporter. While the authors focus on the cellular metabolism in the Txnip-mediated rescue effect, it is unknown whether anti-oxidative stress plays a role as well.

    2. Reviewer #1 (Public Review):

      The goal of this manuscript is to develop gene-agonistic approaches for promoting cone survival in retinal degenerative diseases. Based on their previous studies, the authors tested a total of 20 genes by subretinal delivery using an AAV vector which utilized a cone-specific promoter. Most of these genes augmented glucose utilization. Interestingly, only Txnip showed a positive result by prolonging cone survival (tested up to 50 days in rd1 retina). Txnip therapy also appears to be effective in rd10 and rho-/- retina. Additional strength of this study is the use of Txnip C247S allele that blocks its association with thioredoxin. Furthermore, additional work on how Txnip may contribute to cone survival by better utilization of lactate for energy is well presented though the conclusion on "heathier" mitochondria require additional data. This manuscript is potentially of great interest. The data are extensive and biological implications of the study are clear. However, the broad conclusions with respect of Txnip therapy for RP (or even AMD) are less than justified based on the data. Two weaknesses are apparent: the first is related to the method of quantification using whole mount retina, and the second related to the duration of the study. Immunostainings of retinal sections (and even TEMs) are critical to elucidate the structure of surviving cone photoreceptors (specially in the absence of rods) and their relationship to other cells (e.g., RPE, bipolar cells, glia). Similarly, Prusky's OMR can't be equated to visual acuity. The authors need to show cone structure/function at P50 and beyond (how long do the cones survive?) in rd1 and other models before claiming the potential benefit of Txnip for retinal and macular degeneration.

    3. Evaluation Summary:

      This authors used AAV in mouse retinas to express several candidate genes that they thought might have favorable effects on cone metabolism and therefore make cones more robust to stress caused by genetic deficiencies. Txnip is the most effective at prolonging cones survival and a combo of HK and PFK is the most effective at shortening cone survival. The investigators evaluated effects of specific mutations in Txnip with known biochemical effects. Their general conclusion is that Txnip may be enhancing mitochondrial function and ATP production and it may allow cones to use alternative fuels more effectively. This is an interesting and informative set of findings and it is presented and discussed in the context of what currently is known about retina metabolism and its influences on photoreceptor survival.

      (This preprint has been reviewed by eLife. We include the public reviews from the reviewers here; the authors also receive private feedback with suggested changes to the manuscript.)

    1. Author Response to Public Reviews

      We thank the reviewers and editors for their detailed and insightful comments. We believe the consequent revisions have greatly increased the overall clarity of the manuscript, and provide important additional context and analysis.

      Reviewer #1 (Public Review):

      We thank the reviewer for the detailed comments.

      [...] Overall, the manuscript lacks substantial statistical support or clear evidence of some of the patterns they are stating and would require a substantial revision to justify their conclusions. The majority of the manuscript relies on 8 infant/mother pairs where they have evidence of pertussis infection and rely on the dense sampling to investigate infection dynamics. However, this is a very small sample size and further, based on the results displayed in Figure 1, it is not obvious that the data has a very pattern that warrant their assertions.

      As noted in the introduction, we begin our results with “a descriptive analysis of eight mother/infant pairs where each symptomatic infant had definitive qPCR-based evidence of pertussis infection.” Our goal in this section is to use noteworthy examples to highlight salient epidemiological patterns, which we explore in further detail using data from the full cohort in subsequent sections. We note that the results presented in Fig 3 onwards in no way rely on any arguments and/or specific patterns described in Fig 2. In other words, the original eight pairs revealed several unanticipated findings (particularly the finding of repeated high CT values PCR findings in the mothers of a child with definite pertussis), that were intriguing and potentially relevant in terms of pertussis epidemiology. They are also unique – we have not seen any published time series data using qPCR in this way before. These early observations motivated us to conduct a more detailed and quantitative analysis of the cohort of >1,300 mother/infant pairs.

      The sample size under consideration in the majority of the manuscript (i.e., all except for the above section) is 1,320 mother/infant pairs (2,640 subjects), as shown in Table 1 and 2. In the original submission, sample sizes were also clearly indicated in Figure 2B (assays per week), Fig 3B (subjects per group), Table 2 (subjects per group), Figures S1-2 (study profile), Figure S3 (NP samples per infant), and Table S1.

      We have revised the panel order and axes labels of the current Figure 3 to more clearly illustrate the relationship between panels, and to clarify that the 6 example pairs shown in Fig 3A are unrelated to the 8 pairs shown in Figure 2. We hope this addresses any remaining confusion.

      While there are some instances with a combination of higher/lower IS481 CT values, it does not appear to have a clear pattern. For example, what are possible explanations for time periods between samples with evidence of IS481 and those without (such as pair A, C, D, E, F and H)? There also does not appear to be a clear pattern of symptoms in any of these samples (aside from having fewer symptoms in the mothers than infants).

      The ambiguity of these patterns played a role in guiding our analysis of the entire cohort, where we establish evidence for infection based on a preponderance of evidence from a large number of individuals.

      Further, it is not obvious how similar these observed (such as a mixture of times of high or low values often preceded or followed by times when IS481 was not detected) is similar to different to the rest of the cohort (in contrast to those who have a definitive positive NP sample during a symptomatic visit).

      The main results are primarily a descriptive analysis of these 8 mother/infant pairs with little statistical analyses or additional support.

      We strongly disagree with this characterization of our results, where we state that “In this analysis, we focus on the 1,320 pairs with ≥4 NP samples per subject (Figure S3)”. We believe the reviewer’s confusion may stem, in part, from a mis-interpretation of Figure 2 (below), along with our erroneous reference to Figure 3 (we incorrectly stated Fig 2, adding to the confusion). With this in mind, we have revised the previous Figure 2 (now Figure 3) in the interest of clarity, and more carefully described exactly what the points displayed in Figure 3 represent.

      The authors do not provide evidence or detail about what is known about the variability in IS481 CT values, amongst individuals, or over time, or pre/post vaccination. Without this information, it is not clear how informative some of this variability is versus how much variability in these values is expected.

      We agree that this is important information, and we have added figures and results summarizing the observed impact of vaccination on CT values (see essential revision 1, above), and the patterns of transitions of CT values across adjacent samples within individuals throughout the study (see essential revision 2). This latter analysis is now summarized in Figure 6, and shows a clear tendency for step-wise transitions over time. The implication is that the data present structure rather than random noise. This supports our overall contention that full-range CT values can provide meaningful insights into pertussis epidemiology. We also note that Fig. 7A (previously Fig 3A) and Table 3 (previously Table S1) do indeed summarize the distribution of CT values, including variability amongst individuals. As noted above, we have also included an additional analysis summarizing the interdependence of CT value on both symptoms and antibiotics (Fig 8-figure supplement 1).

      I think particularly in Figure 1, how many of the individuals have periods between times when IS481 evidence was observed when it was not observed, is concerning that these data (at this granular a level) are measuring true infection dynamics.

      Adding in additional information about the distribution and patterns of these values for the other cohort members would also provide valuable insight into how Figure 1 should be interpreted in this context.

      We believe our previous comments concerning the relationship between the current Figure 2 (illustrative example) and the remaining figures (cohort analysis) addresses this comment.

      As it stands, the authors do not provide sufficient interpretation and evidence for having relevant infection arcs.

      We have revised the manuscript to clarify that infection arcs are observed in other studies and expected in infected individuals, rather than directly observed and/or quantified in this study.

      It appears that Figure 2A was created using only 8 data points (from the infant data values). If so, this level of extrapolation from such few data points does not provide enough evidence to support to the results in the text (particularly about evidence for fade-in/fade-out population-level dynamics). Also, in Figure 2, it is not clear to me the added value of Figure 2C and the main goal of this figure.

      We believe our previous comments have addressed this point. As noted, we have revised the current Fig 3 for clarity. Figure 3A and 3C are intended to demonstrate the structure of the cohort across the study period. We have revised the caption to clarify this point.

      The authors have created a measure called, evidence for infection (EFI), which is a summary measure of their IS481 CT values across the study. However, it is not clear why the authors are only considering an aggregated (sum) value which loses any temporality or relationship with symptoms/antibiotic use. For example, the values may have been high earlier in the study, but symptoms were unrelated to that evidence for infection - or visa versa.

      We believe that temporal patterns of CT values within subjects now described in Figure 6 deserve further detailed attention that is outside the scope of the current work. We believe the high-level empirical summaries presented here are strengthened by their reliance on a preponderance of evidence. In the current revision, we have also included additional analyses that we believe address some (if not all) of the reviewers concerns.

      This seems to be an important factor - were these possible undiagnosed, asymptomatic, or mild symptomatic pertussis infections? It is not clear why the authors only focus on a sum value for EFI versus other measures (such as multiple values above or below certain thresholds, etc.) to provide additional support and evidence for their results.

      Our approach seeks to use an objective statistical summary (geometric mean RCD proportion) to quantify the “signal” contained in IS481 assays within individuals across the course of the study. We note that, while both false positives and false negatives are likely in this study, the sample characteristics of the cohort mean that repeated false positives within individuals are unlikely based on chance alone. Further, a central aspect to our argument is that dichotomizing a continuous variable at an arbitrary threshold is reductive and unnecessarily introduces misclassification that reduces, rather than improves, statistical power.

      It is not clear why the authors have emphasized the novelty and large proportion of asymptomatic infections observed in these data. For example, there have been household studies of pertussis (see https://academic.oup.com/cid/article-abstract/70/1/152/5525423?redirectedFrom=PDF which performed a systematic review that included this topic) that have also found such evidence.

      We are aware of the paper above, which we had cited in the discussion. A key limitation of the referenced study is reliance on retrospective recall spanning many months. Since pertussis infections may be mild and non-specific, the fact that household contacts of an index case cannot recall a pertussis-like infection is consistent with asymptomatic infection, but far from definitive evidence. Moreover, the use of seroconversion as the measure of exposure is unreliable, since variations in antibody concentrations can be driven by a number of factors other than natural exposure.

      While cross-sectional surveys may be commonly used in practice, it is not clear that there is no other type of study that provides any evidence for asymptomatic infections.

      Our core argument is that it is impossible to know with certainty that a symptom-free patient with a detecting qPCR on Monday would not have become symptomatic if recontacted on Tuesday. By their nature, cross-sectional studies simply cannot parse asymptomatic from pre-symptomatic infections. To do that, one needs a longitudinal design, as reflected in the aforementioned longitudinal household contact studies. A key consideration addressed in the current work is the extent to which low and/or borderline CT values should be reinterpreted within the context of A) repeated sampling of individuals over time and B) epidemiological surveillance versus clinical diagnosis. We do not claim that our approach is the only one possible.

      Further, it is not clear why the authors refer to widespread asymptomatic pertussis when a large proportion of individuals with evidence for pertussis infection had symptoms. Would it not be undiagnosed pertussis if it is associated with clinical symptomatology?

      We have revised the text to highlight the significance of both asymptomatic and minimally symptomatic pertussis. As we describe both here and in Gill et al. 2016, only a handful of individuals meet the consensus criteria for clinical pertussis (Ct<35). In addition, qPCR results were not available to clinic staff in real-time. This, coupled with the relative absence of severe symptoms during study visits (especially in mothers), meant that only one study participant was diagnosed with pertussis at the time of their visit.

      Reviewer #2 (Public Review):

      We thank the reviewer for their supportive comments.

      This study was done in a population with wP vaccine, I wonder if that's part of the reason many of the CT values are high. Can the authors speculate what this study would look like in a population having received aP for a long period? I'd appreciate more discussion around vaccination in general.

      We have added results summarizing the possible interaction between IS481 assays with infant vaccination.

      We also note that aP is widely used in high-resource settings where overall pertussis incidence is lower, while pertussis diagnosis and treatment are more widely available. Our results indicate that mothers in this population experience non-trivial pertussis incidence over time, yielding immunological profiles from repeated infection that we expect differ markedly from that of individuals who lack naturally-derived resistance to infection via, e.g., mucosal antibodies and tissue-resident T-cells. Recognizing that our study does not provide a direct comparison with aP-vaccinated populations, we nonetheless believe that directly comparable populations (urban poor in under-served communities) are both numerous and under-studied.

    2. Reviewer #3 (Public Review):

      Gill et al. presents an extensive analysis of information/data collected as part of a pertussis vaccine study conducted in Zambia (the basis for an earlier publication, Gill et al., CID 2016). As part of the initial study, the investigators collected serial NP samples from mother/infant pairs at sequential follow-up clinic visits and analyzed them by PCR for the presence of IS481 and, in some cases, ptxS1. The results from these assays were evaluated in conjunction with clinical information on potential manifestations of respiratory illness in the infants and mothers. The authors found important patterns of PCR Ct values, which might not have been considered positive on a single sample PCR from a single patient PCR in a US clinical microbiology lab. Together, however, representing a collection of serial samples from study subjects, they strongly support the proposal that asymptomatic infections occurred in these study subjects. The authors used multiple approaches, including determining a mathematical "Evidence For Infection" or EFI to analyze the data from individual subjects and infant/mother pairs. From the collective data and analytical approaches, the authors provide a compelling case for infections with B. pertussis that are not associated with significant clinical symptoms. This possibility has certainly been considered previously, but not possible to address in the absence of the enormous amount of quantitative data and analysis provided from this prospective study. Another important point made from these data is that PCR Ct values can be useful in other than an all-or-nothing (positive or negative) decision, as is done appropriately with single patient samples submitted to clinical microbiology labs for PCR analysis.

    3. Reviewer #2 (Public Review):

      In the current study Gill et al present a retrospective analysis of NP swabs of mother infant pairs taken longitudinally in Zambia. They use qPCR CT values to quantify the amount of IS431 in each sample to detect pertussis infection. They find strong evidence for asymptomatic pertussis infection in both mothers and infants, validating previous work identifying the role of asymptomatic transmitters in populations. This is a tremendously important study and is conducted and analyzed very well. The manuscript is well written, and I heartily recommend publication. Excellent work, well done.

      Comments:

      This study was done in a population with wP vaccine, I wonder if that's part of the reason many of the CT values are high. Can the authors speculate what this study would look like in a population having received aP for a long period? I'd appreciate more discussion around vaccination in general.

    4. Reviewer #1 (Public Review):

      In "Asymptomatic Bordetella pertussis infections in a longitudinal cohort of young African infants and their mothers", the authors analyze longitudinal data from a cohort in Zambia of infant/mother pairs to investigate the evidence for subclinical and asymptomatic infections in both pairs as well as the use of IS481 qPCR cycle threshold (CT) values in providing evidence for pertussis infection. Overall, the manuscript lacks substantial statistical support or clear evidence of some of the patterns they are stating and would require a substantial revision to justify their conclusions. The majority of the manuscript relies on 8 infant/mother pairs where they have evidence of pertussis infection and rely on the dense sampling to investigate infection dynamics. However, this is a very small sample size and further, based on the results displayed in Figure 1, it is not obvious that the data has a very pattern that warrant their assertions.

      Major comments:

      The main results and conclusions are highly reliant on details from eight mother/infant pairs. However, Figure 1 does not show a clear picture of the fade-in/fade-out. The authors go into great detail describing each of these 8 pairs, however based on the figure and text there does not appear to be clear evidence of an underlying pattern. While there are some instances with a combination of higher/lower IS481 CT values, it does not appear to have a clear pattern. For example, what are possible explanations for time periods between samples with evidence of IS481 and those without (such as pair A, C, D, E, F and H)? There also does not appear to be a clear pattern of symptoms in any of these samples (aside from having fewer symptoms in the mothers than infants). Further, it is not obvious how similar these observed (such as a mixture of times of high or low values often preceded or followed by times when IS481 was not detected) is similar to different to the rest of the cohort (in contrast to those who have a definitive positive NP sample during a symptomatic visit). The main results are primarily a descriptive analysis of these 8 mother/infant pairs with little statistical analyses or additional support.

      The authors do not provide evidence or detail about what is known about the variability in IS481 CT values, amongst individuals, or over time, or pre/post vaccination. Without this information, it is not clear how informative some of this variability is versus how much variability in these values is expected. I think particularly in Figure 1, how many of the individuals have periods between times when IS481 evidence was observed when it was not observed, is concerning that these data (at this granular a level) are measuring true infection dynamics. Adding in additional information about the distribution and patterns of these values for the other cohort members would also provide valuable insight into how Figure 1 should be interpreted in this context. As it stands, the authors do not provide sufficient interpretation and evidence for having relevant infection arcs.

      It appears that Figure 2A was created using only 8 data points (from the infant data values). If so, this level of extrapolation from such few data points does not provide enough evidence to support to the results in the text (particularly about evidence for fade-in/fade-out population-level dynamics). Also, in Figure 2, it is not clear to me the added value of Figure 2C and the main goal of this figure.

      The authors have created a measure called, evidence for infection (EFI), which is a summary measure of their IS481 CT values across the study. However, it is not clear why the authors are only considering an aggregated (sum) value which loses any temporality or relationship with symptoms/antibiotic use. For example, the values may have been high earlier in the study, but symptoms were unrelated to that evidence for infection - or visa versa. This seems to be an important factor - were these possible undiagnosed, asymptomatic, or mild symptomatic pertussis infections? It is not clear why the authors only focus on a sum value for EFI versus other measures (such as multiple values above or below certain thresholds, etc.) to provide additional support and evidence for their results.

      It is not clear why the authors have emphasized the novelty and large proportion of asymptomatic infections observed in these data. For example, there have been household studies of pertussis (see https://academic.oup.com/cid/article-abstract/70/1/152/5525423?redirectedFrom=PDF which performed a systematic review that included this topic) that have also found such evidence. While cross-sectional surveys may be commonly used in practice, it is not clear that there is no other type of study that provides any evidence for asymptomatic infections. Further, it is not clear why the authors refer to widespread asymptomatic pertussis when a large proportion of individuals with evidence for pertussis infection had symptoms. Would it not be undiagnosed pertussis if it is associated with clinical symptomatology?

    5. Evaluation Summary:

      Overall the reviewers were positive about this manuscript and the importance of this analysis being in identifying the role of asymptomatic transmitters in populations. There are some revisions that will be required and a number of areas for additional analyses and clarifications that would help the reader better put this manuscript in context.

      (This preprint has been reviewed by eLife. We include the public reviews from the reviewers here; the authors also receive private feedback with suggested changes to the manuscript. Reviewer #3 agreed to share their name with the authors.)

    1. Author Response to Public Reviews

      Reviewer #2 (Public Review):

      []... A somewhat puzzling point is that the authors emphasize that their proposed frame work explains diminishing-return and increased-costs epistasis. Diminishing return has been described as a "regression to the mean effect" of sorts in Draghi and Plotkin (2013) for the NK model, and it was argued that a similar regression effect applies to a broad category of fitness landscapes in Greene and Crona (2014). Moreover, "increased-costs epistasis" is likely to apply broadly as well with a similar argument also for landscapes that fall outside the category discussed by in the manuscript (an example is in the Recommendation section). On the other hand, a major strength of the manuscript is that it provides a superior quantitative precision, and some quantitative understanding for when one can expect diminishing returns and increased costs epistasis (that should be emphasized more in my view).

      We thank the reviewer for bringing the above two references to our attention. We have added the two refs and a statement in the Discussion (line 472-476 in RM) to emphasize the above.

      [...] From a conceptual point of view, the locus specific framework, as well as the historical contingency discussion are valuable contributions. The fact that the author could construct a model (the CN model) that satisfy their minimal contingency condition is very interesting as well.

      The weakness of the manuscript is the presentation of the work, especially for a general audience. More context and background, explanations of quantitative results and references would help. There are also a few cases of unclear claims and confusing notation (SSWM seems to be assumed without that being stated, the notation for Fourier coefficients is unclear in some cases) and the text has some other minor issues. Fortunately, a limited effort (in terms of time) would resolve the problem, and also improve the prospects for high impact.

      We thank the reviewer for the detailed comments.

    2. Reviewer #3 (Public Review):

      The proposed model is a variation on existing probabilistic fitness landscapes with a number of novel ingredients that are crucial for explaining the observed patterns. The model successfully accounts for the experimental results and makes new predictions, some of which are confirmed by the analysis of existing data. It also provides a coherent picture of the dynamics of adaptation that matches experimental observations. Overall, this is a conceptually deep and potentially highly influential study.

      I see only one major issue that requires clarification. This concerns the distinction between the directed mutation scheme (leading to Eqs.(3,4) in the main text) and the symmetric version (Eqs.(5,6)).

    3. Reviewer #2 (Public Review):

      The authors analyze diminishing-return (beneficial mutations likely having a small effects for genotypes of high fitness) and increasing-costs epistasis (deleterious mutations likely having large effects for genotypes of high fitness). A framework is proposed where the fitness of genotype after a mutation at a single locus can be estimated from (i) the additive effect at the locus and (ii) a component determined by the fitness of the original genotype at the locus, referred to as "global epistasis". The concept of locus-specific global epistasis is new, even if variants of global epistasis have been discussed in published work. The manuscript shows that the locus specific assumption is empirically justified and it provides applications to a study of yeast.

      Regression effects (diminishing returns and increasing costs epistasis) are quantified under the assumption that epistasis can be considered noise (idiosyncratic epistasis). The result is expressed in terms of Fourier representation for the fitness of a genotype, and the proof depends on a locus-specific analysis of correlations derived from the Fourier representation. In particular, the author clarify under what circumstances one can expect the regression effects. Several conclusions are very precise, and numerical results are provided as a complement to the analytical work.

      The second part of the manuscript concerns historical contingency. Absence of contingency means that the expected fitness effect of new mutation for a genotype is independent of previous substitutions. A condition for minimal contingency in provided, and a new model (The Connected Network model, or CN-model) which satisfies is introduced.

      A somewhat puzzling point is that the authors emphasize that their proposed frame workexplains diminishing-return and increased-costs epistasis. Diminishing return has been described as a "regression to the mean effect" of sorts in Draghi and Plotkin (2013) for the NK model, and it was argued that a similar regression effect applies to a broad category of fitness landscapes in Greene and Crona (2014). Moreover, "increased-costs epistasis" is likely to apply broadly as well with a similar argument also for landscapes that fall outside the category discussed by in the manuscript (an example is in the Recommendation section). On the other hand, a major strength of the manuscript is that it provides a superior quantitative precision, and some quantitative understanding for when one can expect diminishing returns and increased costs epistasis (that should be emphasized more in my view).

      From a conceptual point of view, the locus specific framework, as well as the historical contingency discussion are valuable contributions. The fact that the author could construct a model (the CN model) that satisfy their minimal contingency condition is very interesting as well.

      The weakness of the manuscript is the presentation of the work, especially for a general audience. More context and background, explanations of quantitative results and references would help. There are also a few cases of unclear claims and confusing notation (SSWM seems to be assumed without that being stated, the notation for Fourier coefficients is unclear in some cases) and the text has some other minor issues. Fortunately, a limited effort (in terms of time) would resolve the problem, and also improve the prospects for high impact.

    4. Reviewer #1 (Public Review):

      One of the most consistent and thus surprising patterns revealed by experimental evolutionary studies is the observation of a very predictable pattern of increase in fitness of replicate populations. The fitness increase tends to be very rapid at the beginning and then slows down but continues to increase for tens of thousands of generations (e.g. the Lenski LTEE). The studies from the Desai group specifically two: one by Kryazhmisky et al and one by Jonnson et al further established that the pattern of decrease in the fitness gain is due to really counterintuitive patterns of global epistasis. In particular it is not due to the evolution running out of adaptive mutations but rather to the fact that the same adaptive mutations are less beneficial on fitter backgrounds (Kryazhmisky et al). Johnson et al further found that the fitter backgrounds are more fragile with deleterious mutations being more deleterious on fitter backgrounds. All of this is rather bizarre at first glance as the microscopic epistasis is known to be highly idiosyncratic.

      This paper, along with one by Lyons et al (Nat Ecol Evol 2020), resolves this paradox and shows that the observed pattern of global epistasis is in fact directly dependent on microscopic epistasis being widespread, involving multiple loci - with most parts of the organisms being connected in an "everything affecting everything" pattern, and being idiosyncratic. The Lyons et al paper focused on the data showing the epistasis is in fact idiosyncratic - their key observation - and provided an intuition for why such widespread idiosyncrasy would result in the observed pattern of global epistasis. Although neither set of authors seems to use this term, this should fit the notion of the Anna Karenina principle: "All happy families are alike; each unhappy family is unhappy in its own way." That is, in order for the right things to happen, most things need to go right, but in order for things to fail, anyone of many such things can go wrong. The more adapted systems are more fragile and more difficult to improve, because in both cases it is easier to disrupt what is already working.

      The Reddy and Desai paper takes this notion and develops a very simple and transparent quantitative theory of this principle that generates specific quantitative predictions about the dynamics of adaptation that we, as a field, will spend considerable time now testing. The work has the potential to become a seminal paper in the field.

    5. Evaluation Summary:

      The authors consider Darwinian evolution for large systems, with a main focus on how adaptation changes over time. Frequently observed patterns of declining adaptability for a population in a new environment are discussed, i.e., that fitness tends to increase fast initially and then at a slower rate. Another topic is historical contingency in adaptation. A condition for minimal contingency is provided, and a new model (the connectedness model, or CN model) is introduced accordingly. The manuscript is innovative, conceptually interesting, and provides quantitative precision beyond most related studies in the field. However, the presentation currently does not work well for a general audience.

      (This preprint has been reviewed by eLife. We include the public reviews from the reviewers here; the authors also receive private feedback with suggested changes to the manuscript. Reviewers #1, #2, and #3 agreed to share their names with the authors.)

    1. Author Response to Public Reviews

      Reviewer #1 (Public Review):

      [...] If authors wishes to opt for highlighting NLR analysis, the following suggestions would help (9-14).

      1) Earth mover distance (EMD) has been applied to identify a locus with alternative polyadenylation. What is the basis of using EMD value of 25 as a cutoff? According to Figure 4 B,D, EMD can range from 0-4000. One would also wonder if the distance unit equals bp. In addition, EMD values of some genes (e.g. FPA and representative NLRs) can be specified in the main dataset so that significance of the cut-off values shall be appreciated.

      We found that for some very highly expressed loci, we were able to detect statistically significant changes in poly(A) site usage with very small effect sizes which were unlikely to represent functionally important changes. An EMD threshold was therefore required for removing these small effect size loci. The EMD is informally described as the minimum amount of “work” required to turn one distribution into another – it represents the percentage of the distribution moved multiplied by the distance moved. For example, an EMD of 25 could describe a situation where 10% of the transcripts have shifted by 250 nt, or 50% of the transcripts have shifted by 50 nt. A threshold of 25 gives a good trade-off between the percentage of proximal/distal site switching, and the distances between sites (since larger changes in distance are more likely to result in functional changes). We have included EMD values for example NLRs in the main text to give an idea of effect sizes of these genes.

      2) Regarding the manual annotation of alternatively polyadenylated NLR genes (L1160-): Genes with alternative polyadenylation were identified and the ending location was supported when there were minimum four DRS reads. It would be relevant to provide the significance of "the four" based on read coverage statistics, for example, with average read number covering an annotated NLR transcript with the specification of an average size.

      We have previously demonstrated that both Helicos and Nanopore DRS reads are able to capture the true 3’ ends of single RNA molecules. However, both techniques have some technical limitations which may result in artefacts – for example, the over-splitting of nanopore signal from a single molecule into multiple reads, or the incorrect alignment of low-quality basecalls at the ends of reads. For this reason, and also to standardise our approach to manually identifying FPA-regulated NLRs, we developed a standard operating procedure. We chose to identify poly(A) sites using a minimum of four nanopore read alignments, as a trade-off between sensitively detecting genuine alternative polyadenylation events, and ignoring events caused by poor alignment of low-quality reads or over-splitting. We also looked for evidence of events seen in nanopore data in other sequencing datasets, particularly the Helicos DRS alignments, to corroborate our findings. We have improved the language of the relevant methods section to clarify this.

      3) Figure 4E shows that Ilumina-RNAseq dataset detects the number of loci with a different order of magnitude compared with the other two methods. Reference-agonistic pipeline shall be appreciated, however, the method engaged might have elevated the counting of paralogous reads mapped to different locations than they should be. Along with paralogous read collapsing, this is always a problem with tandemly repeated genes, such as NLRs by and large. For example, NLR paralogs in a complex cluster with conserved TIR/NBS but diversified LRRs would have higher coverage in the first two domains but drop in the diversified parts. The authors need to specify their bioinformatic consideration to avoid such problems.

      Although the tone of the Illumina read section was careful and the main 3'-end processing conclusion was made by nanopore DRS, the authors are also advised to clearly state the limitation of using Illumina-RNAseq to address alternative polyadenylating sites at the beginning of the section, for example what to be maximally taken out from Figure 4 E and 4F. This will give relative weights to each dataset generated by different methods. One advantage of using Illumina data would be that the expression level changes can be associated with changes in processing, it seems.

      The reviewer is correct that multimapping reads are an issue at NLR genes and may lead to uneven coverage of uniquely and multi-mapped reads when some regions of a gene are divergent, and others are not. Although it is the relative change in coverage of exons or expressed regions which is important in DEXSeq analysis (rather than absolute coverage), it is possible that changes in processing that cause relative expression changes at one NLR locus may have impacts on the relative expression of multimapping regions at other paralogous NLR loci. We addressed this issue when quantifying the expression of expressed regions by running featureCounts using the –primary option that only counts primary alignments, but we failed to mention this in the methods. We have updated the methods to clarify this.

      4) At the RPP7 locus, At1g58848 is identical in sequences with At1g59218 as is At1g58807 with At1g59214 (two twins in the RPP7 cluster by tandem duplication). It would be good to check whether the TE At1g58889 readthrough indeed occurs in the sister duplicate with a potential TE in the downstream of At1g59218. If not, it can be used as an example of duplication and neofunctionalization through an alternative polyadenylation site choices.

      The tandem duplication of AT1G58848 and AT1G58807 in Col-0 makes the RPP7 locus complex to analyse even with long read sequencing data. We find that even with nanopore DRS data, nearly all reads mapping to AT1G58807 multimap at AT1G59124. There is clear evidence of exonic proximal polyadenylation in these transcripts, but the locus of origin is not determinable. In the case of AT1G58848 and AT1G59218, we find a mixture of uniquely mapping and multimapping reads at both genes, and both genes have uniquely mapped reads indicating exonic proximal polyadenylation in 35S::FPA, and chimeric RNA formation in fpa-8. This suggests that RNA processing of these loci is very similar, and so we opted only to show AT1G58848 as an example. Due to the much shorter length of Helicos DRS reads, we applied much more stringent filtering to remove incorrectly mapping or multimapping reads, meaning that there were not enough uniquely mapped reads at the AT1G58848 and AT1G58807 loci to perform Helicos EMD tests. We have updated the text to explain this more clearly.

      5) HMM search shall be revisited to confirm if they are to detect the TIR domain. Given that a large proportion of NLRs in A. thaliana carry TIR at their N-terminal ends and the specified examples included TIR-NLR, it is surprising to see no TIR domain in Figure 5.

      The absence of the Interpro annotation from Figure 5C (now Figure 4A in the revised manuscript) is a mistake on our part rather than due to its absence from the Interpro annotation. We have now corrected the figure and all other gene tracks to make sure that all Interpro annotations are shown.

      6) L659-668: how does the new data relate to the previously TAIR annotated At1g58602.1 vs At1g58602.2 (Figure 6, Inset 1)? It would be good to see these clearly stated in the main text as compared to newly identified ones. From the nanopore profiling, At1g58602.2 appears to be the dominant form.

      AT1G58602.2 from the Araport11 annotation contains the most distal annotated isoform of RPP7, whilst AT1G58602.1 contains a slightly more proximal 3’UTR. The reviewer is correct that AT1G58602.2 is the more dominant isoform in our Col-0 data. We have added a sentence that acknowledges this to the section on RPP7 3’UTR isoforms.

      7) One thing to note is that in the overexpressor of which Hiks1 R is suppressed, there was hardly any At1g58602.1 produced in addition to the large reduction of At1g58602.2. Thus, relative functional importance of the two transcripts shall be discussed in line with the Hpa resistance data. Accordingly, L740-741 phrasing shall be revised to include the possibility of absolute or relative "depletion" of functional transcript(s) contributing to the compromise in Hpa resistance.

      While we agree that, in principle, the change in relative expression of the two annotated distal isoforms of RPP7 could have functional consequences, given that both of these isoforms can encode a protein, the functional impact of this relative change is much less likely to be the cause of the loss of Hpa resistance in FPA overexpressing plants, compared to the larger change in exonic proximal polyadenylation, which produces transcripts which are unlikely to express protein. Given that we have not demonstrated conclusively that it is the increase in exonic polyadenylation of RPP7 that causes reduced immunity in 35S::FPA:YFP, we have made the language of our conclusions in the section “FPA modulates RPP7-dependent, race-specific pathogen susceptibility” more careful.

      8) It would be necessary to state in the main text the implication of phosphorylation on the two Ser residues on Pol II at L245. A clear description distinguishing the effect of the two phosphorylation and the specificity of the antibodies is desirable, as the data was interpreted as if the two sites made differences, such that Ser2 was heavily emphasized (e.g. subtitle). Albeit low level, Ser5 data also shows an overlap with FPA ChIP-seq coverage at the 3' end. If there is a statistical significance to be taken account to interpret the coverage, please state it. Given that elongation occurs progressively, I wonder how much should be taken out from the distinction.

      It is well established in the literature that Pol II phosphorylated at Ser5 of the C-terminal domain is a hallmark of initiating and elongating Pol II, whilst Ser2 is a hallmark of terminating Pol II (Phatnani and Greenleaf, 2006). This was first established in yeast, where it was shown that Ser5 phosphorylation is necessary for the recruitment of the mRNA capping machinery (Cho et al., 1997; Ho and Shuman, 1999). The yeast homolog of 5’-to-3’ exonuclease which is required for termination (West et al., 2004), was also shown to interact specifically with Pol II phosphorylated at Ser2 via an accessory protein (Kim et al., 2004). Therefore, comparing FPA occupancy to relative levels of Ser2 and Ser5 phosphorylated Pol II is an important validation of the location of FPA binding. We have added a sentence to the relevant Results section describing why CTD phosphorylation varies through the gene body. Arabidopsis ChIP-seq experiments from the literature which profile all Pol II (not just phosphorylated versions) indicate that in Arabidopsis, the highest occupancy is over the terminator (Yu et al., 2019). This may explain why there is also a peak of Ser5 at the terminator (i.e. if there are low levels of Ser5 in a region of higher occupancy, or if there is cross-reactivity of the antibody with Ser2 or unphosphorylated Pol II).

      9) Figures presentation for RPP4 and RPP7 are great in detailing the FPA-dependent NLR transcript complexity. To make the functional link more evident, the authors may consider bringing up parts of the Figure 5-supplement to a main Figure to detail the revised annotation of NLRs. Given recent advances in NLR structure and function studies, extra domain fusion, fission and truncated versions of NLRs require a great deal of attention. For example, potential functional link to the NMD-mediated autoimmunity and revised annotation of At5g46470 (RPS6) needs a clear visual guidance preferably with a main figure (Figure 5-Supplement 3).

      We thank the reviewer for this comment, and we agree that these figures deserve to be made more visible. This is one of the reasons that we have chosen to submit our manuscript to eLife, since supplementary figures are displayed alongside linked main text figures in an image slider which allows easy access to each gene track. We believe that this will also make it much easier to examine individual gene tracks, without having to compress them to fit them into a single figure panel. However, we do agree that RPS6 is particularly interesting and deserves to be a main figure. We have therefore split the NLR figure into two new figures and incorporated RPS6 gene tracks into the first of these.

      10) The section "FPA controls the processing of NLR transcripts" includes dense information and can be broken down to several categories. To this end, Supplement File 3 (NLR list) shall be revised to deliver the categorical classes and further details and converted to a main table.

      For NLR audience, for example, it would be important to associate the information to raw reads to assess where the premature termination would occur. At least, the ways to retrieve dataset or to curate the termination sites shall be guided.

      On the contrary, there is no need to include other genes in Figure 4 Sup4-8 under this section. They are not NLRs.

      We have created main-text tables for each of the three classes of FPA-regulated NLR genes, as suggested by the reviewer. We have also removed the examples of non-NLR genes regulated by FPA from the paper, to streamline the story. All the datasets analysed in the study are already available on ENA with database identifiers provided in the Data Availability section to guide readers.

      11) Figure 7 and IBM1 section can be spared to the supplement.

      We have followed the reviewer’s suggestion and this figure now appears as Figure 2 supplement 4. We have moved the results section on IBM1 up to join it with the global analysis of FPA function in RNA processing.

      12) The list of "truncated NLR transcripts" in particular, either by premature termination within protein-coding or with intronic polyadenylation, should be made as a main table. The table can be preferably carrying details in which degree the truncation is predicted to be made. With current sup excel files, it is difficult to assess the breadth of the FPA effect on the repertoire of NLRs and their function. This way, functional implication of differential NLRs transcriptome can be better emphasized.

      We have followed the reviewer’s suggestion here and prepared this information into main-text tables 1-3, including predictions of the functional consequences for intronic/exonic poly(A) site choice.

      13) FPA-mediated NLR transcript controls, as to promote transcript diversity, is expected to exert its maximum effect if FPA level or activity is subject to the environmental stresses, such as biotic or abiotic stresses. The discussion on effectors targeting RNA-binding proteins (L909-918) is a great attempt in broadening the impact of this research. In addition, if anything is known to modulate FPA activity, such as biotic or abiotic stresses or environmental conditions, please include in the discussion.

      We are not aware of any literature reporting the modulation of FPA activity by biotic or abiotic stresses. This is certainly an interesting question which we would like to examine. However, the analysis of FPA activity is complicated by a number of factors. RNA-level expression is often used as a proxy for overall activity. The RNA-level expression of FPA is not necessarily indicative of FPA activity, however, since the proximally polyadenylated isoform of FPA does not produce functional FPA protein. To get a clear picture of FPA activity during infection will therefore require high-depth Illumina RNA-Seq, nanopore direct RNA sequencing or proteomics analysis.

      14) NLR transcript diversity as source of cryptic variation contributing to NLR "evolution" is an interesting concept, however, evolutionary changes require processes of genic changes affecting transcript layers or stabilizing transcriptome diversity. In the authors' proposition in looking into accessions, potential evolutionary processes can be further clarified.

      We agree with the reviewer that a species-wide transcriptome analysis would provide an invaluable insight into how transcription can affect evolutionary changes. For example, we find that NLRs with high levels of allelic diversity are more likely to be regulated by proximal polyadenylation in Col-0, and so a species-wide approach will reveal whether this regulation is conserved or tailored to environmental conditions. An integrative analysis of genomic and transcriptomic data will also help to identify whether chimeric RNAs present in some accessions are found as retrotransposed genes in others. We have added these specific example experiments to the relevant discussion section.

      Reviewer #2 (Public Review):

      [...] Overall, it is a potentially important research. The data is rich and could be useful. However, the biological stories described are not thoroughly supported by the data presented, especially when the authors tried to touch on several aspects without some important validations and strong connections among different parts. Some special comments are provided below:

      1) The title of this manuscript is "The expression of Arabidopsis NLR immune response genes is modulated by premature transcription termination and this has implications for understanding NLR evolutionary dynamics". Therefore, the readers will expect some functional connections between the FPA and the novel NLR isoforms due to premature transcription termination. However, the transcript levels of plant NLR genes are under strict regulation (e.g. Mol. Plant Pathol. 19:1267). Since the functions of NLR genes are related to effector-triggered immunity, it is more important to study the function of FPA on premature transcription termination when the plants are challenged with pathogens. In this manuscript, most transcript analyses are based on samples under normal growth conditions. It is therefore a weak link between the genomic studies and the functional aspects. For instance, it is more important to identify unique NLR isoforms produced upon pathogen challenges that are regulated by FPA. The authors will need to provide some of these data to fill this gap.

      To clarify, the title of this manuscript is not as stated here by the reviewer but is “Widespread premature transcription termination of Arabidopsis thaliana NLR genes by the spen protein FPA”. We do indeed describe a functional pathogen test to examine the functional impact of FPA. We show that overexpression of FPA reduces the functional expression of RPP7 transcripts, and that this impacts upon the ability of plants to resist Hpa-hiks1. We agree with the referee that it will be very interesting to investigate, not just FPA, but changes in 3’ processing during infection by different pathogens. However, key questions on NLRs extend to how they function, how they evolve, how they trigger hyperimmunity and how they are controlled to limit impact on fitness, all of which may be impacted by the control of RNA 3’ processing.

      2) Since the function of FPA is to regulate NLR immune response genes, we should expect a change in plant defense phenotype in FPA loss-of-function mutants. Could the authors provide more information on this? On the contrary, in line 728 of this manuscript, the authors found that at least for some pathogens, "loss of FPA function does not reduce plant resistance". It is not consistent with the hypothesis that FPA is important to regulate NLR immune response genes.

      There is a straightforward misunderstanding here, possibly because our text in the relevant section was not sufficiently clear.

      We tested the impact of different activity levels of Arabidopsis FPA on NLR function by investigating the NLR, RPP7. We chose RPP7 because features of its function and regulation are relatively well characterised. RPP7 provides disease resistance to the oomycete pathogen Hyaloperonospora arbidopsidis (Hpa) strain Hiks1. The reference Arabidopsis accession, Col-0, encodes a functional RPP7 gene and hence is resistant to Hpa-Hiks1 infection. Not all Arabidopsis accessions are resistant to all Hpa strains. For example, the Duc-1 and Ksk-1 accessions have been reported as having susceptibility to Hpa-Hiks1 infection, likely due to the lack of a functional RPP7 gene (Lai et al., 2019). It was for this reason that we incorporated the Ksk accession as an infectionsensitive positive control accession in our pathogen tests.

      The question we were addressing was: Does FPA-dependent premature cleavage and polyadenylation in RPP7 exon 6 compromise RPP7 function? To address this question, we therefore applied Hpa-Hiks to our different genetic lines. Neither Col-0 nor the fpa-8 mutant (which is in the Col-0 genetic background) were sensitive to infection. This is consistent with our hypothesis because the poly(A) site used in exon 6 in Col-0, is used significantly less in fpa-8. Hence, there is no compromise in the expression of full-length RPP7 in fpa-8 mutants. As Col-0 is already resistant to Hpa-Hiks1, we would therefore expect fpa-8 to also be resistant and indeed, this is what we found.

      This was also true when we tested an independent allele, fpa-7, that is also in the Col-0 background. However, when we tested the line that was over-expressing FPA, which was introduced into an fpa-8 background (and hence, ultimately Col-0), we found that resistance was lost and Hpa-Hiks1 was able to infect these plants.

      Therefore, the findings from this experiment are completely consistent “with the hypothesis that FPA is important for regulating NLR immune response genes, and the observation that premature exonic termination of RPP7 caused by FPA has a functional consequence for Arabidopsis immunity against Hpa-Hiks1.” We have clarified the text in this section to make our hypothesis and findings clearer.

      3) Furthermore, the authors mentioned in lines 729-731 "Greater variability in pathogen susceptibility was observed in the fpa-8 mutant and was not restored by complementation with pFPA::FPA, possibly indicating background EMS mutations affecting susceptibility." Does it mean that fpa-8 contains other mutations? Will these additional mutations complicate the results of the RNA processing? Could the authors outcross the fpa-8 mutation to a clean background?

      Given that the fpa-8 mutant was generated using EMS treatment, it is probable that it does contain other mutations besides the one that removes FPA function (this is likely to be the case with most mutants – whether they are generated with EMS or T-DNA insertions). These mutations are likely to be the source of the slightly greater variability in susceptibility to Hpa-hiks1 in fpa-8 compared to the fpa-7 T-DNA mutant. These potential off-target mutations are unlikely to be the cause of the RNA 3’ processing changes seen in the fpa-8 mutant, however, for three reasons: (i) we have previously published Helicos DRS data from fpa-7 mutants which shows that they have the same RNA 3’ processing defects as fpa-8 mutants, for example at PIF5 and IBM1 (Duc et al., 2013) indicating that changes in 3’ processing in fpa-8 and fpa-7 are caused by the common loss of FPA function; (ii) our Illumina RNA-Seq data for the FPA complementing line shows that an FPA transgene restores 3’ processing effects seen in the fpa-8 mutant, for example at PIF5, but does not restore the variability in susceptibility of fpa-8 to Hpa-hiks1 (Figure 6C) (iii) many of the genes with altered poly(A) site choice in fpa-8, including RPP7, show reciprocal changes in processing in the FPA overexpressing line. Taken together, these findings strongly indicate that the loss of FPA is what causes altered poly(A) site choice in an fpa-8 mutant.

      4) In line 318, the authors found 285 and 293 APA events in the fpa-8 mutant and the 35S::FPA:YFP construct respectively, but only 59 loci (line 347) exhibited opposite APA events (about one fifth). The low overlapping frequency suggests that some results could be false positive.

      The level of reciprocal alternative polyadenylation cannot be used to determine false positive rate. For a gene to show reciprocal effects, when comparing the results of fpa-8 vs Col-0, and 35S::FPA:YFP vs Col-0, requires at least two poly(A) sites to be used at high levels in Col-0. For example, at RPP7, high levels of proximal exonic polyadenylation are detectable in Col-0, meaning that a shift to distal site usage is detectable in fpa-8, as well as the shift to proximal site selection in 35S::FPA:YFP. However, there are many loci where this is not the case. For example, the abundant chimeric RNAs found at the PIF5 locus in fpa-8 are undetectable in Col-0, meaning that overexpression of FPA has no effect on PIF5 when compared to Col-0. Consequently, PIF5 is not amongst those genes with reciprocal regulation, despite the effect of FPA on PIF5 RNA processing being very clear in multiple datasets.

      5) In line 732-736: "In contrast, 35S::FPA:YFP plants exhibited a similar level of sporulation to the pathogen-sensitive Ksk-1 accession (median 3 sporangiophores per plant). This suggests that the premature exonic termination of RPP7 caused by FPA has a functional consequence for Arabidopsis immunity against Hpa-Hiks1." It is contradictory to the statement in line 728 that "loss of FPA function does not reduce plant resistance". Is it possible that overexpression of FPA:YFP had generated an artificial condition that is not related to the natural function of FPA?

      There is a misunderstanding here that may be due to the wording that we used in this section and we explain this above. Col-0 is resistant to Hpa-Hiks1 because it has a functional RPP7 gene. In fpa-8 mutants, the expression of full-length RPP7 transcripts is not compromised relative to Col-0 and hence it is as resistant to Hpa-Hiks1 as Col-0. In contrast, 35S::FPA:YFP promotes the use of a poly(A) site within exon 6, reducing the amount of full-length RPP7 detected. This poly(A) site is used in the Col-0 wildtype line but is not detectably selected in the loss-of-function fpa-8 mutant line. Together, these findings reveal that this poly(A) site is chosen in the Col-0 reference strain and that this requires FPA. Therefore, the selection of this site is the natural function of FPA and not simply generated by an artificial condition. We have re-worded the text in this section to clarify this misunderstanding.

      6) The fpa-8 mutant has a delayed flower phenotype (Plant Cell 13:1427). Could the 35S::FPA:YFP fusion protein construct reverse this phenotype and the plant defense response phenotype? It is important to interpret the data when the 35S::FPA:YFP construct was used to represent the overexpression of FPA.

      As we report in the Materials & Methods section, a line expressing 35S::FPA:YFP was obtained from Caroline Dean. Published evidence that this line complements the late flowering phenotype of fpa-8 is provided in the corresponding publication (Baurle et al., 2007) as Figure S5. In our growth conditions, these lines flower early like wild-type compared to the very late flowering of fpa-8. The late flowering phenotype of fpa-8 mutants is explained by elevated levels of the floral repressor FLC. The Illumina RNA-Seq, Helicos DRS and nanopore DRS data that we release here all show reduced levels of FLC in the 35S::FPA:YFP line compared to fpa-8 consistent with complementation.

      7) Under the subheading "FPA co-purifies with the mRNA 3' end processing machinery". The results were based on in vivo interaction proteomics-mass spectrometry. MS prompts to false positives and will need proper controls and validations. Have the authors added the control of 35S:YFP instead of just the untransformed Col-0? At least for the putative interacting partners in Figure 1A, could the authors perform validations of some important targets, using techniques such as reverse co-IP, or to show direct protein-protein interaction between FPA to a few of the important targets by in vitro pull-down, BiFC, or FRET, etc.

      FP fusions are widely used in IP experiments, but we are not aware of any study that reports 3’ processing factors to be recurrent contaminants in such experiments. We had anticipated submitting an additional proteomics study at around the same time as this study but aspects of this additional work were disrupted by control measures associated with Covid-19. What we do show here, is that an orthogonal approach (ChIP) with different antibodies (anti-FPA) also localises FPA to the 3’ end of Arabidopsis genes together with Pol II phosphorylated on Ser2 of the CTD. These orthogonal datasets are therefore consistent with our interpretation that FPA co-purifies with Pol II and multiple factors involved in the processing of RNA 3’ ends and are also supported by our transcriptomic analyses of fpa mutants and overexpressors which have altered 3’ processing.

      8) In Fig. 3, the data show that the last exon of the FPA gene is missing in the FPA transcripts generated from the 35S::FPA:YFP construct. Will the missing of this exon affect the function of the transcript and the encoded protein?

      As we state in the Materials & Methods section, this line was obtained from Caroline Dean and the details of its construction were previously described (Baurle et al., 2007). The transgene construct has a different promoter (CaMV 35S) and associated 5’UTR sequence and the sequence downstream of the stop codon is replaced by a transgene-derived 3’UTR. Consequently, these regions of the transgene-derived FPA do not align to the Col-0 reference. We have added new text to the Figure legend to clarify this point. Given that the 35S::FPA:YFP transgene complements the flowering time phenotype of fpa-8 mutants, and causes widespread changes in 3’ processing, there is no evidence that the lack of the canonical 3’UTR has a deleterious impact on the function of the FPA protein.

      9) The function of FPA is still ambiguous. There was a quantitative shift toward the selection of distal poly(A) sites in the loss-of-function fpa-8 mutant and a strong shift to proximal poly(A) site selection when FPA is overexpressed (35S::FPA:YFP) in some cases (Fig. 3, Fig. 5, Fig. 8). But the situation could be kind of reversed in other cases (Fig. 6). What is the mechanism behind it?

      Using different sequencing technologies, we clearly show that the predominant effect of FPA is to promote proximal poly(A) site selection and indeed that these cases are associated with the largest effect sizes. The mechanism involved is not studied here. One possibility is that genes which display an increase in distal polyadenylation when FPA is overexpressed are indirect targets of FPA. This would be unsurprising given that FPA regulates the alternative polyadenylation of a number of other factors involved in 3’ processing. Another possibility is that FPA can associate with different complexes of 3’ processing factors at different locations, resulting in opposing effects on 3’ processing. A future goal for us, in dissecting the mechanism by which FPA mediates NLR transcription termination will be to relate poly(A) site choice to direct RNA binding site interactions mapped by iCLIP, for example.

      10) Under the subheading: "The impact of FPA on NLR gene regulation is independent of its role in controlling IBM1 expression". IBM1 is a common target of FPA and IBM2. Indeed, FPA and IBM2 share several common targets (Plant Physiol. 180:392). It may be more meaningful to compare the impact of FPA and IBM2 on NLR gene instead.

      IBM2/ASI1 is an RNA and chromatin binding protein that regulates the expression of IBM1 by promoting elongation through intronic heterochromatic marks, as part of a complex with EDM2 and AIPP1. As a result, edm2, ibm2, and aipp1 mutants fail to produce full length IBM1 transcripts, resulting in phenotypes similar to the ibm1 mutant. Mutations in FPA were recently identified as suppressors of the phenotypes of ibm2 mutants. This is likely because FPA promotes the proximal polyadenylation of IBM1 transcripts.

      Since FPA regulates the proximal polyadenylation of IBM1, we asked if it was possible that some of the targets of FPA overexpression identified by nanopore and Helicos DRS were caused by indirect effects on chromatin state resulting from a decrease in full length IBM1 expression. However, there is no indication that FPA acts to promote alternative polyadenylation of IBM2. We therefore consider it unlikely that proximal polyadenylation of NLRs in the 35S::FPA:YFP line is caused by indirect effects on IBM2.

      11) In lines 423-425, the authors described "Consistent with previous reports, the level of mRNA m6A in the hypomorphic vir-1 allele was reduced to approximately 10% of wild-type levels (Parker et al., 2020b; Ruzicka et al., 2017) (Figure 4 - supplement 3)." This data could not be found.

      We have re-checked the submitted article. These data are indeed there: page 46, line 1510 and correctly labelled as Figure 4 supplement 3. In the revised manuscript these data are included as Figure 2-figure supplement 3, and the raw data is also available as Figure 2 source data 11.

      12) In line 426: "However, we did not detect any differences in the m6A level between genotypes with altered FPA activity." Which data is this statement referring to?

      This statement refers to the data in Figure 2-figure supplement 3 of the revised manuscript.

      Reviewer #3 (Public Review):

      [...] One minor complaint is that the authors don't focus on NLRs starting on line 436, and then they have extensive results on NLRs; by the time I got to the discussion, I'd forgotten about the early focus on the M6A. While the first part of the article is necessary, I would suggest a more concise results section to give the paper more focus on the NLR control (since that is emphasized in the abstract and the title of the manuscript).

      We thank the reviewer for their comments. We agree that the paper is dichotomous due to the initial focus on the function of FPA and subsequent identification of the effect on NLRs. We have reduced the length of the initial results sections, particularly the proteomics results, so as to come to our findings on NLR genes more quickly.

    1. Reviewer #3 (Public Review):

      Yang et al. build on earlier studies from the Zheng lab and show in tissues that (i) the Hedgehog (Hh) co-receptor Ihog mediates homophilic interactions that enable cytoneme bundling and (ii) that Ihog-Hh interactions are stronger than and displace Ihog-Ihog interactions during signaling, consistent with biochemical and cell-based studies of relative affinities of Ihog for itself or Hh. These studies are bolstered by modeling and experiments showing co-localization of Dally and Dlp, which presumably supply the heparan sulfate chains needed to promotes homo- and hetero-philic interactions involving Ihog. I found the studies convincing, interesting, and an important extension of biochemical/cellular work on Ihog to tissue behavior.

    2. Reviewer #1 (Public Review):

      This study builds upon previous findings by the authors and others that the Hedgehog (Hh) co-receptor Ihog not only binds Hh to trigger Hh signal transduction, but also engages trans-homophilic interactions in cell-cell adhesion. Using experimental manipulation and mathematical modeling, the authors assessed the role of Ihog trans-homophilic binding in stabilizing cytoneme structure and the relative strengths of Ihog-Ihog and Hh-Ihog binding. These findings led to a model whereby the weaker Ihog-Ihog trans interaction promotes direct membrane contacts along cytonemes and that Hh-Ihog binding releases Ihog from trans Ihog-Ihog complex. The studies are well designed and executed, and the findings are convincing.

    3. Evaluation Summary:

      This is a well-conceived and well-presented study that sheds light on two critical questions related to Hedgehog signaling, namely, the dual function of the Hedgehog co-receptor Ihog in Hh signal transduction and homophilic adhesion, and the regulation of cytoneme structure.

      (This preprint has been reviewed by eLife. We include the public reviews from the reviewers here; the authors also receive private feedback with suggested changes to the manuscript. Reviewer #3 agreed to share their name with the authors.)

    1. Author Response to Public Reviews

      We thank the reviewers for their careful reading of our work, and their detailed and helpful comments. Their insights have helped us in improving this manuscript. We include their comments and our replies to them below.

      Reviewer #2 (Public Review):

      Line 293, by "comparing the Apo_NE and IB_EQ simulations at equivalent points in time" and perform subtraction "from the corresponding Ca atom from one system to another at 0.05, 0.5, 1, 3, 5ns". It is not clear to me why those time points were chosen? Have authors attempted at validating whether or not the signal from the ligand-binding site has had enough time to propagate across the allosteric signaling pathway? If one considers that the ligand is a spatially localized signal, it requires time to propagate. This is in contrast with the Kubo-Onsager paper cited by authors in which the molecule is responding to a global perturbation such as an external field. However, a local perturbation on one side of the protein will need time to propagate to the other side of the protein (30 angstroms away in this case).

      The time points are chosen to highlight the propagation of signal in the short nonequilibrium simulations. We agree with the reviewer that the signal will take time to propagate; indeed, it evolves over time, as can be seen in the figures and accompanying movies. It is important to emphasise that this is averaged over many trajectories. Some conformational rearrangements will not be fully sampled, as can be seen in Figure 3–Figure supplement 3. It is important to emphasize that the short nonequilibrium simulations are used here to measure the immediate structural response towards a perturbation. The timescale of this response in the nonequilibrium simulation does not correspond to the physical timescale of conformational change induced by/associate with ligand binding. The perturbation here is nonphysical, and the response is rapid. For long simulation times, and as the correlation between the equilibrium and nonequilibrium trajectories is lost, the subtraction technique is no longer useful as the noise arising from the natural divergence of the simulations overcomes the structural response of the system to the perturbation. Thus, this method allows for the identification of the initial conformational changes associated with signal propagation. Also, the difference calculated at any given time point should not be seen in isolation. Instead, it should be compared with the other time points, as it is such a comparison that highlights the cascade of events associated with signal propagation. This is clearly illustrated in Figure 3 supplement 3 and in the movies, where the collective signal from the short nonequilibrium simulations is progressing in a trend that is comparable with the equilibrium simulations. The time evolution of the signal is striking and thought-provoking.

      A simple and naive example is to map out all the bus stops on one's route. 800 simulations between the first and second stop will not be able to provide the locations of other stops. Since authors have used this "subtraction technique" on several other proteins, it would be nice to clarify how this approach works on mapping out signaling propagation perturbed by local ligand binding/unbinding and how to choose the time points for subtraction.

      Analogies can be helpful in understanding the nonequilibrium simulations, some aspects of which are not immediately obvious. One could perhaps think of these nonequilibrium simulations as analogous to striking a bell to see how it rings. The bus stop analogy suggested by the referee is intriguing, and we develop it here.

      In this case, when ‘getting on the bus’ (beginning the simulation), we do not know where the bus is going (i.e. we only knew that we were starting at the allosteric site, so the only thing that we know is the place where we board the bus) or the route it would take to get there. The bus is not travelling on a straight road, and the destination is unknown. We could wend our way slowly by standard equilibrium MD, but we would only reach the first or second stop on the route in the time available, and we would still not know where the bus was going. We would never find out where the bus is going: it takes too long. The nonequilibrium approach is a magic bus! In this approach, as the bus meanders close to its starting point, we suddenly replace the driver. The new driver puts her or his foot on the accelerator and immediate sets off for a new destination, heading away fast from the starting point. The driver is guided by the roads available. The bus can only drive on the road network, i.e. its progress is defined by its physical environment and the available directions of travel. So, while she/he may drive at an unsafe speed, the bus should stay on the road. It’s possible that it will take a short cut or indeed take a wrong turn or enter a dead-end street. But overall, doing this ‘driver replacement’ hundreds of times, on average the bus should follow the right route and go much faster along it. So, it might be a terrifying journey,but we should get to the destination faster! It might not reach the final destination, depending how long we let it go on, but we should pass several of the bus stops along the correct route. We can test how likely the route is by averaging over hundreds of crazy new bus drivers. A well-defined route implies a well designed network. The bus can take any of the roads available to it on the network, and the route taken by the bus may be unpredictable (if it was obvious, we would not need all these crazy drivers!). In other words, the response to a perturbation is non-linear. In terms of the final destination, specifically here in TEM-1 and KPC-2,the omega loop, the 3-4 loop, the hinge region are known to be involved in substrate binding and catalysis. We observe the signal reaching these structural elements, so we can say with confidence that the perturbation is communicated to distant, catalytically important parts of the enzyme. So, in terms of the bus analogy, we show that starting in the distant hills, the crazy bus drivers actually end up in the capital city. The simulations identify the capital city as the actual destination. And the fact that the crazy drivers tend to follow the same route allows us to say that we have identified the bus route to the capital, and the important points along the route.

      Another question is whether tracing the dynamics of Calpha alone is enough. As we have seen from the network analysis papers, Calpha sometimes missed some paths or could overemphasize others. The Center of the mass of residue has been proposed to be a better indicator of protein allostery. Authors may wish to clarify the particular choice of Calpah in this study.

      This is an interesting question. We have found in our previous analyses of nicotinic acetylcholine receptors and other systems that analysing the C-alphas allows the identification of pathways of signal transduction in nicotinic acetylcholine receptors (Oliveira et al. Structure 1171-1183. e3 (2019)) and went on to show that these pathways were common across different receptor subtypes (J. Am. Chem. Soc. 2019, 141, 51, 19953–19958 (2019)). Obviously, all residues in the protein are represented equally when analysing C-alphas. Thus, analysing the C-alphas allows direct comparison of closely related proteins with different sequences, and identification and analysis of the pathway in the framework of the protein backbone. Here, of course, we are interested in whether these C-alpha pathways identify positions of sequence variation that affect function, and the results indicate that indeed they do. There is also the practical advantage of analysing C-alpha behaviour that their motions are less subject to noise and converge more rapidly than e.g. analysing sidechains. Other features could be chosen to trace signal pathways, such as the centre of mass of residues. However, choosing more flexible parts to track signal propagation would also have an impact on speed of convergence (i.e. number of trajectories required): more simulations would be required to achieve convergence. Therefore, as in previous work on other proteins, we chose C-alpha atoms to study signal propagation here.

      The order of events associated with signal propagation is computed by directly comparing the positions of individual C-alpha atoms at equivalent points in time (namely after 0, 50, 500, 1000, 3000 and 5000 ps of simulation) for every pair of unperturbed equilibrium ligand-bound and perturbed nonequilibrium apo simulation. The C-alpha positional deviation is a simple way to directly identify the conformational changes induced by ligand annihilation and their evolution over the 5 ns of simulation. Due to statistics collected over the large number of simulations, we can be sure of the statistical significance of the structural changes identified. The conformational changes extracted from the nonequilibrium simulations reflect the (statistically significant) structural response of the system to the perturbation. These changes propagate over time from the allosteric site to the active site, demonstrating a direct connection between them. Due to the very short timescale of the nonequilibrium simulations (5 ns), the observed conformational rearrangements do not represent the complete mechanism of conformational change, but rather reflect its first steps.

      In Figure 5, the authors seem to use Pearson correlation to compute dynamic cross-correlation maps. Mutual information (M)I or linear MI have advantages over Pearson correlations, as has been discussed in the dynamical network analysis literature.

      The reviewer is indeed correct; the DCCMs were calculated based on the Pearson’s correlation. We have tested and validated this approach over the last 15 years, with results reproduced experimentally by a number of our collaborators for over 10 different enzyme systems, including cyclophilin A, dihydrofolate reductase, ribonuclease, APE1 and Rev1 DNA binding enzymes (Biochemistry 43, no. 33 (2004): 10605-10618; Nature 438, no. 7064 (2005): 117-121; Biochemistry 58, no. 37 (2019): 3861-3868; PLoS Biol 9, no. 11 (2011): e1001193; Structure 26, no. 3 (2018): 426-436; Nucleic acids research 48, no. 13 (2020): 7345-7355; Proceedings of the National Academy of Sciences 117, no. 41 (2020): 25494-25504). The reviewer’s suggestion is an interesting one, and we would be happy to investigate it in future studies. Mutual information analyses offer useful features. Based on our experience, we expect the results to be qualitatively similar and not likely to change the conclusions described in this manuscript.

    2. Reviewer #3 (Public Review):

      In the manuscript entitled "Allosteric communication in Class A 1 b-lactamases occurs via cooperative 2 coupling of loop dynamics", Galdadas et al. aim to use a combination of nonequilibrium and equilibrium molecular dynamics simulations to identify allosteric effects and communication pathways in TEM-1 and KPC-2. They claimed that their simulations revealed pathways of communication where the propagation of signal occurs through cooperative coupling of loop dynamics. This study is highly relevant to the field as allosteric regulation is believed to be a major signal transduction pathway in several drug-targeted proteins. A better understanding of these regulations could increase the efficacy and specificity of drugs.

    3. Reviewer #2 (Public Review):

      This manuscript by Galdadas et. al. used a combination of equilibrium and non-equilibrium simulations to investigate the allosteric signaling propagation pathway in two class-A beta-lactamases, TEM-1 and KPC2, from allosteric ligand binding sites. The authors performed extensive analysis and comparison of the simulated protein allostery pathway with know mutations in the literature. The results are rigorously analyzed and neatly presented in all figures. The conclusions of this paper are mostly supported by previous mutational data, but a few aspects of simulation protocol and data analysis need to be validated or justified.

      Line 293, by "comparing the Apo_NE and IB_EQ simulations at equivalent points in time" and perform subtraction "from the corresponding Ca atom from one system to another at 0.05, 0.5, 1, 3, 5ns". It is not clear to me why those time points were chosen? Have authors attempted at validating whether or not the signal from the ligand-binding site has had enough time to propagate across the allosteric signaling pathway? If one considers that the ligand is a spatially localized signal, it requires time to propagate. This is in contrast with the Kubo-Onsager paper cited by authors in which the molecule is responding to a global perturbation such as an external field. However, a local perturbation on one side of the protein will need time to propagate to the other side of the protein (30 angstroms away in this case). A simple and naive example is to map out all the bus stops on one's route. 800 simulations between the first and second stop will not be able to provide the locations of other stops. Since authors have used this "subtraction technique" on several other proteins, it would be nice to clarify how this approach works on mapping out signaling propagation perturbed by local ligand binding/unbinding and how to choose the time points for subtraction.

      Another question is whether tracing the dynamics of Calpha alone is enough. As we have seen from the network analysis papers, Calpha sometimes missed some paths or could overemphasize others. The Center of the mass of residue has been proposed to be a better indicator of protein allostery. Authors may wish to clarify the particular choice of Calpah in this study.

      In Figure5, the authors seem to use Pearson correlation to compute dynamic cross-correlation maps. Mutual information (M)I or linear MI have advantages over Pearson correlations, as has been discussed in the dynamical network analysis literature.

    4. Reviewer #1 (Public Review):

      Galdadas et al. applied a combinatorial approach of equilibrium and nonequilibrium molecular dynamics methods to study two important members of the Class A β-lactamase enzyme family in detail. Authors carefully chose two representative enzymes from this family, TEM-1 and KPC-2 in this study. Understanding of the nature of the communication pathways between allosteric ligand binding site and the active site has been the main focus of this study. Another very interesting finding of this study was the position of clinical variants that was precisely mapped along the allosteric communication pathway. This approach certainly has broad utility as it can be applied to study long-range communications in enzymes that are triggered by binding of a ligand (drug candidate) to an alternative/remote site, and also in cases where certain mutations occur far away from the active site but lead to drug resistance.

      Overall, the manuscript is well written, and the conclusions are mostly well supported by data.

    5. Evaluation Summary:

      This manuscript presents a computational study aiming to understand the allosteric signaling propagation pathway in two class-A beta-lactamases. The results of this study will be of interest to the readers in the fields of beta-lactamase, antibiotic resistance, and enzyme allostery.

      (This preprint has been reviewed by eLife. We include the public reviews from the reviewers here; the authors also receive private feedback with suggested changes to the manuscript. Reviewers #1, #2, and #3 agreed to share their names with the authors.)

    1. Reviewer #3 (Public Review):

      The paper by Eyal Ben-David and colleagues reports an elegant single cell experiment in a genetic outcross of C. elegans to show where specific genetic regulation of gene expression could be seen at the level of individual cells. This is the first, to my knowledge, genetic mapping experiment at the single cell level in a complex organism. One neat trick was use the transcript sequencing data for genotyping each individual cell. Another above-and-beyond-the-call-of-duty feature was the permutation tests to set FDR levels, which ended up being similar to Benjamini-Hochberg.

      There is complex single cell processing to analyse this data. It could be more clear how complex this analysis is: quite complex models are used to both (a) cluster the cells into cell types across each individual and (b) model the resulting eQTLs. (c) somewhat more routinely, a HMM is used to gentoype but from the single cell transcript data, which is cute. Personally I think more should be made in the main text of the methods, highlighting the complexity of the models (there is at least one parameter this reviewer did not understand why was in the model!). However, a variety of bulk to single cell or single cell to previous experiment data shows that they seem to have discovered correct eQTLs.

      A particular focus was on single cell neuronal eQTLs; this plays to the unique "named cell" aspect of C. elegans and this dataset, and did not disappoint. they found a fair number and one that they highlighted had the (rare) antagonistic effect between cell lines, something much discussed or theorised might exist in some cell types - here it is in all its glory. Backing up this was evidence that the single cell neuronal QTL data cannot be seen by "pan neuronal" analysis.

      Overall this is an excellent paper; it clarifies much of which has been theorised or discussed, while in many ways (in my view) hiding its methodological sophistication in the main text.

    2. Reviewer #2 (Public Review):

      eQTLs can vary between cell types. To capture this in an organism as complex as a mammal looks daunting and expensive if eQTLs have to be mapped a single cell type at a time. However, here the authors propose a 'one pot' method where whole animals are dissociated and the cell types deconvoluted based on a robust set of markers. Thus in a single experiment, eQTLS can be mapped in tens of cell types at once - here they identify 19 major cell types but in the case of the nervous system break it down with even more specificity, down to individual cells.

      They test their method in C. elegans which is ideal for this - the lineage is invariant, there are extensive sets of cell type specific markers, and they can exploit their previously published method called ceX-QTL to generate massive pools of segregants using an elegant genetic trick.

      Overall I was extremely impressed with the clarity of writing, the care of data analysis, and I honestly found that every analysis I was looking for had been done. They highlight some beautiful findings, most striking of which was the opposing regulation of nlp-21 in two neurons, a perfect example of the resolution this can achieve.

    3. Reviewer #1 (Public Review):

      In this manuscript, the authors use single cell RNA sequencing to investigate cell-type specific eQTL within C. elegans. This relies on the well known ability to genotype individuals via their transcriptome allowing the authors to generate both phenotypes and genotypes from single cell transcriptomes. This identifies a blend of cis and trans-eQTL that are cell type specific and starts to provide numerical observations to the communities expectation of cell type specificity.

      The use of simultaneous single cell sequencing on a diversity of individuals is a unique method that is absolutely essential to get around the vast scale issues that are presented when contemplating single cell eQTL within multicellular organisms. However, an unfortunate outcome of this approach that the cell-autonomy of the eQTL cannot be studied. Instead the cell types have to be considered completely independent of each other.

      The authors conduct an analysis of eQTL per each cell type to get at specificity. This identifies a number of eQTL found in only a single cell type but these binary tests can have an ascertainment issue that may be over-estimating the cell type specificity. Optimally, this would be conducted by incorporating the different cell types as different environments within a single eQTL model but given the different sample sizes, this may not be feasible. Alternatively an investigation of how eQTLs specific to one cell type are or are not found by shifting the detection threshold in the other tissues could test this possibility.

    4. Evaluation Summary:

      The authors use a pooled single cell sequencing approach to simultaneously genotype and phenotype C. elegans. This allows them to begin to query the genetic architecture of cell specific eQTLs in a multi-cellular organism.

      (This preprint has been reviewed by eLife. We include the public reviews from the reviewers here; the authors also receive private feedback with suggested changes to the manuscript. Reviewer #3 agreed to share their name with the authors.)

    1. Reviewer #3 (Public Review):

      This paper presents an extensive study on providing a large dataset CEM500K, pre-trained models for electron microscopy data. This dataset is provided by the authors as an unlabeled dataset for supporting generalization problems like transfer learning.

      Strengths:

      — The motivation problem is well defined as the lack of large and, importantly, diverse training datasets of supervised DL segmentation models for cellular EM data.

      — A large and comprehensive dataset, CEM500K, including both 2D and 3D images is designed by the authors to overcome this issue.

      — The experimental results present the efficiency and prominent role of this dataset in training DL.

      Concerns:

      — Some of the claims have not been well supported by proofs/references/examples. As an example, the following claim "The homogeneity of such datasets often means that they are ineffective for training DL models to accurately segment images from unseen experiments" would be more valuable if some examples are provided by the authors.

    2. Reviewer #2 (Public Review):

      In their manuscript "CEM500K - A large-scale heterogeneous unlabeled cellular electron microscopy image dataset for deep learning", the authors describe how they established and evaluated CEM500K, a new dataset and evaluation framework for unsupervised pre-training of 2D deep learning based pixel classification in electron microscopy (EM) images.

      The authors argue that unsupervised pre-training on large and representative image datasets using contrastive learning and other methods has been demonstrated to benefit many deep learning applications. The most commonly used dataset for this purpose is the well established ImageNet dataset. ImageNet, however, is not representative for structural biases observed in EM of cells and biological tissues.

      The authors demonstrate that their CEM500K dataset leads to improved downstream pixel classification results and reduced training time on a number of existing benchmark datasets a new combination thereof compared to no pre-training and pre-training with ImageNet.

      The data is available on EMPIAR under a permissive CC0 license, the code on GitHub under a similarly permissive BSD 3 license.

      This is an excellent manuscript. The authors established an incredibly useful dataset, and designed and conducted a strict and sound evaluation study. The paper is well written, easy to follow and overall well balanced in how it discusses technical details and the wider impact of this study.

    3. Reviewer #1 (Public Review):

      This manuscript describes the curation of a training dataset, CEM500K, of cellular electron microscope (EM) data including STEM, TEM of sections, electron tomography, serial section and array tomography SEM, block-face and focused-ion beam SEM. Using CEM500K to train an unsupervised deep learning algorithm, MoCoV2, the authors present segmentation results on a number of publically available benchmark datasets. They show that the standard Intersection-over-Union scores obtained with the CEM500K-trained MoCoV2 model, referred to as CEM500K-moco, equal or exceed the scores of benchmark segmentation results. They also demonstrate the robustness of CEM500K-moco's performance with respect to input image transformations, including rotation, Gaussian blur and noise, brightness, contrast and scale. The authors make the remarkable discovery that MoCoV2 spontaneously learned to use organelles as "landmarks" to identify important features in images, simulating human behavior to some degree.

    4. Evaluation Summary:

      This manuscript describes the curation of a training dataset that will be an important resource for developers of new segmentation and deep-learning algorithms for electron microscopy data. The small size of the dataset makes it easy to use, and its broad range of image modalities ensure that the model will be applicable in many situations, making it very useful for the community.

      (This preprint has been reviewed by eLife. We include the public reviews from the reviewers here; the authors also receive private feedback with suggested changes to the manuscript. Reviewer #1 and Reviewer #2 agreed to share their names with the authors.)

    1. Reviewer #3 (Public Review):

      In this manuscript, the authors studied how cholinergic neurons in the medial septum contribute to the acquisition of spatial memory. The question that is addressed is that of the requirement for the appropriate timing of cholinergic neurotransmission in memory formation. The main finding is that in mice optogenetic stimulation of cholinergic neurons in the medial septum slowed acquisition of a spatial memory task when the stimulation was applied at the goal location, but not during navigation toward the goal location. Stimulation at the goal location also reduced the rate of hippocampal sharp-wave ripples (SWRs), which the authors point to as a possible explanation of the observed learning deficit.

      The task-phase specific manipulation of the MS cholinergic neurons is a good and appropriate approach. The effect on learning in the Y-maze task after goal location specific stimulation is both clear and convincing. The lack of a behavioral effect with navigation-only stimulation may be due to ACh levels already being high during this task phase (as the authors suggest). It would have been nice if the authors had also used inhibition to address the importance of timing of ACh neuromodulation.

      The authors used prolonged excitatory optogenetic stimulation that lasted anywhere from several seconds (e.g. at goal without reward or running towards goal) to over 30 seconds (e.g. at goal with reward). There are several potential issues with this stimulation protocol:

      — From Figure 1B, it appears that the light-induced increase of mean spike frequency is sustained for quite some time after the light is turned off. The sustained activity will make the manipulation in the behavioral task less temporally specific (and thus less task-phase specific). To assess the possible impact of the sustained activation on the findings in the paper, it should be quantified (i.e. duration of sustained activity, dependence on duration of prior light stimulation) - ideally in awake animals (i.e. under the same conditions as the behavioral experiments). Supporting data to better support this conclusion could be provided in a later study (with a link provided to this study), with this caveat appropriately discussed here.

      — Prolonged light stimulation could lead to non-specific side-effects. Importantly, the authors controlled for this by performing the same light-stimulation protocol in animals that did not express ChR2. Although non-specific effects of light stimulation were found for theta power, the effects on learning and SWR rate at the goal location could not be explained by non-specific light effects. These data add confidence to the main findings. Still, the number of control animals is low (n=2) and increasing the sample size would make these control experiments more robust. This potential caveat should be mentioned.

      — Because the time that animals spent at the goal location is much longer than the travel time to the goal location, the behavioral difference between the "navigation" and "goal" groups could be due to the duration of optical stimulation. The authors point out that the "throughout" group has overall the longest stimulation duration, but an "intermediate" behavioral performance, which would suggest that stimulation duration is not the determining factor.

      Unfortunately, the statistical analysis that the authors performed is inconclusive (i.e. the throughout group is not different from either "navigation" or "goal" groups). However, if duration is an important factor, the hypothesis would be that days-to-criterion for "throughout" condition is larger than "goal" condition (i.e. H0: throughout<=goal and H1: throughout>goal). Authors could test this directly (rather than H0: throughout=goal and H1: throughout≠goal). Bayes Factor analysis could help to assess the confidence in H0 rather than concluding that there is a lack of evidence due to low sampling.

      Even so, the authors' argument could be weakened if long-term stimulation has reduced efficacy (as suggested by the authors on page 18). To exclude this possibility, changes in the long-term stimulation efficacy should be quantified, e.g. by quantifying the stability of light-induced firing of ACh neurons with the same stimulation protocol as used in awake animals, and/or by checking whether the stimulation-induced reduction of SWR rate gets smaller across trials within a day. Supporting data to better support this conclusion could be provided in a later study (with a link provided to this study), with this caveat appropriately discussed here.

      The main novelty of the study is that specific stimulation of cholinergic neurons in the medial septum when animals reach the goal location results in a learning deficit. The reduction of SWRs upon cholinergic stimulation was shown before, but the authors now show that this reduction coincides with and may provide an explanation of the delayed learning. However, the link between the effect of the stimulation on SWRs and the behavioral deficit is indirect and not extremely convincing. This caveat should be discussed and conclusions tempered accordingly. Specific points related to this that should be discussed are described below.

      — First, the analysis of SWR rate is performed in a separate set of experiments as in which the behavioral effect is assessed. This makes it difficult to more directly relate the change of SWR rate to the learning deficit.

      — Second, the reduction of SWR rate is not absolute and SWRs are still present at lower rate. The data in Figure 4E indicate that for some animals the average SWR rate with stimulation is higher than for other animals without stimulation.

      — Third, the Y-maze task used by the authors tests the acquisition of spatial reference memory and bears similarities to the inbound phase of the continuous spatial alternation task in 3-arm mazes. In Jadhav et al. (2012), the inbound phase was not sensitive to selective SWR disruption. These prior data would be an argument against a causative role of the reduction of SWR rate in the observed behavioral deficit.

      — Fourth, while the authors briefly discuss other possible causes (e.g. effects on plasticity), they do not appear to consider non-hippocampal contributions or possible interference with reward-related dopamine signaling.

    2. Reviewer #2 (Public Review):

      Hay et al. investigated the effect of optogenetic activation of MS cholinergic inputs on hippocampal spatial memory formation, which extended our current knowledge of the relationship between MS cholinergic neurons and hippocampal ripple oscillations.

      The authors showed that optogenetic stimulation at the goal location during Y maze task impaired the formation of hippocampal dependent spatial memory. They also found that opto-stimulation at the goal location reduced the incidence of ripple oscillations, while having no effect on the power and frequency of theta and slow gamma oscillations.

      Interestingly, the authors reported different results compared to previously published work by applying the analytical methods developed by Donoghue et al. (Donoghue et al., Nat Neurosci, 2020). They showed that optogenetic activation of MS cholinergic neurons during sleep not only reduced the incidence of hippocampal ripple oscillations, but also increased the power of both theta and slow gamma oscillations, which is contradict to both decreased or no change of theta and gamma power by previous reports (Vandecasteele et al., 2014, Ma et al., 2020). These results are valuable to the community of hippocampal oscillation studies.

    3. Reviewer #1 (Public Review):

      In this study, the authors set out to address the interesting question of how activating septal cholinergic neurons affects learning and memory of reward locations. The work provides compelling evidence showing that activation of septal cholinergic cells at reward zones suppresses sharp wave-ripples and impairs memory performance in freely behaving animals. The data are properly controlled and analyzed, and the results support the conclusions. The results shed new light on the functional significance of cholinergic projections in reward learning. Future follow-up studies designed to selectively activate cholinergic projections specifically at times when sharp wave-ripples occur will be interesting to determine the importance of cholinergic sharp wave-ripple suppression for these effects.

    4. Evaluation Summary:

      This paper is of interest for those interested in the roles of cholinergic projections from the medial septum and sharp wave-ripples on reward learning. The work provides compelling evidence showing that activation of septal cholinergic cells at reward zones suppresses sharp wave-ripples and impairs memory performance in freely behaving animals. The work extends our knowledge of the effect of medial septum cholinergic inputs on hippocampal dependent spatial memory formation.

      (This preprint has been reviewed by eLife. We include the public reviews from the reviewers here; the authors also receive private feedback with suggested changes to the manuscript. Reviewer #2 and Reviewer #3 agreed to share their names with the authors.)

    1. Reviewer #3 (Public Review):

      In the paper entitled "Stress Resets Transgenerational Small RNA Inheritance" Houri-Ze'evi L, Teichman G et al examine the interaction between multiple heritable phenotypes by knocking down a heritable GFP reporter and examining its interaction with other stresses, such as starvation and high temperature, which cause transgenerationally heritable phenotypes. They demonstrate that exposing worms to stresses inhibits the transgenerational silencing of the GFP reporter strain they use. They further demonstrate that deletion of genes involved in the MAPK pathway, the skn-1 transcription factor and the putative H3K9 methyltranferase met-2 eliminate the differential response in the F1 and F2 generations after exposure to stress and the GFP reporter silencing. They also sequence the small RNAs in the P0 and F1 generation with and without the added stresses.

      All in all, the authors have expanded the mechanistic understanding of how heritable small RNAs are influenced by environmental conditions. I think that the conservation of several of the known regulators of epigenetic inheritance appearing in this study reflects how the regulators of non-genetic inheritance are beginning to converge on a few central pathways. The bit about MET-2 is still a bit premature as it's link to SKN-1 and regulated small RNAs is not completely fleshed out here, but I'm sure future studies will help delineate how this putative methyltransferase is communicating with SKN-1 on a more mechanistic level. Future studies examining how and why the MAPK pathway is so critical in this inheritance paradigm will be interesting.

    2. Reviewer #2 (Public Review):

      In humans, extreme stresses, such as famine, can trigger multi-generational physiological responses through altered metabolism. In C. elegans, environmental stresses, such as heat shock, can similarly promote changes in gene expression and physiology. In addition, researchers observed more than two decades ago that dsRNA triggers can silence gene expression transgenerationally. This manuscript by Houri-Zeevi et al., entitled "Stress resets ancestral heritable small RNA responses", seeks to tie these two observations in C. elegans together mechanistically, showing that environmental stress (heat shock, high osmolarity, or starvation) can alter the small RNA populations in adults and their progeny, affecting their gene expression levels. The authors used a GFP reporter as a proxy for exo-siRNA levels in various experimental paradigms. P0 animals were fed dsRNA targeting the GFP transgene, and their F1 progeny were subjected to one of the environmental stresses. The GFP expression levels of P0, F2, and F2 adults were measured, showing that the stressed F1 and their F2 progeny have increased de-silencing of the GFP transgene compared to controls. The authors also performed small RNA sequencing on these populations, showing that a subset of small RNAs become "reset" or decreased after stress, while a different subset was increased. Additionally, the p38 MAPK pathway, SKN-1 TF, and MET-2 H3K4me1/2 HMT were shown to be required for the stress-dependent changes in transgene de-silencing. The manuscript is well-written and contains some very interesting and convincing results that should be of broad interest to the fields of stress biology and RNAi.

    3. Reviewer #1 (Public Review):

      Here, Houri-Ze'evi, et al. treated progeny of parents that had inherited small RNA response (silencing of an artificial, single-copy GL-expressed gfp with anti-gfp dsRNA) with 3 stresses – heat shock, hyperosmolarity, or starvation – starting at L1, and examined gfp silencing. All three treatments reduced silencing (visible as increased GFP fluorescence) in subsequent generations (F1-F3). The authors tested resetting of endogenous (endo-siRNA) and piRNAs using an endo-siRNA sensor target sequence and piRNA recognition sites, respectively. Again, all 3 stressors reset both in the same generation, but did not reset the effect transgenerationally, suggesting that exogenous RNAi resetting functions through a different mechanism than endogenous.

      Next, they tested adults, which also led to resetting. However, only the F1 generation, not F2, is susceptible to resetting (how? Why?), revealing a critical period for resetting susceptibility. Reversal of the stress with RNAi treatment does not result in resetting, nor does simpy changing conditions. The authors then went on to examine mutants that might be defective in stress responses or in resetting; MAPK genes and skn-1 are required for resetting. Small RNA-seq from stressed worms and their progeny showed a decrease overall with stresses, and reveals some potential classes of genes, including targets of the mutator genes, and overlap with classic stress response pathways (dauer, IIS). Overall, this work presents some interesting phenomena and moves towards explaining how it might work through the identification of a critical period and some genes that are required.

      In this version, the authors have added more information regarding the relationship between MAPK and SKN-1, and transcriptional targets. Most importantly, they have performed tissue-specific rescue of sek-1; in neurons, this rescues, but intestine did not.

      These data add to prior work from the Rechavi lab and others in the field, which together address the interplay of small RNAs, response to stress, and transgenerational inheritance.

    4. Evaluation Summary:

      In humans, extreme stresses, such as famine, can trigger multi-generational physiological responses through altered metabolism. In C. elegans, environmental stresses, such as heat shock, can similarly promote changes in gene expression and physiology. Here, the authors convincingly show that environmental stress can alter small RNA populations in such a manner that can alter gene expression over multiple generations. The work is beginning to tease out some of the mechanisms by which non-genetic information can regulate descendants biology.

      (This preprint has been reviewed by eLife. We include the public reviews from the reviewers here; the authors also receive private feedback with suggested changes to the manuscript. The reviewers remained anonymous to the authors.)

    1. Reviewer #2 (Public Review):

      This manuscript addresses how myeloid cells are rapidly regenerated during periods of consumptive stress, such as that what occurs during infection. The authors defined a novel migration pattern activated upon inflammation wherein bone marrow-derived myeloid progenitors rapidly seed lymph nodes to produce dendritic cells. Using an in vivo model (injection of LPS) they demonstrated systemic inflammation was necessary for triggering this migratory pathway. A key observation was that prior to detection in the blood, myeloid progenitors were detected in the lymphatics, including the thoracic duct and lymph nodes. Using a combination of imaging strategies, in vitro assays, and transplantation assays the specific myeloid differentiation of these progenitors was revealed: progenitors in lymphatics did not have stem cell function but maintained potential to generate dendritic cells. Using adoptive transfer experiments they determined that labeled progenitors did not home to the bone marrow after LPS. Moreover, prior to their detection in the lymph nodes, these progenitors were found in close proximity to lymphatic endothelial cells in the bone, as determined with intra vital imaging of Lyve-1-GFP mice. They also observed the existence of Lyve-1+ vessels in the bone of LPS treated mice, rarely observed in controls. Therefore, it was concluded that myeloid progenitors are released from the bone marrow and enter the lymphatics very rapidly upon LPS challenge via a network of lymphatic vessels in the bone.

      To determine mechanisms that were required for this migratory pathway, they first focused on the signaling molecule TRAF6, a key signaling protein downstream of TLR signaling. Using Mx1-Cre inducible TRAF6 deficiency they observed reduce mobilization of progenitors and found a cell-autonomous defect in migration towards LPS-stimulated cells in vitro. These chemotactic assays were used to identify the specific role of myeloid cells in driving migration of progenitors. The authors ruled out the role of NF-kB signaling via over-expressing the degradation-resistant mutant of IkBa, but revealed that protein-trafficking was necessary for progenitor mobilization. Analysis of chemokines and potential factors that could drive this trafficking pattern identified the chemokine CCL19 and its receptor CCR7 in migration. In vivo targeting of this pathway via antibody blockade experiments demonstrated that CCL19 and CCR7 were required for the myeloid progenitor mobilization, and, furthermore, that the mature myeloid (CD11b+CD11c+) cells in the LNs were sources of CCL19.

      The main strengths of this manuscript include: (1) the intriguing and novel observation of lymphatic migration early during inflammation; (2) the various techniques used to address the questions, including imaging and flow cyotmetric analysis, as well as functional assays; and (3) the thorough mechanistic model they have built through their investigation of signaling molecules and the chemokine-receptor interactions necessary for dendritic cell replenishment. Using the Lyve-1 mouse, they were able to identify vessels in the bone, suggesting a specific route for migration. They were also able to determine that the Lin- progenitors were in close proximity to these vessels upon LPS challenge and differentiated into dendritic cells. The ability of myeloid cells to rapidly release preformed CCL19 was also dependent on TRAF6, thus suggesting that mature cells in the lymph nodes initiate recruitment of CCR7+ myeloid progenitors, highlighting a novel circuitry of regeneration.

      This study is very comprehensive, though there are several questions remaining: (1) the conclusion regarding the physiological role of this early response in survival is not well supported by the data; (2) the link with observations in humans is not robust; (3) a number of questions regarding progenitor survival and proliferation remain. First, studies revealing enhanced mortality when CCR7 is blocked or when CCL19 production is lacking may be due to impacts on a variety of other cell types, most notably T regulatory cells. The reason these mice die faster was not carefully investigated and is unclear. While the authors conclude it is due to reduced anti-inflammatory dendritic cells, they provide very little data to support this. Second, data presented in the manuscript highlighting the presence of side population cells in human lymph nodes under specific conditions is consistent with the observations in the mouse model. However, the authors do not investigate functional potential in detail and do not account for abundance of mature cells in these lymph nodes (particularly the lymphoma patients, that may result in decreased frequency of HSPCs). Finally, though the findings are very interesting and the studies are robust, one potential concern is that TRAF6 is downstream of a variety of innate signaling pathways and, in general, the dysfunction of myeloid cells may be profound and beyond the conclusion of directing migration, as TRAF6-dependent proliferation may also contribute to the observations made in vivo.

      Overall, this is a compelling story and reveals a novel migratory pathway that may operate in a variety of settings to replenish immune cells to maintain homeostasis, and how this trafficking is impacted in different immune/inflammatory and diseased states warrants more investigation.

    2. Reviewer #1 (Public Review):

      In this manuscript the authors demonstrate that acute systemic inflammation induces a new system of rapid migration of granulocyte-macrophage progenitors and committed macrophage-dendritic progenitors but not other progenitors or stem cells from BM to lymphatic capillaries. This traffic is mediated by Ccl19/Cccr7 and is NfkB independent but Traf activation dependent. This type of trafficking is anti-inflammatory with promotion of early survival.

      Specifically, authors work shows the traffic of DC-biased myeloid progenitors through direct transit from BM to bone lymphatic capillaries. This type of trafficking is highly activated in endotoxic inflammation. Giving LPS to mice results in massive mobilization of myeloid progenitors from the BM to lymph and retention in LN takes place. This happens rapidly and before the appearance of these cells in PB. This type pf LPS challenge induces Ccr7 expression on GMPs as well as secretion of CcL9 in the LN. Importantly, loss of CcL9 or neutralizing Ccr7 inhibits GMP/MDP migration to the LN and inflammation induce mortality.

      The studies are well performed and the data supports the conclusions. The role of this signaling axis in the recruitment of GMPs/MDPs has not been investigated in this detail.

    3. Evaluation Summary:

      The authors demonstrate that acute systemic inflammation induces a new system of rapid migration of granulocyte-macrophage progenitors and committed macrophage-dendritic progenitors but not other progenitors or stem cells from BM to lymphatic capillaries. The cells appear in the lymphatics earlier than in peripheral blood. This type of trafficking is triggered by LPS administration and is anti-inflammatory.

      (This preprint has been reviewed by eLife. We include the public reviews from the reviewers here; the authors also receive private feedback with suggested changes to the manuscript. Reviewer #2 agreed to share their name with the authors.)

    1. Reviewer #3 (Public Review):

      The authors present here a very interesting and thorough systems biology study of S. cerevisiae involving 22 steady state conditions with different growth rates and nitrogen sources. Proteomics and transcriptomics data, as well as intracellular amino acid concentrations, are gathered in a study that, if only for the sheer amount of data, is quite unique.

      The authors use differential expression analysis, clustering algorithms and correlations to divide the genes and proteins studied into a small number of groups whose behaviour can be generally categorized. For a starter there is a small group (~10%) that map to central carbon metabolism and seems to be regulated by cues not covered in this study (growth rate and metabolic parameters involving amino acid and nucleotide availability). The rest of genes (90%) seem to have their transcript and protein levels heavily determined by growth rate and/or amino acid metabolism. For different growth rates, the expression of these genes and corresponding proteins seemed to be very correlated, and dependent on the availability of translation and transcription machinery (RNA polymerase and ribosomes). For different nitrogen sources, gene expression seemed dependent on amino acid and nucleotide availability.

      These general rules are insightful and can provide a much more informative way to analyze multiomics data sets, by e.g. accounting for expected over/under expressions due to growth rate changes. Indeed, the authors attempt this for two cases: a distantly related yeast (S. pombe) and a human cancer cell model. While they are able to show that most transcript variation for S. pombe seems to be due to growth rate changes, the rest of the inferences do not seem very informative.

      In general, while the findings are interesting and seemed to be mainly supported by the evidence, the manuscript is complicated to read. Evidence is scattered throughout the manuscript and needs to be gathered and compiled by the reader to check the results. Some of the writing is remiss: Figures 6A and 6C have the same caption and different graphs. It is also not clear how the differential expression calculations in Figure 1C were done: what are the two conditions being compared? Figure 7 encapsulates what is learnt from this paper but needs a more informative caption describing the full metabolic lesson learnt.

      In summary, the data presented here is a golden data set that will make a great contribution to science, the general rules are interesting and seemed to be supported by the data, but to be more useful to readers the writing of the paper could be made clearer.

    2. Reviewer #2 (Public Review):

      Using budding yeast, the authors have generated transcriptome and proteome data for a series of experimental conditions, augmented with measurement of some amino acid abundances. These data are subjected to a number of correlation and enrichment analyses. Based on those, the authors put forward a verbal "model of information flow, material flow and global control of material abundance".

      The main message of this paper was not sufficiently clear because at different places of the manuscript the authors highlight different aspects: Based on the title it seems that the "distinct regulation" is the key aspect. Notably, however, this point has only a minor role in the manuscript itself. In the abstract, it seems that the key aspect is a "framework", although after having read the paper it was not clear what the authors mean with the term. Later in the manuscript the authors also use the term "coarse-graining approach", but it was not clear whether this is the same as the "framework". Beyond, throughout the manuscript, the authors make the point that global physiological parameters (such as growth rate) determine gene and protein expression level. Even though this point is important and often overlooked, it has been made before in several papers, which the authors also cite. Thus, this aspect mostly provides confirmation of previous work. Finally, at the end of the introduction, where the authors refer to "our findings... ", it is unclear to which findings they particularly refer to.

      The manuscript could be clearer in certain specific aspects:

      1) The paper uses lots of terms that are not well defined: For instance, it is not explained well what the authors mean by "metabolic parameters". I know metabolite concentrations, and metabolic fluxes, but I don't know what metabolic parameters are. It is also not explained well what is meant with "global control mechanisms" and what is meant by "augment".

      2) Similarly, this lack of clarity also exists when the authors step from a particular analysis (i.e. a correlation) to a conclusion statement. The hard evidence supporting particular statements is not sufficiently explained.

    3. Reviewer #1 (Public Review):

      Nielsen and colleagues describe a large new multi-ome database containing combinations of absolute mRNA quantities, proteome and amino acid concentrations in a set of 14 yeast populations grown in various conditions in chemostats. Apart from being a valuable resource for colleagues, analysis of the data confirms the results of several previous seminal studies.

      For example, the authors confirm the relatively high correlation between transcript and corresponding protein abundance. Moreover, it is shown that for most genes, changes in transcript abundance related to manipulated changes in growth rate largely reflected the availability of RNA polymerase II. Interestingly, this was not the case for genes involved in central carbon metabolism, suggesting that these are regulated separately, likely to maintain the cells' ATP levels. Similarly, manipulation of growth through the use of different nitrogen sources led to changes in transcription that correlated with certain amino-acid-derived metabolites (including nucleotides), but not with RNAPolII levels. Genes involved in central carbon metabolism are again an exception to this rule.

    4. Evaluation Summary:

      This study has generated a large amount of solid data in the form of a new multi-ome database containing combinations of absolute mRNA quantities, proteome and amino acid concentrations in a set of 14 yeast populations grown in various conditions in chemostats. Apart from being a valuable resource for colleagues, analysis of the data confirms the results of several previous seminal studies.

      (This preprint has been reviewed by eLife. We include the public reviews from the reviewers here; the authors also receive private feedback with suggested changes to the manuscript. Reviewer #1 agreed to share their name with the authors.)

    1. Reviewer #3 (Public Review):

      The combination of Cre and Flp recombinase dependent system is powerful in manipulating specific intersectional neurons and has been successfully used in many systems. However, the system cannot express target genes sufficiently in some neurons, e.g., the LepRbVMH neurons. This paper solved this problem by developing a novel AAVs system, in which two AAVs were used, the "Driver" AAV permits Flp dependent expression of tTA, and the "Payload" AAV permits TRE-driven and Cre dependent expression of target gene. Because there two AAVs used, it is also expected to increase the capacity to incorporate more transgenes into the AAV system. The novel system to manipulate the intersectional neurons described in this work is an important addition to the current tools. It should be an excellent resource for the neuroscience community.

      This paper is nicely written and compared the previous intersectional approach of AAV-EF1α-Con/Fon-hChR2(H134R)-EYFP with their novel tTARGIT approach in labelling LepRbVMH neurons. The data convincingly demonstrated that the tTARGIT system can label many more cells. Small caveats include the author co-injected AAV-hSYN-Flex(Lox)-hM3Dq-mCherry as an injection site marker with AAV-EF1α-Con/Fon-hChR2(H134R)-EYFP, the serotypes of these AAVs were not reported. It is well known that different serotypes of AAVs infect different types of neurons with a different efficiency. Furthermore, the combination of the different AAV might affect each other's infection, leading to low expression of one type of AAV. The titres of AAVs also make a big difference to many AAVs, which were not reported in this paper. These information are important for other investigators if they would adopt the tTARGIT system in their own research.

    2. Reviewer #2 (Public Review):

      The research community has been frustrated by difficulties in using AAVs to obtain robust experimental access to neurons co-expressing Cre and Flp recombinase (often called the intersectional approach). In many cases, the approach is sufficiently inefficient as to not be usable. This is in part due to difficulties in designing AAVs that will efficiently express protein-encoded tools in a Cre-ON/Flp-ON fashion, and in part due to the relative inefficiency of Flp recombinase. This present study presents a new intersectional approach for solving this problem. The approach involves co-injecting two AAVs into sites in the brain where Cre/Flp-co-expressing neurons reside - in this case, neurons in the ventromedial nucleus of the hypothalamus (VMH) which co-expresses VGLUT2 (Slc17a6)-Flp and Leptin receptor (Lepr)-Cre. One of the AAVs, in a Flp-dependent fashion, expresses the tTA transcriptional activator, while the other AAV, in a tTA and Cre-dependent fashion, expresses the protein-encoded tool. This new system produced robust expression in neurons co-expressing Flp and Cre in the VMH which previously could not be accomplished using existing intersectional AAVs. The authors also demonstrate a Flp-ON/Cre-OFF version of this approach. Finally, by using these tools the authors show, as was suspected based on prior work, that the Lepr/Vglut2-coexpressing VMH neurons increase brown fat thermogenesis and energy expenditure when stimulated. The results presented very strongly support the effectiveness of this new approach. The only weakness of this study is that, at this point in time, the universality of this approach for all Cre/Flp-co-expressing neurons is unknown. Its effectiveness was only evaluated in VMH neurons. While it is expected that this approach will work for most or all Cre/Flp-co-expressing neurons, there is anecdotal evidence of this or that AAV approach not working in this or that neuron.

    3. Reviewer #1 (Public Review):

      This paper describes the development of a suite of viral vectors that allow expression (either on or off) of genes of interest depending on both Cre and Flp expression. They demonstrate that their system can solve the problem encountered with the other approach and use it for mapping axonal projections of the glutamatergic, LepR-expressing neurons and the consequences of chronic activation of these neurons on food intake and energy expenditure. The results are significant and clearly presented. The failure of the other system (INTRSECT) for their application is not clearly understood, but authors say that it may be due to low expression of Cre or Flp in these neurons; however, Supp Fig. 1 shows that it Lepr-Cre and Slc17a6-FLPo were sufficient to activate a transgenic reporter (Supp Fig. 1). The authors reveal that they probably could have used Nr5a1-Cre mice manipulate the activity of these VMH neurons. Nevertheless, it is worthwhile having multiple methods to attack a specific problem because of unforeseen complications with particular methods.

    4. Evaluation Summary:

      The combination of Cre and Flp recombinase dependent system is powerful in manipulating specific intersectional neurons and has been successfully used in many systems. However, the system cannot express target genes sufficiently in some neurons, e.g., the LepRb VMH neurons. This paper solved this problem. It is therefore an important technical advance.

      (This preprint has been reviewed by eLife. We include the public reviews from the reviewers here; the authors also receive private feedback with suggested changes to the manuscript. Reviewer #1 and Reviewer #2 agreed to share their names with the authors.)

    1. Reviewer #3 (Public Review):

      The manuscript "HPF1 and nucleosomes mediate a dramatic switch in activity of PARP1 from polymerase to Hydrolase" by Rudolph et al. studies the effect of HPF1 on the steps of the catalytic reaction of PARP1. They use various PARP1 activators i.e. free DNA and varied forms of core nucleosomes to quantify reaction rates in the presence and absence of HPF1, using several assays. The main point of the manuscript is the observation that in the presence of HPF1, PARP1 is converted to an NAD+ hydrolase, which releases free ADPr, instead of its normal activity to produce ADPr polymers. The PARP1 hydrolase activity has been described previously, but they now show that HPF1 increases it substantially under the conditions that they tested. The authors also describe their independent identification of HPF1 residue E284 as a residue that is essential for Ser modification, confirming previous structural and biochemical work from Ivan Ahel's group. Although the assays are well performed and controlled and yield important quantitative information that was missing in the field, the main result of the hydrolase activity of PARP1 is hard to reconcile with current knowledge of HPF1 effects in cell-based experiments.

    2. Reviewer #2 (Public Review):

      This enzymological analysis of the DNA-repair protein PARP1 in the presence and absence of its recently discovered regulator, HPF1, is a welcome contribution to the field that provides new data as well as introducing a valuable conceptual framework (seeing PARP1 as simultaneously catalysing 4 different reactions) and novel assays. Some of its conclusions - e.g. regarding the importance of residues Glu284 and Asp283 within HPF1 - are an independent validation of some of those from a recently published study but here they are reached with partially orthogonal means and supported by additional data (e.g. precisely quantified stability, binding, and catalytic parameters). Moreover, the study offers new insights, with the most interesting observation pointing to the prevalence of NAD+ hydrolysis to free ADP-ribose by PARP1 in the presence of HPF1. The technical aspects of the study including the design, number of repeats, data presentation and analysis, and the level of detail provided in the method section are adequate.

    3. Reviewer #1 (Public Review):

      This manuscript describes a set of biochemical studies on the substrate and reaction specificity of PARP1, an important drug target and component of DNA damage response. The focus of the work is on the specific role of HPF1, and how PARP1's numerous activities are altered by complexation with it and with a variety of substrates. There are many important findings described in this paper, which will be of great interest to the researchers studying PARP1 and issues related to NAD+ metabolism. Perhaps the most significant finding is that HPF1 binding to PARP1 causes a shift from primarily PARylation activity to that of hydrolytic activity, yielding a large pool of free ADPR. The paper is very well written. Addressing the following issues would provide clarity.

      1) The kcat enhancement from employing nucleosome substrates is exceedingly small, and probably will not ever be clearly correlated to a specific structural feature. However, more concerning is a possible uncontrolled variable when examining the nucleosome substrates. Specifically, the nucleosome substrates which yield a distinctly higher kcat (Table 1) are the larger, trivalent nucleosomes. It seems prudent to show that simply adding more potential binding sites, or perhaps just adding more protein itself is not causing these small increases in kcat (relative to DNA alone).

      2) Concerning the assignment of E284 of HPF1 as the catalytic base in the deprotonation of the Ser hydroxyl, I'm wondering if there might be a dynamical explanation for its role instead. E284A causes a significant decrease in the KD for HPF1 binding, and an elimination of the observed PARylation activity, suggesting that it may play an allosteric role. Also, we see from Table 2 that H303Q also produces a large reduction in the activity and large reduction in the KD; the standard error on the H303Q binding data is very large, but does suggest that some observations were quite low (similar to E284A). Additionally, H303Q almost eliminates enzymatic activity as well. Overall, this set of data gives me pause about certainty of the assignment of E284 as the catalytic base, as there may be a more complex origin of the loss of enzymatic activity.

      3) It may be that the reason that there is no apparent PARylation at the standard carboxylate residue sites (in the presence of HPF1) is that they are forming transient ester bonds with the anomeric carbon, which are labile to hydrolysis. I feel that a better development of the treadmilling effect would enhance the paper (e.g., mutation of the orthodox carboxylate nucleophiles and examination of changes in HPF1-induced hydrolytic activity). I'm not sure that it can be quantitatively shown that the shorter PAR chains in the presence of HPF1 account for the pool of free ADPR.

    4. Evaluation Summary:

      This manuscript describes a set of biochemical studies on the substrate and reaction specificity of poly(ADP-ribose) polymerase 1 (PARP1), an important antineoplastic drug target and component of DNA damage response. The most significant finding is that histone PARylation factor (HPF1) binding to PARP1 causes a shift from primarily PARylation activity to that of hydrolytic activity, which offers new avenues for understanding and controlling PARP1. While some of the observed effects need a modest amount of further explanation, the findings described in this paper are of broad interest to readers in the fields of DNA damage response, chromatin structure regulation, and to researchers studying PARP1 and issues related to NAD+ metabolism.

      (This preprint has been reviewed by eLife. We include the public reviews from the reviewers here; the authors also receive private feedback with suggested changes to the manuscript. The reviewers remained anonymous to the authors.)

    1. This manuscript is in revision at eLife

      The decision letter after peer review, sent to the authors on October 28 2020, follows.

      Summary

      PP1 and PP2A make up the majority of serine/threonine phosphatase activity in the cell. While substrate recognition has been studied for PP1 and PP2B, the substate recognition of PP2A holoenzymes are less understood. Here, Fowle et al. set to understand substrate recognition of B55/PP2A. Using a specific substrate of B55, p107, the authors identify a conserved binding motif (HxRVxxV) for recognition by B55 and show additional B55 substrates also contain this motif. This work incorporates many complementary structural and biochemical assays to delineate the binding and recognition of substrates by B55.

      Essential Revisions

      1) What is the evidence that this motif is only recognized by B5alpha/PP2A and not other B55 family members? Are the residues identified in B5alpha critical to the p107 interaction (D197 and L225) conserved among all of the isoforms? If they are, can other B55 family members bind p107?

      2) Have the authors looked for the HxRVxxV motif across the proteome? The author only state that they noticed that this motif was found in Tau, p130 and MAP2, but how many proteins contain these motifs? A list or understanding of the potential proteins which contain this motif could give researchers outside the field a link to understand the phosphatase important for their protein of interest.

      3) For the P107 deletion mutants has the expression of each one been confirmed in Figure 1 and is decreased binding to PP2A B55alpha been normalized to the expression of these mutants.

      4) Is the phosphorylation of p107 by CDK2 affecting the affinity of B55 binding to this substrate?

      5) Have the authors considered measuring direct binding affinities using ITC/SPR for example to look at the effects of these various mutants in a cell free / in vitro system?

      6) It would have been interesting to study the effects of the various B55 mutants on the endogenous phosphorylation of p107, Rb, and KSR?

      7) To gain insights into the physiological role of the identified domain of p107 in PP2A-B55 binding and in the dephosphorylation of this protein, new "in cellulo" experiments using the full length p107 mutant protein have to be performed and its impact in the temporal pattern of dephosphorylation analyzed.

      8) Figure 1D, it is obvious that in order to compare the levels of PP2A-B55 associated to each construct it is essential to normalize the levels of A and B55 signals to the quantity of protein that is recovered in each pulldown. As such, the levels of each GST construct in the pulldowns have to be measured by western blot and used to obtain the PP2A A our B55/GST-spacer ratio. Ratios can be then compared.

      9) The authors state that: "a mutant lacking residues C-terminal of R2 binds B55α similarly to the full construct, indicating that residues C-terminal to the R2 domain are dispensable for B55α Binding". Do "residues C-terminal of R2" mean full R2 region? If this is the case, this statement is not supported by Supplementary Figure 1B, where western blot of construct 2 and 7 display dramatically reduced B55 and A levels.

      10) The authors tested the effect of KR residue mutation in the R1 and R2 regions in p107 dephosphorylation. KR mutants used for the R1 are R621A/K623A, the two mutants that were tested in Figure 1D and that were shown to impact B55 binding. However, they select K657A/R659A for R2 region. These two mutants were not tested in Figure 1D. Why do they introduce these mutants and not R647A that was investigated in Figure 1D? If the authors think that these residues are important, why did they not test them for its capacity to bind B55 in Figure 1D?

      11) Other cdk-dependent phosphorylation sites on p107 that are essential for E2F binding have been described. Some of these sites are out of the spacer sequence. It will be interesting to know whether the dephosphorylation of these sites are dependent on PP2A-B55 and regulated by the mutants on the spacer sequence that decrease B55 binding.

      12) Figure 4A and B. Dephosphorylation pattern of R1R2 control construct is drastically different in Figure 4A compared to 4B. In the first case, complete dephosphorylation does only take place upon two hours of incubation compared with fifteen minutes in the second. This is very weird if the same purified phosphatase is used in both experiments. In this line, I would expect a timing of few minutes for a total dephosphorylation when a purified phosphatase is used. Does it mean that phosphatase in Figure 4A lost activity?

      13) "In vivo" experiments on the dephosphorylation of the non-binding p107 full length mutants have not been performed. To demonstrate that these residues are physiologically relevant for the physiological temporal p107 dephosphorylation pattern, these experiments must be done.

      14) In the same line, to really show the involvement of the pST-x(5-10)-(RK)-Vxx(VI)R in Tau dephosphorylation by PP2A-B55 a direct mutant of this sequence of Tau should be checked.

      15) What are the consequences of B55a-interaction mutants in p107 function? Is that mutant protein able to sustain cell cycle arrest?

      16) Since the authors propose a new model/motif, it would be great to add some statistics on to what extent this motif is present in the numerous hits found in recent screens for B55 targets during mitotic exit. Is this motif present in B55 targets involved in non-cell-cycle (TAU) or cell-cycle targets? Is it equally present in proteins dephosphorylated during early versus late mitotic exit? Any hint into these questions may facilitate the impact of the model proposed in the biology of PP2A/B55.

    1. Reviewer #2 (Public Review):

      Alvarez et al. present a study of the heritability of functional properties of early visual cortex, as assessed by a population receptive field (pRF) analysis of retinotopic mapping data in monozygotic (MZ) versus dizygotic (DZ) twin pairs. The use of a MZ versus DZ twin design is a strength, as it permits estimates of heritability, and connects the retinotopic mapping and pRF literature to the literature examining heritability of a diverse range of cognitive functions.

      I have only one point of concern that I feel the authors should address. It seems that the correlation analysis assumes that each vertex in the cortical surface model represents an independent observation, but an assumption of independence does not appear to be satisfied. FMRI responses in nearby vertices are expected to be highly inter-dependent, as a single fMRI voxel may be mapped onto many vertices. Spatial blurring intrinsic to the fMRI signal (i.e., point-spread function), as well as the spatial smoothing of pRF parameters that was performed, would be expected to exacerbate this issue.

    2. Reviewer #1 (Public Review):

      The authors employed population receptive field (pRF) mapping to characterize responses to visual stimuli in early visual cortical areas V1-V3 and to compare the similarity of pRF properties in pairs of monozygotic versus dizygotic twins. They find closer correspondence of the anatomical location and spatial extent of the visual areas, pRF locations (polar angle and eccentricity) in the retinotopic cortical maps of visual space, and spatial selectivity of responses (pRFs size) in monozygotic twins, relative to dizygotic twins, indicating heritability of these structural and functional properties of early visual cortex.

      The pRF mapping procedures used in this study are appropriate and standard in the field, and the statistical analysis and data presentation are thorough and rigorous. Given the many previous demonstrations of heritability in multiple aspects of visual perception and physiological responses to visual stimuli, it would be very surprising if any of the properties studied by the authors did not exhibit some amount of heritability. This paper therefore adds to the list of known heritable properties of the visual system but does not contribute theoretical or conceptual advances or challenge any existing frameworks.

      The fact that pRF eccentricity was more correlated and showed less heritability than pRF polar angle is interesting but was not interpreted or followed up in any meaningful way. Overall, the analyses are basic (% overlap of retinotopic maps and the three main pRF parameters) and descriptive.

    3. Evaluation Summary:

      The paper was viewed as generally sound. There main concern was that the findings were viewed as incremental without a demonstration of a link between the heritability of pRF properties and visual perception. The speculation in the Discussion about shared perceptual experience is intriguing, but psychophysical (or other) evidence would be needed to really make that point clearly. In addition, there was some discussion about the non-independence of vertices and correlation values. In the end, we all agreed that non-independent vertices may inflate correlation coefficient values, but that this is unlikely to substantially affect conclusions drawn from comparisons of monozygotic and dizygotic twins.

      (This preprint has been reviewed by eLife. We include the public reviews from the reviewers here; the authors also receive private feedback with suggested changes to the manuscript. Reviewer #1 agreed to share their name with the authors.)

    1. Reviewer #3 (Public Review):

      Summary:

      This is a tools paper that describes an open source software package, BonVision, which aims to provide a non-programmer-friendly interface for configuring and presenting 2D as well as 3D visual stimuli to experimental subjects. A major design emphasis of the software is to allow users to define visual stimuli at a high level independent of the actual rendering physical devices, which can range from monitors to curved projection surfaces, binocular displays, and also augmented reality setups where the position of the subject relative to the display surfaces can vary and needs to be adjusted for. The package provides a number of semi-automated software calibration tools to significantly simplify the experimental job of setting up different rigs to faithfully present the intended stimuli, and is capable of running at hardware-limited speeds comparable to and in some conditions better than existing packages such as Psychtoolbox and PsychoPy.

      Major comments:

      While much of the classic literature on visual systems studies have utilized egocentrically defined ("2D") stimuli, it seems logical to project that present and future research will extend to not only 3D objects but also 3D environments where subjects can control their virtual locations and viewing perspectives. A single software package that easily supports both modalities can therefore be of particular interest to neuroscientists who wish to study brain function in 3D viewing conditions while also referencing findings to canonical 2D stimulus responses. Although other software packages exist that are specialized for each of the individual functionalities of BonVision, I think that the unifying nature of the package is appealing for reasons of reducing user training and experimental setup time costs, especially with the semi-automated calibration tools provided as part of the package. The provisions of documentation, demo experiments, and performance benchmarks are all highly welcome and one would hope that with community interest and contributions, this could make BonVision very friendly to entry by new users.

      Given that one function of this manuscript is to describe the software in enough detail for users to judge whether it would be suited to their purposes, I feel that the writing should be fleshed out to be more precise and detailed about what the algorithms and functionalities are. This includes not shying away from stating limitations -- which as I see it, is just the reality of no tool being universal, but because of that is one of the most important information to be transmitted to potential users. My following comments point out various directions in which I think the manuscript can be improved.

      The biggest point of confusion for me was whether the 3D environment functionality of BonVision is the same as that provided by virtual spatial environment packages such as ViRMEn and gaming engines such as Unity. In the latter software, the virtual environment is specified by geometrically laying out the shape of the traversable world and locations of objects in it. The subject then essentially controls an avatar in this virtual world that can move and turn, and the software engine computes the effects of this movement (i.e. without any additional user code) then renders what the avatar should see onto a display device. I cannot figure out if this is how BonVision also works. My confusion can probably be cured by some additional description of what exactly the user has to do to specify the placement of 3D objects. From the text on cube mapping (lines 43 and onwards), I guessed that perhaps objects should be specified by their vectorial displacement from the subject, but I have very little confidence in my guess and also cannot locate this information either in the Methods or the software website. For Figure 5F it is mentioned that BonVision can be used to implement running down a virtual corridor for a mouse, so if some description can be provided of what the user has to do to implement this and what is done by the software package, that may address my confusion. If BonVision is indeed not a full 3D spatial engine, it would be important to mention these design/intent differences in the introduction as well as Supplementary Table 1.

      More generally, it would be useful to provide an overview of what the closed-loop rendering procedure is, perhaps including a Figure (different from Supplementary Figure 2, which seems to be regarding workflow but not the software platform structure). For example, I imagine that after the user-specified texture/object resources have been loaded, then some engine runs a continual loop where it somehow decides the current scene. As a user, I would want to know what this loop is and how I can control it. For example, can I induce changes in the presented stimuli as a function of time, whether this time-dependence has to be prespecified before runtime, or can I add some code that triggers events based on the specific history of what the subject has done in the experiment, and so forth. The ability to log experiment events, including any viewpoint changes in 3D scenes, is also critical, and most experimenters who intend to use it for neurophysiological recordings would want to know how the visual display information can be synchronized with their neurophysiological recording instrumental clocks. In sum, I would like to see a section added to the text to provide a high-level summary of how the package runs an experiment loop, explaining customizable vs. non-customizable (without directly editing the open source code) parts, and guide the user through the available experiment control and data logging options.

      Having some experience myself with the tedium (and human-dependent quality) of having to adjust either the experimental hardware or write custom software to calibrate display devices, I found the semi-automated calibration capabilities of BonVision to be a strong selling point. However I did not manage to really understand what these procedures are from the text and Figure 2C-F. In particular, I'm not sure what I have to do as a user to provide the information required by the calibration software (surely it is not the pieces of paper in Fig. 2C and 2E..?). If for example, the subject is a mouse head-fixed on a ball as in Figure 1E, do I have to somehow take a photo from the vantage of the mouse's head to provide to the system? What about the augmented reality rig where the subject is free to move? How can the calibration tool work with a single 2D snapshot of the rig when e.g. projection surfaces can be arbitrarily curved (e.g. toroidal and not spherical, or conical, or even more distorted for whatever reasons)? Do head-mounted displays require calibration, and if so how is this done? If the authors feel all this to be too technical to include in the main text, then the information can be provided in the Methods. I would however vote for this as being a major and important aspect of the software that should be given air time.

      As the hardware-limited speed of BonVision is also an important feature, I wonder if the same ~2 frame latency holds also for the augmented reality rendering where the software has to run both pose tracking (DeepLabCut) as well as compute whole-scene changes before the next render. It would be beneficial to provide more information about which directions BonVision can be stressed before frame-dropping, which may perhaps be different for the different types of display options (2D vs. 3D, and the various display device types). Does the software maintain as strictly as possible the user-specified timing of events by dropping frames, or can it run into a situation where lags can accumulate? This type of technical information would seem critical to some experiments where timings of stimuli have to be carefully controlled, and regardless one would usually want to have the actual display times logged as previously mentioned. Some discussion of how a user might keep track of actual lags in their own setups would be appreciated.

      On the augmented reality mode, I am a little puzzled by the layout of Figure 3 and the attendant video, and I wonder if this is the best way to showcase this functionality. In particular, I'm not entirely sure what the main scene display is although it looks like some kind of software rendering — perhaps of what things might look like inside an actual rig looking in from the top? One way to make this Figure and Movie easier to grasp is to have the scene display be the different panels that would actually be rendered on each physical panel of the experiment box. The inset image of the rig should then have the projection turned on, so that the reader can judge what an actual experiment looks like. Right now it seems for some reason that the walls of the rig in the inset of the movie remain blank except for some lighting shadows. I don't know if this is intentional.

    2. Reviewer #2 (Public Review):

      BonVision is a package to create virtual visual environments, as well as classic visual stimuli. Running on top of Bonsai-RX it tries and succeeds in removing the complexity of the above mentioned task and creating a framework that allows non-programmers the opportunity to create complex, closed loop experiments. Including enough speed to capture receptive fields while recording different brain areas.

      At the time of the review, the paper benchmarks the system using 60Hz stimuli, which is more than sufficient for the species tested, but leaves an open question on whether it could be used for other animal models that have faster visual systems, such as flies, bees etc.

      The authors do show in a nice way how the system works and give examples for interested readers to start their first workflows with it. Moreover, they compare it to other existing software, making sure that readers know exactly what "they are buying" so they can make an informed decision when starting with the package.

      Being written to run on top of Bonsai-RX, BonVision directly benefits from the great community effort that exists in expanding Bonsai, such as its integration with DeepLabCut and Auto-pi-lot. Showing that developing open source tools and fostering a community is a great way to bring research forward in an additive and less competitive way.

    3. Reviewer #1 (Public Review):

      In this project, the authors set out to create an easy to use piece of software with the following properties: The software should be capable of creating immersive (closed loop) virtual environments across display hardware and display geometries. The software should permit easy distribution of formal experiment descriptions with minimal changes required to adapt a particular experimental workflow to the hardware present in any given lab while maintaining world-coordinates and physical properties (e.g. luminance levels and refresh rates) of visual stimuli. The software should provide equal or superior performance for generating complex visual cues and/or immersive visual environments in comparison with existing options. The software should be automatically integrated with many other potential data streams produced by 2-photon imaging, electrophysiology, behavioral measurements, markerless pose estimation processing, behavioral sensors, etc.

      To accomplish these goals, the authors created two major software libraries. The first is a package for the Bonsai visual programming language called "Bonsai.Shaders" that brings traditionally low-level, imperative OpenGL programming into Bonsai's reactive framework. This library allows shader programs running on the GPU to seamlessly interact, using drag and drop visual programming, with the multitude of other processing and IO elements already present in numerous Bonsai packages. The creation of this library alone is quite a feat given the complexities of mapping the procedural, imperative, and stateful design of OpenGL libraries to Bonsai's event driven, reactive architecture. However, this library is not mentioned in the manuscript despite its power for tasks far beyond the creation of visual stimuli (e.g. GPU-based coprocessing) and, unlike BonVision itself, is largely undocumented. I don't think that this library should take center stage in this manuscript, but I do think its use in the creation of BonVision as well as some documentation on its operators would be very useful for understanding BonVision itself.

      Following the creation of Bonsai.Shaders, the authors used it to create BonVision which is an abstraction on top of the Shaders library that allows plug and play creation of visual stimuli and immersive visual environments that react to input from the outside world. Impressively, this library was implemented almost entirely using the Bonsai visual programming language itself, showcasing its power as a domain-specific language. However, this fact was not mentioned in the manuscript and I feel it is a worthwhile point to make. The design of BonVision, combined with the functional nature of Bonsai, enforces hard boundaries between the experimental design of visual stimuli and (1) the behavioral input hardware used to drive them, (2) the dimensionality of the stimuli (i.e. 2D textures via 3D objects), (3) the specific geometry of 3D displays (e.g. dual monitors, versus spherical projection, versus head mounted stereo vision hardware), and (4) automated hardware calibration routines. Because of these boundaries, experiments designed using BonVision become easy to share across labs even if they have very different experimental setups. Since Bonsai has integrated and standardized mechanisms for sharing entire workflows (via copy paste of XML descriptions or upload of workflows to publicly accessible Nuget package servers), this feature is immediately usable by labs in the real world.

      After creating these pieces of software, the authors benchmarked them against other widely used alternatives. IonVisoin met or exceeded frame rate and rendering latency performance measures when compared to other single purpose libraries. BonVision is able to do this while maintaining its generality by taking advantage of advanced JIT compilation features provided by the .NET runtime and using bindings to low-level graphics libraries that were written with performance in mind. The authors go on to show the real-world utility of BonVision's performance by mapping the visual receptive fields of LFP in mouse superior colliculus and spiking in V1. The fact that they were able to obtain receptive fields indicates that visual stimuli had sufficient temporal precision. However, I do not follow the logic as to why this is because the receptive fields seem to have been created using post-hoc aligned stimulus-ephys data, that was created by measuring the physical onset times of each frame using a photodiode (line 389). Wouldn't this preclude any need for accurate stimulus timing presentation?

      Finally the authors use BonVision to perform one human psychophysical and several animal VR experiments to prove the functionality of the package in real-world scenarios. This includes an object size discrimination task with humans that relies on non-local cues to determine the efficacy of the cube map projection approach to 3D spaces (Fig 5D). Although the results seem reasonable to me (a non-expert in this domain), I feel it would be useful for the authors to compare this psychophysical discrimination curve to other comparable results. The animal experiments prove the utility of BonVision for common rodent VR tasks.

      In summary, the professionalism of the code base, the functional nature of Bonsai workflows, the removal of overhead via advanced JIT compilation techniques, the abstraction of shader programming to high-level drag and drop workflows, integration with a multitude of input and output hardware, integrated and standardized calibration routines, and integrated package management and workflow sharing capabilities make Bonsai/BonVision serious competitors to widely-used, closed-source visual programming tools for experiment control such as LabView and Simulink. BonVision showcases the power of the Bonsai language and package management ecosystem while providing superior design to alternatives in terms of ease of integration with data sources and facilitation of sharing standardized experiments. The authors exceeded the apparent aims of the project and I believe BonVision will become a widely used tool that has major benefits for improving experiment reproducibility across laboratories.

    4. Evaluation Summary:

      Increasingly, neuroscience experiments require immersive virtual environments that approximate natural sensory motor loops while permitting high-bandwidth measurements of brain activity. BonVision is an open-source graphics programming library that allows experimenters to quickly implement immersive 3D visual environments across display hardware and geometry with automated calibration and integration with hundreds of different neural recording technologies, behavioral apparatuses, etc. BonVision standardizes sharing complex, closed-loop visual tasks between labs with vastly different equipment, provides a concrete and easy way to do so, and should be of interest to a wide array of visual systems neuroscientists.

  3. Feb 2021
    1. Reviewer #3 (Public Review):

      In this article, Gregory Grecco and colleagues developed a novel translational mouse model of prenatal methadone exposure (PME) that closely resembles the opioid exposure experienced by pregnant women living with opioid use disorder and treated with methadone maintenance pharmacotherapy. The article delineates the impact of prenatal methadone exposure on physical development and motor behavior of the next generation male and female progeny. The authors also relied on a combination of electrophysiological, immunohistochemical and volumetric MRI imaging approaches to investigate the mechanisms underlying PME-derived phenotypes in male and female offspring. Overall, PME produced changes in motor function, motor coordination and growth in progeny. These phenotypes were accompanied by changes in the electrophysiological properties and density of neurons in the primary motor cortex of offspring raised by opioid-exposed dams.

      One of the stated goals by the authors was to develop a mouse model that closely mirrored exposure and dosing regimens in clinical populations living with opioid use disorder in order to increase the translational value of the findings outlined in this report. One of the strengths of the article is the experimental design and the longitudinal nature of the studies. The dams were first treated with oxycodone, a commonly abused pain killer to mimic this condition in patients living with SUD. 5 days prior to mating, the animals were switched to methadone to model maintenance pharmacotherapy that is commonly used in SUD patients. The doses of oxycodone and methadone were carefully selected to mimic as closely as possible the suspected exposure experienced by pregnant women and their unborn offspring. The authors demonstrated that the concentrations of methadone and related metabolites were present in the plasma, brain and placentas of dams and offspring in the opioid-treated group during gestation, parturition and up to one week after birth. Another strength of the study was the fact that the authors convincingly demonstrated a lack of change in maternal behavior in the opioid-treated dams, which could have been a major confounding factor. The dams exposed to oxycodone and methadone did develop dependence to opioids as expected, however the amount and nature of maternal care delivered to their offspring was not affected by oxycodone and methadone exposure. This critical finding enabled the authors to delve further into the biological underpinnings of the observed phenotypes. The offspring produced by opioid-exposed dams showed some phenotypes consistent with neonatal opioid withdrawal syndrome (NOWS) in humans, including hyperthermia and twitches or jerks. Together, these findings demonstrate that the authors were successful in creating a novel model of prenatal opioid use and methadone maintenance in mice.

      Overall, both males and females produced by opioid-treated dams had lower body weight and length during development and through adolescence. Bone volume was also lower in PME offspring compared to controls at 1 week of age, an effect that dissipated by adolescence in PME progeny. Locomotor activity was reduced at P1 and increased at P7 and P21. Interestingly, ultra sonic vocalization emitted by pups when separated from their mothers, was highest for PME females compared to all groups and this increase in calls also coincided with increased activity. PME offspring also had delays in demonstrated coordinated motor behaviors such as acquisition of surface righting, forelimb grasp and cliff aversion during the early stages of development. Prepulse inhibition, a measure of sensorimotor gating was not disrupted by PME.

      At the anatomical level, the largest impact of PME was found in the primary motor region of the cortex, where cell density was reduced particularly in the upper cortical layers. Next, the authors probed the properties of cells and circuits in primary motor cortex and found reduced firing rates in response to injected currents in PME animals compared to controls. The input resistance of these cells was also diminished in the PME group. Together, these findings suggest that the number of cells may be reduced by PME in primary motor cortex and that the remaining neurons are not able to fire as effectively, resulting in blunted transmission within this brain region. Lastly, the authors stimulated local synaptic inputs to M1 using glutamate uncaging and found that the neural circuits connecting the top layers of M1 to layer 5 are enhanced in PME animals.

      Overall, the authors identified some electrophysiological correlates of altered motor function and coordination produced by a novel prenatal opioid exposure model and regimen. This article had several strengths highlighted above but also included some areas of potential improvement. The authors included both sexes in many of their analyses but it is not always clear when the sex of the offspring were combined in the analyses and/or whether sex was always included as a factor in the many endpoints described in the paper. The authors acknowledge some of the limitations of their model in better understanding OUD in pregnant women. Including the caveat that many women do not switch to maintenance therapy prior to conception would be worth mentioning. Moreover the use of buprenorphine has increased in recent years and methadone is not the only maintenance therapy available. Lastly, the electrophysiological recordings do not exactly coincide with some of the overt phenotypes reported: at P21, the PME animals are hyperactive but the time window does not match with the coordination deficits reported. Overall, these minor weaknesses detracted only slightly from the overall impact and value of the reported findings.

    2. Reviewer #2 (Public Review):

      This manuscript establishes a novel rodent model for prenatal methadone exposure and characterizes various aspects of neurodevelopment in the offspring. Given the global opioid crisis and the rampant rise of drug use by pregnant mothers and incidence of neonatal abstinence/opioid withdrawal syndrome, there is a critical need to determine potential outcomes for children born with this condition. In their model, the investigators use mice that are already taking oxycodone and switched to methadone treatment prior to becoming pregnant, which is a major translational advantage compared to other models where opioid dosing does not start until sometime mid-gestation. The experimental design also included a wide variety of measurable endpoints, including physical development, sensorimotor behavioral tasks, vocalizations, brain imaging, circuit electrophysiology, and histology; this comprehensive approach allows for synthesis of the results that has traditionally been difficult to find in this field, given the vast differences in species, dosing paradigms, etc. Sex differences were also considered, which is especially important given what is known about varying rates of NOWS between males and females. The text is very well-written, including detailed descriptions of statistical analysis.

      Despite overall enthusiasm for the study and its findings, there are some concerns regarding the brain volume analyses as well as potential stress confounds with the experimental design. The analysis of structural differences measured by volumetric MRI showed that there were no appreciable differences across grey matter structures with PME (Supp. Fig. 9). This was surprising, given that regional decreases in brain volume are a consistent finding with prenatal drug-exposed offspring (Yuan et al., 2014 [DOI 10.1038/jp.2014.111]; Sirnes et al., 2017 [DOI 10.1016/j.earlhumdev.2017.01.009]; Nygaard et al., 2018 [DOI 10.1016/j.ntt.2018.04.004]). Traditionally, these deficits tend to be more true for white matter than grey, though the authors do not indicate whether this was investigated.

      The opioid dosing protocol required twice-daily subcutaneous injections for at least 3 weeks (possibly longer, but it was difficult to determine from the text when exactly the treatments were halted). The effects of maternal/prenatal stress, even in the vehicles, cannot be discounted. The authors rightly noted this caveat in the Discussion, but it remains a critical concern in this otherwise well-designed study.

    3. Reviewer #1 (Public Review):

      The authors have succeeded in their attempt to develop and characterize a rigorous preclinical model of prenatal methadone exposure secondary to pre-pregnancy prescription opioid use. The model is a technical advance in terms of the opioid exposure being consistent throughout pregnancy and the outcome measures of methadone impact are rigorous. Many aspects neurodevelopment and key physiological processes are assessed and key knowledge is provided about the effects of prenatal methadone exposure on physical development, sensorimotor behavior and neuronal properties.

      Major strengths include the thoroughness and rigor of analyses and the multiple body systems study. In addition, scientific questions are approached using physical, biochemical and behavioral assessments to fully characterize the effects of prenatal methadone exposure.

      The strengths of this paper outweighs the weaknesses. Weakness are minor and include an incomplete assessment or discussion of whether withdrawal in the postnatal period may explain the pathophysiology described and changes in circuitry. Similarly, white matter analyses are not included MRI assessments confining the results to gray matter brain regions.

    4. Evaluation Summary:

      This work studied mice that had already taken oxycodone that then were switched to methadone treatment prior to becoming pregnant, to model prenatal methadone exposure (PME). The experimental design featured a study of a wide array of measures in the next generation progeny: including physical development, sensorimotor behavior, vocalizations, brain imaging, electrophysiology, and histology. All three reviewers agreed this work provides a novel, thorough, and highly clinically-relevant model of PME that has high value to the field of neuroscience of addictions and developmental neuropharmacology.

      (This preprint has been reviewed by eLife. We include the public reviews from the reviewers here; the authors also receive private feedback with suggested changes to the manuscript. Reviewer #1 and Reviewer #2 agreed to share their names with the authors.)

    1. Reviewer #3 (Public Review):

      In this study from the Selimi lab, Gónzalez-Calvo and colleagues investigate the role of the uncharacterized complement family protein SUSD4. SUSD4 is expressed at the time of cerebellar synaptogenesis and localizes to dendritic spines of Purkinje cells. Susd4 KO mice show impaired motor learning, a cerebellum-dependent task. Susd4 KO mice display impaired LTD and facilitated LTP at parallel fiber (PF)-Purkinje cell (PC) synapses, indicating altered synaptic plasticity in the absence of Susd4. Climbing fiber (CF)-Purkinje cell synapses show largely normal basal transmission, with the exception of larger quantal EPSCs. Immunohistochemical analysis shows a small decrease in the proportion of CF/PC synapses lacking GluA2. As their data indicates a role for SUSD4 in regulation of postsynaptic GluA2 content at cerebellar synapses, they next explored the molecular mechanism by which SUSD4 might do so. Activity-dependent degradation of GluA2 does not occur in the absence of SUSD4. Affinity purification of proteins associated with recombinant SUSD4 identifies ubiquitin ligases as well as several proteins involved in AMPAR turnover. Finally, the authors show that SUSD4 can bind GluA2 in HEK cells, and that SUSD4 can bind the ubiquitin ligase NEDD4, but that these two interactions are not dependent on each other.

      This study provides novel insight in the uncharacterized role of SUSD4 and provides a detailed and well-performed analysis of the Susd4 loss of function phenotype in the cerebellar circuit. The exact mechanism by which SUSD4 affects GluA2 levels remains unclear. However, their findings provide leads for further functional follow-up studies of SUSD4.

      Specific comments:

      1) Localization of SUSD4. The authors demonstrate localization to spines in distal PC dendrites (Fig. 1C). Does SUSD4 also localize to CF/PC synapses? This is important to establish given the phenotype of increased quantal EPSCs and decreased proportion of synapses without GluA2 at the CF/PC synapse.

      2) Figure 4B: There seems to be considerably less surface GluA2 in Susd4 KO cerebellar slices. Is the difference in surface GluA2 between WT and KO significant? Although the mean reduction in surface GluA2 in Susd4 KO following cLTD is similar to WT, the difference with control is not significant. This should be pointed out in the text because it can not be definitively concluded that endocytosis of GluA2 is not altered in Susd4 KO on the basis of this experiment.

      3) Figure 4D: The colocalization of SUSD4 with GluA2 is difficult to see in this image. An inset with higher zoom could help. Quantification of colocalization using e.g. Manders coefficient would help.

      4) Figure 5B: The negative control used here, PVRL3alpha, lacks an HA tag. This therefore does not control for non-specific interactions of highly overexpressed membrane proteins in co-transfected HEK cells. The authors should use an HA-tagged membrane protein as a control here to demonstrate that the interaction of SUSD4 and GluA2 is specific for SUSD4.

      5) Figure 5D: The level of GluA2 recovered in the IP appears normalized to HA-SUSD4. This does not control for the variations in GluA2 input levels shown in Fig. S11. Statements on amounts of GluA2 recovered for various SUSD4 mutants should be adjusted to take this into account.

      6) Line 357: binding of SUSD4=is likely meant to be binding of NEDD4.

    2. Reviewer #2 (Public Review):

      The authors show that SUSD4 is expressed throughout the brain and is abundant in cerebellar dendrites and spines. Mice with deletion of SUSD4 have motor coordination and learning deficits, along with impaired LTD induction. The also attempt to show that GluA2 AMPA subunits are misregulated, but that is not as convincing. They find Nedd1, along with many other proteins in a proteomic screen for SUSD4 interactors, and try to explain the phenotypes through the regulation of GluA2 degradation by Nedd4 through SUSD4. These are potentially interesting findings, but very preliminary at this point. While the electrophysiology is good, the mechanistic studies are incomplete.

      Major comments:

      In Figure 1 localization images are shown using exogenous protein. Can the authors visualize endogenous protein?

      It appears that SUSD4 is expressed in multiple brain regions, even at higher levels than the cerebellum. The authors should provide a good explanation for why deficits in the KO do not affect other functions, and seem to preferentially affect cerebellar functions.

      Figure 4: immunofluorescence data are not very convincing.

      Figure 5: The use of the word "could" is not supporting a strong conclusion. The authors should demonstrate whether SUSD4 DOES indeed regulate GluA2.

      Overall, while the electrophysiology seems fine, the mechanistic studies are preliminary and speculative at this point.

    3. Reviewer #1 (Public Review):

      This is a highly interesting manuscript by Gonzalez-Calvo et al., describing the involvement of the CCP domain containing protein SUSD4 in the degradation of GluA4 receptors at cerebellar synapses. The novelty of this work lies in the specificity of this degradation pathway. In comparison, synaptic proteins involved in AMPA receptor endocytosis, such as GRIP1 and PICK1, play a role in multiple trafficking processes. In addition, CCP domain proteins play a role in synaptic pruning, which is closely related to LTD. We will return later to this point.

      The paper will certainly enrich the field and further our understanding of cellular plasticity in the cerebellum. These are exciting findings that should be published. I have three relatively minor comments:

      1) Figure 2E: it is surprising that the potentiation shown in WT mice is not longer lasting. Under the experimental conditions used here, plasticity seems to be biased towards depression. In the methods, the authors state that they use 2mM Calcium and 1mM Magnesium in their external saline. A recent study (Titley et al., J. Physiol. 597, 2019) has demonstrated that under realistic conditions (incl. an ion milieu of 1.2 mM Calcium and 1mM Magnesium), LTP results under most conditions - even those involving climbing fiber co-stimulation - while LTD only results from prolonged complex spike firing. Optimally, the authors would establish a real LTP control in their WT mice (using conditions as described in Titley et al or similar) and test for changes in the mutants. As LTP is not the focus of this paper and this might be out of the scope of this work, it should be acceptable to leave it as it is, but this caveat should at least be discussed.

      2) Figure 3: The climbing fiber physiology is described in detail, but what is missing is a characterization of potential changes in the complex spike waveform, recorded in current-clamp mode. This should certainly be provided. This is important as it has been shown that changes in the complex spike waveform affect the probability for LTD induction (Mathy et al., Neuron 62, 2009). The CF-EPSC is a rather indirect measure.

      3) Is synaptic pruning at parallel fiber synapses impaired in the SUSD4 mutants? The LTD deficit is quite obvious. In the light of the role of autophagy in pruning, and the molecular similarity between LTD and pruning, it would be of interest to see whether activity-dependent pruning at these synapses is altered. This aspect is somewhat addressed by the VGLuT1 measures shown in Figure 2, but should be discussed in more depth.

    4. Evaluation Summary:

      The reviewers agreed that this is a very interesting paper that demonstrates the involvement of a specific protein degradation pathway in a form of synaptic plasticity in the cerebellum. The strength of the work results from its innovative character. The authors show that SUSD4 is expressed throughout the brain and is abundant in cerebellar dendrites and spines. Mice with deletion of SUSD4 have motor coordination and learning deficits, along with impaired LTD induction. This study provides novel insight in the uncharacterized role of SUSD4 and provides a detailed and well-performed analysis of the Susd4 loss of function phenotype in the cerebellar circuit. The exact mechanism by which SUSD4 affects GluA2 levels remains unclear. However, their findings provide leads for further functional follow-up studies of SUSD4.

      (This preprint has been reviewed by eLife. We include the public reviews from the reviewers here; the authors also receive private feedback with suggested changes to the manuscript. The reviewers remained anonymous to the authors.)

    1. Reviewer #3 (Public Review):

      By applying modern viral tracing methods, this paper described in detail extensive input-output connections of Gad1Cre+, VgatCre+, or Ntsr1Cre+ IntA projection neurons.

      Because diverse neurons are intermingled in a small region, it is generally challenging to isolate specific excitatory or inhibitory neurons and their circuits in the cerebellar nucleus.

      The authors focused on IntA of CN and demonstrated that 1) both inhibitory (Gad1Cre+ and/or VgatCre+) and excitatory (Ntsr1Cre+) neurons comprise extensive input-output connections with many extracerebellar regions, and 2) inhibitory circuits are functionally distinct from excitatory circuits on the basis of projection targets. This work could provide insights into diversity of inhibitory IntA neurons, and thus could be an interesting addition to the field's expanding efforts to identify cell types of CN, their input-output connections, and their functions.

      However, interpreting the data is difficult because of technical challenges. Critically, the main conclusion could be compromised by experimental artifacts, which need better characterization. In addition, the text could be revised to make it more accessible to a broad audience.

    2. Reviewer #2 (Public Review):

      Judd et al. systematically examine the input/output connectivity of discrete excitatory and inhibitory neuronal subpopulations in the cerebellar interposed anterior nucleus (IntA) using conditional AAV and rabies virus mapping strategies. The authors first define distinctions in the output connectivity of excitatory and inhibitory neurons in the IntA nucleus, and describe a surprisingly much wider projection pattern by inhibitory neurons than previously thought. They also characterize distinctions in projection pattern between identifiable subtypes of IntA inhibitory neurons as well as distinctions in morphology of their terminal fields. The authors next explore the input connectivity of excitatory and inhibitory neurons in the IntA nucleus and found that excitatory output neurons receive fewer, but more organized inputs than inhibitory output neurons, and that many output targets provide reciprocal connections with the CN.

      In general, the output analysis is strong and there are only a few questions about interpretation of the distinctions of projections by different subtypes of IntA inhibitory neurons. For instance, the distribution of the initial targeting within the cerebellar nuclei, cerebellar cortex and outside the cerebellum was not analyzed in Ntsr1-Cre and Gad1-Cre similar to the analysis performed for the intersectional output analysis. Clarification on whether and how the distinctions in projections could be due to variability in the specificity of the initial targeting or recombination ability of the two mouse Cre-lines is needed to strengthen interpretation of the different projections patterns observed. As for the input analysis using rabies, there were two major issues identified.

      First, the use of conditional GFP-labeled G protein and the use of rabies that is also GFP potentially confounds analysis of input cells.

      Next, the low number of starter cells is a concern and the identity of starter cells outside the cerebellar nuclei in Ntsr1-Cre and Gad1-Cre is vague and needs to be clarified. This is important for interpretation of whether input structures observed project specifically into the CN or also into the cerebellar cortex, and whether distinctions observed in number of input structures may reflect amount of starter cells in each Cre line.

    3. Reviewer #1 (Public Review):

      In this paper, Judd et al performed intersectional viral-mediated genetics to resolve a projection map from Ntsr1-positive and inhibitory neurons in the anterior interposed nucleus. They show that, in contrast of what is currently thought, inhibitory neurons that project to the inferior olive in fact bifurcate to multiple brainstem and midbrain areas. This is a thorough and timely paper, with valuable information for cerebellar scientists with implications that will be of interest to the general neuroscience audience. As a direct consequence of the vast amount of information, this paper summarizes a lot of data using acronyms and summary schematics, which makes it at times difficult to follow the core story. A bigger concern is that the main conclusion arguing that inhibitory neurons make widespread extra-cerebellar projections relies on the assumption that the Cre-lines used in the study are able to specifically/exclusively mark to those inhibitory neurons – these details were not fully worked out in this study.

    4. Evaluation Summary:

      Judd and colleagues use a combination of mouse genetics and viral marking to expand the extra-cerebellar map of projections. These data will impact our understanding of how the cerebellum contributes to behavior and in general how brain function is packaged at the anatomical level. These data will not only impact cerebellar scientists but also those workers interested in how inter-regional brain connectivity is organized and how fine input-output circuit relationships are structured.

      (This preprint has been reviewed by eLife. We include the public reviews from the reviewers here; the authors also receive private feedback with suggested changes to the manuscript. Reviewers #1, #2, and #3 agreed to share their names with the authors.)

    1. Reviewer #3 (Public Review):

      The manuscript by Sando et al. describes experiments directed at unraveling how latrophilins (Lphns) orchestrate synapse formation. Lphns are a unique family of adhesion molecules harboring extensive extracellular N-terminal domains with several known interacting motifs coupled to the classical 7 transmembrane architecture of G-protein coupled receptors. In recently published work from the Sudhof group, Lphns were shown to play a surprising postsynaptic role in synapse formation onto CA1 pyramidal neurons with Lphn2 and 3 important for perforant path and Schaffer collateral synapse formation respectively (Sando et al., Anderson et al). However, it remains unclear whether G-protein signaling through Lphns is important for their role as synapse organizers.

      To address this issue, the authors use conditional knockout/rescue approaches to convincingly demonstrate an essential role of the GPCR domain of Lphns 2 and 3 both in vitro and in vivo. Replacing the intracellular 3rd loop of the GPCR domain (which is essential for G-protein activation) of either Lphn2 or 3 fails to rescue reduced synapse number in the knockout background (nor does deleting the entire GPCR domain). Thus it appears that cell adhesion properties alone are not sufficient for Lphn-mediated synapse formation. The experiments appear to be robust and convincing and the conceptual advance of Lphn-mediated GPCR signaling during synapse formation is substantial. I have a few specific points outlined below, but overall the authors use a nice combination of imaging, electrophysiology and rabies virus-based synaptic connectivity measurements to support their conclusions. Naturally, I'd like to know more details about the signaling requirement (e.g. how is Lphn signaling spatially compartmentalized compared to other GPCRs present, which G-protein(s) Lphns couple to, how/when/whether GPCR signaling is regulated by ligand engagement etc.) but these questions seem better suited to a separate study.

    2. Reviewer #2 (Public Review):

      This manuscript by Sando and Sudhof addresses whether GPCR activity of latrophilin2 and 3 is necessary for the role of these proteins in synapse formation. The key findings are:

      — the generation and validation of mutants that lack transmembrane and intracellular domains (but are GPI-anchored instead), the lack only intracellular domains, or that contain all domains but lack GPCR-activity. All mutants work properly in cell aggregation assays and appear to be localized normally when overexpressed in wild type neurons. This also led to the development of an elegant PKA-phosphorylation reporter assay.

      — in cultured latrohphilin 3 knockout neurons, latrophilin3 expression restores a decreased synapse density and mini-frequency, but the GPI-anchored, truncated or inactive versions do not restore these parameters.

      — in vivo/hippocampal brain slices, latrophilin2 knockout impaired perforant path but not Schaffer collateral transmission onto CA1 neurons, and rescue required latrphilin2 GPCR activity. Conversely, Latrophilin3 knockout impaired Schaffer collateral but not perforant path transmission onto CA1 neurons, and rescue required latrophilin3 GPCR activity.

      — finally, monosynaptic tracing confirmed that latrophilin3 knockout reduced inputs onto CA1 starter neurons, and rescue again required GPCR activity.

      Altogether, the data are rigorously acquired, the paper is well written, and the finding that GPCR activity is necessary for latrophilins' role is both surprising and important. It is also elegant, as coupling cell-adhesion directly to signal transduction via a single molecule for synapse formation is a compelling way to drive synaptic assemblies. Naturally, the question arises how compartmentalized GPCR-signaling then instructs synapse formation, a topic that will undoubtedly require and attract more research. This is an exciting manuscript that will inspire new research on compartmentalized GPCR signaling at the synapse. Given the central importance of surface trafficking and localization within spines for the conclusions, better description of experimental procedures and quantification, and possibly additional data would clearly strengthen this point.

    3. Reviewer #1 (Public Review):

      The general thesis of the work, provided by the authors, is the demonstration that latrophilins 2 and 3 function as classical GPCRs at the synapse and that this activity is necessary for synapse formation at a specific synapse within the hippocampus. The topic is interesting and important for several reasons. First, the knowledge of GPCRs at synaptic connections is focused largely on neurotransmitter receptors in the literature – metabotropic GluR and AChR as well as neuromodulatory neurotransmitter receptors (NPY, Seratonin etc). The mechanism demonstrated in this work concerns the function of a GPCR receptor system that could confer specificity to synapse formation.

      The effect sizes that are documented throughout this work are large, giving this reviewer confidence that the effects are robust and will be reproducible and, more importantly, are indeed a biological mechanism related to synapses.

      The other major strength of the work is that the studies in neuronal cell culture are recapitulated in vivo providing additional confidence in the validity and importance of the work. Indeed, the concept of specificity requires this type of in vivo work as the identity of synapses in culture systems can not be readily determined.

      A further strength is the rational and implementation of three mutant receptors that are used to dissect the signaling modalities of these receptors, validated for their effects on the protein and then used as rescue constructs in synaptogenesis assays.

    4. Evaluation Summary:

      The main finding that GPCR activity is necessary for latrophilins' role in synapse formation is both surprising and important. This work will inspire new research on compartmentalized GPCR signaling at the synapse.

      (This preprint has been reviewed by eLife. We include the public reviews from the reviewers here; the authors also receive private feedback with suggested changes to the manuscript. Reviewer #1 agreed to share their name with the authors.)

    1. Reviewer #3 (Public Review):

      The authors herein have nicely dissected the role of RNF43 in WNT5A signaling in mammalian cells, with a focus in the context of melanoma. They show that RNF43 inhibits WNT5A activity by ubiquitinating and thereby marking for proteasomal degradation multiple proteins involved in WNT5A signal transduction (i.e., VANGL2). The authors have performed the study in a thorough manner.

    2. Reviewer #2 (Public Review):

      In the present manuscript Radaszkiewicz et al. analyze the role of Ring Finger Protein 43 (RNF43) in inhibiting the noncanonical WNT5A pathway. The authors demonstrate that RNF43 can interact with proteins involved in the WNT5A pathway, including ROR1, ROR2, VANGL1 and VANGL2. Specifically, they propose that RNF43 induces: i) VANGL2 ubiquitination and proteasomal degradation and ii) clathrin-dependent internalization of the ROR1 receptor. Considering the role of the WNT5A pathway in melanoma metastasis and resistance to targeted therapy, the authors further explore the role of RNF43 in melanoma invasion and resistance to vemurafenib. The authors ultimately conclude that RNF43 can prevent invasion and resistance to targeted therapy by inhibiting the WNT5A pathway. The data supporting the interaction between RNF43 and proteins involved in the WNT5A pathway are pretty rigorous. However, the study would benefit from additional experiments in the context of RNF43's role in invasion and resistance to targeted therapy in melanoma. Overall, the techniques utilized in the manuscript are appropriate, however additional cell lines and in vivo studies are strongly recommended to strengthen the manuscript.

    3. Reviewer #1 (Public Review):

      The authors present data suggesting that RNF43 affects WNT5a signaling through turnover of ROR1 and ROR2 receptors on the cell surface. The strengths of this work are the many overexpression, knockdown and mutant cell lines the authors use to delineate specific protein interactions and localizations. The authors have done a good job of analyzing the interaction of multiple proteins within the Wnt signaling pathways to determine how RNF43 affects expression of proteins associated with non-canonical Wnt signaling. The weakness of this study is that most of these protein interactions were performed in 293 cells and not in melanoma cell lines. One melanoma cell line was used to relate the protein interactions studied in 293 cells to signaling in melanoma. The authors present data that suggest RNF43 decreases invasion and proliferation of melanoma cells in vitro. Analyzing the role of RNF43 in invasion, proliferation and signaling in more than one melanoma cell line would strengthen the authors conclusions about the role of RNF43 in Wnt5A signaling in melanoma.

    4. Evaluation Summary:

      Radaszkiewicz and collaborators describe RNF43 as a novel negative regulator of WNT5A-induced signaling in human cells. They demonstrate that RNF43 can interact with proteins in this pathway, namely ROR1, ROR2, VANGL1 and VANGL2. Specifically, they find that, through these interactions, RNF43 can suppress invasive properties of melanoma cells, as well as the development of resistance to BRAF V600E inhibitor. The experiments are well done and well explained; however, they were performed only in an in vitro setting and with a very limited number of cell lines.

      (This preprint has been reviewed by eLife. We include the public reviews from the reviewers here; the authors also receive private feedback with suggested changes to the manuscript. The reviewers remained anonymous to the authors.)

    1. Reviewer #3 (Public Review):

      P2X2 receptor channels do not have a canonical voltage-sensor, yet they display profound voltage-dependence especially when activated by physiologically relevant low ATP concentrations. Understanding the mechanisms of this voltage dependence is not an easy undertaking because there are neither similar proteins as precedent nor clear indications from available structures. In this manuscript, Andriani and Kubo incorporated Anap into 96 residues (separately) in P2X2 receptor channels and performed a comprehensive scanning using voltage-clamp fluorometry technique to probe structural changes during ATP- and voltage-dependent gating. Out of the 96 residues, the authors only observed voltage-dependent fluorescence intensity (F) changes at A337 and I341 in the TM2 domain. The changes are fast and linear, consistent with them being electrochromic effect. When an additional mutant K308R is introduced, the authors were able to detect a small slow and voltage-dependent F change at A337, which could potentially result from structural rearrangements at this position. With a P2X2 model built upon the hP2X3 open state structure, they also proposed that A337 interacts with F44 in TM1, and this interaction is important for activation. The amount of work involved in this study is impressive. The data presented are of good quality. Most conclusions drawn from the results are reasonable and backed with good evidence.

      Overall, the identification of a converged electric field around A337 and I341 is new and intriguing. Previously reported functional results and available high resolution P2X receptor structures all suggest that residues A337 and I341 are facing TM1 and they are accessible to Ag+ when mutated to Cys. It is conceivable that the "voltage-sensor" in P2X2 receptor channels involve ion filled crevices between TM1 and TM2 in the membrane. This work is of great value for understanding how membrane proteins sense voltages.

    2. Reviewer #2 (Public Review):

      P2X2 activation depends on both ATP binding and voltage. However, the voltage sensor of P2X2 is not elucidated. This manuscript describes the study of voltage dependent conformational changes of P2X2 using voltage clamp fluorometry of the fluorescent unnatural amino acid Anap that substituted P2X2 amino acid residues. 96 positions in different structural domains were scanned by substituting with Anap, and voltage dependent fluorescence signals were detected only at two positions, A337 and I341 in the TM2 domain. A fast and linear voltage dependence of fluorescence suggested that the membrane voltage converged at and around these two positions. With a mutation K308R that was supposed to enhance voltage dependent conformational changes, Anap at the A337 position showed a time and voltage dependent fluorescence. The authors concluded that this result indicated a voltage dependent conformational change. Structure guided mutations suggested that F44 in TM1 might move to interact with A337 in response to voltage. In this study the fluorescence signals were small, but the authors made a great effort and managed to obtain the data that are convincing. The experiments were well designed and the manuscript is clearly reasoned. Considering that among all the positions that were tested only at the two positions in the TM2 segment Anap showed voltage dependent fluorescence, and that the F44 mutations abolished voltage dependence of the P2X2 currents, the conclusion that voltage converges at the A337/I341/F44 and induces a conformational change seems to be well supported.

    3. Reviewer #1 (Public Review):

      The study aims to determine the mechanism of voltage-sensing in P2X2 receptor. These receptors are primarily activated by ligand, ATP but their activity is also regulated to some extent by voltage even though they lack a canonical voltage-sensing domain. To address this question, the authors introduce unnatural fluorescent amino acid throughout the structure of the P2X2 receptor. The interaction between excited state dipole and electric fields can cause shift in the fluorescence emission and excitation spectra. For a given probe, the extent of these shifts are directly proportional to the strength of the electric field. The authors exploit this phenomenon to determine the strength of the electric field in the various regions of the P2X2 receptor. The underlying premise is that the regions which sense the largest electric field are likely to be the primary sensors of membrane voltage.

      Strengths:

      The approach to localize the putative voltage-sensing region is novel and maybe broadly applicable to other voltage-regulated channels which lack canonical voltage-sensors.

      Unnatural amino acid, ANAP was introduced and tested at 96 positions in the structure of P2X2 receptor. This is an insane amount of work and has to be a tour de force.

      Weakness:

      The main limitation of this approach is that ANAP is not going to be incorporated with equal efficiency at all sites and therefore, it is likely that some of the potential where the electric field is strong may remain undetected.

      Overall, using ANAP scanning approach, they were able to identify couple of sites in TM2 helix which exhibits large electrochromic signals. Furthermore, they find that the interaction between Ala 337 and Phe44 is critical for voltage-dependent response. These studies lay the groundwork for further investigations of the mechanism of voltage-sensing these physiologically important ion channels.

    4. Evaluation Summary:

      This study will be of broad interest to ion channel researchers interested in understanding the fundamental mechanisms of voltage-sensing. The researchers use a novel approach to determine the mechanism of voltage-sensing in a channel that lacks a canonical voltage-sensing domain.

      (This preprint has been reviewed by eLife. We include the public reviews from the reviewers here; the authors also receive private feedback with suggested changes to the manuscript. Reviewer #1 and Reviewer #3 agreed to share their names with the authors.)

    1. Reviewer #3 (Public Review):

      The authors describe a method for fitting a simple, separable function of contrast and cone excitation to a set of fMRI data generated from large, unstructured chromatic flicker stimuli that drive the L- and M- cone photoreceptors across a range of amplitudes and ratios. The function is of the form of a scaled ellipse – hereafter referred to as a 'Quadratic Color Model' (QCM). The QCM fits 6 parameters (ellipse orientation, ellipse elongation, and 4 parameters from a non-linear, saturating (Naka-Rushton) contrast response curve. The QCM fits the dataset well and the authors compare it (favorably) to a 40-parameter GLM that fits each separate combination of chromatic direction and contrast separately.

      The authors note three things that 'did not have to be true' (and which are therefore interesting):

      1) The data are well-fit by a separable ellipse+contrast transducer - consistent with the idea that the underlying neuronal computations that process these stimuli combine relatively independent L-M and L+M contrast.

      2) The short axis of the QCM tends to align with the L-M cone contrast directing (indicating that this direction is one of maximum sensitivity and the L+M direction (long axis) is least sensitive. This finding is qualitatively consistent with psychophysical measurements of chromatic sensitivity.

      3) Fit parameters do not change much across the cortical surface – and in particular they are relatively constant with respect to eccentricity.

      This is a technically solid paper – the data processing pipeline is meticulous, stimuli are tightly-calibrated (the ability to apply cone-isolating stimuli to fovea and periphery simultaneously is an impressive application of the 56-primary stimulus generator) and the authors have been careful to measure their stimuli before and after each experimental session. I have a few technical questions but I am completely satisfied that the authors are measuring what they think they are measuring.

      The analysis, similarly, is exemplary in many ways. Robust fitting procedures are used and model performance and generalizablility are evaluated with a leave-run-out and leave-session-out cross validation procedures. Bootstrapped confidence intervals are generated for all fits and analysis code is available online.

      The paper is also useful: it summarises a lot of (similar) previous findings in the fMRI color literature going back to the late 90s and points out that they can, in general, be represented with far fewer parameters than conditions. My main concerns are:

      1) Underlying mechanisms: The QCM is a convenient parameterization of low spatial-frequency, high temporal-frequency L-M responses. It will be a useful tool for future color vision researchers but I do not feel that I am learning very much that is new about human color vision. The choice to fit an ellipse to these data must have been motivated at least in part by inspection. It works in this case (possibly because of the particular combination of spatial and temporal frequencies that are probed) but it is not clear that this is a generic parametric model of human color responses in V1. Even very early fMRI data from stimuli with non-zero spatial frequency (for example, Engel, Zhang and Wandell '97) show response envelopes that are ellipse-like but which might well also have additional 'orthogonal' lobes or other oddities at some temporal frequencies.

      2) Model comparison: The 40-parameter GLM model provides a 'best possible' linear fit and gives a sense of the noisiness of the data but it feels a little like a strawman. It is possible to reduce the dimensionality of the fit significantly with the QCM but was it ever really plausible that the visual system would generate separate, independent responses for each combination of color direction and contrast? I suspect that given the fact that the response data are not saturating, it would be possible to replace the Naka-Rushton part of the model with a simple power function, reducing the parameter space even further. It would be more interesting to use the data to compare actual models of color processing in retina/V1 and, potentially, beyond V1.

      3) Link to perception. As the authors note, there is a rich history of psychophysics in this domain. The stimuli they choose are also, I think, well suited to modelling in the sense that they are likely to drive a very limited class of chromatic cells in V1 (those with almost no spatial frequency tuning). It is a shame therefore that no corresponding psychophysical data are presented to link physiology to perception. The issue is particularly acute because the stimulus differs from those typically used in more recent psychophysical experiments: it flickers relatively quickly and it has no spatial structure. It may, however, be more similar to the types of stimuli used prior to the advent of color CRTs : Maxwellian view systems that presented a single spot of light.

    2. Reviewer #2 (Public Review):

      The goal of this work is to advance knowledge of the neural bases of color perception. Color vision has been a model system for understanding how what we see arises from the coordinated action of neurons; detailed behavioral measurements revealed color vision's dependence upon three types of photoreceptors (trichromacy) and three second stage retinal circuits that compute sums and differences of the cone signals (color opponency). The processing of color at later, cortical stages has remained poorly understood however, and studies of human cortex have been hampered by methodologies that abandoned the detailed approach. Typical past work simply compared neural responses in two conditions, the presentation of colorful (formally, chromatic) vs grayscale (luminance) images. The present work returns to the older tradition that proved so successful.

      The project's specific goals were to measure functional MRI responses in human cortex to a large range of colors, and equally importantly, capture the pattern responses with a quantitative model that can be used to predict response to many additional colors with just a few parameters. The reported work achieved these goals, establishing both a comprehensive data set and a modeling framework that together will provide a strong basis for future investigations. I would not hesitate to query the data further or to use the QCM model the paper provides to characterize other data sets.

      The strengths of the work include its methodological rigor, which gives high confidence that the goals were achieved. Specifically:

      1) The visual presentation equipment was uniquely sophisticated, allowing it to correct for possible confounds due to differences in photoreceptor responses across the retina.

      2) The testing of the model was quite rigorous, aided by distinct replications of the experiment planned prior to data collection.

      3) The fMRI methods were also state of the art.

      The work was well-situated within the literature, comparing its findings to past results. The limitations and assumptions of the present work were also clearly stated, and conclusions were not overstated.

      Weaknesses of the current draft are relatively minor, however, I believe:

      1) The data could be presented in a way to make them more comparable to prior fMRI work, e.g. by using percent change units in more places, comparing the R^2 of model fits reported here to those reported in other papers, and explaining and exploring how the spatially uniform stimuli, used here but not in other fMRI studies, limited responses in visual areas beyond V1.

      2) Comparison between the two models, the GLM and QCM is not quite complete.

      3) The present results are not discussed in context with past results using EEG, and Brouwer and Heeger's model of fMRI responses to color.

      4) Implications of the basic pattern of response for the cortical neurons producing the data are discussed less than they could be.

    3. Reviewer #1 (Public Review):

      This manuscript presents new data and a model that extend our understanding of color vision. The data are measurements of activity in human primary visual cortex in response to modulations of activity in the L- and M-cone photoreceptors. The model describes the data with impressive parsimony. This elegant simplification of a complex data set reveals a useful organizing principle of color processing in the visual cortex, and it is an important step towards construction of a model that predicts activity in the visual cortex to more complex visual patterns.

      Strengths of the study include the innovative stimulus generation technique (which avoided technical artifacts that would have otherwise complicated data interpretation), the rigor of experimental design, the clear and even-handed data presentation, and the success of the QCM.

      The study could be improved by a more thorough vetting of the QCM and additional discussion on the biological substrate of the activation patterns.

    4. Evaluation Summary:

      This paper will be of interest to neuroscientists who study relationships between visual stimuli and their cortical representation, particularly, but not exclusively, those who use functional imaging techniques. The experiments are carefully designed, the dataset is substantial, and a model is presented that describes the data with very few parameters.

      (This preprint has been reviewed by eLife. We include the public reviews from the reviewers here; the authors also receive private feedback with suggested changes to the manuscript. Reviewer #1 and Reviewer #2 agreed to share their names with the authors.)

    1. Reviewer #3 (Public Review):

      Myotonia congenita is a heritable disorder of muscle fiber excitability in which a severe reduction of the resting chloride conductance (gCl, CLCN1 mutations) produces susceptibility to involuntary after-contractions and transient weakness. Fifty years ago, Bryant, Adrian and colleagues showed that loss of > 50% of gCl is sufficient to cause myotonic bursts of after-discharges. Much less is known about the mechanistic basis for the transient weakness (several seconds, up to 1 minute) that occurs with initial contractions after rest. This study elegantly confirms what has long been suspected; that sustained depolarization of the resting potential is the basis for the transient weakness. The experimental approach employed several new techniques to achieve this demonstration. First, the use of repeated in situ contraction tests every 4 sec (Fig. 1) clearly shows the coincidence of myotonia and transient weakness, both of which exhibit warm-up. This animal model for the transient weakness in a low gCl state was essential for the success of this study. Secondly, the remarkably stable measurements of membrane potential (Vm), without the need to apply a holding current to achieve the normal resting potential (Figure 2) is necessary to convincingly demonstrate the plateau depolarizations are a consequence of the myotonic condition, and not a stimulation artifact. Moreover, a severe reduction of fiber excitability was directly demonstrated by application of brief current pulses during the plateau depolarization (Figure 2E). Third, the authors have used the ncDHPR mouse (non-conducting CaV1.1) to show the Ca current has some role in prolonging the duration of the plateau. This is an important contribution because the sluggish, low-amplitude Ca current in skeletal muscle has not previously been implicated in the pathogenesis of myotonia. Finally, the authors built upon their recent work showing ranolazine suppresses myotonia in low gCl muscle to also show this drug abolishes the plateau potential. Taken together, this excellent study provides the most definitive experimental evidence to date for the mechanistic basis of transient weakness in myotonia congenita and also suggests ranolazine may be beneficial for prophylactic management.

      Major Points:

      1) The major experimental limitation that prevented prior studies from establishing the mechanism for the transiently reduced excitability and weakness in MC was the concern that plateau depolarizations frequently occur as an artifact in studies of skeletal muscle membrane potential (e.g. secondary to leakage current from electrode impalement or failure to completely suppress contraction with motion-induced damage). The authors are to be commended for including many records of Vm (absolutely necessary for this publication) and for explicitly stating that a holding current was not applied to maintain Vrest. The confidence of these observation could be further increased by addressing these questions:

      — Were recordings excluded from the analysis if the plateau potential was not followed by a subsequent return to Vrest? Was a criterion used to define successful return to the resting potential?

      — If fibers that failed to repolarize were excluded, was this a frequent or a rare event, and importantly, was the likelihood of failure different for control versus myotonic fibers?

      2) The data clearly show a large variance for the duration of the plateau potential (e.g. horizontal extent of data in Figure 3B), which is interesting and may provide additional insights on the balance of currents that contribute to this phenomenon. The authors also point out that the distribution was skewed toward briefer plateau periods for the 9-AC model than the adr mouse. It is suggested this difference may be a consequence of life-long reduced gCl in adr mice with some chronic compensation versus the acute block of ClC-1 in the 9-AC model. What about the possibility that the reduction of gCl is more severe in the adr fibers than in 9-AC treated animals? A residual Cl current could foreshorten the duration of the plateau potential. Another question with regard to the variable duration of the plateau potential is a "duration of 0". In other words, as shown in Fig 3C, how frequently was the absence of a PP encountered?

      3) The possibility that activity-dependent accumulation of myoplasmic Ca may contribute to the PP is suggested (page 9 line 175), but this is not further commented upon in the Discussion. Namely, is the reduction of PP duration in ncDHPR fibers proposed to be a consequence of less inward charge movement or of less myoplasmic Ca accumulation (i.e. is it a balance of ionic currents or an intracellular signaling factor)? Moreover, with regard to an activity-dependent process that influences the likelihood and/or duration of the PP, the authors quantify the "mean firing rate" and the "mean membrane potential", both quantified during the preceding myotonic burst. Both of these factors may contribute to an activity-dependent process, but another factor has been omitted; namely the duration of the antecedent myotonic run. It would be interesting to test whether the duration of the myotonic burst had an influence on the PP.

    2. Reviewer #2 (Public Review):

      The manuscript by Myers et al provides new insight into the mechanism of transient muscle in myotonia congenita, a question that has escaped understanding since its first description over >40 years ago. The authors use a complementary set of approaches (including measurements of in situ muscle force production, membrane voltage and ion currents) to determine the membrane conductances that underlie transient weakness in muscle from both genetic (Clc1-/- adr mice) and pharmacologic (9-AC-treated WT mice) models of myotonia congenita. The authors utilize a combination of a non-conducting Cav1.1 mouse and treatment with ranolazine to dissect the relative contribution of Cav1.1 and persistent Nav1.4 conductances, respectively, to sustained plateau membrane depolarizations observed following myotonic runs, which are proposed to underlie the transient weakness observed following myotonic runs.

    3. Reviewer #1 (Public Review):

      Patients with myotonia congenita caused by loss-of-function mutations in ClC-1 experience muscle stiffness (due to hyperexcitability) as well as transient muscle weakness. This study examines the mechanisms underlying the transient muscle weakness seen myotonia congenita. The authors show that a ClC-1 null mouse exhibits the transient weakness after muscle stimulation observed in humans. Current clamp recordings of muscle fibers from ClC-1-null mice showed indicated myotonia after electrical stimulation that often terminated in a plateau potential for varying periods, during which the muscle was unexcitable, before repolarization to the resting membrane potential. The myotonia and plateau potentials could be recapitulated in wild type muscle fibers with acute pharmacological inhibition of ClC-1. Experiments in fibers from a non-conducting Cav1.1 knockin mouse indicated Ca2+ influx is important for sustaining, but not initiating, plateau potentials. Ranolazine blocked both the myotonia and development of a plateau potential in isolated muscle fibers, as well as the in vivo transient muscle weakness observed in ClC-1-null mice, implicating Na+ persistent inward currents through Nav1.4 (NAPIC) as the molecular mechanism.

      Overall, the experiments presented in this work are well-executed and the results convincing. While the role of NAPIC in the development of myotonia in ClC mice has been previously reported this work provides the new insight that it is also responsible for the development of plateau potentials that underlie muscle weakness in myotonia congenita.

    4. Evaluation Summary:

      Patients with myotonia congenita (or Becker disease) experience episodes of transient muscle weakness but the reasons underlying this phenomenon are unknown. This study provides the most definitive experimental evidence to date for the mechanistic basis of transient weakness in myotonia congenita and also suggests ranolazine may be beneficial for prophylactic management.

      (This preprint has been reviewed by eLife. We include the public reviews from the reviewers here; the authors also receive private feedback with suggested changes to the manuscript. Reviewers #1, #2, and #3 agreed to share their names with the authors.)

    1. Joint Public Review:

      The presented manuscript takes a very comprehensive look at the molecular underpinnings of the differential outcomes of IL-27 and IL-6 signaling. Both cytokines engage GP130 as a cellular receptor, however while IL-6 uses homodimers of this signal transducing receptor, IL-27 signals through a heterodimer of GP130 and IL-27Ra. Both receptor complexed lead to the phosphorylation and activation of STAT1 and STAT3 and, hence, to a similar transcriptional program. Strikingly, however, IL-27 responses lean more towards an anti-inflammatory nature (suppressing Th17 and supporting Treg responses), and IL-6 stimulates a classical inflammatory response (inhibiting Treg differentiation, supporting Th17 generation). The presented study deals with elucidating this functional pleiotropy of similar or identical signal transducers.

      The authors follow a comprehensive and elaborated approach, combining in vitro experiments in cell lines and human Th1 cells with (phospho-)proteomics, transcriptome sequencing and mathematical modeling, which gives rise to an impressive data set presented in this manuscript. The large body of experimental work is complemented by mathematical modelling of the signaling pathway(s), which is used to discriminate feasibility of distinct hypothesis in terms of mechanisms behind differential STAT activation.

      The major finding of the study is that IL-27, at least in certain cells (Th-1), leads to the stronger and more sustained activation of STAT1 as compared to IL-6, and that this higher activation of STAT1 is the basis of the differential transcriptional result. The subsequent -omics analyses support differences in signaling outcome between IL-6 and IL-27, and provide an interesting data base for the community. Finally, data re-analysis in a cohort of patients suffering from the autoimmune disease Systemic lupus erythematosus (SLE), reproduced the effects expected by the mathematical model, potentially pointing to differences in their response to different cytokines.

      Overall, the extensive and complex study presents a comprehensive analyses of IL-6 and IL-27 signaling, puzzling together pieces that may have been around before but not put into meaningful context. It provides a compelling overall idea and model of how cytokine receptors make differential use of STAT proteins.

    2. Evaluation Summary:

      This study is a great example of an elaborate combination of experimental and mathematical analyses to examine an intriguing, pleiotropic immunological signaling pathway. While a good number of individual aspects of this signaling pathway have been studied and reported before, the present work pieces together many pieces and succeeds to present a conclusive and comprehensive model of this particular cytokine system. The main conclusions are well supported by the presented data and the manuscript will be of interest and relevance for the study of many other cytokine signaling pathways, being of broad relevance for immunologists and cell biologists.

      (This preprint has been reviewed by eLife. We include the public reviews from the reviewers here; the authors also receive private feedback with suggested changes to the manuscript. Reviewer #2 agreed to share their name with the authors.)

    1. Reviewer #3 (Public Review):

      Lee et al. report results from an fMRI experiment with repeated viewings of a single movie clip, finding that different brain regions come to anticipate events to different degrees. The findings are brief but a potentially very interesting contribution to the literature on prediction in the brain, as they use rich movie stimuli. This literature has been limited as it has typically focused on fixed short timescales of possible anticipation, with many repetitions of static visual stimuli, leading to only one possible time scale of anticipation. In contrast, the current video design allows the authors to look in theory for multiple timescales of anticipation spanning simple sensory prediction across seconds to complex social dynamics across tens of seconds.

      The authors applied a Hidden Markov Model to multivoxel fMRI data acquired across six viewings of a 90 second movie. They fit a small set of components with the goal of capturing the different sequentially-experienced events that make up the clip. The authors report clusters of regions across the brain that shift in their HMM-identified events from the first viewing of the movie through the (average of the) remaining 5 viewings. In particular, more posterior regions show a shift (or 'anticipation') on the order of a few seconds, while more anterior regions show a shift on the order of ~10 seconds. These identified regions are then investigated in a second way, to see how the HMM-identified events correspond to subjective event segmentation given by a separate set of human participants. These data are a re-analysis of previously published data, presenting a new set of results and highlighting how open sharing of imaging data can have great benefits. There are a few important statistical issues that the authors should address in a revision in order to fully support their arguments.

      1) The authors report different timescales of anticipation across what may be a hierarchy of brain regions. However, do these timescales change significantly across regions? The paper rests in part on these differences, but the analyses do not yet actually test for any change. For this, there are multiple methods the authors could employ, but it would be necessary to do more than fit a linear model to the already-reported list of (non-independently-sorted) regions.

      2) The description of the statistical methods is unclear at critical points, which leads to questions about the strength of the results. The authors applied the HMM to group-averaged fMRI data to find the neural events. Then they run statistical tests on the difference in the area-under-the-curve (AUC) results from first to other viewings. It seems like they employ bootstrap testing using the group data? Perhaps it got lost, but the methods described here about resampling participants do not seem to make sense if all participants contributed to the results. Following this, they note that they used a q < 0.05 threshold after applying FDR for the resulting searchlight clusters, but based on their initial statement about the AUC tests, this is actually one-tailed? Is the actual threshold for all these clusters q < 0.10? That would be quite a lenient threshold and it would be hard to support using it. The authors should clarify how these statistics are computed.

      3) Regarding the relationship to annotated transitions, the reported difference in correlations at zero lag don't tell the story that the authors wish they tell, and as such it does not appear that they support the paper. While it is interesting to see that the correlation at zero lag in the initial viewing is often positive in the independently identified clusters, the fact that there is a drop in correlation on repeated viewings doesn't, in itself, mean that there has been a shift in the temporal relationship between the neural and annotated events. A drop in correlation could also occur if there was just no longer any correlation between the neural and annotated events at any lag due to noisy measurements, or even if, for example, the comparison wasn't to repeated viewings but to a totally different clip. The authors want to say something about the shift in in the waveform/peak, but they need to apply a different method to be able to make this argument.

      4) Imaging methods with faster temporal resolution could reveal even earlier reactivation, or replay, of the movies, that would be relatively invisible with fMRI, and the authors do not discuss relevant recent work. E.g. Michelmann et al. 2019 (Nat Hum Beh) and Wimmer et al. 2020 (Nat Neuro) are quite relevant citations from MEG. Michelmann et al. utilize similar methods and results very similar to the current findings, while Wimmer et al. use a similar 'story' structure with only one viewing (followed by cued retrieval) and find a very high degree of temporal compression. The authors vaguely mention faster timescale methods in the discussion, but it would be important to discuss these existing results, and the relative benefits of these methods versus the benefits and limitations of fMRI. It would be interesting and puzzling if there were multiple neural timescales revealed by different imaging methods.

      5) The original fMRI experiment contained three conditions, while the current results only examine one of these conditions. Why weren't the results from the two scrambled clip conditions in the original experiment reported? Presumably there were no effects observed, but given that the original report focused on a change in response over time in a scrambled video where the scrambled order was preserved across repetitions, and the current report also focuses on changes across viewings, it would be important to describe reasons for not expecting similar results to these new ones in the scrambled condition.

    2. Reviewer #2 (Public Review):

      Aly et al. investigated anticipatory signals in the cortex by analysing data in which participants repeatedly watched the same movie clip. The authors identified events using an HMM-based data-driven event segmentation method and examined how the timing of events shifted between the initial and repeated presentation of the same video clip. A number of brain regions were identified in which event timings were shifter earlier in time due to repeated viewing. The main findings is that more anterior brain regions showed more anticipation than posterior brain regions. The reported findings are very interesting, the approach the authors used is innovative and the main conclusions are supported by the results and analyses. However, many cortical regions did not show any anticipatory effects and it is not clear why that is. In part, this may be due to a number of suboptimal aspects in the analysis approach. In addition, the analyses of behavioural annotations are open to multiple interpretations.

      Methods and Results:

      1) The paper shows that across multiple regions in the cortex, there is significant evidence for anticipation of events with repeated viewing. However, there are also many areas that do not show evidence for anticipation. It is not clear whether this is due to a lack of anticipation in those areas, or due to noise in the data or low power in the analyses. There are two factors that may be causing this issue. First, the data that were used are not optimal, given the short movie clip and relatively low number of participants. Second, there are a number of important issues with the analyses that may have introduced noise in the observed neural event boundaries (see points 2-4 below).

      2) Across all searchlights, the number of estimated events was fixed to be the same as the number of annotated events. However, in previous work, Baldassano and colleagues (2017) showed that there are marked differences between regions in the timescales of event segmentation across the cortex. Therefore, it may be that in regions such as visual cortex, that tends to have very short events, the current approach identifies a mixture of neural activity patterns as one 'event'. This will add a lot of noise to the analysis and decrease the ability of the method to identify anticipatory event timings, particularly for regions lower in the cortical hierarchy that show many more events than tend to be observed in behavioural annotations.

      3) If I understand correctly, the HMM event segmentation model was applied to data from voxels within a searchlight that were averaged across participants. Regular normalization methods typically do not lead to good alignment at the level of single-voxels (Feilong et al., 2018, Neuroimage). Therefore, averaging the data without first hyperaligning them may lead to noise due to functional alignment issues within searchlights.

      4) In the analyses the five repeated viewings of the clips were averaged into a single dataset. However, it is likely that participants' ability to predict the upcoming information still increased after the first viewing. That is especially true for perceptual details that may not have been memorised after watching the clip once, but will be memorised after watching it five times. It is not clear why the authors choose to average viewings 2-6 rather than analyse only viewing 6, or perhaps even more interesting, look at how predictive signals varied with the number of viewings. I would expect that especially for early sensory regions, predictive signals increase with repeated viewing.

      5) In the analyses of the alignment between the behavioural and neural event boundaries, the authors show the difference in correlation between the initial and repeated viewing without taking the estimated amount of anticipation into account. I wonder why the authors decided on this approach, rather than estimating the delay between the neural and behavioural event boundaries. The finding that is currently reported, i.e. a lower correlation between neural and annotated events in the repeated viewing condition, does not necessarily indicate anticipation. It could also suggest that with repeated viewing, participants' neural events are less reflective of the annotated events. Indeed the results in figure 5 suggest that the correlations are earlier but also lower for the repeated viewing condition.

      6) To do the comparison between neural and annotated event boundaries, the authors refit the HMM model to clusters of significant voxels in the main analysis. I wonder why this was done rather than using the original searchlights. By grouping larger clusters of voxels, which cover many searchlights with potentially distinct boundary locations, the authors may be introducing noise into the analyses.

      Discussion:

      7) To motivate their use of the HMM model, the authors state that: "This model assumes that the neural response to a structured narrative stimulus consists of a sequence of distinct, stable activity patterns that correspond to event structure in the narrative." If neural events are indeed reflective of the narrative event structure, what does it mean if these neural events shift in time? How does this affect the interpretation the association between neural events and narrative events?

    3. Reviewer #1 (Public Review):

      In this study, Lee et al. reanalyzed a previous fMRI dataset (Aly et al., 2018) in which participants watched the same 90s movie segment six times. Using event-segmentation methods similar to Baldassano et al. (2017), they show that event boundaries shifted for the average of the last 5 viewings as compared to the first viewing, in some regions by as much as 12 seconds. Results provide evidence for anticipatory neural activity, with apparent differences across brain regions in the timescale of this anticipation, in line with previous reports of a hierarchy of temporal integration windows.

      – One of the key findings of the paper – long-timescale anticipatory event reinstatement – overlaps with the findings of Baldassano et al., 2017. However, the previous study could not address the multiple time scales/hierarchy of predictions. Considering that this is the novel contribution of the current study, more statistical evidence for this hierarchy should be provided.

      – The current hierarchy of anticipation is closely linked to (and motivated by) previous studies showing evidence of a hierarchy of temporal integration windows. Indeed, the question of the study was "whether this hierarchy also exists in a prospective direction". This question is currently addressed somewhat indirectly, by displaying above-threshold brain regions, but without directly relating this hierarchy to previous findings of temporal integration windows, and without directly testing the claimed "posterior (less anticipation) to anterior (more anticipation) fashion" (from abstract).

      – The analysis is based on averaging the data of the 5 repeated viewings and comparing this average with the data of the first viewing. This means that the repeated viewing condition had much more reliable data than the initial viewing condition. This could potentially affect the results (e.g. better fit to HMM). To avoid this bias, the 5 repeated viewings could be entered separately into the analysis (e.g., each separately compared to the first viewing) and results averaged at the end. Alternatively, only the 6th viewing could be compared to the first viewing (as in Aly et al., 2018).

      – Correlation analysis (Fig 6). "we tested whether these correlations were significantly positive for initial viewing and/or repeated viewing, and whether there was a significant shift in correlation between these conditions". It was not clear to me how we should interpret the correlation results in Figure 6. Might a lower correlation for repeated viewing not also reflect general suppression (e.g. participants no longer paying attention to the movie)? Perhaps comparing the correlations at the optimal lag (for each cluster) might help to reduce this concern; that is, the correlation difference would only exist at lag-0.

      – Correlation analysis (Figure 6). "For both of these regions the initial viewing data exhibits transitions near the annotated boundaries, while transitions in repeated viewing data occur earlier than the annotated transitions" How was this temporal shift statistically assessed?

      – Not all clusters in Figure 2/6 look like contiguous and meaningful clusters. For example, cluster 9 appears to include insula as well as (primary?) sensorimotor cortex, and cluster 4 includes both ventral temporal cortex and inferior parietal cortex/TPJ. It is thus not clear what we can conclude from this analysis about specific brain regions. For example, the strongest r-diff is in cluster 4, but this cluster includes a very diverse set of regions.

      – In previous related work, the authors correlated time courses within and across participants, providing evidence for temporal integration windows. For example, in Aly et al., 2018 (same dataset), the authors correlated time courses across repeated viewings of the movie. Here, one could similarly correlate time courses across repeated viewings, shifting this time course in multiple steps and testing for the optimal lag. This would seem a more direct (and possibly more powerful) test of anticipation and would link the results more closely to the results of the previous study. If this analysis is not possible to reveal the anticipation revealed here, please motivate why the event segmentation is crucial for revealing the current findings.

    4. Evaluation Summary:

      The study addresses a topic that is timely and of general interest. The findings represent a potentially very interesting contribution to the important question of how the brain comes to predict the future, in particular lifelike sequences of events. However, some of the main conclusions would require further statistical support.

      (This preprint has been reviewed by eLife. We include the public reviews from the reviewers here; the authors also receive private feedback with suggested changes to the manuscript. Reviewer #2 agreed to share their name with the authors.)

    1. Reviewer #3 (Public Review):

      In a previous study, the authors had shown that germline tumors that accumulate in the C. elegans gonad because of the lack the RNA binding translational repressor GLD-1, have an increased propensity to differentiate and express somatic proteins in response to ER stress induced by tunicamycin or the absence of the TRK kinase protein tfg-1 (a process the authors call GED). Using this as a model, here, the authors investigate the mechanisms by which the abnormal nuclei accumulate in the tumorous gonad of glp-1 animals by manipulating genes in the soma and germline.

      The key message of this paper is, then, the identification of neurons and neuromodulators that suppress or enhance this accumulation of abnormal germline cells in the glp-1 germline. While the results of this analysis could potentially provide an interesting advance, the validity of the many of the conclusions are difficult to evaluate because of limitations posed by the experimental methods and ambiguity in defining the GED.

      Weaknesses:

      A key issue is the identity of the abnormal germline cells that accumulate in glp-1 gonads. Modulation of the neuronal circuits examined (FLP-6, serotonin, cholinergic) change the germline, alter ovulation rates, modulate somatic gonad contraction rates etc. in wild-type animals. The effects of these circuits on a glp-1 germline are not known, but some of the same effects are likely to continue even if germ cells turned tumorous. Therefore, how neurons and neuromodulators alter the accumulation of abnormal cells in the gonad may or may not be surprising or novel, based on what is actually happening to these cells (the phenotype scored as GED). However, this is unclear as all the abnormal effects on the germline are assessed using DAPI at some steady state. Therefore, GED (ectopic differentiation) needs to be better demonstrated separate from the simple accumulation of abnormal nuclei, which could happen for a number of different reasons.

      Strengths:

      One strength of this paper is the identification of the neuropeptide FLP-6 as a suppressor of GED and a possible RIDD target. However, there is insufficient analysis conducted to fully support this claim.

    2. Reviewer #2 (Public Review):

      Levi-Ferber and colleagues showed in their previous paper that ER stress regulates germline transdifferentiation in a way that is IRE-1 dependent, but XBP-1 independent. An open question at that time was how IRE-1 activation could mediate this signaling. The authors present several experiments in this manuscript that support the idea that neuronal Ire-1 can cell non-autonomously control germline differentiation through regulation of the neuropeptide FLP-6. Mechanistically, the authors characterize that FLP-6 is a target of IRE-1 RIDD activity. This is the first demonstration of RIDD in C. elegans, an important finding given that no RIDD targets have yet been identified in this organism. Using a wide range of mutants, the authors were also able to identify a neuronal circuit that can control the germline ectopic differentiation (GED) phenotype, involving the sensory neuron ASE, the interneuron AIY, and the motor neuron HSN. The data presented in the manuscript are sound, the mapping of a pivotal three-neuron circuit is impressive, and the findings are likely to be of high interest to a broad readership. However, some more evidence is required to support some of the conclusions made, in particular the characterization of flp-6 as a substrate for RIDD.

    3. Reviewer #1 (Public Review):

      In this manuscript, Levi-Ferber et al use C elegans to study how germline cells maintain pluripotency and avoid GED (germline ectopic differentiation) before fertilization. The authors previously showed that activation of the ER stress sensor Ire1 (but not its major downstream target Xbp1) enhances GED, and here they explore the mechanism of this effect.

      The authors convincingly – and surprisingly – show that the Ire1-mediated GED increase results not from Ire1 activity in the germline but in the nervous system, specifically in certain sensory neurons. Worms lacking a specific neuropeptide (FLP-6) or a particular neuron that produces this peptide (ASE) also displayed increased GED. Although FLP-6 deficiency did not induce ER stress, ER stress did lead to a reduction of FLP-6 transcript (and protein) levels in an Ire1-dependent manner, suggesting this RNA is a target of Regulated Ire1-dependent decay (RIDD). The authors then go on to map out the signaling cascade that begins with FLP6 reduction in ASE by Ire1 and is transmitted to the gonad via an ASE-AIY-HSN circuit, including serotonin produced by HYE.

      This paper is quite interesting and for the most part the data are very convincing and support the model. The demonstration that Ire1 and the ER stress response have non-cell autonomous effects is of particular interest, and is very well supported here. The description of this circuit linking particular neurons and signaling molecules to gonad pluripotency is also very strong.

      A weakness of the paper is the link between RIDD of FLP6 and the disruption of this circuit. The data presented do clearly support the model. However, additional information would strengthen this considerably. The authors show that FLP6 mRNA levels are reduced in Ire1+ but not Ire-/- animals subjected to ER stress. They also show that GED results from the nuclease activity of Ire1 in the ASE; and that loss of FLP6 can also induce a similar effect. However, they do not show as clearly that Ire1's effects on GED are mediated primarily through FLP6.

    4. Evaluation Summary:

      The authors of this manuscript previously showed that ER stress, and in particular the ER stress sensor Ire1, regulates transdifferentiation in C. elegans, leading to the ectopic differentiation of germline cells. In this follow-up manuscript, the authors present several lines of evidence supporting the idea that Ire1 modules these effects through degrading a novel mRNA substrate flp6. The authors identify the neurons and neuromodulators that affect accumulation of abnormal germline cells. The reviewers agreed that the discovery that flp6 is a regulated Ire-1-dependent decay target in C. elegans, and the demonstration of a non-cell-autonomous effect of Ire1 activity, are novel and likely to be of interest to a broad readership. However, more evidence is required to support some of the main conclusions.

      (This preprint has been reviewed by eLife. We include the public reviews from the reviewers here; the authors also receive private feedback with suggested changes to the manuscript. The reviewers remained anonymous to the authors.)

    1. Reviewer #3 (Public Review):

      This is a very interesting and well conducted study that addresses a question of crucial importance and will make a very valuable contribution to the literature. The question of the vulnerability of newly generated oligodendrocytes in an inflamed environment has not previously been examined with anything like the sophistication of the current series of experiments. The paper is excellent and the data convincing. I only have a few relatively minor issues that the authors might want to consider.

      The first results section on sephin1 in EAE is a little confusing. If I have understood the rationale correctly, it is to activate the ISR to protect oligodendrocytes, newly generated from OPCs, in the face of a hostile inflammatory environment. If that is correct, then perhaps this could be explained more explicitly, and the concluding sentence re-worded so as not to give the impression that sephin-1 is able to enhance remyelination (which I realise is not what is stated but is the conclusion that might be drawn).

      The effect of the BZA-sephin combination of g ratio of remyelinated axons is very interesting. This could, of course, be because the process is accelerated with this combination rather than enhanced given that g ratios in the CC will eventually return to normal after cuprizone induced demyelination (eg Stidworthy et al., Brain Pathology 2003). This could perhaps be addressed in the discussion.

      The authors could make the point in the discussion that regenerative medicines are very unlikely to be given in the absence of effective drug-mediated suppression of aggrieved inflammation.

    2. Reviewer #2 (Public Review):

      This is an interesting paper showing that prolonging the integrated stress response provides protection to oligodendrocytes in the presence of an inflammatory cytokine. For their experiments, the authors use the cuprizone model in transgenic mice overexpressing IFNg in an inducible manner in combination with a genetic and pharmacological approach to enhance the integrated stress response. The experiments are well conducted and the results clearly presented in the text. The Popko lab has previously demonstrated in a series of papers the importance of the integrated stress response for oligodendrocyte function. The novel aspect of this work is that targeting the integrated stress response requires a neuroinflammtory environment for the protective effects to occur.

      It is important to improve the introduction. As written it is not clear what was known before and how this paper goes beyond the existing literature.

      The rational for combining for combining BZA and Seph needs to be explained.

      The figures and legends could be improved according to the following suggestions:

      The evidence that Sephin1 promotes remyelination in the EAE model shown in Figure 1 is only based on differences in g-ratio with the overall number of myelinated axons being unchanged. It is difficult to make conclusion based on these results. It is difficult to obtain accurate g-ratios in lesions. Maybe the authors could extend the analysis by performing histology and counting the number of oligodendrocytes.

      Figure 2 contains only a scheme. Figure 2 should be combined with Figure 3. In addition, a scheme showing the time line of the cuprizone treatment and recovery from the treatment would be helpful. I assume W0 is at the time of treatment, W5 after 5 weeks of cuprizone and W8 represents 5 weeks of cuprizone and 3 weeks of recovery. If yes, it is not clear why the ASPA cell count shown it not reduced between W0 and W5. The numbers seem to be similar for W0, W5 and W8 in the absence of IFNg. In addition, the comparison shown in Figure 3 are incomplete. W0 is only shown without IFNg but not with. Does IFNg affect ASPA number in the absence of cuprizone?

      Panel B and C in Figure 5 could be combined to be able to compare the analyses and to evaluate the recovery of cell number by Seph at W8. The number of mice per group is borderline (only 3 mice).

      Same issue as above: Panel B and C in Figure 6 should be combined and a multiple comparison should be performed between W0, W5 and W8.

      The rational for combining BZA and Seph as shown in Figure 8 should be explained in the text. The figure and legends should be improved to clarify at which time point the analyses were performed. The panel number stated in the legends do not match with what is shown in the figure. I assume the analyses were done at W8. Only g-ratios change, whereas the number of ASPA cells and amount of myelinated axons are not affected by the combined treatment. The interpretation of this result is not easy, and the emphasis of this result should be removed from the abstract.

    3. Reviewer #1 (Public Review):

      Drs. Chen and colleagues report that augmentation of the integrated stress response (ISR) increases the oligodendrocytes and myelination during recovery after experimental demyelination in the presence of inflammation. Homozygous GADD43 KO mice or Sephin1 are used, respectively, to genetically and pharmacologically augment the ISR. Sephin1 treatment in mice with experimental autoimmune encephalomyelitis (EAE) shows increased remyelination in the spinal cord after inflammatory demyelination. Cuprizone administration to GFAP/tre;TRE/IFN-gamma double transgenic mice produced corpus callosum demyelination and CNS inflammation, with release of interferon-gamma initiated by removal of doxycycline from the drinking water. GADD43 KO did not change overall severity of cuprizone demyelination based on loss of oligodendrocytes and demyelination in corpus callosum after 5 weeks of cuprizone with ectopic interferon-gamma. The authors state that GADD43 KO enhanced the recovery of oligodendrocytes and remyelination during the 3 weeks after removal of cuprizone from the diet, but an incorrect figure prevents evaluation of this result. In double transgenic mice, with initiation of CNS inflammation, but without the GADD43 null mutation, pharmacologically enhancing the ISR with Sephrin1, increased recovery of oligodendrocytes and remyelination at 3 weeks after removal of cuprizone from the diet. These effects of genetically or pharmacologically enhancing ISR were not observed in the absence of ectopic interferon-gamma. Genetic and pharmacologic enhancement of the ISR did not appear to significantly alter the progenitor or microglial response to cuprizone demyelination. The combination of Sephin1 with bazedoxifene (BZA) enhanced the oligodendrocyte density and remyelination during the recovery period to a similar extent as either treatment alone. The authors provide several results supporting their interpretation that augmenting the ISR can overcome inhibitory effects of inflammation to enhance oligodendrocyte density and remyelination. Clarifications of the methods, correction of missing data, and additional experiments are needed to support the authors' conclusions that the potentially significant findings that combination of Sephin1 and BZA protects remyelinating oligodendrocytes and promotes remyelination even in the presence of inflammation.

      Major concerns:

      1) The experimental design and interpretation of the results would be strengthened by examining an indicator of the ISR to allow the reader to interpret the extent of ISR activation and the effect of the genetic and pharmacologic modulators of the ISR. This analysis would be particularly helpful in the corpus callosum in conditions with and without cuprizone.

      2) Cuprizone is started at 6 weeks of age which is designated as week 0 (W0). The studies use W0 for comparison to the treatment groups that are analyzed at W5 or W8. The authors refer to W0 as pre-lesion or baseline levels, which is appropriate. The authors' statements related to the vehicle condition are appropriate as is. However, it is not clear why the W8 age-match (non-cuprizone and non-IFN-gamma) was not used to more directly interpret the extent of recovery. Using W0, the comparison is 6 versus 14 weeks of age. Myelinated axons continue to significantly increase during this age interval in mice.

      3) The data graphed in panel 3C for the KO genetic prolongation of the ISR is exactly the same and the data graphed in panel 5C for the Seph pharmacologic enhancement of the ISR. The graph in 3C is actually labeled for Seph and so must have been inadvertently inserted when the graph of the KO data was intended.

      4) The combined Sephin1/BZA treatment does not appear to work through remyelination, based on the definition of thinly myelinated axons (g-ratio >0.8) as used by the authors. The authors state that the data shows the after cuprizone demyelination, mice treated with Sephin1/BZA "reached myelin thickness levels comparable to pre-lesion levels" and "restored myelin thickness to baseline levels". To support this interpretation, the authors would need to include analysis of the Sephin1/BZA mice at 5 weeks of cuprizone to show that the combined treatment, which is initiated at 3 weeks of cuprizone, did not protect oligodendrocytes or reduce demyelination during weeks 3-5 of cuprizone and Sephin1/BZA treatment.

      5) Conditions during which augmenting ISR is protective of mature oligodendrocytes or protecting remyelinating oligodendrocytes should be more clearly presented in the Discussion. The prior EAE results are reported as protecting mature oligodendrocytes. The results (Figures 3B and 5B) show that genetically or pharmacologically augmenting the ISR did NOT protect from mature oligodendrocyte loss at 5W cuprizone. The results (Figure 5B) show increased oligodendrocytes at 8W cuprizone. The current results are interpreted as protecting remyelinating oligodendrocytes, which are presumably mature as well.

    4. Evaluation Summary:

      This is an elegantly conducted study showing integrated stress response (ISR) contributes to protection of oligodendrocytes in the remyelination process in the setting of an inflammatory environment. The authors use both genetic (GADD43KO) and pharmacological approaches (Sephin1) to study ISR in demyelination animal models. The data are convincing and have important clinical implications for multiple sclerosis and other diseases. The reviewers agree that revisions are needed for the sake of presentation, clarity, rationale, and interpretation of datasets.

      (This preprint has been reviewed by eLife. We include the public reviews from the reviewers here; the authors also receive private feedback with suggested changes to the manuscript. The reviewers remained anonymous to the authors.)

    1. Reviewer #3 (Public Review):

      In the article "Widespread premature transcription termination of Arabidopsis thaliana NLR genes by the spen protein FPA", the authors describe the function of FPA as a mediator of premature cleavage and polyadenylation of transcripts. They also focused their study on NLR-encoding transcripts, as that was their most novel observation, describing an additional layer of control.

      In general, the article is well written and clear. The experimental design is good, they didn't seem to over-interpret the results, the controls were solid, and the nanopore data were quite informative for their work. It is rather descriptive, but the results will be helpful for those working on NLRs, and demonstrate the utility of bulk long-read transcript data. The authors were able to string together a number of descriptive observations or vignettes into an informative paper. Overall, it is solid science.

      One minor complaint is that the authors don't focus on NLRs starting on line 436, and then they have extensive results on NLRs; by the time I got to the discussion, I'd forgotten about the early focus on the M6A. While the first part of the article is necessary, I would suggest a more concise results section to give the paper more focus on the NLR control (since that is emphasized in the abstract and the title of the manuscript).

    2. Reviewer #2 (Public Review):

      Parker et al attempted to show that the FPA protein functions to regulate the widespread premature transcription termination of the Arabidopsis NLR genes. Using in vivo interaction proteomic-mass spectrometry, FPA was shown to co-purified with the mRNA 3' end processing machinery. Metagene analysis was used to show that FPA co-localized with Pol II phosphorylated at Ser2 of the CTD heptad repeat at the 3' end of Arabidopsis genes. Using a combination of Illumina RNA-Seq, Helicos, and nanopore DRS technologies, FPA was found to affect RNA processing by promoting poly(A) site choice, and hence controls the processing of NLR transcripts whereas such process is independent of IBM1.

      Overall, it is a potentially important research. The data is rich and could be useful. However, the biological stories described are not thoroughly supported by the data presented, especially when the authors tried to touch on several aspects without some important validations and strong connections among different parts. Some special comments are provided below:

      1) The title of this manuscript is "The expression of Arabidopsis NLR immune response genes is modulated by premature transcription termination and this has implications for understanding NLR evolutionary dynamics". Therefore, the readers will expect some functional connections between the FPA and the novel NLR isoforms due to premature transcription termination. However, the transcript levels of plant NLR genes are under strict regulation (e.g. Mol. Plant Pathol. 19:1267). Since the functions of NLR genes are related to effector-triggered immunity, it is more important to study the function of FPA on premature transcription termination when the plants are challenged with pathogens. In this manuscript, most transcript analyses are based on samples under normal growth conditions. It is therefore a weak link between the genomic studies and the functional aspects. For instance, it is more important to identify unique NLR isoforms produced upon pathogen challenges that are regulated by FPA. The authors will need to provide some of these data to fill this gap.

      2) Since the function of FPA is to regulate NLR immune response genes, we should expect a change in plant defense phenotype in FPA loss-of-function mutants. Could the authors provide more information on this? On the contrary, in line 728 of this manuscript, the authors found that at least for some pathogens, "loss of FPA function does not reduce plant resistance". It is not consistent with the hypothesis that FPA is important to regulate NLR immune response genes.

      3) Furthermore, the authors mentioned in lines 729-731 "Greater variability in pathogen susceptibility was observed in the fpa-8 mutant and was not restored by complementation with pFPA::FPA, possibly indicating background EMS mutations affecting susceptibility." Does it mean that fpa-8 contains other mutations? Will these additional mutations complicate the results of the RNA processing? Could the authors outcross the fpa-8 mutation to a clean background?

      4) In line 318, the authors found 285 and 293 APA events in the fpa-8 mutant and the 35S::FPA:YFP construct respectively, but only 59 loci (line 347) exhibited opposite APA events (about one fifth). The low overlapping frequency suggests that some results could be false positive.

      5) In line 732-736: "In contrast, 35S::FPA:YFP plants exhibited a similar level of sporulation to the pathogen-sensitive Ksk-1 accession (median 3 sporangiophores per plant). This suggests that the premature exonic termination of RPP7 caused by FPA has a functional consequence for Arabidopsis immunity against Hpa-Hiks1." It is contradictory to the statement in line 728 that "loss of FPA function does not reduce plant resistance". Is it possible that overexpression of FPA:YFP had generated an artificial condition that is not related to the natural function of FPA?

      6) The fpa-8 mutant has a delayed flower phenotype (Plant Cell 13:1427). Could the 35S::FPA:YFP fusion protein construct reverse this phenotype and the plant defense response phenotype? It is important to interpret the data when the 35S::FPA:YFP construct was used to represent the overexpression of FPA.

      7) Under the subheading "FPA co-purifies with the mRNA 3' end processing machinery". The results were based on in vivo interaction proteomics-mass spectrometry. MS prompts to false positives and will need proper controls and validations. Have the authors added the control of 35S:YFP instead of just the untransformed Col-0? At least for the putative interacting partners in Figure 1A, could the authors perform validations of some important targets, using techniques such as reverse co-IP, or to show direct protein-protein interaction between FPA to a few of the important targets by in vitro pull-down, BiFC, or FRET, etc.

      8) In Fig. 3, the data show that the last exon of the FPA gene is missing in the FPA transcripts generated from the 35S::FPA:YFP construct. Will the missing of this exon affect the function of the transcript and the encoded protein?

      9) The function of FPA is still ambiguous. There was a quantitative shift toward the selection of distal poly(A) sites in the loss-of-function fpa-8 mutant and a strong shift to proximal poly(A) site selection when FPA is overexpressed (35S::FPA:YFP) in some cases (Fig. 3, Fig. 5, Fig. 8). But the situation could be kind of reversed in other cases (Fig. 6). What is the mechanism behind it?

      10) Under the subheading: "The impact of FPA on NLR gene regulation is independent of its role in controlling IBM1 expression". IBM1 is a common target of FPA and IBM2. Indeed, FPA and IBM2 share several common targets (Plant Physiol. 180:392). It may be more meaningful to compare the impact of FPA and IBM2 on NLR gene instead.

      11) In lines 423-425, the authors described "Consistent with previous reports, the level of mRNA m6A in the hypomorphic vir-1 allele was reduced to approximately 10% of wild-type levels (Parker et al., 2020b; Ruzicka et al., 2017) (Figure 4 - supplement 3)." This data could not be found.

      12) In line 426: "However, we did not detect any differences in the m6A level between genotypes with altered FPA activity." Which data is this statement referring to?

    3. Reviewer #1 (Public Review):

      The manuscript by Parker and colleagues presents an extensive body of work on characterizing the role of FPA in the choice of polyadenylation sites in transcripts of A. thaliana. Investigation on the mechanistic details that FPA engages on the mRNA processing was first initiated with the in vivo pull-down followed by LC-MS/MS, which revealed the its protein interactome relevant for 3'-end processing. The main dataset pertaining to the manuscript title comes from the comparative transcriptome analysis of Col-0, fpa-8 mutant and the overexpressor of FPA, 35S:FPA:YFP. The strength of this work lies in the use of nanopore DRS by demonstrating the layers of FPA-dependent transcripts, including its own, and its comparison to datasets by Illumina RNA-Seq and Helicos DRS. The systematic analysis uncovered unexpected complexity in the A. thaliana NLR transcriptome under the control of FPA and thus delivers a new insight on NLR biology. Several studies anecdotally have reported the importance of using genomic DNA, but not a single cDNA species, for addressing full functionality of NLR genes. Recent advances in NLRome sequencing from multiple genomes of a species and NLR structure/function studies also highlight the importance of understanding modular nature of NLR. As alluded with the modular diversity of NLRs kept in the genomes of a species in recent studies, NLR genes are prone to reshuffle in the genome to generate different variants, including partial entities with the loss of some parts of the proteins or even chimeras, supposedly maximizing the repertoire for defense. This work adds the level of transcript diversity on that of genomic diversity; FPA, an essential factor for transcription termination determinant, targets numerous NLRs to control the layers of NLR transcriptome of an individual plant. Although it is yet to be clarified for the regulatory significance of FPA-mediated NLR transcript changes under biotic or abiotic conditions, the authors succeeded in employing fine genetic schemes utilizing FPA-defective vs. -overexpressing lines along with long-read nanopore DRS technology for the first time to uncover the breadth of differential transcript generation focused on 3'-end choices. This work is timely and impactful for NLR research owing to the above-mentioned recent advances in NLR field.

      As this work is the first of its kind in utilizing nanopore DRS to address NLR transcriptome, several technical concerns can be addressed to corroborate the claims made in the manuscript, which authors can find in the following section (1-8). Regarding the organization of the manuscript, the authors may consider to rebalance the two parts: FPA interactome vs. FPA targets and NLRs. Overall, the manuscript can be seen as combining two stories; first to characterize FPA function in 3'-end processing of transcripts inferred by interacting proteomes and meta-analysis of ChIP-seq data; second part includes detailed analysis of NLR transcripts and others. Although the first half of the analysis is a necessary prelude to the following NLR analysis, the current title and academic novelty mainly lies, or were intended by the authors, on the NLR analysis. However, current manuscript has relatively enlarged section of the first with NLR analysis packed into a series of supplementary dataset. If authors wishes to opt for highlighting NLR analysis, the following suggestions would help (9-14).

      1) Earth mover distance (EMD) has been applied to identify a locus with alternative polyadenylation. What is the basis of using EMD value of 25 as a cutoff? According to Figure 4 B,D, EMD can range from 0-4000. One would also wonder if the distance unit equals bp. In addition, EMD values of some genes (e.g. FPA and representative NLRs) can be specified in the main dataset so that significance of the cut-off values shall be appreciated.

      2) Regarding the manual annotation of alternatively polyadenylated NLR genes (L1160-): Genes with alternative polyadenylation were identified and the ending location was supported when there were minimum four DRS reads. It would be relevant to provide the significance of "the four" based on read coverage statistics, for example, with average read number covering an annotated NLR transcript with the specification of an average size.

      3) Figure 4E shows that Ilumina-RNAseq dataset detects the number of loci with a different order of magnitude compared with the other two methods. Reference-agonistic pipeline shall be appreciated, however, the method engaged might have elevated the counting of paralogous reads mapped to different locations than they should be. Along with paralogous read collapsing, this is always a problem with tandemly repeated genes, such as NLRs by and large. For example, NLR paralogs in a complex cluster with conserved TIR/NBS but diversified LRRs would have higher coverage in the first two domains but drop in the diversified parts. The authors need to specify their bioinformatic consideration to avoid such problems.

      Although the tone of the Illumina read section was careful and the main 3'-end processing conclusion was made by nanopore DRS, the authors are also advised to clearly state the limitation of using Illumina-RNAseq to address alternative polyadenylating sites at the beginning of the section, for example what to be maximally taken out from Figure 4 E and 4F. This will give relative weights to each dataset generated by different methods. One advantage of using Illumina data would be that the expression level changes can be associated with changes in processing, it seems.

      4) At the RPP7 locus, At1g58848 is identical in sequences with At1g59218 as is At1g58807 with At1g59214 (two twins in the RPP7 cluster by tandem duplication). It would be good to check whether the TE At1g58889 readthrough indeed occurs in the sister duplicate with a potential TE in the downstream of At1g59218. If not, it can be used as an example of duplication and neofunctionalization through an alternative polyadenylation site choices.

      5) HMM search shall be revisited to confirm if they are to detect the TIR domain. Given that a large proportion of NLRs in A. thaliana carry TIR at their N-terminal ends and the specified examples included TIR-NLR, it is surprising to see no TIR domain in Figure 5.

      6) L659-668: how does the new data relate to the previously TAIR annotated At1g58602.1 vs At1g58602.2 (Figure 6, Inset 1)? It would be good to see these clearly stated in the main text as compared to newly identified ones. From the nanopore profiling, At1g58602.2 appears to be the dominant form.

      7) One thing to note is that in the overexpressor of which Hiks1 R is suppressed, there was hardly any At1g58602.1 produced in addition to the large reduction of At1g58602.2. Thus, relative functional importance of the two transcripts shall be discussed in line with the Hpa resistance data. Accordingly, L740-741 phrasing shall be revised to include the possibility of absolute or relative "depletion" of functional transcript(s) contributing to the compromise in Hpa resistance.

      8) It would be necessary to state in the main text the implication of phosphorylation on the two Ser residues on Pol II at L245. A clear description distinguishing the effect of the two phosphorylation and the specificity of the antibodies is desirable, as the data was interpreted as if the two sites made differences, such that Ser2 was heavily emphasized (e.g. subtitle). Albeit low level, Ser5 data also shows an overlap with FPA ChIP-seq coverage at the 3' end. If there is a statistical significance to be taken account to interpret the coverage, please state it. Given that elongation occurs progressively, I wonder how much should be taken out from the distinction.

      9) Figures presentation for RPP4 and RPP7 are great in detailing the FPA-dependent NLR transcript complexity. To make the functional link more evident, the authors may consider bringing up parts of the Figure 5-supplement to a main Figure to detail the revised annotation of NLRs. Given recent advances in NLR structure and function studies, extra domain fusion, fission and truncated versions of NLRs require a great deal of attention. For example, potential functional link to the NMD-mediated autoimmunity and revised annotation of At5g46470 (RPS6) needs a clear visual guidance preferably with a main figure (Figure 5-Supplement 3).

      10) The section "FPA controls the processing of NLR transcripts" includes dense information and can be broken down to several categories. To this end, Supplement File 3 (NLR list) shall be revised to deliver the categorical classes and further details and converted to a main table.

      For NLR audience, for example, it would be important to associate the information to raw reads to assess where the premature termination would occur. At least, the ways to retrieve dataset or to curate the termination sites shall be guided.

      On the contrary, there is no need to include other genes in Figure 4 Sup4-8 under this section. They are not NLRs.

      11) Figure 7 and IBM1 section can be spared to the supplement.

      12) The list of "truncated NLR transcripts" in particular, either by premature termination within protein-coding or with intronic polyadenylation, should be made as a main table. The table can be preferably carrying details in which degree the truncation is predicted to be made. With current sup excel files, it is difficult to assess the breadth of the FPA effect on the repertoire of NLRs and their function. This way, functional implication of differential NLRs transcriptome can be better emphasized.

      13) FPA-mediated NLR transcript controls, as to promote transcript diversity, is expected to exert its maximum effect if FPA level or activity is subject to the environmental stresses, such as biotic or abiotic stresses. The discussion on effectors targeting RNA-binding proteins (L909-918) is a great attempt in broadening the impact of this research. In addition, if anything is known to modulate FPA activity, such as biotic or abiotic stresses or environmental conditions, please include in the discussion.

      14) NLR transcript diversity as source of cryptic variation contributing to NLR "evolution" is an interesting concept, however, evolutionary changes require processes of genic changes affecting transcript layers or stabilizing transcriptome diversity. In the authors' proposition in looking into accessions, potential evolutionary processes can be further clarified.

    4. Evaluation Summary:

      In this study, the authors examined the function of the RNA-binding protein FPA through analyzing its protein interactome and its global impact on gene expression using a combined approach of Nanopore DRS, Helicos DRS, and short-read Illumina RNA-Seq. The combined datasets and new computational approaches developed by the authors permitted them to identify the predominant role of FPA in promoting poly(A) site choice. The authors further revealed that FPA mediates widespread premature cleavage and polyadenylation of transcripts of NLR genes, important plant immune regulators. Overall, this study suggests that control of transcription termination processes mediated by FPA provides an additional layer of the regulatory dynamics of NLRs in plant immune responses.

      (This preprint has been reviewed by eLife. We include the public reviews from the reviewers here; the authors also receive private feedback with suggested changes to the manuscript. Reviewer #1 and Reviewer #3 agreed to share their names with the authors.)

    1. Reviewer #3 (Public Review):

      The manuscript of Anchimiuk and colleagues investigates the mechanism of translocation of Bacillus subtilis SMC-ScpAB, a well characterized bacterial condensin. First, the authors use several SMC constructs where the coil-coiled region has been extended and /or the hinge exchanged and test what are the effects on growth and on the organization of the chromosome. They find highly altered conformations for most of the mutants. Particularly, these altered SMCs are unable to bridge two arms in the presence of the naturally-occurring parS sequences. Interestingly, they are partially able to restore arm pairing if a single parS sequence is provided.

      Next, the authors used Chipseq to compare the binding pattern of wildtype SMC and SMC-CC425 (a mutant with an extended coil coiled region and a different hinge). They observe that the binding of wt-SMC is only midly affected by removal of most parS sequences, whilst that of the mutant is highly affected. In time-lapse experiments where ParB is depleted and then re-expressed, the authors show that in a strain with a single parS wt-SMC loads in the origin region and then redistributes over the chromosome while the mutant can only partially achieve redistribution and to a large extent remains concentrated on the origin region.

      The authors then use wt-SMC and investigate how the conformation of the chromosome changes with two different parS sites located in different positions. They observe that each parS site is able to produce arm-pairing. They observe a decrease in the strength of arm pairing when both parS sites are present.

      Finally, the authors increase the expression level of wt-SMC, and observe decreased levels of arm-pairing in the presence of all the naturally-occurring parS sites. More normal levels of arm-pairing are observed when only one parS is present, despite the higher wt-SMC levels. When two parS sites are introduced, more complex structures appear in the contact map.

      These observations are new, interesting and intriguing. However, there are multiple possible interpretations, models and mechanism that are not discerned by the data presently presented in the manuscript.

      At times, there seem to be inconsistencies in their interpretation of results, and at times the models proposed do not seem well supported by data.

      Finally, the presentation of previous models and results from the literature could be improved.

      Major issues:

      In Fig. 1 the authors make several mutant SMC constructs with larger or shorter arms and different hinges and use Hi-C to explore the changes in 3D chromosome organization. Is it not clear to me why the arc is still visible in the mutants, nor what happens to the overall organization of the chromosome in the mutants? Is chromosome choreography normal?

      In Fig. 1C the authors show that strains with parS-359 only display a secondary diagonal and conclude "chromosome arm alignment was comparable to wild-type". A quantification of the degree of pairing for each mutant normalized by the wild-type is necessary to evaluate the degree of pairing and its dependence on genomic distance to the origin.

      In Fig. 2, the authors use HiC and chip-seq to quantify the effects of changes in SMC arm length on chromosome organization and SMC genomic distributions. It would be important to verify that the expression levels of these SMC mutants are the same as wt, as as they show in Fig. 4 changes in protein levels can change also 3D chromosome organization.

      In Fig. 2C, what is the distribution of SMC at t0? Showing this result would support their claim that SMC can load in absence of ParB.

      In Fig. 2C it is claimed that SMC-CC425 moves at a slower rate than WT. Can the authors provide a quantification?

      In Fig. 2, the authors focused on one of the mutants with longer SMC arms (CC425) and performed HiC and Chip-seq in time-lapse after induction of ParB in a ParB-depleted culture. These experiments clearly establish that SMC-CC425 can redistribute from the origin and can achieve arm pairing but to a lesser extent than the WT. The authors speculate that a slower translocation rate and/or a faster dissociation rate explain the experiments. However, other possibilities exist: for instance that the mutant SMC is defective at passing through road-blocks (highly expressed genomic regions, e.g rRNA sites) or at managing collisions with RNAP/ DNAP/ other SMCs, it makes different higher-order complexes than wt-SMC, etc. This could could be due to the change in the length of the SMC, or to the use of a hinge/coiled-coil region different from that of the wt-SMC. Thus, I am not convinced that the text explores all the possible models or that the data shown discerns between any of them.

      In Fig. 3B, the authors show that use of two parS-opt sites at -304kb and -9kb lead to the formation of two secondary diagonals. They argue that these can be rationalized in terms of the diagonals formed by the strains harboring single parS-opt (either -9kb or -304kb). However, I cannot see how these can happen at the same time! If a cells makes arm pairing from -9kb then it cannot make it from -304kb right? I do not understand either how the authors can conclude from these experiments that ParS may act as unloading sites for SMC. Again, the authors are speculating over mechanisms that are not really tested.

      If parS sites triggered the unloading of SMCs, then one would assume that ~5-6 natural parS sites in the origin region are unloading the SMC complexes loaded at other parS sites? This makes little sense to me, or there is something I clearly do not understand in their explanations.

      In their text, the authors explain that "A small but noticeable fraction of SMC complexes however managed to translocate towards and beyond other parS sites apparently mostly unhindered". I am confused as to where is the evidence supporting this statement. I do not think the ensemble Hi-C experiments provided in Fig. 3 can provide conclusive evidence for this.

      The authors often hypothesize on a mechanism, but then assume this mechanism is correct. For instance, the disruption in the secondary diagonals in Fig. 3B when experiments are performed with two parS sites are initially hypothesized to be due to roadblocks (e.g with highly transcribed regions) or to collisions between SMCs loaded at different parS sites. These possibilities cannot be discerned from their data. However, the authors then assume that collisions is what is going on (e.g. paragraph in lines 274-284). I think they should provide evidence on what is producing the changes in the secondary diagonals in mutants with two ParS sites.

      Why is the ChIP-seq profile for a strain with all the natural parS sites and for a strain with only parS-9kb the same? even with the same peaks at the same locations? Does this mean that SMC peaks do not require the presence of parS? But, then SMCs do not load equally well in all naturally occurring parS sites? This is then in contradiction to their assumption that parS cannot be selectively loaded?

      Do we really know that it is a single SMC ring that is responsible for translocation? The authors assume so in their models and interpretations, but if it were not the case it could drastically modify the mechanisms proposed. For instance, SMC may be able to load on a ParS site without pairing arms (i.e. only one dsDNA strand going through the SMC ring).

      In Fig. 2C-D it is shown that a large fraction of wildtype SMC and SMC-CC425 accumulate at the origin region at early time points (Fig. 2C) however this does not seem to lead to an increased Hi-C signal in the origin region (compare early time points to the final t60). Also, despite small amounts of wt-SMC in the chromosome at the latter time points, the intensity of the secondary diagonal is very strong. Why is this? These results would be consistent with many SMCs loading at the origin region but only a fraction of them being responsible for arm-pairing. Is this not in contradiction to their assumption that SMCs pair two dsDNA arms when they load?

      The authors state that: "If SMC-CC425 indeed fails to juxtapose chromosome arms due to over-enrichment in the replication origin region, collisions may be rare in wild-type cells because of a high chromosome residence time and a limited pool of soluble SMC complexes, resulting in a small flux of SMC onto the chromosome. If so, artificially increasing the flux of SMC should lead to defects in chromosome organization with multiple parS sites but not with a single parS site (assuming that most SMC is loaded at parS sites)". However, this assumption seems inconsistent with their results in Fig. 2 that show that the peaks of SMC do not change upon removal of most parS sites.

      I am a bit confused about the interpretation of the results in Fig. 4D. The authors talk about 'loop contacts' and point to the secondary diagonal (yellow ellipses). But these are not loop contacts, but rather contacts between arms that have surpassed the two parS sequences, right? Also, it is not clear what they mean by paired-loop contacts (red ellipse). Do they mean contacts between the two loops originating at parS-359 and parS-334? If this where the case, then it means SMCs are bridging more than two dsDNA segments? Or that there are multimers of SMC linking together? Or that and SMC can circle one arm from one loop and another from the other...? But in this case, how can it load? For me it is very unclear what these experiments really mean. The explanations provided by the authors seem again highly hypothetical.

    2. Reviewer #2 (Public Review):

      In this manuscript, Anchimiuk et al reported that B. subtillis SMC can collide with each other, and that the collision is modulated by several factors including the number, strength, distribution of parS sites, the residence time of SMC on DNA, the translocation rate, and the cellular abundance of SMC. The authors suggested that these parameters are fine-tuned in the wild-type B. subtillis to minimize SMC collision. In my opinion, the finding is interesting, the experimental setup is creative, and the experiments were beautifully executed. Arguably, these experiments can only be performed in B. subtilis since parAB- and the insertion of another parS site at the mid-arm are not detrimental to cell viability (in Caulobacter crescentus, insertion of another parS mid-arm affects chromosome segregation, hence cell viability severely). Furthermore, the rare set of arm-modified SMCs from the Gruber lab also gives this manuscript a unique mechanistic angle. Given the available data, the conclusion of the manuscript is safe. I especially appreciate that the authors did not bias towards the model of SMC traversing each other by Z-loop formation.

    3. Reviewer #1 (Public Review):

      The authors investigate the role of Condensin and its loading in ensuring appropriate chromosome dynamics in the model organism Bacillus subtilis. The data are of high quality and generally support the ultimate conclusions.

      The demonstration of collisions between ectopically-loaded Condensin and their negative impact on cellular viability are important insights, particularly in light of the recent single-molecular in vitro experiments demonstrating the ability of 2 Condensins to pass one another and thereby form Z-structures on DNA.

      The main caveat is that the work lacks direct quantization of the levels of chromosome-associated Condensin—inclusion of experiments to evaluate this parameter would go a long way to validating (or refuting) the authors' conclusions.

    4. Evaluation Summary:

      This manuscript presents some intriguing data to support the notion that B. subtilis cells have tuned a variety of parameters related to SMC loading and translocation to ensure that individual complexes do not collide. This is likely an important but poorly understood aspect of condensins/SMCs, and as such represents a valuable contribution to the field and should be of interest to a broad set of readers.

      (This preprint has been reviewed by eLife. We include the public reviews from the reviewers here; the authors also receive private feedback with suggested changes to the manuscript. The reviewers remained anonymous to the authors.)

    1. Reviewer #3 (Public Review):

      The authors of this manuscript combine electrophysiological recordings, anatomical reconstructions and simulations to characterize synapses between neurogliaform interneurons (NGFCs) and pyramidal cells in somatosensory cortex. The main novel finding is a difference in summation of GABAA versus GABAB receptor-mediated IPSPs, with a linear summation of metabotropic IPSPs in contrast to the expected sublinear summation of ionotropic GABAA IPSPs. The authors also provide a number of structural and functional details about the parameters of GABAergic transmission from NGFCs to support a simulation suggesting that sublinear summation of GABAB IPSPs results from recruitment of dendritic shaft GABAB receptors that are efficiently coupled to GIRK channels.

      I appreciate the topic and the quality of the approach, but there are underlying assumptions that leave room to question some conclusions. I also have a general concern that the authors have not experimentally addressed mechanisms underlying the linear summation of GABAB IPSPs, reducing the significance of this most interesting finding.

      1) The main novel result of broad interest is supported by nice triple recording data showing linear summation of GABAB IPSPs (Figure 4), but I was surprised this result was not explored in more depth.

      2) To assess the effective radius of NGFC volume transmission, the authors apply quantal analysis to determine the number of functional release sites to compare with structural analysis of presynaptic boutons at various distances from PC dendrites. This is a powerful approach for analyzing the structure-function relationship of conventional synapses but I am concerned about the robustness of the results (used in subsequent simulations) when applied here because it is unclear whether volume transmission satisfies the assumptions required for quantal analysis. For example, if volume transmission is similar to spillover transmission in that it involves pooling of neurotransmitter between release sites, then the quantal amplitude may not be independent of release probability. Many relevant issues are mentioned in the discussion but some relevant assumptions about QA are not justified.

      3) The authors might re-think the lack of GABA transporters in the model since the presence and characteristics of GATs will have a large effect on the spread of GABA in the extracellular space.

      4) I'm not convinced that the repetitive stimulation protocol of a single presynaptic cell shown (Figure 5) is relevant for understanding summation of converging inputs (Figure 4), particularly in light of the strong use-dependent depression of GABA release from NGFCs. It is also likely that shunting inhibition contributes to sublinear summation to a greater extent during repetitive stimulation than summation from presynaptic cells that may target different dendritic domains. The authors claim that HCN channels do not affect integration of GABAB IPSPs but one would not expect HCN channel activation from the small hyperpolarization from a relatively depolarized holding potential.

    2. Reviewer #2 (Public Review):

      The authors present a compelling study that aims to resolve the extent to which synaptic responses mediated by metabotropic GABA receptors (i.e. GABA-B receptors) summate. The authors address this question by evaluating the synaptic responses evoked by GABA released from cortical (L1) neurogliaform cells (NGFCs), an inhibitory neuron subtype associated with volume neurotransmission, onto Layer 2/3 pyramidal neurons. While response summation mediated by ionotropic receptors is well-described, metabotropic receptor response summation is not, thereby making the authors' exploration of the phenomenon novel and impactful. By carrying out a series of elegant and challenging experiments that are coupled with computational analyses, the authors conclude that summation of synaptic GABA-B responses is linear, unlike the sublinear summation observed with ionotropic, GABA-A receptor-mediated responses.

      The study is generally straightforward, even if the presentation is often dense. Three primary issues worth considering include:

      1) The rather strong conclusion that GABA-B responses linearly summate, despite evidence to the contrary presented in Figure 5C.

      2) Additional analyses of data presented in Figure 3 to support the contention that NGFCs co-activate.

      3) How the MCell model informs the mechanisms contributing to linear response summation.

      These and other issues are described further below. Despite these comments, this reviewer is generally enthusiastic about the study. Through a set of very challenging experiments and sophisticated modeling approaches, the authors provide important observations on both (1) NGFC-PC interactions, and (2) GABA-B receptor mediated synaptic response dynamics.

      The differences between the sublinear, ionotropic responses and the linear, metabotropic responses are small. Understandably, these experiments are difficult – indeed, a real tour de force – from which the authors are attempting to derive meaningful observations. Therefore, asking for more triple recordings seems unreasonable. That said, the authors may want to consider showing all control and gabazine recordings corresponding to these experiments in a supplemental figure. Also, why are sublinear GABA-B responses observed when driven by three or more action potentials (Figure 5C)? It is not clear why the authors do not address this observation considering that it seems inconsistent with the study's overall message. Finally, the final readout – GIRK channel activation – in the MCell model appears to summate (mostly) linearly across the first four action potentials. Is this true and, if so, is the result inconsistent with Figure 5C?

      Presumably, the motivation for Figure 3 is that it provides physiological context for when NGFCs might be coactive, thereby providing the context for when downstream, PC responses might summate. This is a nice, technically impressive addition to the study. However, it seems that a relevant quantification/evaluation is missing from the figure. That is, the authors nicely show that hind limb stimulation evokes responses in the majority of NGFCs. But how many of these neurons are co-active, and what are their spatial relationships? Figure 3D appears to begin to address this point, but it is not clear if this plot comes from a single animal, or multiple? Also, it seems that such a plot would be most relevant for the study if it only showed alpha-actin 2-positive cells. In short, can one conclude that nearby, presumptive NGFCs co-activate, and is this conclusion derived from multiple animals?

      The inclusion of the diffusion-based model (MCell) is commendable and enhances the study. Also, the description of GABA-B receptor/GIRK channel activation is highly quantitative, a strength of the study. However, a general summary/synthesis of the observations would be helpful. Moreover, relating the simulation results back to the original motivation for generating the MCell model would be very helpful (i.e. the authors asked whether "linear summation was potentially a result of the locally constrained GABAB receptor - GIRK channel interaction when several presynaptic inputs converge"). Do the model results answer this question? It seems as if performing "experiments" on the model wherein local constraints are manipulated would begin to address this question. Why not use the model to provide some data – albeit theoretical – that begins to address their question?

      In sum, the authors present an important study that synthesizes many experimental (in vitro and in vivo) and computational approaches. Moreover, the authors address the important question of how synaptic responses mediated by metabotropic receptors summate. Additional insights are gleaned from the function of neurogliaform cells. Altogether, the authors should be congratulated for a sophisticated and important study.

    3. Reviewer #1 (Public Review):

      This manuscript by Gabor Tamas' group defines features of ionotropic and metabotropic output from a specific cortical GABAergic cell cortical type, so-called neurogliaform cells (NGFCs), by using electrophysiology, anatomy, calcium imaging and modelling. Experimental data suggest that NGFCs converge onto postsynaptic neurons with sublinear summation of ionotropic GABAA potentials and linear summation of metabotropic GABAB potentials. The modelling results suggest a preferential spatial distribution of GABA-B receptor-GIRK clusters on the dendritic spines of postsynaptic neurons. The data provide the first experimental quantitative analysis of the distinct integration mechanisms of GABA-A and GABA-B receptor activation by the presynaptic NGFCs, and especially gain insights into the logic of the volume transmission and the subcellular distribution of postsynaptic GABA-B receptors. Therefore, the manuscript provides novel and important information on the role of the GABAergic system within cortical microcircuits.

    4. Evaluation Summary:

      This manuscript provides quantitative information of the integration of GABA-A and GABA-B receptor inhibitory responses in cortical pyramidal neurons induced by a presynaptic GABAergic neuron type called neurogliaform cell (NGFC). Experimental and modeling data suggest that NGFCs converge onto postsynaptic neurons with sublinear summation of ionotropic GABA-A potentials and linear summation of metabotropic GABA-B potentials probably due to a preferential spatial distribution of GABA-B receptor-GIRK clusters on the dendritic spines of postsynaptic neurons. The data represent an attempt to gain insights into the logic of GABA volume transmission within cortical microcircuits.

      (This preprint has been reviewed by eLife. We include the public reviews from the reviewers here; the authors also receive private feedback with suggested changes to the manuscript. Reviewer #1 and Reviewer #2 agreed to share their names with the authors.)

    1. Reviewer #2 (Public Review):

      In "Evolution of cytokine production capacity in ancient and modern European populations", Dominguez-Andrés et al. collect a large amount of trait association data from various studies on immune-mediated disorders and cytokine production, and use this data to create polygenic scores in ancient genomes. They then use the scores to attempt to test whether the Neolithic transition was characterized by strong changes in the adaptive response to pathogens. The impact of pathogens in human prehistory and the evolutionary response to them is an intriguing line of inquiry that is now beginning to be approachable with the rapidly increasing availability of ancient genomes.

      While the study shows a commendable collection of association data, great expertise in immune biology and an interesting study question, the manuscript suffers from severe statistical issues, which makes me doubt the validity and robustness of their conclusions. I list my concerns below, in rough order of how important I believe they are to the claims of the paper:

      — In addition to the magnitude of an effect away from the null, P-values are a function of the amount of data one has to fit a model or test a hypothesis. In this case, the authors have vastly more data after the Neolithic Revolution than before, and so have much higher power to reject the null hypothesis of "no relationship to time" after the revolution than before. One can see this in the plots the authors provided, which show vastly more data after the Neolithic, and consequently a greater ability to fit a significant linear model (in any direction) afterwards as well.

      — The authors argue that Figure S2 makes their results robust to sample size differences, but showing a consistency in direction before and after downsampling in the post-neolithic samples is not enough, because:

      1) you still lack power to detect changes in direction before the Neolithic.

      2) even for the post-Neolithic, the relationship may be in the same direction but no longer significant after downsampling. How much the significance of the linear model fit is affected by the downsampling is not shown.

      — The authors chose to test "relationship between PRS with time" before and after the Neolithic as a way to demonstrate that "the advent of the Neolithic was a turning point for immune-mediated traits in Europeans". A more appropriate way to test this would be creating a model that incorporates both sets of scores together, accounts for both sample size and genetic drift in the change of polygenic scores, and shows a significant shift occurs particularly in the Neolithic, rather in any other time period, instead of choosing the Neolithic as an "a priori" partition of the data. My guess is that one could have partitioned the data into pre- and post-Mesolithic and gotten similar results, largely due to imbalances in data availability.

      — The authors only talk about partitions before and after the Neolithic, but plots are colored by multiple other periods. Why is the pre- and post-Neolithic the only transition that is mentioned?

      — Extrapolating polygenic scores to the distant past is especially problematic given recent findings about the poor portability of scores across populations (Martin et al. 2017, 2019) and the sensitivity of tests of polygenic adaptation to the choice of GWAS reference used to derive effect size estimates (Berg et al. 2019, Sohail et al. 2019). In addition to being more heavily under-represented, paleolithic hunter-gatherers are the most differentiated populations in the time series relative to the GWAS reference data, and so presumably they are also the genomes for which PGS estimates built using such a reference would have higher error (see, e.g. Rosenberg et al. 2019). Some analyses showing how believable these scores are is warranted (perhaps by comparing to phenotypes in distant present-day populations with equivalent amounts of differentiation to the GWAS panel).

      — In multiple parts of the paper, the authors mention "adaptation" as equivalent to the patterns they claim to have found, but alternative hypotheses like genetic drift are not tested (see e.g. Guo et al. 2018 for a review of methods that could be used for this).

      — 250 kb window is too short a physical distance for ensuring associated loci that are included in the score are not in LD, and much shorter than standard approaches for building polygenic scores in a population genomic context (e.g. see Berg et al. 2019, Berisa et al. 2016). Is this a robust correction for LD?

      — If one substitutes dosage with the average genotyped dosage for a variant from the entire dataset, then one is biasing towards the partitions of the dataset that are over-represented, in this case, post-Neolithic samples.

      — It seems from Figure 2, that some scores are indeed very sensitive to the choice of P-value cutoff (e.g., Malaria, Tuberculosis) and to the amount of missing data (e.g. HIV). This should be highlighted in the main text.

      — Some of the score distributions look a bit strange, like the Tuberculosis ones in Figure 2, which appear concentrated into particular values. Could this be because some of the scores are made with very few component SNPs?

    2. Reviewer #1 (Public Review):

      This paper focuses on the role of historical evolutionary patterns that lead to genetic adaptation in cytokine production and immune mediated diseases including infectious, inflammatory, and autoimmune diseases. The overall goal of this research was to track the evolutionary trajectories of cytokine production capacity over time in a number of patients with different exposure to infectious organisms, infectious disease, autoimmune and inflammatory diseases using the 500 Functional Genomics cohort of the Human Functional Genomics Project. The identified cohort is made up of 534 individuals of Western European ancestry. Much of this focus is on the impact and limitations of certain datasets that they have chosen to use such as the "average genotyped dosage" to be substituted for missing variants and data interpretation. Moreover, some data pairings in the data set are not complete or had varying time points . Similarly, a split was done to look at before and after the Neolithic era and the linear regression correspond to those two eras. However, the authors do not comment or show the data to demonstrate why they choose that specific breakpoint as opposed to looking at every historical era transition, i.e., from early upper paleolithic to late upper paleolithic to Mesolithic to Neolithic to post-Neolithic to modern. Lastly, the authors should highlight additional limitations of this current study in terms of the generalizability to other populations or to clearly state that this is limited to the European population at the specified latitude and longitudes used.

    3. Evaluation Summary:

      Dominguez-Andrés et al. collect a large amount of immune-related trait association data from a cohort made up of 534 individuals of Western European ancestry. The goal was to track the evolutionary trajectories of cytokine production capacity over time in a number of patients with different exposure to infectious organisms, infectious disease, autoimmune and inflammatory diseases, using the 500 Functional Genomics cohort of the Human Functional Genomics Project. From this analysis it was hypothesized that the Neolithic transition was characterized by strong changes in the adaptive response to pathogens in human biology. Overall, the manuscript is interesting but could be improved by significant enhancements to statistical methodology.

      (This preprint has been reviewed by eLife. We include the public reviews from the reviewers here; the authors also receive private feedback with suggested changes to the manuscript. Reviewer #2 agreed to share their name with the authors.)

    1. Reviewer #3 (Public Review):

      In zebrafish embryo development the surface epithelium, the enveloping layer (EVL), proliferates and migrates along with the yolk sac during epiboly. This process requires the simultaneous proliferation and migration of cells, which must undergo cell shape changes. Co-ordination of these processes is regulated by proliferation, whereby cell number and shape perturb tissue-scale forces necessary for epiboly. This paper investigates explicitly the importance of successful cytokinesis, through abscission of cytokinetic bridges, on regulating these forces and epiboly progression. They show that Rab25, a GTPase belonging to the Rab11 subfamily, regulates abscission through endomembrane trafficking in the EVL. Through their detailed analysis of cellular-level phenotypes, including qualitative and quantitative approaches, this paper presents convincing evidence for this novel role of Rab25. The authors should be congratulated on excellent time-lapse movies of cytokinesis in early zebrafish development.

    2. Reviewer #2 (Public Review):

      The authors examined the role of Rab25 during cell division within a developing epithelia. Strikingly, they found that the RabGTPase, Rab25, localized to mitotic structures such as centrosomes and cytokinetic midbodies in dividing cells of the developing zebrafish embryo. They went on to create maternal-zygotic Rab25a and Rab25b mutant embryos where they clearly demonstrate that apical cytokinetic bridges fail to undergo abscission leading to anisotropic cell morphologies that likely contribute to a delayed epiboly.

      The major strengths of this study is the clear cell biology defects found in a developing embryo that lead to downstream developmental defects (delayed epiboly). The rab25 localization is beautiful. The examination of the viscoelastic properties is also compelling. The main improvements would be to expand upon the spatio-temporal localization of Rab25a and Rab25b during cell division at different stages of epiboly, present Rab11 localization patterns in the Rab25 mutant embryos, and clearly demonstrate that changes in viscoelasticity are also in their multinucleated cells that occur in Rab25 mutant conditions. These additions will help the authors support their conclusions that Rab25 localization/regulation of endomembranes (potentially recycling endosomes) regulates abscission and subsequently the viscoelastic properties of the developing tissue.

      This study has identified novel roles for Rab25 in cytokinesis/abscission and opens the doors for examining it in regulating mitotic centrosome function. It is paradigm shifting in that it creates a new way to think about Rab25 and potentially its relationship with Rab11 and recycling endosomes during division in the early embryo.

    3. Reviewer #1 (Public Review):

      In the manuscript by Willoughby et al. the authors examine the role of Rab25 in early embryogenesis in zebrafish. They implicate Rab25 activity in abscission and show various defects including delayed epiboly and altered cell behaviors associated with defective acting dynamics. This is an interesting and well-written paper that uses reverse genetics and microscopy to analyze the function of Rab25, a GTPase previously implicated in membrane recycling, in vivo. Their work illustrates how defects in cytokinesis affect epiboly and establish an interesting link to acto-myosin regulation of the mechanical properties of the EVL. While these pehnotypes are described and demonstrated clearly, the implication of membrane recycling is not fully supported in the present work. It is also unclear whether Rab25 plays a role in oogenesis that may account for some of the observed phenotypes.

    4. Evaluation Summary:

      Willoughby et al. examine the role of Rab25 in early embryogenesis in zebrafish. They implicate Rab25 activity in abscission and show various defects including delayed epiboly and altered cell behaviors associated with defective acting dynamics. Overall, this is an interesting and well-written paper. However, there are a number of important controls that are missing and some connections such as the implication of membrane recycling that require stronger experimental validation.

      (This preprint has been reviewed by eLife. We include the public reviews from the reviewers here; the authors also receive private feedback with suggested changes to the manuscript. Reviewer #1 agreed to share their name with the authors.)

    1. Reviewer #2 (Public Review):

      This manuscript set out to address several outstanding questions concerning the impact of 'eusocial' behaviour in mammals, here represented by the experimental model of the Damaraland mole-rat, on skeletal remodelling. Specifically, the transition to breeding status (queen) for some individuals in the colony is accompanied by changes that support high fecundity. The authors investigate the extent to which changes are localised in the skeleton and the underlying regulatory changes that are associated with these morphological features. The paper is well-written, the experiments have been planned thoughtfully and described carefully, and the panel figures convey information without over-crowding. Overall, I thoroughly enjoyed reading this manuscript, which represents as a multi-pronged approach to advancing understanding of the unusual biology and phenotype of queen mole rats.

    2. Reviewer #1 (Public Review):

      The authors provide a novel case-study of the skeletal consequences of queen-only breeding in Damaraland mole-rats, one of the few eusocial mammals. Out of a population of adults, a queen will be selected as the sole female to breed with a male, and the non-breeders will provide support in the highly cooperative society. Once selected, a new queen will undergo a rapid skeletal transformation in which lumbar vertebrae expand. Supporting closely-timed pregnancies and lactation, mineral reserves will be excavated by bone-specific macrophages along the inner, or endosteal, lining of some limb bones. Unlike most other mammals, the skeletons of queens do not typically recover to their pre-pregnancy phenotype as rapid sequential pregnancies continually erode the limbs, leaving them vulnerable to fracture.

      To understand the molecular mechanisms driving these phenotypic changes associated with breeding in queens, the authors artificially selected queens in captivity, recreated a eusocial society, and then tracked gene expression along with skeletal phenotypes throughout breeding cycles. After lumbar expansion in queens had completed only long bones showed gene expression consistent with breeding status. Specifically, results showed upregulation of differentiation and activity of bone-specific macrophages, call osteoclasts. These cells liberate minerals from bone and make components of the extracellular matrix available metabolism and development of embryos.

      To understand if these changes were driven by the presence of sex-steroids, multiple cell types were harvested from the marrow of lumbar vertebrae and limb bones and treated with estradiol. No significant effect was found. Data, therefore, suggest that mechanisms shaping the postcranial skeleton were not consequences of sex-steroid mediated signaling pathways.

      Non-recoverable bone loss in queens is unusual among mammals and is a vulnerability that potentially limits the number of pups a queen can produce. Vulnerable queens may therefore be protected in cooperative societies in which non-breeders can work more and offer queens more rest.

      This study furthers the field of skeletal biology by exploring how enduring bone resorption contributes to the greater fecundity of one of the world's few eusocial mammals but has a potentially life-long consequence on limb performance and fracture resistance. The authors weave together multiple lines of evidence to better illustrate the enormous and rapid changes that occur as a female ascends to queen status, and what she sacrifices to build her colony. Results offer compelling and transdisciplinary insights into an extreme skeletal strategy and the impact of this work can be bolstered by only minor changes.

    3. Evaluation Summary:

      This manuscript takes a deep dive into the skeletal effects of burrowing and eusocial Damaraland mole rats. By exploring the genetic and skeletal consequences of breeding restricted to a single queen with multiple and closely-timed pregnancies and lactation, this study offers a compelling story that will bolster textbooks on skeletal biology, mammalian evolution, and ethology. The results show the molecular mechanisms driving adaptive plasticity within the unusually expanded lumbar spine and thin limb bones of queens are an adaptive consequence of breeding status.

      (This preprint has been reviewed by eLife. We include the public reviews from the reviewers here; the authors also receive private feedback with suggested changes to the manuscript. The reviewers remained anonymous to the authors.)

    1. Reviewer #3 (Public Review):

      The manuscript by Turner et al. employs a transcriptome-wide approach to study the effects of mutants of the 3'-end processing machinery and the anti-cancer drug cordycepin (3' deoxyadenosine) on alternative poly(A) site selection in budding yeast to better understand alternative polyadenylation (APA) mechanism(s). In particular, poly(A) test sequencing (PAT-seq), a 3'-end focused deep sequencing technique, is employed to determine cleavage/poly(A) site choice in seven mutants of the core 3'-end processing machinery – three cleavage factor IA (CFIA) mutants (rna14-1, pcf11-2, clp1-pm), one cleavage factor IB (CFIB) mutant (nab4-1), and three cleavage and polyadenylation factor (CPF) mutants (ysh1-13, fip1-1, pap1-1). Six of the 3'-end processing factor mutants exhibit increased distal poly(A) site usage and lengthening of 3'-UTRs, with rna14-1 and pcf11-2 showing the greatest effect, but clp1-pm exhibiting little effect. Notably, 3511/7091 genomic annotations (49.5%) have two or more poly(A) sites and 422 genes have significantly changed poly(A) sites in all the 3'-end processing factors mutants except clp1-pm. APA is also examined in 41 genes in a full spectrum of 3'-end processing mutants (22) using a multiplexed poly(A) test (mPAT) method and most of the mutants alter poly(A) site choice, with a predominant shift to distal site usage. In addition, APA analysis of cells treated with cordycepin using PAT-seq indicates that cordycepin alters poly(A) site choice in 1959 genes, with predominant distal cleavage site usage and lengthening of 3'-UTRs. Cordycepin is also shown to increase nucleotide abundance. Interestingly, impairment of transcription elongation, using mycophenolic acid (MPA), which reduces GTP levels, or an RNA polymerase II mutant, rpb1-H1085Y, in cells treated with cordycepin promotes proximal poly(A) site usage and shorter 3'-UTRs, reversing the effects of cordycepin. Finally, comparison of genes altered in APA by cordycepin to a dataset of yeast nucleosome occupancy suggests that 3'-end nucleosome positioning and length of intergenic regions in convergent genes correlates with cordycepin responsiveness. The data presented in the paper suggest a kinetic model for cleavage/poly(A) site selection in yeast that involves a balance between the concentration/availability of the cleavage and polyadenylation machinery and transcription elongation rate.

      The strengths of the study include the generation of transcriptome-wide datasets for poly(A) site usage in numerous mutants of evolutionarily conserved, essential cleavage and polyadenylation factors using the PAT-seq method. In addition, the study indicates that almost 50% of the annotated genes in budding yeast exhibit alternative polyadenylation. The study also indicates that impairment of numerous 3'-end processing factors, irrespective of subcomplex, predominantly causes an increase in distal poly(A) site usage and lengthening of 3'-UTRs. Interestingly, the study also suggests that the choice of poly(A) site is regulated by the availability of cleavage and polyadenylation factors and transcription elongation. Finally, the study shows that anticancer drug cordycepin causes transcriptome-wide changes in alternative polyadenylation, predominantly elevating distal poly(A) site usage.

      The weaknesses of the study revolve around basing some conclusions solely on the transcriptome-wide data without additional small-scale experiments. In addition, the effects of 3'-end processing mutants and cordycepin on alternative polyadenylation have been examined in two different strain backgrounds, which could impact direct comparisons of the data. The proposed kinetic model for cleavage site choice in yeast seems only to be tested in cells treated with cordycepin.

      Overall, the authors achieved their aims of providing greater insight into the mechanism of alternative polyadenylation and its links to transcription and more understanding of the biological effects of cordycepin in cells. At present, most of the conclusions are supported by the results, but some conclusions require additional experiments.

      This study will be of enormous interest to the RNA processing field and to the wider community, especially given that alternative polyadenylation regulates so many aspects of mRNA function, the 3'-end processing factors studied are evolutionary conserved, and cordycepin is an anti-cancer agent.

    2. Reviewer #2 (Public Review):

      The authors investigated how alternative polyadenylation (APA) is modulated in yeast using appropriate transcriptomic methodologies.

      The authors found that mutants for mRNA 3' end formation factors and cordycepin treatment alter alternative polyadenylation in the same manner, generating transcripts with longer 3'UTRs, due to a switch to distal polyadenylation sites (PAS). Most mutants analyzed cause a PAS switch, in particular mutants for RNA14, PCF11, YSH1, FIP1, NAB4 and PAP1. They also found that MPA and a rpb1 mutant, with a slower transcription elongation rate, reverts the cordycepin effect of distal PAS selection. This implies that in yeast, as in higher organisms, APA is modulated by RNAPII elongation. There is nucleosome depletion in the 3' end of convergent genes that undergo cordycepin-driven APA alterations, which is a new finding.

      On the basis of their data, the authors propose a kinetic model for APA in yeast that is regulated by the concentration of core mRNA 3' end factors and nucleotide levels, which in turn modulates RNAPII elongation. This integrative model has been already described in higher organisms, but not in yeast, and overall this study covers an impressive body of work that makes an important contribution to the field.

      1) The authors show that cordycepin have the same effect in APA as most of the 3' end factors mutants used, but there is a lack of integration between the two sets of PAS-seq data. The cordycepin APA effect may be due to decreased expression of mRNA 3' end factors but this hypothesis was not fully explored. Treating those mRNA 3' end mutants with cordycepin could shed some light on this.

      2) A new role for SEN1 in APA for a subset of protein coding was observed. The SEN1 mechanism could be clarified if the authors show that SEN1 is within the subset of convergent genes analyzed, and also if SEN1 expression changes upon cordycepin treatment.

    3. Reviewer #1 (Public Review):

      The authors set out to test a variety of factors that could impact poladenylation site (PAS) selection in yeast. To that end, they rigorously tested a collection of temperature-sensitive mutations in polyadenylation machinery components and utilized a custom 3'-end sequencing method to assess PAS selection genome-wide. The most common result associated with polyadenylation machinery dysfunction was global switching to a more distal PAS. Further, the authors test an interesting phenomenon of cordecypin-induced switching to the distal PAS and reveal through metabolomics that enhanced nucleotide biosynthesis may be the root cause. The enhanced nucleotide pools was found to alter elongation rate leading to alterations in PAS choice. Finally, the authors find that convergent genes are influenced by the nucleosome landscape to impact APA events.

      Overall, this is a rigorous and thorough study that brings together multiple regulatory components that impact PAS selection. The model presented by the authors is supported by their work and provides the field with a clear picture of the complex nature of cleavage and polyadenylation in yeast.

    4. Evaluation Summary:

      This study aims to provide a comprehensive analysis of factors governing polyadenylation site selection in yeast. Overall, the authors reveal that multiple but distinct inputs including polyadenylation machinery integrity, transcription elongation rate, nucleotide availability and chromatin landscape all contribute to controlling cleavage and polyadenylation.

      (This preprint has been reviewed by eLife. We include the public reviews from the reviewers here; the authors also receive private feedback with suggested changes to the manuscript. The reviewers remained anonymous to the authors.)

    1. Reviewer #4 (Public Review):

      The authors have studied the effects of microstimulation in a single subject with 2 microelectrode arrays in the somatosensory cortex. They aimed to investigate the how altering frequency, current amplitude and train duration affected the elicited percepts. They report three new findings:

      1) Increasing stimulus frequency did not increase the intensity of the percept, in fact there was frequency selectivity of cortical regions and these were somewhat topographically organized on the cortical surface.

      2) The intensity of the subject's responses were similar using suprathreshold (higher) currents but using lowest electrical currents (perithreshold) required higher frequencies for detection similar to other somatosensory brain regions.

      3) Frequency-intensity variation could evoke different types of sensations, with higher frequencies more likely to evoke tingle or buzz (less natural), and lower frequencies eliciting more pressure, tap, or touch (more natural type sensations).

      The major strength of this work is the detailed testing performed over multiple sessions through the same microelectrodes, demonstrating consistent effects. It provides new methods to alter sensations by changing the parameters of stimulation to optimize the type of percept that they are trying to produce.

    2. Reviewer #3 (Public Review):

      Microstimulation of the somatosensory cortex is a very promising approach to restore sensory feedback in disabled people. Hughes and colleagues performed cortical microstimulation experiments in a spinal cord injured subject to characterize the relationship between the stimulation parameters (frequency and amplitude) and the perceived sensation (type and intensity). This type of experiment is very important to better understand the potentials and limits of this approach. The results achieved by the authors are very interesting and can represent a first step towards the development of more effective and personalized approaches to restore sensory feedback. These results need to be confirmed with additional subjects and during closed-loop experiments.

    3. Reviewer #2 (Public Review):

      This study induced tactile percepts through microstimulation via two multi-electrode arrays implanted over a quadriplegic's primary somatosensory hand region. The report focuses on manipulation of the stimulation frequency of microstimulation, though further manipulations were tested and are briefly reported.

      For different stimulation sites, the perceived intensity was highest at different stimulation frequencies. This result contradicted the expectation that higher stimulation frequency would be related to higher perceived intensity. This expectation derived from previous work in non-human primates that showed lower detection thresholds for higher-frequency stimulation. The authors show that the same result is obtained in their human patient, suggesting that differences exist between near- and supra-threshold perceived stimuli and that, accordingly, generalizing from non-human primate work has its traps.

      The authors grouped stimulation sites according to optimal stimulation frequency into low, intermediate, and high frequency preferring sites. These three classes were spatially clustered, and related to different patterns of reported perceptual qualities (such as vibration, pressure etc).

      The paper's results are important for practical developments of sensory feedback in brain-machine interfaces. Understanding the perceptual result of brain stimulation requires reports by human participants, as underlined by the differences uncovered here between near- and supra-threshold stimulation. They furthermore reveal new aspects of the cortical organisation of primary somatosensory cortex.

      The conclusion of clustered patches sensitive to specific frequencies is tentative. As an inherent limitation of intracranial recordings, the total number of stimulation sites is small, and some electrodes did not produce significant results, further reducing the number of analysable sites. Therefore, it is possible that stimulation doesn't truly fall into three distinct clusters (even if such clustering is statistically supported with the current data set), but are actually continuous or divide into a larger number of classes. Notably, this critique does not invalidate the main finding that different patches of cortex show specific frequency preferences.

    4. Reviewer #1 (Public Review):

      This manuscript reports data from unique experiments in which a paralysed person reported sensations evoked by microstimulation of the somatosensory cortex. The main emphasis of this paper is on the effects of increase in stimulation frequency. It was discovered that depending on the electrode used, the peak intensity was felt at different frequencies. Accordingly, the electrodes and stimulation sites were divided into three groups-Low, Intermediate and High frequency preferring. Overall, it was noticed that in most electrodes increasing stimulation frequency beyond about 100 Hz led to less intense sensation. Without knowing the exact somatosensory circuits involved in processing, the connection with recently discovered human vibrotactile psychophysics phenomena and cortical recordings in mice are speculative, but are in close agreement with the current observation and thus the manuscript would benefit from expanding discussion on this. I personally don't think there is any contradiction with non-human primate studies, as the authors state, rather it should be viewed as a significant extension to those studies and warrants viewing them in a new light.

      A very interesting observation is that three types of frequency-intensity effects are associated with different perceptual qualities. However, types of seemingly distinct sensations might be attributed to semantics describing sensation of periodic stimulation at different intensities. Subjective reports of one subject are very valuable to set future directions for this kind of investigation, but may not be enough to generalise those findings just yet.

      The location of electrodes belonging to three different frequency-intensity effect groups appeared to be not at random, but whether it reflects cortical organisation or some other factors like systematic variation in electrode depth might have influenced the result, needs to be confirmed. Only a small number of electrodes was tested - 8 in the Medial Array and 11 in the Lateral Array.

      Three frequency-intensity effect group electrodes also differed in median intensity reported across all frequencies, which cautions that the reported perceptual quality differences at least partly might be attributed to the overall level of intensity sensation. It has to be noted that the overall frequency-intensity response profile did not change by changing the stimulation current, however some shifts seems to be present. Alternatively, such frequency-intensity effect profiles represent circuits tuned to detection of specific features of stimuli. This possibility is indeed very intriguing.

      As those experiments performed on a human subject with implanted electrodes are absolutely unique, the data are exceptionally interesting regardless of limitations generalising those findings. Unlike animal experiments humans can describe sensations evoked by cortical microstimulation so there is no substitution for these experiments and every piece of evidence is highly valuable. These results give ground for new hypotheses to better understand how the somatosensory system works and generate ideas for designing future human psychophysics and animal model experiments. From a practical point of view, it is exceptionally valuable for informing the design of stimulation protocols for bidirectional brain-computer interfaces (BCIs).

    5. Evaluation Summary:

      This paper characterizes percepts evoked by micro-stimulating the somatosensory cortex of a human participant. The study provides some new insight into the organization of the human somatosensory cortex and represents an important step in providing more effective somatosensory feedback for brain-machine interface users.

      (This preprint has been reviewed by eLife. We include the public reviews from the reviewers here; the authors also receive private feedback with suggested changes to the manuscript. Reviewer #2 and Reviewer #3 agreed to share their names with the authors.)

    1. Reviewer #3 (Public Review):

      Hallast and coworkers identify a potentially novel complex Y chromosome structural rearrangement that is associated with male infertility in a carefully phenotyped European cohort. The authors interrogate the Y chromosome AFZc region in 1190 Estonian idiopathic male infertility cases of varying severity and 1134 controls (healthy young men or proven fathers). They replicate partial AFZc deletions and replicate a known gr/gr deletion association with comparable effect sizes. After conditioning on gr/gr deletion status, they identify an association with secondary b2/b4 duplications on case status, but with no accompanying observed effect on andrological sub-phenotypes.

      The authors identify multiple non-syntenic DAZ/CDY1 deletion patterns that are consistent with a large inversion followed by deletion. The authors further infer that this putative inversion is fixed in a Y chromosome sub-lineage. Based on population haplotype frequency estimates they infer that a surprisingly large number of individuals harbouring the r2/r3 inversion have a subsequent deletion. They show through detailed phenotyping shows that r2/r3 inversion+deletion cases in their cohort have more severe disease.

      Strengths:

      1) Despite being a very common disease, idiopathic infertility is severely understudied, due in large part to difficulties in sample acquisition. More generally, sex chromosome genetic associations for common disease as a whole are understudied owing to their structural complexity and other technical issues. The authors should be applauded for attempting to overcome these challenges.

      2) The putative finding of a large-effect common variant conferring risk to a common genetic disease is of great interest. The authors leverage the advantages of a logistically coherent health care system. The level of phenotypic detail of andrological parameters in both cases and controls is impressive and aid in biological interpretation of the genetic findings. For example, the distinction between azoo- versus oligozoo-spermia shed light on a potential meiotic disease aetiology. The endocrine values add important context.

      3) The authors imply that the combination of the inversion+deletion risk allele favours a meiotic failure disease aetiology as opposed to a gene dosage aetiology. This is a potentially disruptive finding.

      Weaknesses:

      1) The authors do not replicate their association, raising the possibility of a false positive finding.

      2) The study is underpowered to reliably detect variants of small effect, and underpowered in general. This is a common challenge in reproductive genetics.

      3) The logical inferences (as opposed to direct measurement) made by the authors are elegant but add substantial uncertainty to the findings. Most notably, cytogenetic or long-read sequencing based validation of the inversion genotype would strengthen confidence in the study considerably.

      If the genetic association is robust and the allele frequency estimates are well calibrated, the implications of this work are considerable. The locus could become a genetic biomarker for infertility. The locus could potentially account for a huge amount of variance in polygenic risk associated with infertility. The findings also raise a fascinating evolutionary conundrum as to how an allele associated with such an evolutionarily destructive phenotype could occur at such high frequencies. The authors briefly raise the possibility of age-dependent effects, but with extremely sparse data.

    2. Reviewer #2 (Public Review):

      Hallast et al. have performed an extensive genetic analysis of a cohort of men with idiopathic infertility, for whom many have accompanying phenotypic data in the form of andrological parameters. The complex genetic architecture of repeating sequences on the Y chromosome gives rise to recurrent AZFc deletions that affect male infertility. However, while partial deletions of AZFc are reasonably frequent, they have less clear phenotypic effects. gr/gr and b2/b3 deletions seem to be a risk factor for spermatogenic impairment in some populations but are fixed in others. Hallast et al. focus on these partial AZFc deletions in a reference cohort and a cohort with idiopathic infertility from the same geographic population, characterising further structural and sequence variation, Y-chromosomal haplogroups, and gene dosage.

      While the gr/gr deletion is present in the reference group of individuals with normal andrological parameters, Hallast et al. show that this deletion is enriched among patients, with 2.2-fold increased susceptibility to infertility. As observed in other European populations, the prevalence of b2/b3 deletion was similar in the reference group and the patient group, suggesting that it is not a spermatogenic impairment risk factor for this Estonian population either.

      A quarter of Estonian gr/gr deletion carriers belonged to the Y chromosomal haplogroup R1a1-M458. Within this Y haplogroup, an inversion has occurred that promotes subsequent deletion, likely causing severe spermatogenic failure in the majority of carriers as this complex rearrangement is enriched 8.6-fold in individuals with severe spermatogenic impairment.

      Some major strengths of this paper are the size of the groups recruited (1,190 patients and 1,134 reference individuals) from a single national population, the extensive accompanying andrological data, and the genomic characterisation of many individuals to elucidate the relationship between specific structural variants and effects on fertility.

      The discovery of the fixed inversion infertility risk factor on a specific Y haplogroup is a useful contribution that could aid genetic counselling efforts through carrier identification and risk mitigation.

      However, I am seeking clarity on multiple testing correction for microdeletion association with specific andrological parameters. Besides this, the main conclusions of this paper are supported by other data presented.

    3. Reviewer #1 (Public Review):

      In this study, Hallast and colleagues performed a detailed genetic analysis of the AZFc region of the Y-chromosome in a large cohort of 1190 Estonian men with idiopathic infertility and >1100 controls from the same population. They focused on partial deletions of the AZFc regions, because their clinical significance remains controversial and published reports are often contradictory. The authors performed a comprehensive genetic analysis, which in addition to a standard AZFc deletion protocol with gene dosage of the key AZFc genes, included also Y-haplogroup determination and re-sequencing of the retained DAZ, BPY2 and CDY genes. The authors showed that gr/gr deletions were enriched in infertile men, thus confirming that this deletion is a risk factor for impaired spermatogenesis. An important novel finding is identification of a previously unknown structural variant: a long r2/r3 inversion, which likely destabilizes two palindromes and leads to deletions. This variant is fixed in the Y lineage R1a1-M458, which is common in some Central European populations. In the Estonian study group, nearly all patients with this variant and a gr/gr deletion, had a severe impairment of spermatogenesis. The authors mentioned that the variant largely 'destroys' two palindromes, P1 and P2. One would like to see more discussion what are the structural and functional consequences - e.g. are any loci for e.g. non-coding RNA affected by a deletion in men with this inversion in comparison to those without?

      The authors also speculated in the discussion that deletion on this background might lead to progressive worsening of the reproductive phenotype. This is based on just one control individual, a young man with borderline reproductive parameters, and corroborating this hypothesis would require further studies, including repeated evaluation of the same individuals over a long period of time.

      This is a high quality study, performed by collaborators from the UK and Estonia, with an excellent track record in the analysis of the Y-chromosome structure and evolution, and in reproductive genetics and clinical andrology, respectively. The data presentation and figures are very informative and convincing. Among the strengths of the study, I have to emphasise a detailed phenotypic evaluation of the study subjects, including several parameters of testis function, semen analysis, and reproductive hormone profiles. Hence, the results and conclusions are valuable and add to the understanding of the consequences of the partial AZFc deletions. The authors also provided useful guidelines how to identify men with this variant in labs performing genetic analysis of infertile couples.

    4. Evaluation Summary:

      This study presents extensive genetic analysis of a relatively large cohort of men with idiopathic infertility, with considerable accompanying andrological phenotypic data. Through careful step-by-step investigations, an inversion variant is identified as a risk factor for subsequent deletion variants that can lead to substantially increased risk of impaired spermatogenesis, on an age-structured basis, relative to non-carriers. This work will be of particular interest to the reproductive genetics field, but also has wide ranging implications for colleagues interested in common disease genetics, meiosis, structural variation, dosage sensitivity, and sex chromosome evolution. As part of the most comprehensive investigation of AZFc micro-deletions and structural variation to date, the authors have identified a novel structural variant of the Y-chromosome that predisposes to spermatogenic failure and provided clear guidelines for genetic counseling.

      (This preprint has been reviewed by eLife. We include the public reviews from the reviewers here; the authors also receive private feedback with suggested changes to the manuscript. The reviewers remained anonymous to the authors.)

    1. Joint Public Review:

      Hsiang-Chun Chang et al. investigated the role of ALR, component of the mitochondrial MIA40/ALR protein import apparatus, in cytosolic Fe/S cluster biogenesis performing loss-of-function (silencing) and gain-of-function (over-expression) experiments with MEFs (mouse embryonic fibroblast) and HEK293 (human embryonic kidney) cells. They find that downregulation of ALR impairs maturation of cytosolic Fe/S cluster proteins, while activities of mitochondrial Fe/S cluster proteins such as complex I and II are unaffected. Furthermore by reducing ALR expression cells up-regulate cellular iron transporter transferrin receptor 1 (Tfrc) and consequently cellular iron levels increase. The authors reveal that ALR down-regulation post-transcriptionally regulates Trfc through stabilization of Trfc mRNA mediated by IRP1, which is activated by absence of its mature Fe/S cluster. Additionally they demonstrate that only over- expression of full-length ALR, mainly located in the mitochondria and not the cytosolic short from ALR can reverse cytosolic Fe/S cluster maturation and therefore IRP1 activity and cellular iron levels. In the last part of their manuscript the authors present evidence about the mechanism by which ALR carries out this function. They find that ALR enables mitochondrial import of ABCB8 but not ABCB7, two mitochondrial proteins involved in the maturation of cytoplasmic Fe/S clusters. This transport into mitochondria requires functional MIA40/ALR in the IMS and further the TIM23 complex to the inner mitochondrial membrane. ABCB8 interacts directly with MIA40 by 5 cysteines (difulfide bond formation) and therefore these conserved cysteins are necessary for recognition and binding, which is not the case for ABCB7. These data add an interesting view on how ALR expression is linked to Fe/S cluster protein maturation, cellular iron homeostasis and their potential impact on related dieases.

      The strength of the manuscript are the well designed and performed experiments presenting evidence of how mitochondrial function of ALR is linked to the sulfur redox homeostasis and cellular iron regulation. Interestingly, reduction in cytsolic Fe/S cluster maturation and therefore increased cellular iron levels is also associated with increased sensitivity of cells to oxidative stress and this might be a plausible explanation for the previously described impact of full length ALR expression on oxidative stress in various disease models (PMID: 30579845).

      The drawn conclusions that the mechanistic studies about the role of ALR for Fe/S cluster maturation and cellular iron uptake may parallel the disease phenotype of patients with mutations in ALR gene GFER may be in parts speculative. The reported ALR mutations are varying and result either in partial functional or truncated protein expression (PMID: 20593814, PMID: 25269795). ALR is expressed in several isoforms (varying between two or three depending on the organ) of different size (15kDa, 21kDa, 23kDa). Most of the data showing the short form ALR (15kDa) solely in the cytosol and the full length ALR (23 kDa) as wells a second immuno-reactive band of 21 kDa ALR, both in cytosol and mitochondria (PMID: 30579845). While over-expressing full length ALR the authors show in the manuscript higher expression level in the cytosol than in the mitochondria fraction (w-blot, which is not reflected in the graph of Fig. S3 B). It was reported earlier that continuous over-expression of full length ALR in mammalian cells leads to the accumulation of full length ALR not only in the mitochondria but also in the cytosol (PMID: 23676665), which is also in agreement to observations of cytosolic occurrence of full length ALR (see above). This raises the question whether the conclusions made in the manuscript may be due to its cytosolic accumulation rather than or in addition to its mitochondrial localization. The presented study refers at several points to a study by Lange et al 2001 demonstrating that ALR rescues cytoplasmic Fe/S cluster maturation defects in Erv1- null yeast. There has been contradictory evidence published about the role of ALR in the maturation and export of cytosolic Fe-S cluster proteins. Lange et al. claimed that ALR interacts with Atm1 (an ABC transporter in the inner membrane of the mitochondria) and facilitates the export of Fe-S proteins to the cytosol. However, later it was suggested that, in yeast cells, ALR plays neither a direct nor an indirect role in cytosolic Fe-S cluster assembly and iron homeostasis. It is claimed that Iron homeostasis is independent of Erv1/Mia40 function in various yeast strains (Erv1 mutant) and that the finding by Lange et al. is based on only one Erv1 mutant strain, mainly due to strongly decreased glutathione (GSH) levels (PMID: 26396185).

      Additionally, this statement is reinforced by a study in human cells, demonstrating that depletion of ALR does not impact the maturation of cytosolic Fe-S proteins assembled via the CIA pathway (PMID: 25012650). Furthermore, this study in mammalian cells has pointed out the role of ALR in exporting MitoNEEt to the outer mitochondrial membrane (OMM). MitoNEEt is a Fe-S protein that is synthesized in the mitochondrial matrix. Upon synthesis, MitoNEEt translocates through the inner membrane of the mitochondria by ABCB7 and then through the IMS by ALR to the OMM where it contributes to cell proliferation (PMID: 25012650).

    2. Evaluation Summary:

      This is an interesting manuscript and experiments generally make their point on Alr effects. However, additional data would strengthen the paper with respect to the relative roles of cytoplasmic vs mitochondrial isoforms as would mitochondrial function studies.

      (This preprint has been reviewed by eLife. We include the public reviews from the reviewers here; the authors also receive private feedback with suggested changes to the manuscript. Reviewer #1 and Reviewer #3 agreed to share their names with the authors.)

    1. Reviewer #3 (Public Review):

      These authors report the identification of the function of a genetic determinant (dev1, formerly ydcO ) carried by the ICEBs1 element that increases fitness of the host strain by delaying the entry into the normal developmental pathway leading to biofilm formation and ultimately sporulation, such that the subpopulation expressing the product of dev1 increases in a mixed pool. An interesting novel aspect of the dev1 system is that it is co-regulated with ICEBs1 conjugation, and thus is only activated when the host strain is a minority of a mixed population; in this scenario the Dev1+ subpopulation is essentially cheating on the Dev-. Since expression of the Dev1 phenotype in an entire population would likely cause a crash, the ICE- population density-dependent regulation ensures that the fitness advantage disappears before the crash can occur. I think that the gene is interesting and this report adds a significant aspect to our understanding of the biology and evolution of ICE elements. Overall I am positive about this paper.

    2. Reviewer #2 (Public Review):

      This manuscript provides convincing evidence that the ICEBs1 conjugative element confers a fitness advantage on the model bacterium B. subtilis during biofilm formation and sporulation. This effect is frequency dependent and is effected in large measure via an element gene, named devI, by an unknown mechanism that probably decreases the concentration of Spo0A-P. The data are well presented and successfully make the case for a fitness advantage conferred by the mobile element during biofilm formation and sporulation. It is likely that a mechanistic exploration of DevI will follow and will provide another facet to the regulation of Spo0A, a gift that keeps on giving.

      Delaying sporulation in a mixed culture confers an advantage for the delayers. This has been convincingly shown. But I wonder about the effects in a clonal population of cells carrying ICEBs1 in competition with a null population. I appreciate that the delay in sporulation is transient, as pointed out in lines 404-407. But a delay of a few hours may be critical in this type of competition between populations as resources become limiting. This is presumably why sporulation is so exquisitely regulated on so many levels and in response to many external an internal signals. If so, ICEBs1 would have a deleterious effect and the element might be in danger of extinction. I suppose that an analogous discussion could be considered for biofilm formation.

    3. Reviewer #1 (Public Review):

      Mobile genetic elements like phages, transposons, plasmids, and conjugative elements are widespread in prokaryotes and confer important traits to their hosts, including antibiotic resistance and virulence. In this study, the authors convincingly demonstrate that the mobile element ICEBs1 of Bacillus subtilis confers a fitness advantage to its host by delaying entry into metabolically costly developmental processes (biofilm formation and sporulation). The gene devI is identified as being responsible for delaying initiation of development, but the mechanistic basis for this could be further explored. Their results show that, in addition to conferring novel phenotypes, mobile elements exert influence by tuning existing host pathways, a paradigm that could be extended to many other prokaryotes.

      Strengths:

      The paper is written very clearly, the experimental data is convincing, the interpretations and conclusions are justified by the data.

      The authors implemented clever genetic approaches to quantitatively compare the fitness of strains harboring or lacking ICEBs1 in co-culture. I appreciated the use of the conjugation mutant (comEK476E) to prevent ICE transfer that would confound the analysis. Similarly, the authors genetically separate the developmental pathways under which ICEBs1 confers an advantage (biofilm formation and sporulation), by deleting the spo0A promoter under sigH control to prevent sporulation but retain biofilm formation. Finally, to assess the contribution of ICE-encoded genes to fitness, the authors take advantage of a "locked-in" ICE variant (∆attR, oriT*) that cannot excise and replicate - thereby eliminating the confounding variable of gene dosage from ICE replication.

      As mentioned above, the effects of ICEBs1 on development set an important precedent for how mobile genetic elements interact with their hosts. They are often regarded as autonomous elements, but the authors provide an example of how these elements can influence host pathways.

      Suggestions for improvement:

      The authors show that the gene devI is necessary and sufficient for ICE-mediated delay of development initiation. Gene expression analyses suggest this delay affects the earliest stages of development (genes under control of spo0A, the master regulator of sporulation, are affected). I think the authors could investigate the mechanism of spo0A inhibition in more detail. Which aspect of spo0A function is affected by DevI? Starvation sensing, spo0A expression, activation of upstream kinases (KinA?), phosphorelay, or binding of Spo0A~P to promoters?

      Ectopically expressed DevI (Fig 5) seemed to have a stronger inhibition of sporulation than ICEBs1 alone (Figure 2) - does the constitutively expressed protein block rather than delay sporulation? I wonder if the authors would like to comment on how, in the wild-type ICEBs1 context, DevI activity is eventually overcome by cells that eventually do sporulate after a delay. Furthermore, will cells that successfully transfer ICEBs1 be relieved of DevI-mediated sporulation inhibition?

      The data in Fig 4 suggest that devI is not the only ICEBs1-encoded factor providing a fitness advantage. Do the unknown factor(s) also delay development, or do they work via other mechanisms: i.e. does the ∆devI mutant have a sporulation delay? Any idea what the other factors might be (from bioinformatics for example)?

    4. Evaluation Summary:

      All the reviewers were in agreement that this is an exceptionally rigorous paper that sets an important precedent for how mobile genetic elements can influence host biology.

      (This preprint has been reviewed by eLife. We include the public reviews from the reviewers here; the authors also receive private feedback with suggested changes to the manuscript. Reviewer #2 and Reviewer #3 agreed to share their names with the authors.)

    1. Reviewer #3 (Public Review):

      In "KLF10 integrates circadian timing and sugar signaling to coordinate hepatic metabolism", Anthony Ruberto and colleagues characterize the role of the transcription factor KLF10 in circadian transcription and the transcriptional and physiological responses to hexose sugars in mouse hepatocytes. They confirm earlier reports that Klf10 is expressed rhythmically in mouse liver, with peak expression at ZT9. They show that Klf10 expression is induced by glucose and fructose and that hepatocyte-specific deletion of Klf10 exacerbates hyperglycemic and hepatosteatotic responses to 8 weeks of elevated sugar consumption. They use RNA sequencing and ChIP sequencing to define the complement of Klf10 target genes in hepatocytes and how they are regulated by glucose and fructose. Together their data support a model in which KLF10 limits the transcriptional induction of rate-limiting enzymes involved in gluconeogenesis and lipogenesis in response to elevated sugar consumption, thus mitigating the pathophysiological impact of high sugar diets. The experiments are mostly well designed, presented, and interpreted but several points require additional investigation and/or clarification. While the current manuscript suggests an integration of circadian timing and sugar signaling by KLF10, additional experiments to establish how some of the molecular and physiological effects are modulated by time of day are needed to better support that claim.

      Strengths:

      This study uses a combination of genetic, biochemical, and physiological approaches to investigate the hepatocyte-specific function of the transcription factor KLF10. Deletion of KLF10 specifically in hepatocytes distinguishes this study from other related work. Further, the characterization of global daily gene expression patterns in mouse liver is well designed and analyzed and establishes that hepatocyte-specific deletion of Klf10 remodels daily rhythms of gene expression in the liver. The combination of that analysis with ChIP sequencing provides powerful evidence to establish the hepatocyte-specific KLF10-dependent transcriptome and highlights its targeting of rate-limiting enzymes in lipogenic pathways. Together, the molecular and physiological analyses in this study provide compelling evidence that KLF10 plays a protective role in the context of excessive sugar consumption by limiting lipogenic gene expression pathways and thereby suppressing hepatic steatosis.

      Weaknesses:

      In its present form, this study does not thoroughly connect the in vitro and in vivo findings and misses the opportunity to fully characterize the role of KLF10 in circadian regulation of lipogenesis in response to excessive sugar consumption in vivo. It is unclear whether the concentrations of glucose and fructose used to stimulate primary hepatocytes are similar to those experienced in response to the dietary stimulus in vivo and there is no examination of the impact of sucrose on Klf10 expression or downstream gene expression. This omission complicates the interpretation of the response to the combined sugar stimulus in vivo, especially in light of a recent report that KLF10 deletion protects against hepatosteatosis caused by consumption of a high sucrose diet. It also does not examine how time of day influences KLF10-dependent gene regulation in response to sugar consumption. Without these analyses, it falls short of connecting the circadian and sugar-response pathways through KLF10.

    2. Reviewer #2 (Public Review):

      This study builds on a previously published paper from this group showing that KLF10 is under circadian control, and it in turn affects the oscillation of a set of metabolic genes in the liver. While the previous study utilized a systemic Klf10 KO mouse model, here, Ruberto et al. generated a conditional hepatocyte-specific Klf10 KO mouse model (Klf10Δhep).

      The authors find that the absence of hepatocyte KLF10 alters the circadian oscillation of a number of metabolic genes. In response to sugar consumption, Klf10Dhep mice demonstrate exacerbated adverse effects as well as significantly increased hepatic expression of many glycolysis, gluconeogenesis, and lipogenesis related genes. They conclude that Klf10 normally acts as a "transcriptional brake" to protect animals against the effects of high sugar consumption and show via ChIP-seq that KLF10 is present at a wide range of metabolic genes, particularly at those involved in acetyl-CoA metabolism. The findings are interesting, particularly in the context of the burgeoning burden of metabolic disease and its relation to high sugar consumption, and are supported by the experimental findings.

    3. Reviewer #1 (Public Review):

      Ruberto et al. utilize hepatocyte-specific Klf10 knock-out mice to demonstrate expression changes of rhythmic transcripts, highlighting dysregulated glucose and lipid metabolism as an enriched gene set. They demonstrate that KLF10 is necessary for proper glycemic control in mice and that KLF10 coordinates suppression of metabolic gene expression in the liver in response to high sugar diet. The authors corroborate their findings by analyzing gene expression changes of primary hepatocytes stimulated with fructose and high glucose. Finally, the authors identify KLF10 target genes using ChIP-seq and validate Acss2 and Acacb as target genes suppressed in mice following a high sugar diet. Novel aspects of this work include the metabolic characterization of a hepatocyte-specific Klf10 knock-out mouse, identification of KLF10 target genes in hepatocytes using ChIP-seq, and description of circadian transcript expression with Klf10 loss.

    4. Evaluation Summary:

      This paper will be of interest in the fields of circadian biology and metabolic physiology. It provides a molecular mechanism for protection against development of fatty liver in response to high sugar consumption. Quality data support the key claims of the paper in each of the main research areas (circadian biology and metabolism) but additional efforts are needed to integrate the two parts. The current study does not thoroughly connect the in vitro and in vivo findings and misses the opportunity to fully characterize the role of KLF10 in circadian regulation in response to excessive sugar consumption.

      (This preprint has been reviewed by eLife. We include the public reviews from the reviewers here; the authors also receive private feedback with suggested changes to the manuscript. Reviewer #3 agreed to share their name with the authors.)

    1. Reviewer #3 (Public Review):

      The authors sought to directly compare manipulations of different signaling pathways for their ability to induce cell cycle activation and proliferation in cardiomyocytes from various species and maturation levels. The manipulation consisted of peristent lentiviral expression of beta catenin, cyclin D2, rat Erbb2, human Erbb2, and Yap8SA.

      A major strength of this study is that it shows that most of above expressions appeared to induce negative feed-back responses at the post-transcriptional level to limit protein overexpression, illustrating how difficult it is to manipulate cardiomyocyte proliferation. By contrast, human Erbb2 did induce prominent proliferative effects in both rat and human cardiomyocytes. However, this finding has been shown before. The novelty here is limited to interspecies differences of the effects of Erbb2 overexpression. Multiple studies in oncology have shown that Erbb2 overexpression increases cell proliferation and is sufficient to induce cancer growth. It has also been shown that transient overexpression of Erbb2 in vivo in the heart results in dedifferentiation and proliferation of cardiomyocytes. The observation that Erbb2 overexpression induces cardiomyocyte dedifferentiation alongside mitosis is not unexpected; in general, stimuli that induce cardiomyocyte proliferation also induce cardiomyocyte dedifferentiation and sarcomere disassembly.

      In this study, in a 3D model of rat neonatal cardiobundles Erbb2 overexpression also led to formation of a necrotic core. It also led to loss of sarcomeres and contractile force and tissue stiffening. These effects appeared to be mediated by mTOR-independent, Erk-dependent mechanisms. Although experiments in this study are of a high technical level, and results interesting, the likely impact of this work is minor. Indeed, the overall picture of Erbb2-induced pathologic hypertrophy is likely related to the applied methodologies, i.e., a persistent as opposed to temporally controlled Erbb2 overexpression and the use of an avascular 3D model lacking the cellular complexity of the intact heart.

    2. Reviewer #2 (Public Review):

      This manuscript by Nicholas Strash et al. compares the effects of several potential mitogens on cell cycle of the two most used in vitro models of cardiomyocytes (CMs): neonatal rat ventricular myocytes (NRVMs) and human induced pluripotent stem cell (hiPSC)-derived CMs. In addition, they use a 3D model of NRVMs as a model that represents more mature, non-proliferating CMs. The work is interesting for researchers working in the field of cardiac regeneration and provides the first direct comparison of several potential mitogens. The inclusion of several in vitro models to account for potential species differences strengthens the data. The results support previously published findings and the main conclusions are supported by the data presented.

      The authors used a 3D model, cardiobundles made from NRVMs, as a more mature CM model. However, these cardiobundles still had a considerable number of CMs in active cell cycle in basal conditions. Whether this reflects true proliferation or the postnatal multinucleation process of rat cardiomyocytes, is unclear. Furthermore, post-mitotic human CMs were not studied. These can be obtained from hiPSC-CMs by prolonged culture or using metabolic stimuli as shown by Mills et al. 2017 (PNAS).

      The authors demonstrate that the known mitogenic pathway for CMs, Erbb2-mediated signalling, promotes cell cycle activation in 2D cultures or NRVMS and hiPSC-CMs as well as in 3D cardiobundles. Although cell cycle activity was clearly induced, no actual proof of cytokinesis has been presented. For the cardiobundle work, it remains unclear if the increase in cross-sectional size of cardiobundles induced by Erbb2 signalling is due to increased number of CMs or increased size of CMs. Both the physiological ligand of Erbb3, Neuregulin-1, and the downstream ERK pathway are known to induce CM hypertrophy (see for example Zurek et al. 2020 Circulation; Bueno and Molkentin 2002 Circ Res).

      The data analysis and statistics raise some concerns, which require clarification. First, the N numbers are really big and according to the Table 1 it is unclear if they all indeed represent independent samples. For example, one field in a monolayer (Table 1, definition of n in Figures 1J, 1P, 4C, 4E, 4G) should not be considered to represent n=1, if several images were analysed from the same sample and/or if several technical replicates (samples prepared from the same cell isolation or differentiation and treated similarly) were analysed. Only samples from separate differentiations or cell isolations should be considered as representatives of n and the results from technical replicates should be averaged to form the n=1 data. Second, the selection of statistical tests is a concern. It is unclear if the data were analysed for equal variances before selecting the test (parametric vs. non-parametric). It is also unclear why the authors carried out multiple t tests instead of using ANOVA or its variations, which are generally considered more suitable for multiple comparisons.

    3. Reviewer #1 (Public Review):

      This manuscript titled "Human Erbb2-induced Erk Activity Robustly Stimulates Cycling and Functional Remodeling of Rat and Human Cardiomyocytes" directly compared a number of previously identified candidate mitogenic genes in different cardiomyocytes and different maturity status and investigated the pathway involved. The authors found that the human Erbb2 triggers the strongest proliferative effect in both human-induced Pluripotent Stem Cells and Neonatal Rat Ventricular Myocyte, and was associated with the Erk pathway. The authors then proved this association by demonstrating that inhibition with Mek inhibitor and Erk inhibitor attenuates the human Erbb2-induced response. In addition, the authors found that Yap8SA failed to trigger proliferation in the cardiomyocyte tested due to negative feedback loop. Thus, this study provides helpful information regarding the relative effectiveness of a number of candidate genes.

      Strengths:

      — This study investigates five candidate genes in different species and different maturation status of cardiomyocyte. In each setting, all genes are studied. Therefore, direct comparison regarding their effectiveness can be made.

      — Furthermore, this study demonstrated the mechanism on how the differing responses arose, providing in-depth information.

      Weakness:

      — Although this study showed induced proliferation of cardiomyocyte following candidate genes expression, the authors did not present sufficient proof that the function would improve. Cardiomyocyte harbor differing functions and parameters that represents it should ideally be investigated.

    4. Evaluation Summary:

      This paper will be of interest to scientists in the field of regenerative medicine. The authors compare effects of persistent lentiviral expression of various mitogens in cardiomyocytes in vitro. Technically experiments are of a very high standard, but the data are somewhat difficult to translate to the in vivo situation. The statistical analyses would have to be robust and sufficient for the conclusions to be supported by the data.

      (This preprint has been reviewed by eLife. We include the public reviews from the reviewers here; the authors also receive private feedback with suggested changes to the manuscript. Reviewer #3 agreed to share their name with the authors.)

    1. Joint Public Review:

      The manuscript by Liu and colleagues is a very elegant study demonstrating the emergence of ectopic beta cells after beta cell specific ablation in zebrafish pancreas in a context in which vascularization of the larvae was altered in either npas4l mutants or etv2 morphants. Provocatively, the authors demonstrate the mesodermal origin of ectopic and functional beta cells using 2 mesodermal mapping strategies. This study is very well conducted with appropriate controls and rigorous statistical analyses. This study will likely impact the field of pancreas regeneration providing a novel source for beta cells within the adjacent mesodermal tissue.

    2. Evaluation Summary:

      This is an elegant study demonstrating the emergence of mesoderm-derived beta-like cells following beta-cell ablation in an endothelial cell deficient context. These findings will be of interest to scientists in the areas of regeneration and reprogramming, as they reveal a previously unknown degree of germ layer plasticity in the embryo. In the long term the study has potential impact in the diabetes field, as it reveals a novel path for redirecting somatic cells into insulin-producing cells in an in vivo context.

      (This preprint has been reviewed by eLife. We include the public reviews from the reviewers here; the authors also receive private feedback with suggested changes to the manuscript. Reviewer #1 and Reviewer #3 agreed to share their names with the authors.)

    1. Joint Public Review:

      Although sensory neurons are thought to be the primary detectors of environmental stimuli in skin, it is more and more appreciated that non-neuronal cell types also play important roles. Previous work from the Stucky group (and others) has shown stimulation of optical excitation of keratinocytes can evoke action potentials in sensory neurons and behavioral responses suggesting functional connectivity. Earlier work from the Stucky group provided evidence that keratinocytes are thermosenstive and required for normal temperature sensation.

      Here, they look into whether these cells are also important for mechanosensation. Using K14-Cre-dependent conditional KO mice, functional assays and behavioral analysis, Moehring and collaborators report that the mechanosensitive channel Piezo1 is expressed in keratinocytes in mice and humans and claim that it contributes to normal touch sensation. The in vitro data convincingly show that keratinocytes have mechanically evoked currents mediated by Piezo1. Interestingly, this work shows that recruitment of epidermal, non-neuronal Piezo1 by mechanical stimulation of keratinocytes could contribute significantly to touch through activation of cutaneous sensory fibers (mechanoreceptors). Specifically, they provide evidence that removing Piezo1 from keratinocytes reduces the frequency of spiking in select types of sensory neurons to punctate and dynamic touch stimuli. Finally, they supply quite surprising data documenting significant behavioral deficits in Krt-conditional knockout mice.

      Overall, this work provides an intriguing series of observation and potentially fundamental discovery. However, concerns remain as to how the relatively subtle differences in the skin-nerve recordings result in such profound behavioral effects? Similarly, it is hard to understand how loss of the related channel Piezo2 in sensory neurons completely abolishes many touch responses if mechanosensitivity of keratinocytes is sufficient to evoke touch behaviors (as their experiments applying Yoda-1 to the hindpaw of mice would suggest). Altogether, this work suggests a novel role for epidermal Piezo1 in normal touch but the key neuro-epithelial signaling remains to be identified.

    2. Evaluation Summary:

      This manuscript is of broad interest to readers in the field of somatosensation. The identification that a common type of skin cell responds to mechanical force using a specific molecular receptor called Piezo1 is an important contribution to our understanding of mechanotransduction. A combination of conditional gene knockout with physiological and behavioral assays provides intriguing evidence that communication between skin and nerves is important for normal touch sensation, a conclusion that if further supported by additional data could become a fundamental discovery.

      (This preprint has been reviewed by eLife. We include the public reviews from the reviewers here; the authors also receive private feedback with suggested changes to the manuscript. Reviewer #1 and Reviewer #2 agreed to share their names with the authors.)

    1. Reviewer #3 (Public Review):

      The authors clearly demonstrate the effectiveness of optimized tools to generate precise C to T point mutations in zebrafish F0 embryos. The demonstrate germline transmission and an associated mutation for one mutation. There is sufficient data for members of the community to consider adopting these tools to generate mutation in their own laboratories

    2. Reviewer #2 (Public Review):

      Rosello et al. present very compelling evidence that Cytosine base editors can be used to introduce G:C to A:T base conversions with high efficiency in zebrafish. Furthermore, they describe engineering and validation of a base editor targeting the NAA PAM sequence. Finally, they have developed a potential novel model of the Noonan syndrome. The manuscript represents an important and much needed advance in precision genome editing in the zebrafish model system.

    3. Reviewer #1 (Public Review):

      The manuscript by Rosello et al., describes the application of cytosine base editing to efficiently introduce known and predictable mutations into disease genes in vivo in zebrafish, and examine signaling pathways and model disease. The majority of the data presented is analysis of editing precision and efficiency in somatically targeted embryos, with one example of a precise edited germline allele recovered. A direct comparison of the cytosine base editor BE4 and an improved version ancBE4max indicates both are highly efficient at somatic base editing. ancBE4max reduces alteration of bases outside the base editing window, and the data suggests loci for which BE4 base editing has failed can be targeted with ancBe4max. The authors demonstrate efficient base editing in embryos at multiple cancer genes (up to 91%), introducing activating mutations into oncogenes and nonsense mutations in a number of tumor suppressors. A S33L allele was introduced into the b-catenin gene ctnnb1 to activate the wnt signaling pathway as evidenced by expression of the wnt reporter Tg(tcf:GFP). Another novel aspect of this study is that the authors have expanded base editing target site selection by switching out the ancBe4max SpCas9 PAM-interacting motif domain with the domain from Spymac, which recognizes an NAA PAM. ancBe4maxSpymac editing efficiency was modest (16-19%). The method reported here has strong potential for effective combinatorial mutagenesis to map complex genetic interactions that underly disease pathogenesis. Overall, this study demonstrates cytosine base editing is an efficient and powerful method for introducing precise in vivo edits into the zebrafish genome.

    4. Evaluation Summary:

      The manuscript by Rosello et al. represents a major advance in implementation of cutting-edge genome editing methodologies in the zebrafish. The study seeks to describe optimized tools for precise base editing in zebrafish and to demonstrate their effective application. Overall, this study demonstrates that cytosine base editing is an efficient and powerful method for introducing precise in vivo edits into the zebrafish genome, and will be of interest to scientists who use zebrafish and other genetic systems to model human development and disease.

      (This preprint has been reviewed by eLife. We include the public reviews from the reviewers here; the authors also receive private feedback with suggested changes to the manuscript. Reviewer #1 and Reviewer #2 agreed to share their names with the authors.)

    1. Reviewer #2 (Public Review):

      The manuscript "Archaeal chromatin 'slinkies' are inherently dynamic complexes with deflected DNA wrapping pathways" by Bowerman and colleagues describes a study of archaeasome dynamics combining molecular simulations, cryo-EM, and sedimentation velocity analytical ultracentrifugation. How chromatin evolved is a fundamental question in biology, marking a striking departure from the bacterial nucleoid. Indeed, ever since the first description of archaeal nucleosomes and histones HmfA/B (Sandman and Reeves mid-80s) from thermophilic archaea, this question has fascinated and puzzled the field.

      Recent work from the Luger lab figured out the organization of these archaeal chromatin fibers as a continuous loop structure. Here, the authors extend this question further. MD analyses show that Arc90 has two preferred states (closed and flexible ends), but the same 5T5K structure on 120 or 180 bp of DNA prefer a single state (closed). Sedimentation velocity analytical ultracentrifugation showed that Arc207 sediments slower than the H3 mononucleosome, implying that that Arc207 has a shape with higher anisotropy, resulting in excessive drag compared to a mononucleosome. Subsequently, high-resolution cryoEM showed that at least two distinct classes for Arc207 exist, where one class represents a 5-mer and another class represent a 7-mer. The latter has a unique shape in that the 7-mer forms an L-shape (or open clam) with a 3-mer hinging on a 4-mer.

      Overall, these data provide exciting structural insights into how archaeal chromatin is folded up at its basic unit level, which the authors describe as most fittingly as a "slinkie". Because so little is known about how nucleosomes evolved during the transition from archaea to eukaryotes, we found this interdisciplinary report well written and with compelling data, that will be of interest to the chromosome biology field at large. We suggest a minor revision in which a few technical points are addressed.

      Considerations:

      1) The cryoEM data showed two main groups of particles: 5-mer protecting 150 bp and a 7-mer protecting either 90bp or 120bp. A few times in the manuscript (both in the results and discussion section) the authors mention a 30-bp MNase digestion ladder is observed. The Mnase data should be included, as this provides evidence that the structures observed by cryoEM indeed represent physiological structures, especially if strong discrete bands are observed at 90, 120, and 150 bp.

      2) The two main classes found by cryoEM give the impression that adding dimers results in altered structures. The 7-mer shows an angled structure, which is interpreted as an open structure. The 5-mer shows a more uniform structure, which is interpreted as a closed structure. The former structure protects the full length of DNA on which HTkA histones were reconstituted, whereas the latter might be an incomplete reconstitution or a partially disassembled structure. It also raises the question if the length of the DNA is a limiting factor. What if HTkA was reconstituted on 170 bp or 307 bp instead? Would this in turn only permit the formation of the 5-mer on the 170 bp construct and two 5-mers on the 307 bp construct? The authors should consider addressing this point because the reconstitution might be constrained by the length of the DNA construct used. Indeed, a related topic might be AT content- what does archaeal DNA look like from the perspective of DNA sequence for chromatin (Jon Widom's group had a ChIPSeq paper on this a few years ago, just after his untimely passing).

      3) In the discussion the authors cite that in one archaeal species the Mg2+ concentration is ~120 mM, more than a magnitude greater than that tested in Figure 5. What happens to reconstituted archaeasomes at higher Mg+? This is relevant because in vivo, archaea are thought to have 10x the concentration of Mg+ (amongst other ions) relative to us humble eukaryotes who would probably die of kidney failure at those ionic concentrations. Indeed at high ionic conditions, eukaryotic chromatin can be made to precipitate out of solution (for e.g. 10mM Mg+, 3M NaCl). An AUC assay with higher Mg2+ concentrations seems a doable and physiologically relevant addition to the ms that would strengthen it. It is relevant to consider that in vivo structure in these halophilic and thermophilic organisms might be dependent on the concentration of various salts and temperature, it would be nice to read the authors' thoughts on this issue.

    2. Reviewer #1 (Public Review):

      While I am not sufficiently qualified to comprehensively assess the molecular dynamics simulations, all interpretations seem careful and remain within the described limitations of the various metrics that the authors report.

      The experiments are well executed; the results are presented clearly and interpreted carefully. This is a rigorous and important biophysical study that provides a solid foundation for the investigation of archaeal genome biology. The authors' new findings raise interesting questions, and although addressing them is outside the scope of this study, the article would perhaps benefit from a more detailed discussion of the biological implications of the results. The manuscript does not indicate whether the cryo-EM maps and atomic models were deposited in the EMDB and PDB. I strongly encourage the authors to do that: it would add a lot of value not only for the readers of this study, but also for the wider structural biology community.

    3. Evaluation Summary:

      In their manuscript titled "Archaeal chromatin 'slinkies' are inherently dynamic complexes with deflected DNA wrapping pathways", Bowerman et al. use an elegant combination of cryo-EM, analytical ultracentrifugation and molecular dynamics simulations to investigate the structure and dynamics of archaeal histone — DNA complexes, termed archaeasomes to distinguish them from eukaryotic nucleosomes. This study builds upon the crystal structure of an archaeasome and the functional analysis of its disruption recently published by the same group (Mattiroli et al, 2017) by analyzing the dynamics of this complex and discussing how these dynamics could relate to archaeal genome biology. How chromatin evolved is a fundamental question in biology, marking a striking departure from the bacterial nucleoid. This current manuscript describes a rigorous biophysical study that not only provides substantial new insights into archaeal genome biology but also raises intriguing questions for future study. This manuscript will therefore no doubt be of interest not only to the archaeal research community but also to the field of chromatin biology.

      (This preprint has been reviewed by eLife. We include the public reviews from the reviewers here; the authors also receive private feedback with suggested changes to the manuscript. Reviewer #1 and Reviewer #2 agreed to share their names with the authors.)

    1. Reviewer #3 (Public Review):

      This is a well written and elegant study from a collaboration of groups carrying out models based on high resolution imaging. I think the study also serves as a prime example for where modeling and simulation bring added value in the sense that the insights revealed in the study would not likely be gained through other methods.

      1) As the authors point out, clinical studies have revealed that the fibrotic burden in ESUS patients is similar to those with aFib. The question is why then, do so few ESUS patients exhibit clinically detectable arrhythmias with long-term monitoring. The authors hypothesize and their data support the notion that while the substrate is prime for pro-arrhythmia in ESUS patients, a lack of triggering events may explain the differences between the two groups.

      2) I think the authors could go further in describing why this is surprising. Generally, severe fibrosis is thought to potentially serve as a means or mechanism for pro-arrhythmic triggers. This is because damage to cardiac tissue typically results in calcium dysregulation. When calcium overload occurs in isolated fibrotic tissue areas, or depolarization of the resting membrane potential due to localized ischemia allows for ectopic peacemaking, we might expect that the diseased/fibrotic tissue is itself the source of arrhythmia generation. I think the novel finding here is that this notion may be a simplification, and the sources of arrhythmia generation may be more complex and may need to come from outside the areas of fibrosis. I think this is a big deal.

    2. Reviewer #2 (Public Review):

      Bifulco et al. performed a large-scale in silico study to test whether the spatial fibrosis distribution measured via LGE-MRI in 45 patient with embolic stroke of undetermined source (ESUS) as compared to the distribution in 45 atrial fibrillation (AFib) patients without stroke leads to differences in reentrant arrhythmia inducibility of dynamics.

      1) This study comprises a high number of simulations and is one of the computational electrophysiology studies that covers the most anatomical and structural variability on the atrial level. In their comprehensive analysis, Bifulco et al. answered their question and found no pronounced differences in arrhythmia inducibility and dynamics between ESUS and AFib models. It would be interesting to learn how the spatial fibrosis distributions compare in terms of the previously suggested features density and entropy (Zahid et al.). This might also influence the statements in L170/L207.

      2) The authors chose to exclude patients with stroke from the AFib group, the reasons for this choice are not entirely clear. The same holds for the fact that the ESUS models included AFib-induced electrophysiological remodeling even though these patients have not been diagnosed with AFib (by definition).

      3) An acknowledged limitation of the study is the assumption of fixed conduction velocity and action potential duration/effective refractory period. Bifulco et al. base this assumption on previous studies by the group (e.g. L312), which, however, concluded that reentrant driver locations and inducibility are sensitive to changes of action potential and conduction velocity (Deng et al.). For conduction velocity, wider ranges have been reported since the publication of the supporting reference (35) in 1994, e.g. Verma et al.; Roney et al.

      4) The number of pacing sites is rather low for a comprehensive in silico arrhythmia inducibility test but likely a good balance of coverage and computational feasibility considering that the primary goal of this research was to check whether the two groups of models show differences when undergoing the same (but not necessarily exhaustive) protocol.

      5) The discussion does a good job in putting the results into context. Two interesting observations that deserve more attention are that i) the Inducibility Score was always higher for AFib vs. ESUS (Figure 6A, no statistical test performed). However, this did not translate to a difference in silico arrhythmia burden (inducibility). ii) Reentrant drivers were about twice as likely to localize to the left pulmonary veins than the right pulmonary veins in the AFib models (Figure 6D).

      6) The study succeeded in answering the question it posed in the sense that no marked difference was found between the ESUS and AFib models. This leads to the question what the stroke-inducing mechanism is in the ESUS patients. A hypothesis for future work could be that the fibrotic infiltrations in the ESUS patients reduce the hemodynamic efficacy of the left atrium and render clot formation (e.g. in the atrial appendage) more likely in this way.

      7) The negative finding in this study (no difference between groups) does not naturally allow us to draw clinical implications for diagnosis or stratification. Additional ways to put the hypothesis proposed by the authors (fewer arrhythmogenic triggers in the ESUS patients) to test could be to consider readouts/surrogate measures of the autonomic nervous system.