185 Matching Annotations
  1. Apr 2025
    1. We selected fission yeast as our model due to the ease of genetic manipulation, its shared regulatory pathways with mammals, and the presence of two rDNA arrays as opposed to the single array in budding yeast.

      Why fission yeast?

    2. How rDNA spatial organization is coupled to or distinct from nucleolar structure is unclear.

      rDNA morphology digs deeper into how nucleolar organization changes:

      rDNA organization in the nucleolus is not well understood. Therefore, how it influences nucleolar morphology is not understood.

    3. Changes in ribosome biogenesis are reflected in the structural organization of the nucleolus.

      Changes in ribosome biogenesis can be identified through structural changes in the nucleolus:

      • Enlargement of the nucleolus can reflect increased ribosome biogenesis in cancer, as it supports the need for higher rates of proliferation

      Other things that can signify changes in ribosome biogenesis: * Nucleolar structure * Presence of multiple nucleoli per nucleus (polynucleolarity) * Output of ribosomes

    4. Two conserved MAPK pathways modulate ribosome output in response to stress. These include the Stress-Activated MAPK pathway, orthologous to the mammalian p38 pathway, and the Cell Integrity Pathway, the suspected ERK ortholog for its role in responding to extracellular stress

      Stress-Activated MAPK Pathway * Name in Yeast: Hog1 pathway * Function: responds to osmotic and environmental stress * Mammalian ortholog: p38 MAPK pathway

      Cell Integrity Pathway * Name in Yeast: Slt2/Mpk1 pathway * Function: maintains cell wall integrity and responds to extracellular stress such as heat, hypotonic shock, or membrane stress * Mammalian ortholog: ERK MAPK pathway - suspected because of similar roles in growth and stress response

    5. cell signaling pathways regulate RNA pol I activity in response to environmental cues, stressors, and nutrient availability

      Conserved cellular signaling pathways regulate RNA polymerase I to modulate ribosome biogenesis:

      A cell would not want to go through the energy-intensive process of making ribosomes if there was not a need for them, so there are many cell signaling pathways that regulate RNA polymerase I in response to cellular stimuli. These are conserved between fission yeast and humans.

      • TOR

      • cAMP

      • MAPK

      • Cell Integrity Pathway

    6. strict regulation of several assembly steps

      Ribosome biogenesis is energetically costly, so it should be well regulated:

      Ribosome assembly requires large amounts of energy, so it is important to regulate several steps of the process.

      A primary step of ribosome biogenesis is transcribing rDNA arrays into rRNA via RNA polymerase I. rRNA transcripts comprise 50%+ of all transcripts in a cell, so this is a very robust process.

    7. We established GapR-GFP, a prokaryotic DNA-binding protein that recognizes transcriptionally-induced overtwisted DNA, as a live visual fluorescent marker for quantitative analysis of rDNA organization in Schizosaccharomyces pombe.

      GapR-GFP marks overtwisted DNA and can be used to study rDNA morphology:

      GapR is a protein that binds to overtwisted DNA. It recruits a topoisomerase to release topological stress on DNA during transcription.

      When tagged with GFP, it functions as a fluorescent marker and tracker (live cell imaging) of overtwisted DNA.

      To identify overtwisted rDNA specifically, you can tag the nucleolus with a separate color and look at the merged fluorescent images of the nucleolus and overtwisted DNA. Alternatively, you could attach a nuclear localization sequence to GapR-GFP to primarily express it in the nucleus, increasing the probability of only marking rDNA.

    8. We hypothesized that the morphology of rDNA arrays reflects ribosome biogenesis activity

      Hypothesis

      The morphology of rDNA arrays can reflect ribosome biogenesis.

      What are rDNA arrays?

      Many sections of a given genome contain repeats. In the case of rDNA, the repeats exist to produce large amounts of rRNA to meet the need of ribosomes in the cell.

      Another example of repeats include satellite DNA which is found at centromeres. Long arrays of tandem repeats are coiled to provide a large surface area for the attachment of kinetochore proteins).

    9. GapR-GFP in wild-type (WT) fission yeast cells localized to the bulk chromatin as well as the rDNA arrays on both ends of chromosome 3

      Fig 1.A finding:

      GapR-GFP does not bind exclusively to rDNA, but also binds to bulk chromatin. However, it also accumulates in rDNA.

      GapR-GFP is a valid live-cell marker for rDNA arrays, because it reliably lights up regions near or overlapping with the nucleolus, consistent with the known location of rDNA on chromosome 3.

    10. generate a marker for quantification of rDNA spatial organization that would not disrupt rDNA function and could be used for live cell imaging

      Fig. 1 Goal:

      Produce a marker that can quantify rDNA organization without interfering with it's function and works in live cells.

    11. factors that regulate rDNA spatial organization, discovering that the deletion of ribosome protein genes causes rDNA array expansion

      2:

      When RPL is deleted from cells, their rDNA array is expanded. So, the rDNA is becoming more packed and the repeats are becoming stacked.

    12. ribosome protein gene insufficiency activates conserved regulatory signaling pathways as part of a compensatory response

      3:

      When a cell doesn’t have enough ribosomal proteins (due to RPL deletion), it turns on important internal signaling pathways that are conserved across many organisms to try and compensate for the ribosome production problem.

    13. organization of the rDNA arrays changes with the cell cycle, glucose starvation, RNA pol I inhibition, and TOR signaling

      1:

      GapR-GFP helped them identify that the organization of rDNA changes with the cell cycle, glucose starvation, RNA pol1 inhibition, and TOR (cell growth) signaling.

    14. To ensure that ribosome production matches cellular needs, activation of ribosome assembly is regulated by many inputs.

      Problem:

      Because ribosome production requires so much energy and resources, there must be cellular pathways that regulate ribosome biogenesis to ensure that production matches cellular needs.

    15. We present a new imaging reporter, a fluorescently tagged DNA-binding protein called GapR, that highlights rDNA spatial organization in fission yeast, a model system that shares similar regulatory networks with mammals.

      Novel technique: GapR-GFP

      They introduce a novel technique using GapR, an endogenous protein that binds to overtwisted DNA, that is tagged with GFP, allowing for the live tracking and marking of actively transcribed rDNA into rRNA.

    16. RPL gene deletion triggers altered rDNA morphology due to compensatory changes in ribosome biogenesis via multiple signaling pathways, and we further suggest compensatory responses may contribute to human diseases such as ribosomopathies.

      Summary:

      When certain RPLs are depleted from a cell, ribosome biogenesis is changed. To compensate, the cell activates various signaling pathways, such as MAPK signaling which is involved in transmitting stress signals, that change how ribosomes are made leading to a change in rDNA structure.

    17. resistance phenotype implicated many factors including a conserved MAPK, Pmk1, previously linked to extracellular stress responses

      Major finding 4:

      A genetic analysis to identify genes or proteins involved in Torin1 resistance identified: 1. MAPK: protein kinase involved in directing cellular responses from external stimuli to regulate cell proliferation, gene expression, mitosis, and apoptosis. 2. Pmk1: Mitogen-activated protein kinase that enables MAPK activity and RNA polymerase II-specific DNA-binding transcription factor binding activity.

    18. genetic analysis of signaling pathways essential for this resistance phenotype

      Why are RPL mutants resistant to Torin1?

      • Genetic Analysis

      • They introduce a pool of Bioneer Deletion Collection strains to the RPL mutant yeast strain and produce a mixture of double mutants (RPL mutant + any of the gene deletions from the collection).

      • Then, they select for double mutant cells that show resistance to Torin1 and identify a list of deleted genes that are enriched (i.e., more common) in the Torin1 resistant cells.
      • Next, they identify patterns in this list of deleted genes. For example, if two deleted genes are involved in the same cellular function or located in the same complex, then they are likely contributing to the Torin1 resistance.
      • Then, they experimentally validate any enriched genes with patterns. So, they would deleting one enriched gene in in the RPL mutant and see if the cells are infact resistant to Torin1.
    19. RPL gene deletion mutants with altered rDNA organization also demonstrate resistance to the TOR inhibitor Torin1

      Major finding 3:

      Cells regulate ribosome biogenesis using RPLs and adjusts both rDNA transcription and sensitivity to TOR signaling.

      So, regulation of ribosome biogenesis is not only dependant on TOR signaling.

    20. Screening the haploid S. pombe Bioneer deletion collection for spatial organization phenotypes revealed large ribosomal protein (RPL) gene deletions that alter rDNA organization

      Major finding 2:

      They analyzed a collection of yeast strains, where each strain was missing one gene (Bioneer Deletion Collection). They found that certain deletions of genes encoding large ribosomal protein (RPL) led to a change in rDNA morphology.

      This tells us that rDNA morphology reflect a cell’s ability to make ribosomes. When proteins necessary for ribosome biogenesis are depleted, rDNA morphology is changed in response.

    21. dynamic throughout the cell cycle, under glucose starvation, RNA pol I inhibition, and TOR activation

      Major finding 1:

      Normal twisting versus overtwisting of rDNA (aka rDNA array morphology aka spatial organization of rDNA arrays) is variable throughout different cellular processes.

      Some of the processes they looked at include: * Cell cycle events

      Different parts of the cell cycle will require more or less ribosomes which will in turn affect how much rDNA is being transcribed into rRNA.

      • Glucose starvation

      Ribosome biogenesis requires significant energy. In glucose starvation, less ribosome biogenesis is expected to occur, thus less overtristing of rDNA will occur due to reduced rDNA transcription.

      • RNA polymerase inhibition

      Reduced RNA transcription aka reduced rDNA --> rRNA. If transcription cannot occur, then rDNA will not be overtwisted.

      • TOR activation:

      TOR is a Target Of Rapamycin protein kinase that regulates cell growth and metabolism. When active, cells are in "grow-mode" meaning that they have high energy reserves. Thus, we can assume that there will be more rDNA overtwisting due to increased ribosome biogenesis.

      Question:

      Can we use the morphology of rDNA as a readout of how much ribosome production is happening? How do cells adjusts it to ribosome production in real time?

    22. rRNA gene transcription in modulating ribosome output

      Why do we care about rDNA morphology?

      How rDNA is transcribed into rRNA plays an essential role in how much ribosome biogenesis occurs.

    23. broad-scale investigation of the regulation of ribosomal DNA morphology

      Gap in field

      While we understand a lot about how the shape of the nucleolus changes with ribosome biogenesis, we have not studied how the condensation, modification status, or secondary structures, for example, of of ribosomal DNA is modulated to affect ribosome biogenesis.

    24. Nucleolar

      Nucleolus is the location of ribosome production:

      The nucleolus makes ribosomal RNA (rRNA), and it combines it with proteins (transported from the cytoplasm via a nuclear localization sequence) to build ribosomes.

      How did we find out that ribosomes were made in the nucleolus? Scientists used radioactive labels that could track molecules inside cells. They labeled RNA and followed it, noticing that ribosomal RNA was always found in the nucleolus.

    25. Nucleolar morphology

      What is nucleolar morphology?

      Nucleolus: structure inside of the nucleus that is responsible for making ribosomes

      Morphology = structure: shape, size, and appearance of the nucleolus

  2. Nov 2024
    1. Summary

      Overall, the authors are seeking an in depth molecular understanding of how DNA replication forks stall, restart, and how the DNA damage checkpoint leads to genome integrity.

      They identified a mechanism for how fork stalling and restarting in vitro.

      • They also found that by removing nucleotides from replication, DNA synthesis was quickly halted. However, CMG itself was not halted.
      • When CMG continues, Okazaki fragments are still built, triggering the recruitment of:
      • PCNA
      • RFC
      • DNA pol delta, epsilon
      • These proteins halt DNA synthesis from starting and allow the DNA to be chewed up by nucleases.

      When nucleases start chunkin the DNA up, this triggers the DNA damage checkpoint and fork progression is slowed.

    2. In thispaper we use DNA replication with purified proteins to characterise fork stalling, restart, andthe mechanism of fork stabilization by the DNA damage checkpoint.

      The authors reconstitute DNA replication in vitro using budding yeast proteins to understand the molecular mechanisms of fork stalling, restarting, and stabilization by the DNA damage check point.

    3. When Polδ from these first OkFs reachesthe CMG, DNA polymerase ε (Polε), which associates with CMG and is required for itsformation, normally takes over for the duration of leading strand synthesis. Polε associateswith dual processivity factors CMG helicase and PCNA to perform bulk leading strandsynthesis5-8

    4. OkFs are initiated by DNA polymerase α-primase(Polα): the DNA primase generates 7-10 nt RNA primers that are extended as DNA ~20 ntby the DNA polymerase4. Rfc1-5 (RFC) loads the ring-shaped PCNA sliding clampprocessivity factor on the 3’ DNA end generated by Polα, promoting completion of OkFsynthesis by DNA polymerase δ (Polδ). Displacement of the 5’ end of the previous OkF byPolδ generates a flap which is cleaved by endonucleases, primarily Fen1, and the two OkFsare ligated together by ligase I (Lig1)

    5. irreversible fork collapse

      Any event that impedes replication fork progression (difficult to replicate sequences, conflicts with transcription machinery, and DNA damage) may result in incomplete genome replication.

      These frequently lead to fork stalling, but rarely cause a failure to complete replication.When failures do happen the fork collapses leading to genome rearrangements, cell death and disease.

    6. DNAdamage checkpoint

      DNA damage activates three major checkpoints to halt the progression of the cell cycle.

      • The G1/S checkpoint is activated in G1 cells to inhibit S-phase entry.
      • The intra-S checkpoint is activated in S-phase cells to prevent the not-yet-activated origins from initiating DNA replication.
      • The G2/M checkpoint is activated in G2 cells to inhibit the entry into mitosis.

      The cell cycle checkpoints are triggered by protein phosphorylation that is readily reversible upon protein dephosphorylation so that cell cycle progression can resume after DNA lesions are repaired.

  3. Oct 2024
    1. Figure EV2

      The authors wanted to start by directly impairing ubiquitylation of Mcm7. However this was not simple, because Mcm7 has multiple sites for possible ubiquitylation.

      Figure 2EV shows the process of broadly finding regions of ubiquitylation sites on Mcm7.

      Pannel A:

      Their previous findings from 2020 show that the first lysine residue #29 on Mcm7 was the sole residue for ubiquitylation by SCF-Dia2 in vitro, even with Mrc1 present, which stimulates the formation of long ubiquitin chains on Mcm7.

      However,

    2. ubiquitin conjugating enzymes (E2 enzymes) do not target specific sites within a consensus sequence, but instead are positioned by ubiquitin ligases (E3 enzymes) in close proximity to their substrates, and thus are able to access a range of potential ubiquitylation sites

      • E1 activates ubiquitin and transfers it to E2
      • E2 is positioned close to the target by E3
      • E3 transfers ubiquitin from E2 to the target
    3. Rrm3 DNA helicase and its paralogue Pif1 also act at DNA replication forks (Bochman et al, 2010; Malone et al, 2022; Muellner and Schmidt, 2020), helping forks to pass tightly bound protein-DNA complexes including Mcm2–7 double hexamers (Hill et al, 2020) and stable complexes at tRNA promoters or telomeres (Ivessa et al, 2003; Ivessa et al, 2002), as well as stable DNA structures such as G-quadruplexes

      Function of Rrm3 and Pif1 helicases.

    4. genome instability

      Because Mcm7 cannot be ubiquitinated, CMG is constitutively bound to DNA, and will not be removed at any point in the cell cycle. This means that when the cell divides, it will divide it's DNA with CMG still loaded, and the next round of DNA replication will be impaired.

    5. mcm7-10R allele

      The authors mutated a region of the Mcm complex, specifically Mcm7, seemingly through a mutation at residue 10 from lysine to arginine, making it impossible to be ubiquitinated by SCF-Dia2.

      Ubiquitnation leads to CMG unloading, via ubiquitylation, via disassembly by Cdc48/p97, so this mutation makes the CMG constitutively bound to DNA.

    6. viability of mcm7-10R and dia2∆ is dependent upon

      Cells with the Mcm7-10R mutation could not be ubiquitated and therefore CMG could not be disassembled.

      However, this did not lead to cell death, because a secondary disassembly pathway using Rrm3 and Pif1 helicases was enacted.

    7. These findings indicate that CMG disassembly is essential in yeast cells

      Without CMG disassembly, cells were not viable and the ability to ubiquitinate new helicases was lost? It seems.

    8. We show that Rrm3 acts during S-phase to disassemble old CMG complexes from the previous cell cycle

      Cells that have the MCM7-10R mutation will carry the CMG complex on their DNA into the next cell cycle. This helicase must be removed to make way for new helicases and further DNA replication.

      The authors found that Rrm3 acts during S-phase to disassemble the CMG complexes from previous cell generations.

    9. orthologues

      Orthologues are genes in different species that are related through evolution from a common ancestor and are expected to have similar functions.

  4. Aug 2024
    1. Our results suggest that cells arrested in metaphase for prolonged periods of time do not undergo DNA synthesis during the arrest

      Figures 1-3 demonstrate that the presence of ssDNA during metaphase in 44% of yeast cells may suggest that there is no DNA synthesis occurring during mitosis in these cells.

    2. The median under-replication for all genes in each gene-ontology (GO) term is inversely proportional to the median distance to the closest telomere

      As genes get further away from the telomere, their % under-replication decreases.

      The GO terms were likely shown to also contribute to the finding that these are unessential genes?

    3. Majority of genes replicated after metaphase are not essential and do not contribute to the fitness cost once knocked out. Each point represents one gene, showing the % under-replication in metaphase-arrested cells and the fitness of the deletion mutant (0 for essential genes).

      Knock outs of genes being replicated after metaphase have no affect on the fitness.

      The big fat yellow spot is genes not replicating late in mitosis. As you move to the right along the x-axis, these genes do replicate late in mitosis and have the same affect on fitness in WT as the other ones do.

    4. There is correlation between replication timing and mutation rates in yeast and human cells26,27 and a strong relationship between distance to the telomere and mutation rate in budding yeast28. Deletion of genes that are replicated in late mitosis has no apparent fitness cost, consistent with these genes being dispensable under non-challenging conditions (Fig. 7a and Supplementary Fig. 14).

      Correlation: * Replication timing and mutations rates in yeast (& humans) * Distance to telomere and mutation rates in yeast

    5. Inactivation of Cdk function allows chromatin bridge resolution in MEN-deficient (cdc15-as + 1-NA-PP1) cells. Arrowheads mark chromatin bridges and asterisks bridge resolution. Time 0 corresponds to the start of imaging (temperature shift). n = number of cells is indicated. Cells were pooled from three independent experiments. ****p < 0.0001, two-sided Fisher’s exact test. Scale bar: 1 µm.

      Finally, when they inhibit Cdk, chromatin bridges are resolved in MEN-defic. cells.

    6. Genome sequencing was performed in metaphase-arrested (Cdc20-depleted) cells before and after inhibition of Cdk using the ATP analogue-sensitive mutant cdc28-as1

      Cells arrested in metaphase had stalled replication relative to cells in metaphase that had Cdk inhibited.

    7. G4-rich regions are mainly located in subtelomeric regions and replicated later than the majority of the genome

      Stable G-rich regions near telomeres are replicated later than the rest of the genome.

    8. Regions with high frequency of G-quadruplexes, transposable elements and fragile sites exhibit higher under-replication in metaphase (***p < 0.0001, two-sided Wilcoxon rank test).

      Regions with many stable G-rich regions, transposable elements, and fragile sites are not replicated as much in metaphase.

    9. Late-replicating regions show higher under-representation in both non-subtelomeric and subtelomeric regions (N.S. p > 0.05; ***p < 0.0001, Wilcoxon rank test). All 200-bp windows of measured under-replication split into bins based on their replication timing (data from51). Colour-code corresponds to the proximity to telomeres (1:100 kb). ~0.1% of 200 bp regions have under-representation less than −20%; for visualization we plot them at -20%

      After release from G1, subtelomeric regions were more under-replicated than regions further away from telomeric regions.

    10. Under-representation values for all 200 bp windows throughout the genome, with significantly underrepresented genomic regions colored green.

      As you move further from the telomere, the underreplicated DNA decreases.

    11. Distribution of sequences under-represented in metaphase across the whole genome, with values greater than a threshold of 20.5% (see Methods) shaded in green (1.2 Mb, about 10% of the genome)

      ??

    12. Under-representation of subtelomeric regions in chromosome V for metaphase (MET3pr-CDC20, in green) and telophase (dbf2-2, in red) arrests. Shadows correspond to standard deviation across biological replicates (6 for MET3pr-CDC20, 5 for dbf2-2)

      The authors used DNA copy number to distinguish the reasoning behind DNA synthesis late in mitosis. They found that subtelomeric regions were more underreplicated in metaphase than in telophase.

    13. DNA synthesis during late mitosis may reflect mitotic repair of already replicated DNA, mitotic DNA synthesis of diverse genomic regions, or mitotic DNA synthesis of specific genomic regions.

      The signs of DNA synthesis occurring in anaphase could be due to a number of possibilities: * Repair of replicated DNA * Replication of diverse genomic regions * Replication of specific genomic regions

      I feel like we know it's not replicated DNA, because we see single stranded DNA being carried through anaphase.

      Why do we care if it is diverse of specific regions? - we want to know what regions of DNA are being replicated.

    14. RPA foci persist into anaphase in MEN mutants. 1-NA-PP1 was added to mid-log phase cells at 25 °C. Representative cells are shown. Arrowheads point to Rfa2-GFP foci. The graph shows the fraction of cells with RPA foci during the first 20 min after anaphase entry. Cells were pooled from three independent experiments (two-sided T test across replicates p = 0.0068, two-sided Fisher’s exact test of pooled cell counts, p = 1.4e-09)

      Identification of single stranded DNA throughout anaphase in cells without MENS

    15. MEN bridges require DNA polymerases for their resolution. Cells of the indicated strains were treated and analysed as in (b). Arrowheads in a-c point to chromatin bridges and asterisks mark actomyosin ring contraction. Two-sided Fisher’s exact tests: *p < 0.05; **p < 0.01; ***p < 0.001; ****p < 0.0001.

      Another protein they looked at was DNA polymerase delta and epsilon.

      When knocked out, they saw that MEN reactivation caused bridge disappearance after actomyosin ring (green) contraction.

    16. MEN bridges do not require topoisomerase II for their resolution. Cells were treated as in (a) except that after 3 h, NAAP1 was removed to allow Cdc15 reactivation. Numbers indicate time (min) relative to cytokinesis. The fraction of cells resolving their bridges before actomyosin ring contraction during 3 h following washout of 1-NA-PP1 was determined. Cells were pooled from three (cdc15-as1 top2-4) or six independent experiments (cdc15-as1).

      MEN reactivation allowed the cells to resolve their anaphase bridges. However, topoisomerase did not play a role in this.

    17. Inactivation of type II topoisomerase in cdc15-as1 top2-4 cells, by increasing the temperature to 37 °C before 1-NA-PP1 washout, did not reduce the efficiency of bridge resolution during anaphase

      They wanted to identify what proteins were involved in the resolution of anaphase bridges.

      They looked at topoisomerase, because this is the protein that helps fix intertwined sister chromatids - which may have been contributing to the bridges.

      However, inhibition of this protein did not not affect the resolution of anaphase bridges.

    18. Washout of 1-NA-PP1 led to chromatin bridge disappearance during anaphase (before cytokinesis, monitored with Myo1-GFP) in the majority of cdc15-as1 cells, demonstrating that MEN reactivation allows chromatin bridge resolution

      They also saw that when the ATP analog was washed out from the reaction, the bridges resolved themselves. This was in cells that had cohesin present.

    19. MEN bridges are stable even in the absence of cohesin. 1NA-PP1 was added to mid-log phase cultures at 25 °C to inactivate Cdc15. After 3 h, cultures were shifted to 37 °C, imaged by time-lapse fluorescence microscopy, and the number of cells with stable vs. resolved bridges during the next 3 h was determined. t = 0 corresponds to the start of imaging (temperature shift). Cells were pooled from three independent experiments.

      Men inhibition did affect the amount and longevity of chromatin bridges in anaphase. So, the authors next sought to identify if persistent cohesion (holds sister chromatids together) was the reason that these bridges were forming.

      They did this by inhibiting both MEN and cohesion in one cell population, and then inhibiting only cohesion in another, and observing their affect on each other.

      They saw that MEN bridges were stable in both cell populations throughout anaphase.

    20. To determine if MEN bridges are due to persistent cohesion between replicated sister DNA molecules, we used cdc15-as1 mutants to inactivate MEN by addition of the ATP analogue 1-NA-PP1, and a ts allele of the kleisin subunit Scc1 to inactivate cohesin

      The authors next looked into the cohesion of sister chromatin, seeking to identify if the cohesion of sister chromatids led to the anaphase bridges.

      They did this by mutating MEN using an ATP analog (NA-PP1), and by heat inactivating cohesin. They also reintroduced MEN to see if chromatin bridges were affected.

    21. The time of rDNA and subTel12R separation relative to anaphase in WT and MEN mutants. n = 202 cells (WT); 252 (cdc15-2), 235 (dbf2-2). p values (two-sided Student T test) are indicated.

      They compared the time it took for loci to separate and found that mutations to MEN components did not affect segregation of rDNA or Tel12R.

      While MEN inhibition does affect the amount of longevity of chroamtin bridges during anaphase, it does not affect the segregation of difficult-to-replicate regions of DNA.

    22. A 5-kb tetO array was inserted in subTel12R, Chromosome 12 at 1061 kb from the left telomere; the fluorescent spot is centred 20 kb away from TEL12R (green arrowheads). The rDNA locus in the same arm is labeled with Net1-mCherry (white arrowheads). The SPBs are marked with Spc42-mCherry (asterisks)
      • 5-kb tetO array = allows for controlled expression of yellow fluorescent protein (YFP).
      • This was inserted downstream to the telomere region.

      • The spindle poles are marked with mCherry to identify cell cycle status and gain spatial reasoning.

      Telomeres and rRNA are regions suspected to be more difficult to replicate, making them ideal for study during anaphase.

    23. Quantification of chromatin bridges in MEN mutants. Cells of the indicated strains expressing Htb2-mCherry were arrested in G1 at 25 °C, released from the block at 37 °C, fixed at the indicated times, and imaged (see Methods). Images depict wt cells during the time course and MEN mutant cells 2–3 h after release from the G1 block. Arrows mark anaphase bridges. At least 100 cells were imaged per time point. The graph shows the mean and SEM of 3 independent experiments.

      In panel a, the WT cells display chromatin bridges between 100 and 150 minutes from G1 release.

      In the MEN mutants, chromatin bridges are sustained from 100 minutes to 200 minutes from G1 release, and the number of cells with chromatin bridges increases. This was the case for all MEN mutants.

      MEN inhibiton delays resolution of chromatin bridges during anaphase.

    24. To test this, we examined cells defective in the mitotic exit network (MEN), a kinase cascade pathway required to inactivate Cdk at the end of mitosis.

      The authors studied cells with and without MEN (responsible for inactivating Cdk at the end of mitosis).

      The MEN complex inhibitis cdk to allow cells to finish DNA replication at the end of mitosis, during anaphase.

    25. In MEN cells, the subTel12R sister spots get closer to each other after their initial separation. Left: an example of sister spot collapse is shown. Note that as the sister spots collapse, the spindle remains elongated and the rDNA masses separated, demonstrating non-disjunction of subtelomere regions. Top right: the minimal distance between subTel12R spots after their initial maximal separation for all cells imaged; 0 indicates collapse. Bottom right: the distance between SPBs in the same frame in which the subTel12R spots reach their minimal distance. Thus, the minimal distance between subTel12R spots is not associated with a shortening of the spindle. ****p < 0.0001, two-sided Student T test. Scale bars: 1 µm.

      They next studied the division of chromosomes following initial seperation.

      By marking two individual sister chromatids, they could track where they move throughout anaphase relative to each other. They observed sister chromatids collasping back into one position in late anaphase.

      They believe this is nondisjunction.

    26. telomere-proximal regions in MEN ts mutant cells. A subtelomeric region

      Subtelomeres are composed of two regions: a telomere-proximal region and a telomere-distal region.

    27. We hypothesized that high Cdk activity inhibits DNA synthesis in metaphase, and that the inhibition of Cdk during mitotic exit enables synthesis to complete.

      Q: how does Cdk activity, specifically the inhibition of Cdk at the end of mitosis, affect DNA synthesis?

      High Cdk activity during metaphase (M checkpoint) stalls DNA replication at this point.

      And the inhibition of Cdk during metaphase should allow for cells to move on in the cell cycle and replicate their DNA.

    28. Interestingly, deletion of the RAD9 checkpoint gene abolished nuclear division delays and chromatin bridge formation in response to challenges in DNA synthesis during mitosis

      Rad9 = DNA damage response during G2

      When the gene was knocked-out, the inhibition of nuclear division and chromatin bridges were abolished.

      RAD9 = mediates stalled DNA rep.

    29. On the other hand, this result also suggests that mitotic DNA synthesis promotes nuclear division

      If pol3 is required for both DNA synthesis and for nuclear division, then the two actions must be interdependent.

    30. maximize population-level growth rate while simultaneously exploring greater genetic space

      Selects for regions that evolve faster - may produce helpful mutations

    31. b,c

      Overall, figure 3 shows that 44% of cells have ssDNA during anaphase of mitosis. This seems to correlate with the slowing of cell cycle progression and an increase in the duration that chromosome bridges exist and the time for nuclear division.

    32. Cells expressing Spc42-mCherry to visualise the spindle poles, and Rfa2-GFP to visualise RPA foci, were grown to mid-log phase and imaged every 6 min for 3 h at 30 °C. RPA foci are present in all cells in S-phase and persist during anaphase in 44% of cells (arrows). Time from anaphase onset is indicated in minutes. Scale bar, 2 µm.

      GFP>single stranded DNA = can be associated with DNA synthesis mCherry>spindle poles = appear in prophase, breaks down in telophase

      The arrows in panel a point to signs of single stranded DNA that persists during anaphase (anaphase is identified by appearance of red spindle poles).

    33. The time of cytokinesis (membrane closure at the bud neck, monitored with GFP-CAAX) for cells expressing the indicated reporters and released from a metaphase arrest in the presence or absence of 0.1 M HU at 30 °C. Representative cells are shown; asterisks indicate cytokinesis.

      Was cytokinesis (metaphase into anaphase and so on) delayed by the inhibition of DNA synthesis?

      mCherry is large compared to histones and can have side affects in experiments.

    34. b

      A RAD9 checkpoint gene knockout: * Abolished delays in nuclear division * Abolished chromatin bridge formation

      Without RAD9, the bridges resolve quicker

    35. a

      You can see in panel a that the +HU cells took longer to fully divide and had chromatin bridges for longer than the -HU cells.

      Disruption of DNA synthesis during mitosis 1. delayed nuclear and cell division 2. triggered longer lasting chromatin bridges

      You need nucleotides to finish the division

    36. MET3pr-CDC20

      MET3pr-CDC20 cells utilize the methionine 3 (MET3) promoter to regulate the expression of the CDC20. This allows for the regulation of CDC20 expression based on the availability of methionine in the growth medium.

      • When methionine is present, the MET3 promoter is inactive, and CDC20 expression is low.

      • When methionine is absent, the MET3 promoter becomes active, leading to increased expression of CDC20.

      Easiest to arrest in met

    37. Cells with RPA foci in anaphase take more time to resolve chromatin bridges and accomplish cell division. Cells as in (a) but expressing Htb2-mCherry to visualise chromosomes, imaged every 5–7 min. Chromatin bridge lifetime and nuclear division were quantified for cells with and without RPA anaphase foci and represented as boxplots. On each box, the central mark indicates the median, and the bottom and top edges of the box indicate the 25th and 75th percentiles, respectively. The whiskers extend to the most extreme data points not considered outliers. Bridge lifetime was defined as the time during which the two divided nuclear masses are joined by a thinner connection (visualised with Htb2-mCherry). The timing of nuclear division is defined as the interval between the onset of nuclear elongation and bridge disappearance. n = 62 cells pooled from 4 independent experiments; p values are indicated (two-sided Student t test). Scale bars: 2 µm.
      • GFP>single stranded DNA = associated with DNA synthesis

      • mCherry>chromosomes

    38. The time of nuclear division and bridge lifetime for cells blocked in metaphase at the permissive condition, and released from the metaphase arrest after inhibition of DNA synthesis. Nuclear division is defined as the time between release from metaphase and resolution of chromatin bridges (final DNA segregation). Bridge duration is defined as the time between anaphase onset (nuclear elongation) and bridge resolution. Cells were either released from a metaphase arrest in the presence of HU at 30 °C, or arrested in metaphase at 25 °C and released at the restrictive temperature to inactivate DNA replication. Arrest conditions and fluorescent reporters are indicated at the top of each panel.

      Panel b * The number of +HU cells that divided over time was less than -HU cells

      • The knock-out of RAD improved the number of +HU cells dividing.

      Temperature Sensitive Mutants

      Panel c

      • The temperature-sensitive mutant of GINS showed a similar trend, to a lesser extent.

      Panel d

      • Mut Polα reduced division a little bit

      • Mut Polε reduced division a lot

      • Mut Polδ did not reduce division

      Panel e

      • Emphasis on Polε
    39. Cells arrested in metaphase by treatment with nocodazole and released from metaphase in fresh medium (-HU), or treated with 0.1 M HU for 30 min and released from the metaphase block in fresh medium containing HU (+HU)

      Cells were arrested in metaphase. They then released cells into anaphase with the following conditions: 1. ribonucleotide reductase inhibitor hydroxyurea 2. temperature sensitive-mutants of pol alpha, delta, epsilon, and GINS

      • mCherry>chromatin = visualize bridges
      • GFP>actomyosin ring = visualize cellular division
    40. Disruption of DNA synthesis during mitosis delayed or inhibited nuclear and cell division and triggered long-lived chromatin bridges

      When DNA synthesis machinery was inhibited during M phase, both DNA synthesis and nuclear and cell division was inhibited.

    41. inactivate DNA replication in metaphase arrested cells

      To do this, they shut down DNA synthesis completely by inhibiting the catalytic subunit of pol δ (pol3).

      However, this depletion inhibited nuclear division :/

    42. Fig. 1
      • When S phase checkpoint is not triggered, cancer cells complete any unfinished DNA replication during early mitosis.
      • If cancer cells can do this, maybe healthy cells can too.
      • Yeast mutants can get past this checkpoint and enter mitosis with unreplicated DNA.

      Question: does mitotic DNA synthesis occur in healthy yeast cells?

    43. Nuclear EdU incorporation in G1 cells may reflect DNA synthesis in the nucleus and/or increased nuclear import of nucleotides

      During G1, a cell contains high levels of nucleotides. This is because G1 is the growth phase, where it prepares everything it needs to DNA replication in S phase, and subsequent cell division in M phase.

    44. To visualise G1 nuclear morphology after metaphase arrest and release, cells expressing Net1-GFP (to label the nucleolus) and Nup49-mCherry (nuclear envelope) were arrested with nocodazole for 3 h, and released into fresh medium supplemented with alpha factor

      In panel C, they looked at cell morphology 1. After metaphase arrest 2. After metaphase release

      They stained for the nucleolus and the nuclear envelope.

      • DAPI>chromosomes, shows how condensed chromosomes are
      • GFP>nucleolus = breaks down in prophase
      • mCherry>nuclear envelope = prometaphase
    45. Cells blocked in G1 showed higher nuclear EdU incorporation than metaphase cells

      Cells in G1 had higher EdU incorporation than those in metaphase.

      This suggests that mitotic DNA synthesis occurs between metaphase and G1 - maybe anaphase.

    46. block them in metaphase and treated with EdU as they were either kept in metaphase arrest or released into alpha factor-containing -Met medium for 60 min to arrest them in G1

      The authors arrested cells in metaphase, incorporated EdU, then released.

      They then arrested again in G1.

      EdU incorporation was measured: 1. 1 hr into metaphase 2. Following G1 arrest

    47. certain budding yeast mutants can enter mitosis in the presence of unreplicated DNA8,9,10,11,12. Thus, to what extent eukaryotic cells temporally separate DNA synthesis and segregation under physiological conditions remains an open question

      Budding yeast mutants have been able to enter mitosis without complete DNA replication, suggesting that the S phase checkpoint was left untriggered.

      Thus, these are candidates for the study of MiDAS.

    48. possibility that DNA synthesis and mitosis may overlap during normal cell cycles

      In the event that replication stress does not trigger S phase checkpoints, cancer cells have been observed to complete DNA replication during early mitosis.

      If cancer cells can do this, maybe healthy cells can too.

    49. Detection of EdU was not affected by differences in cell cycle stage such as chromosome condensation

      DAPI staining may elucidate cell cycle stage based on chromosome condensation status. Thus, the researchers can look at EdU incorporation in relation to chromosome condensation.

    50. nucleolus

      The nucleolus takes up 25% of a cell's nucleus. It is a region of the nucleus responsible for the synthesis of ribosomal RNA (rRNA), which is a building block of ribosomes, and the synthesis of ribosomes themselves.

    51. mitochondrial DN

      Mitochondria evolved from bacteria that were engulfed by nucleated ancestral cells. Thus, mitochondria have their own genomes, as well as their own machinery for making RNA and organelle proteins.

    52. DAPI-rich (white arrows) and DAPI-poor region

      4′,6-diamidino-2-phenylindole (DAPI) is a blue-fluorescent DNA stain that exhibits fluorescence upon binding to AT regions of double stranded DNA, allowing you to count chromosomes.

    53. ensured by the temporal separation of replication and chromosome segregation

      Canonically, during S phase of the cell cycle, all of a cell's DNA is replicated with the assistance of a protein complex called a replisome.

      DNA replication must be highly accurate, as this newly synthesized DNA will be passed onto progeny cells and is necessary for cell survival.

      In this instance temporal relates to time.

      The accuracy of DNA replication is ensured through the separation of DNA replication and division of chromosomes in time. Furthermore, once a cell is dividing, there are mechanisms in place to ensure that one copy of each chromosome is allocated to each new cell.

    54. DNA synthesis during late mitosis correlates with elevated mutation rates at subtelomeric regions, including copy number variation

      DNA synthesis that occurs during chromosome segregation has been shown to increase mutation rates of DNA near telomeres

      Subtelomeric regions

      One specific mutation being observed is the gain of multiple copies of a given piece of DNA, or the loss of that piece of DNA all together. Aneuploidy is a type of copynumber variation.

    55. 20–40% of unperturbed yeast cells, DNA synthesis continues during anaphase, late in mitosis

      DNA replication has been observed outside of S-phase, and as late as anaphase in mitosis. This contradicts the previous sentence in which DNA replication occurs separate from cellular division in order to ensure faithful replication and segregation.

      It is unclear why this may be occurring in 20-40% of yeast cells not experiencing replicative stress.

    1. environmental toxins or drugs cause DNA damage and interfere with DNA replication

      Replicative stress can manifest from a number of things.

      Misincorporation of ribonucleotides, secondary DNA structures, conflicts between replication and transcription machinery, insufficiency of essential replication factors, common fragile sites, or chromosome inaccessibility can all cause replicative stress.

      Replication stress leads to the appearance of stalled replication forks. 
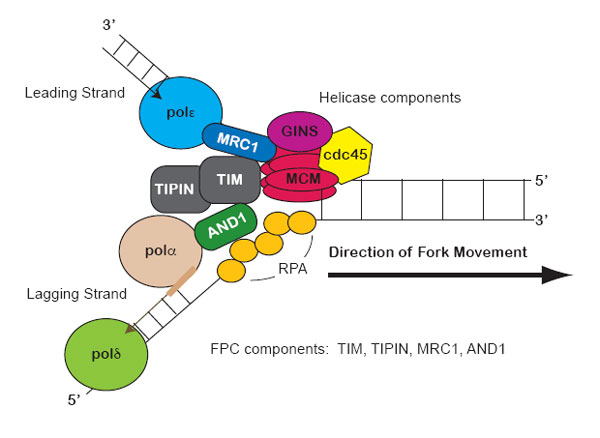
Stalled replication forks produce physical changes to DNA that induce checkpoint signals. For example, the minichromosome maintenance (MCM) helicase continues unwinding the DNA and generates some excess single stranded DNA (ssDNA).

      Resources

    2. Eukaryotic genomes are replicated with almost absolute fidelity every time cells divide

      When cells divide, they must first replicate all of their DNA, to be passed onto progeny cells.

      Eukaryotic cells replicate their genome with significantly high accuracy.

    1. Sera were collected from Peruvian patients with acute or chronic phase bartonellosis in 2000. Western blot analysis and ELISA were carried out as previously described.7
      1. The recombinant Pap31 antigen is added to the well and incubated, allowing for Pap31 to adhere to the well.
      2. The patient sample is then added to the well and incubated, allowing for binding of existing antibodies to Pap31.
      3. A secondary antibody, against IgG and IgM, are bound to an enzyme, and then are added and incubated to bind to the primary antibody.
      4. The well is then filled with a substrate that will react with the enzyme and lead to a color change. The intensity of this color change is measured via optical density and correlated to antigen concentration.
    2. Western blot analysis and ELISA were carried out as previously described.

      "Microtiter plates (96 well) were coated overnight at 4°C with antigens diluted in PBS, blocked with 0.5% boiled casein for 1 h, and rinsed twice with PBS for 5 min each time. Linbro U plates (catalog no. U 76-311-05; ICN, Costa Mesa, Calif.) were used for assays with rabbit sera, while Microtest III tissue culture plates (Falcon catalog no. 3072) were employed with human sera. Patient sera were diluted 1:400 in PBS with control protein extracts (20 μg/ml) purified from E. coli BL21 by a procedure identical to that used for purifying r56 (fractions collected at 21 to 32 min pooled from gradients equivalent to Fig. ​Fig.2),2), preabsorbed for about 1 h at room temperature, and then added to the ELISA plates. The plates were incubated for 1 h at room temperature and washed four times with 0.1% Triton X-100 in PBS. Peroxidase-conjugated mouse anti-human IgG (Fc specific) (Accurate Chemical and Scientific Corp., Westbury, N.Y.) diluted 1:8,000 and goat anti-human IgM (mu chain specific) (Kirkegaard & Perry) diluted 1:1,000 were added. After 1 h of incubation at room temperature, the plates were washed four times with 0.1% Triton X-100 in PBS and the last wash was with PBS only before the addition of the 2,2′-azinobis(3-ethylbenzthiazoline sulfonic acid) (ABTS) substrate (Kirkegaard & Perry). Optical densities at 405 nm (OD405) were measured after 15 min of incubation at room temperature. Rabbit sera were diluted 1:250 with PBS only. All procedures were the same as for detection of human antibodies except that rabbit sera were not preabsorbed with protein preparations from BL21 and peroxidase-conjugated goat anti-rabbit IgG (Kirkegaard & Perry) diluted 1:2,000 was used."

      https://www.ncbi.nlm.nih.gov/pmc/articles/PMC95611/

    1. The recombinant Pap31 antigen was prepared as described previously.

      "Primers for rPap31 were designed according to the ATCC strain 35685 (KC583) sequence determined by L. Hendrix. The sequence has just been submitted to GenBank (accession number DQ207957) (forward primer: gcagcatatgttatgatcccgcaagaaata; reverse primer: ctaaaggcacaaccacaacgcattcttaag). The rPap31 gene segment was amplified using the genomic DNA of a local strain HOSP 800–09 as the template. PCR product was inserted between the NdeI and EcoRI sites of the expression vector pET24a (pET24a-pap31). The rPap31 protein was expressed in E. coli BL21 (DE3) after induction with 1 mM IPTG. The Pap31 gene segment in pET24a was recloned by GenWay Biotech Incorporated (San Diego, CA) to attach a T7 tag to the N-terminus of the rPap31 gene insert. The rPap31 was expressed as an inclusion body, which was washed and solubilized with 8 M urea in the presence of 1% Triton X-100 and 2 mM DTT in 50 mM Tris HCl, pH 8.0. The polypeptide was refolded by dialysis against 0.1 mM EDTA/12% glycerol in 50 mM Tris-HCl, pH 8.0, at 4°C. The refolded protein was further purified using the T7-tag affinity column in the presence of 2 M urea."

      https://nyaspubs.onlinelibrary.wiley.com/doi/10.1196/annals.1355.045

    2. Youden's index

      Statistic of the ROC curve used in the interpretation and evaluation of a biomarker, which defines the maximum potential effectiveness of a biomarker.

      Youden's J Statistic (J)

      $$ \sum (sensitivity + specificity)-1$$

      • Sensitivity: true positive rate
      • Specificity: true negative rate

      It outputs a value between -1 and 1, which can then be turned into a percentage.

      • -1: test preforms opposite to it's intended function
      • 1: test preforms exactly as it's intended function

      https://www.ncbi.nlm.nih.gov/pmc/articles/PMC2515362/ https://www.youtube.com/watch?v=wMRFteWbfX0

    3. using recombinant protein Pap31 (rPap31) for the detection of antibodies against B. bacilliformis

      In this paper, the authors produced recombinant Pap31 to capture antibodies against b. bacilliformis in an ELISA assay.

      The goal is to detect this antibody using a method that yields similar sensitivity and specificity to IFA (the standard diagnostic tool for Carrion's), but is more affordable.

    4. Of 302 sera that were examined in the study, 103 samples tested positive for IFA-IgG and 34 samples tested positive for IFA-IgM.

      IgM antibodies are produced against an antigen in the early stages of infection and are detectable after four to seven days.

      IgG antibodies are produced seven to 14 days after infection, and are detectable for months and even years, depending upon the antigen and the individual.

      What Testing for IgG and IgM Reveals

      • Positive IgM and Negative IgG: recent or acute infection

      • Positive IgG and Negative IgM: a past infection

      • Positive IgM and Positive IgG: ongoing infection

      • Negative IgM and Negative IgG: no current or past infection

      Their findings from 302 samples

      • Positive IgM and Negative IgG: 34

      • Positive IgG and Negative IgM: 103

      • Positive IgM and Positive IgG: 22

      • Negative IgM and Negative IgG: 143

    5. The performance of the rPap31-based ELISA compared with IFA for detection of antibody against B. bacilliformis is shown in Table 2.

      The authors then compared an ELISA for recombinant Pap31 antigen and the detection of antibodies specific to B. bacilliformis.

    6. Figure 1.

      Figures 1 and 2 and Table 1 are a proof of concept, designed to confirm that the authors could accurately and specifically detect IgG and IgM antibodies from patient serum samples using OD readings as a diagnostic tool.

    7. Table 1

      In Table 1, the mean optical density (OD) from ELISA assays is measured.

      The table is split into IgG and IgM results.

      Findings

      • IgG positive patient samples had a higher OD than IgG negative patient samples. The same trend was observed in IgM positive and negative samples.

      • Patients who were positive for either IgG or IgM have higher OD readings than patients who were negative for either IgG or IgM.

      This table shows that an ELISA-based assay is able to differentiate between individuals with and without IgG or IgM antibodies with statistical significance. This table tells us the disease state of a given patient.

    8. Figure 1.

      Indirect ELISA 1. The patient sample is added to a well and incubated, allowing for any antigens to adhere to the well. 2. Then, a primary antibody designed to specifically bind to a given antigen (Pap31) is added to the solution and incubated.<br /> 3. A secondary antibody, bound to an enzyme, is then added and incubated to bind to the primary antibody. 4. The well is then filled with a substrate that will react with the enzyme and lead to a color change. The intensity of this color change is correlated to antigen concentration.

    9. The mean OD value was significantly higher among sera that were IFA positive for either IgG or IgM compared with those that were IFA negative for either IgG or IgM (P < 0.001)

      Optical Density (OD)

      OD values measure the amount of light absorbed by a sample. Higher OD values generally indicate a higher concentration of antibodies or a stronger reaction.

      Their findings on OD from IFA assays

      Patient samples that were positive for IgG or IgM had higher OD values than patient samples that were negative for IgG or IgM.

      This indicates that the positive patient samples have higher antibody concentrations, and likely higher Pap31 concentrations. This result can be used to support the diagnostic accuracy of the IFA test.

    10. Receiver operating characteristics

      This plot tells us the sensitivity of the ELISA assays preformed in these experiments. It will tell us how often the result, whether positive or negative, was correct.

      Here is how it works

      A receiver operating characteristic curve plots true positive rate (TPR) against false positive rate (FPR) at each threshold setting. A threshold is a value that determines whether a prediction is classified as positive or negative.

      • TPR: This measures the proportion of actual positives that are correctly identified by the mode

      • FPR: This measures the proportion of actual negatives that are incorrectly classified as positive

  5. Jul 2024
    1. We next examined the relationship between POLD3 and MUS81in regulating recruitment of DNA replication/repair factors to CFSsin mitosis. Depletion of POLD3 or POLD4 had negligible effects onthe association of MUS81, POLD1 or PCNA with S phase or mitoticchromatin (Extended Data Fig. 8i, j).

      Relationship between POLD3 and MUS81 and how they may function to regulate DNA replication factors at CFSs.

      POLD3 nor POLD4 are not necessary for MUS81, POLD1 or PCNA recruitment to chromatin.

    2. Subcellular fractionation analysis

      Subcellular fractionation analysis is used to separate and isolate different organelles or subcellular components from a cell, including chromatin.

    3. U2OS

      U2OS cells are a type of human osteosarcoma cell line. Osteosarcoma is a type of bone cancer. U2OS cells were derived from a 15-year-old female with osteosarcoma and have been extensively used in biomedical research.

    4. Figure 1

      Question: how late in S phase does replication of CFSs under stress occur?

      Major findings: 1. Replicative-stress-induced DNA synthesis can occur after entry into mitosis, but only before prometaphase. 2. Mitotic DNA synthesis occurs primarily at CFSs.

      Experiments: EdU incorporation to detect new DNA synthesis under three conditions: stress, cell cycle step, location on chromosomes.

    5. MUS81 depletionalso abrogated recruitment of POLD3 and POLD4 to chromatin inprometaphase cells

      MUS81 likely helps recruit POLD3, POLD4 during mitosis.

    6. metaphase chromosome breaks/gaps are associated with de novomitotic DNA synthesis promoted by the POLD3-associated DNApolymerase δ complex

      New mitotic DNA synthesis occurs via the POLD3 subunit of POLδ.

    7. APH-induced CFS expression, and suppres-sion of CFS-associated UFBs and 53BP1 bodies, required POLD3but not POLD4

      POLD3 is required for reduction of DNA damage, anaphase bridges.

    8. did not pre-vent MUS81 recruitment to CFSs in mitosis (Fig. 4e, f). However,POLD3 (but not POLD4) depletion prevented mitotic DNA synthesisat CFSs (Fig. 4g, h and Extended Data Fig. 8a), and led to increasedlevels of DNA strand breaks (TUNEL+) on metaphase chromosomes(Fig. 4i, j).

      POLD3 nor POLD4 are not required for MUS81 localization to CFSs during mitosis. Thus, the chromosome can still be cut, even without the polymerase there to repair it with new DNA.

      This leads to more broken DNA that cannot be repaired.

    9. POLD3 formed APH-inducible foci in early mitosis, but very rarelyin anaphase (Fig. 4c, d), similar to the pattern reported previously forMUS81 (ref. 7). POLD3, like its yeast orthologue Pol32, is requiredfor a specialized form of DNA repair termed break-induced replica-tion (BIR), which is POLD4-independent 24–26

      POLD3, required for break-induced repair, appears early in mitosis, but not during anaphase.

    10. MUS81 was largely absent from chromatin in theG2 phase (Fig. 4a, b), and was again recruited to chromatin afterentry into mitosis at the same time as EME1 was phosphorylated

      Phosphorylation of EME1 helps recruit MUS81 during mitosis to initiate the DNA damage response and mitotic DNA synthesis.

    11. Figure 3

      Hypothesis/question:

      If DNA synthesis is occuring in mitosis, there must be a polymerase carrying out the synthesis. What would happen if we inhibited this polymerase?

      Major findings: 1. Inhibition of DNA polymerase during mitosis led to lethal chromosomal mis-segregation and non-disjunction. 2. Mitotic DNA synthesis is necessary for cell survival under replicative stress.

      Experiments: cell synchronization experiments allowed researchers to release all cells into mitosis at once, and then observe the affects following cell division. They used 53BP1 nuclear bodies to identify regions of unprocessed CFSs in progeny cells to determine the affect of DNA polymerase inhibition during mitosis.

    12. A highdose of APH in mitosis generated an increased frequency of CFS-associated UFBs, increased non-disjunction of chromosomes 3and 16 harbouring FRA3B and FRA16D, and reduced cell survival

      Inhibition of DNA polymerase during mitosis led to greater number of anaphase bridges, non-disjunction, and cell death. This means that mitotic DNA synthesis can be cricual to cell survival and ability to thrive.

    13. failure to perform mitotic DNA synthesis adverselyimpacts daughter cells

      Inhibition of DNA polymerase during mitosis led to greater number of unprocessed CFSs.

    14. 53BP1 nuclear bodies

      53BP1 nuclear bodies are specialized structures in the nucleus that form around unprocessed CFSs and are associated with DNA damage response mechanisms.

      Using 53BP1 nuclear bodies, the authors could identify sites of DNA damage, particularly at CFSs.

    15. To examine the DNA polymerase(s) responsible for mitoticDNA synthesis

      Researchers wanted to know what polymerases were involved in the synthesis of new DNA during mitosis.

    16. Figure 2

      Hypothesis/question:

      1. What is the role of MUS81-EME1 and their scaffold proein SLX4 in mitotic DNA synthesis?
      2. What events in prophase contribute to DNA synthesis during mitosis (specifcally prophase)?

      Major findings:

      1. Confirmation that MUS81-EME1 are both required for new DNA synthesis in mitotic cells. MUS81 specically uses endonuclease catalytic activity to promote new DNA synthesis.
      2. SLX4 is requried for MUS81 localization to CFSs, but not the opposite.
      3. SMC2 and WAPL are required for MUS81 recruitment to CFSs.
      4. While they are required for chromosome morphology during the cell cycle, SMC2 and WAPL do not contribute to the stability of chromosomes.
      5. Mitotic DNA synthesis occursbefore or during the release of sister chromatids.

      Experiments: EdU incorporation to detect new DNA synthesis during knock outs of mitotic proteins involved in DNA damage repair and DNA morphology. Co-localization to detect presence of proteins at CFSs.

    17. Depletion of either SMC2 orWAPL led to characteristic alterations in chromosome morphologyand compaction (Extended Data Fig. 5d–f), but failed to activate inter-phase checkpoints (Fig. 2a, b and Extended Data Fig. 4a) or gener-ate increased numbers of DNA damage foci in S phase compared tocontrol-siRNA-depleted cells (

      When SMC2 and WAPL were depleted, chromosomes were not formed correctly for cell division, as expected.

      SMC2 or WAPL depletion led to stalling of interphase checkpoints.

      Depletion of SMC2 or WAPL have no affect on DNA damage during S phase.

    18. PLK1i in mitosis also inhibited mitotic EdUincorporation (Extended Data Fig. 5i, j), implying that CFS-associatedDNA synthesis occurs after, or concomitant with, release of sisterchromatid arm cohesion

      PLK1i helps release sister chromatids in preparation for cell division.

      It's presence inhibited the cell's ability to synthesize new DNA during mitosis, suggesting that sister chromatids are released before or during MiDAS.

    19. SLX4 with FANCD2 twin foci in mitosis was unaffected

      Depletion of these proteins related to chromosome structure did not affect SLX4's ability to localize at CFSs.

    20. FANCD2 twin

      FANCD2 twin foci are formed by the FANCD2 protein, which is part of the Fanconi Anemia (FA) DNA repair pathway.

      The presence of FANCD2 twin foci indicates the location of CFSs.

    21. SMC2 or WAPL depletion did lead to a failure to recruit MUS81 tochromatin, decreased CFS expression, and an abolition of EdU incor-poration at CFSs in mitosis (Fig. 2b–g). Furthermore, these cells exhib-ited increased numbers of anaphase bridges (Extended Data Fig. 4e–h)and 53BP1 nuclear bodies

      SMC2 and WAPL are required for MUS81 recruitment.

    22. To study whether the key events occurring in prophase wererequired for EdU incorporation,

      Note: PMAT = mitosis 
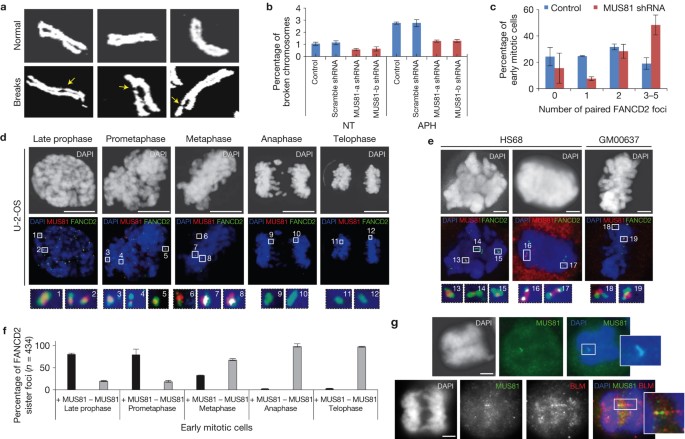
Because the events of MiDAS were determined to occur after G2 but before prometaphase, the authors were interested to see what in prophase contributed to new DNA synthesis.

      SMC2 = chromosome compaction

      WAPL and PLK1 = release of sister chromatids

    23. Depletion of SLX4 (Extended Data Fig. 4a) also led to: (1) reduced EdU incorporation at CFSs in mitosis; (2) reduced CFS expression; (3) defective recruitment of MUS81 to CFSs; (4) increased FANCD2-associated ultra-fine anaphase DNA bridges (UFBs); and (5) increased 53BP1 nuclear bodies that form around unprocessed CFSs

      Because SLX4 is a scaffold protein for MUS81 and was found to localize with CFSs during mitosis.

      Thus, they depleted SLX4 to determine it's role in relation with CFSs during mitosis.

      Results: 1. New DNA synthesis was reduced 2. CFS turning into gaps or breaks during mitosis was reduced 3. Reduced recruitment of MUS81 to CFSs

    24. A short interfering RNA (siRNA)-resistant MUS81 cDNA, but not a catalytically inactive version (MUS81(D338A/D339A)) (refs 15, 16); Extended Data Fig. 4a), could restore mitotic EdU incorporation and CFS expression in MUS81 siRNA-depleted cells

      After knocking down MUS81, the researchers wanted to restore it's function to see how EdU incorporation was affected with MUS81 present.

      They tried two different methods: 1. siRNA resistant MUS81 2. catalytically inactive MUS81?? (I think this was to determine if it has a catalytic function)

      Results: 1. siRNA resistant MUS81 can restore function 2. catalytically inactive MUS81 cannot restore function

    25. siRNA

      siRNA is a type of RNA interference, a mechanism used for regulation of proteins.

      In combination with an Ago protein, the seed sequence of the siRNA, found in the 5' UTR, functions as a RISC complex that can find and bind to complimentary mRNA sequences and target them for silencing.

      The use of an siRNA resistant MUS81 sequence in this experiment allows for both the knock-down and introduction of MUS81 to observe it's affects.

    26. Consistent with a role for the MUS81–EME1 complex in promoting CFS expression7,8,9, depletion of either MUS81 or EME1 inhibited EdU incorporation in mitotic cells

      MUS81-EME1 is responsible for cleaving DNA at stalled and collapsed replication forks, triggering a DNA repair pathway.

      However, when MUS81 was knocked down, new DNA synthesis was not observed, because stalled forks were not cleaved and the pathway to fix them was not triggered.

    27. SLX4

      Scaffold proteins are known to interact with multiple proteins involved in a signaling pathway, tethering them into complexes. In such pathways, they regulate signal transduction and help localize pathway components.

    28. Figure 1

      Hypothesis/question: how late in S phase does replication of CFSs under stress occur?

      Major findings: 1. Replicative-stress-induced DNA synthesis can occur after entry into mitosis, but only before prometaphase. 2. Mitotic DNA synthesis occurs primarily at CFSs.

      Experiments: EdU incorporation to detect new DNA synthesis under three conditions: stress, cell cycle step, location on chromosomes.

    29. EdU incorporation was only detectable in APH-treated cells that had initiated mitosis (Extended Data Fig. 2e, f). If EdU was added to nocodazole-arrested cells in prometaphase, EdU foci were not observed

      Occurrence of DNA synthesis was tracked and visualized specifically in cells that had progressed into mitosis after being exposed to replicative stress (APH inhibitor).

      Cells that had already moved to prometaphase did not show signs of mitotic DNA synthesis - later papers showed otherwise.

    30. In addition to scheduled DNA replication in S phase, over 40% of the mitotic cells, including those in anaphase, contained EdU foci

      Tells us that some level of DNA replication is occurring in mitosis, as late as anaphase.

      40% is questionable among scientists.

    31. EdU

      (A) thymidine amino acid, (B) 5-bromo-2'-deoxyuridine antibody (BrdU), and (C) 5-ethynyl-2'-deoxyuridine azide (EdU).

      EdU is incorporated into the genome during DNA replication and allows for the identification of newly synthesized DNA via fluorescence.

    32. nuclease activity of MUS81 then promotes POLD3-dependent DNA synthesis at CFSs, which serves to minimize chromosome mis-segregation and non-disjunction

      Major finding

    33. MUS81–EME1 structure-specific endonuclease promotes the appearance of chromosome gaps or breaks at CFSs following replicative stress

      MUS81-EME1 promotes the appearance of chromosome gaps or breaks at CFSs by cleaving stalled replication forks, triggering a DNA damage response that can lead to chromosomal instability.

    34. MUS81–EME1 structure-specific endonuclease

      MUS81-EME1 is a DNA endonuclease that is recruited during prophase of the mitosis. MUS81-EME1 is involved in resolving DNA structures, such as Holliday junctions, formed during genetic recombination. These structures need to be resolved correctly to ensure accurate chromosome segregation during mitosis.

      Holliday junction: involves the exchange of DNA strands between two homologous chromosomes or sister chromatids. Resolving a Holliday junction means cleaving the junction to allow the strands to separate properly, ensuring accurate recombination and genetic diversity.

    35. manifest as gaps or breaks on metaphase chromosomes (termed CFS ‘expression’)

      Stalled replications forks arising from CFSs can collapse and form DNA breaks (SSBs and DSBs). This causes the gaps or breaks on metaphase chromosomes.

    36. common fragile sites (CFSs)

      Common fragile sites are regions of a genome that exhibit difficult-to-replicate sequences and secondary structures (generally resulting from AT-rich repeats). These regions are generally stable, but when a cell experiences replicative stress, they can become more difficult to replicate, leading to incomplete replication of CFSs that are carried through into mitosis [1,2].

      CFSs are hotspots for chromosomal instability and rearrangements in cancers [2].

      1. T. Glover. Common fragile sites. Cancer Lett 2006. Doi: 10.1016/j.canlet.2005.08.032.
      2. Li, S., Wu, X. Common fragile sites: protection and repair. Cell Biosci 2020. https://doi.org/10.1186/s13578-020-00392.
    37. Oncogene-induced DNA replication stress has been implicated as a driver of tumorigenesis

      Oncogene activation disrupts canonical cellular pathways, leading to genome instability.

    1. CFS expression is not simply caused by a single feature of CFSs, but rather by a combination of more than one mechanism
      • secondary structures resulting from AT-rich sequences
      • Transcription–replication conflicts: cellular machineries responsible for gene expression and genome duplication collide with each other on the same genomic location.
      • Lack of replication origins
    2. replication stress

      Replication is a highly regulated process designed to guarantee accurate duplication of the genome once per cell cycle. Any condition that compromises it is referred to as replication stress.

    3. which then leads to incomplete DNA replication of CFSs when cells enter mitosis, resulting in CFS expression

      When cells experience replication stress, replication of CFSs are particularly impacted, leading to uncomplete replication when cells enter mitosis.

    4. Prominently, CFSs are hotspots for chromosomal instability and rearrangements in cancers.

      The recurrent formation of gaps and breaks at CFSs highlights their inherent instability and vulnerability to disruptions in DNA replication processes.

    5. Common fragile sites (CFSs) are normal chromosomal regions that recurrently form cytogenetically defined gaps and breaks on metaphase chromosomes upon partial inhibition of DNA synthesis

      Cytogenetically defined gaps and breaks: gaps and breaks on chromosomes at CFSs are visually identifiable under a microscope using cytogenetic techniques.

  6. Apr 2024
    1. relatively little is known of the mechanisms that regulate cardiac and smooth muscle genes

      In an effort to elucidate the mechanisms that regulate cardiac and smooth muscle genes, scientists performed a BLAST search to look for potential cardiac-specific genes that may be involved in regulation.

    2. SRF is not muscle specific, it has been postulated to activate muscle genes by recruiting myogenic accessory factors.

      SRF doesn ot appear to function only in the muscles, so it likely relies on the recruitment of myogenic accessroy factors to accomblish gene activation.

    3. Serum response factor (SRF) regulates transcription of numerous muscle and growth factor-inducible genes

      SRF binds to the serum response element (SRE) in the promoter region of target genes.

      When certain cells are stimulated by growth factors or mitogens, some of their genes get turned on temporarily. These genes are generally regulated by a region called the serum response element (SRE).

      Mitogen = A mitogen is a small bioactive protein or peptide that induces a cell to begin cell division, or enhances the rate of division (mitosis).

    1. one of the 20 novel sequences to correspond to the 3′ untranslated region of MYOCD

      1 of the 20 new, previously unidentified sequences matched with a region of the gene MYOCD known as the 3' untranslated region (UTR)

    2. BLAST search algorithm

      BLAST (Basic Local Alignment Search Tool): * Compares sequences of nucleotides or proteins to find similarities * Wang et. al. compared sequences derived from RNA (expressed sequence tags) obtained from libraries of embryonic cardiac muscle cells with sequences already known and recorded in databases

    3. data accumulating from global work on transcriptomics

      Transcriptomics: * Techniques used to study an organism's transcriptome, the sum of all of its RNA transcripts. * Can provide insight into gene expression.

    1. All of these diseases were recessive, and all were caused by deficiencies in enzymes (e.g., phenylketonuria, galactosemia). This observation gave rise to the general notion that a 50% deficiency of an enzyme, as in heterozygotes for enzyme deficiencies, would not be sufficient to cause disease.

      individuals who inherit only one mutated copy of the gene (heterozygotes) typically have around a 50% deficiency in the corresponding enzyme. However, this level of deficiency is usually not enough to cause the disease.

      Individuals who were homozygous recessive would have the disease.