homozygous deletions
Deletions in which the genetic information is missing on both chromosomes.
homozygous deletions
Deletions in which the genetic information is missing on both chromosomes.
Bioenergetics models
Bioenergetics is a field in biochemistry and cell biology that concerns energy flow through living systems. This bioenergetics model is showing how much energy sharks require.
multibeam sonar system
Type of sonar used to map the seabed. RLS
hydrophones
A microphone that detects sound waves underwater. RLS
trophic pyramid
a visual figure and/or explanation of the distribution of biomass through an ecosystem. -MSars
hectare
A metric unit equal to 10,000 square meters. Used commonly for large areas of land. -ASR
See this article in Metric Views for help to visual this size: http://metricviews.org.uk/2007/11/how-big-hectare/
reciprocal
Having to do something to both side, the bearing or binding of 2 parties equally.
-Otniel Gonzalez
gradients
Describes different sides in comparison to each-other, a gradient can be in reference to water pressure as well as many other things.
-Otniel Gonzalez
morphological
Relating to the form or structure of things, having to do with somethings physical appearance/structure.
-Otniel Gonzalez
pubescence
Pubescence in this context means small hairs or short down on the leaves and stems of various plants.
-Otniel Gonzalez
qualitative
Referring to something's qualities, not numerical but categorical. Can be described with words, not numbers.
-Otniel Gonzalez
phenotypic plasticity
A genotypes ability to change as an adaptation to the environment. This refers to the plant's distribution of resources.
regression
Regression analysis is a statistical model made up up of a series of processes used to understand how the dependent variable changes when any of the independent variables are modified.
habitat-mediated speciation
Habitat-mediated speciation is the emergence of different species throughout evolution, brought about by the natural environment and its effects.
incipient speciation
incipient meaning the beginning of a process and speciation is the diverging of similar species into two or more differing species due to evolution
-Luisa Bermeo
heterogeneity
describes a state of being different in character in this case in reference to the environment
-Luisa Bermeo
elliptical transect
The orbital path along which the species is studied. -Sindy
precludes
To prevent from occuring -Sindy
cayes
Also known as a key, a caye is a low level island topical to a reef. -Sindy
endemic
Native or confined to a certain area -Sindy
) Lognormal
A distribution of normally displayed logarithms. A logarithm is a mathematical formulation. -Mohammad
coelom.
A body cavity that is lined on one side by the body wall and the other by a main body system such as the intestinal tract. -Mohammad
monofilament gillnets
A type of fishing gear that is harmful to species that are supposed to be protected. -Mohammad
Akaike's Information Criterion (AIC)
Determines the Quality of a set of data. -Alejandro
sporadically
Irregularly occurring -Mohammad
gill-nets
A net that traps fish in it by their gills. -Emily
relative abundance
How common or rare a species is compared to other species in its community. -Emily
catch-per-unit effort
Index of fish abundance. -Emily
respite
A period of rest, usually during or after an action requiring maximal effort. -Alejandro
telemetry
The recordings of information gathered by a particular machine. -Alejandro
ontogenetic
Having to do with the development from initial location to final location. -Alejandro
fauna
Inhabitants. in this case animals, belonging to a specific area. -Alejandro
Linear regression
Linear Regression is a statistical way to determine the relationship between the independent and dependent variable displayed as a straight line on a graph to indicate a set of real data values. -Sindy
spurious
Not being what it claims or appears to be. -Sindy
inclement
Undesirable -Sindy
congeners
Organisms that share the same genus -Sindy
no-take marine reserves
Reserves that restrict human activity. -Sindy
morphogenesis
The formation of an organism's structures and features.
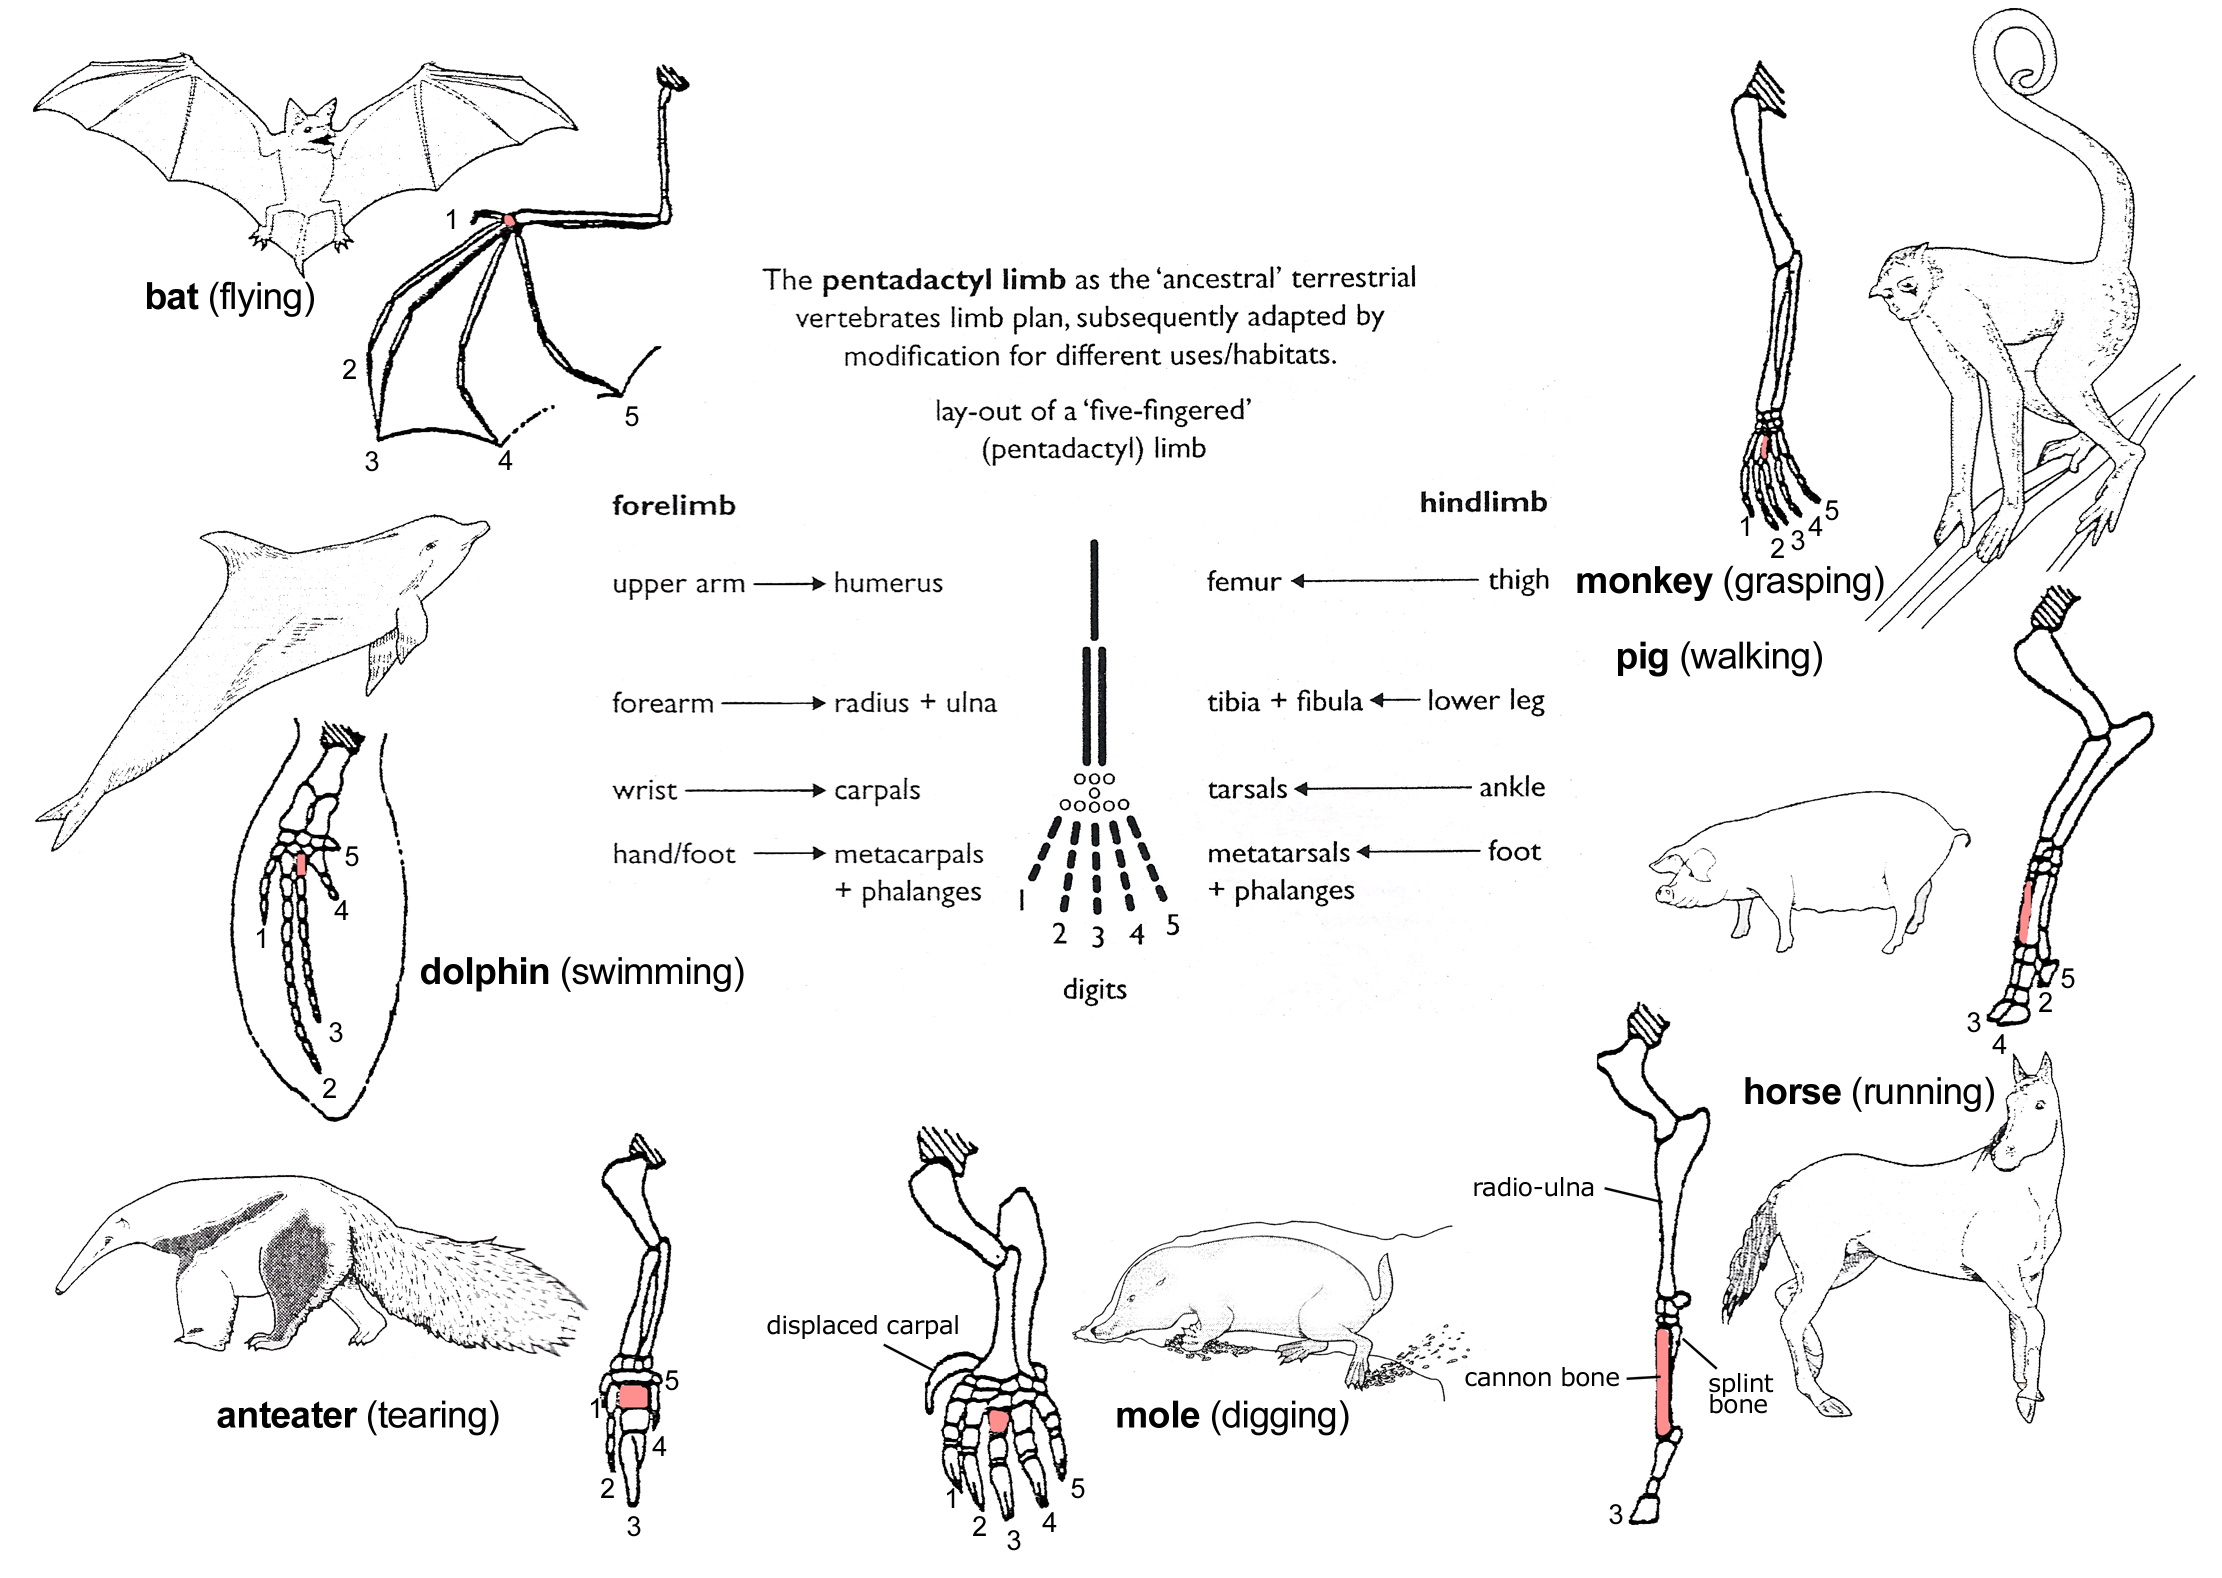
homologous
Homologous properties in biology have the same evolutionary origins, but not necessarily the same function. A common example is the human arm and a bat's wing.
dermoepidermal elevations
Bumps found in the area of tissue that joins the epidermal (outer) layer and the dermal (middle) layers of the skin.

epistatic
The phenomenon in which one gene is affected by the presence of other genes. The phenotypic effect of one gene is being masked by another gene. -Elder
protein divergence
The process by which genes after duplication shift in function. -Eri-Ray
homologous
A homologous gene is a gene inherited from a common ancestor. Homo- is a prefix for "same", implying that the genes are similar in sequence and may have similar functions. -Eri-Ray
regulatory cascade
A regulatory cascade is a system of signal-transducer proteins that relay signals from receptors to the proteins that carry out cellular responses. -Eri-Ray
pleiotropic
pleiotropy can be defined as the production by a single gene of two or more unrelated effects. -Eri-Ray
dipterans
Dipterans are insects of the order diptera. They are considered "true" flies, as they can undergo rapid and radical metamorphosis. Flies are commonly used for experiments due to their availability and ease to breed. -Eri-Ray
adaptive selection
The mechanism of choosing the most beneficial trait for survival in an environment, the other traits that are not needed are kept in small reserves, but not wiped out. The rest die off due to having less relative fitness. -Elder
diversifying selection
Changes in the population's genome based on the traits that are being favored by the environment. -Elder
evolutionary constraints
restraints on adaptive evolution, a.k.a. restraints on natural selection. -Elder
genetic switches
The mechanism in which genes are regulated to be expressed or not expressed. (to be "turned on" or "turned off") -Elder
trans-regulatory elements
Specific genes that regulate distant genes, also known as DNA sequences that code for transcription factors. - Elder
splicing regulation
join or insert (a gene or gene fragment). -Melanie
basal
forming or belonging to a bottom layer or base -Melanie
TRA
represents the fastest evolving protein in the sex determination cascade -Melanie
epistatic
the interaction of genes that are not alleles, in particular the suppression of the effect of one such gene by another -Melanie
phylogeny
is the branch of biology that deals with phylogenesis; the evolutionary development and diversification of a species or group of organisms, or of a particular feature of an organism -Melanie
impedance
The resistance of an electric circuit towards a current that is different from which it usually interacts with.
-Kierra Hobdy
small-field perturbations
Perturbations in this instance are disturbances in the surroundings of the fish, such as a duck swimming or a fly landing in the water. Small-field refers to the small range in which the fish can detect movements or perturbations in its environment.
-Kierra Hobdy
transderma
'Derma" refers to skin and in this case, "Trans" means through; so transdermal means the electroreceptors are being emitted through the skin of the fish.
-Kierra Hobdy
quantifying
To quantify means to organize into a numerical format . -Kierra Hobdy
ellipsoids
A 3D geometric figure whose planes or sections consist of ellipses or circles. -Kierra Hobdy
impedance
The resistance of an electric circuit to an opposing or alternating current. -Kierra Hobdy
propagating caudally
This means to spread toward the tail or posterior section of the body-Kierra Hobdy
oscillating dipole
Dipoles are equal magnetic positive and negative charges separated by a distance. In this case oscillate means to cause the electric current to move in a way that influences the dipoles to change and fluctuate. Picture strings vertically tied to a rope in the middle, movement to the rope cause the strings to ripple in the direction they are facing outward. -Kierra Hobdy
neural substrates
Functional units of the Central Nervous System that are organized systematically based on function and vary in their anatomical location in the body; they all work together to carry out complex body functions, in this case the process of electrolocation. -Kierra Hobdy
interpolating
The act of inserting one object or substance into another. so for this study , the slices from the EOD records taken through time are put into the slices from EOD records taken through space to create a map that shows the potential and amplitude of the EOD. - Michelle Gomez-Guevara
neurocomputational
"neuro" refers to the organism's nerves and nervous system and "computional" refers to any act that the organisms does. The study , is measuring the work that the nervous system is conducting in order to use electrolocation. - Michelle Gomez-Guevara
protagonists
fortaler
woefully
sørgeligt
ladder
stige / skala
yielded
gav / ydede
devastated
helt slået ud
meritocracy
Meritokrati, præstationssamfund
sentiments
indstillinger / synspunkter / følelser
decades
Årti
blue-collar worker
Fabriksarbejder
Mortality
Dødelighed
resilient
Spændstig
resilient
Ikke lade sig slå ud
prematurely
for tidligt, tidligere end forventet
inequality
Ulighed
Hispanic
af latinamerikansk
satisfaction
Tilfredshed
poverty
fattigdom
yielded
give, yde
eschews
undgå
meritocracy
præstationssamfund
eschews
Undgå
meritocracy
Præstationssamfund
tatters
pjalter: udtryk for fattigdom
philanthropist
Filantrop: en, der uselvisk arbejder på at hjælpe ringere stillede medmennesker
due
Pga.
persona
The aspect of someone's character that is presented to or perceived by others.
narrow-and-deep approach
This refers to results of studies that go into detail on a specific area, without covering a wide range of different topics.
innovation versus verification
Innovation refers to coming up with new ideas for research—in other words, generating new hypotheses. Verification refers to checking if a certain idea holds up in subsequent research—in other words, confirming hypotheses.
preregistration
A preregistration is a document in which researchers compile information on how their study will be run and analyzed before it is conducted. The document often contains information on which research question will be pursued; which hypothesis will be tested; how the data is collected and how the sample is generated; which data is excluded; and how the data will be prepared for analysis and ultimately analyzed. Documenting in advance helps separate confirmatory hypothesis testing from exploratory research.
repeated measurement designs
A repeated measurement design assesses the same outcome variable at several points in time. For example, let’s say we want to find out whether jogging before class improves students’ ability to follow a class. We might ask 20 students to jog before class and 20 students not to jog before class, and then after class ask them how easy it was for them to follow the class. However, we might be unlucky and conduct our experiment on a day where a particularly difficult topic was covered in class. No one—neither the joggers nor the nonjoggers—could understand the lecture, so all our subjects report they absolutely couldn’t follow the class.
This problem could be ameliorated if we used a repeated measurement design instead. We would ask our 20 joggers and 20 nonjoggers to either jog nor not jog before class on five days in a row, and then ask them for their ability to follow the class each time. Now, we would have not only one point of measurement from each student, but five points of measurement of their ability to follow the class at several points in time.
within-subjects manipulations
Within-subjects manipulations refer to situations in experiments where the same person is assigned to multiple experimental conditions.
For example, let’s say we want to find out which of two different learning techniques (A and B) is more effective in helping students prepare for a vocabulary test. If we conducted a within-subjects manipulation, each student would apply both learning techniques. Let’s say every student must first apply learning technique A, then take a vocabulary test, and then a week later for the next test apply learning technique B. We could now compare following which learning technique the students perform better with.
In contrast, if we conducted a between-subjects manipulation, each student would only apply one learning technique. We would split the group of students, so that half of them use learning technique A and then take the vocabulary test, while the other students use learning technique B and then take the vocabulary test. Again, we could compare which learning technique the students perform better with.
fixed-effect model
A fixed effect model is a statistical model which accounts for individual differences in the data which cannot be measured by treating them as nonrandom, or “fixed” at the individual level.
As an example, let’s say we wanted to study if drinking coffee makes people more likely to cross the street despite a red light. Our outcome variable of interest is how often each subject crosses a street despite a red light on a walk with 10 red traffic lights. The explanatory variable we manipulate for each participant is if they had a cup of coffee before the experiment or a glass of water (our control condition), and we would use this variable to try to explain ignoring red lights. However, there are several other influences on ignoring red lights which we have not accounted for. Next to random and systematic error, we have also not accounted for individual characteristics of the person such as their previous experience with ignoring red lights.
For instance, have the participants received a fine for this offense? If so, they might be less likely to walk across a red light in our experiment. Using a fixed effect model makes it possible to account for these types of characteristics that rest within each individual participant. This, in turn, gives us a better estimate of the relationship between coffee drinking and crossing red lights, cleaned from other individual-level influences.
multivariate interaction effects
A multivariate interaction effect is an effect that is the product of several variables working together and influencing each other.
For example, we might be interested in finding out how water temperature (warm: 38°C; cold: 15°C) affects the body temperature of humans and sea lions. We might find that humans, on average, have a higher body temperature than sea lions, and that body temperature is higher when the body is immersed in warm compared to cold water. However, we might find that a human’s body temperature shows bigger differences between the warm and cold water conditions than the sea lion’s body temperature. Because sea lions have a substantive layer of protective fat, their body temperature does not change as much when water temperature changes, compared to humans. Here, species and water temperature show an interaction effect on body temperature.
standard error
When experiments are run using a sample instead of the entire population, each sample will show slightly different estimates of the true population parameter. The standard deviation of this range of estimates is called the standard error.
For example, if we wanted to know the average body mass of Chihuahuas, we couldn’t gather data from every single Chihuahua in the world. If we sampled 20 Chihuahuas, we might find that the average is 2.5 kg. If we sample 20 other Chihuahuas, their average weight might be 2.4 kg. Repeating this process, we would find a range of different average weights in the different samples. Taken together, these means are our estimates for the true average Chihuahua body mass in the population of all Chihuahuas. The dispersion, or the amount of variation in these means, is called standard error.
Wilcoxon signed-rank test
The Wilcoxon signed-rank test is a statistical procedure used with two related samples. It assesses the differences between each data pair with regard to both direction and size.
For example, if we wanted to find out if students prefer pasta or salad served in the school cafeteria, we could run an experiment where on three consecutive days, we invite 20 students for lunch and observe how many of them chose pasta and how many chose the salad option. We end up with three pairs of data: On the first day, 18 students chose pasta and two chose salad; on the second day, 15 students chose pasta and four chose salad; on the third day, four students chose pasta and 16 chose salad. The test now calculates the differences between each data pair: On the first day, the difference is 18 – 2 = + 16; on the second day, the difference is 15 – 4 = + 11; on the third day, the difference is 4 – 16 = - 12. Then, the differences are sorted by their absolute size (ignoring the sign: 11, 12, 16) and assigned a rank (11 gets rank 1, 12 gets rank 2, 16 gets rank 3). The sum of the ranks of the positive differences (1 + 3 = 4) is then compared to that of the negative differences (2). The smaller of the two sums of ranks (2) is then compared against a critical value, which informs us whether it is statistically different from zero. If we find a statistically significant result, we can conclude that students have a preference for pasta over salad.
df
Df is an abbreviation for the term “degrees of freedom.” The degrees of freedom are an important piece of information for a statistical test, which describes the number of values in the analysis that are free to vary. It depends on how many values are considered (that means, how big the sample size is), and which statistical test is used.
null hypothesis
The null hypothesis is the assumption that a certain effect does not exist in reality, and that any observations of this effect in data is due to unsystematic error.
predictors
Predictors are variables that the researchers identified as potentially correlated with reproducibility.
exploratory analyses
An exploratory analysis is conducted in the absence of a specific hypothesis you would like to confirm with your study. They are used to explore the data; that is, to see what data patterns can be found, without trying to prove a specific point.
correlation coefficient (r)
A correlation coefficient describes the statistical relationship between two variables. It shows both the direction (positive coefficient: as A increases, B increases as well; negative coefficient: as A increases, B decreases), and the strength of the relationship (coefficient close to zero: weak relationship; coefficient close to +/- 1: strong relationship).
For example, there might be a positive correlation between years of attendance to school and general knowledge: the longer people have attended school, the more knowledge they acquire. On the other hand, there could be a negative correlation between hours spent watching TV and enjoyment of outdoor activities: the more time people spend watching TV, the less they might enjoy going for a hike.
Importantly, correlation coefficients do not tell us anything about causation.
generalizability
When we conduct a scientific study, it is often not possible to collect data from every person in the population in the exact situation we want to study. Instead, we often have only a sample of subjects, which we observe in a certain, typical situation. For example, if we want to study adherence to red lights in traffic, we cannot check if every human being will stop at every red light, when driving cars, riding a bike, walking, skateboarding, or using any other means of transportation. We could, however, test 200 pedestrians’ behavior at the traffic light in front of a university.
Generalizability refers to whether a study’s findings, given its own restricted circumstances, can be extended to make statements about what will be true for the population in general, and for similar situations. For example, imagine we want to study adherence to red lights in traffic by observing 200 pedestrians’ behavior at the traffic light in front of a university. Given that our sample size is small and not representative (because there are mostly students in front of a university, a very specific sample of people), and that the situation we observe is only one facet of participation in traffic (we ignore driving, cycling, skateboarding, etc.), we could not make very good statements about adherence to red lights in general.
sufficient
Sufficient conditions are one set of circumstances under which a specific effect can be found, but there could be many other circumstances under which the effect would occur.
For example, if a person asks you for money and you give it to them, asking for money is a sufficient condition. It's enough to make you give the person money. But there are other circumstances in which you would have done the same. For example, you may have given them money in exchange for a bouquet of flowers.
necessary
Necessary conditions are the circumstance that must be met in order to find a specific effect. If these conditions are not met, the effect cannot be found.
For example, to find the effect that prosocial people are more likely than selfish people to give change to someone asking for money, a necessary condition would be studying human subjects, not penguins.
predictors
A predictor (sometimes also called a predictor variable or an independent variable) is a variable that represents the potential reasons why we see a certain result.
For example, if we wanted to study which factors increase students’ performance in their final exams, we could consider a number of different potential reasons, or predictors, such as how often they did their homework during the past school year, how much time they spent reviewing the materials before the exam, or how well they slept the night before the exam.
random or systematic error
There are two sources of error which can occur in scientific studies and distort their results.
Systematic errors are inaccuracies that can be reproduced. For example, imagine we wanted to measure a participant’s weight and we make our participant step on five different scales and measure her weight on each scale 10 times. Four scales report that she weighs 74 kg each time she steps on them. The last scale shows that she weighs 23 kg each time she steps on it. We would say there is a systematic error involved in our study of her weight, because the last scale consistently and erroneously reports her weight as too low.
Random errors are inaccuracies that occur because there are unknown influences in the environment. For example, imagine we wanted to measure a participant’s weight and had her step on the same scale three times in a row, within one minute. The first time, the scale reports 74.43 kg, the second time 74.34 kg, the third time 74.38 kg. We don’t think that the participant's weight has actually changed in this 1 minute, yet our measurement shows different results, which we would attribute to random errors.
effect sizes
The strength of an effect.
statistically significant
Results are referred to as statistically significant when we find the result convincing because it is extremely unlikely that the observed effects are due to random chance.
Reproducibility
Reproducibility is a characteristic of a scientific study, stating that it can be run and run repeatedly, and will in its repetitions yield the same result.
If an experiment has been reproduced successfully, it has been conducted more than once with similar results each time. Subsequent studies are called reproducing studies, replication studies, or replications.
correlational
A study is referred to as correlational if it investigates if there is a relationship between two factors without assigning subjects to conditions manipulating a variable of interest. A causal interpretation (that changes in factor A cause changes in factor B) is not possible in correlational studies.
For example, if we wanted to study the influence of intelligence on students’ biology exam scores in a correlational study, we would first observe students’ intelligence via an IQ test, and then measure their score in the exam. Then we could judge if there was a positive relationship between IQ and exam score: Smarter students might be shown to score better on the test. However, since we did not manipulate students’ IQ to be high or low, we could not say that a higher IQ causes better test scores, only that the two variables are positively related.
fecund
Fecundity refers to the ability of an organism to produce offspring. If an organism is more fecund, this means it produces more offspring
brittle stars
Sea stars from the class Ophiuroidea. Brittle stars are named so for their fragile, thin arms.
Montastrea annularis
Montastraea annularis (now known as Orbicella annularis) is a species of coral that can grow into boulder-shaped heads. It is commonly known as boulder star coral.
polyps
Though corals may look like plants, they are actually animals. The basic body form of a coral is called a polyp, which has a mouth surrounded by tentacles. Colonial corals consist of many tiny interconnected polyps.
Diadema antillarum
Diadema antillarum is commonly known as the long-spined sea urchin. Before populations of D. antillarum died off in 1983 in massive numbers, they were a common sight in Caribbean reefs and played an important role in controlling the growth of macroalgae.
arborescent gorgonians
Gorgonians are part of a group of corals often called "soft corals" due to their lack of a rigid calcified skeleton. Arborescent means "treelike," referring to gorgonians that specifically have upright treelike forms.
Agraria spp.
Agaricia is a genus of corals that form flat leaf-like or plate-like structures. The "spp." means "multiple species of." So Agaricia spp. means "species of the genus Agaricia."
Acropora palmata
Acropora palmata is commonly known as Elkhorn coral for its antlerlike appearance. As a result of its complex 3D shape, A. palmata adds significant structure to coral reefs and forms an important habitat for many other marine organisms.
Parafilm
primarily used in laboratories. It is commonly used for sealing or protecting vessels (such as flasks or cuvettes). It is a ductile, malleable, waterproof, odorless, translucent and cohesive thermoplastic.
-Mikaela
maneuverability
the quality of being able to sail close to the wind with little drift to the leeward.
-Mikaela
deviation
the amount by which a single measurement differs from a fixed value such as the mean.
-Mikaela
anaerobic
Relating to, involving, or requiring an absence of free oxygen. -Mikaela
pelagic
Of or relating to the open sea. -Mikaela
accelerometry
use of a accelerometer to quantify movement -Kyrsten
propulsive
creating force to result in movement -Kyrsten
post hoc
occurs after the event -Kyrsten
thermocouple
sensor used to record temperature -Kyrsten
microstimulation
A technique that stimulates a small population of neurons by passing an electrical current through a nearby microelectrode.
Deep-layer trunk cortex
The cortex is divided into layers from the surface of the brain inward. The deep-layer levels of the trunk cortex are closer the the center of the brain.
Diagram of the cortical layers of a human brain: https://www.ncbi.nlm.nih.gov/books/NBK10870/figure/A1798/
somatosensory cortex
The part of the brain that detects touch happening in certain places in the body.
The trunk region of the somatosensory cortex specifically activates when the trunk, or the main body, of the rat is stimulated.
Diagram of the human somatosensory cortex: https://www.ncbi.nlm.nih.gov/books/NBK11153/figure/A641/?report=objectonly
active prostheses
Prostheses are an artificial part of a body. It can play an unconscious or conscious role in the body. For example, a titanium leg can replace a leg and adapt itself to the host walking patterns.
The double-reversal validation test
Double-reversal validation test tries to define and remove bias in the data. For example, consider a natural factor that could remove one parameter, and ask if you should counter this evolution to keep the status quo. If so, consider when the natural factor is about to vanish and ask if it is a good thing to act again to reverse the first intervention you made. If not, it is preferable to think that the first intervention is usefull even in the absence of the natural factor.
(CMA-ES)
Evolution strategy (ES) is an optimisation technique based on the principle of evolution. The Covariance Matrix Adaptation (CMA) is one method that proved itself to be one of the more effective by recalculate at each iteration the Covariance matrix of the distribution.
transient metabolic data
Transient represents a small time interval, which is the case for the metabolic data represented.
first-order dynamical model
Such a model is based on a first order differential equation (ODE). An ODE represents the slope at one time point, rather than between two time points.
Exoskeletons
An exoskeleton refers to a skeleton outside the body - or external skeleton. It has a role of protection in addition to the support role of the internal skeleton. It is commonly found in the insect kingdom.
quadratic approximations
In Mathematics, approximation means a function can be estimated by a simpler function. The quadratic approximation makes use of the second derivative of the function of interest.
physiological
Physiology is a fiel of study that focus on the interactions between different systems inside one organism and their normal mechanism.
motor learning
Motor learning is the change of response or performence one can do after a new experience or training.
biomechanics observations
Biomechanics observations focuses on the motions and forces in actions while the body is moving.
customization
Customization consists of addapting a devise in regard of the differences between individuals. This for a better accomodation.
benchmarking problems
Benchmark problem is a way to compare several algorithms to check wich one is the more efficient to solve a problem.
parametric interactions
parametric interaction is the way parameters interact or influence each other.
time-varying dynamics
The dynamic of a system is how this system will evolve with time. Time-varying means here that the system will have different patterns according to the time it was recorded.
human locomotor performance
Locomotor performances are the variety of movements a human can do related to the energy needed for such a movement.
torque patterns
Torque represents a rotational force. It can be seen as the twist of an object.
nervous systems
The nervous system is responsible for the coordination of body by sending signals to the other organ systems.
Soleus
A major muscle in the calf.
RT-PCR
Reverse transcriptase polymerase chain reaction is a variation of polymerase chain reaction (PCR). RT-PCR begins with an "extra" step in which RNA is reverse transcribed into its DNA complement and then amplified using traditional PCR.
It is commonly used to analyze the expression patterns of infections and diseases.
domestic cat
An indoor feline that doesn't need to be distinguished from other felids.
inertia
Inertia is a Newtonian law of motion that describes the tendency of matter to be in an unchanging state of motion when not acted upon by external forces. This could either be an object moving along a trajectory or stationary.
conserved
Conservation in evolution refers to a trait of a species that remains unchanged over generations. It is maintained and passed down to the next generation because it is usually essential and helps the organism to survive.
hydrophilic
Hydro refers to water. Phylic refers to member of the same group.
Hydrophylic is a substance that is attracted and mixes well with water.
electromotor
This usually term refers to a machine that is able to produce electricity in order to produce motion. For electric fish and similar organisms , it means their organs have the ability to produce electricity , that is used to produce movement.- Michelle Gomez-Guevara
electrosensory
The ability of the nervous system if certain organisms to sense electrical impulses in their environment . It's similar to when a person uses their nose to smell a certain scent or odor in the proximity ; in this case the electric fish are able to use their organs to sense electrical pulses nearby. - Michelle Gomez-Guevara
Calliphoridae
Calliphoridae is the scientific name for "blow flies". -Jake Barbee
truncated
To truncate something means to cut off a piece of in order to shorten it. In this case the SXL and TRA proteins have been cut short. - Jake Barbee
Drosophila melanogaster
Drosophila melanogaster is the scientific name for the common fruit fly. -Jake Barbee
cascade
Cascade is a series of events that occur subsequently to one another. -Jake Barbee
deleterious pleiotropic effects
You can break this down into two main parts: deleterious, and pleiotropic. "Deleterious" meaning something that is harmful or causes damage, while "pleiotropic" means one gene is adversely affecting other phenotypic traits . In this way we can conclude that a "deleterious pleiotropic effect" is when one gene causes harm or damage to phenotypic traits. -Jake Barbee
pristine
It is a paleontological term which describes earliest period or states of life before human impact. YS
inverted biomass pyramid
A biomass pyramid where there is a larger biomass of larger predator species and a smaller biomass of smaller, prey species. - M.A.S.
bioenergetics
Is the study of the energy conversion within an organism's metabolism. -MSars
cryptic
Camouflaged or otherwise hidden (e.g. in a crevice).
hydrocoral Millepora spp.
A hydrocoral looks like a coral, but is actually in the class Hydrozoa rather than the class Anthozoa, like true corals. Millepora hydrocorals are also known as fire corals due to their painful sting.
The advantage of flexibility was evident among gorgonian branches encrusted
Millepora hydrocorals can detect nearby gorgonians and attack them by growing on top of them.
significant at P < .001, Mann-Whitney U test
The Mann-Whitney U test is a statistical test used when values are not normally distributed. Here, it is used to compare live tissue coverage before and after the hurricane. The P-value of less than 0.001 indicates that there was a statistically significant difference between the two groups (a P-value of less than 0.05 is commonly accepted as statistically significant under convention).
Fore Reef
The fore reef is the ocean-facing section of a reef, seaward of the reef flat.
reef flat
The flat, shallowest part of a coral reef.
natural experiment
When natural events (i.e. fires, hurricanes, or other disturbances) happen to only some areas, scientists can study the effects by comparing affected and unaffected sites.
This is a natural experiment.
community composition
A community is a group of interacting organisms that live in the same location. Community composition is the makeup of a community.
Coral reefs
Corals are a group of colonial marine animals that form hard calcium skeletons. They have stinging cells that can be used to catch and kill small prey, but they also often carry symbiotic algae inside that they can use to convert sunlight into cellular energy.
When corals live together in large groups, they can form a buildup of sediment and minerals in the ocean called a reef. The complex structures of reefs create habitats for many other ocean animals.
geographic centroids of the alleles
In this study the geographic centroid of an allele is the average location calculated from every location where the allele is present. Such that if an allele is most abundant in Portugal than its geographic centroid will be in Portugal.
fecundity
A measurement of the reproductive rate of an organism. In this research it is measured as the number of siliques.
ecotypes
A term for plants derived from a geographically distinct population.
latitude
A geographic coordinate that specifies the north-south position of a location.
continental
A location far from the coast, such as the site in Germany.
Mediterranean
In southern Europe, Mediterranean environments are characterized by rainy winters and hot summers.
Nordic
Northern Europe where the climate is generally much colder and sees more snow than southern Europe.
transcription factor
A protein that can bind to DNA to alter the expression of genes.
genetic architecture
The set of genes that create characteristics in the organism. In this case the genes that are involved in local adaptation.
viability
A measurement of how many seeds are able to develop into adult plants that are capable of reproduction
heritable variation
Heritability is a measurement of how much variation in a trait is caused by genetic factors, rather than environmental factors. Heritable variation occurs in a population when the influence of genetic factors on a trait differs between individuals.
silique
The fruit of the Arabidopsis plant where the seed is stored
selection
Environmental pressures result in individuals with certain characteristics reproducing more than others. This results in these individuals genes becoming more common in the population. This is the process of evolution.
molecular functions
The actions of cellular components such as DNA and proteins.
climate spaces
An area of the environment that is suitable for a particular population to survive.
alleles
A variation of a gene. Most multi-cellular organisms, including Arabidopsis, have duplicated chromosomes meaning that every gene is present twice in the genome and hence may have two variations of a gene.
fitness
This evolutionary term describes how successful an organism is at reproducing and passing its genes through the next generations. Factors such as lifespan and percentage of offspring that survive contribute to this.
genome-wide association study
This method searches for small variations in the genomes of a large population and investigates whether these variations are associated with certain characteristics. This helps researchers identify which genes might control traits in an organism. The method is used in a large variety of research including human and plant science.
candidate loci
Locations in the genome that contain genes with functions of interest, in this case this is genes that been involved in local adaptation.
Arabidopsis thaliana
Commonly called thale cress, this plant is a small flower that is a weed in the wild but is a very popular model organism used in plant science research.
genetic basis
The genes that become locally adapted.
Local adaptation
Local adaptation occurs when a population that is spatially separate from others of its species faces selective pressures unique to its environment. Therefore, the population evolves to be best suited to its local environment.