2,729 Matching Annotations
  1. Jan 2024
    1. Author Response

      Reviewer #1 (Public Review):

      This paper combines a number of cutting-edge approaches to explore the role of a specific mouse retinal ganglion cell type in visual function. The approaches used include calcium imaging to measure responses of RGC populations to a collection of visual stimuli and CNNs to predict the stimuli that maximally activate a given ganglion cell type. The predictions about feature selectivity are tested and used to generate a hypothesized role in visual function for the RGC type identified as interesting. The paper is impressive; my comments are all related to how the work is presented.

      We thank the reviewer for appreciating our study and for the interesting comments.

      Is the MEI approach needed to identify these cells?

      To briefly summarize the approach, the paper fits a CNN to the measured responses to a range of stimuli, extracts the stimulus (over time, space, and color) that is predicted to produce a maximal response for each RGC type, and then uses these MEIs to investigate coding. This reveals that G28 shows strong selectivity for its own MEI over those of other RGC types. The feature of the G28 responses that differentiate it appears to be its spatially-coextensive chromatic opponency. This distinguishing feature, however, should be relatively easy to discover using more standard approaches.

      The concern here is that the paper could be read as indicating that standard approaches to characterizing feature selectivity do not work and that the MEI/CNN approach is superior. There may be reasons why the latter is true that I missed or were not spelled out clearly. I do think the MEI/CNN approach as used in the paper provides a very nice way to compare feature selectivity across RGC types - and that it seems very well suited in this context. But it is less clear that it is needed for the initial identification of the distinguished response features of the different RGC types. What would be helpful for me, and I suspect for many readers, is a more nuanced and detailed description of where the challenges arise in standard feature identification approaches and where the MEI/CNN approaches help overcome those challenges.

      Thank you for the opportunity for clarification. In fact, the MEI (or an alternative nonlinear approach) is strictly necessary to discover this selectivity: as we show above (response #1 to editorial summary), the traditional linear filter approach does not reveal the color opponency. We realize that this fact was not made sufficiently clear in the initial submission. In the revised manuscript, we now include this analysis. Moreover, throughout the manuscript, we added explanations on the differences between MEIs and standard approaches and more intuitions about how to interpret MEIs. We also added a section to the discussion dedicated to explaining the advantages and limitations of the MEI approach.

      Interpretation of MEI temporal structure

      Some aspects of the extracted MEIs look quite close to those that would be expected from more standard measurements of spatial and temporal filtering. Others - most notably some of the temporal filters - do not. In many of the cells, the temporal filters oscillate much more than linear filters estimated from the same cells. In some instances, this temporal structure appears to vary considerably across cells of the same type (Fig. S2). These issues - both the unusual temporal properties of the MEIs and the heterogeneity across RGCs of the same type - need to be discussed in more detail. Related to this point, it would be nice to understand how much of the difference in responses to MEIs in Figure 4d is from differences in space, time, or chromatic properties. Can you mix and match MEI components to get an estimate of that? This is particularly relevant since G28 responds quite well to the G24 MEI.

      One advantage of the MEI approach is that it allows to distinguish between transient and sustained cells in a way that is not possible with the linear filter approach: Because we seek to maximize activity over an extended period of time, transient cells need to be repetitively stimulated whereas sustained cells will also respond in the absence of multiple contrast changes. In the revised manuscript, we add a section explaining this, together with Figure 3-supplement 2, illustrating this point by showing that oscillations disappear when we optimize the MEI for a short time window. The benefit of a longer time window lies in the increased discriminability between transient and sustained cells, which is also shown in the new supplementary figure.

      Regarding the heterogeneity of MEIs, this is most likely due to heterogeneity within the RGC group: “The mixed non-direction-selective groups G17 and G31 probably contain more than one type, as supported by multiple distinct morphologies and genetic identities (for example, G31,32, Extended Data Fig. 5) or response properties (for example, G17, see below)” (Baden et al. Nature 2016). We added a paragraph in the Results section.

      Concerning the reviewer’s last point: We agree that it is important to know whether the defining feature - i.e., the selectivity for chromatic contrast - is robust against variations in other stimulus properties. New electrophysiological data included in the manuscript (Fig. 6e,f) offers some insights here. We probed G28/tSbC cells with full-field flashed stimuli that varied in chromatic contrast. Despite not matching the cell’s preferred spatial and temporal properties, this stimulus still recovered the cell’s preference for chromatic contrast. While we think it is an interesting direction to systematically quantify the relative importance of temporal, spatial and chromatic MEI properties for an RGC type’s responses, we think this is beyond the scope of this manuscript.

      Explanation of RDM analysis

      I really struggled with the analysis in Figure 5b-c. After reading the text several times, this is what I think is happening. Starting with a given RGC type (#20 in Figure 5b), you take the response of each cell in that group to the MEI of each RGC type, and plot those responses in a space where the axes correspond to responses of each RGC of this type. Then you measure euclidean distance between the responses to a pair of MEIs and collect those distances in the RDM matrix. Whether correct or not, this took some time to arrive at and meant filling in some missing pieces in the text. That section should be expanded considerably.

      We appreciate the reviewer’s efforts to understand this analysis and confirm that they interpreted it correctly. However, we decided to remove the analysis. The point we were trying to make with this analysis is that the transformation implemented by G28/tSbC cells “warps” stimulus space and increases the discriminability of stimuli with similar characteristics like the cell’s MEI. We now make this point in a - we think - more accessible manner by the new analysis about the nonlinearity of G28/tSbC cell’s color opponency (see above).

      Centering of MEIs

      How important is the lack of precise centering of the MEIs when you present them? It would be helpful to have some idea about that - either from direct experiments or using a model.

      In the electrophysiological experiments, the MEIs were centered precisely (now Fig. 5 in revised manuscript) and these experiments yielded almost identical results to the 2P imaging experiments, where the MEIs were presented on a grid to approach the optimal position for the recorded cells. Additionally, all model simulations work with perfectly centered MEIs. We hence conclude that our grid-approach at presenting stimuli provided sufficient precision in stimulus positioning.

      We added this information to the revised manuscript.

      Reviewer #2 (Public Review):

      This paper uses two-photon imaging of mouse ganglion cells responding to chromatic natural scenes along with convolutional neural network (CNN) models fit to the responses of a large set of ganglion cells. The authors analyze CNN models to find the most effective input (MEI) for each ganglion cell as a novel approach to identifying ethological function. From these MEIs they identify chromatic opponent ganglion cells, and then further perform experiments with natural stimuli to interpret the ethological function of those cells. They conclude that a type of chromatic opponent ganglion cell is useful for the detection of the transition from the ground to the sky across the horizon. The experimental techniques, data, and fitting of CNN models are all high quality. However, there are conceptual difficulties with both the use of MEIs to draw conclusions about neural function and the ethological interpretations of experiments and data analyses, as well as a lack of comparison with standard approaches. These bear directly both on the primary conclusions of the paper and on the utility of the new approaches.

      We thank the reviewer for the detailed comments.

      1) Claim of feature detection.

      The color opponent cells are cast as a "feature detector" and the term 'detector' is in the title. However insufficient evidence is given for this, and it seems likely a mischaracterization. An example of a ganglion cell that might qualify as a feature detector is the W3 ganglion cell (Zhang et al., 2012). These cells are mostly silent and only fire if there is differential motion on a mostly featureless background. Although this previous work does not conduct a ROC analysis, the combination of strong nonlinearity and strong selectivity are important here, giving good qualitative support for these cells as participating in the function of detecting differential motion against the sky. In the present case, the color opponent cells respond to many stimuli, not just transitions across the horizon. In addition, for the receiver operator characteristic (ROC) analysis as to whether these cells can discriminate transitions across the horizon, the area under the curve (AUC) is on average 0.68. Although there is not a particular AUC threshold for a detector or diagnostic test to have good discrimination, a value of 0.5 is chance, and values between 0.5 and 0.7 are considered poor discrimination, 'not much better than a coin toss' (Applied Logistic Regression, Hosmer et al., 2013, p. 177). The data in Fig. 6F is also more consistent with a general chromatic opponent cell that is not highly selective. These cells may contribute information to the problem of discriminating sky from ground, but also to many other ethologically relevant visual determinations. Characterizing them as feature detectors seems inappropriate and may distract from other functional roles, although they may participate in feature detection performed at a higher level in the brain.

      The reviewer apparently uses a rather narrow definition of a feature detector. We, however, argue for a broader definition, which, in our view, better captures the selectivities described for RGCs in the literature. For example, while W3 cells have been quite extensively studied, one can probably agree on that so far only a fraction of the possible stimulus space has been explored. Therefore, it cannot be excluded that W3 cells respond also to other features than small dark moving dots, but we (like the reviewer) still refer to it as a feature detector. Or, for instance, direction-selective (DS) RGCs are commonly considered feature detectors (i.e., responsive to a specific motion direction), although they also respond to flashes and spike when null-direction motion is paused (Barlow & Levick J Physiol 1965).

      The G28/tSbC cells’ selectivity for full-field changes in chromatic contrast enables them to encode ground-sky horizon transitions reliably across stimulus parameters (e.g., see new Fig. 7i panel). This cell type is thus well-suited to contribute to detecting context changes, as elicited by ground-sky transitions.

      Therefore, we think that the G28/tSbC RGC can be considered a feature detector and as such, could be used at a higher level in the brain to quickly detect changes in visual context (see also Kerschensteiner Annu Rev Vis Sci 2022). Still, their signals may also be useful for other computations (e.g., defocus, as discussed in our manuscript).

      Regarding the ROC analysis, we acknowledge that an average AUC of .68 may seem comparatively low; however, this is based on the temporally downsampled information (i.e., by way of Ca2+ imaging) gathered from the activity of a single cell. A downstream area would have access to the activity of a local population of cells. This AUC value should therefore be considered a lower bound on the discrimination performance of a downstream area. We now comment on this in the manuscript.

      2) Appropriateness of MEI analysis for interpretations of the neural code.

      There is a fundamental incompatibility between the need to characterize a system with a complex nonlinear CNN and then characterizing cells with a single MEI. MEIs represent the peak in a complex landscape of a nonlinear function, and that peak may or may not occur under natural conditions. For example, MEIs do not account for On-Off cells, On-Off direction selectivity, nonlinear subunits, object motion sensitivity, and many other nonlinear cell properties where multiple visual features are combined. MEIs may be a useful tool for clustering and distinguishing cells, but there is not a compelling reason to think that they are representative of cell function. This is an open question, and thus it should not be assumed as a foundation for the study. This paper potentially speaks to this issue, but there is more work to support the usefulness of the approach. Neural networks enable a large set of analyses to understand complex nonlinear effects in a neural code, and it is well understood that the single-feature approach is inadequate for a full understanding of sensory coding. A great concern is that the message that the MEI is the most important representative statistic directs the field away from the primary promise of the analysis of neural networks and takes us back to the days when only a single sensory feature is appreciated, now the MEI instead of the linear receptive field. It is appropriate to use MEI analyses to create hypotheses for further experimental testing, and the paper does this (and states as much) but it further takes the point of view that the MEI is generally informative as the single best summary of the neural code. The representation similarity analysis (Fig. 5) acts on the unfounded assumption that MEIs are generally representative and conveys this point of view, but it is not clear whether anything useful can be drawn from this analysis, and therefore this analysis does not support the conclusions about changes in the representational space. Overall this figure detracts from the paper and can safely be removed. In addition, in going from MEI analysis to testing ethological function, it should be made much more clear that MEIs may not generally be representative of the neural code, especially when nonlinearities are present that require the use of more complex models such as CNNs, and thus testing with other stimuli are required.

      The reviewer correctly characterizes MEIs as representing the peak in a nonlinear loss landscape that, in this case, describes the neurons’ tuning. As such, the MEI approach is indeed capable of characterizing nonlinear neuronal feature selectivities that are captured by a nonlinear model, such as the CNN we used here. We therefore disagree with the suggestion that MEIs should not be used “when nonlinearities are present that require the use of more complex models such as CNNs”. It is unclear what other “analysis of neural networks” the reviewer refers to. One approach to analyze the predictive neural network are MEIs.

      We also want to clarify that, while the reviewer is correct in stating that the MEI approach as used here only identifies a single peak, this does not mean that it cannot capture neuronal selectivities for a combination of features, as long as this combination of features can be described as a point in high-dimensional stimulus space. In fact, this is demonstrated in our manuscript for the case of G28/tSbC cell’s selectivity for large or full-field, sustained changes in chromatic contrast (a combination of spatial, temporal, and chromatic features). While approaches similar to the one used here generate several diverse exciting inputs (Ding et al. bioRxiv 2023) and could therefore also fully capture On-Off selectivities, we pointed out the limitation of MEIs when describing On-Off cells in the manuscript (both original and revised).

      Regarding the reviewer’s concern that “[...] the message that the MEI is the most important representative statistic [...] takes us back to the days when only a single sensory feature is appreciated”. It was certainly not our intention to proclaim MEIs as the ultimate representation of a cell’s response features and we have clarified this in the revised manuscript. However, we also think that (i) in applying a nonlinear method to extract chromatic, temporal, and spatial response properties from natural movie responses, we go beyond many characterizations that use linear methods to extract spatial or temporal only, achromatic response properties from static, white-noise stimuli. This said, we agree that (ii) expanding around the peak is desirable, and we do that in an additional analysis (new Fig. 6); but that reducing complexity to a manageable degree (at least, at first) is useful and even necessary when discovering novel response properties.

      Concerning the representational similarity analysis (RSA): the point we were trying to make with this analysis is that the transformation implemented by G28 “warps” stimulus space and increases the discriminability of stimuli with similar characteristics like the cell’s MEI. We now made this point in a more accessible fashion through the above-mentioned analysis, where we extended the estimate around the peak. We therefore agree to remove the RSA from the paper.

      In the revised manuscript, we (a) discuss the advantages and limitations of the MEI approach in more detail (in Results and Discussion; see also our reply #1) and (b) replaced the RSA analysis.

      3) Usefulness of MEI approach over alternatives. It is claimed that analyzing the MEI is a useful approach to discovering novel neural coding properties, but to show the usefulness of a new tool, it is important to compare results to the traditional technique. The more standard approach would be to analyze the linear receptive field, which would usually come from the STA of white noise measurement, but here this could come from the linear (or linear-nonlinear) model fit to the natural scene response, or by computing an average linear filter from the natural scene model. It is important to assess whether the same conclusion about color opponency can come from this standard approach using the linear feature (average effective input), and whether the MEIs are qualitatively different from the linear feature. The linear feature should thus be compared to MEIs for Fig. 3 and 4, and the linear feature should be compared with the effects of natural stimuli in terms of chromatic contrast (Fig. 6b). With respect to the representation analysis (Fig. 5), although I don't believe this is meaningful for MEIs, if this analysis remains it should also be compared to a representation analysis using the linear feature. In fact, a representation analysis would be more meaningful when performed using the average linear feature as it summarizes a wider range of stimuli, although the most meaningful analysis would be directly on a broader range of responses, which is what is usually done.

      We agree that the comparison with a linear model is an important validation. Therefore, we performed an additional analysis (see also reply #1, as well as Fig. 6 and corresponding section in the manuscript) which demonstrates that an LN model does not recover the chromatic feature selectivity. This finding supports our claims about the usefulness of the MEI approach over linear approaches.

      Regarding the comment on the representation analysis, as mentioned above, we consider it replaced by the analysis comparing results from an LN model and a nonlinear CNN.

      4) Definition of ethological problem. The ethological problem posed here is the detection of the horizon. The stimuli used do not appear to relate to this problem as they do not include the horizon and only include transitions across the horizon. It is not clear whether these stimuli would ever occur with reasonable frequency, as they would only occur with large vertical saccades, which are less common in mice. More common would be smooth transitions across the horizon, or smaller movements with the horizon present in the image. In this case, cells which have a spatial chromatic opponency (which the authors claim are distinct from the ones studied here) would likely be more important for use in chromatic edge detection or discrimination. Therefore the ethological relevance of any of these analyses remains in question.

      It is further not clear if detection is even the correct problem to consider. The horizon is always present, but the problem is to determine its location, a conclusion that will likely come from a population of cells. This is a distinct problem from detecting a small object, such as a small object against the background of the sky, which may be a more relevant problem to consider.

      Thank you for giving us the opportunity to clear these things up. First, we would like to clarify that we propose that G28/tSbC cells contribute to detecting context changes, such as transitions across the horizon from ground to sky, not to detecting the horizon itself. We acknowledge that we were not clear enough about this in the manuscript and corrected this. To back-up our hypothesis that G28 RGCs contribute to detecting context changes, we performed an additional simulation analysis, which is described in our reply #3 (see above).

      5) Difference in cell type from those previously described. It is claimed that the chromatic opponent cells are different from those previously described based on the MEI analysis, but we cannot conclude this because previous work did not perform an MEI analysis. An analysis should be used that is comparable to previous work, the linear spatiotemporal receptive field should be sufficient. However, there is a concern that because linear features can change with stimulus statistics (Hosoya et al., 2005), a linear feature fit to natural scenes may be different than those from previous studies even for the same cell type. The best approach would likely be presenting a white noise stimulus to the natural scenes model to compute a linear feature, which still carries the assumption that this linear feature from the model fit to a natural stimulus would be comparable to previous studies. If the previous cells have spatial chromatic opponency and the current cells only have chromatic opponency in the center, there should be both types of cells in the current data set. One technical aspect relating to this is that MEIs were space-time separable. Because the center and surround have a different time course, enforcing this separability may suppress sensitivity in the surround. Therefore, it would likely be better if this separability were not enforced in determining whether the current cells are different than previously described cells. As to whether these cells are actually different than those previously described, the authors should consider the following uncited work; (Ekesten Gouras, 2005), which identified chromatic opponent cells in mice in approximate numbers to those here (~ 2%). In addition, (Yin et al., 2009) in guinea pigs and (Michael, 1968) in ground squirrels found color-opponent ganglion cells without effects of a spatial surround as described in the current study.

      First of all, we did not intend to claim to have discovered a completely new type of color-opponent tuning in general; what we were trying to say is that tSbC cells display spatially co-extensive color opponency, a feature selectivity previously not described in this mouse RGC type, and which may be used to signal context changes as elicited by ground-sky transitions.

      Concerning the reviewer’s first argument about a lack of comparability of our results to results previously obtained with a different approach: We think that this is now addressed by the new analysis (new Fig. 6), where we show why linear methods are limited in their capability to recover the type of color opponency that we discovered with the MEI approach.

      Regarding the argument about center-surround opponency, we agree that “if the previous cells have spatial chromatic opponency and the current cells only have chromatic opponency in the center, there should be both types of cells in the current data set”. We did not focus on analyzing center-surround opponency in the present study, but from the MEIs, it is visible that many cells have a stronger antagonistic surround in the green channel compared to the UV channel (see Fig. 4a, example RGCs of G21, G23, G24; Figure 3-supplement 1 example RGCs of G21, G23, G24, G31, G32). Importantly, the MEIs shown in Fig. 4a were also shown in the verification experiment, and had G28 RGCs preferred this kind of stimulus, they would have responded preferentially to these MEIs, which was not the case (Fig. 4f).

      It should also be noted here that, while the model’s filters were space-time separable, we did not impose a restriction on the MEIs to be space-time separable during optimization. However, we analyzed only the rank 1 components of the MEIs (see Methods section Validating MEIs experimentally). since our analysis focused on aspects of retinal processing not contingent on spatiotemporal interactions in the stimulus.

      In summary, we are convinced that our finding of center-opponency in G28 is not an artifact of the methodology.

      We discuss this in the manuscript and add the references mentioned by the reviewer to the respective part of the Discussion.

      Reviewer #3 (Public Review):

      This study aims to discover ethologically relevant feature selectivity of mouse retinal ganglion cells. The authors took an innovative approach that uses large-scale calcium imaging data from retinal ganglion cells stimulated with both artificial and natural visual stimuli to train a convolutional neural network (CNN) model. The resulting CNN model is able to predict stimuli that maximally excite individual ganglion cell types.

      The authors discovered that modeling suggests that the "transient suppressed-by-contrast" ganglion cells are selectively responsive to Green-Off, UV-On contrasts, a feature that signals the transition from the ground to the sky when the animal explores the visual environment. They tested this hypothesis by measuring the responses of these suppressed-by-contrast cells to natural movies, and showed that these cells are preferentially activated by frames containing ground-to-sky transitions and exhibit the highest selectivity of this feature among all ganglion cell types. They further verified this novel feature selectivity by single-cell patch clamp recording.

      This work is of high impact because it establishes a new paradigm for studying feature selectivity in visual neurons. The data and analysis are of high quality and rigor, and the results are convincing. Overall, this is a timely study that leverages rapidly developing AI tools to tackle the complexity of both natural stimuli and neuronal responses and provides new insights into sensory processing.

      We thank the reviewer for appreciating our study.

    1. Author Response

      Reviewer #3 (Public Review):

      This manuscript uses ASO to inhibit the self-cleaving ribozyme within CPEB intron 3 and test its effect on CPEB3 expression and memory consolidation. The authors conclude that the intronic ribozyme negatively affects CPEB3 mRNA splicing and expression, and suggests its implications for experience-induced gene expression underlying learning and memory.

      The strength of the manuscript is in its exploration of a potentially novel mechanism of regulating CPEB3 expression in learning and memory, a combination of both biochemical and behavioral approaches to gain a wide perspective of this regulatory mechanism, and the application of ASO in this context. The introduction is sufficiently detailed. Statistics are thorough and appropriate. If the results could be more robust, the mechanism would provide a novel target and venue to modify learning and memory paradigm.

      The weakness of the manuscript is that the magnitude of the activity-dependent regulation of ribozyme, the effects of ASOs on CPEB3 expression (mRNA and protein) and downstream target gene expression, in vitro and in vivo, are generally weak, raising concerns about the robustness of the result. This may have caused some of the inconsistencies between the data presentation (see below). Also unclear is whether the ribozyme activity is physiologically regulated by experience without ASO interference.

      While the statistics tests support corresponding figure panels and their conclusions. The manuscript can be significantly strengthened by additional evidence, clarification of some methodologies, and reconciling some inconsistent results.

      The premise of a comparable timescale between transcription and ribozyme activity as the foundation of the whole thesis was based on in vitro measurement of self-scission half-life and a broadly generalized transcription rate (which actually varies significantly between genes). This premise is weak and needs direct experimental support.

      The physiological relevance of the proposed mechanism has yet to be demonstrated without ASO interference.

      Fig2b: how were total and uncleaved Ribozymes measured by qRT-PCR? Where are the primers' locations? If the two products were amplified using different primers, their subtraction to derive % cleavage would not be appropriate.

      We thank the reviewer for the thoughtful review. We measured the levels of the total ribozyme by measuring a 220-bp amplicon that starts 18 nts downstream from the ribozyme cleavage site. The uncleaved ribozyme levels were measured using oligos that amplify a region of the intron that starts 45 nts upstream and ends 238 nts downstream of the ribozyme cleavage site. We added this information to the Table of primers in the manuscript. For all PCR oligos we established independent standard curves and calculated RNA levels independently of other amplicons, as noted in the Methods section and now specified in the Results section as well (Page 15). The measurements were thus appropriate for the calculation of the cleaved ribozyme fractions in the various experiments. The fraction ribozyme cleaved was calculated from the uncleaved fraction as the difference between uncleaved fraction and unity (1 – fraction uncleaved), now specified on page 16 of the manuscript. Fraction uncleaved was calculated as [uncleaved ribozyme]/[total ribozyme], as was done previously (see Salehi-Ashtiani et al. Science 313:1788-1792 or Webb et al. Science 326:953).

      Line 400-403: shouldn't ribozyme-blocking ASO prevent ribozyme self-cleavage, and as a result should further increase ribozyme levels? This would contradict the result in fig3a.

      We showed that the ribozyme is inhibited in vitro (Fig. 1F and 1G) and all our data are consistent with ASO inhibition of the ribozyme in cellulo and in vivo. However, we do not have direct evidence for this ribozyme inhibition in vivo, because such an experiment would require a single-molecule FRET-type sensitivity in cells and this assay has not been developed for ribozyme cleavage in cellulo or in vivo. We measured the ribozyme levels by RT-qPCR and observed lower ribozyme levels in presence of ASO in cultured neurons (Fig. 3A) as well as in vivo (Fig. 5B), which is nominally in contrast to the observations in vitro. However, in these situations we do not measure the co-transcriptional fate of the intron or the ribozyme; rather, we measure the levels of the intron after splicing (evidenced by the increased levels of spliced exons 2–3) when the intron is likely already being degraded. We also do not know what effect the ribozyme ASO has on the intron stability once splicing occurs. Understandably, this is a weakness of the study—and we are fully open about this result— however, given the abundance of evidence that the ribozyme ASO leads to increase of CPEB3 mRNA under all conditions tested, we feel that there is strong, if indirect, evidence that our model for the ribozyme function is correct. Future studies will examine this issue closer, but a definitive experimental investigation for the mechanism and timing of ribozyme inhibition and intron degradation is out of scope of this study.

    1. Author Response

      The following is the authors’ response to the original reviews.

      Reviewer 1 (Public Review):

      Weakness: Although the cross-links stimulate ATP hydrolysis, further controls are needed to convince me that the TM1 conformations observed in the structures are physiologically relevant, since they have been trapped by "large" substrates covalently-tethered by crosslinks.

      Our response: Reviewer 1 raised concerns about the relatively large size of our covalently attached AAC substrate that would potentially distort TM1 in Pgp. We would like to clarify that AAC has a molecular weight of 462 Da, which, in comparison to many known Pgp substrates ranging from 250 to over 1,000 Da, is not a large compound. For instance, the few other Pgp substrates mentioned in our manuscript all have a comparable or larger size: verapamil, 455 Da; doxorubicin, 544 Da; FK506, 804 Da; valinomycin, 1,111 Da; cyclosporin A, 1,203 Da.

      Furthermore, AAC was strategically attached to a site distant from TM1 in the inwardfacing Pgp conformation. After it was exported to the outward-facing state, several TM helices accommodate the compound. The observation that only TM1 exhibited significant conformational changes suggests its potential role in the transport mechanism. This hypothesis is supported by our findings, where a conservative substitution (G72A) in TM1 resulted in a dramatic loss of transport function for various drug substrates and impaired verapamil-stimulated ATPase activity.

      Reviewer 1 (Recommendations for the Authors):

      I understand the need for an unconventional approach to understanding the translocation pathway. What would help to support this model is to cross-link a much smaller substrate, as the one used is quite large and could potentially distort TM1 in the outward-state when cross-linked.

      Our response: We thank the reviewer for this recommendation, and we have outlined plans for future experiments involving other substrates, including smaller ones, to further investigate our proposed model. However, it is important to acknowledge that conducting these studies will require a significant amount of effort and resources, which we believe extend beyond the scope of our current manuscript.

      In unbiased MD simulations starting from the IF state are there any simulations where the substrate follows the same path as proposed here?

      Our response: All our MD simulations were performed in the outward-facing state to focus on potential substrate release pathways. Starting MD simulations from the inwardfacing state would introduce complexities in capturing the necessary domain motions and nucleotide binding and hydrolysis required for substrate translocations. Therefore, we opted not to perform MD studies starting from the inward-facing state.

      Reviewer 2 (Public Review):

      Weakness: There is much to like about the experimental work here but I am less sanguine on the interpretation. The main idea is to covalently link via disulfide bonds a model tripeptide substrate under different conditions that mimic transport and then image the resulting conformations. The choice of the Pgp cysteine mutants here is critical but also poses questions regarding the interpretation. What seems to be missing, or not reported, is a series of control experiments for further cysteine mutations.

      Our response: Reviewer 2 raised concerns about the interpretation of our results and suggested the need for additional mutant designs to validate our proposed TM1 mechanism. Firstly, we believe that the observed TM1 conformational changes are valid in our cryoEM structures, despite the use of different conditions and several mutants to capture Pgp in the outward-facing state.

      Regarding the G72A mutant, we consider it conclusive that this single point mutation in the TM1 has a profound effect. Importantly, the G72A mutant was readily expressed and purifiable as a stable protein. We were able to resolve a high-resolution structure of the G72A mutant (without the substrate), confirming that the protein is not generally destabilized but properly folded.

      Above all, we appreciate the Reviewer’s suggestion to explore additional mutations and intend to do so in future studies.

      Reviewer 2 (Recommendations for the Authors):

      I am sold on the results regarding TM1 conformational changes as they are evident in the cryoEM structures. However, the set of states compared between mutants are not biochemically equivalent: for 335 and 978 they used an ATP-impaired Pgp whereas for 971 they used what appears to be WT, and the conformation was imaged presumably subsequent to ATP hydrolysis and Vanadate trapping. This is significant if the authors were unable to trap the OF in the impaired mutant background and should be highlighted. I have to believe that they tried that condition but I could be wrong.

      Our response: We acknowledge the point made by the Reviewer about the biochemical equivalence of mutant states and the potential significance of using an ATP-impaired mutant for trapping the outward-facing conformation of 971. We have not yet attempted to use the ATPase-deficient 971C mutant for crosslinking and intend to address this question in future studies.

      In our current approach, we used the ATPase-active 971C for two specific reasons:

      1) Our biochemistry data, as shown in Fig 1C, indicates that 971C only crosslinks in the presence of ATP hydrolysis conditions. Vanadate trapping was employed to stabilize the outward-facing conformation.

      2) Based on our experience, we have observed that the conformations of ATP-bound (mutant) and vanadate-trapped states of an ABC transporter are structurally equivalent at this resolution level of our study (see ref. 21: Hoffmann et al. NATURE 2019).

      The authors propose a new model for substrate translocation. It is based on three mutants and a number of structures. If the authors were not challenging the current dogma I would not have written the next comment. Considering the impact of the findings, I would have designed a couple more cysteine mutants based on their model. For instance, this pathway has a number of stabilizing interactions, can't they make a mutant that preserves conformational switching but eliminates substrate translocation? I like the G97A mutant result but I am worried that the effect could just be a general destabilization or misfolding as part of the cryoEM particles seem to suggest. The authors advance one interpretation of the disorder observed in this mutant but it could easily be my interpretation.

      Our response: We thank the reviewer for the suggestion to design additional mutants to further validate our proposed model for substrate translocation. We agree that this would be highly valuable, considering the potential impact of our findings. However, given the time-intensive nature of our approach, we believe that presenting these additional designs in a future study is a reasonable course of action.

      Regarding the G72A mutation, we believe that our current data fully supports our model and the role of TM1 in regulating the Pgp activity. Importantly, we would like to emphasize that the G72A mutant was readily expressed and purifiable as a stable protein. Additionally, our cryoEM structural determination of the G72A mutant at high resolution confirmed that the protein is not generally destabilized but properly folded.

      There are a couple of troubling methodological questions that I want the authors to address or clarify:

      1. In the methods they report that the final sample for cryoEM was prepared on a SEC devoid of detergent. It is obvious that the sample was folded but I was wondering why the detergent was removed? Was that critical for observing these structures with multiple ligands? Did they observe any lipids in their cryoEM?

      Our response: We avoid detergent in the buffer on final SEC purification. This step is to remove free detergent from the background which helps during cryoEM imaging. Of course, this cannot be done with every detergent but due to the very low CMC of LMNG it is possible. By now, we have verified this method for several other transporters with the same success. While this procedure helps us to obtain better images it is not necessary to obtain specific conformations or ligand bound states, nor does it affect these states or conformations.

      In our cryoEM structures , we did observe multiple cholesterol hemisuccinate (CHS) molecules on the outer transmembrane surface of Pgp.

      1. Can the authors comment on why labeling was carried out in the presence of ATP? Does it matter if the substrate was added prior to ATP and incubated for a few minutes?

      Our response: For every dataset, we first added the substrate to be cross-linked and afterwards added the ATP. In the cases of 335C and 978C, labeling was successful before ATP was added, as evidenced by the inward-facing structures with cross-linked substrate. However, for 971C, cross-linking only occurred after the addition of ATP. We interpret this data to suggest that the 971 site is inaccessible to the substrate in the inward-facing state, and cross-linking can only occur after the transporter transitions to outward-facing state. This is in line with our inward-facing structure which does not show a cross-linked substrate, and our biochemical data shown in Fig 1C, where 971C only crosslinked in the presence of ATP.

      1. I am not an expert on MD simulations and I understand that carrying out simulations at higher temperatures used to be a trick to accelerate the process. Is this still necessary? Why didn't the author use approaches such as WESTPA?

      Our response: Most so-called enhanced sampling methods, including WESTPA, explicitly define a reaction coordinate for the process of interest, usually based on intuition or prior studies. If this coordinate is chosen poorly, enhanced sampling usually fails, either because the sampling becomes inefficient or because the sampling biases the transition pathway (or both). Lacking reliable intuition or prior knowledge on which motions would result in substrate release, we chose temperature to speed up the process. High temperature largely avoids the introduction of an any bias through the definition of a progress coordinate. By contrast, the weighted ensemble method underlying WESTPA is a great method to simulate unbiased dynamics of a process with a known progress coordinate, but unfortunately requires to choose a progress coordinate prior to the simulation and will then mostly sample the process along this progress coordinate, because this is the only direction in which sampling is improved. High temperature MD on the other hand accelerates all processes in the system under study. Indeed, we have now confirmed that the pathway found at high temperature is also feasible at near-ambient conditions.

      In new simulations, we have now observed a similar release pathway at T=330 K. As the only difference, the substrate has not fully dissociated from the protein after 2.5 us, with weak interactions persisting at the top part of TM1 from the extracellular side. Importantly, this is a configuration observed also in higher temperature simulations but with much shorter lifetime.

      In response, we now included these new findings and a new Extended Data Fig. 15 in the revised manuscript.

      1. One way to show that the two substrates binding mode is biochemically relevant is to measure Vmax at different substrate concentrations. One would expect a cooperative transition if that interaction is mechanistically important.<br /> Our response: We have measured Vmax as a function of QZ-Ala concentration in a previous report (ref. 24), supporting positive cooperativity for binding to two sites.

      Reviewer 3 (Public Review):

      We thank Reviewer 3 for recommending the acceptance of our manuscript as is.

      Reviewer 3 (Recommendations for the Authors):

      Page 4, last line: Pgp302 should be Pgp1302. In addition, I can only encourage the authors to add an additional table to the manuscript. Here, the mutation, the obtained structure(s), IF or OF, the resolution, and the main message should be summarized.

      Our response: Following the reviewer’s suggestion, we have added Extended Data Table 2 summarizing the Pgp mutants and respective structural data in the revised manuscript.<br /> We verified that Pgp302 is the correct term on Page 4, last line.

      Pg. 5, section 'Covalent ligand design for Pgp labeling', it is mentioned that even in the presence of Mg2+ATP, Pgp302 could not react with AAC-DNPT. Maybe it would be worthwhile to add the data either in Supplementary Information or state 'data not shown'.

      Our response: We stated ‘data not shown’ in the text.

      Pg. 47, last line : A space is missing between M68, and M74.

      Our response: Space was added.

      Pg. 7, line 2: The authors mention that a single dataset of ATP-bound Pgp335 revealed three different OF conformations: ligand-free, single-ligand-bound, and double-ligandbound. However, the percentage fraction of each dataset sums up to be more than 100%. Would request the authors to recalculate the fraction size of each conformation.

      Our response: We have corrected the error in our calculation, based on the particle distribution in our dataset (OF335-nolig: 1,437,110 particles, 40.4%; OF335-1lig: 1,184,253 particles, 33.3%; and OF335-2lig: 939,924 particles, 26.4%).

      Pg 53, Figure legend of Extended Data Fig. 11: Please include the color coding for the helix TM1 and also the residues colored plum.

      Our response: We added the color coding for TM1 and other residues in the figure legend.

      Pg. 8, line 3: While referring to the structure of OF971-1lig, the authors nicely point towards the conserved residues M74 and F78 which coordinate the ligand. However, in Fig. 3b, residues M74 and F78 should also be indicated.

      Our response: We updated Fig. 3b by adding arrows pointing towards the residues M74 and F78.

      Pg. 54, Extended data Fig. 12: The authors should adopt a single writing style. In some places, Pgp is referred to as P-gp while in others as Pgp.

      Our response: We updated the protein labels in Extended Data Fig. 12.

      Pg. 54, Extended data Fig. 12: The authors should clearly mention which OF335 structure (1st panel) was used for visualizing the interactions.

      Our response: To clarify, we added the following sentences in the figure legend: “Pgp335 OF in the top panel refers to OF335-1lig. In the bottom panel describing OF335-2lig, the left and right diagrams refer to the binding positions of non-covalent and covalent ligand, respectively”.

      Pg. 18, section 'synthesis of dipeptide 8': In the text it is mentioned that for the synthesis of thiazole acid 6, compound 3 was dissolved in a mixture of THF/MeOH/H2O (3:1:1), while in the corresponding figure (Extended Data Fig. 1), the ratio is stated as 5:1:2.

      Our response: 3:1:1 ratio is correct. We made the correction in Extended Data Fig. 1.

      Pg. 19, section 'synthesis of linear tripeptide 10': Same as above for compounds 10 and 4, respectively.

      Our response: We corrected the conditions in the Extended Data Fig. 1 accordingly.

      Pg. 20, section 'Synthesis of cyclic peptide 11': There seems to be a discrepancy in the synthesis protocol between the text and the extended figure 1, especially regarding the use of THF/MeOH/H20, followed by NaOH and TFA or only NaOH and TFA.

      Our response: we further clarified the conditions of using NaOH in THF/MeOH/H2O (3:1:1) and TFA in DCM in the text for synthesis and Extend Data Fig. 1.

      Pg. 40, Extended Data Fig. 1: In the bottom last panel showing the synthesis of peptide 11, the authors have missed showing peptide 10 as the starting material for the reaction.

      Our response: Label for the peptide 10 was added following the suggestion.

      Pg. 26, third last line: 'o' is missing from the last word cry'o'

      Our response: We corrected the typo.

      Pg. 63 and 64, Extended Data Table 1: The Cryo-EM data collection, refinement, and validation statistics for OF971-1lig, IF971-1lig, OF978-1lig, and IF978-2lig are mentioned twice in the table.

      Our response: This was now corrected in the revision.

    1. Author Response

      The following is the authors’ response to the previous reviews.

      Recommendations for the authors:

      Reviewer #1 (Recommendations for the Authors):

      The authors have addressed my recommendations in the previous review round in a satisfactory way. I only have one additional comment to the authors:

      In the manuscript abstract lines 31-32, the author state that: "Using NIH data for the period 2006-2022, we report that ~230 K99 awards were made every year, representing ~$25 million annually."-- The "~$25 million" is under-stating the actual funds spent because this sum is just money spent on the first year of some k99s while the NIH is paying years 2,3,4 etc for others for k99 awards (~90% conversion rate to R00) awarded in previous years for a given year. The NIH is actually spending ~$230-$250 million a year on the k99 award mechanism in a given year. so the authors need to amend the stated amount in the manuscript.

      Thank you for pointing this out. The reviewer is correct, that we had incorrectly only calculated the investment $ in new K99 awards made. We have corrected this in the revised manuscript. We appreciate your careful reading of our manuscript and the edits made based on your comments have improved the final version.

      Reviewer #2 (Recommendations for the Authors):

      Thank you for taking the time to revise this important work. I learned a lot reading this paper a second time, and appreciate the improvements you have made.

      My only major thought while re-reading this is that I wish you all had written two papers! I see two themes in this work: one looking at faculty hiring networks from the Wapman et al. dataset, and another at K99/R00 conversions by institution, gender, and researcher mobility and its impact on subsequent funding success. After reading, I felt like I had many follow-up questions about both analyses, but it would be impractical for me to suggest all these follow-up analyses without making your paper unreasonably long.

      Thank you for these comments. We agree that there are 2 general themes in this paper. While we feel that significantly expanding on both themes will be important in future research. Our hope is that this work continues to inspire others to critically examine funding practices and inequity in the same way that the work of Wapman, Pickett, etc. inspired the present work.

      For example, regarding the results that more R00 are activated at different institutions, and that moving institutions improves subsequent funding success, I wonder: Do proportionally more women or men move institutions? Do proportionally more K99 awardees at less-funded places move for their R00, or less? The Cox proportional hazard models illustrate the impact of various characteristics on subsequent funding success, but they do not illustrate disparate impacts of mobility on different groups (if I am understanding them correctly). (You sort of dive into these questions in the very interesting subsection, "K99/R00 awardee self-hires are more common at institutions with top NIH funding." I wanted to read more!)

      Thank you for these kind comments. These are fantastic follow-up questions. We do not feel that we can adequately address them within the present manuscript without potentially splitting it into 2 separate manuscripts. However, we may examine these in future analyses. We are particularly interested in examining additional aspects such as how the K99 MOSAIC funding mechanism may differ from the traditional K99 mechanism. Since the K99 MOSAIC mechanism is newer, there may not be enough K99 MOSAIC awards made for a thorough exploration.

      As another example, for your analysis on faculty hiring networks, the prevalence of self-hiring amongst institutions and regions was one finding. However, this finding seems somewhat at odds with the previous takeaway about how researcher mobility improves subsequent funding success. Are institutions doing themselves a disfavor by hiring their own, then? I suspect there is more to say here about this pattern... maybe there are important differences between PhD institution and postdoc institution and its impact on hiring/subsequent funding success? Or is this a story about upward mobility into the top 25 well-funded NIH institutions?

      Again, these are very insightful comments and follow-up questions. We hope to address these in potential future manuscripts. We also hope that others may become interested in finding answers to these questions by exploring our dataset as well as other publicly available datasets such as the Wapman et al. dataset.

      I can completely understand how combining the faculty hiring network analysis with the K99/R00 conversions would seem like a natural fit, but I personally feel - emphasis on this being a personal opinion - that there would have been benefits to giving more space to the details of both analyses separately. Perhaps this is a "hindsight is 20/20" issue. Or an issue with the current times in which ones' brain can only hold so many main takeaways from a single body of work. (For example, I struggled to summarize your paper in my public review because I find so many takeaways important.)

      I suppose this is all to say that I find your work important enough to warrant additional follow-up work! :)

      Thank you for these very kind remarks. This work evolved over 8-10 months as evidenced by the updates to the biorXiv preprint. With unlimited time and foresight, it would probably be best to have separated the 2 themes into separate manuscripts and expanded both. Given current constraints, we plan to make some changes/updates to the present manuscript and hopefully include more in-depth analyses on each theme in future works. Thank you again for the thoughtful reading and critique of both our original manuscript and the revised version.

      Minor comments/questions:

      "K99 to R00 conversions are increasing in time"

      • Assuming I am interpreting the figures correctly, in my opinion, the most important takeaway is that the number of R00 awards have increased, but only for awardees moving to another institution. This key result, best illustrated by panels A and C of Figure 1, is buried in the long paragraph in this section. The organization of content in this section could be improved and more focused. Consider renaming this subsection to be more declarative: "K99 tR00 conversions have increased, but only for awardees moving to another institution."

      This is a very concise interpretation of this data. We have edited the paragraph referenced by the reviewer, split it into 2 paragraphs, and changed the title to “K99 awardees increasingly move to other institutions for R00 awards from 2008 to 2022” and the final sentence to “Thus, the number of K99 to R00 conversions is consistent over time, but increasingly more R00 awardees have moved to other institutions since 2013”

      • Similarly, I personally found the current title of the subsection, "K99 to R00 conversions are increasing with time" is mildly confusing. An R00 award indicates a successful conversion, so why not simply call this an R00 award instead of saying K99-to-R00 conversion? Also, when I look at Figure 1B and exclude the conversion rates for 2007 and 2008 (because this is a 3 year rolling average), I see that conversion rates (or R00 awards) have remained stagnant. This comment is very much in-the-weeds and is mainly to do with clarity of language.

      Thank you for these comments. We had “K99 to R00 conversion” to highlight the unique nature of this award mechanism that a person can only receive an R00 if they previously had a K99 award. Nevertheless, we have edited the text to “R00 awards” and “R00 awardees” to simplify things. We also want to note that we did not compute a 3-year rolling average. The function we used was: (X/(Y -1))x100 where X is the number of R00 awards made in a year and Y is the number of K99 awards made in a year. We did note an error in our calculation in the previous version of the manuscript. Previously, we included all R00 awards and K99 awards for each year from the NIH Reporter dataset; however, this is a flawed methodology. NIH reporter includes only extramural K99 award data and extramural R00 awards, but intramural K99 awardees can receive extramural R00 awards and thus are only included in the R00 dataset. There were 141 R00 awardees in our dataset from NIH Reporter that did not have K99 data, so we assume these are intramural K99 awards since it is required to have a K99 to be eligible for the R00 award. Since we do not know the awarding year for intramural K99 awardees or have data on intramural K99 awardees that fail to activate the R00 award (or stay internal at NIH), we have excluded these 141 R00 awardees. In the previous version, this mis-calculation exaggerated rolling conversion rate (we had correctly calculated the 78% total conversion rate). We re-analyzed our rolling conversion rate and found the average is 81.8% (excluding the first 2 years of the K99 program and the last 2 years).

      This is a long explanation, but essentially, we overestimated the number of R00 awards which inadvertently increased the rolling conversion rate. We have corrected this and simplified the first 2 paragraphs of the Results section.

      • I was also mildly confused looking at Figure 1c. The caption says that the percentages represent the K99 awardees that stayed at the same institution for the R00 activation, but the percentages are next to the solid circles which the legend labels as "different institution." Perhaps another or different way to show this is a stacked bar chart, where one bar represents the percentage of R00 awards activated at the same institution and another bar represents the percentage of R00 awards activated at a different institution. The bars always add to 100% but the change in proportions illustrates that proportionally fewer awards are being made to those remaining at the same institution.

      Great idea. We have included a stacked bar chart here. Since the stacked bar chart is percentages, we felt it was important to also show the total numbers so we still included the previous chart also but removed the percentage numbers from it. We also changed the departmental analysis to stacked bar charts. This shows the stark difference between 2008-2012 and 2013 onward. These changes were made in the revised Fig. 1.

      • Minor question: I would love to see Table 3 and Table 4 as a time-series. Has the proportion of recipients at various institution types changed with time?

      This is a great suggestion and we felt it fit best in Figure 5, so we’ve added it there.

      • Table 3 is useful but only indirectly addresses my first "Recommendation to the Authors" from my previous review. I did some number crunching myself from the data provided. Assuming I did this correctly: If you're a K99 awardee at a private institute, you had a 76.3% change of getting an R00 compared to 80.4% for a K99 awardee at a public institution. If you're a K99 awardee at a top-funded institution, you had a 76.8% chance of R00 compared to 78.6% for a lower-funded institution. I would have liked to see more figures and tables to illustrate conversion rates by institution type in this way. Interestingly, to me, these data suggest that there are not enormous conversion rate differences by institution type (though looking at these now, I am confused at the 89% statistic in line 174 and where that comes form, since it is much higher than what I've calculated).

      Thank you for this suggestion and these comments. Please see above where we describe how we incorrectly overestimated the 89% statistic. This has been corrected. As the reviewer suggested, we now show yearly percent of grants to specific institution types in the revised Figure 5. We agree with the reviewer that showing the conversion rate by institution type is interesting; however, it is fairly obvious from the new panels in Figure 5 that there is not much difference in conversion rate. Thus, to avoid crowding too many panels into the figure, we opted to keep the stacked bar plot.

      Reviewer #3 (Recommendations for the Authors):

      -One minor change to Figure 1C would be to switch the color coding for the lines so that they match with 1D whereby "same institution" would be white circles, or whatever the authors decide would be best for consistency since they are similar comparisons.

      Thank you for this suggestion. We have corrected this to be consistent.

      -Minor note for lines 459-461: I would suggest changing the wording to "intersectional inequalities" as it is not that a scientist's identities impact their careers as much as how those identities are positioned within an unequal opportunity structure and differentially treated that produce varying career trajectories and experiences of marginalization and cumulative (dis)advantages.

      Thank you and we agree with you. We have made this correction.

      -To carry forward a suggestion for the authors in my previous review, future research that more fully explores the research infrastructure of institutions for how top NIH funded institutions continue to be top funded institutions year after year could help clarify some of the career mobility and same/similar institution hiring found in the data. Rather than hand coding institutions for some of the infrastructure, the National Center for Education Statistics' Integrated Postsecondary Education Data System (IPEDS) has data on colleges and universities including whether they operate a hospital, have a medical degree, and many other interesting data about student and faculty demographics, institutional expenditures (including research budgets), and degrees awarded in different fields of study (undergrad and grad) that may be helpful to the authors as they continue their research stream in this area.

      Thank you very much. We will look into this data set as we continue our investigations in this area.

    1. Author Response

      The following is the authors’ response to the original reviews.

      Reviewer #1 (Recommendations For The Authors):

      The discussion seems to imply that the ball-and-chain peptide is or is related to the common gate. (Although it isn't stated explicitly, it is implied based on the presentation of the gating model in Figure 8 immediately after the discussion of common gating, and the simultaneous opening of both pores in Figure 8). What does the asymmetric structure say about the relationship between the N-term peptide and common gating in ClC-2? It seems like this structure suggests that the CTDs can independently rotate, and independently bind N-terminal peptide, which might not be expected to impact both pores. Some additional clarification and/or discussion of these ideas could be helpful here.

      We thank the reviewer for raising these very important points. We agree we should have been more explicit and have now expanded our discussion on this topic, highlighting the independent movement of the N-term peptide and CTDs and clarifying that it is currently unknown whether CLC-2 has a common gate (lines 431484).

      Discussion of "Revised Framework for CLC-2 gating": I think this would be a little easier to follow if most of the legend from Figure 8 was in the main text at the end of that section. Also, additional labels in Figure 8 (of the glutamates, the N-terminal peptide, and what the CTD arrows represent).

      We have revised this section of the text and added labels to the (revised) Figure as suggested.

      Line 261: typo, misspelling of "hydrogen"

      Fixed. (Now line 279.)

      Figure 6 - supplement 2B: Looks like an error in numbering y-axis - should be 90/120/150, I think. Can you show the three data points for the WT initial current rectification? Can you clarify whether the 3 that you are analyzing are the ones where AK42 the AK42 "zero current" level is not more than the initial positive current?

      We apologize for this error, which arose from the Y-axis label overlapping the tick labels, so 90/120/150 showed as 90/20/50. We have fixed this error and have added a new panel (C) to show three data points for the WT initial current rectification. In the Figure legend to panel C, we clarify that the 3 experiments we analyzed are the ones where the AK-42 current level is not more than the initial current at 80 mV.

      Reviewer #2 (Recommendations For The Authors):

      1. It appears from a close inspection of Figure 2 that the TM dimer is not quite symmetric, but I couldn't tell for sure from the figures as presented. No comment is made in the methods about symmetry imposed, and the authors explicitly comment on asymmetry in the cytoplasmic domain. It would be useful to have an explicit discussion of the TM dimer symmetry.

      We have now explicitly stated that the TM dimer is symmetric, and we have clarified the wording in the Methods:

      Main text, line 81: "The TM region of CLC-2 displays a typical CLC family symmetric homodimeric structure, with each subunit containing an independent Cl– pathway (Figure 2A, B)."

      Methods (lines 557-558): "The following ab initio reconstruction and 3D refinement (for all structures presented in this paper) were performed with C1 symmetry (no symmetry imposed)."

      1. For the simulations in Figure 5 Supplement 2, the N terminus flexibility is shown, but this of course can't be compared to a control. However, given the structural results, one might expect the JK helix to show changes in flexibility/mobility in the apo vs inactivated structures. Is this observed?

      We agree that the structures strongly suggest the JK-helix is not as stable without the N-terminus bound. We did not perform comparative simulations on the JK helix in the apo vs inactivated structures. While we agree this could be of interest, we don’t think it is essential to our conclusions, and the simulations might need to be quite long to adequately capture dynamics of the JK helix. [In the simulation results shown in Figure 5 Supplement 2, our aim was to test the validity of the structure by determining whether the N-terminus remains bound to the channel in simulations. The plot shows that the N-terminus stays in the same binding pose with an average RMSD (to the initial structure) of less than 2 angstroms, which is generally considered to be relatively stable.]

      1. I find the section "revised framework for ClC-2 gating" to be wanting. The ideas are illustrated in the cartoon, but should also be laid out in the text. In what ways are you revising the framework, and in what aspects are you carrying through ideas already proposed?

      Thank you for raising this point, which was also raised by Reviewer 1. We have revised this section and the accompanying Figure (Figure 8 and Lines 431-484).

      1. The authors mention in passing the idea that the hairpin could contribute to inward rectification (lines 227/8), but also suggest a role for the gating glutamate in this process. They also mention the idea of a common gate, but don't flesh out its function very much. These possibilities are very interesting and should be substantially fleshed out in the "framework" section, even if they cannot be fully answered yet.

      We have expanded on these points in the “framework” section.

      1. Figure 6E. points representing individual experiments should be shown.

      We added points representing individual experiments for Delta N (normalized to WT) in the surface-expression experiments in Figure 6E. Individual data points for the electrophysiology experiments are in panel C; we did not replot these in panel E because some of the points would have been off scale.

      1. The density in Figure 2A is hard to see, is there a better way to display it? Also, the orientation of the rightmost panel in Figure 2C is difficult to interpret.

      We revised 2A to make the density easier to see. We revised Figure 2C so that the middle and rightmost panels have the same orientation.

      1. P6. Line 87. This sentence is a little confusing, and perhaps could be a little clearer-the density is consistent with a Cl- ion, but no experiments have been done to support this, no?

      We have clarified the wording as suggested (now line 89) and added references supporting Clˉ binding to the Sext site in CLCs (line 90).

      1. P6 lines 89-98. Two lines of evidence, the conformation of the gate and the pinch point, both point to the structure representing a closed state. The wording as presented is a little hard to follow.

      We have revised the wording in this paragraph (lines 92-111)

      1. It's hard to distinguish water protons and oxygens in the lower right panel (QQQ).

      We revised this panel (in Figure 3 – figure supplement 2) to better distinguish the water protons and oxygens.

      Reviewer #3 (Recommendations For The Authors):

      A few points to consider for improving the manuscript

      1. It is intriguing that in the AK-42 structure, there is no density for the hairpin loop even though the CTD is in a symmetrical conformation as the apo. The authors could perhaps comment on whether there is any difference in the rectification properties of currents (or run-up) upon unblocking of AK-42 which may suggest that the hairpin binding is prevented by AK-42.

      We have not yet performed the suggested experiment nor any experiments to examine state-dependence, though we agree such experiments would be informative. We have added a note on this point in the discussion, lines 334-337.

      1. Although the conformation-dependent placement of the hairpin loop is convincing based on the density, the sequence assigned to this region is not conclusive.

      To strengthen our conclusion concerning the hairpin assignment, we investigated fits of peptide segments from the disordered sections of the C-terminal cytoplasmic domain to the hairpin density. We found that these fits are not as good as that with the N-terminal peptide. This analysis is described in lines 179-181 and a new figure (Figure 5 – figure supplement 1). We appreciate the reviewer’s point that it is extremely difficult to conclusively assign residues that are not contiguous with the rest of the structure. Nevertheless, given the wide variety of evidence all pointing to the conclusion that the hairpin loop corresponds to residues 14-28, we think the assignment is on strong footing. We respectfully ask that you consider removing this criticism from the public review, as we think it will hinder the casual reader from recognizing the strength of the evidence: (1) of unresolved regions in CLC-2, residues 14-28 fit best; (2) residues 14-28 were previously identified as part of the ball blocking region (lines 158-161); (3) MD simulations support that the N-terminal residues stay stably bound (Figure 5 – figure supplement 4) (4) gain-of-function disease causing mutations map onto either the Nterminal residues or interacting residues on the TM domain (Figure 5 – figure supplement 6). Thank you for considering this request.

      1. The authors should comment on the physiological relevance of the CBS domain rearrangements during gating.

      We have added this sentence (lines 131-133): “The physiological relevance of C-terminal domain rearrangements is suggested by disease-causing mutations that alter channel gating (Estevez et al., 2004; Brenes et al., 2023).”

      1. For the figures with cryo-EM maps, indicate the contour levels.

      Contour levels are now indicated in the Figure legends.

      1. It will be useful to the electrostatic map of the N-terminal peptide and the docking site.

      This is now shown in Figure 5 – figure supplement 3 and Video 5.

      1. Include a comment on the recent CLC-2 /AK-42 structure and if there are any differences in the structural features.

      We added this text to lines 273-274: “The RMSD between our CLC2-TM-AK42 structure and that of Ma et al. is 0.655 Å, and the RMSD between the apo TM structures is 0.756 Å.”

    1. Author Response

      The following is the authors’ response to the previous reviews.

      eLife assessment

      The paper contains some useful analysis of existing data but there are concerns regarding the conclusion that there might be alternative mechanisms for determining the location of origins of DNA replication in human cells compared to the well known mechanism known from many eukaryotic systems, including yeast, Xenopus, C. elegans and Drosophila. The lack of overlap between binding sites for ORC1 and ORC2, which are known to form a complex in human cells, is a particular concern and points to the evidence for the accurate localization of their binding sites in the genome being incomplete.

      Public Reviews:

      Reviewer #1 (Public Review):

      In the best genetically and biochemically understood model of eukaryotic DNA replication, the budding yeast, Saccharomyces cerevisiae, the genomic locations at which DNA replication initiates are determined by a specific sequence motif. These motifs, or ARS elements, are bound by the origin recognition complex (ORC). ORC is required for loading of the initially inactive MCM helicase during origin licensing in G1. In human cells, ORC does not have a specific sequence binding domain and origin specification is not specified by a defined motif. There have thus been great efforts over many years to try to understand the determinants of DNA replication initiation in human cells using a variety of approaches, which have gradually become more refined over time.

      In this manuscript Tian et al. combine data from multiple previous studies using a range of techniques for identifying sites of replication initiation to identify conserved features of replication origins and to examine the relationship between origins and sites of ORC binding in the human genome. The authors identify a) conserved features of replication origins e.g. association with GC-rich sequences, open chromatin, promoters and CTCF binding sites. These associations have already been described in multiple earlier studies. They also examine the relationship of their determined origins and ORC binding sites and conclude that there is no relationship between sites of ORC binding and DNA replication initiation. While the conclusions concerning genomic features of origins are not novel, if true, a clear lack of colocalization of ORC and origins would be a striking finding. However, the majority of the datasets used do not report replication origins, but rather broad zones in which replication origins fire. Rather than refining the localisation of origins, the approach of combining diverse methods that monitor different objects related to DNA replication leads to a base dataset that is highly flawed and cannot support the conclusions that are drawn, as explained in more detail below.

      Response: We are using the narrowly defined SNS-seq peaks as the gold standard origins and making sure to focus in on those that fall within the initiation zones defined by other methods. The objective is to make a list of the most reproducible origins. Unlike what the reviewer states, this actually refines the dataset to focus on the SNS origins that have also been reproduced by the other methods in multiple cell lines. We have changed the last box of Fig. 1A to make this clearer: Shared origins = reproducible SNS-seq origins that are contained in initiation zones defined by Repli-seq, OK-seq and Bubble-seq. This and the Fig. 2B (as it is) will make our strategy clearer.

      Methods to determine sites at which DNA replication is initiated can be divided into two groups based on the genomic resolution at which they operate. Techniques such as bubble-seq, ok-seq can localise zones of replication initiation in the range ~50kb. Such zones may contain many replication origins. Conversely, techniques such as SNS-seq and ini-seq can localise replication origins down to less than 1kb. Indeed, the application of these different approaches has led to a degree of controversy in the field about whether human replication does indeed initiate at discrete sites (origins), or whether it initiates randomly in large zones with no recurrent sites being used. However, more recent work has shown that elements of both models are correct i.e. there are recurrent and efficient sites of replication initiation in the human genome, but these tend to be clustered and correspond to the demonstrated initiation zones (Guilbaud et al., 2022).

      These different scales and methodologies are important when considering the approach of Tian et al. The premise that combining all available data from five techniques will increase accuracy and confidence in identifying the most important origins is flawed for two principal reasons. First, as noted above, of the different techniques combined in this manuscript, only SNS-seq can actually identify origins rather than initiation zones. It is the former that matters when comparing sites of ORC binding with replication origin sites, if a conclusion is to be drawn that the two do not co-localise.

      Response: We agree. So the reviewer should agree that our method of finding SNS-seq peaks that fall within initiation zones actually refines the origins to find the most reproducible origins. We are not losing the spatial precision of the SNS-seq peaks.

      Second, the authors give equal weight to all datasets. Certainly, in the case of SNS-seq, this is not appropriate. The technique has evolved over the years and some earlier versions have significantly different technical designs that may impact the reliability and/or resolution of the results e.g. in Foulk et al. (Foulk et al., 2015), lambda exonuclease was added to single stranded DNA from a total genomic preparation rather than purified nascent strands), which may lead to significantly different digestion patterns (ie underdigestion). Curiously, the authors do not make the best use of the largest SNS-seq dataset (Akerman et al., 2020) by ignoring these authors separation of core and stochastic origins. By blending all data together any separation of signal and noise is lost. Further, I am surprised that the authors have chosen not to use data and analysis from a recent study that provides subsets of the most highly used and efficient origins in the human genome, at high resolution (Guilbaud et al., 2022).

      Response: 1) We are using the data from Akerman et al., 2020: Dataset GSE128477 in Supplemental Table 1. We have now separately examined the core origins defined by the authors to check its overlap with ORC binding (Supplementary Fig. S8b)

      2) To take into account the refinement of the SNS-seq methods through the years, we actually included in our study only those SNS-seq studies after 2018, well after the lambda exonuclease method was introduced. Indeed, all 66 of SNS-seq datasets we used were obtained after the lambda exonuclease digestion step. To reiterate, we recognize that there may be many false positives in the individual origin mapping datasets. Our focus is on the True positives, the SNS-seq peaks that have some support from multiple SNS-seq studies AND fall within the initiation zones defined by the independent means of origin mapping (described in Fig. 1A and 2B). These True positives are most likely to be real and reproducible origins and should be expected to be near ORC binding sites.

      We have changed the last box of Fig. 1A to make this clearer: Shared origins = reproducible SNS-seq origins that are contained in initiation zones defined by Repli-seq, OK-seq or Bubble-seq.

      Ini-seq by Torsten Krude and co-workers (Guillbaud, 2022) does NOT use Lambda exonuclease digestion. So using Ini-seq defined origins is at odds with the suggestion above that we focus only on SNS-seq datasets that use Lambda exonuclease. However, Ini-seq identifies a much smaller subset of SNS-seq origins, so, as requested, we have also done the analysis with just that smaller set of origins, and it does show a better proximity to ORC binding sites, though even then the ORC proximate origins account for only 30% of the Ini-seq2 origins (Supplementary Fig. S8d). Note Ini-seq2 identifies DNA replication initiation sites seen in vitro on isolated nuclei.

      Update in response to authors' comments on the original review:

      While the authors have clarified their approach to some aspects of their analysis, I believe they and I are just going to have to disagree about the methodology and conclusions of this work. I do not find the authors responses sufficiently compelling to change my mind about the significance of the study or veracity of the conclusions. In my opinion, the method for identification of strong origins is not robust and of insufficient resolution. In addition, the resolution and the overlap of the MCM Chip-seq datasets is poor. While the conclusion of the paper would indeed be striking and surprising if true, I am not at all persuaded that it is based on the presented data.

      Reviewer #2 (Public Review):

      Tian et al. performed a meta-analysis of 113 genome-wide origin profile datasets in humans to assess the reproducibility of experimental techniques and shared genomics features of origins. Techniques to map DNA replication sites have quickly evolved over the last decade, yet little is known about how these methods fare against each other (pros and cons), nor how consistent their maps are. The authors show that high-confidence origins recapitulate several known features of origins (e.g., correspondence with open chromatin, overlap with transcriptional promoters, CTCF binding sites). However, surprisingly, they find little overlap between ORC/MCM binding sites and origin locations.

      Overall, this meta-analysis provides the field with a good assessment of the current state of experimental techniques and their reproducibility, but I am worried about: (a) whether we've learned any new biology from this analysis; (b) how binding sites and origin locations can be so mismatched, in light of numerous studies that suggest otherwise; and (c) some methodological details described below.

      • I understand better the inclusion/exclusion logic for the samples. But I'm still not sure about the fragments. As the authors wrote, there is both noise and stochasticity; the former is not important but the latter is essential to include. How can these two be differentiated, and what may be the expected overlap as a function of different stochasticity rates?

      It is difficult to separate the effect of noise from the effect of stochastic firing of origins. We therefore took the simplest approach: focus only on the most reproducible origins (shared origins) and ignore the non-reproducible origins. At least the most reproducible origins can be used to test the hypotheses regarding origin firing.

      • Many of the major genomic features analyzed have already been found to be associated with origin sites. For example, the correspondence with TSS has been reported before:

      https://www.ncbi.nlm.nih.gov/pmc/articles/PMC6320713/

      https://www.ncbi.nlm.nih.gov/pmc/articles/PMC6547456/

      • Line 250: The most surprising finding is that there is little overlap between ORC/MCM binding sites and origin locations. The authors speculate that the overlap between ORC1 and ORC2 could be low because they come from different cell types. Equally concerning is the lack of overlap with MCM. If true, these are potentially major discoveries that butts heads with numerous other studies that have suggested otherwise.

      The key missing dataset is ORC1 and ORC2 CHiP-seq from the same cell type. This shouldn't be too expensive to perform, and I hope someone performs this test soon. Without this, I remain on the fence about how much existing datasets are "junk" vs how much the prevailing hypothesis about replication needs to be revisited. Nonetheless, the authors do perform a nice analysis showing that existing techniques should be carefully used and interpreted.

      We agree that a thorough set of ChIP-seq data (with multiple antibodies or with equivalent techniques that do not use antibodies) for all six subunits of ORC in mammalian cells will be very useful for the field. Note, though, that just by simple cell lysis, it is very easy to divide human ORC into at least three different parts: ORC1, ORC2-5, and ORC6. The subunits do not form as robust a complex as seen in the yeasts and in flies.

      Reviewer #3 (Public Review):

      Summary: The authors present a thought-provoking and comprehensive re-analysis of previously published human cell genomics data that seeks to understand the relationship between the sites where the Origin Recognition Complex (ORC) binds chromatin, where the replicative helicase (Mcm2-7) is loaded, and where DNA replication actually beings (origins). The view that these should coincide is influenced by studies in yeast where ORC binds site-specifically to dedicated nucleosome-free origins where Mcm2-7 can be loaded and remains stably positioned for subsequent replication initiation. However, this is most certainly not the case in metazoans where it has already been reported that chromatin bindings sites of ORC and Mcm2-7 do not necessarily overlap, nor do they always overlap with origins. This is likely due to Mcm2-7 possessing linear mobility on DNA (i.e., it can slide) such that other chromatin-contextualized processes can displace it from the site in which it was originally loaded. Additionally, Mcm2-7 is loaded in excess and thus only a fraction of Mcm2-7 would be predicted to coincide with replication start sites. This study reaches a very similar conclusion of these previous studies: they find a high degree of discordance between ORC, Mcm2-7, and origin positions in human cells.

      Strengths: The strength of this work is its comprehensive and unbiased analysis of all relevant genomics datasets. To my knowledge, this is the first attempt to integrate these observations. It also is an important cautionary tale to not confuse replication factor binding sites with the genomic loci where replication actually begins, although this point is already widely appreciated in the field. Response: Thank you for recognizing the comprehensive and unbiased nature of our analysis. Our findings will prevent the unwise adoption of ORC or MCM binding sites as surrogate markers of origins and will stimulate the field to try and improve methods of identifying ORC or MCM binding until the binding sites are found to be proximal to the most reproducible origins. The last possibility is that there are ORC- or MCM-independent modes of defining origins, but we have no evidence of that.

      Weaknesses: The major weakness of this paper is the lack of novel biological insight and that the comprehensive approach taken failed to provide any additional mechanistic insight regarding how and why ORC, Mcm2-7, and origin sites are selected or why they may not coincide.

      Response: we agree that we cannot provide a novel biological insight from this kind of meta-analysis. The importance of this study is in highlighting that there is either significant problems with the data collected till now (preventing the co-localization of ORC or MCM binding sites with the most reproducible origins) or ORC and MCM binding sites are often far away from where the most reproducible origins fire, which should make us consider ways in which origins could be activated kilobases away from ORC and MCM binding sites.

      Recommendations for the authors:

      Reviewer #2 (Recommendations For The Authors):

      All suggestions and recommendations were described in a previous review.

      Reviewer #3 (Recommendations For The Authors):

      The most significant omission is a contextualization of the results in the discussion and an explanation of why these results matter for the biology of replication, disease, and/or our confidence in the genomic techniques reported on in this study. As written, the discussion simply restates the results without any interpretation towards novel insight. I suggest that the authors revise their discussion to fill this important gap.

      A second important, unresolved point is whether replication origins identified by the various methods differ due to technical reasons or because different cell types were analyzed. Given the correlation between TSS and origins (reported in this study but many others too), it is somewhat expected that origins will differ between cell types as each will have a distinct transcriptional program. This critique is partly addressed in Figure S1C. However, given the conclusion that the techniques are only rarely in agreement (only 0.27% origins reproducibly detected by the four techniques), a more in-depth analysis of cell type specific data is warranted. Specifically, I would suggest that cell type-specific data be reported wherever origins have been defined by at least two methods in the same cell type, specifically reporting the percent of shared origins amongst the datasets. This type of analysis may also inform on whether one or more techniques produces the highest (or lowest) quality list of true origins.

      We have done what has been suggested: used K562 cell type-specific data because here the origins have been defined by at least two methods in the same cell type and reported the percent of shared origins amongst the datasets (Supp. Fig. S4).

      Other MINOR comments include:

      • Line 215: the authors show that shared origins overlap with TF binding hotspots more often than union origins, which they claim suggests "that they are more likely to interact with transcription factors." As written, it sounds like the authors are proposing that ORC may have some direct physical interaction with transcription factors. Is this intended? If so, what support is there for this claim?

      The reviewer is correct. We have rephrased because we have no experimental support for this claim.

      • In the text, Figure 3G is discussed before Figure 3F. I suggest switching the order of these panels in Figure 3.

      Done.

      • It's not clear what Figure 5H to Figure 6 accomplishes. What specifically is added to the story by including these data? Is there something unique about the high confidence origins? If there is nothing noteworthy, I would suggest removing these data.

      We want to keep them to highlight the small number of origins that meet the hypothesis that ORC and MCM must bind at or near reproducible origins. These would be the origins that the field can focus in on for testing the hypothesis rigorously. They also show the danger of evaluating proximity between ORC or MCM binding sites with origins based on a few browser shots. If we only showed this figure, we could conclude that ORC and MCM binding sites are very close to reproducible origins.

      • Line 394: "Since ORC is an early factor for initiating DNA replication, we expected that shared human origins will be proximate to the reproducible ORC binding sites." This is only expected if one disbelieves the prior literature that shows that ORC and origins are not, in many cases, proximal. This statement should be revised, or the previous literature should be cited, and an explanation provided about why this prior work may have missed the mark.

      We do not know of any genome-wide study in mammalian cell lines where ORC binding sites and MCM binding have been compared to highly reproducible origins, or that show that these binding sites and highly reproducible origins are mostly not proximal to each other. Most studies cherry pick a few origins and show by ChIP-PCR that ORC and/or MCM bind near those sites. Alternatively, studies sometimes show a selected browser shot, without a quantitative measure of the overlap genome wide and without doing a permutation test to determine if the observed overlap or proximity is higher than what would be expected at random with similar numbers of sites of similar lengths. In the revised manuscript we have discussed Dellino, 2013; Kirstein, 2021; Wang, 2017; Mas, 2023. None of them have addressed what we are addressing, is the small subset of the most reproducible origins proximal to ORC or MCM binding sites?

      • Line 402-404: given the lack of agreement between ORC binding sites and origins the authors suggest as an explanation that "MCM2-7 loaded at the ORC binding sites move much further away to initiate origins far from the ORC binding sites, or that there are as yet unexplored mechanisms of origin specification in human cancer cells". The first part of this statement has been shown to be true (Mcm2-7 movement) and should be cited. But what do the authors mean by the second suggestion of "unexplored mechanisms"? Please expand.

      We have addressed this point in the revised manuscript.

      • The authors should better reference and discuss the previous literature that relates to their work, some of these include Gros et al., 2015 Mol Cell, Powell et al., 2015 EMBO J, Miotto et al., 2016 PNAS, but likely there are many others.

      We have addressed this point in the revised manuscript.

      Note for authors:

      Line 107: The introduction discusses the mechanism for yeast ORC recognizes specific origins and discusses the Orc4 contribution, but it is known that Orc2 also binds DNA on a base-specific manner (see PMID 33056978). Thus Lee et al. did not "humanize ORC" as stated.

      Done

      Lines 117-119: Two of the cited papers are on endo-reduplication and not on initiation in a normal cell cycle and this should be pointed out. Second, there is contradictory evidence that ORC is essential in human cells and this should be cited (PMID 33522487)

      Done

    1. Author Response

      The following is the authors’ response to the original reviews.

      Based on the reviewer comments (see below) and subsequent discussion between the reviewers and the Reviewing Editor, I would like to invite the authors to make major revisions, including new experiments. However, if major new experiments are not feasible, as may be the case, then at a minimum, I would urge the authors to:

      1. Tone down the language regarding a causative role for changes in GH/IGF-I signaling in mediating the effects of Tmem63 on the skeleton, and also be very open in acknowledging the lack of mechanistic insight into how Tmem regulates GH signaling.

      Response: We toned down the language as suggested and also acknowledged the lack of mechanistic insights into how Tmem263 regulates GH signaling.

      1. Revise/redo or if not possible, then delete the problematic experiment in Fig. 5E.

      Response: We have included additional Western blot data in Figure 5 from control WT and KO male mice without exogenous GH injection. In the absence of GH injection, we could not detect Jak2 and Stat5 phosphorylation in the liver of male WT and KO mice.

      1. Address the comments about liver feminization.

      Response: We have performed additional analysis as suggested by reviewer # 3. We have now included additional data to address the issue of liver feminization (new Fig. 6G-I and Figure 6-figure supplement 1). We plan to expand on this very topic in future studies as this is an interesting transcriptional phenomenon.

      1. Revise the manuscript to address as many of the recommendations for the authors as possible, many of which can be addressed by textual edits. Response: We have addressed as many of the textual changes as suggested in the revised manuscript.

      Reviewer #2 (Recommendations for The Authors):

      TMEM263 has been suggested to be associated with bone mineral density and growth in humans and mice, but the functional role of this transmembrane protein in the regulation of bone metabolism is unknown. With the knockout mouse approach, this manuscript demonstrates that Tmem263 is essential for longitudinal bone growth in the mouse as deletion of Tmem263 in knockout (KO) mice developed severe postnatal growth impairment and proportional dwarfism. It is determined that the dwarfism was caused by a substantial reduction in liver expression of growth hormone receptor (GHR), a slight increase in serum GH, and a reduction in serum IGF-I, which resulted in disruptive of GH/IGF-I regulatory axis of endochondral bone formation.

      The study was relatively well designed, and the results in general are supportive of the conclusions. While this study discloses new and intriguing functional information about a novel cytoplasmic membrane gene, there are a few minor issues that the authors may wish to address. These issues are listed in the following:

      1. One of the intriguing findings of this manuscript is that deletion of a gene encoding a small cytoplasmic membrane protein could cause a substantial reduction in the expression and protein levels of GHR. Inasmuch as a couple of potential explanations were offered in the Discussion section (first complete paragraph of page 10), there has been no attempt to test any of the suggested causes, since many of these potential mechanisms can readily be tested experimentally. Accordingly, the lack of mechanistic investigation into this intriguing effect renders the manuscript largely descriptive in nature.

      Response: The point made by the reviewer is well taken. We do plan to have follow up studies to establish which among the mechanisms we highlighted in the discussion is contributing to the reduction in GHR transcript and protein level. Our present study is the first functional characterization of this enigmatic novel membrane protein. We anticipate that multiple follow-up studies are needed to gain a deeper understanding of the biology of Tmem263. We believe that our present study represents an important first step.

      1. Because a major conclusion is that the bone phenotype of Tmem263 KO mice was caused by deficient hepatic expression and/or action of GHR, it would be helpful to (or strengthen) the conclusion if a brief comparison of the bone phenotype between GHR KO mice and Tmem263 KO mice is included in the Discussion section.

      Response: We have now included this information in the revised manuscript.

      1. In Figure 3, the cortical bone parameters (i.e., Tt.Ar, Ct.Ar, and Ct.Th), but none of the trabecular bone parameters (i.e., BV/TV, Tb.N, Tb.Th), were normalized against femur length. The authors did not provide a rationale for this differential treatment with the cortical bone parameters from the trabecular bone parameters. If the reason to normalize the cortical bone parameters against bone length was to demonstrate that the reduced cortical bone mass in mutants was related to the impaired longitudinal bone growth, then why did the authors not also assess whether the observed reduction in these trabecular bone parameters in KO mutants was proportional to reduced longitudinal bone growth?

      Response: We actually made the exact adjustments that the reviewer refers to, as stated in the methods section. Please see page 14. The regions of interest (ROIs) of both the trabecular bone analysis and the cortical analysis in the mutants was reduced proportional to the length of the bone (40% smaller). The normalization to Tt Ar to femur length in Figure 3I was only meant to show that the reduction in Tt Ar in the mutants was proportional. We have modified the text in our result section for clarity.

      1. Elements described in Fig. 5A have been well documented. Therefore, Fig. 5A is unnecessary and can be deleted.

      Response: We felt that Figure 5A should remain. It helps orient readers that are not familiar with the literature to be aware that both liver- and bone-derived IGF-1 contribute to longitudinal bone growth.

      1. Figure 6 was performed with male KO mice. Were the altered gene expression profiles in female KO mice any different from male KO mice?

      Response: We plan to perform RNA-seq in female mouse liver in our follow-up studies. We do not know, at present, whether and to what extent the liver transcriptomic profile would be different between male and female KO mice. As far as dwarfism and deficiency in skeletal acquisition, both male and female KO mice showed the same phenotypes.

      1. The number of animals (or samples) per group in some of the Figures (i.e., Fig. 2G, 2I, 2J, 3A to J, the entire Fig. 4, 5D, 5F, and Suppl Fig. 1) is needed to be provided in the legends.

      Response: We have included this information in the figure legends.

      Reviewer #3 (Recommendations for The Authors):

      1. Explain the discrepancy between the impact of KO on serum Igfbp3 (= decreased) vs. hepatic Igfbp3 (= unchanged).

      Response: We do not have a plausible mechanism, at present, that can explain the reduction in circulating serum Igfbp3 level without an apparent reduction in Igfbp3 transcript level in the liver. In human studies, typically only serum IGFBP3 levels are measured but not the hepatic IGFBP3 transcript level. Therefore, it is unclear whether the circulating levels of IGFBP3 is being regulated at the posttranscriptional level, an issue that can be explored in future studies.

      1. Line 215, 221, and elsewhere - Foxa1 does not show significant male-biased expression in mouse liver.

      Response: We have removed Foxa1 from the text.

      1. Line 225- According to the abstract of Ref. #45, Cux2 regulates a subset of sex-biased genes in the liver. The authors should compare the genes dysregulated by TMEM263-KO (Fig. 6) to those altered by Cux2 loss (Ref. #45) to ascertain whether the results of Fig. 6 are partially or entirely explained by Cux2 overexpression.

      Response: We agree that this is a great area of future study. We do feel this, however, would be better explored in a more in-depth follow-up article. We felt, given the current direction of the paper it made more sense to include differential expression comparisons of male vs female, hypophysectomized vs sham control, and Stat5b-KO vs WT mouse liver gene expression data. Our future work will explore the transcriptomes of male and female WT and Tmem263-KO liver gene expression in the context of the observed physiology.

      1. Line 262- "lower transcription of Ghr gene". A decrease in mRNA levels does NOT equate with a decrease in transcription per se. Altered mRNA splicing, poly A, export, cytoplasmic stability, etc. are all potential contributors.

      Response: We have included these possibilities highlighted by the reviewer in our revised Discussion section.

      1. Line 273, "TMEM263... most highly expressed in liver" Not correct - see Fig. 1C for TMEM263 RNA levels in mouse tissues.

      Response: We have corrected the text on page 11.

      1. Line 425 - Include GEO accession number.

      Response: We have already uploaded our RNA-seq data to the NCBI Sequence Read Archive (SRA), and the data can be accessed under accession number # PRJNA938158.

      1. Fig. 6 - Line 796 - Specify the age and sex of mice analyzed.

      Response: We have included the information in the revised figure 6 legend.

      1. Fig.2 - Suppl 1- Specify age of mice.

      Response: We have included the information in the revised Figure 2-figure supplement 2.

      1. Fig.2G -Specify the sex of the mice.

      Response: For the P1 to P21 pups’ data, we did not separate by sex, as gender determination of pups at P1 and P7 can be challenging. We now indicated this in the figure legend.

      1. Fig. 6A and 6C-6F: Which of these genes shows sex-dependent expression in wild-type liver? Use color to highlight gene names for genes that show male-biased or female-biased expression.

      Response: We agree with the reviewer that additional labels on Figure 6A and 6C-F would be helpful to show genes of sex-bias. However, this is not the primary point of the paper. This topic deserves a much more in-depth analysis in follow up studies focused on defining the exact type and degree of transcript feminization in the liver of Tmem263-KO mice, as well as, its physiologic consequences. For readers interested in this topic, we have included the subfigures G-I in Figure 6 and for greater transcript level detail, figure 6 supplement 1.

    1. Author Response

      The following is the authors’ response to the original reviews.

      Reviewer #1

      Recommendation 1: The authors reasoned upon the presence of a differential basal hydraulic stress in waves' valleys vs hills at first from the observation of "domes" formation upon 48h cultivation. I suggest performing a quantification to support the statement as a good scientific practice. Furthermore, it would strengthen the concept when the formation of domes was compared between the waves' dimensions as a different grade of cell extrusion was quantified. i.e., 50, 100, and 200 µm.

      Response 1: Upon seeing the phenomenon (Author response image 1 A), we performed a count for domes on the 100 µm and saw a significant effect. We refrained from including the results as it is the subject of ongoing research in our lab. In response to the reviewer’s suggestion, we have included a graph (Author response image 1 B) showing the increasing number of domes over 48 hours from three 100 µm wave samples.

      We have updated Figure 2A and B in the manuscript to include the new graph.

      Author response image 1.

      (A) shows dome (white arrows) over a 100 µm wave substrate. (B) is the number of accumulated domes in valley and hill regions, for 3 independent samples, over 48 hours.

      Recommendation 2: Using RICM microscopy to quantify the cell basal separation with the substrate and hydraulic stress is very clever. Nevertheless, I am in doubt if the different intensity reported for the hills vs valley (Fig. 2G and H) is a result of the signal reduction at deeper Z levels. Since there is no difference in extrusion and forces between valleys and hills in the 200 µm waves but only in 50µm and 100µm, I would add this to the quantification. I would expect no intensity difference from RICM for the 200 µm sample if this is not an artefact of imaging.

      Response 2: We performed additional experiments on blank wave substrates (both 100 and 200 µm) to ascertain the extent of reflection intensity drop (Author response image 2A). And, as correctly pointed out by Reviewer #1, there was a drop in intensity even without cells. On the 100 µm waves, hill reflections are on average ~27 % dimmer than valley reflections. Whereas, on the 200 µm waves, hill reflections are on average ~39 % dimmer.

      Using this information, we performed a calibration on the RICM results obtained from both the 100 and 200 µm waves (Author response image 3B). The calibrated 100 µm data showed residual signatures of difference, whereas the calibrated 200 µm distributions appeared very similar. We noticed large cross- sample variations in the registered intensities, which will negatively impact effect size if not accounted for. To do this, we subsequently normalized both hill and valley intensities against planar region intensities for each sample. As shown by the final output (Author response image 3C), we were able to remove the skewness in the distributions. Moreover, 1-way ANOVA followed by a post hoc analysis with BH correction revealed a significant reduction in 100 µm hill/flat intensity ratio compared to 100 µm valley/flat intensity ratios (Δ~-23 %). Conversely, no significance was observed for the same comparison on the 200 µm waves.

      Author response image 2.

      (A). RICM from blank wave samples reveal a reduction in reflection intensity in hill regions compared to flat and valley regions.

      Author response image 3.

      (B) shows the RICM intensities after adjusting for the inherent reflection intensity drop shown in (A). (C) show the RICM intensities after normalization against planar region signals; this removes cross-sample variations and improve effect size of differences.

      We have updated the manuscript Figure 2I and text accordingly. The blank wave results are included in Figure 2-figure supplement 1 along with updated text and summary data table in Supplementary File 4.

      Recommendation 3: To measure 3D forces on top of the hills and valleys, the use of PAA gels is necessary. Since in Fig 3B, the authors show a difference in cell extrusion number between substrates and stiffnesses, I think it is necessary to confirm the presence of more extrusion in valleys vs hills on PAA gels. This would ensure the conclusion between normal forces and extrusion.

      Response 3: We do have time-lapse data with monolayers on the PAA waves. However, we felt results from the flat regions were sufficient in supporting the point being made in the text. Specifically, our original intention with PAA gels was to show that the extrusion reductions seen in osmotic perturbations were by virtue of removing basal stress and not some cryptic osmotic response. Hydrogels were chosen because they can effectively dilute basal solute concentration and thereby reduce the osmotically induced water transport. Moreover, as fluid could freely move within the gel, the fluid stress can quickly equilibrate across the basal surface. In contrast, poorly water/solute permeable substrates could lead to localized spikes in solute concentration and transient basal regions with high fluid stress.

      To get a sense of the potential difference in basal solute concentration between the two materials, we can do a quick hand-waving estimation. For monolayers on non-water/solute permeable PDMS of 20x20 mm and using the laser wavelength (640 nm) for RICM as an extreme estimate of basal separation, we should expect ~0.25 µl of total basal water content. On the other hand, we typically produce our PAM gel slabs using ~150 µl of precursor solutions. This means that, given similar amounts of solute, PAM gels will lead to monolayer basal osmolarity that is around 3 orders of magnitude lower than monolayers on PDMS, producing significantly lower osmotic potential. This implies from the outset that we should expect high survivability of cells on these substrates irrespective of curvature domains. Indeed, later immunoblotting experiments showed MDCKs exhibiting hyper activated FAK and Akt on PAM gels.

      In response to Reviewer #1’s suggestion then, we have added another supporting time-lapse (Video 19) showing typical response of MDCK monolayers on 100 µm PAA waves (Author response image 4). Evident from the time-lapses, like the planar regions, cell extrusions were very rare. This supports the idea that on PAM gels the effects of basal hydraulic stress and asymmetric forces are marginal against the strong survival signals. And the response is similar to hyper-osmotic perturbations; there, we did not see a significant difference between valley and hill extrusions.

      Author response image 4.

      Time-lapse snapshot showing negligible MDCK extrusions 24 hours after confluency over PAM gel wave substrates.

      Recommendation 4: Before proceeding with the FAK inhibitor experiment, the authors should better justify why the 4.1 wt % sucrose vs DMSO or NaCl is the most inert treatment. This can be done by citing relevant papers or showing time-lapses (as it is done for the higher FAKI14 dose).

      Response 4: Although some cells have recently been shown to be able to transport and utilize sucrose, mammalian cells generally cannot directly take up polysaccharides for metabolism and this is frequently mentioned in literature: see (Ref. R1) for example. Without special enzymes to break sucrose down into monosaccharides, such as sucrase found in the gut, the sugars should remain spectators in the culture medium, contributing only to osmotic effects.

      DMSO on the other hand, besides changing osmolarity, can also be integrated into cell membrane and pass through cells over time. It has been reported to chronically affect cell membrane properties and gene expressions (Ref. R2).

      Finally, it is well known that both sodium and chloride ions are readily taken up and transported by cells (Ref R3). They help to regulate the transmembrane potential, which in turn can affect membrane bound proteins and biochemical reactions within a cell.

      Hence, comparing the 3 hyper-osmotic perturbations, adding sucrose should have the least off- target effects on both the inhibitor study and the subsequent immunoblotting. And, in response to the reviewer’s recommendation, we have updated the text accordingly and included new references to support our statement.

      Ref R1. H. Meyer, O. Vitavska, H. Wieczorek; Identification of an animal sucrose transporter. Journal of Cell Science 124, 1984–1991 (2011). Doi: 10.1242/jcs.082024

      Ref R2. B. Gironi, Z. Kahveci, B. McGill, B.-D. Lechner, S. Pagliara, J. Metz, A. Morresi, F. Palombo, P. Sassi, P. G. Petrov; Effect of DMSO on the Mechanical and Structural Properties of Model and Biological Membranes. Biophysical Journal 119, 274-286 (2020). Doi: doi.org/10.1016/j.bpj.2020.05.037

      Ref R3. X. Zhang, H. Li; Interplay between the electrostatic membrane potential and conformational changes in membrane proteins. Protein Science 28, 502-512 (2019). Doi: 10.1002/pro.3563

      Recommendation 5: The data showing a FAK-dependent phosphorylation of AKT responsible for a higher cell survival rate in the hills is not yet completely convincing. Please show a reduced AKT phosphorylation level after FAK inhibition in high osmolarity levels. Furthermore, the levels of AKT activation seem to increase slightly upon substrate softening independently of FAK activation or osmotic pressure (i.e., Fig. 4E, Soft PDMS). The authors should comment on this in connection with the results shown for PAA gels.

      Response 5: For the additional immunoblotting experiments, work is currently underway. We could not, however, complete these experiments in time for this revision, as both Cheng-Kuang and Xianbin will shortly be taking on new jobs elsewhere. David will continue with the immunoblotting studies and should be able to include the results in an update in the coming months. As for the apparent elevated levels of AKT seen on soft silicones, we speculate that it is because we cannot immunoblot cells that have died and were inevitably washed out at the start of the procedure. Inferring from the higher extrusion rates on these soft substrates, we could be missing a significant portion of stats. Specifically, we are missing all the cells that would have lowered AKT activation but died, and had we been able to collect those statistics, perhaps both the FAK and AKT should have shown lower levels. We risk committing survival bias on the results if we read too much into the data as is.

      Alternatively, another explanation could be that, by virtue of survival of the fittest, we might have effectively selected a subpopulation of cells that were able to survive on lower FAK signals, or completely irrespectively of it.

      At any rate, to prove our foregoing hypothesis would require us to perform comprehensive immunoblotting and total transcriptome analysis over different duration conditions. Unfortunately, we do not have the time to do that for the current article, but it could be developed into a stand-alone molecular biology investigation in future. We have included similar discussion in the main text.

      Recommendation 6: In the discussion, the authors suggest the reported findings be especially relevant for epithelia that significantly separate compartments and regulate water and soluble transport. These are for example kidney epithelia (i.e., MDCK is the best experimental choice), retinal epithelium or intestinal epithelium. I would suggest that some proof-of-concept experiments could be done to support this concept. For example, I would expect keratinocytes (i.e., HaCaT) not to show a strong difference in extrusion rate between valleys and hills since the monolayer is not so sealed as kidney epithelium. In general, this kind of experiment would significantly strengthen the finding of this work.

      Response 6: As recommended, we tracked the behavior of retina pigment epithelial cells (hTERT RPE-1 from ATCC) which do not form tight monolayers like MDCKs (Ref. R4). We did not detect extrusion events occurring from monolayers of these cells (Author response image 5). This is true even for portions of monolayers over waved regions.

      Author response image 5.

      Time-lapse snapshot showing non-existent o cell extrusions from RPE monolayers confluent for over 21 hours.

      We have updated these findings in the main text discussions and included a new supporting time- lapse (Video 15) in our article.

      Ref R4 F. Liu, T. Xu, S. Peng, R. A. Adelman, L. I. Rizzolo; Claudins regulate gene and protein expression of the retinal pigment epithelium independent of their association with tight junctions. Experimental Eye Research 198, 108157 (2020). Doi: 10.1016/j.exer.2020.108157

      Recommendation 7 (minor point): Figure S1 needs to have clear notes indicating in each step what is what. i.e., where is glass, PDMS, NOA73, etc? A more detailed caption will help the figure's comprehension. Also "Cy52" should be changed to "soft silicone" to be consistent with the text (or Cy52 should be mentioned in the text).

      Response 7 (minor point): Changes were made to Figure 1-figure supplement 1 to improve comprehension accordingly. CY52 was added to the main-text, next to the first appearance of the word soft silicone, to be consistent with the figures.

      Recommendation 8 (minor point): The authors often mentioned that epithelial monolayers are denser on PAA gels. Please add a reference(s) to this statement.

      Response 8 (minor point): The statement is an inference from visually comparing monolayers on PAM gels and PDMS. The difference is quite evident (Author response image 6). The density difference is in spite of the fact that the substrates share similar starting cell numbers.

      To address the reviewer’s comment, we have combined time-lapses of monolayers on silicones and PAM gels side-by-side in Video 17 to facilitate convenient comparisons.

      Author response image 6.

      Time-lapse snapshot at 24 hours after confluence, showing conspicuously higher density of MDCK monolayers on PAM gel compared to those on silicon elastomer.

      Reviewer #2

      Recommendation 1: The sinusoidal wavy substrate that the authors use in their investigation is interesting and relevant, but it is important to realize that this is a single-curved surface (also known as a developable surface). This means that the Gaussian curvature is zero and that monolayers need to undergo (almost) no stretching to conform to the curvature. The authors should at least discuss other curved surfaces as an option for future research, and highlight how the observations might change. Convex and concave hemispherical surfaces, for example, might induce stronger differences than observed on the sinusoidal substrates, due to potentially higher vertical resultant forces that the monolayer would experience. The authors could discuss this geometry aspect more in their manuscript and potentially link it to some other papers exploring cell-curvature interactions in more complex environments (e.g. non-zero Gaussian curvature).

      Response 1: In response to reviewer #2’s recommendation we have highlighted in the discussion of our text that our waves constitute a developable surface and that cells will experience little stretching for the most part. Based on our knowledge of how curvature can modulate forces and thus osmotic effects, we included some rudimentary analysis of what one would expect on hemispherical surfaces of two types: one that is periodic and contiguous (Ref. R5), and another with delineating flat regions (Ref. R6).

      For epithelial monolayers in the first scenario, and on poorly solute/water permeable substrates, we should also expect to see a relatively higher likelihood of extrusions from concave regions compared to convex ones. Moreover, as the surfaces are now curved in both principal directions (producing larger out-of-plane forces), we should see the onset of differential extrusions seen in this study, but at larger length scales. For example, the effects seen on 100 µm hemicylindrical waves might now happen at larger feature size for hemispherical waves. Furthermore, as this kind of surface would invariably contain hyperbolic regions (saddle points), we might expect an intermediate response from these locations. If the forces in both principal directions offset each other, the extrusion response may parallel planar regions. On the other hand, if one dominates over the other, we may see extrusion responses tending to the dominating curvature (concave of convex).

      On the other hand, on curved landscapes with discrete convex or concave regions, we should expect, within the curved surface, extrusion behaviors paralleling findings in this study. What would be interesting would be to see what happens at the rims (or skirt regions) of the features. At these locations we effectively have hyperbolically curved surfaces, and like before, we should expect some sort of competing effect between the forces generated from the principal directions. So, for dome skirts, we should see fewer extrusions when the domes are small, and vice versa, when they are larger. Meanwhile, for pit rims, we should see a reversed behavior. It should also be noted that the transitioning curvature between convex/concave and planar regions would also modulate the effect.

      These effects might have interesting developmental implications. For instance, in developing pillar like tissues (e.g., villi) structures, the strong curvatures of nascent lumps would favor accumulation of cell numbers. However, once the size of the lumps reaches some critical value, epithelial cell extrusions might begin to appear at the roots of the developing structures, offsetting cell division, and eventually halting growth.

      Ref R5. L. Pieuchot, J. Marteau, A. Guignandon, T. Dos Santos, I. Brigaud, P. Chauvy, T. Cloatre, A. Ponche, T. Petithory, P. Rougerie, M. Vassaux, J. Milan, N. T. Wakhloo, A. Spangenberg, M. Bigerelle, K. Anselme, Curvotaxis directs cell migration through cell-scale curvature landscapes. Nature Communications 9, 3995 (2018). Doi: 10.1038/s41467-018-06494-6

      Ref R6. M. Werner, S. B.G. Blanquer, S. P. Haimi, G. Korus, J. W. C. Dunlop, G. N. Duda, D. W. Grijpma, A. Petersen, Surface curvature differentially regulates stem cell migration and differentiation via altered attachment morphology and nuclear deformation. Advanced Science 4, 1–11 (2017). Doi: 10.1002/advs.201600347

      Recommendation 2: The discussion of the experiments on PAM gels is rather limited. The authors describe that cells on the PAM gels experience fewer extrusions than on the PDMS substrates, but this is not discussed in sufficient detail (e.g. why is this the case). Additionally, the description of the 3D traction force microscopy and its validation is quite limited and should be extended to provide more convincing evidence that the measured force differences are not an artefact of the undulations of the surface.

      Response 2: We first saw a significant reduction in cell extrusions when we performed hyper-osmotic perturbations, and to eliminate possible off-target effects of the compounds used to increase osmolarity, we used three different compounds to be sure. In spite of this, we felt it would further support our argument, that basal accumulation of fluid stress was responsible for the extrusions, if we had some other independent means of removing fluid stress without directly tuning osmolarity through addition of extraneous solutes. We hence thought of culturing MDCK monolayers on hydrogels.

      Hydrogels were chosen because they can effectively dilute basal solute concentration (for reference ions (Na+) are continuously pumped out basally by the monolayer) and thereby reduce the associated osmotically induced water transport. Moreover, as fluid could freely move within the gel, the fluid stress can quickly equilibrate across the basal surface. In contrast, poorly water/solute permeable substrates will lead to localized spikes in solute concentration and transient basal regions with high fluid stress.

      To get a sense of the extent of difference in basal solute concentration between the two materials, we can do a quick hand-waving estimation. For monolayers on non-water-permeable PDMS of 20x20 mm, and using the laser wavelength (640 nm) for RICM as an extreme estimate of basal separation, we should expect ~0.25 µl of total basal water content. On the other hand, we typically produce our PAM gel slabs using ~150 µl of precursor solutions. This means that, given similar amounts of solute, PAM gels will lead to monolayer basal osmolarity that is around 3 orders of magnitude lower than monolayers on PDMS, producing significantly lower osmotic potential. This implies from the outset that we should expect high survivability of cells on these substrates. Indeed, later immunoblotting experiments showed MDCKs exhibiting hyper activated FAK and Akt on PAM gels.

      As for the 3D TFM used in this study, it is actually implemented from a well-established finite element method to solve inverse problems in engineering and has been repeatedly validated in larger scale engineering contexts (Ref. R7). The novelty and contribution of our article is in its adaptation to reconstruct cellular forces at microscopic scales.

      In brief, soft materials, such as hydrogels used in our case, are doped with fluorescent particles, coated with ECM, and then seeded with cells. The cells would exert forces that deform the soft substrate, thereby displacing the fluorescent particles from their equilibrium positions. This particle displacement can be extracted by producing an image pair with microscopy; first one with the cells, and subsequent one of relaxed gel after removal of cells with acutely cytotoxic reagents, such as SDS. There are several ways in which the displacement field can be extracted from the image pair. These include particle tracking velocimetry, particle image velocimetry, digital volume correlation, and optical flow.

      We employed 3D Farneback optical flow in our study for its superior computational performance. The method was validated using synthetically generated images from Sample 14 of the Society for Experimental Mechanics DIC challenge. The accuracy of the calculated displacements using the 3D Farneback optical flow was then compared to the provided ground truth displacements. For the highest frequency displacement image pairs, an x-component root-mean-square-error (RMSE) value of 0.0113 was observed. This was lower than the 0.0141 RMSE value for the Augmented Lagrangian Digital Volume Correlation method. This suggested that the 3D Farneback optical flow is capable of accurately calculating the displacement between two bead images.

      The displacement fields are then fed into a finite element suite (ANSYS in our case) along with the model and mesh of the underlying substrate structure to obtain node specific displacements. This is required because mech nodes do not typically align with voxel positions of displacements. With these node specific displacements, we subsequently solve the inverse problem for the forces using Tikhonov regularization (Ref. R8). The outcome is a vector of node specific forces.

      In light of the above, to physically validate the method in our context would require the generation of a known ground truth force on the scale of pico- to nano-newtons and subsequently image the particle displacements from this force using confocal microscopy. The force must then be released in situ in order for the relaxed gel to be imaged again. This is not a straightforward feat at this scale, and a method that immediately springs to mind is magnetic tweezers. Unfortunately, this is a tool that we cannot develop within reasonable timeframes, as the method will have to be seamlessly integrated with our spinning-disk confocal. However, as a compromise, we have included an in-silico validation with our revised manuscript.

      Specifically, given a finite element model with a predefined curvature, a known force was applied to the surface of the model (Author response image 7A). The resulting displacements were then calculated from the finite element solution. A 10% random noise is then added to the resulting displacement. The traction force recovery (Fig. R2-1 B) was then performed using the in-silico noisy displacements. To evaluate the accuracy of the recovery, the cosine similarity along with the mean norm of the force vectors were calculated. A value closer to 1 for both evaluation metrics indicates a more accurate reconstruction of the simulated traction force. The cosine similarity of the recovered traction forces to the original applied force was 0.977±0.056 while the norm of the recovered traction forces as a proportion of the original applied force was 1.016±0.165. As both values are close to 1 (i.e., identical), this suggested that the traction forces could be satisfactorily recovered using the finite-element based method.

      In response to the reviewer’s recommendations then, additional content has been included in the main text to explain the use of PAM gels and the workings of our 3D TFM pipeline.

      Ref R7. James F. Doyle, Modern Experimental Stress Analysis: Completing the Solution of Partially Specified Problems (John Wiley & Sons, Chichester, 2004).

      Ref R8. Per Christian Hansen, Discrete Inverse Problems: Insight and Algorithms (siam, Philadelphia, 2010).

      Author response image 7.

      (A) shows simulated force field to generate simulated displacements. (B) shows force field reconstructed from simulated displacements with noise.

      Recommendation 3: The authors show nuclear deformation on the hills and use this as evidence for a resultant downward-pointing force vector. This has, indeed, also been observed in other works referenced by the authors (e.g. Werner et al.), and could be interesting evidence to support the current observations, provided the authors also show a nuclear shape on the concave and flat regions. The authors could potentially also characterize this shape change better using higher-resolution data.

      Response 3: We characterized nucleus deformation using Hoechst-stained samples as per recommendation. The deformation is estimated by dividing segmented nuclei volumes by best-fit ellipsoid volumes of same objects. In this way, objects exhibiting minimal bending will lead to values close to 1.0. The obtained graph is shown in figure Author response image 8B (and manuscript Figure 3D).

      Author response image 8.

      (A) an example of deformed nuclei on 50 µm wave hill region. (B) a Violin plot of calculated nuclear deformations across dimensions and features using segmented volume normalized against best-fit ellipsoid volume.

      Our quantifications show a statistically significant difference in nuclei deformation measure medians between hill and valley cells on the 50 µm (0.973 vs 0.982) and 100 µm (0.971 vs 0.979) waves; this indicates that cells on the hills tend to have more deformed nuclei compared to cells in the valleys. Meanwhile, no significant difference was found for a similar comparison on 200 µm (0.978 vs 0.978) samples. For reference, the median found for cells pooled from planar regions was 0.975.

      In response to the reviewer’s suggestions Figure 3 of our manuscript has been updated to include the new results on nuclei deformation. The text has also been updated to account for the new information to support our claims. The statistics are included in a new summary data table in Supplementary File 6.

      Recommendation 4: The U-net for extrusion detection is a central tool used within this study, though the explanation and particularly validation of the tool are somewhat lacking. More clarity in the explanation and more examples of good (or bad) detections would help establish this tool as a more robust component of the data collection (on all geometries).

      Response 4: The architecture of the neural network used in this study is outlined in supplementary figure S5a. To validate the performance of the model, a test dataset consisting of 200 positive examples and 100 negative examples were fed into the network and the resulting prediction was obtained from model. The confusion matrix of the model is shown in supplementary figure S5c. The weighted precision and recall of the model are 0.958 and 0.953 respectively.

      Additionally, we have included examples of false positive and false negative detections in Figure 1-figure supplement 5 (Author response image 8). For false positive detections, these were typically observed to be extrusions that were labelled to have occurred the frame prior to the frame of interest (Author response image 9 bottom sequence). However, as the extrusion process is incomplete in the prior frame, there are still changes in the extruded cell body and the network falsely predicts this as a detection.

      Author response image 9.

      Examples of false negative and false positive extrusions registration.

      Recommendation 5: The authors study the involvement of FAK in the observed curvature-dependent and hydraulic stress-dependent spatial regulation of cell extrusion. In one of the experiments, the authors supplement the cell medium with FAK inhibitors, though only in a hyper-osmotic medium. They show that FAK inhibition counteracts the extrusion-suppressing effect of a hyper-osmotic medium. However, no data is shown on the effect of FAK inhibitors within the control medium. Would the extrusion rates be even higher then?

      Response 4: We proceeded, as suggested by the reviewer, to explore the effects of the FAK inhibitor on MDCK monolayers in our control medium. The results revealed that, at the 3 µM FAK concentration, where cells in sucrose media showed an elevated extrusion rate, monolayers in control medium quickly suffered massive cell death (Author response image 10) similar to what was seen when 6 µM FAK was introduced to sucrose medium.

      This finding suggests that osmolarity protects against FAK inhibitors in a dose dependent manner. Moreover, as cell extrusions require an intact monolayer, its rates cannot increase indefinitely: a point will be reached where an intact monolayer can no longer be maintained.

      We have updated the main text of our article to mention this observation, and also included a new time-lapse (Video 22) to demonstrate the effect.

      Author response image 10.

      Timelapse snapshot of MDCK monolayers over waves 4 hours after inclusion of focal adhesion kinase inhibitor.

      Recommendation 6: The supplementary videos show two fields of view next to each other, which is not immediately clear to the viewer. I strongly advise the authors to add a clear border between the two panels, so that it is clear that the cells from one panel are not migrating into the next panel.

      Response 6: A distinctive border has been added to the movies to separate panels showing different focal planes of the same stack.

      Recommendation 7: The general quality and layout of the figures could be improved. Some figures would benefit from higher-resolution or larger cell images (e.g. Figure 2A, C, D), and the organisation of subpanels could be improved (e.g. especially in Figure 2). The box plots and bar graphs are also not consistent throughout the manuscript in terms of colouring and style, which should be improved.

      Response 7: We have enlarged the figures in question accordingly, at the cost of reducing some information. However, the full scope of the sub-figures remains accessible in the supplementary movies. We have also tried to change the placement of the panels to improve readability. We have also adjusted the valley, hill, and flat coloring scheme for the extrusion boxplots in Figures 1 and 2 to make them consistent.

      Recommendation 8: The graphs in Figures 3E and F are confusing and difficult to interpret. The x-axis states "Position along curve in radians" but it is unclear how to relate this to the position on the wavy substrate. The graphs also have a second vertical axis on the right ("valley-interface-hill"), which adds to the confusion. I would recommend the authors provide more explanation and consider a different approach of plotting this.

      Response 8: We have removed the confusing plot of cross-sectional profile from the force graphs. To indicate positions on the waves, we have augmented radian values with Hill, Interface, and Valley accordingly.

      Recommendation 9: Specify which silicone was used for the low-stiffness silicone substrates in the methods and in the main text.

      Response 9: CY52 has been added to the main-text, next to the first appearance of the word soft silicone, to be consistent with the figures.

      Recommendation 10: The flow lines that are plotted over the RICM data make it difficult to see the underlying RICM images. I would advise to also show the RICM images without the flow lines.

      Response 10: The original movie S15 (now Video 16) showing the RICM overlapped with optical flow paths has now been replaced by a movie showing the same, but with the flow paths and RICM in separate panels.

      Recommendation 11: In the first paragraph of the discussion, the authors write: "And this difference was both dependent on the sense (positive or negative)...". This is superfluous since the authors already mentioned earlier in the paragraph that the convex and concave regions (i.e. different signs of curvature) show differences in extrusion rates.

      Response 11: The sentence has been changed to “And this difference was also dependent on the degree of curvature.”

      Recommendation 12: In the second paragraph of the discussion, the authors mention that "basal fluid spaces under monolayers in hill regions were found consistently smaller than those in valley regions". Is this data shown in the figures of the manuscript? If so, a reference should be made because it was unclear to me.

      Response 12: This statement is an inference from the comparison of the hill and valley RICM grey values. Specifically, RICM intensities are direct surrogates for basal separations (i.e., fluid space (as there cannot be a vacuum)) by virtue of the physics underlying the effect. To be more precise then, “inferred from RICM intensity differences (Figure 2I)” has been added to support the statement.

      Recommendation 13: On page 7 of the discussion, the authors talk about positively and negatively curved surfaces. This type of description should be avoided, as this depends on the definition of the surface normal (i.e. is positive convex or concave?). Rather use convex and concave in this context.

      Response 13: The wording has been changed accordingly.

      Recommendation 14: The label of Table 8 reads "Table 2".

      Response 14: The error has been corrected.

      Reviewer #3

      Recommendation 1: The central finding seems to be opposite to an earlier report (J Cell Sci (2019) 132, jcs222372), where MDCK cells in curved alginate tubes exhibit increased extrusion on a convex surface. I suggest that you comment on possible explanations for the different behaviors.

      Response 1: The article in question primarily reported the phenomenon of MDCK and J3B1A monolayers detaching from the concave alginate tube walls coated with Matrigel. The authors attributed this to the curvature induced out-of-plane forces towards the center of the tubes. Up to this point, the findings and interpretation are consistent with our current study where we also find a similar force trend in concave regions.

      To further lend support to the importance of curvature in inducing detachment, the authors cleverly bent the tubes to introduce asymmetry in curvature between outer and inner surfaces. Specifically, the outside bend is concave in both principal directions, whereas the inside bend is convex in one of its principal directions. As expected, the authors found that detachment rates from the outer surface were much larger compared to the inner one. Again, the observations and interpretations are consistent with our own findings; the convex direction will generate out-of-plane forces pointing into the surface, serving to stabilize the monolayer against the substrate. It should be noted however, since the inner-side tube is characterized by both convex and concave curvatures in its two principal directions, the resulting behavior of overlaying monolayers will depend on which of the two resulting forces become dominant. So, for gradual bends, one should expect the monolayers to still be able to detach from the inner tube surface. This is what was reported in their findings.

      For their extrusion observations, I am surprised. Because their whole material (hydrogels) is presumably both solute and water permeable, I would be more inclined to expect very few extrusions irrespective of curvature. This is indeed the case with our study of MDCKs on PAM hydrogels, where the hydrogel substrate effectively buffers against the quick build-up of solute concentration and basal hydraulic stress. Without the latter, concave monolayer forces alone are unlikely to be able to disrupt cell focal adhesions. Indeed, the detachments seen in their study are more likely by exfoliation of Matrigel rather than pulling cells off Matrigel matrix entirely.

      My guess is that the extrusions seen in their study are solely of the canonical crowding effect. If this was the case, then the detached monolayer on the outside bend could buffer against crowding pressure by buckling. Meanwhile, the monolayer on the inside bend, being attached to the surface, can only regulate crowding pressure by removing cells through extrusions. This phenomenon should be particular to soft matrices such as Matrigel. Using stiffer and covalently bonded ECM should be sufficient to prevent monolayers from detaching, leading to similar extrusion behaviors. In response to the reviewer’s recommendation then, we have included a short paragraph to state the points discussed in this response.

      Recommendation 2: Fig 3E, F: The quantities displayed on the panels are not forces, but have units of pressure (or stress).

      Response 2: we have changed “force” to “stress” according to the reviewer’s suggestion. The reason we kept the use of force in the original text was due to the fact that we were reconstructing forces. Due to discretization, the resulting forces will inevitably be assigned to element nodes. In between the nodes, in the faces, there will be no information. So, in order to have some form of continuity to plot, the face forces are obtained by averaging the 4 nodes around the element face. Unfortunately, element face areas are not typically of the same size, therefore the average forces obtained needs to be further normalized against the face area, leading to a quantity that has units of stress.

      Recommendation 3: Fig 2D: Asterisks are hard to see.

      Response 3: the color of the asterisks has been changed to green for better clarity against a B&W background.

      Recommendation 4: p 19, l 7: Word missing in "the of molding"

      Response 4: the typo has been amended to “the molding of”.

    1. Author response

      Reviewer #1 (Public Review):

      Loss of skeletal muscle tissue from traumatic injury is debilitating. Restoring muscle mass and function remains a challenge. Using a mouse model, the authors performed punch biopsy injuries of the tibialis anterior in which the volume of muscle loss was varied to result in either successful muscle regeneration with a smaller injury or the unsuccessful outcome of fibrosis with a larger injury. For both conditions, a novel lipidomic profiling approach was used to evaluate pro-inflammatory and anti-inflammatory lipids at key time points post-injury with respect to collagen deposition, macrophage infiltration, muscle fiber regeneration, and force produced during isometric contractions. A key finding was that while all lipids increased at 3 days post-injury (dpi) and then declined through 14 dpi, pro-inflammatory lipids remained elevated during recovery from greater muscle loss which led to fibrosis. Maresin 1 was identified as an anti-inflammatory lipid that, when injected into injured muscle, reduced fibrosis, improved muscle regeneration, and partially restored the strength of contraction.

      Strengths: The metabolipidomic profiling demonstrated here represents a novel approach to identifying pro-inflammatory and anti-inflammatory mediators of successful vs unsuccessful skeletal muscle regeneration. These findings may translate into a new therapeutic approach for promoting successful regeneration following volumetric muscle loss.

      Weaknesses: Certain aspects of the data are overinterpreted; while some measures appear to have an adequate sample size to make sound conclusions, other measures are likely to lack sufficient statistical power given their variability. Presentation of the results would be strengthened by adhering to consistent terminology and labeling of figures throughout; specific examples are identified in recommendations to the authors. Several of the images used to illustrate differences between treatments are unconvincing because differences are not readily.

      We agree with the reviewer and have scaled back some of the interpretation as well as clarified the sample sizes. We have also amended the text to maintain a consistent terminology.

      Reviewer #2 (Public Review):

      The study is novel and valuable to the field and provides new and important insights into the role of lipid mediators in VML injuries. By expanding our understanding of the mechanisms that regulate muscle regeneration following VML injuries, the study has the potential to guide the development of novel therapeutic interventions that promote tissue repair and recovery. The data presented in the manuscript is of good quality. The findings and conclusions are supported by a variety of different analyses (e.g., gene expression, histology, flow cytometry).

      Despite the strengths of the study, some limitations are identified. Specifically, the impact of maresin 1 on macrophage phenotypes (M1/M2) could have been explored in more detail using histological or protein expression analysis. Moreover, additional data are needed to substantiate the claims about increased muscle regeneration. Lastly, the study does not address myofiber innervation, myofiber-type transitions, or motor unit remodeling.

      We thank the reviewer for the suggestions and have performed a more in-depth exploration of macrophage phenotypes through additional scRNA-sequencing analysis. We have also included additional data describing how Maresin 1 impacts muscle stem cells through cyclic AMP. Respectfully, profiling myofiber innervation, motor unit remodeling and myofiber-type transitions are beyond the scope of this manuscript.

    1. Author Response

      Reviewer #1 (Public Review):

      In this work George et al. describe RatInABox, a software system for generating surrogate locomotion trajectories and neural data to simulate the effects of a rodent moving about an arena. This work is aimed at researchers that study rodent navigation and its neural machinery.

      Strengths:

      • The software contains several helpful features. It has the ability to import existing movement traces and interpolate data with lower sampling rates. It allows varying the degree to which rodents stay near the walls of the arena. It appears to be able to simulate place cells, grid cells, and some other features.

      • The architecture seems fine and the code is in a language that will be accessible to many labs.

      • There is convincing validation of velocity statistics. There are examples shown of position data, which seem to generally match between data and simulation.

      Weaknesses:

      • There is little analysis of position statistics. I am not sure this is needed, but the software might end up more powerful and the paper higher impact if some position analysis was done. Based on the traces shown, it seems possible that some additional parameters might be needed to simulate position/occupancy traces whose statistics match the data.

      Thank you for this suggestion. We have added a new panel to figure 2 showing a histogram of the time the agent spends at positions of increasing distance from the nearest wall. As you can see, RatInABox is a good fit to the real locomotion data: positions very near the wall are under-explored (in the real data this is probably because whiskers and physical body size block positions very close to the wall) and positions just away from but close to the wall are slightly over explored (an effect known as thigmotaxis, already discussed in the manuscript).

      As you correctly suspected, fitting this warranted a new parameter which controls the strength of the wall repulsion, we call this “wall_repel_strength”. The motion model hasn’t mathematically changed, all we did was take a parameter which was originally a fixed constant 1, unavailable to the user, and made it a variable which can be changed (see methods section 6.1.3 for maths). The curves fit best when wall_repel_strength ~= 2. Methods and parameters table have been updated accordingly. See Fig. 2e.

      • The overall impact of this work is somewhat limited. It is not completely clear how many labs might use this, or have a need for it. The introduction could have provided more specificity about examples of past work that would have been better done with this tool.

      At the point of publication we, like yourself, also didn’t know to what extent there would be a market for this toolkit however we were pleased to find that there was. In its initial 11 months RatInABox has accumulated a growing, global user base, over 120 stars on Github and north of 17,000 downloads through PyPI. We have accumulated a list of testimonials[5] from users of the package vouching for its utility and ease of use, four of which are abridged below. These testimonials come from a diverse group of 9 researchers spanning 6 countries across 4 continents and varying career stages from pre-doctoral researchers with little computational exposure to tenured PIs. Finally, not only does the community use RatInABox they are also building it: at the time of writing RatInABx has received logged 20 GitHub “Issues” and 28 “pull requests” from external users (i.e. those who aren’t authors on this manuscript) ranging from small discussions and bug-fixes to significant new features, demos and wrappers.

      Abridged testimonials:

      ● “As a medical graduate from Pakistan with little computational background…I found RatInABox to be a great learning and teaching tool, particularly for those who are underprivileged and new to computational neuroscience.” - Muhammad Kaleem, King Edward Medical University, Pakistan

      ● “RatInABox has been critical to the progress of my postdoctoral work. I believe it has the strong potential to become a cornerstone tool for realistic behavioural and neuronal modelling” - Dr. Colleen Gillon, Imperial College London, UK

      ● “As a student studying mathematics at the University of Ghana, I would recommend RatInABox to anyone looking to learn or teach concepts in computational neuroscience.” - Kojo Nketia, University of Ghana, Ghana

      ● “RatInABox has established a new foundation and common space for advances in cognitive mapping research.” - Dr. Quinn Lee, McGill, Canada

      The introduction continues to include the following sentence highlighting examples of past work which relied of generating artificial movement and/or neural dat and which, by implication could have been done better (or at least accelerated and standardised) using our toolbox.

      “Indeed, many past[13, 14, 15] and recent[16, 17, 18, 19, 6, 20, 21] models have relied on artificially generated movement trajectories and neural data.”

      • Presentation: Some discussion of case studies in Introduction might address the above point on impact. It would be useful to have more discussion of how general the software is, and why the current feature set was chosen. For example, how well does RatInABox deal with environments of arbitrary shape? T-mazes? It might help illustrate the tool's generality to move some of the examples in supplementary figure to main text - or just summarize them in a main text figure/panel.

      Thank you for this question. Since the initial submission of this manuscript RatInABox has been upgraded and environments have become substantially more “general”. Environments can now be of arbitrary shape (including T-mazes), boundaries can be curved, they can contain holes and can also contain objects (0-dimensional points which act as visual cues). A few examples are showcased in the updated figure 1 panel e.

      To further illustrate the tools generality beyond the structure of the environment we continue to summarise the reinforcement learning example (Fig. 3e) and neural decoding example in section 3.1. In addition to this we have added three new panels into figure 3 highlighting new features which, we hope you will agree, make RatInABox significantly more powerful and general and satisfy your suggestion of clarifying utility and generality in the manuscript directly.

      On the topic of generality, we wrote the manuscript in such a way as to demonstrate how the rich variety of ways RatInABox can be used without providing an exhaustive list of potential applications. For example, RatInABox can be used to study neural decoding and it can be used to study reinforcement learning but not because it was purpose built with these use-cases in mind. Rather because it contains a set of core tools designed to support spatial navigation and neural representations in general. For this reason we would rather keep the demonstrative examples as supplements and implement your suggestion of further raising attention to the large array of tutorials and demos provided on the GitHub repository by modifying the final paragraph of section 3.1 to read:

      “Additional tutorials, not described here but available online, demonstrate how RatInABox can be used to model splitter cells, conjunctive grid cells, biologically plausible path integration, successor features, deep actor-critic RL, whisker cells and more. Despite including these examples we stress that they are not exhaustive. RatInABox provides the framework and primitive classes/functions from which highly advanced simulations such as these can be built.”

      Reviewer #3 (Public Review):

      George et al. present a convincing new Python toolbox that allows researchers to generate synthetic behavior and neural data specifically focusing on hippocampal functional cell types (place cells, grid cells, boundary vector cells, head direction cells). This is highly useful for theory-driven research where synthetic benchmarks should be used. Beyond just navigation, it can be highly useful for novel tool development that requires jointly modeling behavior and neural data. The code is well organized and written and it was easy for us to test.

      We have a few constructive points that they might want to consider.

      • Right now the code only supports X,Y movements, but Z is also critical and opens new questions in 3D coding of space (such as grid cells in bats, etc). Many animals effectively navigate in 2D, as a whole, but they certainly make a large number of 3D head movements, and modeling this will become increasingly important and the authors should consider how to support this.

      Agents now have a dedicated head direction variable (before head direction was just assumed to be the normalised velocity vector). By default this just smoothes and normalises the velocity but, in theory, could be accessed and used to model more complex head direction dynamics. This is described in the updated methods section.

      In general, we try to tread a careful line. For example we embrace certain aspects of physical and biological realism (e.g. modelling environments as continuous, or fitting motion to real behaviour) and avoid others (such as the biophysics/biochemisty of individual neurons, or the mechanical complexities of joint/muscle modelling). It is hard to decide where to draw but we have a few guiding principles:

      1. RatInABox is most well suited for normative modelling and neuroAI-style probing questions at the level of behaviour and representations. We consciously avoid unnecessary complexities that do not directly contribute to these domains.

      2. Compute: To best accelerate research we think the package should remain fast and lightweight. Certain features are ignored if computational cost outweighs their benefit.

      3. Users: If, and as, users require complexities e.g. 3D head movements, we will consider adding them to the code base.

      For now we believe proper 3D motion is out of scope for RatInABox. Calculating motion near walls is already surprisingly complex and to do this in 3D would be challenging. Furthermore all cell classes would need to be rewritten too. This would be a large undertaking probably requiring rewriting the package from scratch, or making a new package RatInABox3D (BatInABox?) altogether, something which we don’t intend to undertake right now. One option, if users really needed 3D trajectory data they could quite straightforwardly simulate a 2D Environment (X,Y) and a 1D Environment (Z) independently. With this method (X,Y) and (Z) motion would be entirely independent which is of unrealistic but, depending on the use case, may well be sufficient.

      Alternatively, as you said that many agents effectively navigate in 2D but show complex 3D head and other body movements, RatInABox could interface with and feed data downstream to other softwares (for example Mujoco[11]) which specialise in joint/muscle modelling. This would be a very legitimate use-case for RatInABox.

      We’ve flagged all of these assumptions and limitations in a new body of text added to the discussion:

      “Our package is not the first to model neural data[37, 38, 39] or spatial behaviour[40, 41], yet it distinguishes itself by integrating these two aspects within a unified, lightweight framework. The modelling approach employed by RatInABox involves certain assumptions:

      1. It does not engage in the detailed exploration of biophysical[37, 39] or biochemical[38] aspects of neural modelling, nor does it delve into the mechanical intricacies of joint and muscle modelling[40, 41]. While these elements are crucial in specific scenarios, they demand substantial computational resources and become less pertinent in studies focused on higher-level questions about behaviour and neural representations.

      2. A focus of our package is modelling experimental paradigms commonly used to study spatially modulated neural activity and behaviour in rodents. Consequently, environments are currently restricted to being two-dimensional and planar, precluding the exploration of three-dimensional settings. However, in principle, these limitations can be relaxed in the future.

      3. RatInABox avoids the oversimplifications commonly found in discrete modelling, predominant in reinforcement learning[22, 23], which we believe impede its relevance to neuroscience.

      4. Currently, inputs from different sensory modalities, such as vision or olfaction, are not explicitly considered. Instead, sensory input is represented implicitly through efficient allocentric or egocentric representations. If necessary, one could use the RatInABox API in conjunction with a third-party computer graphics engine to circumvent this limitation.

      5. Finally, focus has been given to generating synthetic data from steady-state systems. Hence, by default, agents and neurons do not explicitly include learning, plasticity or adaptation. Nevertheless we have shown that a minimal set of features such as parameterised function-approximator neurons and policy control enable a variety of experience-driven changes in behaviour the cell responses[42, 43] to be modelled within the framework.

      • What about other environments that are not "Boxes" as in the name - can the environment only be a Box, what about a circular environment? Or Bat flight? This also has implications for the velocity of the agent, etc. What are the parameters for the motion model to simulate a bat, which likely has a higher velocity than a rat?

      Thank you for this question. Since the initial submission of this manuscript RatInABox has been upgraded and environments have become substantially more “general”. Environments can now be of arbitrary shape (including circular), boundaries can be curved, they can contain holes and can also contain objects (0-dimensional points which act as visual cues). A few examples are showcased in the updated figure 1 panel e.

      Whilst we don’t know the exact parameters for bat flight users could fairly straightforwardly figure these out themselves and set them using the motion parameters as shown in the table below. We would guess that bats have a higher average speed (speed_mean) and a longer decoherence time due to increased inertia (speed_coherence_time), so the following code might roughly simulate a bat flying around in a 10 x 10 m environment. Author response image 1 shows all Agent parameters which can be set to vary the random motion model.

      Author response image 1.

      • Semi-related, the name suggests limitations: why Rat? Why not Agent? (But its a personal choice)

      We came up with the name “RatInABox” when we developed this software to study hippocampal representations of an artificial rat moving around a closed 2D world (a box). We also fitted the random motion model to open-field exploration data from rats. You’re right that it is not limited to rodents but for better or for worse it’s probably too late for a rebrand!

      • A future extension (or now) could be the ability to interface with common trajectory estimation tools; for example, taking in the (X, Y, (Z), time) outputs of animal pose estimation tools (like DeepLabCut or such) would also allow experimentalists to generate neural synthetic data from other sources of real-behavior.

      This is actually already possible via our “Agent.import_trajectory()” method. Users can pass an array of time stamps and an array of positions into the Agent class which will be loaded and smoothly interpolated along as shown here in Fig. 3a or demonstrated in these two new papers[9,10] who used RatInABox by loading in behavioural trajectories.

      • What if a place cell is not encoding place but is influenced by reward or encodes a more abstract concept? Should a PlaceCell class inherit from an AbstractPlaceCell class, which could be used for encoding more conceptual spaces? How could their tool support this?

      In fact PlaceCells already inherit from a more abstract class (Neurons) which contains basic infrastructure for initialisation, saving data, and plotting data etc. We prefer the solution that users can write their own cell classes which inherit from Neurons (or PlaceCells if they wish). Then, users need only write a new get_state() method which can be as simple or as complicated as they like. Here are two examples we’ve already made which can be found on the GitHub:

      Author response image 2.

      Phase precession: PhasePrecessingPlaceCells(PlaceCells)[12] inherit from PlaceCells and modulate their firing rate by multiplying it by a phase dependent factor causing them to “phase precess”.

      Splitter cells: Perhaps users wish to model PlaceCells that are modulated by recent history of the Agent, for example which arm of a figure-8 maze it just came down. This is observed in hippocampal “splitter cell”. In this demo[1] SplitterCells(PlaceCells) inherit from PlaceCells and modulate their firing rate according to which arm was last travelled along.

      • This a bit odd in the Discussion: "If there is a small contribution you would like to make, please open a pull request. If there is a larger contribution you are considering, please contact the corresponding author3" This should be left to the repo contribution guide, which ideally shows people how to contribute and your expectations (code formatting guide, how to use git, etc). Also this can be very off-putting to new contributors: what is small? What is big? we suggest use more inclusive language.

      We’ve removed this line and left it to the GitHub repository to describe how contributions can be made.

      • Could you expand on the run time for BoundaryVectorCells, namely, for how long of an exploration period? We found it was on the order of 1 min to simulate 30 min of exploration (which is of course fast, but mentioning relative times would be useful).

      Absolutely. How long it takes to simulate BoundaryVectorCells will depend on the discretisation timestep and how many neurons you simulate. Assuming you used the default values (dt = 0.1, n = 10) then the motion model should dominate compute time. This is evident from our analysis in Figure 3f which shows that the update time for n = 100 BVCs is on par with the update time for the random motion model, therefore for only n = 10 BVCs, the motion model should dominate compute time.

      So how long should this take? Fig. 3f shows the motion model takes ~10-3 s per update. One hour of simulation equals this will be 3600/dt = 36,000 updates, which would therefore take about 72,000*10-3 s = 36 seconds. So your estimate of 1 minute seems to be in the right ballpark and consistent with the data we show in the paper.

      Interestingly this corroborates the results in a new inset panel where we calculated the total time for cell and motion model updates for a PlaceCell population of increasing size (from n = 10 to 1,000,000 cells). It shows that the motion model dominates compute time up to approximately n = 1000 PlaceCells (for BoundaryVectorCells it’s probably closer to n = 100) beyond which cell updates dominate and the time scales linearly.

      These are useful and non-trivial insights as they tell us that the RatInABox neuron models are quite efficient relative to the RatInABox random motion model (something we hope to optimise further down the line). We’ve added the following sentence to the results:

      “Our testing (Fig. 3f, inset) reveals that the combined time for updating the motion model and a population of PlaceCells scales sublinearly O(1) for small populations n > 1000 where updating the random motion model dominates compute time, and linearly for large populations n > 1000. PlaceCells, BoundaryVectorCells and the Agent motion model update times will be additionally affected by the number of walls/barriers in the Environment. 1D simulations are significantly quicker than 2D simulations due to the reduced computational load of the 1D geometry.”

      And this sentence to section 2:

      “RatInABox is fundamentally continuous in space and time. Position and velocity are never discretised but are instead stored as continuous values and used to determine cell activity online, as exploration occurs. This differs from other models which are either discrete (e.g. “gridworld” or Markov decision processes) or approximate continuous rate maps using a cached list of rates precalculated on a discretised grid of locations. Modelling time and space continuously more accurately reflects real-world physics, making simulations smooth and amenable to fast or dynamic neural processes which are not well accommodated by discretised motion simulators. Despite this, RatInABox is still fast; to simulate 100 PlaceCell for 10 minutes of random 2D motion (dt = 0.1 s) it takes about 2 seconds on a consumer grade CPU laptop (or 7 seconds for BoundaryVectorCells).”

      Whilst this would be very interesting it would likely represent quite a significant edit, requiring rewriting of almost all the geometry-handling code. We’re happy to consider changes like these according to (i) how simple they will be to implement, (ii) how disruptive they will be to the existing API, (iii) how many users would benefit from the change. If many users of the package request this we will consider ways to support it.

      • In general, the set of default parameters might want to be included in the main text (vs in the supplement).

      We also considered this but decided to leave them in the methods for now. The exact value of these parameters are subject to change in future versions of the software. Also, we’d prefer for the main text to provide a low-detail high-level description of the software and the methods to provide a place for keen readers to dive into the mathematical and coding specifics.

      • It still says you can only simulate 4 velocity or head directions, which might be limiting.

      Thanks for catching this. This constraint has been relaxed. Users can now simulate an arbitrary number of head direction cells with arbitrary tuning directions and tuning widths. The methods have been adjusted to reflect this (see section 6.3.4).

      • The code license should be mentioned in the Methods.

      We have added the following section to the methods:

      6.6 License RatInABox is currently distributed under an MIT License, meaning users are permitted to use, copy, modify, merge publish, distribute, sublicense and sell copies of the software.

    1. Author Response

      LD Score regression (LDSC) is a software tool widely used in the field of genome-wide association studies (GWAS) for estimating heritabilities, genetic correlations, the extent of confounding, and biological enrichment. LDSC is for the most part not regarded as an accurate estimator of \emph{absolute} heritability (although useful for relative comparisons). It is relied on primarily for its other uses (e.g., estimating genetic correlations). The authors propose a new method called \texttt{i-LDSC}, extending the original LDSC in order to estimate a component of genetic variance in addition to the narrow-sense heritability---epistatic genetic variance, although not necessarily all of it. Epistasis in quantitative genetics refers to the component of genetic variance that cannot be captured by a linear model regressing total genetic values on single-SNP genotypes. \texttt{i-LDSC} seems aimed at estimating that part of the epistatic variance residing in statistical interactions between pairs of SNPs. To simplify, the basic model of \texttt{i-LDSC} for two SNPs $X_1$ and $X_2$ is

      \begin{equation}\label{eq:twoX} Y = X_1 \beta_1 + X_2 \beta_2 + X_1 X_2 \theta + E, \end{equation}

      and estimation of the epistatic variance associated with the product term proceeds through a variant of the original LD Score that measures the extent to which a SNP tags products of genotypes (rather than genotypes themselves). The authors conducted simulations to test their method and then applied it to a number of traits in the UK Biobank and Biobank Japan. They found that for all traits the additive genetic variance was larger than the epistatic, but for height the absolute size of the epistatic component was estimated to be non-negligible. An interpretation of the authors' results that perhaps cannot be ruled out, however, is that pairwise epistasis overall does not make a detectable contribution to the variance of quantitative traits.

      We thank the reviewer for carefully reading of our manuscript and we appreciate the constructive comments. Our responses and edits to the specific major comments and minor issues are given below.

      Major Comments

      This paper has a lot of strong points, and I commend the authors for the effort and ingenuity expended in tackling the difficult problem of estimating epistatic (non-additive) genetic variance from GWAS summary statistics. The mere possibility of the estimated univariate regression coefficient containing a contribution from epistasis, as represented in the manuscript's Equation~3 and elsewhere, is intriguing in and of itself.

      Is \texttt{i-LDSC} Estimating Epistasis?

      Perhaps the issue that has given me the most pause is uncertainty over whether the paper's method is really estimating the non-additive genetic variance, as this has been traditionally defined in quantitative genetics with great consequences for the correlations between relatives and evolutionary theory (Fisher, 1930, 1941; Lynch & Walsh, 1998; Burger, 2000; Ewens, 2004).

      Let us call the expected phenotypic value of a given multiple-SNP genotype the \emph{total genetic value}. If we apply least-squares regression to obtain the coefficients of the SNPs in a simple linear model predicting the total genetic values, then the partial regression coefficients are the \emph{average effects of gene substitution} and the variance in the predicted values resulting from the model is called the \emph{additive genetic variance}. (This is all theoretical and definitional, not empirical. We do not actually perform this regression.) The variance in the residuals---the differences between the total genetic values and the additive predicted values---is the \emph{non-additive genetic variance}. Notice that this is an orthogonal decomposition of the variance in total genetic values. Thus, in order for the variance in $\mathbf{W}\bm{\theta}$ to qualify as the non-additive genetic variance, it must be orthogonal to $\mathbf{X} \bm{\beta}$.

      At first, I very much doubted whether this is generally true. And I was not reassured by the authors' reply to Reviewer~1 on this point, which did not seem to show any grasp of the issue at all. But to my surprise I discovered in elementary simulations of Equation~\ref{eq:twoX} above that for mean-centered $X_1$ and $X_2$, $(X_1 \beta_1 + X_2 \beta_2)$ is uncorrelated with $X_1 X_2 \theta$ for seemingly arbitrary correlation between $X_1$ and $X_2$. A partition of the outcome's variance between these two components is thus an orthogonal decomposition after all. Furthermore, the result seems general for any number of independent variables and their pairwise products. I am also encouraged by the report that standard and interaction LD Scores are ``lowly correlated' (line~179), meaning that the standard LDSC slope is scarcely affected by the inclusion of interaction LD Scores in the regression; this behavior is what we should expect from an orthogonal decomposition.

      I have therefore come to the view that the additional variance component estimated by \texttt{i-LDSC} has a close correspondence with the epistatic (non-additive) genetic variance after all.

      In order to make this point transparent to all readers, however, I think that the authors should put much more effort into placing their work into the traditional framework of the field. It was certainly not intuitive to multiple reviewers that $\mathbf{X}\bm{\beta}$ is orthogonal to $\mathbf{W}\bm{\theta}$. There are even contrary suggestions. For if $(\mathbf{X}\bm{\beta})^\intercal \mathbf{W} \bm{\theta} = \bm{\beta}^\intercal \mathbf{X}^\intercal \mathbf{W} \bm{\theta} $ is to equal zero, we know that we can't get there by $\mathbf{X}^\intercal \mathbf{W}$ equaling zero because then the method has nothing to go on (e.g., line~139). We thus have a quadratic form---each term being the weighted product of an average (additive) effect and an interaction coefficient---needing to cancel out to equal zero. I wonder if the authors can put forth a rigorous argument or compelling intuition for why this should be the case.

      In the case of two polymorphic sites, quantitative genetics has traditionally partitioned the total genetic variance into the following orthogonal components:

      \begin{itemize}

      \item additive genetic variance, $\sigma^2_A$, the numerator of the narrow-sense heritability;

      \item dominance genetic variance, $\sigma^2_D$;

      \item additive-by-additive genetic variance, $\sigma^2_{AA}$;

      \item additive-by-dominance genetic variance, $\sigma^2_{AD}$; and

      \item dominance-by-dominance genetic variance, $\sigma^2_{DD}$.

      \end{itemize}

      See Lynch and Walsh (1998, pp. 88-92) for a thorough numerical example. This decomposition is not arbitrary or trivial, since each component has a distinct coefficient in the correlations between relatives. Is it possible for the authors to relate the variance associated with their $\mathbf{W}\bm{\theta}$ to this traditional decomposition? Besides justifying the work in this paper, the establishment of a relationship can have the possible practical benefit of allowing \texttt{i-LDSC} estimates of non-additive genetic variance to be checked against empirical correlations between relatives. For example, if we know from other methods that $\sigma^2_D$ is negligible but that \texttt{i-LDSC} returns a sizable $\sigma^2_{AA}$, we might predict that the parent-offspring correlation should be equal to the sibling correlation; a sizable $\sigma^2_D$ would make the sibling correlation higher. Admittedly, however, such an exercise can get rather complicated for the variance contributed by pairs of SNPs that are close together (Lynch & Walsh, 1998, pp. 146-152).

      I would also like the authors to clarify whether LDSC consistently overestimates the narrow-sense heritability in the case that pairwise epistasis is present. The figures seem to show this. I have conflicting intuitions here. On the one hand, if GWAS summary statistics can be inflated by the tagging of epistasis, then it seems that LDSC should overestimate heritability (or at least this should be an upwardly biasing factor; other factors may lead the net bias to be different). On the other hand, if standard and interaction LD Scores are lowly correlated, then I feel that the inclusion of interaction LD Score in the regression should not strongly affect the coefficient of the standard LD Score. Relatedly, I find it rather curious that \texttt{i-LDSC} seems increasingly biased as the proportion of genetic variance that is non-additive goes up---but perhaps this is not too important, since such a high ratio of narrow-sense to broad-sense heritability is not realistic.

      We thank the reviewer for taking the time to thoughtfully offer more context on how we might situate the i-LDSC framework within the greater context of traditional quantitative genetics. We now formalize the interaction component used in the i-LDSC model as an estimate of the phenotypic variance explained by additive-by-additive interactions between genetic variants (which we denote by 𝜎" to follow the conventional notation). In the newly revised Material and Methods, we also show how the i-LDSC model can be formulated to include dominance effects in a more general framework. Our updated derivations provide two key takeaways.

      First, we assume that the additive and interaction effect sizes in the general model (𝜷,𝜽) are each normally distributed with variances proportional to their individual contributions to trait heritability: 𝛽& ∼ 𝒩(0, 𝜎"), 𝜃' ∼ 𝒩(0, 𝜎" ). This independence assumption implies that the additive and non- $ $$ additive components 𝑿𝜷 and 𝑾𝜽 are orthogonal where 𝔼[𝜷⊺𝑿⊺𝑾𝜽] = 𝔼[𝜷⊺]𝑿⊺𝑾𝔼[𝜽] = 𝟎. This is important because, as the reviewer points out, it means that there is a unique partitioning of genetic variance when studying a trait of interest. In the revised version of the manuscript, we show this derivation in the main text (see lines 129-143). We also extend this derivation in the Materials and Methods where we show the same result even after we include the presence of dominance effects in the generative model (see lines 415-417 and 438-457).

      Second, we show that the genotype matrix 𝑿 and the matrix of genetic interactions 𝑾 are not linearly dependent because the additive-by-additive effects between two SNPs are encoded as the Hadamard product of two genotypic vectors in the form 𝒘! = 𝒙" ∘ 𝒙# (which is a nonlinear function of the genotypes). Linear dependence would have implied that one could find a transformation between a SNP and an interaction term in the form 𝒘! = 𝑐 × 𝒙" for some constant 𝑐. However, despite their linear independence, 𝑿 and 𝑾 are themselves not orthogonal and still have a nonzero correlation. This implies that the inner product between genotypes and their interactions is nonzero 𝑿⊺𝑾 ≠ 𝟎. To see this, we focus on a focal SNP 𝒙& and consider three different types of interactions:

      • Scenario I: Interaction between a focal SNP with itself (𝒙" ∘ 𝒙").
      • Scenario II: Interaction between a focal SNP with a different SNP (𝒙" ∘ 𝒙#).
      • Scenario III: Interaction between a focal SNP with a pair of different SNPs (𝒙# ∘ 𝒙$).

      In the Materials and Methods of the revised manuscript, we now provide derivations showing when would expect nonzero correlation between 𝑿 and 𝑾 which rely on the fact that: (1) we assume that genotypes have been mean-centered and scaled to have unit variance, and (2) under Hardy-Weinberg equilibrium, SNPs marginally follow a binomial distribution 𝒙& ∼ 𝐵𝑖𝑛(2, 𝑝) where 𝑝 represents the minor allele frequency (MAF) (Wray et al. 2007, Genome Res; Lippert et al. 2013, Sci Rep). These new additions are given in new lines 460-485).

      Lastly, we agree with the reviewer that our results indicate that LDSC inflates estimates of SNP- based narrow-sense heritability. Our intuition for why this happens is largely consistent with the reviewer’s first point: since GWAS summary statistics can be inflated by the tagging of non- additive genetic variance, then it makes sense that LDSC should overestimate heritability. LDSC uses a univariate regression without the inclusion of cis-interaction scores. A simple consequence from “omitted variable bias” is likely happening where, since LDSC does not explicitly account for contributions from the tagged non-additive components which also contribute to the variance in the GWAS summary statistics, the estimate for the coefficient 𝜎" becomes slightly inflated.

      How Much Epistasis Is \texttt{i-LDSC} Detecting?

      I think the proper conclusion to be drawn from the authors' analyses is that statistically significant epistatic (non-additive) genetic variance was not detected. Specifically, I think that the analysis presented in Supplementary Table~S6 should be treated as a main analysis rather than a supplementary one, and the results here show no statistically significant epistasis. Let me explain.

      Most serious researchers, I think, treat LDSC as an unreliable estimator of narrow-sense heritability; it typically returns estimates that are too low. Not even the original LDSC paper pressed strongly to use the method for estimating $h^2$ (Bulik-Sullivan et al., 2015). As a practical matter, when researchers are focused on estimating absolute heritability with high accuracy, they usually turn to GCTA/GREML (Evans et al., 2018; Wainschtein et al., 2022).

      One reason for low estimates with LDSC is that if SNPs with higher LD Scores are less likely to be causal or to have large effect sizes, then the slope of univariate LDSC will not rise as much as it ``should' with increasing LD Score. This was a scenario actually simulated by the authors and displayed in their Supplementary Figure~S15. [Incidentally, the authors might have acknowledged earlier work in this vein. A simulation inducing a negative correlation between LD Scores and $\chi^2$ statistics was presented by Bulik-Sullivan et al. (2015, Supplementary Figure 7), and the potentially biasing effect of a correlation over SNPs between LD Scores and contributed genetic variance was a major theme of Lee et al. (2018).] A negative correlation between LD Score and contributed variance does seem to hold for a number of reasons, including the fact that regions of the genome with higher recombination rates tend to be more functional. In short, the authors did very well to carry out this simulation and to show in their Supplementary Figure~S15 that this flaw of LDSC in estimating narrow-sense heritability is also a flaw of \texttt{i-LDSC} in estimating broad-sense heritability. But they should have carried the investigation at least one step further, as I will explain below.

      Another reason for LDSC being a downwardly biased estimator of heritability is that it is often applied to meta-analyses of different cohorts, where heterogeneity (and possibly major but undetected errors by individual cohorts) lead to attenuation of the overall heritability (de Vlaming et al., 2017).

      The optimal case for using LDSC to estimate heritability, then, is incorporating the LD-related annotation introduced by Gazal et al. (2017) into a stratified-LDSC (s-LDSC) analysis of a single large cohort. This is analogous to the calculation of multiple GRMs defined by MAF and LD in the GCTA/GREML papers cited above. When this was done by Gazal et al. (2017, Supplementary Table 8b), the joint impact of the improvements was to increase the estimated narrow-sense heritability of height from 0.216 to 0.534.

      All of this has at least a few ramifications for \texttt{i-LDSC}. First, the authors do not consider whether a relationship between their interaction LD Scores and interaction effect sizes might bias their estimates. (This would be on top of any biasing relationship between standard LD Scores and linear effect sizes, as displayed in Supplementary Figure~S15.) I find some kind of statistical relationship over the whole genome, induced perhaps by evolutionary forces, between \emph{cis}-acting epistasis and interaction LD Scores to be plausible, albeit without intuition regarding the sign of any resulting bias. The authors should investigate this issue or at least mention it as a matter for future study. Second, it might be that the authors are comparing the estimates of broad-sense heritability in Table~1 to the wrong estimates of narrow-sense heritability. Although the estimates did come from single large cohorts, they seem to have been obtained with simple univariate LDSC rather than s-LDSC. When the estimate of $h^2$ obtained with LDSC is too low, some will suspect that the additional variance detected by \texttt{i-LDSC} is simply additive genetic variance missed by the downward bias of LDSC. Consider that the authors' own Supplementary Table~S6 gives s-LDSC heritability estimates that are consistently higher than the LDSC estimates in Table~1. E.g., the estimated $h^2$ of height goes from 0.37 to 0.43. The latter figure cuts quite a bit into the estimated broad-sense heritability of 0.48 obtained with \texttt{i-LDSC}.

      Here we come to a critical point. Lines 282--286 are not entirely clear, but I interpret them to mean that the manuscript's Equation~5 was expanded by stratifying $\ell$ into the components of s-LDSC and this was how the estimates in Supplementary Table~S6 were obtained. If that interpretation is correct, then the scenario of \texttt{i-LDSC} picking up missed additive genetic variance seems rather plausible. At the very least, the increases in broad-sense heritability reported in Supplementary Table~S6 are smaller in magnitude and \emph{not statistically significant}. Perhaps what this means is that the headline should be a \emph{negligible} contribution of pairwise epistasis revealed by this novel and ingenious method, analogous to what has been discovered with respect to dominance (Hivert et al., 2021; Pazokitoroudi et al., 2021; Okbay et al., 2022; Palmer et al., 2023).

      This is an excellent question raised by the reviewer and, again, we really appreciate such a thoughtful and thorough response. First, we completely agree with the reviewer that the s-LDSC estimates previously included in the Supplementary Material should instead be discussed in the main text of the manuscript. In the revision, we have now moved the old Supplemental Table S6 to be the new Table 2. Second, we also agree that the conclusions about the magnitude of additive-by-additive effects should be based upon variance explained when using the cis- interaction score in addition to scores specific to different biological annotations when available, per s-LDSC.

      However, we want to respectfully disagree that the results indicate a negligible contribution of additive-by-additive genetic variance to all the traits we analyzed (see Figure 4D). Although the additive-by-additive genetic variance component is not significant in any trait in the UK Biobank, there is little reason to expect that they would be given the inclusion of 97 other biological annotations from the s-LDSC model. Indeed, in the s-LDSC paper itself the authors look only for enrichment of heritability for a given annotation not a statistically significant test statistic. It also worth noting that jackknife approaches tend to be conservative and yield slightly larger standard errors for hypothesis testing. Taking all the great points that the reviewer mentioned into account, we believe that a moderate stance to the interpretation of our results is one that: (i) emphasizes the importance of using s-LDSC with the cis-interaction score to better assess the variance explained by additive-by-additive interaction effects and (ii) allows for the significance of the additive-by-additive component to not be the only factor when determining the importance of the role of non-additive effects in shaping trait architecture.

      In the revision, we now write the following in lines 331-343:

      Lastly, we performed an additional analysis in the UK Biobank where the cis-interaction scores are included as an annotation alongside 97 other functional categories in the stratified-LD score regression framework and its software s-LDSC (Materials and Methods). Here, s-LDSC heritability estimates still showed an increase with the interaction scores versus when the publicly available functional categories were analyzed alone, but albeit at a much smaller magnitude (Table 2). The contributions from the additive-by-additive component to the overall estimate of genetic variance ranged from 0.005 for MCHC (P = 0.373) to 0.055 for HDL (P = 0.575) (Figures 4C and 4D). Furthermore, in this analysis, the estimates of the additive-by-additive components were no longer statistically significant for any of the traits in the UK Biobank (Table 2). Despite this, these results highlight the ability of the i-LDSC framework to identify sources of “missing” phenotypic variance explained in heritability estimation. Importantly, moving forward, we suggest using the cis- interaction scores with additional annotations whenever they are available as it provides more conservative estimates of the role of additive-by-additive effects on trait architecture.

      Lastly, in the Discussion, we now mention an area of future work would be to explore how the relationship between cis-interaction LD scores and interaction effect sizes might bias heritability estimates from i-LDSC (e.g., similar to the relationship explored standard LD scores and linear effect sizes in Figure 3 – figure supplement 8). See new lines 364-367.

    1. Author Response

      The following is the authors’ response to the current reviews.

      We agree with Reviewer #1 that it is not typical to include primary data in a review, but this seems to be a very unusual situation and it is not unprecedented. We seriously believe that it will significantly dilute the impact of the message if we were to separate this into two papers. We intended initially to do a comprehensive review of the αC-β4 motif as we think it is an extremely important element of secondary structure that has been rather overlooked in the protein kinase field. It is the site where the nucleotide and peptide/protein binding sites converge in the C:PKI complex and also in the RIα holoenzyme, which is also a pseudo-substrate inhibitor. This stable element is highly conserved in all protein kinases, and we think it is an extremely important allosteric site where the kinases differ. Thus, it is highly relevant for this set of Elife papers on kinase allostery. In parallel, we have developed the Local Spatial Pattern (LSP) alignment method for identifying Protein Residue Networks (PRNs) into a robust tool. When the Veglia team, our long-time collaborators, did their NMR analysis of the F100A mutant, which is in the αC-β4 loop, we thus decided to do the LSP analysis. The LSP results were so interesting and striking that we decided immediately to explore the motif further and to specifically compare the various crystal structures that we had solved in the past to see if indeed we had missed some changes. In addition to looking at the backbone, we decided to also look at the side chains and to compare the structures with the simulations. The results proved to be extremely informative and defined a multi-pronged approach that could be used to screen any disease mutation or alternatively as an Ala scan for any residue in any protein. I consider this to be one of the most important papers that I have published in many years. It describes a process for exploring the potential dynamic impact of any disease mutation or any point mutation. We emphasize repeatedly that the hypotheses generated from the computational screen will need to be validated experimentally, but our LSP analysis is a rapid and relatively inexpensive way to screen a set of mutations and predict which will have the greatest impact on dynamics. It is an especially powerful and robust way to identify allosteric sites as the LSP approach maps global changes of a single mutation across the entire protein. These mutants would then be prioritized for experimental follow-up. We are indeed now implementing this more comprehensive strategy in two ways. We are specifically exploring three disease mutations in the αC-β4 loop and, in parallel, are also doing a computational Ala scan of the entire loop (L95-L106); however, this is part of a separate and more comprehensive study that will take much longer. It will be the "Proof-of-Principle” of the hypotheses that we propose in our Elife paper. In addition to the LSP method, the MD simulations provide new and complementary insights into side chain dynamics in contrast to the static crystal structures. We will also begin to compare the αC-β4 loop in other kinases, specifically PKCβ2 and LRRK2, but once again this is part of a separate study and is clearly beyond the scope of this Elife paper. This focus on the αC-β4 loop is an excellent strategy that can be applied to any protein kinase. The LSP approach, however, can obviously also be applied to any protein or any motif, so it is potentially very powerful tool. We think that the impact and potential importance of this paper will be lost if it is split into two papers.

      I went back to look at a recent review that we did for the Biochemical Journal on the PKA Cβ isoform, and there we also included some new primary data in the review. It was never questioned. We believe that our manuscript is so perfectly appropriate for this Elife series that is focus on allostery in kinases, and having our paper back-to-back with the Veglia NMR paper is especially important and relevant. We thus ask you will seriously consider keeping this as a single paper as part of this series on allostery.


      The following is the authors’ response to the original reviews.

      Public Reviews:

      Reviewer #1 (Public Review):

      In this work Wu, J., et al., highlight the importance of a previously overlooked region on kinases: the αC-β4 loop. Using PKA as a model system, the authors extensively describe the conserved regulatory elements within a kinase and how the αC-β4 loop region integrates with these important regulatory elements. Previous biochemical work on a mutation within the αC-β4 loop region, F100A showed that this region is important for the synergistic high affinity binding of ATP and the pseudo substrate inhibitor PKI. In the current manuscript, the authors assess the importance of the αC-β4 loop region using computational methods such as Local Spatial Pattern Alignment (LSP) and MD simulations. LSP analysis of the F100A mutant showed decreased values for degree centrality and betweenness centrality for several key regulatory elements within the kinase which suggests a loss in stability/connectivity in the mutant protein as compared to the WT. Additionally, based on MD simulation data, the side chain of K105, another residue within the αC-β4 loop region had altered dynamics in the F100A mutant as compared to the WT protein. While these changes in the αC-β4 loop region seem to be consistent with the previous biochemical data, the results are preliminary and the manuscript can be strengthened (as the authors themselves acknowledge) with additional experiments. Specific comments/concerns are listed below.

      1. MD simulations were carried out using a binary complex of the catalytic subunit of PKA and ATP/Mg and not the ternary complex of PKA, ATP/Mg and PKI. MD simulations carried out using the ternary complex instead of the binary complex would be more informative, especially on the role of the αC-β3 loop region in the synergistic binding of ATP/Mg and PKI.

      Response 1. Thank you for your suggestion. We have included the data for the MD simulations of the ternary complex in the revised manuscript. This includes a new figure and was indeed informative (Figure 11). Text describing this simulation is also added on pages 15-17. All the changes in the revised manuscript are highlighted in red.

      1. The LSP analysis shows a decrease in degree centrality for the αC-β4 loop region in the F100A mutant compared to the WT protein which suggests a gain in stability in this region for the F100A mutant (Fig. 8A). These results seem to be contradictory to the MD simulation data which shows the side chain dynamics of K105 destabilizes the αC-β4 loop region in the F100A mutant (Fig. 10B). It would be helpful if the authors could clarify this apparent discrepancy.

      Response 2. In Figure 8A, the negative values of degree centrality for the αC-β4 loop region show that the value of DC is less in the WT compared to the mutant, suggesting that those regions are more stable in the mutant. This says that the mutation in the αC-β4 loop region both rigidifies the motif and alters the communication signaling networks between the two lobes.

      The betweenness centrality plots (Figure 8B) also show how the connectivity between the two lobes is altered upon mutation. In the mutant the major connectors become V104 and I150 in the C-lobe, whereas connectivity was primarily governed by K72 (N-lobe) and D184 (C-lobe) in the wt C-subunit. Overall, the mutation causes rigidification of the αC-β4 loop and this leads to loss of allosteric communication between the two lobes.

      The MD simulation results as shown in Figure 10B are not contradictory. This figure shows the overall dynamic profile of the protein, based on principal component analysis (PCA) using the parameter of the residual flexibility. It does not reflect a particular motif's stability or flexibility. Instead it shows that overall the protein upon mutation becomes more dynamic and can sample different conformational states, while, in contrast, the WT protein preferred a single global state of conformation. However, the LSP results showed that, compared to the other parts, the αC-β4 loop, especially V104 at the tip, becomes more stable following mutation, and this has an impact on the allosteric communication between the two lobes. We have added this information into the revised manuscript on page 14, also highlighted in red.

      1. The foundation for the experiments carried out in this paper are based on previous NMR and computational data for the F100A mutant. However, the specific results and conclusions from these previous experiments are not clearly described.

      Response 3. The NMR paper has been already accepted by eLIFE and here we are attaching the bioRxiv paper link, “https://www.biorxiv.org/content/10.1101/2023.09.12.557419v1.”

      Reviewer #1 (Recommendations For The Authors):

      In this work Wu, J., et al., draw attention to the αC-β4 loop, a previously neglected region within kinases. A comprehensive review on the important regulatory elements within the kinase along with how the αC-β4 loop (and the αE helix) integrates with these different regulatory elements is presented well. As the authors themselves acknowledge, the data presented here while promising is preliminary. Additional biochemical, NMR and computational experiments need to be carried out to assess the importance of F100, K105 and other residues in this region.

      1. The authors indicate that previous computational studies predict a flip in the αC-β4 loop in the apo state. It would be helpful to have a figure showing the predicted flip as well as an explanation for the significance of this predicted flip.

      Response 1. The NMR paper has been already accepted by eLIFE and here we are attaching the bioRxiv paper link, “https://www.biorxiv.org/content/10.1101/2023.09.12.557419v1.” The Figures 3 and 6 in that paper described the predicted flip in the αC-β4 loop in the apo state. We did not see a flip in any of our crystal structures, and the LSP analysis which is based on 200 ns simulations is not sufficient to see this major conformational change.

      1. The authors cite previous NMR and biochemical experiments (reference 62), work that has just been submitted to eLife. Access to this work was difficult as this manuscript could not be found on the eLife website.

      Response 2. The NMR paper has been already accepted by eLIFE and here we are attaching the bioRxiv paper link, “https://www.biorxiv.org/content/10.1101/2023.09.12.557419v1.”

    1. Author Response

      The following is the authors’ response to the original reviews.

      eLife assessment

      Despite the importance of T follicular helper cells (Tfh cells) in vaccine-induced humoral responses, it is still unclear which type of Tfh cells (Tfh1, Tfh2, and Tfh17) is critical for generating protective humoral immunity. By using the rhesus macaques model (most similar to human), the authors have addressed this potentially important question and obtained suggestive data that Tfh1 is critical. Although being suggestive, the evidence for the importance of Tfh1 is incomplete.

      Public Reviews:

      Reviewer #1 (Public Review):

      Summary:

      Developing vaccination capable of inducing persistent antibody responses capable of broadly neutralizing HIV strains is of high importance. However, our ability to design vaccines to achieve this is limited by our relative lack of understanding of the role of T-follicular helper (Tfh) subtypes in the responses. In this report Verma et al investigate the effects of different prime and boost vaccination strategies to induce skewed Tfh responses and its relationship to antibody levels. They initially find that live-attenuated measles vaccine, known to be effective at inducing prolonged antibody responses has a significant minority of germinal center Tfh (GC-Tfh) with a Th1 phenotype (GC-Tfh1) and then explore whether a prime and boost vaccination strategy designed to induce GC-Tfh1 is effective in the context of anti-HIV vaccination. They conclude that a vaccine formulation referred to as MPLA before concluding that this is the case.

      Clarification: MPLA serves as the adjuvant, and the vaccine formulation is characterized as a Th1 formulation based on the properties of the adjuvant.

      Strengths:

      While there is a lot of literature on Tfh subtypes in blood, how this relates to the germinal centers is not always clear. The strength of this paper is that they use a relevant model to allow some longitudinal insight into the detailed events of the germinal center Tfh (GC-Tfh) compartment across time and how this related to antibody production.

      Weaknesses:

      The authors focus strongly on the numbers of GC-Tfh1 as a proportion of memory cells and their comparison to GC-Tfh17. There seems to be little consideration of the large proportion of GC-Tfh which express neither CCR6 and CXCR3 and currently no clear reasoning for excluding the majority of GC-Tfh from most analysis. There seems to be an assumption that since the MPLA vaccine has a higher number of GC-Tfh1 that this explains the higher levels of antibodies. There is not sufficient information to make it clear if the primary difference in vaccine efficacy is due to a greater proportion of GC-Tfh1 or an overall increase in GC-Tfh of which the percentage of GC-Tfh1 is relatively fixed.

      Response: We appreciate the reviewer's comment. Indeed, while there is substantial literature on Tfh subtypes in blood; the strength of our study lies in utilizing a relevant model to provide longitudinal insights into the dynamics of the germinal center Tfh (GC-Tfh) compartment over time and its relationship to antibody production. Regarding the concern about the comprehensive analysis of GC Tfh subsets, including GC-Tfh1, GC-Tfh17, and others not expressing CCR6 and/or CXCR3, we fully acknowledge its importance. To address this, we will conduct a detailed analysis of GC Tfh and GC Tfh1 frequencies, encompassing subsets without CCR6 and CXCR3 expression, to provide a more comprehensive view of the GC-Tfh population in our analysis.

      Reviewer #2 (Public Review):

      Summary:

      Anil Verma et al. have performed prime-boost HIV vaccination to enhance HIV-1 Env antibodies in the rhesus macaque model. The authors used two different adjuvants, a cationic liposome-based adjuvant (CAF01) and a monophosphoryl lipid A (MPLA)+QS-21 adjuvant. They demonstrated that these two adjuvants promote different transcriptomes in the GC-TFH subsets. The MPLA+QS-21 adjuvant induces abundant GC TFH1 cells expressing CXCR3 at first priming, while the CAF01 adjuvant predominantly induced GC TFH1/17 cells co-expressing CXCR3 and CCR6. Both adjuvants initiate comparable Env antibody responses. However, MPLA+QS-21 shows more significant IgG1 antibodies binding to gp140 even after 30 weeks.

      The enhancement of memory responses by MPLA+QS-21 consistently associates with the emergence of GC TFH1 cells that preferentially produce IFN-γ.

      Strengths:

      The strength of this manuscript is that all experiments have been done in the rhesus macaque model with great care. This manuscript beautifully indicated that MPLA+QS-21 would be a promising adjuvant to induce the memory B cell response in the HIV vaccine.

      Weaknesses:

      The authors did not provide clear evidence to indicate the functional relevance of GC TFH1 in IgG1 class-switch and B cell memory responses.

      Response. We appreciate the recognition of our meticulous work in the rhesus macaque model and the potential of MPLA+QS-21 as an adjuvant for HIV vaccine-induced humoral immunity. We acknowledge the need to provide clearer evidence of the functional relevance of GC Tfh1 in IgG1 class-switching and B cell memory responses. We will attempt to address this concern in our revisions.

      Recommendations for Authors:

      Reviewer #1:

      1. Is the proportion of GC-Tfh1 within GC-Tfh significantly increased in MPLA vs CAF01? The balance between Tfh1 and Tfh17 data is shown in 4C but appears quite a modest difference. Additionally, it excludes the majority of GC-Tfh since it only considers CCR6 and CXCR3 expressing cells.

      Response. We have now included a comparison of the relative proportions of GC Tfh cells expressing CCR6 and CXCR3, as well as those lacking these markers. Our data now demonstrate an increased presence of Tfh1 within the GC-Tfh population when MPLA is employed at P1w2, as depicted in Figure 4D.

      1. Is there any relationship between GC-Tfh17, 1/17 and non Th1/17 GC-Tfh and antibody levels? In Figure 5C only GC Tfh1 is examined making it impossible to judge if this is specific to GC-Tfh1 or a general relationship between higher total GC-Tfh and antibodies.

      Response. In our revised description of the results, we have mentioned that GC Tfh frequencies correlated with antibody levels (r = 0.6, p < 0.05). However, it is important to note that this correlation was specific to the GC Tfh1 subset and was not observed with other subsets.

      Other points:

      1. The authors make a number of statements that rather exaggerate differences such as stating in the abstract that CAF01 induces Tfh1/17 while MPLA predominantly induces Tfh1. As shown in Figure 4C the majority of CCR6-CXCR3- GC-Tfh induced by CAF01 are GC-Tfh1 i.e. both formulations predominantly induce GC-Tfh1. Also, it is difficult to judge since the data is never provided but the predominant group of GC-Tfh appears to be CCR6-CXCR3- in both cases.

      Response. We acknowledge the need for greater precision in our descriptions. In response, we have addressed this concern by providing the frequencies of CCR6-CXCR3- GC Tfh cells in Figure 4D. We have also included a comparison of the relative frequencies across the adjuvant groups in the Results section (Lines 331-338).

      1. The authors use the term peripheral Tfh (pTfh), it may be better to use the more common term circulating Tfh (cTfh) to avoid confusion with T peripheral helper cells (Tph).

      Response. We appreciate the reviewer's suggestion to use the more commonly accepted term "circulating Tfh (cTfh)" instead of "peripheral Tfh (pTfh)." We have incorporated this change into our manuscript to ensure clarity and avoid potential confusion with "peripheral helper cells (Tph).

      1. Some further labelling of the pie chart in Figure 1G to at least specify larger groups such as Tfh2, Tfh17, Tfh1/17 would be helpful.

      Response. We have incorporated the suggestion and identified cTfh2, cTfh17, and cTfh2/17 cells. We additionally now state in the legend that overlapping pie arcs correspond to specific polarized Tfh subsets denoted by arc color.

      1. A gating example of the CXCR3, CCR6, CCR4 patterns in the GC Tfh would be helpful. "up to 25% of GC Tfh cells expressed CCR6" I think it is better to state the average here since 25% appears an outlier.

      Response. We have now included a gating example of chemokine receptor expression, patterns in the GC Tfh. Additionally, we have revised the statement to mention the median (7%) of GC Tfh cells expressing CCR6 instead of specifying the upper limit.

      1. Figure 1I, does this graph exclude triple negative cells? It's not clear from the figure legend but the numbers do not seem to add up with the graphical proportions shown in figure 1H.

      Response. We have made the necessary clarification in both the results section, figure, and the figure legend to state that the Boolean analysis is based on cells expressing either CXCR3 or CCR6, thus explaining the exclusion of triple negative cells.

      1. Figure 3C. Some label should be added to make clear which violins are from the CD95- and CD95+ groups. There may be too much data in this panel for p values to be legible. Either less graphs or more space may be needed.

      Response. We have updated the Y axis labels in the figure to state that the violin plots show the differences in gene expression between CD95+ CD4 T cells and CD95- CD4 T cells (naive).

      1. Figure 4B. Numbers attached to the gates (1, 17 etc) should be more clearly labeled Tfh1, Tfh17 etc since normally they might be expected to be gate percentages in this format. Gate percentages should also be added.

      Response. We have clearly labeled the subsets as "Tfh1" and "Tfh17," making it easier for readers to interpret the figure. Additionally, we have included gate percentages in the flow plot. Furthermore, the percentages of GC Tfh subsets are now depicted in Figure 4D.

      1. Overlarge and indistinct datapoint symbols are often a problem e.g. Figure 4G most of the CAF01 datapoints are merged into a single blob with no indication of where one point ends or begins. Supplementary figure 5E. Datapoint sizes are large to the extent that the lines are difficult to see. Lines indicating central tendency are often lost.

      Response. We have reworked the graphs (including 4G, now 4I) to ensure clarity,

      1. Generally greater care is needed with graph layout e.g. the B indicating figure 6B is on the graph of figure 6A.

      Response. We have made the necessary adjustment to ensure that the letter "B" correctly corresponds to the graph in Figure 6B.

      1. Figure 6J, the text seems to indicate "higher avidity with MPLA against autologous Env including V1V2 loops." However, the graph seems to indicate lower avidity for V1V2 loops? Response. We appreciate the careful observation. We have rectified this by updating the description in the results section to accurately reflect the graph, which shows higher avidity for V1V2 loops with CAF01.

      2. Figure 6A. The authors state that significantly higher IgG1 was induced but Figure 6A seems to be the only graph lacking an indication of statistical significance.

      Response. We have made the necessary adjustment to ensure that significance symbol is depicted in Figure 6A.

      1. Brackets indicating significance are often unclear. e.g. in Figure 4B MPLA graph there are three groups and a single multipoint bracket with a single result making it unclear which groups are being compared.

      Response. We have added clarification to the legend. It now states that the temporal comparisons in GC Tfh subsets for each vaccine group are made in relation to frequencies at baseline. This revision provides a clear reference point for the significance comparisons and ensures that readers can easily understand which groups are being compared.

      Reviewer #2:

      Overall, the manuscript is well-written and addresses an important issue. However, further investigation is warranted to understand how the MPLA+QS-21 induced GC TFH1 influenced on memory B cell response. This manuscript only showed the correlation between GC TFH1 and antibody responses. If the authors explain adjuvant preference in memory B cell responses, this manuscript could be more considerable for publication.

      1. This reviewer recommends that the author provide more evidence to indicate the functional relevance of GC TFH1 in IgG1 class-switch and B cell memory responses. Some evidence supports that IFN-γ controls the antigen-specific IgG1 responses in humans, but it is still controversial. The author also suggests the involvement of IL-21, but this is also an open question even in the human system. This is also the case in the memory responses. There is no direct link between IFN-γ and memory B cell responses in the human system. The authors need more evidence of how GC TFH1 cell development has more advantages in IgG1 and memory responses than GC TFH1 /17 cells. I believe an antibody blockade of cytokines would be a possible strategy to prove these questions.

      Response. We appreciate the reviewer's valuable suggestion to provide more evidence regarding the functional relevance of GC Tfh1 cells in IgG1 class-switch and B cell memory responses. It is indeed important to establish a direct link between GC Tfh1 cells and these responses, particularly in the context of cytokine skewing. The suggestion of antibody blockade studies to mechanistically link the modulation of the inflammatory milieu to Tfh differentiation and subsequent antibody functions is important. However, we must acknowledge that these studies are currently beyond the scope of our work. We have included this as a limitation in our study, recognizing the need for further studies to address these important questions.

      1. In Fig.5, the authors use different scales to indicate the IgG antibody titer. A shows the log scale, while B shows the linear scale. Moreover, the differences are minimal, even though the authors indicated a significant difference. I am not sure this difference is meaningful.

      Response. To clarify, we used a log scale in Figure 5A to demonstrate temporal changes over the course of vaccination. In Figure 5B, where we are comparing differences across vaccine regimens at week 30, a linear scale was deemed more appropriate, as it allows for a clear representation of the approximately two-fold difference observed. We fully acknowledge that to establish the biological significance of the observed difference, challenge studies will be essential.

    1. Author Response

      Reviewer #1 (Public Review):

      This article proposes a new statistical approach to identify which of several experimenter-defined strategies best describes a biological agent's decisions when such strategies are not fully observable by choices made in a given trial. The statistical approach is described as Bayesian but can be understood instead as computing a smoothed running average (with decay) of the strategies' success at matching choices, with a winner-take-all inference across the rules. The article tests the validity of this statistical approach by applying it to both simulated agents and real data sets in mice and humans. It focuses on dynamically changing environments, where the strategy best describing a biological agent may change rapidly.

      The paper asks an important question, and the analysis is well conducted; the paper is well-written and easy to follow. However, there are several concerns that limit the strength of the contribution. Major concerns include the framing of the method, considerations around the strategy space, limitations in how useful the technique may be, and missing details in analyses.

      Reviewer #2 (Public Review):

      In this study, the goal is to leverage the power of Bayesian inference to estimate online the probability that any given arbitrarily chosen strategy is being used by the decision-maker. By computing the trial-by-trial MAP and variance of the posterior distribution for each candidate strategy, the authors can not only see which strategy is primarily being used at every given time during the task and when strategy changes occur but also detect when the target rule of a learning task becomes the front-running strategy, i.e., when successful learning occurs.

      Strengths:

      1) The proposed approach adds to recent methods for capturing the dynamics of decision-making at finer temporal resolution (trials) (Roy et al., 2021; Ashwood et al., 2022) but it is novel and differs from these in that it is suited especially well for analyzing when learning occurs, or when a rule switches and learning must recommence, and it does not necessitate large numbers of trials.

      2) The manuscript starts with a validation of the approach using synthetic data and then is applied to datasets of trial-based two-alternative forced choice tasks ranging from rodent to non-human primate to human, providing solid evidence of its utility.

      3) Compared to classic procedures for identifying when an animal has learned a contingency which typically needs to be conservative in favor of better accuracy, this method retrieves signs of learning happening earlier (~30 trials earlier on average). This is achieved by identifying the moment (trial) when the posterior probability of the correct "target" rule surpasses the probability of all other strategies. Having greater temporal precision in detecting when learning happens may have a very significant impact on studies of the neural mechanisms of learning.

      4) This approach seems amenable to testing many different strategies depending on the purpose of the analysis. In the manuscript, the authors test target versus non-target strategies (correct versus incorrect) and also in another version of the analysis, they test what they call "exploratory" strategies.

      5) One of the main appeals of this method is its apparent computational simplicity. It necessitates only updating on every trial the parameters of a beta distribution (prior distribution for a given strategy) with the evidence that the behavior on trial was either consistent or inconsistent with the strategy. Two scalars, the mode of the posterior (MAP) and the inverse of the variance, are all that are required for identifying the decision criterion (highest MAP and if tied lowest variance) and the learning criterion (first trial where MAP for target strategy is higher than chance).

      Weaknesses:

      1) It seems like a limitation of this approach is that the candidate strategies to arbitrate between must be known ex-ante. It is not clear how this approach could be applied to uncover latent strategies that are not mixtures of the strategies selected.

      2) Different strategies may be indistinguishable from each other and thus it may not be possible to distinguish between them. Similarly, the fact that two strategies seem to be competing for the highest MAP doesn't necessarily mean that those are correct strategies and perhaps interchangeable as the manuscript seems to suggest.

      3) The decay parameter is a necessary component to make the strategy selection non-stationary and accommodate data sets where the rules are changing throughout the task. However, the choice of the decay parameter value bounds does not seem very principled. Having this parameter as a free-parameter adds a flexibility that seems to have significant effects on when the strategy switch is detected and how stable the detected switch is.

      4) This method is a useful approach for arbitrating between strategies and describing the behavior with a temporal precision that may prove important for studies attempting to tie these precise events to changes in neural activity. However, it seems limited in its explanatory power. In its current form, this method does not provide a prediction of the probability to transition from one strategy to another. And, because the MAP of different strategies may be close at any given moment, it is hard to imagine using this approach to tease out the different "mental states" that represent each strategy being at play.

      The reviewers’ detailed comments, not shared here, helped us considerably to improve the paper, and we thank the reviewers for their time here. We are unsure of the merits of sharing public reviews of a paper that has now changed considerably from the version that these reviews address. Nonetheless we shall address some key points of potential misunderstanding here.

      “The statistical approach is described as Bayesian but can be understood instead as computing a smoothed running average (with decay) of the strategies' success at matching choices, with a winner-take-all inference across the rules.“

      This is inaccurate. The algorithm performs sequential Bayesian updates on the evidence for and against the use of each strategy considered; for a given strategy i, its output at each trial is a fully parameterised posterior distribution over the probability of that strategy being used by the subject.

      We are careful in the paper to separate the algorithm’s output from our further use of that output. To plot and analyse the output we often make use of the maximum a posteriori (MAP) estimate from each posterior. Other choices are of course possible, and we discuss them in the text.<br /> In one set of simulations we quantify the results using a decision rule that chooses the strategy with the highest MAP - this is presumably the “winner-takes-all inference” in the quoted text. We do not use this anywhere else in the paper, including the analyses of the 4 datasets, and so do not consider it as part of our method, but one possible use of the output of the algorithm.

      “Major concerns include the framing of the method, considerations around the strategy space, limitations in how useful the technique may be, and missing details in analyses”

      Our goal for this paper was to develop a computationally lightweight, trial-resolution, Bayesian approach to tracking the probability of user-specified strategies, so that we can capture the observer’s evidence for learning or for the features driving exploratory choice (e.g. whether subjects are responding to losses or wins; are they responding to cues or choice etc). The above quote reflects their detailed review comments, where we felt this reviewer wanted a solution to a different problem, that of a parameterised latent model of strategy use: while a perfectly valid research goal, this was not what we addressed here.

      “1) It seems like a limitation of this approach is that the candidate strategies to arbitrate between must be known ex-ante. It is not clear how this approach could be applied to uncover latent strategies that are not mixtures of the strategies selected.”

      The problem of knowing which strategies to analyse in advance only applies when running our algorithm in real-time. The fact that it could be run in real-time on modest computing hardware is to us one of its strengths, so we consider this a good problem to have.

      As noted above, rather than determine latent strategies, our goal was to build an observer model that allows users to specify whatever strategy they wanted in order to answer their scientific question(s) of their data. For example, to define when a particular rule has been learnt; or to look for changes in response to particular features of the environment, such as a cue, or to a drug treatment or other intervention.

      2) Different strategies may be indistinguishable from each other and thus it may not be possible to distinguish between them. Similarly, the fact that two strategies seem to be competing for the highest MAP doesn't necessarily mean that those are correct strategies and perhaps interchangeable as the manuscript seems to suggest.

      As noted above, this is an observer model, and it is thus necessarily true that there are strategies for which the observer does not have sufficient evidence to distinguish. For example, a subject who continually chooses the rewarded left-hand lever will be doing both a strategy of “go left” and of “win-stay” in response to their choice. The inability to distinguish strategies is a property of the data, not of the algorithm. Also as noted above, we do not here consider the competition between strategies.

      3) The decay parameter is a necessary component to make the strategy selection non-stationary and accommodate data sets where the rules are changing throughout the task. However, the choice of the decay parameter value bounds does not seem very principled. Having this parameter as a free-parameter adds a flexibility that seems to have significant effects on when the strategy switch is detected and how stable the detected switch is.

      The revised manuscript draws together the existing simulations and analysis of the method to directly address this point, showing that there is a principled range of the decay parameter in which the algorithm should operate. The Discussion also points out that this is no different to a free parameter than any frequentist approach to strategy analysis, which must choose some time windows over which to compute the frequentist probability.

      4) This method is a useful approach for arbitrating between strategies and describing the behavior with a temporal precision that may prove important for studies attempting to tie these precise events to changes in neural activity. However, it seems limited in its explanatory power. In its current form, this method does not provide a prediction of the probability to transition from one strategy to another. And, because the MAP of different strategies may be close at any given moment, it is hard to imagine using this approach to tease out the different "mental states" that represent each strategy being at play.

      As noted above, this is an observer model and does not intend to infer mental states. The goal is to make accurate statements about observable behaviour. We agree that an interesting extension to this approach would be to model the transitions between strategies, and had already outlined this in the Discussion.

    1. Author Response

      The following is the authors’ response to the original reviews.

      REVIEWER 1:

      Reviewer 1 stated: “The authors have provided strong evidence that high levels of auxin exposure perturb feeding behavior, survival rates, lipid metabolism, and gene expression patterns, providing a cautionary note for the field in using this technology. They also concluded that “overall, the experiments were suitably designed with appropriate sample size and data analysis methods.”

      Reviewer 1 provided the following recommendations for improvement, which are addressed below:

      Point 1: “Although authors showed that auxin causes gene expression changes including the possible alteration of Gal4 expression levels, no cell-type-specific data is provided. It would be informative to the Drosophila field if the authors could examine major Gal4 drivers in their expression levels, such as the ones used in studying metabolism and oogenesis.”

      We agree with the reviewer that cell-type specific Gal4 expression should be thoroughly analyzed by scientists in the community wishing to use the current auxin-inducible gene expression system (AGES) in their studies; however, those analyses are beyond the scope of our manuscript. There are many tissues and cell types that are used to study metabolism and oogenesis (e.g., muscle, adipocytes, oenocytes, multiple cell types in the gut, multiple cell types in the ovary), and Gal4 expression patterns could be different depending on age, sex, and diet. It is therefore impossible for us to pinpoint one or two key tissues important for regulating lipid levels and would be a significant investment of time. We believe that each researcher should thoroughly check the Gal4 expression pattern for their specific tissue of interest under their normal standard or altered food conditions. As this reviewer pointed out, our current study provides a cautionary note for the field in using this technology. Nevertheless, we have provided a reference to a recent micropub (Hawley et al; PMID: 37396791) which describes neuronal Gal4 expression patterns comparing the AGES and temporal and regional gene expression targeting (TARGET) systems and updated the text in lines 539-544 of the revised manuscript.

      Point 2: “Although the authors briefly mentioned aging research, feeding behavior, and lipid metabolism, RNA-seq data are provided only for short-term treatment (2 days). The ovary phenotype was examined with long-term treatment (15 days). It would be informative if the authors could also show other long-term treatment data.”

      We respectfully point out to the reviewer that a 5-day auxin feeding assay was provided in Figure S4H, which reproduces the data provided for the 2-day auxin treatment. In addition, the original AGES paper (McClure et al, PMID: 35363137) provided adult survival data that extended to 80 days. In our updated manuscript, we have provided data for a 10-day auxin treatment that also addresses Point #4 below regarding whether the decrease in lipid levels upon auxin feeding is reversible.

      Point 3: “The auxin used in this work is a more water-soluble version and at a high concentration (10 mM). In the C. elegans system, researchers are using a much lower concentration of auxin typically at 1 mM. Therefore, the discussion of their results in terms of potential impacts on other experimental systems should be done carefully. It would be helpful to know what impacts might be observed at a lower concentration of auxin. The recommendation would be that the authors add the 1 mM auxin data point to key elements of their analysis.”

      The concentration of 10 mM auxin used in our study is the recommended dose to use in Drosophila (see McClure et al) and has been used in at least one additional study (Hawley et al). We also would like to point out that other systems (e.g., C. elegans and mice) have many differences in physiology and therefore the concentration of auxin used to elicit a response are likely to be different (e.g., 71.4 mM final concentration is the recommended concentration used in mice; Macdonald et al; PMID: 35736539). We have merely suggested that researchers using auxin for protein degradation should carefully check whether lipid levels (or other physiological processes of interest) are altered upon auxin feeding (or soaking) alone compared to a 0 mM auxin control. The text in lines 467-470 has been altered to reflect this. In addition, the specific recommended dose for Drosophila is highlighted and referenced in multiple places (i.e., methods and results and discussion) throughout the updated text.

      Point 4: “Another related question is whether these detected changes are reversible or not after exposure to auxin at different concentrations. This would be informative for researchers to better design their temporally controlled experiments.”

      We thank the reviewer for this suggestion and have provided the data in Figure S4I. Briefly, we found that after a 5-day treatment of auxin, removal of auxin for an additional 5 days does not recover lipid levels to those of control animals never exposed to auxin.

      Point 5: “It would also be helpful to know whether spermatogenesis is affected or not.”

      Although this would be an interesting developmental process to determine if affected by auxin exposure, we believe that these analyses are beyond the scope of the current manuscript.

      Point 6: “A few other points include changing the nomenclature and validating some of the key genes shown in Figure 3 using quantitative RT-PCR experiments with the tissues where the affected genes are known to be expressed and functional.”

      We thank the reviewer for this suggestion. We have provided qRT-PCR analysis using whole body samples and this data is now provided in the new Figure S8. We used whole-body samples for the qRT-PCR analysis because it would be impossible to pinpoint the specific tissue the differentially regulated genes are required for eliciting the response to auxin exposure. For example, according to Flybase (flybase.org) GstE3 transcripts are moderately to highly expressed in 15 of the 23 cell types annotated by the Fly Cell Atlas project (Li et al; PMID: 35239393).

      REVIEWER 2:

      Reviewer 2 stated: “The authors provide evidence of several Auxin effects. Experiments are suitably designed with appropriate sample size and data analysis methods.”

      This reviewer expressed the following concerns, which are addressed below:

      Point 1: “The provided information is limited and not very helpful for many applications. For example, although authors briefly mentioned aging research, feeding behavior, and lipid data, RNA seq data are provided only for short-term (48 hours) treatment. Especially, since ovary phenotype was examined with long-term treatment (15 days), authors should also show other data for long-term treatment as well.”

      Please see our response to Point #2 of Reviewer 1 regarding long-term treatment experiments. Furthermore, although the ending timepoint for the ovarian analyses is 15 days, we also provide analysis at shorter time points (e.g., daily analysis for egg counts, 5 and 10 day timepoints for fixed sample analyses).

      Point 2: “Although the authors show that Auxin causes a change in gene expression patterns and suggests the possible alteration of Gal4 expression levels, no cell-type-specific data is provided. It would be informative if the authors could examine the expression level of major Gal4 drivers. Authors should discuss how severe these changes are by comparing them with other treatments or conditions, such as starvation or mutant data (ideally, comparing with reported data or their own data if any?).”

      Please see our response to Point #1 from Reviewer 1.

      REVIEWER 3:

      Reviewer 3 stated that they “found the study to be carefully done” and “this study will be of interest to researchers using the Drosophila system, especially those focusing on fatty acid metabolism or physiology.”

      Reviewer 3 also had the following minor points, which are addressed below:

      Point 1: “Auxin, actually 1-naphthaleneaceid acid here, which is a more water-soluble version of auxin (indole-3-acetic acid) is used at what I consider to be a high concentration-10 mM. The problem I have is that the authors are discussing their results in terms of potential impacts on other experimental systems. At least for C. elegans, I think this is not a reasonable extension of the current dataset. In the C. elegans system, researchers are using 1 mM auxin. The authors note that their RNA-seq results suggest a xenobiotic response. Could this apparent xenobiotic response be due to a metabolic byproduct following auxin administration at high concentrations? Figure S1A shows that there is quite a robust transcriptional response at 1 mM auxin. It would be helpful to know what impacts might be observed at this lower concentration in which the transcriptional induction could be used in the context of biologically meaningful experiments. The recommendation would be that the authors add the 1 mM auxin data point to key elements of their analysis.”

      Regarding the comparisons to other model organisms, we refer to our response to Point #3 from Reviewer 1. We also point out that although there is a robust response to 1 mM auxin using the 3.1Lsp2-Gal4 driver, 1 mM is not sufficient for a robust response using additional driver lines in Drosophila (see Hawley et al). It is possible that the xenobiotic response is due to using the recommended dose of auxin (McClure et al).

      However, given the fact that researchers are currently using the 10 mM dose for experiments in Drosophila, we believe that the 10 mM transcription dataset is the most relevant. Nevertheless, we do agree that researchers who choose to use lower concentrations of auxin in the future should carefully look at whether any transcriptional induction alters physiological processes of interest.

      Point 2: “This reviewer was confused by the genetic nomenclature the authors use. The authors have chosen to use the designation 3.1Lsp2-Gal4 (3.1Lsp2-Gal4AID). I think this is potentially confusing because a reader might think that it is the Gal4 transcription factor that is the direct target of auxin- and TIR1-mediated protein degradation, as I initially did. Rather, it is the Gal80 repressor protein that is the direct target. The authors might consider a nomenclature that is more reflective of how this system works. It would also be helpful if the full genotypes of strains were included in each figure legend.”

      We apologize for the nomenclature confusion in our original submission. We have changed our “AID” nomenclature throughout the manuscript to “AGES,” which is the nomenclature used in McClure et al. We respectfully note that the traditional nomenclature for using the temperature-sensitive Gal80 system is Gal80ts or adding the “ts” superscript to the Gal4 line used (e.g., 3.1Lsp2ts).

      Point 3: “The RNA-seq dataset does not appear to be validated by RT-PCR experiments. The authors should consider validating some of the key genes shown in Figure 3 using quantitative RT-PCR experiments, potentially adding a 1 mM auxin data point.”

      Please see our response to Point #6 to Reviewer 1.

      REVIEWER 4:

      Reviewer 4 stated: “Overall, the experiments were well-designed and carefully executed. The results were quantified with appropriate statistical analyses. The paper was also well-written and the results were presented logically.”

      RECOMMENDATIONS FOR THE AUTHORS:

      We have further addressed reviewer recommendations below. Thank you again, for your critique of our manuscript.

      REVIEWER 2:

      As I mentioned in my public review, long-term treatment data would be especially helpful. Examining changes in the expression level of major Gal4 lines is also informative.

      Please see our responses to Points #1 and #2 to Reviewer 1 in the “Public Reviews” section. Although examination of Gal4 expression patterns is extremely important, we believe that these analyses should be carefully performed on a case-by-case basis in the future for labs who wish to continue to use this methodology.

      REVIEWER 4:

      I feel addressing #2 would be a great addition to the current version, while #1 and #3 could be addressed in future studies or by researchers who are interested in these processes.

      Recommendation 1: “Both the metabolomics and transcriptome analyses were done using the whole animals, would it be more informative if these were done using specific tissue/organs such as the adult adipose tissue?”

      Please see our response to Points #1 and #6 to Reviewer 1 in the “Public Reviews” section.

      Recommendation 2: “Another related question is whether these detected changes are reversible or not after exposure to auxin? This would be informative for researchers to better design their temporally controlled experiments.”

      We thank the reviewer for this suggestion and the analysis for this experiment is now provided in Figure S4I.

      Recommendation 3: “Is spermatogenesis affected at all?”

      We respectfully point out that many processes in spermatogenesis (as well as other biological processes) are affected by feeding (e.g., starvation) and would be extremely time consuming to carefully perform the analyses with the rigor required. We agree with Reviewer 4 and believe that this would be best to be performed on a case-by-case examination in the future.

    1. Author Response

      Our responses to the reviewers to go into the published pre-print. We thank the reviewers for their encouraging and thoughtful comments. These are good points that we would like to comment on as follows:

      Reviewer 1:

      Some important and interesting data are missing. For example, whether the gene therapy can extend the life span of these mutants? The overall in vivo voiding function is missing. AAV9/HSPE2 expression in the bladder wall is not shown.

      A. Our study was not designed to determine whether gene therapy can improve life span of the Hpse2 mutant mice. We know that the mutant mice usually become ill after the first month of life and can die. However, we wanted to study the mice when they were generally well so that there would be no confounding effects on the bladder physiology caused by general ill health. Indeed, a recent study of Hpse2 inducible deletion in adult mice has shown evidence of exocrine pancreatic insufficiency (Kayal et al., PMID 37491420). We are currently exploring the status of the pancreas in our non-conditional juvenile Hpse2 mice, and whether gene transfer into the pancreas is possible.

      B. We strongly agree that in vivo voiding studies will be important it the future, and suggest in vivo cystometry is the gold standard for this but is currently beyond the remit of this study.

      C. It is correct that in this paper we have focussed on gene transduction into the pelvic ganglia, because the evidence is mounting that this is a neurogenic disease. Our ex vivo physiological studies show predominantly neurogenic defects that are corrected by the gene therapy. A detailed study of the bladder body is an interesting idea, in terms of possible transgene expression and detailed histology, and is something we will pursue in future studies.

      Review 2:

      Weaknesses include a lack of discussion of the basis for differences in carbachol sensitivity in Hpse2 mutant mice, limited discussion of bladder tissue morphology in Hpse2 mutant mice, some questions over the variability of the functional data, and a need for clarification on the presentation of statistical significance of functional data.

      A. Yes, it is interesting that untreated male mutant mice have an increased bladder body contraction to carbachol compared with WT males. In a previous paper (Manak et al., 2020) we performed quantitative western blots for the M2 and M3 receptors and found levels were similar in mutants to the WTs, thus the increased sensitivity probably lies post-receptor.

      B. A detailed study of the bladder body is an interesting idea, in terms of possible transgene expression and detailed histology, and is something we will pursue in future studies.

      C. We have reported in our physiology graphs what we find. We do find some variability, particularly at lower frequencies, but our conclusions depend on analyses of the whole curve, which depend on multiple frequencies and show the expected overall pattern of frequency-dependent relaxation.

      D. Thank you, the stats for Figure 8 will be corrected in the final version.

      Reviewer 3:

      Single-cell analysis of mutants versus control bladder, urethra including sphincter. This would be great also for the community.

      A. Yes, in future we are very interested in using a single cell sequencing approach to look at the mutant, WT and rescued pelvic ganglia. In relation to this, there is a recent proof-of-principle paper pre-print in WT mouse pelvic ganglia, which suggests this may be feasible (Sivori et al., 2023).

      Detailed tables showing data from each mouse examined.

      B. In theory, it would be very interesting to correlate the strength of human gene transduction into the pelvic ganglia, with, for example, the effect on a physiological parameter. However, in general we used different sets of mice for these techniques so at the present we don’t have this information.

      Use of measurements that are done in vivo (spot assay for example). This sounds relatively simple.

      C. We strongly agree that in vivo voiding studies will be important it the future, and suggest in vivo cystometry is the gold standard for this but is currently beyond the remit of this study.

      Assessment of viral integration in tissues besides the liver (could be done by QPCR).

      D. This is an important point, and suggest the pancreas is a particularly interesting target for future studies. a recent study of Hpse2 inducible deletion in adult mice has shown evidence of exocrine pancreatic insufficiency (Kayal et al., PMID 37491420). We are currently exploring the status of the pancreas in our non-conditional juvenile Hpse2 mice, and whether gene transfer into the pancreas is possible.

      Discuss subtypes of neurons that are present and targeted in the context of mutants and controls.

      E. The make-up of the pelvic ganglia in Hpse2 mutant mice is a fascinating question. Future analysis using scRNA-Seq may be the most effective way to answer this question and is a molecular approach we are looking to pursue in the future.

    1. Author Response

      The following is the authors’ response to the original reviews.

      eLife assessment

      This paper reports the development of SCA-seq, a new method derived from PORE-C for simultaneously measuring chromatin accessibility, genome 3D and CpG DNA methylation. Most of the conclusions are supported by convincing data. SCA-seq has the potential to become a useful tool to the scientific communities to interrogate genome structure-function relationships.

      Public Reviews:

      Reviewer #1 (Public Review):

      In this work, Xie et al. developed SCA-seq, which is a multiOME mapping method that can obtain chromatin accessibility, methylation, and 3D genome information at the same time. SCA-seq first uses M.CviPI DNA methyltransferase to treat chromatin, then perform proximity ligation followed by long-read sequencing. This method is highly relevant to a few previously reported long read sequencing technologies. Specifically, NanoNome, SMAC-seq, and Fiber-seq have been reported to use m6A or GpC methyltransferase accessibility to map open chromatin, or open chromatin together with CpG methylation; Pore-C and MC-3C have been reported to use long read sequencing to map multiplex chromatin interactions, or together with CpG methylation. Therefore, as a combination of NanoNome/SMAC-seq/Fiber-seq and Pore-C/MC-3C, SCA-seq is one step forward. The authors tested SCA-seq in 293T cells and performed benchmark analyses testing the performance of SCA-seq in generating each data module (open chromatin and 3D genome). The QC metrics appear to be good and I am convinced that this is a valuable addition to the toolsets of multi-OMIC long-read sequencing mapping.

      The revised manuscript addressed most of my questions except my concern about Fig. S9. This figure is about a theory that a chromatin region can become open due to interaction with other regions, and the author propose a mathematic model to compute such effects. I was concerned about the errors in the model of Fig. S9a, and I was also concerned about the lack of evidence or validation. In their responses, the authors admitted that they cannot provide biological evidence or validations but still chose to keep the figure and the text.

      The revised Fig. S9a now uses a symmetric genome interaction matrix as I suggested. But Figure S9a still have a lot of problems. Firstly, the diagonal of the matrix in Fig. S9a still has many 0's, which I asked in my previous comments without an answer. The legend mentioned that the contacts were defined as 2, 0 or -2 but the revised Fig. S9a only shows 1,0, or -1 values. Furthermore, Fig. S9b,9c,9d all added a panel of CTCF+/- but there is no explanation in text or figure legend about these newly added panels. Given many unaddressed problems, I would still suggest deleting this figure.

      In my opinion, this paper does not need Fig. S9 to support its major story. The model in this figure is independent of SCA-seq. I think it should be spinoff as an independent paper if the authors can provide more convincing analysis or experiments. I understand eLife lets authors to decide what to include in their paper. If the authors insist to include Fig. S9, I strongly suggest they should at least provide adequate explanation about all the figure panels. At this point, the Fig. S9 is not solid and clearly have many errors. The readers should ignore this part.

      We appreciate the reviewer for raising these concerns regarding Fig. S9. After careful consideration, we have decided to address your concerns by deleting Fig. S9 and the corresponding text from the manuscript. We understand your point that the model presented in Fig. S9 is independent of SCA-seq and may require additional evidence and validation to be presented in a separate paper.

      We agree that it is important to maintain the integrity and accuracy of the manuscript, and we appreciate your feedback in helping us make this decision.

      Reviewer #2 (Public Review):

      In this manuscript, Xie et al presented a new method derived from PORE-C, SCA-seq, for simultaneously measuring chromatin accessibility, genome 3D and CpG DNA methylation. SCA-seq provides a useful tool to the scientific communities to interrogate the genome structure-function relationship.

      The revised manuscript has clarified almost of the concerns raised in the previous round of review, though I still have two minor concerns,

      1. In fig 2a, there is no number presented in the Venn diagram (although the left panel indeed showed the numbers of the different categories, including the numbers in the right panel would be more straightforward).

      We appreciate the reviewer for pointing out the need for clarification in the Venn diagram in Fig 2a. We have added the numbers to Venn diagram.

      1. The authors clarified the discrepancy between sfig 7a and sfig 7g. However, the remaining question is, why is there a big difference in the percentage of the cardinality count of concatemers of the different groups between the chr7 and the whole genome?

      We apologize for the confusion regarding the difference in the percentage of the cardinality count of concatemers between chr7 and the whole genome in figures S7a and S7g. The difference arises because the chr7 cardinality count only considers the intra-chromosome segments that are adjacent to each other on a SCA-seq concatemer, while the whole genome cardinality count includes both intra-chromosome and inter-chromosome segments.

      In the case of a SCA-seq concatemer that contains both intra-chromosome junctions and inter-chromosome junctions, the whole genome cardinality count will be greater than the intra-chromosome cardinality count. This explains the difference in the percentages between chr7 and the whole genome in figures S7a and S7g.

      To better clarify the definition of intra-chromosome cardinality, we have added an illustrative graph in figure S7a. In the updated figure S7a, the given exemplary SCA-seq concatemer has a whole genome cardinality of 4 and a chr7 intra-chromosome cardinality of 3.

    1. Author Response

      The following is the authors’ response to the original reviews.

      eLife assessment

      This important study reports investigation of the dynamics of PKA at the single-cell level in in vitro and in epithelia in vivo. Using different fluorescent biosensors and optogenetic actuators, the authors dissect the signaling pathway responsible for PKA waves, finding that PKA activation is a consequence of PGE2 release, which in turn is triggered by calcium pulses, requiring high ERK activity. The evidence supporting the claims is solid. At this stage the work is still partly descriptive in nature, and additional measurements would increase the strength of mechanistic insights and physiological relevance.

      We deeply appreciate Dr. Alejandro San Martín and Dr. Jonathan Cooper and the reviewers. Each comment is valuable and reasonable. We will revise our paper as much as possible.

      We have described what we will do for the reviewer’s comments one by one in the below section.

      Reviewer #1 (Recommendations For The Authors):

      1. Even though the phenomenon of PGE2 signal propagation is elegantly demonstrated and well described, the whole paper is mostly of descriptive nature - the PGE2 signal is propagated via intercellular communication and requires Ca transients as well as MAPK activity, however function of these RSPAs in dense epithelium is not taken into consideration. What is the function of these RSPAs in cellular crowding? - Does it promote cell survival or initiate apoptosis? Does it feed into epithelial reorganization during cellular crowding? Still something else? The authors discuss possible roles of this phenomenon in cell competition context, but show no experimental or statistical efforts to answer this question. I believe some additional analysis or simple experiment would help to shed some light on the functional aspect of RSPAs and increase the importance of all the elegant demonstrations and precise experimental setups that the manuscript is rich of. Monolayer experiments using some perturbations that challenge the steady state of epithelial homeostasis - drug treatments/ serum deprivation/ osmotic stress/ combined with live cell imaging and statistical methods that take into account local cell density might provide important answers to these questions. The authors could consider following some of these ideas to improve the overall value of the manuscript.

      We would like to thank the reviewer’s comment. Although we have intensively tried to identify the physiological relevance of RSPA, we could not detect the function at present.

      In the case of MDCK, the treatment of NSAIDs, which cancels RSPA, did not affect its cell growth, ERK wave propagation during collective migration, migration velocity, cell survival, or apoptosis. In mouse epidermis, the frequency of RSPA was NOT affected by inflammation and collective cell migration, evoked by TPA treatment and wound, respectively.

      Notably, RSPA also occurs in the normal epidermis, implying its relevance in homeostasis. However, at the current stage, we believe that the PGE2 dynamics and its regulation mechanism in the normal epidermis would be worth reporting to researchers in the field.

      1. In the line 82-84 the authors claim: "We found that the pattern of cAMP concentration change is very similar to the activity change of PKA, indicating that a Gs protein-coupled receptor (GsPCR) mediates RSPA". In our opinion, this conclusion is not well-supported by the results. The authors should at least show that some measurements of the two patterns show correlation. Are the patterns of cAMP of the same size as the pattern of PKA? Do they have the same size depending on cell density? Do they occur at the same frequency as the PKA patterns, depending on the cell density? Do they have an all or nothing activation as PKA or their activation is shading with the distance from the source?

      We have modified the text (line85)

      “Although the increment of the FRET ratio was not so remarkable as that of Booster-PKA, Wwe found that the pattern of cAMP concentration change is very similar to the activity change of PKA, indicating that a Gs protein-coupled receptor (GsPCR) mediates RSPA. This discrepancy may be partially explained by the difference in the dynamic ranges for cAMP signaling in each FRET biosensor (Watabe2020). “

      1. In general, the absolute radius of the waves is not a good measurement for single-cell biology studies, especially when comparing different densities or in vivo vs in vitro experiments. We suggest the authors add the measurement of the number of the cells involved in the waves (or the radius expressed in number of cells).

      We appreciate the reviewer’s comment. We have analyzed our results to demonstrate the number of cells as in Fig2E, which would be easy for readers to understand.

      1. In 6D, the authors should also show the single-cell trajectories to understand better the correlation between PKA and ERK peaks. Is the huger variability in ERK activity ratio dues to different peak time or different ERK activity levels in different cells? The authors should show both the variability in the time and intensity.

      We have added a few representative results as Fig. S4.

      1. In lines 130-132, the authors write, "This observation indicates that the amount of PGE2 secretion is predetermined and that there is a threshold of the cytoplasmic calcium concentration for the triggered PGE2 secretion". How could the author exclude that the amount of PGE2 is not regulated in its intensity as well? For sure, there is a threshold effect regarding calcium, but this doesn't mean that PGE2 secretion can be further regulated, e.g. by further increasing calcium concentration or by other mechanisms.

      We agree with the reviewer’s comment. We have modified the text.

      1. The manuscript shows that not all calcium transients are followed by RSPAs. Does the local cell density/crowding increase the probability of overlap between calcium transients and RSPAs?

      We appreciate the reviewer’s comment. We have also hypothesized the model. However, we did not see the correlation that the reviewer pointed out. Currently, the increment of the RSPA frequency at high density is partially caused by the increment of calcium transients.

      Reviewer #2 (Recommendations For The Authors):

      1. The work is hardly conclusive as to the actual biological significance of the phenomenon. It would be interesting to know more under which physiological and pathological conditions PGE2 triggers such radial PKA activity changes. It is not well explained in which tissues and organs and under what conditions this type of cell-to-cell communication could be particularly important.

      The greatest weakness of the study seems to be that the biological significance of the phenomenon is not clearly clarified. Although it can be deduced that PKA activation has many implications for cell signaling and metabolism, the work lacks the actual link to physiological or pathological significance.

      We deeply appreciate the reviewer’s comment. Similar to the reseponse of reviewer#1, although we have intensively tried to identify the physiological relevance of RSPA, we could not detect the function.

      On the other hand, we believe that the PGE2 dynamics and its regulation mechanism in the normal epidermis would be worth reporting to researchers in the field.

      1. The authors do not explain further why in certain cells of the cell clusters Ca2+ signals occur spontaneously and thus trigger the phenomenon. What triggers these Ca2+ changes? And why could this be linked to certain cell functions and functional changes?

      At this moment, we do not have a clear answer or model for the comment although the calcium transients have been reported in the epidermis (https://doi.org/10.1038/s41598-018-24899-7). Further studies are needed and we will pursue this issue as a next project.

      1. What explains the radius and the time span of the radial signal continuation? To what extent are these factors also related to the degradation of PGE2? The work could be stronger if such questions and their answers would be experimentally integrated and discussed.

      We agree with the reviewer’s comment. Although we have intensively studied that point, we have omitted the results because of its complications. In HeLa cells, but not MDCK cells, we demonstrate the meaning of the radius of RSPA (https://pubmed.ncbi.nlm.nih.gov/37813623/)

      1. The authors could consider whether they could investigate the subcellular translocation of cPLA2 in correlation with cytosolic Ca2+ signals using GFP technology and high-resolution fluorescence microscopy with their cell model.

      Actually, we tried to monitor the cPLA2 translocation using GFP-tagged cPLA2. However, the translocation of GFP-cPLA2 was detected, only when the cells were stimulated by calcium ionophore. At this point, we have concluded that the quantitative analysis of cPLA2 translocation would be difficult.  

      Reviewer #3 (Recommendations For The Authors):

      1. "The cell density in the basal layer is approximately 2x10⁶ cells cm-2, which is markedly higher than that in MDCK cells (Fig. 2D). It is not clear whether this may be related to the lower frequency (~300 cm-2 h-1) and smaller radius of RSPA in the basal layer cells compared to MDCK cells (Fig. 2E)." Wasn't the relationship with cell density the opposite, higher density higher frequency? Isn't then this result contradicting the "cell density rule" that the authors argue is there in the in vitro system? The authors need to revise their interpretation of the data obtained.

      We agree with the reviewer’s comment. Currently, we do not find the "cell density rule" in mouse epidermis. It would be difficult to identify common rules between mouse epidermis and MDCK cells. However, although it is descriptive, we believe it is worth comparing the MDCK results at this moment.

      1. Similarly, the authors over conclude on the explanation of lack of change in the size of RSPA size when the change in fluorescence for the calcium reporter surpasses a threshold by saying that "This observation indicates that the amount of PGE2 secretion is predetermined and that there is a threshold of the cytoplasmic calcium concentration for the triggered PGE2 secretion." First, the study does not really measure directly PGE2 secretion. Hence, there is no way that they can argue that the level of PGE2 secreted is "predetermined". Instead, there could be an inhibitory mechanism that is triggered to limit further activation of PGE2 signaling/PKA in neighboring cells.

      We agree with the reviewer’s comment. We have omitted the context.

      1. To rule out a transcription-dependent mechanism in the apparent cell density-regulated sensitivity to PGE2, the authors need to inhibit transcription. We agree that our RNA-seq analysis would not 100% rule out the transcription-dependent mechanism. However, we believe that shutting down all transcription will show a severe off-target effect that indirectly affects the calcium transients and the PGE2-synthetase pathway. Therefore, our conclusion is limited.

      4) EGF is reported to increase the frequency of RSPA but the change shown in Fig. 6F is not statistically significant, hence, EGF does not increase RSPA frequency in their experiments.

      We have toned down the claim that EGF treatment increases the frequency (line172).

      "Accordingly, the addition of EGF faintly increased the frequency of RSPA in our experiments, while the MEK and EGFR inhibitors almost completely abrogated RSPA (Fig. 6F), representing that ERK activation or basal ERK activity is essential for RSPA.“

      1. The Discussion section is at times redundant with the results section. References to figures should be kept in the Results section.

      We would like to argue in opposition to this comment. For readers, we believe that the reference to figures would be helpful and kind. However, if eLife recommends removing the reference from the Discussion section, we will follow the publication policy.

      1. "Notably, the propagation of PKA activation, ~100 μm/min (Fig. 1H), is markedly faster than that of ERK activation, 2-4 μm/min (Hiratsuka et al., 2015)." The 2 kinase reporters are based on different molecular designs. Thus, it does not seem appropriate to compare the kinetics of both reporters as a proxy of the comparison of the kinetics of propagation of both kinases.

      We think that we should discuss the comparison of the activity propagation between ERK and PKA. First, among many protein kinases, only ERK and PKA activities have been shown to spread in the epithelial cells. Second, both pathways are considered to be intercellular communication. Finally, crosstalk between these two pathways has been reported in several cells and organs.

      1. In Figure 1E it is unclear what is significantly different from what. Statistical analysis should be added and reporting of the results should reflect the results from that analysis.

      2. In Figure 3F and G the color coding is confusing. In F pink is radius and black is GCaMP6 and in G is RSPA+ and - cells. The authors should change the color to avoid ambiguity in the code.

      We have amended the panels.

      1. In Fig. 5C, how do they normalize per cell density if they are measuring radius of the response?

      In Fig5C, we just measure the increment of FRET ratio in the view fields.

      1. In Fig. 5D, what is the point of having a label for PTGER3 if data were not determined (ND)?

      We have added what N.D. means.

      “N.D. represents Not Detected.”

      1. It is important to assess whether ERK activation depends of PGE2 signaling to better place ERK in the proposed signaling pathway. In fact, the authors argue that "ERK had a direct effect on the production of PGE2." But it could be that ERK is downstream PGE2 signaling instead.

      It could be possible in other experimental conditions via EP1 and/or EP3 pathways. However, we never detected an effect of RSPA on ERK activity by analyzing our imaging system. In addition, treatment with NSAIDs or COX-2 depletion, which completely abolishes RSPA, did not affect ERK wave propagation. Thus, in our context, we concluded that ERK is not downstream of PGE2. This notion is also supported by the NGS results in Fig. 5D.

      We have refrained from discussing the pathway of PGE2-dependent ERK activation because it would be redundant.

      1. The authors need to explain better what they mean by "AND gate" if they want to reach a broad readership like that of eLife

      We have modified the legend to explain the “AND gate” as much as possible (line639).

      “Figure 7: Models for PGE2 secretion.

      The frequency of calcium transients is cell density-dependent manner. While the ERK activation wave is there in both conditions. Because both calcium transient and ERK activation are required for RSPA, the probability for PGE2 secretion is regulated as “AND gate”. ”

      1. In Fig. 5D, "The average intensity of the whole view field of mKate2 or mKOκ, at 20 to 30 min after the addition of PGE2, was applied to calculate the mKate2/mKOκ ratio." But this means that overlapping/densely plated cells in high density will show stronger changes in fluorescence. This should be done per cell not per field of view. It is obvious that the higher density will have more dense/brighter signal in a given field of view.

      We are sorry for the confusion. The cell density does not affect the FRET ratio, although the brightness could be changed. A typical example is Fig1D. Thus, we are sure that our procedures represent the PKA activity in plated cells.

      1. In Fig. 6B the authors need to explain how were the "randomly set positions" determined.

      We have modified the legend section as below (line618).

      “The ERK activities within 10 µm from the center of RSPA and within 10 µm from randomly set positions with a random number table generated by Python are plotted in the left panel. Each colored dot represents an average value of an independent experiment.”

      1. Sentences 314-318 are repeated in 318-322.

      We deeply appreciate the reviewer’s comment and have amended

    1. Author Response

      The following is the authors’ response to the original reviews.

      Public Reviews:

      Reviewer #1 (Public Review):

      Summary:

      Here, Boor et al focus on the regulation of daf-7 transcription in the ASJ chemosensory neurons, which has previously been shown to be sensitive to a variety of external and internal signals. Interestingly, they find that soluble (but not volatile) signals released by food activate daf-7 expression in ASJ, but that this is counteracted by signals from the ASIC channels del-3 and del-7, previously shown to detect the ingestion of food in the pharynx. Importantly, the authors find that ASJ-derived daf-7 can promote exploration, suggesting a feedback loop that influences locomotor states to promote feeding behavior. They also implicate signals known to regulate exploratory behavior (the neuropeptide receptor PDFR-1 and the neuromodulator serotonin) in the regulation of daf-7 expression in ASJ. Additionally, they identify a novel role for a pathway previously implicated in C. elegans sensory behavior, HEN1/SCD-2, in the regulation of daf-7 in ASJ, suggesting that the SCD-2 homolog ALK may have a conserved role in feeding and metabolism.

      Strengths:

      The studies reported here, particularly the quantitation of gene expression and the careful behavioral analysis, are rigorously done and interpreted appropriately. The results suggest that, with respect to food, DAF-7 expression encodes a state of "unmet need" - the availability of nearby food to animals that are not currently eating. This is an interesting finding that reinforces and extends our understanding of the neurobiological significance of this important signaling pathway. The identification of a role for ASJ-derived daf-7 in motor behavior is a valuable advance, as is the finding that SCD-2 acts in the AIA interneurons to influence daf-7 expression in ASJ.

      We appreciate the Reviewer 1’s thoughtful assessment of our work and inference that the expression of daf-7 encodes internal state corresponding to “unmet need.” Based on comments of Reviewer 1 and other reviewers, we have revised the title, abstract, and parts of the discussion to highlight not only the functional contribution of daf-7 expression in the ASJ neurons to behavioral state, but also the remarkable correlation between gene expression and internal state driving foraging behavior.

      Weaknesses:

      A limitation of the work is that some mechanistic relationships between the identified signaling pathways are not carefully examined, but this provides interesting opportunities for future work.

      To enable the reader to begin to infer the relative contributions of the identified signaling pathways to the circuitry coupling distinct bacterial cues to foraging behavior, we have added data for the analysis of DAF-7 expression in the ASJ neurons in the tph-1 and pdfr-1 mutants in the complete absence of food. Our current leaning is that multiple pathways, including those we have begun to characterize here, may function in parallel to influence DAF-7 expression and internal state driving foraging behavior. Future work to explore this further is certainly of interest.

      A minor weakness concerns the experiment in which daf-7 is conditionally deleted from ASJ. This is an ideal approach for probing the function of daf-7, but these experiments seem to be carried out in the well-fed, on-food condition in which control animals should express little or no daf-7 in ASJ. Thus, the experimental design does not allow an assessment of the role of daf-7 under conditions in which its expression is activated (e.g., in animals exposed to un-ingestible food).

      The interpretation of genetic analysis in the complete absence of food is complicated by what we think are multiple parallel pathways that function to strongly promote roaming, as indicated in the prior work of Ben Arous et al. Our observation that the conditional deletion of daf-7 from the ASJ pair of neurons confers altered roaming behavior on a lawn of bacterial food supports physiological ongoing role for dynamic daf-7 expression from the ASJ neurons even in the presence of bacterial food that may contribute to the control of transitions between foraging states and the persistence of roaming and dwelling states.

      To demonstrate the functional contribution of DAF-7 expression from the ASJ neuron pair during constitutive expression favoring roaming, we examined the roaming behavior of scd2(syb2455) animals that carry a gain-of-function mutation in scd-2 that promotes roaming and how the selective deletion of daf-7 from the ASJ neurons in the scd-2(syb2455) genetic background influences roaming behavior. This new experiment supports a model in which DAF-7 expression from the ASJ neurons contributes to the increased roaming behavior exhibited by scd-2(syb2455) animals. The new experiment is added as Figure 4I.

      An additional minor issue concerns the interpretation of the scd-2 experiments. The authors' findings do support a role for scd-2 signaling in the activation of daf-7 expression by un-ingestible food, but the data also suggest that scd-2 signaling is not essential for this effect, as there is still an effect in scd-2 mutants (Figure 4B).

      Considering that most of previous Figure 4B is redundant with previous Figure 4D, we removed previous Figure 4B. Our current Figure 4 has redesignated previous Figure 4D as 4B. We have also added qualification to the text to indicate that other pathways may modulate the daf-7 expression response to ingested food in parallel to SCD-2 signaling.

      Reviewer #2 (Public Review):

      Summary:

      In this work, Boor and colleagues explored the role of microbial food cues in the regulation of neuroendocrine-controlled foraging behavior. Consistent with previous reports, the authors find that C. elegans foraging behavior is regulated by the neuroendocrine TGFβ ligand encoded by daf-7. In addition to its known role in the neuroendocrine/sensory ASI neurons, Boot and colleagues show that daf-7 expression is dynamically regulated in the ASJ sensory neurons by microbial food cues - and that this regulation is important for exploration/exploitation balance during foraging. They identify at least two independent pathways by which microbial cues regulate daf-7 expression in ASJ: a likely gustatory pathway that promotes daf-7 expression and an opposing interoceptive pathway, also likely chemosensory in nature but which requires microbial ingestion to inhibit daf-7 expression. Two neuroendocrine pathways known to regulate foraging (serotonin and PDF-1) appear to act at least in part via daf-7 induction. They further identify a novel role for the C. elegans ALK orthologue encoded by scd-2, which acts in interneurons to regulate daf-7 expression and foraging behavior. These results together imply that distinct cues from microbial food are used to regulate the balance between exploration and exploitation via conserved signaling pathways.

      Strengths:

      The findings that gustatory and interoceptive inputs into foraging behavior are separable and opposing are novel and interesting, which they have shown clearly in Figure 1. It is also clear from their results that removal of the interoceptive cue (via transfer to non-digestible food) results in rapid induction of daf-7::gfp in ASJ, and that ASJ plays an important role in the regulation of foraging behavior.

      We thank Reviewer 2 for underscoring the modulation of neuroendocrine gene expression in the ASJ neuron pair by distinct gustatory and interoceptive inputs derived from bacterial food that we show in Figure 1.

      The role of the hen-1/scd-2 pathway in mediating the effects of ingested food is also compelling and well-interpreted. The use of precise gain-of-function alleles further supports their conclusions. This implies that important elements of this food-sensing pathway may be conserved in mammals.

      We thank Reviewer 2 for emphasizing the implications of our study on SCD-2/ALK as well as the generation and use of gain-of-function scd-2 alleles based on oncogenic mutations in ALK.

      Weaknesses:

      What is less clear to me from the work at this stage is how the gustatory input fits into this picture and to what extent can it be strongly concluded that the daf-7regulating pathways that they have identified (del-3/7, 5-HT, PDFR-1, scd-2) act via the interoceptive pathway as opposed to the gustatory pathway.

      It follows from the work of the Flavell lab that del-3/7 likely acts via the interoceptive pathway in this context as well but this isn't shown directly - e.g. comparing the effects of aztreonam-treated bacteria and complete food removal to controls. The roles of 5-HT and PDFR-1 are even a bit less clear. Are the authors proposing that these are entirely parallel pathways? This could be explained in better detail.

      We have added additional data regarding daf-7 expression from the ASJ neurons in the complete absence of food in the different mutant backgrounds noted by Reviewer 2. Data regarding daf-7 expression in the ASJ neurons under three distinct conditions—ingestible bacterial food, non-ingestible bacterial food, and the complete absence of food—enable the pairwise comparison of mutant data that allows for inference regarding the relative contributions of the genes to the interoceptive vs. gustatory pathways. In particular, effects on the interoceptive pathway can be inferred from the comparison of daf-7 expression on ingestible vs. non-ingestible food, whereas effects on the gustatory pathway can be inferred from the comparison of daf-7 expression on non-ingestible food vs. the absence of food (newly added).

      These additional data are most informative for del-3; del-7 (Figure 1H), where the added data corroborate a role for these genes in the interoceptive pathway, consistent with the findings of the Flavell lab. Specifically, the observation that daf-7 expression levels are equivalent between wild-type and del-3;del-7 animals when there is no ingestible food (either no food or non-ingestible food conditions) suggest that DEL-3 and DEL-7 are functioning specifically to sense ingested food.

      For pdfr-1, the analysis of the gain-of-function allele suggest that this pathway may have a greater relative effect on the gustatory pathway compared with the interoceptive pathway (Figure 3D). The robust upregulation seen in the pdfr-1(syb3826) animals between animals on ingestible and non-ingestible food, suggests that the interoceptive regulation is functional in these mutants, while the lack of upregulation between no-food and noningestible-food conditions suggests that the gustatory pathway is affected.

      The observations with the 5-HT biosynthesis mutant are most consistent with serotonin signaling affecting daf-7 expression in the ASJ neurons through a mechanism that is parallel to the gustatory and interoceptive inputs into daf-7 expression in the ASJ neurons, as tph1(n4622) animals appear to have an elevated baseline expression of daf-7 in the ASJ neurons while retaining sensitivity to both gustatory and interoceptive food cues (Figure 3B).

      The data with scd-2 are consistent with a role in the epistatic interoceptive pathway, considering the roughly equivalent levels of daf-7 expression in the ASJ neurons under all food conditions in scd-2(syb2455) animals (Figure 4B). However it is difficult to exclude the possibility that SCD-2 functions in both pathways or parallel to the gustatory and interoceptive inputs.

      While we agree that our genetic analysis alone cannot distinguish between genes acting in parallel or directly in serial with the gustatory or interoceptive inputs, our data do establish that signaling through SCD-2, 5-HT or PDFR-1-dependent pathways can act on the same gene expression and signaling node (i.e. daf-7 expression in the ASJ neurons) to modulate the effects of bacterial food inputs on foraging behavior, with the effects on daf-7 expression in the ASJ neurons in scd-2, tph-1 and pdfr-1 mutants correlating with their effects on roaming and dwelling behaviors.

      It would also be helpful to elaborate more on why the identified transcriptional positive feedback loop is predicted to extend roaming state duration - as opposed to some other mechanism of increasing roaming such as increased probability of roaming state initiation. This doesn't seem self-evident to me.

      Given that animals can exist in only two states, the increased probability of roaming state initiation would present as shorter dwelling states, which we do not see for daf-7 mutants. As described in Flavell, et al., 2013, a decreased fraction of time roaming can be attributed to longer dwelling states, shorter roaming states, or both. Our positive feedback loop is predicted to extend roaming states because of the predicted effect of DAF-7 on stabilizing the roaming state.

      Related to this point is the somewhat confusing conclusion that the effects of tph-1 and pdfr-1 mutations on daf-7 expression are due to changes in ingestion during roaming/dwelling. From my understanding (e.g. Cermak et al., 2020), pharyngeal pumping rate does not reliably decrease during roaming - so is it clear that there are in fact lower rates of ingestion during roaming in their experiments?

      This is an interesting point. Despite consistent pumping rates, we still believe that roaming animals ingest less food than dwelling animals. For instance, dwelling animals are localized to areas with bacterial food, while roaming animals might traverse patches with no food where pumping does not result in food ingestion.

      If so, why does increased roaming (via tph-1 mutation) result in further increases in daf-7 expression in animals fed aztreonam-treated food (Fig 3B)?

      This is possibly because although roaming animals are eating less, when animals are on non-ingestible food, they’re not eating at all, resulting in further daf-7 upregulation.

      Alternatively, there could be a direct signaling connection between the 5-HT/PDFR-1 pathways and daf-7 expression which could be acknowledged or explained.

      Yes, this is certainly possible. We do not propose that all of the difference in daf-7 expression is due to changes in foraging behavior, but rather we are highlighting further instances of the correlation between daf-7 expression in the ASJ neurons and roaming. For instance, in the case of our tph-1 mutants, we see a relatively modest effect on daf-7 expression in the ASJ neurons but a large difference in the fraction of time roaming. This suggests that the magnitude of change in one (daf-7 expression in ASJ or roaming) does not predict the magnitude of the change in the other, but rather that they trend in the same direc<on.

      Reviewer #3 (Public Review):

      Summary:

      In this interesting study, the authors examine the function of a C. elegans neuroendocrine TGF-beta ligand DAF-7 in regulating foraging movement in response to signals of food and ingestion. Building on their previous findings that demonstrate the critical role of daf-7 in a sensory neuron ASJ in behavioral response to pathogenic P. aeruginosa PA14 bacteria and different foraging behavior between hermaphrodite and male worms, the authors show, here, that ingestion of E. coli OP50, a common food for the worms, suppresses ASJ expression of daf-7 and secreted water-soluble cues of OP50 increases it. They further showed that the level of daf-7 expression in ASJ is positively associated with a higher level of roaming/exploration movement. Furthermore, the authors identify that a C. elegans ortholog of Anaplastic Lymphoma Kinase, scd-2, functions in an interneuron AIA to regulate ASJ expression of daf-7 in response to food ingestion and related cues. These findings place the DAF-7 TGF-beta ligand in the intersection of environmental food conditions, food intake, and foodsearching behavior to provide insights into how orchestrated neural functions and behaviors are generated under various internal and external conditions.

      Strengths:

      The study addresses an important question that appeals to a wide readership. The findings are demonstrated by generally strong results from carefully designed experiments.

      We thank Reviewer 3 for the comments and interest in the work.

      Weaknesses:

      However, a few questions remain to provide a complete picture of the regulatory pathways and some analyses need to be strengthened. Specifically,

      1. The authors show that diffusible cues of bacteria OP50 increase daf-7 expression in ASJ which is suppressed by ingestible food. Their results on del-3 and del-7 suggest that NSM neuron suppresses daf-7 ASJ expression. What sensory neurons respond to bacterial diffusible cues to increase daf-7 expression of ASJ? Since ASJ is able to respond to some bacterial metabolites, does it directly regulate daf-7 expression in response to diffusible cues of OP50 or does it depend on neurotransmission for the regulation? Some level of exploration in this question would provide more insights into the regulatory network of daf-7.

      The focus of our study has been on the modulation of daf-7 expression in the ASJ neurons by distinct bacterial food cues and the downstream neuroendocrine circuitry that is influenced. The question of whether bacterial cues are directly sensed by the ASJ neurons remains unresolved by our study. However, we have previously demonstrated that the daf-7 expression in the ASJ neurons induced by P. aeruginosa metabolites is likely the result of direct detection by the ASJ neurons. We would also note (and have added to the manuscript) the observation of Zaslaver et al. (2015), in which increased calcium transients were observed in the ASJ neurons in response to the withdrawal of E. coli OP50 supernatant, which is consistent with our observations of the effect of a soluble bacterial food signal on daf-7 expression in the ASJ neurons.

      1. The results including those in Figure 2 strongly support that daf-7 in ASJ is required for roaming. Meanwhile, authors also observe increased daf-7 expression in ASJ under several conditions, such as non-ingestible food. Does non-ingestible food induce more roaming?

      Yes, this has been published by Ben Arous, et al., 2009. Figure 3C shows increased roaming on aztreonam-treated food. We have added specific mention of this in the text.

      It would complete the regulatory loop by testing whether a higher (than wild type) level of daf-7 in ASJ could further increase roaming. The results in pdf-1 and scd-2 gain-of-function alleles support more ASJ leads to more roaming, but the effect of these gain-of-function alleles may not be ASJ-specific and it would be interesting to know whether ASJ-specific increase of daf-7 leads to a higher level of roaming. In my opinion, either outcome would be informative and strengthen our understanding of the critical function of daf-7 in ASJ demonstrated here.

      We looked at roaming in animals with a ptrx-1::daf-7 cDNA transgene in a wild-type background and did not see changes in the fraction of time animals roam. However, multiple experimental factors could contribute to our inability to detect an effect, including relative promoter strength and context of other variables that alter daf-7 expression. Nevertheless, our data confirmed that ASJ neuron-specific expression of daf-7 cDNA can increase roaming in a daf-7 mutant background (Figure 2B).

      We have also included an experiment (Figure 4I) looking at roaming in the scd-2(syb2455) gain-of-function animals in animals with daf-7 deleted from the ASJ neurons. These results suggest that part of the increased roaming seen in these scd-2(syb2455) animals is specifically due to increased daf-7 expression in the ASJ neurons.

      1. The analyses in Figure 4 cannot fully support "We further observed that the magnitude of upregulation of daf-7 expression in the ASJ neurons when animals were moved from ingestible food to non-ingestible food was reduced in scd-2(syb2455) to levels only about one-fourth of those seen in wild-type animals (Figure 4D)...", because the authors tested and found the difference in daf-7 expression between ingestible and non-ingestible food conditions in both wild type and the mutant worms. The authors did not analyze whether the induction was different between wild type and mutant. Under the ingestible food condition, ASJ expression of daf-7 already looks different in scd-2(syb2455).

      We appreciate the reviewer pointing out our lack of clarity in discussing our analysis of the data. The 4x difference represents the difference in fold change from ingested to noningested food in wild type and scd-2(syb2455) backgrounds. For wild-type animals, daf-7 expression in the ASJ neurons on non-ingestible food is 8.1-times higher on non-ingestible food than on ingestible food. In scd-2(syb2455) animals, this difference is 1.7 times. We have clarified this in the text.

      1. The authors used unpaired two-tailed t-tests for all the statistical analyses, including when there are multiple groups of data and more than one treatment. In their previous study Meisel et al 2014, the authors used one-way ANOVA, followed by Dunnett's or Tukey's multiple comparison test when they analyzed daf-7 expression or lawn leaving in different mutants or under different bacterial conditions. It is not clear why a two-tailed t-test was used in similar analyses in this study

      We have performed one-way ANOVAs for all comparisons included, and the results were largely consistent with what we found for t-tests. Ultimately, for our analysis we were most interested in pairwise comparisons and decided that t-tests would be most appropriate.

      *Reviewer #1 (Recommendations For The Authors):

      Line 170: For clarity, I suggest editing this to: "When animals are removed from edible food but are still exposed to soluble food signals, upregulation of daf-7..."

      We have edited this in the text and appreciate the suggestion.

      The authors report that pdfr-1(syb3826) was retrieved from "a screen done in parallel to this work." syb3826 is a Suny Biotech allele, suggesting that this screen may not have been done in the authors' lab but rather outsourced. Some additional details might be useful.

      This S325F allele was originally recovered as qd385 in an EMS screen performed in our lab. syb3826 is an independently generated Suny Biotech allele we ordered to confirm that the S325F substitution in PDFR-1 was responsible for our phenotypes. This has been clarified in the text.

      Line 210: Please provide a citation for the screen that identified hen-1(qd259).

      This is the first time the allele is being published. The screen is included in two theses from our lab, Meisel 2016 and Park 2019.

      Line 214: It would be useful here to also mention the previously identified role of scd2 in sensory integration.

      Yes, we have added this to the text. Additionally, we have included a couple of sentences in the discussion about how previous studies that have found a role for SCD-2 in sensory integration may instead be detecting the role for SCD-2 in food sensing, as many of the assays used for sensory integration are also sensitive to nutritional status of the animals.

      Line 271: Please provide a citation for the sex differences in food-leaving behavior (Lipton 2004 PMID 15329389 is the first careful characterization of this).<br /> We have added this to the text.

    1. Author Response

      The following is the authors’ response to the original reviews.

      Reviewer #2 (Recommendations For The Authors):

      The evidence provided in this study reflects important discoveries on language lateralisation and most of the conclusions of this paper are supported by evidence. However, there are several areas regarding the characteristics of participants tested, hypotheses/predictions and the type of analysis, that need to be clarified and/or corrected.

      1. There is a substantial disconnection between the introduction and the methods/results section.

      One reason is because of lack of consistency. One example refers to the fact that, in the introduction, only IFC is mentioned. However, the analyses carried out to examine neural activity in different groups focused on IFC as well as other brain regions related to inhibitory control. However, these areas were not mentioned at all in the introduction. Second and related to the above, the rationale for conducting certain types of analyses is not specified. Some brain analyses focus on IFC only. Instead, other analyses focus on several areas.

      Another weakness is that there is not sufficient detail regarding the hypotheses/predictions and the specific types of analyses chosen to test these hypotheses/predictions. For example, there is no mention of resting state fMRI data in the introduction, but later we discover that this type of data was collected and analyzed. Even a brief mention of the inclusion of resting state data in the introduction would be beneficial. Along the same lines, by reading the methods section we find out that VBM analyses were conducted. But it is unclear why. What was the purpose of this data analysis? This should be clarified briefly in the introduction and then in the methods section. It remains unclear why resting state results would be particularly informative for addressing the research question of this study. Task-related brain connectivity seems a more appropriate choice. Additionally, it is not explained what comparisons and outcomes would be informative/expected to distinguish between the two mentioned competing hypotheses. This should be made clear.

      Another aspect that lacks clarity is the authors' predictions when investigating the relationship "between the lateralization of both functions and inter-hemispheric structural-functional connectivity, as well as with behavioural markers of certain clinical conditions that have been related with atypical lateralization". The hypotheses are completely omitted in this section.

      Thank you for bringing this to our attention. We concur with Reviewer #2 that our introduction was somewhat lacking in detail and assumed too much prior knowledge on the part of the reader. This, together with a lack of a clear presentation of our tested hypotheses, made the introduction have a poor connection with both the results and discussion sections, which hindered the understanding of the paper.

      As a result, we have made some additions to enhance the exposition of the following areas: (1) the causal and statistical hypotheses of lateralization (Lines 55-65); and (2) the hypotheses regarding subclinical markers of neurological disorders and the corpus callosum (Lines 90-104).

      Furthermore, we have extensively revised the final paragraph of the introduction (Lines 105-121) to provide a clearer and more coherent linkage between the drivers presented during the introduction, our hypotheses, and the subsequent analyses.

      1. It is important to provide more information on the language background of the participants. Were the participants in this study Catalan-Spanish bilinguals? If so, it is crucial for the authors to mention this.

      Language background of the participants has been added to the corresponding section (Lines 138-145).

      In fact, previous studies, including several publications from the authors themselves (Garbin et al., 2010; Rodríguez-Pujadas et al., 2013; Anderson et al., 2018), have shown that there are qualitative differences between bilinguals and monolinguals in the neural circuitry underlying executive control. Across all these studies, it was consistently reported that bilingual individuals, when engaged in non-linguistic inhibitory control tasks, recruited a broader network of left-brain regions associated with language control, including the left IFC, in comparison to monolingual individuals. If the participants in this study were indeed bilinguals, it raises concern if the aim of the study is to generalize the conclusions on lateralization effects beyond the bilingual population.

      Rodríguez-Pujadas, A., Sanjuán, A., Ventura-Campos, N., Román, P., Martin, C., Barceló, F., … & Ávila, C. (2013). Bilinguals use language-control brain areas more than monolinguals to perform non-linguistic switching tasks. PLoS One, 8(9), e73028.

      Garbin, G., Sanjuan, A., Forn, C., Bustamante, J. C., Rodríguez-Pujadas, A., Belloch, V., ... & Ávila, C. (2010). Bridging language and attention: Brain basis of the impact of bilingualism on cognitive control. NeuroImage, 53(4), 1272-1278.

      Anderson, J. A., Chung-Fat-Yim, A., Bellana, B., Luk, G., & Bialystok, E. (2018). Language and cognitive control networks in bilinguals and monolinguals. Neuropsychologia, 117, 352-363.

      Indeed, we have thoroughly reported that, when compared to monolinguals, bilinguals exhibit a significant implication of left brain regions during switching and inhibition tasks. So, this is a legitimate concern. Unfortunately, the society from which our participants were drawn is primarily bilingual, encompassing both active and passive bilinguals. The monolingual sample in those previous studies consisted of university students originating from predominantly monolingual regions of Spain. Given this context, it is unsurprising that the current study has a rather limited number of monolinguals (n=8), with only 2 displaying atypical language lateralization. Thus, we cannot provide a reliable answer to the role of bilingualism status in our data. Consequently, we have included a comment on this limitation on the discussion (Lines 504-512).

      1. Regarding the methods section, I have the following specific queries. The first is about the control condition in the verb generation task. I find it puzzling that the 'task' and 'control' conditions differ in terms of the number of words uttered. Could the authors please provide further clarification on this?

      Thank you for raising this question. Regarding the control condition, it is important to note that the design of this task drew inspiration from previously published verb generation tasks for fMRI (Benson et al., 1999; Fitzgerald et al., 1997) and PET (Petersen et al., 1988). In the fMRI tasks, a fixation cross served as the control condition, while the PET study used word repetition as the control. We acknowledged that a mere fixation cross might not adequately control for the movement and visual-related activations inherent in the verb generation task. Conversely, word repetition could potentially engage the default mode network due to the repetition of the same simple task, which might not be suitable for a control condition, and it could be overly linguistic because it involves a word. Consequently, we aimed to strike a balance by employing a control condition that consisted of reading letters. This approach allowed us to control for movement and vision factors without invoking semantics. Thus, after careful consideration, we ultimately opted on the reading of two letters to equate the response to the vocalization length of generating a verb.

      Although we understand the concern of single vs. two vocalizations, it is worth emphasizing that this version of the verb generation task had undergone prior testing to assess its suitability for determining language lateralization in both healthy and clinical populations (Sanjuan et al., 2010). In fact, this task has been an integral component of our lab’s standard presurgical assessment protocol, which has been used for nearly two decades in individually evaluating language function in over 500 patients with central nervous system lesions.

      Benson, R. R., Fitzgerald, D. B., Lesueur, L. L., Kennedy, D. N., Kwong, K. K., Buchbinder, B. R., Davis, T. L., Weisskoff, R. M., Talavage, T. M., Logan, W. J., Cosgrove, G. R., Belliveau, J. W., & Rosen, B. R. (1999). Language dominance determined by whole brain functional MRI in patients with brain lesions. Neurology, 4(52), 798–809.

      Fitzgerald, D. B., Cosgrove, G. R., Ronner, S., Jiang, H., Buchbinder, B. R., Belliveau, J. W., Rosen, B. R., & Benson, R. R. (1997). Location of Language in the Cortex: A Comparison between Functional MR Imaging and Electrocortical Stimulation. AJNR Am J Neuroradiol, 18, 1529–1539.

      Petersen, S. E., Fox, P. T., Posner, M. I., Mintun, M., & Raichle, M. E. (1988). Positron emission tomographic studies of the cortical anatomy of single-word processing. Nature, 331(18), 585–589.

      Sanjuán, A., Bustamante, J. C., Forn, C., Ventura-Campos, N., Barrós-Loscertales, A., Martínez, J. C., Villanueva, V., & Ávila, C. (2010). Comparison of two fMRI tasks for the evaluation of the expressive language function. Neuroradiology, 52(5), 407–415. https://doi.org/10.1007/s00234-010-0667-8

      Second, it is mentioned that some participants were excluded from different tasks due to technical issues or time constraints. It is important to ensure that all the results can be attributed to the exact same sample of participants across all tasks.

      We absolutely agree that excluding participants can be problematic when presenting the results of multiple sets of analyses. Therefore, we repeated all analyses while excluding the 7 participants that lacked resting-state data. All results remained virtually identical, with a few minor exceptions:

      1) Region-wise analysis of the stop-signal task: Hemisphere × Group effect in the preSMA region is significant (uncorrected P = 0.019), but it does not survive Bonferroni correction (corrected P = 0.076)

      2) Voxel-wise analysis of the stop-signal task: The Thalamus + STN and Caudate clusters are significant at the voxel level, but do not survive the cluster-based FWE correction. They do survive FDR correction, though.

      3) Correlation between SPQ score and LI of the stop-signal task: This correlation weakens just behind statistical significance, with a P value of 0.053.

      4) Correlation between reading variables and LIs of both tasks: Severe drops in P values are evident between both LIs and reading length accuracy (P = .111 and .133), as well as between verb generation LI and reading familiarity accuracy (P = .111). However, the association between the stop-signal LI and the reading length time is now significant (r = −.229, P = .042).

      According to this, we have included this statement in the methods section: (Lines 218-220).“It is important to highlight that the exclusion of these seven participants across all analyses does not notably impact the overall results.“

      It is unclear how the authors have estimated the RTs results from the practice trials. This requires more explanation. Also, why was the median used for the Go Reaction Time instead of the mean, when calculating the individual SSRT?

      We adapted the procedure used by Xue et al. (2008), implementing their approach to calculate SSRT. This has been elaborated further (Lines 227-230), together with the use of practice trials (Lines 233-236).

      Xue, G., Aron, A.R., and Poldrack, R.A. (2008). Common Neural Substrates for Inhibition of Spoken and Manual Responses. Cerebral Cortex 18, 1923–1932. 10.1093/CERCOR/BHM220.

      On a final note, information about the different types of pre-processing and data analysis is all reported in the same paragraph. I think using subsections would increase the intelligibility of the section.

      Thank you for this suggestion. We have added subsections in both the ‘image processing’ and ‘statistical analyses’ sections.

      1. Data analysis and Interpretation of the results. It is unclear how the mean BOLD signal was extracted to conduct ROI analysis (Marsbar?).

      Thank you for ponting this out. Indeed, we were not very accurate in the description of this procedure. We extracted the first eigenvariate via the VOI function within SPM12. This has been included in Lines 291-293.

      I feel uneasy about the way results are corrected for multiple comparisons. For instance, it is mentioned that in the ROI analysis, all p-values were FDR-corrected for four comparisons, but it is unclear why. The correct procedure for supporting conclusions about the effect of specific brain would be to have 'brain region' (n=4) as another within-subject factor. Furthermore, the one-tailed correlation is appropriate but only when testing for the possibility of a relationship in one direction and completely disregarding the possibility of a relationship in the other direction. However, this does not seem to be the case here (see Introduction), so a two-tailed correlation would be more appropriate.

      We agree with Reviewer #2 that presenting this analysis as a single MANOVA that includes a ‘Region’ factor is a more accurate approach. Consequently, we have made the aforementioned correction in the methods section (Lines 357-364) and the results section (Lines 395-406). The LI-LI one-tailed correlation was also changed to a two-tailed correlation in the methods section (Line 383), the results section (Line 417), and Figure 2 (Line 886).

      I am quite confused about using the term interhemispheric connectivity to refer to the volume of the genu, body and splenium of the corpus callosum. In fact, the volumes of genu, body and splenium of the corpus callosum do not reflect a measure of how strongly RH and LH IFC are connected to each other.

      We agree that using the term ‘interhemispheric connectivity’ when referring to callosal volume may be somewhat misleading. We have replaced every instance of this terminology throughout the paper.

      Furthermore, it is unclear why in a set of analyses (ROI and whole brain analyses) the authors focus on brain responses in different ROIs but instead, in connectivity measures the focus is only on IFC.

      Our initial rationale was to focus on regions that are prominently involved in language, particularly the IFC, for examining inter-hemispheric connectivity at rest.

      However, upon more careful consideration, it is true that the preSMA is also implicated in the language network (Labache et al., 2018), and certain studies have reported an impact of STN stimulation on specific language skills (for a review, see Vos et al., 2021). Consequently, we have incorporated these two regions into the resting-state analysis, along with subsequent correlations with LIs (Table 1 and Lines 118, 321-322 & 449-452).

      Labache, L., Joliot, M., Saracco, J., Jobard, G., Hesling, I., Zago, L., Mellet, E., Petit, L., Crivello, F., Mazoyer, B., & Tzourio-Mazoyer, N. (2018). A SENtence Supramodal Areas AtlaS (SENSAAS) based on multiple task-induced activation mapping and graph analysis of intrinsic connectivity in 144 healthy right-handers. Brain Structure and Function 2018 224:2, 224(2), 859–882. https://doi.org/10.1007/S00429-018-1810-2

      Vos, S. H., Kessels, R. P. C., Vinke, R. S., Esselink, R. A. J., & Piai, V. (2021). The Effect of Deep Brain Stimulation of the Subthalamic Nucleus on Language Function in Parkinson’s Disease: A Systematic Review. Journal of Speech, Language, and Hearing Research, 64(7), 2794–2810. https://doi.org/10.1044/2021_JSLHR-20-00515

      Minor corrections/comments:

      It is unclear why in figure caption 1, the conjunction maps are mentioned even if formal conjunction analysis was not conducted.

      This poor choosing of words has been replaced to ‘overlapping maps’.

      Line 382. VHMC should be VMHC.

      Fixed. Thank you.

      Line 334. This sentence and especially its relationship with the results is not clear at all. What do you mean by 'This finding is consistent with previous reports showing that cognitive deficits appear only in specific cognitive domains'?

      This has been clarified (Lines 521-525).

    1. Author Response

      The following is the authors’ response to the original reviews.

      Public Reviews:

      Throughout the study, there is insufficient information about how experiments were performed and how often (imaging, pull-downs etc), how data was acquired, modified and analysed (especially imaging data, see below), how statistical analyses were done and what is presented in the figures (single planes or maximum intensity projections etc). This makes it difficult to evaluate the data and results.

      We have incorporated additional experimental details to the Materials and Methods section: "Recent advancements in optical and camera technologies permit the acquisition of Z-stacks without perturbing Q cell division or overall animal development. Z-stack images were acquired over a range of -1.6 to +1.6 μm from the focal plane, at intervals of 0.8 μm. The field-of-view spanned 160 μm × 160 μm, and the laser power, as measured at the optical fiber, was approximately 1 mW. ImageJ software (http://rsbweb.nih.gov/ij/) was used to perform image analysis and measurement. Image stacks were z-projected using the average projection for quantification and using the maximum projection for visual display. "

      The majority of our experimental procedures adhere to methodologies delineated in our prior publications and other scientific literature. We were pioneers in the development of fluorescence time-lapse live microscopy techniques for capturing Q cell migration and asymmetric division (Ou and Vale, Journal of Cell Biology, 2009; Ou et al., Science, 2010; Chai et al., Nature Protocols, 2012). Our innovative imaging protocol uncovered a novel mode of polarized, non-muscle myosin-II-dependent asymmetric cell division (Ou et al., Science, 2010). Subsequently, we unveiled another previously uncharacterized mechanism of asymmetric cell division dependent on polarized actin polymerization (Chai et al., Cell Discovery, 2022). In the present study, we have significantly refined our imaging and quantification protocols. Different from the single-focal-plane imaging employed in our earlier study by Ou et al. 2009, advancements in optical technologies and camera resolution now enable us to undertake time-lapse imaging across multiple focal planes and track signal differences between the anterior and posterior segments of dividing cells.

      There is insufficient information about tools and reporters used. This is misleading and impacts the conclusions that can be made from the results presented. To give an example, in Figure 1D-F, the authors present data that HDA-1::GFP and LIN-53::mNeonGreen (both components of the nucleosome remodeling and deacetylation complex) but not the histone acetyltransferase MYS-1::GFP are 'asymmetrically segregated' during QR.a division. However, the authors do not mention that HDA-1::GFP and LIN-53::mNeonGreen are expressed at endogenous levels (they are CRISPR alleles) whereas MYS-1::GFP is overexpressed (integration of a multi-copy extrachromosomal array). The difference in 'segregation' could therefore be a consequence of different levels of expression rather than different modes of segregation ('asymmetric' versus 'symmetric').

      Figure S2 shows overexpressed HDA-1, LIN-53 and CHD-3 are also asymmetrically segregated during ACD of QR.a, which indicates that different levels of expression do not affect the modes of segregation, at least for the NuRD subunits. In the main text, however, we presented the asymmetric segregation of HDA-1::GFP and LIN-53::mNeonGreen using their CRISPR KI alleles.

      There is insufficient information about the phenotypes of the animals used (RNAi knock-downs of hda-1, lin-53 RNAi, pig-1 etc). Again this is misleading and impacts the conclusions that can be made. To give some examples,

      1. In Figure 3A-G, control RNAi embryos are compared to hda-1 RNAi and lin-53 RNAi embryos. What the authors do not mention is that hda-1 RNAi and lin-53 RNAi embryos have severe developmental defects and essentially cannot be compared to control RNAi embryos. The differences between the embryos can be seen in Figure S7B where bright-field images of control RNAi, hda-1 RNAi and lin-53 RNAi embryos are shown. At the 350 min time point, a normal embryo is visible for the control, a 'ball of cells' embryo for hda-1 RNAi and an embryo that seems to have arrested at an earlier developmental stage (and therefore have much larger cells) for lin-53 RNAi. Because of these pleiotropic phenotypes, it is unclear whether differences seen for example in sAnxV::GFP positive cells (Figure 3A) are the result of a direct effect of hda-1(RNAi) on cell death or whether they are the result of global changes in development and cell fate induced by hda-1(RNAi). hda-1(RNAi) and lin-53(RNAi) embryos are also used for the data shown in Figures S6 and S7, raising the same concerns;

      In the submitted manuscript, we mentioned that hda-1 RNAi and lin-53 RNAi caused embryonic lethality and that we could track some of the apoptotic events in hda-1 RNAi embryos arrested between the late gastrulation stage and bean stage. We agree with the reviewers that because of the pleiotropic phenotypes, we cannot distinguish whether sAnxV::GFP positive cells (Figure 3A) are the result of a direct effect of hda-1 (RNAi) on cell death or whether they are the result of global changes in development and cell fate induced by hda-1 (RNAi). We added the sentence to page 9 line 26: “Considering the pleiotropic phenotypes caused by loss of HDA-1, we cannot exclude the possibility that ectopic cell death might result from global changes in development, even though HDA-1 may directly contribute to the life-versus-death fate determination.”

      1. The authors do not mention what the impact of Baf A1 treatment is on animals; however, the images provided in Figure 5E indicate that Baf A1 treatment causes pleiotropic effects in L1 larvae.

      We have carefully checked the BafA1 treated animals, but have not been able to detect any visible defect in Baf A1 treated animals under a 25× dissection microscope at the given dosage and duration of treatment. We also searched for the published images or literature and did not find pleiotropic effects on the animal level at this dosage and duration; however, we agree with the reviewers that perturbation of pH homeostasis in lysosomes by BafA1 will certainly generate pleiotropic cellular defects. We discussed the issue below:

      "Although BafA1-mediated disruption of lysosomal pH homeostasis is recognized to elicit a wide array of intracellular abnormalities, we found no evidence of such pleiotropic effects at the organismal level with the dosage and duration of treatment employed in this study."

      There is a lack of adequate controls. Because of this, some of the data presented must be considered as preliminary. To give some examples:

      1. Controls are lacking for the data shown in Figure 3D-G (i.e. genes other than egl-1). Since hda-1 RNAi has a pleiotropic effect and most likely affects H3K27 acetylation genome-wide, this is critical. Based on what is shown, it is unclear whether the results presented are specific to egl-1 or not;

      In figure 3F, we added F23B12.1 and sru-43 as the controls of egl-1. We added “while the H3K27ac level of genes adjacent to egl-1 showed no significant changes” to Page 10 line 22 in the revised text.

      1. The co-IP and mass spec data shown in Figure 4A, C and Figure S8 also lack a critical control, which is GFP only. Because of this, it is unclear whether subunits of the V-ATPase bind to HDA-1 or GFP. The co-IP and mass spec data forms the basis of Figures 5 and 6 as well as Figure S9. Data presented in these figures therefore has to be considered preliminary as well.

      In the co-IP and mass spec shown in Figure 4A, we used ACT-4::GFP as the negative control, which can preclude V-ATPase subunits that bind to GFP. In Figure 4C, we used anti-V1A (V-ATPase V1 domain A subunit) antibody to confirm the interaction between V1A and HDA-1. In Figure S8B, we also used ACT-4::GFP as a control, showing other NuRD subunits bind to HDA-1 rather than GFP.

      Inappropriate methods are used. For this reason, some of the data again must be considered preliminary. To give some examples:

      1. In Figure 5A, B, the authors used super-ecliptic pHluorin to look at changes in pH in the daughter cells. However, the authors used quenching of super-ecliptic pHluorin fluorescence rather than a ratio-metric method to 'measure' changes in pH. Because of this, it is unclear whether the changes in fluorescence observed are due to changes in pH or changes in the amount of pHluorin protein. Figure 5A, B forms the basis for the experiments presented in the remaining parts of Figure 5 as well as in Figure 6 and Figure S9;

      Bafilomycin A1 inhibits the activity of V-ATPase, presumably preventing the pumping of protons into the apoptotic daughter cell. It is more likely that the apoptotic daughter cell becomes less acidic and more neutral after the treatment of Baf1A, although we cannot exclude the possibility that the changes in fluorescence could be due to changes in the amount of pHluorin protein. A ratio-metric method to measure changes in pH will be further used to distinguish the two possibilities.

      We added “although we cannot exclude the possibility that the changes in fluorescence could be due to changes in the amount of pHluorin protein.” to Page 12 line 12 in the revised text.

      1. The authors' description of how some images were modified before quantitative analysis raises concerns. The figures of concern are particularly Figure 1 and Figure S4, where background subtraction with denoising and deconvolution was used. Background subtraction, with denoising and deconvolution is an image manipulation that enhances the contrast between background and what looks like foreground. Therefore, background subtraction should be applied primarily in experiments involving image segmentation not fluorescence intensity measurement. Not being provided any information by the authors about the kind of subtraction that was made, this processing could lead to an uneven subtraction across the image, which can easily lead to artefacts. Since the fluorescence intensity in the smaller daughter cell is lower, and thus closer to background, the algorithm the authors used may have misinterpreted the grey value information in the smaller daughter cell pixels. This could have led to an asymmetric subtraction of background in the two daughter cells, leading to a stronger subtraction in the smaller daughter cell. Ultimately, their processing could have artificially increased the intensity asymmetry between the two daughter cells in all their results.

      As mentioned earlier, the imaging and quantification methods of this manuscript have been routinely used in our previous publications or studies from many other labs (Gräbnitz F, et al., Cell Rep. 2023; Herrero E, et al., Genetics. 2020; Roubinet C, et al., Curr Biol. 2021). Background subtraction is a standard procedure to quantify cellular fluorescence intensities. The fluorescence intensity of the slide background was measured from a region without worm bodies, of the same size as the region of interest. We have added how we measured the background to page 19 Line 24: “The fluorescence intensity of the slide background was measured from a region without worm bodies, of the same size as the region of interest.”

      The imaging data is of low quality (for example Figures 1, 2, 5, 6; Figures S2, S3, S5, S6, S9). Since much of the study and the findings are based on imaging, this is a major concern. Critical parameters are not mentioned (number of sections in z-stack, size of the field-of-view, laser power used etc), which makes it difficult to understand what was done and what one is looking at.

      Fluorescence images of neuroblast asymmetric cell division in developing C. elegans larvae has historically presented considerable challenges. Our recent methodological advancements have facilitated live imaging in this intricate system with improved resolution. In the revised manuscript, we have elucidated the specific z-stack parameters, field-of-view dimensions, and laser power settings employed: "Z-stack images were acquired over a range of -1.6 to +1.6 μm from the focal plane, at intervals of 0.8 μm. The field-of-view spaned 160 μm × 160 μm, and the laser power, as measured at the optical fiber, was approximately 1 mW."

      To give some specific examples,

      1. The images shown in Figure 2B are of very low quality with severe background from neighbouring cells. In addition, the outline of the cells (plasma membrane) or the nuclei of the daughter cells is unknown. Based on this it is not clear how the authors could have measured 'Fluorescence intensity ratio between sister nuclei' in an accurate and unbiased way (what is clear from these images is that there is an increase in HDA-1::GFP signal in ALL surviving daughters (asymmetric and symmetric divisions) post cytokinesis but not in the daughter cell that is about to die (asymmetric and unequal division));

      We employed live-cell imaging in conjunction with automated cell lineage tracing algorithms (Du et al., Cell, 2014) to scrutinize NuRD asymmetry in embryos from the two- or four-cell stage up to the 350-cell stage. This sophisticated approach was initially pioneered by Dr. Zhirong Bao at Sloan Kettering and subsequently refined by Dr. Zhuo Du during Dr. Du's postdoctoral training in Dr. Bao's laboratory. This advanced imaging pipeline enables the scientific community to quantify cellular fluorescence intensity in an automated fashion, thereby substantially mitigating manual intervention and bias.

      1. The images in Figure 6A and Figure S9A on VHA-17 segregation and its colocalization to ER and lysosome segregation during QR.a division are of very low quality and it is unclear to the reviewer how such images were used to obtain the quantitative data shown.

      In some cases, there is a discrepancy between what is shown in figures and what the authors state in the text. To give some examples:

      1. On page 7, the authors state "..., we found that nuclear HDA-1 or LIN-53 asymmetry gradually increased from 1.1-fold at the onset of anaphase to 1.5 or 1.8-fold at cytokinesis, respectively (Figure 1D-E)." Looking at the images for HDA-1 and LIN-53 in Figure 1D, the increase in the ratio mainly occurs between 4 min and 6 min, which is post cytokinesis and NOT prior to cytokinesis;

      Thank the reviewer for pointing out this. The nuclear HDA-1 or LIN-53 asymmetry increased to 1.5 or 1.8-fold 6 min after the onset of anaphase, when QR.a just completes cytokinesis. Therefore, We change the sentence “we found that nuclear HDA-1 or LIN-53 asymmetry gradually increased from 1.1-fold at the onset of anaphase to 1.5 or 1.8-fold at cytokinesis, respectively (Figure 1D-E).” to “we found that nuclear HDA-1 or LIN-53 asymmetry gradually increased from 1.1-fold at the onset of anaphase to 1.5 or 1.8-fold upon the completion of cytokinesis, respectively (Figure 1D-E).”

      However, nuclear HDA-1 or LIN-53 asymmetry initiates prior to cytokinesis. We started to see the nuclear HDA-1 or LIN-53 asymmetry (1.4 fold for HDA-1 and 1.2 fold for LIN-53 ) 2 min after the onset of anaphase (Figure 1D).

      1. These images (Figure 1D) also show that there is an increase in the HDA-1 and LIN-53 signals in the larger daughter cells (QR.ap), which suggests that the increase in ratios (Figure 1E) is the result of increased HDA-1 and LIN-53 synthesis post cytokinesis. However, on top of page 8, the authors state "The total fluorescence of HDA-1, LIN-53 and MYS-1 remained constant during ACDs, suggesting that protein redistribution may establish NuRD asymmetry (Figure S4C)." In Figure S4C, the authors present straight lines for 'relative total fluorescence' for imaging (probably z-stacks) that was done every min over the course of 7 min. If there was no increase in material as the authors claim, they should have seen significant photobleaching over the course of the 7 min and therefore reduced level of 'relative total fluorescence' over time. How the data presented in Figure S4C was generated is therefore unclear. (Despite the fact that the authors claim that the asymmetry seen is not due to new synthesis in the larger daughter cell post cytokinesis, it would be more consistent with the first experiment presented in this study (Figure S1) that shows that there is more hda-1 mRNA in egl-1(-) cells compared to egl-1(+) cells);

      Regarding the concern of photo-bleaching, we have meticulously calibrated our imaging system over the past several years. Rigorous controls, qualification, and analyses were scrupulously undertaken during the development of our fluorescence time-lapse imaging system for the investigation of Q cell dynamics, initially established by Dr. Guangshuo Ou in Ron Vale's laboratory—a renowned hub for avant-garde imaging techniques (Ou & Vale, Journal of Cell Biology, 2009; Ou et al., Science, 2010). Remarkably, no discernible photobleaching was observed even during two to three-hour imaging.

      We agree that protein turnover, involving both degradation and synthesis, may occur. However, NuRD asymmetric distribution occurred within several minutes after metaphase and QR.a completes cytokinesis ~6min after the onset of anaphase, while GFP protein translation and maturation require ~ 30 min in Q neuroblast (Ou & Vale, Journal of Cell Biology, 2009). Even if hda-1::gfp mRNA is translated during cell division, the nascent GFP-tagged protein will mature long after the completion of cytokinesis. Consequently, we postulate that the influence of newly synthesized GFP-tagged protein during Q cell division is negligible for quantification purposes. It is plausible that the asymmetry in HAD-1 protein distribution is independent of hda-1 mRNA asymmetry.

      1. On page 12, the authors state "..., in Baf A1-treated animals, QRaa inherited similar levels of HDA-1::GFP as its sister cell,...". However, looking at the image provided in Figure 5E (0 min), there seems to be a similar ratio of HDA-1::GFP between the daughter cells in DMSO and Baf A1-treated animals.

      We have adjusted the images in Figure 5E to show the asymmetry in DMSO-treated control animals. We acknowledge variations among animals. Our quantifications from more than 10 animals show the HDA-1 asymmetry in DMSO-treated animals in Figure 5B.

      Recommendations for the authors:

      Conclusion 1

      "Here, we demonstrate that the nucleosome remodeling and deacetylase (NuRD) complex is asymmetrically segregated into the surviving daughter cell rather than the apoptotic one during ACDs in Caenorhabditis elegans" (Abstract)

      Results described on pages 6-9 ("NuRD asymmetric segregation during neuroblast ACDs" and "NuRD asymmetric segregation in embryonic cell lineages") and data shown in Figure S1, Figure 1, Figures S2, S3, S4, S5, Figure 2.

      Conclusion 1 is not supported by the results as numerous concerns exist about the data in many of these figures (see above, major weaknesses). A more likely explanation for the authors' observations is that there is synthesis of NuRD post cytokinesis and that asymmetries in the amounts of NuRD observed in the two daughter cells is a consequence of their different cell sizes (QR.ap is 3x as large as QR.aa). This is supported by the finding that the loss of pig-1, which causes 'equal' division resulting in two daughter cells of similar sizes, abolishes the differences in NuRD seen between the daughter cells.

      As discussed earlier, GFP protein translation and maturation require ~ 30 min in Q neuroblast (Ou & Vale, Journal of Cell Biology, 2009). Even if there is the synthesis of NuRD post cytokinesis, the nascent GFP-tagged protein will not mature within our imaging timeframe, Therefore, NuRD asymmetry is unlikely to be a result of the synthesis of NuRD post cytokinesis. In addition, We found that MYS-1::GFP was symmetrically segregated into the small apoptotic daughter cells and big surviving daughter cells, suggesting NuRD asymmetry may be irrelevant to cell size asymmetry.

      Interestingly, despite the fact that the loss of pig-1 causes 100% of the divisions to be equal by size and symmetric with respect to NuRD amounts, it only causes about 30% of QR.aa cells to inappropriately survive. This demonstrates that there is a correlation between NuRD asymmetry and daughter cell size asymmetry but NOT between NuRD asymmetry and cell death. This also demonstrates that loss of 'NuRD asymmetry' and presence of NuRD in the daughter that should die is NOT sufficient to block its death.

      Cordes et al. 2006 (DOI: 10.1242/dev.02447) reported that in pig-1 loss-of-function mutants, <40% of Q.p lineages produce extra neurons because Q.pp cells inappropriately survive. Noticeably, only 30% and 5% Q.p lineages produce extra neurons in ced-3 and egl-1 loss of function single mutant, respectively. pig-1 ced-3 double mutant or pig-1 egl-1 double mutants show a dramatically stronger phenotype than either single mutant, resulting in about 80% of Q.p lineages producing extra neurons. These results suggest that pig-1 functions in parallel to the EGL-1-CED-9-CED-4-CED-3 cell death pathway to promote Q cell apoptosis.

      We agree with the reviewer that “loss of 'NuRD asymmetry' and presence of NuRD in the daughter that should die is NOT sufficient to block its death” in pig-1 loss-of-function mutants. However, these results do not rule out the correlation between NuRD asymmetry and cell death. In the pig-1 mutant, the concentration of NuRD in Q.pp might not be high enough to completely block the death pathway. Alternatively, NuRD may be one but not the only factor blocking the cell death pathway.

      Lastly, it is imperative to underscore that cellular aberrations observed during early developmental stages frequently undergo compensatory correction during subsequent developmental stages or even initial aging stages. For example, in certain cell migration mutants exhibiting early migration defects, the initial penetrance exceeds 80%; however, the penetrance is mitigated to a mere 30% in adults. Such observations have been corroborated in our prior publications focusing on cell migration dynamics (Wang et al., PNAS, 2013; Zhu et al., Dev Cell, 2016). This appears to be a pervasive phenomenon, echoed by several laboratories specializing in neural development. Sengupta and Blacque’s labs has reported that early aging can ameliorate ciliary phenotypes in C. elegans mutants with compromised intraflagellar transport mechanisms. Accordingly, late developmental stages may act as a compensatory buffer for antecedent developmental abnormalities.

      Conclusion 2

      "The absence of NuRD triggers apoptosis via the EGL-1-CED-9-CED-4-CED-3 pathway, while an ectopic gain of NuRD enables apoptotic cells to survive." (Abstract) Results described on pages 8-10 ("Loss of the deacetylation activity of NuRD causes ectopic apoptosis" and "NuRD RNAi upregulates the egl-1 expression by increasing its H3K27 aceylation") and data shown in Figure S6, Figure 3, Figure S7 and data shown in Figure 5.

      Because of the various concerns raised above (major weaknesses) about the data presented in Figure S6, Figure 3, Figure S7 (pleiotropic phenotypes of hda-1 and lin-53 RNAi animals, lack of controls etc), there is no evidence that NuRD has a specific and/or direct effect on egl-1 expression in cells programmed to die or that loss of NuRD causes ectopic egl-1-dependent cell death. The claim that "ectopic gain of NuRD enables apoptotic cells to survive." is based on Figure 5E, where the authors show that Baf A1 treatment causes symmetric NuRD segregation in 11/12 animals and that QR.aa survives in 11/12 animals. However, those data are unconvincing. As mentioned above (major weaknesses), from the low-quality images provided, it is not clear whether there is 'symmetric NuRD segregation' in Baf A1 treated animals, and the conditions of the animals are a concern because of pleiotropic effects of blocking V-ATPase. (I am not convinced I am actually looking at the same region of an L1 larvae in the three animals because the HDA-1::GFP signal seems inconsistent across them.) One process that is affected by a block of V-ATPase is engulfment. The fact that the authors observe that 130 min post-cytokinesis, QR.aa still persists in Baf A1 treated animals could therefore be the result of a delay in engulfment rather than a block in cell death. In addition, the claim that ectopic gain of NuRD enables apoptotic cells to survive contradicts their findings on loss of pig-1 described about ('Conclusion 1').

      We acknowledge the limitations of our imaging system; however, as we pointed out earlier that we developed imaging methods and kept improving them. We have tried our best to obtain images from developing C. elegans larvae. On the other hand, we showed that hda-1 RNAi and lin-53 RNAi increase the expression of a subset of genes, including egl-1, either directly or indirectly (Fig. 3C). Figure 3B shows the ectopic cell death caused by loss of NuRD is dependent on EGL-1-CED-9-CED-4-CED-3 pathway. While we cannot exclude several other possibilities while addressing such a complex problem in such a challenging model system, these results provide some evidence supporting that our claim can be one of the possibilities.

      Conclusion(s) 3

      "We identified the vacuolar H+-adenosine triphosphatase (V-ATPase) complex as a crucial regulator of NuRD's asymmetric segregation. V-ATPase interacts with NuRD and is asymmetrically segregated into the surviving daughter cell. Inhibition of V-ATPase disrupts cytosolic pH asymmetry and NuRD asymmetry" (Abstract)

      Results described on pages 10-13 ("V-ATPase regulates asymmetric segregation of NuRD during somatic ACDs") and data shown in Figures 4, 5, 6, Figures S8, S9.

      As outlined above (major weaknesses), the evidence that HDA-1 interacts with the V-ATPase complex is preliminary (no GFP control), and I consider the imaging data showing that V-ATPase asymmetrically segregates very low quality and unconvincing (Figure 6). The data on pH changes are also preliminary as the experiment was not done the way it should have (quenching rather than ratiometric). Finally, there are concerns about the results that apparently demonstrate that inhibiting V-ATPase activity disrupts pH asymmetry and NuRD asymmetry (impact of Baf A1 treatment).

      As discussed earlier, Bafilomycin A1 inhibits the activity of V-ATPase, presumably preventing the pumping of protons into apoptotic daughter cells. It is more likely that the apoptotic daughter cell becomes less acidic and more neutral after the treatment of Baf1A, although we cannot exclude the possibility that the changes in fluorescence could be due to changes in the amount of pHluorin protein. A ratio-metric method to measure changes in pH will be further used to distinguish the two possibilities.

      We added “although we cannot exclude the possibility that the changes in fluorescence could be due to changes in the amount of pHluorin protein.” to Page 12 line 12 in the revised text.

      Conclusion 4

      "We suggest that asymmetric segregation of V-ATPase may cause distinct acidification levels in the two daughter cells, enabling asymmetric epigenetic inheritance that specifies their respective life-versus-death fates." (Abstract) Discussion and model Figure 6C.

      I consider the model premature and not based on any convincing data. In addition, the role of V-ATPase and acidification does not make sense. V-ATPase is involved in the acidification of the lysosomal system (lumen), and it is thought that cytosolic acidification in apoptotic cells is caused by lysosomal leakage. This is not consistent with the authors' model.

      This manuscript lacks a section describing details of statistical analyses and the rationale for the chosen test, sample sizes, exclusion criteria, and replication details. Although the sample size is relatively smaller (less than 30), the authors used "unpaired t-test" for most of the tests. They should describe which type of t-test they used (parametric or non-parametric test). They also should provide replication details for non-statistical data set, for example Fig 3F and Fig 4C.

      We used the Unpaired two-tailed parametric t-test. We have now added the information for statistic tests in the revised methods and figure legends.

    1. Author Response

      The following is the authors’ response to the original reviews.

      Thank you for the thoughtful consideration of our work, including both reviewers’ constructive comments. Our apologies for taking some extra time for this revision, but we wanted to adress comments thoroughly with new analyses, not to mention a PhD defense, parental leave and my teaching ultimately being the bottleneck for the team’s work!

      Reviewer #1 (Public Review):

      The authors use a combination of structural and MD simulation approaches to characterize phospholipid interactions with the pentameric ligand-gated ion channel, GLIC. By analyzing the MD simulation data using clusters of closed and open states derived previously, the authors also seek to compare lipid interactions between putative functional states. The ultimate goal of this work is to understand how lipids shape the structure and function of this channel.

      The strengths of this article include the following:

      1) The MD simulation data provide extensive sampling of lipid interactions in GLIC, and these interactions were characterized in putative closed and open states of the channel. The extensive sampling permits confident delineation of 5-6 phospholipid interaction sites per subunit. The agreement in phospholipid binding poses between structures and the all-atom MD simulations supports the utility of MD simulations to examine lipid interactions.

      2) The study presents phospholipid binding sites/poses that agree with functionally-important lipid binding sites in other pLGICs, supporting the notion that these sites are conserved. For example, the authors identify interactions of POPC at an outer leaflet intersubunit site that is specific for the open state. This result is quite interesting as phospholipids or drugs that positively modulate other pLGICs are known to occupy this site. Also, the effect of mutating W217 in the inner leaflet intersubunit site suggests that this residue, which is highly conserved in pLGICs, is an important determinant of the strength of phospholipid interactions at this site. This residue has been shown to interact with phospholipids in other pLGICs and forms the binding site of potentiating neurosteroids in the GABA(A) receptor.

      Weaknesses of this article include the following:

      1) The authors describe in detail state-dependent lipid interactions from the MD simulations; however, the functional significance of these findings is unclear. GLIC function appears to be insensitive to lipids, although this understanding is based on experiments where GLIC proteoliposomes were fused to oocyte membranes, which may not be optimal to control the lipid environment. Without functional studies of GLIC in model membranes, the lipid dependence of GLIC function is not definitively known. Therefore, it is difficult to interpret the meaning of these state-dependent lipid interactions in GLIC.

      2) It is unlikely that the bound phospholipids in the GLIC structures, which are co-purified from e. coli membranes, are POPC. Rather, these are most like PE or PG lipids. While it is difficult to accommodate mixed phospholipid membranes in all-atom MD simulations, the choice of POPC for this model, while practically convenient, seems suboptimal, especially since it is not known if PE or PG lipids modulate GLIC function. Nevertheless, it is striking that the overall binding poses of POPC from the simulations agree with those identified in the structures. It is possible that the identity of the phospholipid headgroup will have more of an impact on the strength of interactions with GLIC rather than the interaction poses (see next point).

      3) The all-atom MD simulations provide limited insight into the strength of the POPC interactions at each site, which is important to interpret the significance of these interactions. It is unlikely that the system has equilibrated within the 1.7 microseconds of simulation for each replicate preventing a meaningful assessment of the lipid interaction times. Although the authors report exchange of up to 4 POPC interacting at certain residues in M4, this may not represent binding/unbinding events (depending on how binding/interaction is defined), since the 4 Å cutoff distance for lipid interactions is relatively small. This may instead be a result of small movements of POPC in and out of this cutoff. The ability to assess interaction times may have been strengthened if the authors performed a single extended replicate up to, for example, 10-20 microseconds instead of extending multiple replicates to 1.7 microseconds.

      Reviewer #2 (Public Review):

      The authors convincingly show multiple inner and outer leaflet non-protein (lipid) densities in a cryo-EM closed state structure of GLIC, a prokaryotic homologue of canonical pentameric ligand-gated ion channels, and observe lipids in similar sites during extensive simulations at both resting and activating pH. The simulations not only corroborate structural observations, but also suggest the existence of a state-dependent lipid intersubunit site only occupied in the open state. These important findings will be of considerable interest to the ion channel community and provide new hypotheses about lipid interactions in conjunction with channel gating.

      Recommendations for the authors: please note that you control which, if any, revisions, to undertake

      In particular, a discussion of whether the timescale of the simulations permit measurements of residence or interaction times of the lipids should be addressed.

      Reviewer #1 (Recommendations for the authors):

      Comment 1.1: The authors may consider expanding the discussion about the significance of state-dependent lipid interactions. On the one hand, they emphasize state-dependent interactions of POPC with closed and open states in the outer leaflet in the results. On the other hand, they state that GLIC is insensitive to its lipid environment. What is the significance of the state-dependent interactions of POPC in GLIC, if any? It is possible that GLIC agonist responses are sensitive to phospholipids (such as PE or PG found in e. coli)? The state-dependent differences in lipid interaction identified in this study support this possibility and suggest the need to better understand the effects of phospholipids on GLIC function.

      Response 1.1: We agree with the reviewer that this is an interesting question and we have therefore extended the discussion with additional references on the functional effects on GLIC of various lipid membranes:

      p. 11 (Discussion)

      “Sampling was further simplified by performing simulations in a uniform POPC membrane. Prior experiments have been conducted to assess the sensitivity of GLIC in varying lipid environments (Labriola et al., 2013; Carswell et al., 2015; Menny et al., 2017), indicating that GLIC remains fully functional in pure POPC bilayers. In our cryo-EM experiments, the protein was recombinantly expressed from E. coli, which means that the experimental density would likely represent phosphatidylglycerol or phosphatidylethanolamine lipids. However, as the molecular identities of bound lipids could not be precisely determined, POPC lipids were built for straightforward comparison with simulation poses. While it appears that GLIC is capable of gating in a pure POPC bilayer, it remains plausible that its function could be influenced by different lipid species, especially due to the presence of multiple charged residues around the TMD/ECD interface which might interact differently with different lipid head groups. Further experiments would be needed to confirm whether the state dependence observed in simulations is also lipid-dependent. It is possible that certain types of lipids bind in one but not the other state, or that certain states are stabilized by a particular lipid type.”

      Comment 1.2: It would be helpful to state in the discussion that the co-purified lipids from GLIC structures are likely PE or PG from e. coli membranes. Nevertheless, it is interesting that the phospholipid poses from the structures generally agree with those identified from the MD simulations using PC.

      Response 1.2: Good point. We have clarified in the discussion that the native lipids in the cryo-EM structure are likely PG or PE lipids, as quoted in the preceding Response.

      Comment 1.3: The authors describe a more deeply penetrating interaction of POPC in the outer intrasubunit cleft in the open state, but this is difficult to appreciate from the images in Fig. 4B, 4E or S3B. The same is true of the deep POPC interaction at the outer intersubunit site. It may be helpful to show these densities from a different perspective to appreciate the depth of these binding poses.

      Response 1.3: We have added Figure 4 – figure supplement 1 to better show the depth of lipid binding poses, especially the ones in the outer leaflet intrasubunit cleft and at the inner intersubunit site, and cited the figure on p. 7 (Results).

      Comment 1.4: The representation of the lipid densities in Fig. 4B is not easy to interpret. First, the meaning of resting versus activating conditions and closed versus open states can be easily missed for readers who are not familiar with the author's previous study. It may be helpful to describe this (i.e. how open and closed state clusters were generated from structures determined in resting and activating conditions) in greater detail in either the figure legend, results or methods. Second, the authors state that there are differences in lipid poses between the closed and open states but not resting and activating conditions. With the exception of the intersubunit density, this is difficult to appreciate from Fig. 4B. As stated in point #3, the difference, for example, in the complementary intrasubunit site may be better appreciated with an image from a different perspective.

      Response 1.4: Acknowledged - the distinction between resting and activating conditions v.s. open and closed states can be confusing. We have tried to clarify these differences at the beginning of the results section, the methods section, and in the caption of Figure 4. Regarding differences in lipid poses between open and closed states, we agree it is difficult to appreciate from Figure 4, but here we refer the reader to Figure 4 – figure supplement 2 for an overlay between open and closed densities. Additionally, we now added Figure 1 – figure supplement 1 which provides lipid densities for all five subunits and overlays with the build cryo-EM lipids, possibly making differences easier to appreciate. Regarding images from different perspectives, we trust the new figure supplement described in Response 1.3 provides a better perspective.

      p. 3 (Results)

      “For computational quantification of lipid interactions and binding sites, we used molecular simulations of GLIC conducted under either resting or activating conditions (Bergh et al., 2021a). As described in Methods, resting conditions corresponded to neutral pH with most acidic residues deprotonated; activating conditions corresponded to acidic pH with several acidic residues protonated. Both open and closed conformations were present in both conditions, albeit with different probabilities.”

      p. 8 (Figure 4)

      “Overlaid densities for each state represent simulations conducted under resting (dark shades) or activating (light shades) conditions, which were largely superimposable within each state.”

      p. 24 (Methods)

      “We analyzed previously published MSMs of GLIC gating under both resting and activating conditions (Bergh et al., 2021a). Resting conditions corresponded to pH 7, at which GLIC is nonconductive in functional experiments, with all acidic residues modeled as deprotonated. Activating conditions corresponded to pH 4.6, at which GLIC is conductive and has been crystallized in an open state (Bocquet et al., 2009). These conditions were modeled by protonating a group of acidic residues (E26, E35, E67, E75, E82, D86, D88, E177, E243; H277 doubly protonated) as previously described (Nury et al., 2011).”

      Comment 1.5: The new closed GLIC structure was obtained by merging multiple datasets. What were the conditions of the datasets used? Was it taken from samples in resting or also activating conditions?

      Response 1.5: We have updated the Results, Discussion, and Methods to clarify this important point, in particular by merging datasets and rerunning the classification:

      p. 3 (Results)

      “In our cryo-EM work, a new GLIC reconstruction was generated by merging previously reported datasets collected at pH 7, 5, and 3 (Rovšnik et al., 2021). The predominant class from the merged data corresponded to an apparently closed channel at an overall resolution of 2.9 Å, the highest resolution yet reported for GLIC in this state (Figure 1 – figure supplement 2, Table 1).”

      p. 11 (Discussion)

      “Interestingly, the occupational densities varied remarkably little between resting and activating conditions (Figure 1 – figure supplement 1), indicating state- rather than pH- dependence in lipid interactions, also further justifying the approach of merging closed- state GLIC cryo-EM datasets collected at different pH conditions to resolve lipids.”

      p. 14 (Methods)

      “After overnight thrombin digestion, GLIC was isolated from its fusion partner by size exclusion in buffer B at pH 7, or in buffer B with citrate at pH 5 or 3 substituted for Tris. The purified protein was concentrated to 3–5 mg/mL by centrifugation. [...] Data from three different grids, at pH 7, 5, and 3, were merged and processed together.”

      Comment 1.6: In Fig. 3D, do the spheres represent the double bond? If so, please state in the legend

      Response 1.6: We have clarified in the legend of Figure 3D that the yellow spheres on the lipid tails represent a double bond.

      Comment 1.7: In Fig. 3E, what is the scale of the color representation?

      Response 1.7: We have clarified in the legend of Figure 3E that colors span 0 (white) to 137015 contacts (dark red).

      Reviewer #2 (Recommendations For The Authors):

      Comment 2.1: I'm not sure I fully understand how the final lipids were modeled (built). Fig. 1 caption suggests they may have been manually built? I understand that the idea was to place them in the overlap of simulation densities and structure densities, but can the authors please clarify if there were any quantifiable conditions that were employed during this process or if this was entirely manual placement in a pose that looked good? Regardless, it would be helpful to see an overlay of the built lipids with both the cryo and simulation densities (e.g., overly of Fig. 1F/H and G/H) to better visualize how the final built lipids compare.

      Response 2.1: We thank the reviewer for pointing out unclarities regarding our methods. We have extended the methods section to clarify how the lipids were manually built in the cryo-EM structure. We have also added Figure 1 – figure supplement 1 showing overlays of the computational densities and built cryo-EM lipids.

      p. 15 (Methods)

      “Lipids were manually built in COOT by importing a canonical SMILES format of POPC (Kim et al., 2021) and adjusting it individually into the cryo-EM density in each of the sites associated with a single subunit, based in part on visual inspection of lipid densities from simulations, as described above. After building, 5-fold symmetry was applied to generate lipids at the same sites in the remaining four subunits.”

      Comment 2.2: Regarding the state-dependent lipid entry to the outer leaflet intersubunit site associated with channel opening, if the authors could include a movie depicting this process that would be great. The current short explanation does not do this justice. Also, what were the dynamics of this process? Beyond the correlation between site occupancy and the pore being open, how did the timing of lipid entry/exit and pore opening/closing correlate?

      Response 2.2: The point regarding the timing of state-dependent lipid binding at the subunit interface and pore opening is indeed an interesting one. We have added Figure 4 – figure supplement 3D showing that the state-dependent P250 lipid interaction precedes pore opening, as quantified by pore hydration levels, indicating a potential role in gating. The interaction between lipid binding and conformational change of the protein is also depicted in the newly added Figure 4 - video supplement 1, which we hope will be able to better communicate the conclusions regarding state-dependent interactions. We have also expanded the results and discussion to better explain these results:

      p. 9 (Results)

      “The lipid head made particularly close contacts with residue P250 on the M2-M3 loop, which undergoes substantial conformational change away from the pore upon channel opening, along with outer-leaflet regions of M1–M3 (Figure 4E, Figure 4—figure Supplement 3A,B,C, Figure 4—video 1). These conformational changes were accompanied by a flip of M1 residue F195, which blocked the site in the closed state but rotated inward to allow closer lipid interactions in the open state (Figure 4—figure Supplement 3C, Figure 4—video 1). Indeed, P250 was predominantly located within 3 Å of the nearest lipid atom in open- but not closed-state frames (Figure 4F). Despite being restricted to the open state, interactions with P250 were among the longest duration in all simulations (Figure 2C) and as these binding events preceded pore opening, it is plausible to infer a role for this state-dependent lipid interaction in the gating process (Figure 4 – figure supplement 3D).”

      p. 12 (Discussion)

      “The state-dependent binding event at this site preceded pore opening in MSMs, where lipid binding coincided with crossing a smaller energy barrier between closed and intermediate states, followed by pore opening at the main energy barrier between intermediate and open states (Figure 4 – figure supplement 3D). Further, since the P250- lipid interaction was characterized by relatively long residence times (Figure 2), it is possible this lipid interaction has a role to play in GLIC gating.”

      Comment 2.3: Although the interaction times are helpful, I didn't get a great sense of how mobile the lipids are during the simulations. Can the authors discuss this a bit more. For example, are interaction times dominated by lipids that jiggle a bit away from a residue and then back again, vs how often are lipids exchanging with other lipids initially further away from the protein?

      Response 2.3: We have now added various measures of lipid diffusion, both for initially interacting lipids and for bulk lipids, which are summarized in the new Figure 2 – figure supplement 1. We have further addressed the question of simulation timescales in Results, Discussion, and Methods. These numbers highlight that it is possible for lipids several nanometers away from the protein surface to exchange with lipids of the first lipid shell.

      p. 3,6 (Results)

      “Lateral lipid diffusion coefficients were estimated to 1.47 nm2/µs for bulk lipids and 0.68 nm2/µs for lipids of the first lipid shell (Figure 2 – figure supplement 1A), which is relatively slow compared to the timescales of each trajectory (1.7 µs). However, multiple residues throughout the M1, M3, and M4 helices exchanged contacts with 2-4 different lipid molecules in individual simulations (Figure 2C). Furthermore, 1.7-µs root mean square displacement of lipids originally in the first lipid shell was 2.15 nm, and 3.16 nm in the bulk bilayer, indicating such exchanges are not limited to nearby lipids (Figure 2 – figure supplement 1B). Thus, exchange events and diffusion estimates indicate that the duration of lipid contacts observed in this work can be at least partly attributed to interaction stabilities and not solely to sampling limitations.”

      p. 11 (Discussion)

      “Indeed, the unrestrained atomistic MD simulations studied here were not expected to capture the maximal duration of stable contacts, as indicated by some interaction times approaching the full 1.7-µs trajectory (Figure 2}). Nevertheless, simulations were of sufficient length to sample exchange of up to four lipids, particularly around the M4 helix. Calculation of lipid lateral diffusion coefficients resulted in average displacements at the end of simulations of 2.15 nm for lipids initially interacting with the protein surface, roughly corresponding to lipids diffusing out to the 4th lipid shell. Diffusion of bulk lipids was faster, allowing lipids originally 3.16 nm away from the protein surface to ingress the first lipid shell. This observation underscores the potential for lipid exchange events even among lipids initially distant from the protein surface. Of course, duration of exceptionally stable interactions, such as those involving T274 (Figure 2C), inevitably remain bounded by the length of our simulations. Still, diffusion metrics, supported by robust statistical analysis encompassing diverse starting conditions (500 trajectories), enable confident estimation of relative interaction times.“

      p. 13 (Methods)

      “Time-based measures of protein-lipid interactions, such as mean duration times and exchange of interactions, were calculated for the 100 x 1.7 µs-long simulations using prolintpy (Sejdiu and Tieleman, 2021) with a 4 Å interaction cutoff. Analysis of lateral lipid diffusion in individual simulations was carried out for two disjoint sets of lipids: the first lipid shell defined as lipids with any part within 4 Å of the protein surface (~90 lipids), and bulk lipids consisting of all other lipids (~280 lipids). Mean square displacements of each lipid set were calculated using GROMACS 2021.5 (Abraham et al., 2015b) with contributions from the protein center of mass removed. Diffusion coefficients for each set, DA, were calculated using the Einstein relation (Equation 1) by estimating the slope of the linear curve fit to the data.

      where ri(t) is the coordinate of the center of mass of lipid i of set A at time t and DA is the self-diffusion coefficient.”

      Comment 2.4: How symmetric or asymmetric are the cryo and simulation densities across subunits and was there subunit asymmetry in the final build lipids? I could not tell from any of the figures beyond the casual observation that they maybe look somewhat similar in Fig. 1?

      Response 2.4: We thank the reviewer for this useful remark. We have clarified in the methods that the cryo-EM lipids were built in C5-symmetry, and thus the positions are symmetric. The computational densities were calculated independently for each subunit and are thus not necessarily symmetric. We have added Figure 1 – figure supplement 1 showing densities for all five subunits, also serving as an indication of convergence of the results.

      p. 3 (Results) “Although the stochastic nature of simulations resulted in nonidentical lipid densities associated with the five GLIC subunits, patterns of lipid association were notably symmetric (Figure 1 – figure supplement 1).”

      p. 14-15 (Methods)

      “A smaller subset of particles was used to generate an initial model. All subsequent processing steps were done using 5-fold symmetry. […] A monomer of that model was fit to the reconstructed density and 5-fold symmetry was applied with PHENIX 1.19.2-4158 through NCS restraints detected from the reconstructed cryo-EM map, to generate a complete channel. […] After building, 5-fold symmetry was applied to generate lipids at the same sites in the remaining four subunits.”

      Minor comments:

      Comment 2.5: Fig. 1 is probably not easy to follow for the general reader and the caption is very brief. I suggest adding an additional explanation to the caption and/or additional annotations to the figure to help a general reader step through this.

      Response 2.5: We have expanded the caption of Figure 1 and clarified the meanings of colors, labels, and annotations.

      Comment 2.6: Fig. 1B - Caption is confusing. I would not call the state separation lines outlines as they are not closed loops. Also, I see red/orange and two shades of blue whereas the caption mentions orange and blue only. The caption should also explicitly say what the black lines are (other cluster separations).

      Response 2.6: We have edited the caption to better describe colors, annotations, and the meaning of the data:

      p. 4 (Figure 1)

      “(B) Markov state models were used to cluster simulations conducted under resting (R) or activating (A) conditions into five states, including closed (left of the light or dark orange lines) and open (right of the light or dark blue lines). Black lines mark edges of other state clusters derived from MSM eigenvectors. Experimental structures are highlighted as white circles.”

      Comment 2.7: Fig. 3F caption appears to conflict with data where interaction with W217A appears longer than W217. I think the authors want to suggest here that W217A reduces contact time with T274 as stated in the main text.

      Response 2.7: We have clarified in this legend that “Mutation of residue W217, lining this pocket, reveals shortened interactions at the T274 binding site” (p. 6, Figure 3).

      Comment 2.8: Ref 25 and 26 are the same.

      Response 2.8: Apologies; this mistake has been corrected.

    1. Author Response

      The following is the authors’ response to the original reviews.

      Reviewer #1 (Public Review):

      In this study, single neurons were recorded, using tetrodes, from the parahippocampal cortex of 5 rats navigating a double-Y maze (in which each arm of a Y-maze forks again). The goal was located at any one of the 4 branch terminations, and rats were given partial information in the form of a light cue that indicated whether the reward was on the right or left side of the maze. The second decision point was uncued and the rat had no way of knowing which of the two branches was correct, so this phase of the task was more akin to foraging. Following the outbound journey, with or without reward, the rat had to return (inbound journey) to the maze and start to begin again.

      Neuronal activity was assessed for correlations with multiple navigation-relevant variables including location, head direction, speed, reward side, and goal location. The main finding is that a high proportion of neurons showed an increase in firing rate when the animal made a wrong turn at the first branch point (the one in which the correct decision was signalled). This increase, which the authors call rate remapping, persisted throughout the inbound journey as well. It was also found that head direction neurons (assessed by recording in an open field arena) in the same location in the room were more likely to show the rate change. The overall conclusion is that "during goal-directed navigation, parahippocampal neurons encode error information reflective of an animal's behavioral performance" or are "nodes in the transmission of behaviorally relevant variables during goal-directed navigation."

      Overall I think this is a well-conducted study investigating an important class of neural representation: namely, the substrate for spatial orientation and navigation. The analyses are very sophisticated - possibly a little too much so, as the basic findings are relatively straightforward and the analyses take quite a bit of work to understand. A difficulty with the study is that it was exploratory (observational) rather than hypothesis-driven. Thus, the findings reveal correlations in the data but do not allow us to infer causal relationships.

      We would like to clarify that this report consists of hypothesis-driven experiments, with post-hoc exploratory analyses. We have now made hypotheses more explicit in the text, and pointed out that follow-up analyses were to understand how these effects came to be. We thank the reviewer for pointing out that our hypotheses were not explicit in the introduction. We believe our results open the door for investigating the causal role of these regions in the propagation or generation of error signals during navigational behavior. Those types of experiments are however, outside the scope of the current work.

      That said, the observation of increased firing in a subset of neurons following an erroneous choice is potentially interesting. However, the effect seems small. What were the actual firing rate values in Hz, and what was the effect size?

      We thank the reviewer for the opportunity to clarify the effect size question. As there are multiple neurons in the analyses, differences in firing rate need necessarily to be normalized by a neuron's mean activity. For example, a difference of 1 spk/s is less meaningful when a neuron's base rate is 50 spk/s than when it is 10spks/s. Furthermore, our reports are for population level analyses, at which point comparing raw firing rate values and differences becomes more challenging. Nonetheless, we are including these raw metrics in two new supplemental figures (Figure 2 - figure supplement 4,5), where differences in individual neurons change can be up to 15 spks/s. Additionally, the patterns and statistical results observed in the main text are preserved, with outbound Right Cue minus Left Cue showing a left>stem>right (indicating error coding), and RW minus NRW showing negative values across all segments, indicating NRW>RW or higher activity following on inbound unrewarded trials. Statistics follow the corresponding main text results (Cue: segment LRT = 71.70; RW: segment LRT=45.80).

      I also feel we are lacking information about the underlying behavior that accompanies these firing rate effects. The authors say "one possibility is that the head-direction signal in the parahippocampal region reflects a behavioral state related to the navigational choice or the lack of commitment to a particular navigational route" which is a good thought and raises the possibility that on error trials, rats are more uncertain and turn their heads more (vicarious trial and error) and thus sample the preferred firing direction more thoroughly. Another possibility is that they run more slowly, which is associated with a higher firing rate in these cells. I think we, therefore, need a better understanding of how behavior differed between error trials in terms of running speed, directional sampling, etc.

      In terms of running speed, there was a small effect of mean running speed between correct and incorrect trials (across subjects LMEM: Cue correct>incorrect Z=2.3, p=0.02; RW Z=2.15, p=0.03). In most neurons, increases in speed will be accompanied by increases in firing rate. Thus, the differences in running speed cannot explain the observed results, as higher speed during correct trials would predict higher activity, which is the opposite of what we found.

      A few good, convincing raw-data plots showing a remapping neuron on an error trial and a correct trial on the same arm would also be helpful (the spike plots were too tiny to get a good sense of this: fewer, larger ones would be more helpful).

      Additional plots for individual units have been added, Figure 2 - figure supplement 3.

      It would be useful to know at what point the elevated response returned to baseline, how - was it when the next trial began, and was the drop gradual (suggesting perhaps a more neurohumoral response) or sudden.

      Due to the experimental design, this question cannot be addressed fully. Concretely, error trials incur a time-penalty in which the rats need to wait an additional 10 seconds before the next trial, while a new trial would start immediately when the animal nose-poked the home well after a correct trial. Nonetheless, the data on Reward provides insight into this question. The magnitude of the responses on left and right segments of the maze were larger than on the stem for Unrewarded (NRW) vs Rewarded (RW) trials on inbound trajectories, Fig. 4c. This suggests that while activity is still elevated post-incorrect throughout the maze, across units, this effect is smaller on the stem segment. Additionally, the analyses indicate that in the transition between outbound vs inbound trajectories (Figure 4 - figure supplement 3), activity patterns are sustained (incorrect>correct). Together, these results indicate that elevated "error-like" signal are slow in returning to baseline.  

      Reviewer #2 (Public Review):

      This work recorded neurons in the parahippocampal regions of the medial entorhinal cortex (MEC) and pre- and para-subiculum (PrS, PaS) during a visually guided navigation task on a 'tree maze'. They found that many of the neurons reflected in their firing the visual cue (or the associated correct behavioral choice of the animal) and also the absence of reward in inbound passes (with increased firing rate). Rate remapping explained best these firing rate changes in both conditions for those cells that exhibited place-related firing. This work used a novel task, and the increased firing rate at error trials in these regions is also novel. The limitation is that cells in these regions were analyzed together.

      We acknowledge this limitation on our study, and we believe there might be interesting differences between these regions. Unfortunately, the post-mortem extraction of the recording implant micro-drive used for these experiments generated too much tissue damage for exact localization of the tetrodes. Nonetheless, given that the patterns were observed in all subjects, we are confident that at least the major findings of "error-like" signaling is present across the parahippocampal regions. At the same time, the distributions of functional cell types as defined in the open field are different across the PaS, PrS and MEC, leaving the possibility of a more nuanced error coding scheme by region.

      Reviewer #3 (Public Review):

      The authors set out to explore how neurons in the rodent parahippocampal area code for environmental and behavioral variables in a complex goal-directed task. The task required animals to learn the association between a cue and a spatial response and to use this information to guide behavior flexibly on a trial-by-trial basis. The authors then used a series of sophisticated analytical techniques to examine how neurons in this area encode spatial location, task-relevant cues, and correct vs. incorrect responding. While these questions have been addressed in studies of hippocampal place cells, these questions have not been addressed in these upstream parahippocampal areas.

      Strengths:

      1) The study presents data from ensembles of simultaneously recorded neurons in the parahippocampal region. The authors use a sophisticated method for ensuring they are not recording from the same neurons in multiple sessions and yet still report impressive sample sizes.

      2) The use of the complex behavioral task guards against stereotyped behavior as rats need to continually pay attention to the relevant cue to guide behavior. The task is also quite difficult ensuring rats do not reach a ceiling level of performance which allows the authors to examine correct and incorrect trials and how spatial representations differ between them.

      3) The authors take the unusual approach of not pre-processing the data to group neurons into categories based on the type of spatial information that they represent. This guards against preconceived assumptions as to how certain populations of neurons encode information.

      4) The sophisticated analytical tools used throughout the manuscript allow the authors to examine spatial representations relative to a series of models of information processing.

      5) The most interesting finding is that neurons in this region respond to situations where rewards are not received by increasing their firing rates. This error or mismatch signal is most commonly associated with regions of the basal ganglia and so this finding will be of particular interest to the field.

      Weaknesses:

      1) The histological verification of electrode position is poor and while this is acknowledged by the authors it does limit the ability to interpret these data. Recent advances have enabled researchers to look at very specific classes of neurons within traditionally defined anatomical regions and examine their interactions with well-defined targets in other parts of the brain. The lack of specificity here means that the authors have had to group MEC, PaS, and PrS into a functional group; the parahippocampus. Their primary aim is then to examine these neurons as a functional group. Given that we know that neurons in these areas differ in significant ways, there is not a strong argument for doing this.

      See response to Reviewer 2.

      2) The analytical/statistical tools used are very impressive but beyond the understanding of many readers. This limits the reader's ability to understand these data in reference to the rest of the literature. There are lots of places where this applies but I will describe one specific example. As noted above the authors use a complex method to examine whether neurons are recorded on multiple consecutive occasions. This is commendable as many studies in the field do not address this issue at all and it can have a major impact as analyses of multiple samples of the same neurons are often treated as if they were independent. However, there is no illustration of the outputs of this method. It would be good to see some examples of recordings that this method classifies as clearly different across days and those which are not. Some reference to previously used methods would also help the reader understand how this new method relates to those used previously.

      We have added an additional Supplemental Figure (Figure 7 - figure supplement 1, that showcases the matching waveform approach. In the original manuscript, Fig. 7a provided an example output of the method.

      3) The effects reported are often subtle, especially at the level of the single neuron. Examples in the figures do not support the interpretations from the population-level analysis very convincingly.

      Additional plots for individual units have been added, Figure 2 - figure supplement 3. However, the effects, though small by unit, are consistent across neurons and subjects.

      The authors largely achieve their aims with an interesting behavioral task that rats perform well but not too well. This allows them to examine memory on a trial-by-trial basis and have sufficient numbers of error trials to examine how spatial representations support memory-guided behavior. They report ensemble recordings from the parahippocampus which allows them to make conclusions about information processing within this region. This aim is relatively weak though given that this collection of areas would not usually be grouped together and treated as a single unitary area. They largely achieve their aim of examining the mechanisms underlying how these neurons code task-relevant factors such as spatial location, cue, and presence of reward. The mismatch or error-induced rate remapping will be a particularly interesting target for future research. It is also likely that the analytical tools used in this study could be used in future studies.

      Reviewer #1 (Recommendations For The Authors):

      1) Typo: "attempted to addresses these challenges"

      We thank the reviewer for pointing out, this has been fixed.

      2) "classified using tuning curve based metrics" - what does "tuning curve" mean in this context?

      We have clarified this sentence in the main text.

      3) "MEC neurons encode time-elapsed" should be "MEC neurons encode time elapsed" (no hyphen)

      We thank the reviewer for pointing out, this has been fixed.

      4) "a phenomenon referred to as 'global remapping'." - I dislike this term because it has two meanings in the literature. On the one hand, it is used to contrast with rate remapping: that is, it refers to a change in the location of place fields. On the other hand, it refers to the remapping of the whole population of cells at once, as contrasted with partial remapping. I suggest calling them location remapping (vs. rate) and complete remapping (vs. partial)

      We agree that this is an overloaded term in the field. We have added 'location remapping' in the intro as a more specific term for global remapping.

      5) " tasks with no trial-to-trial predictability or experimenter-controlled cues and goals in the same environment." - ambiguously worded as it isn't clear whether the "no" refers to one or both of what follows. Also needs a hyphen after experimenter.

      We thank the reviewer for pointing out, this sentence has been reworded for clarity.

      6) " neurons changed their firing activity as a function of cue identity" - this is confounded by behavior and reward contingency, both linked to cue identity, so the statement is slightly misleading.

      We thank the reviewer for pointing this out, however, we disagree that this wording is misleading. Neurons changed their activity as a function cue identity and reward contingencies. Why neurons change their activity in such a manner is a different, more nuanced question, that we addressed through our analyses by converging on the "error" like signal that these signals seem to carry.

      7) "remapping" - I am not fully comfortable with the use of this term in this context. It derives from the original reports of change in the firing location of place cells, and the proposal that these cells form a "map" with the change in activity reflecting recruitment of a new map. With observations of rate changes in some place cells, the new term "rate remapping" was introduced, and now the authors are using "rate remapping" to mean firing rate changes in non-spatial cells. The meaning is thus losing its value. "Re-coding" might be slightly better, although we can argue about whether "code" is much better than "map"

      While we agree with the reviewer that "remapping" has been coerced into a grab-all term, these are the accepted semantics in the field. Thus, we are disinclined to change the language.

      8) Figure 1 - it would be useful to indicate somehow that one of the decision points was cued and once free choice with the random outcome - it took me a while to work this out. Also, the choice of colors for the cues needs explaining - my understanding is that rats are very insensitive to these wavelengths. And what does Pse mean? I didn't understand those scatterplots at all.

      The section "Tree-Maze behavior and electrophysiological recordings" under Results go into the details of the task. A reference and additional context for the selection of cues is now included in the "Behavioral Training" methods section. Rats possess dichromatic vision systems. Caption of Figure 1, 2 includes what Pse means, the performance of a subject for a given session. The scatter plots relate remapping to performance.

      9) Also on Figure 1 - in the examples shown, it looks like the animals always checked the two end arms in the same order. Was this position habit typical?

      We have added additional context in "Behavioral Training" methods section. Well trained rats do exhibit stereotyped behaviors (eg. going to one well then the other).

      10) "...we hypothesized that the cue remapping score would be related to a subject's performance in the task." I am struggling to see why this doesn't follow trivially from the observation that remapping occurred on error trials.

      We thank the reviewer for pointing out that this could use further clarity. We have added that the magnitude of remapping is what should relate to performance. To further clarify, remapping does not occur on error trials, remapping as operationally defined in this work, is the difference of spatial maps as a function of Cue identity or Reward contingency. Thus, as a difference metric, remapping occurs because there is a difference in activity between correct and incorrect trials. The magnitude of that difference need not relate to how the subject performed on the task.

      11) "With this approach, found that incorrect coding units were more likely to overlap between cue and RW coding units than correct." Missing "we". I didn't understand this sentence - what does "overlap" mean?

      We have added a sentence to further clarify this point.

      12) "We found that incorrect>correct activity levels on outbound trajectories predicted incorrect>correct activity levels on inbound trajectories" - I don't understand how this can be the case given that many of these units were head direction tuned and therefore shouldn't even have been active in both directions.

      As seen in Figure 7b, we were able to match 217 units across tasks. Of those, "Cluster 0" with 98 units showed strong head-direction coding. While "Cluster 0" units showed strong remapping effects, there were a lot of other units that could have contributed to the "incorrect>correct" across (out/in)-bound segments. Further, head-direction coding is defined in the Open-field environment, and there's no constraint on what these neurons could do on the Tree Maze task.

      13). " Error or mismatch signals conform a fundamental computation" - should be "perform"

      Wording slightly changed, but "conform" as in "act in accordance to" is what we intend here.

      14) " provides it with the required stiffness and chemical resistivity"- what does "chemical resistivity" mean? To what chemicals?

      This is mostly in reference to rat waste and cleaning products (alcohol). We changed the wording to durability for simplicity.

      15) Supp Fig 1 shows that behavioral performance was very distinctly different for one of the animals. Was its neural data any different? What happens to the overall effect if this animal is removed from the analysis?

      Unless otherwise stated, all analyses are performed through linear mixed effects with "subject" as a random effect. Thus, the effects of individual subjects are accounted for.

      16) Histology - it would be useful to have a line drawing from the atlas alongside the micrographs to enable easier anatomical understanding.

      There was variability in the medial lateral location of the tetrodes across animals and in the histological images provided and thus, we felt this would not be useful information as a single line drawing will not encompass/apply to all histology photos.

      17) Supp. Fig. 5/6 I didn't understand what Left, Stem, and Right mean at the top. Also, the color keys are too tiny to be noticed

      An additional sentence has been added to the caption to clarify that left, stem, right refer to what segment was selected via the ranking of scores.

      Reviewer #2 (Recommendations For The Authors):

      Was there a particular reason why cells in these regions were analyzed together? Can some of the results be tested for cells of a particular region, especially the MEC? One major limitation of these results is that it is unclear which regions it applies to, e.g., one cannot be certain that data shows here that MEC cells have these firing properties.

      Damage due to the extraction of the recording tetrode bundle was extensive and we were not able to parcelate out individual regions. We have added additional details on this in the "Histology" section of the methods.

      It is unclear how many cells in each region are included in each analysis. There is supplementary fig 3 but not sure how many of these met the criteria to be included in a certain analysis and it does not differentiate regions. Also, was any of the MUA included in the analyses?

      Isolated single units were included in all analyses, but we did not differentiate from what region each unit came from. Analyses that include MUA are separate from the main findings, and are included in supplemental figures as reference.

      Was the error trial defined as a trial when the animal did not make the right light-guided choice or did it also include cases in which the light-related arm choice was correct, but the animal first went to the unrewarded end arm? Nomenclature in the results is not explained well - what is an unrewarded trial or unrewarded trajectory or an error trial?

      We have added a new paragraph in the methods under Behavioral Training that address trial nomenclature. This methods section is now referenced twice in the initial paragraphs of the results section.

      Were any grid cells included in the data, especially could any cross-matched across the open field and the maze runs?

      This was indeed a question of interest to us, however, the number of grid-cells recorded was not adequate for meaningful statistical inference. We further sought to avoid tuning curve based functional classifications of units.

      In general, the results section is difficult to read, and its accessibility could be improved.

      We thank the reviewer for this accessibility point. We hope that the small tweaks as a product of this revision will improve the readability of the manuscript. We tried to have major takeaways for each result, but the nature of the analyses necessarily make the text somewhat dense.

      Minor:

      One of the Figure 3f references should be Figure 3g and later, Figure 44 should be corrected.

      We thank the reviewer for noting this, it has been fixed.

      Reviewer #3 (Recommendations For The Authors):

      There are a number of issues that I think could be addressed to improve the manuscript:

      1) The figure could make it clearer where the LED panel is. Are the authors confident the rats see the cue on each trial?

      We have added a new supplemental figure to address this question (Figure 1 - figure supplement 1). The new figures show the 3D geometry of the maze and the location of the Cue panel. The rats were able to see the cue, otherwise task performance would have remained at chance levels.

      2) The same maze has been used in a series of studies of hippocampal place cells by Paul Dudchenko's group. They also went on to examine how these representations are affected in a very similar cued spatial response task. These studies should be acknowledged.

      We thank the reviewer for pointing out this oversight. We have added the Ainge et al. citation ( https://doi.org/10.1523/JNEUROSCI.2011-07.2007) when first introducing the maze and in the methods.

      3) In a number of supplementary figures, the authors present neurons that are selective for different properties such as segment, cue, reward, and direction. However, the number of spatially and cue-selective cells and the criteria by which cells are designated as selective are not reported. The analyses of spatial remapping and response to cues are done at the population level so I'm not sure how these cells are classified or selected for the figures.

      The procedure for selection is included in the figure captions. Each unit is ranked based on the Uz score by segment as originally shown in Figures 2 and 4.

      4) Related to this, the example cells on the figures do not clearly represent the effects presented. For example, given the title of Figure 2, I assume that the cells in 2B significantly remap. However, they don't look like they remap - the cells in the top row show rate remapping in one segment of the maze while the cells in the bottom do not show clear rate remapping responses. I suspect that traditional rate map-based analyses using maps based on consistently sized pixels rather than large segments would show only very modest changes in correlations or rates across these different types of trials. It is important to report the findings in this way as the authors interpret their data relative to the rate-remapping studies which have used these analyses. Readers who do not have the time or expertise to examine the methods in detail will conclude that the effects reported here are the same as previous rate remapping studies which the examples suggest is not the case.

      Additional plots for individual units have been added to the supplement, Figure 2 - figure supplement 3. However, the effects, though small by unit, are consistent across neurons and subjects (Figure 2 - figure supplement 5).

      5) Why is there a bias on the stem in 2C? This is of similar size to the effect on the right size and so deserves discussion.

      The analysis in question is the across unit level bias in cue-coding by maze segment. The left segment shows elevated Right Cue coding, while the right segment shows elevated Left Cue coding. There was one reported statistical result, the main effect of segment in the Linear Mixed Effects model. We expand this result in the following two ways:

      1. Individual statistical results by segment

      a. Left Segment (Uz Coef. Estimate = 0.5, CI95%=[0.26, 0.75; p<1e-4])

      b. Stem Segment (Uz Coef. Estimate = 0.22, CI95%=[-0.01, 0.47]; p=0.06)

      c. Right Segment (Uz Coef. Estimate = -0.27, CI95%=[-0.51, -0.03], p=0.03)

      1. Reporting the joint hypothesis test of left > stem > right by unit.

      a. X2=90.45, p=2.28e-20

      b. The comparison of left>stem by unit:

      i. coefficient estimate = 0.28, CI95%=[0.11, 0.44], p=0.0008

      Although the reviewer is correct in pointing out the effect size similarity, the appropriate statistical comparisons within and across units support the stated conclusions. In terms of systematic coding bias, there is a small bias across units (60% of units) and animals (4 out 5) for the Right Cue. Although interesting, this effect is orthogonal to the comparisons of interests (within unit differences). In order to highlight this point we have added the statistics of the joint hypothesis test of left>stem>right to the main manuscript.

    1. Author Response

      The following is the authors’ response to the original reviews.

      Response to Reviewer 1 Comments (Public Review):

      Point 1: While the authors provided a large amount of data regarding the genes involved in the TOR pathway, it is highly descriptive and mostly confirmative data, as numerous papers have already shown that the TOR pathway plays essential roles in a myriad of biological processes in multiple fungi.

      Response 1: Thank you for your comment. The target of rapamycin (TOR) signal pathway plays critical roles in various eukaryotic organisms. However, its specific role in controlling the development and virulence of opportunistic pathogenic fungi like A. flavus has remained unclear. Additionally, the underlying mechanism of the TOR pathway remains elusive in the A. flavus. As such, our study provides a useful contribution, as it is the first to comprehensively investigate the majority of genes in the conserved TOR signaling pathway in A. flavus.

      Point 2: The authors seemed to perform a series of parallel studies in several genes involved in the TOR pathway in other fungi. However, their data are not properly interconnected to understand the TOR signaling pathway in this fungal pathogen. The authors frequently drew premature conclusions from basic phenotypic observations. For instance, based on their finding that sch9 mutant showed high calcium stress sensitivity, they concluded that Sch9 is the element of the calcineurin-CrzA pathway. Furthermore, based on their finding that the sch9 mutant show weak rapamycin sensitivity and increased Hog1 phosphorylation, they concluded that Sch9 is involved in TOR and HOG pathways. To make such conclusions, the authors should provide more detailed mechanistic data.

      Response 2: Yes, we agree with the reviewer's comment. We have carefully reviewed the manuscript and made necessary revisions to eliminate arbitrary conclusions. For example, we have removed the statement that "Sch9 is the element of the calcineurin-CrzA pathway". Furthermore, we have rephrased our conclusions to better reflect our findings. "these results reflected that Sch9 regulates osmotic stress response via the HOG pathway in A. flavus"(Lines 279-280, page 13). We appreciate the reviewer's input, which has contributed to the clarity and accuracy of our work.

      Point 3: In the section "Tor kinase plays important roles in A. flavus", some parts of their data are confusing. The authors said they identified a single Tor kinase ortholog, which is orthologous to S. cerevisiae Tor2. And then, they said failed to obtain a null mutant, but constructed a single copy deletion strain delta Tor1+/Tor2-. What does this mean? Does this mean A. flavus diploid strain? So is this heterozygous TOR/tor mutant? Otherwise, does the haploid A. flavus strain they used contain multiple copies of the TOR gene within its genome? What is the real name of A. flavus Tor kinase (Tor1 or Tor2?). "tor1+/tor2-" is the wrong genetic nomenclature. What is the identity of detalTor1+/Tor2-? Please provide detailed information on how all these mutants were generated. A similar issue was found in the analysis of TapA, which is speculated to be essential (what is the deltaTapA1+/TapA2-?). I couldn't find any detailed information even in Materials and Methods. The authors should provide southern blot data to validate all their mutants.

      Response 3: Thank you for your comments. We acknowledge the confusion in our presentation and will ensure that accurate genetic nomenclature is used consistently throughout the paper.

      In response to your queries, we have included a section in the Materials and Methods, titled "Detection of tor and tapA genes copy number in strains" (Lines 615-621, page 29), to provide details on how we determined the copy numbers of the tor and tapA genes in the strains. Our findings revealed that both the tor and tapA genes are present in double copies in our strains, which guided our decision to construct single-copy deletion strains using homologous recombination. We have verified these copy numbers using absolute quantification PCR (Table S1).

      The use of the abbreviation '+/-' for the single copy knockout strains, such as tor+/- and tapA+/-, is consistent with common fungal literature practice. We apologize for any confusion caused by this nomenclature.

      Although we did not employ southern blot data for validation, we conducted PCR and gene sequencing to confirm the mutants. We appreciate your comments to improve the clarity and accuracy of our manuscript.

      Point 4: How were the FRB domain deletion mutants constructed? If the FKBP12-rapamycin binding (FRB) domain is specifically deleted in the Tor kinase allele, should it be insensitive and resistant to rapamycin? However, the authors showed that the FRB domain deleted TOR allele was indeed non-functional.

      Response 4: We appreciate the reviewer's attention to the construction of the Fkbp12-rapamycin binding (FRB) domain deletion mutants and the discrepancy between the expected and observed results.

      For the knockout of the FRB domain, we used the homologous recombination method, but because tor genes are double-copy genes, there are also double copies in the FRB domain. Despite our efforts, we encountered challenges in precisely determining the location of the other copy of the tor gene.

      We speculate the common expectation that the deletion of the FRB domain should result in insensitivity and resistance to rapamycin, as it disrupts the binding site for Fkbp-rapamycin. However, we observed that the FRB domain-deleted mutant was more sensitive to rapamycin. This intriguing result suggests that there are additional factors or complexities involved in TOR signaling pathway regulation in A. flavus. We hypothesize that this result is related to the double copy of the tor gene. The reviewer's keen observation and comment have contributed to our efforts to better understand and explain this intriguing result.

      Point 5: In Figure 4C, the authors should monitor Hog1 phosphorylation patterns under stressed conditions, such as NaCl treatment, and provide quantitative measurements. Similar issues were found in the western blot analysis of Slt2 (Fig. 8D).

      Response 5: We agree with the reviewer that we should monitor Hog1 phosphorylation patterns under stressed conditions. In response to this valuable suggestion, we conducted additional experiments to examine Hog1 phosphorylation patterns under NaCl treatment for 30 minutes. The quantitative measurements of Hog1 phosphorylation levels under stress have been added to Figure 4E in the revised manuscript. Similarly, we have addressed the issue raised regarding Slt2 in Figure 8D.

      Point 6: For all the deletion mutants generated in this study, the authors should generate complemented strains to validate their data.

      Response 6: We appreciate the reviewer's suggestion to generate complemented strains for all the deletion mutants in our study to validate our data. However, due to the extensive number of genes involved in this research, it is hard to create complemented strains for each individual deletion mutant. As suggested by the reviewer, we have constructed complemented strains for several key deletion mutants, such as ΔsitA-C and Δppg1-C.

      Response to Reviewer 1 Comments (Recommendations For The Authors):

      Point 1: Overall, this manuscript was very poorly organized and not presented logically. It requires extensive English language editing.

      Response 1: We appreciate the reviewer's feedback regarding the organization and language quality of our manuscript. To address these concerns, we have restructured the manuscript to improve its logical flow and coherence. We thank the reviewer for their constructive criticism, which has been instrumental in the manuscript's refinement.

      Point 2: The authors did not present their figures in the order of description. For example, the authors suddenly described Figure 9A data in lines 128-130 in the middle of describing Figure 1. Furthermore, Figures 1D and 1F were described earlier than Figures 1B and 1C. In addition, Figure S2 was shown earlier than Figure S1. Please check this throughout the manuscript.
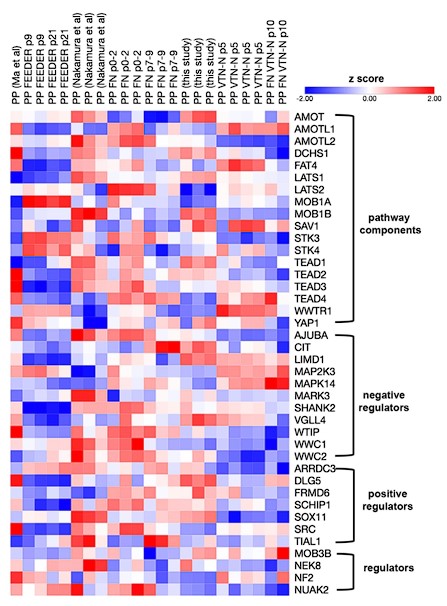
      Response 2: We thank the reviewer for their insightful observation. We acknowledge the importance of a logical and coherent figure sequence for reader comprehension. After careful review, we have rearranged the text and images throughout the entire document to enhance the reading experience. The revised manuscript now presents figures in a consistent and logical order, following the sequence of descriptions. We believe this improvement will enhance the overall readability and comprehension of our research.

      Point 3: The authors should follow the standard genetic nomenclature rules.

      Response 3: Thank you for your suggestion. We have revised our manuscript to ensure that we are following the standard genetic nomenclature rules throughout. This includes the correct naming of genes, proteins, and mutations, as well as the use of appropriate italicization and formatting. We follow the rules: gene symbols are typically composed of three lowercase italicized letters, while protein symbols are not italicized, with an initial capital letter followed by lowercase letters.

      Point 4: These are just a few examples. Besides the ones that I mentioned, I found numerous grammatically wrong or awkward sentences throughout the manuscript. So this manuscript requires extensive English proofreading.
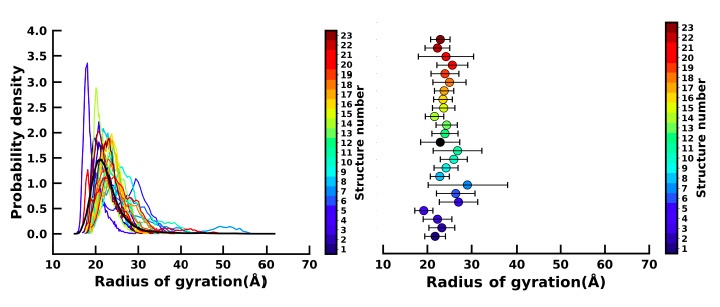
      Response 4: We apologize for the problem of our manuscript. We have asked an English native speaker to enhance the overall language quality and readability of the text. We believe that these improvements will significantly enhance the manuscript's overall quality and make it more accessible to a broader audience.

      Response to Reviewer 2 Comments (Public Review):

      Point 1: However, findings have not been deeply explored and conclusions mostly are based on parallel phenotypic observations. In addition, there are some concerns that exist surrounding the conclusions.

      Response 1: We are grateful for the suggestion. We conduct additional experiments and analyses to delve more deeply into our findings and ensure a more robust basis for our conclusions.

      Response to Reviewer 2 Comments (Recommendations For The Authors):

      Point 1: Verification for mutants: a single copy deletion strain ΔTor1+/Tor2(containing one copy of the Tor gene), however, in the table of strain list, it seems like null mutants. There are no further verifications for relative genes' expression and no complementary strains.

      A. Flavus ΔTor: Δku70; ΔniaD; ΔTor::pyrG

      A. Flavus ΔTapA Δku70; ΔniaD; ΔTapA::pyrG

      As described in pp208, "While we failed to obtained a null mutant, we constructed a single copy deletion strain ΔTor1+/Tor2- (containing one copy of the Tor gene) constructed by homologous recombination)"? But the authors think there was only one Tor kinase ortholog (AFLA_044350). It is hard to understand for this mutant What is the evidence to verify phenotypes of the ΔTor1+/Tor2- strain resulted from deletion of Tor2, no detail for how to make ΔTor1+/Tor2- strain.

      Response 1: Thank you for your important comments and suggestion. We apologize for the confusion caused by genetic nomenclature. We make the necessary corrections in the table of strain lists to accurately reflect the genotypes of the strains (Table S3).

      Multicopy variation of genes has not been explored in detail in fungi, especially in A. flavus, but is a commonly known phenomenon in mammalian genomes[1-2]. In yeast, the presence of two tor genes, tor1 and tor2, whereas in higher eukaryotes such as plants, animals, and filamentous fungi, there is only one tor gene[3-4]. The homology comparison results show that the genome of A. flavus contains only one tor gene. However, the tor gene in A. flavus exhibited varying copy numbers, as was confirmed by absolute quantification PCR at the genome level (Table S1).

      In this study, we constructed a single copy deletion strain, tor+/-, through homologous recombination. This strain contains one copy of the tor gene. We provide a more detailed and explicit description of the methods used to detect of the genes copy number in strains (Lines 615-621, page 29). We thank the reviewer for pointing out these important issues.

      Point 2: For a point mutant strain TORS1904L, they found that the sensitivity to rapamycin is consistent with the WT strain, it could not tell anything. It should be moved to Suppl.

      Response 2: Thanks for your important comments. We acknowledge that these results may not provide significant insights. In response to this suggestion, we delete the data related to the TORS1904L point mutant strain and its sensitivity to rapamycin to ensure that the main manuscript focuses on the most pertinent and informative findings. Corresponding modifications have been made in the revised manuscript.

      Point 3: For subtitle "Sch9 is correlate with the HOG and TOR pathways "What is the meaning for "correlate" similarly?

      Response 3: Thank you for this comment. We apologize for the unclear wording. To enhance clarity, we revise the subtitle to more explicitly convey this conclusion, for example, "The Sch9 kinase is involved in aflatoxin biosynthesis and the HOG pathway". (Lines 242, page 12).

      Point 4:for the ΔTapA 1+/TapA 2- strain (containing one copy of the TapA gene). It should have the complementary strain to verify the specific role of TapA. In FigS1B, ΔTOR and ΔTapA it could not tell TOR gene has been edited. Did you test mRNA of TOR gene?

      Response 4: Thanks for your important comments. Due to the large number of genes involved, we did not perform a complementation experiment. However, we used PCR and sequencing to verify the editing of our gene. Additionally, we conducted copy number and mRNA analyses to verify its function. The transcriptional level of the tor gene in the tor+/- mutant was downregulated compared to the level in the wild-type strain (Fig. S6).

      Response to Reviewer 3 Comments (Public Review):

      Point 1: As for many results, I miss the re-complementation of the created mutants throughout the manuscript. This is standard praxis.
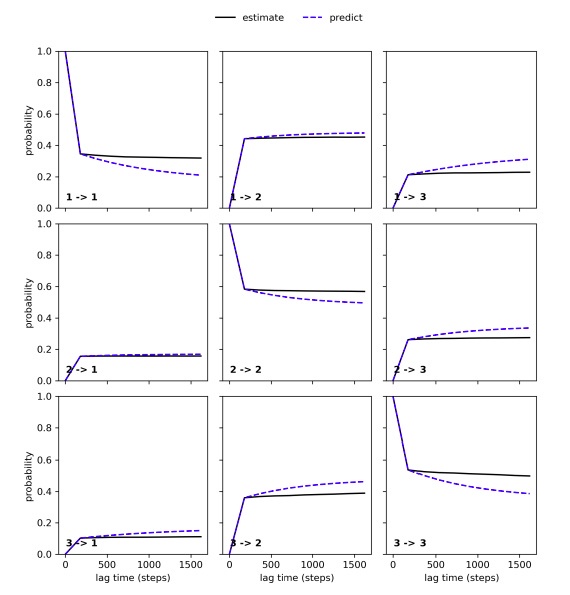
      Response 1: Thanks for your suggestions. We acknowledge that re-complementation is a standard practice for validating the effects of gene deletions. However, due to the large number of genes involved in our study, we have performed supplementary experiments on a selection of them, such as ΔsitA-C and Δppg1-C. We are grateful to the reviewer for your understanding of this practical consideration.

      Point 2: Fig. 1: cultures were grown for 48 h before measuring the transcript level. The authors show that brlA, abaA, and some sexual regulators are less expressed. In my opinion, this does not allow the conclusion that there is a direct control through rapamycin. Since the colonies grow very slowly in the presence of rapamycin, the authors should add rapamycin and follow gene expression after 15, 30, 60, 90 min. The figure legend needs to be more detailed. Which type of cultures were used, liquid, solid medium? Etc.

      Response 2: We deeply appreciate the reviewer’s suggestion. Since we found that there were no significant differences in gene expression changes following shorter treatment times, we extended the treatment duration. We conduct additional experiments to examine the gene expression levels at longer time intervals (3, 6, and 9 h) after the addition of rapamycin (Figure 1H-1J). These time points allow us to capture the dynamic changes in gene expression in response to rapamycin more effectively. Additionally, we enhance the figure legend to provide a more comprehensive description that specifies the type of cultures used in the experiments.

      Point 3: Why in chapter one Fig. 9 is already cited? Those data should then be included in Fig. 1 for the general phenotype.

      Response 3: Thank you for the suggestion. We have reordered the figures in the updated version of the manuscript to ensure that the data for consistent and clarity.

      Point 4: The authors wrote that radial growth and conidiation were gradually reduced with increasing rapamycin concentrations. This is not true. There is no gradient! However, it should be tested if there is a gradient if lower concentrations are used. The current data imply that there is a threshold concentration, so either there is 100 % growth or a reduction to 25 %. This looks strange.

      Response 4: Thank you for underlining this deficiency. We agree that a threshold concentration versus a gradient is an important distinction that needs to be clarified. Our results show that the addition of excessive quantities of rapamycin does not increase the inhibition of A. flavus growth. As the concentration of the FK506 drug increases, there is a gradual decrease in the growth and cell production of A. flavus. This phenomenon could potentially be attributed to varying mechanisms of action exhibited by the drugs. Therefore, we have revised these confused sentences. ( Lines 120-121, Page 5)

      Point 1: There are many wrong spellings:

      Fig. 1. Before washed, before washing; RelaTEtive gene expERSion should read relative gene expression. Sclerotial should be sclerotia. See also Fig. 5 F, H, Fig. 6 E. 6D colon diameter should be colony diameter.

      Fig. 4E. The expressED level... should read Expression level..... (also without article) Also in A, F, H.

      Fig. 6C. TLC detection of WT.... The authors mean AF detection in extracts of WT..... AF was extracted and analyzed by TLC.....

      Labelling of axes in one figure should be uniform.

      Response 1: Thank you for your reminder. We apologize for the oversights, and we carefully address and correct all the mentioned spelling issues to ensure the accuracy and clarity of the manuscript.

      Point 2: If the authors refer to the genes, I think they should be in small letters and italics, if it is the protein, the first letter should be capitalised tap1 (italics) and Tap1.

      Response 2: We appreciate this suggestion. We have carefully checked the entire manuscript and revised follow the standard genetic nomenclature rules. We follow the naming conventions for microbial genes and proteins, where gene symbols are typically composed of three lowercase italicized letters, and protein symbols are not italicized, with an initial capital letter followed by lowercase letters.

      Point 3: Very often articles are used where I would not use them.

      Response 3: Thanks for your careful checks. We are sorry for our carelessness. Based on your comments, we have made the corrections to make the articles harmonized within the whole manuscript. We value the reviewer's feedback, which will contribute to the overall quality of our writing.

      References:

      [1] Handsaker R, Van Doren, V, Berman, J. et al. Large multiallelic copy number variations in humans. Nat Genet 47, 296–303 (2015).

      [2] Wang Y, Wang S, Nie X. et al. Molecular and structural basis of nucleoside diphosphate kinase-mediated regulation of spore and sclerotia development in the fungus Aspergillus flavus. J Biol Chem. 2019 Aug 16;294(33):12415-12431.

      [3] Kim DH, Sarbassov DD, Ali SM, et al. mTOR interacts with raptor to form a nutrient-sensitive complex that signals to the cell growth machinery. Cell. 2002; 110(2): 163-75.

      [4] Fu L, Liu Y, Qin G, et al. The TOR-EIN2 axis mediates nuclear signalling to modulate plant growth. Nature. 2021; 591(7849): 288-292.

    1. Author Response

      The following is the authors’ response to the original reviews.

      Thank you for submitting your article "New genetic tools for mushroom body output neurons in Drosophila" for consideration by eLife. Your article has been reviewed by 2 peer reviewers, and the assessment has been overseen by a Reviewing Editor and Albert Cardona as the Senior Editor.

      eLife assessment:

      This work advances on two Aso et al 2014 eLife papers to describe further resources valuable for the field. This paper adds more MBON split-Gal4s convincingly describing their anatomy, connectivity and function.

      Public Reviews:

      Reviewer #1 (Public Review):

      In this manuscript Rubin and Aso provide important new tools for the study of learning and memory in Drosophila. In flies, olfactory learning and memory occurs at the Mushroom Body (MB) and is communicated to the rest of the brain through Mushroom Body Output Neurons (MBONs). Previously, typical MBONs were thoroughly studied. Here, atypical MBONs that have dendritic input both within the MB lobes and in adjacent brain regions are studied. The authors describe new cell-type-specific GAL4 drivers for the majority of atypical MBONs (and other MBONs) and using an optogenetic activation screen they examined their ability to drive behaviors and learning.

      The experiments in this manuscript were carefully performed and the results are clear. The tools provided in this manuscript are of great importance to the field.

      Reviewer #2 (Public Review):

      In this study, Aso and Rubin generated new split-GAL4 lines to label Drosophila mushroom body output neurons (MBONs) that previously lacked specific GAL4 drivers. The MBONs represent the output channels for the mushroom body (MB), a computational center in the fly brain. Prior research identified 21 types of typical MBONs whose dendrites exclusively innervate the MB and 14 types of atypical MBONs whose dendrites also innervate brain regions outside the MB. These MBONs transmit information from the MB to other brain areas and form recurrent connections to dopaminergic neurons whose axonal terminals innervate the MB. Investigating the functions of the MBONs is crucial to understanding how the MB processes information and regulates behavior. The authors previously established a collection of split-GAL4 lines for most of the typical MBONs and one atypical MBON. That split-GAL4 collection has been an invaluable tool for researchers studying the MB. This work extends their previous effort by generating additional driver lines labeling the MBON types not covered by the previous split-GAL4 collection. Using these new driver lines, the authors also activated the labeled MBONs using optogenetics and assessed their role in learning, locomotion, and valence coding. The expression patterns of the new split-GAL4 lines and the behavioral analysis presented in this manuscript are generally convincing. I believe that these new lines will be a valuable resource for the fly community.

      Recommendations for the authors:

      Minor additional suggestions:

      1. Please ensure that the FlyLight links are provided for the new splitGal4s in the methods as well as results.

      We added the requested link to the methods.

      1. Correct a typo in 'ethyl lactate in the learning assays section of methods

      corrected

      Reviewer #1 (Recommendations For The Authors):

      In the behavior assay, the authors use the same flies that were used for optogenetic olfactory conditioning and memory tests, to also examine the effects of activation in the absence of odors but with airflow. I think this may affect the interpretation of the results. If possible, it would be nice to show in the MBON types where a conditioning effect was found (i.e. MBON21, 29, 33) that performing the activation in the absence of odors but with airflow without previous conditioning yields the same results.

      We share the reviewers concern that behavioral phenotypes during the later 10s LED sessions may be compromised by early optogenetic olfactory conditioning. Therefore, prior to running the experiment shown in Figure 2, we confirmed that the activation phenotypes of three positive control lines (MB011B and SS40755) could be observed after olfactory conditioning sessions. We added this data as Figure 2-figure supplement 2. For SS75200 and SS77383, a split-GAL4 driver for MBON33, we observed a loss of activation phenotype in the second trial of LED ON/OFF binary choice assay (Figure 3H). Therefore, we reran the 10s LED activation experiments without a previous optogenetic olfactory conditioning assay; these data are now also included in Figure 2-figure supplement 2.

      Reviewer #2 (Recommendations For The Authors):

      Below, I list some comments and suggestions which I hope could help the authors further improve their manuscript.

      1. The authors identified 2 candidate lines for MBON28. It would be helpful if they could clarify how they determined whether a split-GAL4 correctly labels an MBON or is just a candidate line.

      We have added in the methods section an explanation of the criteria used.

      “The correspondence between the morphologies of EM skeletons and light microscopic images of GAL4 driver line expression patterns was used to assign GAL4 lines to particular cell types. This can be done with confidence when there are not multiple cell types with very similar morphology. However, in the case MBON28 we were not able to make a definitive assignment because of the similarity in the morphologies of MBON16, MBON17 and MBON28.”

      1. The authors have previously shown that the expression pattern of a GAL4 driver is strongly influenced by the reporter used. The expression patterns of the split-GAL4 lines in this study are based on 20XUAS-Chrimson-mVenus trafficked (attp18), the expression strength of which may differ from other reporters or effectors. I suggest that the authors discuss this potential caveat in their manuscript. This will allow readers to be more cautious and check the expression patterns with their own reporters/effectors when using these new split-GAL4 lines.

      We added the sentences below to address this concern.

      “The expression patterns shown in this paper were obtained using an antibody against GFP which visualizes expression from 20xUAS-CsChrimson-mVenus in attP18. Directly visualizing the optogenetic effector is important since expression intensity, the number of labeled MBONs and off-targeted expression can differ when other UAS-reporter/effectors are used (for an example, see Figure 2—figure supplement 1 of Aso et al., 2014a).”

      1. For the kinematic parameters in Fig. 2C, it is important to also show the baseline value of the parameters (i.e., the value before the light stimulation). For example, if a group of flies moves slower during the baseline period, their slower speed during the light-on period may not be due to MBON activation.

      Figure 2 has been revised to include the z-scores for the 2s period just before turning on LED. The source data includes the parameter values used to calculate z-scores.

      1. For Methods and Materials, the authors mostly refer to previous papers or websites for details. However, it would be helpful if they could include in this manuscript key information essential for repeating their experiments, such as the reporter/effector transgenes, empty-split controls, and antibodies and their working concentrations. It would also be helpful if they could provide the manufacturers and catalog numbers for the reagents used in this study.

      We have added Appendix 1- Key Resource Table to list all the key reagents.

      1. The original studies that identified the reward or punishment dopaminergic neurons mentioned in this manuscript should be cited.

      We have added the following citations:

      “Total number of synaptic connections from each MBON type to DANs and OANs. Based on the valence of memory when activation of DANs is used as unconditioned stimulus in olfactory conditioning (Aso et al., 2012, 2010; Aso and Rubin, 2016; Claridge-Chang et al., 2009; Huetteroth et al., 2015; Ichinose et al., 2015; Lin et al., 2014; Liu et al., 2012; Yamada et al., 2023; Yamagata et al., 2016, 2015)”

    1. Author Response

      The following is the authors’ response to the previous reviews.

      Public Reviews:

      Reviewer #1 (Public Review):

      The proposed study provides an innovative framework for the identification of muscle synergies taking into account their task relevance. State-of-the-art techniques for extracting muscle interactions use unsupervised machine-learning algorithms applied to the envelopes of the electromyographic signals without taking into account the information related to the task being performed. In this work, the authors suggest including the task parameters in extracting muscle synergies using a network information framework previously proposed. This allows the identification of muscle interactions that are relevant, irrelevant, or redundant to the parameters of the task executed.

      The proposed framework is a powerful tool to understand and identify muscle interactions for specific task parameters and it may be used to improve man-machine interfaces for the control of prostheses and robotic exoskeletons.

      With respect to the network information framework recently published, this work added an important part to estimate the relevance of specific muscle interactions to the parameters of the task executed. However, the authors should better explain what is the added value of this contribution with respect to the previous one, also in terms of computational methods.

      It is not clear how the well-known phenomenon of cross-talk during the recording of electromyographic muscle activity may affect the performance of the proposed technique and how it may bias the overall outcomes of the framework.

      We thank reviewer 1 for their useful commentary on this manuscript.

      Reviewer #2 (Public Review):

      This paper is an attempt to extend or augment muscle synergy and motor primitive ideas with task measures. The authors idea is to use information metrics (mutual information, co-information) in 'synergy' constraint creation that includes task information directly. By using task related information and muscle information sources and then sparsification, the methods construct task relevant network communities among muscles, together with task redundant communities, and task irrelevant communities. This process of creating network communities may then constrain and help to guide subsequent synergy identification using the authors published sNM3F algorithm to detect spatial and temporal synergies.

      The revised paper is much clearer and examples are helpful in various ways. However, figure 2 as presented does not convincingly show why task muscle mutual information helps in separating synergies, though it is helpful in defining the various network communities used in the toy example.

      The impact of the information theoretic constraints developed as network communities on subsequent synergy separation are posited to be benign and to improve over other methods (e.g., NNMF). However, not fully addressed are the possible impacts of the methods on compositionality links with physiological bases, and the possibility remains of the methods sometimes instead leading to modules that represent more descriptive ML frameworks that may not support physiological work easily. Accordingly, there is a caveat. This is recognized and acknowledged by the authors in their rebuttal of the prior review. It will remain for other work to explore this issue, likely through testing on detailed high degree of freedom artificial neuromechanical models and tasks. This possible issue with the strategy here likely needs to be fully acknowledged in the paper.

      The approach of the methods seeks to identify task relevant coordinative couplings. This is a meta problem for more classical synergy analyses. Classical analyses seek compositional elements stable across tasks. These elements may then be explored in causal experiments and generative simulations of coupling and control strategies. However, task-based understanding of synergy roles and functional uses is significant and is clearly likely to be aided by methods in this study.

      Information based separation has been used in muscle synergy analyses using infomax ICA, which is information based at core. Though linear mixing of sources is assumed in ICA, minimized mutual information among source (synergy) drives is the basis of the separation and detects low variance synergy contributions (e.g., see Yang, Logan, Giszter, 2019). In the work in this paper, instead, mutual information approaches are used to cluster muscles and task features into network communities preceding the SNM3F algorithm use for separation, rather than using minimized information in separation. This contrast of an accretive or agglomerative mutual information strategy here used to cluster into networks, versus a minimizing mutual information source separation used in infomax ICA epitomizes a key difference in approach here.

      Physiological causal testing of synergy ideas is neglected in the literature reviews in the paper. Although these are only in animal work (Hart and Giszter, 2010; Takei and Seki, 2017), the clear connection of muscle synergy analysis choices to physiology is important, and eventually these issues need to be better managed and understood in relation to the new methods proposed here, even if not in this paper.

      Analyses of synergies using the methods the paper has proposed will likely be very much dependent on the number and quality of task variables included and how these are managed, and the impacts of these on the ensuing sparsification and network communities used prior to SNM3F. The authors acknowledge this in their response. This caveat should likely be made very explicit in the paper.

      It would be useful in the future to explore the approach described with a range of simulated data to better understand the caveats, and optimizations for best practices in this approach.

      A key component of the reviewers’ arguments here is their reductionist view of muscle synergies vs the emergentist view presented in our work here. In the reductionist lens, muscle groupings are the units (‘building blocks’) of coordinated movement and thus the space of intermuscular interactions is of particular interest for understanding movement construction. On the other hand, the emergentist view suggests that muscle groupings emerge from interactions between constituent parts (as quantified here using information theory, synergistic information is the information found when both activities are observed together). This is in line with recent work in the field showing modular control at the intramuscular level, exemplifying a scale-free phenomena. Nonetheless, we consider these approaches to muscle synergy research as complementary and beneficial for the field overall going forward.

      Reviewer #3 (Public Review):

      In this study, the authors developed and tested a novel framework for extracting muscle synergies. The approach aims at removing some limitations and constraints typical of previous approaches used in the field. In particular, the authors propose a mathematical formulation that removes constraints of linearity and couples the synergies to their motor outcome, supporting the concept of functional synergies and distinguishing the task-related performance related to each synergy. While some concepts behind this work were already introduced in recent work in the field, the methodology provided here encapsulates all these features in an original formulation providing a step forward with respect to the currently available algorithms. The authors also successfully demonstrated the applicability of their method to previously available datasets of multi-joint movements.

      Preliminary results positively support the scientific soundness of the presented approach and its potential. The added values of the method should be documented more in future work to understand how the presented formulation relates to previous approaches and what novel insights can be achieved in practical scenarios and confirm/exploit the potential of the theoretical findings.

      In their revision, the authors have implemented major revisions and improved their paper. The work was already of good quality and now it has improved further. The authors were able to successfully:

      • improve the clarity of the writing (e.g.: better explaining the rationale and the aims of the paper);

      • extend the clarification of some of the key novel concepts introduced in their work, like the redundant synergies;

      • show a scenario in which their approach might be useful for increasing the understanding of motor control in patients with respect to traditional algorithms such as NMF. In particular, their example illustrates why considering the task space is a fundamental step forward when extracting muscle synergies, improving the practical and physiological interpretation of the results.

      We thank reviewer 3 for their constructive commentary on this manuscript.

      Recommendations for the authors:

      Reviewer #1 (Recommendations For The Authors):

      Figure 3 should report the distances between reaching points in panel A and the actual length distances of the walking paths in panel C.

      The caption of fig.3 concerning the experimental setup of the datasets analysed has been updated with the following for dataset 1: “(A) Dataset 1 consisted of participants executing table-top point-to-point reaching movements (40cm distance from starting point P0) across four targets in forward (P1-P4) and backwards (P5-P8) directions at both fast and slow speeds (40 repetitions per task) [25]. The muscles recorded included the finger extensors (FE), brachioradialis (BR), biceps brachii (BI), medial-triceps (TM), lateral-triceps (TL), anterior deltoid (AD), posterior deltoid (PD), pectoralis major (PE), latissimus dorsi (LD) of the right, reaching arm.”. For dataset 3, to the best of the authors knowledge, this information was not given in the original paper.

      Figure 4, what is the unit of the data shown?

      The unit of bits is now mentioned in the toy example figure caption and in the caption of fig.5

      Figure 4, the characteristics of the interactions are not fully clear, and the graphical representation should be improved.

      We have made steps to improve the clarity of the figures presented.

      For dataset 3, τ was the movement kinematics, but it is not specified how the task parameters were formulated. Did the authors use the data from all 32 kinematic markers, 4 IMUs, and force plates? If yes, it should be specified why all these signals were used. For sure, there will be signals included that are not relevant to the specific task. Did the authors select specific signals based on their relevance to the task (e.g., ankle kinematics)?

      We have now clarified this in the text as follows: “For datasets 1 and 2, we determine the MI between vectors with respect to several discrete task parameters representing specific task attributes (e.g. reaching direction, speed etc.), while for dataset 3 we determined the task-relevant and -irrelevant muscles couplings in an unassuming way by quantifying them with respect to all available kinematic, dynamic and inertial motion unit (IMU) features.”

      How did the authors endure that crosstalk did not affect their analysis, particularly between, e.g., finger extensors and brachioradialis and posterior deltoid and anterior deltoid (dataset 1)?

      We have addressed this point in the previous round of reviews and made an explicit statement regarding cross-talk in the discussion section: “Although distinguishing task-irrelevant muscle couplings may capture artifacts such as EMG crosstalk, our results convey several physiological objectives of muscles including gross motor functions [66], the maintenance of internal joint mechanics and reciprocal inhibition of contralateral limbs [19,51].”

      It would be informative to add some examples of not trivial/obvious task-related synergistic muscle combinations that have been extracted in the three datasets. Most of the examples reported in the manuscript are well-known biomechanically and quite intuitive, so they do not improve our understanding of synergistic muscle control in humans.

      Our framework improves our understanding of synergistic motor control by enabling the formal quantification of synergistic muscle interactions, a capability not present among current approaches. Regarding the implications of this advance in terms of concrete examples, we have further clarified our examples presented in the results section, for example:

      “Across datasets, many the muscle networks could be characterised by the transmission of complementary task information between functionally specialised muscle groups, many of which identified among the task-redundant representations (Fig.9-10 and Supp. Fig.2). The most obvious example of this is the S3 synergist muscle network of dataset 2 (Fig.11), which captures the complementary interaction between task-redundant submodules identified previously (S3 (Fig.9)).”

      The description shows how our framework can extract the cross-module interactions that align with the higher-level objectives of the system, here the synergistic connectivity between the upper and lower body modules. Current approaches can only capture redundant and task-irrelevant interactions. Thus our framework provides additional insight into movement control.

      The number of participations in dataset 2 is very limited and should be increased. We appreciate the reviewer's comment and would like to point out that for dataset 2 our aim was to increase the number of muscles (30), tasks (72) and trials for each task (30) which produced a very large dataset for each participant. This came at the expense of low number of participants, however all our statistical analyses here can be performed at the single-participant level. Furthermore, dataset 3 includes 25 participants and it enables us to demonstrate the reliability of the findings across participants.

      Reviewer #2 (Recommendations For The Authors):

      I believe it is important in the future to explore the approach proposed with a range of simulation data and neuromechanical models, to explore the issues I have raised and that you have acknowledged, though I agree it is likely out of scope for the paper here.

      We agree with the reviewer that this would be valuable future work and indeed plan to do this in our future research.

      The Github code for this paper should likely include the various data sets used in the paper and figures, appropriately anonymized, in order to allow the data to be explored and analyses replicated and package demonstrated to be exercised fully by a new user.

      We thank the reviewer for this suggestion. Dataset3 is already available online at https://doi.org/10.1016/j.jbiomech.2021.110320. We will also make the other 2 datasets publicly available on our lab website very soon. Until then, as stated in the manuscript, we will make them available to anyone upon reasonable request.

      Reviewer #3 (Recommendations For The Authors):

      I have the following open points to suggest to the authors:

      First, I recommend improving the quality of the figures: in the pdf version I downloaded, some writings are impossible to read.

      We fully agree with the reviewer and note that in the pdf version of the paper, the figures are a lot worse than in the submitted word document submitted. Nevertheless, we will make further improvements on the figures as requested.

      Even though the manuscript has improved, I still feel that some points were not addressed or were only partially addressed. In particular:

      • The proposed comparison with NMF helps understanding why incorporating the task space is useful (and I fully agree with the authors about this point as the main reason to propose their contribution). However, the comparison does not help the reader to understand whether the synergies incorporating the task space are biased by the introduction of the task variables.

      This question can be also reformulated as: are muscle synergies modified when task space variables are incorporated? Is the "weight" on task coefficients affecting the composition of muscle synergies? If so, the added interpretational power is achieved at the cost of losing the information regarding the neural substrate of synergies? I understand this point is not immediate to show, but it would increase the quality of the work.

      • Reference to previous approaches that aimed at including task variables into synergy extraction are still missing in the paper. Even though it is not required to provide quantitative comparisons with other available approaches, there are at most 2-3 available algorithms in the literature (kinematics-EMG; force-EMG), that should not be neglected in this work. What did previous approaches achieve? What was improved with this approach? What was not improved?

      Previous attempts of extracting synergies with non-linear approaches could also be described more.

      In the latest version of the manuscript, we have referenced both the mixed NMF and autoencoders based algorithms. In both the introduction and discussion section of the manuscript, we also specify that our framework quantifies and decomposes muscle interactions in a novel way that cannot be done by other current approaches. In the results section we use examples from 3 different datasets to make this point clear, providing intuition on the use cases of our framework.

    1. Author Response

      The following is the authors’ response to the original reviews.

      Response to comments of editor/s:

      • With regard to the comments on nonavailability of representative images/videos for Figures 1 A and B, in the revised manuscript we have added a representative video of GFP (-) and GFP (+) tracks in Supplemental video 1.

      Response to comments of reviewer 2:

      • With respect to the concern on figure 1, we have changed ‘% CD4+ T cell Migration’ to ‘% Proportion CD4+ T cell migration’ in Figures 1D & 1E in the revised manuscript. We also labelled the upper and lower panels of Figure 1I as ‘Untreated’ and ‘SDF1α’ respectively.

      Response to comments of reviewer 1:

      • With regard to the concern that ‘The transfection alone with siRNA may cause the lack of polarity’, we have added comparison of 2D migration MSD between control EGFP siRNA and Piezo1 siRNA-transfected CD4+ T cells as Supplementary Figure 1E.

      • We have added new references as ref 42 and 43, with respect to PIEZO1 association with focal adhesions.

      • With regard to the concerns around co-localization of Piezo1 and focal adhesions, we have added a representative image of Piezo1 and pFAK co-localization upon treatment of chemokine in revised Supplementary Fig. 3C. We have also used an additional focal adhesion marker, paxillin, to show that focal adhesion formation is not affected by Piezo1 KD (Revised Fig. 3E-3H). Upon comparing the mean pFAK and paxillin intensities, we observed no difference in Control and Piezo1 KD CD4+ T cells (Supplementary Figs. 3A, B).

      • All the minor concerns and suggestions have been taken care of in the revised manuscript.

    1. Author Response

      The following is the authors’ response to the original reviews.

      Reviewer #1 (Public Review):

      The manuscript is very-well written. Although the study is well-conducted the authors should be more convincing on how bacteria residing in tissues do not induce death. The association with IL-10 cytokine production appears weak and more experiments are needed to make it more robust

      Reviewer #2 (Public Review):

      Iske et al. provide experimental data that NAD+ lessens disease severity in bacterial sepsis without impacting on the host pathogen load. They show that in macrophages, NAD+ prevents Il1b secretion potentially mediated by Caspase11.

      While the in vivo and in vitro data is interesting and hints towards a crucial role of NAD+ to promote metabolic adaptation in sepsis, the manuscript has shortcomings and would profit from several changes and additional experiments that support the claims.

      Conceptually, the definition of sepsis is outdated. Sepsis is not SIRS, as in sepsis-2. Sepsis-3 defines sepsis as infection-associated organ dysfunction. This concept needs to be taken into account for the introduction and when describing the potential effects of NAD+ in sepsis. Also, LPS application cannot be considered a sepsis model, since it only recapitulates the consequence of TLR-4 activation. It is a model of endotoxemia. Also, the LPS data does not allow to draw conclusions about bacterial clearance (L135).

      The authors state that protective effects by NAD were independent of the host pathogen load. This clearly indicates that NAD confers protection via enhancing a disease tolerance mechanism, potentially via reducing immunopathology. This aspect is not considered by the authors. The authors should incorporate the concept of disease tolerance in their work, cite the relevant literature on the topic and discuss it their findings in light of the published evidence for metabolic alteration sand adaptations in sepsis.

      For the in vitro data, the manuscript would benefit from additional experiments using in vitro infection models.

      In the merge manuscript, the authors provide two different versions of the figures. In one, bar plots are shown without individual data and in the other with scatter blots. All bar plots need to be provided as scatter plots showing individual values.

      The authors should show further serology data for kidney and liver failure etc. as well as further cytokine data such as IL-6 and TNF to better characterize their models.

      Careful revision of the entire manuscript, the figure legends and figures is required. The figure legend should not repeat the methods and materials section. The nomenclature for mouse protein and genes needs to be thoroughly revised.

      L350. The authors write that they dissect the capacity of NAD+ to dampen auto- and alloimmunity. In this work, no data that supports this statement is shown and experiments with autoantigens or alloantigens are not performed.

      L163 The authors describe pyroptosis but in the figure legend call it apoptosis. Specific markers for each cell death should be measured and determined which cell death mechanisms is involved.

      Animal data comes from an infection model and LPS application. The RNAseq data is obtained from cells primed with Pam3CSK4 and subsequently subjected to LPS. It is unclear how the cell culture model reflects the animal model. As such the link between IFN signaling and the bacterial infection/LPS model are not convincing and need to be further elaborated.

      Figure 5: It is unclear how many independent survival experiments were done, how many mice per group were used and whether the difference between groups was statistical significant. This information should be added.

      Further experiments with primary cells from Il10 k.o. and Caspase11 k.o. animals should be provided that support the findings in macrophages.

      Author Response:

      Reviewer #1 (Public Review):

      “The manuscript is very-well written. Although the study is well-conducted the authors should be more convincing on how bacteria residing in tissues do not induce death. The association with IL-10 cytokine production appears weak and more experiments are needed to make it more robust.”

      Thank you very much for your thoughtful and constructive feedback on our manuscript. We appreciate your positive assessment of the writing quality and the acknowledgment of the wel-lconducted nature of the study.

      In regard to the reviewer's comment that "The association with IL-10 cytokine production appears weak," we would like to provide a comprehensive response based on the findings and insights presented in our study (Fig 5). We would like to emphasize several key points to further elucidate this association:

      The established knowledge underscores IL-10's capacity to hinder the activation and proliferation of macrophages, thereby safeguarding against an overly aggressive immune-inflammatory reaction (as referenced). In our earlier investigations, we demonstrated that NAD+ orchestrates a systemic generation of IL-10, which assumes a pivotal function in curtailing proinflammatory responses across various conditions, such as autoimmune diseases (as referenced), alloimmunity (as referenced), and bacterial infections (as referenced). In our latest research, we divulge that the introduction of NAD+ leads to an elevated occurrence of IL-10-producing CD4+ T cells, CD8+ T cells, and macrophages, although not dendritic cells (depicted in Figure 5B and C). Furthermore, our comprehensive analyses have substantiated that NAD+ administration thwarts pyroptosis by specifically targeting the non-canonical inflammasome pathway. Intriguingly, our in vitro outcomes suggest that the neutralization of the autocrine IL-10 signaling pathway through a neutralizing antibody and an IL-10 receptor antagonist partially reverses the NAD+-mediated blockage of pyroptosis. These in vitro results imply that NAD+ induces the production of IL-10 cytokines by macrophages, contributing to the suppression of pyroptosis. To corroborate our in vitro conclusions, we employed IL-10 knockout mice and wild-type mice, both treated with either NAD+ or a placebo solution. The wild-type mice treated with NAD+ displayed a survival rate exceeding 80%, whereas the IL-10 knockout mice exhibited a survival rate of "only" 40%. These in vivo findings align with our in vitro discoveries, underscoring the crucial role of NAD+mediated IL-10 cytokine production in impeding pyroptosis through NAD+ and shielding against septic shock. Drawing from our prior and current investigations, we respectfully disagree with the reviewer's characterization of our work as "weak."

      Recommendations for the authors

      ‘’I suggest that animals subject to E. coli infection need to be followed-up for longer and sacrificed at a later time points. It is too difficult to believe that mice are surviving with full resting bacteria in tissues. Do results suggest a full shut-down of the mechanism? What was the level of infiltration of the tissues by neutrophils?’’

      ‘’I have difficulty to agree with the survival results of the IL-10(-/-) mice of Figure 5E. Can the authors provide the p-values and follow-up for longer? Why the WT and the IL-10(-/-) mice survive the same?’’

      Thank you for your thoughtful and constructive comments on our manuscript. We appreciate your valuable insights, and we have carefully considered your suggestions.

      We thank the reviewers for this comment. We have indeed followed-up for a longer period of time mice subjected to E. Coli infection and LPS (54mg/kg). Mice infected and treated with NAD+ survived for several months and recovered fully after 10 days. Mice survived for at least a year following infection. We have now included a sentence regarding the long-term survival in the results section of Figure 1 entitled “NAD+ protects mice against septic shock not via bacterial clearance but via inflammasome blockade”. Figure illustrating the level of infiltration of the tissues by neutrophils was added in supplementary data as supplementary figure 4.

      In contrast, WT and IL-10-/- mice failed to withstand E. Coli or LPS (54mg/kg) administration when treated with a placebo solution. To our knowledge, our investigation represents the pioneering instance of successfully conferring protection against the lethal doses of E. Coli and LPS administered to animals. Considering the potent immunosuppressive nature of IL-10, our anticipation was that IL-10-/- mice would manifest an exacerbated inflammatory response subsequent to LPS administration, in contrast to WT mice. Our in vivo findings indeed corroborate this assumption, revealing that IL-10-/- mice succumbed more swiftly to LPS administration, displaying statistically significant disparities in survival rates compared to WT mice (p value of 0.0154). The pertinent p-value has been thoughtfully included in Figure 5E of our study.

      Reviewer #2 (Public Review):

      “Iske et al. provide experimental data that NAD+ lessens disease severity in bacterial sepsis without impacting on the host pathogen load. They show that in macrophages, NAD+ prevents Il1b secretion potentially mediated by Caspase11.

      While the in vivo and in vitro data is interesting and hints towards a crucial role of NAD+ to promote metabolic adaptation in sepsis, the manuscript has shortcomings and would profit from several changes and additional experiments that support the claims.

      Conceptually, the definition of sepsis is outdated. Sepsis is not SIRS, as in sepsis-2. Sepsis-3 defines sepsis as infection-associated organ dysfunction. This concept needs to be taken into account for the introduction and when describing the potential effects of NAD+ in sepsis. Also, LPS application cannot be considered a sepsis model, since it only recapitulates the consequence of TLR-4 activation. It is a model of endotoxemia. Also, the LPS data does not allow to draw conclusions about bacterial clearance (L135).

      The authors state that protective effects by NAD were independent of the host pathogen load. This clearly indicates that NAD confers protection via enhancing a disease tolerance mechanism, potentially via reducing immunopathology. This aspect is not considered by the authors. The authors should incorporate the concept of disease tolerance in their work, cite the relevant literature on the topic and discuss it their findings in light of the published evidence for metabolic alteration sand adaptations in sepsis.

      For the in vitro data, the manuscript would benefit from additional experiments using in vitro infection models.

      In the merge manuscript, the authors provide two different versions of the figures. In one, bar plots are shown without individual data and in the other with scatter blots. All bar plots need to be provided as scatter plots showing individual values.

      The authors should show further serology data for kidney and liver failure etc. as well as further cytokine data such as IL-6 and TNF to better characterize their models.

      Careful revision of the entire manuscript, the figure legends and figures is required. The figure legend should not repeat the methods and materials section. The nomenclature for mouse protein and genes needs to be thoroughly revised.

      L350. The authors write that they dissect the capacity of NAD+ to dampen auto- and alloimmunity. In this work, no data that supports this statement is shown and experiments with autoantigens or alloantigens are not performed.

      L163 The authors describe pyroptosis but in the figure legend call it apoptosis. Specific markers for each cell death should be measured and determined which cell death mechanisms is involved.

      Animal data comes from an infection model and LPS application. The RNAseq data is obtained from cells primed with Pam3CSK4 and subsequently subjected to LPS. It is unclear how the cell culture model reflects the animal model. As such the link between IFN signaling and the bacterial infection/LPS model are not convincing and need to be further elaborated.

      Figure 5: It is unclear how many independent survival experiments were done, how many mice per group were used and whether the difference between groups was statistical significant. This information should be added.

      Further experiments with primary cells from Il10 k.o. and Caspase11 k.o. animals should be provided that support the findings in macrophages.”

      Thank you for taking the time to review our manuscript. We appreciate your insightful comments and valuable feedback regarding our study on the role protective role and underlying mechanisms of NAD+ in septic shock.

      “While the in vivo and in vitro data is interesting and hints towards a crucial role of NAD+ to promote metabolic adaptation in sepsis, the manuscript has shortcomings and would profit from several changes and additional experiments that support the claims.”

      We would like to point out that our current study does not underscore a metabolic adaptation in sepsis but more an immune regulation and a specific blockade of the non-canonical inflammasome signaling machinery.

      “Conceptually, the definition of sepsis is outdated. Sepsis is not SIRS, as in sepsis-2. Sepsis-3 defines sepsis as infection-associated organ dysfunction. This concept needs to be taken into account for the introduction and when describing the potential effects of NAD+ in sepsis. Also, LPS application cannot be considered a sepsis model, since it only recapitulates the consequence of TLR-4 activation. It is a model of endotoxemia. Also, the LPS data does not allow to draw conclusions about bacterial clearance (L135).”

      Our study uses highly lethal doses of E. Coli or LPS. These doses have been shown to result in multiple organ failure (1, 2). For many decades until now an un-numerable number of studies have used LPS as a model of sepsis (3, 4, 5). We have used LPS animal model based on a study published in 2013 by Kayagaki et al. (1), where the authors reported a novel TLR4-independent mechanism but mediated via activate caspase-11. We used the same animal model to demonstrate the specific role of NAD+ in targeting this TLR4-independent mechanism but mediated via activate caspase-11 and underscore NAD+’s mode of protection.

      Moreover, we have not only used LPS but bacterial infection as well using E. Coli. We have also previously published an additional research article demonstrating the protective effect against Listeria Monocytogenes (6). The only model we currently did not use in our current study, is a cecal ligation puncture (CLP) model which is also another common animal model for sepsis.

      Our conclusions regarding bacterial clearance are based not only on LPS results but also based on the bacterial load measurement and survival (Figure 1B&C) following E. Coli administration in different tissues (kidney and liver) and not LPS.

      “The authors state that protective effects by NAD were independent of the host pathogen load. This clearly indicates that NAD confers protection via enhancing a disease tolerance mechanism, potentially via reducing immunopathology. This aspect is not considered by the authors. The authors should incorporate the concept of disease tolerance in their work, cite the relevant literature on the topic and discuss it their findings in light of the published evidence for metabolic alteration sand adaptations in sepsis.”

      We respectfully disagree with the reviewer’s comment and do not believe that NAD+ enhances disease tolerance. We have supporting data indicating that NAD+ mediates protection via a specific blockade of the non-canonical inflammasome pathway, which prevents an over-zealous immune response that results in organ damage and multiple organ failure (MOF). Moreover, we demonstrate that not only NAD+ mediates protection via a specific blockade of the non-canonical inflammasome pathway but prevents septic shock induced death by an additional immunosuppression mediated by the systemic production of IL-10.

      Both Caspase-11 and IL-10 pathways are crucial in NAD+ mediated protection against lethal doses of E. Coli and LPS administration. Figure 5A indicates that caspase-11-/- mice treated with PBS have a modest survival rate (~40% survival) when compared to the group of mice treated with NAD+ (>80% survival). These data indicate that NAD+ promotes survival via a caspase-11independent mechanism. Similarly, wild type mice subjected to NAD+ administration exhibited >80% survival, while NAD+ administration to IL-10-/- mice resulted only in a 40% survival rate. Based on these findings, we believe that NAD+ mediated protection against septic shock via a blockade of caspase-11 blockade and by IL-10 cytokine production that dampened the overzealous immune response rather than a disease tolerance.

      “For the in vitro data, the manuscript would benefit from additional experiments using in vitro infection models.”

      In the current study we have used two in vivo models using LPS and E. Coli a gram-negative bacterium. We have also previously reported the protective role of NAD+ in the context of Listeria Monocytogenes (6) a gram-positive bacterium. In the current study, our aim was to demonstrate the inhibitory role of NAD+ on the non-canonical pathway specifically. We believe that additional in vitro experiments for this study are out of scope.

      “In the merge manuscript, the authors provide two different versions of the figures. In one, bar plots are shown without individual data and in the other with scatter blots. All bar plots need to be provided as scatter plots showing individual values.”

      As requested by reviewer #2 all bar plots are now provided as scatter plots showing individual values.

      “The authors should show further serology data for kidney and liver failure etc. as well as further cytokine data such as IL-6 and TNF to better characterize their models.”

      We did not perform further serology analysis, but we did measure IL-6 and TNFα in mice treated with NAD+ or PBS. Mice treated with NAD+ had a reduced systemic level of both cytokines IL-6 and TNFα. We have now added the figures (Figure 1F). In addition, we performed a long-term survival, and all mice treated with NAD+ recovered fully after 10 days and survived over a year after infection. In addition, the mice that survived following NAD+ treatment died of old age.

      “Careful revision of the entire manuscript, the figure legends and figures is required. The figure legend should not repeat the methods and materials section. The nomenclature for mouse protein and genes needs to be thoroughly revised.”

      A Careful revision of the entire manuscript has been performed.

      “L350. The authors write that they dissect the capacity of NAD+ to dampen auto- and alloimmunity. In this work, no data that supports this statement is shown and experiments with autoantigens or alloantigens are not performed.”

      We thank the reviewer for this comment. We have now re-phrased our last sentence in the discussion and included references for our previous work. We have now stated:” We have previously reported that NAD+ administration can block auto- (7) and allo-immunity (8) via IL10 cytokine production. Here, we unveiled the capacity of NAD+ to protect against sepsisinduced death via a specific blockade of the non-canonical inflammasome pathway and a robust immunosuppression mediated by IL-10 cytokine production.

      L163 The authors describe pyroptosis but in the figure legend call it apoptosis. Specific markers for each cell death should be measured and determined which cell death mechanisms is involved.

      We thank the reviewer for this comment. We have focuses on pyoptosis-mediated cell death and not apoptosis. We have now replaced the term “apoptosis” by “pyroptosis-mediated to cell death”.

      “Animal data comes from an infection model and LPS application. The RNAseq data is obtained from cells primed with Pam3CSK4 and subsequently subjected to LPS. It is unclear how the cell culture model reflects the animal model. As such the link between IFN signaling and the bacterial infection/LPS model are not convincing and need to be further elaborated.”

      Our findings, depicted in Figure 3, pertain exclusively to in vitro investigations rather than in vivo examinations. Our research has demonstrated the selective inhibition of the non-canonical inflammasome pathway by NAD+, with a primary focus on unraveling the specific signaling pathway influenced by NAD+. Our in vitro outcomes indicate that the introduction of recombinant IFN-β counteracted the inhibitory effect of NAD+ on the non-canonical pathway. However, it's important to note that we have not evaluated the IFN-β pathway within our E. Coli and LPS in vivo models. Our primary intention was to exclusively decipher the roles of IFN-β and NAD+ in the context of inhibiting the non-canonical inflammasome, without extending our investigation to the broader in vivo scenarios.

      “Figure 5: It is unclear how many independent survival experiments were done, how many mice per group were used and whether the difference between groups was statistical significant. This information should be added.”

      We have now included the number of experiments, p values and number of animals used in Figure 5.

      “Further experiments with primary cells from Il10 k.o. and Caspase11 k.o. animals should be provided that support the findings in macrophages.”

      We concur with the reviewer's suggestion regarding the need for further experiments involving primary cells from IL-10-/- and Caspase-11-/- mice. However, we are uncertain about the potential contribution of these experiments in generating novel or supplementary findings to the existing study.

      Recommendations For The Authors:

      Besides the comments made in the public section, there are further issues that need to be considered by the authors.

      “It is unclear what signifies „impressive, L106" or „dramatic, L257"”

      “impressive” meant that we were surprised by the results since to the best of our knowledge prior this study there exists no report/study claiming such survival (>80%) following such high dose of E. Coli. In this aspect protective effects of NAD+ are unique. “dramatic” We (8) and others (9, 10) have previously used this term to describe a robust increase of cytokine production.

      “L116. The authors describe „symptoms". It should be clarified what symptoms they observed and the data should be shown. If only temperature is available, then this should be said. It would be interesting to see effects of NAD+ on the glucose levels of the animals during sepsis.”

      We thank the reviewer’s comment. We have measured only temperature. We believe that glucose level is beyond the scope of this study.

      “L29. Sepsis is not restricted to bacterial and viral pathogens. Also fungi and protozoa can cause sepsis.”

      We have now included fungi and protozoa.

      “Suppl.Fig.1. A scale should be added.”

      Scale has been added

      “L822. Lethal dose of LPS would mean that this was lethal for all mice. However, the data suggests that NAD+ treated animals would not have died. This should be clarified.”

      Here we meant lethal dose in absence of NAD+ treatment. Our study focuses on the protective role of NAD+ in a lethal context (bacterial and LPS).

      “L823/824. The part of the sentence: ... IHC was performed staining for H&E.. is incomplete.”

      We thank the reviewer’s comment. We have re-phrased our sentence.

      “L804. IL-10 is not a pathway. This should be revised.”

      We have replaced “pathway” by” mechanism”.

      “The graphical abstract should be the last figure summarizing all findings.”

      Figure 4 isn't the final illustration, as it doesn't encompass an overarching graphical summary of our discoveries. Instead, it exclusively highlights the findings related to NAD+'s impact on noncanonical inflammasome inhibition. Notably, this figure omits NAD+-mediated IL-10 cytokine generation and its crucial role in mitigating septic shock.

      “The authors report that they used a dosage of 54mg/kg LPS (l.502). This is a rather unusual concentration. How was this determined?”

      This was initially based on the first study reporting the role of casapase-11 in septic shock induced death published in 2013 by Kayagaki et al. (1). Many other have used this dosage for septic shock induced death animal model (11, 12, 13).

      References:

      1. Kayagaki N, et al. Noncanonical inflammasome activation by intracellular LPS independ ent of TLR4. Science 341, 1246‐1249 (2013).

      2. Qin, X., Jiang, X., Jiang, X. et al. Micheliolide inhibits LPS-induced inflammatory response and protects mice from LPS challenge. Sci Rep 6, 23240 (2016).

      3. Li Z, Qu W, Zhang D, Sun Y, Shang D. The antimicrobial peptide chensinin-1b alleviates the inflammatory response by targeting the TLR4/NF-κB signaling pathway and inhibits Pseudomonas aeruginosa infection and LPS-mediated sepsis. Biomed Pharmacother. 2023 Aug 1; 165:115227.

      4. Ramani V, Madhusoodhanan R, Kosanke S, Awasthi S. A TLR4-interacting SPA4 peptide inhibits LPS-induced lung inflammation. Innate Immun. 2013 Dec;19(6):596610.

      5. Zhang Y, Lu Y, Ma L, Cao X, Xiao J, Chen J, Jiao S, Gao Y, Liu C, Duan Z, Li D, He Y, Wei B, Wang H. Activation of vascular endothelial growth factor receptor-3 in macrophages restrains TLR4-NF-κB signaling and protects against endotoxin shock. Immunity. 2014 Apr 17;40(4):501-14.

      6. Rodriguez Cetina Biefer H, Heinbokel T, Uehara H, Camacho V, Minami K, Nian Y, Koduru S, El Fatimy R, Ghiran I, Trachtenberg AJ, de la Fuente MA, Azuma H, Akbari O, Tullius SG, Vasudevan A, Elkhal A. Mast cells regulate CD4+ T-cell differentiation in the absence of antigen presentation. J Allergy Clin Immunol. 2018 Dec;142(6):18941908.e7.

      7. Tullius SG, Biefer HR, Li S, Trachtenberg AJ, Edtinger K, Quante M, Krenzien F, Uehara H, Yang X, Kissick HT, Kuo WP, Ghiran I, de la Fuente MA, Arredouani MS, Camacho V, Tigges JC, Toxavidis V, El Fatimy R, Smith BD, Vasudevan A, ElKhal A. NAD+ protects against EAE by regulating CD4+ T-cell differentiation. Nat Commun. 2014 Oct 7;5:5101.

      8. Elkhal A, et al. NAD(+) regulates Treg cell fate and promotes allograft survival via a systemic IL‐10 production that is CD4(+) CD25(+) Foxp3(+) T cells independent. Sci Rep 6, 22325 (2016).

      9. Natalia Garcia-Becerra, Marco Ulises Aguila-Estrada, Luis Arturo Palafox-Mariscal, Georgina Hernandez-Flores, Adriana Aguilar-Lemarroy, Luis Felipe Jave-Suarez, FOXP3 Isoforms Expression in Cervical Cancer: Evidence about the Cancer-Related Properties of FOXP3Δ2Δ7 in Keratinocytes, Cancers, 15, 2, (347), (2023).

      10. Estelle Bettelli, Maryam Dastrange, Mohamed Oukka. Foxp3 interacts with nuclear factor of activated T cells and NF-κB to repress cytokine gene expression and effector functions of T helper cells. Proceedings of the National Academy of Sciences. 2005.102; 14; 5138-5143.

      11. Han Gyung Kim, Chaeyoung Lee, Ji Hye Yoon, Ji Hye Kim, Jae Youl Cho,BN82002 alleviated tissue damage of septic mice by reducing inflammatory response through inhibiting AKT2/NF-κB signaling pathway,Biomedicine & Pharmacotherapy,Volume 148,2022,112740.

      12. Tao Q, Zhang Z-D, Qin Z, Liu X-W, Li S-H, Bai L-X, Ge W-B, Li J-Y and Yang Y-J (2022) Aspirin eugenol ester alleviates lipopolysaccharide-induced acute lung injury in rats while stabilizing serum metabolites levels. Front. Immunol. 13:939106.

      13. Chen, N, Ou, Z, Zhang, W, Zhu, X, Li, P, Gong, J. Cathepsin B regulate non-canonical NLRP3 inflammasome pathway by modulating activation of caspase-11 in Kupffer cells. Cell Prolif. 2018; 51:e12487.

    1. Author Response:

      Reviewer #1:

      1. This is a complex paper and would benefit from a schematic depicting the key findings.

      This comment is appreciated. Unfortunately, due to time restraints, the authors were not able to graphically depict our findings.

      1. The paper would benefit from additional supporting evidence. Would it be possible to measure fatty acid oxidation by metabolic tracing here, in IRG-deficient cells or in response to 4-OI? Although changes in protein level for Cpt1A are seen, this is correlated with fatty acid oxidation rather than direct demonstration. This may be challenging but would strengthen the manuscript.

      This is a great comment. While we did not directly measure fatty acid flux in our manuscript, Weiss et al. Nature Metabolism 2023 did these studies in primary hepatocytes. They showed an increased palmitate incorporation into citrate.

      1. The aspect concerning body temperature regulation is confusing. Would Itaconate not promote fatty acid oxidation to increase or maintain body temperature? Itaconate must therefore not be involved in the hypothermic response? Bringing UCP1 into the finding is confusing and needs to be better explained. Again a diagram would help, but enhanced BAT fatty acid oxidation and UCP1 expression appear linked here, with both being affected by Itaconate. This needs clarifying.

      We appreciate this comment. The rationale is that if itaconate is stabilizing fatty acid oxidation, it would be necessary to fuel thermogenesis, a process dependent on fatty acid utilization. Our data support a role for itaconate in stabilizing body temperature following inflammation, potentially through enhanced fatty acid oxidation. This is evidenced by the hypothermic response to LPS in Acod1 KO mice. Furthermore, Mills et al. Nature 2018 show 4-OI injection boosts body temperature following LPS stimulation.

      Reviewer #2:

      Some conclusions involving the Irg1 knockout mice require important controls and clarifications to be fully convincing and some controls are missing.

      We appreciate the needs for appropriate controls. Negative controls were omitted when baseline phenotypes were not observed. Due to time and resource limitations we were unable to repeat the experiments.

  2. Dec 2023
    1. Author Response

      The following is the authors’ response to the original reviews.

      Public Reviews:

      Reviewer #1 (Public Review):

      Summary:

      The authors explored correlations between taste features of botanical drugs used in ancient times and therapeutic uses, finding some potentially interesting associations between intensity and complexity of flavors and therapeutic potential, plus some more specific associations described in the discussion sections. I believe the results could be of potential benefit to the drug discovery community, especially for those scientists working in the field of natural products.

      Strengths:

      Owing to its eclectic and somehow heterodox nature, I believe the article might be of interest to a general audience. In fact, I have enjoyed reading it and my curiosity was raised by the extensive discussion.

      The idea of revisiting a classical vademecum with new scientific perspectives is quite stimulating.

      The authors have undertaken a significant amount of work, collecting 700 botanical drugs and exploring their taste and association with known uses via eleven trained panelists.

      Weaknesses:

      I have some methodological concerns. Was subjective bias within the panel of participants explored or minimized in any manner?

      Yes, in all models we included ‘panellist’ as a random effect and therefore any biased perception by a single panellist across drugs or differences among panellists for an individual drug was accounted for. We now make this clearer in our methods.

      Were the panelists exposed to the drugs blindly and on several occasions to assess the robustness of their perceptions?

      The study was double blind, but blinding was not possible with the more well-known drugs (e.g., almonds, walnuts, thyme, mint). A random number generator was used to assign the drugs to the panellists, and according to the random distribution, some drugs were presented to the same panellist more than once. Robustness of panellists’ perception was not assessed specifically. We have added some text to the methods to clarify.

      Judging from the total number of taste assessments recorded and from Supplementary Material, it seems that not every panelist tasted every drug. Why?

      Because there were many drugs and panellists had time constraints. Overall, 3973 individual sensory trials were conducted, with an average of 361±153 trials per panellist and 5.7±1.3 trials per botanical drug.

      It may be a good idea to explore the similarity in the assessments of the same botanical drug by different volunteers. If a given descriptor was reported by a single volunteer, was it used anyway for the statistical analysis or filtered out?

      All responses were used as reported by the panellists, including potential ‘outliers’. As described above, the inclusion of ‘panellist’ as a random effect means that if one individual gave an unusual description of a particular drug in comparison to other individuals, this would be less impactful on any parameter estimates.

      The idea of "versatility" is repeatedly used in the manuscript, but the authors do not clearly define what they call "versatile".

      In line with suggestions made by reviewers, we have slightly adjusted the definition of therapeutic versatility and have now clearly defined the term on first use. Here, we define therapeutic versatility as the number of therapeutic ‘categories’ a drug is used for (the 25 broad categories are represented by shared iconography in Figure 1). Our revised results include analyses using this definition – which are qualitatively identical to our previous results which defined versatility using the 46 individual therapeutic uses.

      The introduction should be expanded. There are plenty of studies and articles out there exploring the evolution of bitter taste receptors, and associating it with a hypothetical evolutionary advantage since bitter plants are more likely to be poisonous.

      We agree. Bitter is arguably the most frequent chemosensory attribute of plants and botanical drugs perceived by humans. Our data shows that ‘poisons’ are not associated with bitterness but positively with ‘aromatic’, ‘sweet’ and ‘soapy’ – and negatively with ‘salty’ qualities.

      We have added this paragraph to the introduction:

      "The perception of taste and flavour (a combination of taste, smell and chemesthesis) here also referred to as chemosensation, has evolved to meet nutritional requirements and are particularly important in omnivores for seeking out nutrients and avoiding toxins (Rozin and Todd, 2016; Breslin, 2013; Glendinning, 2022). The rejection of bitter stimuli has generally been associated with the avoidance of toxins (Glendinning, 1994; Lindemann, 2001; Breslin, 2013) but to date no clear relationship between bitter compounds and toxicity at a nutritionally relevant dose could be established (Glendinning, 1994; Nissim et al., 2017). While bitter tasting metabolites occurring in fruits and vegetables have been linked with a lower risk for contracting cancer and cardiovascular diseases (Drewnoswski and Gomez-Carneros, 2000) the avoidance of pharmacologically active compounds is probably the reason why many medicines, including botanical drugs, taste bitter (Johns, 1990; Mennella et al., 2013)."

      And expanded in the discussion:

      "Though many bitter compounds are toxic, not all bitter plant metabolites are (Glendinning, 1994; Drewnoswski and Gomez-Carneros, 2000; e.g., iridoids, flavonoids, glucosinolates, bitter sugars). In part, this may be the outcome of an arms race between plant defence and herbivorous mammals’ bitter taste receptor sensitivities, resulting in the synthesis of metabolites capable of repelling herbivores and confounding the perception of potential nutrients by mimicking tastes of toxins. Here, poisons showed no association with bitter but positive associations with aromatic (px = 0.041), sweet (px = 0.022) and soapy (px = 0.025) as well as a negative association with salty (px = 0.046) qualities."

      Since plant secondary metabolites are one of the most important sources of therapeutic drugs and one of their main functions is to protect plants from environmental dangers (e.g., animals), this evolutionary interplay should be at least briefly discussed in the introductory section.

      This is now referred to in the introduction as well as in the discussion.

      Since the authors visit some classical authors, Parecelsus' famous quote "All things are poison and nothing is without poison. Solely the dose determines that a thing is not a poison" may be relevant here. Also note that some authors have explored the relationship between taste receptors and pharmacological targets (e.g., Bioorg Med Chem Lett. 2012 Jun 15;22(12):4072-4).

      We agree that pharmacologic action is determined by the dose. We now refer to the dose in the introduction: “…to date no clear relationship between bitter compounds and toxicity at a nutritionally relevant dose could be established (Glendinning, 1994; Nissim et al., 2017)”.

      We are aware of the fact that several authors have explored the relationship between taste receptors as targets and their similarity with other targets. We use many examples from the literature to explain our data. Our analysis did, however, not highlight any association between sweet tastes and epilepsy (as reported in Bioorg Med Chem Lett. 2012 Jun 15;22(12):4072-4)). We are not able to explain all associations, and we acknowledge that there may be more associations between chemosensory receptors and therapeutic effects than those found and discussed here.

      Reviewer #2 (Public Review):

      Summary:

      This is an unusual, but interesting approach to link the "taste" of plants and plant extracts to their therapeutic use in ancient Graeco-Roman culture. The authors used a panel of 11 trained tasters to test ~700 different medicinal plants and describe them in terms of 22 "taste" descriptors. They correlated these descriptors with the plant's medical use as reported in the De Materia Medica (DMM 1st Century, CE). Correcting for some of the plants' evolutionary phylogenetic relationships, the authors found that taste descriptors along with intensity measures were correlated with the "versatility" and/or specific therapeutic use of the medicine. For example, simple but intense tastes were correlated with the versatility of a medicine. Specific intense tastes were linked to versatility while others were not; intense bitter, starchy, musky, sweet, cooling, and soapy were associated with versatility, but sour and woody were negatively associated. Also, some specific tastes could be associated with specific uses - both positive and negative associations. Some of these findings make sense immediately, but others are somewhat surprising, and the authors propose some links between taste and medicinal use (both historical and modern use) in the discussion. The authors state that this study allows for a re-evaluation of pre-scientific knowledge, pointing toward a central role of taste in medicine.

      Strengths:

      The real strength of this study is the novelty of this approach - using modern-day tasters to evaluate ancient medicinal plants to understand the potential relationships between taste and therapeutic use, lending some support to the idea that the "taste" of a medicine is linked to its effectiveness as a treatment.

      Weaknesses:

      While I find this study very interesting and potentially insightful into the development and classification of certain botanical drugs for specific medicinal use, I would encourage the authors to revise the manuscript and the accompanying figures significantly to improve the reader's understanding of the methods, analyses, and findings. A more thorough discussion of the limitations of this particular study and this general type of approach would also be very important to include.

      Figures were revised, one deleted (former Fig. 3), and another one put to the supplementary (former Fig. 4, now Figure supplement 1). We now acknowledge limitations in the final paragraph.

      The metric of versatility seems somewhat arbitrary. It is not well explained why versatility is important and/or its relationship with taste complexity or intensity.

      We have modified the definition of versatility in line with reviewers’ comments. We have provided a detailed explanation of this in our response to reviewer #1 but for ease of reference, we paste this again here:

      Here, we define therapeutic versatility as the number of therapeutic ‘categories’ a drug is used for (the 25 broad categories are represented by shared iconography in Figure 1). Our revised results include analyses using this definition – which are qualitatively identical to our previous results which defined versatility using the 46 individual therapeutic uses.

      The importance of versatility was not the focus but the impact of taste intensity and complexity on versatility. We hypothesize that associations between perceived complexity and intensity of chemosensory qualities with versatility of botanical drug use provides insights into the development of empirical pharmacological knowledge and therapeutic behaviour (now included in the introduction).

      Similarly, the rationale for examining the relationships between individual therapeutic uses and taste intensity/complexity is not well explained, and given that a similar high intensity/low complexity relationship is common for most of the therapeutic uses, it restates the same concepts that were covered by the initial versatility comparison.

      The examination of the relationships between individual therapeutic uses and taste intensity/complexity fine-tunes the overall analysis and shows that this concept is applicable in general. However, in general, the reviewer is correct, and this is not our main focus. We therefore shifted the analysis including the figure to the supplementary material and state in the discussion: “We also detected nuances in significance, and complete absence of significance across the relationships between individual therapeutic uses and complexity/intensity magnitudes for which we lack, however, more specific explanations (Figure supplement 1).

      There are multiple issues with the figures - the use of icons is in many cases counterproductive and other representations are not clear or cause confusion (especially Figure 3).

      We have excluded former Fig. 3. Otherwise, the use of iconography is to facilitate graphical representation and cross-referencing between figures without over-cluttering. We provide all text and numeric values in the supporting information if individual detail is required.

      The phylogenetic information about the botanicals is missing. Also missing is any reference/discussion about how that analysis was able to disambiguate the confounding effects of shared uses and tastes of drugs from closely related species.

      This is explained in the methods (sections: ‘Phylogenetic tree’ and ‘statistical procedure’). We highlight that all models showed high heritability which means that shared ancestry has a statistical influence on the model. The trees themselves are now represented in our modified Figure 2.

      Reviewer #1 (Recommendations For The Authors):

      Besides the points already covered in my public review, I believe it would be interesting to assess and discuss the differences between the category "food" (how many drugs were allocated there?) and the drugs used for therapeutic purposes. In this manner, the food category could serve as a retrospective negative control to test the authors' hypotheses. Does the food category include drugs of weak flavor? Does it include drugs of complex flavor?

      All drugs in this database are associated with therapeutic uses. Only 96 are specifically mentioned to be also used as food while in total at least 152 are also used as food (many of the most obvious food drugs are not labelled as such in DMM). It is difficult to use the food category as a negative control (for testing whether food drugs have weaker tastes), because spices are included in the food category. If at all, only staples should be used for such an analysis. But this would be another study.

      In the context of the present analyses, we do agree that there is interest and so we have therefore added a small section to our manuscript: The 96 botanical drugs specifically mentioned also for food (though there are more than 150 edible drugs in our dataset; Supplementary file 1) show positive associations with starchy (px = 0.005), nutty (px = 0.002) and salty (px = 0.001) and negative associations with bitter (px = 0.007), woody (px = 0.001) and stinging (px = 0.033) tastes and flavours.

      Please replace "plant defence" with "plant defense".

      Currently the whole MS is formatted BE. We are happy to revise on the basis of editorial policy.

      Reviewer #2 (Recommendations For The Authors):

      1. I would encourage replacing "taste" with "flavor" throughout the manuscript and in the title because this paper addresses "taste here defined as a combination of taste, odour and chemesthesis" which essentially is the definition of flavor, and should not be simplified to taste. Flavor is the more precise word, and there is no need to confuse readers by defining "taste" in this way when taste means just the gustatory aspect of flavor.

      We now define flavour as a combination of taste, smell and chemesthesis and use ‘taste’ when referring to a specific taste quality. We use the term ‘chemosensory’ (perception, quality) and chemosensation for addressing the perception of both, taste and flavour qualities together. The abstract now reads: “The perception of taste and flavour (a combination of taste, smell and chemesthesis) here referred to as chemosensation, enables animals to find high-value foods and avoid toxins.”

      We prefer to leave the title as it is in accordance with standard books (e.g., “Pharmacology of Taste” by Palmer and Servant) which address all kinds of chemosensory interactions and the fact that we’ve conducted a ‘tasting panel’ (and not a ‘flavour panel’), and because flavour as a concept is only used in English (and also there not consistently, with ‘taste’ being the preferred term used by English native speakers for describing perception where in a strict sense, ‘flavour’ would be the correct term, see Rozin P. "Taste-smell confusions" and the duality of the olfactory sense. Percept Psychophys. 1982 Apr;31(4):397-401)) and maybe also in French.

      1. Methods - A much more detailed description of how the samples were prepared for the taste tests is needed. Were they sampled as a dry powder? No, they were sampled as dried pieces. We have added more information to our methods section to clarify.

      Why is there such a big range in the amount provided (.1 to 2 g)? Because certain drugs are highly toxic (aconitum, opium) we could only provide a relatively small amount (that still permitted the perception of taste qualities). For practical reasons, half a walnut was dispensed. We have added more information to our methods section to clarify.

      Also "Panelists were instructed to spit, rinse their mouth with drinking water and to take a break before tasting the next sample" This seems more likely that the samples were dissolved in a liquid if they were spitting and rinsing, but this is not clear. Also - take a break for how long between samples?

      Panellists were instructed to chew the amount of sample necessary for taste perception, to annotate their perception, and to spit out residues of samples and finally rinse their mouth with drinking water. The breaks between tasting different samples depended on chemosensory persistence. We have added more information to our methods section to clarify.

      How many samples were tested per day?

      The number of tasted samples was different from panelist to panelist and depending on available time frames. On average each panellist tasted 17,2 drugs per hour using 10.5 sessions (18 sessions in total) lasting approximately two hours each. We have added more information to our methods section to clarify.

      Did individual panelists get repeated samples?

      Random distribution permitted that individual panellists were challenged also with repeated samples. We have added more information to our methods section to clarify.

      1. Methods - Phylogenetic tree - Where is the output of this tree? It should be included in the figures and referred to in the results/discussion where the authors claim that they have been able to disambiguate phylogenetic closeness with taste and medicinal use.

      We did not ‘build’ a phylogenetic tree, rather we modified an existing one. Therefore, the wording of that section in the methods has been adjusted for clarity. We refer to the tree in the results pertaining to phylogenetic relatedness by explicitly quantifying the extent of phylogenetic signal using the widely used heritability (h2) statistic. This means that shared ancestry has a statistical influence on the model. We have also added to our Figure 2 representations of the phylogenetic tree we used in our analysis, limited to the species for which we have data, also displaying the data (in this case, intensity and complexity) at the tips.

      1. Taste intensity ratings should be better explained. Since the panelists are evaluating different amounts of samples (.1 to 2g) wouldn't the intensity of taste also depend on the amount of the substance?

      The panelists were not told to introduce all the sample into their mouth but just enough to perceive the taste qualities clearly (explanation given in methods). E.g.: one black pepper corn is normally enough to perceive the taste and flavour of pepper while the same amount of hazelnut would be insufficient.

      Or is this measure a relative value - "woodiness" vs "sourness" for example within the sample is strong/weak?

      Chemosensation and sensory perception in general is always relative. (For instance, currently I can hear the birds singing outside. Was there music playing in my room I wouldn’t be able to hear them).

      Because of this - are samples with strong tastes less likely to seem complex because the intensity of one stimulus masks the other?

      Yes, we argue that drugs with strong tastes/flavours are less likely be perceived as being complex (fewer individual qualities perceived), arguably because strong stimuli overshadow weaker ones. We currently address this in the discussion and have made some modifications in line with the below comment.

      This issue was presented briefly in the discussion when addressing the finding that samples with intense, but fewer tastes were more versatile, but this was highly confusing.

      The authors presented both sides of the problem without referring to any of their own experiments to resolve the issue, or to highlight this as a potential limitation of the study at hand.

      Yes, stronger tastes mask weaker tastes which addresses both sides of the problem.

      We have modified the first paragraph of the discussion to make this clearer.

      It now reads: "Unexpectedly, botanical drugs eliciting fewer but intense chemosensations were more versatile (Fig. 2). People often associate complexity with intensity, and taste complexity is popularly interpreted with a higher complexity of ingredients (Spence, and Wang, 2018). However, simple tastes can be associated with complex chemistry when intense tastes mask weaker tastes, or when tastants are blended (Breslin and Beauchamp, 1997; Green et al., 2010). For example, starchy flavours or sweet tastes can be sensed when bitter and astringent antifeedant compounds are present below a certain threshold while salts enhance overall flavour by suppressing the perception of bitter tastants (Breslin and Beauchamp, 1997; Johns, 1990). On the other hand, combinations of different tastants or olfactory stimuli do not necessarily result in increased perceived complexity (Spence and Wang, 2018; Weiss et al., 2012)."

      It would be useful to understand the parameters a bit more - a data visualization of the relationships of intensity and complexity across all samples would be a welcome addition to Figure 2.

      Shared ancestry has a statistical influence on the model. We have now also added to our Figure 2 representations of the phylogenetic tree we used in our analysis, limited to the species for which we have data, also displaying the data (in this case, intensity and complexity) at the tips.

      1. "Therapeutic Versatility" is a measure of how many different therapeutic uses a given botanic is listed in the DMM. This is one of the primary comparisons of this study, but the authors do not provide much of a rationale for using this metric. Also, there are 46 therapeutic uses, but many are interrelated such as gastric, gynecology, muscle, neurological, respiratory, skin, and kidney. It is not clear in my reading of the methods if this was also treated in some type of "phylogeny" as well or not. I would assume a real therapeutic versatility metric should be higher for something used for cough, ulcers, gout, and menses rather than something that was used for 4 different, but skin-related complaints.

      The reviewer is correct, and we appreciate this comment. We have modified the definition of versatility in line with the suggestions laid out here. We have provided a detailed explanation of this in our public responses but for ease of reference, we paste this again here:

      Here, we define therapeutic versatility as the number of therapeutic ‘categories’ a drug is used for (the 25 broad categories are represented by shared iconography in Figure 1). Our revised results include analyses using this definition – which are qualitatively identical to our previous results which defined versatility using the 46 individual therapeutic uses.

      We repeated our original ‘versatility’ analyses using the 25 broader categories rather than the 46 individual uses. The results remained largely the same.

      1. Use of icons/pictorial representations in figures. Overall, the use of icons is not necessary - words could be used, and then readers would not need to keep going back and forth to the key in Figure 1 to identify the taste/use. I am very confused by Figure 3. How is the strength of taste shown in this figure? The use of the balance is a confusing representation since I don't associate strength/intensity with weight. Also there are specific tastes that are used more, and others that are used less (but the numbers of those are also more/less). I do not think this figure accomplishes the goal of relaying these findings.

      Whilst we agree that iconography is not strictly necessary, we think it is a good way of graphically representing the results without over-crowding the figures or introducing text sizes too small to read in print. All values are provided in the supporting information if any individual detail is required.

      We have decided on the basis of these comments to exclude former Fig. 3 and (Figure supplement 1). We hope that the removal of this figure and clearer signposting towards the text and numerical tables in the supplementary information alleviates the reviewer’s concerns.

      1. Similarly, figure 4 is unclear. This could be better represented in a table with words and p values listed. But a larger issue is that this shows essentially the same overarching relationship across the therapeutic use cases - high intensity, low complexity. Only the pink kidney (other?) case differs from this pattern. In the discussion, several therapeutic uses are discussed that could need intense tasting medicine - but these are not related directly back to the relationships shown in Figure 4.

      Yes, we agree with the reviewer and have now moved Fig. 4 to the supplementary (Figure supplement 1)

    1. Author Response

      The following is the authors’ response to the original reviews.

      Note to all Reviewers

      We appreciate the reviewers’ comments and suggestions for improving the manuscript. Below is a summary of new data added and a brief description of the major new results. A detailed pointby-point response follows.

      New data:

      • Figure 1f

      • Figure 2b, f, g

      • Figure 4b

      • Figure S7 • Figure S8

      • Figure S9

      Summary of major new results/edits:

      • At the request of Reviewer #1 we have updated the name of the degradation tag to be more specific and we now call it the “LOVdeg” tag.

      • We have added new controls demonstrating that light stimulation does not cause photobleaching or toxicity issues (Fig. S7).

      • We now show that LOVdeg can function at various points in the growth cycle, demonstrating robust degradation (Fig. 1f, Fig. S8).

      • We have included relevant controls for the AcrB-LOVdeg efflux pump results (Fig. 2f-g).

      • We have included important benchmarking controls, such as an EL222-only control and SsrA tag control to provide a clearer view of how LOVdeg performance compares to other systems (Fig. S9, Fig. 4b).

      Additional note:

      • While repeating experiments during the revision process we found that the results for the combined action of EL222 and the LOVdeg tag were not as dramatic as in our original measurements, though the overall findings are consistent with our original results. Specifically, we still find that the combination of EL222 and the LOVdeg tag produces a lower signal than either on their own. We have updated these data in the revised manuscript (Fig. 4b).

      Reviewer #1:

      Public Review:

      Specifically controlling the level of proteins in bacteria is an important tool for many aspects of microbiology, from basic research to protein production. While there are several established methods for regulating transcription or translation of proteins with light, optogenetic protein degradation has so far not been established in bacteria. In this paper, the authors present a degradation sequence, which they name "LOVtag", based on iLID, a modified version of the blue-light-responsive LOV2 domain of Avena sativa phototropin I (AsLOV2). The authors reasoned that by removing the three C-terminal amino acids of iLID, the modified protein ends in "-E-A-A", similar to the "-L-A-A" C-terminus of the widely used SsrA degradation tag. The authors further speculated that, given the light-induced unfolding of the C-terminal domain of iLID and similar proteins, the "-E-A-A" C-terminus would become more accessible and, in turn, the protein would be more efficiently degraded in blue light than in the dark.

      Indeed, several tested proteins tagged with the "LOVtag" show clearly lower cellular levels in blue light than in the dark. While the system works efficiently with mCherry (10-20x lower levels upon illumination), the effect is rather modest (2-3x lower levels) in most other cases. Accordingly, the authors propose to use their system in combination with other light-controlled expression systems and provide data validating this approach. Unfortunately, despite the claim that the "LOVtag" should work faster than optogenetic systems controlling transcription or translation of protein, the degradation kinetics are not consistently shown; in the one case where this is done, the response time and overall efficiency are similar or slightly worse than for EL222, an optogenetic expression system.

      The manuscript and the figures are generally very well-composed and follow a clear structure. The schematics nicely explain the underlying principles. However, limitations of the method in its main proposed area of use, protein production, should be highlighted more clearly, e.g., (i) the need to attach a C-terminal tag of considerable size to the protein of interest, (ii) the limited efficiency (slightly less efficient and slower than EL222, a light-dependent transcriptional control mechanism), and (iii) the incompletely understood prerequisites for its application. In addition, several important controls and measurements of the characteristics of the systems, such as the degradation kinetics, would need to be shown to allow a comparison of the system with established approaches. The current version also contains several minor mistakes in the figures.

      We thank reviewer #1 for the feedback and suggestions to strengthen the manuscript. We have addressed these comments in the points that follow and now include important controls and benchmarks for our molecular tool.

      Major points

      1. The quite generic name "LOVtag" may be misleading, as there are many LOV-based tags for different purposes.

      We appreciate that it would be beneficial to have a more specific name. We have updated the name to “LOVdeg” tag, which captures both the inclusion of LOV and the degradation function of the tag.

      Updated throughout the manuscript and figures

      1. Throughout the manuscript, the authors use "expression levels". As protein degradation is a post-expression mechanism, "protein levels" should be used instead.

      We have transitioned to using “protein levels” at many points in the manuscript.

      Updated throughout the manuscript

      1. Degradation dynamics (time course experiments) should be shown. The only time this is done in the current version (in Fig. 4), degradation appears to be in the same range (even a bit slower) than for EL222, which does not support the claim that the "LOVtag" acts faster than other optogenetic systems controlling protein levels.

      In the revised manuscript, time course data are now shown at multiple points. These include new data in Fig. 1f and Fig. S8 that demonstrate degradation at various stages of growth. Fig. S4 also shows the dynamics of degradation when comparing to the addition of exogenously expressed ClpA. We have added text in the results section to point the reader to these data. In addition, we have made minor modifications to the text in the Introduction to avoid making claims about speed comparisons. Fig. 1f, Fig. S8, Fig. S4

      Results: Design and characterization of the AsLOV2-based degradation tag, Introduction

      1. "Frequency" is used incorrectly for Fig. 3. A series of 5 seconds on, 5 seconds off corresponds to a frequency of 0.1 Hz (1 illumination round / 10 s), not of 0.5 Hz. What the authors indicate as "frequency" is the fraction of illumination time. However, the (correct) frequency should be given, as this is likely the more important factor.

      We have changed how we calculate frequency to use the proposed definition of one pulse per time period. We updated the values in the text and in the figure. Fig. 3c

      Results: Tuning frequency response of the LOVdeg tag

      1. To properly evaluate the system, several additional controls are needed:

      a. To test for photobleaching of mCherry by blue light illumination, untagged controls should be shown for the mCherry-based experiments. Fluorescence always seems to be lower upon illumination, except for the AsLOV2*(546) data, where it cannot be excluded that fluorescence readings are saturated. Relatedly, the raw data for OD and fluorescence should be included. Showing a Western blot against mCherry in at least one case would allow to separate the effects of photobleaching and degradation.

      We appreciate the suggestion and have conducted these important controls. We now include new data demonstrating that light induction does not change fluorescence levels using an untagged mCherry control, nor does it significantly affect endpoint OD levels. Based on these results, we did not perform a Western blot because there were no effects to separate. Fig. S7

      b. In Fig. 2b, light + IPTG should be shown to estimate the activity of the system at higher expression levels.

      We have added these to the figure. Light + IPTG modestly increases expression compared to IPTG only, likely due to the saturating level of IPTG added, which achieves near full induction. Fig. 2b

      c. In Fig. 4, EL222 alone should be shown to allow a comparison with the LOVtag. From the data presented, it looks like EL222 is both slightly faster and more efficient than the LOVtag.

      We have added the EL222-only case for comparison with LOVdeg only and EL222 + LOVdeg. We note that Reviewer #3 raised a similar concern. Fig. 4b

      d. The effect of the used light on bacterial viability under exponential and stationary conditions should be shown.

      In this revision, we have added new data on light exposure at various points during exponential and stationary phase (Fig. 1f, Fig. S8). These OD data show that growth curves are similar for all cultures, regardless of the time light is applied during the growth phase. Additionally, we also now include ODs for the photobleaching experiments. These data also show that growth is not significantly altered under continuous light exposure. Figure 1f, Fig. S7b

      1. The claim that "Post-translational control of protein function typically requires extensive protein engineering for each use case" is not correct. The authors should discuss alternative options, e.g. based on dimerization, more extensively and in a less biased manner.

      We have toned down the language in this location and at other points in the manuscript. However, we maintain that other types of post-translational control, such as dimerization or LOV2 domain insertion, require more protein engineering than inserting a degradation tag. For example, we and others have directly demonstrated this in previous work (e.g. DOI: 10.1021/acssynbio.9b00395, 10.1101/2023.05.26.542511, 10.1038/s41467-023-38993-6), where numerous split site or insertion variants need to be screened and fine-tuned for successful light control. In contrast, a degradation mechanism has the potential to require less fine tuning to achieve a light response. We have included the above sources to clarify this point. Introduction, Results: Modularity of the LOVdeg tag

      Minor points

      1. In Suppl. Fig. 1, amino acid numbers seem to be off. Also, the alterations in iLID (compared to AsLOV2) that are not used in "LOVtag" appear to be missing and the iLID sequence incorrect, as a consequence.

      Thank you for catching this. The number indices in Fig. S1 have been corrected. We also realized we were reporting the iLID(C530M) variant in our amino acid sequence and have reverted the 530M back to C. Fig. S1

      1. Why is AsLOV2(543) more efficiently degraded than AsLOV2(543) (blue column in Fig. 1d) when the dark state should be stabilized in AsLOV2(543)?

      We are not sure of the exact reason for the increased degradation response in the AsLOV2*(543) variant. It may be that the dark-state stabilizing mutations introduced also have more favorable interactions with degradation machinery, although this is highly speculative.

      1. Why does the addition of EL222 reduce protein levels so strongly in the dark for CpFatB1* (Fig. 5)?

      We believe this effect stems from the EL222 responsive promoter (PEL222). With LOVdeg only, CpFatB1* is expressed from an IPTG inducible promoter (PlacUV5) whereas EL222 responsive constructs necessitate a promoter switch containing an EL222 binding site. We have clarified this point and expanded our discussion of these results.

      Results: Optogenetic control of octanoic acid production

      1. Fig. 2f / S10 are difficult to interpret. Why does illumination only lead to a significant effect at 2.5 and 5 µg/ml and not at lower concentrations, where the degradation system would be expected to be most efficient?

      We have expanded our discussion on these results to explain that this likely stems from basal protein levels of AcrB-LOVdeg in the light that can provide resistance at low antibiotic concentrations. We have also added new controls to this figure to show the chloramphenicol sensitivity of a ΔacrB strain and a ΔacrB strain with an IPTG-inducible version of acrB with no induction, demonstrating the lowest achievable chloramphenicol resistance from a standard inducible system.

      Results: Modularity of the LOVdeg tag, Fig. 2f-g

      1. Fig. 2f / S10 do not measure the MIC (which is a clearly defined value), but the sensitivity to Chloramphenicol.

      We have changed the text to use the term chloramphenicol sensitivity instead of MIC. Results: Modularity of the LOVdeg tag

      1. "***" in Fig. S1 should be explained.

      We have removed the ‘***’ to avoid confusion. Fig. S1

      1. The fold-change differences between light and dark, indicated in some selected cases, should be listed for all figures.

      We have added fold-change values where appropriate. Fig 1d, Fig. 2b

      Reviewer #2:

      Public Review:

      In this manuscript the authors present and characterize LOVtag, a modified version of the bluelight sensitive AsLOV2 protein, which functions as a light-inducible degron in Escherichia coli. Light has been shown to be a powerful inducer in biological systems as it is often orthogonal and can be controlled in both space and time. Many optogenetic systems target regulation of transcription, however in this manuscript the authors target protein degradation to control protein levels in bacteria. This is an important advance in bacteria, as inducible protein degradation systems in bacteria have lagged behind eukaryotic systems due to protein targeting in bacteria being primarily dependent on primary amino acid sequence and thus more difficult to engineer. In this manuscript, the authors exploit the fact that the J-alpha helix of AsLOV2, which unwinds into a disordered domain in response to blue light, contains an E-A-A amino acid sequence which is very similar to the C-terminal L-A-A sequence in the SsrA tag which is targeted by the unfoldases ClpA and ClpX. They truncate AsLOV2 to create AsLOV2(543) and combine this truncation with a mutation that stabilizes the dark state to generate AsLOV2*(543) which, when fused to the C-terminus of mCherry, confers light-induced degradation. The authors do not verify the mechanism of degradation due to LOVtag, but evidence from deletion mutants contained in the supplemental material hints that there is a ClpA dominated mechanism. They demonstrate modularity of this LOVtag by using it to degrade the LacI repressor, CRISPRa activation through degradation of MCP-SoxS, and the AcrB protein which is part of the AcrAB-TolC multidrug efflux pump. In all cases, measurement of the effect of the LOVtag is indirect as the authors measure reduction in LacI repression, reduction in CRISPRa activation, and drug resistance rather than directly measuring protein levels. Nevertheless the evidence is convincing, although seemingly less effective than in the case of mCherry degradation, although it is hard to compare due to the different endpoints being measured. The authors further modify LOVtag to contain a known photocycle mutation that slows its reversion time in the dark, so that LOVtag is more sensitive to short pulses of light which could be useful in low light conditions or for very light sensitive organisms. They also demonstrate that combining LOVtag with a blue-light transcriptional repression system (EL222) can decrease protein levels an additional 269-fold (relative to 15-fold with LOVtag alone). Finally, the authors apply LOVtag to a metabolic engineering task, namely reducing expression of octanoic acid by regulating the enzyme CpFatB1, an acyl-ACP thioesterase. The authors show that tagging CpFatB1 with LOVtag allows light induced reduction in octanoic acid titer over a 24 hour fermentation. In particular, by comparing control of CpFatB1 with EL222 transcriptional repression alone, LOVtag, or both the authors show that light-induced protein degradation is more effective than light-induced transcriptional repression. The authors suggest that this is because transcriptional repression is not effective when cells are at stationary phase (and thus there is no protein dilution due to cell division), however it is not clear from the available data that the cells were in stationary phase during light exposure. Overall, the authors have generated a modular, light-activated degron tag for use in Escherichia coli that is likely to be a useful tool in the synthetic biology and metabolic engineering toolkit.

      We thank Reviewer #2 for the constructive feedback. In the updated manuscript, we now include data demonstrating degradation at different growth stages and address other points brought up in the review to improve understanding of the degradation tag.

      Overall, the authors present a well written manuscript that characterizes an interesting and likely very useful tool for bacterial synthetic biology and metabolic engineering. I have a few suggestions that could improve the presentation of the material.

      Major Comments:

      • Could the authors clarify, perhaps through OD measurements, that the cultures in the octanoic acid experiment are actually in stationary phase during the relevant light induction. It isn't clear from the methods.

      We have updated the Methods to clarify that the cells are entering stationary phase (OD600 = 0.6) when light is either kept on or turned off for production experiments. Production is continued for the following 24 hours. Note that we now show OD measurements in a separate set of experiments (Fig. 1f, Fig. S8).

      Methods: Octanoic acid production experiment. Fig. 1f, Fig. S8

      • Can the authors clarify why there is an overall decrease in protein in the clpX deletion? And is it this initial reduction that is the source of the change in fold in 1C? Similarly, for hslU is it because overall protein levels are higher with the tag? In general, I feel that the interpretation of Supplemental Figures S6-S10 could be moved in more detail to the main text, or at least the main takeaway points. But this is a personal preference, and not necessary to the major flow of the story which is about the utility of the LOVtag tool.

      As shown in Fig. S5, expression of mCherry without any degradation tag is decreased in a clpX knockout strain compared to wild type. This difference may be the result of reduced cell health, and we now note this in the text. The strains shown in Fig. 1c are in wild type cells with normal expression, so this is not the source of the fold change. As for hslU, we agree it is interesting that expression seems to increase. However, the increase is modest and could stem from gene network regulation differences in that strain compared to wild type and may not be related to LOVdeg tag degradation. Each endogenous protease is involved in a wide range of functions within the cell, and it is unknown how global gene expression is impacted. We acknowledge the suggestion of moving the protease results to the main text, but we have ultimately elected to keep these data in the Supplementary Information to maintain the flow in the manuscript. However, we have added additional text pointing the reader to the Supplemental Text and include a brief summary of the findings in the main text.

      Results: Design and characterization of the AsLOV2-based degradation tag

      • What is the source of the poor repression in Figure 2D?

      Presumably, this stems from low levels of the CRISPRa MCP-SoxS activator, even in the presence of light. We have added this point to the text.

      Results: Modularity of the LOVdeg tag

      • In general, it would be nice to have light-only controls for many of the experiments to validate that light is not affecting the indicated proteins or their function.

      We thank the reviewer for this suggestion and note that Reviewer #1 raised a similar concern. We have now included light-only data for a strain containing IPTG-inducible mCherry without the LOVdeg tag (Fig. S7). These data show that light itself, at the levels used in this study, does not affect mCherry expression or cell growth. This strain serves as a direct control for data presented in Fig. 1 and Fig. 2b, as the systems are identical except for the addition of the LOVdeg tag onto either mCherry or the LacI repressor. Additionally, the control translates to other experiments since mCherry is used as a reporter for other systems in this study. Fig. S7

      • It would be nice to directly measure the function of the tool at different phases of E. coli growth to show directly that protein degradation works at stationary phase, rather than the more indirect measurements used in the octanoic acid experiment.

      We thank the reviewer for this suggestion, which significantly strengthens our results. We have added an experiment that tests the LOVdeg tag at different phases of growth (Fig. 1f, Fig. S8). In this experiment, cultures are growth from early exponential to stationary phase, and light is introduced at various points. Exposure windows of 4 hours, ranging from early exponential to stationary phase, all show functional light inducible degradation. Fig. 1f, Fig. S8.

      Results: Design and characterization of the AsLOV2-based degradation tag

      Minor Comments:

      • It would be nice to make clear that the data in S6d and S7 is repeated, but with the HslUV data in S7.

      We clarified this point in the caption of Fig. S4 (the former Fig. S7 in the original manuscript). Fig. S4 caption

      • Why was 5s picked for the frequency response in Figure 3

      We picked 5s because 1) it is a substantially shorter timescale than overall degradation dynamics seen for the LOVdeg tag, and 2) we found that shorter pulses could not be reliably achieved with the light stimulation hardware and software we used (Light Plate Apparatus with Iris software). To ensure high fidelity pulses, we opted for 5 second pulses that we empirically determined to be stable throughout long experiments. We have added text clarifying this. Results: Tuning frequency response of the LOVdeg tag

      Reviewer #3:

      Public Review:

      The authors present the mechanism, validation, and modular application of LOVtag, a light-responsive protein degradation tag that is processed by the native degradosome of Escherichia coli. Upon exposure to blue light, the c-terminal alpha helix unfolds, essentially marking the protein for degradation. The authors demonstrate the engineered tag is modular across multiple complex regulatory systems, which shows its potential widespread use throughout the synthetic biology field. The step-by-step rational design of identifying the protein that was most dark stabilized as well as most light-responsive for degradation, was useful in terms of understanding the key components of this system. The most compelling data shows that the engineered LOVTag can be fused to multiple proteins and achieve light-based degradation, without affecting the original function of the fused protein; however, results are not benchmarked against similar degradation tagging and optogenetic control constructs. Creating fusion proteins that do not alter either of the original functions, is often difficult to achieve, and the novelty of this should be expanded upon to drive further impact.

      We appreciate the feedback from Reviewer #3 to improve the manuscript. We have included important controls and benchmarking experiments to address the reviewer’s concerns, which are detailed in the points below.

      Benchmarking:

      The similarity between the L-A-A sequence of SsrA and the E-A-A sequence of LOVtag is one of the pieces of evidence that led the authors to their current protein design. The differences in degradation efficiency between the SsrA degradation tag and LOVtag are not shown, and benchmarking against SsrA would be a valuable way to demonstrate the utility of this construct relative to an established protein tagging tool.

      We thank the reviewer for suggesting an experiment to benchmark performance. We have added new experimental data where a full length SsrA tag is added to a fusion protein of nearly identical size (mCherry-iLID), allowing us to directly compare performance to mCherryLOVdeg (Fig. S9). These results show that light inducible control with LOVdeg tag decreases protein expression levels to near those achieved with the native SsrA tag. Fig. S9.

      Results: Design and characterization of the AsLOV2-based degradation tag

      Additionally, there is a lack of an EL222-only control presented in Figure 4b and in the results section beginning with "Integrating the LOVtag with EL222...". Without benchmarking against this control the claim that "EL222 and the LOVtag work coherently to decrease expression" is unsubstantiated. No assumptions of synergy can be made.

      We appreciate this comment and note that Reviewer #1 raised a similar concern. We have added data to Fig. 4b with an EL222-only control for comparison. Fig. 4b

      The dramatic change in dark octanoic acid titer between the EL222, LOVtag and combined conditions are surprising, especially in comparison to the lack of change in the dark mCherry expression shown in Figure 4b. This data is the only to suggest that LOVtag may perform better than EL222. However, the inconsistencies in dark state regulation presented in the two experiments, and between conditions in this experiment bring the latter claim to question. A recommendation is that the authors either repeat this experiment, or comment on the observed discrepancy in dark state octanoic acid titers in their discussion.

      First, a key difference between the data presented in Fig. 4 and Fig. 5 is that the production experiment is conducted over a long time period (24 hours) and the EL222/LOVdeg reporter experiment is conducted over 5 hours. Likely, performance differences between EL222 and the LOVdeg tag become more pronounced as protein accumulation occurs. Second, the LOVdeg only construct is expressed from a non-EL222 promoter which is able to achieve higher expression (see response to Reviewer #1, Minor point #3). Lastly, a convoluting factor is that the relationship between expression of CpFatB1 and octanoic acid production is not completely linear, and there are likely thresholds or expressions windows that result in similar endpoint titers. We agree a more detailed examination of how CpFatB1 changes over the course of the production period would be very interesting. However, this is beyond the scope of the present study, whose goal is to introduce and showcase the utility of the LOVdeg tag as a tool. We have added new discussion on this in the Results section to clarify some of these points. We have also repeated all experiments in Fig. 4 and consistently see the LOVdeg tag performing as well as or better than EL222. As noted in the remarks to all reviewers, these data have been updated in the revised manuscript.

      Results: Optogenetic control of octanoic acid production. Fig. 4d

      Based on the methodology presented, no change in the duration in light exposure was tested, even though this may be an important part of the system response. The on/off, for example in Figure 4b, is either all light or all dark, but they claim that their system is beneficial especially at stationary phase. The authors should consider showing the effects of shifting from dark to light at set intervals. (i.e. 1 hr dark then light, 2hr dark until light, etc.) This data would also aid in supporting the utility of this tag for controlling expression during different growth phases, where light may be used after the cells have reached a certain phase.

      We have added new data showing the effect of light stimulation at different times in the growth cycle (see response to Reviewer #2, bullet point #5). These data demonstrate that the LOVdeg tag performs well at various points in the growth cycle. Fig. 1f, Fig. S8.

      Results: Design and characterization of the AsLOV2-based degradation tag

      Minor Revisions Figures:

      • Figure 1:

      • More clarity is needed in the naming conventions for this figure and in the body of the text. For example, a different convention than 546 and 543 should be used to refer to the full and truncated lengths of the tag. It would greatly aid understanding for this to be made more clear. The authors could simply continue to use "full" and "truncated" to refer to them. In addition, the term "stabilizing mutations" in 1c could be changed to read "dark state stabilizing mutations" to aid in clarity.

      When describing the design of the LOVdeg tag, we opted towards a more technically accurate description over clarity in order to make our engineering process easily comparable to other LOV2 systems. As such, we kept the number-based nomenclature (543 or 546) to represent the domain within the phototropin 1 protein from Avena sativa (AsLOV2). The domain used in this study, and many other studies, are only amino acids 404-546, i.e. not the full sequence, thus saying simply ‘full’ or ‘truncated’ is not technically accurate. We believe the detailed nomenclature, which is limited to one section, is important to provide clarity on exactly what we used for protein engineering. In the revised version we introduce the nickname “LOVdeg” tag earlier and use it throughout the rest of the manuscript.

      Results: Design and characterization of the AsLOV2-based degradation tag

      • 1b It is not clear that this is the dark state stabilized structure in the figure, but is referred to as such only in the body of the text.

      We have added text in the manuscript to clarify this is AsLOV2, not iLID, and have labeled it in the figure caption as well.

      Results: Design and characterization of the AsLOV2-based degradation tag

      • 1d. Fold change is reported in Figure 2d, and may be relevant to include those values in 1d as well.

      Done. Fig. 1d

      • 1e. It is not clear which tag is being used in this bar plot. Please specify that this is the dark state stabilized, truncated tag.

      We have added a title to the plot and language to the caption, both of which clarify this point. Fig. 1e

      • In addition, the microscopy images provided in supplemental material should be included in the first figure as it adds a compelling observation of LOVtag activity.

      We are pleased to hear that the microscopy results are beneficial, however we elected to leave them in Supplementary to preserve the flow of the manuscript in the text surrounding Fig. 1.

      • Figure 2:

      • 2d. It is unclear what the 2.5x fold change is relative to (the baseline or the dark)

      We have added a line in the figure to clarify the comparison being made. Fig. 2d

      • 2f. More discussion can be added to describe what concentration of chloramphenicol is biologically/bioreactor relevant.

      Our previous studies on the relationship between AcrAB expression and mutation rate (cited in the text) were carried out at a concentration within the range in which the LOVdeg tag is effective (5 μg/ml), suggesting this range to be relevant to tolerance and resistance.

      • Figure 3:

      • We recommend that this data and discussion are better suited for supplementary figures. The results shown here essentially recapitulate the same findings of Zoltowski et al., 2009. In addition, the paper describing this mutation should be cited in this figure caption in addition to the body of the text

      Although these results are in line with previous findings, we believe this dataset is important for several reasons. First, the agreement with known mutations validates the unfolding-based mechanism for degradation control. Second, degradation that is contingent on unfolding of LOV2 offers a direct actuating mechanism of photocycle properties. Other systems, like that in Zoltowski et al., examine properties of purified proteins but lack the mechanism to translate its effect in live cells. This figure demonstrates how degradation can do so and lays the groundwork for degradation-based frequency processing circuits. Last, there are discrepancies between photocycle kinetics in situ, as reported by Li et al. (DOI: 10.1038/s41467-020-18816-8), and in cell-free studies such as in Zoltowski et al. The studies use different methods of measuring photocycle kinetics (in situ vs cell-free). This dataset substantiates relaxation times from Li et al. and suggests cell-free relaxation time constants are over estimated relative to our live cell results.

      • Figure 4:

      • There is a lack of an EL222-only control presented in Figure 4b. Without this data present, the claim that "EL222 and the LOVtag work coherently to decrease expression" is unsubstantiated. No assumptions of synergy can be made.

      We have added EL222-only data to the figure; we note that Reviewer #1 made a similar request. Figure 4b

      Manuscript

      Results

      • Design and characterization...

      • Due to the extensive discussion of ClpX at the beginning of this section, more of the results on evaluating the binding partners and mechanism of LOVtag degradation should be presented in the main body of the manuscript and not in supplementary materials.

      To maintain flow of the manuscript and focus on how the LOVdeg tag works as a synthetic biology tool, we have opted to keep this section in the Supplement Information, but have several lines in the text related to Fig. 1 that point the reader to this material. Results: Design and characterization of the AsLOV2-based degradation tag

      • In the second paragraph of this section, the authors theorize that the C-terminal truncated E-AA sequence will "remain caged as part of the folded helix". How did the authors determine this? Was there any evidence to suggest that the truncated state would be any more responsive than the full length sequence? More data or rationale may need to be introduced to support the overall hypothesis presented in this paragraph.

      We determined this by examining the crystal structure which shows that the E-A-A sequence is part of the folded helix. As seen in Fig. 1b, addition of amino acids after the EAAKEL sequence would not be part of the folded helix which ends prior to the terminal leucine. We added text to clarify our logic.

      Results: Design and characterization of the AsLOV2-based degradation tag

      • The similarity between the L-A-A sequence of SsrA and the E-A-A sequence of LOVtag is one of the pieces of evidence that brought the authors to their current protein design. The differences in degradation efficiency between the SsrA degradation tag and LOVtag are not clear, and benchmarking against SsrA would be a valuable way to demonstrate the utility of this construct relative to an established protein tagging tool.

      We added an SsrA comparison to benchmark the system. Fig. S9

      Results: Design and characterization of the AsLOV2-based degradation tag

      • Tuning frequency and response...

      • Overall the results presented in this section essentially recapitulate the effects that mutation presented in Zoltowski et. al., 2009 have on AsLOV2 dark state recovery and although this is a useful observation of LOVtag performance, a recommendation is to move this into a supplementary section.

      See above response to Fig. 3 comment.

      • Integrating the LOVtag with EL222...

      • The claim is made in this section that LOVtag and EL222 work synergistically, however the experiments presented do not test repression due to EL222 activity alone. Without benchmarking against this control, the claim of synergy is not supported and we recommend that the authors perform this experiment again with the EL222-only control.

      We have added this important control. Fig. 4b

      Discussion

      • The statement "the LOVtag can easily be integrated with existing optogenetic systems to enhance their function" is not substantiated without benchmarking LOVtag against an EL222- only control. As mentioned above this condition should be included in the experiments discussed in Figure 4 and in the section "Integrating the LOVtag with EL222.."

      We added EL222-only regulation to benchmark the LOVdeg tag and LOVdeg + EL222 experiments. Fig. 4b

      Experiments

      Applications:

      The application of this tag to the metabolic control of octanoic acid production could be more impactful. For instance, using the LOVtag with two different enzymes to change the composition of long/short chain fatty acids with light induction., Or possibly integrating the tag into a switch to activate production. However, the authors address that "decreasing titers is not the overall goal in metabolic engineering" in their discussion, and therefore the pursuit of this additional experiment is up to the authors' discretion.

      We appreciate the suggestions for further applications of the LOVdeg tag. We envision that follow up studies will focus on the application of the LOVdeg tag in metabolic engineering. However, this will require significant development of production systems. We believe this to be out of the scope of this work, where the goal is to present the design and function of the LOVdeg tag as a tool.

    1. Author Response

      We are very thankful to the reviewers for a thorough review of our manuscript, and we are confident that we can address all identified weaknesses in the revised version. At the current point, we believe that it is important to mention the following:

      1. The review by reviewer 1 contains factual errors. For example, the reviewer writes "There is much important information missing. For instance: how many animals were used per group and how was the breeding done?" Both animal numbers and the breeding scheme are described in detail in the manuscript.

      2. Reviewer 3 criticizes our choice of animal ages used for the analysis of sperm DNA methylation aging. The reviewer suggests that the sperm of our younger group may contain spermatozoa from the 1st wave of spermatogenesis, while our older group cannot be considered chronologically old mice. We have experimental data that demonstrate that DNA regions that undergo methylation change with age have a linear association between methylation levels and age across the mouse lifespan (including ages used in our study). Thus, age-dependent changes in DNA methylation may be analyzed using any two ages as soon as they are different enough to detect the changes. We will include this experimental data in our resubmitted manuscript.

    1. Author Response

      Reviewer #1 (Public Review):

      Question 1: The experiment that utilizes lactose or glucose supplementation to infer the importance of carbohydrate recognition by galectin-9 cannot be interpreted unequivocally owing to the growth-enhancing effect of lactose supplementation on Mtb during liquid culture in vitro.

      Response: Thanks for this very constructive comment. We will repeat this experiment and lower the concentration of lactose in order to attenuate its effect on Mtb growth, thereby highlighting the reversed mycobacterial growth inhibition by galectin-9.

      Question 2: Similar to the comment above, the apparent dose-independent effect of galectin-9 on Mtb growth in vitro is difficult to reconcile with the interpretation that galectin is functioning as claimed.

      Response: We thank the reviewer for the correction. Indeed, as the reviewer pointed out, galectin-9 inhibits Mtb growth in dose-independent manner. We will correct the claim in the revised manuscript.

      Question 3: The claimed differences in galectin-9 concentration in sera from tuberculin skin test (TST)-negative or TST-positive non-TB cases versus active TB patients are not immediately apparent from the data presented.

      Response: We appreciate the reviewer’s concern. We will perform the detection of galectin-9 in sera in another independent cohort of active TB patients and healthy donors in China.

      Question 4: Neither fluorescence microscopy nor electron microscopy analyses are supported by high-quality, interpretable images which, in the absence of supporting quantitative data, renders any claims of anti-AG mAb specificity (fluorescence microscopy) or putative mAb-mediated cell wall swelling (electron microscopy) highly speculative.

      Response: We appreciate the reviewer’s concern. We will improve the procedure of the immunofluorescence assay to obtain high-quality and interpretable images with quantitative data. As for electron microscopy analyses, we will add a more precise label indicating cell wall in revised manuscript.

      Question 5: Finally, the absence of any discussion of how anti-AG antibodies (similarly, galectin-9) gain access to the AG layer in the outer membrane of intact Mtb bacilli (which may additionally possess an extracellular capsule/coat) is a critical omission - situating these results in the context of current knowledge about Mtb cellular structure (especially the mycobacterial outer membrane) is essential for plausibility of the inferred galectin-9 and anti-AG mAb activities.

      Response: Exactly, AG is hidden by mycolic acids in the outer layer of Mtb cell wall. As we have discussed in the Discussion part of previous manuscript (line286), we speculate that during Mtb replication, cell wall synthesis is active and AG becomes exposed, thereby facilitating its binding to galectin-9 or AG antibody and leading to Mtb growth arrest. It’s highly possible that galectin-9 or AG antibody targets replicating Mtb. We will describe this point more comprehensibly.

      Reviewer #2 (Public Review):

      Question 1: In light of other observations that cleaved galectin-9 levels in the plasma is a biomarker for severe infection (Padilla A et al Biomolecules 2021 and Iwasaki-Hozumi H et al. Biomoleucles 2021) it is difficult to reconcile the author's interpretation that the elevated gal-9 in Active TB patients (Figure 1E) contributes to the maintenance of latent infection in humans. The authors should consider incorporating these observations in the interpretation of their own results.

      Response: Thank you for these very insightful comments. We observed elevated levels of galectin-9 in the serum of active TB patients, consistent with reports indicating that cleaved galectin-9 levels in the serum serve as a biomarker for severe infection (Iwasaki-Hozumi et al., 2021; Padilla et al., 2020). We interpret this to mean that elevated levels of galectin-9 in serum of active TB are an indicator of the host immune response to Mtb infection. However, the magnitude of elevated galectin-9 is insufficient to control Mtb infection thereby maintaining latent infection. This is comparable to other protective immune factors such as interferon gamma, which is considered protective and elevated in active TB, as well (El-Masry et al., 2007; Hasan et al., 2009).

      Question 2: The anti-AG titers were measured only in individuals with active TB (Figure 3C), generally thought to be a less protective immunological state. The speculation that individuals with anti-AG titers have some protection is not founded. Further only 2 mAbs were tested to demonstrate restriction of Mtb in culture. It is possible that clones of different affinities for AG present within a patient's polyclonal AG-antibody responses may or may not display a direct growth restriction pressure on Mtb in culture. The authors should soften the claims about the presence of AG-titers in TB patients being indicative of protection.

      Response: We appreciate the reviewer’s concern. As per the reviewer’s suggestion, we will soften the claim that anti-AG antibodies in the sera of TB patients indicate protection.

      References El-Masry, S., Lotfy, M., Nasif, W.A., El-Kady, I.M., and Al-Badrawy, M. (2007). Elevated serum level of interleukin (IL)-18, interferon (IFN)-gamma and soluble Fas in patients with pulmonary complications in tuberculosis. Acta microbiologica et immunologica Hungarica 54, 65-77.

      Hasan, Z., Jamil, B., Khan, J., Ali, R., Khan, M.A., Nasir, N., Yusuf, M.S., Jamil, S., Irfan, M., and Hussain, R. (2009). Relationship between circulating levels of IFN-gamma, IL-10, CXCL9 and CCL2 in pulmonary and extrapulmonary tuberculosis is dependent on disease severity. Scandinavian journal of immunology 69, 259-267.

      Iwasaki-Hozumi, H., Chagan-Yasutan, H., Ashino, Y., and Hattori, T. (2021). Blood Levels of Galectin-9, an Immuno-Regulating Molecule, Reflect the Severity for the Acute and Chronic Infectious Diseases. Biomolecules 11.

      Padilla, S.T., Niki, T., Furushima, D., Bai, G., Chagan-Yasutan, H., Telan, E.F., Tactacan-Abrenica, R.J., Maeda, Y., Solante, R., and Hattori, T. (2020). Plasma Levels of a Cleaved Form of Galectin-9 Are the Most Sensitive Biomarkers of Acquired Immune Deficiency Syndrome and Tuberculosis Coinfection. Biomolecules 10.

    1. Author Response

      We thank the reviewers for spending the time to read and provide reviews for our manuscript. The reviewers bring good points regarding the sample size, and the low exposure in the South Asian cohort owing to their unique cultural and social practices. We recognize these as limitations of the paper and will discuss these more extensively in the revised version. With respect to sample size, we are not attempting discovery but rather application of mDNA scores derived from external, large discovery samples. As such, though our sample sizes (n = 300–500) seem low for a typical EWAS, they are in a similar range as replication samples in other studies.

      We would also like to take this opportunity to emphasize there is no possible overfitting as the score was tested in studies (FAMILY and START) independent of the discovery set (Joubert et al., 2016; n > 5,000) and the LASSO validation (CHILD; n = 352). In other words, the same participants used for LASSO validation were not used in testing. This is precisely to leverage the larger sample size from external studies to select more plausible CpGs as candidates to include in the model. In fact, the discovery sample size in Reese et al., (2017) was only n = 1,057 in comparison.

      The validated score was then used for further testing in new datasets (FAMILY and START), where FAMILY achieved a more significant association than in the original validation sample (CHILD). At the same time, the mean squared error for the continuous smoking severity outcome (0 for no smoking, 1 for quit before pregnancy, 2 for quit during pregnancy, and 3 for current smoker) was 0.68 in CHILD and 1.43 in FAMILY, which indicate good fit; while the AUC for predicting current vs. non-smoker was 0.86 in CHILD and 0.9 in FAMILY. Taken together, these suggest the MRS constructed was not in violation of overfitting, or “failing to fit to additional data or predict future observations reliably”.

      In terms of value, our derived score contained 11 CpGs that only overlapped 2 out of the 28 CpGs in the score that was derived in the reference provided (Reese, EHP, 2017, PMID 27323799), but they shared four genes that contributed the most weight to the score (MYO1G, CYP1A1, AHRR, and GFI1). In fact, using the 7 CpGs of the score derived in Reese that were present in all cohorts, we obtained slightly worse performance in CHILD (validation cohort; ANOVA p = 4.1E-5, AUC 0.74), and it was not associated with smoking history in FAMILY (testing cohort; p = 0.13). However, we do agree with the reviewer that including more CpGs will improve the performance, using 24/28 CpGs available in CHILD (HM450K), we obtained slightly better results (ANOVA p = 3.8E-7, AUC 0.94), but these were mostly due to the 14/24 CpGs that showed evidence of association with maternal smoking according to EWAS catalog. In conclusion, we believe our score captures the core genes with robust evidence of association and is more parsimonious for applying to external data, but it can also benefit from a larger sample size to capture CpGs that are moderately associated with maternal smoking.

    1. Author Response

      Reviewer #1 (Public Review):

      Overall, the magnitude of the effect size due to FNDC5 deficiency in both male and female mice is rather modest. Looking at the data from a qualitative perspective, it is clear that knockout females still lose bone during lactation and on the low calcium diet (LCD). It is difficult to assess the physiologic consequence of the modest quantitative 'protection' seen in FNDC5 mutants since the mutants still show clear and robust effects of lactation and LCD on all parameters measured. Similarly, the magnitude of the 'increased' cortical bone loss in FNDC5 mutant males is also modest and perhaps could be related to the fact that these mice are starting with slightly more cortical bone. Since the authors do not provide a convincing molecular explanation for why FNDC5 deficiency causes these somewhat subtle changes, I would like to offer a suggestion for the authors to consider (below, point #2) which might de-emphasize the focus of the manuscript on FNDC5. If the authors chose not to follow this suggestion, the manuscript could be strengthened by addressing the consequences of the modest changes observed in WT versus FNDC5 KO mice.

      We agree that the magnitude of the effect size due to FNDC5 deficiency is modest with regards to the quantitative cortical bone parameters. However, if one examines the changes in osteocyte lacunar size and the mechanical properties of these bones, the differences are greater. As shown in Figure 3 E, the lacunar area of the WT females on a low calcium diet increases by over 30% and the KO by less than 20%, while in the males it is approximately 38% in WT compared to 46% in KO mice. According to Sims and Buenzli (PMID: 25708054) a potential total loss of ~16,000 mm3 (16 mL) of bone occurs through lactation in the human skeleton. This was based on our measurements in lactation-induced murine osteocytic osteolysis (Qing et al PMID: 22308018). They used our 2D section of tibiae from lactating mice showing an increase in lacunar size from 38 to 46 um2. In that paper we also showed that canalicular width is increased with lactation. Therefore, this would suggest a dramatic decrease in intracortical porosity due to the osteocyte lacunocanalicular system in female KO on a low calcium diet compared to WT females and a dramatic increase in KO males compared to WT males. Also, PTH was higher in the serum of female WT compared to female KO mice on a low calcium diet, the opposite for males in order to maintain normal calcium levels (See Table 1). Based on this data, using the FNDC5 null animals, we would speculate that the product of FNDC5, irisin, is having a highly significant effect on the ultrastructure of bone in both males and females challenged with a low calcium diet.

      2) The bone RNA-seq findings reported in Figures 4-6 are quite interesting. Although Youlten et al previously reported that the osteocyte transcriptome is sex-dependent, the work here certainly advances that notion to a considerable degree and likely will be of high interest to investigators studying skeletal biology and sexual dimorphism in general. To this end, one direction for the authors to consider might be to refocus their manuscript toward sexually-dimorphic gene expression patterns in osteocytes and the different effects of LCD on male versus female mice. This would allow the authors to better emphasize these major findings, and to then use FNDC5 deficiency as an illustrative example of how sexually-dimorphic osteocytic gene expression patterns might be affected by deletion of an osteocyte-acting endocrine factor. Ideally, the authors would confirm RNA-seq data comparing male versus female mice in osteocytes using in situ hybridization or immunostaining.

      Thank you for this suggestion. We have compared the different effects of LCD on male versus female mice in our revised version and have added a figure containing this information.

      3) Along the lines of point #2 (above), the presentation of the RNA-seq studies in Figures 4-6 is somewhat confusing in that the volcano plot titles seem to be reversed. For example, Figure 4A is titled "WT M: WT F", but the genes in the upper right quadrant appear to be up-regulated in female cortical bone RNA samples. Should this plot instead be titled "WT F: WT M"? If so, then all other volcano plots should be re-titled as well.

      We have now insured that the plots are appropriately labeled.

      4) Have the authors compared male versus female transcriptomes of LCD mice?

      We have now compared the male vs female transcriptomes of LCD mice and added an additional figure.

      5) It would be appreciated if the authors could provide additional serum parameters (if possible) to clarify incomplete data in both lactation and low-calcium diet models: RANKL/OPG ratio, Ctx, PTHrP, and 1,25-dihydroxyvitamin D levels.

      It is not possible to quantitate each of these as the serum has been exhausted. We have checked the RANKL/OPG ratio in the RNA seq and qPCR data using osteocyte enriched bone chips and found no difference.

      6) Lastly, the data that overexpressing irisin improved bone properties in Fig 2G was somewhat confusing. Based on Kim et al.'s (2018) work, irisin injection increased sclerostin gene expression and serum levels, thus reducing bone formation. Were sclerostin levels affected by irisin overexpression in this study? Was irisin's role in modulating sclerostin levels attenuated with additional calcium deficiency?

      We have not observed any differences in the osteocyte Sost mRNA expression between WT and KO normal and low-calcium-diet male and female mice in our RNAseq and qPCR data. As such, we did not check the Sost levels for the 2G experiment.

      Reviewer #2 (Public Review):

      Summary:

      The goal of this study was to examine the role of FNDC5 in the response of the murine skeleton to either lactation or a calcium-deficient diet. The authors find that female FNDC5 KO mice are somewhat protected from bone loss and osteocyte lacunar enlargement caused by either lactation or a calcium-deficient diet. In contrast, male FNDC5 KO mice lose more bone and have a greater enlargement of osteocyte lacunae than their wild-type controls. Based on these results, the authors conclude that in males irisin protects bone from calcium deficiency but that in females it promotes calcium removal from bone for lactation.

      While some of the conclusions of this study are supported by the results, it is not clear that the modest effects of FNDC5 deletion have an impact on calcium homeostasis or milk production.

      Specific comments:

      1) The authors sometimes refer to FNDC5 and other times to irisin when describing causes for a particular outcome. Because irisin was not measured in any of the experiments, the authors should not conclude that lack of irisin is responsible. Along these lines, is there any evidence that either lactation or a calcium-deficient diet increases the production of irisin in mice?

      The global FNDC5 KO mice used for our experiments do not produce or secrete irisin, therefore we have extrapolated that the observed effects are due to a lack of circulating irisin. However, this does not rule out that Fndc5 itself could have a function, but this would have to be most likely in muscle and not in the osteocyte as we do not detect significant levels of irisin in either primary osteoblasts nor primary osteocytes compared to muscle and C2C12 cells. As such, we concluded that the phenotypical differences we saw in our experiments are due to a lack of irisin. We now address the reviewer’s point in the discussion. The measurement of irisin in the circulation with lactation or with low calcium diet of normal mice has not been performed.

      2) The results of the irisin-rescue experiment shown in figure 2G cannot be appropriately interpreted without normal diet controls. In addition, some evidence that the AAV8-irisin virus actually increased irisin levels in the mice would strengthen the conclusion.

      We do not have the normal diet controls at this time. We have now added the quantitative data for tagged irisin in these mice showing highly significant expression

      3) There is insufficient evidence to support the idea that the effect of FNDC5 on bone resorption and osteocytic osteolysis is important for the transfer of calcium from bone to milk. Previous studies by others have shown that bone resorption is not required to maintain milk or serum calcium when dietary calcium is sufficient but is critical if dietary calcium is low (Endo. 156:2762-73, 2015). To support the conclusions of the current study, it would be necessary to determine whether FNDC5 is required to maintain calcium levels when lactating mice lack sufficient dietary calcium.

      We agree that it would be important to measure calcium levels in the milk to test the hypothesis that FNDC5 is important to maintain calcium levels in milk. However, as the calcium levels are normal in the serum, we are assuming they are normal in milk. This would require future experiments.

      4) The amount of cortical bone loss due to lactation is very similar in both WT and FNDC5 KO mice. The results of the statistical analysis of the data presented in figure 1B are surprising given the very similar effect size of lactation. The key result from the 2-way ANOVA is whether there is an effect of genotype on the effect size of lactation (genotype-lactation interaction). The interaction terms were not provided. Similar concerns are noted for the results shown in figure 1G and H.

      We agree, thanks. We will now add the interaction terms in the figure legends.

      5) It is not clear what justifies the term 'primed' or 'activated' for resorption. Is there evidence that a certain level of TRAP expression lowers the threshold for osteocytic osteolysis in response to a stimulus?

      The number of TRAP positive osteocytes in female KO mice are lower than in female WT. The number of TRAP positive osteocytes are lower in WT males compared to WT females. We propose that irisin plays a role in the number of TRAP positive osteocytes in normal, WT females by readying or preparing these cells to rapidly respond to low calcium. We will use the term ‘primed’ and will not use the term ‘activated’. We are open to any terminology or description as to why this is observed and what irisin could be doing to the osteocyte.

      Reviewer #3 (Public Review):

      Summary: Irisin has previously been demonstrated to be a muscle-secreted factor that affects skeletal homeostasis. Through the use of different experimental approaches, such as genetic knockout models, recombinant Irisin treatment, or different cell lines, the role of Irisin on skeletal homeostasis has been revealed to be more complex than previously thought and this warrants further examination of its role. Therefore, the current study sought to rigorously examine the effects of global Irisin knockout (KO) in male and female mouse bone. Authors demonstrated that in calcium-demanding settings, such as lactation or low-calcium diet, female Irisin KO mice lose less bone compared to wild-type (WT) female mice. Interestingly male Irisin KO mice exhibited worse skeletal deterioration compared to WT male mice when fed a low-calcium diet. When examined for transcriptomic profiles of osteocyte-enriched cortical bone, authors found that Irisin KO altered the expression of osteocytic osteolysis genes as well as steroid and fatty acid metabolism genes in males but not in females. These data support the authors' conclusion that Irisin regulates skeletal homeostasis in sex-dependent manner.

      Strengths: The major strength of the study is the rigorous examination of the effects of Irisin deletion in the settings of skeletal maturity and increased calcium demands in female and male mice. Since many of the common musculoskeletal disorders are dependent on sex, examining both sexes in the preclinical setting is crucial. Had the investigators only examined females or males in this study, the conclusions from each sex would have contradicted each other regarding the role of Irisin on bone. Also, the approaches are thorough and comprehensive that assess the functional (mechanical testing), morphological (microCT, BSEM, and histology), and cellular (RNA-seq) properties of bone.

      Weaknesses: One of the weaknesses of this study is a lack of detailed mechanistic analysis of why Irisin has a sex-dependent role on skeletal homeostasis. This absence is particularly notable in the osteocyte transcriptomic results where such data could have been used to further probe potential candidate pathways between LC females vs. LC males.

      Our future studies will focus on understanding the molecular mechanism behind the sex-dependent effects of irisin. Our RNA seq data shows a significant difference in the lipid, steroid, and fat metabolism pathways between male and female mice, as well as between WT and KO mice. Future studies will focus on these pathways.

      Another weakness is authors did not present data that convincingly demonstrate that Irisin secretion is altered in the skeletal muscle between female vs. male WT mice in response to calcium restriction. The supplement skeletal muscle data only present functional and electrophysiolgical outcomes. Since Itgav or Itgb5 were not different in any of the experimental groups, it is assumed that the changes in the level of Irisin is responsible for the phenotypes observed in WT mice. Assessing Irisin expression will further strengthen the conclusion based on observing skeletal changes that occur in Irisin KO male and female mice.

      The problem is that the commercial assays for irisin are not dependable, and results can differ widely across and beyond the physiologic range of 1-10 ng/ml. In part this is due to the nature of the polyclonal antibodies used and the resultant cross reactivity with other proteins. It was shown in Islam et al, 2021 (Nature Metabolism) that the commercial ELISAs were completely unreliable in mice and the only reliable method of measuring circulating irisin is mass spectrometry.

    1. Author Response

      Reviewer #1 (Public Review):

      Strengths:

      1. In my assessment, the data sufficiently demonstrates that a modified version of Pertuzamab can bind both the wild-type and S310 mutant forms of ERBB2.

      2. The engineering strategy employed is rational and effectively combines computational and experimental techniques.

      3. Given the clinical activity of HER2-targeting ADCs, antibodies unaffected by ERBB2 mutations would be desired.

      Weaknesses:

      1. There is no data showing that the engineered antibody is equally specific as Pertuzamab i.e. that it does not bind to other (non-ERBB2) proteins.

      Showing the specificity of the engineered antibodies is indeed important. We did not address it in the current ms, but it can be tested in the future.

      1. There is no data showing that the engineered antibody has the desired pharmacokinetics/pharmacodynamics properties or efficacy in vivo.

      In this ms we did not conduct in-vivo experiments. When moving forward, pharmacokinetics/pharmacodynamics properties and efficacy will be tested as well.

      1. Computational approaches are only used to design a phage-screen library, but not used to prioritize mutations that are likely to improve binding (e.g. based on predicted impact on the stability of the interaction). A demonstration of how computational pre-screening or lead optimization can improve the time-intensive process would be a welcome advance.

      Thank you for this important comment. In the present ms we indeed used a computational approach for prioritizing residues to be mutated, but we did not prioritize the mutations that are likely to improve binding. In the initial library design, we did prioritize the mutations. However, due to experimental approach limitations with codon’s selection for the library, we had decided to allow all possible residues in each position, knowing that the selection will remove non-binding variants.

      Context:

      The conflict of interest statement is inadequate. Most authors of the study (but not the first author) are employees of Biolojic, a company developing multi-specific antibodies, but the statements do not clarify whether the presented antibodies represent Biolojic IP, whether the company sponsored the research, and whether the company is further developing the specific antibodies presented.

      The Conflict-of-Interest statement will be revised as such: The Biolojic Design authors are employees of Biolojic Design and have stock options in Biolojic Design. The company did not sponsor the research, does not hold IP for the presented antibodies, and is not further developing the presented antibodies.

      Reviewer #2 (Public Review):

      Strengths:

      1. Deep computational analyses of large datasets of clinical data provide useful information about HER2 mutations and their potential relevance to antibody therapy resistance.

      2. There is valuable information analyzing the residues within or near the interface between the antigen HER2 and the Pertuzumab antibody (heavy chain). The experimental antibody library screening obtained 90+ clones from 3.86×10¹¹ sequences for further functional validation.

      Weaknesses:

      1. There is a lack of assessment for antibody variant functions in cancer cell phenotypes in vitro (proliferation, cell death, motility) or in vivo (tumor growth and animal survival). The only assay was the western blotting of phosphopho-HER3 in Figure 4. However, HER2 levels and phosphor-HER2 were not analyzed.

      We indeed did not assess the engineered antibodies function in cancer cells. Regarding signaling assessment, previous works [1-3] also measured the signaling activation following HER2-HER3 dimerization by measuring pHER3, and we relied on them in this ms.

      1. There is a misleading impression from the title of computational engineering of a therapeutic antibody and the statement in the abstract "we designed a multi-specific version of Pertuzumab that retains original function while also bindings these HER2 variants" for a few reasons:

      a. The primary method used for variant antibody identification for HER2 mutant binding is rather traditional experimental screening based on yeast display instead of the computational design of a multi-specific version of Pertuzumab.

      b. There is insufficient or lack of computational power in the antibody design or prioritization in choosing variant residues for the library construction of 3.86×10¹¹ sequences. It seems random combinations from 6 residues out of 4 groups with 20 amino acid options.

      c. The final version of the tri-binding variant is a combination of screened antibody clones instead of computation design from scratch.

      d. There is incomplete experimental evidence about the therapeutic values of newly obtained antibody clones.

      Thank you for this relevant comment. When addressing relevant residues to be mutated, the number of potential variants is enormous. The computational approach was aimed at identifying the most preferable residues, in which variation can improve binding and is not likely to harm important interactions. Although an initial smaller number of residues could be chosen, we decided to broaden our view and create a larger library, in the aim of combining the computational selection with an experimental selection. This indeed is not a computational design from scratch, but rather an intercourse between the computer and the lab, that yielded the presented results.

      1. Figures can be improved with better labeling and organization. Some essential pieces of data such as Supplementary Figure 1B on HER2 mutations in S310 that abrogated its binding to Pertuzumab should be placed in the main figures.

      Thank you for this comment, the relevant figures will be moved to the main text, and the labels will be revised.

      1. It is recommended to provide a clear rationale or flowchart overview into the main Figure 1. Figure 2A can be combined with Figure 1 to the list of targeted residues.

      Figures 1 and 2 will be divided differently, and the rationale will be detailed in the revised text.

      1. The quality of Figures such as Figure 2B-C flow data needs to be improved.

      This will be corrected in the revised text.

      1. Diwanji, D., et al., Structures of the HER2-HER3-NRG1β complex reveal a dynamic dimer interface. Nature, 2021. 600(7888): p. 339-343.

      2. Yamashita-Kashima, Y., et al., Mode of action of pertuzumab in combination with trastuzumab plus docetaxel therapy in a HER2-positive breast cancer xenograft model. Oncol Lett, 2017. 14(4): p. 4197-4205.

      3. Kang, J.C., et al., Engineering multivalent antibodies to target heregulin-induced HER3 signaling in breast cancer cells. MAbs, 2014. 6(2): p. 340-53.

    1. Author Response

      The following is the authors’ response to the original reviews.

      Reviewer #1 (Recommendations For The Authors):

      This reviewer found the paper of very high interest, well supported, and well written. I have only a few suggestions to the authors for further improvement:

      1. TRAIL mutants carrying individual mutations of basic residues R119, R122 and K125 were tested, but a TRAIL mutant lacking all three residues was not. This combined mutant protein would have allowed to test whether all heparin binding is abolished (e.g. that no other residues contribute to HS binding) and could have also been used as an independent control replacing heparin and heparinase treatment in binding/apoptosis studies. Given that the DR4/5 and heparin binding sites of TRAIL do not overlap, this form would be useful in determining the extent to which HS contributes to, or serves as a prerequisite for TRAIL binding to its receptor and cell death. Moreover, if bound to the receptor, this mutant TRAIL is expected to completely prevent HS-mediated receptor internalization. The added value of this experiment therefore is that it may provide an answer to the controversial debate on whether DR receptor internalization promotes or inhibits apoptosis.

      In Fig. 5C, we provided data showing that the binding of R115A mutant of hTRAIL (equivalent to murine R199A mutant) to MB-453 cells was very similar to the binding of WT hTRAIL to heparin lyase treated cells. This finding suggests that nearly all HS-dependent binding to cell surface HS was abolished by mutating R115. Since a single mutant is sufficient, we felt there is little point in combining multiple mutations. We also used R115A mutant as an independent control replacing heparin and heparinase treatment in apoptosis assay in Fig. 7E. With regard to using the mutant in the internalization assay, we thank the reviewer for this excellent suggestion and will incorporate it into our future study as we intend to perform more in-depth investigation on the exact mechanism of internalization.

      1. The domain data is interesting, but its physiological significance remains obscure and it also somewhat distracts from the main theme of the study. It may be removed from a revised manuscript.

      We partially agree with the reviewer’s assessment, but we felt that this discovery is of sufficient novelty and should be made known to the whole community.

      1. TUNEL data is shown as a picture in Figure 6, but quantification is lacking.

      We have included the statistics of the TUNEL data in the final version as Fig. 6D.

      1. Is the HS20 antibody a well-suited pan-anti-HS antibody? Why was this antibody used instead of heparinase digestion followed by the use of HS "stub" antibodies that were previously used as a reliable readout for overall sulfation?

      The HS20 mAb has been very well characterized by Dr. Mitchell Ho group (Gao et al., 2016). We have also done side-by-side comparison of HS20 and the most commonly used anti-HS mAb 10E4 by immunostaining and FACS. In nearly all tissues and cells tested, HS20 gave better sensitivity and lower background (after heparin lyase treatment) compared to 10E4. The staining pattern of the two mAbs are usually identical, but the signal/noise ratio of HS20 is much better than 10E4. The HS ”stub” antibody can be useful in certain applications, but it is used mainly as an indicator of the distribution/abundance of HSPGs, rather than a readout of overall sulfation.

      1. The discussion should be stripped from expressions such as interestingly, curiously, unexpectedly, certainly, undoubtedly and the like to improve readability. The manuscript should be checked for typos (for example surface plasma resonance line 473, was served line 481).

      We thank the reviewer for the suggestions and many of these expressions were removed in the final version.

      1. Last but not least: to test the physiological relevance of these findings, it would be of the highest interest to use a mouse model harboring a tumor cell line of choice and derived lines with impaired or increased HS expression, as outlined in my public comments, and to test tumor responsiveness to TRAIL treatment. If already planned, I wish you Good Luck with the experiments!

      We thank the reviewer for this excellent suggestion and we have indeed planned to do exactly that!

      Reviewer #2 (Recommendations For The Authors):

      1. The authors showed in Fig.2 that 12mer HS forms complex with TRAIL homotrimer. Please clarify if 12mer HS binding leads to the formation of the TRAIL homotrimer or TRAIL can form homotrimer in the absence of HS binding. Do the TRAIL mutations that affect HS binding, such as R115A, also impact the homotrimer formation?

      TRAIL automatically forms a homotrimer independent of HS. It is known that formation of the homotrimer critically depends on a zinc ion, which is located on the threefold axis of the trimer and is bound by cysteine 240. We have also verified that all TRAIL mutants remain homotrimeric by size exclusion chromatography.

      1. Does 12mer HS also suppress TRAIL-mediated apoptosis in MDA-MB-453 cells?

      We thank the reviewer for this question but felt performing this experiment will not add any more insight to the main conclusion. Most likely, the result will be similar to what we saw in Fig. 7D, where we found 12mer significantly inhibits TRAIL-induced apoptosis, but inhibits less efficiently compared to heparin.

      1. The authors nicely showed the correlation between surface HS level and sensitivity to TRAIL-induced apoptosis in MM cell lines and implicated that such correlation could be related with the difference in the expression level of SDC1. This is an interesting point worth further validation. Does ectopic SDC1 expression in IM-9 cells lead to increase cell surface HS and sensitivity to TRAIL treatment? On the other hand, will depletion of SDC1 expression in U266 or RPMI8226 cells decrease their sensitivity to TRAIL treatment?

      We agree that this would be an excellent experiment to try and have actually attempted to overexpress SDC1 in IM-9 cells. But we found IM-9 cells are very difficult to transfect and we only managed to convert a small percentage of SDC1 negative cells to positive cells. Also, the level of SDC1 expression on the SDC1-positive cells was not changed after overexpression. We have not tried depleting SDC1 expression in U266 and RPMI8226 cells because such an experiment might change the property of these cells in unexpected ways, which would make result interpretation impossible. A previous report has shown that knocking down SDC1 could enhance clustering of TRAIL receptors in H929 cells (Wu et al., J Immunol 2012;), which actually led to slightly increased apoptosis.

    1. Author Response

      The following is the authors’ response to the original reviews.

      eLife assessment

      This important study extends insights on NAFLD and NASH regarding the role of plasma lactate levels using mice haplo-insufficient for the gene encoding lactate transporter MCT-1. While the evidence is largely convincing and the work significantly advances our understanding of the roles of distinct hepatic cell types in steatosis, a number of issues require attention and would best be solved by further experimentation.

      RESPONSE: We agree with this assessment by eLife, and appreciate the reviewers’ view that the study is important and extends insights into liver disease.

      Public Reviews:

      Reviewer #1 (Public Review):

      The authors put forth the hypothesis that hepatocyte and/or non-parenchymal liver MCT1 may be responsible for physiologic effects (lower body weight gain and less hepatic steatosis) in MCT1 global heterozygote mice. They generate multiple tools to test this hypothesis, which they combine with mouse diets that induce fatty liver, steatohepatitis and fibrosis. Novel findings include that deletion of hepatocyte MCT1 does not change liver lipid content, but increases liver fibrosis. Deletion of hepatic stellate cell (HSC) MCT1 does not substantially affect any liver parameter, but concomitant HSC MCT1 deletion does reverse fibrosis seen with hepatocyte MCT1 knockout or knockdown. In both models, plasma lactate levels do not change, suggesting that liver MCT1 does not substantially affect systemic lactate. In general, the data match the conclusions of the manuscript, and the studies are well-conducted and well-described. Further work would be necessary to dissect mechanism of fibrosis with hepatocyte MCT1, and whether this is due to changes in local lactate (as speculated by the authors) or another MCT1 substrate. This would be important to understand this novel potential cross-talk between hepatocytes and HSCs.

      A parallel and perhaps more important advance is the generation of new methodology to target HSC in mice, using modified siRNA and by transduction of AAV9-Lrat-Cre. Both methods would reduce the need to cross floxed mice with the Lrat-Cre allele, saving time and resources. These tools were validated to an extent by the authors, but not sufficiently to ensure that there is no cross-reactivity with other liver cell types. For example, AAV9-LratCre-transduced MCT1 floxed mice show compelling HSC but not hepatocyte Mct1 knockdown, but other liver cell types should be assessed to ensure specificity. This is particularly important as overall liver Mct1 decreased by ~30% in AAV9-Lrat-Cre-transduced mice, which may exceed HSC content of these mice, especially when considering a 60-70% knockdown efficiency. This same issue also affects Chol-MCT1-siRNA, which the authors demonstrate to affect hepatocytes and HSC, but likely affects other cell types not tested. As this is a new and potentially valuable tool, it would be important to assess Mct1 expression across more non-parenchymal cells (i.e. endothelial, cholangiocytes, immune cells) to determine penetration and efficacy.

      RESPONSE: We appreciate the reviewer’s view that the new methods we describe represent an important advance. To ensure the specificity of our novel AAV-Lrat-Cre construct, it would be fair to test its distribution among all possible hepatic cell types, including endothelial cells, cholangiocytes, and other immune cells, as suggested. Our efforts in this study were primarily focused on the major cell types thought to contribute to NASH, namely hepatocytes, Kupffer cells, and in particular hepatic stellate cells. The reasons for this focus were:

      1) Our primary goal was to investigate the role of MCT1 in hepatic fibrogenesis. According to Manderacke et al. (2013, Nature Comm), hepatic stellate cells account for the dominant proportion (82-96%) of myofibroblast progenitors, which produce collagen fibers. While there may be interesting roles of MCT1 in those other cell types, to elucidate MCT1's role in fibrogenesis, focusing on the dominant fibrogenic cell type, hepatic stellate cells, was the most appropriate approach for this goal.

      2) Considering the proportion of each hepatic cell type in the liver, hepatocytes constitute the majority (60-70%), followed by endothelial cells (15%), immune cells (10%), and stellate cells (5%), among others.

      3) The AAV-Cre system is highly specific to its promoter, in this case, Lrat, which has been well established in multiple previous studies to exhibit high specificity for hepatic stellate cells in the liver. We will certainly conduct more comprehensive biodistribution studies in the future, as we believe that our AAV-Lrat-Cre system could be a valuable tool in this field.

      Reviewer #2 (Public Review):

      In this study, the authors seek to answer two main questions: 1) Whether interfering with lactate availability in hepatocytes through depletion of hepatocyte specific MCT-1 depletion would reduce steatosis, and 2) Whether MCT-1 in stellate cells promote fibrogenesis. While the first question is based on the observation that haploinsufficiency of MCT-1 makes mice resistant to steatosis, the rationale behind how MCT-1 could impact fibrogenesis in stellate cells is not clear. A more detailed discussion regarding how lactate availability would regulate two different processes in two different cell types would be helpful. The authors employ several mouse models and in vitro systems to show that MCT1 inhibition in hepatic stellate cells reduces the expression of COL-1. The significance of the findings is moderately impacted due to the following considerations:

      RESPONSE: We have included additional in vitro data in order to provide a more comprehensive discussion of MCT1's potential role in regulating collagen production. Please refer to the new Figure 8, Supplementary Figure 6, and the results section (Potential Mechanism). Also note that our original hypothesis was that depleting MCT1 specifically in hepatocytes would protect mice with MCT1 haploinsufficiency from liver lactate overload and NAFLD. Furthermore, we postulated that this protection might prevent NASH progression since lipotoxicity-driven hepatocyte damage is a central factor in NASH pathogenesis. However, our findings did not support this hypothesis. We found only one brief article (2015, Z Gastroenterol et al., "Functional effects of monocarboxylate transporter 1 expression in activated hepatic stellate cells") that discussed the potential role of MCT1 depletion in hepatic stellate cells in regulating collagen production or fibrosis, as mentioned in their abstract. Unfortunately, the DOI for this article is not functional, and the data cannot be located. Moreover, when we attempted to replicate their results, we were unable to do so, leading us to report our own findings in the current paper.

      a. Fibrosis in human NAFLD is a significant problem as a predictor of liver related mortality and is associated with type 1 and type 3 collagen. However, the reduction in COL1 in stellate cells did not amount to a reduction in liver fibrosis even in cell specific KO (in Fig 7E, there is no indication of whether Sirius red staining was different between HSC KO and control mice- the authors mention a downward trend in the text). The authors postulate that type 1 COL may not be the more predominant form of fibrosis in the model. This does not seem likely, since the same ob/ob mouse model was used to determine that fibrosis was enhanced with hepatocyte specific MCT-1 KO and decreased with Chol MCT-1KO. Measurements of different types of collagens in their model and the effect of MCT-1 on different types could be more informative. In particular, although collagens are the structural building blocks for hepatic fibrosis, fibrosis can also be controlled by matrix remodeling factors such as Timp1, Serpine 1, PAI-1 and Lox.

      RESPONSE: We monitored the expression levels of matrix remodeling factors, such as Timp1 (Figure 5C, 5F). There was no change in expression upon Chol-MCT1-siRNA treatment, while a significant increase was observed upon GN-MCT1-siRNA treatment. This trend was similar to collagen expression in both cases. Regarding the different types of collagen, instead of measuring each individual type of collagen, we conducted Sirius red and trichrome staining, which enabled us to detect multiple types of collagen simultaneously (Figure 5G, Figure 7D).

      b. The authors use multiple animal models including cell specific KO to conclude that stellate cell MCT-1 inhibition decreases COL-1. However, the mechanisms behind this reduced expression of COL-1 are not discussed or explored, making it descriptive.

      RESPONSE: We agree that the mechanisms involved are not fully defined but have added new data (Figure 8, Supplement Figure 6) and text to discuss possibilities.

      c. Different types of diets are used in this study which could impact lactate availability. Choline deficiency diets are reported to cause weight loss, and importantly have none of the metabolic features of human NASH. Therefore, their utility is doubtful, especially for this study which proposes to investigate if metabolic dysregulation and substrate availability could be a tool for therapy.

      RESPONSE: Unfortunately, none of the rodent models used to study NASH completely replicate the condition in human patients, each having its own set of advantages and drawbacks. In line with the concern raised by reviewer #2, there has been a shift away from the use of severely detrimental methionine and choline-deficient diets in contemporary NASH research. Instead, diets that combine methionine and other amino acids with cholinedeficient diets, in conjunction with high-fat diets, have become more popular. The diet we employed in our study consists of high-fat diet combined with choline-deficient diets. We believe that our findings, which are consistent and established across two distinct NASH pathogenesis models and genetic backgrounds, lend additional robustness to our results.

      d. Hepatocyte specific MCT-1 KO mice seem to have increased COL-1 production, despite no noticeable difference in hepatocyte steatosis. The reasons for this are not discussed. Fibrosis in NASH is thought to be from stellate cell activation secondary to signals from hepatocellular damage. There is no evidence that there was a difference in either of these parameters in the mouse models used.

      RESPONSE: While lipotoxicity-driven liver damage remains a central aspect of NASH pathogenesis, the traditional two-hit theory has become less tractable, giving way to the multi-hit theory in the NASH field. The current debate revolves around whether steatosis is a decisive factor and requirement for NASH fibrogenesis. Our previous publication (Yenilmez et al., 2022, Mol Ther) demonstrated that nearly complete resolution of steatosis did not prevent other NASH features like inflammation and fibrosis, indicating the existence of multiple factors beyond steatosis in NASH pathogenesis. We believe that steatosis and fibrosis influence each other but can also develop independently.

      e. The authors report that serum lactate levels did not rise after MCT-1 silencing, but the reasons behind this are unclear. There is insufficient data about lactate production and utilization in this model, which would be useful to interpret data regarding steatosis and fibrosis development. For example, does the MCT-1 KO prevent hepatocyte and stellate cell net import or export of lactate? What is the downstream metabolic consequence in terms of pyruvate, acetylCoA and the NAD/NADH levels. Does the KO have downstream effects on mitochondrial TCA cycling?

      RESPONSE: Due to both biological and technical challenges (which are described in the new draft), conducting a comprehensive metabolomics study comparing hepatocyte MCT1 KO to hepatic stellate cell MCT1 KO was not feasible. It is important to note that MCT1 can also transport other substrates that are often overlooked, including pyruvate, short-chain fatty acids, and ketone bodies. Also, in addition to MCT1, there are at least two other functional isoforms of MCT: MCT2 and MCT4. Regrettably, due to these biological and technical complications, conducting a comprehensive metabolomic analysis is extremely complicated and difficult to interpret. Nevertheless, some insights are gained from a study involving MCT1 chaperone protein Basigin/CD147 knockout (KO) mice in a high-fat diet- induced hepatic steatosis model. Basigin acts as an auxiliary protein for MCT1, and its absence leads to improper localization and stabilization of MCT1, effectively simulating a state of MCT1 deficiency. In this context, hepatic lactate levels were reduced by half, and other metabolites such as pyruvate, citrate, α-ketoglutarate, fumarate, and malate were significantly decreased. While we must exercise caution when extrapolating these findings to our MCT1 study, they suggest that multiple metabolites, particularly pyruvate, may play a crucial role in the context of MCT1 deficiency.

      f. MCT-1 protein expression is measured only in the in vitro assay. Similar quantitation through western blot is not shown in the animal models.

      RESPONSE: We monitored MCT1 protein expression with either Western blot (Fig 2D, 2E (in vitro)) or immune-histology (Fig 4B, 4C (in vivo, ob/ob + GAN diet NASH model), Sup Fig 5F, 5G (in vivo, MCT1 f/f + CDHFD model)).

      Reviewer #3 (Public Review):

      A major finding of this work is that loss of monocarboxylate transporter 1 (MCT1), specifically in stellate cells, can decrease fibrosis in the liver. However, the underlying mechanism whereby MCT1 influences stellate cells is not addressed. It is unclear if upstream/downstream metabolic flux within different cell types leads to fibrotic outcomes. Ultimately, the paper opens more questions than it answers: why does decreasing MCT1 expression in hepatocytes exacerbate disease, while silencing MCT1 in fibroblasts seems to alleviate collagen deposition? Mechanistic studies in isolated hepatocytes and stellate cells could enhance the work further to show the disparate pathways that mediate these opposing effects. The work highlights the complexity of cellular behavior and metabolism within a disease environment but does little to mechanistically explain it.

      RESPONSE: Described above to Reviewer #2

      The observations presented are compelling and rigorous, but their impact is limited by the nearly complete lack of mechanistic insight presented in the manuscript. As also mentioned elsewhere, it is important to know whether lactate import or export (or the transport of another molecule-like ketone bodies, for example) is the decisive role of MCT1 for this phenotype. Beyond that, it would be interesting, albeit more difficult, to determine how that metabolic change leads to these fibrotic effects.

      RESPONSE: Described above to Reviewer #2

      Kuppfer cells are initially analyzed and targeted. These cells may play a major role in fibrotic response. It will be interesting to determine the effects of lactate metabolism in other cells within the microenvironment, like Kuppfer cells, to gain a complete understanding of how metabolism is altered during fibrotic change.

      RESPONSE: To address the potential involvement of inflammatory cells, we added new data to the manuscript (Supplement Figure 4). Given the distinct hepatic cellular distribution of Chol-MCT1-siRNA and GN-MCT1-siRNA, the opposite fibrogenic phenotype observed may be attributed to MCT1’s role in non-hepatocyte cell types such as the inflammatory Kupffer cells and the fibrogenic hepatic stellate cells. To determine which hepatic cell type drives the opposite fibrotic phenotypes, we first hypothesized that GN-MCT1-siRNA activates M2 pro-fibrogenic macrophages more than Chol-MCT1-siRNA does. The representative M1/ M2 macrophage polarization gene markers were monitored in Kupffer cells. However, GN-MCT1-siRNA treatment caused comparable M1/M2 macrophage activation levels to Chol-MCT1-siRNA treatment (Supplement Figure 4A, 4B). These data suggest that the opposite fibrotic phenotypes caused by the different siRNA constructs are not due to M1/M2 macrophage polarization.

      The timing of MCT1 depletion raises concern, as this is a largely prophylactic experiment, and it remains unclear if altering MCT1 would aid in the regression of established fibrosis. Given the proposal for translation to clinical practice, this will be an important question to answer.

      RESPONSE: Agree these are important experiments for future evaluation.

      Reviewer #1 (Recommendations For The Authors):

      As above, in general, the conclusions match the data presented. The one exception is the authors discussion point that these data show the importance of lactate flux in fibrosis. As MCT1 has other substrates, it does not seem this is definitively due to lactate flux. It would be helpful to have additional experiments to clarify mechanism by which loss of hepatocyte MCT1 leads to increased fibrosis, while loss of HSC MCT1 reverses this finding. This may aid in concluding that altered fibrosis is in fact due to lactate flux in these cell types.

      RESPONSE: Described above to Reviewer #2

      In addition, it is unclear why the authors switched NASH models for the two tools generated (GAN diet for siRNA, CDHFD for AAV). Similarly, methodology to assess fibrosis switched between these two experiments - i.e. Sirius Red staining for siRNA-treated GAN diet-fed mice vs. Trichrome staining for AAV-transduced CDHFD-fed mice. These changes make it difficult to perform cross-comparisons of the data, to explain (for example), why GN-siRNA to Mct1 reduced body weight but AAV8-TBG-Cre did not. Similarly, GN-siRNA increased liver Col1a1 protein but AAV8-TBG-Cre did not. These differences could be explained by model system, or tool efficacy/off-target effects.

      RESPONSE: We agree that different model systems can explain difference in results, but there is also an advantage of using different models and various methodologies as preclinical tests of consistency of data on NASH under different conditions. There are no perfect mouse models for human NASH.

      • Phenotyping is also incomplete for the latter experiment, in particular amount of liver lipid content –

      RESPONSE: We estimated lipid content by H&E (Fig 6E, F). In some experiments, we focused mostly on COL1 protein expression, as this rather than mRNA is the functional aspect of fibrosis.

      Reviewer #2 (Recommendations For The Authors):

      This study could benefit from standardization of the types of diet used across all animal models and a more comprehensive focus on the metabolic/substrate availability and utilization aspects of NAFLD and NASH affected in the mouse models with MCT-1 dependent lactate transport deficiency. Since hepatic fibrogenesis in NASH is impacted by signals following hepatocyte damage, the extent of cell death in these models could also be better characterized.

      RESPONSE: Our ALT data provides indirect insight into hepatocyte damage. Our histology images did not reveal significant changes in cell morphology or integrity and there were no notable changes in caspase protein levels.

      Other comments:

      In Fig 4G, there is an increase in the number of lipid droplets with Chol- MCT-1 siRNA compared to GN-MCT1-sirRNA, suggesting that the stellate cell component might be responsible for this finding. The possible reasons for this are not discussed.

      RESPONSE: The effects in Fig 4G were exceedingly small and there is no difference in total TG in these experiments, so it is hard to interpret these data and provide logical explanations.

      In Fig 5A. A western Blot for aSMA and COL 1 is shown but the sample labeling is unclear i.e, do the lanes belong to different mice of the same condition? HFD mice vs Ctr mice?

      RESPONSE: Both groups of ob/ob mice were fed a GAN diet. The graph in Fig 5 is a direct comparison between NTC-siRNA and MCT1-siRNA. To enhance clarity, this is indicated in the figure legends, and the data in Fig 5 is a continuation of the data presented in Fig 4

      In Fig 5E, COL1 densitometry data should also be provided for non-silenced mice on HFD and Chow diet for appropriate comparison

      RES\PONSE: Both groups of ob/ob mice were fed a GAN diet. The graph in Fig 5 represents a comparison between NTC-siRNA and MCT1-siRNA. It's important to note that, typically, ob/ob mice fed either a chow diet or a high-fat diet do not exhibit fibrogenic phenotypes within this time frame (3 weeks of dietary intervention).

      There are many mis-statements throughout the text.Page 6 - "MCT1 silencing significantly inhibited Tgf1β-stimulated ACTA2 mRNA expression as well as collagen 1 protein production" but it is not stated that CO1A1 mRNA is unchanged in Fig 1C.

      RESPONSE: We observed no change in CO1A1 mRNA levels (Fig 1C), so we focused on collagen 1 protein production (Fig 1B) on page 6. Given the consistent trend observed in Chol-MCT1-siRNA (Fig 5C), we proposed the possibility of MCT1's influence on collagen translation or protein turnover on page 11.

      Page 7- ".......our Chol-MCT1-siRNA does not require transfection reagents as it is fully chemically modified". What does fully chemically modified mean and why does this mean in terms of transfection efficiency.

      RESPONSE: One of the primary challenges in utilizing RNAi as a therapeutic approach has been the effective in vivo delivery strategy, particularly concerning stability and longevity against systemic nucleases. Recent developments in siRNA duplex chemical modification strategies, such as 2-Fluoro and 2-O-Methyl ribose substitutions, as well as phosphorothioate backbone replacements, have addressed these challenges (Please see Figure 3. In our current study, we employed 'chemically fully modified' siRNA, featuring several key modifications: (1) every single ribose is chemically modified to 2-F or 2-OMeribose, (2) phosphorothioate backbone replacement, (3) 5'-end of the antisense strand modification to (E)-Vinyl-phosphonate, and (4) 3'-end of the sense strand linkers such as Cholesterol or Tri-N-Acetyl-galactosamine. These chemical enhancements significantly improve transfection efficiency, longevity, and selectivity, setting it apart from traditional siRNA lacking such chemical modifications. A prior study from the Khvorova lab has demonstrated substantial efficiency differences between partially and fully modified siRNA in vivo.

      Page 7- the results present for Fig 2 ignores Fig, 2C, if this is important it needs to be described if not, please delete.

      RESPONSE: The dose-response potency results, crucial for identifying the most potent Chol-MCT1-siRNA compound, are depicted in Figure 2C. The wording "(Figure 2C)" has been inserted in the sentence as follows. “The silencing effect on Mct1 mRNA was monitored after 72 hours (Figure 2B). Several compounds elicited a silencing effect greater than 80% compared to the NTC-siRNA. The two most potent Chol-MCT1-siRNA, Chol- MCT1-2060 (IC50: 59.6nM, KD%: 87.2), and Chol-MCT1-3160 (IC50: 32.4nM, KD%: 87.7) (Figure 2C) were evaluated for their inhibitory effect on MCT1 protein levels (Figure 2D, 2E). Based on its IC50 value and silencing potency, Chol-MCT1-3160 construct was chosen for further studies in vivo (Table 2).”

      Supplement Fig 1A-F should be analyzed by multiple comparisons not by paired t-tests.

      RESPONSE: We performed t-tests for every comparison between two groups. However, for Sup Fig 1A-F, which involved a comparison among three different groups, we applied oneway ANOVA.

      The x-axis in supplement Fig 2A and B are not labeled, and I assume are in weeks. The Fig 2B x-axis numbers also mis-labeled and should also be 0-3 and not 10-13.

      RESPONSE: The x-axis is now appropriately labeled.

      Page 10 - the description of supplement Fig 4A is not accurate. Srebf1 mRNA is unchanged by the GN-MCT1-siRNA treatment and Mlxipl mRNA is unchanged by Chol-MCT1-siRNA treatment. Is this total Mlxipl mRNA or can you distinguish between the alpha and beta variants.

      RESPONSE: We adhered to NCBI nomenclature, where 'SREBP1' and 'ChREBP' represent proteins, not mRNA. The Mlxipl mRNA we tested pertains to total Mlxipl mRNA. Original draft shown below.

      “To investigate the underlying mechanism by which lipid droplet morphological dynamics change, we monitored the effect of hepatic MCT1 depletion on DNL-related gene expression. Both GN-MCT1-siRNA and Chol-MCT1-siRNA strongly decreased the mRNA and protein levels related to representative DNL genes (Supplement Figure 4A-4D). Intriguingly, both modes of hepatic MCT1 depletion also inhibited expression of the upstream regulatory transcription factors SREBP1 and ChREBP.”

      There are no molecular weight markers in supplement Fig 4C and D. Is the Srebp1c blot for the nuclear or precursor form?

      RESPONSE: The Srebp1c blot presented represents the precursor form. I have edited the figure legend accordingly. It's worth noting that the cleaved form of Srebp1c either exhibited significantly lower expression compared to its precursor form or displayed comparable expression between the control group and the MCT1 depletion group.

      Changes in mRNA and protein do not always reflect changes in activity (allosteric regulation). If you want to draw any conclusions about de novo lipogenesis you need to directly measure fatty acid synthesis rates from a carbohydrate precursor.

      RESPONSE: We completely agree. Therefore, in the current study, we emphasized two key points: (1) hepatic MCT1 depletion affects the expression levels of representative DNL genes, and (2) however, this regulation was insufficient to resolve the steatosis phenotypes in our NASH model. We have added the text “while recognizing that the decreased expression of DNL genes does not necessarily indicate inhibited fatty acid synthesis rate” on page 15.

      Reviewer #3 (Recommendations For The Authors):

      Figure 1 - Are there changes to fibroblast phenotype with TGF-beta stimulation and are these changes reversed with MCT1 siRNA-mediated silencing, or is this purely an expression phenomenon?

      RESPONSE: This study was designed to assess the preventative effect of MCT1 silencing on Tgf1β-induced fibrosis, rather than a reversal study. As detailed in the methods section, LX2 cells were initially cultured in DMEM/high glucose media with 2% FBS. The following day, we transfected the cells with either NTC-siRNA or MCT1-siRNA (IDT, cat 308915476) using Lipofectamine RNAi Max (ThermoFisher, cat 13778075) for 6 hours in serum-reduced Opti-MEM media (ThermoFisher, cat 31985062). Subsequently, the cells were maintained in serum-starved media, with or without 10ng/ml of recombinant human Tgf1β (R&D Systems, cat 240-B/CF), for 48 hours before harvesting.

      Is lactate import/export itself responsible for this phenotype? It is presumed that MCT1 depletion alters import/export of lactate and subsequently modulates this phenotype, but this is never shown experimentally. Does lactate accumulate in these cells or in the medium in culture? The foundation of the paper rests on this hypothesis, so we believe that this is critical to establish. This is particularly relevant as MCT1 has been proposed to function primarily as a lactate importer, so the availability of medium lactate could be easily modulated to determine whether that mimics MCT1 loss.

      RESPONSE: To address the underlying mechanism of MCT1/Lactate in stellate cells, we added a new figure to the manuscript (Figure 8). We had previously conducted an experiment to determine whether MCT1 depletion in LX2 cells in vitro influences extracellular lactate concentrations in DMEM/high glucose (25mM glucose) media supplemented with 1mM sodium pyruvate but without sodium lactate. Interestingly, we found no significant difference in extracellular glucose and lactate concentrations, which remained at 25mM and 5mM, respectively. These concentrations were comparable between groups, regardless of MCT1 loss. Additionally, we investigated the effects of MCT1 silencing in the presence of potent fibrogenic inducer TGF-β1. Intriguingly, MCT1 depletion effectively prevented TGF-β1-induced collagen production, irrespective of lactate (+/- pyruvate) supply in the media. LX2 cells with MCT1 depletion exhibited reduced collagen 1 production when lactate was solely generated by endogenous glycolysis (Figure 8F) and when exogenous lactate was supplied (Figure 8G).

      Figure 2 - It is compelling that the Chol-MCT1-siRNA compounds are effective at targeting MCT1. However, is it clear how specific the siRNA target is? Are other MCT genes affected as well (if the siRNAs target areas of homology, for example)? Given that this siRNA strategy is used going forward and proposed as a therapeutic, it would be important to discuss and perhaps characterize off-target effects. A simple BLAST search for homology for the chosen siRNAs could help answer this question.

      RESPONSE:

      1) We designed the siRNA to specifically avoid any potential off-target effects on MCT1's 14 isoforms, and this approach aligns with the results obtained from the NCBI-BLAST analysis.

      2) While there are 14 isoforms of MCTs, only the first four are functional. To assess the off-target effect of Chol-MCT1-siRNA on MCT2 and MCT4 (MCT3 was excluded due to its limited expression in retinal pigment epithelium), we conducted in vivo experiments in ob/ob mice, which demonstrated a highly selective MCT1 silencing effect. We have also included MCT1, MCT2, and MCT4 rt-qPCR data in the manuscript (Supplement Figure 2A, 2B).

      3) We plan to further optimize and validate the human MCT1-targeting siRNA sequence for use in humanized mouse studies. It's important to note that the MCT1-siRNA used in this study was designed for mice.

      Supplemental Figure 1 - brain would be one other highly metabolic tissue wherein it would be important to show lack of activity/accumulation.

      RESPONSE: Undoubtedly, the brain is one of the most metabolically active tissues, playing a pivotal role in regulating signaling pathways and metabolism in other tissues. However, it poses a significant challenge in terms of targeting due to the presence of the blood-brain barrier (BBB). Overcoming BBB penetration remains one of the foremost challenges in the field of therapeutic siRNA delivery. For many therapeutic oligonucleotides, including Cholesterol-conjugated siRNAs, systemic administration alone is normally insufficient to achieve BBB penetration. Direct local injection or transient disruption of the BBB is normally required.

      Figure 4 - The image shown for chol-MCT1-siRNA seems to show variation in lipid droplet size. Is this just this single image? The authors quantify smaller lipid droplets in this group, so the image may not be representative as there are many large droplets. Ultimately, additional mechanisms as to how alterations in lactate metabolism could mediate this phenotype are missing. This hypothesis also rests upon the assumption that MCT1 is modulating lactate, which is not shown experimentally, as discussed above.

      RESPONSE: We changed the representative images (Fig 4B). We agree this aspect of the study is not resolved, and we have related text in the manuscript on this point: “neither GNMCT1-siRNA nor Chol-MCT1-siRNA decreased total hepatic TG levels (Figure 4H), although quantitative analysis of H&E images showed a small decrease in mean lipid droplet size and increased number of lipid droplets upon MCT1 silencing (Figure 4F, 4G). These data suggest the possibility that hepatic MCT1 depletion either 1) inhibits formation or fusion of lipid droplets, or 2) enhances lipolysis to diminish lipid droplet size.”

      Figure 5 provides evidence that Chol-MCT1-siRNA expression decreases fibrosis but this is attributed to the effects on stellate cells. While GN-MCT1-siRNA and subsequent MCT1 silencing in hepatocytes has an opposite effect. The cell population that is not discussed, however, is the Kupffer cell. Could MCT1 silencing in this cell population be mediating part of the phenotype observed? How does MCT1 silencing affect Kupffer cell phenotype and activity?

      This extends into Figure 6 where Kupffer cells are not given consideration in targeted experiments.

      RESPONSE: Described above to Reviewer #3

      Figure 6 and 7 use a different model to show that stellate cell depletion of MCT1, specifically, decreases collagen 1 protein levels in NASH, which reinforces the authors claims. Given the cell specificity of this experiment, it is more compelling data. It would be nice to show that Kupffer cell depletion of MCT1 does not have any affect (or perhaps show that it does.

      RESPONSE: We agree, but Kupffer selective depletion is not possible to do with this siRNA technology. Please see the response above as our most recent attempt to address this question.

      Figure 7 shows that even with decreased collagen deposition, there is no effect on liver stiffness or chronic liver injury as measure by ALT. This may suggest that the decreased level of fibrosis is either not significant to overall clinical outcome or that there are other fibroinflammatory mechanisms compensating for lack of COL1 deposition. Is there increased reticulin fibrosis when MCT1 is knocked down? This could be assessed with IHC or monitoring type 3 collogen (COL3A1).

      RESPONSE: Reticulin fibrosis results from the excessive deposition of reticular fibers, primarily composed of type 3 collagen. However, based on our observation of trichrome staining in whole liver histology data (Fig 7D-E), which exhibited nearly identical trends to collagen type 1 expression (Fig 7A-C), it seems unlikely that type 3 collagen compensated for the decrease in type 1 collagen protein expression upon hepatic stellate cell MCT1 KO. We plan to perform detailed analysis of a more comprehensive list of ECM proteins including type 3 collagen in our humanized mouse model with engrafted human liver cells in future experiments.

      Additional considerations:

      It may be useful to know if inhibition of fibrosis affects survival/progression in these NASH models over a longer timeframe, although this may understandably be beyond the scope of the current work. The timing of MCT1 depletion is prophylactic and given the proposal to translate this research, it would be important to determine whether MCT1 inhibition reversed fibrosis, and if so, by what metabolic mechanism?

      RESPONSE: We have observed that extending the duration of the NASH model increases the likelihood of hepatocarcinoma development. Exploring the aim to include survival and disease progression as well as reversal of fibrosis would be important in future experiments.

      Summary of new Figures and Figures modified:

      • Fig 1B: added "and" (significance) between the first and the third group, and the second and the last group.

      • Fig 4B: replaced images with more representative ones as the mean lipid size was questioned by the reviewer.

      • Fig 7D: made the images bigger (original images cropped and enlarged → 5X)

      • Fig 8: newly created to explain the underlying pathway of lactate, and MCT1 regulating collagen production. Please find the results sections.

      • Sup fig 2A, B: newly added to show our compounds’ selective silencing effect. - Sup Fig 2C-D: Added missing x-axis (moved from previous Figure 2A, 2B) - Sup Fig 2E-F: moved from sup Fig 3 not to have too many sup figures.

      • Sup Fig 3C-D: showed both precursor and cleaved form of SREBP1 bands as requested (moved from previous sup Figure 4)

      • Sup Fig 4: newly created, as questioned many times for the effect on Kupffer cells or other inflammatory cells.

      • Sup Fig 6: newly created to explain the potential underlying mechanism of MCT1 depletion on collagen production.

      • Sup Fig 7: moved from previous sup Fig 6.

      • Sup Fig 8: moved from previous sup Fig 7.

    1. Author Response

      The following is the authors’ response to the previous reviews.

      Public Reviews:

      Reviewer #1 (Public Review):

      The authors have previously employed micrococcal nuclease tethered to various Mcm subunits to the cut DNA to which the Mcm2-7 double hexamers (DH) bind. Using this assay, they found that Mcm2-7 DH are located on many more sites in the S. cerevisiae genome than previously shown. They then demonstrated that these sites have characteristics consistent with origins of DNA replication, including the presence of ARS consensus sequences, the location of very inefficient sites of initiation of DNA replication in vivo, and for the most part are free of nucleosomes. They contain a G-C skew and they locate to intergenic regions of the genome. The authors suggest, consistent with published single molecule results, that there are many more potential origins in the S. cerevisiae genome than previously annotated, but also conclude that many of the newly discovered Mcm2-7 DH are very infrequently used as active origins of DNA replication.

      The results are convincing and are consistent with prior observations. The analysis of the origin associated features is informative.

      Specific Comments:

      1. Page 8. The addition of an estimate of the most active origins using Southern blotting is fine for highly active origins, but how was Southern blotting used to calculate that 1-2% of cells in the eight cohort have an Mcm complex loaded.

      We used a combination of Southern blotting and qPCR to measure licensing at the most active origins and then used our abundance curve to extrapolate these values to the less abundant cohorts. We expand on this point below, and we have changed the text to clarify this issue.

      Reviewer #3 (Public Review):

      By mapping the sites of the Mcm2-7 replicative helicase loading across the budding yeast genome using highresolution chromatin endogenous cleavage or ChEC, Bedalov and colleagues find that these markers for origins of DNA replication are much more broadly distributed than previously appreciated. Interestingly, this is consistent with early reconstituted biochemical studies that showed that the ACS was not essential for helicase loading in vitro (e.g. Remus et al., 2009, PMID: 19896182). To accomplish this, they combined the results of 12 independent assays to gain exceptionally deep coverage of Mcm2-7 binding sites. By comparing these sites to previous studies mapping ssDNA generated during replication initiation, they provide evidence that at least a fraction of the 1600 most robustly Mcm2-7-bound sequences act as origins. A weakness of the paper is that the group-based (as opposed to analyzing individual Mcm2-7 binding sites) nature of the analysis prevents the authors from concluding that all of the 1,600 sites mentioned in the title act as origins. The authors also show that the location of Mcm2-7 location after loading are highly similar in the top 500 binding sites, although the mobile nature of loaded Mcm2-7 double hexamers prevents any conclusions about the location of initial loading. Interestingly, by comparing subsets of the Mcm2-7 binding sites, they find that there is a propensity of at least a subset of these sites to be nucleosome depleted, to overlap with at least a partial match to the ACS sequence (found at all of the most well-characterized budding yeast origins), and a GC-skew centered around the site of Mcm loading. Each of these characteristics is related to previously characterized S. cerevisiae origins of replication.

      Overall, this manuscript greatly broadens the number of sites that are capable of loading Mcm2-7 in budding yeast cells and shows that a subset of these additional sites act as replication origins. Although these studies show that the sequence specificity of S. cerevisiae replication origins still sets it apart from metazoan origins, the ability to license and initiate replication from sites with increasing sequence divergence suggests a previously unappreciated versatility.

      Specific points:

      1. The authors need to come up with a consistent name for loaded Mcms at an origin. In the manuscript they variously use 'MCM'(page 3), 'Mcm complexes' (page 4), 'MCM double hexamer' (page 6), and 'double-helicase' (page 8) to describe the Mcm2-7 complexes detected in their ChEC experiments. They should pick one name (Mcm2-7 double hexamer or MCM double hexamer would be the most accurate and clear) and stick with it throughout the manuscript.
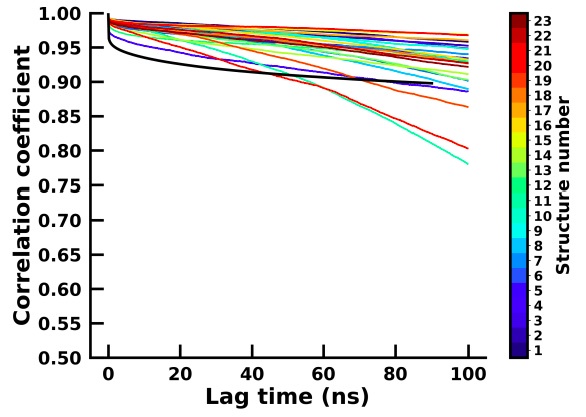
      We appreciate the criticism and agree that consistency is important for clarity, thus we tried using the term "Mcm2-7 double hexamer" in every instance in which we refer to Mcm loaded at an origin. However, upon reading the resulting manuscript, we felt that these changes hurt readability more than they helped with clarity, so we left the manuscript in its original form.

      1. The authors state that "It is notable that, when Mcm is present, it is present predominantly as a single doublehexamer (right panel of Figure 3A), and that this remains true across the entire range of abundance shown in Figure 3A." This statement would be improved by prefacing it with "Based on the size of the protected regions" or some other clarifying statement that lets the reader know what they should be looking for in the data in 3A.


      We thank the reviewer for the helpful suggestion. We have added the underlined words to the text to clarify this point.

      It is notable that, when Mcm is present, it is present predominantly as a single doublehexamer (based on the size of the protected region in the right panel of Figure 3A), and that this remains true across the enAre range of abundance shown in Figure 3A.

      1. The revised statements that "We have previously used Southern blotting to demonstrate that approximately 90% of the DNA at one of the most active known origins (ARS1103) is cut by Mcm-MNase (Foss et al., 2021), and to thereby infer that 90% of cells have a double- helicase loaded at this origin. Using this as a benchmark, we estimate that ~1-2% cells have an Mcm complex loaded at the Mcm binding sites in the eighth cohort (ranks 1401- 1600)." partially clarifies how the authors came to the 1-2% number, however, the calculation is still unclear. Based on Figure 1A, there are at least three logs (1,00 fold) difference in the number of CBMSs between the best origins (which is what they state the 90% comes from) to anywhere close to the 1400-1600 rank. Seems like the number should be at best 0.1% and probably less. Either way, the authors need to explain this calculation either in the text or in the text. This sort of number tends to get thrown around later and without a clear explanation readers cannot evaluate its credibility. 
<br /> We apologize for insufficiently clarifying how we arrived at our estimate of licensing. We believe that we have now remedied this, both by incorporating more measurements of licensing to improve our accuracy and by expanding the text to make our calculation unambiguous. We have added a supplemental figure showing the linear regression, based on 7 qPCR-based measurements of licensing, that we used to determine the median level of licensing of the first cohort of 200, and the altered text in the main text reads as follows:

      We have previously used Southern blotting to demonstrate that approximately 90% of the DNA at one of the most active known origins (ARS1103) is cut by Mcm-MNase (Foss et al. 2021), and to thereby infer that 90% of cells have a double-helicase loaded at this origin. Combining this measurement with 6 additional measurements of licensing in cohort 1, we used linear regression (r2=0.7) to infer a median value of 69% for cohort 1. Because the median abundance in the 8th cohort is 1.5% of that in the first cohort, we estimate that CMBSs in the 8th cohort are typically licensed in 1% of cells in the population (69% x 0.015 = 1.0%).

      1. The authors make the point in the introduction and discussion that recent single-molecule studies of replication origins indicate that as many as 20% of the origins identified are outside of known origins. This is very interesting but there seems to be a missed opportunity of comparing the location of these origins with the CBMSs. It would improve the manuscript to include some sort of comparison rather than using only the much older and less accurate ssDNA analysis.

      Unfortunately, coverage and resolution with nanopore-based single-molecule precludes such an analysis.

      1. The authors state at the end of the first paragraph on page 6 that the ChEC data is "very reproducible" which does seem to be the case but it is a little confusing for the knowledgeable reader since one would expect quite different results for an HU arrested strain versus a asynchronous or G1 arrested strain. This is hidden in the analysis in Figure S1 since 13 experiments are compared against one in each plot, however, if one x one comparisons were done there would certainly be substantial differences (or if there are not, there is a problem with the data - e.g. HU arrested cells should lack licensing at early firing origins).

      It may appear counterintuiAve that one could obtain high r2 values when comparing G1 and HU-arrested samples. However, HU arrest was performed by transferring log phase cultures to 200 mM HU and harvesting cells after just 50 minutes. In this situation, most cells will be in G1 or very early S phase. Presumably, increasing times of incubation in HU would cause r2 values to decline.

      1. On page 8 the authors state, "First, clear peaks of ssDNA extend down to the eighth cohort..." This seems to be stretching the data. There are clear peaks for the first five cohorts and then there is a notable change with any peak being much broader, extending over at least 10,000 bp. The authors should reconsider their statement here as it is not well supported by the data.

      We have softened our language to the following: First, peaks of ssDNA signal, as judged by higher signal at the midpoints than the edges, extend down to the eighth cohort (brown line), which corresponds to CMBSs ranked 1401-1600.

      1. There is one last missing reference. Wherever Eaton et al, 2010 is referenced Berbenetz, et al, 2010 (full ref below) should also be referenced as they come to very similar conclusions.

      Berbenetz, N. M., Nislow, C. & Brown, G. W. Diversity of eukaryotic DNA replication origins revealed by genome-wide analysis of chromatin structure. PLoS Genet 6, (2010).

      We have added this reference at all 4 instances in which we reference Eaton et al., 2010.

      Recommendations for the authors:

      Reviewer #3 (Recommendations For The Authors):

      There are missing references in several places:

      All references are included, and the references in point 3 have been split according to the reviewer's suggestion.

      1. "For example, 15 of the 56 genes that contained a high abundance site have been implicated in meiosis and sporulation and are not expressed during vegetative growth (~5 out of 56 expected from random sampling), consistent with previous observations (Mori and Shirahige, 2007)." Should include Blitzblau et al., 2012 (PMC3355065) which showed that Mcm2-7 loading was impacted by differences in meiotic and mitotic transcription.

      2. "In contrast to the low abundance sites, the most abundant 500 sites showed a preference for convergent over divergent transcription (left of vertical dotted line in Figure 4B), in agreement with a previous report (Li et al., 2014)." This preference was first pointed out in MacAlpine and Bell, 2005 (PMID: 15868424).

      3. "This sequence is recognized by the Origin Recognition Complex (Orc), a 6-protein complex that loads MCM (Broach et al., 1983; Deshpande and Newlon, 1992; Eaton et al., 2010; Kearsey, 1984; Newlon and Theis, 1993; Singh and Krishnamachari, 2016; Srienc et al., 1985)." This list should include a reference to Bell and Stillman, 1992 (PMID: 1579162), which first described ORC and showed that it recognized the ACS. It would also be more helpful to the reviewer to distinguish the references that identified that ACS from those concerning ORC binding to it.

    1. Author Response

      The following is the authors’ response to the previous reviews.

      On behalf of all the authors, I'd like to thank you for your insightful comments and valuable suggestions, which fully reflect your high level of scientific thinking and point the direction of our research and help us and other future researchers in the field to more comprehensively study and interpret the toxic effects of imidacloprid on honey bee larvae and its potential mechanisms, as well as the mechanisms of larval resistance and adaptations to imidacloprid. We have addressed each of the questions and revised the manuscript point-by-point in response to your comments. Below are detailed point-by-point responses to each question.

      Public Review:

      This study provides evidence of the ability of sublethal imidacloprid doses to affect growth and development of honeybee larva. While checking the effect of doses that do not impact survival or food intake, the authors found changes in the expression of genes related to energy metabolism, antioxidant response, and metabolism of xenobiotics. The authors also identified cell death in the alimentary canal, and disturbances in levels of ROS markers, molting hormones, weight and growth ratio. The study strengths come from exploring different aspects and impacts of imidacloprid exposure on honeybee juvenile stages and for that it demonstrates potential for assessing the risks posed by pesticides. The study weaknesses come from the lack of in depth investigation and an incomplete methodological design. For instance, many of the study conclusions are based on RT-qPCR, which show only a partial snapshot of gene expression, which was performed at a single time point and using whole larvae. There is no understanding of how different organs/tissues might respond to exposure and how they change over time. That creates a problem to understand the mechanisms of damage caused by the pesticide in the situation studied here. There is no investigation of what happens after pupation. The authors show that the doses tested have no impact on survival, food consumption and time to pupation, and the growth index drops from ~0.96 to ~0.92 in exposed larvae, raising the question of its biological significance. The origin of ROS are not investigated, nor do the authors investigate if the larvae recover from the damage observed in the gut after pupation. That is important as it could affect the adult workers' health. One of the study's central claims is that the reduced growth index is due to the extra energy used to overexpress P450s and antioxidant enzymes, but that is based on RT-qPCR only. Other options are not well explored and whether the gut damage could be causing nutrient absorption problems, or the oxidative stress could be impairing mitochondrial energy production is not investigated. These alternatives may also affect the growth index. The authors also state that the honeybee larvae has 7 instars, which is an incorrect as Apis mellifera have 5 larval instars. It is not clear from methods which precise stage of larval development was used for gut preparations. That information is important because prior to pupation larvae defecate and undergo shedding of gut lining. That could profoundly affect some of the results in case gut preparations for microscopy were made close to this stage. A more in-depth investigation and more complete methodological design that investigates the mechanisms of damage and whether the exposures tested could affect adult bees may demonstrate the damage of low insecticide doses to a vital pollinator insect species.

      Recommendations for the authors:

      This study presents a useful investigation on changes in gene expression by real time PCR and some of the physiological consequences of sublethal exposures to the neonicotinoid insecticide imidacloprid in honeybee larvae. It offers preliminary evidence of imidacloprid impacts on the development of bee larvae by interfering with molting and metabolism. Whereas the study provides evidence that small doses of imidacloprid affect larval growth rate, there is no investigation on whether that could affect the overall colony health, and some of the results open the possibility that the larvae may overcome some of the impacts of the exposure. As the authors state, the doses tested show no impact on larvae survival, food consumption or time to pupation. The investigation and methodological design lack in depth to explain the findings and provide incomplete evidence to support the authors conclusions. The study would benefit from a more thorough mechanistic characterization to better sustain the findings and demonstrate their biological relevance.

      Response: I would like to express, on behalf of all the authors, our sincere appreciation for your insightful and insightful comments and suggestions, which significantly enhanced the quality of the manuscript. Your incisive insights point the way for future research in the field of bee biology on the mechanisms underlying imidacloprid-induced delays in larval development.

      In this study, we investigated the effects of imidacloprid on honey bee larval development, including macro and micro changes and possible causes. This is the first of its kind in the field of honeybee biology research. However, we found that the underlying mechanism is extremely complex. The effects of toxic substances on animals and their interactions with larval development are complex and far-reaching. They include oxidative stress and damage; disruption of nutrient metabolic homeostasis; inhibition of detoxification and immunity; adverse effects on the nervous, circulatory, and digestive systems; inflammation, disease, and even organ failure; and subsequent effects on physiological activities such as development, reproduction, and behavior, and even death. These toxic effects interact in complex ways with the development of young animals, with some effects directly or indirectly affecting development while others do not.

      Addressing this complex mechanistic issue based solely on the results of this study is a formidable challenge, which leads to some limitations of our study as pointed out by the reviewers. Although our study is not comprehensive enough in terms of mechanistic analysis and does not fully elucidate the mechanism, we believe it is an important and valuable first step in this area.

      In the future, we will follow the reviewers' suggestions and deliberately redesign the experiments to focus on further research on the issues they raised. These include examining the effects of larval developmental delay on adult and colony health, investigating the post-pupal situation, identifying the source of ROS, and determining whether the larval gut damage observed after pupalization recovers.

      In accordance with the reviewers' comments and suggestions, we have revised the manuscript to improve its rigor and scientific quality. We sincerely ask the reviewers to understand and accept this modification from us!

      Next is our response to each of the questions and valuable suggestions provided by reviewers:

      Recommendations For The Authors:

      1. The authors found a reduction in growth index and body mass, but document no impact on survival, food consumption or time to pupariation. How much exactly is the reduction in growth index? It seems to be from ~0.96 to ~0.93. Is this biologically relevant? Would that be enough to impact the colony health?

      Response: Thank you for your comments. In this study, we observed a gradual decrease in larval growth index from day 4, which stabilized by day 6. At the 4th, 5th and 6th instars, the growth index of the imidacloprid-treated groups were significantly lower than those of the control group by an average of 1.35%, 4.49% and 2.76%, respectively (Figure 1, source data 8). Statistical analysis confirmed the significance of the difference in these results. We have incorporated the above description into the red text on lines 148-152 of the Results section. Regarding the reviewer's inquiry on colony health, including imidacloprid-induced delayed larval development and some reduction in growth index and body weight with no effect on survival, food consumption, or time develop to pupation, because we do not currently have the technical capabilities to culture larvae to adulthood in laboratory incubators, this has resulted in a failure to further investigate the effects of imidacloprid-induced delayed larval development on adult colony health. However, this is a very important scientific question for future colony health. We will design experiments to address this issue in a follow-up study.

      1. The authors find that P450s can help in detoxifying mechanisms to mitigate imidacloprid impacts. That however is a well-known fact. What is new about this claim?

      Response: The point at which the ability to detoxify toxic substances is acquired during early development varies widely among animals. Although many studies have reported that the detoxification function of P450s helps mitigate the effects of imidacloprid in adult honey bees, there is no conclusive evidence as to whether or not honey bee larvae have acquired this ability at early stages of development. This ability is critical to the defense and health of honey bee larvae. Therefore, it is incumbent upon this study to clarify this issue, which is important in explaining the effects of imidacloprid on honey bee larvae.

      1. Some references are cited incorrectly. The first and last name are swapped, for instance Charles et al.

      Response: Thank you very much for pointing out this error, which we have corrected. Please see lines 92 and 889 in our revised version.

      1. I still encounter important methodological flaws. The authors acknowledge my previous suggestions but only address a small fraction of them. The most relevant points regarding the understanding of the mechanisms behind the delayed growth rate remain unexplored. The expression levels of other nAChRs target of imidacloprid in honeybees were not investigated. The expression analyses are still based on a single time point and using whole larvae, which only superficially explore the problem and may lead to misinterpretations. I do not understand the authors claim that a technological breakthrough is required to address these issues, when performing more PCRs and doing dissections should cover the matter.

      Response: Thank you very much for your important comment. You point out several unexplored issues related to understanding the mechanisms behind delayed growth rates. For example, The most relevant points regarding the understanding of the mechanisms behind the delayed growth rate remain unexplored. The expression levels of other nAChRs target of imidacloprid in honeybees were not investigated. The expression analyses are still based on a single time point and using whole larvae. Please allow me to explain. Honeybees (Apis mellifera) have nine different α-subunits, Amelα1-9, and two β-subunits, Amelβ1-2. Amelα5, Amelα7, and Amelα8 are expressed in MB Kenyon cells and AL neurons, and the Amelβ2 subunit is present in Kenyon cells. Amelα2, Amelα3, and Amelα7-2 are expressed in the optic lobes. The aim of this study was to investigate whether imidacloprid induces larval neurotoxicity. Based on the above information, we selected the two most representative nAChRs (Alph1 and Alph2) for analysis. The results showed that exposure to imidacloprid increased the expression of the Alph2 gene and inhibited AChE activity, indicating that imidacloprid is neurotoxic to larvae. This result answered our question of whether imidacloprid induces neurotoxicity in larvae. Therefore, we did not further analyze the expression levels of other nAChRs. We believe that this does not affect the understanding of the mechanism behind the delayed growth rate and that it is not necessarily necessary to analyze all 11 nAChRs to find an answer. We sincerely hope that the reviewers will understand and agree with this.

      Furthermore, regarding the expression analysis based on a single time point and whole larvae. In this study, 72 h after imidacloprid exposure Fig. 1J, 5 days of age) was chosen for sampling because this is when imidacloprid has the greatest and most representative effect on larval development. Therefore, analyzing samples at this time point did not interfere with our exploration of the mechanisms by which imidacloprid causes larval developmental retardation. We used whole larvae rather than individual tissues for sample selection, which is a shortcoming for us. This was mainly due to technical challenges where we were unable to obtain pure single tissues through dissection. Nevertheless, we will make technical breakthroughs in the future so that we can sample and compare different tissues and developmental stages to obtain more comprehensive and accurate data. Thank you again for raising this important issue and for your valuable suggestions.

      1. The authors could in many different ways explore what are the origin of ROS is. That is important to further develop their hypothesis on reduced energy levels.

      Response: Thank you very much for your insightful comment and suggestion, it gives us great insight. Mitochondria are the main producers of ATP for cellular metabolism, accounting for approximately 90% of the total. However, mitochondria are also involved in the generation of reactive oxygen species (ROS). Excessive accumulation of ROS in mitochondria leads to oxidative stress, which in turn damages mitochondria and further increases ROS levels, creating a vicious cycle (Boovarahan and Kurian, 2018). In the present study, it was found that imidacloprid exposure led to increased ROS and MDA levels in larvae (Figure 5A and Figure 5-source data 14), indicating that imidacloprid induced severe oxidative stress and lipid damage, which may damage mitochondria and in turn affect mitochondrial ATP production, resulting in insufficient energy supply for larval development. This factor may also be an important explanation for the larval developmental delay caused by imidacloprid. We have included the above text in our revised manuscript. Please see the lines 432-442 in the revised manuscript.

      1. If there is gut damage, is it restored in the adults? It is not clear from the methods which precise stage of larval development was used for gut preparations. That information is important because prior to pupation larvae defecate for the first time and undergo shedding of the gut lining. That could profoundly affect some of the results in case gut preparations for microscopy were made close to this stage. If no food residues are found in the gut of control larvae, does it mean that they are close to pupation? Could the apoptosis found in gut of exposed larvae be the natural shedding of gut lining prior to pupation? All these possibilities have to be discussed and authors should clarify the precise larval stage used in every assay.

      Response: Thank you for your important comments. In this study, all samples used for the assay were larvae that had developed to 5-day-old after oral administration imidacloprid at 2-day-old. This is described in detail in the Materials and Methods. See lines 507, 517-521 in the revised manuscript. In general, 6-day-old bee larvae cease feeding and begin their first defecation at approximately 7-day-old. However, in our study, intestinal sections were prepared from 5-day-old larvae that had not fasted or defecated, when the intestinal mucosa was normal and not undergoing shedding. In this case, we found that imidacloprid caused damage to intestinal structures, apoptosis of intestinal cells, incomplete formation of the peritrophic membrane, and undigested food residues in the intestine. We believe that these results are objective and reliable.

      1. Honeybee have 5 larval instars, not 7 (Figure 1). That creates confusion about which larval stage the authors used.

      Response: Thank you very much for pointing out this editorial error, which we have corrected, please see Figure 1.

      1. The Results section does not state the numbers by which parameters measures have changed, neither the values of significance. How much is the impact in growth index, body mass, gene fold change, etc?

      Response: Thank you very much for pointing out this important problem. We have revised the Results section according to your suggestions. Please see the revised manuscript.

      1. Mention figures in order (5c comes before 5b in the text)

      Response: Thank you very much for the comment. We have revised according to your suggestions. Please see the lines 208-212 in the revised manuscript.

      1. Paraquat is a herbicide not a pesticide

      Response: Thank you for pointing out the loose wording. We have revised according to your suggestions. Please see the lines 316-319 in the revised manuscript.

      1. What is the evidence that imidacloprid reduces growth index by inhibiting 20E? The authors provide real time data and discuss the data in terms of correlation. But correlation does not mean causation. Reduction in growth index could come from multitude of factors such as ROS affecting mitochondrial energy metabolism.

      Response: We deeply appreciate your insightful comments and valuable suggestions. In this study, although we conducted an in-depth analysis of ecdysone regulation, which is crucial for insect larval development, and found some clues, as you pointed out, this is not the sole reason for larval developmental delay. In fact, animal growth and development are collectively regulated by numerous physiological, biochemical, and genetic factors. The the decline in the growth index may be due to other factors as you mentioned, such as oxidative stress impairing mitochondria, dysregulated neuro-endocrine axis caused by imidacloprid targeting neurons, poor nutrient absorption, impaired movement, etc, as animal growth and development are collectively regulated by numerous physiological, biochemical, and genetic factors. We have incorporated this understanding into the revised manuscript. Please see the lines 389-394 in the revised manuscript.

      1. The authors state that "digestion and breakdown of nutrients is impaired by imidacloprid", the evidence discussed in the paragraph however supports only that imidacloprid impairs some of the genes involved in these processes.

      Response: Thank you for your comments and valuable insights. In this paragraph, a lack of clarity and completeness in our writing may have led to the misconception that the evidence discussed only demonstrates the effects of imidacloprid on specific genes in these processes. In fact, our intent in this paragraph was to analyze and discuss the effects of imidacloprid on nutrient digestion and breakdown in larvae and to explore the causes of larval developmental delay. We demonstrated this using tissue sections, qRT-PCR and correlation analysis, which showed that the intestinal structure was disrupted and the expression of genes involved in nutrient digestion and catabolism was suppressed, resulting in defects in the catabolic utilization of food and consequently the presence of many food residues. In addition, there was a positive correlation between these genes and larval developmental delay. All this may be another important factor contributing to imidacloprid-induced larval developmental delay. We have revised and incorporate the above logic into the revised manuscript. Please see the lines 407-431 in the revised manuscript.

      1. There is no evidence for the claim that overexpressing P450s and antioxidant enzymes cause a reduction in growth index. No transcriptome analysis was performed so it is unknown under the circumstances presented here how all the other P450s, antioxidant genes and overall gene profiles are responding. Surely, some genes will be repressed. Reduction in growth index could stem from, oxidative stress impairing mitochondria, dysregulated neuro-endocrine axis caused by imidacloprid targeting neurons, poor nutrient absorption, impaired movement, etc.

      Response: Thank you for your comments and valuable insights. Indeed, as you have pointed out, drawing the conclusion that antioxidants and detoxification are significant contributors to larval developmental retardation solely based on correlation analysis is inherently flawed and lacks critical support, especially in the absence of P450 and antioxidant enzyme overexpression and comprehensive transcriptome analysis of other P450s, antioxidant genes, and the entire gene map. We have revised and included in the revised manuscript. Please see lines 461-467 in the red text in the revised manuscript. We have revised and incorporate the above logic into the revised manuscript. Please see the lines 407-431 in the revised manuscript.

      1. How come the decreased ATP and glycogen levels have no effect on time to pupation? Extra time points for gene expression, measurements of gut damage, ATP levels, ROS, etc, are vital to answer how the exposed larvae eventually catch up with the unexposed group. Also, it is vital to understand whether these larval impacts translate to impacts on adults.

      Response: We sincerely thank you for your insightful comments and suggestions! These important scientific issues you've raised are a good example of your high-level scientific thinking, and they will help us and other future researchers in the field to more comprehensively study and interpret the toxic effects of imidacloprid on honey bee larvae and their potential mechanisms, as well as the mechanisms of larval resistance and adaptation to imidacloprid. According to your comments, we will adapt our experiments and conduct more thorough research in the future to address the above issues.

      1. I am confused about the author's definition of developmental rate; rate gives the notion of speed to achieve something. But the authors use developmental rate as a measure of viability (number of larvae that successfully pupated). There seems to be a significant decrease in their developmental rate plot (Fig 1i), but at the same time the authors show in Figure 1c (and mention throughout the manuscript) that there is no difference in probability of survival. This is quite confusing and the method section regarding these data is too concise and does little to help explain what the authors were trying to measure. The whole section on developmental traits would benefit of more details on how experiments were conducted and equipment used.

      Response: Thank you so much for your valuable comments. Yes, as you can see, there appears to be a significant decrease in developmental rate but no difference in survival probability, which is an intriguing finding of this study. This finding suggests that the 377 ppb imidacloprid dose is not as harmful to the larvae as previously thought. Imidacloprid appeared to limit the larval ability to molt and develop only to a certain extent, but had no effect on the developmental process, let alone survival. It's worth investigating the underlying mechanism. As a result, we have included this question in the design of future studies. In addition, following your suggestion, we have revised the description of the material and methods in this section, including the experimental method in more detail. For more information, please see the revised manuscript, lines 530-541.

      1. The authors should try to make it clear what percentage of exposed larvae become adults? I am confused because the plot called developmental rate might be trying to convey this message, but developmental rate and viability are very distinct traits. What is the difference, if any, in the time it takes for exposed larvae to become adults in comparison to non-exposed ones? Is there a difference in adult body weight? The answers to these last two questions are important to start understanding if the impacts of imidacloprid on larvae alimentation would still impact these same individuals once they become adults, i.e., would there be impacts for the colony and workers activity?

      Response: Thank you very much for your insightful comments. Unfortunately, this is where the research falls short. Culturing larvae to adulthood in 24-well cell culture plates is a significant technical challenge that we have yet to overcome. As a result, the important questions you raise, such as what percentage of exposed larvae become adults? How does the time to adulthood differ (if at all) for exposed larvae versus non-exposed larvae? Is there a difference in adult weight? Do the effects of imidacloprid on larval feeding persist after these individuals reach adulthood? Does imidacloprid damage to larvae affect colony and adult activity? We do not have answers at this time. We are aware that answers to the above questions will help people better understand how serious the effects of imidacloprid environmental residues on honey bee larvae and adults, as well as bee colonies as a whole, are, and will draw sufficient attention to them. We intend to break through this technological bottleneck of culture larvae to adulthood in future studies and incorporate the above scientific questions into our next research design. Thank you again for your insightful comments! This gives us new research ideas.

    1. Author Response

      The following is the authors’ response to the original reviews.

      eLife assessment

      This important paper builds on a method, previously conceptualized and validated, of genetic control for insect populations. The method, called pgSIT, uses integrated CRISPR-Cas9 based constructs to generate, in certain combinations of genotypes, mutations that cause both male sterility and female inviability. Release of such genotypes in sufficiently large numbers can lead to an inundation of a local insect population with sterile males and this can lead to localised population suppression, which represents an important method of control for problematic insect populations. The data are convincing and will be valuable to anyone working on vector control strategies.

      Public Reviews:

      Reviewer #1 (Public Review):

      Precision guided sterile insect technology (pgSIT) is a means of mosquito vector control that aims to simultaneously kill females while generating sterile males for field release. These sterile males are expected to mate with 'wild' females resulting in very few eggs being laid or low hatching rates. Repeated releases are expected to result in the suppression of the mosquito population. This method avoids cumbersome sex-sorting while generating the sterile males. Importantly, until release, the two genetic elements that bring about female lethality and male sterility - the Cas9 and the gRNA carrying mosquitoes - are maintained as separate lines. They are crossed only prior to release, and therefore, this approach is considered to be more safe than gene drives.

      The authors had made a version of this pgSIT in their 2021 paper where they targeted β-Tubulin 85D, which is only expressed in the male testes and its loss-of-function results in male sterility. In that pgSIT, they did not have female lethality, but generated flightless females by simultaneously targeted myosin heavy chain, which is expressed only in the female wings. Here the authors argue, that the survival of females is not ideal, and so modify their 2021 approach to achieve female lethality/sterility.

      To do this, they target two genes - the female specific isoform of Dsx and intersex. They use multiple gRNAs against these genes and validate their ability to cause female lethality/sterility. Having verified that these do indeed affect female fertility, they combine gRNAs against Dsx and ix to generate female lethality/sterility and use β-Tubulin 85D to generate male sterility (previously validated). When these gRNA mosquitoes are crossed to Cas9 and the progeny crossed to WT (the set-up for pgSIT), they find that very few eggs are laid, larval death is high, and what emerges are males or intersex progeny that are sterile.

      As this is the requirement for pgSIT, the authors then test if it is able to induce population suppression. To do this, they conduct cage trials and find that only when they use 20:1 or 40:1 ratio of pgSIT:WT cages, does the population crash in 4-5 generations. They model this pgSIT's ability to suppress a population in the wild. Unfortunately, I was not able to assess what parameters from their pgSIT were used in the model and therefore the predicted efficacy of their pgSIT, (though the range of 0-.1 is not great, given that the assessment is between 0-0.15).

      We express our sincere appreciation for the valuable comments received. A wide range of ♀ viability and ♂ fertility values were explored in the model. The results determined that: “Achieving a ≥90% probability of elimination places slightly tighter restrictions on ♀ viability and ♂ fertility - a safe ballpark being ♀ viability and ♂ fertility both in the range 0-0.10, given a release scheme of ~26 releases of 250 pgSIT eggs per wild adult (Fig. 4B). These results suggest a target product profile for pgSIT to be ♀ viability and ♂ fertility both in the range 0-0.10.” A subsequent sentence has been added pointing out how the described pgSIT strain falls within this range: “The pgSIT strain described here falls well within these bounds, with ♀ viability of 0 and ♂ fertility of ~0.01.” The parameters of the described pgSIT strain are also listed throughout the paper and quoted here: “Cas9 in combination with gRNAdsx,ix,βTub induces either the lethality or transformation of pgSIT ♀’s into sterile unfit ⚥’s.” And: “Firstly, we determined that pgSIT males were not 100% sterile, with an estimated ~1% still producing some progeny.”

      Finally, they also develop a SENSR with a rapid fluorescence read-out for detecting the transgene in the field. They show that this sensor is specific and sensitive, detecting low copy numbers of the transgene. This would be important for monitoring any release.

      Overall, the data are clear and well presented. The manuscript is well written (albeit likely dense for the uninitiated!). I had concerns about the efficacy of generating the pgSIT animals - the overall number of eggs hatched from the gRNA (X) Cas9 cross appears to be low, therefore, very large numbers of parental animals would have to be reared and crossed to obtain enough sterile males for the SIT. In addition to this, I was concerned about the intersex progeny that can blood-feed. These could potentially contribute to the population and it would be useful to see the data that suggest that these numbers are low and the animals will not be competent in the field.

      Reviewer #2 (Public Review):

      This is a thorough and convincing body of work that represents an incremental but significant improvement on iterations of this method of CRISPR-based Sterile Insect Technique ('pgSIT'). In this version, compared to previous, the authors target more genes than previously, in order to induce both female inviability (targeting the genes intersex and doublesex, compared to fem-myo previously) and male sterility (targeting a beta-tubulin, as previously in the release generation. The characterization of the lines is extensive and this data will be useful to the field. However, what is lacking is some context as to how this formulation compares to the previous iteration. Mention is made of the possible advantage of removing most females, compared to just making them flightless (as previously) but there is no direct comparison, either experimental, or theoretical i.e. imputing the life history traits into a model. For me this is a weakness, yet easily addressed. In a similar vein, much is made in alluding to the 'safety concerns of gene drive' and how this is a more palatable half-way house, just because it has CRISPR component within it; it is not. It would be much more sensible, and more informative, to compare this pgSIT technology to RIDL (release of insects carrying a dominant lethal), which is essentially a transgene-based version of the Sterile Insect Technique, as is the work presented here.

      We express our sincere appreciation for the valuable comments received. A wide range of ♀ viability and ♂ fertility values were explored in the model. Given the intricate nature of this study and taking into account the recommendations provided by multiple reviewers and the editor, we have eliminated superfluous comparisons among various methodologies.

      The authors achieve impressive results and show that these strains, under a scenario of high levels of release ratios compared to WT, could achieve significant local suppression of mosquito populations. The sensitivity analysis that examines the effect of changing different biological or release parameters is well performed and very informative.

      The authors are honest in acknowledging that there are still challenges in bringing this to field release, namely in developing sexing strains and optimizing release strategies - a question I have here is how to actually release eggs, and could variability in the efficiency of this aspect be modelled in the sensitivity analysis? It seems to me like this could be a challenge and inherently very variable.

      We really appreciate comments. Several approaches are available to release eggs - either in pre-existing breeding sites in the field, or in artificial breeding sites (e.g., cups). We have added a sentence in the Discussion section to highlight that this is an area requiring further research: “Secondly, studies are required to determine the survival and mating competitiveness of released pgSIT males under field conditions, and to optimize their release protocol.” Regarding the efficiency of egg releases, the following sentence in the modeling results section has been added: “We assume released eggs have the same survival probability as wild-laid eggs; however if released eggs do have higher mortality, this would be equivalent to considering a smaller release.” As stated in the modeling results (and depicted in Figure 4 and Supplementary Figure 5): “Suppression outcomes were found to be most sensitive to release schedule parameters (number, size and interval of releases), ♂ fertility and ♀ viability.” It follows that suppression outcomes are equivalently sensitive to the efficiency of an egg release.

      Reviewer #3 (Public Review):

      Summary and Strengths:

      The manuscript by Li et al. presents an elegant application of sterile insect technology (pgSIT) utilizing a CRISPR-Cas9 system to suppress mosquito vector populations. The pgSIT technique outlined in this paper employs a binary system where Cas9 and gRNA are conjoined in experimental crosses to yield sterile male mosquitoes. Employing a multiplexed strategy, the authors combine multiple gRNA to concurrently target various genes within a single locus. This approach successfully showcases the disruption of three distinct genes at different genomic positions, resulting in the creation of highly effective sterile mosquitoes for population control. The pioneering work of the Akbari lab has been instrumental in developing this technology, previously demonstrating its efficacy in Drosophila and Aedes aegypti. By targeting the female-specific splice isoform (exon-5) of doublesex in conjunction with intersex and β-tubulin, the researchers induce female lethality, leading to a predominance of sterile male mosquitoes. This innovation is particularly noteworthy as the deployment of sterile mosquitoes on a large scale typically requires substantial investment in sex sorting. However, this study circumvents this challenge through genetic manipulation.

      Weaknesses:

      One notable concern arising from this manuscript pertains to the absence of data regarding the potential off-target effects of the gRNA. Given the utilization of multiple gRNA, the risk of unintended mutations in non-target areas of the genome increases. With around 1% of males still capable of producing fertile offspring, understanding the frequency of unintended genome targeting becomes crucial. Such mutations could potentially become fixed within the natural population.

      We express our sincere appreciation for the valuable comments received and fully agree with the reviewer regarding the importance of understanding the frequency of unintended genome targeting. However, the likelihood of off-target effects becoming fixed within the population is exceedingly low. To mitigate potential negative impacts, we employed CHOPCHOP V3.0.0 (https://chopchop.cbu.uib.no) for the selection of gRNAs, which will specifically tminimize the occurrence of genomic off-target cleavage events. Furthermore, our releasing process will be carried out in multiple rounds. In the event that an undesired mutant is introduced into the local population, the mutated gene will either be quickly eradicated through subsequent rounds of releases or be naturally eliminated through the process of natural selection over time.

      The experiments are well-conceived, featuring suitable controls and repeated trials to yield statistically significant data. However, a primary issue with the manuscript lies in its data presentation. The authors' graphical representations are intricate and demand considerable attention to discern the nuances, especially due to the striking similarity between the symbols representing different genotypes. As it stands, the manuscript primarily caters to experts within the field, thereby warranting improvements in data visualization for broader comprehension.

      We appreciate the comment. However, as this work is indeed complex and intricate and as there is limitations imposed by the publisher on data visualizations (i.e. number of figures in the main text, etc.) we have tried our best for presenting our data in full.

      All three reviewers were appreciative of the work presented in this manuscript. There were some common concerns that we shared, that the authors could consider revising. They are listed below.

      Essential revisions:

      1. Formal comparison with the previous/other methods: The authors make many statements that compare this pgSIT with their previous method, gene drives, or with RIDL. We suggest that they focus their comparisons within the scope of data and avoid comparisons between RIDL, gene drive, and pgSIT that are based on perceptions of these methods. It would be useful if, for example, they could impute life history traits and demonstrate this pgSIT's efficacy over their previous versions.

      We express our sincere appreciation for the valuable comments received. We have removed the unnecessary comparisons between different methods, please review the revised version.

      1. Writing and presentation of figures: The authors should please take advantage of the eLife format and unpack each sentence/figure so that it's accessible to readers outside this field.

      We appreciate your comment, and we have implemented some necessary changes based on your suggestions.

      1. Data to support claims made in passing: There are many instances, such as detailed in the reviews (and the entire second paragraph in the discussion) that are not supported by data. The authors should either provide that data or not make these claims.

      Thank you for the comment. We have removed these claims.

      1. Off target effects: There is the formal possibility that off target effects that might get fixed in the population. Could the authors please address this in the discussion.

      We appreciate the comment and fully agree with the reviewer regarding the importance of understanding the frequency of unintended genome targeting. However, the likelihood of off-target effects becoming fixed within the population is exceedingly low. We have address this in the discussion.

      “Even though mutations could potentially become fixed within the natural population, the likelihood of off-target effects becoming fixed within the population is exceedingly low. To mitigate potential negative impacts, we employed CHOPCHOP V3.0.0 (https://chopchop.cbu.uib.no) for the selection of gRNAs, specifically to minimize the occurrence of genomic off-target cleavage events. Furthermore, our releasing process will be carried out in multiple rounds. Even in the event that an undesired mutant is introduced into the local population, it will either be completely eradicated through subsequent rounds of releases or be naturally eliminated through the process of natural selection over time.”

      Aside from this, we ask that the authors please pay attention to the detailed reviews.

      Reviewer #1 (Recommendations For The Authors):

      The writing: Each sentence is packed with information and while this is fine for those immersed in the field, it might be dense for those who are not. There are a lot of nuances in such an approach and clearly laying it out for the reader is important. The authors should unpack some of these sentences to make their work more accessible.

      Thank you for the comment. We have unpacked some of sentences, please review the revised version.

      It will help to have a schematic linked to the introduction about how these mosquitoes are designed to be used. Which strains would be scaled up in the lab, which ones (and what stage) could be released, and in which animal/generation they expect sterility or lethality. This would be useful while interpreting the schematics of the genetic crosses in the rest of the figures (1B, 2B). Li et al 2021 has something to this effect. I say this particularly because in the text, 'pgSIT' is used to refer to both the lab stocks and the F1s.

      We really appreciate the suggestion to incorporate a schematic into the introduction to clarify the intended use of these mosquitoes. Taking into account all the suggestions, we would like to keep textual descriptions and context provided within the manuscript, which, together with Figures 1B and 2B, illustrate our intentions. Nevertheless, we value your input and have taken other feedback into account to improve the overall quality of the content.

      Because Figure 1A depicts all the gRNAs I thought that's what they were testing in the first results section. But the legends seems to suggest that the individual gRNAs have been tested. Such issues will be sorted with attention to the writing. It would also be nice to have Figure 2A here.

      We apologize for any misunderstanding. Figure 1A displays two gRNA constructs: one for dsx (comprising 4 gRNAs) and another for ix (with 2 gRNAs). All of these gRNAs were tested in the initial results section. Subsequently, we engineered the final gRNA construct, denoted as gRNAdsx,ix,βTub, which combines the effective gRNAs described earlier (3 targeting dsx and 1 targeting ix, as illustrated in Supplementary Figure 2).

      It wasn't clear to me how egg laying percentages were calculated or what it means.

      We appreciate your comment. Female fecundity depends on the egg output (egg laying percentage) and the egg hatching rate, since insect female can lay unfertalized eggs that does not hatch. Egg laying percentages were calculated by dividing the numbers of laid eggs by a test female group by that of the control female group that laid the highest egg number. This procedure is called normalization and enable relative comparison of laid egg number.

      How is hatching at times more than laying?

      When a female group laid a small egg number but the high percentage of those eggs hatched.

      Calling something 'intersex': The authors are assessing intersex by malformed genitalia, maxillary palps and ovaries. But the genitalia defects in Fig1D were not clear to me. Can the authors show better images? While the MP snd ovary phenotypes were clear, it would be nice to see these quantified - what proportion of the females have each/some/all of these phenotypes? It would be nice to see this quantified. (They have some of this in the supplementary table).

      We express our gratitude for the comment received and acknowledge the issue regarding the clarity of the images. It is important to note that these photographs represent the highest level of clarity achieved thus far. We value your interest in the quantification of the observed phenotypes. However, due to certain constraints, we were unable to quantify the proportions for all the females, and we did not retain all the samples needed for this specific quantification.

      It's interesting that 50% of the intersex don't blood-feed - is this because they do not have appropriately formed stylets? It would be important to quantify the number of hatch-able eggs. This is particularly important in the context of field application and should ideally be included in the mathematical modelling. In the discussion, the authors mention that they are not able to host-seek and a variety of other behaviours - these data should be presented as it would be important for assessing the efficacy of the pgSIT.

      Thank you for the comment. We did not find the mutant stylets from these intersex mosquitoes. We agree with the reviewer that the number of hatchable eggs is particularly important in the context of field application. Indeed, the number of hatchable eggs is what was considered in the mathematical modeling. We did a blood feed assay (small cage and big cage) for host seeking behavior. Data were presented in Supplementary Table 5.

      At the end of the first results section, the authors state, "Taken together, these findings reveal that ♀-specific lethality and/or ⚥..." But I don't see data that show female-specific lethality until Figure 2C.

      Thank you for pointing out this. In order to describe our results clearly, we have deleted “♀-specific lethality and/or”

      In the combined gRNA mosquito (the pgSIT), they find that the cross between the gRNA and Cas9 results in very few eggs being laid, high larval death, and what emerges are males. This suggests that it would be a poor pgSIT, right? You'd have to set up huge crosses to get enough males emerging in the wild to mate with WT females to bring about population suppression. Could the authors comment on this?

      We appreciate the comment. Even in the presence of imperfections, such as reduced egg production resulting from the gRNA and Cas9 cross and the necessity of extensive mating to obtain an adequate number of males, population suppression is very promising with the pgSIT, both in terms of the potential to eliminate a mosquito population, or to suppress it to an extent that would largely interrupt disease transmission. It's worth noting that our current efforts serve as a validation of the system before its potential large-scale application, because we have demonstrated that removing females by disrupting sex determinate genes is possible with pgSIT, which can inform the development of such systems in other species in the future.

      If I'm reading Figure 2C right, the authors have combined the results from two types of crosses in the last two plots: 1) the Cas9 (X) gRNA mosquitoes and 2) the progeny from these crossed to WTs. This is not ideal. I would suggest the authors unpack the text around this data and plot it separately.

      We really appreciate the comment here, the panel 2C depicts the phenotypic data of the F1 progeny generated by the cross of the parents indicated below the X axis: egg-to-adult survival, larval death, sex ratios, and fertility. The fertility of F1 progeny is the major phenotypic feature for the project. To assess the fertility of the surviving F1 progeny, we had to cross the F1 females and males to WT males and females, respectively and assess the hatching rate of produced eggs before sacrificing emerged larvae and unhatched eggs. It's important to note that mosquito females can lay unfertilized eggs that fail to hatch.

      The text around 2F needs to be more explanatory. There are lots of labels in the figure that are not referred to, making it difficult to follow the data.

      We have gone through and expanded many of the figure legends and modified some figures to help make them more understandable.

      The supplementary figure numbering is off.

      We really appreciate the comment. The supplementary figure numbering have been fixed.

      I cannot comment on Figure 4 as this is outside my expertise. However, I do feel that some attention to the writing might help make the approach more accessible to the invested advanced lay-person.

      We appreciate the comment, and we re-wrote some of the sentences describing Figure 4.

      Reviewer #2 (Recommendations For The Authors):

      Line 49 'resistances' is a strange plural.

      Corrected. Thank you so much!

      the genitive, used with the sex symbols throughout, looks very weird e.eg line 60, 66 etc. Also the intersex symbol, on my copy at least, just prints as a square

      These have been fixed in the revised version. Thank you so much!

      Line 74 syntax (...: the spread of...") seems off

      Corrected. Thank you for pointing out this.

      Line 80-81 " to address some of the challenges with gene drives, pgSIT also leverages....." this is a straw man/red herring argument, and simply does not follow. It is this element that I raised above in the public review. See also line 84 'gene drive safety concerns'.

      Thank you, we have re-wrote the paragraph.

      Line 128 "the induced phenotypes were especially strong in intersex individuals" - this is a curious statement since, if intersex, they are by definition already showing a strongly induced phenotype

      We apologize for the lack of clarity and have updated the text, we have deleted “the induced phenotypes were especially strong in intersex individuals”, to be more explicit, now stating “These gRNAdsx/+; Cas9/+ ⚥ exhibited multiple malformed morphological features, such as mutant maxillary palps, abnormal genitalia, and malformed ovaries”

      The extent and completeness of the supplementary data is appreciated but there needs to be some statistical tests applied to back up statements like 'showed normal fertility' (line 138) or wind lengths 'were a bit larger'. None seem to have been applied.

      We appreciate the comment. We've removed these sentences in the new version.

      Supp Fig 4 - on left of panel C there is a small blue square at dsx locus that is unexplained. What is this?

      Thank you for pointing this. It was a mistake, we have removed the small blue square from Sup Fig4.

      Line 182 the reduction in flight activity in release genotype of pgSIT males - is it only those coming with the maternal source of Cas9 that are plotted (only pink dots)?

      We appreciate the comment. pgSIT males, regardless of whether they originate from a maternal or paternal source of Cas9, exhibit a similar reduction in flight activity compared to wild-type (WT) males.

      Figure 3A legend - I think there is a typo that says males were fed

      Corrected. Thank you for pointing this out.

      “♂’s” to “♀’s”

      On the window of protection (WOP) plots (e.g. supp fig 12) what is the unit on Y-axis for WOP? It goes from 0-1, as if it were probability, but I was expecting some duration.

      Thanks for the comment. The y-axis for WOP in Supp Fig 12 had been normalized unnecessarily. It has now been corrected to span from 0 to 5 years.

      Fig 4B blue (line) on blue(shading) is impossible to decipher on my copy

      Thank you for pointing this out. We have changed the colors of the traces (population dynamics), made the window of protection line thicker, and have made the shading less opaque to make the population dynamics in this figure clearer.

      Line 250 and 252: supp Fig 13 (not 12)

      Corrected. Thank you for pointing this out.

      Line 279 "potentially a more widespread effect of sex determination genes than previously expected" - I simply don't see how this is so, or why there is the need to make such a claim. Dsx is known to underpin almost of somatic determination of sex-specific morphologies, in a range of insects.

      We appreciate the comment. We have delete the sentence:

      “Taken together, these observations indicate a potentially more widespread effect of sex determination genes than previously expected, though regardless.”

      Line 320 "We would expect pgSIT to be regulated similarly to Oxitec's RIDL" because they are similar, which goes to my main point above about more appropriate context, and this warrants some direct attention to a comparison of the efficacy.

      We appreciate the comment. We have delete these sentences:

      “We would expect pgSIT to be regulated similarly to Oxitec's RIDL technology (Spinner et al., 2022), which has already been successfully deployed in numerous locations, including the United States.”

      Was there a minimal performance advantage with strain #1 with the triple locus g-RNA suite, over the other two strains? Am just curious as to why one was chosen over the other

      We appreciate the comment. There was no performance advantage with the strain #1 over the other two strains.

    1. Author Response

      The following is the authors’ response to the original reviews.

      Public Reviews:

      Reviewer #1 (Public Review):

      Summary

      In this manuscript, Hagihara et al. characterized the relationship between the changes in lactate and pH and the behavioral phenotypes in different animal models of neuropsychiatric disorders at a large-scale level. The authors have previously reported that increased lactate levels and decreased pH are commonly observed in the brains of five genetic mouse models of schizophrenia (SZ), bipolar disorder (BD), and autism spectrum disorder (ASD). In this study, they expanded the detection range to 109 strains or conditions of animal models, covering neuropsychiatric disorders and neurodegenerative disorders. Through statistical analysis of the first 65 strains/conditions of animal models which were set as exploratory cohort, the authors found that most strains showed decreased pH and increased lactate levels in the brains. There was a significant negative correlation between pH and lactate levels both at the strain/condition level and the individual animal level. Besides, only working memory was negatively correlated with brain lactate levels. These results were successfully duplicated by studying the confirmative cohort, including 44 strains/conditions of animal models. In all strains/conditions, the lactate levels were not correlated with age, sex, or storage duration of brain samples.

      Strengths

      1. The manuscript is well-written and structured. In particular, the discussion is really nice, covering many potential mechanisms for the altered lactate levels in these disease models.

      2. Tremendous efforts were made to recruit a huge number of various animal models, giving the conclusions sufficient power.

      We are grateful to Reviewer #1 for the positive evaluation of our manuscript. As indicated in the responses that follow, we have taken all the comments and suggestions made by the reviewer into account in the revised version of our paper.

      Weaknesses

      1. The biggest concern of this study is the limited novelty. The point of "altered pH and/or lactate levels in the brains from human and rodent animals of neuropsychiatric disorders" has been reported by the same lab and other groups in many previous papers.

      The previous study mentioned by the reviewer evaluated a small number of animal models of psychiatric disorders. The novelty of this study is underscored by two key findings: 1) the generality of changes in brain pH and lactate levels across a diverse range of disease models, and 2) the association of these phenomenon with specific behaviors. First, this large-scale animal model study revealed that alterations in brain pH/lactate levels can be found in approximately 30% of the animal models examined. This generality suggests a common basis in the neuropathophysiology of not only schizophrenia, bipolar disorder, and ASD, but also of Alzheimer’s disease (APP-J20 Tg mice), Down’s syndrome (Ts1Cje mice), Mowat–Wilson syndrome (Zeb2 KO mice), Dravet syndrome (Scn1a-A1783V KI mice), tuberous sclerosis complex (Tsc2 KO mice), Ehlers-Danlos syndrome (Tnxb KO mice), and comorbid depression in diabetes (streptozotocin-treated mice) and colitis (dextran sulfate sodium-treated mice). Secondly, this study demonstrated that these phenomenon in the brain are primarily associated with working memory impairment over depression- and anxiety-related behaviors. Importantly, developing these hypotheses in an exploratory cohort of animals and confirming them in an independent cohort within this study enhances the robustness and reliability of our hypotheses, which we believe are equally crucial as their novelty. Accordingly, we have revised the discussion section as follows (page 31, line 7):

      Original text

      "We performed a large-scale analysis of brain pH and lactate levels in 109 animal models of neuropsychiatric disorders, which revealed the diversity of brain energy metabolism among these animal models. Some strains of mice that were considered models of different diseases showed similar patterns of changes in pH and lactate levels. Specifically, the SZ/ID models (Ppp3r1 KO, Nrgn KO mice, and Hivep2 KO mice), BD/ID model (Camk2a KO mice), ASD model (Chd8 KO mice), depression models (mice exposed to social defeat stress, corticosterone-treated mice, and Sert KO mice), AD model (APP-J20 Tg mice), and DM model (Il18 KO and STZ-treated mice) commonly exhibited decreased brain pH and increased lactate levels."

      Revised text

      "We performed a large-scale analysis of brain pH and lactate levels in 109 animal models of neuropsychiatric disorders, which revealed the diversity of brain energy metabolism among these animal models. The key findings of this study are as follows: 1) the generality of changes in brain pH and lactate levels across a diverse range of disease models, and 2) the association of these phenomenon with specific behaviors. First, this large-scale animal model study revealed that alterations in brain pH/lactate levels can be found in approximately 30% of the animal models examined. This generality suggests a common basis in the neuropathophysiology of not only schizophrenia, bipolar disorder, and ASD, but also of Alzheimer’s disease (APP-J20 Tg mice), Down’s syndrome (Ts1Cje mice), Mowat–Wilson syndrome (Zeb2 KO mice), Dravet syndrome (Scn1a-A1783V KI mice), tuberous sclerosis complex (Tsc2 KO mice), Ehlers-Danlos syndrome (Tnxb KO mice), and comorbid depression in diabetes (streptozotocin-treated mice) and colitis (dextran sulfate sodium-treated mice). Secondly, this study demonstrated that these phenomenon in the brain are primarily associated with working memory impairment over depression- and anxiety-related behaviors. Importantly, developing these hypotheses in an exploratory cohort of animals and confirming them in an independent cohort within this study enhances the robustness and reliability of our hypotheses."

      1. This study is mostly descriptive, lacking functional investigations. Although a larger cohort of animal models were studied which makes the conclusion more solid, limited conceptual advance is contributed to the relevant field, as we are still not clear about what the altered levels of pH and lactate mean for the pathogenesis of neuropsychiatric disorders.

      We agree with the reviewer’s comment. To address this issue, it is necessary to comprehensively identify brain regions and cell types responsible for pH and lactate changes in each strain/condition of animals, as these may differ among them. Subsequently, based on such findings, we can then proceed with functional investigations that specifically target the identified brain regions/cell types. However, conducting such investigations would require a significant amount of time to complete, approximately 2–3 years, and is beyond the scope of this study. Therefore, we would like to conduct such studies in the future. We have mentioned this limitation by revising the discussion section of this study as follows (page 43, line 5):

      Original text

      "Because we used whole brain samples to measure pH and lactate levels, we could not determine whether the observed changes in pH and/or lactate levels occurred ubiquitously throughout the brain or selectively in specific brain region(s) in each strain/condition of the models. Indeed, brain region-specific increases in lactate levels were observed in human patients with ASD in an MRS study (Goh et al., 2014). Furthermore, while increased lactate levels were observed in whole-brain measurements in mice with chronic social defeat stress (Figure S7) (Hagihara et al., 2021a), decreased lactate levels were found in the dorsomedial prefrontal cortex (Yao et al., 2023). The brain region-specific changes may occur even in animal models in which undetectable changes were observed in the present study. This could be due to the masking of such changes in the analysis when using whole-brain samples. Further studies are needed to address this issue by measuring microdissected brain samples and performing in vivo analyses using pH- or lactate-sensitive biosensor electrodes (Marunaka et al., 2014; Newman et al., 2011) and MRS (Davidovic et al., 2011)."

      Revised text:

      "The major limitations of this study include the absence of analyses specific to brain regions or cell types and the lack of functional investigations. Because we used whole brain samples to measure pH and lactate levels, we could not determine whether the observed changes in pH and/or lactate levels occurred ubiquitously throughout the brain or selectively in specific brain region(s) in each strain/condition of the models. It is known that certain molecular expression profiles and signaling pathways display brain region-specific alterations, and in some cases, even exhibit opposing changes in neuropsychiatric disease models (Hosp et al., 2017; Floriou-Servou et al. 2018; Reim et al., 2017). Indeed, brain region-specific increases in lactate levels were observed in human patients with ASD in an MRS study (Goh et al., 2014). Furthermore, while increased lactate levels were observed in whole-brain measurements in mice with chronic social defeat stress (Figure S7) (Hagihara et al., 2021a), decreased lactate levels were found in the dorsomedial prefrontal cortex (Yao et al., 2023). Additionally, it has been reported that the basal intracellular pH differs between neurons and astrocytes (lower in astrocytes than in neurons), and their responsiveness to conditions simulating neural hyperexcitation and the metabolic acidosis in terms of intracellular pH also varies (Raimondo et al., 2016; Salameh et al., 2017). It would also be possible that the brain region/cell type-specific changes may occur even in animal models in which undetectable changes were observed in the present study. This could be due to the masking of such changes in the analysis when using whole-brain samples. Given the assumption that the brain regions and cell types responsible for pH and lactate changes vary across different strains/conditions, comprehensive studies are needed to thoroughly examine this issue for each animal model individually. This can be achieved through techniques such as evaluating microdissected brain samples, conducting in vivo analyses using pH- or lactate-sensitive biosensor electrodes (Marunaka et al., 2014; Newman et al., 2011), and MRS (Davidovic et al., 2011). Subsequently, based on such findings, it is also necessary to conduct functional analyses for each model animal by manipulating pH or lactate levels in specific brain regions/cell types and evaluating behavioral phenotypes relevant to neuropsychiatric disorders."

      1. The experiment procedure is also a concern. The brains from animal models were acutely collected without cardiac perfusion in this study, which suggests that resident blood may contaminate the brain samples. The lactate is enriched in the blood, making it a potential confounded factor to affect the lactate levels as well as pH in the brain samples.

      We thank the reviewer for pointing this out. We have discussed this issue as follows (page 45, line 4):

      We also note that there are several potential confounding factors in this study. The brain samples analyzed in this study contained cerebral blood. The cerebral blood volume is estimated to be approximately 20–50 μl/g in human and feline brains (Leenders et al., 1990; van Zijl et al., 1998). When we extrapolate these values to murine brains, it would imply that the proportion of blood contamination in the brain homogenates analyzed is 0.2–0.6%. Additionally, lactate concentrations in the blood are two to three times higher than those in the brains of mice (Béland-Millar et al., 2017). Therefore, even if there were differences in the amount of resident blood in the brains between control and experimental animals, the impact of such differences on the lactate measurements would likely be minimal.

      1. The lactate and pH levels may also be affected by other confounded factors, such as circadian period, and locomotor activity before the mice were sacrificed. This should also be discussed in the paper.

      Following the reviewer’s suggestion, we have discussed the matter as follows (page 45, line 12): Other confounding factors include circadian variation and locomotor activity before the brain sampling. Lactate levels are known to exhibit circadian rhythm in the rodent cortex, transitioning gradually from lower levels during the light period to higher levels during the dark period (Dash et al., 2012; Shram et al., 2002; Wallace et al., 2022). The variation in the times of sample collection during the day was basically kept minimized within each strain/condition of animals. However, the sample collection times were not explicitly matched across the different laboratories, which may contribute to variations in the baseline control levels of pH and lactate among different strains/conditions of animals (Table S3). In addition, motor activity and wake/sleep status immediately before brain sampling can also influence brain lactate levels (Neylor et al., 2012; Shram et al., 2002). These factors have the potential to act as confounding variables in the measurement of brain lactate and pH in animals.

      1. Another concern is the animal models. Although previous studies have demonstrated that dysfunctions of these genes could cause related phenotypes for certain disorders, many of them are not acknowledged by the field as reliable disease models. Besides, gene deficiency could also cause many known or unknown unrelated phenotypes, which may contribute to the altered levels of lactate and pH, too. In this circumstance, the conclusion "pH and lactate levels are transdiagnostic endophenotype of neuropsychiatric disorders" is somewhat overstated.

      We thank the reviewer for pointing this out. We should have taken this issue into consideration. Accordingly, we have discussed this issue as the limitation of this study in the discussion section as follows (page 34, line 14):

      "While we analyzed 109 strains/conditions of animals, we included both those that are widely recognized as animal models for specific neuropsychiatric disorders and those that are not. For example, while interleukin 18 (Il18) KO mice and mitofusin 2 (hMfn2-D210V) Tg mice exhibited changes in pH and lactate levels, the evidence that these genes are associated with specific neuropsychiatric disorders is limited. However, these strains of mice exhibited behavioral abnormalities related to neuropsychiatric disorders, such as depressive-like behaviors and impaired working memory (Ishikawa et al., 2019, 2021; Yamanishi et al., 2019). Furthermore, these mice showed maturation abnormality in the hippocampal dentate gyrus and neuronal degeneration due to mitochondrial dysfunction, respectively, suggesting conceptual validity for utilization as animal models for neuropsychiatric and neurodegenerative disorders (Cunnane, et al., 2021; Burté et al., 2015; Hagihara et al., 2013, 2019). In contrast, mice with heterozygous KO of the synaptic Ras GTPase-activating protein 1 (syngap1), whose mutations have been identified in human patients with ID and ASD, showed an array of behavioral abnormalities relevant to the disorders (Komiyama et al., 2002; Nakajima et al., 2019), but did not show changes in brain pH or lactate levels. Therefore, while changes in brain pH and lactate levels could be transdiagnostic endophenotypes of neuropsychiatric disorders, they might occur depending on the subpopulation due to the distinct genetic and environmental causes or specific disease states in certain disorders."

      Regarding the latter point suggested by the reviewer, we consider that alterations in brain pH and lactate levels occur, whether they are a direct and known consequence or indirect and unknown ones of genetic modifications. We have proposed that genetic modifications, along with environmental stimulations, may induce various changes, which subsequently converge toward specific endophenotypes in the brain, such as neuronal hyperexcitation, inflammation, and maturational abnormalities (Hagihara et al., 2013; Yamasaki et al., 2008). The findings of this study, demonstrating the commonality of alteration of brain pH and lactate levels, align with this concept, suggesting that these alterations could serve as brain endophenotypes in multiple neuropsychiatric disorders. We have revised the discussion section as follows (page 42, line 8):

      Original text

      "These findings suggest that the observed increase in lactate production and subsequent decrease in pH in whole-brain samples may be attributed to the hyperactivity of specific neural circuits in a subset of the examined animal models."

      Revised text

      "These findings suggest that neuronal hyperexcitation may be one of the common factors leading to increased lactate production and decreased pH in the brain. We consider that alterations in brain pH and lactate levels occur, whether they are a direct and known consequence or indirect and unknown ones of genetic modifications. We have proposed that genetic modifications, along with environmental stimulations, may induce various changes, which subsequently converge toward specific endophenotypes in the brain, such as neuronal hyperexcitation, inflammation, and maturational abnormalities (Hagihara et al., 2013; Yamasaki et al., 2008). The findings of this study, demonstrating the commonality of alterations in brain pH and lactate levels, align with this concept and suggest that these alterations could serve as brain endophenotypes in multiple neuropsychiatric disorders."

      1. The negative correlationship between pH and lactate is rather convincing. However, how much the contribution of lactate to pH is not tested. In addition, regarding pH and lactate, which factor contributes most to the pathogenesis of neuropsychiatric disorders is also unclear. These questions may need to be addressed in the future study.

      To estimate the degree of contribution of lactate to pH, we determined the contribution ratio using the regression coefficient within a linear regression model applied to a combined cohort. The results showed that 33.2% of changes in pH may be explained by changes in lactate level. We have added the following text in the Results section (page 28, line 7).

      The contribution ratio of lactate to pH, calculated based on the regression coefficient in a linear regression model, was 33.2% at the individual level, suggesting a moderate level of contribution.

      Regarding the latter suggestion, we would like to address the issue in the future study. Accordingly, we have added the following sentence in the discussion section (page 40, line 11):

      Original text

      "Further studies are needed to address these hypotheses by chronically inducing deficits in mitochondrial function to manipulate endogenous lactate levels in a brain region-specific manner and to analyze their effects on working memory."

      Revised text

      "Further studies are needed to address these hypotheses by chronically inducing deficits in mitochondrial function to manipulate endogenous lactate levels in a brain region-specific manner and to analyze their effects on working memory. It is also important to consider whether pH or lactate contributes more significantly to the observed behavioral abnormalities."

      1. The authorship is open to question. Most authors listed in this paper may only provide mice strains or brain samples. Maybe it is better just to acknowledge them in the acknowledgments section.

      In the light of the current circumstances, wherein there is no universally agreed definition of authorship (the Committee on Publication Ethics1), we acknowledge the reviewer’s concern. Collecting a comprehensive range of mouse strains and brain samples is a fundamental principle of this study. Maintaining mouse lines, breeding mice, genotyping, drug administration, and preparation of brain samples each require specialized expertise. Therefore, the scientific and technical contributions of individuals who only provided mouse strains or brain samples was also crucial for obtaining the data essential to this study. In accordance with the authorship guidelines outlined by the journal, which stipulate that “We recommend that all researchers who made substantial or important contributions to the design of a work, or the acquisition, analysis or interpretation of the data used in the paper, be included as authors.”, we would like to retain their authorship status. Furthermore, we ensured that all authors had read and approved the manuscript before submission, using Google Forms.

      1. GUIDELINES ON GOOD PUBLICATION PRACTICE, Committee on Publication Ethics (COPE), https://publicationethics.org/files/u7141/1999pdf13.pdf
      1. The last concern is about the significance of this study. Although the majority of strains showed increased lactate, some still showed decreased lactate levels in the brains. These results suggested that lactate or pH is an endophenotype for neuropsychiatric disorders, but it is hard to serve as a good diagnostic index as the change is not unidirectional in different disorders. In other words, the relationship between lactate level and neuropsychiatric disorders is not exclusive.

      As pointed out by the reviewer, whether brain pH and lactate levels increase or decrease could vary among animal models. Such variation may represent subpopulations of patients or specific disease states. Considering both increases and decreases in changes in pH and lactate levels could be important to achieve that goal. Accordingly, we have revised the text as follows:

      Added text (page 33, line 12)

      "Detecting changes in brain pH and lactate levels, whether resulting in an increase or decrease due to their potential bidirectional alterations, using techniques such as MRS may help the diagnosis, subcategorization, and identification of specific disease states of these biologically heterogeneous and spectrum disorders, as has been shown for mitochondrial diseases (Lin et al., 2003)."

      Added text (page 35, line 14)

      "Therefore, while changes in brain pH and lactate levels could be transdiagnostic endophenotypes of neuropsychiatric disorders, they might occur depending on the subpopulation due to the distinct genetic and environmental causes or specific disease states in certain disorders."

      Reviewer #2 (Public Review):

      Hagihara et al. conducted a study investigating the correlation between decreased brain pH, increased brain lactate, and poor working memory. They found altered brain pH and lactate levels in animal models of neuropsychiatric and neurodegenerative disorders. Their study suggests that poor working memory performance may predict higher brain lactate levels.

      However, the study has some significant limitations. One major concern is that the authors examined whole-brain pH and lactate levels, which might not fully represent the complexity of disease states. Different brain regions and cell types may have distinct protein and metabolite profiles, leading to diverse disease outcomes. For instance, certain brain regions like the hippocampus and nucleus accumbens exhibit opposite protein/signaling pathways in neuropsychiatric disease models.

      We want to thank the reviewer for the valuable suggestions. To address this issue, it is necessary to comprehensively identify brain regions and cell types responsible for pH and lactate changes in each strain/condition of animals, as these may differ among them. Subsequently, based on such findings, we can then proceed with functional investigations that specifically target the identified brain regions/cell types. However, conducting such investigations would require a significant amount of time to complete, approximately 2–3 years, and is beyond the scope of this study. Therefore, we would like to conduct such studies in the future. We have mentioned this limitation by revising the discussion section of this study as follows (page 43, line 5):

      Original text

      "Because we used whole brain samples to measure pH and lactate levels, we could not determine whether the observed changes in pH and/or lactate levels occurred ubiquitously throughout the brain or selectively in specific brain region(s) in each strain/condition of the models. Indeed, brain region-specific increases in lactate levels were observed in human patients with ASD in an MRS study (Goh et al., 2014). Furthermore, while increased lactate levels were observed in whole-brain measurements in mice with chronic social defeat stress (Figure S7) (Hagihara et al., 2021a), decreased lactate levels were found in the dorsomedial prefrontal cortex (Yao et al., 2023). The brain region-specific changes may occur even in animal models in which undetectable changes were observed in the present study. This could be due to the masking of such changes in the analysis when using whole-brain samples. Further studies are needed to address this issue by measuring microdissected brain samples and performing in vivo analyses using pH- or lactate-sensitive biosensor electrodes (Marunaka et al., 2014; Newman et al., 2011) and MRS (Davidovic et al., 2011)."

      Revised text

      "The major limitations of this study include the absence of analyses specific to brain regions or cell types and the lack of functional investigations. Because we used whole brain samples to measure pH and lactate levels, we could not determine whether the observed changes in pH and/or lactate levels occurred ubiquitously throughout the brain or selectively in specific brain region(s) in each strain/condition of the models. It is known that certain molecular expression profiles and signaling pathways display brain region-specific alterations, and in some cases, even exhibit opposing changes in neuropsychiatric disease models (Hosp et al., 2017; Floriou-Servou et al. 2018; Reim et al., 2017). Indeed, brain region-specific increases in lactate levels were observed in human patients with ASD in an MRS study (Goh et al., 2014). Furthermore, while increased lactate levels were observed in whole-brain measurements in mice with chronic social defeat stress (Figure S7) (Hagihara et al., 2021a), decreased lactate levels were found in the dorsomedial prefrontal cortex (Yao et al., 2023). Additionally, it has been reported that the basal intracellular pH differs between neurons and astrocytes (lower in astrocytes than in neurons), and their responsiveness to conditions simulating neural hyperexcitation and the metabolic acidosis in terms of intracellular pH also varies (Raimondo et al., 2016; Salameh et al., 2017). It would also be possible that the brain region/cell type-specific changes may occur even in animal models in which undetectable changes were observed in the present study. This could be due to the masking of such changes in the analysis when using whole-brain samples. Given the assumption that the brain regions and cell types responsible for pH and lactate changes vary across different strains/conditions, comprehensive studies are needed to thoroughly examine this issue for each animal model individually. This can be achieved through techniques such as evaluating microdissected brain samples, conducting in vivo analyses using pH- or lactate-sensitive biosensor electrodes (Marunaka et al., 2014; Newman et al., 2011), and MRS (Davidovic et al., 2011). Subsequently, based on such findings, it is also necessary to conduct functional analyses for each model animal by manipulating pH or lactate levels in specific brain regions/cell types and evaluating behavioral phenotypes relevant to neuropsychiatric disorders."

      Moreover, the memory tests used in the study are specific to certain brain regions, but the authors did not measure lactate levels in those regions. Without making lactate measurements in brain-regions and cell types involved in these diseases, any conclusions regarding the role of lactate in CNS diseases is premature.

      Regarding the point about “lactate measurements in brain-regions and cell types involved in these diseases,” please refer our responses provided above.

      Additionally, evidence suggests that exogenous treatment with lactate has positive effects, such as antidepressant effects in multiple disease models (Carrard et al., 2018, Carrard et al., 2021, Karnib et al., 2019, Shaif et al., 2018). It also promotes learning, memory formation, neurogenesis, and synaptic plasticity (Suzuki et al., 2011, Yang et al., 2014, Weitian et al., 2015, Dong et al., 2017, El Hayek et al. 2019, Wang et al., 2019, Lu et al., 2019, Lev-Vachnish et a.l, 2019, Descalzi G et al., 2019, Herrera-López et al., 2020, Ikeda et al., 2021, Zhou et al., 2021,Roumes et al., 2021, Frame et al., 2023, Akter et al., 2023).

      We thank the reviewer for pointing out many references regarding the effects of lactate that were not cited in our paper. We have since included these studies and discussed in more detail the effect of lactate at molecular, cellular, and behavioral levels (page 39, line 11).

      Original text

      "Moreover, increased lactate may have a positive or beneficial effect on memory function to compensate for its impairment, as lactate administration with an associated increase in brain lactate levels attenuates cognitive deficits in human patients (Bisri et al., 2016) and rodent models (Rice et al., 2002) of traumatic brain injury. In addition, lactate administration exerts antidepressant effects in a mouse model of depression (Carrard et al., 2016)."

      Revised text

      "Moreover, increased lactate may have a positive or beneficial effect on memory function to compensate for its impairment, as lactate administration with an associated increase in brain lactate levels attenuates cognitive deficits in human patients (Bisri et al., 2016) and rodent models (Rice et al., 2002) of traumatic brain injury. In addition, lactate administration exerts antidepressant effects in a mouse model of depression (Carrard et al., 2021, 2016; Karnib et al., 2019; Shaif et al., 2018). Lactate has also shown to promote learning and memory (Descalzi G et al., 2019; Dong et al., 2017; Hayek et al. 2019; Lu et al., 2019; Roumes et al., 2021; Suzuki et al., 2011), synaptic plasticity (Herrera-López et al., 2020; Yang et al., 2014; Zhou et al., 2021), adult hippocampal neurogenesis (Lev-Vachnish et al., 2019), and mitochondrial biogenesis and antioxidant defense (Akter et al., 2023), while its effects on adult hippocampal neurogenesis and learning and memory are controversial (Ikeda et al., 2021; Lev-Vachnish et al., 2019; Wang et al., 2019)."

      In conclusion, the relevance of total brain pH and lactate levels as indicators of the observed correlations is controversial, and evidence points towards lactate having more positive rather than negative effects. It is important that the authors perform studies looking at brain-region-specific concentrations of lactate and that they modulate lactate levels (decrease) in animal models of disease to validate their conclusions. it is also important to consider the above-mentioned studies before concluding that "altered brain pH and lactate levels are rather involved in the underlying pathophysiology of some patients with neuropsychiatric disorders" and that "lactate can serve as a potential therapeutic target for neuropsychiatric disorders".

      Regarding the points about positive effects of lactate, measurement of brain-region-specific lactate concentrations, and modulation of lactate levels, please refer to our responses provided earlier. The points raised by the reviewer are important and should be addressed in future studies.

      Reviewer #2 (Recommendations For The Authors):

      • Measure lactate in specific brain regions. The whole brain measurements are not relevant to the disease states.

      We thank the reviewer for pointing this out. We totally agree with the reviewer’s comment and recognize that the lack of investigations in specific brain regions is one of the major limitations of this study. To address this issue, it is necessary to comprehensively identify brain regions and cell types responsible for pH and lactate changes in each strain/condition of animals, as these may differ among them. Subsequently, based on such findings, we can then proceed with functional investigations that specifically target the identified brain regions/cell types. However, conducting such investigations would require a significant amount of time to complete, approximately 2–3 years, and is beyond the scope of this study. Therefore, we would like to conduct such studies in the future. We have mentioned this limitation by revising the discussion section of this study as follows (page 43, line 5):

      Original text

      "Because we used whole brain samples to measure pH and lactate levels, we could not determine whether the observed changes in pH and/or lactate levels occurred ubiquitously throughout the brain or selectively in specific brain region(s) in each strain/condition of the models. Indeed, brain region-specific increases in lactate levels were observed in human patients with ASD in an MRS study (Goh et al., 2014). Furthermore, while increased lactate levels were observed in whole-brain measurements in mice with chronic social defeat stress (Figure S7) (Hagihara et al., 2021a), decreased lactate levels were found in the dorsomedial prefrontal cortex (Yao et al., 2023). The brain region-specific changes may occur even in animal models in which undetectable changes were observed in the present study. This could be due to the masking of such changes in the analysis when using whole-brain samples. Further studies are needed to address this issue by measuring microdissected brain samples and performing in vivo analyses using pH- or lactate-sensitive biosensor electrodes (Marunaka et al., 2014; Newman et al., 2011) and MRS (Davidovic et al., 2011)."

      Revised text:

      "The major limitations of this study include the absence of analyses specific to brain regions or cell types and the lack of functional investigations. Because we used whole brain samples to measure pH and lactate levels, we could not determine whether the observed changes in pH and/or lactate levels occurred ubiquitously throughout the brain or selectively in specific brain region(s) in each strain/condition of the models. It is known that certain molecular expression profiles and signaling pathways display brain region-specific alterations, and in some cases, even exhibit opposing changes in neuropsychiatric disease models (Hosp et al., 2017; Floriou-Servou et al. 2018; Reim et al., 2017). Indeed, brain region-specific increases in lactate levels were observed in human patients with ASD in an MRS study (Goh et al., 2014). Furthermore, while increased lactate levels were observed in whole-brain measurements in mice with chronic social defeat stress (Figure S7) (Hagihara et al., 2021a), decreased lactate levels were found in the dorsomedial prefrontal cortex (Yao et al., 2023). Additionally, it has been reported that the basal intracellular pH differs between neurons and astrocytes (lower in astrocytes than in neurons), and their responsiveness to conditions simulating neural hyperexcitation and the metabolic acidosis in terms of intracellular pH also varies (Raimondo et al., 2016; Salameh et al., 2017). It would also be possible that the brain region/cell type-specific changes may occur even in animal models in which undetectable changes were observed in the present study. This could be due to the masking of such changes in the analysis when using whole-brain samples. Given the assumption that the brain regions and cell types responsible for pH and lactate changes vary across different strains/conditions, comprehensive studies are needed to thoroughly examine this issue for each animal model individually. This can be achieved through techniques such as evaluating microdissected brain samples, conducting in vivo analyses using pH- or lactate-sensitive biosensor electrodes (Marunaka et al., 2014; Newman et al., 2011), and MRS (Davidovic et al., 2011). Subsequently, based on such findings, it is also necessary to conduct functional analyses for each model animal by manipulating pH or lactate levels in specific brain regions/cell types and evaluating behavioral phenotypes relevant to neuropsychiatric disorders."

      • Discuss in detail the studies that show the neuroprotective effects of lactate and reconcile these with the authors' conclusions.

      As suggested by the reviewer, we have discussed in more detail the positive effect of lactate at molecular, cellular, and behavioral levels as below (page 39, line 11):

      Original text

      "Moreover, increased lactate may have a positive or beneficial effect on memory function to compensate for its impairment, as lactate administration with an associated increase in brain lactate levels attenuates cognitive deficits in human patients (Bisri et al., 2016) and rodent models (Rice et al., 2002) of traumatic brain injury. In addition, lactate administration exerts antidepressant effects in a mouse model of depression (Carrard et al., 2016)."

      Revised text

      "Moreover, increased lactate may have a positive or beneficial effect on memory function to compensate for its impairment, as lactate administration with an associated increase in brain lactate levels attenuates cognitive deficits in human patients (Bisri et al., 2016) and rodent models (Rice et al., 2002) of traumatic brain injury. In addition, lactate administration exerts antidepressant effects in a mouse model of depression (Carrard et al., 2021, 2016; Karnib et al., 2019; Shaif et al., 2018). Lactate has also shown to promote learning and memory (Descalzi G et al., 2019; Dong et al., 2017; Hayek et al. 2019; Lu et al., 2019; Roumes et al., 2021; Suzuki et al., 2011), synaptic plasticity (Herrera-López et al., 2020; Yang et al., 2014; Zhou et al., 2021), adult hippocampal neurogenesis (Lev-Vachnish et al., 2019), and mitochondrial biogenesis and antioxidant defense (Akter et al., 2023), while its effects on adult hippocampal neurogenesis and learning and memory are controversial (Ikeda et al., 2021; Lev-Vachnish et al., 2019; Wang et al., 2019)."

      • Conduct experiments whereby you decrease/deplete/modulate lactate levels in animal models and show that there is amelioration of the symptoms.

      Regarding this point, kindly refer to the responses we provided in the first comment from the reviewer. We have mentioned this limitation by revising the discussion section of this study as follows (page 43, line 5):

      Original text

      "Because we used whole brain samples to measure pH and lactate levels, we could not determine whether the observed changes in pH and/or lactate levels occurred ubiquitously throughout the brain or selectively in specific brain region(s) in each strain/condition of the models. Indeed, brain region-specific increases in lactate levels were observed in human patients with ASD in an MRS study (Goh et al., 2014). Furthermore, while increased lactate levels were observed in whole-brain measurements in mice with chronic social defeat stress (Figure S7) (Hagihara et al., 2021a), decreased lactate levels were found in the dorsomedial prefrontal cortex (Yao et al., 2023). The brain region-specific changes may occur even in animal models in which undetectable changes were observed in the present study. This could be due to the masking of such changes in the analysis when using whole-brain samples. Further studies are needed to address this issue by measuring microdissected brain samples and performing in vivo analyses using pH- or lactate-sensitive biosensor electrodes (Marunaka et al., 2014; Newman et al., 2011) and MRS (Davidovic et al., 2011)."

      Revised text:

      "The major limitations of this study include the absence of analyses specific to brain regions or cell types and the lack of functional investigations. Because we used whole brain samples to measure pH and lactate levels, we could not determine whether the observed changes in pH and/or lactate levels occurred ubiquitously throughout the brain or selectively in specific brain region(s) in each strain/condition of the models. It is known that certain molecular expression profiles and signaling pathways display brain region-specific alterations, and in some cases, even exhibit opposing changes in neuropsychiatric disease models (Hosp et al., 2017; Floriou-Servou et al. 2018; Reim et al., 2017). Indeed, brain region-specific increases in lactate levels were observed in human patients with ASD in an MRS study (Goh et al., 2014). Furthermore, while increased lactate levels were observed in whole-brain measurements in mice with chronic social defeat stress (Figure S7) (Hagihara et al., 2021a), decreased lactate levels were found in the dorsomedial prefrontal cortex (Yao et al., 2023). Additionally, it has been reported that the basal intracellular pH differs between neurons and astrocytes (lower in astrocytes than in neurons), and their responsiveness to conditions simulating neural hyperexcitation and the metabolic acidosis in terms of intracellular pH also varies (Raimondo et al., 2016; Salameh et al., 2017). It would also be possible that the brain region/cell type-specific changes may occur even in animal models in which undetectable changes were observed in the present study. This could be due to the masking of such changes in the analysis when using whole-brain samples. Given the assumption that the brain regions and cell types responsible for pH and lactate changes vary across different strains/conditions, comprehensive studies are needed to thoroughly examine this issue for each animal model individually. This can be achieved through techniques such as evaluating microdissected brain samples, conducting in vivo analyses using pH- or lactate-sensitive biosensor electrodes (Marunaka et al., 2014; Newman et al., 2011), and MRS (Davidovic et al., 2011). Subsequently, based on such findings, it is also necessary to conduct functional analyses for each model animal by manipulating pH or lactate levels in specific brain regions/cell types and evaluating behavioral phenotypes relevant to neuropsychiatric disorders."

      Other corrections

      Title page and Acknowledgements:

      We have revised the affiliation information for the following co-authors: Drs. Anja Urbach8, Mohamed Darwish19, 20, Keizo Takao20, 22, Bong-Kiun Kaang53, 54, Michihiro Igarashi74, 75, Rie Ohashi87-89, and Nobuyuki Shiina87-89.

      Page 56, line 12:

      The term ‘The International Brain pH Consortium’ has been corrected to ‘The International Brain pH Project Consortium’.

      Supplementary Table 1: Supplementary References:

      1. Oota-Ishigaki A, Takao K, Yamada D, Sekiguchi M, Itoh M, Koshidata Y, et al. (2022): Prolonged contextual fear memory in AMPA receptor palmitoylation-deficient mice. Neuropsychopharmacology 47: 2150–2159.

      We have updated the name of the mouse strain from “patDp” to “15q dup” throughout the manuscript.
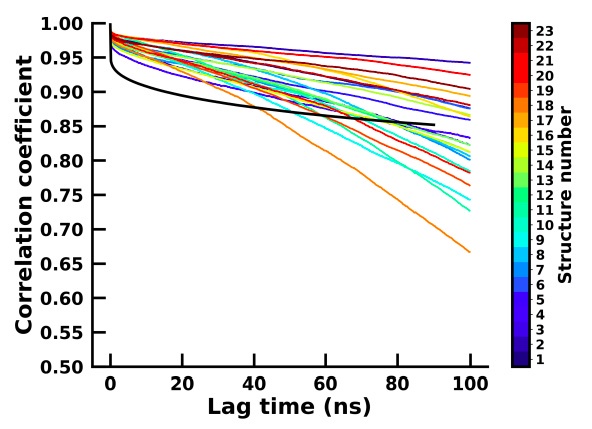
      We have made the following revisions to enhance readability.

      Page 24, line 9: According to a simple correlation analysis, working memory measures (correct responses in the maze test) were significantly negatively correlated with brain lactate levels (r = -0.76, P = 1.93 × 10⁻⁵; Figure 1F).

      Page 27, line 1:

      Revised text

      "We found that working memory measures (correct responses in the maze test) were the most frequently selected behavioral measures for constructing a successful prediction model (Figure 2E), which is consistent with the results of the exploratory study (Figure 1E)."

      Figure 1 legend:

      Revised text

      "(F–H) Scatter plot showing correlations between actual brain lactate levels and measures of working memory (correct responses in the maze test) (F), the number of transitions in the light/dark transition test (G), and the percentage of immobility in the forced swim test (H)."

      Figure 2 legend:

      Revised text

      "(F–H) Scatter plots showing correlations between actual brain lactate levels and working memory measures (correct responses in the maze test) (F), the acoustic startle response at 120 dB (G), and the time spent in dark room in the light/dark transition test (H)."

      Page 30, line 2:

      Original text

      "The high to moderate-high pH/low to moderate-low lactate group included mouse models of ASD or developmental delay, such as Shank2 KO, Fmr1 KO, BTBR, Stxbp1 KO, Dyrk1 KO, Auts2 KO, and patDp mice (Table S1, Figure S7)."

      Revised text

      "The high pH/low lactate group and moderate-high pH/moderate-low lactate group included mouse models of ASD or developmental delay, such as Shank2 KO, Fmr1 KO, BTBR, Stxbp1 KO, Dyrk1 KO, Auts2 KO, and 15q dup mice (Table S1, Figure S7)."

      Page 40, line 7:

      Original text

      "Moreover, increased lactate levels may also be involved in behavioral changes other than memory deficits such as anxiety."

      Revised text

      "Moreover, increased lactate levels may also be involved in behavioral changes other than memory deficits, such as anxiety."

    1. Author Response

      The following is the authors’ response to the original reviews.

      Reviewer #1 (Public Review):

      The experimental design presented cannot clearly show that the effect of passive exposure was due to the specific exposure to task-relevant stimuli since there is no control group exposed to irrelevant stimuli.

      We acknowledge the possibility that exposure to task-irrelevant stimuli could result in improvements in learning. Testing this possibility would be a worthwhile goal of future experiments, but it is outside the scope of our current study. We have been careful in our paper to only draw conclusions about the effects of exposure to task-relevant stimuli compared to no exposure. We have added a discussion of this point and relevant references to the literature in the Discussion section of our manuscript.

      The conclusion that "passive exposure influences responses to sounds not used during training" (line 147) does not seem fully supported by the authors' analysis. The authors show that there is an increase in accuracy for intermediate sweep speeds despite the fact that this is the first time the animals encounter them in the active session. However, it seems impossible to exclude that this effect is not simply due to the increased accuracy of the extreme sounds that the animals had been trained on.

      We have modified this sentence to emphasize that it refers to “intermediate” sounds. Regarding the reviewer’s concern, the conclusion is drawn from Figure 3, in which we show that mice exhibit an improvement on non-extreme stimuli after training on extreme stimuli. Panel 3D illustrates that the observed improvements are not just changes in psychometric performance driven by the extreme sounds. In the context of this result, the conclusion relates to generalization in performance on task-relevant stimuli that are closely related to the training stimuli. In our view, it was not entirely obvious a priori that this result would have to occur, since it is possible that performance could improve at the extremes without improving at the intermediate stimuli.

      In the modelling section, the authors adjusted the hyper-parameters to maximize the difference between pure active and passive/active learning. This makes a comparison of learning rates between models somewhat confusing.

      We apologize for the confusion. None of our conclusions are based on comparisons of learning speed between models, but perhaps this was not pointed out sufficiently clearly. The relevant comparisons between conditions for each specific model are made using the same hyperparameters. We have clarified this point in the modeling section of our manuscript.

      The description of the sound does not state whether when reducing the slope of the sweeps the center or the onset frequency of the sounds is preserved.

      Frequency modulated sounds of different FM slopes were generated such that the center frequency was always the same. This is now clarified in the updated version of the manuscript.

      Reviewer #1 (Recommendations for the authors):

      As mentioned, the specificity of the stimuli presented during the passive period is not explicitly addressed in either modelling or behaviour. For modelling, this could be quite straightforward to assess by manipulating the input stimuli during passive episodes. For the behaviour, this would require repeating the experiment with passive sessions during which unrelated sounds are presented (for example varying in frequency or intensity instead of frequency slope). I mainly include this suggestion to clarify my previous comment because this would require a huge amount of work.

      We agree that varying the extent to which the presented passive stimuli are task-related to the task is an interesting point to study for future experiments. However, doing so for the experiments is outside the scope of the current study, and we believe exploring this only in the modeling part would add little value to the current study, because the outcome will highly depend on the details of the implementation.

      Reviewer #2 (Public Review):

      One limitation here is that the presented analysis is somewhat simplistic, does not include any detailed psychometric analysis (bias, lapse rates etc), and primarily focuses on learning speed.

      In our preliminary analyses of trials that included extreme and intermediate stimuli after animals had learned the task (Figure 3), we investigated some metrics of the type that the reviewer suggests here. However, since such additional psychometric analyses were somewhat tangential to our main results (which are about learning speed and responses to sounds not included during training), we did not include these in our manuscript. In agreement with the reviewer’s concern, a main limitation of our study is that the available data does not allow for an analysis of psychometrics during the initial learning stages, since only the extreme stimuli were presented during the task.

      Reviewer #2 (Recommendations for the authors):

      The International Brain Lab has shown quite nicely that psychometric curves continue to improve (increased slope, decreased bias) across learning. This was not really discussed or presented in your data - is this observed during the S4 training portion?

      We indeed saw improvements in the psychometric performance during stage S4, in particular for the active-only learners, as can be seen in Figure 3. We quantified these changes (now presented in the Results section), and added a discussion to the main text.

      Why use a linear fit to extract the various quantities of interest? All of these quantities could be extracted from the raw behavioral data itself.

      Because of the large variations in performance from day-to-day, a linear fit allowed us to extract a more reliable estimate of quantities like “Time to achieve 70%” and “Performance at 21 days” for each animal.

      The analysis presented was focussed primarily on the fast learners. What about the slow learners? Are the ANN models able to recapitulate different aspects of their behavior?

      We agree with the reviewer that the observation that the learners clustered into two groups calls for further investigation. In this study, we focused on the mice that learned more efficiently, because those allowed us to address our main research question about the influence of passive exposure. We believe, the slow learners could be modeled with ANNs that start with a less-easily discriminable input representation, which limits the performance that the trained network is ultimately able to achieve. This additional analysis is outside the scope of the current manuscript, but we hope to address these questions in the future.

      Although I appreciate the thoroughness of the modeling, I was not entirely convinced by the narrative underlying models 1-5, since none of these models were able to successfully recapitulate your core findings. Would it not make more sense to focus primarily on the final model?

      By starting with the simplest possible model that incorporates supervised and unsupervised learning, we were able to determine which ingredients were necessary to capture the behavioral data. We believe this could not have been clearly established by considering the final model alone.

      Reviewer #3 (Public Review):

      The first [major weakness] is that even Model 5 differs from their data. For example, the A+P (passive interleaved condition) learning curve in Figure 7 seems to be non-monotonic, and has some sort of complex eigenvalue in its decay to the steady state performance as trials increase. This wasn't present in their experimental data (Figure 2D), and implies a subtle but important difference. There also appear to be differences in how quickly the initial learning (during early trials) occurs for the A+P and A:P conditions. While both A+P and A:P conditions learn faster than A only in M5, A+P and A:P seem to learn in different ways, which isn't supported in their data.

      The reviewer is correct that there are subtle differences between the two learning curves produced by Model 5. Due to expected variability in the experimental data, however, it is difficult to conclude whether such subtle distinctions also appear in the learning curves of the mice. Further, the slight overshoot of the learning curve that the reviewer mentions is not constrained by the experimental data due to different mice reaching asymptotic performance at different times, and many of them not having even reached asymptotic performance by the end of the training period.

      However, even if there are minor discrepancies between the learning curves produced by the final version of the model and by the mice, we do not see this as being especially surprising or problematic. As in any model, there are a large number of potentially important features that are not included in any of our models–for example, realistic spectrotemporal neural responses, nonlinearity in neural activations, heterogeneity across mice, and many others. The aim of our modeling was to choose a space of possible models (which is inevitably restricted) and show which model version within that space best captures our experimental observations. Expanding the space of possible models that we considered to capture further nuances in the data will be a task for future work.

      The second major weakness is that the authors also don't generate any predictions with M5. Can they test this model of learning somehow in follow-up behavioural experiments in mice? ... Without follow-up experiments to test their mechanism of why passive exposure helps in a schedule-independent way, the impact of this paper will be limited.

      Although testing predictions from our models was beyond the scope of the current study, we do generate specific predictions with model M5 (in particular, about neural representations). Our model produces predictions about neural representations and the ways in which they evolve through learning, and we hope to test these predictions in future work.

      I believe the authors need to place this work in the context of a large amount of existing literature on passive (unsupervised) and active (supervised) learning interactions. This field is broad both experimentally and computationally. For example, there is an entire sub-field of machine learning, called semi-supervised learning that is not mentioned at all in this work.

      We thank the reviewer for pointing this out. The Discussion section of the updated manuscript now includes a discussion on how our results fit in with this literature.

      Reviewer #3 (Recommendations for the authors):

      All points made by the reviewer in their Recommendations For The Authors are associated with those presented in the Public Review and they are addressed in our response above.

    1. Author Response

      The following is the authors’ response to the previous reviews.

      eLife assessment

      This is a valuable study of Eph-Ephrin signaling mechanisms generating pathological changes in amyotropic lateral sclerosis. There are exciting findings bearing on the role of glial cells in this pathology. The study emerges with solid evidence for a novel astrocyte-mediated mechanism for disease propagation. It may help identify potential therapeutic targets.

      Response to Editor’s decision letter: Drs. Huang and Zaidi: Thank you for considering this re-revision of our manuscript for potential publication in eLife. We have addressed the remaining comments of reviewer #2. We have included detailed response-to-reviewer comments below to address each of these remaining specific points from reviewer #2, and we have highlighted all the changes in the manuscript text (using a red font color) made in response to these comments. Based on the reviewers’ critiques, we feel our re-working of the manuscript has made for a greatly improved study.

      Reviewer #1 (Recommendations For The Authors):

      Reviewer comment: All questions/concerns have been addressed.

      Response: We thank Reviewer #1 for the previous helpful comments that we used to improve our manuscript. As Reviewer #1 has no new comments, we have provided no additional responses to address this reviewer’s input. Instead, we only focus (in this new “Response to Reviewer Comments” document) on the remaining points from Reviewer #2 below.

      Reviewer #2 (Recommendations For The Authors):

      Overall, the authors have addressed most concerns raised in the prior review. A couple of very minor points remain, which would improve the clarity of the report.

      Reviewer comment 1: The abstract has not been edited and still emphasizes that astrocyte-mediated upregulation in ephrinB2 signaling underlies pathogenicity in mutant SOD1-associated ALS. There is certainly sufficient evidence to suggest a large role for astrocytes, however, without a thorough investigation of other key cell types in the spinal cord, this cannot be concluded specifically. Especially given that a non-specific promoter (U6) was employed in the viral constructs.

      Response: We apoplogize for this mistake. In response to the reviewer’s previous comment in the first round of review, we made changes throughout the manuscript to address this issue; however, we failed to do this in the Abstract. In this re-revised manucript, we now also make the necessary changes to the Abstract.

      Reviewer comment 2: It is interesting to note that a non-specific promoter, U6, exhibited such large specificity to astrocytes in the cord as compared to neurons (Fig 2M). This is worth discussing briefly in the discussion and how this result compares to those in the literature.

      Response: We have now added a brief discussion of this issue to the Discussion section, including describing our previous studies that used the Gfa2 promotor to achieve astrocyte-specific transduction when employing viral vectors in the rodent spinal cord.

      Reviewer comment 3: I appreciate the authors including a supplemental figure on the expression of ephrinA4 receptors in the cervical ventral horn. Unfortunately, the quality of this image is very poor in conveying the receptor expression. The detailed discussion point on the expression of EphB receptors in the cervical ventral horn should be sufficient for readers to take into consideration.

      Response: We have now removed this supplemental figure and keep only the text from the rerevised manuscript.

      Reviewer comment 4: A few instances of motor neuron diameter being attributed to a 200μm2 size remain (e.g. pg 14).

      Response: We have corrected this issue throughout the re-revised manuscript. The correct information is: somal diameter greater than 20 μm.

      Reviewer comment 5: It is still a little unclear in the result text as to when assessment of lentiviral transduction was conducted following intraspinal injections.

      Response: We have now added this detail about the time point of assessing transduction to both the Results section and the Materials/Methods section.

      Reviewer comment 6: Some figures are missing markers of significance (e.g. Fig 2M).

      Response: Below are our comments about significance markers for each graph in all figures.

      Figure 1:

      Panel E: We have now added asterisks for any statistically-significant comparisons. In addition, we provide the details of this statistical analysis in the text of the re-revised manuscript.

      Figure 2:

      Panel M: We have now added asterisks for statistical comparisons, as well as details in the text.

      Panel N: The asterisk was already shown in the previous version of the figure.

      Figure 3:

      Panels B and G: The asterisks were already shown in the previous version of the figure.

      Figure 4:

      All panels: There are no significant differences; therefore, no asterisks are needed.

      Figure 5:

      Panel F and G: The asterisks were already shown in the previous version of the figure.

      Panel H: The difference is not statistically-signficant.

      Figure 6: No graphs are shown in this figure.

      Reviewer comment 7: Since a wild type mouse control has not been included in the quantification of diaphragm NMJ innervation with and without ephrin knock-down, it would be useful to include a description or discussion on the phenotype of NMJ denervation exhibited in the SOD1G93A mouse model of ALS.

      Response: We have now added description of diaphragm NMJ denervation that occurs in SOD1G93A mice, in particular at the age/time point of our NMJ analysis.

    1. Author Response

      The following is the authors’ response to the original reviews.

      eLife Assessment

      This valuable manuscript investigates the roles of DKK3 in AD synapse integrity. Although previous work has identified the involvement of Wnt and DKK1 in synaptic physiology, this study provides compelling evidence that suppression of DKK3 rescues the changes in excitatory synapse numbers, as well as memory deficits in an established AD model mice. The authors provide both gain and loss of function data that support the main conclusion and advance our understanding of the mechanisms by which Wnt pathway mediates early synaptic dysfunction in AD models.

      Public Reviews:

      Reviewer #1 (Public Review):

      In this study, Nuria Martin-Flores, Marina Podpolny and colleagues investigate the role of Dickkopf-3 (DKK3), a Wnt antagonist in synaptic dysfunction in Alzheimer's disease. Loss of synapses is a feature of Alzheimer's and other forms of dementia such as frontotemporal dementia and linked amyotrophic lateral sclerosis (FTD). The authors utilise a broad range of experimental approaches. They show that DKK3 levels are increased in Alzheimer's disease and that this occurs early in disease. This is an important finding since early disease changes are believed to be the most important. They also show increases in DKK3 in transgenic mouse models of Alzheimer's disease and that DKK3 knockdown restores synapse number and memory in one such model. Finally, they link these DKK3 increases to loss of excitatory synapses via the blockade of the Wnt pathway and subsequent activation of GSK3B; GSK3B is strongly linked to both Alzheimer's disease and FTD. The quality of the data is good and the conclusions well supported by these data. There are no major weaknesses. The findings support studies that target the Wnt pathway as a potential therapeutic for Alzheimer's disease.

      Reviewer #2 (Public Review):

      This manuscript by Martin-Flores et al., has examined the role of DKK3 in Alzheimer's disease, focusing on the regulation of synaptic numbers. By using human AD brain databases and tissue samples, the authors showed that DKK3 protein and mRNA levels are increased in the brains of AD patients. DKK3 is expressed in the excitatory neurons in WT mouse brains and accumulates at atrophic neurites around amyloid plaques in AD mouse brains. Interestingly, secretion of DKK3 appears to be regulated by NMDAR antagonist as well as chemical LTD. Through gain and loss of function studies, the authors showed that DKK3 regulates the number of excitatory as well as inhibitory synapses with distinct downstream pathways. Finally, the authors investigated the contribution of DKK3 to synaptic changes in AD and found that DKK3 loss of function rescues both the excitatory and inhibitory synaptic defects, resulting in the improvement of memory function in J20 mice.

      Overall, the data is clearly presented and deals with novel roles of DKK3 in controlling excitatory and inhibitory synapses. The finding that shRNA expression of DKK3 in AD model mice rescues synaptic phenotypes and memory impairment is potentially interesting and may provide a new strategy for AD treatment.

      We would like to thank the Editors and the Reviewers for their very insightful suggestions. We are delighted to receive very positive reviews of our manuscript. In response to the comments made by the reviewers, we have carried out an extensive revision of our manuscript. In the revised manuscript, we have addressed all the comments made by the reviewers.

      Recommendations for the authors:

      Reviewer #1:

      My only comment regards the role of GSK3B activation in synaptic dysfunction and its targets. GSK3B is a Tau kinase but is also involved in IP3 receptor delivery of Ca2+ to mitochondria. This delivery is major regulator of mitochondrial ATP production and synaptic function is heavily dependent on ATP. Both Alzheimer's disease and FTD insults have been linked to GSK3B activation -see for e.g. Szabo EMBO R 2023, Gomez-Suaga Aging Cell 2022. It might be valuable to readers for the authors to speculate briefly on potential GSK3B synaptic targets in the Discussion.

      We appreciate the reviewer for this suggestion. In the Discussion, we now included how GSK3β may contribute to synaptic dysfunction and loss in the context of increased DKK3 levels and in Alzheimer’s disease.

      Reviewer #2:

      1. In Fig 1B, the authors showed that soluble DKK3 levels were increased in Braak 1-3 patients, while no changes were observed in Braak 4-5. If the secretion of DKK3 is dependent on NMDAR activity, does this data imply that Braak 4-5 patients have reduced NMDAR activity in general, resulting in the reduced DKK3 release even with the increased mRNA levels? It would be interesting to test this hypothesis in a mouse AD model.

      In Figure 1B, we analyzed the levels of soluble and insoluble DKK3 in the hippocampus of AD patients at different disease stages based on their Braak stages. As the reviewer indicated, soluble levels of DKK3 were increased in patients with Braak I-III but not at later stages. Importantly, DKK3 levels were also elevated in Braak IV-VI patients, but only in the insoluble fraction (Figure 1C), suggesting that DKK3 could accumulate within Aβ aggregates. Based on these findings, we cannot conclude that DKK3 release is reduced at later stages of the disease in patients.

      To explore the underlying mechanisms regulating DKK3 levels, we used cultured hippocampal neurons and AD mouse brain slices. In mouse models, we have demonstrated that extracellular DKK3 levels (secreted DKK3 fraction) depends on NMDAR activation early in the disease progression (Figure 2E, F). Moreover, we also provide new data showing that antagonizing NMDAR partially blocks the increase of DKK3 extracellular levels induced by oligomeric Aβ (see response to question 4 of this reviewer and Figure S2G, H). It is well established that oligomeric Aβ promotes hyperexcitability through, in part, the aberrant activation of NMDAR (Li S et al., 2011, PMID: 21543591; Mucke L and Selkoe DJ et al., 2012, PMID: 22762015). In line with this, NMDAR blockers prevent Aβ-induced synapse loss and improve cognition in AD models (Hu NW et al., 2009, PMID: 19918059; Ye C et al., 2004, PMID: 15288443). In addition, an NMDAR antagonist is currently approved as a drug treatment for AD patients (Cumming J 2021, PMID: 33441154). Together, our findings in dissociated neurons, AD mouse brain and human samples indicate that soluble Aβ oligomers promote the release of DKK3 through NMDAR activation and suggest that this mechanism might also be occurring in the brain of AD patients.

      1. Recent work (Yuan et al., 2022, Nature) has shown that dystrophic neurites/axonal spheroids found around Aβ deposits are filled with neuronal endolysosomes. Are DKK3 in ThioS positive amyloid plaques located in endolysosomes of these axonal spheroids? If so, does this data mean that DKK3 in Fig 2B-D represents the entrapped DKK3 protein population that fails to be secreted from dystrophic neurites?

      The reviewer points an interesting question. Our results show that secretion of DKK3 is increased in two AD models before substantial plaque load. Later in the disease, DKK3 accumulates in dystrophic neurites (visualized as axonal spheroids) surrounding amyloid plaques. To address if DKK3 protein is located in vesicles of the endolysosomal pathway within axonal spheroids, we performed co-localization analyses of DKK3 and the endolysosomal marker LAMP1. We found that DKK3 colocalized with LAMP1 (Figure 2D) indicating the presence of DKK3 in axonal spheroids. These results indeed suggest that DKK3 is present in abnormally enlarged vesicles in dystrophic neurites around Aβ plaques. This could affect the axonal transport of DKK3. Given that proteins present in dystrophic neurites have been correlated with defects in bidirectional transport in the axon (Stokin GB et al., 2005, PMID: 15731448; Sadleir KR et al., 2016, PMID: 26993139), both DKK3 turnover and secretion could be affected.

      1. Why does only LTD induce DKK3 release? Why not general activation of neuronal activity? It would be important to test the relationship between DKK3 secretion and neuronal activity with optogenetics and chemogenetics.

      We tested whether neuronal activity triggered increased extracellular DKK3 levels by subjecting neurons to chemical long-term potentiation (cLTP) or long-term depression (cLTD). However, only cLTD increased extracellular DKK3, which we then confirmed in brain slices (Figure S3). This finding is not unexpected as it is well described that different patterns of activity can lead to different molecular outcomes. For example, high-frequency stimulation (HFS; an activity pattern that resembles LTP) and low-frequency stimulation (LFS; a different activity pattern resembling LTD) leads to opposing effects on surface levels of the Wnt receptor Frizzled-5 (Fz5) (Sahores M et al., 2010, PMID: 20530549). Furthermore, cLTP increases Fz5 s-acylation, an important post-translational modification that regulates the surface levels of Fz5, whereas cLTD decreases it (Teo S et al., 2023, PMID: 37557176). Another example is the BDNF receptor TrkB. Surface TrkB is increased by tetanic stimulation, which also induces LTP as HFS or cLTP, but not by LFS (Du J et al., 2000, PMID: 10995446). Our findings suggest that DKK3 might contribute to synaptic changes underlying cLTD. Future experiments using chemogenetics or optogenetics might elucidate the role of DKK3 in activity-induced synaptic changes.

      1. Are Abeta oligomer treatment-dependent increases in DKK3 protein levels in the cellular lysate and the extracellular fraction also suppressed by APV?

      Our results in AD mice indicate that increased DKK3 release is dependent on NMDAR activation. To investigate if amyloid-β oligomers (Aβo) increase DKK3 levels in the cell lysate and extracellular fractions through NMDAR, we blocked these receptors in hippocampal neurons using AP-V (Figure S2G, H). In these experiments, we use a lower concentration of Aβo (200nM of Aβ1-42) to avoid any potential cytotoxic effect. In line with our previous results using a higher concentration of Aβo, we observed that Aβo markedly increased DKK3 levels both in the cell lysate and in the extracellular fraction compared to the reverse Aβ42-1 control peptide. Kruskal-Wallis with Dunn’s test showed a trend to a reduced levels of DKK3 in the extracellular fraction when we compared neurons treated with Aβo and APV with those neurons treated with Aβ and vehicle (p = 0.0726). However, this reduced levels of DKK3 in the extracellular fraction reached statistical significance using a t-test (p = 0.0384). No differences were observed between the reverse control peptide and Aβo and APV conditions. These results suggest that blockade of the NMDAR partially occludes the ability of Aβo to increase DKK3 levels in the extracellular fraction.

      1. Why does DKK3 shRNA only downregulate inhibitory synapses but not excitatory synapses in the WT brain slice? Does this mean that in the WT brain, other DKK proteins (without changes in their expression as shown in Fig S6) are sufficiently expressed and compensate for the roles of DKK3 in excitatory synapse integrity?

      The reviewer points out an interesting result. In J20 mice, DKK3 knockdown affects both excitatory and inhibitory synapse density (Figure 6B, C). In Figure 3B, D, we show that in vivo downregulation of DKK3 leads to an increased number of inhibitory synapses without affecting excitatory ones in the brain of WT animals. These results indicate that in a healthy brain (WT), DKK3 is required for the maintenance of inhibitory synapses but not for excitatory synapses under our experimental conditions. Furthermore, DKK3 partially shares the mechanism of action with DKK1 as both DKK proteins promote excitatory synapse loss through the Wnt/GSK3β pathway (Figure 4A-C) (Marzo A et al., 2016, PMID: 27593374). Therefore, it is possible that endogenous DKK1 levels in the hippocampus could compensate for the reduced expression of DKK3 resulting in the lack of changes in excitatory synapse number when DKK3 is knockdown in WT animals.

      1. Manipulating DKK3 in WT brains only affects Gephyrin but not VGAT, but in J20, both Gephyrin and VGAT seem to be affected by DKK3 shRNA (Fig 6). The authors need to provide the pre vs post synapse number in Fig 6 and discuss the potential differences.

      We have now included the quantification of excitatory and inhibitory pre- and postsynaptic puncta for 4-months old (Figure S6B, C) and 9-months old (Figure S6D, E) WT and J20 mice. At 4-months old, the density of Homer1 puncta for excitatory synapses and both vGAT and Gephyrin for inhibitory synapses was increased and decreased respectively by knocking down DKK3 in the J20 mice. At 9-months, strong trends were observed in all the synaptic markers when downregulating DKK3, but significance was only reached for Homer1 puncta.

      1. Where are the Wnt receptors expressed? Are they exclusively expressed in neurons? Can the authors exclude the potential involvement of glial cells in this process?

      In neurons, Wnt receptors can be expressed in the synaptic terminals. For example, Wnt receptor Frizzled-5 is located at the presynaptic terminal and the dendritic shaft but not at spines (Sahores M et al., 2010, PMID: 20530549; McLeod F et al., 2018, PMID: 29694885), whereas Frizzled-7 is located at the dendritic shaft and spines (McLeod F et al., 2018, PMID: 29694885). In addition, the Wnt co-receptor LRP6 is present at both pre- and postsynaptic sites in excitatory synapses (Jones ME et al., 2023, PMID: 36638182). Kremen1, another receptor for Dkk proteins, is also highly expressed in the brain and our unpublished superresolution results show that this receptor is present in both pre- and postsynaptic sites of 53% of excitatory and 30% of inhibitory synapses. However, these receptors are not exclusively expressed in neurons and many of them are also highly expressed in astrocytes (Zhang Y et al., 2016, PMID: 25186741). Based on the literature and our findings, we cannot rule out the possibility that DKK3 may signal to other cell types such as astrocytes, which could also contribute to changes in synapse density. However, recombinant DKK3 induces structural and functional changes in excitatory and inhibitory synapses within 3-4h (Figure 3), suggesting that DKK3 acts on neurons leading to synaptic changes.

      1. Does the shRNA treatment of DKK3 affect the size and number of amyloid plaques in the AD mice?

      We thank the reviewer for raising this very important question. We have now evaluated the impact of DKK3 knockdown in Aβ pathology in the J20 mice. We did not observe differences in the Aβ coverage nor the averaged number and size of Aβ plaques when DKK3 was silenced in the CA3 (Figure S6F). Therefore, the changes we observe in excitatory and inhibitory synapse density around plaques after knocking down DKK3 are unlikely to be due to changes in Aβ plaques.

    1. Author Response

      eLife assessment

      This study presents a valuable finding on the distinct subpopulation of adipocytes during brown-to-white conversion in perirenal adipose tissue (PRAT) at different ages. The evidence supporting the claims of the authors is convincing, although specific lineage tracing of this subpopulation of cells and mechanistic studies would expand the work. The work will be of interest to scientists working on adipose and kidney biology.

      Public Reviews:

      Reviewer #1 (Public Review):

      Summary:

      In this manuscript, the authors performed single nucleus RNA-seq for perirenal adipose tissue (PRAT) at different ages. They concluded a distinct subpopulation of adipocytes arises through brown-to-white conversion and can convert to a thermogenic phenotype upon cold exposure.

      Strengths:

      PRAT adipose tissue has been reported as an adipose tissue that undergoes browning. This study confirms that brown-to-white and white-to-beige conversions also exist in PRAT, as previously reported in the subcutaneous adipose tissue.

      We did not observe any white-to-beige conversion in PRAT under regular condition. The adipocyte population that arises from brown-to-white conversion (mPRAT-ad2) can respond to cold and restore their UCP1 expression. However, brown adipocytes that arise from the mPRAT-ad2 subpopulation after cold exposure have a distinct transcriptome to that of cold-induced beige adipocyte in iWAT (Figure S6K) and are more related to iBAT brown adipocytes (Figure 6E).

      Weaknesses:

      1. There is overall a disconnection between single nucleus RNA-seq data and the lineage chasing data. No specific markers of this population have been validated by staining.

      We are not sure what “this population” refers to. We suspect it is the Ucp1-&Cidea+ mPRAT-ad2 adipocyte subpopulation. If so, we did not identify specific markers for these adipocytes as shown in Figure 1H and statement in the Discussion. mPRAT-ad2 is negative for Ucp1 and Cyp2e1, which are markers for mPRAT-ad1 and mPRAT-ad3&4, respectively. Therefore, we plan to stain the mPRAT with Ucp1, Cyp2e1 and Perilipin (a pan adipocyte marker) antibodies. Cells that are Perilipin+&Ucp1-&Cyp2e1- will represent the mPRAT-ad2 subpopulation.

      1. It would be nice to provide more evidence to support the conclusion shown in lines 243 to 245 "These results indicated that new BAs induced by cold exposure were mainly derived from UCP1- adipocytes rather than de novo ASPC differentiation in puPRAT". Pdgfra-negative progenitor cells may also contribute to these new beige adipocytes.

      Our sequencing data and many previous studies (Angueira et al., 2021; Burl et al., 2022; Dong et al., 2022) have shown that Pdgfra is a marker for all ASPCs. We will also check adipocyte labelling pattern of mPRAT in the PdgfraCre;Ai14 mice. If all adipocytes are Tomato+, it suggests that adipocytes in mPRAT are all derived from Pdgfra-expressing cells. Also, the cold-induced adipocytes in mPRAT resemble more to the brown adipocytes of iBAT than the beige adipocytes of iWAT (Figure 6E and S6K).

      Angueira, A.R., Sakers, A.P., Holman, C.D., Cheng, L., Arbocco, M.N., Shamsi, F., Lynes, M.D., Shrestha, R., Okada, C., Batmanov, K., et al. (2021). Defining the lineage of thermogenic perivascular adipose tissue. Nat Metab 3, 469-484. 10.1038/s42255-021-00380-0.

      Burl, R.B., Rondini, E.A., Wei, H., Pique-Regi, R., and Granneman, J.G. (2022). Deconstructing cold-induced brown adipocyte neogenesis in mice. Elife 11. 10.7554/eLife.80167.

      Dong, H., Sun, W., Shen, Y., Balaz, M., Balazova, L., Ding, L., Loffler, M., Hamilton, B., Kloting, N., Bluher, M., et al. (2022). Identification of a regulatory pathway inhibiting adipogenesis via RSPO2. Nat Metab 4, 90-105. 10.1038/s42255-021-00509-1.

      1. The UCP1Cre-ERT2; Ai14 system should be validated by showing Tomato and UCP1 co-staining right after the Tamoxifen treatment.

      We will inject Ucp1CreERT2;Ai14 mice at 1- and 6-month-old of age with tamoxifen and collect one day after the last injection to check the overlap between the Tomato signal and UCP1 immunofluorescent staining.

      Reviewer #2 (Public Review):

      Summary:

      In the present manuscript, Zhang et al utilize single-nuclei RNA-Seq to investigate the heterogeneity of perirenal adipose tissue. The perirenal depot is interesting because it contains both brown and white adipocytes, a subset of which undergo functional "whitening" during early development. While adipocyte thermogenic transdifferentiation has been previously reported, there remain many unanswered questions regarding this phenomenon and the mechanisms by which it is regulated.

      Strengths:

      The combination of UCP1-lineage tracing with the single nuclei analysis allowed the authors to identify four populations of adipocytes with differing thermogenic potential, including a "whitened" adipocyte (mPRAT-ad2) that retains the capacity to rapidly revert to a brown phenotype upon cold exposure. They also identify two populations of white adipocytes that do not undergo browning with acute cold exposure.

      Anatomically distinct adipose depots display interesting functional differences, and this work contributes to our understanding of one of the few brown depots present in humans.

      Weaknesses:

      The most interesting aspect of this work is the identification of a highly plastic mature adipocyte population with the capacity to switch between a white and brown phenotype. The authors attempt to identify the transcriptional signature of this ad2 subpopulation, however, the limited sequencing depth of single nuclei somewhat lessens the impact of these findings. Furthermore, the lack of any form of mechanistic investigation into the regulation of mPRAT whitening limits the utility of this manuscript. However, the combination of well-executed lineage tracing with comprehensive cross-depot single-nuclei presented in this manuscript could still serve as a useful reference for the field.

      The sequencing depth of our data is comparable, if not better than previously published snRNA-seq studies on adipose tissue (Burl et al., 2022; Sarvari et al., 2021; Sun et al., 2020). Therefore, the depth of our data has reached the limit of the 3’ sequencing methods. Unfortunately, due to size limitation of the adipocytes, it is also not feasible to sort them for Smart-seq.

      Burl, R.B., Rondini, E.A., Wei, H., Pique-Regi, R., and Granneman, J.G. (2022). Deconstructing cold-induced brown adipocyte neogenesis in mice. Elife 11. 10.7554/eLife.80167.

      Sarvari, A.K., Van Hauwaert, E.L., Markussen, L.K., Gammelmark, E., Marcher, A.B., Ebbesen, M.F., Nielsen, R., Brewer, J.R., Madsen, J.G.S., and Mandrup, S. (2021). Plasticity of Epididymal Adipose Tissue in Response to Diet-Induced Obesity at Single-Nucleus Resolution. Cell Metab 33, 437-453 e435. 10.1016/j.cmet.2020.12.004.

      Sun, W., Dong, H., Balaz, M., Slyper, M., Drokhlyansky, E., Colleluori, G., Giordano, A., Kovanicova, Z., Stefanicka, P., Balazova, L., et al. (2020). snRNA-seq reveals a subpopulation of adipocytes that regulates thermogenesis. Nature 587, 98-102. 10.1038/s41586-020-2856-x.

    1. Author Response

      The following is the authors’ response to the original reviews.

      Public Reviews:

      The study could also valuably explore what kinds of genes experienced what forms of expression evolution. A brief description of GO terms frequently represented in genes which showed strong patterns of expression evolution might be suggestive of which selective pressures led to the changes in expression in the C. bursa-pastoris lineage, and to what extent they related to adaptation to polyploidization (e.g. cell-cycle regulators), compensating for the initial pollen and seed inviability or adapting to selfing (endosperm- or pollen-specific genes), or adaptation to abiotic conditions. ”

      We did not include a gene ontology (GO) analysis in the first place as we did not have a clear expectation on the GO terms that would be enriched in the genes that are differentially expressed between resynthesized and natural allotetraploids. Even if we only consider adaptive changes, the modifications could occur in various aspects, such as stabilizing meiosis, adapting to the new cell size, reducing hybrid incompatibility and adapting to self-fertilization. And each of these modifications involves numerous biological processes and molecular functions. As we could make post-hoc stories for too many GO terms, extrapolating at this stage have limited implications and could be misleading.

      Nonetheless, we are not the only study that compared newly resynthesized and established allopolyploids. GO terms that were repeatedly revealed by this type of exploratory analysis may give a hint for future studies. For this reason, now we have reported the results of a simple GO analysis.

      Recommendations for the authors: please note that you control which, if any, revisions, to undertake

      The majority of concerns from reviewers and the reviewing editor are in regards to the presentation of the manuscript; that the framing of the manuscript does not help the general reader understand how this work advances our knowledge of allopolyploid evolution in the broad sense. The manuscript may be challenging to read for those who aren't familiar with the study system or the genetic basis of polyploidy/gene expression regulation. Further, it is difficult to understand from the introduction how this work is novel compared to the recently published work from Duan et al and compared to other systems. Because eLife is a journal that caters to a broad readership, re-writing the introduction to bring home the novelty for the reader will be key.

      Additionally, the writing is quite technical and contains many short-hands and acronyms that can be difficult to keep straight. Revising the full text for clarity (and additionally not using acronyms) would help highlight the findings for a larger audience.

      Reviewer #1 (Recommendations For The Authors):

      Most of my suggestions on this interesting and well-written study are minor changes to clarify the writing and the statistical approaches.

      The use of abbreviations throughout for both transcriptional phenomena and lines is logical because of word limits, but for me as a reader, it really added to the cognitive burden. Even though writing out "homoeolog expression bias" or "hybridization-first" every time would add length, I would find it easier to follow and suspect others would too.

      Thank you for this suggestion. Indeed, using less uncommon acronyms or short-hands should increase the readability of the text for broader audience. Now in most places, we refer to “Sd/Sh” and “Cbp” as “resynthesized allotetraploids” and “natural allotetraploids”, respectively. We have also replaced the most occurrences of the acronyms for transcriptional phenomena (ELD, HEB and TRE) with full phrases, unless there are extra attributes before them (such as “Cg-/Co-ELD” and “relic/Cbp-specific ELD”).

      It would be helpful to include complete sample sizes to either a slightly modified Figure 1 or the beginning of the methods, just to reduce mental arithmetic ("Each of the five groups was represented by six "lines", and each line had six individuals" so there were 180 total plants, of which 167 were phenotyped - presumably the other 13 died? - and 30 were sequenced).

      The number 167 only applied to floral morphorlogical traits (“Floral morphological traits were measured for all five groups on 167 plants…”), but the exact total sample size for other traits differed. Now the total sample sizes of other traits have also been added to beginning of the second paragraph of the methods.

      For this study 180 seedings have been transplanted from Petri dishes to soil, but 8 seedlings died right after transplanting, seemingly caused by mechanical damage and insufficient moistening. Later phenotyping (2020.02-2020.05) was also disrupted by the COVID-19 pandemic, and some individuals were not measured as we missed the right life stages. Specifically, 5 individuals were missing for floral morphological traits (sepal width, sepal length, petal width, petal length, pistil width, pistil length, and stamen length), 30 for pollen traits, 1 for stem length, and 2 for flowering time. As for seed traits, we only measured individuals with more than ten fruits, so apart from the reasons mentioned above, individuals that were self-incompatible and had insufficient hand-pollination were also excluded. We spotted another mistake during the revision: two individuals with floral morphological measurements had no positional information (tray ID). These measurements were likely mis-sampled or mislabeled, and were therefore excluded from analysis. We assumed most of these missing values resulted from random technical mistakes and were not directly related to the measured traits.

      In general, the methods did a thorough job of describing the genomics approaches but could have used more detail for the plant growth (were plants randomized in the growth chamber, can you rule out block/position effects) and basic statistics (what statistical software was used to perform which tests comparing groups in each section, after the categories were identified).

      When describing the methods, mention whether the plants; this should be straightforward as a linear model with position as a covariate.

      Data used in the present study and a previously published work (Duan et al., 2023) were different subsets of a single experiment. For this reason, we spent fewer words in describing shared methods in this manuscript but tried to summarize some methods that were essential for understanding the current paper. But as you have pointed out, we did miss many important details that should have been kept. Now we have added some description and a table (Supplementary file 1) in the “Plant material” section for explaining randomization, and added more information of the software used for performing statistic tests in the “Phenotyping” section.

      Although we did not mention in the present manuscript, we used a randomized block design for the experiment (Author response image 1).

      Author response image 1.

      Plant positions inside the growth chamber.

      Plants used in the present study and Duan et al. (2023) were different subsets of a single experiment. The entire experiment had eight plant groups, including the five plant groups used in the present study (diploid C. orientalis (Co2), diploid C. grandiflora (Cg2), “whole-genome-duplication-first” (Sd) and “hybridization-first”(Sh) resynthesized allotetraploids, and natural allotetraploids, C. bursa pastoris (Cbp), as well as three plant groups that were only used in Duan et al. (2023; tetraploid C. orientalis (Co4), tetraploid C. grandiflora (Cg4) and diploid hybrids (F)). Each of the eight plant groups had six lines and each line represented by six plants, resulting in 288 plants (8 groups x 6 lines x 6 individuals = 288 plants). The 288 plants were grown in 36 trays placed on six shelves inside the same growth chamber. Each tray had exactly one plant from each of the eight groups, and the position of the eight plants within each tray (A-H) were randomized with random.shuffle() method in Python (Supplementary file 1). The position of the 36 trays inside the growth room (1-36) was also random and the positions of all trays were shuffled once again 28 days after germination (randomized with RAND() and sorting in Microsoft Excel Spreadsheet). (a) Plant distribution; (b) An example of one tray; (c) A view inside the growth chamber, showing the six benches.

      With the randomized block design and one round of shuffling, positional effect is very unlikely to bias the comparison among the five plant groups. The main risk of not adding positions to the statistical model is increasing error variance and decreasing the statistical power for detecting group effect. As we had already observed significant among-group variation in all phenotypic traits (p-value <2.2e-16 for group effect in most tests), further increasing statistical power is not our primary concern. In addition, during the experiment we did not notice obvious difference in plant growth related to positions. Although we could have added more variables to account for potential positional effects (tray ID, shelf ID, positions in a tray etc.), adding variables with little effect may reduce statistical power due to the loss of degree of freedom.

      Due to one round of random shuffling, positions cannot be easily added as a single continuous variable. Now we have redone all the statistical tests on phenotypic traits and included tray ID as a categorical factor (Figure 2-Source Data 1). In general, the results were similar to the models without tray ID. The F-values of group effect was only slightly changed, and p-values were almost unchanged in most cases (still < 2.2e-16). The tray effect (df=35) was not significant in most tests and was only significant in petal length (p-value=0.0111), sepal length (p-value=0.0242) and the number of seeds in ten fruits (p-value=0.0367). As expected, positions (tray ID) had limited effect on phenotypic traits.

      Figure 2 - I assume the numbers at the top indicate sample sizes but perhaps add this to the figure caption.

      Statistical power depends on both the total sample size and the sample size of each group, especially the group with the fewest observations. We lost different number of measurements in each phenotypic trait, and for pollen traits we did have a notable loss, so we chose to show sample sizes above each group to increase transparency. Since we had five different sets of sample sizes (for floral morphological traits, stem length, days to flowering, pollen traits and seed traits, respectively), it would be cumbersome to introduce all 25 numbers in figure caption and could be hard for readers to match the sample sizes with results. For this reason, we would like to keep the sample sizes in the figure, and now we have modified the legend to clarify that the numbers above groups are sample sizes.

      ’The trend has been observed in a wide range of organisms, including ...’ - perhaps group Brassica and Raphanobrassica into one clause in the sentence, since separating them out undermines the diversity somewhat.

      Indeed, it is very strange to put “cotton” between two representatives from Brassicaceae. Now the sentence is changed to “… including Brassica (Wu et al., 2018; Li et al., 2020; Wei et al., 2021) and Raphanobrassica (Ye et al., 2016), cotton (Yoo et al., 2013)…”

      The diagrams under the graph in Figure 4B are particularly helpful for understanding the expression patterns under consideration! I appreciated them a lot!

      Thank you for the comment. We also feel the direction of expression level dominance is convoluted and hard to remember, so we adopted the convention of showing the directions with diagrams.

      Reviewer #2 (Recommendations For The Authors):

      The science is very interesting and thorough, so my comments are mostly meant to improve the clarity of the manuscript text:

      • I found it challenging to remember the acronyms for the different gene expression phenomena and had to consistently cross-reference different parts of the manuscript to remind myself. I think using the full phrase once or twice at the start of a paragraph to remind readers what the acronym stands for could improve readability.

      Thank you for this reasonable suggestion. Now we have replaced the most occurrence of acronyms with the full phrases.

      • There are some technical terms, such as "homoeologous synapsis" and "disomic inheritance", which I think are under-defined in the current text.

      Indeed these terms were not well-defined before using in the manuscript. Now we have added a brief explanation for each term.

      • Under the joint action of these forces, allopolyploid subgenomes are further coordinated and degenerated, and subgenomes are often biasedly fractionated" This sentence has some unclear terminology. Does "coordinated" mean co-adapted, co-inherited, or something else? Is "biasedly fractionated" referring to biased inheritance or evolution of one of the parental subgenomes?

      We apologize for not using accurate terms. With “coordinated” we emphasized the evolution of both homoeologs depends on the selection on total expression of both homoeologs, and on both relative and absolute dosages, which may have shifted away from optima after allopolyploidization. “Co-evolved” or “co-adapted” might be a better word.

      But the term "biasedly fractionation" has been commonly used for referring to the phenomenon that genes from one subgenome of polyploids are preferentially retained during diploidization (Woodhouse et al., 2014; Wendel, 2015). Instead of inventing a new term, we prefer to keep the same term for consistency, so readers could link our findings with numerous studies in this field. Now the sentence is changed to “Under the joint action of these forces, allopolyploid subgenomes are further co-adapted and degenerated, and subgenomes are often biasedly retained, termed biased fractionation”.

      • There are a series of paragraphs in the results, starting with "Resynthesized allotetraploids and the natural Cbp had distinct floral morphologies", which consistently reference Figure 1 where they should be referencing Figure 2.

      Thank you for spotting this mistake! Now the numbers have been corrected.

      • ‘The number of pollen grains per flower decreased in natural Cbp’ this wording implies it's the effect of some experimental treatment on Cbp, rather than just measured natural variation.

      Yes, it is not scientifically precise to say this in the Results section, especially when describing details of results. We meant that assuming resynthesized allopolyploids are good approximation of the initial state of natural allotetraploid C. bursa-pastoris, our results indicate that the number of pollen grains had decreased in natural C. bursa-pastoris. But this is an implication, rather than an observation, so the sentence is better rewritten as “Natural allotetraploids had less pollen grains per flower.”

      • ‘The percentage of genes showing complete ELD was altogether limited but doubled between resynthesized allotetraploid groups and natural allotetraploids’ for clarity, I would suggest revising this to something like "doubled in natural allotetraploids relative to resynthesized allotetraploids

      Thank you for the suggestion. The sentence has been revised as suggested.

      • I'm not sure I understand what the difference is between expression-level dominance and homeolog expression bias. It seems to me like the former falls under the umbrella of the latter.

      Expression-level dominance and homeolog expression bias are easily confused, but they are conceptually independent. One gene could have expression-level dominance without any homeolog expression bias, or strong homeolog expression bias without any expression-level dominance. The concepts were well explained in Grover et al., (2012) with nice figures.

      Expression level dominance compares the total expression level of both homoeologs in allopolyploids with the expression of the same gene in parental species, and judges whether the total expression level in allopolyploids is only similar to one of the parental species. The contributions from different homoeologs are not distinguished.

      While homoeolog expression bias compares the relative expression level of each homoeologs in allopolyploids, with no implication on the total expression of both homoeologs.

      Let the expression level of one gene in parental species X and Y be e(X) and e(Y), respectively. And let the expression level of x homoeolog (from species X) and y homoeolog (from species Y) in allopolyploids be e(x) and e(y), respectively.

      Then a (complete) expression level dominance toward species X means: e(x)+e(y)=e(X) and e(x)+e(y)≠e(Y);

      While a homoeolog expression bias toward species X means: e(x) > e(y), or e(x)/e(y) > e(X)/e(Y), depending on the definition of studies.

      Both expression-level dominance and homeolog expression bias have been widely studied in allopolyploids (Combes et al., 2013; Li et al., 2014; Yoo et al., 2014; Hu & Wendel, 2019). As the two phenomena could be in opposite directions, and may be caused by different mechanisms, we think adopting the definitions in Grover et al., (2012) and distinguishing the two concepts would facilitate communication.

      • Is it possible to split up the results in Figure 7 to show which of the two homeologs was lost (i.e. orientalis vs. grandiflora)? Or at least clarify in the legend that these scenarios are pooled together in the figure?

      Maybe using acronyms without explanation made the figure titles hard to understand, but in the original Figure 7 the loss of two homoeologs were shown separately. Figure 7a,c showed the loss of C. orientalis-homoeolog (“co-expession loss”), and Figure 7b,d showed the loss of C. grandiflora-homoeolog (“cg-expession loss”). Now the legends have been modified to explain the Figure.

      • The paragraph starting with "The extant diploid species" is too long, should probably be split into two paragraphs and edited for clarity.

      The whole paragraph was used to explain why the resynthesized allotetraploids could be a realistic approximation of the early stage of C. bursa-pastoris with two arguments:

      1) The further divergence between C. grandiflora and C. orientalis after the formation of C. bursa-pastoris should be small compared to the total divergence between the two parental species; 2) The mating systems of real parental populations were most likely the same as today. Now the two arguments were separated as two paragraphs, and the second paragraph has been shortened.

      • On the other hand, the number of seeds per fruit" implies this is evidence for an alternative hypothesis, when I think it's really just more support for the same idea.

      “On the other hand” was used to contrast the reduced number of pollen grains and the increased number of seeds in natural allotetraploids. As both changes are typical selfing syndrome, indeed the two support the same idea. We replaced the “On the other hand” with “Moreover”.

      • ‘has become self-compatible before the formation" "has become" should be "became".

      The tense of the word has been changed.

      • If natural C. bursa-pastoris indeed originated from the hybridization between C. grandiflora-like outcrossing plants and C. orientalis-like self-fertilizing plants, the selfing syndrome in C. bursa-pastoris does not reflect the instant dominance effect of the C. orientalis alleles, but evolved afterward.’ This sentence should be closer to the end of the paragraph, after the main morphological results are summarized.

      Thank you for the suggestion. The paragraph is indeed more coherent after moving the conclusion sentence.

      References

      Combes, M.C., Dereeper, A., Severac, D., Bertrand, B. & Lashermes, P. (2013) Contribution of subgenomes to the transcriptome and their intertwined regulation in the allopolyploid Coffea arabica grown at contrasted temperatures. New Phytologist, 200, 251–260.

      Grover, C.E., Gallagher, J.P., Szadkowski, E.P., Yoo, M.J., Flagel, L.E. & Wendel, J.F. (2012) Homoeolog expression bias and expression level dominance in allopolyploids. New Phytologist, 196, 966–971.

      Hu, G. & Wendel, J.F. (2019) Cis – trans controls and regulatory novelty accompanying allopolyploidization. New Phytologist, 221, 1691–1700.

      Li, A., Liu, D., Wu, J., Zhao, X., Hao, M., Geng, S., et al. (2014) mRNA and Small RNA Transcriptomes Reveal Insights into Dynamic Homoeolog Regulation of Allopolyploid Heterosis in

      Nascent Hexaploid Wheat. The Plant Cell, 26, 1878–1900. Wendel, J.F. (2015) The wondrous cycles of polyploidy in plants. American Journal of Botany, 102, 1753–1756.

      Woodhouse, M.R., Cheng, F., Pires, J.C., Lisch, D., Freeling, M. & Wang, X. (2014) Origin, inheritance, and gene regulatory consequences of genome dominance in polyploids. Proceedings of the National Academy of Sciences of the United States of America, 111, 5283–5288.

      Yoo, M.J., Liu, X., Pires, J.C., Soltis, P.S. & Soltis, D.E. (2014) Nonadditive Gene Expression in Polyploids. https://doi.org/10.1146/annurev-genet-120213-092159, 48, 485–517.

    1. Author Response

      Public Reviews:

      Roget et al. build on their previous work developing a simple theoretical model to examine whether ageing can be under natural selection, challenging the mainstream view that ageing is merely a byproduct of other biological and evolutionary processes. The authors propose an agent-based model to evaluate the adaptive dynamics of a haploid asexual population with two independent traits: fertility timespan and mortality onset. Through computational simulations, their model demonstrates that ageing can give populations an evolutionary advantage. Notably, this observation arises from the model without invoking any explicit energy tradeoffs, commonly used to explain this relationship.

      The model’s results are based on both numerical simulations and formal mathematical analysis.

      Additionally, the theoretical model developed here indicates that mortality onset is generally selected to start before the loss of fertility, irrespective of the initial values in the population. The selected relationship between the fertility timespan and mortality onset depends on the strength of fertility and mortality effects, with larger effects resulting in the loss of fertility and mortality onset being closer together. By allowing for a trans-generational effect on ageing in the model, the authors show that this can be advantageous as well, lowering the risk of collapse in the population despite an apparent fitness disadvantage in individuals. Upon closer examination, the authors reveal that this unexpected outcome is a consequence of the trans-generational effect on ageing increasing the evolvability of the population (i.e., allowing a more effective exploration of the parameter landscape), reaching the optimum state faster.

      The simplicity of the proposed theoretical model represents both the major strength and weakness of this work. On one hand, with an original and rigorous methodology, the logic of their conclusions can be easily grasped and generalised, yielding surprising results. Using just a handful of parameters and relying on direct competition simulations, the model qualitatively recapitulates the negative correlation between lifespan and fertility without requiring energy tradeoffs. This alone makes this work an important milestone for the rapidly growing field of adaptive dynamics, opening many new avenues of research, both theoretically and empirically.

      We thank the reviewers and editor for highlighting the importance of the work presented here.

      On the other hand, the simplicity of the model also makes its relationship with living organisms difficult to gauge, leaving open questions about how much the model represents the reality of actual evolution in a natural context.

      We presented both in results and discussion how the mathematical trade-offs between fertility and survival time give rise to (xb, xd) configuration representative of existing aging modes.

      In particular, a more explicit discussion of how the specifics of the model can impact the results and their interpretation is needed. For example, the lack of mechanistic details on the trans-generational effect on ageing makes the results difficult to interpret.

      We discussed the role of the transgenerational Lansing effect played to its function, there is no need for a particular mechanism beyond that function of transgenerational negative effect. We reinforce this in the discussion by adding the following sentence “Regarding the nature of the transgenerational effect, our model is agnostic and the mere transmission of any negative effect would be sufficient to exert the function. “

      Even if analytical results are obtained, most of the observations appear derived from simulations as they are currently presented. Also, the choice of parameters for the simulations shown in the paper and how they relate to our biological knowledge are not fully addressed by the authors.

      The long time limit of the system with and without the Lansing effect is based on analytical results later confirmed using numerical simulations. The choice of parameters is explained in the introduction as being the minimum ones for defining a living organism. As for the parameters’ values, our numerical analysis gives a solution for any ib, id, xb and xd on R+, making the choice of initial value a mere random decision.

      Finally, the conclusions of evolvability are insufficiently supported, as the authors do not show if the wider genotypic variability in populations with the ageing trans-generational effect is, in fact, selected.

      We do not show nor claim that evolvability per se is selected for but that the apparent advantage given by this transgenerational effect seems to be mediated by an increased genotypic/phenotypic variability conferred to the lineage that we interpreted as evolvability.

    1. Author Response

      Reviewer #1 (Public Review):

      De Seze et al. investigated the role of guanine exchange factors (GEFs) in controlling cell protrusion and retraction. In order to causally link protein activities to the switch between the opposing cell phenotypes, they employed optogenetic versions of GEFs which can be recruited to the plasma membrane upon light exposure and activate their downstream effectors. Particularly the RhoGEF PRG could elicit both protruding and retracting phenotypes. Interestingly, the phenotype depended on the basal expression level of the optoPRG. By assessing the activity of RhoA and Cdc42, the downstream effectors of PRG, the mechanism of this switch was elucidated: at low PRG levels, RhoA is predominantly activated and leads to cell retraction, whereas at high PRG levels, both RhoA and Cdc42 are activated but PRG also sequesters the active RhoA, therefore Cdc42 dominates and triggers cell protrusion. Finally, they create a minimal model that captures the key dynamics of this protein interaction network and the switch in cell behavior.

      We thank reviewer #1 for this assessment of our work.

      The conclusions of this study are strongly supported by data. Perhaps the manuscript could include some further discussion to for example address the low number of cells (3 out of 90) that can be switched between protrusion and retraction by varying the frequency of the light pulses to activate opto-PRG.

      The low number of cells being able to switch can be explained by two different reasons:

      1) first, we were looking for clear inversions of the phenotype, where we could see clear ruffles in the case of the protrusion, and clear retractions in the other case. Thus, we discarded cells that would show in-between phenotypes, because we had no quantitative parameter to compare how protrusive or retractile they were. This reduced the number of switching cells

      2) second, we had a limitation due to the dynamic of the optogenetic dimer used here. Indeed, the control of the frequency was limited by the dynamic of unbinding of the optogenetic dimer. This dynamic of recruitment (~20s) is comparable to the dynamics of the deactivation of RhoA and Cdc42. Thus, the differences in frequency are smoothed and we could not vary enough the frequency to increase the number of switches. Thanks to the model, we can predict that decreasing the unbinding rate of the optogenetic tool should allow us to increase the number of switching cells.

      We will add further discussion of this aspect to the manuscript.

      Also, the authors could further describe their "Cell finder" software solution that allows the identification of positive cells at low cell density, as this approach will be of interest for a wide range of applications.

      There is a detailed explanation of the ‘Cell finder’ in the method sections. It is also available on github at https://github.com/jdeseze/cellfinder and currently in development to be more user-friendly and properly commented.

      Reviewer #2 (Public Review):

      Summary:

      This manuscript builds from the interesting observation that local recruitment of the DHPH domain of the RhoGEF PRG can induce local retraction, protrusion, or neither. The authors convincingly show that these differential responses are tied to the level of expression of the PRG transgene. This response depends on the Rho-binding activity of the recruited PH domain and is associated with and requires (co?)-activation of Cdc42. This begs the question of why this switch in response occurs. They use a computational model to predict that the timing of protein recruitment can dictate the output of the response in cells expressing intermediate levels and found that, "While the majority of cells showed mixed phenotypes irrespectively of the activation pattern, in few cells (3 out of 90) we were able to alternate the phenotype between retraction and protrusion several times at different places of the cell by changing the frequency while keeping the same total integrated intensity (Figure 6F and Supp Movie)."

      Strengths:

      The experiments are well-performed and nicely documented. However, the molecular mechanism underlying the shift in response is not clear (or at least clearly described). In addition, it is not clear that a prediction that is observed in ~3% of cells should be interpreted as confirming a model, though the fit to the data in 6B is impressive.

      Overall, the main general biological significance of this work is that RhoGEF can have "off target effects". This finding is significant in that an orthologous GEF is widely used in optogenetic experiments in drosophila. It's possible that these findings may likewise involve phenotypes that reflect the (co-)activation of other Rho family GTPases.

      We thank reviewer #2 for having assessed our work. Indeed, the main finding of this work is the change in the GEF function upon its change in concentration, which could be explained with a simple model supported by quantitative data. We think that the mechanism of the switch is quite clear, supported by the data showing the double effect of the PH domain and the activation of Cdc42. The few cells that are able to switch phenotype have to be seen as an honest data confirming that 1) concentration is indeed the main determinant of the protein’s function, and the switch is hard to obtain (which is also predicted by the model) 2) the two underlying networks are being activated at different timescales, which leaves some space for differential activation in the same cell. We are here limited by the dynamic of the optogenetic tool, as explained in the response to reviewer #1, and the intrinsic cell-to-cell variability.

      Regarding the interpretation of our results as RhoGEF “off target effects”, we think that it might be too reductive. As said in the discussion, we proposed that the dual role of the RhoGEF could have physiological implications on the induction of front protrusions and rear retractions. While we do not demonstrate it here, it opens the door for further investigation.

      Weaknesses:

      The manuscript makes a number of untested assumptions and the underlying mechanism for this phenotypic shift is not clearly defined.

      We may not have been clear in our manuscript, but we think that the underlying mechanism for this phenotypic shift is clearly explained and backed up by the data and the literature. It relies on 1) the ability of PRG to activate both RhoA and Cdc42 and 2) the ability of the PH domain to directly bind to active RhoA (which is, as shown in the manuscript, necessary but not sufficient for protrusions to happen). The model succeeds in reproducing the data of RhoA with only one free parameter and two independently fitted ones. The fact that activation of RhoA and Cdc42 lead to retraction and protrusion respectively is known since a long time. Thus, we think that the switch is clearly and quantitatively explained.

      This manuscript is missing a direct phenotypic comparison of control cells to complement that of cells expressing RhoGEF2-DHPH at "low levels" (the cells that would respond to optogenetic stimulation by retracting); and cells expressing RhoGEF2-DHPH at "high levels" (the cells that would respond to optogenetic stimulation by protruding). In other words, the authors should examine cell area, the distribution of actin and myosin, etc in all three groups of cells (akin to the time zero data from figures 3 and 5, with a negative control). For example, does the basal expression meaningfully affect the PRG low-expressing cells before activation e.g. ectopic stress fibers? This need not be an optogenetic experiment, the authors could express RhoGEF2DHPH without SspB (as in Fig 4G).

      We thank reviewer #2 for this suggestion. PRG-DHPH is known to affect the phenotype of the cell as shown in Valon et al., 2017. Thus, we really focused on the change implied by the change in optoPRG expression, to understand the phenotype difference. However, we agree that this could be an interesting data to add and will do the experiments for the revised version of the manuscript.

      Relatedly, the authors seem to assume ("recruitment of the same DH-PH domain of PRG at the membrane, in the same cell line, which means in the same biochemical environment." supplement) that the only difference between the high and low expressors are the level of expression. Given the chronic overexpression and the fact that the capacity for this phenotypic shift is not recruitment-dependent, this is not necessarily a safe assumption. The expression of this GEF could well induce e.g. gene expression changes.

      We agree with reviewer #2 that there could be changes in gene expression. In the next point of this supplementary note, we had specified it, by saying « that overexpression has an influence on cell state, defined as protein basal activity or concentration before activation. » We are sorry if it was not clear and will change this sentence for the new version.

      One of the interests of the model is that it does not require any change in absolute concentrations, beside the GEF. The model is thought to be minimal and fits well and explains the data with very few parameters. We don’t show that there is no change in concentration but we show that it is not required to invoke it.

      We will add in the revised version of the manuscript a paragraph discussing this question.

      The third paragraph of the introduction, which begins with the sentence, "Yet, a large body of works on the regulation of GTPases has revealed a much more complex picture with numerous crosstalks and feedbacks allowing the fine spatiotemporal patterning of GTPase activities" is potentially confusing to readers. This paragraph suggests that an individual GTPase may have different functions whereas the evidence in this manuscript demonstrates, instead, that a particular GEF can have multiple activities because it can differentially activate two different GTPases depending on expression levels. It does not show that a particular GTPase has two distinct activities. The notion that a particular GEF can impact multiple GTPases is not particularly novel, though it is novel (to my knowledge) that the different activities depend on expression levels.

      We thank the reviewer for this remark and didn’t intended to confuse the readers. Indeed, we think that this manuscript confirms the canonical view on the GTPases (as most optogenetic experiments did in the past years). We show here that it is more complicated at the level of the GEF. We agree that this is not particularly novel. However, to our knowledge, there is no example of such clear phenotypic control, explained solely by the change in concentration.

      We think that the last paragraph of the introduction is quite clear in the fact that it is the GEF itself that switches its function, and not the Rho-GTPases, but we will reconsider the phrasing of this paragraph for the revised version.

      Concerning the overall model summarizing the authors' observations, they "hypothesized that the activity of RhoA was in competition with the activity of Cdc42"; "At low concentration of the GEF, both RhoA and Cdc42 are activated by optogenetic recruitment of optoPRG, but RhoA takes over. At high GEF concentration, recruitment of optoPRG lead to both activation of Cdc42 and inhibition of already present activated RhoA, which pushes the balance towards Cdc42."

      These descriptions are not precise. What is the nature of the competition between RhoA and Cdc42? Is this competition for activation by the GEFs? Is it a competition between the phenotypic output resulting from the effectors of the GEFs? Is it competition from the optogenetic probe and Rho effectors and the Rho biosensors? In all likelihood, all of these effects are involved, but the authors should more precisely explain the underlying nature of this phenotypic switch. Some of these points are clarified in the supplement, but should also be explicit in the main text.

      We are going to precise these descriptions for the revised version of the manuscript. The competition between RhoA and Cdc42 was thought as a competition between retraction due to the protein network triggered by RhoA (through ROCK-Myosin and mDia-bundled actin) and the protrusion triggered by Cdc42 (through PAK-Rac-ARP2/3-branched Actin). We will make it explicit in the main text.

    1. Author Response

      The following is the authors’ response to the original reviews.

      eLife assessment

      The findings of this study are valuable as they provide new insights into the role of acetylcholine in modulating sensory processing in the auditory cortex. This paper reports a systematic measurement of cell activity in the auditory cortex before and after applying ACh during an oddball and cascade sequence of auditory stimuli in anesthetized rats. The results presented are solid given the rigorous experimental design and statistical analysis. The conclusions are provocative and will interest researchers in auditory neuroscience and neuromodulation, as well as clinicians and individuals with auditory processing disorders. However, the findings support multiple interpretations, beyond that offered by the authors.

      Our reply: First and foremost, we would like to thank the editors and reviewers for their constructive criticisms, as well as their thoughtful and thorough evaluations of our manuscript. We greatly appreciate their assessment about the novelty and general significance in our study and have revised the manuscript according to their recommendations. In the following we include detailed responses and revisions based on the reviewer’s recommendations.

      Public Reviews:

      Reviewer #1 (Public Review):

      Summary:

      This study examined the impact of exogenous microapplication of acetylcholine (Ach) on metrics of novelty detection in the anesthetized rat auditory cortex. The authors found that the majority of units showed some degree of modulation of novelty detection, with roughly similar numbers showing enhanced novelty detection, suppressed novelty detection, or no change. Enhanced novelty responses were driven by increases in repetition suppression. Suppressed novelty responses were driven by deviance suppression. There were no compelling differences seen between auditory cortical subfields or layers, though there was heterogeneity in the Ach effects within subfields. Overall, these findings are important because they suggest that fluctuations in cortical Ach, which are known to occur during changes in arousal or attentional states, will likely influence the capacity of individual auditory cortical neurons to respond to novel stimuli.

      Strengths:

      The work addresses an important problem in auditory neuroscience. The main strengths of the study are that the work was systematically done with appropriate controls (cascaded stimuli) and utilizes a classical approach that ensures that drug application is isolated to the micro-environment of the recorded neuron. In addition, the authors do not isolate their study to only the primary auditory cortex, but examine the impact of Ach across all known auditory cortical subfields.

      Our reply: Thank you very much for these supportive comments and the appreciation of our work.

      Weaknesses:

      1. As acknowledged by the authors, this study explicitly examines a phenomenon of high relevance to active listening but is done in anesthetized animals, limiting its applicability to the waking state.

      Our reply: We agree; and indeed, this weakness was already recognized in the original manuscript but is now emphasized in the discussion.

      1. The authors do not make any attempt to determine, by spike shape/duration, if their units are excitatory or inhibitory, which may explain some of the variance of the data.

      Our reply: This is a very interesting question, and in fact, we have previously estimated whether neurons are excitatory or inhibitory based on the spike shape (Pérez-Gonzalez et al., 2021). Originally, we sought to implement a similar analysis here and tried to estimate if the recorded units were excitatory or inhibitory based on the spike shapes. But when we tried to perform this analysis, we found that in many cases the recordings had captured occasional spikes from other neurons. This caveat had introduced alterations in the average spike shape, and thus precluded an accurate categorization. Therefore, we decided to discard this analysis for the sake of correctness. This weakness is further commented on in the discussion.

      1. The application of exogenous Ach, potentially in supra-physiological amounts, makes this study hard to extrapolate to a behaving animal. A more compelling design would be to block Ach, particularly at particular receptor types, to determine the effect of endogenous Ach.

      Our reply: We agree again with the reviewer; this weakness was already acknowledged, but this is now further highlighted in discussion where we comment that future studies should analyze the effect of muscarinic- and nicotinic- receptors and blockade them to potentially observe more physiologically-comparable effects. Moreover, this issue is also related to a comment raised by reviewer#2 on a possible ‘dose-response relationship’ issue.

      Reviewer #2 (Public Review):

      Summary:

      In this study, the authors investigate the effect of ACh on neuronal responses in the auditory cortex of anesthetized rats during an auditory oddball task. The paradigm consisted of two pure tones (selected from the frequency responses at each recording site) presented in a pseudo-random sequence. One tone was presented frequently (the "standard" tone) and the other infrequently (the "deviant" tone). The authors found that ACh enhances the detection of unexpected stimuli in the auditory environment by increasing or decreasing the neuronal responses to deviant and standard tones.

      Strengths:

      The study includes the use of appropriate and validated methodology in line with the current state-of-the-art, rigorous statistical analysis, and the demonstration of the effects of acetylcholine on auditory processing.

      Our reply: Thank you very much for these supportive comments and the appreciation of our work.

      Weaknesses:

      The study was conducted in anesthetized rats, and further research is needed to determine the behavioral relevance of these findings.

      Our reply: We agree; and indeed, this weakness was already recognized but is now emphasized in discussion.

      Reviewer #1 (Recommendations For The Authors):

      As outlined above, breaking out the units into those that are putative excitatory or inhibitory cells would be helpful, if possible. Other critiques are minor:

      1. "Acetylcholine", "ACh" and "Ach" are used throughout the manuscript. Please define the chosen abbreviation at first use, and be consistent.
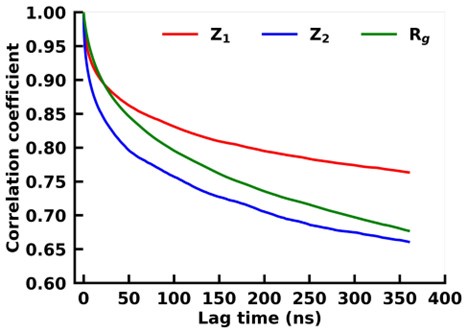
      2. Line 116, remove comma after "ACh".

      3. Line 123, I would add "in the rat at the end of the first sentence since the species was not mentioned up to this point.

      4. Fig 2 - it would be useful in the Figure (not just in the text) to label red as being the deviant tone and blue as being the standard.

      5. In many Figures (e.g., Fig 5), the term "effect" is found in the legend rather than "ACh". It would seem more intuitive to label these as "ACh".

      6. The AUC and MI interpretations are not clear. Both are metrics that quantify similarity but the authors state that when these values decrease the neurons are less able to discriminate between them (i.e., they are more similar). Some clarifying text would be useful.

      7. L276 - should "SI increase" be "SI decrease"?

      8. L285 - would replace "solely" with "primarily".

      9. Fig 7 - the authors may consider indicating with a label what the difference is between A and C compared to B and D.

      10. L634 - why were only females used?

      11. L646 - "bran" should be "brain".

      12. L649 - "homoeothermic" should be "homeothermic".

      13. L661 - "allowed to generate" should be "allowed the generation of".

      14. L670 - no need for both "about" and "approximately".

      15. L681 - please state what the search stimuli were.

      16. L688 - should be "closed-field".

      17. L754 - add a hyphen to "time-consuming".

      Our reply: Thanks so much for the detailed proofreading of the manuscript and suggestions. All them have been clarified or implemented and corrected in the text.

      Reviewer #2 (Recommendations For The Authors):

      The authors could investigate the effects of different doses of ACh on auditory processing to determine if there is a dose-response relationship.

      Our reply: We agree that this is an interesting question also relate to a matter raised by Reviewer#1 that could be linked to the issue of ‘exogenous Ach’.

      The study only investigated the effects of ACh on neuronal responses during an auditory oddball task. It would be interesting to investigate the effects of ACh on other aspects of auditory processing, such as sound localization or the discrimination of tones.

      Our reply: We agree that, while these aspects of auditory processing are very fascinating, they were outside the scope of the study, and not directly related to predictive coding and precision, so each one of these characteristics would be a full, future project in itself.

      The authors could provide more context on the significance of their findings for individuals with auditory processing disorders.

      Our reply: Thanks for the suggestion. It remains unclear how abnormal brainstem and cortical processing associated with auditory processing disorders arises (Moore, 2006, 2012). While we are not aware of any known direct connection between auditory processing disorders and acetylcholine, individuals with auditory processing disorders do have difficulties with auditory selective attention, so perhaps one could speculate that ACh, by modulating SSA/prediction error, could have some impact on encoding salient events, and if disrupted could lead to problems with selective attention. Moore (2012) speculated that auditory processing disorders may arise from unbalanced processing in bottom-up and top-down contributions.

      Since ACh has been implicated in some neurogenerative diseases and neurodevelopmental disorders, we have also added in the Discussion dialogue about a possible relationship between the modulatory effect of ACh on predictive coding (which involves bottom-up and top-down contributions) and auditory processing disorders. We also cite the recent work by Felix and colleagues (2019) which is the only study we have found on the effects of ACh on auditory processing disorders where they analyzed altered temporal processing at the level of the brainstem in α7-subunit of the nicotinic acetylcholine receptor (α7-nAChR)-deficient mice. After studying α7-nAChR knockout mice of both sexes and wild-type colony controls, they concluded that the malfunction of the CHRNA7 gene that encodes the α7-nAChR may contribute to degraded spike timing in the midbrain, which may underlie the observed timing delay in the ABR signals. These authors propose that their findings are consistent with a role for the α7-nAChR in types of neurodevelopmental and auditory processing disorders. There is also evidence on cholinergic system disfunction being related to the pathophysiology of Alzheimer’s disease (Pérez-González et al., 2022). For instance, disfunction of the synapses of cholinergic neurons in the hippocampus and nucleus basalis of Meynert, as well as decreased choline acetyltransferase activity, is associated to memory disorders in Alzheimer’s disease (Hampel et al., 2018). Also, A Alzheimer’s disease D patients show reduced amounts of the vesicular ACh transporter in some brain areas (Aghourian et al., 2017). Finally, cholinesterase inhibitors seem to have some favorable effect in the treatment of Alzheimer’s disease patients (Sharma, 2019).

      Aghourian M, Legault-Denis C, Soucy J-P, Rosa-Neto P, Gauthier S, Kostikov A, et al. 2017. Quantification of brain cholinergic denervation in Alzheimer’s disease using PET imaging with [18F]-FEOBV. Mol. Psychiatry 22:1531–1538. doi: 10.1038/mp.2017.183

      Felix RA 2nd, Chavez VA, Novicio DM, Morley BJ, Portfors CV. 2019. Nicotinic acetylcholine receptor subunit α7-knockout mice exhibit degraded auditory temporal processing. J Neurophysiol. 122(2):451-465. doi: 10.1152/jn.00170.2019.

      Hampel H, Mesulam M-M, Cuello AC, Khachaturian AS, Vergallo A, Farlow MR, et al. 2018. Revisiting the Cholinergic Hypothesis in Alzheimer’s Disease: emerging Evidence from Translational and Clinical Research. J. Prev. Alzheimers Dis. 6:1–14. doi:10.14283/jpad.2018.43

      Moore DR. 2006. Auditory processing disorder (APD)-potential contribution of mouse research. Brain Res. 1091:200–206.

      Moore DR. 2012. Listening difficulties in children: bottom-up and top-down contributions. J Commun Disord. ;45:411–418.

      Pérez-González D, Parras GG, Morado-Díaz CJ, Aedo-Sánchez C, Carbajal GV, Malmierca MS. 2021. Deviance detection in physiologically identified cell types in the rat auditory cortex. Hear Res. 2021 Jan;399:107997. doi: 10.1016/j.heares.2020.107997.

      Pérez-González D, Schreiner TG, Llano DA and Malmierca MS. 2022. Alzheimer’s Disease, Hearing Loss, and Deviance Detection. Front. Neurosci. 16:879480. doi: 10.3389/fnins.2022.879480

      Sharma K. 2019. Cholinesterase inhibitors as Alzheimer’s therapeutics. Mol. Med. Rep. 20:1479–1487. doi:10.3892/mmr.2019.1 0374

    1. Author Response

      The following is the authors’ response to the original reviews.

      Public Reviews:

      Reviewer #1 (Public Review):

      Summary:

      The manuscript by Heyndrickx et al describes protein crystal formation and function that bears similarity to Charcot-Leyden crystals made of galectin 10, found in humans under similar conditions. Therefore, the authors set out to investigate CLP crystal formation and their immunological effects in the lung. The authors reveal the crystal structure of both Ym1 and Ym2 and show that Ym1 crystals trigger innate immunity, activated dendritic cells in the lymph node, enhancing antigen uptake and migration to the lung, ultimately leading to induction of type 2 immunity.

      Strengths:

      We know a lot about expression levels of CLPs in various settings in the mouse but still know very little about the functions of these proteins, especially in light of their ability to form crystal structures. As such data presented in this paper is a major advance to the field.

      Resolving the crystal structure of Ym2 and the comparison between native and recombinant CLP crystals is a strength of this manuscript that will be a very powerful tool for further evaluation and understanding of receptor, binding partner studies including the ability to aid mutant protein generation.

      The ability to recombinantly generate CLP crystals and study their function in vivo and ex vivo has provided a robust dataset whereby CLPs can activate innate immune responses, aid activation and trafficking of antigen presenting cells from the lymph node to the lung and further enhances type 2 immunity. By demonstrating these effects the authors directly address the aims for the study. A key point of this study is the generation of a model in which crystal formation/function an important feature of human eosinophilic diseases, can be studied utilising mouse models. Excitingly, using crystal structures combined with understanding the biochemistry of these proteins will provide a potential avenue whereby inhibitors could be used to dissolve or prevent crystal formation in vivo.

      The data presented flows logically and formulates a well constructed overall picture of exactly what CLP crystals could be doing in an inflammatory setting in vivo. This leaves open a clear and exciting future avenue (currently beyond the scope of this work) for determining whether targeting crystal formation in vivo could limit pathology.

      Weaknesses:

      Although resolving the crystal structure of Ym2 in particular is a strength of the authors work, the weaknesses are that further work or even discussion of Ym2 versus Ym1 has not been directly demonstrated. The authors suggest Ym2 crystals will likely function the same as Ym1, but there is insufficient discussion (or data) beyond sequence similarity as to why this is the case. If Ym1 and Ym2 crystals function the same way, from an evolutionary point, why do mice express two very similar proteins that are expressed under similar conditions that can both crystalise and as the authors suggest act in a similar way. Some discussion around these points would add further value.

      We agree with reviewer. We have further elaborated the discussion section including these points, stating clearly that more research needs to be done using Ym2 crystals before we can draw parallels in vivo.

      Additionally, the crystal structure for Ym1 has been previously resolved (Tsai et al 2004, PMID 15522777) and it is unclear whether the data from the authors represents an advance in the 3D structure from what is previously known.

      The crystal structure of Ym1 has indeed been previously solved, and we refer to that paper. In addition, we also provide the crystal structure of in vitro grown Ym1, ashowing biosimilarity. This, for the field of crystallography is a major finding, since it validates the concept that crystal structures generated in vitro can reflect in vivo grown structures. Moreover, the in vivo crystallization of Ym2 was unknown prior to this work, and is now clear as revealed by the ex vivo X-ray crystallography. The strength of our story is that we can now compare Ym1 and Ym2 crystals structures in detail.

      Whilst also generating a model to understand Charcot-Leyden crystals (CLCs), the authors fail to discuss whether crystal shape may be an important feature of crystal function. CLCs are typically needle like, and previous publications have shown using histology and TEM that Ym1 crystals are also needle like. However, the crystals presented in this paper show only formation of plate like structures. It is unclear whether these differences represent different methodologies (ie histology is 2D slides), or differences in CLP crystals that are intracellular versus extracellular. These findings highlight a key question over whether crystal shape could be important for function and has not been addressed by the authors.

      In contrast to the bipyramidal, needle-like CLC crystals formed by human galectin-10 protein (hexagonal space group P6522), the in vivo grown Ym1 and Ym2 crystals we were able to isolate for X-ray diffraction experiments had a plate-like morphology with identical crystallographic parameters as recombinant Ym1/Ym2 crystals (space group P21). We note that depending on the viewing orientation of the thin plate-like Ym1 crystals, they may appear needle-like in histology and TEM images. In addition, we can fully not exclude that both Ym1 or Ym2 may crystallize in vivo in different space groups (which could result in different crystal morphologies for Ym1/Ym2) but we have no data to support this. It is finally also a possibility that plate like structures can break up in vivo along a long axis as a result of mechanical forces, and end up as rod-or needle like shapes.

      Ym1/Ym2 crystals are often observed in conditions where strong eosinophilic inflammation is present. However, soluble Ym1 delivery in naïve mice shows crystal formation in the absence of a strong immune response. There is no clear discussion as to the conditions in which crystal formation occurs in vivo and how results presented in the paper in terms of priming or exacerbating an immune response align with what is known about situations where Ym1 and Ym2 crystals have been observed.

      Although Ym1 and Ym2 crystals are often observed in mice at sites of eosinophilic inflammation, they are not made by eosinophils, but mainly by macrophages and epithelial cells, respectively. In vitro, protein crystallization typically starts from supersaturated solutions that support crystal nucleation. Several factors such as temperature and pH can affect the solubility of Ym1 and Ym2 in vivo and thus affect the nucleation and crystallization process. For Ym1 and Ym2 we noticed in vitro that a small drop in pH facilitates the crystallization process. Although the physiological pH is 7.4, during inflammation, there is a drop in pH. This drop in pH is the result of the infiltration and activation of inflammatory cells in the tissue, which leads to an increased energy and oxygen demand, accelerated glucose consumption via glycolysis and thus increased lactic acid secretion. In addition, we cannot exclude that in vivo, the nucleation process for Ym1/Ym2 is facilitated by interaction with ligands in the extracellular space (e.g. polysaccharide ligands or other – yet to be identified – specific ligands to Ym1/Ym2).

      Reviewer #2 (Public Review):

      Summary:

      This interesting study addresses the ability of Ym1 protein crystals to promote pulmonary type 2 inflammation in vivo, in mice.

      Strengths:

      The data are extremely high quality, clearly presented, significantly extending previous work from this group on the type 2 immunogenicity of protein crystals.

      Weaknesses:

      There are no major weaknesses in this study. It would be interesting to see if Ym2 crystals behave similarly to Ym1 crystals in vivo. Some additional text in the Introduction and Discussion would enrich those sections.

      We agree that this would be interesting to investigate, however, we choose to not include recombinant Ym2 crystal data in this report. However, we have further elaborated the discussion section including this point.

      Recommendations for the authors:

      Reviewer #1 (Recommendations For The Authors):

      Suggestions for improved experiments and to strengthen findings:

      I think additional data on the ability of Ym2 crystals to induce an immune response would be advantageous. I'm not by any means suggesting the authors repeat all the experiments with Ym2 crystals, but even just the ability to show that Ym2 could promote type 2 immunity in the acute OVA model, would help to strengthen the argument that these crystals in general function in a similar way. Alternatively, a discussion on whether these protein crystals may function in different scenarios/tissues or conditions could help in light of additional data

      We agree that this is an interesting point to investigate, however, we choose to not include recombinant Ym2 crystal data in this report. However, we have further elaborated the discussion section including this point.

      Measuring IL-33 in lung tissue is difficult to interpret as cells will express intracellular IL-33 that is not active and may explain why the results in Fig 2D are not overly convincing. It could just be that Ym1 crystals are changing the number of cells expressing IL-33 (e.g macrophages, or type 2 pneumocytes) Did the authors also measure active IL-33 release in the BAL fluid which may give a better indication of Ym1's ability to activate DAMPs?

      We also measured active IL-33 release in the BAL fluid, but due to the limited sample availability we could only measure this in one of the two repeat experiments, resulting in non-significant results for the BAL fluid. However, certainly for the 6h timepoint we saw a similar trend in the BAL fluid as in the lung tissue, meaning higher levels of IL-33 in the Ym1 crystal group compared to the PBS and soluble Ym1 group.

      Crystals in Fig 2F staining with Ym1 appear to be brighter in the soluble Ym1 group. Is this related to increased packing of Ym1 in the crystals formed in vivo as opposed to those formed in vitro? Aside from reduced amount of crystals that form when you give soluble Ym1, could the type of crystal also be influencing the ability of soluble Ym1 crystals to generate an immune response?

      Our X-ray diffraction experiments show that the packing of Ym1 is identical for in vivo and in vitro grown crystals. Possibly the apparent difference in brightness is caused by stochastic staining by the antibody. In this regard we note that the crystals formed from soluble Ym1 after 24h also can appear as less bright in a similar fashion as recombinant Ym1 crystals.

      Overall, the data and writing of the manuscript is presented to a very high standard

      A few minor points:

      • Fig 2F - a little unsure what the number in the left top corner of the images represented.

      These numbers represent the picture numbers generated by the software, but as they don’t have any added value for the story, we removed these numbers from the images.

      • Not clear why two different expression vectors were used - one for Ym1 and one for Ym2?

      Because we observed that recombinant Ym2 is more poorly secreted in the mammalian cell culture supernatant as compared to recombinant Ym1, we produced Ym2 with an N-terminal hexahistidine-tag followed by a Tobacco Etch Virus (TEV)-protease cleavage site to facilitate its purification.

      Reviewer #2 (Recommendations For The Authors):

      The authors briefly outline in their Introduction potential Sources of Ym1/2 in vivo, highlighting monocytes, M2 macrophages, alveolar macrophages, neutrophils and epithelial cells. Do DCs also make detectable/meaningful amounts of Ym1/2 in vivo, particularly in type 2 settings?

      In the introduction we only highlighted the main cellular sources of Ym1 and Ym2, but there is literature available stating/showing that Ym1/2 is not only expressed by macrophages, neutrophils, monocytes and epithelial cells, but can also be induced in DCs and mast cells. We added the word ‘mainly’ to this sentence in the introduction, to make clear that macrophages, neutrophils and monocytes are not the only sources of Ym1.

      Given the nicely demonstrated similarity of recombinant Ym1 and Ym2 crystals, I think it is important for the authors to include at least initial data on the outcome of recombinant Ym2 crystal admin to mice, in comparison to their Ym1 data.

      We agree that this is an interesting point to investigate, however, we choose to not include recombinant Ym2 crystal data in this report. However, we have further elaborated the discussion section including this point.

      Given the generation of crystals following in vivo administration of soluble Ym1, albeit at a lower level than when crystals were administered, it would be interesting to see if increased concentrations of soluble material show a dose dependent increase in lung inflammation readouts.

      We agree that this would be an interesting point to investigate. Alongside this we could also titrate down the crystal dose, to see if there is a dose dependent decrease in lung inflammation readouts. However, at this time, we choose to not investigate this further.

      I couldn't easily follow the authors' Discussion about potential ability of anti Ym-1/2 Abs to dissolve Ym1/2 crystals (similar to what they have demonstrated for Abs vs Gal10 crystals). Have they addressed this possibility experimentally? If so, addition of such data to the manuscript would be extremely interesting, given the obvious potential Ym1/2 crystal dissolving Abs for investigation of the role of these in a range of different murine models of type 2 inflammation.

      We agree that the phrasing of this part of the discussion can be unclear/confusing. We rephrased this part to make it clearer. However, we did not address the possibility of Ym1/2 crystal dissolving antibodies experimentally.

      In the Results section, the authors briefly comment on the pro-type 2 nature of Ym1 crystals in relation to their previous work with uric acid and Gal10 crystals, proposing that the pulmonary type 2 response may be a 'generic response to crystals of different chemical composition'. The Discussion would be enriched by deeper exploration of this comment.

      We have further elaborated the discussion section including this point.

    1. Author Response

      The following is the authors’ response to the original reviews.

      We thank the reviewers for their thorough reading of the manuscript and insightful comments. We have responded to both the “public review” and the “recommendations” and feel that the manuscript is now significantly strengthened.

      Public Review comments

      Reviewer #1:

      Weaknesses:

      1. The abstract does not discuss the reduction of E-gel consumption that occurs after multiple days of exposure to the THC formulation, but rather implies that a new model for chronic oral self-administration has been developed. Given that only two days of consumption was assessed, it is not clear if the model will be useful to determine THC effects beyond the acute measures presented here. The abstract should clarify that there was evidence of reduced consumption/aversive effects with repeated exposures.

      Thank you for your observation. We have added language to address this in the manuscript and the abstract. The model developed in the manuscript is an acute exposure model, with the intention of further chronic exposure adaptations to be developed separately (page 2, line 29).

      1. In the results section, the authors sometimes describe effects in terms of the concentration of gel as opposed to the dose consumed in mg/kg, which can make interpretation difficult. For example, the text describing Figure 1i states that significant effects on body temperature were achieved at 4 mg CTR-gel and 5 mg THC-gel, but were essentially equivalent doses consumed? It would be helpful to describe what average dose of THC produced effects given that consumption varied within each group of mice assigned to a particular concentration.

      We thank the reviewer for this comment and have edited our text to clarify our results. For example, this point is further emphasized by the correlation of the data in Figure1l-n showing the relationship between individual consumption and behavioral readouts (page 11, line 225-226).

      1. The description of the PK data in Figure 3 did not specify if sex differences were examined. Prior studies have found that males and females can exhibit stark differences in brain and plasma levels of THC and metabolites, even when behavioral effects are similar. However, this does depend on species, route, timing of tissue collection. It would be helpful to describe the PK profile of males and females separately.

      We did compare sex dependent effects and found no significant effects after THC E-gel consumption. We’ve added additional language to address this point in the discussion (Supplementary tables T1 and T2).

      1. In Figure 5, it is unclear how the predicted i.p. THC dose could be 30 mg/kg when 30 mg/kg was not tested by the i.p. route according to the figure, and if it had been it would have likely been almost zero acoustic startle, not the increased startle that was observed in the 2 hr gel group. It seems more likely that it would be equivalent to 3 mg/kg i.p. Could there be an error in the modeling, or was it based on the model used for the triad effects? This should be clarified.

      We apologize for the confusion created by that data, and it has now been updated for clarity. The original ~30mg/kg was not a predicted dose consumed, but rather an expected dose consumed based on individual male v. female consumption data in Supplemental Figure S1b. For clarity on the figure, we’ve instead placed dashed lines that draw attention only to the predicted startle response expected from our THC-E-gel model. We have also updated the text which hopefully makes this clearer.

      Reviewer #2:

      Weaknesses:

      Certainly, more THC mediated behavioral outcomes could have been tested, but the work presents a proof-of-concept study to investigate acute THC treatment.

      It would have been interesting if this application form is also possible for chronic treatment regimen

      We agree that a chronic treatment regimen and additional behavioral outcomes is the next, most exciting step for expanding this oral THC-E-gel consumption model, and something we are actively pursuing.

      Reviewer #3:

      Weaknesses:

      The main weaknesses of the manuscript revolve around clarification of the Methods section. All of these weaknesses are described in the "Recommendations to authors" section. Revising the manuscript would account for many of these weaknesses.

      Thank you for carefully reading through our methodology. We have made edits according to everything brought up in the recommendation section of reviewer comments.

      Recommendations for Authors

      Reviewer #1:

      Minor edits to the text:

      Abstract: "intraperitoneal contingent" should be "intraperitoneal noncontingent".

      Line 221, this sentence needs editing for clarity.

      Lines 249-250, incomplete sentence.

      Line 284, the word "activity" is missing from "locomotor between mice".

      Lines 299-301, incomplete sentence.

      Thank you for finding these mistakes. All these recommendations have been incorporated into the final publication.

      Reviewer #2:

      1. The typical THC tetrad includes catalepsy. Why was this behavioral outcome not monitored?

      We felt that locomotion, analgesia, and body temperature were robust behavioral readouts for monitoring cannabimimetic responses and that acoustic startle served as an additional, novel means of understanding THC-E-gel effects.

      1. Please specify the exact substrain of C57BL/6 (i.e., J or N or some other)

      C57BL/6J mice were used for the publication. This clarification has been made in the methods section.

      1. Figure S3 is not mentioned in the result part, but only in the discussion.

      Figure S3 is now referenced in the main body of the Results section.

      1. It might be interesting to follow up the issue that the individual THC consumption is considerable, as depicted in Fig. 1e (at high dose). This will presumably also lead to different behavioral responses. Or is there individual metabolism, also difference male vs. female?

      Thank you for the suggestion. We agree that the distribution of THC doses consumed (calculation based on weight) would be worth further investigating and have now included language about this (page 20, line 436). Please note that we did not find a sex difference (Supplemental Figure S1b), but it would be exciting to discover some biologically relevant cause such as individual absorption or metabolism

      Reviewer #3:

      Major

      1. Methods: Were the observers of experiments blinded to animal treatment? Why or why not?

      Multiple investigators performed the behavioral measurements and were not blinded to mouse treatments, but the dose consumed by each mouse remained blind. Thus, because animals consumed THC gelatin of their own volition while having ad libitum access, we performed the correlational analysis presented in Figure 1 l-n.

      1. Methods: The authors could consider relating their study design to the ARRIVE guidelines and providing a statement as to whether their study adheres to these guidelines. Related to this, were mice provided with any environmental enrichment during the study?

      We followed the ARRIVE guidelines with exception to investigator blinding (described above). Please note that mice were not provided with additional environmental enrichment during the study, a point that we specified in our methods (page 5, line 91).

      1. Methods / Results: In the Methods it is stated that the triad of cannabimimetic behaviors was measured 1 h post-injection or immediately after gelatin exposure. Why were these timepoints chosen? Perhaps this wording should be revised because measurements of cannabimimetic effects were taken several times after drug exposure. Peak i.p. drug may occur earlier than 1 h whereas peak oral drug effect is likely to occur over a longer time period (i.e., not immediately after) due to delays of absorption and first pass metabolism. Is it possible that the authors have underestimated oral drug effects by selecting these timepoints? Please discuss.

      We observed a reduction in locomotion activity starting 1 h following the beginning of exposure to the gelatin (Figure 2), suggesting initial cannabimimetic changes. Based on this observable response we chose to measure all cannabimimetic behaviors immediately following gelatin exposure. The exposure timeline for i.p. injection (1 h post-injection) was selected based on a standard published protocol (Metna-Laurent et al, 2017).

      a. Pharmacodynamics: Related to this and because the aim of this paper is to establish a rodent oral dose model, could the authors discuss the need for better characterization of the time course of drug effects? For example, how might anti-nociception or locomotor activity vary following THC E-gel consumption? This is somewhat addressed in the locomotion time course in Figure 2G but could be elaborated on or discussed in more detail.

      We agree that future studies should include additional time points measuring behavioral changes. This important point is now emphasized in the discussion (page 21, line 455).

      b. Pharmacokinetics: Related to this point above, have the authors considered collecting blood or tissue samples from their i.p.-injected animals to assess drug pharmacokinetics as they relate to drug effect and as compared to oral THC consumption? I am not suggesting the authors conduct a completely new study for this manuscript; however, this could be raised as a future study and/or as a weakness of the current study.

      We did not measure blood and tissue concentrations after i.p. administration due to the number of studies reporting these values by our co-author, Dr. Daniele Piomelli, that established these pharmacokinetic measures. Thus, we chose to reference these studies. Please note that repeating such measurements would be labor intensive, unnecessary use federal NIH resources and animals, while being very redundant to the existing literature.

      c. Minor, but related to these points: In the results, page 14 line 299: the first sentence of this paragraph is confusing as written. The Reviewer recognizes that the authors are relating the pharmacokinetic work to previously published findings, but still thinks that measuring and comparing THC levels from their cohort of i.p.-injected animals would have benefitted the present study.

      Thank you, this edit has been made in the manuscript.

      1. Methods, Histology: The methods as described do not contain sufficient detail regarding THC and THC metabolite quantification. In addition, it is not clear from this section what Histology was performed and how (no histology results appear in the manuscript). Please add more detail to this section of the Methods.

      We apologize for this typo and have corrected it in the methods section of the manuscript.

      1. Methods / Results: The statistics section requires additional detail regarding the rationale for tests being performed on different datasets. In addition, a description of the curve fitting used for data in figures 1H-J, 4B-D, and S4 would be helpful to the reader.

      Thank you, we have updated and provided more information regarding the curve fitting that was used in the methods and results section for the respective figure panels (page 9, line 183-184).

      Minor

      1. Throughout: The use of the phrase "high" dose is somewhat arbitrary and not defined relative to other doses of the THC formulation throughout the manuscript. The Reviewer suggests simply stating that THC was used, specifying the dose, or justifying in the Abstract and/or Introduction the classification of "high" based on relevant literature.
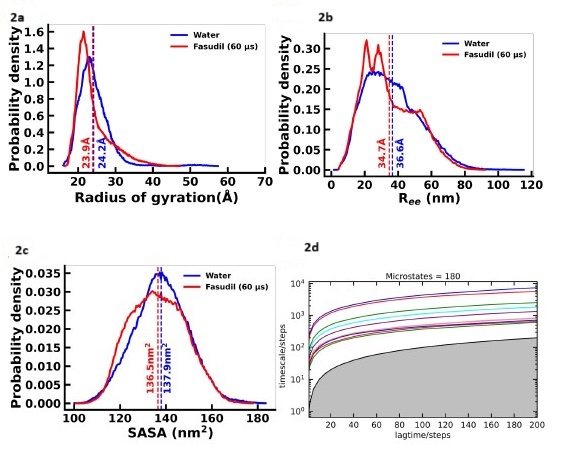
      Thank you for the observation. We have removed this ambiguity by specifically mentioning the dose that was consumed (e.g., abstract page 2, line 20).

      1. Abstract: define "CB1" in the abstract. Although this is a common abbreviation within the field, its use should be defined.

      We have added this definition in the abstract for clarification.

      1. Figure 2: why are the consumption panels B, C, and D given separate labels but the locomotor data are all labeled together as panel G?

      Thank you for the observation, we have adjusted the labeling, so it is equal for both sets of panels.

    1. Author Response

      The following is the authors’ response to the original reviews.

      Thank you very much for forwarding these two important reviews on our paper. Please find hereby our point-by-point responses addressing the ideas, arguments and points of concern raised by the reviewers. We provide explanation of how these points have been incorporated in the paper.

      We feel the review process has been a useful exercise and that the paper has greatly benefited in terms of clarity and accessibility. It is our hope that our findings may ignite renewed interest on unexplored and “unexpected” aspects of great ape vocal communication, inspire novel research, and invite bold new advances on the long-standing puzzle of language origins and evolution. In several relevant sections, we have also sought to explicitly address the point of doubt raised in eLife’s editorial assessment, published alongside the reviewed preprint of our paper. The editorial assessment stated that “…However the evidence provided to support the major claims of the paper is currently incomplete. Specifically, it is not yet clear how the rhythmic structuring found in these long calls is more similar to human language recursion per se rather than isochrony as a broader, more common phenomenon.” To directly clarify this point, we provide now various examples of how recursion is distinct from repetition, using everyday objects for an intuitive understanding (e.g., lines 43-51). We have also expanded the discussion to better contextualise and clarify the implications of our findings on language evolution theory. We hope this will help addressing the implicit request for clarification in the previous editorial assessment.

      Thank you very much for your kind and dedicated attention in the processing of our study.

      Public Reviews:

      Reviewer #1 (Public Review):

      This study investigates the structuring of long calls in orangutans. The authors demonstrate long calls are structured around full pulses, repeated following a regular tempo (isochronic rhythm). These full pulses are themselves structured around different sub-pulses, themselves repeated following an isochronic rhythm. The authors argue this patterning is evidence for self-embedded, recursive structuring in orangutang long calls.

      The analyses conducted are robust and compelling and they support the rhythmicity the authors argue is present in the long calls. Furthermore, the authors went above and beyond and confirmed acoustically the sub-categories identified were accurate.

      We thank the reviewer for this important support regarding our methods and findings.

      However, I believe the manuscript would benefit from a formal analysis of the specific recursive patterning occurring in the long call. Indeed, as of now, it is difficult for the reader to identify what the authors argue to be recursion and distinguish it from simple repetitions of motifs, which is essential.

      We agree with the reviewer that the distinction between repetition and recursion is very important for the adequate interpretation of our findings. Following the reviewer’s point (and the Editorial Assessement), we have now rephrased several passages in the initial paragraph of the paper for added clarity, where recursion is introduced and explained. We now also provide various new examples of recursion in everyday life and popular culture to better illustrate in an easy and accessible way the fundamental nature of recursion. We then use two of these common examples (computer folders and Russian dolls) to specifically distinguish repetition from recursion.

      Although the authors already discuss briefly why linear patterning is unlikely, the reader would benefit from expanding on this discussion section and clarifying the argument here (a lay terminology might help).

      Corrected accordingly.

      I believe an illustration here might help. In the same logic, I believe a tree similar to the trees used in linguistics to illustrate hierarchical structuring would help the reader understand the recursive patterning in place here. This would also help get the "big picture", as Fig 1A is depicting a frustratingly small portion of the long call.

      We completely understand the reviewer’s concern here. As proposed by the reviewer, and in addition to changes in the Introduction (see above) and Discussion (see below), we have now added a new figure in the Discussion to help the reader get the “big picture” of our findings.

      We have also made revisions throughout the Introduction and Discussion to simplify the text, clarify our exposition and facilitate the reader better and intuitively understand the nature and relevance of our results.

      Notwithstanding these comments, this paper would provide crucial evidence for recursion in the vocal production of a non-human ape species. The implication it would have would represent a key shift in the field of language evolution. The study is very elegant and well-constructed. The paper is extremely well written, and the point of view adopted is original, well-argued and compelling.

      We are humbled by the reviewer’s words, and we thank the reviewer for attributing these qualities to our paper. This feedback reassures us of the disruptive potential that these and similar future findings may have on our understanding of language evolution.

      Reviewer #2 (Public Review):

      I am not qualified to judge the narrow claim that certain units of the long calls are isochronous at various levels of the pulse hierarchy. I will assume that the modelling was done properly. I can however say that the broad claims that (i) this constitutes evidence for recursion in non-human primates, (ii) this sheds light on the evolution of recursion and/or language in humans are, when not made trivially true by a semantic shift, unsupported by the narrow claims. In addition, this paper contains errors in the interpretation of previous literature.

      We report the first confirmed case of “vocal sequences within vocal sequences” in a wild nonhuman primate, namely a great ape. The currently prevailing models of language evolution often rest on the (purely theorical) premise that such structures do not exist in any animal bar humans. We find the discovery of such structures in a wild great ape exciting, remarkable, and promising. We regret that the reviewer does not share this sentiment with us. We feel that the statement that these findings are trivial and narrow is unfounded.

      In order to clarify and better communicate the significance of our findings, we now explain in more detail in the Introduction and Discussion how the discovery of nested isochrony in wild orangutans promises to stimulate new series of studies in nature and captivity. Our findings dovetail nicely with previous captive studies that have shown that animals can learn how to recognise recursive patterns and invite new research efforts for the investigation of recursive abilities in the wild and in the absence of human priming and in nonhuman primates.

      The main difficulty when making claims about recursion is to understand precisely what is meant by "recursion" (arguably a broader problem with the literature that the authors engage with). The authors offer some characterization of the concept which is vague enough that it can include anything from "celestial and planetary movement to the splitting of tree branches and river deltas, and the morphology of bacteria colonies". With this appropriately broad understanding, the authors are able to show "recursion" in orangutans' long calls. But they are, in fact, able to find it everywhere.

      The reviewer is correct in highlighting that recursion is ubiquitous in nature and this is something that we explicitly state in the paper. This only makes it the more surprising that, when it comes to vocal combinatorics, recursion has only been described in human language and music, but in no other animals. If studies providing such evidence are known to reviewer, we kindly request their corresponding references.

      In the new revised version, we have paid attention to this aspect raised by the reviewer, and we have sought to disambiguate that our observations pertain to temporal recursion. This clarification will hopefully allow a better understanding of our results.

      The sound of a plucked guitar string, which is a sum of self-similar periodic patterns, count as recursive under their definition as well.

      The example pointed out here by reviewer is factually correct; sound harmonics represent a recursive pattern of a fundamental frequency. (In fact, we explain this phenomenon in the Discussion.) The reviewer’s comment seems to offer an analogy to oscillatory phenomena in the physiology of the vocal folds, and so, it is misplaced with regards to our present study, which focused vocal sequences. Admittedly, this misinterpretation may have been implicitly caused by our wording and we apologise for this. We now refer to “vocal combinatorics” instead of “vocal production” throughout the paper to avoid the reader considering that our findings pertain to the physiology of the vocal folds.

      One can only pick one's definition of recursion, within the context of the question of interest: evolution of language in humans. One must try to name a property which is somewhat specific to human language, and not a ubiquitous feature of the universe we live in, like self-similarity. Only after having carved out a sufficiently distinctive feature of human language, can we start the work of trying to find it in a related species and tracing its evolutionary history. When linguists speak of recursion, they speak of in principle unbounded nested structure (as in e.g., "the doctor's mother's mother's mother's mother ..."). The author seems to acknowledge this in the first line of the introduction: "the capacity to iterate a signal within a self-similar signal" (emphasis added). In formal language theory, which provides a formal and precise definition of one notion of recursivity appropriate for human language, unbounded iteration makes a critical difference: bounded "nested structures" are regular (can be parsed and generated using finite-state machines), unbounded ones are (often) context-free (require more sophisticated automaton). The hierarchy of pulses and sub-pulses only has a fixed amount of layers, moreover the same in all productions; it does not "iterate".

      The reviewer explains here how recursion, in its fully fledged form in modern language(s), is defined by linguistics. We fully agree and do not contest such descriptions and definitions in any way. These descriptions and definitions aim to describe how recursion operates today, not how it evolved. Nor do these descriptions and definitions generate data-driven, testable predictions about precursors or proto-states of recursion as used by modern language-able humans. This is scientifically problematic and heuristically unsatisfying regarding the open question of language evolution.

      Following human-specific definitions for recursion, as proposed by the reviewer, cannot per se be used to undertake a comparative approach to evolution because they leave nothing to compare recursion with in other (wild) species. Using human-specific definitions unavoidably leads to black-and-white notions that language is always absolutely present in humans and always absolutely absent in other animals, regardless of their degree of relatedness to humans. It is unpreventable that these descriptions flout foundational principles of evolution, such as descent with modification and shared ancestry.

      This conceptual problem is not new. Less than a century ago, it was believed that humans were the only tool-user (thousands of examples are known today in nonhuman animals, including fish and invertebrates), and later, that humans were the only cultural animal (today it is known that migrating caribou and fruit flies can establish traditions based on social learning). We must follow in the footsteps of those who have helped redefine human nature in the past. As famously stated by Louis Leakey when presented with evidence for chimpanzee tool-use collected by Jane Goodall, “Now we must redefine tool, redefine man, or accept chimpanzees as human”. Therefore, as a matter of course, we must redefine recursion, embracing empirically (other than purely theoretically) definitions that allow recursion to take on forms and functions different from that of modern language-able humans.

      Another point is that the authors don't show that the constraints that govern the shape of orangutans long calls are due to cognitive processes.

      The reviewer is indeed correct. This does not, however, refute our findings. We do not directly show that cognitive processes govern recursion in orangutan long calls. Instead, we show that the observed patterns cannot be explained by simple bodily or motoric processes, excluding therefore low-level explanations. With more than 50 years of accumulated field experience in primatology, this was the only possible way that our team found to go about conducting research and analyses on natural behaviour, in the wild, with a critically endangered primate. We would be very interested in learning from the reviewer what ethical and non-invasive methods, specific locations in the wild, and type of behavioural or socio-ecological data could be otherwise viably used to demonstrate what the reviewer requests. If other scientists believe that the patterns observed in wild orangutan long calls – three independent, but simultaneously-occurring recursive motifs – can be generated based on low-level physiological mechanisms alone, the burden of proof resides with them.

      Any oscillating system will, by definition, exhibit isochrony.

      We disagree with this statement. The example provided above by the reviewer him/her-self disproves the statement: a guitar string when struck is an oscillating system but it is not isochronic nor is it combinatorial. Isochrony cannot be established with single events, only with event sequences (in practice, ideally >3).

      For instance, human trills produce isochronouns or near isochronous pulses. No cognitive process is needed to explain this; this is merely the physics of the articulators. Do we know that the rhythm of the pulses and sub-pulses in orangutans is dictated by cognition as opposed to the physics of the articulators?

      The reviewer seems to misinterpret our results here. Our focus is on vocal combinatorics, not vocal fold oscillation (see previous response). We have now reworded all instances where the text could be unclear.

      Even granting the authors' unjustified conclusion that wild orangutans have "recursive" structures and that these are the result of cognition, the conclusions drawn by the authors are too often fantastic leaps of induction. Here is a cherry-picked list of some of the far-fetched conclusions: - "our findings indicate that ancient vocal patterns organized across nested structural strata were likely present in ancestral hominids". Does finding "vocal patterns organized across nested structural strata" in wild orangutans suggest that the same were present in ancestral hominids?

      Following the reviewer’s comment, we have now rephrased and toned down this passage, stating that such structures “may have been present” in ancestral hominids. We are grateful to the reviewer for this comment.

      • "given that isochrony universally governs music and that recursion is a feature of music, findings (sic.) suggest a possible evolutionary link between great ape loud calls and vocal music". Isochrony is also a feature of the noise produced by cicadas. Does this suggest an evolutionary link between vocal music and the noise of cicadas?

      We apologise, but it is unclear what the reviewer is exactly suggesting or proposing here. It seems as though it is believed that cicadas are as phylogenetically related to humans as great apes are. Our last common ancestor with great apes diverged about 10mya, but with cicadas 600mya. The last common ancestor with great apes was a great ape (or hominid). The human-cicada last common ancestor would have looked like a worm (it is probable it would already have a nervous bulge at the head, or “brain”). In order to avoid similar misinterpretations, we have now clarified in several instances that our study and interpretation of results are based on shared ancestry within the Hominid family.

      It seems that the reviewer may be also misinterpreting our findings. We do not simply report isochrony in a wild great ape (multiple references for isochronous calls in primate are provided in the Discussion). We report isochrony within isochrony in three non-exclusive rhythmic arrangements. In case the reviewer knows of a study on cicadas, or any non-human species, showing recursive sound combinatorics of this nature, we kindly request the citation. We can only hope that such new cases may be gradually unveiled in wild animals to help propel our general understanding of possible ways of how insipient recursive vocal combinatorics in ancient hominids could have given rise to recursion as used today by language-able modern humans.

      Finally, some passages also reveal quite glaring misunderstandings of the cited literature. For instance:

      • "Therefore, the search for recursion can be made in the absence of meaning-base operations, such as Merge, and more generally, semantics and syntax". It is precisely Chomsky's (disputable) opinion that the main operation that govern syntax, Merge, has nothing to do with semantics. The latter is dealt within a putative conceptual-intentional performance system (in Chomsky's terminology), which is governed by different operations.

      Following the reviewer’s comment, we have now removed “meaning-base operations, such as Merge, and more generally” from the target sentence in order to avoid confusion. Thank you.

      • "Namely, experimental stimuli have consisted of artificial recursive signal sequences organized along a single temporal scale (though not structurally linear), similarly with how Merge and syntax operate". The minimalist view advocated by Chomsky assumes that mapping a hierarchichal structure to a linear order (a process called linearizarion) is part of the articulatory-perceptual system. This system is likewise not governed by Merge and is not part of "syntax" as conceived by the Chomskyan minimalists.

      Following the reviewer’s comment, we have not omitted the target sentence for added clarity.

      Reviewer #1 (Recommendations For The Authors):

      L55-67: I feel there is a step missing in the logic of the argumentation here. The studies cited by the authors here are mostly about syntactic-like structuring but not recursion. Hence when the authors mention in the next sentence that these studies investigate the perception of recursive signalling, it seems incorrect. I agree with the logic, but the references do not seem appropriate. I would further suggest that if there are no other references, that would make the introduction of the study here even easier: there is very little work investigating this capacity in non-human animals, let alone on a production perspective, therefore, the study conducted here is paramount and fills this important gap in the literature.

      We are grateful to Reviewer #1 for these comments, and we are honoured to hear that our findings are filling a literature gap. We have now carefully revised the manuscript, hopefully, streamlining our line of reasoning and improving the paper’s overall readability. We agree that there is very little work investigating the spontaneous “production” of recursion in nonhuman animals. We decided to better detail the logic of our paper by clarifying the difference between recursion and repetition and clarifying that the motifs that we identify in wild orangutan represent a case of "temporal recursion".

      L59: Johan J should be removed (same in discussion).

      Removed, thanks.

      L60: For example is repeated twice, here and L55.

      We have rephrased this part of the manuscript, thanks.

      L72-73: If we consider the Watson et al., 2020 study an example of recursive perception (which I do not think is true), this was conducted using a passive design - i.e. with no active training.

      We have rephrased this part of the manuscript, thanks.

      L240-241: Again, non-adjacent dependency processing does not equal recursion.

      We agree that non-adjacent dependency processing does not equal recursion. We have now clarified this section accordingly.

      L269: one of the most.

      Corrected, thanks.

      L296: add space after settings.

      Corrected, thanks.

      Reviewer #2 (Recommendations For The Authors):

      In addition to the public portion of the review, I advise the authors' to substantially alter their style of writing. The language used is not accurate and the intended meaning is often not clear. This makes it hard for any reader to follow the authors' reasoning fully. Below I list only a few of the egregious examples but the examples abound:

      • "this hints at a neuro-cognitive or neuro-computational transformation in the human brain" what meaning do the author assign to "neuro-cognitive" and "neuro-computational" ? what difference do they place between the two (so that they would be disjoined.) ? What "transformation" are we talking about ? From what to what ?

      • " However, recursive signal structures can also unfold in other manners, such as across nested temporal scales and in the absence of semantics (Fitch, 2017a), as in music." what is meant here by nested temporal scales ?

      • "The simultaneous occurrence of non-exclusive recursive patterns excludes the likelihood that orangutans concatenate long calls and their subunits in linear structure without any recursive processes": isn't there a more straightforward way to say "excludes the likelihood"? What is meant by "non-exclusive recursive patterns"?

      It seems that Reviewer #2 does not share our writing style. Nonetheless, we have tried to meet the reviewer halfway, clarifying throughout the new revised version our definitions, our line of argument, our motivations, our results, the context of our findings in what is known about recursion in animals, and the implication of our discovery for language evolution theory.

    1. Author Response

      The following is the authors’ response to the current reviews.

      We agree with the reviewer that the statistics are buried in a dense excel file without a read-me page. We will address this by making a summary excel page for p-values during the production process.


      The following is the authors’ response to the original reviews.

      eLife assessment

      This important study uses genomically-engineered glypican alleles to demonstrate convincingly that Dally (not Dally-like protein [Dlp]) is the key contributor to formation of the Dpp/BMP morphogen gradient in the wing disc of Drosophila. The authors provide solid genetic evidence that, surprisingly, the core domain of Dally appears to suffice to trap Dpp at the cell surface. They conclude with a model according to which Dally modulates the range of Dpp signaling by interfering with Dpp's internalization by the Dpp receptor Thickveins.

      Public Reviews:

      Reviewer #1 (Public Review):

      How morphogens spread within tissues remains an important question in developmental biology. Here the authors revisit the role of glypicans in the formation of the Dpp gradient in wing imaginal discs of Drosophila. They first use sophisticated genome engineering to demonstrate that the two glypicans of Drosophila are not equivalent despite being redundant for viability. They show that Dally is the relevant glypican for Dpp gradient formation. They then provide genetic evidence that, surprisingly, the core domain of Dally suffices to trap Dpp at the cell surface (suggesting a minor role for GAGs). They conclude with a model that Dally modulates the range of Dpp signaling by interfering with Dpp's degradation by Tkv. These are important conclusions, but more independent (biochemical/cell biological) evidence is needed.

      As indicated above, the genetic evidence for the predominant role of Dally in Dpp protein/signalling gradient formation is strong. In passing, the authors could discuss why overexpressed Dlp has a negative effect on signaling, especially in the anterior compartment. The authors then move on to determine the role of GAG (=HS) chains of Dally. They find that in an overexpression assay, Dally lacking GAGs traps Dpp at the cell surface and, counterintuitively, suppresses signaling (fig 4 C, F). Both findings are unexpected and therefore require further validation and clarification, as outlined in a and b below.

      a. In loss of function experiments (dallyDeltaHS replacing endogenous dally), Dpp protein is markedly reduced (fig 4R), as much as in the KO (panel Q), suggesting that GAG chains do contribute to trapping Dpp at the cell surface. This is all the more significant that, according to the overexpression essays, DallyDeltaHS seems more stable than WT Dally (by the way, this difference should also be assessed in the knock-ins, which is possible since they are YFP-tagged). The authors acknowledge that HS chains of Dally are critical for Dpp distribution (and signaling) under physiological conditions. If this is true, one can wonder why overexpressed dally core 'binds' Dpp and whether this is a physiologically relevant activity.

      According to the overexpression assay, DallyDeltaHS seems more stable than WT Dally (Fig. 4B’, E’, 5A’, B’). As the reviewer suggested, we addressed the difference using the two knock-in alleles and found that DallyDeltaHS is more stable than WT Dally (Fig.4 L, M inset), further emphasizing the insufficient role of core protein of Dally for extracellular Dpp distribution.

      In summary, we showed that, although Dally interacts with Dpp mainly through its core protein from the overexpression assay (Fig. 4E, I), HS chains are essential for extracellular Dpp distribution (Fig. 4R). Thus, the core protein of Dally alone is not sufficient for extracellular Dpp distribution under physiological conditions. These results raise a question about whether the interaction of core protein of Dally with Dpp is physiologically relevant. Since the increase of HS upon dally expression but not upon dlp expression resulted in the accumulation of extracellular Dpp (Fig. 2) and this accumulation was mainly through the core protein of Dally (Fig. 4E, I), we speculate that the interaction of the core protein of Dally with Dpp gives ligand specificity to Dally under physiological conditions.

      To understand the importance of the interaction of core protein of Dally with Dpp under physiological conditions, it is important to identify a region responsible for the interaction. Our preliminary results overexpressing a dally mutant lacking the majority of core protein (but keeping the HS modified region intact) showed that HS chains modification was also lost. Although this is consistent with our results that enzymes adding HS chains also interact with the core protein of Dally (Fig. 4D), the dally mutant allele lacking the core protein would hamper us from distinguishing the role of core protein of Dally from HS chains.

      Nevertheless, we can infer the importance of the interaction of core protein of Dally with Dpp using dally[3xHA-dlp, attP] allele, where dlp is expressed in dally expressing cells. Since Dally-like is modified by HS chains but does not interact with Dpp (Fig. 2, 4), dally[3xHA-dlp, attP] allele mimics a dally allele where HS chains are properly added but interaction of core protein with Dpp is lost. As we showed in Fig.3O, S, the allele could not rescue dallyKO phenotypes, consistent with the idea that interaction of core protein of Dally with Dpp is essential for Dpp distribution and signaling and HS chain alone is not sufficient for Dpp distribution.

      b. Although the authors' inference that dallycore (at least if overexpressed) can bind Dpp. This assertion needs independent validation by a biochemical assay, ideally with surface plasmon resonance or similar so that an affinity can be estimated. I understand that this will require a method that is outside the authors' core expertise but there is no reason why they could not approach a collaborator for such a common technique. In vitro binding data is, in my view, essential.

      We agree with the reviewer that a biochemical assay such as SPR helps us characterize the interaction of core protein of Dally and Dpp (if the interaction is direct), although the biochemical assay also would not demonstrate the interaction under the physiological conditions.

      However, SPR has never been applied in the case of Dpp, probably because purifying functional refolded Dpp dimer from bacteria has previously been found to be stable only in low pH and be precipitated in normal pH buffer (Groppe J, et al., 1998)(Matsuda et al., 2021). As the reviewer suggests, collaborating with experts is an important step in the future.

      Nevertheless, SPR was applied for the interaction between BMP4 and Dally (Kirkpatrick et al., 2006), probably because BMP4 is more stable in the normal buffer. Although the binding affinity was not calculated, SPR showed that BMP4 directly binds to Dally and this interaction was only partially inhibited by molar excess of exogenous HS, suggesting that BMP4 can interact with core protein of Dally as well as its HS chains. In addition, the same study applied Co-IP experiments using lysis of S2 cells and showed that Dpp and core protein of Dally are co-immunoprecipitated, although it does not demonstrate if the interaction is direct.

      In a subsequent set of experiments, the authors assess the activity of a form of Dpp that is expected not to bind GAGs (DppDeltaN). Overexpression assays show that this protein is trapped by DallyWT but not dallyDeltaHS. This is a good first step validation of the deltaN mutation, although, as before, an invitro binding assay would be preferable.

      Our overexpression assays actually showed that DppDeltaN is trapped by DallyWT and by dallyDeltaHS at similar levels (Fig. 5C), indicating that interaction of DppDeltaN and HS chains of Dally is largely lost but DppDeltaN can still interact with core protein of Dally.

      We thank the reviewer for the suggesting the in vitro experiment. Although we decided not to develop biophysical experiments such as SPR for Dpp in this study due to the reasons discussed above, we would like to point out that our result is consistent with a previous Co-IP experiment using S2 cells showing that DppDeltaN loses interaction with heparin (Akiyama2008).

      However, in contrast to our results, the same study also proposed by Co-IP experiments using S2 cells that DppDeltaN loses interaction with Dally (Akiyama2008). Although it is hard to conclude since western blotting was too saturated without loading controls and normalization (Fig. 1C in Akiyama 2008), and negative in vitro experiments do not necessarily demonstrate the lack of interaction in vivo. One explanation why the interaction was missed in the previous study is that some factors required for the interaction of DppDeltaN with core protein of Dally are missing in S2 cells. In this case, in vivo interaction assay we used in this study has an advantage to robustly detect the interaction.

      Nevertheless, the authors show that DppDeltaN is surprisingly active in a knock-in strain. At face value (assuming that DeltaN fully abrogates binding to GAGs), this suggests that interaction of Dpp with the GAG chains of Dally is not required for signaling activity. This leads to authors to suggest (as shown in their final model) that GAG chains could be involved in mediating the interactions of Dally with Tkv (and not with Dpp. This is an interesting idea, which would need to be reconciled with the observation that the distribution of Dpp is affected in dallyDeltaHS knock-ins (item a above). It would also be strengthened by biochemical data (although more technically challenging than the experiments suggested above). In an attempt to determine the role of Dally (GAGs in particular) in the signaling gradient, the paper next addresses its relation to Tkv. They first show that reducing Tkv leads to Dpp accumulation at the cell surface, a clear indication that Tkv normally contributes to the degradation of Dpp. From this they suggest that Tkv could be required for Dpp internalisation although this is not shown directly. The authors then show that a Dpp gradient still forms upon double knockdown (Dally and Tkv). This intriguing observation shows that Dally is not strictly required for the spread of Dpp, an important conclusion that is compatible with early work by Lander suggesting that Dpp spreads by free diffusion. These result show that Dally is required for gradient formation only when Tkv is present. They suggest therefore that Dally prevents Tkv-mediated internalisation of Dpp. Although this is a reasonable inference, internalisation assays (e.g. with anti-Ollas or anti-HA Ab) would strengthen the authors' conclusions especially because they contradict a recent paper from the Gonzalez-Gaitan lab.

      Thanks for suggesting the internalization assay. As we discussed in the discussion, our results suggest that extracellular Dpp distribution is severely reduced in dally mutants due to Tkv mediated internalization of Dpp (Fig. 6). Thus, extracellular Dpp available for labelling with nanobody is severely reduced in dally mutants, which can explain the reduced internalization of Dpp in dally mutants in the internalization assay. Therefore, we think that the nanobody internalization assay would not distinguish the two contradicting possibilities.

      The paper ends with a model suggesting that HS chains have a dual function of suppressing Tkv internalisation and stimulating signaling. This constitutes a novel view of a glypican's mode of action and possibly an important contribution of this paper. As indicated above, further experiments could considerably strengthen the conclusion. Speculation on how the authors imagine that GAG chains have these activities would also be warranted.

      Thank you very much!

      Reviewer #2 (Public Review):

      The authors are trying to distinguish between four models of the role of glypicans (HSPGs) on the Dpp/BMP gradient in the Drosophila wing, schematized in Fig. 1: (1) "Restricted diffusion" (HSPGs transport Dpp via repetitive interaction of HS chains with Dpp); (2) "Hindered diffusion" (HSPGs hinder Dpp spreading via reversible interaction of HS chains with Dpp); (3) "Stabilization" (HSPGs stabilize Dpp on the cell surface via reversible interaction of HS chains with Dpp that antagonizes Tkv-mediated Dpp internalization); and (4) "Recycling" (HSPGs internalize and recycle Dpp).

      To distinguish between these models, the authors generate new alleles for the glypicans Dally and Dally-like protein (Dlp) and for Dpp: a Dally knock-out allele, a Dally YFP-tagged allele, a Dally knock-out allele with 3HA-Dlp, a Dlp knock-out allele, a Dlp allele containing 3-HA tags, and a Dpp lacking the HS-interacting domain. Additionally, they use an OLLAS-tag Dpp (OLLAS being an epitope tag against which extremely high affinity antibodies exist). They examine OLLAS-Dpp or HA-Dpp distribution, phospho-Mad staining, adult wing size.

      They find that over-expressed Dally - but not Dlp - expands Dpp distribution in the larval wing disc. They find that the Dally[KO] allele behaves like a Dally strong hypomorph Dally[MH32]. The Dally[KO] - but not the Dlp[KO] - caused reduced pMad in both anterior and posterior domains and reduced adult wing size (particularly in the Anterior-Posterior axis). These defects can be substantially corrected by supplying an endogenously tagged YFP-tagged Dally. By contrast, they were not rescued when a 3xHA Dlp was inserted in the Dally locus. These results support their conclusion that Dpp interacts with Dally but not Dlp.

      They next wanted to determine the relative contributions of the Dally core or the HS chains to the Dpp distribution. To test this, they over-expressed UAS-Dally or UAS-Dally[deltaHS] (lacking the HS chains) in the dorsal wing. Dally[deltaHS] over-expression increased the distribution of OLLAS-Dpp but caused a reduction in pMad. Then they write that after they normalize for expression levels, they find that Dally[deltaHS] only mildly reduces pMad and this result indicates a major contribution of the Dally core protein to Dpp stability.

      Thanks for the comments. We actually showed that compared with Dally overexpression, Dally[deltaHS] overexpression only mildly reduces extracellular Dpp accumulation (Fig. 4I). This indicates a major contribution of the Dally core protein to interaction with Dpp, although the interaction is not sufficient to sustain extracellular Dpp distribution and signaling gradient.

      The "normalization" is a key part of this model and is not mentioned how the normalization was done. When they do the critical experiment, making the Dally[deltaHS] allele, they find that loss of the HS chains is nearly as severe as total loss of Dally (i.e., Dally[KO]). Additionally, experimental approaches are needed here to prove the role of the Dally core.

      Since the expression level of Dally[deltaHS] is higher than Dally when overexpressed, we normalized extracellular Dpp distribution (a-Ollas staining) against GFP fluorescent signal (Dally or Dally[deltaHS]). To do this, we first extracted both signal along the A-P axis from the same ROI in the previous version. The ratio was calculated by dividing the intensity of a-Ollas staining with the intensity of GFP fluorescent signal at a given position x. The average profile from each normalized profile was generated and plotted using the script described in the method (wingdisc_comparison.py) as other pMad or extracellular staining profiles.

      Although this analysis provides normalized extracellular Dpp accumulation at different positions along the A-P axis, we are more interested in the total amount of Dpp or DppDeltaN accumulation upon Dally or dallyDeltaHS expression. Therefore, in the revised ms, we decided to normalize total amount of extracellular Dpp against the level of Dally or Dally[deltaHS] by dividing total signal intensity of extracellular Dpp staining (ExOllas staining) by total GFP fluorescent signal (Dally or Dally[deltaHS]) around the Dpp producing cells in each wing disc. Statistical analysis showed that accumulation of extracellular Dpp is only slightly reduced without HS chains (Fig.4I), indicating that Dally interacts with Dpp mainly through its core protein.

      We agree with the reviewer that additional experimental approaches are needed to address the role of the core protein of Dally. As we discussed in the response to the reviewer1, to understand the importance of the interaction of core protein of Dally with Dpp, it is important to identify a region responsible for the interaction. Our preliminary results overexpressing a dally mutant lacking the majority of core protein (but keeping the HS modified region intact) showed that HS chains modification was also lost. Although this is consistent with our results that enzymes adding HS chains also interact with the core protein of Dally (Fig. 4D), the dally mutant allele lacking the core protein would hamper us from distinguishing the role of the core protein of Dally from HS chains.

      Nevertheless, we can infer the importance of the interaction of core protein of Dally with Dpp using dally[3xHA-dlp, attP] allele, where dlp is expressed in dally expressing cells. Since Dally-like is modified by HS chains but does not interact with Dpp (Fig. 2, 4), dally[3xHA-dlp, attP] allele mimics a dally allele where HS chains are properly added but interaction of core protein with Dpp is lost. As we showed in Fig.3O, S, the allele could not rescue dallyKO phenotypes, consistent with the idea that interaction of core protein of Dally with Dpp is essential for Dpp distribution and signaling.

      Prior work has shown that a stretch of 7 amino acids in the Dpp N-terminal domain is required to interact with heparin but not with Dpp receptors (Akiyama, 2008). The authors generated an HA-tagged Dpp allele lacking these residues (HA-dpp[deltaN]). It is an embryonic lethal allele, but they can get some animals to survive to larval stages if they also supply a transgene called “JAX” containing dpp regulatory sequences. In the JAX; HA-dpp[deltaN] mutant background, they find that the distribution and signaling of this Dpp molecule is largely normal. While over-expressed Dally can increase the distribution of HA-dpp[deltaN], over-expression of Dally[deltaHS] cannot. These latter results support the model that the HS chains in Dally are required for Dpp function but not because of a direct interaction with Dpp.

      Our overexpression assays actually showed that both Dally and Dally[deltaHS] can accumulate Dpp upon overexpression and the accumulation of Dpp is comparable after normalization (Fig. 5C), consistent with the idea that interaction of DppdeltaN and HS chains are largely lost. As the reviewer pointed out, these results support the model that the HS chains in Dally are required for Dpp function but not because of a direct interaction with Dpp.

      In the last part of the results, they attempt to determine if the Dpp receptor Thickveins (Tkv) is required for Dally-HS chains interaction. The 2008 (Akiyama) model posits that Tkv activates pMad downstream of Dpp and also internalizes and degrades Dpp. A 2022 (Romanova-Michaelides) model proposes that Dally (not Tkv) internalizes Dpp.

      To distinguish between these models, the authors deplete Tkv from the dorsal compartment of the wing disc and found that extracellular Dpp increased and expanded in that domain. These results support the model that Tkv is required to internalize Dpp.

      They then tested the model that Dally antagonizes Tkv-mediated Dpp internalization by determining whether the defective extracellular Dpp distribution in Dally[KO] mutants could be rescued by depleting Tkv. Extracellular Dpp did increase in the D vs V compartment, potentially providing some support for their model. However, there are no statistics performed, which is needed for full confidence in the results. The lack of statistics is particularly problematic (1) when they state that extracellular Dpp does not rise in ap>tkv RNAi vs ap>tkv RNAi, dally[KO] wing discs (Fig. 6E) or (2) when they state that extracellular Dpp gradient expanded in the dorsal compartment when tkv was dorsally depleted in dally[deltaHS] mutants (Fig. 6I). These last two experiments are important for their model but the differences are assessed only visually. In fact, extracellular Dpp in ap>tkv RNAi, dally[KO] (Fig. 6B) appears to be lower than extracellular Dpp in ap>tkv RNAi (Fig. 6A) and the histogram of Dpp in ap>tkv RNAi, dally[KO] is actually a bit lower than Dpp in ap>tkv RNAi, But the author claim that there is no difference between the two. Their conclusion would be strengthened by statistical analyses of the two lines.

      We provided statistics for all the quantifications for pMad and extracellular Dpp distribution as supplementary data. In the previous version, we argued that extracellular Dpp level in ap>tkvRNAi, dallyKO (Fig.6B) does not increase compared with that in ap>tkvRNAi (Fig.6A). Statistical analysis (t-test) showed that the extracellular Dpp level in Fig. 6B is similar to or lower than that in Fig. 6A (Fig. 6E), confirming our conclusion. Statistical analysis (t-test) also confirmed that extracellular Dpp distribution expanded when tkv was knocked down in dallyHS mutants (Fig. 6I).

      Strengths:

      1. New genomically-engineered alleles

      A considerable strength of the study is the generation and characterization of new Dally, Dlp and Dpp alleles. These reagents will be of great use to the field.

      Thanks. We hope that these resources are indeed useful to the field.

      1. Surveying multiple phenotypes

      The authors survey numerous parameters (Dpp distribution, Dpp signaling (pMad) and adult wing phenotypes) which provides many points of analysis.

      Thanks!

      Weaknesses:

      1. Confusing discussion regarding the Dally core vs HS in Dpp stability. They don't provide any measurements or information on how they "normalize" for the level of Dally vs Dally[deltaHS]? This is important part of their model that currently is not supported by any measurements.

      We explained how we normalized in the above section and updated the method section in the revised ms.

      1. Lacking quantifications and statistical analyses:

      a. Why are statistical significance for histograms (pMad and Dpp distribution) not supplied? These histograms provide the key results supporting the authors' conclusions but no statistical tests/results are presented. This is a pervasive shortcoming in the current study.

      Thanks. We provided t-test analyses together with the raw data as supplementary data.

      b. dpp[deltaN] with JAX transgene - it would strengthen the study to supply quantitative data on the percent survival/lethal stage of dpp[deltaN] mutants with or without the JAK transgene

      In this study, we are interested in the role of dpp[deltaN] during the wing disc development. Therefore, we decided not to perform the detailed analysis on the percent survival/lethal stage of dpp[deltaN] mutants with or without the JAX transgene in the current study. Nevertheless, the fact that dpp[deltaN] allele is maintained with a balanced stock and JAX;dpp[deltaN] allele can be maintained as homozygous stock indicates that the lethality of dpp[deltaN] allele comes from the early stages. Indeed, our preliminary results showed that pMad signal is severely lost in the dpp[deltaN] embryo without JAX (data not shown), indicating that the allele is lethal at early embryonic stages.

      c. The graphs on wing size etc should start at zero.

      Thanks. We corrected this in the current ms.

      d. The sizes of histograms and graphs in each figure should be increased so that the reader can properly assess them. Currently, they are very small.

      Thanks. We changed the sizes in the current ms.

      The authors' model is that Dally (not Dlp) is required for Dpp distribution and signaling but that this is not due to a direct interaction with Dpp. Rather, they posit that Dally-HS antagonize Tkv-mediated Dpp internalization. Currently the results of the experiments could be considered consistent with their model, but as noted above, the lack of statistical analyses of some parameters is a weakness.

      Thanks. We now performed and provided the statistical analyses in the revised ms.

      One problematic part of their result for me is the role of the Dally core protein (Fig. 7B). There is a mis-match between the over-expression results and Dally allele lacking HS (but containing the core). Finally, their results support the idea that one or more as-yet unidentified proteins interact with Dally-HS chains to control Dpp distribution and signaling in the wing disc.

      Our results simply suggest that Dpp can interact with Dally mainly through core protein but this interaction is not sufficient to sustain extracellular Dpp gradient formation under physiological conditions (dallyDeltaHS) (Fig. 4Q). We find that the mis-match is not problematic if the role of Dally is not simply mediated through interaction with Dpp. We speculate that interaction of Dpp and core protein of Dally is transient and not sufficient to sustain the Dpp gradient without HS chains of Dally stabilizing extracellular Dpp distribution by blocking Tkv-mediated Dpp internalization.

      There is much debate and controversy in the Dpp morphogen field. The generation of new, high quality alleles in this study will be useful to Drosophila community, and the results of this study support the concept that Tkv but not Dally regulate Dpp internalization. Thus the work could be impactful and fuel new debates among morphogen researchers.

      Thanks.

      The manuscript is currently written in a manner that really is only accessible to researchers who work on the Dpp gradient. It would be very helpful for the authors to re-write the manuscript and carefully explain in each section of the results (1) the exact question that will be asked, (2) the prior work on the topic, (3) the precise experiment that will be done, and (4) the predicted results. This would make the study more accessible to developmental biologists outside of the morphogen gradient and Drosophila communities.

      Thanks. We modified texts and changed the order of Fig.5. We hope that the changes make this study more accessible to developmental biologists outside of the field.

    1. Author Response

      The following is the authors’ response to the original reviews.

      We thank the reviewers for their feedback. Our response and a summary of the changes made to the manuscript are shown below. In addition to the changes made in response to the reviewer’s comments, we made the following changes to improve the manuscript:

      • We updated figures 8 and 9 using data with improved preprocessing and source reconstruction. We now also include graphical network plots. This helps in the cross method (figure 8 vs 9) and cross dataset (figure 9 vs 10) comparison.

      • We added funding acknowledgments and a credit author statement.

      Reviewer #1 (Public Review):

      Summary:

      These types of analyses use many underlying assumptions about the data, which are not easy to verify. Hence, one way to test how the algorithm is performing in a task is to study its performance on synthetic data in which the properties of the variable of interest can be apriori fixed. For example, for burst detection, synthetic data can be generated by injected bursts of known durations, and checking if the algorithm is able to pick it up. Burst detection is difficult in the spectral domain since direct spectral estimators have high variance (see Subhash Chandran et al., 2018, J Neurophysiol). Therefore, detected burst lengths are typically much lower than injected burst lengths (see Figure 3). This problem can be solved by doing burst estimation in the time domain itself, for example, using Matching Pursuit (MP). I think the approach presented in this paper would also work since this model is also trained on data in the time domain. Indeed, the synthetic data can be made more "challenging" by injecting multiple oscillatory bursts that are overlapping in time, for which a greedy approach like MP may fail. It would be very interesting to test whether this method can "keep up" as the data is made more challenging. While showing results from brain signals directly (e.g., Figure 7) is nice, it will be even more impactful if it is backed up with results obtained from synthetic data with known properties.

      We completely agree with the reviewer that testing the methods using synthetic data is an important part of validating such an approach. Each of the original papers that apply these methods to a particular application do this. The focus of this manuscript is to present a toolbox for applying these methods rather than to introduce/validate the methods themselves. For a detailed validation of the methods, the reader should see the citations. For example, the following paper introduces the HMM as a method for oscillatory burst detection:

      • A.J. Quinn, et al. “Unpacking transient event dynamics in electrophysiological power spectra”. Brain topography 32.6 (2019): 1020-1034. See figures 2 and 3 for an evaluation of the HMM’s performance in detecting single-channel bursts using synthetic data.

      We have added text to paragraph 2 in section 2.5 to clarify this burst detection method has been validated using simulated data and added references.

      I was wondering about what kind of "synthetic data" could be used for the results shown in Figure 8-12 but could not come up with a good answer. Perhaps data in which different sensory systems are activated (visual versus auditory) or sensory versus movement epochs are compared to see if the activation maps change as expected. We see similarities between states across multiple runs (reproducibility analysis) and across tasks (e.g. Figure 8 vs 9) and even methods (Figure 8 vs 10), which is great. However, we should also expect the emergence of new modes specific to sensory activation (say auditory cortex for an auditory task). This will allow us to independently check the performance of this method.

      The following papers study the performance of the HMM and DyNeMo in detecting networks using synthetic data:

      • D. Vidaurre, et al. “Spectrally resolved fast transient brain states in electrophysiological data”. Neuroimage 126 (2016): 81-95. See figure 3 in this paper for an evaluation of the HMM’s performance in detecting oscillatory networks using simulation data.

      • C. Gohil, et al. “Mixtures of large-scale dynamic functional brain network modes”. Neuroimage 263 (2022): 119595. See figures 4 and 5 for an evaluation of DyNeMo performance in detecting overlapping networks and long-range temporal structure in the data.

      We have added text to paragraph 2 in section 2.5 to clarify these methods have been well tested on simulated data and added references.

      The authors should explain the reproducibility results (variational free energy and best run analysis) in the Results section itself, to better orient the reader on what to look for.

      Considering the second reviewer’s comments, we moved the reproducibility results to the supplementary information (SI). This means the reproducibility results are no longer part of the main figures/text. However, we have added some text to help the reader understand what aspects indicate the results are reproducible in section 2 of the SI.

      Page 15: the comparison across subjects is interesting, but it is not clear why sensory-motor areas show a difference and the mean lifetime of the visual network decreases. Can you please explain this better? The promised discussion in section 3.5 can be expanded as well.

      It is well known that the frequency and amplitude of neuronal oscillations changes with age. E.g. see the following review: Ishii, Ryouhei, et al. "Healthy and pathological brain aging: from the perspective of oscillations, functional connectivity, and signal complexity." Neuropsychobiology 75.4 (2018): 151-161. We observe older people have more beta activity and less alpha activity. These changes are seen in time-averaged calculations, i.e. the amplitude of oscillations are calculated using the entire time series for each subject.

      The dynamic analysis presented in the paper provides further insight into how changes in the time-averaged quantities can occur through changes in the dynamics of frequency-specific networks. The sensorimotor network, which is a network with high beta activity, has a higher fractional occupancy. This indicates the change we observe in time-average beta power may be due to a longer amount of time spent in the sensorimotor network. The visual network, which is a network with high alpha activity, shows reduced lifetimes, which can explain the reduced time-averaged alpha activity seen with ageing.

      We hope the improved text in the last paragraph of section 3.5 clarifies this. It should also be taken into account that the focus of this manuscript is the tools rather than an in-depth analysis of ageing. We use the age effect as an example of the potential analysis this toolbox enables.

      Reviewer #2 (Public Review):

      Summary:

      The authors have developed a comprehensive set of tools to describe dynamics within a single time-series or across multiple time-series. The motivation is to better understand interacting networks within the human brain. The time-series used here are from direct estimates of the brain's electrical activity; however, the tools have been used with other metrics of brain function and would be applicable to many other fields.

      Strengths:

      The methods described are principled, and based on generative probabilistic models.

      This makes them compact descriptors of the complex time-frequency data.

      Few initial assumptions are necessary in order to reveal this compact description.

      The methods are well described and demonstrated within multiple peer-reviewed articles.

      This toolbox will be a great asset to the brain imaging community.

      Weaknesses:

      The only question I had was how to objectively/quantitatively compare different network models. This is possibly easily addressed by the authors.

      We thank the reviewer for his/her comments. We address the weaknesses in our response in the “Recommendations For The Authors” section.

      Reviewer #1 (Recommendations For The Authors):

      Figure 2 legend: Please add the acronym for LCMV also.

      We have now done this.

      Section 2.5.1 page 8: the pipeline is shown in Figure 4, not 3.

      This has been fixed.

      Reviewer #2 (Recommendations For The Authors):

      This is a great paper outlining a resource that can be applied to many different fields. I have relatively minor comments apart from one.

      How does one quantitatively compare network descriptors (from DyNeMo and TDE-HMM for example)? At the moment the word 'cleaner' (P17) is used, but is there any non-subjective way? (eg Free energy/ cross validation etc). At the moment it is useful that one method gives a larger effect size (in a comparison between groups).. but could the authors say something about the use of these methods as more/less faithful descriptors of the data? Or in other words, do all methods generate datasets (from the latent space) that can be quantitatively compared with the original data?

      In principle, the variational free energy could be used to compare models. However, because we use an approximate variational free energy (an exact measure is not attainable) for DyNeMo and an exact free energy for the HMM, it is possible that any differences we see in the variational free energy between the HMM and Dynemo are caused by the errors in its approximation. This makes it unreliable for comparing across models. That said, we can still use the variational free energy to compare within models. Indeed, we use the variational free energy for quantitative model comparisons when we select the best run to analyse from a set of 10.

      One viable approach for comparing models is to assess their performance on downstream tasks. In this manuscript, examples of downstream tasks are the evoked network response and the young vs old group difference. We argue a better performance in the downstream task indicates a more useful model within that context. This performance is a quantitative measure. Note, there is no straightforward answer to which is the best model. It is likely different models will be useful for different downstream tasks.

      In terms of which model provides a more faithful description of the data. The more flexible generative model for DyNeMo means it will generate more realistic data. However, this doesn’t necessarily mean it’s the best model (for a particular downstream task). Both the HMM and DyNeMo provide complementary descriptions that can be useful.

      We have clarified the above in paragraph 5 of section 4.

      Other comments:

      • Footnote 6 - training on concatenated group data seems to be important. It could be more useful in the main manuscript where the limitations of this could be discussed.

      By concatenating the data across subjects, we learn a group-level model. By doing this, we pool information across all subjects to estimate the networks. This can lead to more robust estimates. We have moved this footnote to the main text in paragraph 1 of section 2.5 and added further information.

      • In the TDE burst detection section- please expand on why/how a specific number of states was chosen.

      As with the HMM dynamic network analysis, the number of states must be pre-specified. For burst detection, we are often interested in an on/off type segmentation, which can be achieved with a 2 state HMM. However, if there are multiple burst types, these will all be combined into a single ‘on’ state. Therefore, we might want to increase the number of states to model multiple burst types. 3 was chosen as a trade-off to stay close to the on/off description but allow the model to learn more than 1 burst type. We have added text discussing this in paragraph 4 of section 4.

      • Normally the value of free energy is just a function of the data - and only relative magnitude is important. I think figures (eg 7c) would be clearer if the offset could be removed.

      We agree only the relative magnitude is important. We added text clarifying this in section 2 of the SI. We think it would still be worthwhile to include the offset so that future users can be sure they have correctly trained a model and calculated the free energy.

      • Related to the above- there are large differences in model evidence shown between sets. Yet all sets are the same data, and all parameter estimates are more or less the same. Could the authors account for this please (i.e. is there some other parameter that differentiates the best model in one set from the other sets, or is the free energy estimate a bit variable).

      We would like to clarify only the model parameters for the best run are shown in the group-level analysis. This is the run with the lowest variational free energy, which is highlighted in red. We have now clarified this in the caption of each figure. The difference in free energy for the best runs (across sets) is relatively small compared to the variation across runs within a set. If we were to plot the model parameters for each of the 10 runs in a set, we would see more variability. We have now clarified this in section 2 of the SI.

      Also note, the group analysis usually involves taking an average. Small differences in the variational free energy could reflect small differences in subject-specific model parameters, which are then averaged out, giving virtually identical group effects.

      • And related once again, if the data are always the same, I wonder if the free-energy plots and identical parameter estimates could be removed to free up space in figures?

      The reproducibility results have now been moved to the supplementary information (SI).

      • When citing p-values please specify how they are corrected (and over what please eg over states, nodes, etc?). This would be useful didactically as I imagine most users will follow the format of the presentation in this paper.

      We now include in the caption further details of how the permutation significance testing was done.

      • Not sure of the value of tiny power maps in 9C. Would consider making it larger or removing it?

      The scale of these power maps is identical to part (A.I). We have moved the reproducibility analysis to the SI, enlarged the figure and added colour bars. We hope the values are now legible.

      • Figure 3. I think the embedding in the caption doesn't match the figure (+-5 vs +-7 lags). Would be useful to add in the units of covariance (cii).

      The number of embeddings in the caption has been fixed. Regarding the units for the covariances, as this is simulated data there aren’t really any units. Note, there is already a colour bar to indicate the values of each element.

      • Minimize variational free energy - it may be confusing for some readers that other groups maximize the negative free energy. Maybe a footnote?

      We thank the reviewer for their suggestion. We have added a footnote (1).

      • Final question- and related to the Magnetoencephalography (MEG) data presented. These data are projected into source space using a beamformer algorithm (with its own implicit assumptions and vulnerabilities). Would be interested in the authors' opinion on what is standing between this work and a complete generative model of the MEG data - i.e. starting with cortical electrical current sources with interactions modeled and a dynamic environmental noise model (i.e. packing all assumptions into one model)?

      In principle, there is nothing preventing us from including the forward model in the generative model and training on sensor level MEG data. This would be a generative model starting from the dipoles inside the brain to the MEG sensors. This is under active research. If the reviewer is referring to a biophysical model for brain activity, the main barrier for this is the inference of model parameters. However, note that the new inference framework presented in the DyNeMo paper (Gohil, et al. 2022) actually makes this more feasible. Given the scope of this manuscript is to present a toolbox for studying dynamics with existing methods, we leave this topic as future work.

    1. Author Response

      We are delighted that the reviewers found our work to have merit and we are thankful for their careful reviews and suggestions for experiments and changes to the text to further improve this study.

    1. Author Response

      We would like to express our thorough gratitude to the editors and reviewers, for the helpful comments and valuable suggestions, which provided us an opportunity to further address our research. Prior to submitting our final revision, here we provide our preliminary responses for the comments. Please find our detailed responses to the reviewers’ recommendations below.

      Reviewer #1 (Public Review):

      Summary:

      This study examines the spatial and temporal patterns of occurrence and the interspecific associations within a terrestrial mammalian community along human disturbance gradients. They conclude that human activity leads to a higher incidence of positive associations.

      Strengths:

      The theoretical framework of the study is brilliantly introduced. Solid data and sound methodology. This study is based on an extensive series of camera trap data. Good review of the literature on this topic.

      Weaknesses:

      The authors use the terms associations and interactions interchangeably.

      Response: This is not the case. In fact, we state specifically that "... interspecific associations should not be directly interpreted as a signal of biotic interactions between pairs of species…" However, co-occurrence can be an important predictor of likely interactions, such as competition and predation. We stand by our original text.

      It is not clear what the authors mean by "associations". A brief clarification would be helpful.

      Response: Our specific definition of what is meant here by spatial association can be found in the Methods section. To clarify, the calculation of the index of associations is based on the covariance for the two species of the residuals (epsilon) after consideration of all species-specific response to known environmental covariates. These covariances are modelled to allow them to vary with the level of human disturbance, measured as human presence and human modification. After normalization, the final index of association is a correlation value that varies between -1 (complete disassociation) and +1 (complete positive association).

      Also, the authors do not delve into the different types of association found in the study. A more ecological perspective explaining why certain species tend to exhibit negative associations and why others show the opposite pattern (and thus, can be used as indicator species) is missing.

      Response: Suggesting the ecological underpinnings of the associations observed here would mainly be speculation at this point, but the associations demonstrated in this analysis do suggest promising areas for the more detailed research suggested.

      Also, the authors do not distinguish between significant (true) non-random associations and random associations. In my opinion, associations are those in which two species co-occur more or less than expected by chance. This is not well addressed in the present version of the manuscript.

      Response: Results were considered to be non-random if correlation coefficients (for spatial association) or overlap (for temporal association) fell outside of 95% Confidence Intervals. This is now stated clearly in the Methods section. In Supplementary Figures S2 and S3, p<0.01 levels are also presented.

      The obtained results support the conclusions of the study.

      Anthropogenic pressures can shape species associations by increasing spatial and temporal co-occurrence, but above a certain threshold, the positive influence of human activity in terms of species associations could be reverted. This study can stimulate further work in this direction.

      Reviewer #2 (Public Review):

      Summary:

      This study analyses camera trapping information on the occurrence of forest mammals along a gradient of human modification of the environment. The key hypotheses are that human disturbance squeezes wildlife into a smaller area or their activity into only part of the day, leading to increased co-occurrence under modification. The method used is joint species distribution modelling (JSDM).

      Strengths:

      The data source seems to be very nice, although since very little information is presented, this is hard to be sure of. Also, the JSDM approach is, in principle, a nice way of simultaneously analysing the data.

      Weaknesses:

      The manuscript suffers from a mismatch of hypotheses and methods at two different levels.

      1. At the lower level, we first need to understand what the individual species do and "like" (their environmental niche). That information is not presented, and the methods suggest that the representation of each species in the JSDM is likely to be extremely poor.

      Response: The response of each species to the environmental covariates provides a window into their environmental niche, encapsulated in the beta coefficients for each environmental covariate. This information is presented in Figure 2.

      1. The hypothesis clearly asks for an analysis of the statistical interaction between human disturbance and co-occurrence. Yet, the model is not set up this way, and the authors thus do a lot of indirect exploration, rather than direct hypothesis testing.

      Response: Our JSDM model is set up specifically to examine the effect of human disturbance on co-occurrence, after controlling for shared responses to environmental variables. It directly tests the first hypothesis, since, if increase in indices of human disturbance had not tended to increase the measured spatial correlations between species as detected by the model, we would have rejected our stated hypothesis that human modification of habitats results in increased positive spatial associations between species.

      Even when the focus is not the individual species, but rather their association, we need to formulate what the expectation is. The hypotheses point towards presenting the spatial and the temporal niche, and how it changes, species for species, under human disturbance. To this, one can then add the layer of interspecific associations.

      Response: Examining each species one by one and how each one responds to human disturbance would miss the effects of any meaningful interactions between species. The analysis presented provides a means to highlight associations that would have been overlooked. Future research could go on to analyze the strongest associations in the community and the strongest effects of human disturbance so as to uncover the underlying interactions that give rise to them and the mechanisms of human impact. We believe that this will prove to be a much more productive approach than trying to tackle this problem species by species and pair by pair.

      The change in activity and space use can be analysed much simpler, by looking at the activity times and spatial distribution directly. It remains unclear what the contribution of the JSDM is, unless it is able to represent this activity and spatial information, and put it in a testable interaction with human disturbance.

      The topic is actually rather complicated. If biotic interactions change along the disturbance gradient, then observed data are already the outcome of such changed interactions. We thus cannot use the data to infer them! But we can show, for each species, that the habitat preferences change along the disturbance gradient - or not, as the case may be.

      Then, in the next step, one would have to formulate specific hypotheses about which species are likely to change their associations more, and which less (based e.g. on predator-prey or competitive interactions). The data and analyses presented do not answer any of these issues.

      Response: We suggest that the so-called “simpler” approach described above is anything but simple, and this is precisely what the Joint Species Distribution Model improves upon. As pointed out in the Introduction, simply examining spatial overlap is not enough to detect a signal of meaningful biotic interaction, since overlap could be the result of similar responses to environmental variables. With the JSDM approach, this would not be considered a positive association and would then not imply the possible existence of meaningful interaction.

      Another more substantial point is that, according to my understanding of the methods, the per-species models are very inappropriate: the predictors are only linear, and there are no statistical interactions (L374). There is no conceivable species in the world whose niche would be described by such an oversimplified model.

      Response: While interaction terms can be included in the JSDM, this would considerably increase the complexity of the models. In previous work, we have found no strong evidence for the importance of interaction terms and they do not improve the performance of the models.

      We have no idea of even the most basic characteristics of the per-species models: prevalences, coefficient estimates, D2 of the model, and analysis of the temporal and spatial autocorrelation of the residuals, although they form the basis for the association analysis!

      Response: The coefficient estimates for response to environmental variables used in the JSDM are provided in Figure 2.

      Why are times of day and day of the year not included as predictors IN INTERACTION with niche predictors and human disturbance, since they represent the temporal dimension on which niches are hypothesised to change?

      Also, all correlations among species should be shown for the raw data and for the model residuals: how much does that actually change and can thus be explained by the niche models?

      The discussion has little to add to the results. The complexity of the challenge (understanding a community-level response after accounting for species-level responses) is not met, and instead substantial room is given to general statements of how important this line of research is. I failed to see any advance in ecological understanding at the community level.

      Response: We agree that the community-level response to human disturbance is a complex topic, and we believe it is also a very important one. This research and its support of the spatial compression hypothesis, while not providing definitive answers to detailed mechanisms, opens up new lines of inquiry that makes it an important advance. For example, the strong effects of human disturbance on certain associations that were detected here could now be examined with the kind of detailed species by species and pair by pair analysis that this reviewer appears to demand.

    1. Author Response

      The following is the authors’ response to the original reviews.

      Reviewer #1 (Public Review):

      The manuscript has helped address a long-standing mystery in splicing regulation: whether splicing occurs co- or post-transcriptionally. Specifically, the authors (1) uniquely combined smFISH, expansion microscopy, and live cell imaging; (2) revealed the ordering and spatial distribution of splicing steps; and (3) discovered that nascent, not-yet-spliced transcripts move more slowly around the transcription site and undergo splicing as they move through the clouds. Based on the experimental results, the authors suggest that the observation of co-transcriptional splicing in previous literature could be due to the limitation of imaging resolution, meaning that the observed co-transcriptional splicing might actually be post-transcriptional splicing occurring in proximity to the transcription site. Overall, the work presented here clearly provides a comprehensive picture of splicing regulation.

      Major points:

      1. Linearity of expansion microscopy. For Figure 2B, it would be helpful to display the same sample before and after expansion, just like Supplementary Figure 3, but with a transcription site and "cloud". In the current version, the transcription site looks quite different in the not-expanded (more green dots on the left) and expanded image (more green dots on the top).

      We thank the reviewer for this comment on linearity of expansion. Based on our prior manuscript (Chen et al 2015 Nature Methods. PMID: 27376770), we expect expansion microscopy to yield isotropic expansion. Indeed, as shown in Supplemental Figure 3, we confirmed that expansion of nuclei (3B, top) and transcripts (3B, bottom) is isotropic. Additionally, before splicing inhibition, we demonstrated the linearity of expansion for a transcription site (3B, left), shown at standard resolution with intron stain. The images shown in Figure 2B are meant solely to illustrate the change in resolution upon expansion, and are not meant to imply spatial matching between the expanded and unexpanded image. We apologize for the confusion and have clarified this in the figure legend for Figure 2.

      We also point the reader towards Supplemental Figure 4, in which we validate the use of expansion microscopy in these findings. We show that transcription sites in expanded samples were the same size as those imaged using stochastic optical reconstruction microscopy (STORM), demonstrating that expansion did not significantly alter the morphology of the site.

      1. FISH dot colocalization. What is the colocalization rate of FISH dots in general under experimental conditions? In addition, in Figures 2C and 2G, why do some 3'exon dots not have co-localized 5'exon dots?

      We thank the reviewer for asking for these important clarifications. Under standard (non-expanded) conditions, our colocalization of 3’ and 5’ spots varies by gene, but more than 75% of intron spots colocalize with exon spots for the vast majority of transcripts we evaluated. The percentage of colocalization for each gene and intron can be found in column 4 of Table 1.

      Regarding the second point—these individual images may not reflect the actual quantitative number of spot counts at the site, as these transcription sites have a sizable Z dimension that is difficult to capture in one image, and certain dyes are more easily visually distinguished in contrasted images than others. These factors may cause some 3’ spots to appear without a corresponding co-localized 5’ spot in these images. We refer the reviewer to Supplemental Figure 4C for quantitative spot counting of an expanded transcription site, for which there are a similar number of 3’ end and 5’ end spots within the entire Z-stacked image. Importantly, these transcription site clouds contain longer, unspliced transcripts, potentially leading to further separation between the 5’ and 3’ ends of a single transcript when compared to a cytoplasmic, spliced transcript (quantified in Figure 2I).

      1. It would be helpful if the authors uploaded a few examples of live cell imaging movies.

      Certainly! Please refer to the new Supplementary Movies 1-3 for representative examples of live cell imaging data.

      1. It is recommended to double-check the text for errors.

      We apologize for errors in the original manuscript, and have made the appropriate corrections.

      Reviewer #2 (Public Review):

      Allison Coté et al. investigated the ordering and spatial distribution of nascent transcripts in several cells using smFISH, expansion microscopy, and live-cell imaging. They find that pre-mRNA splicing occurs post-transcriptionally at the clouds around the transcription start site, termed the transcription site proximal zone. They show that pre-mRNA may undergo continuous splicing when they pass through the zone after transcription. These data suggest a unifying model for explaining previously reported co-transcriptional splicing events and provide a direction for further study of the nature of the slow-moving zone around the transcription start site.

      This paper is well-written. The findings are very important, and the data supports the conclusions well. However, some aspects of the image and description need to be clarified and revised.

      The authors describe Figure 4E and 4F results in the main text as that "we performed RNA FISH simultaneously with immunofluorescence for SC35, a component of speckles, and saw that this compartmentalized pre-mRNA did indeed appear near nuclear speckles both before (Supplementary Figure 6C) and after (Figure 4E) splicing inhibition." However, no SC35 staining is shown in the Figure 4E. A similar situation happened in describing Figure 4F.

      We thank the reviewer for noting this error. We mistakenly called in text for Figure 4E, when we meant to refer to Figure 4G, which shows combined RNA FISH and SC35 immunofluorescence show compartmentalization within nuclear speckles. Figures 4E and 4F do not show SC35 immunofluorescence. We have altered the text and figure captions accordingly. Recommendations for the authors: please note that you control which revisions to undertake from the public reviews and recommendations for the authors Reviewer #1 (Recommendations For The Authors):

      Minor points:

      1. For Figures, it would be better to mark co-transcriptional and proximal post-transcriptional splicing in a clearer way. Like in Figure 1A, the simulated RNA FISH signals are almost identical across two conditions, which is a bit confusing. Overlapping and close proximity shall be better illustrated in related figures.

      We thank the reviewer for these suggestions. We have iterated these figures through multiple revisions and have found that these diagrams tend to resonate the most, so we have elected to keep them as is, but we do appreciate the suggestion.

      1. May include some details of expansion microscopy in the last paragraph of the Introduction. For example, why introduce expansion microscopy? To what level it can help overcome the diffraction limit?

      We thank the reviewer for this comment, and have added additional text to this paragraph to further set up the use of expansion microscopy.

      1. Double-check the formatting. Some sub-titles are in Bold, some in Italic.

      We apologize for any formatting errors, and have made the appropriate corrections.

      1. Please double-check the writing. I find many incompatible parts across the manuscript. For example, as described in the Figure 1D caption, there aren't "first" and "second" graphs in the figure. Moreover, some writings require additional refinement. For instance, in the Introduction part, the paragraph discussing RNA imaging, various techniques (such as FISH and live imaging), and concerns (such as microscopy resolution, chromatin fraction, and limitations related to reporter genes) are intertwined without clear indexing or logical structuring. Similar cases in other paragraphs too. Last but not least, I can even find repetitive sentences across the manuscript. For instance, I believe that the authors forgot to delete "By distinguishing the separate fluorescent signals from probes bound to exons and introns, we could visualize splicing intermediates (represented by colocalized intron and exon spots) relative to the site of transcription (represented by bright colocalized intron and exon spots) and fully spliced products (represented by exon spots alone)." in the first paragraph of the Results part, as the exact same sentence re-occurs right after. I've only listed a few examples here. Please refine the manuscript.

      We apologize for any errors in the original manuscript, and have made the appropriate corrections.

      Reviewer #2 (Recommendations For The Authors):

      1. The sentence "By distinguishing the separate fluorescent signals from probes bound to exons and introns, we could visualize splicing intermediates (represented by colocalized intron and exon spots) relative to the site of transcription (represented by bright colocalized intron and exon spots) and fully spliced products (represented by exon spots alone)." is accidentally repeated twice, one of them should be deleted.

      We apologize for this duplication, and have made the appropriate correction.

    1. Author Response:

      Reviewer #1 (Public Review):

      Summary:<br /> The global decline of amphibians is primarily attributed to deadly disease outbreaks caused by the chytrid fungus, Batrachochytrium dendrobatidis (Bd). It is unclear whether and how skin-resident immune cells defend against Bd. Although it is well known that mammalian mast cells are crucial immune sentinels in the skin and play a pivotal role in the immune recognition of pathogens and orchestrating subsequent immune responses, the roles of amphibian mast cells during Bd infections are largely unknown. The current study developed a novel way to enrich X. laevis skin mast cells by injecting the skin with recombinant stem cell factor (SCF), a KIT ligand required for mast cell differentiation and survival. The investigators found an enrichment of skin mast cells provides X. laevis substantial protection against Bd and mitigates the inflammation-related skin damage resulting from Bd infection. Additionally, the augmentation of mast cells leads to increased mucin content within cutaneous mucus glands and shields frogs from the alterations to their skin microbiomes caused by Bd.

      Strengths:<br /> This study underscores the significance of amphibian skin-resident immune cells in defenses against Bd and introduces a novel approach to examining interactions between amphibian hosts and fungal pathogens.

      Weaknesses:<br /> The main weakness of the study is the lack of functional analysis of X. laevis mast cells. Upon activation, mast cells have the characteristic feature of degranulation to release histamine, serotonin, proteases, cytokines, and chemokines, etc. The study should determine whether X. laevis mast cells can be degranulated by two commonly used mast cell activators IgE and compound 48/80 for IgE-dependent and independent pathways. This can be easily done in vitro. It is also important to assess whether in vivo these mast cells are degranulated upon Bd infection using avidin staining to visualize vesicle releases from mast cells. Figure 3 only showed rSCF injection caused an increase in mast cells in naïve skin. They need to present whether Bd infection can induce mast cell increase and rSCF injection under Bd infection causes a mast cell increase in the skin. In addition, it is unclear how the enrichment of mast cells provides protection against Bd infection and alternations to skin microbiomes after infection. It is important to determine whether skin mast cells release any contents mentioned above.

      We would like to thank the reviewer for taking the time to review our work and for providing us with valuable feedback.

      Please note that amphibians do not possess the IgE antibody isotype1.

      To our knowledge there have been no published studies using approaches for studying mammalian mast cell degranulation to examine amphibian mast cells. Notably, several studies suggest that amphibian mast cells lack histamine2, 3, 4, 5 and serotonin2, 6. While there are commercially available kits and reagents for examining mammalian mast cell granule content, most of these reagents may not cross-react with their amphibian counterparts. This is especially true of cytokines and chemokines, which diverged quickly with evolution and thus do not share substantial protein sequence identity across species as divergent as frogs and mammals. Respectfully, while following up on these findings is possible, it would involve considerable additional work to find reagents that would detect amphibian mast cell contents.

      We would also like to respectfully point out that while mast cell degranulation is a feature most associated with mammalian mast cells, this is not the only means by which mammalian mast cells confer their immunological effects. While we agree that defining the biology of amphibian mast cell degranulation is important, we anticipate that since the anti-Bd protection conferred by enriching frog mast cells is seen after 21 days of enrichment, it is quite possible that degranulation may not be the central mechanism by which the mast cells are mediating this protection.

      As noted in our manuscript, frog mast cells upregulate their expression of interleukin-4 (IL4), which is a hallmark cytokine associated with mammalian mast cells7. We are presently exploring the role of the frog IL4 in the observed mast cell anti-Bd protection. Should we generate meaningful findings in this regard, we will add them to the revised version of this manuscript.

      We are also exploring the heparin content of frog mast cells and capacities of these cells to degranulate in vitro in response to compound 48/80. In addition, we are exploring in vivo mast cell degranulation via histology and avidin-staining. Should these studies generate significant findings, we will include them in the revised version of this manuscript.

      Per the reviewer’s suggestion, in our revised manuscript we also plan to include data showing whether Bd infections affect skin mast cell numbers and how rSCF injection impacts skin mast cell numbers in the context of Bd infections.

      In regard to how mast cells impact Bd infections and skin microbiomes, our data indicate that mast cells are augmenting skin integrity during Bd infections and promoting mucus production, as indicated by the findings presented in Figure 4A-C and Figure 5A-C, respectively. There are several mammalian mast cell products that elicit mucus production. In mammals, this mucus production is mediated by goblet cells while the molecular control of amphibian skin mucus gland content remains incompletely understood. Interleukin-13 (IL13) is the major cytokine associated with mammalian mucus production8, while to our knowledge this cytokine is either not encoded by amphibians or else has yet to be identified and annotated in these animals’ genomes. IL4 signaling also results in mucus production9 and we are presently exploring the possible contribution of the X. laevis IL4 to skin mucus gland filling. Any significant findings on this front will be included in the revised manuscript. Histamine release contributes to mast cell-mediated mucus production10, but as we outline above, several studies indicate that amphibian mast cells may lack histamine2, 3, 4, 5. Mammalian mast cell-produced lipid mediators also play a critical role in eliciting mucus secretion11 and our transcriptomic analysis indicates that frog mast cells express several enzymes associated with production of such mediators. We will highlight this observation in our revised manuscript.

      We anticipate that X. laevis mast cells influence skin integrity, microbial composition and Bd susceptibility in a myriad of ways. Considering the substantial differences between amphibian and mammalian evolutionary histories and physiologies, we anticipate that many of the mechanisms by which X. laevis mast cells confer anti-Bd protection will prove to be specific to amphibians and some even unique to X. laevis. We are most interested in deciphering what these mechanisms are but foresee that they will not necessarily reflect what one would expect based on what we know about mammalian mast cells in the context of mammalian physiologies.

      Reviewer #2 (Public Review):

      Summary:<br /> In this study, Hauser et al investigate the role of amphibian (Xenopus laevis) mast cells in cutaneous immune responses to the ecologically important pathogen Batrachochytrium dendrobatidis (Bd) using novel methods of in vitro differentiation of bone marrow-derived mast cells and in vivo expansion of skin mast cell populations. They find that bone marrow-derived myeloid precursors cultured in the presence of recombinant X. laevis Stem Cell Factor (rSCF) differentiate into cells that display hallmark characteristics of mast cells. They inject their novel (r)SCF reagent into the skin of X. laevis and find that this stimulates the expansion of cutaneous mast cell populations in vivo. They then apply this model of cutaneous mast cell expansion in the setting of Bd infection and find that mast cell expansion attenuates the skin burden of Bd zoospores and pathologic features including epithelial thickness and improves protective mucus production and transcriptional markers of barrier function. Utilizing their prior expertise with expanding neutrophil populations in X. laevis, the authors compare mast cell expansion using (r)SCF to neutrophil expansion using recombinant colony-stimulating factor 3 (rCSF3) and find that neutrophil expansion in Bd infection leads to greater burden of zoospores and worse skin pathology.

      Strengths: <br /> The authors report a novel method of expanding amphibian mast cells utilizing their custom-made rSCF reagent. They rigorously characterize expanded mast cells in vitro and in vivo using histologic, morphologic, transcriptional, and functional assays. This establishes solid footing with which to then study the role of rSCF-stimulated mast cell expansion in the Bd infection model. This appears to be the first demonstration of the exogenous use of rSCF in amphibians to expand mast cell populations and may set a foundation for future mechanistic studies of mast cells in the X. laevis model organism. 

      We thank the reviewer for recognizing the breadth and extent of the undertaking that culminated in this manuscript. Indeed, this manuscript would not have been possible without considerable reagent development and adaptation of techniques that had previously not been used for amphibian immunity research. In line with the reviewer’s sentiment, to our knowledge this is the first report of using molecular approaches to augment amphibian mast cells, which we hope will pave the way for new areas of research within the fields of comparative immunology and amphibian disease biology.

      Weaknesses:<br /> The conclusions regarding the role of mast cell expansion in controlling Bd infection would be stronger with a more rigorous evaluation of the model, as there are some key gaps and remaining questions regarding the data. For example:

      1. Granulocyte expansion is carefully quantified in the initial time courses of rSCF and rCSF3 injections, but similar quantification is not provided in the disease models (Figures 3E, 4G, 5D-G). A key implication of the opposing effects of mast cell vs neutrophil expansion is that mast cells may suppress neutrophil recruitment or function. Alternatively, mast cells also express notable levels of csfr3 (Figure 2) and previous work from this group (Hauser et al, Facets 2020) showed rG-CSF-stimulated peritoneal granulocytes express mast cell markers including kit and tpsab1, raising the question of what effect rCSF3 might have on mast cell populations in the skin. Considering these points, it would be helpful if both mast cells and neutrophils were quantified histologically (based on Figure 1, they can be readily distinguished by SE or Giemsa stain) in the Bd infection models.

      We thank the reviewer for this insightful suggestion. We are performing a further examination of skin granulocyte content during Bd infections and plan on including any significant findings in our revised manuscript.

      We predict that rSCF administration results in the accumulation of mast cells that are polarized such that they ablate the inflammatory response elicited by Bd infection. Mammalian mast cells, including peritonea-resident mast cells, express csf3r12, 13. Although the X. laevis animal model does not permit nearly the degree of immune cell resolution afforded by mammalian animal models, we do know that the adult X. laevis peritonea contain heterogenous leukocyte populations. We anticipate that the high kit expression reported by Hauser et al., 2020 in the rCSF3-recruited peritoneal leukocytes reflects the presence of mast cells therein. As such and in acknowledgement of the reviewer’s suggestion, we also think that the cells recruited by rCSF3 into the skin may include not only neutrophils but also mast cells. Possibly, these mast cells have distinct polarization states from those enriched by rSCF. While the lack of antibodies against frog neutrophils or mast cells has limited our capacity to address this question, we will attempt to reexamine by histology the proportions of skin neutrophils and mast cells in the skins of frogs under the conditions described in our manuscript. Any new findings in this regard will be included in the revised version of this work.

      2. Epithelial thickness and inflammation in Bd infection are reported to be reduced by rSCF treatment (Figure 3E, 5A-B) or increased by rCSF3 treatment (Figure 4G) but quantification of these critical readouts is not shown.

      We thank the reviewer for this suggestion. We will score epithelial thickness under the distinct conditions described in our manuscript and present the quantified data in the revised paper.

      3. Critical time points in the Bd model are incompletely characterized. Mast cell expansion decreases zoospore burden at 21 dpi, while there is no difference at 7 dpi (Figure 3E). Conversely, neutrophil expansion increases zoospore burden at 7 dpi, but no corresponding 21 dpi data is shown for comparison (Figure 4G). Microbiota analysis is performed at a third time point,10 dpi (Figure 5D-G), making it difficult to compare with the data from the 7 dpi and 21 dpi time points. Reporting consistent readouts at these three time points is important to draw solid conclusions about the relationship of mast cell expansion to Bd infection and shifts in microbiota.

      Because there were no significant effects of mast cell enrichment at 7 days post Bd infection, we chose to look at the microbiome composition in a subsequent experiment at 10 days and 21 days post Bd infection, with 10 days being a bit more of a midway point between the initial exposure and day 21, when we see the effect on Bd loads. We will clarify this rationale in the revised manuscript.

      The enrichment of neutrophils in frog skins resulted in prompt (12 hours post enrichment) skin thickening (in absence of Bd infection) and increased frog Bd susceptibility by 7 days of infection. Conversely, mast cell enrichment stabilized skin mucosal and symbiotic microbial environment, presumably accounting at least in part for the lack of further Bd growth on mast cell-enriched animals by 21 days of infection. Our question regarding the roles of inflammatory granulocytes/neutrophils during Bd infections was that of ‘how’ rather ‘when’ these cells affect Bd infections. Because the central focus of this work was mast cells and not other granulocyte subsets, when we saw that rCSF3-recruited granulocytes adversely affected Bd infections at 7 days post infection, we did not pursue the kinetics of these responses further. We plan to explore the roles of inflammatory mediators and disparate frog immune cell subsets during the course of Bd infections, but we feel that these future studies are more peripheral to the central thesis of the present manuscript regarding the roles of frog mast cells during Bd infections.

      4. Although the effect of rSCF treatment on Bd zoospores is significant at 21 dpi (Figure 3E), bacterial microbiota changes at 21 dpi are not (Figure S3B-C). This discrepancy, how it relates to the bacterial microbiota changes at 10 dpi, and why 7, 10, and 21 dpi time points were chosen for these different readouts (Figure 5F-G), is not discussed.

      Our results indicate that after 10 days of Bd infection, control Bd-challenged animals exhibited reduced microbial richness, while skin mast cell-enriched Bd-infected frogs were protected from this disruption of their microbiome. The amphibian microbiome serves as a major barrier to these fungal infections14, and we anticipate that Bd-mediated disruption of microbial richness and composition facilitates host skin colonization by this pathogen. Control and mast cell-enriched animals had similar skin Bd loads at 10 days post infection. However, by 21 days of Bd infection the mast cells-enriched animals maintained their Bd loads to levels observed at 10 days post infection, whereas the control animals had significantly greater Bd loads. Thus, we anticipate that frog mast cells are conferring the observed anti-Bd protection in part by preventing microbial disassembly and thus interfering with optimal Bd colonization and growth on frog skins. In other words, maintained microbial composition at 10 days of infection may be preventing additional Bd colonization/growth, as seen when comparing skins of control and mast cell-enriched frogs at 21 days post infection. By 21 days of infection, control animals rebounded from the Bd-mediated reduction in bacterial richness seen at 10 days. Considering that after 21 days of infection control animals also had significantly greater Bd loads than mast-cell enriched animals suggests that there may be a critical earlier window during which microbial composition is able to counteract _Bd_growth. 

      While the current draft of our manuscript has a paragraph to this effect (see below), we appreciate the reviewer conveying to us that our perspective on the relationship between skin mast cells and the kinetics of microbial composition and _Bd_loads could be better emphasized. We plan to revise our manuscript to include the above discussion points. 

      Bd infections caused major reductions in bacterial taxa richness, changes in composition and substantial increases in the relative abundance of Bd-inhibitory bacteria early in the infection. Similar changes to microbiome structure occur during experimental Bd infections of red-backed salamanders and mountain yellow-legged frogs15, 16. In turn, progressing Bd_infections corresponded with a return to baseline levels of _Bd-inhibitory bacteria abundance and rebounding microbial richness, albeit with dissimilar communities to those seen in control animals. These temporal changes indicate that amphibian microbiomes are dynamic, as are the effects of Bd infections on them. Indeed, Bd infections may have long-lasting impacts on amphibian microbiomes15. While Bd infections manifested in these considerable changes to frog skin microbiome structure, mast cell enrichment appeared to counteract these deleterious effects to their microbial composition. Presumably, the greater skin mucosal integrity and mucus production observed after mast cell enrichment served to stabilize the cutaneous environment during Bd infections, thereby ameliorating the Bd-mediated microbiome changes. While this work explored the changes in established antifungal flora, we anticipate the mast cell-mediated inhibition of Bd may be due to additional, yet unidentified bacterial or fungal taxa. Intriguingly, while mammalian skin mast cell functionality depends on microbiome elicited SCF production by keratinocytes17, our results indicate that frog skin mast cells in turn impact skin microbiome structure and likely their function. It will be interesting to further explore the interdependent nature of amphibian skin microbiomes and resident mast cells.

      5. The time course of rSCF or rCSF3 treatments relative to Bd infection in the experiments is not clear. Were the treatments given 12 hours prior to the final analysis point to maximize the effect? For example, in Figure 3E, were rSCF injections given at 6.5 dpi and 20.5 dpi? Or were treatments administered on day 0 of the infection model? If the latter, how do the authors explain the effects at 7 dpi or 21 dpi given mast cell and neutrophil numbers return to baseline within 24 hours after rSCF or rCSF3 treatment, respectively?

      Please find the schematic of the immune manipulation, Bd infection, and sample collection times below. We will include a figure like this in our revised manuscript.

      The title of the manuscript may be mildly overstated. Although Bd infection can indeed be deadly, mortality was not a readout in this study, and it is not clear from the data reported that expanding skin mast cells would ultimately prevent progression to death in Bd infections.

      We acknowledge this point. The revised manuscript will be titled: “Amphibian mast cells: barriers to chytrid fungus infections”.

      Reviewer #3 (Public Review):

      Summary:<br /> Hauser et al. provide an exceptional study describing the role of resident mast cells in amphibian epidermis that produce anti-inflammatory cytokines that prevent Batrachochytrium dendrobatidis (Bd) infection from causing harmful inflammation, and also protect frogs from changes in skin microbiomes and loss of mucin in glands and loss of mucus integrity that otherwise cause changes to their skin microbiomes. Neutrophils, in contrast, were not protective against Bd infection. Beyond the beautiful cytology and transcriptional profiling, the authors utilized elegant cell enrichment experiments to enrich mast cells by recombinant stem cell factor, or to enrich neutrophils by recombinant colony-stimulating factor-3, and examined respective infection outcomes in Xenopus.

      Strengths:<br /> Through the use of recombinant IL4, the authors were able to test and eliminate the hypothesis that mast cell production of IL4 was the mechanism of host protection from Bd infection. Instead, impacts on the mucus glands and interaction with the skin microbiome are implicated as the protective mechanism. These results will press disease ecologists to examine the relative importance of this immune defense among species, the influence of mast cells on the skin microbiome and mucosal function, and open the potential for modulating mucosal defense.

      We thank the reviewer for recognizing the significance and utility of the findings presented in our manuscript.

      Weaknesses:<br /> A reduction of bacterial diversity upon infection, as described at the end of the results section, may not always be an "adverse effect," particularly given that anti-Bd function of the microbiome increased. Some authors (see Letourneau et al. 2022 ISME, or Woodhams et al. 2023 DCI) consider these short-term alterations as encoding ecological memory, such that continued exposure to a pathogen would encounter an enriched microbial defense. Regardless, mast cell-initiated protection of the mucus layer may negate the need for this microbial memory defense.

      We thank the reviewer their insightful comment. We will revise our discussion to include this possible interpretation.

      While the description of the mast cell location in the epidermal skin layer in amphibians is novel, it is not known how representative these results are across species ranging in chytridiomycosis susceptibility. No management applications are provided such as methods to increase this defense without the use of recombinant stem cell factor, and more discussion is needed on how the mast cell component (abundance, distribution in the skin) of the epidermis develops or is regulated.

      We appreciate the reviewer’s comment and would like to point out that the work presented in our manuscript was driven by comparative immunology questions more than by conservation biology.

      We thank the reviewer for suggesting expanding our discussion to include potential management applications and potential mechanisms for regulating frog skin mast cells. While any content to these effects would be highly speculative, we agree that it may spark new interest and pave new avenues for research. To this end, our revised manuscript will include a paragraph to this effect.

      References:

      1.         Flajnik, M.F. A cold-blooded view of adaptive immunity. Nat Rev Immunol 18, 438-453 (2018).

      2.         Mulero, I., Sepulcre, M.P., Meseguer, J., Garcia-Ayala, A. & Mulero, V. Histamine is stored in mast cells of most evolutionarily advanced fish and regulates the fish inflammatory response. Proc Natl Acad Sci U S A 104, 19434-19439 (2007).

      3.         Reite, O.B. A phylogenetical approach to the functional significance of tissue mast cell histamine. Nature 206, 1334-1336 (1965).

      4.         Reite, O.B. Comparative physiology of histamine. Physiol Rev 52, 778-819 (1972).

      5.         Takaya, K., Fujita, T. & Endo, K. Mast cells free of histamine in Rana catasbiana. Nature 215, 776-777 (1967).

      6.         Galli, S.J. New insights into "the riddle of the mast cells": microenvironmental regulation of mast cell development and phenotypic heterogeneity. Lab Invest 62, 5-33 (1990).

      7.         Babina, M., Guhl, S., Artuc, M. & Zuberbier, T. IL-4 and human skin mast cells revisited: reinforcement of a pro-allergic phenotype upon prolonged exposure. Archives of dermatological research 308, 665-670 (2016).

      8.         Lai, H. & Rogers, D.F. New pharmacotherapy for airway mucus hypersecretion in asthma and COPD: targeting intracellular signaling pathways. J Aerosol Med Pulm Drug Deliv 23, 219-231 (2010).

      9.         Rankin, J.A. et al. Phenotypic and physiologic characterization of transgenic mice expressing interleukin 4 in the lung: lymphocytic and eosinophilic inflammation without airway hyperreactivity. Proc Natl Acad Sci U S A 93, 7821-7825 (1996).

      10.       Church, M.K. Allergy, Histamine and Antihistamines. Handb Exp Pharmacol 241, 321-331 (2017).

      11.       Nakamura, T. The roles of lipid mediators in type I hypersensitivity. J Pharmacol Sci 147, 126-131 (2021).

      12.       Aponte-Lopez, A., Enciso, J., Munoz-Cruz, S. & Fuentes-Panana, E.M. An In Vitro Model of Mast Cell Recruitment and Activation by Breast Cancer Cells Supports Anti-Tumoral Responses. Int J Mol Sci 21 (2020).

      13.       Jamur, M.C. et al. Mast cell repopulation of the peritoneal cavity: contribution of mast cell progenitors versus bone marrow derived committed mast cell precursors. BMC Immunol 11, 32 (2010).

      14.       Walke, J.B. & Belden, L.K. Harnessing the Microbiome to Prevent Fungal Infections: Lessons from Amphibians. PLoS Pathog 12, e1005796 (2016).

      15.       Jani, A.J. et al. The amphibian microbiome exhibits poor resilience following pathogen-induced disturbance. ISME J 15, 1628-1640 (2021).

      16.       Muletz-Wolz, C.R., Fleischer, R.C. & Lips, K.R. Fungal disease and temperature alter skin microbiome structure in an experimental salamander system. Mol Ecol 28, 2917-2931 (2019).

      17.       Wang, Z. et al. Skin microbiome promotes mast cell maturation by triggering stem cell factor production in keratinocytes. J Allergy Clin Immunol 139, 1205-1216 e1206 (2017).

    1. Author Response

      The following is the authors’ response to the original reviews.

      We thank the two reviewers very much for their careful review and valuable comments. Upon these comments, the following revisions have been made. First, we have performed a new analysis on human accelerated regions (HARs) recently reported by the Zoonomia Project. Second, we have presented more data on experimentally detected and computationally predicted DBSs of MALAT1, NEAT1, and MEG3. Third, we have added details on the RNA-seq data processing and subsequent differential expression testing to the Materials and Methods section. Fourth, we have clarified some details on the human ancestor sequence and the use of parameters and thresholds. Six new citations are added. In addition, we have also carefully polished the main text. We hope these revisions, together with the Responses-to-Reviewers, would help the reader better get the information from the paper.

      eLife assessment

      In this valuable manuscript, the authors attempt to examine the role of long non-coding RNAs (lncRNAs) in human evolution, through a set of population genetics and functional genomics analyses that leverage existing datasets and tools. Although the methods are at times inadequate - for example, suitable methods and/or relevant controls are lacking at many points, and selection is inferred sometimes too quickly - the results nonetheless point towards a possible contribution of long non-coding RNAs to the evolution of human biology and they suggest clear directions for future, more rigorous study.

      Public Reviews:

      Reviewer #1 (Public Review):

      Summary

      While DNA sequence divergence, differential expression, and differential methylation analysis have been conducted between humans and the great apes to study changes that "make us human", the role of lncRNAs and their impact on the human genome and biology has not been fully explored. In this study, the authors computationally predict HSlncRNAs as well as their DNA Binding sites using a method they have developed previously and then examine these predicted regions with different types of enrichment analyses. Broadly, the analysis is straightforward and after identifying these regions/HSlncRNAs the authors examined their effects using different external datasets.

      Strengths/weaknesses

      By and large, the analysis performed is dependent on their ability to identify HSlncRNAs and their DBS. I think that they have done a good job of showing the performance metrics of their methods in previous publications. Thereafter, they perform a series of enrichment-type analyses that have been used in the field for quite a while now to look at tissue-specific enrichment, or region-specific enrichment, or functional enrichment, and I think these have been carried out well. The authors achieved the aims of their work. I think one of the biggest contributions that this paper brings to the field is their annotation of these HSlncRNAs. Thus a major revisionary effort could be spent on applying their method to the latest genomes that have been released so that the community could get a clean annotation of newly identified HSlncRNAs (see comment 2).

      Comments

      1. Though some of their results about certain HSlncRNAs having DBSs in all genes is rather surprising/suspicious, I think that broadly their process to identify and validate DBSs is robust, they have multiple lines of checks to identify such regions, including functional validation. These predictions are bound to have some level of false positive/negative rate and it might be nice to restate those here and on what experiment/validation data these were conducted. However, the rest of their analysis comprises different types of enrichment analysis which shouldn't be affected by outlier HSlncRNAs if indeed their FPR/FNR are low.

      2. There are now several new genomes available as part of the Zoonomia consortium and 240 Primate consortium papers released. These papers have re-examined some annotations such as Human Accelerated Regions (HARs) and found with a larger dataset as well as better reference genomes, that a large fraction of HARs were actually incorrectly annotated - that is that they were also seen in other lineages outside of just the great apes. If these papers have not already examined HSlncRNAs, the authors should try and re-run the computational predictions with this updated set and then identify HSlncRNAs there. This might help to clarify their signal and remove lncRNAs that might be present in other primates but are somehow missing in the great apes. This might also help to mitigate some results that they see in section 3 of their paper in comparing DBS distances between archaics and humans.

      Responses:

      (1) Thanks for the good suggestion. We have checked the Zoonomia reported genomes and found that new primate genomes are monkeys and lemurs but not apes (Zoonomia Consortium. Nature 2023. https://doi.org/10.1038/s41586-020-2876-6), and the phylogenetic relationships between monkeys and humans are much more remote than those between apes and humans. In addition, the Zoonomia project did target identifying new lncRNA genes.

      (2) We have examined the Zoonomia-reported HARs (Keough et al. Science 2023. DOI: 10.1126/science.abm1696). Of the 312 HARs reported by Keough et al, 8 overlap 26 DBSs of 14 HS lncRNAs; moreover, DBSs greatly outnumber HARs, suggesting that HAR and DBS are different sequences with different functions.

      (3) In the revised manuscript, a new paragraph (the second one) has been added to the section “HS lncRNAs regulate diverse genes and transcripts” to describe the HAR analysis result.

      1. The differences between the archaic hominins in their DBS distances to modern humans are a bit concerning. At some level, we expect these to be roughly similar when examining African modern humans and perhaps the Denisovan being larger when examining Europeans and Asians, but they seem to have distances that aren't expected given the demography. In addition, from their text for section 3, they begin by stating that they are computing two types of distances but then I lost track of which distance they were discussing in paragraph 3 of section 3. Explicitly stating which of the two distances in the text would be helpful for the reader.

      Responses:

      (1) Upon the archaic human genomes, the genomic distances from the three modern humans are shorter to Denisovan than to Altai Neanderthal; however, upon the related studies we cite, the phylogenetic relationship between the three modern humans is more remote to Denisovan than to Altai Neanderthal. Thus, the finding that 2514 and 1256 DBSs have distances >0.034 in Denisovans and Altai Neanderthals is not unreasonable. The numbers of DBSs, of course, depend on the cutoff of 0.034, which is somewhat subjective but not unreasonable.

      (2) The second paragraph is added to the Discussion, discussing parameters and cutoffs.

      (3) Regarding the two types of distance, the distances computed in the first way were not further analyzed because, as we note, “This anomaly may be caused by that the human ancestor was built using six primates without archaic humans”.

      1. Isn't the correct control to examine whether eQTLs are more enriched in HSlncRNA DBSs a set of transcription factor binding sites? I don't think using just promoter regions is a reasonable control here. This does not take away from the broader point however that eQTLs are found in DBSs and I think they can perform this alternate test.

      Responses:

      Indeed, TFBSs are more comparable to DBSs than promoters. However, many more methods have been developed to predict TFBSs than to predict DBSs, making us concerned about TFBS prediction's reliability. Since most QTLs in DBSs are mQTLs (Supplementary Table 13), but many QTLs in TFBSs are eQTLs (Flynn et al. PLoS Genetics 2021. DOI: 10.1371/journal.pgen.1009719), it is pretty safe to conclude that DBSs are enriched in mQTLs.

      1. In the Discussion, they highlight the evolution of sugar intake, which I'm not sure is appropriate. This comes not from GO enrichment but rather from a few genes that are found at the tail of their distribution. While these signals may be real, the evolution of traits is often highly polygenic and they don't see this signal in their functional enrichment. I suggest removing that line. Moreover, HSlncRNAs are ones that are unique across a much longer time frame than the transition to agriculture which is when sugar intake rose greatly. Thus, it's unlikely to see enrichment for something that arose in the past 6000-7000 years would in the annotation that is designed to detect human-chimp or human-neanderthal level divergence.

      Responses:

      (1) The Discussion on human adaptation to high sugar intake is based on both enriched GO terms (Supplementary Table 4, 7) and a set of genes in modern humans with the most SNP-rich DBSs (Table 2). These glucose-related GO terms are not at the tail of the list because, of the 614 enriched GO terms (enriched in genes with strongest DBSs), glucose metabolism-related ones are ranked 208, 212, 246, 264, 504, 522, 591, and of the 409 enriched GO terms (enriched in the top 1256 genes in Altai Neanderthals), glucose metabolism-related ones are ranked 152 and 217.

      (2) Indeed, there are other top-ranked enriched GO terms; some (e.g., neuron projection development (GO:0031175) and cell projection morphogenesis (GO:0048858)) have known impact on human evolution, but the impact of others (e.g., cell junction organization (GO:0034330)) remain unclear. We specifically report human adaptation to high sugar intake because the DBSs in related genes show differences in modern humans (Table 2).

      Reviewer #2 (Public Review):

      Lin et al attempt to examine the role of lncRNAs in human evolution in this manuscript. They apply a suite of population genetics and functional genomics analyses that leverage existing data sets and public tools, some of which were previously built by the authors, who clearly have experience with lncRNA binding prediction. However, I worry that there is a lack of suitable methods and/or relevant controls at many points and that the interpretation is too quick to infer selection. While I don't doubt that lnc RNAs contribute to the evolution of modern humans, and certainly agree that this is a question worth asking, I think this paper would benefit from a more rigorous approach to tackling it.

      At this point, my suggestions are mostly focused on tightening and strengthening the methods; it is hard for me to predict the consequence of these changes on the results or their interpretation, but as a general rule I also encourage the authors to not over-interpret their conclusions in terms of what phenotype was selected for when as they do at certain points (eg glucose metabolism).

      Responses:

      (1) Now, we use more cautious wording to describe the results.

      (2) A paragraph (the second one) is added to Discussion to explain parameters and cutoffs.

      (3) We make the caution at the end of the third paragraph that “We note that these are findings instead of conclusions, and they indicate, suggest, or support something revealing the primary question of what genomic differences critically determine the phenotypic differences between humans and apes and between modern and archaic humans”.

      I note some specific points that I think would benefit from more rigorous approaches, and suggest possible ways forward for these.

      1. Much of this work is focused on comparing DNA binding domains in human-unique long-noncoding RNAs and DNA binding sites across the promoters of genes in the human genome, and I think the authors can afford to be a bit more methodical/selective in their processing and filtering steps here. The article begins by searching for orthologues of human lncRNAs to arrive at a set of 66 human-specific lncRNAs, which are then characterised further through the rest of the manuscript. Line 99 describes a binding affinity metric used to separate strong DBS from weak DBS; the methods (line 432) describe this as being the product of the DBS or lncRNA length times the average Identity of the underlying TTSs. This multiplication, in fact, undoes the standardising value of averaging and introduces a clear relationship between the length of a region being tested and its overall score, which in turn is likely to bias all downstream inference, since a long lncRNA with poor average affinity can end up with a higher score than a short one with higher average affinity, and it's not quite clear to me what the biological interpretation of that should be. Why was this metric defined in this way?

      Responses:

      (1) Binding affinity and length of all DBSs of HS lncRNAs are given in Supplementary Table 2 and 3. Since a triplex (say, 100 bp in length) may have 50% or 70% of nucleotides bound, it is necessary to differentiate binding affinity and length, and the two measures can differentiate DBSs of the same length but with different binding affinity and DBSs with the same binding affinity but different length.

      (2) Differentiating DBSs into strong and weak ones is somewhat subjective, accurately differentiating them demands experimental data that are currently unavailable, and it is advisable to separately analyze strong and weak DBSs because they may likely influence different aspects of human evolution.

      1. There is also a strong assumption that identified sites will always be bound (line 100), which I disagree is well-supported by additional evidence (lines 109-125). The authors show that predicted NEAT1 and MALAT1 DBS overlap experimentally validated sites for NEAT1, MALAT1, and MEG3, but this is not done systematically, or genome-wide, so it's hard to know if the examples shown are representative, or a best-case scenario.

      Responses:

      (1) We do not assume/think that identified sites will always be bound. Instead, lncRNA/DBS binding is highly context-dependent (including tissue-specific).

      (2) An extra supplementary table (Supplementary Table 15) is added to show what predicted DBSs overlap experimentally detected DBSs for NEAT1, MALAT1, and MEG3. By the way, it is more accurate to say “experimentally detected” than “experimentally validated”, because experimental data have true/false positives and true/false negatives, and different sequencing protocols (for detecting lncRNA/DNA binding) may generate somewhat different results.

      It's also not quite clear how overlapping promoters or TSS are treated - are these collapsed into a single instance when calculating genome-wide significance? If, eg, a gene has five isoforms, and these differ in the 3' UTR but their promoter region contains a DBS, is this counted five times, or one? Since the interaction between the lncRNA and the DBS happens at the DNA level, it seems like not correcting for this uneven distribution of transcripts is likely to skew results, especially when testing against genome-wide distributions, eg in the results presented in sections 5 and 6. I do not think that comparing genes and transcripts putatively bound by the 40 HS lncRNAs to a random draw of 10,000 lncRNA/gene pairs drawn from the remaining ~13500 lncRNAs that are not HS is a fair comparison. Rather, it would be better to do many draws of 40 non-HS lncRNAs and determine an empirical null distribution that way, if possible actively controlling for the overall number of transcripts (also see the following point).

      Responses:

      (1) We analyzed each and every GENCODE-annotated transcript (Supplementary Table 2). For example, if a gene has N TSS and N transcripts, DBSs are predicted in N promoter regions. When analyzing gene expression in tissues, each and every transcript is analyzed.

      (2) Ideally, it would be better to do many draws, but statistically, a huge number is needed due to the number of total genes in the human genome.

      (3) We feel that doing many draws of 40 non-HS lncRNAs and determining an empirical null distribution is not as straightforward as comparing HS lncRNA-target transcript pairs (45% show significant expression correlation) with random lncRNA-random transcript pairs (2.3% show significant expression correlation).

      1. Thresholds for statistical testing are not consistent, or always well justified. For instance, in line 142 GO testing is performed on the top 2000 genes (according to different rankings), but there's no description of the background regions used as controls anywhere, or of why 2000 genes were chosen as a good number to test? Why not 1000, or 500? Are the results overall robust to these (and other) thresholds? Then line 190 the threshold for downstream testing is now the top 20% of genes, etc. I am not opposed to different thresholds in principle, but they should be justified.

      Responses:

      (1) The over-representation analysis using g:Profiler was applied to the top and bottom 2000 genes with the whole genome as the background. The number “2000” was chosen somewhat subjectively. If more or fewer genes were chosen, more or fewer enriched GO terms would be identified, but GO terms with adjusted P-values <0.05 would be quite stable.

      (2) A paragraph (the second one) is added to the Discussion to explain parameters and cutoffs.

      Likewise, comparing Tajima's D values near promoters to genome-wide values is unfair, because promoters are known to be under strong evolutionary constraints relative to background regions; as such it is not surprising that the results of this comparison are significant. A fairer comparison would attempt to better match controls (eg to promoters without HS lncRNA DBS, which I realise may be nearly impossible), or generate empirical p-values via permutation or simulation.

      Responses:

      We examined Tajima’s D in DBSs (Supplementary Figure 9) and in HS lncRNA genes (Supplementary Figure 18). We compared the Tajima’s D values with the genome-wide background in both cases.

      1. There are huge differences in the comparisons between the Vindija and Altai Neanderthal genomes that to me suggest some sort of technical bias or the such is at play here. e.g. line 190 reports 1256 genes to have a high distance between the Altai Neanderthal and modern humans, but only 134 Vindija genes reach the same cutoff of 0.034. The temporal separation between the two specimens does not seem sufficient to explain this difference, nor the difference between the Altai Denisovan and Neanderthal results (2514 genes for Denisovan), which makes me wonder if it is a technical artefact relating to the quality of the genome builds? It would be worth checking.

      Responses:

      (1) The cutoff of 0.034 was chosen upon that DBSs in the top 20% (4248) genes in chimpanzees have distances larger than this cutoff, and accordingly, 4248, 1256, 2514, and 134 genes have DBSs distances >0.034 in chimpanzees, Altai Neanderthals, Denisovans, and Vindija Neanderthals. These numbers of genes qualitatively agree with the phylogenetic distances from chimpanzees, archaic humans to modern humans. If a percentage larger or smaller than 20% (e.g., 10% or 30%) is chosen, and so is a cutoff X, the numbers of genes with DBSs distance >X would not be 4248, 1256, 2514, and 134, but could still qualitatively agree with the phylogenetic distances from chimpanzees, archaic humans to modern humans.

      (2) The second paragraph in the Discussion now explains the parameters and cutoffs.

      1. Inferring evolution: There are some points of the manuscript where the authors are quick to infer positive selection. I would caution that GTEx contains a lot of different brain tissues, thus finding a brain eQTL is a lot easier than finding a liver eQTL, just because there are more opportunities for it. Likewise, claims in the text and in Tables 1 and 2 about the evolutionary pressures underlying specific genes should be more carefully stated. The same is true when the authors observe high Fst between groups (line 515), which is only one possible cause of high Fst - population differentiation and drift are just as capable of giving rise to it, especially at small sample sizes.

      Responses:

      (1) We analyzed brain tissues separately instead of taking the whole brain as a tissue, see Supplementary Table 12 and Figure 3.

      (2) We make the caution at the end of the third paragraph that “We note that these are findings instead of conclusions, and they indicate, suggest, or support something revealing the primary question of what genomic differences critically determine the phenotypic differences between humans and apes and between modern and archaic humans”.

      Reviewer #1 (Recommendations For The Authors):

      Some figures are impossible to see/read so I wasn't able to evaluate them - Fig, 1B, 1E, 1F are small and blurry.

      Responses:

      High-quality figures are provided.

      Typo in line 178: in these archaic humans, the distances of HS lncRNAs are smaller than the distances of DBSs.

      Responses:

      This is not a typo. We use “distance per base” to measure whether HS lncRNAs or their DBSs have evolved more from archaic humans to modern humans. See also Supplementary Note 4 and 5.

      Reviewer #2 (Recommendations For The Authors):

      1. There's some inconsistency in the genome builds and the database versions used, eg, sometimes panTro4 is used and sometimes panTro5 (line 456). Likewise, the version of GENCODE used is very old (18), the current version is 43. The current version contains 19928 lncRNAs, which is a big difference relative to what is being tested!

      Responses:

      (1) panTro4 was used to search orthologues of human lncRNAs; this time-consuming work started several years ago when the version of GENCODE was V18 (see Lin et al., 2019).

      (2) Regarding “the version of GENCODE used is very old (V18)”, we have later examined the 4396 human lncRNAs reported in GENCODE V36 and found that the set of 66 HS lncRNAs remains the same.

      (3) The counterparts of HS lncRNAs’ DBSs in chimpanzees were predicted recently using panTro5.

      1. Table 1: What does 'mostly' mean in this context? I understand that it refers to sequence differences between humans and the other genomes, but what is the actual threshold, and how is it defined?

      Responses:

      The title of Table 1 is “Genes with strongest DBSs and mostly changed sequence distances from modern humans to archaic humans and chimpanzees”. Instead of using two cutoffs, choosing genes with the two features seems easy and sensible.

      1. Line 117: The methods do not include information on the RNA-seq data processing and subsequent DE testing.

      Responses:

      The details are added to the section “Experimentally validating DBS predictiom” (The reads were aligned to the human GRCh38 genome using Hiasat2 (Kim et al., 2019), and the resulting sam files were converted to bam files using Samtools (Li et al., 2009). Stringtie was used to quantify gene expression level (Pertea et al., 2015). Fold change of gene expression was computed using the edgeR package (Robinson et al., 2010), and significant up- and down-regulation of target genes after DBD knockout was determined upon |log2(fold change)| > 1 with FDR < 0.1).

      1. Line 180: I looked at the EPO alignment and it's not clear to me what 'human ancestor' means, but it may well explain the issues the authors have with calculating distances (I agree those numbers are weird). Is it the reconstructed ancestral state of humans at around 300-200,000 years ago (coalescence of most human uniparental lineages), or the inferred sequence of the human-chimpanzee most recent common ancestor? If it's the former, it's not surprising it skews results towards shorter distances for modern humans, since the tree distance from that point to archaic hominins is significantly larger than to modern humans.

      Responses:

      The “human ancestor” is constructed by the EBI team upon the genomes of six primates in the Ensembl website. We find that the reconstructed ancestral state of humans may be unlikely around 300,000-200,000 years, and may be much earlier. We also find that many DNA sequences of the “human ancestor” are low-confidence calls (i.e., the ancestral states are supported by only one primate’s sequence).

      1. Line 221: SNP-rich DBS: Is this claim controlled for the length of the DBS?

      Responses:

      No. Long DBSs tend to have more SNPs. When comparing the same DBS in modern humans, archaic humans, and chimpanzees, both the length and SNP number reflect evolution, so it is not necessary to control for the length.

      1. Given that GTEx is primarily built off short-read data and it is impossible to link binding of a lncRNA to a DBS with its impact with a specific transcript

      Responses:

      As written in the section “Examining the tissue-specific impact of HS lncRNA-regulated gene expression”, we calculated the pairwise Spearman's correlation coefficient between the expression of an HS lncRNA (the representative transcript, median TPM value > 0.1) and the expression of each of its target transcripts (median TPM value > 0.1) using the scipy.stats.spearmanr program in the scipy package. The expression of an HS lncRNA gene and a target transcript was considered to be significantly correlated if the |Spearman's rho| > 0.3, with Benjamini-Hochberg FDR < 0.05.

      1. Line 429: should TTO be TFO?

      Responses:

      Here TTO should be TFO; the typo is corrected.

      1. Methods, section 7: Some of the text in this section should perhaps be moved to the results section?

      Responses:

      Each of the two paragraphs in Methods’ section 7 is quite large, and some contents in Supplementary Notes are also very relevant. Thus, moving them to the Results section could make the Results too lengthy and specific.

      1. Line 587: GTEx is built from samples of primarily European ancestry and has poor representation of African ancestry and negligible representation of Asian ancestry (see the GTEx v8 paper supplement). This means that it is basically impossible to find a non-European population-specific eQTL in GTEx, which in turn impacts these results.

      Responses:

      (1) Indeed, this is a serious issue of data analysis, and this issue cannot be solved until more Africans are sequenced.

      (2) Anyway, one can still find considerable African-specific eQTLs in GTEx, such as rs28540058 (with frequency of 0, 0, 0.13 in CEU, CHB, YRI) and rs58772997 (with frequency of 0, 0, 0.12 in CEU, CHB, YRI (see Supplementary Table12 and Supplementary Figure 22).

    1. Author Response

      The following is the authors’ response to the previous reviews.

      eLife assessment

      The finding that Fusicoccin (FC-A) promotes locomotor recovery after spinal cord injury is useful, and the idea of harnessing small molecules that may affect protein-protein interactions to promote axon regeneration is interesting and worthy of study. However, the main methods, data, and analyses are inadequate to support the primary claim of the manuscript that a 14-3-3-Spastin complex is necessary for the observed FC-A effects.

      Response: We appreciate the eLife editorial and review team for consideration and evaluation of our manuscript. In light of the feedback from the editors and reviewers, we recognize that certain aspects of the title and key conclusions require further refinement. We have shown that 14-3-3, through its interaction with phosphorylated spastin, inhibits the degradation of spastin. Also, we have demonstrated that 14-3-3 can enhance spastin's microtubule-severing ability in cell lines. Furthermore, our work has illustrated the significant roles of 14-3-3 and spastin in the repair process of spinal cord injury. However, there is currently insufficient direct evidence to confirm the cooperation between 14-3-3 and spastin during axon regeneration and the recovery of spinal cord injury. Moreover, we have not provided conclusive evidence of their simultaneous action in injured axons, mediating changes in microtubule dynamics. Consequently, we have re-evaluated the manuscript's title and primary conclusions, and have made relevant modifications. For more detailed information, please refer to the reviewer's comments.

      Public Reviews:

      Reviewer #1 (Public Review):

      The present work establishes 14-3-3 proteins as binding partners of spastin and suggests that this binding is positively regulated by phosphorylation of spastin. The authors show evidence that 14-3-3 - spastin binding prevents spastin ubiquitination and final proteasomal degradation, thus increasing the availability of spastin. The authors measured microtubule severing activity in cell lines and axon regeneration and outgrowth as a prompt to spastin activity. By using drugs and peptides that separately inhibit 14-3-3 binding or spastin activity, they show that both proteins are necessary for axon regeneration in cell culture and in vivo models in rats.

      The following is an account of the major strengths and weaknesses of the methods and results.

      Major strengths

      -The authors performed pulldown assays on spinal cord lysates using GST-spastin, then analyzed pulldowns via mass spectrometry and found 3 peptides common to various forms of 14-3-3 proteins. In co-expression experiments in cell lines, recombinant spastin co-precipitated with all 6 forms of 14-3-3 tested. The authors could also co-immunoprecipitate spastin-14-3-3 complexes from spinal cord samples and from primary neuronal cultures.

      -By protein truncation experiments they found that the Microtubule Binding Domain of spastin contained the binding capability to 14-3-3. This domain contained a putative phosphorylation site, and substitutions that cannot be phosphorylated cannot bind to 14-3-3.

      -Overexpression of GFP-spastin shows a turn-over of about 12 hours when protein synthesis is inhibited by cycloheximide. When 14-3-3 is co-overexpressed, GFP-spastin does not show a decrease by 12 hours. When S233A is expressed, a turn-over of 9 hours is observed, suggesting that phosphorylation increases the stability of the protein. In support of that notion, the phospho-mimetic S233D makes it more stable, lasting as much as the over-expression of 14-3-3.

      -By combining FCA with Spastazoline, authors claim that FCA increased regeneration is due to increased spastin activity in various models of neurite outgrowth and regeneration in cell culture and in vivo, the authors show impressive results on the positive effect of FCA in regeneration, and that this is abolished when spastin is inhibited.

      Major weaknesses

      1. The present manuscript suggests that 14-3-3 and spastin work in the same pathway to promote regeneration. Although the manuscript contains valuable evidence in support for a role of 14-3-3 and spasting in regeneration, the conclusive evidence is difficult to generate, and is missing in the present manuscript. For example, there are simpler explanations for the combined effect of FC-A and spastazoline. The FC-A mechanism of action can be very broad, since it will increase the binding of all 14-3-3 proteins with presumably all their substrates, hence the pathways affected can rise to the hundreds. The fact that spastazoline abolishes FC-A effect, may not be because of their direct interaction, but because spastin is a necessary component of the execution of the regeneration machinery further downstream, in line with the fact that spastazoline alone prevented outgrowth and regeneration, and in agreement with previous work showing that normal spastin activity is necessary for regeneration.

      With this in mind, I consider the title and most major conclusions of the manuscript related to these two proteins acting together for the observed effects are overstated.

      Response: We appreciate and acknowledge the reviewers' considerations. Our results demonstrated that the spastin inhibitor, spastazolin, almost completely inhibited axon regeneration and the spinal cord injury repair process. This, in turn, leads to the disappearance of any promoting effect on spinal cord injury repair when spastin function is compromised. While we have provided evidence that the expression levels of spastin are moderately increased at the injury site in mice after treatment with FC-A following spinal cord injury, the conclusion that FC-A promotes spinal cord injury repair through the direct interaction between 14-3-3 and spastin still lacks direct evidence. Therefore, we have made appropriate modifications to the manuscript's title and main conclusions.

      1. Authors show that S233D increases MT severing activity, and explain that it is related to increased binding to 14-3-3. An alternative explanation is that phosphorylation at S233 by itself could increase MT severing activity. The authors could test if purified spastin S233D alone could have more potent enzymatic activity.

      Response: We appreciate the considerations of the reviewer. We believe that supplementing in vitro experiments to assess whether S233D affects spastin's microtubule severing function can more intuitively demonstrate whether phosphorylation of spastin at S233 affects its microtubule severing function; however, spastin forms hexamers through its AAA domain to exert ATPase activity and cut microtubules. Current research has reported that mutation sites leading to changes in microtubule severing function are mainly located within spastin's AAA domain (affecting spastin's ATPase activity, amino acids 342-599), such as E356A, G370R, N386K, K388R, E442Q, K427R and R562Q. Furthermore, studies have shown that mutating 11 phosphorylation sites in spastin's MIT and MTBD regions to alanine does not affect spastin's microtubule severing function, including human S268 (Rat Ser233) (Phosphorylation mutation impairs the promoting effect of spastin on neurite outgrowth without affecting its microtubule severing ability. Eur J Histochem. doi: 10.4081/ejh.2023.3594). Additionally, we also provided supplementary experiments in cell lines which showed that both spastin S233A and S233D could effectively sever microtubules (Fig.S2).

      1. The interpretation of the authors cannot explain how Spastin can engage in MT severing while bound to 14-3-3 using its Microtubule Binding Domain.

      Response: We appreciate the considerations of the expert reviewer. The IP experiments with truncated fragments suggest that the binding region of 14-3-3 with spastin is located within the region (215-336 amino acids) in spastin. Furthermore, experiments involving site-directed mutagenesis confirm that the actual binding site of 14-3-3 with spastin is the S233 site, rather than its MTBD region (270-328). Therefore, we have made corrections in the manuscript. We also indicate that 14-3-3 enhances spastin's protein levels by binding to the S233 site, which may be due to 14-3-3 masking the ubiquitination sites near spastin S233 (K206 or K254). Our further experiments also demonstrate that 14-3-3 inhibits the ubiquitination degradation pathway of phosphorylated spastin.

      1. Also, the term "microtubule dynamics", which is present in the title and in other major conclusions, is overstated. Although authors show, in cell lines, changes in microtubule content, it is far from evidence for changes in "MT dynamics" in the settings of interest (i.e. injured axons).

      Response: We appreciate and acknowledge the rigorous feedback. While our manuscript demonstrated the regulatory role of 14-3-3 and spastin in microtubule dynamics in cell lines, we lack direct evidence of these changes in microtubule dynamics within injured axons. Therefore, we have made appropriate modifications to the title, main conclusions, and related statements in our manuscript.

      1. In the same lines, the manuscript lacks evidence for the changes of MT content and/dynamics as a function of the proposed 14-3-3 - Spastin pathway.

      Response: We appreciate and concur with the opinions of the expert reviewer. The observed changes in microtubule dynamics in spinal cord injury were related to the overall alterations in microtubule dynamics within the spinal cord injury site. We still lack direct evidence that 14-3-3, in conjunction with spastin, alters the microtubule dynamics within axons during the process of regeneration. Therefore, we have made modifications to the manuscript.

      Reviewer #2 (Public Review):

      Summary:

      The idea of harnessing small molecules that may affect protein-protein interactions to promote axon regeneration is interesting and worthy of study. In this manuscript Liu et al. explore a 14-3-3-Spastin complex and its role in axon regeneration.

      Strengths:

      Some of the effects of FC-A on locomotor recovery after spinal cord contusion look interesting

      Weaknesses:

      The manuscript falls short of establishing that a 14-3-3-Spastin complex is important for any FC-A-dependent effects and there are several issues with data quality that make it difficult to interpret the results. Importantly, the effects of the spastin inhibitor has a major impact on neurite outgrowth suggesting that cells simply cannot grow in the presence of the inhibitor and raising serious questions about any selectivity for FC-A - dependent growth. Aspects of the histology following spinal cord injury were not convincing.

      Response: We appreciate the rigorous review by the expert reviewers. In response to the feedback from reviewer 1, we lack direct evidence to demonstrate that the reparative effect of FC-A on spinal cord injury is mediated by the combined action of 14-3-3 and spastin. We have accordingly made the necessary changes to our manuscript. Additionally, due to upload limitations, the resolution of our tissue slices related to spinal cord injury in the manuscript is relatively low. To address this, we have supplemented relevant images which was enlarged in the supplementary materials (Fig. S7-9), Also, the original confocal files and images were uploaded.

      Furthermore, our manuscript does not suggest that the reparative effect of FC-A in spinal cord injury selectively impacts the interaction between 14-3-3 and spastin. Therefore, we have modified our claims (title and conclusions) to ensure a more precise statement. Despite the fact that our axonal markers do not fully align, our evidence still strongly supports the role of FC-A in promoting nerve regeneration after spinal cord injury. Additionally, we will further optimize our immunohistochemistry methods.

      Reviewer #3 (Public Review):

      Summary:

      The current manuscript shows that 14-3-3 are binding partners of spastin, preventing its degradation. It is additionally shown, using complementary methods, that both 14-3-3 and spastin are necessary for axon regeneration in vitro and in vivo. While interesting in vitro and vivo data is provided, some of the claims of the authors are not convincingly supported.

      Major strengths:

      Very interesting effect of FC-A in functional recovery after spinal cord injury.

      Major Weaknesses:

      Some of the in vitro data, including colocalizations, and analysis of microtubule severing fall short to support the claims of the authors.

      The in vivo selectivity of FC-A towards spastin is not adequately supported by the data presented. There are aspects of the spinal cord injury site histology that are unclear.

      Response: Reviewer 3's comments align with those of Reviewers 1 and 2.

      Reviewer #1 (Recommendations For The Authors):

      -The new blots presented in Fig. 3N lacks corresponding labels as for antibodies used for IP and IB and molecular weight markers.

      Response: We appreciate the reviewer's feedback. We have made the corresponding modifications in the figure.

      Reviewer #2 (Recommendations For The Authors):

      The authors have addressed many of the specific concerns shared with the authors in the first round of review but several issues remain with the manuscript.

      1. Fig. 1D - the interpretation that spastin co-localizes with 14-3-3 proteins in hippocampal neurons is still tenuous since 14-3-3 uniformly labels the cell.

      Response: We appreciate the reviewer's consideration. Upon re-examining the source files, we found that the predominant reason for 14-3-3 showing a ubiquitous cellular distribution was excessive brightness and insufficient contrast. After appropriate adjustments, we discovered that 14-3-3 exhibits characteristic distribution in axons, including aggregation at growth cone and specific locations in the axon shaft. We have made the relevant changes in the revised version.

      1. Line 336. The meaning of the following statement is unclear "To further identify which isoform of 14-3-3 interacts with spastin, we generated six 14-3-3 isoforms in rats (β、γ、ε、ζ、η、θ ), then purified GST fusion 14-3-3 proteins (Figure 1G).

      Response: Sorry for any confusing statement. We obtained gene fragments of six 14-3-3 isoforms from rat brain cDNA and inserted these fragments into the pEGX-5X-3 vector. Subsequently, GST 14-3-3 fusion proteins were expressed and purified in vitro. We have made the corresponding revisions in the revised version.

      1. Line 341. The authors still fall short of showing that spastin and 14-3-3 interact directly thus it may be more accurate to say that they form a complex.

      Response: Thank you for the reviewer's advice. We have made the corresponding corrections in the manuscript.

      1. Line 388. Please clarify 2th and the meaning of "moderately" - "S233D) was moderately expressed in primary hippocampal neurons at 2th DIV." While it is specified that the transfection dosage and duration were meticulously controlled - it is unclear what the criteria was for establishing the appropriate moderate dosage.

      Response: Sorry about the mistake, it should be "2nd" instead of "2th". In order to establish a model for overexpressing spastin to promote neuronal neurite growth, we transfected 0.2 µg of plasmid into 1 well (1×10⁴ cells/cm2, 24-well plate), with a transfection duration controlled at 24 hours.

      1. Line 395 - It is unclear if S233D is toxic as there seem to be no measurements of cell survival.

      Response: We have supplemented relevant experiments (See comment 6) based on comment 6 and found that Spastin S233D can promote neuronal neurite growth. The corresponding descriptions have been revised.

      1. The pro-growth effects of S233A still does not seem to fit the narrative and the results would have been more convincing if dosage was better controlled to establish any differences between WT and S233A Spastin.

      Response: We appreciate the constructive comments from the reviewer. In order to better illustrate the role of spastin S233 in neuronal growth, we have made appropriate adjustments to our experimental conditions based on previous experiments. Cells were transfected with plasmids expressing non-fused GFP and spastin and the relevant S233 mutants at a transfection dose of 0.2 µg into 1 well (1×10⁴ cells/cm2, 24-well plate), duration was controlled at 12 hours. Due to the low expression state of the overexpressed protein, GFP (ab290 antibody for IF) was then stained to trace neuronal morphology. The experimental results demonstrate that spastin promotes neuronal neurite growth, and the dephosphorylation mutant of spastin (spastin S233A) significantly attenuates its neurite-promoting effect compared to wild-type spastin. Conversely, the phosphorylation mutant spastin S233D further enhances the promotion of neuronal neurite growth. We have also made corrections to the relevant statements in the manuscript.

      1. The reason for examining protection in response to glutamate is not well rationalized based on known spastin functions. The interpretation of this experiment is unclear with respect to effects on protection vs repair.

      Response: Thank you for the reviewer's consideration. We suppose that spastin may be involved in both protective and repair processes. Existing studies suggest that spastin can control store-operated calcium entry (SOCE) by altering endoplasmic reticulum morphology (doi: 10.1093/brain/awac122, doi: 10.3389/fphys.2019.01544), which may indicate its role in regulating calcium overload. Additionally, due to the critical role of spastin in axon growth, it is also essential for neuronal repair after injury. Therefore, we have not strictly distinguished between these two concepts here.

      1. It is unclear if Spastazoline simply blocks any type of growth and it is thus difficult to conclude that FC-A functions through a 14-3-3-spastin effect based on the current data.

      Response: We have re-evaluated and modified the title and main conclusions of the manuscript based on the reviewer's comments and the existing evidence, as responded to in reviewer 1's comments.

      1. The access of FC-A to the CNS with the current protocol has not been clearly established and the effects of FC_A on spastin expression seem to mirror the profile of the control condition.

      Response: We agree with the reviewer's comments. The expression trend of spastin after FC-A treatment is consistent with that of the control group, with a slight increase in its expression level compared to the control group.

      1. The NF and 5-HT staining is not convincing labelling fibres.

      Response: We appreciate the reviewer's comments. We believe that the reason for the incomplete axon staining is closely related to the thickness of the tissue sections. In our future research, we will further optimize our axon labeling methods.

      Reviewer #3 (Recommendations For The Authors):

      Figure 1D: Both spastin and 14-3-3 label the entire neuron which is rather unusual. Conditions of immunfluorescence should be improved. As it is, this image should not be used to claim colocalization.

      Response: We appreciate the reviewer's consideration. In response to comment 1 from the expert reviewer 2, we have re-examined the source files and identified that the primary reason for the overall cell-wide distribution of 14-3-3 and spastin is due to excessive brightness and a lack of sufficient contrast. After making appropriate adjustments, we found that 14-3-3 and spastin exhibit characteristic localization within the axon (concentrated in a particular region of the axon shaft and the growth cone). We have made corresponding revisions in the revised version of the manuscript.

      Figure S2: The experimental setup and data provided is not adequate to infer microtubule severing.

      Response: We appreciate the reviewer's guidance. We have improved the relevant experiments and used a 100X objective lens to observe the microtubule structures more clearly.

      Figure 2 I-K: The functional effect of spastin S233A and S233D on neurite outgrowth does not correlate with a function of 14-3-3 and thus does not support the central hypothesis of the manuscript. Minor: The images selected as representative show differences in neurite length and branching that are not portrayed in the graphs.

      Response: Thank you for the reviewer’s comment. Similar to the response to the reviewer 2's comment 6, in order to better illustrate the role of spastin S233 in neurite outgrowth, we made corresponding adjustments to our experimental conditions. Cells were transfected with plasmids expressing non-fused GFP and spastin and the relevant S233 mutants at a transfection dose of 0.2 µg into 1 well (1×10⁴ cells/cm2, 24-well plate), duration was controlled at 12 hours. Due to the low expression state of the overexpressed protein, GFP (ab290 antibody for IF) was then stained to trace neuronal morphology. The experimental results demonstrate that spastin promotes neuronal neurite growth, and the dephosphorylation mutant of spastin (spastin S233A) significantly attenuates its neurite-promoting effect compared to wild-type spastin. Conversely, the phosphorylation mutant spastin S233D further enhances the promotion of neuronal neurite growth. We have also made corrections to the relevant statements in the manuscript.

      Figure 5 J and L: The quality, resolution and size of the images is insufficient to support the claims of the authors. As it is, one cannot interpret the data. It is very hard to envisage, even considering the explanation provided by the authors, that spinal cords where spastazoline was used correspond to contusion as a complete discontinuity between the rostral and caudal spinal cord tissue is present.

      Response: Due to limitations in file uploads, we encountered issues with the resolution of the tissue slices related to spinal cord injury. To address this, we have adjusted the size and resolution of the corresponding images in the supplementary materials (Fig.S7-S9 ) and included the original confocal files and images.

      Additionally, it's important to note that the tissue slices we presented do not represent all layers of the spinal cord, and not all layers exhibit discontinuity. Our slices are taken longitudinally at the dorsal site of the lesion area. The dorsal slices represent areas closer to the injury site, while deeper slices correspond to areas distant from the injury site. Therefore, we selected areas closer to the injury site to reflect the repair process following injury.

      Figure 7B: Similar comment to spianl cord images provided in Figure 5. NF and MBP are not supposed to colocalize as they label different cell types...

      Response: We appreciate the comments from the expert reviewer, and we agree with their suggestions. We will further optimize our axon labeling methods. The excessive brightness and lack of contrast primarily led to the non-specific labeling of other cell types with the MBP antibody. In fact, our primary goal was to highlight the injured areas by enhancing the fluorescence intensity of the images, which inadvertently resulted in neglecting the exclusion of non-specific staining. Therefore, we have made appropriate adjustments to the images to better visualize the distribution of myelin sheaths.

    1. Author Response

      The following is the authors’ response to the original reviews.

      Reviewer #1 (Public Review):

      The importance of the role of sexual behavior, specifically ejaculation rates, is worth emphasizing for the formation of pair bonds in prairie voles. It suggests that the role of sexual behavior in contributing to the strength of pair bonds should be explored more. It is also important to add that males and females in the study were screened for sexual receptivity. It would therefore be important to identify characteristics of animals that did not mate under the laboratory conditions used that may add depth and complexity to what was identified in the current study. The identification of brain regions for pair bond maintenance centered around the amygdala was also intriguing.

      Thank you for pointing some interpretations of our findings that can be emphasized in the Discussion. We added the following sentences to the Discussion:

      “Our findings, along with this previous work, support the hypothesis that sexual behavior plays a key role in driving pair-bond strength. However, the current study focused on animals that were screened for sexual receptivity, which may have limited variation in sexual behavior across pairs. An intriguing direction for future research will be to test how this variation contributes to bond strength.”

      We also emphasized amygdala in relation to pair bond maintenance. We added the following sentence to the Discussion:

      “These brain regions, and especially amygdala, will be important candidates for future research on neural regulation of pair-bond maintenance.”

      The issue of the lack of a strong presence of the reward circuitry (nucleus accumbens) in the final models is also worth more discussion. Perhaps it has been overly emphasized in the past, but there are strong results from other studies pointing to the importance of reward circuitry.

      Thank you for this suggestion. There is a section in the Results that analyses accumbens in more detail than other brain regions. Accumbens did not survive our corrections for multiple statistical tests, however it was significant at early timepoint without these corrections. This Results paragraph states the following:

      “Although the nucleus accumbens did not survive multiple test corrections in our ROI analysis (q=0.17), it was significant in univariate analysis (p=0.03), particularly when focused on the 2.5 and 6h timepoints (two sample t-test: t=2.53, p=0.01, Video 2). Furthermore, voxel-level comparisons revealed significant sites within the ventral striatum and the posterior nucleus accumbens (Figure 2A, Figure Supplement 1b-c, Video 2).”

      We added Supplementary File 4, which contains model comparison results for accumbens and all other ROIs. We also added more detail on nucleus accumbens to the Discussion:

      “Pairing drove increased c-Fos expression in the ventral pallidum, a major node in reward circuity, as well as in the paraventricular nucleus and the medial preoptic area, modulators of reward. This is consistent with a large body of work implicating neuropeptide actions on reward circuits in the formation of bonds (Walum & Young, 2018; Young & Wang, 2004). Conspicuously missing from our list, however, is significant pairing induced c-Fos induction in the nucleus accumbens. One possibility is that an absence of significant accumbens IEG induction reflects the limitations of using c-Fos and other immediate early genes as indicators of neural activity. It is known that some neuronal populations can be active without expressing c-Fos (Sheng & Greenberg, 1990). Indeed, although a variety of studies implicate the accumbens in bond formation (Amadei et al., 2017; Aragona et al., 2006; Scribner et al., 2020), previous work finds only weak c-Fos induction in the prairie vole accumbens during bonding (Curtis & Wang, 2003). Another possibility is that there was heterogeneous activation in the accumbens that was not captured by the precision of our atlas. Consistent with this interpretation, found that the accumbens was significant in univariate tests, as well as in voxel-level analyses. Overall, our results do not conflict with pharmacological, electrophysiological, and calcium-imaging data on the role of the nucleus accumbens in prairie vole bonding (Amadei et al., 2017; Aragona et al., 2006; Scribner et al., 2020). Instead, the absence of significant effects at the level of the entire nucleus accumbens together with the presence of anatomically restricted voxel-level significance suggests substantial anatomical heterogeneity in the contributions of the nucleus accumbens to bond formation.”

      Please discuss the consequences of creating the behavioral data for pair bond formation by subtracting same-sex pairs interactions from the opposite-sex interactions. What sources of information are removed by using this approach?

      One limitation of our study’s approach is that we are unable to fully separate information related to social novelty from mating experience. Thank you for pointing out that we should touch on this sort of caveat in the paper. We added several sentences to the Discussion:

      “It seems likely that sensory and motor areas were important for social processes related to both pair-bonding and reunion with same-sex cagemates, such as investigation and recognition. Our study design, however, highlights differences between treatments, and in order to detect such effects, it might be necessary to compare mating and bonding pairs to animals left in complete isolation.”

      We reiterate the point in a new paragraph we added to the Discussion to explicitly provide caveats regarding our data:

      “Before offering a synthesis of our findings, it would be useful to acknowledge a few caveats. First, as noted above, IEG induction does not capture all relevant neural activity. Second, the design of our experiment, which controlled for social interaction, likely excluded many circuits important to both pair bonding and sibling social interactions. Third, c-Fos activity within a given brain region may nevertheless rely on distinct cell types, and so the absence of sex differences in c-Fos immunoreactivity does not definitively rule out the sexually dimorphic circuits hypothesized in the “dual function hypothesis” (de Vries, 2004). Lastly, the current study focused on animals that were screened for sexual receptivity, which may have limited the variation in sexual behavior across opposite-sex pairs.”

      Time 0 is when the barrier is removed after a two-hour exposure. Please speculate on what is going on during the two-hour exposure. Time zero is potentially more than the time of mating. Is it possible that aggression is being decreased during this timepoint that represents mating? Could it also be a measure of the outcome of an initial compatibility assessment by the male and female?

      Thank you for this interesting observation. While the opaque divider prevented physical social interactions, it is possible that animals picked up on auditory or olfactory cues. We did not detect group differences in movement patterns and vocalization rates from the 0 h timepoint group (Figure 2). These findings suggest that potential partner detection and assessment occurred in a similar way for both experiment groups. It is unlikely that this period represents a decrease in aggression, since unbonded prairie voles are not known to be aggressive towards conspecifics. However, the idea that animals may potentially use olfactory or auditory cues to assess each other is an interesting idea, and one that we cannot rule out. We added a brief statement to the Methods “Experiment Design” section about the possibility that the two hours prior to divider removal (0 h timepoint) could represent more than an acclimation period:

      “It is important to note that the opaque divider in the acclimation period prevented physical interactions, but it is possible that animal pairs may have detected each other through olfactory or auditory cues.”

      We also mention this in the revised Discussion in the context of the PFC cluster, which not only differed between mating and non-mating groups, but also showed differences between isolated (0h) and socially interacting animals (sibs and mates, 2.5h-22h):

      “A fourth cluster (“PFC,” green) is composed of prelimbic, infralimbic and olfactory cortex; activity in the vole prefrontal cortex is known to be modulated by hypothalamic oxytocin, and to shape bonding through projections to the nucleus accumbens (Amadei et al., 2017; Burkett et al., 2016; Horie et al., 2020). The pattern of activity in this cluster, however, indicates that it was due in part to differences between the isolated animals (0h) and other time points (Figure 4—figure supplement 1 and Figure 4—figure supplement 2). Because animals in the isolated condition were in a compartment adjacent to either an opposite sexed individual or a familiar former cagemate, we cannot rule out that olfactory or auditory cues may have made animals aware of the presence of a potential social partner. Indeed, we interpret this dimension as capturing appetitive aspects of behaviors associated with investigation of the animal isolated from the subject by the barrier.”

      Reviewer #2 (Public Review):

      An important caveat to this study not mentioned by the authors is that c-fos provides a snapshot of neural activity and that important populations of neurons could be active and not express c-fos. Thus observed correlations are likely to be robust, but the absence of differences (in say accumbens) may just reflect the limits of c-fos estimation of neural activity. Similarly, highly coordinated neural activity between males and females might still be driven by different mechanisms if different cell types were activated within a specific region.

      We now discuss limitations of c-Fos in the Discussion paragraph that focuses on accumbens:

      “The absence of significant accumbens IEG induction may reflect the limitations of using c-Fos and other immediate early genes as indicators of neural activity. It is known that some neuronal populations can be active without expressing c-Fos (Sheng & Greenberg, 1990). Indeed, although a variety of studies implicate the accumbens in bond formation (Amadei et al., 2017; Aragona et al., 2006; Scribner et al., 2020), previous work finds only weak c-Fos induction in the prairie vole accumbens during bonding (Curtis & Wang, 2003).”

      We also include the following sentence in a new Discussion paragraph that focuses on caveats to our findings:

      “Before offering a synthesis of our findings, it would be useful to acknowledge or reiterate a few caveats. First, as noted above, IEG induction does not capture all relevant neural activity (Sheng & Greenberg 1990). Second, the design of our experiment, which controlled for social interaction, likely excluded many circuits important to both pair bonding and sibling social interactions. Third, c-Fos activity within a given brain region may nevertheless rely on distinct cell types, and so the absence of sex differences in c-Fos immunoreactivity does not definitively rule out the sexually dimorphic circuits hypothesized in the “dual function hypothesis” (de Vries, 2004). Lastly, the current study focused on animals that were screened for sexual receptivity, which may have limited the variation in sexual behavior across opposite-sex pairs.”

      Recommendations for the authors:

      It appears as if df is missing from some statistical reporting.

      Thank you for pointing this out. We went through the manuscript and added in sample sizes to statistical reporting.

      Reviewer #1 (Recommendations for the authors):

      It is surprising that the cortex was not more extensively identified as being involved in pair bonding, but perhaps this is because the emphasis for choosing brain areas in the cortical region is biased towards olfactory regions. Please discuss. It may also be worth noting that brain regions associated with perception may be important in all of these processes, but selected out because of the design.

      Thank you for this observation. We agree that some cortical regions may not have been identified due to the study design. For example, social processes related to both pair bonding and cagemate recognition likely rely on overlapping circuits. It is also important to note here that our analysis approach identified the “most” significant regions. This means that several candidate regions did not survive the statistical threshold used to select regions. We now discuss the cortex in more detail in the Discussion, where we also identify the regions that approached significance but did not survive multiple test corrections:

      “Although the PFC and other olfactory cortical areas formed a cluster, we did not find widespread c-Fos induction throughout the cortex in response to pairing. It seems likely that sensory and motor areas were important for social processes related to both pair-bonding and reunion with same-sex cagemates, such as investigation and recognition. Our study design, however, highlights differences between treatments, and in order to detect such effects, it might be necessary to compare mating and bonding pairs to animals left in complete isolation. Moreover, several cortical regions that did not survive corrections for multiple tests may have been identified in a less stringent analysis. Several subregions within the isocortex, hippocampal formation, and cortical subplate had statistical models that approached significance (i.e., p-values < 0.1) prior to multiple test corrections. These subregions were found within primary somatosensory area, primary auditory area, dorsal and ventral auditory areas, primary visual area, anteromedial visual area, agranular insular area, temporal association areas, ectorhinal area, postsubiculum, and basomedial amygdala. Frontal cortex subregions were within the agranular insular area and orbital area, as well as additional subregions in prelimbic and infralimbic areas of the PFC.”

      Same-sex siblings were isolated for 4-5 days and then repaired. This is a creative way of dealing with this, but was any aggression displayed in the same-sex pairs? Are there bonds or preferences among same-sex individuals? Could the isolation have set the stage for neural changes associated with migrating from the natal group? 4-5 days of isolation is not trivial.

      Thank you for these questions. We did not witness aggression between same-sex pairs. We had recorded ‘aggression’ events (lunges and chases) during the 1 h behavioral observation epochs and found that these rates were nearly zero for all sibling timepoint groups (events/h per focal animal in mean ± sd: 2.5 h group = 0.58 ± 1.53, 6 h group = 0.17 ± 0.48, 22 h group = 0.25 ± 0.44).

      The question about peer relationships is a good one. Previous literature does suggest that prairie voles can develop preferences for familiar same-sex individuals (e.g., Beery et al. 2018 Front. Behav. Neuro., Lee et al. 2019 Front. Behav. Neuro). Thus, we want to reiterate here that our study design tests for differences between these baseline levels of affiliation with pair bonding in a reproductive context.

      It is possible that the period of isolation prior to experiments may have set the stage for neural changes associated with migration from the natal group. Testing this possibility is outside the scope of the current study. We want to point out here that animals were separated from their natal groups several weeks prior to the experiment. Animals were weaned at 21 days and put into same-sex cages, and then experiments occurred between 8-12 weeks of age. All experiment groups went through the same weaning and co-housing conditions.

      Pg 26, Line 655: "better" is listed twice in the sentence and only one is needed

      Thank you for catching this typo. This is fixed.

      Reviewer #2 (Recommendations for the authors):

      Why was it necessary to bring voles into estrus when they are induced ovulators? The authors need to state how voles were brought into estrus.

      Thank you for this suggestion. We explained estrus induction in the Methods, but this explanation could be missed because it was within the “Behavioral procedures” section. We put the paragraph about estrus induction into a new section called “Estrus induction and animal selection”. We also elaborated on the final sentences of this paragraph to provide a clearer rationale:

      “We used this mating assay to restrict study subjects to voles that showed lordosis (females) or mounting behavior (males). By selecting voles who showed sexual behavior, we could control the estrus state and timing of mating across the 0, 2.5, 6 and 22 h study groups. This selection process also ensured that animals assigned to the same-sex sibling pair and opposite-sex mating pair groups had similar sexual motivation and experience.”

      I assume in the final manuscript the authors will release the availability of the atlas? Making the atlas public seems to be in the spirit of the eLife publishing model.

      The prairie vole reference brain, atlas, and atlas annotation labels, are now included on the Figshare repository site. We updated the Data and code availability section to clarify this.

      Reviewer #3 (Recommendations for the authors):

      Please clarify in the Methods if same-sex sibling females were also estrogen primed. If not, could the estrogen exposure cause Fos differences?

      Thank you for this suggestion. All females were estrogen primed. We refined the Methods section “Estrus induction and animal selection” to make this part of the study design clearer. We edited one of the sentences to say “During this isolation period, all females were induced into estrus[...]” We also added a couple sentences at the end of this paragraph:

      “By selecting voles who showed sexual behavior, we could control the estrus state and timing of mating across the 0, 2.5, 6 and 22 h study groups. This selection process also ensured that animals assigned to the same-sex sibling pair and opposite-sex mating pair groups had similar sexual motivation and experience.”

    1. Author Response:

      We thank the reviewers for their careful comments. We sincerely agree with the comments from both reviewers, and noticed the word “cell transplantation”, throughout the manuscript including the title, was confusing. We will revise the manuscript to clarify the aim of the study, and to express the conclusion more straightforwardly.

      Response to reviewers:

      We interpret the data of the present study as the color of each RPE cell is a temporal condition which does not necessarily represent the quality (e.g. for cell transplantation) of the cells. We consider this may be applicable not only in vitro but also in vivo, although we do not know whether RPE shows heterogeneous level of pigmentation in vivo.

      As our concern for iPSC-RPE is always about their quality for cell transplantation, maybe we haven’t fairly evaluated the scientific significance obtained from the present study.

      Another thing we noticed was, although we used the term “cell transplantation” to explain what we meant by “quality” of the cells, we agree this was confusing. The aim of the study was not to show how the pigmentation level of transplant-RPE affects the result of cell transplantation, but to show the heterogeneous gene expression of iPSC-derived RPE cells, and the less correlation of the heterogeneity with the pigmentation level. We went through the manuscript, including the title, to more straightforwardly lead this conclusion: the degree of pigmentation had some but weak correlation with the expression levels of functional genes, and the reason for the weakness of the correlation may be because the color is a temporal condition (as we interpreted from the data) that is different from more stable characteristics of the cells.

      We agree that “cell transplantation” in the title (and other parts) was misleading. So, we will change the title, and removed the phrase that led as if the aim of the study was to show something about cell transplantation or in vivo results.

      Also, to face scientifically significant results obtained from the present study appropriately, we will discuss more about the correlation of the pigmentation level with some functional genes, and brought this as one of the conclusions of the manuscript.

    1. Author Response:

      Reviewer #1 (Public Review):

      [...] Weaknesses:

      1. I feel the authors need to justify why flow-crushing helps localization specificity. There is an entire family of recent papers that aim to achieve higher localization specificity by doing the exact opposite. Namely, MT or ABC fRMRI aims to increase the localization specificity by highlighting the intravascular BOLD by means of suppressing non-flowing tissue. To name a few:

      Priovoulos, N., de Oliveira, I.A.F., Poser, B.A., Norris, D.G., van der Zwaag, W., 2023. Combining arterial blood contrast with BOLD increases fMRI intracortical contrast. Human Brain Mapping hbm.26227. https://doi.org/10.1002/hbm.26227.

      Pfaffenrot, V., Koopmans, P.J., 2022. Magnetization Transfer weighted laminar fMRI with multi-echo FLASH. NeuroImage 119725. https://doi.org/10.1016/j.neuroimage.2022.119725

      Schulz, J., Fazal, Z., Metere, R., Marques, J.P., Norris, D.G., 2020. Arterial blood contrast ( ABC ) enabled by magnetization transfer ( MT ): a novel MRI technique for enhancing the measurement of brain activation changes. bioRxiv. https://doi.org/10.1101/2020.05.20.106666

      Based on this literature, it seems that the proposed method will make the vein problem worse, not better. The authors could make it clearer how they reason that making GE-BOLD signals more extra-vascular weighted should help to reduce large vein effects.

      The empirical evidence for the claim that flow crushing helps with the localization specificity should be made clearer. The response magnitude with and without flow crushing looks pretty much identical to me (see Fig, 6d). It's unclear to me what to look for in Fig. 5. I cannot discern any layer patterns in these maps. It's too noisy. The two maps of TE=43ms look like identical copies from each other. Maybe an editorial error?

      The authors discuss bipolar crushing with respect to SE-BOLD where it has been previously applied. For SE-BOLD at UHF, a substantial portion of the vein signal comes from the intravascular compartment. So I agree that for SE-BOLD, it makes sense to crush the intravascular signal. For GE-BOLD however, this reasoning does not hold. For GE-BOLD (even at 3T), most of the vein signal comes from extravascular dephasing around large unspecific veins, and the bipolar crushing is not expected to help with this.

      The authors would like to clarify that the velocity-nulling gradient is NOT designed to suppress all the contributions from intravascular blood. Instead, we tried to find a balance so that the VN gradient maximally suppressed the macrovascular signal in unspecific veins but minimally attenuated the microvascular signal in specific capillary bed. We acknowledge the reviewer's concern regarding the potential extravascular contributions from large, non-specific vessels. This aspect will be thoroughly evaluated and addressed in the revised manuscript. Additionally, we will make clarifications in other parts that may have cause the reviewer’s misunderstandings.

      1. The bipolar crushing is limited to one single direction of flow. This introduces a lot of artificial variance across the cortical folding pattern. This is not mentioned in the manuscript. There is an entire family of papers that perform layer-fmri with black-blood imaging that solves this with a 3D contrast preparation (VAPER) that is applied across a longer time period, thus killing the blood signal while it flows across all directions of the vascular tree. Here, the signal cruising is happening with a 2D readout as a "snap-shot" crushing. This does not allow the blood to flow in multiple directions. VAPER also accounts for BOLD contaminations of larger draining veins by means of a tag-control sampling. The proposed approach here does not account for this contamination.

      Chai, Y., Li, L., Huber, L., Poser, B.A., Bandettini, P.A., 2020. Integrated VASO and perfusion contrast: A new tool for laminar functional MRI. NeuroImage 207, 116358. https://doi.org/10.1016/j.neuroimage.2019.116358

      Chai, Y., Liu, T.T., Marrett, S., Li, L., Khojandi, A., Handwerker, D.A., Alink, A., Muckli, L., Bandettini, P.A., 2021. Topographical and laminar distribution of audiovisual processing within human planum temporale. Progress in Neurobiology 102121. https://doi.org/10.1016/j.pneurobio.2021.102121

      If I would recommend anyone to perform layer-fMRI with blood crushing, it seems that VAPER is the superior approach. The authors could make it clearer why users might want to use the unidirectional crushing instead.

      We acknowledge that the degree of velocity nulling varies across the cortical folding pattern. We intend to discuss potential solutions to address this variance, and these may be implemented in the revised manuscript as appropriate. Furthermore, we will provide a comprehensive discussion on the advantages and disadvantages of both CBV-based and BOLD-based approaches.

      1. The comparison with VASO is misleading. The authors claim that previous VASO approaches were limited by TRs of 8.2s. The authors might be advised to check the latest literature of the last years. Koiso et al. performed whole brain layer-fMRI VASO at 0.8mm at 3.9 seconds (with reliable activation), 2.7 seconds (with unconvincing activation pattern, though), and 2.3 (without activation). Also, whole brain layer-fMRI BOLD at 0.5mm and 0.7mm has been previously performed by the Juelich group at TRs of 3.5s (their TR definition is 'fishy' though).

      Koiso, K., Müller, A.K., Akamatsu, K., Dresbach, S., Gulban, O.F., Goebel, R., Miyawaki, Y., Poser, B.A., Huber, L., 2023. Acquisition and processing methods of whole-brain layer-fMRI VASO and BOLD: The Kenshu dataset. Aperture Neuro 34. https://doi.org/10.1101/2022.08.19.504502

      Yun, S.D., Pais‐Roldán, P., Palomero‐Gallagher, N., Shah, N.J., 2022. Mapping of whole‐cerebrum resting‐state networks using ultra‐high resolution acquisition protocols. Human Brain Mapping. https://doi.org/10.1002/hbm.25855

      Pais-Roldan, P., Yun, S.D., Palomero-Gallagher, N., Shah, N.J., 2023. Cortical depth-dependent human fMRI of resting-state networks using EPIK. Front. Neurosci. 17, 1151544. https://doi.org/10.3389/fnins.2023.1151544

      The authors are correct that VASO is not advised as a turn-key method for lower brain areas, incl. Hippocampus and subcortex. However, the authors use this word of caution that is intended for inexperienced "users" as a statement that this cannot be performed. This statement is taken out of context. This statement is not from the academic literature. It's advice for the 40+ user base that wants to perform layer-fMRI as a plug-and-play routine tool in neuroscience usage. In fact, sub-millimeter VASO is routinely being performed by MRI-physicists across all brain areas (including deep brain structures, hippocampus etc). E.g. see Koiso et al. and an overview lecture from a layer-fMRI workshop that I had recently attended: https://youtu.be/kzh-nWXd54s?si=hoIJjLLIxFUJ4g20&t=2401

      Thus, the authors could embed this phrasing into the context of their own method that they are proposing in the manuscript. E.g. the authors could state whether they think that their sequence has the potential to be disseminated across sites, considering that it requires slow offline reconstruction in Matlab? Do the authors think that the results shown in Fig. 6c are suggesting turn-key acquisition of a routine mapping tool? In my humble opinion, it looks like random noise, with most of the activation outside the ROI (in white matter).

      Those literatures will be included and discussed in the revised manuscript. Furthermore, we are considering the exclusion of the LGN results presented in Figure 6, as they may divert attention from the primary focus of the study.

      We are enthusiastic about sharing our imaging sequence, provided its usefulness is conclusively established. However, it's important to note that without an online reconstruction capability, such as the ICE, the practical utility of the sequence may be limited. Unfortunately, we currently don’t have the manpower to implement the online reconstruction. Nevertheless, we are more than willing to share the offline reconstruction codes upon request.

      1. The repeatability of the results is questionable. The authors perform experiments about the robustness of the method (line 620). The corresponding results are not suggesting any robustness to me. In fact, the layer profiles in Fig. 4c vs. Fig 4d are completely opposite. The location of peaks turns into locations of dips and vice versa. The methods are not described in enough detail to reproduce these results. The authors mention that their image reconstruction is done "using in-house MATLAB code" (line 634). They do not post a link to github, nor do they say if they share this code.

      It is not trivial to get good phase data for fMRI. The authors do not mention how they perform the respective coil-combination. No data are shared for reproduction of the analysis.

      There may have been a misunderstanding regarding the presentation in Figure 4, which illustrates the impact of TEs and the VN gradient. To enhance clarity and avoid further confusion, we will redesign this figure for improved comprehension.

      The authors are open to sharing the MATLAB codes associated with our study. However, we were limited by manpower for refining and enhancing the readability of these codes for broader use.

      Regarding the coil combination, we utilized an adaptive coil combination approach as described in the paper by Walsh DO, Gmitro AF, and Marcellin MW, titled 'Adaptive reconstruction of phased array MR imagery' (Magnetic Resonance in Medicine 2000; 43:682-690). The MATLAB code for this method was implemented by Dr. Diego Hernando. We will include a link for downloading this code in the revised manuscript for the convenience of interested readers.

      1. The application of NODRIC is not validated. Previous applications of NORDIC at 3T layer-fMRI have resulted in mixed success. When not adjusted for the right SNR regime it can result in artifactual reductions of beta scores, depending on the SNR across layers. The authors could validate their application of NORDIC and confirm that the average layer-profiles are unaffected by the application of NORDIC. Also, the NORDIC version should be explicitly mentioned in the manuscript.

      Akbari, A., Gati, J.S., Zeman, P., Liem, B., Menon, R.S., 2023. Layer Dependence of Monocular and Binocular Responses in Human Ocular Dominance Columns at 7T using VASO and BOLD (preprint). Neuroscience. https://doi.org/10.1101/2023.04.06.535924

      Knudsen, L., Guo, F., Huang, J., Blicher, J.U., Lund, T.E., Zhou, Y., Zhang, P., Yang, Y., 2023. The laminar pattern of proprioceptive activation in human primary motor cortex. bioRxiv. https://doi.org/10.1101/2023.10.29.564658

      During our internal testing, we observed that the NORDIC denoising process did not alter the activation patterns. These findings will be incorporated into the revised manuscript. The details of NORDIC will be provided as well.

      Reviewer #2 (Public Review):

      [...] The well-known double peak feature in M1 during finger tapping was used as a test-bed to evaluate the spatial specificity. They were indeed able to demonstrate two distinct peaks in group-level laminar profiles extracted from M1 during finger tapping, which was largely free from superficial bias. This is rather intriguing as, even at 7T, clear peaks are usually only seen with spatially specific non-BOLD sequences. This is in line with their simple simulations, which nicely illustrated that, in theory, intravascular macrovascular signals should be suppressible with only minimal suppression of microvasculature when small b-values of the VN gradients are employed. However, the authors do not state how ROIs were defined making the validity of this finding unclear; were they defined from independent criteria or were they selected based on the region mostly expressing the double peak, which would clearly be circular? In any case, results are based on a very small sub-region of M1 in a single slice - it would be useful to see the generalizability of superficial-bias-free BOLD responses across a larger portion of M1.

      Given the individual variations in the location of the M1 region, we opted for manual selection of the ROI. In the revised manuscript, we plan to explore and implement an independent criterion for ROI selection to enhance the objectivity and reproducibility of our methodology.

      As repeatedly mentioned by the authors, a laminar fMRI setup must demonstrate adequate functional sensitivity to detect (in this case) BOLD responses. The sensitivity evaluation is unfortunately quite weak. It is mainly based on the argument that significant activation was found in a challenging sub-cortical region (LGN). However, it was a single participant, the activation map was not very convincing, and the demonstration of significant activation after considerable voxel-averaging is inadequate evidence to claim sufficient BOLD sensitivity. How well sensitivity is retained in the presence of VN gradients, high acceleration factors, etc., is therefore unclear. The ability of the setup to obtain meaningful functional connectivity results is reassuring, yet, more elaborate comparison with e.g., the conventional BOLD setup (no VN gradients) is warranted, for example by comparison of tSNR, quantification and comparison of CNR, illustration of unmasked-full-slice activation maps to compare noise-levels, comparison of the across-trial variance in each subject, etc. Furthermore, as NORDIC appears to be a cornerstone to enable submillimeter resolution in this setup at 3T, it is critical to evaluate its impact on the data through comparison with non-denoised data, which is currently lacking.

      We appreciate the reviewer’s comments. Those issues will be addressed carefully.

      Reviewer #3 (Public Review):

      [...] Weaknesses: - Although the VASO acquisition is discussed in the introduction section, the VN-sequence seems closer to diffusion-weighted functional MRI. The authors should make it more clear to the reader what the differences are, and how results are expected to differ. Generally, it is not so clear why the introduction is so focused on the VASO acquisition (which, curiously, lacks a reference to Lu et al 2013). There are many more alternatives to BOLD-weighted imaging for fMRI. CBF-weighted ASL and GRASE have been around for a while, ABC and double-SE have been proposed more recently.

      The principal distinction between DW-fMRI and our methodology lies in the level of the b-value employed. DW-fMRI typically measures cellular swelling by utilizing a b-value greater than 1000 s/mm^2 (e.g. 1800). Conversely, our Velocity Nulling functional MRI (VN-fMRI) approach continues to assess hemodynamic responses, utilizing a smaller b-value specifically for the suppression of signals from draining veins. In addition, other layer-fMRI methods will be discussed.

      • The comparison in Figure 2 for different b-values shows % signal changes. However, as the baseline signal changes dramatically with added diffusion weighting, this is rather uninformative. A plot of t-values against cortical depth would be much more insightful.
      • Surprisingly, the %-signal change for a b-value of 0 is not significantly different from 0 in the gray matter. This raises some doubts about the task or ROI definition. A finger-tapping task should reliably engage the primary motor cortex, even at 3T, and even in a single participant.
      • The BOLD weighted images in Figure 3 show a very clear double-peak pattern. This contradicts the results in Figure 2 and is unexpected given the existing literature on BOLD responses as a function of cortical depth.

      In our study, the TE in Figure 2 is shorter than that in Figure 3 (33 ms versus 43 ms). It has been reported in the literature that BOLD fMRI with a shorter TE tends to include a greater intravascular contribution. Acknowledging this, we plan to repeat the experiments with a controlled TE to ensure consistency in our results.

      • Given that data from Figures 2, 3, and 4 are derived from a single participant each, order and attention affects might have dramatically affected the observed patterns. Especially for Figure 4, neither BOLD nor VN profiles are really different from 0, and without statistical values or inter-subject averaging, these cannot be used to draw conclusions from.

      The order of the experiments were randomized to ensure unbiased results.

      It is important to note that the error bars presented in Figures 2, 3, and 4 do not represent the standard deviation of the residual fitting error. Instead, they illustrate the variation across voxels within a specific layer. This approach may lead to the error bars being influenced by the selection of the Region of Interest (ROI). In light of this, we intend to refine our statistical methodologies in the revised manuscript to address this issue.

      • In Figure 5, a phase regression is added to the data presented in Figure 4. However, for a phase regression to work, there has to be a (macrovascular) response to start with. As none of the responses in Figure 4 are significant for the single participant dataset, phase regression should probably not have been undertaken. In this case, the functional 'responses' appear to increase with phase regression, which is contra-intuitive and deserves an explanation.
      • Consistency of responses is indeed expected to increase by a removal of the more variable vascular component. However, the microvascular component is always expected to be smaller than the combination of microvascular + macrovascular responses. Note that the use of %signal changes may obscure this effect somewhat because of the modified baseline. Another expected feature of BOLD profiles containing both micro- and microvasculature is the draining towards the cortical surface. In the profiles shown in Figure 7, this is completely absent. In the group data, no significant responses to the task are shown anywhere in the cortical ribbon.
      • Although I'd like to applaud the authors for their ambition with the connectivity analysis, I feel that acquisitions that are so SNR starved as to fail to show a significant response to a motor task should not be used for brain wide directed connectivity analysis.

      We agree that exploring brain-wide directed functional connectivity may be overly ambitious at this stage, particularly before the VN-fMRI technique has been comprehensively evaluated and validated. In the revised manuscript, we will focus more on examining the characteristics of the layer-dependent BOLD signal rather than delving into layer-dependent functional connectivity.

    1. Author Response

      The following is the authors’ response to the original reviews.

      Public Reviews:

      Reviewer #1 (Public Review):

      Summary:

      The authors developed computational models that capture the electrical and Ca2+ signaling behavior in mesenteric arterial cells from male and female mice. A baseline model was first formulated with eleven transmembrane currents and three calcium compartments. Sex-specific differences in the L-type calcium channel and two voltage-gated potassium channels were then tuned based on experimental measurements. To incorporate the stochastic ion channel openings seen in smooth muscle cells under physiological conditions, noise was added to the membrane potential and the sarcoplasmic Ca2+ concentration equations. Finally, the models were assembled into 1D vessel representations and used to investigate the tissue-level electrical response to an L-type calcium channel blocker.

      Strengths:

      A major strength of the paper is that the modeling studies were performed on three different scales: individual ionic currents, whole-cell, and 1D tissue. This comprehensive computational framework can help provide mechanistic insight into arterial myocyte function that might be difficult to achieve through traditional experimental methods.

      The authors aimed to develop sex-specific computational models of mesenteric arterial myocytes and demonstrate their use in drug-testing applications. Throughout the paper, model behavior was both validated by experimental recordings and supported by previously published data. The main findings from the models suggested that sex-specific differences in membrane potential and Ca2+ handling are attributable to variability in the gating of a small number of voltage-gated potassium channels and L-type calcium channels. This variability contributes to a higher Ca2+ channel blocker sensitivity in female arterial vessels. Overall, the study successfully met the aims of the paper.

      Thank you for your insightful review and for recognizing the strengths of our study. We appreciate your encouraging comment regarding our multi-scale approach. Indeed, we believe that by systematically connecting these scales—individual ionic currents, whole-cell, and 1D tissue—we can integrate and reconcile experimental and clinical data. We anticipate that this approach will not only provide mechanistic insights into arterial myocyte function that may not be easy to glean from traditional experimental methods but will also facilitate the translation of this information into the development of therapeutic interventions.

      Weaknesses:

      A main weakness of the paper, as addressed by the authors, is the simplicity of the 1D vessel model; it does not take into account various signaling pathways or interactions with other cell types which could impact smooth muscle electrophysiology.

      Thank you for highlighting areas for improvement in our study. The strength of computational modeling lies in its iterative nature, allowing us to introduce and examine variables in a systematic manner. While our current model is simplified and does not contain all details, the modular nature of the build will allow continuous expansion to add the important elements described by the reviewer. We are enthusiastic about progressively enriching the model in subsequent studies, introducing signaling pathways in a step-by-step manner, and ensuring their validation with rigorous experimental data.

      Another potential shortcoming is the use of mouse data for optimizing the model, as there could be discrepancies in signaling behavior that limit the translatability to human myocyte predictions.

      We appreciate this important comment. Our model was parametrized using data from mouse mesenteric artery smooth muscle cells as initial proof of concept. Mouse arteries are a good representation of human arteries, as they have similar intravascular pressure-myogenic tone relationships, resting membrane potentials, and express similar ionic channels (e.g., CaV1.2, BK channels, RyRs, etc) (PMID: 28119464, PMID: 29070899, PMID: 23232643). In response to the reviewer, we have modified the discussion section of the manuscript to specifically note the mouse is not identical to the human but does share some common important features that make mice a good approximate model.

      Reviewer #2 (Public Review):

      In this study, Hernandez-Hernandez et al developed a gender-dependent mathematical model of arterial myocytes based on a previous model and new experimental data. The ionic currents of the model and its sex difference were formulated based on patch-clamp experimental data, and the model properties were compared with single-cell and tissue scale experimental results. This is a study that is of importance for the modeling field as well as for experimental physiology.

      Thank you for the comment. In fact, we developed a model that incorporates sex-dependent differences that allowed for male and female models. It’s an important distinction as sex is a biological variable and gender is a self-ascribed characteristic.

      Reviewer #3 (Public Review):

      Summary:

      This hybrid experimental/computational study by Hernandez-Hernandez sheds new light on sex-specific differences between male and female arterial myocytes from resistance arteries. The authors conduct careful experiments in isolated myocytes from male and female mice to obtain the data needed to parameterize sex-specific models of two important ionic currents (i.e., those mediated by CaV1.2 and KV2.1). Available experimental data suggest that KV1.5 channel currents from male and female myocytes are similar, but simulations conducted in the novel Hernandez-Hernandez sex-specific models provide a more nuanced view. This gives rise to the first of the authors' three key scientific claims: (1) In males, KV1.5 is the dominant current regulating membrane potential; whereas, in females, KV2.1 plays a primary role in voltage regulation. They further show that this (2) the latter distinction drives drive sex-specific differences in intracellular Ca2+ and cellular excitability. Finally, working with one-dimensional models comprising several copies of the male/female myocyte models linked by resistive junctions, they use simulations to (3) predict that the sensitivity of arterial smooth muscle to Ca2+ channel-blocking drugs commonly used to treat hypertension is heightened in female compared to male cells.

      Strengths:

      The Methodology is described in exquisite detail in straightforward language that will be easy to understand for most if not all peer groups working in computational physiology. The authors have deployed standard protocols (e.g., parameter fitting as described by Kernik et al., sensitivity analysis as described by Sobie et al.) and appropriate brief explanations of these techniques are provided. The manoeuvre used to represent stochastic effects on voltage dynamics is particularly clever and something I have not personally encountered before. Collectively, these strengthen the credibility of the model and greatly enrich the manuscript.

      We appreciate your comment highlighting the robustness of our methodology. Your acknowledgment of our approach to represent stochastic effects on voltage dynamics is especially encouraging. Indeed, noise is a fundamental component of physiological systems, including in vascular myocytes

      Broadly speaking, the Results section describes findings that robustly support the three key scientific claims outlined in my summary. While there is certainly room for further discussion of some nuanced points as outlined below, it is evident these experiments were carefully designed and carried out with care and intentionality. In the present version of the manuscript, there are a few figures in which experimental data is shown side-by-side with outputs from the corresponding models. These are an excellent illustration of the power of the authors' novel sex-specific computational simulation platform. I think these figures will benefit from some modest additional quantitative analysis to substantiate the similarities between experimental and computational data, but there is already clear evidence of a good match.

      We sincerely appreciate your constructive feedback on the Results section. We have included additional quantitative analysis to substantiate the similarities between experimental and computational data. We agree with the reviewer that the suggestion on the potential value of a more quantitative assessment. As such we have updated the figure to include an in-depth analysis that provides greater insights and solidifies the power of our simulation predictions when compared to experimental results. A detailed analysis of the male and female data as well as the male and female simulations are summarized in the text as follows:

      Baseline membrane potential is -40 mV in male myocytes compared to -30 mV. The frequency of hyperpolarization transients (THs) is 1 Hz in male and 2.5 Hz in female cells for the specific baseline membrane potential shown in Figure 5 A-B. In the range of membrane potentials from -50 mV to -30 mV the frequency increases from 1-2.8Hz which is identical to the experimental frequency range.

      Areas for Improvement:

      The authors used experimental data from a prior publication to calibrate their model of the BKCa current. As indicated in the manuscript, these data are for channel activity measured in a heterologous expression system (Xenopus oocytes). A similar principle applies to other major ion channels/pumps/etc. Is it possible there might be relevant sex-specific differences in these players as well? In the context of the present work, this feels like an important potential caveat to highlight, in case male/female differences in the activity of BKCa or other currents might influence model-predicted differences (e.g., the relative importance of KV1.5 and KV2.1). This should be discussed, and, if possible, related to the elegant sensitivity analysis presented in Fig. 5C (which shows, for example, that the models are relatively insensitive to variation in GBK).

      We fully agree with the reviewer - an important caveat to highlight is the unknown sex-specific differences in all the other players regulating membrane potential and calcium signaling. While our initial assessments indicated that the contribution of BKCa channels to the total voltage-gated K+ current (IKvTOT) was small within the physiological range of -50 mV to -30 mV, further analysis of spontaneous transient outward currents revealed sex-specific variations. We have investigations underway to explore if BKCa channel expression and organization may be also sex-dependent.

      The authors state that their model can be expanded to 2D/3D applications, "transitioning seamlessly from single-cell to tissue-level simulations". I would like to see more discussion of this. For example, given the modest complexity of the cell-scale model, how considerable would the computational burden be to implement a large network model of a subset of the human female or male arterial system? Are there sex-specific differences in vessel and/or network macro-structure that would need to be considered? How would this influence feasibility? Rather than a 1D cable as implemented here, I imagine a multi-scale implementation would involve the representation of myocytes wrapped around vessels. How would the behavior of such a system differ from the authors' presented work using a 1D representation of 100 myocytes coupled end-to-end? Could these differences partially explain why the traces in Fig. 8D are smoother than those in Fig. 8C? From my standpoint, discussing these points would enrich the paper.

      We appreciate the reviewer’s thoughtful and forward-looking ideas! Indeed, we are very interested to extend the model to incorporate a number of these important items.

      Our choice for the 1D cable model was driven by its anatomical relevance to the structure of third and fourth-order mesenteric arteries. These arteries possess a singular layer of vascular myocytes encircling the lumen in a cylindrical arrangement. When we conceptualize this structure as unrolled or viewed laterally, it aligns with a flat, rectangular form, closely paralleling our 1D cable implementation. One option is to expand this into a 2D representation by connecting multiple 1D cables together. Another option would be to connect the 1D cable end-to-end to create a ring to represent a cross section. While these approaches would appear to be different geometries, in either case, the dynamics will remain consistent because the cells comprising the tissue are the same. There is no propagating impulse (for example – although even then in a 2D homogenous tissue, a planar wave is identical in 1D), and the only effect will be an increase in electrotonic load (sink) from neighboring cells, which can readily be approximated in 1D by increasing coupling or modification of the boundary conditions.

      We totally agree that future investigation should include exploration into the potential sex-specific differences in vessel and/or network macro-structure, as these factors may critically impact predictions and indeed the difference in traces observed between Fig. 8D and Fig. 8C may well involve “insulating” effects of vessel layers and interaction between various cell types and other structural factors. In particular, the contribution of endothelial cells in modulating membrane potential in vascular myocytes might be one such influential factor. In future studies, we are also keen to investigate blood flow regulation where a 3D configuration might become necessary.

      The nifedipine data presented in Fig. 9 are quite compelling, and a nice demonstration of the potential power of the new models. How does this relate to what is known about the clinical male/female responses to nifedipine? Are there sex differences in drug efficacy?

      Thank you for your comment regarding Fig. 9.

      It is well known that sex-specific differences in pharmacokinetics and pharmacodynamics influence antihypertensive drug responses [PMID: 8651122., PMID: 22089536]. Previous studies, notably by Kloner et al., have illustrated this point quantitatively, highlighting a more pronounced diastolic BP response in women (91.4%) compared to men (83%) when treated with dihydropyridine-type channel blockers, such as amlodipine/nifedipine. Importantly, this distinction persisted even after adjusting for confounding factors such as baseline BP, age, weight, and dosage per kilogram [PMID: 8651122]. An interesting observation from Kajiwara et al. emphasizes that vasodilation-related adverse symptoms occur significantly more frequently in younger women (<50 years) compared to their male counterparts, suggesting a heightened sensitivity to dihydropyridine-type calcium channel blockers [PMID: 24728902].

      While our findings resonate with clinical observations, a word of caution is in order. Our data suggest that, in the mouse model, nifedipine elicits distinct sex-specific effects. Importantly, future research should test the direct translatability and implications of these observations in human subjects.

      Reviewer #1 (Recommendations For The Authors):

      1. Cellular simulations with noise: It might be useful to also include in this section how noise was introduced specifically into the [Ca]SR equations.

      We agree. The manuscript now includes an expanded explanation of how noise was incorporated into the model. This includes the addition of Equation 6 into section 2.4 "Cellular simulations with noise" to describe how noise was specifically integrated into the [Ca]SR equations. Please see LINE 355.

      1. For equation 14, the description might be confusing. RCG and Ri are not explicitly included.

      Thank you – this has been corrected.

      1. In the paragraph starting with, "Having explored the regulation of graded membrane potential..." , the references to Figure 7C-D do not seem to match the content of the text. Namely, the figures show female versus male responses to nifedipine, which is not introduced until the next paragraph. Additionally, the graphs in 7C-D do not have the panels titled and the y-axes labeled.

      We apologize for the error. We have modified the text and figures to address these issues.

      1. Perhaps give more detail on how the effects of nifedipine were mathematically simulated at the ionic current level.

      Good suggestion. Briefly, previous studies [PMID: 1329564] have shown that at the therapeutic dose of nifedipine (i.e., about 0.1 μM) L-type Cav1.2 channel currents are reduced by about 70%. Accordingly, we decreased ICaL in our mathematical simulations by the same extent. It is known that dihydropyridine-type channel blockers exhibit a voltage-dependent behavior, predominantly binding to the inactivated state. In smooth muscle cells, these blockers initiate inhibition quickly within a voltage range of -60 to -40 mV. This range aligns with the membrane potential baseline of vascular muscle cells (PMID: 8388295), ensuring the blockers are effective without the need of inducing significant depolarization. Therefore, the voltage dependency of dihydropyridine-type channel blockers can be neglected.

      1. For the simulations with 400 uncoupled myocytes, the methods stated that the "gap junctional resistance [was set] to zero". Did the authors mean to use "conductivity" or am I misunderstanding?

      Thank you for bringing up this issue with the term "gap junctional resistance." We now state that the "gap junctional conductivity" was set to zero to indicate no electrical communication/coupling.

      1. Address whether there are differences-such as in cell geometry, degree of sex-based ionic current changes, and frequency of spontaneous hyperpolarization-between mice and human smooth muscle myocytes that could limit the predictive capability of the model.

      Excellent point. Our model was parametrized using data from mouse mesenteric artery smooth muscle cells as initial proof of concept. In general terms, mouse arteries are a good animal model for human arteries, as they have similar intravascular pressure-myogenic tone relationships, resting membrane potentials, and express similar ionic channel (e.g., CaV1.2, BK channels, RyRs, etc) (PMID: 28119464, PMID: 29070899). Unfortunately, these studies have largely been done in male arteries and myocytes. Thus, while we recognize that the physiological distinctions between mice and humans could introduce variances in the model's outcomes. Our model offers valuable insights into the sex-specific mechanisms of KV2.1 and CaV1.2 channels in controlling membrane potential and Ca2+ dynamics in mice. It has been shown that sex-specific differences in pharmacokinetics and pharmacodynamics influence antihypertensive drug responses [[PMID: 8651122., PMID: 22089536]. Previous studies, notably by Kloner et al., have illustrated this point quantitatively, highlighting a more pronounced diastolic BP response in women (91.4%) compared to men (83%) when treated with dihydropyridine-type channel blockers, such as amlodipine/nifedipine. Importantly, this distinction persisted even after adjusting for confounding factors such as baseline BP, age, weight, and dosage per kilogram [PMID: 8651122]. An interesting observation from Kajiwara et al. emphasizes that vasodilation-related adverse symptoms occur significantly more frequently in younger women (<50 years) compared to their male counterparts, suggesting a heightened sensitivity to dihydropyridine-type calcium channel blockers [PMID: 24728902].

      While our findings resonate with clinical observations, a word of caution is in order. Our data suggest that, in the mouse model, nifedipine elicits distinct sex-specific effects. Importantly, future research should test the direct translatability and implications of these observations in human subjects.

      1. "A virtual drug-screening system that can model drug-channel interactions" (pg 32) sounds very novel.

      Thank you for highlighting this. We recognize the typo in our manuscript and have made the necessary corrections to ensure clarity and accuracy.

      Reviewer #2 (Recommendations For The Authors):

      The manuscript is well written. I only have some minor comments:

      1. In the patch clamp experiments, there is no information on the recovery of the ionic currents. Is recovery important or not in arterial myocytes? This question is related to the results shown in Figs 5-7. In Fig.5, is the oscillation caused by noise alone or a spontaneous oscillation (such as the oscillation in Fis.6-7) modulated by noise? In general, recovery is an important parameter for the frequency of spontaneous oscillations. It seems to me that the spontaneous oscillations in Fig.8 are mainly noise-driven since they disappear after the cells are coupled through gap junctions.

      One important aspect of the oscillatory behavior of the smooth muscle cells is the very long timescales, with fluctuations occurring on the order of seconds. But the majority of ion channels are operating and recovering on the order of milliseconds, so a reasonable approximation is that most ion channels in the cell are operating at steady state at low voltages.

      Oscillations in Fig.5: Both the intrinsic oscillations and the noise play key roles in shaping in the oscillations.

      The intrinsic deterministic dynamics of the model cells are oscillatory (as seen in Figures 6-7), but the noise can trigger sparks early or delay them, which leads to substantial fluctuations in the inter-spark intervals. Therefore, the spontaneous oscillations are technically modulated by the noise rather than driven by the noise. Nevertheless, in both cases, recovery dynamics play an essential role in shaping the oscillations and determining their frequency

      Note however that, when an excitable system is around the bifurcation for oscillations and noise is included, the "firing" statistics in the oscillatory state and the non-oscillatory state are indistinguishable for moderate to high levels of noise.

      Noise Exclusion in Figures 6-7: To offer a clear and undistracted interpretation of the results, noise was intentionally omitted from Figures 6-7. This was done to ensure that the primary phenomena under investigation were not obscured. While we recognize the significance of incorporating all elements, including noise, in simulating biological systems, in this case we prioritized a clear point to be made in this context.

      Oscillations in Fig.8: Your observation regarding Fig.8 is insightful. Here, uncoupled cells indeed display a spontaneous oscillatory behavior. As documented in previous research, this behavior is not an artifact resulting from cell isolation from the vessel but represents an intrinsic characteristic vital for maintaining electrical signals. The noise in the cells leads to substantial fluctuations in the inter-spike intervals. Because the noise in each cell is uncorrelated, it acts to desynchronize the activity of the cells. Therefore, instead of synchronizing the activity of the cells, the gap junction coupling quenches the large-scale oscillations (the spikes), creating lower amplitude irregular oscillations.

      1. The calcium level is much higher in women than in men as shown in Figs.7 and 9. Do women have higher arterial pressure than men?

      We thank the reviewer for the observation regarding the calcium levels in Figs.7 and 9. All data presented comes from both male and female C57BL/6J animal models, forming the foundation of our experimental framework.

      From earlier studies by the Santana lab (PMID: 32015129), distinct sex-specific differences were found between male and female vascular mesenteric vessels. When the endothelium was removed from small arteriole segments and these segments were subsequently pressurized within a range of 20–120 mmHg, the female arterioles exhibited a pronounced myogenic response in comparison to the male ones. This brings to the forefront the marked sex-based differences, especially in the context of vascular smooth muscle activity.

      Yet, when examining the behavior of whole, intact vessels, a different picture emerges. Despite clear sex-specific differences in conditions with the endothelium removed, these distinctions become less pronounced in whole, intact vessels. In essence, both male and female mice exhibit analogous arterial pressure patterns. This suggests possible compensatory mechanisms related to the caliber and structure of the small vessels.

      To address the core issue: Despite our data showing higher calcium levels in female samples, it doesn't necessarily imply females consistently exhibit higher arterial pressure across all physiological scenarios.

      1. In Fig.9, where is the intravascular pressure (a variable or a parameter) in the mathematical model?

      In our model, the intravascular pressure effects are implicitly introduced by modulating the conductance of the non-selective cation currents (INSCC). Specifically, the increase in INSCC is our way of simulating the effects of pressure-induced membrane depolarization. This approach allows us to capture the physiological response to intravascular pressure changes without explicitly introducing it as a separate parameter in the model. We have modified the manuscript to ensure that this rationale is clarified.

      1. In Eq.14, the given units of Rmyo (Ohmcm) and Rg (Ohmcmcm) are different, but Eq.14 implies they should have the same unit.

      We sincerely appreciate the reviewer's meticulous observation regarding the units discrepancy in Eq.14. We have revised the manuscript to correct the error.

      Reviewer #3 (Recommendations For The Authors):

      Suggestions for improved or additional experiments, data, or analyses:

      Fig. 5 A-B: This is a beautiful qualitative comparison between experimental and simulation data! I think it would be even more impactful if the authors carried out some quantitative analysis of the similarity between male/female experimental/simulation data. For example, the "resting" Vm levels (approx. -30 mV and -40 mV for females and males, respectively) and the peak levels of Vm hyperpolarization could be compared, as well as the frequency of transient hyperpolarization events. It seems like the female model is much more prone to intervals of relative quiescence (i.e., absence of transient hyperpolarization events - e.g., from ~5-6.5 s). Is this consistent with the duration of such ranges in the experimental data (e.g., from 0 to 2.5 s in Fig. 5A).

      Thank you for your positive remarks concerning the qualitative comparison in Fig. 5 A-B. We are indeed enthusiastic about the parallels we've identified between experimental and simulation outcomes. We agree with the reviewer that the suggestion on the potential value of a more quantitative assessment. As such we have updated the figure to include an in-depth analysis that provides greater insights and solidifies the power of our simulation predictions when compared to experimental results. A detailed analysis of the male and female data as well as the male and female simulations are summarized in the text as follows:

      Baseline membrane potential is -40 mV in male myocytes compared to -30 mV. The frequency of hyperpolarization transients (THs) is 1 Hz in male and 2.5 Hz in female cells for the specific baseline membrane potential shown in Figure 5 A-B. In the range of membrane potentials from -50 mV to -30 mV the frequency increases from 1-2.8Hz which is identical to the experimental frequency range.

      • Fig. 7 C-D: Likewise, it would be helpful to quantitatively characterize male/female differences in the model's response to simulated Ca channel blockade (e.g., rate of transient hyperpolarization events, relative levels of ICa and [Ca]i).

      Thank you for the constructive feedback on Fig. 7 C-D. We appreciate the emphasis on a quantitative approach to solidify our understanding and have modified the results as follows:

      Next, we simulated the effects of calcium channel blocker nifedipine on ICa at a steady membrane potential of -40 mV in male and female simulations. Briefly, previous studies70 have shown that at the therapeutic dose of nifedipine (i.e., about 0.1 μM) L-type Cav1.2 channel currents are reduced by about 70%. Accordingly, we decreased ICa in our mathematical simulations by the same extent. In Figure 7C-D, we show the predicted male (gray) and female (pink) time course of membrane voltage at -40 mV (top panel), ICa (middle panel), and [Ca2+]i (lower panel). First, we observed that in both male and females 0.1 μM nifedipine modifies the frequency of oscillation in the membrane potential, by causing a reduction in oscillation frequency. Second, both male and female simulations (middle panels) show that 0.1 μM nifedipine caused a reduction of ICa to levels that are very similar in male and female myocytes following treatment. Consequently, the reduction of ICa causes both male and female simulations to reach a very similar baseline [Ca2+]i of about 85 nM (lower panels). As a result, simulations provide evidence supporting the idea that CaV1.2 channels are the predominant regulators of intracellular [Ca2+] entry in the physiological range from -40 mV to -20 mV. Importantly, these predictions also suggest that clinically relevant concentrations of nifedipine cause larger overall reductions in Ca2+ influx in female than in male arterial myocytes.

      Recommendations for improving the writing and presentation:

      When I accessed the GitHub repository linked in section 2.7 (Aug 17, 13:30 PT) it only contained a LICENSE file and none of the described codes and model equations appeared to be publicly available. I would like to access and examine these files. Based on the Clancy lab's excellent track record for making their work publicly available, I have no doubt that the published files will be complete, thoroughly documented, and ready for implementation in studies to reproduce or extend the work described in this manuscript.

      https://github.com/ClancyLabUCD/sex-specific-responses-to-calcium-channel-blockers-in-mesenteric-vascular-smooth-muscle

      We sincerely apologize for the omission regarding the GitHub repository. It was never our intention to omit the crucial files that should accompany our manuscript. We deeply regret any inconvenience this may have caused in your review process.

      We deeply value transparency and the importance of making our work accessible to fellow researchers and the wider community. As you rightly pointed out, the Clancy lab has always been committed to ensuring that our work is available publicly, and this instance is no exception. Please find all codes and documentation here:

      Minor corrections to the text and figures:

      The introduction is somewhat lengthy, and some of the material contained therein might be more suitable to be merged into the Discussion instead (e.g., paragraphs on negative feedback regulation and the recent study by O'Dwyer et al.).

      Thank you – we have updated the introduction but left some foundational work descriptions intact.

      • Page 6, section 1.1: There is a missing word (mice?) in the first sentence.

      • Page 11, under Eqn. 7: Luo is misspelled as Lou. (Also twice on Page 20.)

      Thank you – these have been corrected.

      Figs. 2-3: As a colorblind person, it was somewhat challenging for me to differentiate between the red and black lines. Choosing a higher-contrast colour pairing would be beneficial. For some reason, this is not so much of an issue for other figures that use the red/black scheme later in the manuscript (e.g., Figs. 5, 7-8).

      We truly appreciate your feedback on the color contrast used in our figures. Accessibility and clarity are crucial to us, and we regret any difficulty you encountered due to the color choices. Based on your valuable feedback, we have included different color pairings in our visual representations to ensure they are comprehensible to all readers, including those who are colorblind.

      Fig. 2-3: I am also confused about the use of symbols to indicate significant differences in these plots. In Fig. 2, ** is defined in the legend but not used in the figure. In both figures, the symbols are placed above/below specific sets of points, but it is unclear whether large differences for other x-axis values are statistically significant (e.g., -20 mV in Fig. 3B, +40 mV in Fig. 2C, etc.) This should be clarified.

      Thank you – we now have included all the significant differences in the data discussed in the manuscript.

      Page 22: The authors state that they "introduced noise into the [Ca]SR..." but the specifics of this approach are not described. As with other aspects of the Methods section, it would be suitable to provide a brief description of the technique used in ref. 40, perhaps added to section 2.4.

      Thank you – it has been corrected.

      Fig.7 C-D: Axis labels and units are missing. Even though the labels and units will be inferred by most readers, it would be helpful to include them here (at least in C).

      Thank you for pointing out the inconsistency between the textual references and Figure 7C-D. We have added the corrected figure.

      Page 32: "...the first step toward the development of a virtual drug-screaming system..." I think the authors mean drug-screening. As a side note, this is immediately in the running for the best typo I've ever seen as a peer reviewer.

      <good laugh> Thank you for pointing out this error, and we sincerely appreciate your sense of humor about it. You are indeed correct; the intended word is "drug-screening." We have corrected this typo in the manuscript. We're grateful for your thorough review and the light-hearted way you brought this to our attention.

    1. Author Response

      The following is the authors’ response to the original reviews.

      We would like to thank the reviewers for their strong interest in our studies and their excellent suggestions for improvement.

      Reviewer #1:

      Weaknesses:

      Comment 1. The authors identified NPR-15 and ASJ neurons that are involved in both molecular and behavioral responses to pathogen attack. This finding, by itself, is significant. However, how the NPR-15/ASJ circuit regulates the interplay between the two defense strategies was not explored. Therefore, emphasizing the interplay in the title and the abstract is misleading.

      Response to comment 1. We have removed the word “interplay.”

      Comment 2. Although the discovery of a single GPCR regulating both immunity and avoidance behavior is significant and novel, NPR-15 is not the first GPCR identified with these functions. Previously, the same lab reported that the GPCR OCTR-1 also regulates immunity and avoidance behavior through ASH and ASI neurons respectively (PMID: 29117551). This point was not mentioned in the current manuscript.

      Response to Comment 2. We’d like to clarify that it remains unclear whether OCTR-1 itself controls both immunity and behavior (PMID: 29117551). The reference study showed that OCTR-1-expressing neurons ASH and ASI control immunity and behavior, respectively. We modified the manuscript to make this point clearer: “While OCTR-1-expressing neurons ASI play a role in avoidance (34), the specific role of OCTR-1 in ASH and ASI neurons remains unclear. “

      Comment 3. The authors discovered that NPR-15 regulates avoidance behavior via the TRPM gene, GON-2. Only two factors (GON-2 and GTL-2) were examined in this study, and GON-2 happens to function through the intestine.

      Response to comment 3. We studied GON-2 and GTL-2 because a recent screen of intestinal TRPM genes showed that they are the only two involved in the control of pathogen avoidance. We modified the manuscript to make this rationale clearer: “Because transient receptor potential melastatin (TRPM) ion channels, GON-2 and GTL-2, are required for pathogen avoidance (32), we studied whether they may be part of the NPR-15 pathway that controls pathogen avoidance”

      Comment 3b. It is possible that NPR-15 may broadly regulate multiple effectors in multiple tissues. Confining the regulation to the amphid sensory neuron-intestinal axis, as stated in the title and elsewhere in the manuscript, is not accurate.

      Response to comment 3b. We agree that NPR-15 may broadly regulate multiple effectors in different tissues. Indeed, we have shown that the transcriptional activity of ELT-2, HLH-30, DAF-16, and PMK-1 is higher in npr-15 than in WT animals. We found that expression of NPR-15 only in ASJ cells rescues both the survival and behavioral phenotypes of npr-15 animals (Figs. 4F and 5C).

      Comment 4. The C. elegans nervous system is simple, and hermaphrodites only have 302 neurons. Individual neurons possessing multiple regulatory functions is expected. Whether this is conserved in mammals and other vertebrates is unknown, because in higher animals, neurons and neuronal circuits could be more specialized.

      Response to Comment 4. We agreed. We have removed the statements discussing conservation in that manner.

      Comment 5. A key question, that is, why would NPR-15 suppress immunity (which is bad for defense) but enhance avoidance behavior (which is good for defense), is not addressed or explained. This could be due to temporal regulation, for example, upon pathogen exposure, NPR-15 could regulate behavior to avoid the pathogen, but after infection, NPR-15 could suppress excessive immune responses or quench the responses for the resolution of infection.

      Response to comment 5. We found that NPR-15 controls the expression of immune genes in the absence of an infection. Without further experiments, we think it would be too speculative to discuss the possibility of a temporal regulation. However, we modified the manuscript to address the control of both molecular and behavioral immunity by NPR-15. The revised discussion reads: “Our findings shed light on the role of NPR-15 in the control of the immune response. NPR-15 seems to suppress specific immune genes while activating pathogen avoidance behavior to minimize potential tissue damage and the metabolic energy cost associated with activating the molecular immune response against pathogen infections. Overall, the control of immune activation is essential for maintaining homeostasis and preventing excessive tissue damage caused by an overly aggressive and energy-costly response against pathogens (60-63).”

      Comment 6. Discussion appears timid in scope and contains some repetitive statements. Point 5 can be addressed in the Discussion.

      Response to comment 6. We have removed repetitive concepts and modified the discussion as mentioned in the response to point 5.

      Comment 7. Overall, the authors presented an impactful study that identified specific molecules and neuronal cells that regulate both molecular and behavioral immune responses to pathogen attack. Most conclusions are supported by solid evidence. However, some statements are overreaching, for example, regulation of the interplay between molecular and behavioral immune responses was emphasized but not explored. Nonetheless, this study reported a significant and novel discovery and has laid a foundation for investigating such an interplay in the future.

      Response to comment 7: We removed the statements that may have appeared to be overreaching and addressed the weakness raised by the reviewer. The revised discussion reads “Our findings shed light on the role of NPR-15 in the control of the immune response. NPR-15 seems to suppress specific immune genes while activating pathogen avoidance behavior to minimize potential tissue damage and the metabolic energy cost associated with activating the molecular immune response against pathogen infections. Overall, the control of immune activation is essential for maintaining homeostasis and preventing excessive tissue damage caused by an overly aggressive and energy-costly response against pathogens (60-63).”

      Recommendations for the authors:

      Recommendations 1. The title, abstract and some statements in the main text need to be re-written to reflect the fact that regulation of the interplay between molecular and behavioral immune responses was not explored in this study.

      Response to recommendations 1. We modified the title and abstract accordingly.

      Recommendations 2. It should be mentioned in the manuscript that OCTR-1 is the first GPCR that was identified to regulate both immunity and avoidance behavior.

      Response to recommendation 2. We addressed this issue as discussed in the response to comment 2.

      Recommendations 3. Repetitive statements should be removed from Discussion.

      Response to recommendations 3. The statements were removed.

      Recommendations 4. It is surprising to see that pmk-1 RNAi did not affect the survival of npr-15(tm12539) animals against S. aureus because PMK-1 has a general role in defense against S. aureus infection.

      Response to recommendations 4. We agree. However, the RNAi studies were validated using mutants (Fig. S3B).

      Recommendations 4b. Also, the rationale for using skn-1 RNAi as a control was not given. These need to be explained adequately in the manuscript.

      Response to recommendations 4b. There’s no need to include skn-1 RNAi and we removed the data.

      Recommendations 5. The conclusion that the lack of avoidance behavior by NPR-15 loss-of-function is independent of immunity and neuropeptide genes was drawn entirely based on experiments with RNAi of individual genes. Functional redundancy among genes could render RNAi of individual genes ineffective, thus masking the dependence of avoidance behavior on these genes. More experiments are needed to support this conclusion, or the wording of the conclusion need to be changed.

      Response to recommendations 5. We modified the conclusion to address this issue: “Given the possibility of functional redundancy among these genes, we cannot rule out the possibility that different combinations may play a role in controlling avoidance behavior.”

      Recommendations 6. What is representation factor in Fig. 2B and 2C?

      Response to recommendations 5. Figure 2B shows significantly enriched terms with a Q value < 0.1, sorted by P values. Figure 2 C shows the representation factor that is calculated using a tool, http://nemates.org/MA/progs/overlap_stats.html. The calculation is based on the number of genes in set 1, the number of genes in set 2, and the Overlap between set 1 and set 2, as well as the number of genes in the genome.

      We corrected the Figure legends and included the corresponding information in Material and Methods.

      Recommendations 7. The legend of Fig. 6 was wrong and should be changed to 'GPCR/NPR-15 suppressed immune response and enhanced avoidance behavior via sensory neurons'.

      Response to recommendations 7. Thank you for pointing this out. We changed the legend.

      Reviewer #2:

      Comments 1. There is some variance in lawn occupancy of wt strains between the different trials in WT animals (e.g. in Fig. 1: 25 for wt vs 60% for npr mutant; S1c 5% for wt and 60% for npr mutant).

      Response to comment 1. We appreciate the observation. We did notice some variation in both the WT and npr-15(tm12539) animals during our study. Notably, the variation appeared to be more in the WT compared to the npr-15(tm12539) animals. However, it's important to note that these variations did not significantly affect the outcome of our findings. We calculated the means, standard deviation, and standard error across different experimental trials that are presented in the manuscript (Table S2) (new Table). It's worth noting that these variations did not significantly impact the observed differences in lawn occupancy between the wild-type (WT) and npr-15 mutant strains.

      We addressed this issue in the revised manuscript: “Interestingly, we noticed that the variation in lawn occupancy is greater in WT than in npr-15(tm12539) animals across experiments (Table S2), which suggests that the strong lack of avoidance of npr-15(tm12539) somehow counteracts the experimental variation”

      Comment 2. Does this reflect rates of migration or re-occupancy in WT?

      Response to comment 2. We did not observe any re-occupancy in either the WT or npr-15 animals at 24-hour time points (which we mostly use in this study) or beyond. To address the comment, we performed a new experiment and found that the re-occupancy of npr-15 mutants is comparable to that of WT animals at 4 hours post-exposure (Figure S1B).

      Comment 3. Does pathogen avoidance persist and/or the rate of avoidance differ in npr mutant worms?

      Response to comment 3. As illustrated in new Figure S1B, the avoidance behavior in response to pathogens remained consistent even when we extended our observations up to 48 hours (Figure S1B).

      Comment 4. if animals were exposed then re-exposed, could the authors to determine whether a learned avoidance was similarly affected by this mutation by assessing rate changes?

      Response to comment 4. We conducted the proposed experiment and observed that the WT animals learned to avoid the pathogen but not npr-15(tm12539) mutants (Figure S1C). The revised manuscript reads: “We also found that npr-15(tm12539) exhibited reduced learned avoidance compared to WT animals (Figure S1C).”

      Comment 5: Is there any difference in gene expression of animals that have migrated off the lawn to those remaining on the lawn (e.g. in partial lawn experiments?).

      Response to comment 5. This is an interesting question that has not been addressed in the field yet. While we think the study is exciting, we believe that it is outside the scope of our work. All the gene expression studies performed here are in non-avoiding conditions.

      Comment 6. No concerns but the P values in the legends are a pain to read. Why not put them in figures as in above figures.

      Response to comment 6. We included the P values as suggested.

      Recommendations for the authors:

      Recommendation 1. Fig. 1/S1. Comments: There is some variance in lawn occupancy of wt strains between the different trials in WT animals (e.g. in Fig. 1: 25 for wt vs 60% for npr mutant; S1c 5% for wt and 60% for npr mutant).

      Response to recommendation 1. We addressed this issue as discussed in the response to comment 1.

      Recommendation 2. Fig. 1/S1. Comments. Does this reflect rates of migration or re-occupancy in WT?

      Response to recommendation 2. We have responded to this issue in comment 2.

      Recommendations 3. Fig. 1/S1. Comments. Does pathogen avoidance persist and/or the rate of avoidance differ in npr mutant worms.

      Response to recommendation 3. We have responded to this issue in comment 3.

      Recommendation 4. Fig. 1/S1. Comments B. and if animals were exposed then re- exposed, could the authors to determine whether a learned avoidance was similarly affected by this mutation by assessing rate changes?

      Response to recommendation 4: We have responded to this issue in comment 4 above.

      Recommendation 5. Fig. 2/S2. Comment: Is there any difference in gene expression of animals that have migrated off the lawn to those remaining on the lawn (e.g. in partial lawn expts?).

      Response to recommendation 5. We have responded to this issue in comment 5 above.

      Recommendation 6. Fig. 3/S3. Comment. No concerns but the P values in the legends are a pain to read. Why not put them in figures as in above figures.

      Response to recommendation 6. We included the P values.

      Recommendation 7. Fig. 5. Comments: The authors suggest that the ASJ/NPR15 effect to limit avoidance acts via inhibition of GON-2 in the intestine. The observation that GON-2 inhibition effects on pathogen avoidance occur independently of neurons could suggest that it is a redundant way of accomplishing the same thing, which then makes one wonder if or what the connection is exists between the neuron and the gut. The effect of ASJ via NPR on pathogen avoidance is not neuropeptide dependent, which they show. So how the neuronal-gut communication works. Specific Transmitters... perhaps.

      Response to Recommendation 7 Fig. 5. Thanks for this observation. To address the recommendation, we modified the discussion: “Our research additionally indicates that the regulation of NPR-15-mediated avoidance is not influenced by intestinal immune and neuropeptide genes. Given the potential for functional redundancy and our focus on genes upregulated in the absence of NPR-15, we cannot entirely rule out the possibility that unexamined immune effectors or neuropeptides, not transcriptionally controlled by NPR-15, might be involved. Different intestinal signals may also participate in the NPR-15 pathway that controls pathogen avoidance.”

      Recommendation 8. Comment. Since ASJ neurons control entry into dauer, perhaps isn't surprising that DAF-16 showed up as an NPR-15. induced factor (and dauer worms are resistant to a lot of stressors); that said dauer hormones might be involved as well. Is there any evidence that DAF-16 down-regulates GON-2 expression (see Murphy, Kenyon et al. 2005), and along these lines would GON-2 RNAi work in a DAF-16 mutant? I think addressing these issues are the subject of future studies.

      Response to recommendation 8. We checked the data in the study by Murphy, Kenyon et al., and found that the gon-2 gene was not downregulated.

      Recommendation 9. Minor: Regarding the description to Fig. 5. "Consistently with our previous findings, we found that only " The adverb form of consistent should not be used here.

      Response to recommendation 9. Thank you for pointing this out. The description of Figure 5 was corrected.

    1. Author Response

      The following is the authors’ response to the original reviews.

      Reviewer #1:

      A weakness of the paper is that the power of the model is illustrated for only one specific set of parameters, added in a stepwise manner and the comparison to one specific empirical TGM, assumed to be prototypical; And that this comparison remains descriptive. (That is could a different selection of parameters lead to similar results and is there TGM data which matches these settings less well.)

      The fact that the comparisons in the paper are descriptive is a central point of criticism from both reviewers. As mentioned in my preliminary response, I intentionally did not optimise the model to a specific TGM or show an explicit metric of fitness. As I now explicitly mention in the new experimental section of the paper:

      “The previous analyses were descriptive in the sense that they did not quantify how much the generated TGMs resembled a specific empirical TGM. This was deliberate, because empirical TGMs vary across subjects and experiments, and I aimed at characterising them as generally as possible by looking at some characteristic features in broad terms. For example, while TGMs typically have a strong diagonal and horizontal/vertical bars of high accuracy, questions such as when these effects emerge and for how long are highly dependent on the experimental paradigm. For the same reason, I did not optimise the model hyperparameters, limiting myself to observing the behaviour of the model across some characteristic configurations”

      And, in the Discussion:

      “The demonstrations here are not meant to be tailored to a specific data set, and are, for the most part, intentionally qualitative. TGMs do vary across experiments and subjects; and the hyperparameters of the model can be explicitly optimised to specific scientific questions, data sets, and even individuals. In order to explore the space of configurations effectively, an automatic optimisation of the hyperparameter space using, for instance, Bayesian optimisation (Lorenz, et al., 2017) could be advantageous. This may lead to the identification of very specific (spatial, spectral and temporal) features in the data that may be neurobiologically interpreted.”

      Nonetheless, it is possible to fit the model to a specific TGMs by using a explicit metric of fitness. For illustration, this is what I did in the new experimental section Fitting and empirical TGM, where I used correlation with an empirical TGM to optimise two temporal parameters: the rise slope and the fall slope. As can be seen in the Figure 8, the correlation with the empirical TGM was as high as 0.7, even though I did not fit the other parameters of the model. As mentioned in the paragraph above, more sophisticated techniques such as Bayesian optimisation might be necessary for a more exhaustive exploration, but this would be beyond the scope of the current paper.

      I would also like to point out that fitting the parameters in a step-wise manner was a necessity for interpretation. I suggest to think of the way we use F-tests in regression analyses as a comparison: if we want to know how important a feature is, we compare the model with and without this feature and see how much we loss.

      It further remained unclear to me, which implications may be drawn from the generative model, following from the capacities to mimic this specific TGM (i) for more complex cases, such as the comparison between experimental conditions, and (ii) about the complex nature of neural processes involved.

      Following on the previous points, the object of this paper (besides presenting the model and the associated toolbox) was not to mimic a specific TGM, but to characterise the main features that we generally see across studies in the field. To clarify this, I have added Figure 2 (previously a Supplemental Information figure), and added the following to the Results section:

      “Figure 2 shows a TGM for an example subject, where some archetypal characteristics are highlighted. In the experiments below, specifically, I focus on the strong narrow diagonal at the beginning of the trial, the broadening of accuracy later in the trial, and the vertical/horizontal bars of higher-than-chance accuracy. Importantly, this specific example in Figure 2 is only meant as a reference, and therefore I did not optimise the model hyperparameters to this TGM (except in the last subsection), or showed any quantitative metric of similarity.”

      I mention the possibility of using the model to explore more complex cases in the Introduction, although doing so here would be out of scope:

      “Other experimental paradigms, including motor tasks and decision making, can be investigated with genephys”

      Towards this end, I would appreciate (i) a more profound explanation of the conclusions that can be drawn from this specific showcase, including potential limitations, as well as wider considerations of how scientists may empower the generative model to (ii) understand their experimental data better and (iii) which added value the model may have in understanding the nature of underlying brain mechanism (rather than a mere technical characterization of sensor data).

      To better illustrate how to use genephys to explore a specific data set, I have added a section (Fitting an empirical TGM) where I show how to fit specific hyperparameters to an empirical TGM in a simple manner.

      In the Introduction, I briefly mentioned:

      “This (not exhaustive) list of effects was considered given previous literature (Shah, et al., 2004; Mazaheri & Jensen, 2006; Makeig, et al., 2002; Vidaurre, et al., 2021), and each effect may be underpinned by distinct neural mechanisms. For example, it is not completely clear the extent to which stimulus processing is sustained by oscillations, and disentangling these effects can help resolving this question”

      In the Discussion, I have further commented:

      “Genephys has different available types of effect, including phase resets, additive damped oscillations, amplitude modulations, and non-oscillatory responses. All of these elements, which may relate to distinct neurobiological mechanisms, are configurable and can be combined to generate a plethora of TGMs that, in turn, can be contrasted to specific empirical TGMs. This way, we can gain insight on what mechanisms might be at play in a given task.

      The demonstrations here are not meant to be tailored to a specific data set, and are, for the most part, intentionally qualitative. TGMs do vary across experiments and subjects; and the hyperparameters of the model can be explicitly optimised to specific scientific questions, data sets, and even individuals. In order to explore the space of configurations effectively, an automatic optimisation of the hyperparameter space using, for instance, Bayesian optimisation (Lorenz, et al., 2017) could be advantageous. This may lead to the identification of very specific (spatial, spectral and temporal) features in the data that may be neurobiologically interpreted. “

      On p. 15 "Having a diversity of frequencies but not of latencies produces another regular pattern consisting of alternating, parallel bands of higher/lower than baseline accuracy. This, shown in the bottom left panel, is not what we see in real data either. Having a diversity of latencies but not of frequencies gets us closer to a realistic pattern, as we see in the top right panel." The terms frequency and latency seem to be confused.

      The Reviewer is right. I have corrected this now. Thank you.

      Reviewer #2:

      The results of comparisons between simulations and real data are not always clear for an inexperienced reader. For example, the comparisons are qualitative rather than quantitative, making it hard to draw firm conclusions. Relatedly, it is unclear whether the chosen parameterizations are the only/best ones to generate the observed patterns or whether others are possible. In the case of the latter, it is unclear what we can actually conclude about underlying signal generators. It would have been different if the model was directly fitted to empirical data, maybe of different cognitive conditions. Finally, the neurobiological interpretation of different signal properties is not discussed. Therefore, taken together, in its currently presented form, it is unclear how this method could be used exactly to further our understanding of the brain.

      This critique coincides with that of Reviewer 1. In the current version, I made more clear the fact that I am not fitting a specific empirical TGM and why, and that, instead, I am referring to general features that appear broadly throughout the literature. See more detailed changes below.

      Regarding whether the chosen parameterizations are the only/best ones to generate the observed patterns, the Discussion reflects this limitation:

      “Also importantly, I have shown that standard decoding analysis can differentiate between these explanations only to some extent. For example, the effects induced by phase-resetting and the use of additive oscillatory components are not enormously different in terms of the resulting TGMs. In future work, alternatives to standard decoding analysis and TGMs might be used to disentangle these sources of variation (Vidaurre, et al., 2019). ”

      And

      “Importantly, the list of effects that I have explored here is not exhaustive …”

      Of course, since the list of signal features I have explored is not exhaustive, it cannot be claimed without a doubt that these features are the ones generating the properties we observe in real TGMs. The model, however, is a step forward in that direction, as it provides us with a tool to at least rule out some causes.

      Firstly, it was not entirely clear to me from the introduction what gap exactly the model is supposed to fill: is it about variance in neural responses in general, about which signal properties are responsible for decoding, or about capturing stability of signals? It seems like it does all of these, but this needs to be made clearer in the introduction. It would be helpful to emphasize exactly what insights the model can provide that are unable to be obtained with the current methods.

      I have now made this explicit in in the Introduction, as suggested:

      “To gain insight into what aspects of the signal underpin decoding accuracy, and therefore the most stable aspects of stimulus processing, I introduce a generative model”

      To help illustrating what insights the model can provide, I have added the following sentence as an example:

      “For example, it is not completely clear the extent to which stimulus processing is sustained by oscillations, and disentangling these effects can help resolving this question.”

      Furthermore, I was unclear on why these specific properties were chosen (lines 71 to 78). Is there evidence from neuroscience to suggest that these signal properties are especially important for neural processing? Or, if the logic has more to do with signal processing, why are these specific properties the most important to include?

      To clarify this the text now reads:

      “In the model, when a channel responds, it can do it in different ways: (i) by phase-resetting the ongoing oscillation to a given target phase and then entraining to a given frequency, (ii) by an additive oscillatory response independent of the ongoing oscillation, (iii) by modulating the amplitude of the stimulus-relevant oscillations, or (iv) by an additive non-oscillatory (slower) response. This (not exhaustive) list of effects was considered given previous literature (Shah, et al., 2004; Mazaheri & Jensen, 2006; Makeig, et al., 2002; Vidaurre, et al., 2021), and each effect may be underpinned by distinct neural mechanisms”

      The general narrative and focus of the paper could also be improved. It might help to start off with an outline of what the goal is at the start of the paper and then explicitly discuss how each of the steps works toward that goal. For example, I got the idea that the goal was to capture specific properties of an empirical TGM. If this was the case, the empirical TGM could be placed in the main body of the text as a reference picture for all simulated TGMs. For each simulation step, it could be emphasized more clearly exactly which features of the TGM is captured and what that means for interpreting these features in real data.

      Thank you. To clarify the purpose of the paper better, I have brought Figure 2 to the front (before a Supplementary Figure), and in the first part of Results I have now added:

      “Figure 2 shows a TGM for an example subject, where some archetypal characteristics are highlighted. In the experiments below, specifically, I focus on the strong narrow diagonal at the beginning of the trial, the broadening of accuracy later in the trial, and the vertical/horizontal bars of higher-than-chance accuracy. Importantly, this specific example in Figure 2 is only meant as a reference, and therefore I did not optimise the model hyperparameters to this TGM (except in the last subsection), or showed any quantitative metric of similarity. ”

      I have enunciated the goals more clearly in the Introduction:

      “To gain insight into what aspects of the signal underpin decoding accuracy, and therefore the most stable aspects of stimulus processing, …”

      Relatedly, it would be good to connect the various signal properties to possible neurobiological mechanisms. I appreciate that the author tries to remain neutral on this in the introduction, but I think it would greatly increase the implications of the analysis if it is made clearer how it could eventually help us understand neural processes.

      The Reviewer is right in pointing out that I preferred to remain neutral on this. While I have still kept that tone of neutrality throughout the paper, I have now included the following sentence as an example of a neurobiological question that could be investigated with the model:

      “For example, it is not completely clear the extent to which stimulus processing is sustained by oscillations, and disentangling these effects can help resolving this question.”

      And, more generally,

      “Genephys has different available types of effect, including phase resets, additive damped oscillations, amplitude modulations, and non-oscillatory responses. All of these elements, which may relate to distinct neurobiological mechanisms, are configurable and can be combined to generate a plethora of TGMs that, in turn, can be contrasted to specific empirical TGMs. This way, we can gain insight on what mechanisms might be at play in a given task. ”

      Line 57: this sentence is very long, making it hard to follow, could you break up into smaller parts?

      Thank you. The sentence is fragmented now.

      Please replace angular frequencies with frequencies in Hertz for clarity.

      Here I have preferred to stick to angular frequencies because it is more general than if I talk about Hertz, because that would entail having a specific sampling frequency. I think doing so would create confusion precisely of the sorts that I am trying to clarify in this revision: that is, that these results are not specific of one TGM but reflect general features that we see broadly in the literature.

      There are quite some types throughout the paper, please recheck

      Thank you. I have revised and have made my best to clear them out.

    2. Author Response

      The following is the authors’ response to the original reviews.

      Reviewer #1:

      A weakness of the paper is that the power of the model is illustrated for only one specific set of parameters, added in a stepwise manner and the comparison to one specific empirical TGM, assumed to be prototypical; And that this comparison remains descriptive. (That is could a different selection of parameters lead to similar results and is there TGM data which matches these settings less well.)

      The fact that the comparisons in the paper are descriptive is a central point of criticism from both reviewers. As mentioned in my preliminary response, I intentionally did not optimise the model to a specific TGM or show an explicit metric of fitness. As I now explicitly mention in the new experimental section of the paper:

      “The previous analyses were descriptive in the sense that they did not quantify how much the generated TGMs resembled a specific empirical TGM. This was deliberate, because empirical TGMs vary across subjects and experiments, and I aimed at characterising them as generally as possible by looking at some characteristic features in broad terms. For example, while TGMs typically have a strong diagonal and horizontal/vertical bars of high accuracy, questions such as when these effects emerge and for how long are highly dependent on the experimental paradigm. For the same reason, I did not optimise the model hyperparameters, limiting myself to observing the behaviour of the model across some characteristic configurations”

      And, in the Discussion:

      “The demonstrations here are not meant to be tailored to a specific data set, and are, for the most part, intentionally qualitative. TGMs do vary across experiments and subjects; and the hyperparameters of the model can be explicitly optimised to specific scientific questions, data sets, and even individuals. In order to explore the space of configurations effectively, an automatic optimisation of the hyperparameter space using, for instance, Bayesian optimisation (Lorenz, et al., 2017) could be advantageous. This may lead to the identification of very specific (spatial, spectral and temporal) features in the data that may be neurobiologically interpreted.”

      Nonetheless, it is possible to fit the model to a specific TGMs by using a explicit metric of fitness. For illustration, this is what I did in the new experimental section Fitting and empirical TGM, where I used correlation with an empirical TGM to optimise two temporal parameters: the rise slope and the fall slope. As can be seen in the Figure 8, the correlation with the empirical TGM was as high as 0.7, even though I did not fit the other parameters of the model. As mentioned in the paragraph above, more sophisticated techniques such as Bayesian optimisation might be necessary for a more exhaustive exploration, but this would be beyond the scope of the current paper.

      I would also like to point out that fitting the parameters in a step-wise manner was a necessity for interpretation. I suggest to think of the way we use F-tests in regression analyses as a comparison: if we want to know how important a feature is, we compare the model with and without this feature and see how much we loss.

      It further remained unclear to me, which implications may be drawn from the generative model, following from the capacities to mimic this specific TGM (i) for more complex cases, such as the comparison between experimental conditions, and (ii) about the complex nature of neural processes involved.

      Following on the previous points, the object of this paper (besides presenting the model and the associated toolbox) was not to mimic a specific TGM, but to characterise the main features that we generally see across studies in the field. To clarify this, I have added Figure 2 (previously a Supplemental Information figure), and added the following to the Results section:

      “Figure 2 shows a TGM for an example subject, where some archetypal characteristics are highlighted. In the experiments below, specifically, I focus on the strong narrow diagonal at the beginning of the trial, the broadening of accuracy later in the trial, and the vertical/horizontal bars of higher-than-chance accuracy. Importantly, this specific example in Figure 2 is only meant as a reference, and therefore I did not optimise the model hyperparameters to this TGM (except in the last subsection), or showed any quantitative metric of similarity.”

      I mention the possibility of using the model to explore more complex cases in the Introduction, although doing so here would be out of scope:

      “Other experimental paradigms, including motor tasks and decision making, can be investigated with genephys”

      Towards this end, I would appreciate (i) a more profound explanation of the conclusions that can be drawn from this specific showcase, including potential limitations, as well as wider considerations of how scientists may empower the generative model to (ii) understand their experimental data better and (iii) which added value the model may have in understanding the nature of underlying brain mechanism (rather than a mere technical characterization of sensor data).

      To better illustrate how to use genephys to explore a specific data set, I have added a section (Fitting an empirical TGM) where I show how to fit specific hyperparameters to an empirical TGM in a simple manner.

      In the Introduction, I briefly mentioned:

      “This (not exhaustive) list of effects was considered given previous literature (Shah, et al., 2004; Mazaheri & Jensen, 2006; Makeig, et al., 2002; Vidaurre, et al., 2021), and each effect may be underpinned by distinct neural mechanisms. For example, it is not completely clear the extent to which stimulus processing is sustained by oscillations, and disentangling these effects can help resolving this question”

      In the Discussion, I have further commented:

      “Genephys has different available types of effect, including phase resets, additive damped oscillations, amplitude modulations, and non-oscillatory responses. All of these elements, which may relate to distinct neurobiological mechanisms, are configurable and can be combined to generate a plethora of TGMs that, in turn, can be contrasted to specific empirical TGMs. This way, we can gain insight on what mechanisms might be at play in a given task.

      The demonstrations here are not meant to be tailored to a specific data set, and are, for the most part, intentionally qualitative. TGMs do vary across experiments and subjects; and the hyperparameters of the model can be explicitly optimised to specific scientific questions, data sets, and even individuals. In order to explore the space of configurations effectively, an automatic optimisation of the hyperparameter space using, for instance, Bayesian optimisation (Lorenz, et al., 2017) could be advantageous. This may lead to the identification of very specific (spatial, spectral and temporal) features in the data that may be neurobiologically interpreted. “

      On p. 15 "Having a diversity of frequencies but not of latencies produces another regular pattern consisting of alternating, parallel bands of higher/lower than baseline accuracy. This, shown in the bottom left panel, is not what we see in real data either. Having a diversity of latencies but not of frequencies gets us closer to a realistic pattern, as we see in the top right panel." The terms frequency and latency seem to be confused.

      The Reviewer is right. I have corrected this now. Thank you.

      Reviewer #2:

      The results of comparisons between simulations and real data are not always clear for an inexperienced reader. For example, the comparisons are qualitative rather than quantitative, making it hard to draw firm conclusions. Relatedly, it is unclear whether the chosen parameterizations are the only/best ones to generate the observed patterns or whether others are possible. In the case of the latter, it is unclear what we can actually conclude about underlying signal generators. It would have been different if the model was directly fitted to empirical data, maybe of different cognitive conditions. Finally, the neurobiological interpretation of different signal properties is not discussed. Therefore, taken together, in its currently presented form, it is unclear how this method could be used exactly to further our understanding of the brain.

      This critique coincides with that of Reviewer 1. In the current version, I made more clear the fact that I am not fitting a specific empirical TGM and why, and that, instead, I am referring to general features that appear broadly throughout the literature. See more detailed changes below.

      Regarding whether the chosen parameterizations are the only/best ones to generate the observed patterns, the Discussion reflects this limitation:

      “Also importantly, I have shown that standard decoding analysis can differentiate between these explanations only to some extent. For example, the effects induced by phase-resetting and the use of additive oscillatory components are not enormously different in terms of the resulting TGMs. In future work, alternatives to standard decoding analysis and TGMs might be used to disentangle these sources of variation (Vidaurre, et al., 2019). ”

      And

      “Importantly, the list of effects that I have explored here is not exhaustive …”

      Of course, since the list of signal features I have explored is not exhaustive, it cannot be claimed without a doubt that these features are the ones generating the properties we observe in real TGMs. The model, however, is a step forward in that direction, as it provides us with a tool to at least rule out some causes.

      Firstly, it was not entirely clear to me from the introduction what gap exactly the model is supposed to fill: is it about variance in neural responses in general, about which signal properties are responsible for decoding, or about capturing stability of signals? It seems like it does all of these, but this needs to be made clearer in the introduction. It would be helpful to emphasize exactly what insights the model can provide that are unable to be obtained with the current methods.

      I have now made this explicit in in the Introduction, as suggested:

      “To gain insight into what aspects of the signal underpin decoding accuracy, and therefore the most stable aspects of stimulus processing, I introduce a generative model”

      To help illustrating what insights the model can provide, I have added the following sentence as an example:

      “For example, it is not completely clear the extent to which stimulus processing is sustained by oscillations, and disentangling these effects can help resolving this question.”

      Furthermore, I was unclear on why these specific properties were chosen (lines 71 to 78). Is there evidence from neuroscience to suggest that these signal properties are especially important for neural processing? Or, if the logic has more to do with signal processing, why are these specific properties the most important to include?

      To clarify this the text now reads:

      “In the model, when a channel responds, it can do it in different ways: (i) by phase-resetting the ongoing oscillation to a given target phase and then entraining to a given frequency, (ii) by an additive oscillatory response independent of the ongoing oscillation, (iii) by modulating the amplitude of the stimulus-relevant oscillations, or (iv) by an additive non-oscillatory (slower) response. This (not exhaustive) list of effects was considered given previous literature (Shah, et al., 2004; Mazaheri & Jensen, 2006; Makeig, et al., 2002; Vidaurre, et al., 2021), and each effect may be underpinned by distinct neural mechanisms”

      The general narrative and focus of the paper could also be improved. It might help to start off with an outline of what the goal is at the start of the paper and then explicitly discuss how each of the steps works toward that goal. For example, I got the idea that the goal was to capture specific properties of an empirical TGM. If this was the case, the empirical TGM could be placed in the main body of the text as a reference picture for all simulated TGMs. For each simulation step, it could be emphasized more clearly exactly which features of the TGM is captured and what that means for interpreting these features in real data.

      Thank you. To clarify the purpose of the paper better, I have brought Figure 2 to the front (before a Supplementary Figure), and in the first part of Results I have now added:

      “Figure 2 shows a TGM for an example subject, where some archetypal characteristics are highlighted. In the experiments below, specifically, I focus on the strong narrow diagonal at the beginning of the trial, the broadening of accuracy later in the trial, and the vertical/horizontal bars of higher-than-chance accuracy. Importantly, this specific example in Figure 2 is only meant as a reference, and therefore I did not optimise the model hyperparameters to this TGM (except in the last subsection), or showed any quantitative metric of similarity. ”

      I have enunciated the goals more clearly in the Introduction:

      “To gain insight into what aspects of the signal underpin decoding accuracy, and therefore the most stable aspects of stimulus processing, …”

      Relatedly, it would be good to connect the various signal properties to possible neurobiological mechanisms. I appreciate that the author tries to remain neutral on this in the introduction, but I think it would greatly increase the implications of the analysis if it is made clearer how it could eventually help us understand neural processes.

      The Reviewer is right in pointing out that I preferred to remain neutral on this. While I have still kept that tone of neutrality throughout the paper, I have now included the following sentence as an example of a neurobiological question that could be investigated with the model:

      “For example, it is not completely clear the extent to which stimulus processing is sustained by oscillations, and disentangling these effects can help resolving this question.”

      And, more generally,

      “Genephys has different available types of effect, including phase resets, additive damped oscillations, amplitude modulations, and non-oscillatory responses. All of these elements, which may relate to distinct neurobiological mechanisms, are configurable and can be combined to generate a plethora of TGMs that, in turn, can be contrasted to specific empirical TGMs. This way, we can gain insight on what mechanisms might be at play in a given task. ”

      Line 57: this sentence is very long, making it hard to follow, could you break up into smaller parts?

      Thank you. The sentence is fragmented now.

      Please replace angular frequencies with frequencies in Hertz for clarity.

      Here I have preferred to stick to angular frequencies because it is more general than if I talk about Hertz, because that would entail having a specific sampling frequency. I think doing so would create confusion precisely of the sorts that I am trying to clarify in this revision: that is, that these results are not specific of one TGM but reflect general features that we see broadly in the literature.

      There are quite some types throughout the paper, please recheck

      Thank you. I have revised and have made my best to clear them out.

    1. Author Response

      The following is the authors’ response to the original reviews.

      We are grateful for the comments and suggestions from the reviewers and have followed the recommendation in producing our revised manuscript. We have modified the text and performed additional statistical analysis as detailed below, which we believe has improved the overall manuscript.

      Reviewer #1 (Public Review):

      Establishing direct links between the neuronal connectivity information of connectomics datasets with circuit physiology and behavior and exciting current research area in neurobiology. Until recently, studies of aggression in Drosophila had been conducted largely in males, and many of the neurons involved in this behavior are male-specific clusters. Since the currently available fly brain connectomes come from female brains, their applicability for the study of the circuitry underlying aggressive behavior is very limited.

      The authors have previously used the Janelia hemibrain connectome paired with behavior analysis to show that activating either the aIPg or pC1d cell types can induce short-term aggression in females, while activation of other PC1 clusters (a-c and e) does not. Here they expand on those findings, showing that optogenetic stimulation of aIPg neurons was sufficient to promote an aggressive internal state lasting at least 10 minutes following a 30-second activation. In addition, the authors show that while stimulation of PC1d alone is not sufficient to induce this persistent aggressive state, simultaneous activation of PC1d + PC1e is, suggesting a synergistic effect. Connectomics analysis performed in the authors' previous study had shown that PC1d and aIPg are interconnected. However, silencing pC1d neuronal activity did not reduce aIPg-evoked persistent aggression, indicating that the aggressive state did not depend on pC1d-aIPg recurrent connectivity.

      The conclusions are well supported by the data, and the results presented in this manuscript represent an important contribution to our understanding of the neuronal circuitry underlying female aggression.

      Reviewer #1 (Recommendations For The Authors):

      1. Previously, the authors have shown that the activation of PC1e alone does not induce female aggression. In this study, they investigate the role of aIPg, PC1d, or PC1d+e on aggression persistence, but they do not explore the effect of activation of PC1e alone. It is possible that PC1e activation may not produce an immediate short-term effect but could lead to a gradual increase in aggression over time, potentially explaining at least in part the observed effect upon PC1d+e activation. Incorporating an examination of the long-term impact of PC1e activation on aggression could provide valuable information.

      We did perform mixed pair experiments with the pC1e-SS1 line from the Schretter et al. (2020) paper and did not find any significant changes in aggression over time in this setup as well. We have now added a reference to these experiments in the revised submission in lines 135 to 136.

      1. Some important controls are missing: flies with the genetic combinations employed in the activation experiments shown in Figure 2 but in the absence of activation and under the exact same conditions and for a similar observation period.

      For Figure 2, we used an empty split-Gal4 driver as a genetic control for our activation paradigms. As these flies contain the same number of copies of mini-white while not labeling the targeted cell types, we believe that they provide an appropriate control for these experiments. The control information is specified in all figure legends as well.

      1. The quantification shown in Fig 3- Supplementary Figure 1 shows no effect during stimulation (13 s + 15s), but based on the plots of Figure 3, there may be an effect of silencing PC1d on aIPg-induced aggression during the initial 13 second period. Those two time periods (13 s vs 15 s) could be quantified separately to determine if this is the case.

      We examined the two stimulation periods separately and did not find any significant differences in either period (13s period, p = 0.2978; 15s period, p = 0.6650). We have now added this into the figure legend for Figure 3 and Figure 3 supplement 1.

      1. Expression of Kir2.1 in pC1d neurons while aIPg neurons were activated did not suppress aggression after aIPg stimulation, suggesting that connections from pC1d neurons are not necessary for the persistent aggressive state promoted by aIPg. Since previously the authors have shown that TNT-mediated inhibition of aIPg reduces aggression, the reciprocal experiment would be informative: determining if stimulation of PC1d+e no longer produces persistent aggression when aIPg neurons are silenced.

      In this manuscript, we were primarily testing if the connections from aIPg to pC1d were necessary for the persistent aggressive state induced by aIPg activation. Therefore, we believe the suggested experiment is beyond the scope of the current manuscript.

      1. How many times was each experiment repeated? This is important information and should be in the methods section for each type of experiment or in each figure legend.

      We have now added this information in the appropriate figure legends.

      1. Determining the effect on persistent aggression of silencing sNPF (for example via RNAi or Crispr-Cas9 mediated mutagenesis) in aIPG neurons would be an important addition to the manuscript. If peptidergic signaling is underlying the persistence phenotype of aIPg neurons, that would explain why the recurrent connectivity found between those cells and the PC1 cluster does not play a role.

      We agree with the reviewer that this would be a logical next step in extending this work.

      Reviewer #2 (Public Review):

      The mechanisms that mediate female aggression remain poorly understood. Chiu, Schretter, and colleagues, employed circuit dissection techniques to tease apart the specific roles of particular doublesex and fruitless expressing neurons in the fly Drosophila in generating a persistent aggressive state. They find that activating the fruitless positive alPg neurons, generated an aggressive state that persisted for >10min after the stimulation ended. Similarly, activating the doublesex positive pC1de neurons also generated a persistent state. Activating pC1d or pC1e individually did not induce a persistent state. Interestingly, while neural activation of alPGs and pC1d+e neurons induced persistent behavioural states it did not induce persistent activity in the neurons being activated.

      The conclusions of this paper are well supported by the data, there were only a few points where clarification might help:

      1. Figure 3 is a little confusing. This is a circuit behavioural epistasis experiment where the authors activate alPg with CsChrimson while inhibiting pC1d with Kir2.1. In Fig. 2 flies were separated for 10 min following stimulation which allowed for identification of a persistent state. However, in Fig 3 it appears as if flies were allowed to freely interact during and immediately post-stimulation. It is unclear why flies were not separated as in Fig. 2, which makes it difficult to compare the two results. Some discussion of this point would help. Also, from the rasters it appears as if inhibition of pC1d reduced aggression induced by alPg during the stimulation period. Is this true?

      We thank the reviewer for pointing out the need for clarification and we have modified the legend in Figure 3 to address the points raised. The flies were allowed to freely interact during the experiments shown in Figure 3 and we have added this information to the figure legend. To obtain a high level of aggressive behavior that would make it easier to observe a suppression of aggression, the epistasis experiments were performed with freely moving same-genotype pairs. The level of aggression triggered by the generation 1 LexA line labeling aIPg was lower than that observed when using with the aIPg-SS GAL4 line. The experiment was performed as in Schretter et al. (2020) where we found that aIPg activation induced persistent fighting in same genotype pairs. We have added a brief explanation in lines 152 to 155.

      Inhibition of pC1d does not significantly reduce the overall aggression induced by aIPg stimulation in the 13s + 15s period. We also examined the differences within the two stimulation periods and did not find any significant differences (13s period, p = 0.2978; 15s period, p = 0.6650). We have now added this information to the figure legends for Figure 3 and Figure 3 supplement 1.

      1. pC1e neurons also have recurrent connectivity with alPg neurons. It might help to also discuss the potential role of this arm of the microcircuit.

      We thank the review for this suggestion. The number of synapses that aIPg sends back to pC1e is a very low proportion of its total output (0.177%). However, based on the experiments that we have performed, we cannot rule out that this microcircuit might contribute to maintaining persistence. We have added this point into the discussion in lines 210 to 211.

      Reviewer #2 (Recommendations For The Authors):

      1. Line 129-130: A citation for group-housed flies showing lower aggression would be helpful.

      We have now added in the reference to Chiu et al. (2021), as they showed this effect for females, in line 130.

      1. Figure 2 - figure supplement 1: In the legend, change "when pC1d neurons were stimulation" to "when pC1d neurons were stimulated".

      We thank the reviewer for finding this error and have now corrected this.

      Reviewer #3 (Public Review):

      Two studies published in 2020 independently identified the alPg, pC1d, and pC1e neurons to be involved in initiating and maintaining a state of aggression in female Drosophila. Both studies combined behavioural analyses, optogenitic manipulation of neurons, and connectomics. One of these studies proposed that the extensive interconnections seen between the alPg and pC1d+e neurons might represent a recurrent motif known to support persistent behvioural states in other systems. In this manuscript, the authors test this idea and report that their data do not support it. Specifically, they report that alPg or pC1d+e (but not pC1d alone) can initiate a persistent state of aggression. But they find that the persistent aggressive state is maintained even when the pC1d neurons are inactivated. Finally, they show that neither of these neurons themselves sustains neuronal activity upon stimulation, nor do either of them induce a persistent activity in the other. Together, their data suggest that the recurrent connection between alPg and pC1d is not what supports the persistent state. The data underlying these claims are convincing. A possibility to explore before ruling out recurrent motifs (at this circuit level) in maintaining aggression is that the connections between alPg and pC1e can compensate for the loss of pC1e. Overall, the study is important and will be of interest to those who study the circuit basis of persistent behavioural states, but also to neuroscientists in general.

      Reviewer #3 (Recommendations For The Authors):

      I enjoyed reading this manuscript for its clarity in writing and data presentation.

      I would like the authors to comment on the possibility that pC1e can compensate for the loss of pC1d. It is possible that if they silence both pC1d+e in the context of alPg activation, the persistent aggression is lost?

      We agree with the reviewer that this is an intriguing hypothesis. In order to examine if pC1e does compensate for pC1d, we would need to also activate pC1e while inhibiting pC1d. However, such an experiment is not currently possible as we do not have a LexA line that specifically labels either pC1d or pC1e alone.

      For the pC1d+e silencing experiments, we were primarily testing to see if the most prominent recurrent connection, which is between pC1d and aIPg, was responsible for the behavioral persistence. We agree with the reviewer that this would be a logical follow up experiment to be performed in the future.

      Have the authors looked for activity in the pC1e neuron upon simulation of alPg? (Deutsch et al 2020 observed many regions in the brain that maintained sustained activity upon pC1d+e stimulation.)

      We have not examined this activity. We agree that this would be a good follow up experiment; however, we believe it is beyond the scope of the current work.

      Would the more appropriate experiment in Figure 4c be the co-stimulation of pC1d+e while imaging from alPg?

      For these experiments, we were testing to see if the most prominent recurrent connection, which is between pC1d and aIPg, was responsible for the behavioral persistence. We agree with the reviewer that this would be a good follow up experiment

    1. Author Response

      Reviewer #1 (Public Review):

      Summary:

      This study uses whole genome sequencing to characterise the population structure and genetic diversity of a collection of 58 isolates of E. coli associated with neonatal meningitis (NMEC) from seven countries, including 52 isolates that the authors sequenced themselves and a further 6 publicly available genome sequences. Additionally, the study used sequencing to investigate three case studies of apparent relapse. The data show that in all three cases, the relapse was caused by the same NMEC strain as the initial infection. In two cases they also found evidence for gut persistence of the NMEC strain, which may act as a reservoir for persistence and reinfection in neonates. This finding is of clinical importance as it suggests that decolonisation of the gut could be helpful in preventing relapse of meningitis in NMEC patients.

      Strengths:

      The study presents complete genome sequences for n=18 diverse isolates, which will serve as useful references for future studies of NMEC. The genomic analyses are high quality, the population genomic analyses are comprehensive and the case study investigations are convincing.

      We agree

      Weaknesses:

      The NMEC collection described in the study includes isolates from just seven countries. The majority (n=51/58, 88%) are from high-income countries in Europe, Australia, or North America; the rest are from Cambodia (n=7, 12%). Therefore it is not clear how well the results reflect the global diversity of NMEC, nor the populations of NMEC affecting the most populous regions.

      The virulence factors section highlights several potentially interesting genes that are present at apparently high frequency in the NMEC genomes; however, without knowing their frequency in the broader E. coli population it is hard to know the significance of this.

      We acknowledged the limitations of our NMEC collection in the Discussion. We agree the prevalence of virulence factors in our collection is interesting. The limited size of our collection prevented further evaluation of the prevalence of these virulence factors in a broader E. coli population.

      Reviewer #2 (Public Review):

      Summary:

      In this work, the authors present a robust genomic dataset profiling 58 isolates of neonatal meningitis-causing E. coli (NMEC), the largest such cohort to be profiled to date. The authors provide genomic information on virulence and antibiotic resistance genomic markers, as well as serotype and capsule information. They go on to probe three cases in which infants presented with recurrent febrile infection and meningitis and provide evidence indicating that the original isolate is likely causing the second infection and that an asymptomatic reservoir exists in the gut. Accompanying these results, the authors demonstrate that gut dysbiosis coincides with the meningitis.

      Strengths:

      The genomics work is meticulously done, utilizing long-read sequencing.

      The cohort of isolates is the largest to be sampled to date.

      The findings are significant, illuminating the presence of a gut reservoir in infants with repeating infection.

      We agree

      Weaknesses:

      Although the cohort of isolates is large, there is no global representation, entirely omitting Africa and the Americas. This is acknowledged by the group in the discussion, however, it would make the study much more compelling if there was global representation.

      We agree. In the Discussion we state this is likely a reflection of the difficulty in acquiring isolates causing neonatal meningitis, in particular from countries with limited microbiology and pathology resources.

      Reviewer #3 (Public Review):

      Summary:

      In this manuscript, Schembri et al performed a molecular analysis by WGS of 52 E. coli strains identified as "causing neonatal meningitis" from several countries and isolated from 1974 to 2020. Sequence types, virulence genes content as well as antibiotic-resistant genes are depicted. In the second part, they also described three cases of relapse and analysed their respective strains as well as the microbiome of three neonates during their relapse. For one patient the same E. coli strain was found in blood and stool (this patient had no meningitis). For two patients microbiome analysis revealed a severe dysbiosis.

      Major comments:

      Although the authors announce in their title that they study E. coli that cause neonatal meningitis and in methods stipulate that they had a collection of 52 NMEC, we found in Supplementary Table 1, 29 strains (therefore most of the strains) isolated from blood and not CSF. This is a major limitation since only strains isolated from CSF can be designated with certainty as NMEC even if a pleiocytose is observed in the CSF. A very troubling data is the description of patient two with a relapse infection. As stated in the text line 225, CSF microscopy was normal and culture was negative for this patient! Therefore it is clear that patient without meningitis has been included in this study.

      We have reviewed the clinical data for our 52 NMEC isolates, noting that for some of the older Finish isolates we relied on previous publications. This data is shown in Table S1. To address the Reviewer’s comment, we have added the following text to the methods section (new text underlined).

      ‘The collection comprised 42 isolates from confirmed meningitis cases (29 cultured from CSF and 13 cultured from blood) and 10 isolates from clinically diagnosed meningitis cases (all cultured from blood).’

      Patient 2 was initially diagnosed with meningitis based on a positive blood culture in the presence of CSF pleocytosis (>300 WBCs, >95% polymorphs). We understand there may be some confusion with reference to a relapsed infection, which we now more accurately describe as recrudescent invasive infection in the revised manuscript.

      Another major limitation (not stated in the discussion) is the absence of clinical information on neonates especially the weeks of gestation. It is well known that the risk of infection is dramatically increased in preterm neonates due to their immature immunity. Therefore E. coli causing infection in preterm neonates are not comparable to those causing infection in term neonates notably in their virulence gene content. Indeed, it is mentioned that at least eight strains did not possess a capsule, we can speculate that neonates were preterm, but this information is lacking. The ages of neonates are also lacking. The possible source of infection is not mentioned, notably urinary tract infection. This may have also an impact on the content of VF.

      We agree. In the Discussion we now note the following (new text underlined):

      ‘… we did not have clinical data on the weeks of gestation for all patients, and thus could not compare virulence factors from NMEC isolated from preterm versus term infants.’

      Submission to Medrxiv, a requirement for review of our manuscript at eLife, necessitated the removal of some patient identifying information, including precise age and detailed medical history.

      Sequence analysis reveals the predominance of ST95 and ST1193 in this collection. The high incidence of ST95 is not surprising and well previously described, therefore, the concluding sentence line 132 indicating that ST95 E. coli should exhibit specific virulence features associated with their capacity to cause NM does not add anything. On the contrary, the high incidence of ST1193 is of interest and should have been discussed more in detail. Which specific virulence factors do they harbor? Any hypothesis explaining their emergence in neonates?

      We compared the virulence factors of ST95 and ST1193 and summarized this information in Figure 4. We also discussed how the K1 polysialic acid capsule in ST95 and ST1193 could contribute to the emergence of these STs in NM. Specifically, we stated the following: ‘We speculate this is due to the prevailing K1 polysialic acid capsule serotype found in ST95 and the newly emerged ST1193 clone [22, 37] in combination with other virulence factors [15, 28, 29] (Figure 4) and the immature immune system of preterm infants.’

      In the paragraph depicted the VF it is only stated that ST95 contained significantly more VF than the ST1193 strains. And so what? By the way "significantly" is not documented: n=?, p=?

      We compared the prevalence of known virulence factors between ST95 and ST1193, and showed that ST95 strains in our collection contained significantly more virulence factors than the ST1193 strains. The P-value and the statistical test used were included in Supplementary Figure 3. To address the reviewers concern, we have now also added this to the main manuscript text as follows (new text underlined):

      ‘Direct comparison of virulence factors between ST95 and ST1193, the two most dominant NMEC STs, revealed that the ST95 isolates (n = 20) contained significantly more virulence factors than the ST1193 isolates (n=9), p-value < 0.001, Mann-Whitney two-tailed unpaired test (Supplementary Table 1, Supplementary Figure 3).’

      The complete sequence of 18 strains is not clear. Results of Supplementary Table 2 are presented in the text and are not discussed.

      NMEC isolates that were completely sequenced in this study are indicated in bold and marked with an asterisk in Figure 1. This information is indicated in the figure legend and was provided in the original submission. All information regarding genomic island composition and location, virulence genes and plasmid and prophage diversity is included in Supplementary Table 2. This information is highly descriptive and thus we elected not to include it as text in the main manuscript.

      46 years is a very long time for such a small number of strains, making it difficult to put forward epidemiological or evolutionary theories. In the analysis of antibiotic resistance, there are no ESBLs. However, Ding's article (reference 34) and other authors showed that ESBLs are emerging in E. coli neonatal infection. These strains are a major threat that should be studied, unfortunately, the authors haven't had the opportunity to characterize such strains in their manuscript.

      We agree 46 years is a long time-span. The study by Ding et al examined 56 isolates comprised of 25 different STs isolated in China from 2009-2015, with ST1193 (n=12) and ST95 (n=10) the most common. Our study examined 58 isolates comprised of 22 different STs isolated in seven different geographic regions from 1974-2020, with ST1193 (n=9) and ST95 (n=20) the most common. Thus, despite differences in the geographic regions from which isolates in the two studies were sourced, there are similarities in the most common STs identified. The fact that we observed less antibiotic resistance, including a lack of ESBL genes, in ST1193 is likely due to the different regions from which the isolates were sourced. We acknowledged and discussed the potential of ST1193 harbouring multidrug resistance including ESBLs in our manuscript as follows:

      ‘Concerningly, the ST1193 strains examined here carry genes encoding several aminoglycoside-modifying enzymes, generating a resistance profile that may lead to the clinical failure of empiric regimens such as ampicillin and gentamicin, a therapeutic combination used in many settings to treat NM and early-onset sepsis [35, 36]. This, in combination with reports of co-resistance to third-generation cephalosporins for some ST1193 strains [22, 34], would limit the choice of antibiotic treatment.’

      Second part of the manuscript:

      The three patients who relapsed had a late neonatal infection (> 3 days) with respective ages of 6 days, 7 weeks, and 3 weeks. We do not know whether they are former preterm newborns (no term specified) or whether they have received antibiotics in the meantime.

      As noted above, patient ages were not disclosed to comply with submission to Medrxiv, a requirement for review of our manuscript at eLife.

      Patient 1: Although this patient had a pleiocytose in CSF, the culture was negative which is surprising and no explanation is provided. Therefore, the diagnosis of meningitis is not certain. Pleiocytose without meningitis has been previously described in neonates with severe sepsis. Line 215: no immunological abnormalities were identified (no details are given).

      We respectfully disagree with the reviewer. The diagnosis of meningitis is made unequivocally by the presence of a clearly abnormal CSF microscopy (2430 WBCs) and an invasive E. coli from blood culture. This does not seem controversial to the authors. We had believed it unnecessary to include this corroborative evidence, but have added the following to support our assertion:

      ‘The child was diagnosed with meningitis based on a cerebrospinal fluid (CSF) pleocytosis (>2000 white blood cells; WBCs, low glucose, elevated protein), positive CSF E. coli PCR and a positive blood culture for E. coli (MS21522).’

      On the contrary, the authors are surprised by the statement that CSF pleocytosis occurs in neonatal sepsis ‘without meningitis’ and do not know of any definitions of neonatal meningitis that are not tied to the presence of a CSF pleocytosis. Furthermore, the later isolation of E. coli from the CSF during the relapsed infection re-enforces the initial diagnosis.

      Patient 2: This patient had a recurrence of bacteremia without meningitis (line 225: CSF microscopy was normal and culture negative!). This case should be deleted.

      In a similar vein to the previous comment, we respectfully assert that this patient has clear evidence of meningitis (330 WBCs in the CSF, taken 24h after initiation of antibiotic treatment). In this case, molecular testing was not performed as, under the principle of diagnostic stewardship, it was not considered necessary by the clinical microbiologists and treating clinicians following the culture of E. coli in the bloodstream. We agree that this is not a case of recurrent meningitis, but our intention was to highlight the recrudescence of an invasive infection (urinary sepsis requiring admission to hospital and intravenous antibiotics) which we hypothesise has arisen from the intestinal reservoir. We did not state that all patients suffered from relapsed meningitis.

      Despite this, to address this reviewers concern, we have changed all reference to ‘relapsed infection’ to now read ‘recrudescent invasive infection’ in the revised manuscript.

      Patient 3: This patient had two relapses which is exceptional and may suggest the existence of a congenital malformation or a neurological complication such as abscess or empyema therefore, "imaging studies" should be detailed.

      This patient underwent extensive imaging investigation to rule out a hidden source. This included repeated MRI imaging of head and spine, CT imaging of head and chest, USS imaging of abdomen and pelvis and nuclear medicine imaging to detect a subtle meningeal defect and CSF leak. All tests were normal, and no abscess or empyema found.

      We have modified the text to include this information:

      Text in original submission: ‘Imaging studies and immunological work-up were normal.’

      New text in revised manuscript (underlined): ‘Extensive imaging studies including repeated MRI imaging of the head and spine, CT imaging of the head and chest, ultrasound imaging of abdomen and pelvis, and nuclear medicine imaging did not show a congenital malformation or abscess. Immunological work-up did not show a known primary immunodeficiency. At two years of age, speech delay is reported but no other developmental abnormality.’

      The authors suggest a link between intestinal dysbiosis and relapse in three patients. However, the fecal microbiomes of patients without relapse were not analysed, so no comparison is possible. Moreover, dysbiosis after several weeks of antibiotic treatment in a patient hospitalized for a long time is not unexpected. Therefore, it's impossible to make any assumption or draw any conclusion. This part of the manuscript is purely descriptive. Finally, the authors should be more prudent when they state in line 289 "we also provide direct evidence to implicate the gut as a reservoir [...] antibiotic treatment". Indeed the gut colonization of the mothers with the same strain may be also a reservoir (as stated in the discussion line 336). Finally, the authors do not discuss the potential role of ceftriaxone vs cefotaxime in the dysbiosis observed. Ceftriaxone may have a major impact on the microbiota due to its digestive elimination.

      We addressed the limitations of our study in the Discussion, including that we did not have access to urine or stool samples from the mother of the infants that suffered recrudescence, and thus cannot rule out mother-to-child transmission as a mechanism of reinfection. We have now added that we did not have clinical data on the weeks of gestation for all patients, and thus could not compare virulence factors from NMEC isolated from preterm versus term infants. The limitations of our study are summarised as follows in the Discussion (new text underlined):

      ‘This study had several limitations. First, our NMEC strain collection was restricted to seven geographic regions, a reflection of the difficulty in acquiring strains causing this disease. Second, we did not have access to a complete set of stool samples spanning pre- and post-treatment in the patients that suffered NM and recrudescent invasive infection. This impacted our capacity to monitor E. coli persistence and evaluate the effect of antibiotic treatment on changes in the microbiome over time. Third, we did not have access to urine or stool samples from the mother of the infants that suffered recrudescence, and thus cannot rule out mother-to-child transmission as a mechanism of reinfection. Finally, we did not have clinical data on the weeks of gestation for all patients, and thus could not compare virulence factors from NMEC isolated from preterm versus term infants.’

    1. Author Response

      The following is the authors’ response to the original reviews.

      Public Reviews:

      Reviewer #1 (Public Review):

      Summary:

      Shibl et al., studied the possible role of dicarboxylate metabolite azelaic acid (Aze) in modulating the response of different bacteria, it was used as a carbon source by Phycobacter and possibly toxic for Alteromonas. The experiments were well conducted using transcriptomics, transcriptional factor coexpression networks, uptake experiments, and chemical methods to unravel the uptake, catabolism, and toxicity of Aze on these two bacteria. They identified a putative Aze TRAP transporter in bacteria and showed that Aze is assimilated through fatty acid degradation in Phycobacter. Meanwhile, in Alteromonas it is suggested that Aze inhibits the ribosome and/or protein synthesis, and that efflux pumps shuttles Aze outside the cytoplasm. Further on, they demonstrate that seawater amended with Aze selects for microbes that can catabolize Aze.

      Major strengths:

      The manuscript is well written and very clear. Through the combination of gene expression, transcriptional factor co-expression networks, uptake experiments, and chemical methods Shibl et al., showed that Aze has a different response in two bacteria.

      Major weakness:

      There is no confirmation of the Aze TRAP transporters through mutagenesis.

      Impact on the field:

      Metabolites exert a significant influence on microbial communities in the ocean, playing a crucial role in their composition, dynamics, and biogeochemical cycles. This research highlights the intriguing capacity of a single metabolite to induce contrasting responses in distinct bacterial species, underscoring its role in shaping microbial interactions and ecosystem functions.

      We thank the reviewer for their comments on the paper and we appreciate their suggestion to confirm the activity of Aze TRAP transporters through mutagenesis. We agree that this would be a valuable addition to the study, and we mention in the text that “Despite numerous attempts, our efforts to knock-out azeTSL in Phycobacter failed.”

      The success rate of mutagenesis experiments is often low and time-consuming. There are a few reasons why our knock-out experiments with Phycobacter have not been successful. Despite using several modified protocols for electroporation, no Phycobacter colonies grew on the antibiotic plate. We then tried the homologous recombination approach for conjugation but were not successful in selecting for Phycobacter cells, even when grown in high salinity conditions that favor Phycobacter and disfavor the carrier, E. coli . While we would love to include a mutagen to confirm the function of this cluster, the task seems to be unattainable at the moment .

      Reviewer #2 (Public Review):

      This study explores the breadth of effects of one important metabolite, azelaic acid, on marine microbes, and reveals in-depth its pathway of uptake and catabolism in one model bacterial strain. This compound is known to be widely produced by phytoplankton and plants, and to have complex effects on associated microbiomes.

      This work uses transcriptomics to assay the response of two strains that show contrasting responses to the metabolite: one catabolizes the compound and assimilates the carbon, while the other shows growth inhibition and stress response. A highly induced TRAP transporter, adjacent to a previously identified regulator, is inferred to be the specific uptake system for azelaic acid. However the transport function was not directly tested via genetic or biochemical methods. Nevertheless, this is a significant finding that will be useful for exploring the distribution of azelaic acid uptake capability across metagenomes and other bacteria.

      The authors use pulse-chase style metabolomics experiments to beautifully demonstrate the fate of azelaic acid through catabolic pathways. They also measure an assimilation rate per cell, though it remains unclear how this measured rate relates to natural systems. The metabolomics approach is an elegant way to show carbon flux through cells, and could serve as a model for future studies.

      The study seeks to extend the results from two model strains to complex communities, using seawater mesocosm experiments and soil/Arabidopsis experiments. The seawater experiments show a community shift in mesocosms with added azelaic acid. However, the mechanisms for the shift were not determined; further work is necessary to demonstrate which community members are directly assimilating the compound vs. benefitting indirectly or experiencing inhibition. In my opinion the soil and Arabidopsis experiments are quite preliminary. I appreciate the authors' desire to broaden the scope beyond marine systems, but I believe any conclusions regarding different modes of action in aquatic vs terrestrial microbial communities are speculative at this stage.

      This work is a nice illustration of how we can begin to tease apart the effects of chemical currencies on marine ecosystems. A key strength of this work is the combination of transcriptomics and metabolomics methods, along with assaying the impacts of the metabolite on both model strains of bacteria and whole communities. Given the sheer number of compounds that probably play critical roles in community interactions, a key challenge for the field will be navigating the tradeoffs between breadth and depth in future studies of metabolite impacts. This study offers a good compromise and will be a useful model for future studies.

      We thank the reviewer for their thoughtful comments on the manuscript. We appreciate their feedback on the breadth of effects of Aze on marine microbes, and their insights into the strengths and limitations of our study.

      We agree that the specific mechanisms underlying community-level shifts in seawater mesocosm experiments with added Aze are not yet fully understood and we believe such work is beyond the scope of this paper and warrants an in-depth study of its own. This can perhaps be conducted at a larger scale by using a combination of meta-omics and targeted enrichment to identify the community members directly assimilating Aze, as well as those that are benefitting indirectly or experiencing inhibition.

      We also agree that the soil and Arabidopsis experiments are exploratory. However, we believe that these experiments are a valuable first step in highlighting the potential for Aze to have different modes of action in aquatic versus terrestrial microbial communities. Our interest in contrasting bacterial molecular responses in terrestrial plant rhizospheres and marine algal phycospheres stems from the fact that both environments share similar molecules and related bacteria, yet exhibit significantly different evolutionary histories and fluid dynamic profiles (Seymour et al 2017, Nature Microbiol ). Although more is known about Aze in Arabidopsis than phytoplankton, there are still gaps in this knowledge. For example, recent work has shown that Aze and derivatives can be secreted into soil (Korenblum et al 2020, PNAS ), but whether Aze directly influences microbial communities in soil as we have shown in seawater has not been explored. Thus, we feel our preliminary experiments in soil are important to provide such a distinction with seawater. Additional studies in these systems to further investigate the importance of Aze, which were beyond the scope of this current work, would be quite beneficial.

      Reviewer #1 (Recommendations For The Authors):

      General comments:

      A complete supplemental file of differentially expressed genes should be provided in the supplemental. Please add tables with the entire DESeq output for Aze additions in the genomes of Phycobacter (0.5 and 8 h) and Alteromonas (0.5 h). While it makes sense to focus the paper on Aze related genes, the full dataset should be made available in a more curated form than just the raw reads in the SRA.

      We thank the reviewer for this suggestion. We have included three more sheets in Supplementary Table 1 file where readers can find the entire DESeq outputs of Phycobacter (0.5 and 8 h) and Alteromonas (0.5 h) experiments.

      Specific comments:

      • L82 indicates the TRAP transporter for Aze. Looking at the table for gene expression of Phycobacter there are 26 significantly enriched transport genes at 0.5 h other than the putative Aze TRAP transporter. Even though the TRAP transporter is likely transporting Aze, it would be good to let the readers know that other transporters showed transcript enrichment.

      Thank you for this helpful comment. We modified the sentence accordingly to read as follows: “Among 26 enriched transporter genes in our dataset, a C 4 - dicarboxylate tripartite ATP-independent periplasmic (TRAP) transporter substrate-binding protein (INS80_RS11065) was the most and the third most upregulated gene in Phycobacter grown on Aze at 0.5 and 8 hours, respectively.”

      • Figure 1: There are many genes enriched from -1 to 1. Is there a cut off, p-val (can you add it to the caption)? It would be good to have a dashed line or something that indicates the -1 and 1 log2 fold change in the figure.

      We thank the reviewer for this suggestion. We added the following sentence to the legend of Fig. 1: “Genes were considered DE with a p -adjusted value of < 0.05 and a log2 fold-change of ≥ ±0.50.”

      • Supplementary tables: Add a title on all the supplementary tables. It's hard to tell what each one of the tables means without looking at the text and content of each tables.

      A short descriptive title is now added to all supplementary tables.

      • Not sure if it matters, though Table S1 was not available in the attached files, though it is in the complete pdf.

      Table S1 is now in the attached files and the DESeq output has been added to it as suggested in the general comment above.

      Reviewer #2 (Recommendations For The Authors):

      Here I offer some more specific suggestions and comments on the methods and presentation.

      I recommend being careful throughout with the language regarding conclusions. For instance, the study does not directly demonstrate the activity of the TRAP transporter (as mentioned above), and does not directly demonstrate that the bacteria that increase in abundance in the mesocosm experiments are actually assimilating azelaic acid.

      We thank the reviewer for this comment. We agree that further studies are required to get definitive answers regarding the direct activity of the transporter genes and direct assimilation of Aze by bacteria in the mesocosm. These complex experiments would require establishing a reproducible workflow for knocking out genes and further isotope labeling experiments to track Aze assimilation in a natural setting. To that end, we were keen on using language throughout the manuscript indicating that transporter activity is putative. We went through the manuscript again to make sure it was clear that the transporter activity is putative at this time and is not confirmed. For the mesocosms, we cannot rule out that the changes in community structure is not due to other factors besides Aze. We have added this sentence in the discussion of the mesocosm experiments to indicate that the observed changes in microbial community cannot be directly attributed to Aze activity and may be a byproduct of other mechanisms.

      Additionally, I find the soil and plant experiments to be very preliminary, and would personally recommend removing them from the manuscript. This is of course the authors' choice, but I find they detract from an otherwise more solid story. I wonder whether 16 hours was sufficient to see community changes and whether adding azelaic acid directly into the plant is necessary or relevant. The study does not measure any plant immune responses so I caution against drawing conclusions about the mechanism. It seems the connection to plant immunity was already shown in the literature, in which case I'm not sure whether these experiments presented here really add anything new to the paper.

      We thank the reviewer for these comments. Our 16-hour sampling time point (similar to the seawater experiment) represents an overnight incubation period that should allow sufficient change in the natural microbial composition yet avoids the long-term succession of microbes with high metabolic capacities that may outcompete the rest of the community at long incubation periods. Deciding on this length of incubation was also informed by the uptake rate of Aze and its influence on either bacteria assimilating it as a carbon source or being inhibited by it.

      Since no significant changes were observed in the soil, it was necessary to test the hypothesis that the plant host might be indirectly influencing the rhizosphere microbial communities by infiltrating A. thaliana leaves with Aze. As the reviewer mentions, the association between Aze and plant immunity was previously shown; however, the overall influence on the microbial community has not been fully explored yet. The soil and plant experiments were meant to serve an exploratory purpose and we find them necessary to keep in the manuscript as a first step in comparing the mode of action of Aze within marine and terrestrial ecosystems. They are by no means the answer to what role Aze plays in soil systems, but rather they are the starting point. We hope that our results encourage some readers to investigate similar common metabolites to further elucidate the molecular underpinnings of microbial modulation in both environments.

      Regarding the transcriptomics data, I am not clear on why the "expression ratio" -- i.e. the fraction of pathway genes that were differentially abundant -- was used. I would not expect all transcripts in a pathway to behave the same way in response to a perturbation, due to variation in half-life/stability, post-transcriptional and post-translational regulation, etc. I recommend removing the expression ratio (right panel) from Figure 1. The left panel shows the data more clearly and more directly.

      We thank the reviewer for their insight and we agree that not all transcripts in a pathway behave the same way. However, we find the expression ratio panel visually informative to highlight the importance of a pathway in response to Aze, taking into consideration the total number of key genes involved in a pathway. For example, despite the larger number of DE genes associated with the Amino Acid Metabolism & Degradation pathway compared to the Fatty Acid Degradation pathway, the expression ratio for the former in each transcriptome is lower than its Fatty Acid Degradation counterpart, indicating that the response of key fatty acid degradation genes to Aze is more pronounced. We have qualified the reasons for including expression ratios in Figure 1 legend.

      Overall I enjoyed reading the manuscript and applaud the authors on a nice contribution to this important field.

    1. Author Response

      The following is the authors’ response to the previous reviews.

      Public Reviews:

      Reviewer #1 (Public Review):

      Peng et al develop a computational method to predict/rank transcription factors (TFs) according to their likelihood of being pioneer transcription factors--factors that are capable of binding nucleosomes--using ChIP-seq for 225 human transcription factors, MNase-seq and DNase-seq data from five cell lines. The authors developed relatively straightforward, easy to interpret computational methods that leverage the potential for MNase-seq to enable relatively precise identification of the nucleosome dyad. Using an established smoothing approach and local peak identification methods to estimate positions together with identification of ChIP-seq peaks and motifs within those peaks which they referred to as "ChIP-seq motifs", they were able to quantify "motif profiles" and their density in nucleosome regions (NRs) and nucleosome depleted regions (NDRs) relative to their estimated nucleosome dyad positions. Using these profiles, they arrived at an odd-ratio based motif enrichment score along with a Fisher's exact test to assess the odds and significance that a given transcription factor's ChIP-seq motifs are enriched in NRs compared to NDRs, hence, its potential to be a pioneer transcription factor. They showed that known pioneer transcription factors had among the highest enrichment scores, and they could identify a number of relatively novel pioneer TFs with high enrichment scores and relatively high expression in their corresponding cell line. They used multiple validation approaches including (1) calculating the ROC-AUC and Matthews correlation coefficient (MCC) and generating ROC and precision-recall curves associated with their enrichment score based on 32 known pioneer TFs among their 225 TFs which they used as positives and the remaining TFs (among the 225) as negatives; (2) use of the literature to note that known pioneer TFs that acted as key regulators of embryonic stem cell differentiation had a highest enrichment scores; (3) comparison of their enrichment scores to three classes of TFs defined by protein microarray and electromobility shift assays (1. strong binder to free and nucleosomal DNA, 2. weak binder to free and nucleosomal DNA, 3. strong binding to free but not nucleosomal DNA); and (4) correlation between their calculated TF motif nucleosome end/dyad binding ratio and relevant data from an NCAP-SELEX experiment. They also characterize the spatial distribution of TF motif binding relative to the dyad by (1) correlating TF motif density and nucleosome occupancy and (2) clustering TF motif binding profiles relative to their distance from the dyad and identifying 6 clusters.

      The strengths of this paper are the use of MNase-seq data to define relatively precise dyad positions and ChIP-seq data together with motif analysis to arrive at relatively accurate TF binding profiles relative to dyad positions in NRs as well as in NDRs. This allowed them to use a relatively simple odds ratio based enrichment score which performs well in identifying known pioneer TFs. Moreover, their validation approaches either produced highly significant or reasonable, trending results.

      The weaknesses of the paper are relatively minor, and the authors do a good job describing the limitations of the data and approach.

      Reviewer #2 (Public Review):

      In this study, the authors utilize a compendium of public genomic data to identify transcription factors (TF) that can identify their DNA binding motifs in the presence of nuclosome-wrapped chromatin and convert the chromatin to open chromatin. This class of TFs are termed Pioneer TFs (PTFs). A major strength of the study is the concept, whose premise is that motifs bound by PTFs (assessed by ChIP-seq for the respective TFs) should be present in both "closed" nucleosome wrapped DNA regions (measured by MNase-seq) as well as open regions (measured by DNAseI-seq) because the PTFs are able to open the chromatin. Use of multiple ENCODE cell lines, including the H1 stem cell line, enabled the authors to assess if binding at motifs changes from closed to open. Typical, non-PTF TFs are expected to only bind motifs in open chromatin regions (measured by DNaseI-seq) and not in regions closed in any cell type. This study contributes to the field a validation of PTFs that are already known to have pioneering activity and presents an interesting approach to quantify PTF activity.

      For this reviewer, there were a few notable limitations. One was the uncertainty regarding whether expression of the respective TFs across cell types was taken into account. This would help inform if a TF would be able to open chromatin. Another limitation was the cell types used. While understandable that these cell types were used, because of their deep epigenetic phenotyping and public availability, they are mostly transformed and do not bear close similarity to lineages in a healthy organism. Next, the methods used to identify PTFs were not made available in an easy-to-use tool for other researchers who may seek to identify PTFs in their cell type(s) of interest. Lastly, some terms used were not define explicitly (e.g., meaning of dyads) and the language in the manuscript was often difficult to follow and contained improper English grammar.

      Reviewer #3 (Public Review):

      Peng et al. designed a computational framework for identifying pioneer factors using epigenomic data from five cell types. The identification of pioneer factors is important for our understanding of the epigenetic and transcriptional regulation of cells. A computational approach toward this goal can significantly reduce the burden of labor-intensive experimental validation.

      The authors have addressed my previous comments.

      The main issue identified in this re-review is based on the authors' additional experiments to investigate the reproducibility of the pioneer factors identified in the previously analysis that anchored on H1 ESCs.

      The additional analysis that uses the other four cell types (HepG2, HeLa-S3, MCF-7, and K562) as anchors reveals the low reproducibility/concordance and high dependence on the selection of anchor cell type in the computational framework. In particular, now several stem cell related TFs (e.g. ESRRB, POU5F1) are ranked markedly higher when H1 ESC is not used as the anchor cell type as shown in Supplementary Figure 5.

      Of note, the authors have now removed the shape labels that denote Yamanaka factors in Figure 2c (revised manuscript) that was presented in the main Figure 2a in the initial submission. The NFYs and ESRRB labels in Supplementary 4a are also removed and the boxplot comparing NFYs and ESRRB with other TF are also removed in this figure. Removing these results effectively hides the issues of the computational framework we identified in this revision. Please justify why this was done.

      In summary, these new results reveal significant limitations of the proposed computational framework for identifying pioneer factors. The current identifications appear to be highly dependent on the choice of cell types.

      Response: We thank all reviewers for their thoughtful and constructive comments and suggestions, which helped us to strengthen our paper. Following the suggestions, we have further addressed the reviewer’s comments and the detailed responses are itemized below.

      Reviewer #1 (Recommendations For The Authors):

      The following few minor mistakes/discrepancies/omissions should be addressed:

      1. In Figure 3, the Nucleosome Occupancy curves and legend are orange and the Binding Motif Profiles are blue; however, the y-axis label for Nucleosome occupancy profile is blue, and the y-axis label of Binding motif profile is orange. The colors seem to be switched, or I'm missing something.

      Response: We thank the reviewer for pointing it out. We have changed the colors to make it consistent.

      1. The text at the bottom of p. 11 of the main manuscript describing Supplementary Fig. 5 states: "If we repeat our anaysis by redefining differentially open regions as those closed in differentiated cell lines and open in H1 embryonic cell line, then ESSRB and Yamanaka pioneer transcription factor POU5F1 (OCT4) showed significantly higher enrichment scores (Supplementary Figure 5)." However, Supplementary Fig. 5 legend states: "Enrichment analysis of different TFs using the differentially open from one cell line (shown in the title) and conserved open regions from other four cell lines.". These two descriptions of the differential chromatin criteria used in the analysis don't appear to match. The description in the text is the one that makes much more sense to me. The legend should be written a little more clearly and reflect the statement in the main text. One can see from the cut and paste the "analysis" is also misspelled.

      Response: We have rewritten the legend of Supplementary Figure 5 to make it clear and consistent. The misspelling has also been corrected.

      1. It might be helpful to add that a random classifier would yield a constant precision recall (PR) curve (as a function of Recall) with the Precision = P/(P+N) or the fraction of positives for all plotted PR curves which in the case of Fig. 2a is 32/225 = 0.142, for example.

      Response: We thank the reviewer for the suggestions. We have added the fraction of positives for Figure 2.

      1. On p. 17 line 513, the authors refer to "Supplementary 7, 9 and 13". I'm assuming it's "Supplementary Tables 7, 9 and 13".

      Response: It has been corrected.

      1. On p. 18 line 539, "essays" should be "assays".

      Response: It has been corrected.

      Reviewer #2 (Recommendations For The Authors):

      We are satisfied with the revisions in this version of the manuscript.

      Reviewer #3 (Public Review):

      The main issue identified in this re-review is based on the authors' additional experiments to investigate the reproducibility of the pioneer factors identified in the previously analysis that anchored on H1 ESCs.

      The additional analysis that uses the other four cell types (HepG2, HeLa-S3, MCF-7, and K562) as anchors reveals the low reproducibility/concordance and high dependence on the selection of anchor cell type in the computational framework. In particular, now several stem cell related TFs (e.g. ESRRB, POU5F1) are ranked markedly higher when H1 ESC is not used as the anchor cell type as shown in Supplementary Figure 5.

      Of note, the authors have now removed the shape labels that denote Yamanaka factors in Figure 2c (revised manuscript) that was presented in the main Figure 2a in the initial submission. The NFYs and ESRRB labels in Supplementary 4a are also removed and the boxplot comparing NFYs and ESRRB with other TF are also removed in this figure. Removing these results effectively hides the issues of the computational framework we identified in this revision. Please justify why this was done.

      In summary, these new results reveal significant limitations of the proposed computational framework for identifying pioneer factors. The current identifications appear to be highly dependent on the choice of cell types.

      Response: We would like to clarify that our enrichment score used for TF classification, defined by Equation 3, is expected to be cell-type specific. The value of the enrichment score is modulated by a number of factors beyond the property of a TF to act as a PTF, such as the abundance of a given TF in a given cell line, cell type-specific nucleosome binding maps and interactions with other TFs. Thus, it is expected that the enrichment scores calculated for the same TF in different cell lines should be quantitatively different. Following the initial suggestion of Reviewer 3, we have diversified our analysis by using different cell lines as anchors. This analysis showed that most PTFs that we identified could be confirmed based on different cell lines, when comparing the relative enrichment scores within each cell line. On the other hand, it is not expected that the values of enrichment scores of a given TF should be similar across different cell lines.

      Regarding a specific comment about ESRRB and POU5F1, these TFs are known pioneer factors with roles in reprogramming of somatic cells into induced pluripotent stem cells and suppressing cell differentiation. They have the ability to open closed chromatin regions in the differentiated cell lines. Therefore, if we redefine the differentially open regions as those closed in differentiated cell lines and open in H1 embryonic cell line, these pioneer factors are expected to have high enrichment scores. Indeed, our new results validated the roles of these PTFs in cell reprogramming. As mentioned above, their enrichment scores in different cell lines are not expected to be the same.

      We also would like to clarify that no results were removed during the update of the figures, and all modifications of the manuscript following the suggestions of the reviewers were only made to improve the figures and make them clearer and the message more straightforward.

    1. Author Response

      The following is the authors’ response to the previous reviews.

      We would like to thank the Editors and Reviewers for their additional comments and constructive feedback on our manuscript. We have made minor adjustments to the figures and texts based on their suggestions, including improved images in Figure 1 and correction of figure labels.

      Reviewer #1 (Public Review):

      In their previous paper (Lari et al, 2019; Azra Lari Arvind Arul Nambi Rajan Rima Sandhu Taylor Reiter Rachel Montpetit Barry P Young Chris JR Loewen Ben Montpetit (2019) A nuclear role for the DEAD-box protein Dbp5 in tRNA export eLife 8:e48410.) as well as in the current manuscript the authors states that Dbp5 is involved in the export of tRNA that is independent of and parallel to Los1. They state that Dbp5 binds to the tRNA independent of known tRNA export proteins. The obtained conclusion is both intriguing and innovative, since it suggests that there are other variables, beyond the ones previously identified as tRNA factors, that might interact with Dbp5 to facilitate the export process. In order to find out additional factors aiding this process the authors may employ total RNA-associated protein purification (TRAPP) experiments ( Shchepachevto et al., 2019; Shchepachev V, Bresson S, Spanos C, Petfalski E, Fischer L, Rappsilber J, Tollervey D. Defining the RNA interactome by total RNA-associated protein purification. Mol Syst Biol. 2019 Apr 8;15(4):e8689. doi: 10.15252/msb.20188689. PMID: 30962360; PMCID: PMC6452921) to identify extra factors involved in conjunction with Dbp5. The process elucidates hitherto uninvestigated tRNA export components that function in conjunction with Dbp5.

      Author Response: We greatly appreciate this suggestion and agree with the reviewer that identification of the composition of the export competent Dbp5 containing tRNA complex is a critical next step for understanding the mechanism of Dbp5 mediated tRNA export, which will form the foundation of a future investigation in the laboratory and warrants its own study.

      Reviewer #1 (Public Review):

      Various reports suggest that eukaryotic translation elongation factor 1 eEF1A is involved tRNA export Bohnsack et al., 2002 (Bohnsack MT, Regener K, Schwappach B, Saffrich R, Paraskeva E, Hartmann E, Görlich D. Exp5 exports eEF1A via tRNA from nuclei and synergizes with other transport pathways to confine translation to the cytoplasm. EMBO J. 2002 Nov 15;21(22):620515. doi: 10.1093/emboj/cdf613. PMID: 12426392; PMCID: PMC137205), Grosshans etal., 2002; Grosshans H, Hurt E, Simos G. An aminoacylation-dependent nuclear tRNA export pathway in yeast. Genes Dev. 2000 Apr 1;14(7):830-40. PMID: 10766739; PMCID: PMC316491). The presence of mutations in eEF1A has been seen to hinder the nuclear export process of all transfer RNAs (tRNAs). eEF1A has been shown to interact with Los1 aiding in tRNA export. The authors can also explore the crosstalk between Dbp5 and eEF1A in this study. Additionally, suppressor screening analysis in dbp5R423A , los1∆dbp5R423A los1∆msn∆dbp5R423A could shed more light on this.

      Author Response: Thank you for this suggestion and raising an important possible role for Dbp5 in eEF1A mediated tRNA export. Based on more recent investigation of eEF1A function in tRNA export (PMID: 25838545), it is likely that eEF1A functions in re-export of charged tRNAs specifically (likely in conjunction with Msn5). The current manuscript has largely focused on the role of Dbp5 in pre-tRNA export, but a more careful mechanistic characterization of Dbp5 and re-export will be conducted in follow-up studies given the physical interaction between Dbp5 and spliced tRNAs we previously reported. Similarly, suppressor screens with the Dbp5 and los1Δmsn5Δ mutants will likely be a useful tool in identifying additional tRNA export factors and we thank the reviewer for this suggestion.

      Reviewer #1 (Public Review):

      The addition of Gle1 is potentially novel but it's unclear why the authors didn't address the potential involvement of IP6.

      Author Response: The text has been revised to highlight the importance of InsP6 in Gle1 mediated activation of Dbp5. This includes referencing InsP6 throughout the manuscript during discussions of Gle1 activation of Dbp5 and lines 401-404 discussing the potential role for the small molecule in regulating mRNA and tRNA export in different cellular contexts (e.g., stress and disease).

    1. Author Response

      The following is the authors’ response to the original reviews.

      Public Reviews:

      Reviewer #1 (Public Review):

      Weaknesses:

      Reviewer comment: Here, the activity of SWIFT molecules was assessed in single cell types with or without BKlotho expression. Ultimately, the ability of the SWIFT molecules to activate Wnt signaling in a cell type-specific manner should be tested in the context of many different cellular identities that express BKlotho to different extents. It would be good to demonstrate that Wnt activation by SWIFT correlates with BKlotho expression level in multiple cell types - such data would strengthen the claim of cell-type specificity.

      Response: We agree with the reviewer’s comment, it would be interesting to correlate the signaling level to the expression levels of βKlotho. The tools to carry out such an experiment are not currently available, as this would require a culture system that allows efficient growth of different cell types, and the reagents to detect both the receptor protein levels of βKlotho (as well as FZD/LRP) and signaling levels. We did perform an additional experiment to further support this targeting approach using a 2-layered (transwell) cell culture system. In this culture system, one cell type is put into the top well and the other cell type is put into the bottom well. Molecules to be tested were added to the media which is shared and freely diffuse across the two cell types. In this 2-layer cell system, the results again demonstrate the ability of the SWIFT molecules to specifically induce signaling only in βKlotho expressing hepatoma Huh7 cells and not in non-targeting HEK293 cells. This new data is included as Fig. 3H in the revised manuscript.

      Reviewer comment: The study does not address whether the targeted cells express FGFR1c/2c/3c and whether the FGF21 full-length moiety or the 39F7 IgG moiety of SWIFT molecules could unintentionally activate FGF signaling in these cells.

      Response: We agree with the reviewer’s comment. The receptor βKlotho and its binders (FGF21 and 39F7) were used to test the BRAID/SWIFT concept, the effects on FGF signaling were not the focus of the current study. This comment has now been added to the revised manuscript in the discussion. Inclusion of αGFP controls in the study also suggests the observed reporter activity in the targeted scenario is unlikely caused indirectly by any unexpected FGF signaling.

      Reviewer #2 (Public Review):

      Weaknesses:

      Reviewer comment: The study shows the SWIFT approach works in vitro using cell lines, primary human hepatocytes, and human intestinal organoids, but it lacks an in vivo animal model or clinical validation. The applicability of this approach to therapy is still unknown.

      Response: The βKlotho binder, 39F7, is specific to the human receptor and does not cross react with mouse. Unfortunately, we are not able to test these SWIFTs in a mouse model.

      Reviewer comment: The success of SWIFT depends on the presence and expression of the bridging receptor (βKlotho) on target cells. The approach may fail if the target receptor is not expressed or available.

      Response: We agree with the reviewer, the SWIFT molecules should not induce signaling on cells where bridging receptor is not expressed, therefore, achieving target cell specificity. As pointed out by the reviewer, finding the right bridging receptor on the target cell is critical.

      Reviewer #1 (Recommendations For The Authors):

      Reviewer comment 1: One way to further validate the specificity of SWIFT molecules would be to apply them to a mix of different cell types and quantify BKlotho level and Wnt reporter activity at the single cell level, potentially through imaging, FACS, or transcriptomics.

      Response: We agree with the reviewer’s comment, it would be interesting to correlate the signaling level to the expression levels of βKlotho. The tools to carry out such an experiment are not currently available, as this would require a culture system that allows efficient growth of different cell types, and the reagents to detect both the receptor protein levels of βKlotho (as well as FZD/LRP) and signaling levels. We did perform an additional experiment to further support this targeting approach using a 2-layered (transwell) cell culture system. In this culture system, one cell type is put into the top well and the other cell type is put into the bottom well. Molecules to be tested were added to the media which is shared and freely diffuse across the two cell types. In this 2-layer cell system, the results again demonstrate the ability of the SWIFT molecules to specifically induce signaling only in βKlotho expressing hepatoma Huh7 cells and not in non-targeting HEK293 cells. This new data is included as Fig. 3H in the revised manuscript.

      Reviewer comment 2: The experiments presented demonstrate activation of one signaling pathway in cells specifically expressing a target receptor rather than demonstrating "the feasibility of combining different signaling pathways" as stated in the abstract.

      Response: We thank the reviewer for pointing this out and have adjusted the sentence accordingly.

      Reviewer comment 3: What are the biological consequences of activating Wnt signaling in cells expressing BKlotho and why is that of interest? Could these biological outcomes be used as an additional, perhaps more consequential, readout for SWIFT activity?

      Response: βKlotho is expressed on several different cell types that include hepatocytes, WAT, BAT, and certain regions in CNS. Our studies here focused on the WNT signaling pathway, and βKlotho/FGF21/39F7 receptor ligand system was used to illustrate the BRAID/SWIFT cell targeting concept. Whether these molecules may additional modulate endocrine FGF signaling and metabolic homeostasis, and whether there is any interaction between βKlotho and Wnt signaling pathways could be the subject of future studies. This is now added to the revised manuscript.

      Reviewer comment 4: The manuscript would benefit from a careful review to improve wording and address grammatical errors.

      Response: We thank the reviewer for this suggestion, and we have now had another round of language editing by a professional service.

      Reviewer #2 (Recommendations For The Authors):

      Reviewer comment 1. The expression of KLB in Fig 3G and 4B seems way too low and may not represent the amount on the cell surface. Did the authors validate the expression on the cell surface?

      Response: In both figures we have displayed the expression level normalized to housekeeping gene ACTB. Housekeeping genes such as ACTB can be among the most abundant transcripts in a cell. The observation that KLB mRNA detection is below ACTB mRNA levels is expected and we would argue not too low. The average real-time PCR cycle threshold (Ct) for KLB in Huh7 and primary hepatocytes was 18 and 24 respectively. To avoid any confusion, we have now displayed the expression data normalized to HEK293 and intestinal organoids as a fold difference in a new Figure 3G and 4B.

      Comment 2. Fig 3G needs statistical significance.

      Response: We thank the reviewer for highlighting this, we have now included the statistical analysis in an updated Figure 3G.

    1. Author Response

      The following is the authors’ response to the original reviews.

      Public Reviews:

      Reviewer #1 (Public Review):

      In the manuscript there is not much comparison between the crystal and cryoEM structures provided, and on inspection they appear to be very similar. The crystal structures also reveal parts of the CC domains in Las1, which is not present in the cryoEM structures. It is interesting the CC domains in Sc and Cj are quite different as illustrated in Figure 4B. They also seem to be somewhat disconnected from the rest of the complex (more so for Cj), even though that's not apparent in Figures 2-4. Despite this, it would be very useful to show the cryoEM densities when describing the catalytic site and C-terminal domain interactions, for example, as this can be very useful to increase confidence in the model and proposed mechanisms.

      We thank the reviewer for this suggestion. We have added a figure (Figure 5- Figure supplement 3) to show cryo-EM and crystal densities of key amino acids, when describing the catalytic site and C-terminal domain interactions. In analyzing the interaction between Las1 and Grc3, we have also provided additional comparisons of the crystal structure and the cryo-EM structure (Figure 5, Figure 5-figure supplement 1, 2 and 3, Figure 6, Figure 6-figure supplement 1).

      The description of the complex as a butterfly is engaging, and from a certain angle it can be made to look as such; this was also described previously in (Pillon et al., 2019, NSMB) for the same complex from a different organism (Ct). However, it is a bit misleading, because the complex is actually C2 symmetric. Under this symmetry, the 'body' would consist of two 'heads' one pointing up, one down facing towards the back, and one wing would have its back toward the viewer, the other the front. The structures presented here in Sc and Cj seem quite similar to the previous structure of the same complex in Ct, though the latter was only solved with cryoEM, and was also lacking the structure of the CC domain in Las1.

      We thank the reviewer for pointing out this issue. We have re-wrote these sentences and changed the butterfly description of Las1-Grc3 complex in the revised manuscript.

      For the model suggested in Figure 8, perhaps in the 'weak activity' state, the LCT in Las1 could still be connected to Grc3, via the LCT, rather than disconnected as shown. This could facilitate faster assembly of the 'high activity' state. The complex is described as 'compact and stable', but from the structure and this image, it appears more dynamic, which would serve its purpose and the illustrated model better. The two copies of HEPN appear to have more connective area, meaning they are indeed more likely to remain assembled in the 'weak activity' state. On the other hand, HEPN in one protein appears to have less binding surface with PNK in Grc3, and even less so with the CTD (both PNK and CTD being from the other associated protein), meaning these bindings could release easily to form the 'weak activity' state.

      There is also the potential to speculate that the GCT is bound to HEPN near the catalytic area in the 'weak activity' state. The reduced activity when the GCT residues are replaced by Alanine could then be explained by the complex not being able to assemble as quickly upon binding of the substrate, as it could if the GCT remained bound, rather than by a conformational change that it induces upon binding. The conformational change is also likely to be influenced by the combined binding of PNK and CTD in the assembled state, which also contact HEPN, rather than by GCT alone.

      We thank the reviewer for this suggestion. We have revised our model in the new Figure 8 of our revised manuscript. We apologize for the un-clarity description of the 'weak activity' state in our model. In fact, we believe that Las1 is in a "weakly activity" state before binding to Grc3 and is in a "highly activity" state when it forms a complex with Grc3. We strongly agree that the Las1-Grc3 complex is more dynamic than compact and stable, so it is easy to change its active state. We have changed our description and revised our model in the revised manuscript.

      When comparing the structure of the HEPN domain in the lone Las1 protein to the structure of Las1-HEPN in the Las1-Grc3 complex, it is mentioned that 'large conformational changes are observed'. These could be described a bit better. The conformational change is ~3-4Å C-alpha RMSD across all ~150 residues in the domain (~90 residues forming a stable core that only changes by ~1Å). There is also a shift in the associated HEPN domain in Las1B domain compared to the bound HEPN in the Las1-Grc3 complex, as shown in Figure 7D: ~1Å shift and ~12degrees rotation. This does point to the conformation of HEPN changing upon complex formation, as does the relative positions of the HEPN domains in Las1A and Las1B. The conformational change and relative shift could indeed by key for the catalysis of the substrate as mentioned.

      We thank the reviewer for this great suggestion. We have replaced the sentence describing the conformational changes in our revised manuscript.

      Overall, the structures presented should be very useful in further study of this system, even though the exact dynamics and how the substrate is bound are aspects that are perhaps not fully clear yet. The addition of the structures of the CC domain in two different organisms and the Las1 HEPN domain (not in complex with Grc3) as new structural information should allow for increasing our understanding of the overall complex and its mechanism.

      We thank this reviewer for these encouraging comments, which helped us with greatly improving our manuscript.

      Reviewer #2 (Public Review):

      In this manuscript, Chen et al. determined the structural basis for pre-RNA processing by Las1-Grc3 endoribonuclease and polynucleotide kinase complexes from S. cerevisiae (Sc) and C. jadinii (Cj). Using a robust set of biochemical assays, the authors identify that the sc- and CjLas1-Grc3 complexes can cleave the ITS2 sequence in two specific locations, including a novel C2' location. The authors then determined X-ray crystallography and cryo-EM structures of the ScLas1-Grc3 and CjLas1-Grc3 complexes, providing structural insight that is complimentary to previously reported Las1-Grc3 structures from C. thermophilum (Pillon et al., 2019, NSMB). The authors further explore the importance of multiple Las1 and Grc3 domains and interaction interfaces for RNA binding, RNA cleavage activity, and Las1-Grc3 complex formation. Finally, evidence is presented that suggests Las1 undergoes a conformational change upon Grc3 binding that stabilizes the Las1 HEPN active site, providing a possible rationale for the stimulation of Las1 cleavage by Grc3.

      Several of the conclusions in this manuscript are supported by the data provided, particularly the identification and validation of the second cleavage site in the ITS2. However, several aspects of the structural analysis and complimentary biochemical assays would need to be addressed to fully support the conclusions drawn by the authors.

      We thank the reviewer for the positive comments.

      • There is a lack of clarity regarding the number of replicates performed for the biochemical experiments throughout the manuscript. This information is critical for establishing the rigor of these biochemical experiments.
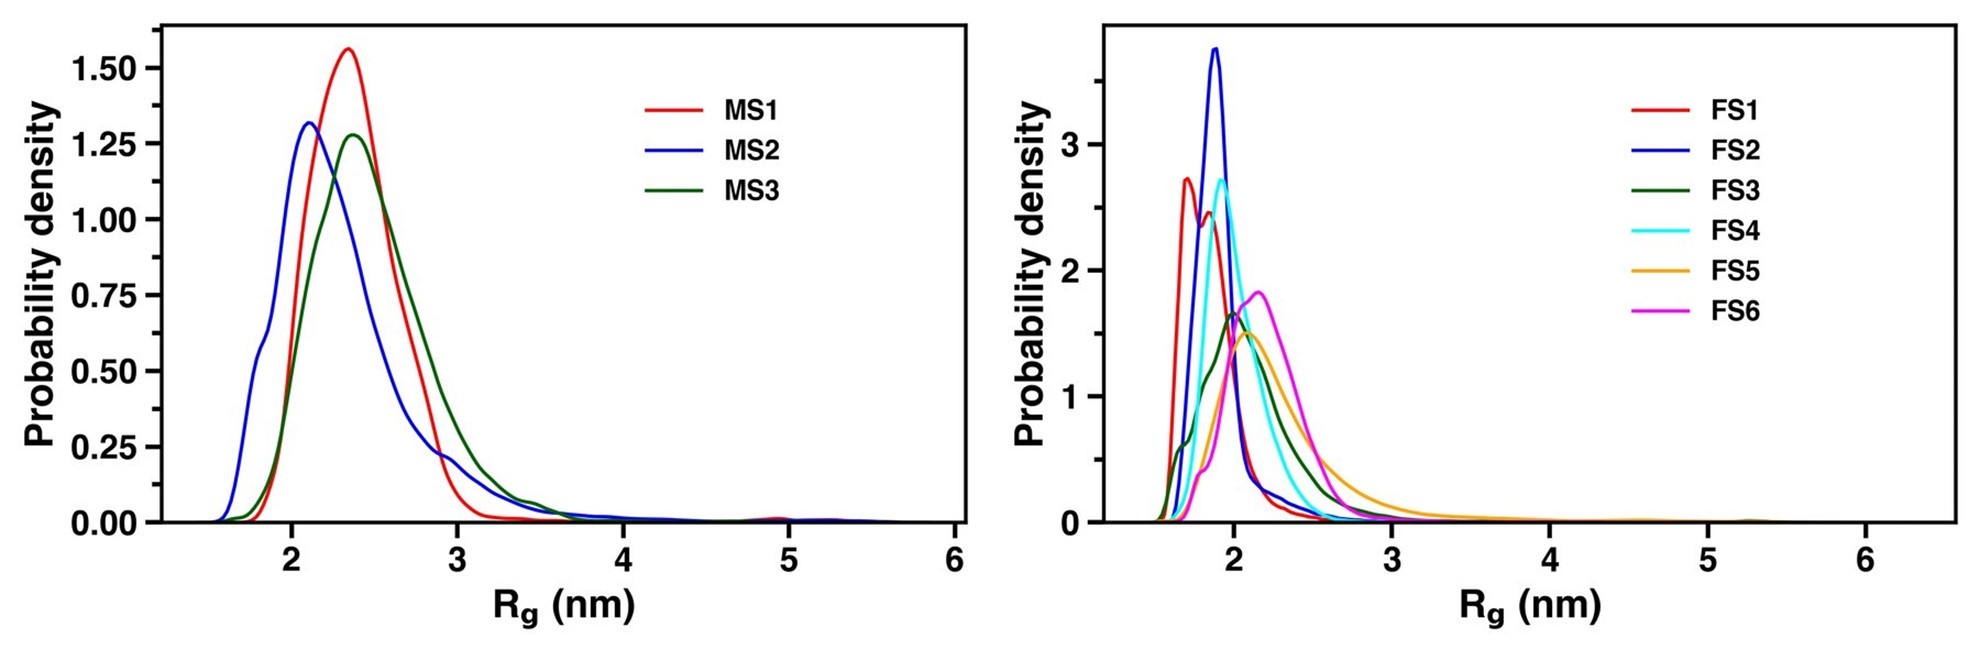
      We apologize for not providing the detailed information on the number of replicates of biochemical experiments. All the biochemical experiments were repeated three times. We have provided this information in the figure legends.

      • The authors conclude that Rat1-Rai1 can degrade the phosphorylated P1 and P2 products of ITS2 (lines 160-162, Figure 1H). However, the data in Fig. 1H shows complete degradation of 5'Phos-P2 and 5'Phos-P4 of ITS2, while the P1 and 5'Phos-P3 fragments remain in-tact. Additional clarification for this discrepancy should be provided.

      We thank the reviewer for pointing out this issue. “phosphorylated P1 and P2 products” should be “phosphorylated P2 and P4 products”. We have corrected this clerical error. In addition, we have also provided an explanation for why phosphorylated P3 product show only partial degradation. We suspect that P3 product may be too short to completely degrade.

      • The authors determined X-ray crystal structures of the ScLas1-Grc3 (PDB:7Y18) and CjLas1-Grc3 (PDB:7Y17) complexes, which represents the bulk of the manuscript. However, there are major concerns with the structural models for ScLas1-Grc3 (PDB:7Y18) and CjLas1-Grc3 (PDB:7Y17). These structures have extremely high clashscores (>100) as well as a significant number of RSRZ outliers, sidechain rotamer outliers, bond angle outliers, and bond length outliers. Moreover, both structures have extensive regions that have been modeled without corresponding electron density, and other regions where the model clearly does not fit the experimental density. These concerns make it difficult to determine whether the structural data fully support several of the conclusions in the manuscript. A more careful and thorough reevaluation of the models is important for providing confidence in these structural conclusions.

      We thank the reviewer for pointing out this issue. We have used the cryo-EM datasets to further validate our conclusions of the manuscript. We analyzed the active site of Las1-Grc3 complex and the interactions between Las1 and Grc3 using the cyro-EM structures and presented new figures (Figure 5- Figure supplement 1, Figure 5- Figure supplement 2, Figure 5- Figure supplement 3, Figure 6- Figure supplement 1) in our revised manuscript. Both the refinement and validation statistical parameters of the cryo-EM datasets are within a reasonable range (Table 2), which will provide confidence for our structure conclusions. The X-ray crystal structures of ScLas1-Grc3 (PDB:7Y18) and CjLas1-Grc3 (PDB:7Y17) complexes has high calshscores and many outliers, which is mainly due to the great flexibility of Las1-Grc3 complex, especially the CC domain of Las1. We have improved our crystal structure models with better refinement and validation of statistical parameters. The clashscores of ScLas1-Grc3 complex and CjLas1-Grc3 complex are 25 and 45, respectively. There are no rotamer outliers and C-beta outliers to report for both ScLas1-Grc3 complex and CjLas1-Grc3 complex.

      • The presentation of the cryo-EM datasets is underdeveloped in the results section drawing and the contribution of these structures towards supporting the main conclusions of the manuscript are unclear. An in-depth comparison of the structures generated from X-ray crystallography and cryo-EM would have greatly strengthened the structural conclusions made for the ScLas1-Grc3 and CjLas1-Grc3 complexes.

      We thank the reviewer for this suggestion. We have performed structural comparisons between X-ray crystal structure and cyro-EM structure in analyzing the active site of Las1-Grc3 complex and the interactions between Las1 and Grc3 (Figure 5- Figure supplement 1, Figure 5- Figure supplement 2, Figure 6- Figure supplement 1). We have also added a figure (Figure 5- Figure supplement 3) to show cryo-EM and crystal densities of the Las1 active site as well as the key amino acids for Las1 and Grc3 interactions. These comparisons and densities have greatly strengthened our structural conclusions.

      • The authors conclude that truncation of the CC-domain contributes to Las1 IRS2 binding and cleavage (lines 220-222, Fig. 4C). However, these assays show that internal deletion of the CC-domain alone has minimal effect on cleavage (Fig 4C, sample 3). The loss in ITS2 cleavage activity is only seen when truncating the LCT and LCT+CC-domain (Fig 4C, sample 2 and 4, respectively). Consistently, the authors later show that Las1 is unable to interact with Grc3 when the LCT domain is deleted (Fig. 6 and Fig. 6-figure supplement 2). These data indicate the LCT plays a critical role in Las1-Grc3 complex formation and subsequent Las1 cleavage activity. However, it is unclear how this data supports the stated conclusion that the CC-domain is important for LasI cleavage.

      Our EMSA data shows that the CC domain contributes to the binding of ITS2 RNA (Figure 4D), suggesting that the CC domain may play a role of ITS2 RNA stabilization in the Las1 cutting reaction. The in vitro RNA cleavage assays (Figure 4C) indicate that the LCT is important for Las1 cleavage because it plays a critical role in the formation of the Las1-Grc3 complex. Compared with LCT, the CC domain, although not particularly important for Las1 cutting ITS2, still has some influence (Fig 4C, sample 1 and 3, sample 2 and 4,). Therefore, we conclude that the CC domain may mainly play a role in the stabilization of ITS2 RNA, thereby enhancing ITS2 RNA cleavage.

      • The authors conclude that the HEPN domains undergo a conformational change upon Grc3 binding, which is important for stabilization of the Las1 active site and Grc3-mediated activation of Las1. This conclusion is based on structural comparison of the HEPN domains from the CjLas1-Grc3 complex (PDB:7Y17) and the structure of the isolated HEPN domain dimer (PDB:7Y16). However, it is also possible that the conformational changes observed in the HEPN domain are due to truncation of the Las1 CC and CGT domains. A rationale for excluding this possibility would have strengthened this section of the manuscript.

      We thank the reviewer for pointing out this issue. We agree that the complete Las1 structure information is helpful in illuminating the conformational activation of the Las1 by Grc3. We screened about 1200 crystallization conditions with full-length Las1 proteins, but ultimately did not obtain any crystals, probably due to flexibility. The CC domain exhibits a certain degree of flexibility, which has not been observed in the structure obtained from electron microscopy. The LCT is involved in binding to the CTD domain of Grc3. The coordination of the active center of HEPN domains by LCT and CC domains is unlikely due to the limited nuclease activity observed in full-length Las1. The conformational changes of the active center are essential for HEPN nuclease activation. Our structure shows that the GCTs of Grc3 interact with the active residues of Las1 HEPN domains, which probably induce conformational changes in the active center of the HEPN domain to activate Las1. Of course, we cannot exclude the possibility that truncation of the Las1 CC and LCT domains will result in little conformational change in the HEPN domains. We have explained this possibility in our revised manuscript.

      Reviewer #1 (Recommendations For The Authors):

      1) It would be very useful to show the cryoEM densities when describing the catalytic site and C-terminal domain interactions.

      The new Figure 5-figure supplement 2 have showed the Cyro-EM densities of the catalytic site of ScLas1 and the C-terminal domain of ScGrc3.

      2) "ScLas1 cleaves the 33-nt ITS2 at C2 site to theoretically generate a 10-nt 5′-terminal product and a 23-nt 3′-terminal product (Figure 1A). Our merger data shows that the final 5′-terminal and 3′-terminal product bands are at nearly the same horizontal position on the gel (Figure 1B), indicating that they are similar in size." These two sentences seem to contradict, i.e. 10-nt and 23-nt are similar in size even though they are different lengths?

      We apologize for the contradiction in these two sentences mentioned above. We have re-wrote these two sentences in the revised manuscript.

      3) We observed four cleavage bands of approximately 23-nt (P2), 14-nt (P3), 10-nt (P1), and 9-nt (P4) in length (Figure 1C). "

      Figure 1C. The bands show 23 nt, 22 nt, 21nt, 14 nt, 13nt, and 11nt, so this text does not seem to describe the figure.

      We have re-wrote this sentence in the revised manuscript.

      4) "We obtained similar cleavage results with a longer 81-nt ITS2 RNA substrate 6 (Figure 1D, E). " Figure 1D,E. The lengths in Figure 1E do not correspond to all bands in Figure 1E, e.g. the 13 nt band, though the others do, e.g. 14 nt, 30nt, 37nt, etc.

      In order to better evaluate the size of the cut product, we used an RNA marker as a comparison. The RNA marker will have more bands than the cleavage products. To further confirm the cleavage site of C2′, we also mapped the cleavage sites of the 81-nt ITS2 using reverse transcription coupling sequencing methods (Figure 1F).

      5) In Figure 3, domains are colored different but it's hard to know which are different proteins.

      We have added a diagram in Figure 3 to show the Las1-Grc3 complex structure, and it is now clear how Las1 and Grc3 are assembled into a tetramer.

      6) Line 267. "we screened a lot of crystallization conditions with full-length Las1 proteins" How many? Rough numbers ok, but 'a lot' is not very informative

      We have provided the approximate numbers of crystallization conditions in our revised manuscript.

      Reviewer #2 (Recommendations For The Authors):

      1) The authors missed an excellent opportunity to compare and contrast the ScLas1-Grc3 and CjLas1-Grc3 complex structures presented here with that of the previously determined CtLas1-Grc3 structure (Pillon et al., 2019, NSMB). For example, His130 in the ScLas1-Grc3 complex active site adopts a similar conformation to His142 in the TcLas1-Grc3 complex active site (Pillon et al., 2019, NSMB). Interestingly, the analogous His134 active site residue in the CjLas1-Grc3 adopts an alternative (maybe inactive) conformation. This observation could provide a structural rationale for the activation of scLas1 and TcLas1 by Grc3, while also providing a rationale for the fairly weak activation of CjGrc3 by CjGrc3.

      We thank the reviewer for this suggestion. We have performed structural comparisons between ScLas1-Grc3, CjLas1-Grc3 and CtLas1-Grc3 complexes, especially the Las1 nuclease active center. We added two figures (Figure7-figure supplement 3A and 3B) in the revised manuscript to contrast and highlight the conformational differences of active amino acids in active centers between ScLas1-Grc3, CtLas1-Grc3 and CjLas1-Grc3. These structural comparisons provide stronger evidence that further reinforces the conclusions of our manuscript.

      2) Can the authors speculate as to whether the structural data can provide any insight into how the Las1-Grc3 may cleave both C2 and C2' positions in the ITS2 RNA? This commentary would further strengthen the discussion section of the manuscript.

      We thank the reviewer for this suggestion. We have provided a speculation in the discussion section of the revised manuscript.

      We think that the structural data may provide some insight into how Las1-Grc3 complex cleaves ITS2 RNA at both C2 and C2' positions. The Las1-Grc3 tetramer complex has one nuclease active center and two kinase active centers. The nuclease active center consists of two Las1 molecules in a symmetric manner, while the kinase active center consists of only one Grc3 molecule. The ITS2 RNA is predicted to form a stem-loop structure. The symmetrical nuclease active center recognizes the stem region of ITS2 RNA and makes it easy to perform C2 and C2' cleavages on both sides of the stem. C2 and C2' cleavage products are further phosphorylated by two Grc3 kinase active centers, respectively.

      3) The method used for the plasmid generation, expression, and purification of the Las1 truncations and the Las1 and Grc3 point mutants should be provided in the methods section.

      The method used for the plasmid generation, expression, and purification of the Las1 truncations and the Las1 and Grc3 point mutants have be provided in the methods section.

      4) The exact amino acid cutoffs for the truncated forms of Las1 used for the biochemical assays in Fig. 4 should be provided.

      We have provided the exact amino acid cutoffs for the truncated forms of Las1 in the figure legend of Figure 4C.

      5) The models associated with the cryo-EM datasets should be deposited in the PDB.

      The models associated with the Cryo-EM datasets have be deposited in the PDB with the following accession codes: 8J5Y (ScLas1-Grc3 complex), and 8J60 (CjLas1-Grc3 complex).

      6) Lines 232-234: Arg129 should be changed to His134.

      We have corrected it.

      7) Figure 5B: the bottom half of the HEPN active site has been labeled incorrectly. The labels should be Arg129, His130, and His134 (from left to right).

      We have corrected it.

      8) Line 252: "multitudinous" should be changed to "multiple."

      We have corrected it.

    1. Author Response

      We are grateful to the reviewers for their thorough and thoughtful critiques, including their agreement on the significant value of this dataset. We intend to respond to their comments in full with a revision in the near future. However, we would like to make an initial comment at this stage. A key concern raised by the reviewers was that the analyses described do not adequately support the claim that "movie-watching data can identify retinotopic regions" (quoted from R2, similar sentiment expressed by R1). To be clear, we agree with this assessment. Our primary aim was not to identify visual areas with movie-watching data. Rather, our focus was on how movies can reveal fine-grained organization in infant visual cortex, which would support their potential utility for understanding the development of dynamic visual processing. To demonstrate this potential, we tested and found that maps of visual activity generated from movies are significantly similar to those generated by a retinotopy task. Nevertheless, we did not intend to argue that movie-based maps are sufficiently accurate to replace task-based retinotopic maps when defining visual areas, nor did we test this possibility. We accept that this point was unclear in the original manuscript and will make edits to avoid this miscommunication. We also plan to incorporate the reviewers’ many other helpful recommendations, including addressing concerns about the clarity of the presentation and double dipping, as well as adding several new analyses we hope will provide greater confidence in the findings and interpretation.

    1. Author Response

      The following is the authors’ response to the original reviews.

      We would like the reviewers for their positive and useful comments. Below please find our answers to the issues raised.

      Reviewer #1 (Public Review):

      Overall, the experiments are well-designed and the results of the study are exciting. We have one major concern, as well as a few minor comments that are detailed in the following.

      Major:

      1) The authors suggest that "Visuomotor experience induces functional and structural plasticity of chandelier cells". One puzzling thing here, however, is that mice constantly experience visuomotor coupling throughout life which is not different from experience in the virtual tunnel. Why do the authors think that the coupled experience in the VR induces stronger experience-dependent changes than the coupled experience in the home cage? Could this be a time-dependent effect (e.g. arousal levels could systematically decrease with the number of head-fixed VR sessions)? The control experiment here would be to have a group of mice that experience similar visual flow without coupling between movement and visual flow feedback.

      Either change would be experience-dependent of course, but having the "visuomotor experience dependent" in the title might be a bit strong given the lack of control for that. We would suggest changing the pitch of the manuscript to one of the conclusions the authors can make cleanly (e.g. Figure 4).

      Although the plasticity is induced by the visuomotor experience in the tunnel, we agree that we do not know what aspect of the repeated exposure to the virtual tunnel caused the plasticity. We cannot rule out that it was the exposure to the visual stimuli alone that caused it. Therefore, we rephrased sentences that suggested that it was the coupling between visual stimuli and motor behavior that was responsible for the plasticity. We also changed the title to “Experience Shapes Chandelier Cell Function and Structure in the Visual Cortex”.

      We do believe that training the mice in the virtual tunnel does significantly increase experience with coupled visuomotor activity, though. In their home cage, mice are mostly active in the dark and there is litle space to run.

      Minor:

      2). "ChCs shape the communication hierarchy of cortical networks providing visual and contextual information." We are not sure what this means.

      We thank the reviewer for helping to raise clarity and we rephrased this sentence to: “…ChCs may establish a hierarchical relationship among cortical networks.”

      3) "respond to locomotion and visuomotor mismatch, indicating arousal-related activity" This is not clear. We think we understand what the authors mean but would suggest rephrasing.

      Agreed. We rephrased this sentence to: "...respond to events that are known to increase arousal levels, such as locomotion and visuomotor mismatch.”

      4) 'based on morphological properties revealed that 87% (287/329) of labeled neurons were ChCs" Please specify the morphological properties used for the classification somewhere in the methods.

      We added that the neurons were positioned at the border of L1 and L2 and had a dendrite reaching into layer 1.

      5) We may have missed this - in the patch clamp experiment (Fig.1 H-K), please add information about how many mice/slices these experiments were performed in.

      We have added the information to the legend of Fig. 1.

      6) "These findings suggest that the rabies-labeled L1-4 neurons providing monosynaptic input to ChCs are predominantly inhibitory neurons". We are not sure this conclusion is warranted given the sparse set of neurons labelled and the low number of cells recorded in the paired patch experiment. We would suggest properly testing (e.g. stain for GABA on the rabies data) or rephrasing.

      We weakened the statement to: “These findings suggest that the rabies-labeled L1-4 neurons providing monosynaptic input to ChCs may include many inhibitory neurons.”

      7) Figure 2E. A direct comparison of dF/F across different cell types can be subject to a problematic interpretation. The transfer function from spikes to calcium can be different from cell type to cell type. Additionally, the two cell populations have been marked with different constructs (despite the fact that it's the same GECI) further reducing the reliability of dF/F comparisons. We would recommend using a different representation here that does not rely on a direct comparison of dF/F responses (e.g. like the "response strength" used in Figure 3B). Assuming calcium dynamics are different in ChCs and PyCs - this similarity in calcium response is likely a coincidence.

      We have removed the quantification in this figure.

      8) If ChCs are more strongly driven by locomotion and arousal, then it's a bit counterintuitive that at the beginning of the visual corridor when locomotion speed consistently increases, the activity of ChCs consistently decreases. This does not appear to be driven by suppression by visual stimuli as it is present also in the first and last 20cm of the tunnel where there are no visual stimuli. How do the authors explain this?

      We do believe that this is suppression driven by visual stimuli. Although on average the strongest visual suppression happens between 20-80 cm, neurons that have their receptive fields toward the center of the visual field will already respond to the stimuli before the mouse reaches the 20 cm location of the tunnel. In addition, although the visual stimuli are the strongest sensory inputs, the background of the visual part of the tunnel has a black and white noise patern, which might already mildly suppress ChC activity. Both arguments are supported by the observation that the visual PyCs (V-PyCs, blue line) in Fig. 4D are already activated at the beginning of the tunnel and that the activity of V-PyCs matches well with the suppression of ChC activity.

      9) The authors mention that "ChC responses underwent sensory-evoked plasticity during the repeated visual exposure, even though the visual stimuli were different from those encountered during training in the virtual tunnel". How would this work? And would this mean all visual responses are reduced? What is special about the visual experience in the virtual tunnel? It does not inherently differ from visual experience in the home cage, given that the test stimuli (full field gratings) are different from both.

      As mentioned in our answer to point 1, the exposure to visual stimuli is strongly increased since, firstly, they are presented during the dark phase when the mice are most active and, secondly, they do not get these types of visual inputs in their home cage.

      10) Just as a point to consider for future experiments: For the open-loop control experiments, the visual flow is constant (20cm/s) - ideally, this would be a replay of the running speed the mouse previously generated to match statistics.

      We agree with this point and will implement replay of earlier sessions in future experiments.

      11) We would recommend specifying the parameters used for neuropil correction in the methods section.

      This is described on page 24, under “preprocessing”. We also refer to the analysis package (Spectral Segmentation - SpecSeg) in which the neuropil correction as used by us here is explained in more detail.

      12) If we understand correctly, the F0 used for the dF/F calculation is different from that used for division. Why is this?

      We apologize for this mistake, which was based on an older version of the software. We have now corrected this in the revised manuscript.

      13) Authors compare neuronal responses using "baseline-corrected average". Please specify the parameters of the baseline correction (i.e. what is used as baseline here).

      In the revised version we have now beter explained this in the methods, page 24, under “Passive Sessions”.

      Reviewer #2 (Public Review):

      Summary:

      Seignete et al. investigated the potential roles of axo-axonic (chandelier) cells (ChCs) in a sensory system, namely visual processing. As introduced by the authors, the axo-axonic cell type has remained (and still is) somehow mysterious in its function. Seignete and colleagues leveraged the development of a transgenic mouse line selective for ChC, and applied a very wide range of techniques: transsynaptic rabies tracing, optogenetic input activation, in vitro electrophysiology, 2-photon recording in vivo, behavior and chemogenetic manipulations, to precisely determine the contribution of ChCs to the primary visual cortex network.

      The main findings are 1) the identification of synaptic inputs to ChC, with a majority of local, deep layer principal neurons (PN), 2) the demonstration that ChC is strongly and synchronously activated by visual stimuli with low specificity in naive animals, 3) the recruitment of ChC by arousal/visuomotor mismatch, 4) the induction of functional and structural plasticity at the ChC-PN module, and, 5) the weak disinhibition of PNs induced by ChCs silencing. All these findings are strongly supported by experimental data and thoroughly compared to available evidence.

      Strengths:

      This article reports an impressive range of very demanding experiments, which were well executed and analyzed, and are presented in a very clear and balanced manner. Moreover, the manuscript is well- writen throughout, making it appealing to future readers. It has also been a pleasure to review this article.

      In sum, this is an impressive study and an excellent manuscript, that presents no major flaws.

      Notably, this study is one of the first studies to report on the activities and potential roles of axo-axonic cells in an active, integrated brain process, beyond locomotion as reported and published in V1. This type of research was much awaited in the fields of interneuron and vision research.

      Weaknesses:

      There are no fundamental weaknesses; the later mainly concern the presentation of the main results. The main weakness may be that the different sections appear somehow disconnected conceptually.

      Additionally, some parts deserve a more in-depth clarification/simplification of concepts and analytic methods for scientists outside the subfield of V1 research. Indeed, this paper will be of key interest to researchers of various backgrounds.

      Reviewer #3 (Public Review):

      Summary:

      The authors set out to characterize the anatomical connectivity profile and the functional responses of chandelier cells (ChCs) in the mouse primary visual cortex. Using retrograde rabies tracing, optogenetics, and in vitro electrophysiology, they found that the primary source of input to ChCs are local layer 5 pyramidal cells, as well as long-range thalamic and cortical connections. ChCs provided input to local layer 2/3 pyramidal neurons, but did not receive reciprocal connections.

      With two-photon calcium imaging recordings during passive viewing of drifting gratings, the authors showed that ChCs exhibit weakly selective visual responses, high correlations within their own population, and strong responses during periods of arousal (assessed by locomotion and pupil size). These results were replicated and extended in experiments with natural images and prediction of receptive field structure using a convolutional neural network.

      Furthermore, the authors employed a learned visuomotor task in a virtual corridor to show that ChCs exhibit strong responses to mismatches between visual flow and locomotion, locomotion-related activation (similar to what was shown above), and visually-evoked suppression. They also showed the existence of two clusters of pyramidal neurons with functionally different responses - a cluster with "classically visual" responses and a cluster with locomotion- and mismatch-driven responses (the later more correlated with ChCs). Comparing naive and trained mice, the authors found that visual responses of ChCs are suppressed following task learning, accompanied by a shortening of the axon initial segment (AIS) of pyramidal cells and an increase in the proportion of AIS contacted by ChCs. However, additional controls would be required to identify which component(s) of the experimental paradigm led to the functional and anatomical changes observed.

      Finally, using a chemogenetic inactivation of ChCs, the authors propose weak connectivity to pyramidal cells (due to small effects in pyramidal cell activity). However, these results are not unequivocally supported, as the baseline activity of ChCs before inactivation is considerably lower, suggesting a potentially confounding homeostatic plasticity mechanism might already be operating.

      Strengths:

      The authors bring a comprehensive, state-of-the-art methodology to bear, including rabies tracing, in vivo two-photon calcium imaging, in vitro electrophysiology, optogenetics and chemogenetics, and deep neural networks. Their analyses and statistical tests are sound and for the most part, support their claims. Their results are in line with previous findings and extend them to the primary visual cortex.

      Weaknesses:

      • Some of the results (e.g. arousal-related responses) are not entirely surprising given that similar results exist in other cortical areas.

      We agree that previous studies have shown arousal-related responses of ChC cells and our study confirms those findings. However, this is not the main message of the article and we present many findings that are novel.

      • Control analyses regarding locomotion paterns before and atier learning the task (Figure 5), and additional control experiments to identify whether functional and anatomical changes following task learning were due to learning, repeated visual exposure, exposure to reward, or visuomotor experience would strengthen the claims made.

      In figure 5 we excluded running trials, so locomotion paterns are unlikely to play a major role. We agree that testing what are the factors that contribute to the observed plasticity are important to investigate in future experiments.

      • The strength of the results of the chemogenetics experiment is impacted by the lower baseline activity of ChCs that express the KORD receptor. At present, it is not possible to exclude the presence of homeostatic plasticity in the network before the inactivation takes place.

      Although we do not know why there is a difference in the baseline df/f (e.g. expression levels), we consider it unlikely that expression of the KORD receptor itself without exposure to the ligand causes reduction of ChC activity. Moreover, we are not sure how homeostatic plasticity in the network would occur selectively in KORD-expressing ChCs. Finally, we do not find evidence for a relationship between lower ChC calcium signals and the effects of ChC silencing on PyC activity. We performed an additional analysis in which we correlated baseline ChC activity (before salvinorin B injection) with the effect of ChC silencing on PyC activity (post – pre) across mice, and found that this correlation was not significant (R = 0.41, p = 0.18).

      Reviewer #1 (Recommendations For The Authors):

      In the spirit of openness of the scientific discussion, all our feedback and recommendations to the authors are included in the public reviews.

      Reviewer #2 (Recommendations For The Authors):

      Most of my comments and suggestions concern the presentation of the data, to (hopefully) help and convey as clearly as possible the messages of this important article.

      Main

      The main weakness of the paper may be that the different sections appear somehow disconnected conceptually. This is particularly true for:

      -structural plasticity: how can we link this finding with the rest of the study? Are there ways to correlate this finding with physiological recordings in individual animals, or to directly test whether particular functional types of PNs (visual, non-visual) undergo plasticity at their AIS?

      This is a very interesting question that may be addressed in future experiments.

      -the indirect finding suggesting that ChC weakly inhibits PNs using chemogenetic silencing of PNs. Do chemogenetic manipulations of ChCs affect PN responses in visual paradigm and/or modify the induction of structural plasticity at the ChC-AIS connection?

      This is also a very interesting question for future work.

      Additionally, some parts would deserve a more in-depth clarification/simplification of concepts and analytic methods (OSI, DSI, MEI...) for scientists outside the subfield of V1 research. Indeed, this paper will be of key interest to researchers of various backgrounds.

      In the revised manuscript we briefly explain what an MEI is when first introduced, and introduce the abbreviations OSI and DSI at the correct location. We believe orientation and direction selectivity are well-known concepts for the audience reading this article.

      Minor

      These are discussed by order of appearance in the text.

      Abstract

      The alternative interpretation of error/mismatch negativity to explain ChC activation deserves to appear in the abstract. Arousal consistency in prediction should be in the introduction. "In mice running in a virtual tunnel, ChCs respond strongly to locomotion and halting visual flow, suggesting arousal-related activity."

      This comment holds for the end of the introduction and the beginning of the discussion, as well.

      "These findings suggest that ChCs provide an arousal-related signal to layer 2/3 pyramidal cells that may modulate their activity". This statement appears to be in contradiction with the weak effect mentioned just before. This comment holds for the end of the introduction.

      The full sentence was: “These findings suggest that ChCs provide an arousal-related signal to layer 2/3 pyramidal cells that may modulate their activity and/or gate plasticity of L2/3 PyCs in V1.” Our results show that activity of layer 2/3 pyramidal cells is modulated (albeit weakly) and it is well possible that ChCs regulate plasticity at the AIS. Therefore, we do not believe that this statement contradicts the weak direct effect of ChCs on layer 2/3 pyramidal cell activity. Therefore , we think that this statement does not contradict the weak direct effect of ChCs on layer 2/3 pyramidal cell activity.

      We changed the last sentence of the introduction to “Our findings suggest that ChCs predominantly respond to arousal related to locomotion or unexpected events/stimuli, and act to weakly modulate activity and/or gate plasticity of L2/3 PyCs in V1.”

      Introduction First paragraph

      Coming from a field outside of vision research, it is not obvious to me what has been learned from interneuron classes in the past. An example would be welcome in the introduction.

      The literature on the role of different interneuron types in visual processing and plasticity is too large to pick one or two examples. For the sake of conciseness, we have therefore provided some important references and reviews for the interested readers (references 1 to 10).

      Interneuron "subtypes" seem to refer to main classes (e.g. PV+): please rephrase accordingly (ChC being a type and PV+ ChC a subtype).

      We changed interneuron “subtypes” to “types” and left L2/3 pyramidal cell “subtypes” unchanged.

      Second paragraph

      Beyond the reversal potential of GABA-ARs at the axon initial segment, GABA may inhibit action potential generation in various conditions (Lipkin et al. 2023, DOI: 10.1523/JNEUROSCI.0605-23.2023 : should be cited).

      We added this citation.

      Fourth paragraph

      "ChCs alter the number of synapses at the AIS based on the activity of their postsynaptic targets": the concept of alteration is too vague to let the reader grasp the concept: could the authors rephrase?

      We have rephrased the sentence to:

      “…ChCs increase the number of synapses at the AIS if their postsynaptic targets are chemogenetically activated…”

      Results 1) ChCs receive input from long-range sources and L5 PyCs in V1 It is not clear how morphological identification of ChC was performed. Did dendrites and/or axons of starter cells occasionally overlap as can be expected, complicating the cell-by-cell morphological classification?

      "Most labeled neurons were located on the border between L1 and L2/3 and displayed typical ChC morphology": maybe clarify that this concerns neurons expressing eYFP-TVA?

      We assessed the location (at the border of L1 and L2) and spatial distribution of the labeled cells and whether they had a dendrite extending upwards towards into L1. We have now indicated this in the results section and clarified that these neurons express eYFP-TVA.

      -Likewise the following would benefit from clarification " This is further supported by the distributed localization of the labeled neurons": it would also help here to remind the reader of the labelling (presumably retrogradely-labeled mCherrry+ neurons).

      We have now clarified in the text that these are mCherry+ neurons labeled by the rabies virus

      2) Chandelier cells are modulated by arousal and show high correlations

      -The authors indicate that the results "(suggest) that ChCs distribute a synchronized signal during high arousal." : it would be stronger to defend this claim by showing a higher ChC-ChC correlation during "arousal" vs. baseline (i.e. analyze high arousal epochs outside of movement). It may be difficult to perform this analysis due to low fluorescence changes outside running episodes, but this should be discussed accordingly. In this respect, the title of the section is more in line with the data presented.

      We believe our statement is correct. The activity of ChCs is highly synchronized and their firing rates increase during arousal. We do not state that synchronization increases with arousal.

      -A brief explanation of DSI and OSI meaning would be nice for the audience that will definitely extend beyond vision research given the importance of this study.

      See above

      3) ChCs are weakly selective to visual information

      -I may very well miss the point, but the equivalence in response strength among cell classes (Fig3B) seems inconsistent with the wider distribution of high response strength in ChCs (Fig3C). Perhaps a graphical representation taking into account the distribution of single data points in Fig3B would help resolve this discrepancy.

      This is because in panel C the response strengths are normalized. We now also state this in the legend to avoid confusion.

      -"clearly oriented edge-like paterns with sharp ON and OFF regions": it would help if a representative example was highlighted in Figure 3F.

      The majority of L2/3 pyramidal MEIs presented in this panel show this patern.

      -It is interesting and surprising that properties of ChCs appear more distinct from those of L5 PNs than from those of L2-3 PNs (Fig 3G-J), given the fact that V1 ChCs were found by the authors to derive their inputs from V1 L5 PNs (please see comments of the discussion for this specific point).

      How ChCs respond based on L5 input depends strongly on how the connections between L5 and ChCs are organized. Similarity between responses of L5 and ChC neurons is not required.

      4) Locomotion and visuomotor mismatch drive chandelier cell activity in a virtual tunnel This is the least convincing part in terms of presentation.

      -It is unclear where/when visuomotor mismatch has been induced in the tunnel: please clarify in the text and in Fig 4B.

      We realized that the title of the paragraphs was indeed confusing. In fig. 4A-D and the first paragraph about the virtual tunnel, we do not discuss the visuomotor mismatch. This comes later, when we describe the results in Fig. 4E. The titles have been changed.

      -No result on visuomotor mismatch is reported in the text of this section, while this is presented in the subsequent section: this needs to be corrected (merge this section with the next?).

      We agree, apologies for the confusion. See above.

      -It would be interesting to further analyze responses to CS and US. Regarding the US: is water rewarding in non-water-restricted mice? This should be mentioned.

      We realized that we did not mention that the mice were water restricted during behavioral training and during the imaging sessions when mice performed the virtual tunnel task. We have now added this to the methods section. Sorry for the omission.

      -Along this line: was water sometimes omited? This would provide a complementary way to test the prediction error theory for ChC activation with an alternative modality.

      We never omited the water reward. It would be interesting to test this in a future experiment.

      5) ChCs have similar response properties as non-visual PyCs

      • It would help to explicitly mention that in Ai65 mice, only Cre and Flp+ cells express tdTomato (here Vipr2 and PV+).

      We added the following sentence: “In these mice, tdTomato was only expressed in cells expressing both Vipr2 and PV.”

      6) Visuomotor experience in the virtual tunnel induces plasticity of ChC-AIS connectivity

      • In relation to the previous section, Jung et al. (doi.org/10.1038/s41593-023-01380-x) recently reported that motor learning reduced ChC-ChC synchrony in M2. Did the author observe a similar change in ChC- ChC synchrony with visual experience/habituation to the task? If available, these data should be reported to help build a clearer picture of ChC functions in the neocortex.

      We tested this and also found reduced correlations between ChCs in trained mice vs naïve mice. We added this as text on p14 in the results section.

      • The low number of ChC boutons' appositions per AIS may be misleading: "While the average number of ChC boutons per AIS remained constant (~2-3 ChC boutons/AIS)"). It would be helpful to make it clear that these are "virally" labelled boutons, as opposed to absolute numbers, if compared with the detailed quantification of Schneider-Mizell et al, 2021 (7.4 boutons per AIS in average; doi: 10.7554/eLife.73783.).

      We added "virally labeled"

      • It may be difficult to clearly isolate boutons in light microscopic images of ChC boutons. could the authors comment on this and explain how they solved this issue (in the methods section for instance)?

      We elaborated on our definition of a bouton under confocal microscopy conditions. We also added that the analysis was performed under blinded conditions for the experimenter (i.e. the experimenter did not know whether the images came from trained or untrained mice).

      • Is there any suggestion for heterogeneity/selectivity for a subset of PNs (the distribution does not seem to show this, though)? It would be interesting to discuss this and try to link this finding to the rest of the study a bit more directly. Future work could also investigate if genetically defined PN types undergo different pre-synaptic plasticity at their AISs (e.g. work cited by the authors by O'Toole et al, 2023 doi: 10.1016/j.neuron.2023.08.015 -this reference can be updated as well, since the work has been published in the meantime).

      In our data, we did not find evidence for heterogeneity or selectivity of targeting, also not in the physiology using KORD (see below). We do agree that it is an interesting question and deserves atention in future experiments. We also updated the reference.

      7) ChCs weakly inhibit PyC activity independent of locomotion speed

      The authors state that "recent work in adult mice has reported hyperpolarizing and shunting effects in prelimbic cortex, S1 and hippocampus (18, 26, 27)": however, to my knowledge studies presented in refs 26 & 27 found reduced activity/firing of PNs upon optogenetic activation of ChCs in vivo, but did not perform intracellular recordings to assess GABA-A reversal potential at the AIS. I would like to kindly ask the authors to correct this sentence.

      If the polarity of responses is discussed, they may rather refer to the corresponding literature including Rinetti Vargas et al (doi: 10.1016/j.celrep.2017.06.030), Lipkin et al (doi: 10.1523/JNEUROSCI.0605- 23.2023), and Khirug et al (doi: 10.1523/JNEUROSCI.0908-08.2008.).

      We added the reference to Lipkin et al and changed the sentence so that it matches the references..

      • In an atempt to link findings from several parts of the article, did the authors investigate whether chemogenetic effects were different in visual vs non-visual PNs? As ChCs are functionally related to visual PNs, one might indeed speculate that these cells are synaptically connected.

      We did not find evidence for selectivity in the chemogenetic effect. We compared the chemogenetic effect to locomotion modulation (see text accompanying Fig 7.) – based on our observation that non- visual PyCs were more strongly modulated by locomotion (see Fig. 4) – but did not find any significant correlation.

      • " We first looked at the average activity of neurons in both essions.": sessions

      Thank you for noticing. We corrected this.

      Discussion

      Summary of findings

      -It would be worthwhile to include in the summary the finding of mismatch-related activity, that appears to explain more convincingly ChC activation than arousal per se (with the data available).

      We updated the summary of the discussion accordingly.

      -Moreover, the last part of the article (weak inhibition of PNs by ChCs), despite being very important, is not mentioned.

      We now mention this in the summary of the discussion (“Finally, ChCs only weakly inhibit PyCs.”)

      Discussion of findings

      -" Optogenetic activation of cortical feedback": it is not clear what the authors mean by cortical feedback. As RS was retrogradely labeled, this region may rather provide feedforward inhibition to V1 via ChCs.

      Retrosplenial cortex is a higher order cortical area and only provides feedback to V1.

      -"This means that each ChC receives input from many L5 PyCs, which could explain the low selectivity of ChC responses we observed to natural images compared to those of L2/3 and L5 PyCs". : perhaps state explicitly that the convergence of many PN inputs each carrying different RF/visual properties "averages out" in ChC (as you do a few lines below for MEI).

      At this point, we do not know how the connections from L5 to ChCs are organized. Whether this converge results in “average out” is therefore not so certain. We have made an atempt to clarify the situation. (“This convergence of L5 PyC inputs, if not strongly organized, could explain the low selectivity of ChC responses we observed to natural images compared to those of L2/3 and L5 PyCs.”)

      -"However, we did not identify neuromodulatory inputs to ChCs in our rabies tracing experiment. Possibly, these inputs act predominantly through extrasynaptic receptors and were therefore not labeled by the transsynaptic rabies approach.": here, the authors should cite the work by Lu et al (doi: 10.1038/nn.4624) which found basal forebrain (diagonal band of Broca) cholinergic inputs to ChC of the PFC in the Nkx2.1CreER mouse model. Moreover, the authors should discuss potential technical differences (?) responsible for this discrepancy. Beyond the extrasynaptic release of neuromodulators, rabies strains may display different tropism profiles for neuron classes.

      We have now added a sentence discussing this and added the reference in the revised manuscript.

      -The section dedicated to prediction error is particularly interesting and relevant. In my opinion, this interpretation should be further emphasized in the abstract and summary of findings paragraph in the discussion (as already indicated).

      Yes, we agree and have added some emphasis.

      -" These findings are thus in contrast with the general notion that ChCs exert powerful control over PyC output (28, 78), but consistent with computational simulations predicting a relatively small inhibitory effect of GABAergic innervation of the AIS, possibly involving shunting inhibition (79, 80)." These findings are also consistent with results from PFC and dCA1 studies showing, with electrophysiological recordings combined with optogenetic stimulation of ChCs, that a small proportion of putative PNs was inhibited upon ChC stimulation (doi: 10.1038/nn.4624 doi: 10.1016/j.neuron.2021.09.033).

      Perhaps the effect of ChCs is limited in all these experiments by a suboptimal efficiency of ChC targeting. Moreover, inhibition might be restricted to a subset of PNs carrying a specific function. This could be discussed.

      We added an explanation for the weak effects of silencing to the discussion and stated that our results are in line with findings in PFC and CA1. (“One explanation for the weak effects we observed is the high variability in the number of GABAergic boutons that PyCs receive at their AISs. Possibly, only a smaller fraction of PyCs with high numbers of AIS synapses are inhibited when ChCs are active. Indeed, we find that only a small fraction of PyCs increased their activity upon chemogenetic silencing of ChCs, in line with findings by others showing that manipulating ChC activity in vivo has relatively weak effects on small populations of PyCs (27, 28).”)

      Although we cannot rule out that ChC targeting is suboptimal in our and other experiments, the expression of the KORD receptor as visualized by mCyRFP1 fluorescence appeared very strong. In addition, the common notion in the ChC field is that ChCs exert powerful control over PyC firing. Even suboptimal labeling should in that case show clear inhibitory effects. Similar experiments with PV+ interneurons would show very convincing inhibition, even if labeling is suboptimal. To keep the discussion concise, we prefer to leave this particular point out.

      -" ChC activation could prevent homeostatic AIS shortening of L2/3 PyCs if their activity occurs during behaviorally relevant, arousal inducing events": this postulate seems to be very interesting but is not very clear and lacks some mechanistic speculation.

      We considered elaborating more on this hypothesis. However – given that it is merely a speculation at this point – we do not wish to lengthen the discussion further on this point.

      • A reference to previous studies demonstrating high levels of synchronous ChC activities is missing: the authors may cite Dudok et al., Schneider-Mizell et al., and Jung et al. (and discuss a change in synchrony with learning or habituation in the case of this study; see above).

      We have now also referred to these papers in the context of high correlations between ChCs.

      Methods

      Beyond references to reagents (eg antibodies, viruses), lot numbers should be provided whenever this is possible. Indeed, there might be strong lot-to-lot variations in specificity and efficiency.

      Reviewer #3 (Recommendations For The Authors):

      Major:

      • (Figure 5) Control analysis missing. Mice before and after training in VR will almost definitely exhibit different running paterns when viewing driftng gratings. Since ChCs are strongly modulated by locomotion, assess whether results depend on changes in running.

      Although we did not compare locomotion paterns before and after training, we removed all trials in which the mice were running (see methods). Therefore, we can exclude that these results are caused by changes in running behavior.

      • (Figure 5 & 6) What would happen with simple passive visual experience, not in a visuomotor task? What if there was no reward? What if there was an open-loop experiment with random reward? To which specific aspect of the experiment are the results atributable?

      These are indeed very interesting questions that may be tested in future experiments.

      (Figure 7 B, H) The pre-injection ChC activity in the KORD group is less than 50% of that in control mice! Discuss the effect of such a shift in baseline. Plasticity of PyCs even before ChC inactivation?

      See answer to the above question in the public section of reviewer 3.

      • (Figure 3 H) Contrast tuning results, as far as I understand, come only from the CNN. However, if I understood correctly, during the passive viewing of gratings there were already different contrasts. Why not show contrast tuning there? Do the results disagree?

      We did indeed show stimuli at different contrasts during the passive viewing of gratings. Although the results from those recordings were not optimal for defining contrast sensitivity, they also showed that ChC responses were less modulated by contrast than PyCs.

      Minor: - (Figure 3) Explain the potential impact of different indicators 8m vs 6f due to different baselines and dynamics.

      We believe there is no impact of different indicators, because for the CNN analyses we estimated spikes using CASCADE. This toolbox is specifically designed to generalize across different calcium indicators. Although GCaMP8m was not included in their training set, the wide variety of indicators used provides a solid basis for generalizable spike estimation. Importantly, comparisons between L2/3 PyCs and ChCs also would not be affected by this concern.

      • (Figure 4) NV-PyCs. Would you call all of these mismatch-responsive neurons? Discuss the difference in the percentage of neurons (more than 50% of total PyCs here, compared to significantly less - up to 40% in previous studies, as far as I'm aware)

      Not all NV-PyCs appeared to be mismatch-responsive neurons.

      • (Figure 6 D) No error bars?

      This is a representation of the fraction of all contacted AISs, which has no error bars indeed.

      • (Figure 6 E-F and H-I) These pairs of panels contain essentially the same information. The first panel of each pair seems redundant.

      We prefer to keep both plots in place, as in this case the skewness of the histogram can be helpful, which is less clear in the boxplot (which in itself displays the quantiles beter).

      • The equation for direction tuning still has ang_ori, instead of ang_dir which I'm assuming should be there.

      Thank you for noticing, we corrected it.

      • The response for drifting gratings is calculated from a different interval (0.2-1.2s) compared to natural images (0-0.5s). Why?

      Because we used spike probability in the case of the natural images to shorten the signal, and the visual stimuli were presented for 0.5 s (instead of 1 s as with the gratings).

      Very minor:

      • It would be helpful for equations to have numbers.

      Done

      • Sparsity equation. Beter to have it as a general equation, with N instead of 40. Then below it can be explained that N is the number of images = 40.

      Done

      • "The similarity of these MEIs with those we found for ChCs is in line with the idea that ChCs are driven by input from a large number of L5 PyCs (but do not exclude alternative explanations)." - in parenthesis it should be does not exclude.

      Corrected.

      • "In contrast, the response strength of PyCs was only mildly and non-significantly reduced after training"

      • statistically non-significant..

      Corrected.

      "We first looked at the average activity of neurons in both essions." - sessions

      Corrected.

      • (Figure 7 C) Explain what points and error bars represent

      Done.

    1. Author Response

      Reviewer #2 (Public Review):

      The study from Gumaste et al investigates whether mice can use changes of intermittency, a temporal odor feature, to locate an odor source. First, the study tries to demonstrate that mice can discriminate between low and high intermittency and that their performance is not affected by the odor used or the frequency of odor whiffs. Then, they show that there is a correlation between glomerular responses (OSNs and mitral cells) and intermittency. Finally, they conclude that sniffing frequency impacts the behavioral discrimination of intermittency as well as its neural representation. Overall, the authors seek to demonstrate that intermittency is an odor-plume property that can inform olfactory navigation.

      The paper explored an interesting question, the use of intermittency of an odor plume as a behavioral cue, which is a new and intriguing hypothesis. However, it falls short in demonstrating that the animal is actually sensitive to intermittency but not other flow parameters, and is missing some important details.

      Major concerns

      1) One of the cornerstones of this paper consists in showing that mice are behaviorally able to distinguish among different intermittency values (high or low), across a variety of different stimuli and without confounds such as the number of whiffs or concentration. However, I could not find in the paper a convincing explanation of how these confounds were tested. It is clear that the authors repeat their measurements in different conditions (low or high concentration, and different whiff numbers) but it is not specified how: do the authors mix all stimuli in the same session, and so the animals simply generalize across all the stimuli and only consider intermittency for the behavioral choices? Or do authors repeat different sessions for different parameters? For example: do they perform two separate sessions with low concentration and high concentration? If this last one is the case, I would argue that this is not enough proof that animals generalize across concentrations, as the animals might simply use concentration as a cue and change the decision criteria at each session. Please clarify.

      We appreciate the reviewer pointing out our oversight in including this information in the manuscript. Trials of the two gain values (which modulate the maximum concentration) are presented interleaved within a session. These trials are solely separated for post-session analysis to test the effect of gain on animal performance. To make this point clearer we have included the following text on line 952 of the manuscript:

      “Additionally, trials of a gain of 0.5 and a gain of 1 are interwoven randomly during the session with each unique stimulus being presented at both a gain of 0.5 and 0.1. Thus, after the initial engagement trials, animals are presented with a total of 28 trials at a gain of 0.5 and 28 trials at a gain of 0.1.”

      Additionally, to address one of the reviewer’s overarching points, that the manuscript “falls short in demonstrating that the animal is actually sensitive to intermittency but not other flow parameters,” we would like to highlight that through our olfactometer design (described in the Olfactometer Design subsection of the Methods section and illustrated in Figure 1C) the flow rate is held constant throughout the experiment. To further ensure that the animal is not using flowrate or other experimental conditions to perform the task, we tested all animals on a “no odor” condition in which the vial of odor is replaced with a vial of mineral oil. In this condition, their hit rate significantly lowered, as shown in Figure 2C and described in Lines 240- 245:

      “Animals’ hit rate also significantly decreased when tested on the Go/No-Go task with the odor vial replaced with mineral oil (n=12 mice, two-sample t-test Naturalistic: odor hit rate = 0.87 ±0.01, no odor hit rate= 0.23 ±0.05, p<0.0001; two-sample t-test Binary Naturalistic: odor hit rate= 0.89±0.01, no odor hit rate= 0.18±0.07, p<0.0001; two-sample t-test Synthetic: odor hit rate= 0.86±0.007, no odor hit rate= 0.23±0.07, p<0.0001), confirming that mice are using odor to perform the task.”

      2) It looks to me that the measure of intermittency strongly depends on the set. What is the logic of setting a specific threshold? Do the results hold when this threshold changes within a reasonable range? The same questions (maybe even more important) go for the measure of glomerular intermittence. Unfortunately, a sensitivity analysis for both measures is missing, which makes it hard to interpret the results.

      We assume the reviewer suggests that we could have tested discrimination at various Intermittency thresholds. This is indeed wat we did, though not by varying the threshold parametrically (due to abovementioned time constraints), but rather qualitatively/categorically. We tested our mice on 3 stimulus "types" (Figure 1F): actual continuous plume concentration traces (naturalistic), thresholded traces (binarized by threshold 0.1) and square wave (odor agnostic periodic binary). Further, each was tested at 2 gain levels. Figure 2B demonstrates mice discriminate similarly across these 3 widely differing stimuli, while traces were spanning most of the range of possible intermittencies. Reducing the threshold by 1 or 2 orders would skew the range of trials toward many more CS+ trials. We hence conclude that the mice are robustly discriminating and that the paradigm chosen and its associated constraints provide a reasonable test of "intermittency space".

      We agree nonetheless that future work should address your suggestion directly by implementing an alternate paradigm. For example, in such a paradigm, mice may be trained to discriminate high vs low intermittencies at varying absolute levels (e.g. 1 vs 0.9 and 0.1 vs 0), etc., however that was well outside the scope of what we aimed to test.

      See Figure 1- Supplement 1A. We varied the threshold half a log unit around the 0.1 threshold used in the neuro-behavioral research. As expected, the higher the odor threshold, the more left-shifted the curve. You can see that the monotonic relationship is qualitatively the same across thresholds.

      3) The logic of choosing the decision boundary for the discrimination task is not clear: low intermittency is considered to be below 0.15 and high intermittency is considered to be between 0.2 and 0.8. Do these values correspond to natural intermittency distribution? How were these values chosen?

      Intermittency drops as function of distance from the source (downwind). It also has a close to normal (with kurtosis) distribution across wind, peaking at the center (see e.g. Crimaldi 2002, Connor 2018). So, animals may encounter any and all intermittencies (0-1). Given our Go/No-Go paradigm we had to set a CS-/CS+ boundary. Typically, to generate an adequate psychometric curve using this paradign, either the CS- or CS+ stimuli need to represent a wide range of values of which the animals are required to compare against a narrow range (or single value). Again, bounded by effective behavioral paradigm design, the number of CS+ and CS- trials need to be even in order to appropriately motivate animals to engage in the task. Thus, considering the entire range of intermittency values animals can encounter while navigating through a plume in conjunction with effective behavioral design, we arrived at our chosen values for low and high intermittency.

      As you can see in Figure 1- Supplement 1A (and also reviewer #1, comment 2), I=0.15 is roughly at the knee where the monotonic decrease begins to asymptote. This is roughly true for all 3 concentration thresholds. Consequently, I=0.2-0.8 effectively samples the region where intermittency clearly relates to distance to the source, which is where we hypothesize animals.

      4) Only 2 odors were used in the whole study and some results were in disagreement between the two odors. By looking at only two odors it is very difficult to make a general conclusion about intermittency encoding in the OB.

      We agree 2 odors are limited, but we were constrained in terms of number of tests that we could run on our cohort of animals. Nonetheless intermittency of both odors is clearly discriminable. As explained to comment 3 by Reviewer 1:

      “We indeed considered several odorants and associated properties. Given time constrains we were limited to 2 stimuli of which we had to vary many parameters (type, I, gain, sniffing) in assessing both discrimination and neural processing.”

      “Additionally, these two odorants recruit glomeruli in different regions of the dorsal olfactory bulb, have different functional groups and elicit different spatiotemporal response properties in the olfactory bulb (Figure 6- figure supplement 1A, stated on line 507). Both odorants are fruit-associated odors with neutral preference indices (Saraiva et al., 2016, Fletcher, 2012). Thus, while we do not explore a panel of odorants, we do explore the generalizability of intermittency processing with two distinct odorants.”

      We decided to test 2 monomolecular odorants (2-heptanone and methyl valerate) as these have been widely used in rodent olfactory bulb imaging, providing distinct and clear glomerular response patterns. They are both fruity smelling odors, implying a relationship to edible food (at least, for humans). Methyl valerate is a methyl ester of pentanoic acid with a fruity (apple) smell and 2-Heptanone is a ketone with a fruity (green banana) smell.

      5) Assuming that all the above issues are resolved, one can conclude that intermittency can be perceived by an animal. The study puts a strong accent on the fact that this feature could be used for navigation. I understand that it is extremely hard to demonstrate that this feature is actually used for navigation, however, the analysis of relevance of this measure is missing. Even if it is used in navigation, most probably this would be in combination with other features, thus its relative importance needs to be discussed, or even better, established.

      We fully appreciate the reviewers reasoning. Our approach indeed intended to establish a conditio sine qua non: if mice could not discriminate these stimuli they would likely not be able to use intermittency in general for navigation (at least for the odorants tested, for the intermittency ranges tested). We show however that they can, and hence they could use it. To demonstrate their use of intermittency alone or combined with other modalities or properties is well beyond the scope of this manuscript and we agree is a very interesting endeavor.

      We discussed other temporal properties on line 58-71 and 657-664 and other general properties on lines 46-56. The relative roles were briefly addressed on lines 664-676 and we hesitate to speculate beyond this.

    1. Author Response

      Reviewer #1 (Public Review):

      With MERGEseq, the authors sought to develop a scalable and accessible method for getting both projectome and transcriptome information at the single-cell level from multiple projection targets within a single animal. MERGEseq uses a retro rAAV2 to deliver a 15-nucleotide barcode driven by a CAG promoter with co-expression of eGFP to enrich barcoded cells using FACS. Injection of this rAAV2 in distinct regions (with each injection region distinguished by a unique barcode that is specific to the virus used) allows retrograde trafficking and expression of the barcodes in cells that project to the injected region. In this manuscript, rAAVs harboring 5 unique barcodes were stereotactically delivered to 5 targets of the mouse: dorsomedial striatum (DMS), mediodorsal thalamic nucleus (MD), basal amygdala (BLA), lateral hypothalamus (LH), and agranular insular cortex (AI). After a 6-week period to allow for viral transduction and expression, the ventromedial prefrontal cortex (vmPFC) was harvested for scRNAseq. vmPFC scRNAseq data were validated against previously published PFC datasets, demonstrating that MERGEseq does not disrupt transcript expression and identifies the same principal cell types as annotated in previous studies. Importantly, MERGEseq enabled the identification of cell types in the vmPFC that project to distinct areas, with separation occurring largely based on cell type and cortical layer. The application of stringent criteria for barcode index determination is rigorous and improves confidence that barcoded cells are correctly identified. The observation that all barcoded cells were excitatory is consistent with prior work, although it is not clear if viral tropism contributes to this in some way. In a parallel experiment, FAC-sorted cells (vmPFC cells expressing EGFP) were isolated as a comparison. Notably, EGFP+ cells were exclusively excitatory neurons, consistent with literature showing PFC projection neurons are excitatory. Next, barcode analysis was combined with transcriptional identification of neuronal subtypes to define general projection patterns and single-cell projection patterns, which were validated by the DMS and MD in situ using retrograde tracing in combination with RNA FISH. MERGEseq data were also used to identify transcriptional differences between neurons with dedicated and bifurcated projections. DMS+LH and DMS+MD projecting neurons had distinct transcriptional profiles, unlike cells with other targets. RNA FISH for marker gene Pou3f and retrograde tracing from DMS+LH projecting cells demonstrate enrichment of this gene in this projection population. Finally, machine-learning was used to predict projection targets based on transcriptional profiles. In this dataset, 50 highly variable genes (HVGs) were optimal for predicting projection patterns, though this might vary in different circuits. Overall, the results of this manuscript are well presented and include rigorous validation for select vmPFC targets with in situ techniques. The application of unique barcodes for retro-AAV delivery is an accessible tool that other labs can implement to study other brain circuits.

      Ultimately, MERGEseq is a subtle conceptual advancement over VECTORseq (retro-AAV delivered transgenes rather than barcodes, in combination with scRNAseq) that offers higher confidence in the described projectome diversity in comparison. The use of a retrograde AAV inherently limits the number of projection areas that can be assessed, a weakness compared to anterograde approaches such as MAPseq/BARseq. However, BARseq demands more time and resources; further, the use of the highly toxic Sindbis virus limits the application of this technique. This manuscript builds upon previous work by utilizing machine learning to predict projection targets. BARseq2 could be used to rigorously validate predicted projectomes and gain single-cell information regarding target neurons. Overall, MERGEseq is an accessible technique that can be used across many animal models and serve as an important starting point to define circuits at the single-cell level.

      We thank reviewer for the comprehensive review. We are grateful for reviewer’s recognition of the conceptual advancement of MERGE-seq and the rigorous criteria we applied for projection barcode determination. We have revised the Introduction to highlight advancements in our method. We also discussed the balance of transcriptomic comprehensiveness against spatial resolution in the revised Discussion. Reviewer’s comments have been invaluable in enhancing the clarity and depth of our manuscript.

      Reviewer #2 (Public Review):

      Investigating the relationship between transcriptomic profiles, their axonal projection and collateralization patterns will help define neuronal cell types in the mammalian central nervous system. The study by Xu et al. combined multiple retrograde viruses with barcodes and single-cell RNA-sequencing (MERGE-seq) to determine the projection and collateralization patterns of transcriptomically defined ventral medial prefrontal cortex (vmPFC) projection neurons. They found a complex relationship: the same transcriptomically defined cell types project to multiple target regions, and the same target region receives input from multiple transcriptomic types of vmPFC neurons. Further, collateralization patterns of vmPFC to the five target regions they investigated are highly non-random.

      While many of the biological conclusions are not surprising given recent studies on the collateralization patterns of vmPFC neurons using single neuron tracing and other methods that integrate transcriptomics and projections, MERGE-seq provides validation, at the single cell level, collateralization patterns of individual vmPFC neurons, and thus offer new and valuable information over what has been published. The method can also be used to study collateralization patterns of other neuron types.

      Some of the conclusions the authors draw depend on the efficiency of retrograde labeling, which was not determined. Without quantitative information on retrograde labeling efficiency, and unless such efficiency is close to 100%, these conclusions are likely misleading.

      We thank reviewer for recognizing the contributions of our MERGE-seq technique in advancing the understanding of projection patterns of vmPFC neurons. We concur that while our conclusions align with previous findings, our single-cell level analysis provides additional depth to the existing knowledge of the field. We acknowledge the challenge to quantify retrograde labeling efficiency to draw quantitive conclusions based on our findings. Alternatively, we have used fMOST-based single-neuron tracing data and analysis to validate our projection patterns and ensure the robustness of our conclusions in the revised manuscript. We also more explicitly clarified the limitations of the quantitive conclusion drawn from MERGE-seq in the revised Discussion. The insights of reviewer are greatly appreciated and will inform the improvement of our research methodology.

      Reviewer #3 (Public Review):

      This manuscript describes a multiplexed approach for the identification of transcriptional features of neurons projecting to specific target areas at the single-cell level. This approach, called MERGE-seq, begins with multiplexed retrograde tracing by injecting distinctly barcoded rAAV-retro viruses into different target areas. The transcriptomes and barcoding of neurons in the source area are then characterized by single-cell RNA sequencing (scRNAseq) on the 10xGenomics platform. The projection targets of barcoded neurons in the source area can be inferred by matching the detected barcodes to the barcode sequences to of rAAV-retro viruses injected into the target areas.

      The authors validated their approach by injecting five rAAV-retro GFP viruses, each encoding a different barcode, into five known targets of the ventromedial prefrontal cortex (vmPFC). The transcriptomes and barcoding of vmPFC neurons were then analyzed by scRNA-seq with or without enrichment of retrogradely labeled neurons based on GFP fluorescence. The authors confirmed the previously described heterogeneity of vmPFC neurons. In addition, they showed that most transcriptionally defined cell types project to multiple targets and that the five targets received projections from multiple transcriptomic types. The authors further characterized the transcriptomic features of barcoded vmPFC neurons with different projection patterns and defined Pou3f1 as a marker gene of neurons extending collateral branches to the dorsomedial striatum and lateral hypothalamus.

      Overall, the results of the manuscript are convincing: the transcriptomic vmPFC cell types defined by scRNAseq in this study appear to correlate well with previous studies, the bifurcated projection patterns inferred by barcoding are validated using dual-color retro-AAV tracing, and marker genes for projection-specific cell subclasses are validated in retrogradely labeled vmPFC using RNA FISH for marker detection.

      The concept of combining retrograde tracing and scRNAseq is not new. Previous studies have applied recombinase-expressing viruses capable of retrograde labeling, such as CAV, rabies virus, and AAV2-Retro, to retrogradely label and induce the expression of fluorescence markers in projection neurons, therefore facilitating enrichment and analysis of neurons projecting to a specific target. Multiplexed analysis can be achieved with the combination of different reporter viruses or viruses expressing different recombinases and appropriate reporter mouse lines. The advantages of MERGE-seq include that no transgenic lines are required and that it could be applied at even higher levels of multiplexity.

      We thank reviewer for the insightful review of our manuscript and the recognition of the advantages of MERGE-seq. We appreciate reviewer acknowledged the robust validation of the method through dual-color retro-AAV tracing and RNA FISH, and the confirmation of previous findings on vmPFC neuronal heterogeneity and collateral projection patterns. We provided additional joint analysis with fMOST-based single-neuron projectome data (Gao et al., 2022, Nature Neuroscience) to further validate the projection patterns (>= 3 targets) that cannot be easily validated with dual-color retro-AAV tracing.

      However, previously existing datasets that have already profiled this region with scRNAseq have not been utilized to their full extent. Therefore, for the proper context with prior literature, bioinformatic integration of these scRNAseq and prior scRNAseq data is needed.

      Moreover, robust detection of barcodes in neurons labeled by barcoded AAV-retro viruses remains a challenge. The authors should clearly discuss the difficulties with barcode detection in this approach, as well as discuss potential solutions, which are important for others interested in its approach.

      While this study is limited to the five known targets of vmPFC, the results suggest that MERGE-seq is a valuable tool that could be used in the future to characterize projection targets and transcriptomes of neurons in a multiplexed manner. As MERGE-seq uses AAVs to deliver barcodes, this method has the potential for application in model organisms for which transgenic lines are not available. Further improvements in experimental design and data analysis should be considered when applying MERGE-seq to poorly characterized source areas or with increased multiplexity of target areas.

      In summary, this is a valuable approach, but the authors should clearly provide the context for their study within the existing literature, transparently discuss the limitations of MERGE-seq, as well as suggest improvements for the future.

      We appreciate your positive assessment of MERGE-seq as a valuable approach with future potential. As recommended, we have performed integration analysis with existing vmPFC scRNA-seq studies, including Bhattacherjee et al., 2019, Lui et al., 2021, Yao at al., 2021, and specifically recently published MERFISH data of PFC (Bhattacherjee et al., 2023).

      In the revised Discussion, we have transparently addressed the current limitations of MERGE-seq, including imperfect retrograde labeling efficiency, variable barcode recovery rates and cell loss during dissociation. We also addressed the challenges in detecting and recovering projection barcodes and suggested potential solutions such as using FAC-sorted EGFP-negative cells for control and applying single-molecule FISH techniques. We sincerely appreciate reviewer’s rigorous and insightful feedback, which has substantially strengthened our manuscript.

    1. Author Response

      Reviewer #1 (Public Review):

      In this paper, the authors develop new models of sequential effects in a simple Bernoulli learning task. In particular, the authors show evidence for both a "precision-cost" model (precise posteriors are costly) and an "unpredictabilitycost" model (expectations of unpredictable outcomes are costly). Detailed analyses of experimental data partially support the model predictions.

      Strengths:

      • Well-written and clear.

      • Addresses a long-standing empirical puzzle.

      • Rigorous modeling.

      Weaknesses:

      • No model adequately explains all of the data.

      • New empirical dataset is somewhat incremental.

      • Aspects of the modeling appear weakly motivated (particularly the unpredictability model).

      • Missing discussion of some relevant literature.

      We thank Reviewer #1 for her/his positive comments on our work and her/his comments and suggestions.

      Reviewer #2 (Public Review):

      This paper argues for an explanation of sequential effects in prediction based on the computational cost of representing probability distributions. This argument is made by contrasting two cost-based models with several other models in accounting for first- and second-order dependencies in people's choices. The empirical and modeling work is well done, and the results are compelling.

      We thank Reviewer #2 for her/his positive comments on our work.

      The main weaknesses of the paper are as follows:

      1) The main argument is against accounts of dependency based on sensitivity to statistics (ie. modeling the timeseries as having dependencies it doesn't have). However, such models are not included in the model comparison, which makes it difficult to compare these hypotheses.

      Many models in the sequential-effects literature (Refs. [7-12] in the manuscript) are ‘leaky-integration’ models that interpret sequential effects as resulting from an attempt to learn the statistics of a sequence of stimuli, through exponentiallydecaying counts of the simple patterns in the sequence (e.g., single stimuli, repetitions, and alternations). In some studies, the ‘forgetting’ of remote observations that results from the exponential decay is justified by the fact that people live in environments that are usually changing: it is thus natural that they should expect that the statistics underlying the task’s stimuli undergo changes (although in most experiments, they do not), and if they expect changes, then they should discard old observations that are not anymore relevant. This theoretical justification raises the question as to why subjects do not seem to learn that the generative parameters in these tasks are in fact not changing — all the more as other studies suggest that subjects are able to learn the statistics of changes (and consistently they are able to adapt their inference) when the environment does undergo changes (Refs. [42,57]).

      Our models are derived from a different approach: we derive behavior from the resolution of a problem of constrained optimization of the inference process. It is not a phenomenological model. When the constraint that weighs on the inference process is a cost on the precision of the posterior, as measured by its entropy, we find that the resulting posterior is one in which remote observations are ‘forgotten’, through an exponentially discount, i.e., we recover the predictions of the leaky-integration models, which past studies have empirically found to be reasonably good accounts of sequential effects. (Thus these models are already in our model comparison.) In our framework, the sequential effects do not stem from the subjects’ irrevocable belief that the statistics of the stimuli change from time to time, but rather from the difficulty that they have in representing precise belief; a rather different theoretical justification.

      Furthermore, we show that a large fraction of subjects are not best-fitted by precision-cost models (i.e., they are not best-fitted by leaky integration), but instead they are best fitted by unpredictability-cost models. These models suggest a different explanation of sequential effects: that they result from the subjects favoring predictable environments, in their inference. In the revised version of the manuscript, we have made clearer that the derivation of the optimal posterior under a precision cost results in the exponential forgetting of remote observations, as in the leaky-integration models. We mention it in the abstract, in the Introduction (l. 76-78), in the Results when presenting the precision-cost models (l. 264-278), and in the Discussion (l.706-716).

      2) The task is not incentivized in any way. Since incentives are known to affect probability-matching behaviors, this seems important. In particular, we might expect incentives would trade off against computational costs - people should increase the precision of their representations if it generates more reward.

      We thank Reviewer #2 for her/his attention to our paper and for her/his comments. As for the point on the models, see answer above (point 1).

      As for the point on incentivization: we agree that it would be very interesting to measure whether and to which extent the performance of subjects increases with the level of incentivization. Here, however, we wanted, first, to establish that subjects’ behavior could be understood as resulting from inference under a cost, and second, to examine the sensitivity of their predictions to the underlying generative probability — rather than to manipulating a tradeoff involving this cost (e.g. with financial reward). We note that we do find that subjects are sensitive to the generative probability, which implies that they exhibit some degree of motivation to put some effort in the task (which is the goal of incentivization), in spite of the lack of economic incentives. But it would indeed be interesting to know how the potential sensitivity to reward interacts with the sensitivity to the generative probability. Furthermore, as Reviewer #2 mentions, some studies show that incentives affect probability-matching behavior: it is then unclear whether the introduction of incentives in our task would change the inference of subjects (through a modification of the optimal trade-off that we model); or whether it would change their probability-matching behavior, as modeled by our generalized probability-matching response-selection strategy; or both. Note that we disentangled both aspects in our modeling and that our conclusions are about the inference, not the response-selection strategy. We deem the incentivization effects very much worth investigating; but they fall outside of the scope of our paper.

      We now mention this point in the Discussion of the revised manuscript (l. 828-840).

      3) The sample size is relatively small (20 participants). Even though a relatively large amount of data is collected from each participant, this does make it more difficult to evaluate the second-order dependencies in particular (Figure 6), where there are large error bars and the current analysis uses a threshold of p < .05 across a large number of tests hence creating a high false-discovery risk.

      Indeed we agree with Reviewer #2 that as the number of tests increases, so does the probability that at least one null hypothesis is rejected at a given level, even if the null hypothesis is correct. But in the panels a, b and c of Figure 6, about half of the tests are rejected, which is very unlikely under the null hypothesis that there is no effect of the stimulus history on the prediction, all the more as the signs of the non-significant results are in most cases consistent with the direction of the significant results. (In panel e, which reports a finer analysis in which the number of subjects is essentially divided by 2, about a fourth of the tests are rejected, and here also the non-significant results are almost all in the same direction as the significant ones.)

      However, we agree that there remains a risk of false discovery, thus we applied a Bonferroni-Holm-Šidák correction to the p-values in order to mitigate this risk. With these more conservative p-values, a lower number of tests are rejected, but in most cases in Fig. 6abc the effects remain significant. In particular, we are confident that there is a repulsive effect of the third-to-last stimulus in the case of Fig. 6c, while there is an attractive effect in the other cases.

      In the revised manuscript, Figure 6 now reports whether the tests are rejected when the p-values are corrected with the Bonferroni-Holm-Šidák correction.

      (We also applied this correction to the p-values of the tests in Fig. 2, which has more data: the corrected p-values are all below 1e-13, which we now indicate in the caption of this figure.)

      4) In the key analyses in Figure 4, we see model predictions averaged across participants. This can be misleading, as the average of many models can produce behavior outside the class of functions the models themselves can generate. It would be helpful to see the distribution of raw model predictions (ideally compared against individual data from humans). Minimally, showing predictions from representative models in each class would provide insight into where specific models are getting things right and wrong, which is not apparent from the model comparison.

      In the main text of the original manuscript, we showed the behavior of the pooled responses of the best-fitting models, and we agree with Reviewer #2 that it did not make clear to the reader that the apparent ability of the models to reproduce the subjects’ behavioral patterns was not a misleading byproduct of the averaging of different models. In the original version of the manuscript, we had put a figure showing the behavior of each individual model (each cost type with each Markov order) in the Methods section of the paper; but this could easily be overlooked, and indeed it would be beneficial for the reader to be shown the typical behaviors of the models, in the main text. We have reorganized the presentation of the models’ behaviors: the first panels in Fig. 4 (in the main text) are now dedicated to showing the individual sequential effects of the precision-cost and of the unpredictabilitycost models with Markov order 0 and 1. The Figure 4 is reproduced in the response to Reviewer #1, above, along with comments on the sequential effects produced by these models (and also on the impact of the generalized probability-matching response-selection strategy, in comparison with the traditional probability matching). We believe that this figure makes clearer how the individual models are able to reproduce the patterns in subjects’ predictions — in particular it shows that this ability of the models is not just an artifact of the averaging of many models, as was the legitimate concern of Reviewer #2. We have left the illustration of the firstorder sequential effects of the other models (with Markov order 2 and 3) in the Methods section (Fig. 7), so as not to overload Fig. 4, and because they do not bring new critical conceptual points.

      As for the higher-order sequential effects, the updated Figure 5, also reproduced above in the responses to Reviewer #1, now includes the sequential effects obtained with the precision-cost model of a Bernoulli observer (m=0), in addition to the precision-cost model of a Markov observer (m=1) and to the unpredictabilitycost model of a Markov observer (m=3), in order to better illustrate the behaviors of the different models. The higher-order sequential effects of the other models can be found in Fig. 8 in Methods.

      Reviewer #3 (Public Review):

      This manuscript offers a novel account of history biases in perceptual decisions in terms of bounded rationality, more specifically in terms of finite resources strategy. Bridging two works of literature on the suboptimalities of human decision-making (cognitive biases and bounded rationality) is very valuable per se; the theoretical framework is well derived, building upon the authors' previous work; and the choice of experiment and analysis to test their hypothesis is adequate. However, I do have important concerns regarding the work that do not enable me to fully grasp the impact of the work. Most importantly, I am not sure whether the hypothesis whereby inference is biased towards avoiding high precision posterior is equivalent or not to the standard hypothesis that inference "leaks" across time due to the belief that the environment is not stationary. This and other important issues are detailed below. I also think that the clarity and architecture of the manuscript could be greatly improved.

      We thank Reviewer #3 for her/his positive comments on our work and her/his comments and suggestions.

      1) At this point it remains unclear what is the relationship between the finite resources hypothesis (the only bounded rationality hypothesis supported by the data) and more standard accounts of historical effects in terms of adaptation to a (believed to be) changing environment. The Discussion suggests that the two approaches are similar (if not identical) at the algorithmic level: in one case, the posterior belief is stretched (compared to the Bayesian observer for stationary environments) due to precision cost, in other because of possible changes in the environment. Are the two formalisms equivalent? Or could the two accounts provide dissociable predictions for a different task? In other words, if the finite resources hypothesis is not meant to be taken as brain circuits explicitly minimizing the cost (as stated by the authors), and if it produces the same type of behavior as more classical accounts: is the hypothesis testable experimentally?

      We agree with Reviewer #3 that the relation between our approach and other approaches in the literature should be made clearer to the reader.

      Since the 1990s, in the psychology and neuroscience literature, many models of perception and decision-making have featured an exponential decay of past observations, resulting in an emphasis, in decisions, of the more recent evidence (‘leaky integration’, Refs. [7-12, 76-86]). In the context of sequential effects, this mechanism has found a theoretical justification in the idea that people believe that statistics typically change, and thus that remote observations should indeed be discarded [8,12]. In inference tasks with binary signals, in which the optimal Bayesian posterior is in many cases a Beta distribution whose two parameters are the counts of the two signals, one way to conveniently incorporate a forgetting mechanism is to replace these counts with exponentially-filtered counts, in which more recent observations have more weight (e.g., Ref. [12]).

      Our approach to sequential effects is not grounded in the history of leakyintegration models: we assume, first, that subjects attempt at learning the statistics of the signals presented to them (this is also the assumption in many studies [712]), and second, that their inference is subject to a cost, which prevents them from reaching the optimal, Bayesian posterior; but under the constraint of this cost, they choose the optimal posterior. We formalize this as a problem of constrained optimization.

      The two formalisms are thus not equivalent. Beyond the fact that we clearly state the problem which we assume the brain is solving, we do not propose that the origin of sequential effects resides in an adaptation to putatively changing environments: instead, we assume that they originate in a cognitive cost internal to the decision-maker. If this cost is proportional to the entropy of the posterior, as in our precision cost, then the optimal approximate posterior is one in which remote observations are ‘forgotten’ through an exponential filter, as in the leakyintegration models. In other words, in the context of this task and with this kind of cost, the models are, as Reviewer #3 writes, identical at the algorithmic level. As for the unpredictability cost, it does not result in a solution that resembles leaky integration; about half the subjects, however, are best fitted by unpredictabilitycost models. We thus provide a different rationale for sequential effects — that the brain favors predictive environment, in its inference — and this alternative account is successful in capturing the behavior of a large fraction of the subjects.

      In the revised manuscript, we now clarify that the precision cost results in leaky integration, in the abstract, in the Introduction (l. 76-78), in our presentation of the precision-cost models (Results section, l. 264-275), and in the Discussion (l. 706716). (We also refer Reviewer #3 to our response to the first comment of Reviewer #2, above.)

      Finally, Reviewer #3 asks the interesting question as to whether the “two accounts provide dissociable predictions for a different task”. Given that the leakyintegration approach is justified by an adaptation to potential changes, and our approach relies on the hypothesis that precision in beliefs is costly, one way to disentangle the two would be to eliminate the sequential nature of the task and presenting instead observations simultaneously. This would eliminate the mere notion of change across time. In this case, the leaky account would predict that subjects’ inference becomes optimal (because the leak should disappear in the absence of change), while in the second approach the precision cost would still weigh on the inference, and result in approximate posteriors that are “wider” (less precise) than the optimal one. The resulting divergence in the predictions of these models is very interesting, but out of the scope of this study on sequential effects.

      2) The current analysis of history effects may be confounded by effects of the motor responses (independently from the correct response), e.g. a tendency to repeat motor responses instead of (or on top of) tracking the distribution of stimuli.

      We thank Reviewer #3 for pointing out the possibility that subjects may have a tendency to repeat motor responses that is not related to their inference.

      We note that in Urai et al., 2017, as in many other sensory 2AFC tasks, successive trials are independent: the stimulus at a given trial is a random event independent of the stimulus at the preceding trial; the response at a given trial should in principle be independent of the stimulus at the preceding trial; and the response at the preceding trial conveys no information about the response that should be given at the current trial (although subjects might exhibit a serial dependency in their responses). By contrast, in our task an event is more likely than not to be followed by the same event (because observing this event suggests that its probability is greater than .5); and a prediction at a given trial should be correlated with the stimuli at the preceding trials, and with the predictions at the preceding trials. In a logit model (or any other GLM), this would mean that the predictors exhibit multicollinearity, i.e., they are strongly correlated. Multicollinearity does not reduce the predictive power of a model, but it makes the identification of parameters extremely unreliable: in other words, we wouldn’t be able to confidently attribute to each predictor (e.g., the past observations and the past responses) a reliable weight in the subjects’ decisions. Furthermore, our study shows that past stimuli can yield both attractive and repulsive effects, depending on the exact sequence of past observations. To capture this in a (generalized) linear model, we would have to introduce interaction terms for each possible past sequence, resulting in a very high number of parameters to be identified.

      However, this does not preclude the possibility that subjects may have a motor propensity to repeat responses. In order to take this hypothesis into account, we examined the behavior and the ability to capture subjects’ data of models in which the response-selection strategy allows for the possibility of repeating, or alternating, the preceding response. Specifically, we consider models that are identical to those in our study, except for the response-selection strategy, which is an extension of the generalized probability-matching strategy, in which a parameter eta, greater than -1 and lower than 1, determines the probability that the model subject repeats its preceding response, or conversely alternates and chooses the other response. With probability 1-|η|, the model subject follows the generalized probability-matching response-selection strategy (parameterized by κ). With probability |η|, the model subject repeats the preceding response, if η > 0, or chooses the other response, if η < 0. We included the possibility of an alternation bias (negative η), but we find that no subject is best-fitted by a negative η, thus we focus on the repetition bias (positive η). We fit the models by maximizing their likelihoods, and we compared, using the Bayesian Information Criterion (BIC), the quality of their fit to that of the original models that do not include a repetition propensity.

      Taking into account the repetition bias of subjects leaves the assignment of subjects into two families of inference cost mostly unchanged. We find that for 26% of subjects the introduction of the repetition propensity does not improve the fit (as measured by the BIC) and can therefore be discarded. For 47% of subjects, the fit is better with the repetition propensity (lower BIC), and the best-fitting inference model (i.e., the type of cost, precision or unpredictability, and the Markov order) is the same with or without repetition propensity. Thus for 73% (=26+47) of subjects, allowing for a repetition propensity does not change the inference model. We also find that the best-fitting parameters λ and κ, for these subjects, are very stable, when allowing or not for the repetition propensity. For 11% of subjects, the fit is better with the repetition propensity, and the cost type of the inference model is the same (as without the repetition propensity), but the Markov order changes. For the remaining 16%, both the cost type and the Markov order change.

      Thus for a majority of subjects, the BIC is improved when a repetition propensity is included, suggesting that there is indeed a tendency to repeat responses, independent of the subjects’ inference process and generative stimulus probability. In Figure 7, in Methods, we show the behavior of the models without repetition propensity, and with repetition propensity, with a parameter η = 0.2 close to the average best-fitting value of eta across subjects. We show, in Methods, that (i) the unconditional probability of a prediction A, p(A), is the same with and without repetition propensity, and that (ii) the conditional probabilities p(A|A) and p(A|B) when η≠0 are weighted means of the unconditional probability p(A) and of the conditional probabilities when eta=0 (see p. 47-49 of the revised manuscript).

      In summary, our results suggest that a majority of subjects do exhibit a propensity to repeat their responses. Most subjects, however, are best-fitted by the same inference model, with or without repetition propensity, and the parameters λ and κ are stable, across these two cases; this speaks to the robustness of our model fitting. We conclude that the models of inference under a cost capture essential aspects of the behavioral data, which does not exclude, and is not confounded by, the existence of a tendency, in subjects, to repeat motor responses.

      In the revised manuscript, we present this analysis in Methods (p.47-49), and we refer to it in the main text (l. 353-356 and 400-406).

      3) The authors assume that subjects should reach their asymptotic behavior after passively viewing the first 200 trials but this should be assessed in the data rather than hypothesized. Especially since the subjects are passively looking during the first part of the block, they may well pay very little attention to the statistics.

      The assumptions that subjects reach their asymptotic behavior after being presented with 200 observations in the passive trials should indeed be tested. To that end, we compared the behavior of the subjects in the first 100 active trials with their behavior in the remaining 100 active trials. The results of this analysis are shown in Figure 9.

      For most values of the stimulus generative probability, the unconditional proportions of predictions A, in the first and the second half (panel a, solid and dashed gray lines), are not significantly different (panel a, white dots), except for two values (p-value < 0.05; panel a, filled dots). Although in most cases the difference between the two is not significant, in the second half the proportions of prediction A seem slightly closer to the extremes (0 and 1), i.e., closer to the optimal proportions. As for the sequential effects, they appear very similar in the two halves of trials. We conclude that for the purpose of our analysis we can reasonably consider that the behavior of the subjects is stationary throughout the task.

      4) The experiment methods are described quite poorly: when is the feedback provided? What is the horizontal bar at the bottom of the display? What happens in the analysis with timeout trials and what percentage of trials do they represent? Most importantly, what were the subjects told about the structure of the task? Are they told that probabilities change over blocks but are maintained constant within each block?

      We thank Reviewer #3 for her/his close attention to the details of our experiment. Here are the answers to the reviewer’s questions:

      • The feedback (i.e., a lightning strike on the left or the right rod, with the rod and the battery turning yellow if the strike is on the side predicted by the subject,) is immediate, i.e., it is provided right after the subject makes a prediction, with no delay. We now indicate this in the caption of Figure 1.

      • The task is presented to the subjects as a game in which predicting the correct location of the lightning strike results in electric power being collected in the battery. The horizontal bar at the bottom of the display is a gauge that indicates the amount of power collected in the current block of trials. It has no operational value in the task. We now mention it in the Methods section (l. 872-874).

      • The timeout trials were not included in the analysis. The timeout trials represented 1.27% of the trials, on average (across subjects); and for 95% of the subjects the timeout trials represented less than 2.5% of the trials. This information was added in Methods (l. 887-889).

      • Each new block of trials was presented to the subject as the lightning strikes occurring in a different town. The 200 passive trials at the beginning of each block, in which subjects were asked to observe a sequence of 200 strikes, were presented as the ‘track record’ for that town, and the instructions indicated that it was ‘useful’ to know this track record. No information was given on the mechanism governing the locations of the strikes. In the main text of the revised manuscript, we now include these details when describing the task (p. 6).

    1. Author Response

      Reviewer #1 (Public Review):

      Sun et al. investigated the circuit mechanism of a novel type of synaptic plasticity in the projection from the visual cortex to the auditory cortex (VC-AC), which is thought to play an important role in visuo-auditory associative learning. The key question behind this paper is what is the role of CCK positive projection from the entorhinal cortex in the plasticity of VC-AC projections? They discover that the strength of VC-AC projections does not change when pairing the stimulation of this pathway with the acoustic stimulation of the auditory cortex (AC) unless CCK is applied to the AC or CCK positive projection from the entorhinal cortex to auditory cortex (EC-AC) is optogenetically stimulated. In contrast, optogenetically stimulating VC-AC projections, which express a lower level of CCK than the EC-AC projection, do not induce such synaptic plasticity. Interestingly, the data also indicates that even if the EC-AC pathway is stimulated 500ms ahead of the pairing of stimulating VC-AC pathway and the AC, the VC-AC synaptic strength can still be potentiated, consistent with the long-lasting nature of CCK as a neuropeptide. By performing a fear conditioning assay, the authors demonstrate that the CCK signaling is indeed required for the association of visual and auditory cues.

      The proposed mechanism is interesting because it not only helps explain the heterosynaptic plasticity of the visual-auditory projection but also will provide insight into how the entorhinal cortex as an association area contributes to the association of visual and auditory cues. Nevertheless, this study suffers from the lack of a few key experiments, which prevents drawing a conclusion on the contribution of CCK release from the EC-AC projection to the plasticity of the VC→AC projection.

      We are grateful for the constructive comments provided by the reviewers and appreciate the significant effort they have dedicated to reviewing our manuscript. To enhance our study and strengthen our conclusions, we have made the following revisions in response to their feedback.

      1) One main conclusion from figures 1-3 is that CCK released from the EC-AC projection is required for the plasticity of VC-AC projection in addition to pairing VALS with noise/electrical stimulation. But the data in those figures cannot exclude alternative explanations that CCK alone or the pairing CCK with either VALS or noise are sufficient to make the VC-AC synaptic connection more potent. It concerns the mechanism underlying the effect of CCK: CCK may function simply as a neuromodulator to regulate the excitatory synaptic transmission, but not to promote long term synaptic plasticity.

      Thanks for the valuable comment and pointing out the weakness. In response to the comment, we have conducted additional control experiments to reinforce our conclusions. These include: For Figure 1G, we introduced three control groups: CCK alone (Figure1-figure supplement 1F-G), CCK + presynaptic activation of VC-to-AC inputs (Figure 1-figure supplement 1H-I), and CCK + postsynaptic firing induced by noise (Figure 1-figure supplement 1J-K). Our findings from these control experiments indicate that in all three scenarios, there was no potentiation of the VC-to-AC inputs. Further details can be found in Figure 1-figure supplement 1F-K.

      For Figure 2E, we introduced three control groups: HFS laser EC-to-AC alone (Figure 2-figure supplement 1H-I), HFS laser EC-to-AC + presynaptic activation of VC-to-AC inputs (Figure 2-figure supplement 1L-M), and HFS laser + postsynaptic firing induced by noise (Figure 2-figure supplement 1P-Q). And we found that in all three scenarios, the VC-to-AC inputs were not significantly potentiated. Please see details in Figure 2-figure supplement 1.

      Given that our in vivo results already demonstrated that neither HFS laser EC-to-AC alone, nor its combination with presynaptic or postsynaptic activation, potentiated the VC-to-AC inputs, we did not replicate these control groups in our ex vivo setup. These additional experiments enhance the robustness of our findings and address the initial concerns raised.

      2) Similar issue exists in Fig. 2H and 3J. Without proper controls, it is impossible to tell whether all three conditions (HFLSEA, VALA, noise/electrical stimulation) are necessary for potentiated AC responses to acoustic/electrical stimulation.

      Same as above, we have conducted additional control experiments to reinforce our conclusions. These include:

      For Figure 2H, we also tested the noise response in the above three control groups: HFS laser EC to AC alone (Figure 2-figure supplement 1J-K), HFS laser EC-to-AC + presynaptic activation of VC-to-AC inputs (Figure 2-figure supplement 1N-O), and HFS laser + postsynaptic firing induced by noise (Figure 2-figure supplement 1R-S). And we found that fEPSPs evoked by noise stimuli were significantly potentiated after HFS laser EC-to-AC + Post (Figure 2-figure supplement 1R-S). However, there was no potentiation observed following HFS laser EC-to-AC alone (Figure 2-figure supplement 1J-K) and HFS laser EC-to-AC + Pre (Figure 2-figure supplement 1N-O).

      These results suggest that both HFS laser targeting the EC-to-AC projection and noise-induced AC firing are required to potentiate the AC's response to acoustic stimuli. In contrast, activation of the VC-to-AC projection is not necessary. This finding aligns with our previous research (Li et al., 2014).

      Given the similarity in experimental design, we opted not to replicate these specific control groups in our ex vivo setup.

      These additional control experiments have been crucial in reinforcing the conclusions of our study.

      3) Fig. 2E and 3G show that the stimulation of CCK-positive EC-AC projection is required for the plasticity of VC-AC projection. Considering most EC-AC projection neurons co-release glutamate and CCK, however, we cannot tell if CCK or glutamate or both matter to this type of plasticity. Even though the long delay in Fig 5B is consistent with the neuropeptide nature of CCK, direct experimental evidence is needed, since it is where the novelty of the paper is.

      Thank you for your constructive feedback. In response to the suggestions, for Figure 2E, we have incorporated two additional experiments: one with a CCKB receptor (CCKBR) antagonist and another with ACSF infused into the AC prior to HFS laser EC-to-AC + Pre/Post Pairing (Figures 2N-P). Our findings demonstrate that the CCKBR antagonist effectively inhibited the potentiation of the VC-to-AC inputs following the HFS laser EC-to-AC + Pre/Post Pairing. Conversely, ACSF did not exhibit this inhibitory effect. For further information, please refer to Figures 2N-P. Given the similarity in experimental design, we opted not to replicate these groups in our ex vivo setup.

      4) In Fig. 6, the authors examined the necessity of CCK for the generation of the visuo-auditory association. The experimental approach of injection CCK receptor blocker or CCK-4 is not specific to the EC-AC pathway. There is neither a link between VC-AC plasticity nor this behavioral result. Thus, the explanatory power of this experiment is limited in the context set up by the first 5 figures.

      Thank you for highlighting this area for improvement. To enhance the explanatory power of our behavioral experiments, we conducted the following additional studies:

      1) Assessing the Necessity of CCK+ EC-to-AC Projection in Establishing Visuo-Auditory Association:

      We bilaterally injected AAV9-syn-DIO-hM4Di-eYFP or AAV9-syn-DIO-eYFP into the EC and implanted cannulae in the AC of Cck Ires-Cre mice. During the encoding phase, we inactivated the CCK+ EC-to-AC pathway via CNO infusion into the AC. Our results show that this inactivation prevents the behavioral establishment of an association between the visual stimulus (VS) and auditory stimulus (AS), without affecting the fear conditioning memory to the AS (Figure 6B, beige).

      2) Determining the Role of VC-to-AC Projection in Establishing Visuo-Auditory Association: We bilaterally injected AAV9-syn-hM4Di-eYFP or AAV9-syn-eYFP into the visual cortex (VC) and also implanted cannulae in the AC of Cck Ires-Cre mice. Inactivating the VC-to-AC pathway during the encoding phase with CNO infusion in the AC, we observed that this inactivation hinders the establishment of a behavioral association between VS and AS, but does not interfere with the fear conditioning memory to the AS (Figure 6B, red).

      3) Investigating the Importance of CCK+ EC-to-AC Projection in Recalling Recent Visuo-Auditory Association:

      Again, AAV9-syn-DIO-hM4Di-eYFP or AAV9-syn-DIO-eYFP was injected bilaterally into the EC, and cannulae were implanted in the AC of Cck Ires-Cre mice. By inactivating the CCK+ EC-AC pathway during the retrieval phase with CNO infusion into the AC, we found that such inactivation disrupted the recall of the recent association between VS and AS behaviorally, yet did not affect the fear conditioning memory to the AS (Figure 6D, beige).

      4) Assessing the Necessity of VC-to-AC Projection in Recalling Recent Association Memory: For this experiment, AAV9-syn-hM4Di-eYFP or AAV9-syn-DIO-eYFP was injected bilaterally into the VC, and cannulae were placed in the AC of Cck Ires-Cre mice. Inactivating the VC-AC pathway during the retrieval phase with CNO infusion in the AC led to the discovery that this inactivation disrupted the behavioral recall of the recent association between VS and AS but did not disrupt the fear conditioning memory to the AS (Figure 6D, red).

      These additional experiments significantly contribute to our understanding of the roles played by the CCK+ EC-AC and VC-AC projections in both the establishment and recall of visuo-auditory associative memories.

      5) In page 16, line 322-326, the authors concluded that to induce the plasticity of VC→AC projection, Delay 1 should be longer than 10 ms and Delay 2 should be longer than 0 ms. This conclusion was not fully supported by the data from Figure 5B-D, because there is no data point between -65 ms and 10 ms for Delay 1 (for example 0 ms), and no negative values for Delay 2.

      We rewrote this paragraph and hope it is more accurate now.

      “Taken together, our study indicates that significant potentiation of the VC-to-AC inputs can be observed (Figure 5D, black cube) across five pairing trials with a 10-second inter-trial interval, under certain tested conditions: (i) the frequency of repetitive laser stimulation of the CCK+ entorhinal cortex (EC) to AC projection was maintained at 10 Hz or higher (as we did not test frequencies between 1 to 10 Hz), (ii) Delay 1 was set within the tested range of 10 to 535 ms (noting the absence of data between -65 to 10 ms), and (iii) Delay 2 was within the range of 0 to 200 ms (acknowledging that negative values for Delay 2 were not explored).”

      Reviewer #2 (Public Review):

      The manuscript by Sun et al., investigates the synaptic plasticity underlying visuo-auditory association. Through a series of in vivo and ex vivo electrophysiology recordings, the authors show that high-frequency stimulation (HFLS) of the cholecystokinin (CCK) positive neurons in the entorhino-auditory projection paired with an auditory stimulus can evoke long-term potentiation (LTP) of the visuo-auditory projection. However, LTP of the visuo-auditory projection could not be elicited by HFLS of the visuo-auditory projection itself or by an unpaired stimulus. They further demonstrate that auditory stimulus pairing with CCK is required to elicit LTP of the visuo-auditory projection as well as visuo-auditory association in a fear conditioning behavioral experiment. As they found elevated expression of CCK in entorhinal neurons which project to the auditory cortex, they conclude that HFLS of the entorhino-auditory projection causes CCK release.

      Strengths:

      The authors use an elegant approach with Chrimson and Chronos to stimulate different auditory inputs in the same mouse in vivo and also in slice and demonstrate that potentiation of the visuo-auditory projection is dependent on HFLS of the entorhino-auditory projection paired with auditory stimulus. Furthermore, they test several parameters in a systematic fashion, generating a comprehensive analysis of the plasticity changes that regulate visuo-auditory association.

      Weaknesses:

      In their previous publications (Chen et al., 2019; Li et al., 2014; Zhang et al., 2020), it has been established that HFLS of the entorhino-auditory projection and CKK release are important for visuo-auditory association via electrophysiology and behavioral experiments. The Chrimson and Chronos approach was applied by Zhang et al., 2020, where they already found that the visuo-auditory projection was potentiated through HFLS of entorhino-neocortical fibers. This manuscript extends those findings by testing different parameters of pairing, which may not represent a major conceptual advance. Unlike the electrophysiological recordings, drug infusion is used in behavioral manipulations to show that HFLS of the entorhino-auditory projection is important for visuo-auditory association. While the use of drugs to inhibit CKK receptors is important, it does not directly demonstrate that CCK release from the entorhino-auditory is necessary.

      We deeply appreciate the reviewer's constructive and insightful feedback. Building on our previous work (Zhang et al., 2020), which highlighted the potentiation of the VC-to-AC projection through high-frequency laser stimulation (HFS laser) of entorhino-neocortical fibers, our current study probes further into the intricacies of this process. We have thoroughly explored the specific conditions necessary for the potentiation of the VC-to-AC projection, assessing a wide range of parameters.

      A significant advancement in our current research is the elucidation of why HFS of the VC-to-AC pathway alone fails to induce potentiation, whereas HFS of the EC-to-AC pathway, coupled with Pre/Post Pairing, is effective. This critical distinction is linked to the heightened expression of CCK in EC neurons projecting to the AC, in contrast to those from the VC. In this revised version of our study, we have also demonstrated that HFS laser stimulation of the EC-to-AC CCK+ projection induces the release of endogenous CCK in the AC using a combination of a CCK sensor and fiber photometry.

      Behaviorally, our revised research emphasizes the vital role of the CCK+ EC-AC projection in both establishing and retrieving visuo-auditory memories, thereby highlighting its fundamental importance in memory processing. Moreover, our study confirms that the CCK+ EC-AC projection is not only crucial for memory formation and retrieval but also indicates that the VC-to-AC projection is the anatomical basis for establishing visuo-auditory associations and serves as the principal storage site for visuo-auditory associative memory. These findings represent significant strides in our understanding of synaptic plasticity and memory mechanisms.

      For the behavioral part, to build the link that HFS laser of the EC-to-AC CCK+ projection is important for visuo-auditory association in the behavioral context, we conducted the following additional behavioral studies (for details please see the response to comment 4 of reviewer 1):

      1) Assessing the Necessity of CCK+ EC-to-AC Projection in Establishing Visuo-Auditory Associative memories, by inactivating the pathway with inhibitory DREADD during the encoding phase.

      2) Investigating the Importance of CCK+ EC-to-AC Projection in Recalling Visuo-Auditory Association, by inactivating the pathway with inhibitory DREADD during the retrieving phase.

    1. Author Response

      Reviewer #1 (Public Review):

      This paper combines an array of techniques to study the role of cholecystokinin (CCK) in motor learning. Motor learning in a pellet reaching task is shown to depend on CCK, as both global and locally targeted CCK manipulations eliminate learning. This learning deficit is linked to reduced plasticity in the motor cortex, evidenced by both slice recordings and two-photon calcium imaging. Furthermore, CCK receptor agonists are shown to rescue motor cortex plasticity and learning in knockout mice. While the behavioral results are clear, the specific effects on learning are not directly tested, nor is the specificity pathway between rhinal CCK neurons and the motor cortex. In general, the results present interesting clues about the role of CCK in motor learning, though the specificity of the claims is not fully supported.

      Since all CCK manipulations were performed throughout learning, rather than after learning, it is not clear whether it is learning that is affected or if there is a more general motor deficit. Related to this point, Figure 1D appears to show a general reduction in reach distance in CCK-/- mice. A general motor deficit may be expected to produce decreased success on training day 1, which does not appear to be the case in Figure 1C and Figure 2B, but may be present to some degree in Figure 5B. Or, since the task is so difficult on day 1, a general motor deficit may not be observable. It is therefore inconclusive whether the behavioral effect is learning-specific.

      Thanks for your comments and suggestions.

      We have tested the basic movement ability of CCK-/- and WT mice and we found that there were no significant difference between CCK-/- and WT in terms of stride length, stride time, step cycle ratio and grasp force (Figure S1C, S1D, S1E, S1F). Besides, we also have tested the performance of mice injected with CCKBR antagonist or injected with hM4Di together with clozapine after learned the task (Figure S2D, S8D). The performance of mice before and after antagonist injection or chemogenetic manipulation were comparable. These results suggested that all the CCK manipulations did not cause general defects to the movement ability of mice.

      The paper implicates motor cortex-projecting CCK neurons in the rhinal cortex as being a key component in motor learning. However, the relative importance of this pathway in motor learning is not pinned down. The necessity of CCK in the motor cortex is tested by injecting CCK receptor antagonists into the contralateral motor cortex (Figure 2), though a control brain region is not tested (e.g. the ipsilateral motor cortex), so the specificity of the motor cortex is not demonstrated.

      Thanks for your comments and suggestions.

      In this study, we focus on the role played by CCK from the rhinal cortex to the motor cortex, and how CCK affects motor learning. The single pellet reaching task was selected to study the role of CCK from the rhinal cortex to the motor cortex in motor skill learning and the motor cortex is considered as the main area generates motor memory when training in this task (Komiyama et al., 2010; Peters et al., 2014; Richard et al., 2019). We emphasized that the importance of the motor cortex in motor learning, not meant that other brain areas where also receive CCK-positive neural projections from the rhinal cortex, for example hippocampus (spatial memory), are not important for the performance of this task. In fact, specifically inhibiting the projection from the rhinal cortex to the contrallateral motor cortex is not enough to suppress the motor learning ability of, but inhibiting projecting in both sides (contro- and ipsi-lateral) could suppress the learning ability of mice, suggesting that the whole motor cortex is critical for motor skill learning (Figure 6, S8). In this paper, we studied the relationship between the rhinal cortex and the motor cortex and the role played by CCK in this circuit. The specificity of the motor cortex is task-dependent, not the main purpose in this study.

      The learning-related source of CCK in the motor cortex is also unclear, since even though it is demonstrated that CCK neurons in the rhinal cortex project to the motor cortex in Figure 4D, Figure 4C shows that there is also a high concentration of CCK neurons locally within the motor cortex. Likewise, the importance of the projection from the rhinal cortex to the motor cortex is not specifically tested, as rhinal CCK neurons targeted for inactivation in Figure 5 include all CCK cells rather than motor cortex-projecting cells specifically.

      Thanks for your comments and suggestions.

      The specificity of the CCK-projection from the rhinal cortex to the motor cortex for motor skill learning was studies using chemogenetic methods in the revised version of the manuscript. We first determined that over 98% of neurons in the rhinal cortex that projected to the motor cortex are CCK positive (Figure 6A, S6A, S6B). Next, we injected the retro-Cre virus in the motor cortex and the Cre-dependent hM4Di in the rhinal cortex in C57BL/6 mice to specifically inhibit the CCK neurons from the rhinal cortex to the motor cortex. Compared to two control groups, the learning ability of the experimental group was significant suppressed, suggesting that CCK projections from the rhinal cortex to the motor cortex are critical for motor skill learning (Figure 6). Detailed description was added in the part of "Result" in the manuscript.

      CCK is suggested to play a role in producing reliable activity in the motor cortex through learning through two-photon imaging experiments. This is useful in demonstrating what looks like normal motor cortex activity in the presence of CCK receptor antagonist, indicating that the manipulations in Figure 2 are not merely shutting off the motor cortex. It is also notable that, as the paper points out, the activity appears less variable in the CCK manipulations (Figure 3G). However, this could be due to CCK manipulation mice having less-variable movements throughout training. The Hausdorff distance is used for quantification against this point in Figure 1E, though the use of the single largest distance between trajectories seems unlikely to give a robust measure of trajectory similarity, which is reinforced by the CCK-/- traces looking much less variable than WT traces in Figure 1D. The activity effects may therefore be expected from a general motor deficit if that deficit prevented the mice from normal exploratory movements and restricted the movement (and activity) to a consistently unsuccessful pattern.

      Thanks for your comments and suggestions.

      To totally suppress CCK receptors in the motor cortex, the antagonist is unavoidable to diffuse to the adjacent brain areas as the motor cortex is not regularly circular. But the area inhibited most should be the motor cortex. We applied the chemogenetics method to further determine the specificity of the motor cortex in the motor skill learning. Specific projection from the RC to the MC was inhibited bilaterally, which suppressed the motor learning ability.

      For a wild-type mouse, neurons were activated when it try to get the food pellet. Neuronal pattern corresponding to each trial will be remembered, and the patterns corresponding to successful movements will tend to be repeated. Manipulations of CCK prevented neurons from remembering the pattern they tried and repeated the pattern they tried before no matter it is successful or not. This is corresponding to the neuron-activation pattern showed in figure 3D, 3E and 3G, the population activities (neuronal activities) are comparable, while the trial-to-trial population correlation is a little bit higher for the CCK-manipulation groups on Day 1. In terms of the behavior, manipulations of CCK decreased the possibility to explore the best path to get food pellets and just repeating a reach for the food pellet like it was the first time. Besides, many tests including the movement ability of CCK-/-, performance of antagonist injection group and chemogenetics manipulation group after learning indicated that CCK-manipulation did not affect the basic movement ability.

      Hausdorff distance is the greatest of all the distances from a point in one set to the closest point in the other set. It is not just the largest distance between two trajectories, but comprehensively takes all points in each trajectory into consideration. Hausdorff distance is widely used to assess the variation of two trajectories. The similarity of the shapes of trajectories is not applied for analysis because it is not very effective to assess the performance of a mouse. The fixed location of the initial site and food site makes all trajectories are single lines in the same direction, thus, the shapes of the trajectories are very similar among different trials. Two trajectories with similar shape but far from each other (big Hausdorff distance) should be treated as big variation because, in terms of the final results, they are quite different (success vs. miss). Therefore, Hausdorff distance is more reliable to be applied for assessment of the performance of mice.

      Finally, slice experiments are used to demonstrate the lack of LTP in the motor cortex following CCK knockout, which is rescued by CCK receptor agonists. This is a nice experiment with a clear result, though it is unclear why there are such striking short-term depression effects from high-frequency stimulation observed in Figure 6A that are not observed in Figure 1H. Also, relating to the specificity of the proposed rhinal-motor pathway, these experiments do not demonstrate the source of CCK in the motor cortex, which may for example originate locally.

      Thanks for your comments.

      1. Because CCK4 is a small molecule, which degrades very fast with half-time less than 1 min in the rat serum and 13 min in the human serum, we injected the drug into the electrode recording dishes, while the ACSF was stopped flowing, leading to a relatively low oxygen condition. As it showed in Figure 6A, it cost about 15 min for the brain slices to recover. Compared with CCK4 manipulation, the depression of vehicle group is stronger, which could be due to the effects of CCK4 induced LTP after HFS compensated the depression.

      2. In the motor cortex, many CCK-positive neurons are γ-aminobutyric acid-ergic (GABAergic) neurons, in which the role played by CCK is not very clear (Whissell et al., 2015). However, evidence showed that GABA may inhibit the release of CCK in the neocortex (Yaksh et al., 1987). Many glutamatergic neurons in the neocortex also express CCK (Watakabe et al., 2012). In this study, the stimulation electrode was placed on the layer 1, where receives most CCK projections from the rhinal cortex, to release CCK from the rhinal cortex, but can not rule out the possibility that some CCK may release from the local CCK neurons (Figure 4B). We focused on the importance of CCK for neural plasticity in the motor cortex, but did not aim to figure out the role played by the cortical CCK-positive neurons, including inhibitory and excitatory neurons, in neuronal plasticity and motor skill learning by this experiment.

      Therefore, the specificity of the projections from the rhinal cortex to the motor cortex was further studied by chemogenetic manipulation. Inhibiting the activity of the projections suppressed the learning ability compared with two types of control manipulations, indicating the CCK projections from RC to the MC is critical for motor skill learning.

      Reviewer #2 (Public Review):

      This study aims to test whether and if so, how cholecystokinin (CCK) from the mice rhinal cortex influences neural activity in the motor cortex and motor learning behavior. While CCK has been previously shown to be involved in neural plasticity in other brain regions/behavioral contexts, this work is the first to demonstrate its relationship with motor cortical plasticity in the context of motor learning. The anatomical projection from the rhinal cortex to the motor cortex is also a novel and important finding and opens up new opportunities for studying the interactions between the limbic and motor systems. I think the results are convincing to support the claim that CCK and in particular CCK-expressing neurons in the rhinal cortex are critical for learning certain dexterous movements such as single pellet reaching. However, more work needs to be done, or at least the following concerns should be addressed, to support the hypothesis that it is specifically the projection from the rhinal cortex to the motor cortex that controls motor learning ability in mice.

      1)Because CCK is expressed in multiple brain regions, as the authors recognized, results from the CCK knock-out mice could be due to a global loss of neural plasticity. In comparison, the antagonist experiment is in my opinion the most convincing result to support the specific effect of CCK in the motor cortex. However, it is unclear to me whether the CCK knock-out mice exhibited an impaired ability to learn in general, i.e., not confined to motor skills. For instance, it would be very valuable to show whether these mice also had severe memory deficits; this would help the field to understand different or similar behavioral effects of CCK in the case of global vs. local loss of function. If the CCK knock-out mice only exhibited motor learning deficits, that would be surprising but also very interesting given previous studies on its effect in other brain areas.

      Thanks for your comments. According to the studies in our lab, we found that CCK is critical for the neural plasticity in the auditory cortex, hippocampus and the amygdala and CCK-/- mice performed much worse than wildtype mice in associative, spatial and fear memory (Li et al.,2014; Chen et al., 2019; Su et al. 2019; Feng et al. 2021).

      2) Related to my last point, I believe that normal neural plasticity should be essential to motor skill learning throughout development not just during the current task. Thus, it would be important to show whether these CCK knock-out mice present any motor deficits that could have resulted from a lack of CCK-mediated neural plasticity during development. If not, the authors should explain how this normal motor learning during development is consistent with their major hypothesis in this study (e.g., is CCK not critical for motor learning during early development).

      Thanks for your comments and suggestions.

      Development is mainly gene-guided which prepares the physical structure for learning, while learning is dependent on the neural plasticity and a period of experience (such as motor training in this research). Besides, development is deemed as "experience-expectant", using common environmental information, while learning is "experience-dependent", sensitive to the specific individual experiences (Greenough et al., 1987; Galván, 2010). Moreover, development costs longer time to form a specific ability of a species in general. The role of CCK plays in the development is not clear. Duchemin et al. (1987) studied the CCK gene expression level in the brain of rats pre- and postnatally. They found that the CCK mRNA was detectable on embryonic day 14 (E14) and gradually increased to the maximum level on postnatal day 14 (P14), indicating that CCK might participate in the development of rats. Paolo et al. (2007) mapped the expression of CCK in the mouse brain. Plentiful CCK expression was observed at E12.5 in the thalamus and spinal cord and by E17.5 CCK expression extended to the cortex, hippocampus and hypothalamus, suggesting that CCK might also regulate the development of mice. Paolo et al. (2004) found that CCK suppressed the migration of GnRH-1 through CCK-A receptor in the brain. Besides, postnatal early learning may participate in development. CCK-B receptor antagonist administration (postnatal 6 hours) suppressed the infant sheep get motor preference, indicating that CCK might be important for the development of mother preference of sheep. However, what the role CCK played in the development of motor system is not known.

      In this study, the performance of both CCK-/- and WT mice is at the same level without significant difference on Day one, in terms of the percentage of "miss", "no-grasp", "drop" and "success". Besides, the movement abilities, including stride length, stride time, step cycle ratio and grasp force, were comparable for both CCK-/- and WT mice (Figure S1C, S1D, S1E, S1F), suggesting that knockout of cck gene did not affect the basic movement ability. This could be because the development of basic movement ability is not learning-guided, but is physical structure-determined. However, all these tests were on physical level, but how CCK affected the motor system on the molecular and cellular level is not known. Therefore, we further applied CCK-BR antagonist and chemogenetic method to study the role of CCK in the motor learning.

      3)Lines 198-200 and Fig. 2C: The authors found that the vehicle group showed significantly increased "no grasp" behavior, and reasoned that the implantation of a cannula may have caused injuries to the motor cortex. In order to support their reasoning and make the control results more convincing, I think it would be helpful to show histology from both the antagonist and control groups and demonstrate motor cortical injury in some mice of the vehicle group but not the antagonist group. Otherwise, I'm a bit concerned that the methods used here could be a significant confounding factor contributing to motor deficits.

      Thanks for your comments and suggestions.

      The injury of the motor cortex can not be avoided, because the cannula was inserted below the surface of the cortex (Figure S2C). The significantly increased "no-grasp" rate is because the improvement of miss rate of the Vehicle group, which turned to "no-grasp" but failed to further improve to drop or success, while for the Antagonist group, there is no significant improving from "miss" to "no-grasp", leaving no change in the "no grasp".

      4) The authors showed that chemogenetic inhibition of CCK neurons in the rhinal cortex impaired motor skill learning in the pellet-reaching task. However, we know that the rhinal cortex projects to multiple brain regions besides the motor cortex (e.g., other cortical areas and the hippocampus). Thus, the conclusion/claim that the observed behavioral deficits resulted from inhibited rhinal-motor cortical projections is not strongly supported without more targeted loss-of-function or rescue experiments.

      It would also be very informative to the field to compare the specific behavioral deficits, if any, of inhibiting specific downstream targets of the rhinal CCK neurons. As a concrete example, the hippocampus may be involved in learning more sophisticated motor skills (as the authors pointed out in the Discussion) besides the motor cortex. It would be a critical result if the authors could either show or exclude the possibility that the motor learning deficits observed in CCK-/- mice were at least partially due to the inhibition of hippocampal plasticity. This echoes my earlier point (point 1) that it is unclear whether the effect of lacking CCK in knock-out mice is specific in the motor cortex or engages multiple brain regions.

      Lastly, because Fig. 4 only showed histology in the rhinal and motor cortices, I am not sure whether the motor cortex solely receives CCK input from the rhinal cortex. A more comprehensive viral tracing result could be important to both supporting the circuit-specificity of the observed behavior in this study and providing a clearer picture of where the motor cortex receives CCK inputs.

      Thanks for your comments.

      The specificity of the CCK-projection from the rhinal cortex to the motor cortex for motor skill learning was studies using chemogenetic methods in the revised version of the paper. We first determined that over 98% of neurons in the rhinal cortex that projected to the motor cortex are CCK positive (Figure 6A, S6A, S6B). Next, we injected the retro-Cre virus in the motor cortex and the Cre-dependent hM4Di in the rhinal cortex in C57BL/6 mice to specifically inhibit the CCK neurons from the rhinal cortex to the motor cortex. Compared to two control groups, the learning ability of the experimental group was significantly suppressed, suggesting that CCK projections from the rhinal cortex to the motor cortex are critical for motor skill learning (Figure 6). Detailed description was added in the part of "Result" in the manuscript.

      In this study, we focus on the role played by CCK from the rhinal cortex, and how CCK affects motor learning. The single pellet reaching task was selected to study the role of CCK from the rhinal cortex in motor skill learning and the motor cortex is considered as the main area generates motor memory when training in this task (Komiyama et al., 2010; Peters et al., 2014; Richard et al., 2019). We emphasized that the importance of the contrallateral motor cortex in motor learning, not meant that other brain areas where also receive CCK-positive neural projections from the rhina cortex, for example hippocampus (spatial memory), are not important for the performance of this task. In fact, specifically inhibiting the projection from the rhinal cortex to the contrallateral motor cortex is not enough to suppress the motor learning ability, but inhibiting projecting in both sides (contro- and ipsi-lateral) could suppress the learning ability of mice, suggesting that the whole motor cortex is critical for motor skill learning (Figure 6, S8). In our lab, we found that CCK projection from the entorhinal cortex to the hippocampus is critical for spatial memory formation (Su et al., 2019). Impaired hippocampus, to some extent, affected the performance in single pellet reaching task (Shwuhuey et al., 2007). Therefore, manipulation of CCK projections from the rhinal cortex to the hippocampus may also affect the performance in the single pellet reaching task. In this paper, we aim to study the relationship between the rhinal cortex and the motor cortex and the role played by CCK in this circuit. Other brain areas involved in the single pellet reaching task are not the core concern in this study.

      The motor cortex also receive CCK projections from other cortices, such as the contrallateral motor cortex, the deep layer of visual cortex and auditory cortex, and thalamus (Figure S4).

      5) I am glad to see the CCK4 rescue experiment to demonstrate the sufficiency of CCK in promoting motor learning. However, the rescue experiment lacked specificity: IP injection did not allow specific "gain of function" in the motor cortex but instead, the improved learning ability in CCK knock-out mice could be a result of a global effect of CCK4 across multiple brain regions. CCK4 injection specifically targeted at the motor cortex would be necessary to support the sufficiency of CCK-regulated neuroplasticity in the motor cortex to promote motor learning.

      Thanks for your comments.

      First, the specificity of the circuit were studied by injecting a Cre virus in the MC and a Cre-dependent hM4Di virus in the RC. After injection with clozapine, the motor learning ability were significantly suppressed compared with the saline control and the control virus combined with clozapine.

      Besides, we emphasized that the importance of the motor cortex in motor learning, not meant that other brain areas where also receive CCK-positive neuronal projections from the rhinal cortex, for example hippocampus (spatial memory), are not important for the performance of this task. Specific infusion the drug into the motor cortex is hard to rescue the motor learning ability of CCK-/- mice because the motor cortex is very large, varying from AP: -1.3 to 2.46 mm and ML: ±0.5 to ±2.75 mm and other areas receiving CCK projections from the rhinal cortex also could be important for motor learning. Actually, we tried to inject CCK into the motor cortex through a drug cannula, but the result showed that it is hard to compensate the knock out of cck gene in the whole brain, and rescue the motor learning ability (Figure S11D, S11E). Moreover, cannula implantation causes inescapable injury to the motor cortex, because the cannula must be inserted into the brain, so that the drug could be infused into the brain. This injury may affect the performance in the task, as the motor cortex is very critical for motor learning. Therefore, it is not the best method to be applied for motor skill rescuing.

      Furthermore, CCK4 molecules can be transported to the whole brain by i.p. injection, as CCK4 is capable to pass through brain blood barrier, which compensates the knockout of cck gene in the whole brain, leading to the rescuing of motor learning ability. Furthermore, i.p. injection is widely accepted for drug discovery because it is very convenient, simply manipulated and does not causes any direct injury on the brain. Thus, we applied i.p. injection not only for whole brain CCK compensation, but also for the further study of the application in drug discovery.

      Reviewer #3 (Public Review):

      The authors elucidated the roles of cholecystokinin (CCK)-expressing excitatory neurons, which project from the rhinal cortex to the motor cortex, in motor skill learning. The authors found CCK knock-out mice exhibited learning defects in the pellet reaching task while the baseline success rate of the knock-out mice was similar to that of the wild-type mice. Application of a CCK B receptor (CCKBR) antagonist into the motor cortex lowered the success rate in the motor task. The authors found the population activity which was observed in the in vivo calcium imaging during motor learning was elevated after motor learning, but this increase disappeared in CCK knock-out mice and animals with CCKBR antagonist administration. Anterograde and retrograde viral tracing revealed that CCK-expressing excitatory neurons in the rhinal cortex projected to the motor cortex. Chemogenetic inhibition of the CCK-expressing neurons in the rhinal cortex lowered the ability for motor learning. The application of a CCKBR agonist increased the motor learning ability of CCK knock-out animals as well as long-term potentiation (LTP) observed in the slice of the motor cortex.

      However, the manuscript contains several shortcomings:

      First, the "Discussion" has several statements that are only supported weakly by the results, for example, ll. 429-431, ll. 432-433, and ll. 447-448. In addition, most of the sentences in this section are not divided into subsections. The paragraphs should be composed in multiple subsections with appropriate subheadings, even though the initial section summarizing the results can lack a subheading.

      Thanks for your suggestions. The statements were revised and the discussion was divided into subsections.

      Second, it would be important that the authors showed which area(s) of the brain is affected by the CCKBR antagonist in the experiments described in ll. 166-206 and Fig. 2. The authors injected the drug into the motor cortex, but the chemical can spread to neighboring cortical areas (e.g. somatosensory cortex) or wider brain regions. If so, the blockade of the CCKBR in the brain areas other than the motor cortex could cause the defects of the motor task learning observed in these experiments. I think it is desirable that such a possibility should be excluded. Conversely, it is possible that the antagonist had an effect on a limited subarea of the motor cortex (e.g. only the primary motor cortex (M1)). In this case, the information about the field altered by the CCKBR blocker would be useful to interpret the results of the learning defects.

      Thanks for your comments and suggestions.

      The drug cannula was implanted in the motor cortex (coordinates: AP, 1.4 mm, ML, -/+1.6 mm, DV, 0.25 - 0.3 mm) contralateral to the dominant hand of the mice (Figure S2C). To totally inhibit CCKBR in the motor cortex, we injected over-dosage of antagonist into the motor cortex. Thus, we cannot totally exclude the possibility that some antagonist spread to the neighboring cortices. However, the fact is that the motor cortex is very large, varying from AP: -1.3 to 2.46 mm and ML: ±0.5 to ±2.75 mm. It is not easily to spread out of the motor cortex with high concentration.

      Third, the authors need to show bilateral data about their anterograde and retrograde tracking of CCK-expressing neurons in the rhinal cortex. In ll. 290-292, they described as follows: "Both anterograde and retrograde tracking results indicated that CCK-expressing neurons in the rhinal cortex projecting to the motor cortex were asymmetric, showing a preference for the ipsilateral hemisphere." However, they provided only unilateral data for the anterograde (Fig. 4B) and the retrograde (Fig. 4D) experiments.

      Thanks for your comments. Both anterograde and retrograde tracking data from bilateral hemisphere were added to the supplementary file (Figure S4).

      Fourth, unilateral (contralateral to the dominant forelimb) experiments are needed in the chemogenetic inhibition of the CCK neurons. In ll. 301-338 and Fig. 5, the authors inhibited the CCK -expressing neurons in both hemispheres by injecting the virus into both sides. However, the CCKBR antagonist injection into the motor cortex contralateral to the dominant forelimb caused defects in motor learning ability, as described in ll. 166-206. The authors also observed that the population neuronal activity in the motor cortex contralateral to the dominant forelimb changed in accordance with the improvement of the motor skill in ll. 208-269. Therefore, it may be the case that inhibition of CCK neurons only in the side contralateral to the dominant forelimb - not bilaterally, as the authors did - could cause the lowered ability of motor learning. Such unilateral inhibition can be carried out by unilateral injection of the virus. In relation to the point above, in the chemogenetic inhibition experiments, it would be important to show which neurons in which cortical area is inhibited. This could be done by examining the distributions of the mCherry-labeled somata in the rhinal cortex using histochemistry.

      Thanks for your comments and suggestions.

      The specific of the CCK-projection from the rhinal cortex to the motor cortex for motor skill learning was studied using chemogenetic methods in the revised version of the paper. We first determined that over 98% of neurons in the rhinal cortex that projected to the motor cortex are CCK positive by retrograde virus injection and immunostaining (Figure 6A, S6A, S6B). Next, we injected the retro-Cre virus in the motor cortex and the Cre-dependent hM4Di in the rhinal cortex in C57BL/6 mice to specifically inhibit the CCK neurons from the rhinal cortex to the motor cortex. Compared to two control groups, the learning ability of the experimental group was significant suppressed, suggesting that CCK projections from the rhinal cortex to the motor cortex are critical for motor skill learning (Figure 6). Furthermore, we also injected the retro-Cre virus into the single site of the motor cortex controlateral to the dominant forelimb together with Cre-dependent hM4Di virus in the rhinal cortex. The result showed that after injection of clozapine, the motor learning ability was not significantly suppressed, suggesting that the bilateral motor cortex is important for motor skill learning. This is consistent with the previous findings that the increased GluA1 expression were observed bilaterally in the motor cortex after training in the single pellet reaching task. Detailed description was added in the part of "Result" in the manuscript.

      Fifth, it would be valuable to further examine differences in task performance across sessions and groups. The paragraph in ll. 138-153 needs a comparison of the "miss" rates of CCK-/- animals between Day 1 vs. Day 6 (related to ll. 429- 431). This paragraph also needs comparisons of the "no-grasp" and "drop" rates of CCK-/- animals between Day 1 vs. Day 6 (related to ll. 432- 433). The paragraph in ll. 175-190 needs comparisons of success rates between Day 1 and Day 5/6 within the antagonist group (related to ll. 447-448).

      Thanks for your comments. The comparisons were made in the revised manuscript.

    1. Author Response

      Reviewer #1 (Public Review):

      This thorough study expands our understanding of BMP signaling, a conserved developmental pathway, involved in processes diverse such as body patterning and neurogenesis. The authors applied multiple, state-of-art strategies to the anthozoan Nematostella vectensis in order to first identify the direct BMP signaling targets - bound by the activated pSMAD1/5 protein - and then dissect the role of a novel pSMAD1/5 gradient modulator, zwim4-6. The list of target genes features multiple developmental regulators, many of which are bilaterally expressed, and which are notably shared between Drosophila and Xenopus. The analysis identified in particular zswim4-6 a novel nuclear modulator of the BMP pathway conserved also in vertebrates. A combination of both loss-of-function (injection of antisense morpholino oligonucleotide, CRISPR/Cas9 knockout, expression of dominant negative) and gain-of-function assays, and of transcriptome sequencing identified that zwim acts as a transcriptional repression of BMP signaling. Functional manipulation of zswim5 in zebrafish shows a conserved role in modulating BMP signaling in a vertebrate.

      The particular strength of the study lies in the careful and thorough analysis performed. This is solid developmental work, where one clear biological question is progressively dissected, with the most appropriate tools. The functional results are further validated by alternative approaches. Data is clearly presented and methods are detailed. I have a couple of comments.

      1) I was intrigued - as the authors - by the fact that the ChiP-Seq did not identify any known BMP ligand bound by pSMAD1/5. Are these genes found in the published ChiP-Seq data of the other species used for the comparative analysis? One hypothesis could be that there is a change in the regulatory interactions and that the initial set-up of the gradient requires indeed a feedback loop, which is then turned off at later gastrula. In this case, immunoprecipitation at early gastrula, prior to the set-up of the pSMAD1/5 gradient, could reveal a different scenario. Alternately, the regulation could be indirect, for example, through RGM, an additional regulator of BMP signaling expressed on the side of lower BMP activity, which is among the targets of the ChiP-Seq. This aspect could be discussed. Additionally, even if this is perhaps outside the scope of this study, I think it would be informative to further assess the effect of ZSWIM manipulation on RGM (and vice versa).

      Indeed, BMP genes are direct BMP signaling targets in Drosophila (dpp) (Deignan et al., 2016, https://doi.org/10.1371/journal.pgen.1006164) and frog (bmp2, bmp4, bmp5, bmp7) (Stevens et al., 2021, https://doi.org/10.1242/dev.145789). Of all these ligands, only the dorsally expressed Xenopus bmp2 is repressed by BMP signaling, while another dorsally expressed Xenopus BMP gene admp is not among the direct targets. All other BMP genes listed here are expressed in the pMad/pSMAD1/5/8-positive domain and are activated by BMP signaling.

      In Nematostella, we do not find BMP genes among the ChIP-Seq targets, but this is not that surprising considering the dynamics of the bmp2/4, bmp5-8 and chordin expression, as well as the location of the pSMAD1/5-positive cells. In late gastrulae/early planulae, Chordin appears to be shuttling BMP2/4 and BMP5-8 away from their production source and over to the gdf5-like side of the directive axis (Genikhovich et al., 2015; Leclere and Rentsch, 2014). By 4 dpf, chordin expression stops, and BMP2/4 and BMP5-8 start to be both expressed AND signal in the mesenteries. If bmp2/4 and bmp5-8 expression were directly suppressed by pSMAD1/5 (as is the case chordin or rgm expression), this mesenterial expression would not be possible. Therefore, in our opinion, it is most likely that at late gastrula and early planula the regulation of bmp2/4 and bmp5-8 expression by BMP signaling is indirect. We do not have an explanation for why gdf5-like (another BMP gene expressed on the “high pSMAD1/5” side) is not retrieved as a direct BMP target in our ChIP data. Since we do not understand well enough how BMP gene expression is regulated, we do not discuss this at length in the manuscript.

      As the Reviewer suggested, we analyzed the effect of ZSWIM4-6 KD on the expression of rgm. Expectedly, since it is expressed on the “low BMP side”, its expression was strongly expanded (Figure 6 - Figure Supplement 4)

      2) I do not fully understand the rationale behind the choice of performing the comparative assays in zebrafish: as the conservation was initially identified in Xenopus, I would have expected the experiment to be performed in frog. Furthermore, reading the phylogeny (Figure 4A), it is not obvious to me why ZSWIM5 was chosen for the assay (over the other paralog ZSWIM6). Could the Authors comment on this experiment further?

      The comparison was done in zebrafish because we were planning to generate zswim5 mutants, whose analysis is currently in progress. ZSWIM6 is not expressed at the developmental stages we were interested in, while ZSWIM5 was, based on available zebrafish expression data (White et al., 2017):

      Reviewer #2 (Public Review):

      The authors provide a nice resource of putative direct BMP target genes in Nematostella vectensis by performing ChIP-seq with an anti-pSmad1/5 antibody, while also performing bulk RNA-seq with BMP2/4 or GDF5 knockdown embryos. Genes that exhibit pSmad1/5 binding and have changes in transcription levels after BMP signaling loss were further annotated to identify those with conserved BMP response elements (BREs). Further characterization of one of the direct BMP target genes (zswim4-6) was performed by examining how expression changed following BMP receptor or ligand loss of function, as well as how loss or gain of function of zswim4-6 affected development and BMP signaling. The authors concluded that zswim4-6 modulates BMP signaling activity and likely acts as a pSMAD1/5 dependent co-repressor. However, the mechanism by which zswim4-6 affects the BMP gradient or interacts with pSMAD1/5 to repress target genes is not clear. The authors test the activity of a zswim4-6 homologue in zebrafish (zswim5) by over-expressing mRNA and find that pSMAD1/5/9 labeling is reduced and that embryos have a phenotype suggesting loss of BMP signaling, and conclude that zswim4-6 is a conserved regulator of BMP signaling. This conclusion needs further support to confirm BMP loss of function phenotypes in zswim5 over-expression embryos.

      Major comments

      1) The BMP direct target comparison was performed between Nematostella, Drosophila, and Xenopus, but not with existing data from zebrafish (Greenfeld 2021, Plos Biol). Given the functional analysis with zebrafish later in the paper it would be nice to see if there are conserved direct target genes in zebrafish, and in particular, is zswim5 (or other zswim genes) are direct targets. Since conservation of zswim4-6 as a direct BMP target between Nematostella and Xenopus seemed to be part of the rationale for further functional analysis, it would also be nice to know if this is a conserved target in zebrafish.

      Thank you for the suggestion. In the paper by Greenfeld et al., 2021, zebrafish zswim5 was downregulated approximately 2.4x in the bmp7 mutant at 6 hpf, while zswim6 was barely expressed and not affected at this stage. We added this information to the text of the manuscript. Expression of several other zebrafish zswim genes was also affected in the bmp7 mutant, but these genes do not appear relevant for our study since their corresponding orthologs are not identified as pSMAD1/5 ChIP-Seq targets in Nematostella. Notably, zebrafish zzswim5 is not clearly differentially expressed in BMP or Chd overexpression conditions (See Supplementary file 1 in Rogers et al. 2020). Importantly, in the paper, we wanted to compare ChiP-Seq data with ChIP-Seq data, however, unfortunately, no ChIP-Seq data for pSMAD1/5/8 is currently available for zebrafish, thus precluding comparisons.

      Related to this, in the discussion it is mentioned that zswim4/6 is also a direct BMP target in mouse hair follicle cells, but it wasn't obvious from looking at the supplemental data in that paper where this was drawn from.

      Please see Supplementary Table 1, second Excel sheet labeled “Mx ChIP_Seq” in Genander et al., 2014, https://doi.org/10.1016/j.stem.2014.09.009. Zswim4 has a single pSMAD1 peak associated with it, Zswim6 has two.

      2) The loss of zswim4-6 function via MO injection results in changes to pSmad1/5 staining, including a reduction in intensity in the endoderm and gain of intensity in the ectoderm, while over-expression results in a loss of intensity in the ectoderm and no apparent change in the endoderm. While this is interesting, it is not clear how zswim4-6 is functioning to modify BMP signaling, and how this might explain differential effects in ectoderm vs. endoderm. Is the assumption that the mechanism involves repression of chordin? And if so one could test the double knockdown of zswim4-6 and chordin and look for the rescue of pSad1/5 levels or morphological phenotype.

      We do not think that the mechanism of the ZSWIM4-6 action is via repression of Chordin. As loss of chordin leads to the loss of pSMAD1/5 in Nematostella (Genikhovich et al., 2015), the proposed experiment is, unfortunately, not feasible to test this hypothesis. Currently, we see two distinct effects of the modulation of zswim4-6 expression. First, it affects the pSMAD1/5 gradient, possibly by destabilizing nuclear SMAD1/5, as has been proposed by Wang et al., 2022 for the vertebrate Zswim4. This is in line with our results shown on Fig. 6C-F’ and Fig. 6-Figure supplement 3. In our opinion, the reaction of the genes expressed on the “high BMP” side of the directive axis to the overexpression or KD of ZSWIM4-6 (Fig. 6I-K’, 6N-P’) can be explained by these changes in the pSMAD1/5 signaling intensity. Secondly, zswim4-6 appears to promote pSMAD1/5-mediated gene repression. This is in line with the reaction of the genes expressed on the “low BMP” side of the directive axis (Fig. 6G-H’, 6L-M’, Fig. 6-Figure Supplement 4). These genes are repressed by BMP signaling, but they expand their expression upon zswim4-6 KD in spite of the increased pSMAD1/5. Our ChiP experiment (Fig. 6Q) supports this view.

      3) Several experiments are done to determine how zswim4-6 expression responds to the loss of function of different BMP ligands and receptors, with the conclusion being that swim4-6 is a BMP2/4 target but not a GDF5 target, with a lot of the discussion dedicated to this as well. However, the authors show a binary response to the loss of BMP2/4 function, where zswim4-6 is expressed normally until pSmad1/5 levels drop low enough, at which point expression is lost. Since the authors also show that GDF5 morphants do not have as strong a reduction in pSmad1/5 levels compared to BMP2/4 morphants, perhaps GDF5 plays a positive but redundant role in swim4-6 expression. To test this possibility the authors could inject suboptimal doses of BMP2/4 MO with GDF5 MO and look for synergy in the loss of zswim4-6 expression.

      Thanks for this great suggestion! We performed this experiment (Fig. 5H’’-L) and indeed, a suboptimal dose of BMP2/4MO + GDF5lMO results in a complete radialization of the embryo and abolished zswim4–6, similar to the effect of a high dose of BMP2/4. This result suggests that rather than being a ligand-specific signaling function, GDF5-like signaling alone still provides sufficiently high pSmad1/5 levels to activate zswim4-6 expression to apparent wildtype levels, demonstrating the sensitivity of this gene to even very low amounts of BMP signaling.

      4) The zswim4-6 morphant embryos show increased expression of zswim4-6 mRNA, which is said to indicate that zswim4-6 negatively regulates its own expression. However in zebrafish translation blocking MOs can sometimes stabilize target transcripts, causing an artifact that can be mistakenly assumed to be increased transcription (https://www.ncbi.nlm.nih.gov/pmc/articles/PMC7162184/). Some additional controls here would be warranted for making this conclusion.

      Thanks for raising this important experimental consideration. To-date, we do not have any evidence for MO-mediated transcript stabilization in Nematostella, and we have not found such data in the literature on models other than zebrafish. mRNA stabilization by the MO also seemed unlikely because we were unable to KD zswim4-6 using several independent shRNAs - an effect we frequently observe with genes, whose activity negatively regulates their own expression. However, to test the possibility that zswim4-6MO binding stabilizes zswim4-6 mRNA, we injected mRNA containing the zswim4-6MO recognition sequence followed by the mCherry coding sequence (zswim4-6MO-mCherrry) with either zswim4-6MO or control MO. We could clearly detect mCherry fluorescence at 1 dpf if control MO was co-injected with the mRNA, but not if zswim4-6MO was coninjected with the mRNA. At 2 dpf (the stage at which we showed upregulation of zswim4-6 upon zswim4-6MO injection on Fig. 6I-I’), zswim4-6MO-mCherrry mRNA was undetectable by in situ hybridization with our standard FITC-labeled mCherry probe independent of whether zswim4-6MO-mCherrry mRNA was co-injected with the control MO or ZSWIM4-6MO, while hybridization with the FITC-labeled FoxA probe worked perfectly.

      Author response image 1.

      We are currently offering two alternative hypothesis for the observed increase in zswim4-6 levels in the paper rather than stating explicitly that ZSWIM4-6 negatively regulates its own expression: “The KD of zswim4-6 translation resulted in a strong upregulation of zswim4-6 transcription, especially in the ectoderm, suggesting that ZSWIM4-6 might either act as its own transcriptional repressor or that zswim4-6 transcription reacts to the increased ectodermal pSMAD1/5 (Fig. 6I-I’).” Given the sensitivity of zswim4-6 to even the weakest pSMAD1/5 signal (zswim4/6 is expressed upon GDF5-like KD, which drastically reduces pSMAD1/5 signaling intensity (see Fig. 1 and 2 in Genikhovich et al., 2015, http://doi.org/10.1016/j.celrep.2015.02.035 and Fig. 6-Figure supplement 3 of this paper), the latter option (that it reacts to the increased ectodermal pSMAD1/5) is, in our opinion, clearly the more probable one.

      5) Zswim4-6 is proposed to be a co-repressor of pSmad1/5 targets based on the occupancy of zswim4-6 at the chordin BRE (which is normally repressed by BMP signaling) and lack of occupancy at the gremlin BRE (normally activated by BMP signaling). This is a promising preliminary result but is based only on the analysis of two genes. Since the authors identified BREs in other direct target genes, examining more genes would better support the model.

      We suggest that ZSWIM4-6 may be a co-repressor of pSMAD1/5 targets because it is a nuclear protein (Fig. 4G), whose knockdown results in the expansion of the ectodermal expression of several genes repressed by pSMAD1/5 in spite of the expansion of pSMAD1/5 itself (Fig. 6G-H’, 6L-M’, Fig. 6-Figure Supplement 4). Our limited ChIP analysis supports this idea by showing that ZSWIM4-6 is bound to the pSMAD1/5 site of chordin (repressed by pSMAD1/5) but not on gremlin (activated by pSMAD1/5). We agree that adding the analysis of more targets in order to challenge our hypothesis would be good. However, given technical limitations (having to inject many thousands of eggs with the EF1a::ZSWIM4-6-GFP plasmid in order to get enough nuclei to extract sufficient immunoprecipitated chromatin for qPCR on 3 genes (chordin, gremlin, GAPDH) for each biological replicate, it is currently unfortunately not feasible to test more genes. It will be of great interest for follow up studies to generate a knock-in line with tagged zswim4-6 to analyze target binding on a genome-wide scale. We stress in the discussion that currently the power of our conclusion is low.

      6) The rationale for further examination of zswim4-6 function in Nematostella was based in part on it being a conserved direct BMP target in Nematostella and Xenopus. The analysis of zebrafish zswim5 function however does not examine whether zswim5 is a BMP target gene (direct or indirect). BMP inhibition followed by an in situ hybridization for zswim5 would establish whether its expression is activated downstream of BMP.

      In the paper by Greenfeld et al., 2021, zebrafish zswim5 was downregulated approximately 2.4x in the bmp7 mutant at 6 hpf. However, this gene was not among the 57 genes, which were considered to be direct BMP targets because their expression was affected by bmp7 mRNA injection into cycloheximide-treated bmp7 mutants (Greenfeld et al., 2021). We added this information to the text of the manuscript.

      7) Although there is a reduction in pSmad1/5/9 staining in zebrafish injected with zswim5 mRNA, it is difficult to tell whether the resulting morphological phenotypes closely resemble zebrafish with BMP pathway mutations (such as bmp2b). More analysis is warranted here to determine whether stereotypical BMP loss of function phenotypes are observed, such as dorsalization of the mesoderm and loss of ventral tail fin.

      We agree, and we have tuned down all zebrafish arguments. Analyses of zswim5 mutants are currently ongoing.

    1. Author Response

      Reviewer #1 (Public Review):

      Strengths:

      The study addresses an intriguing research question that fills a gap in existing literature, and was carefully designed and well-executed, with a series of experiments and control experiments.

      We thank the reviewer for the positive statement about the conception and execution of the study as well as the potential interest to the community within a broader field.

      Weaknesses:

      1) My main concern is the null effect of precision estimation pattern between cued and un-cued trials. It is well established that relative to the un-cued stimuli, the cued stimuli obtain more attentional resource and this study claimed serial attentional resource allocation during parallel feature value tracking. However, all Experiments 3a-c did not find any difference in precision estimates between these two types of trials.

      We would like to annotate that the terminology „cued versus uncured trials“ in the usual sense of distinguishing between stimuli being attended versus unattended is admittedly somewhat misleading in the current work. In cued and uncured trials of the present experiments 3a-c the allocation of attention is equal. The difference is that the color stream that is attended first is defined (knowable) in the cued but not in the uncued trials. In all cases subjects had to track both color streams and report any of the probed streams as accurately as possible. In other words, the overall allocation of attention in cued and uncured trials is the same. Also, the „cue“ did not provide any information regarding the following probe (no indication of likelihood for a probe in that stream as in an attention experiment). It was entirely irrelevant and was therefore expected not to alter subjects overall performance – as confirmed by the mentioned null-result. The performed test shows, that the reported bias of ~2:1 does not depend on whether in one set of the trials one stream is cued or not. The sole purpose of the “cue” was to subconsciously redirect attention briefly towards that particular stream at the start of each trial in order to ‘phase-reset’ any process, switching/oscillating feature-based resources over time. Performance imbalance across streams is hereby not altered by this phase-reset but remains constant since precision ratio is estimated across a large number of trials and durations. To clarify this issue, we rephrased relevant descriptions in the methods section.

      2) Results of Exp.1 in the main text were different from those in Figure.

      Thank you for spotting that error. We have corrected the figure accordingly.

      3) It would be helpful to add more details for the assignation of response 1 and response 2 to target 1 and target 2, respectively, in all experiments.

      For Experiment 2 and 3 only one response per trial was required by the subjects. This design was chosen to avoid potentially ambiguous response-target assignments.

      However in the first experiment, as the reviewer points out, subjects gave two color estimates (one for each of the tracked color streams) within each trial. Given that we intend to split subjects’ target-response differences (precisions) into two distributions (based on the idea that each stream is being maintained by an independent attentional resource), there are two possible ways of assigning responses:

      (1) We split responses into a best and worst independent of which response was given first.

      (2) Alternatively, we assign target-response pairs based on the order of response. The assumption would be, that the first response would be the one with the highest confidence and would be paired with the target closest. This pairing would occur independent of the second response, which is consequently paired with the remaining target. This leaves open the possibility of the second target-response difference being better than the first one due to resource fluctuations. In general, this strategy would be less ‘rigid’ in dividing the two precision-responses into ‘good’ and ‘bad’ responses and was consequently chosen.

      To avoid problems arising from the ambiguity of target-response assignments, in all following experiments (2/3), subjects were required to give one response per trial only. We will go into further detail on this issue with reviewer 3 as well, including a numerical example. The logic behind the target-response assignments in experiment 1 has been described in more detail in the methods.

      Reviewer #2 (Publlic Review):

      The authors asked the question about whether and how changing feature values within the same feature dimensions are tracked. Using a series of behavioral studies combined with modeling approaches, the authors report interesting results regarding a robust, uneven distribution of attentional resources between two changing feature values (in a 2:1 ratio), alternating at 1 Hz. Although the results are clear, it is important to rule out the possible biases due to computational processes. The results advanced our understanding of how parallel tracking of multiple feature values within the same dimension is achieved.

      We thank the reviewer for the summary, including the potential impact on the field and we look forward to clarify methodological imprecisions.

      Reviewer #3 (Public Review):

      The study is interesting and the results are informative in how well people can report colors of two superimposed dot clouds. It reveals that there are trade-offs between reporting two colors. However, I have a few basic but major concerns with the present study and its conclusions about people's abilities to continuously track color values and the rate at which attention may be allocated across the two streams which I am outlining below.

      We thank the reviewer for the positive description of our findings and look forward to address any remaining issues.

      1) The first concern regards the task that was used to measure continuous tracking of feature values, which in my view is ambiguous in whether it truly assesses active tracking of features or rather short-term memory of the last-seen colors. Specifically, participants were viewing two colored dot clouds that then turned gray, and were asked to report each of the colors they saw using continuous report. The test usually occurred after 6-8s (in Exp. 1 &2), so while not completely predictable, participants could easily perform the task without tracking both feature streams continuously and simply perform the color report based on the very last colors they saw. In other words, it does not seem necessary to know which color belonged to which stream, or what color it was before, to perform the task successfully. Thus, it is unclear to what extent this task is actually measuring active tracking, the same way tracking of spatial locations in multiple-object tracking tasks has been studied, which is the literature that the authors are trying to draw parallels to. In multiple-object tracking tasks, targets and nontarget objects look identical and so to keep track of which of the moving objects are targets, participants need to attend to them actively and selectively. (Similarly, the original feature-tracking study by Blaser et al., at least in their main experiment, people were asked to track an object superimposed on a second object which required continuous and selective tracking of that object).

      The reviewer addresses a very fundamental point regarding ‘tracking’ in general: Does tracking rely on attentional processes or mere perception.

      The reviewer posits that subjects may simply ‘report based on the very last color they saw’ without the need to track both features streams continuously. Our argument supported by a broad literature on change blindness, inattentional blindness and related phenomena (c.f. Rensink, 2000) is, that one cannot consciously report a changing feature-value without continuously attending to it, in particular when it moves around randomly in feature space. The report of a feature value at a random unpredictable time t by ‘identifying it’ includes its attentive processing immediately before t. Since the time of the probing identification is random, it must continue throughout the trial. We do also rule out any strategy in which subjects only start tracking after some time (the probe appears between 6-8sec after trial onset) since such a strategy would involve processes of temporal attention as well and increase difficulty.

      Lastly, the reviewer refers to Blaser et al. as an example in which attentive tracking would be required, since ‘an object [is] superimposed on a second object’. We do absolutely agree. However, the same design principle applies in the current experiment: Two objects with separate values in feature space, that continuously change, are superimposed, that is, spatially inseparable. We do believe that the continuous movement of the feature values through color space separates this work from previous feature-tracking studies like Re et al., in which the presented features remained static. The latter work gives rise to alternate explanations in terms of working memory (mentioned in the next point of the reviewer). Once feature values keep changing and are relevant, a process of updating their internal representations in order to grant access is required (i.e. attention).

      2) The main claim that tracking two colors relies on a shared and strictly limited resource is primarily based on the relation between the two responses people give, such that the first response about one color tends to be higher accuracy than for the second response of the other color across participants. In my view, this is a relatively weak version of looking at trade-offs in resources, and it would have been more compelling to show such trade-offs at a single-trial level, or assess them with well-established methods that have been developed to look at attentional bottlenecks such as attention-operating characteristics that allow quantifying the cost of adding an additional task in a precise and much more direct manner.

      The reviewer suggests showing trade-offs at a single trial level within subject, which is in essence what we have done in experiment 1. Testing both streams simultaneously, however, has the drawback of introducing interference effects during the report (Reporting the first stream may degrade the precision of reporting the second stream) as well as the mentioned ambiguity between targets and responses. The second and third experiment circumvent this by probing only one color stream, as to analyze the data with a minimal set of assumptions. As the dependent measure of ‘precision’ fluctuates highly across trials, we have to estimate an overall tracking resource by creating a ‘precision’ distribution across many trials.

      3) Finally, the data of the last experiment is taken as evidence that feature-based selection oscillates at 1Hz between the two streams. This is based on response errors changing across time points with respect to an exogenous cue that is thought to "reset" attentional allocation to one stream. Only one of three data sets (which uses relatively sparse temporal sampling) shows a significant interaction between cue and time, and given that there was no a priori prediction of when such interaction should occur, this result begs for a replication to ensure that this is not a false positive result. Furthermore, based on the analyses done in the paper, it may very well be the case that the presumed "switching rate" is entirely non-oscillatory based on a recent very important paper by Geoffrey Brookshire (2022, Nature Human Behavior) that demonstrates that frequency analysis are not just sensitive to periodic but also aperiodic temporal structures. The paper also has a series of suggested analyses that could be used here to further test the current conclusions.

      The reviewer is absolutely correct in doubting the oscillatory nature of the results in Exp3. Importantly, in our discussion we do not claim that a regular periodicity of the attentional process maintains both color streams. In contrast, we stress the point of ‘one-feature at a time’, indicating a constraint that entails alternation between two representations. We do not presume any sort of regularity of this process but, instead, consider the switching being determined by the recurrent processing of tuning towards one of the two relevant values. Our interpretation is therefore largely in line with Brookshires criticism of previous attentional oscillation studies. In fact, we entirely share the doubtful interpretation of attentional oscillations that transfer mathematical modelling onto functional processes. In our study we use the tool of Fourier transformation in a mere methodological manner, in order to quantify alternations between our color streams but not to imply an underlying oscillatory process. We cannot draw conclusions about underlying attentional oscillations especially since we quantify the alternation/switch only across one full and one half period, in exp3a and exp3b respectively.

      We make the distinction between oscillations as a methodological tool and functional cognitive process more clear in the paper.

    1. Author Response

      eLife Assessment:

      The fluorescently tagged SYT-1 mouse line will be useful for the field. Importantly, the authors used a comprehensive set of immunohistochemical and physiological experiments to demonstrate that the fluorescence tagging did not alter the function of SYT-1. These are important control experiments that will make the strain useful for physiological experiments in the future. However, the advance of this manuscript is less clear.

      We thank the editor for raising this point. In the revised manuscript, we performed additonal experiments including testing the expression level of Syt1-TDT and testing the co-labeling of Syt1-TDT with synaptic marker in situ. We also dicussed the advantage of our model compared with the existed ones in line 285 to 300 in the section of discusion. Briefly, we conclude the advance of our models as follows: First, the Syt1-TDT could label synapse in situ, especially in glomerular layer of olfactory bulb (compared with B6SJL-Tg(Thy1-Syt1/ECFP)1Sud/J (Han et al. 2005)). Second, we provided a potential usage of our model in the study of electrophysiological recording and imaging in vivo, as the electrophyiological properties of neurons from Syt1-TDT mice are normal (not be analyzed in B6.Cg-Tg(Thy1-YFP/Syp)10Jrs/J and B6;CBA-Tg(Thy1-spH)21Vnmu/J (Umemori et al. 2004; Li et al. 2005)), which might be result from the relative low expression of Syt1-TDT compared with the native Syt1. Third, the neurons from the transgenic mice can be used in ASF screening by skiping the procedure of immunostaining. It will save the cost of time, reagents and work.

      Reviewer #1 (Public Review):

      In this manuscript, Zhang and colleagues created a transgenic mouse strain that expresses SYT-1-tdt in all neurons. They showed that the labelled SYT-1 colocalizes with multiple synaptic markers and label synapses in different regions. More importantly, they showed that the transgenic expression does not alter synaptic function using ephys assays. This is a straightforward paper that generated a useful reagent that will be used broadly.

      We are grateful for the reviewer’s positive comments.

      Reviewer #2 (Public Review):

      Yang et al. produced a transgenic mouse line (Syt1-TDT) that could be used for labeling both excitatory and inhibitory synaptic sites in cultured neurons and in vivo neurons. The strength of the current study is to provide a series of thorough analyses to claim the applicability of this mouse line in the relevant neuroscience research field(s). The weakness is the potential impact/usefulness of this mouse line. To strengthen the merit of this mouse line, the authors should present evidence showing its advantage over other similar genetic approaches.

      We thank the reviewer for raising this point. To strengthen the merit of this mouse line, we tested the application of Syt1-TDT in labeling synapse in situ. We found that the Syt1-TDT is highly overlapped with synapsin in the brain slice, especially in hippocampus, cerebellum and olfactory bulb, which suggest a potential usage of our model in imaging synapse in vivo. We also compared our transgenic model with the existed ones in line 285 to 300 in the section of discussion in the revised manuscript:

      “Several fluorescently tagged synaptic protein transgenic mice model, such as YFP tagged synaptophysin and pHluorin tagged synaptobrevin have been developed to label synapses [49, 50]. While these models can label synapse well, it lacks the functional analysis of neurotransmitter release in the overexpressed neurons as synaptophysin and synaptobrevin were reported to play a role in regulating neurotransmitter release. Considering the overexpression of synaptobrevin or synaptophysin were reported to promote neurite elongation or enhance neurotransmitter secretion, the synaptic organization and synaptic transmission might be changed in these models. Weiping Han et al. in their previous work [47] have generated transgenic mice expressing a Syt1-ECFP fusion protein. The Syt1-ECFP mice expressed the fluorescent protein ECFP in the cortex, midbrain, and cerebellum. However, the expression pattern in their model showed some difference with ours: In the olfactory bulb, the Syt1-TDT signals were highly enriched in glomerular layer in our model, which was not observed in the previously reported Syt1-ECFP transgenic mice [47]. It suggested a potential application of our model in labeling synapse in glomerular layer of olfactory bulb compared with Syt1-ECFP transgenic mice.”

      Reviewer #3 (Public Review):

      Yang and colleagues provide a thorough characterization of a transgenic mouse model expressing fluorescently tagged synaptotagmin. In particular, they present key controls validating this mouse model as a tool, including co-localization of the tagged synaptotagmin with other synaptic markers as well as normalcy of synaptic transmission mediated by synaptic terminals expressing the tagged synaptotagmin. Importantly, the authors present data on the potential use of neuronal cultures obtained from these mice in synaptic co-culture assays. In these assays, synaptic cell adhesion molecules expressed on non-neuronal cell lines such as HEK-293 cells or COS cells are used to test the sufficiency of these molecules to trigger synapse assembly. This mouse model will be a useful addition to existing models expressing fluorescently-tagged synaptic vesicle proteins such as synaptophysin, synaptotagmin as well as synaptobrevin.

      We are grateful for the reviewer’s positive comments.

    1. Author Response

      Reviewer #1 (Public Review):

      Bakoyiannis et al. investigated the distinct contribution of ventral hippocampal outputs to the nucleus accumbens and medial prefrontal cortex on memory in mice exposed to a high-fat diet (HFD) beginning in adolescence. The authors first characterize the hippocampal to accumbens or mPFC circuits using intersectional viral approaches. They then replicate their previous finding that adolescent HFD contributes to the overactivation of the ventral hippocampus during contextual learning via quantification of c-fos+ cells. In this manuscript, the authors further explore the distinct contribution of these two outputs from the ventral hippocampus using chemogenetics to specifically inhibit one circuit or the other. Interestingly, the authors find that inhibition of either circuit returns c-fos+ cell number to control levels, but the effects on memory are dissociable. They demonstrate that inhibition of output to the NAc rescues HFD-induced deficits on object recognition, while inhibition of mPFC outputs rescues HFD-induced deficits on object location recall. The authors further confirmed that chemogenetic manipulations resulted in alterations in c-fos+ cells that were specific to CA1, and not CA3 or DG. Behaviorally, they excluded any contribution of anxiety on recall, finding no effect on the elevated plus maze.

      The strengths of this manuscript include robust behavioral findings that can be attributed to specific circuits. The conclusions of this paper are largely well supported by the data, although some of the methods could provide more detail and the statistical approaches used for analysis need improvement.

      We thank the Reviewer for thoroughly summarizing the main results of the study and for providing the comments that we address below.

      Reliance on only one measure of anxiety to exclude this as a confound on recall performance is a weakness of the manuscript. To be more convincing that anxiety is not a confound, more than one behavioral assay should be performed.

      Reviewer #2 (Public Review):

      Bakoyiannis et al. aim to analyze the impact of high-fat diet (HFD) intake during the preadolescent period on memory performances by optogenetically manipulating the circuits responsible for related memory performances. In previous work, they showed the possibility to rescue object-based memory impairments in HFD-exposed animals by silencing the ventral hippocampus (vHPC). Here they investigated further the projections to the nucleus accumbens (NAc) and medial prefrontal cortex (mPFC), 2 of the main monosynaptic targets of the vHPC.

      They used a precise strategy to target and manipulate only vHPC cells that project to either NAc or mPFC. They found that preadolescent HFD can induce different types of memory deficits related to different vHPC pathways. In particular, they found that silencing vHPC-NAc, but not vHPC-mPFC, pathway restored HFD-induced object recognition memory deficit. On the other side, silencing vHPC to mPFC, but not vHPC-NAc, pathway rescued HFD-induced object location memory deficits. Moreover, these pathways do not control anxiety-like behaviours since their inactivation has no effect on anxiety levels.

      We thank the Reviewer for summarizing the findings of the study and for their positive comments on our manuscript.

      The conclusions of the manuscript are mostly supported by the results, but there are some points and controls that need to be addressed and clarified:

      • While identifying the relevance of hippocampal cells projecting to NAc and mPFC, a missing control is to verify the activity of vHPC not projecting to these 2 regions in normal conditions or when the investigated pathways are manipulated. This control is essential to refine and bring novel results related to their previous discovery that vHPC overall is involved in the process.

      • A downstream effect of their optogenetic manipulation on NAc and mPFC cellular populations should be shown if they want to claim that their chemogenetic inhibition decrease the activation of the pathway and not only of vHPC projecting neurons.

      New c-Fos experiments were performed. Please see our response to points 4-5-6 in the “Essential Revision” section.

      Reviewer #3 (Public Review):

      "Obesogenic diet induces circuit-specific memory deficits in mice" by Bakoyiannis et al., investigates the role of specific ventral hippocampal circuits (specifically to nucleus accumbens and mPFC) in high-fat diet-induced memory deficits. The authors had previously shown that increases in activity in the ventral hippocampus accompany high-fat diet-induced memory deficits, and that inhibition of activity thereby normalizes those memory deficits. In this manuscript, the authors extend these findings to specific projections, showing that they normalize different types of memories by inhibiting the two different pathways.

      The strengths of the paper include the pathway-specific manipulations that reveal a difference between the two types of memory. The results are a modest step forward for the field of feeding and learning and memory and would be of interest to that subgroup of neuroscientists. However, the paper also has a number of weaknesses which I detail below.

      We thank the Reviewer for summarizing the finding of our study and for the positive feedback.

      1) First, the authors show an effect of cfos from both pathways in Figure 2 on object learning. However, the inactivation studies show a pathway-specific effect on object recognition and object location, with no experiments to delineate how this divergence occurs. The authors do not specify whether they compared cfos in the control group between NAc and mPFC projections (presumably they did some controls with each injection), which might reveal differences.

      We have added new groups and presented/analyzed the results for each pathway (either vHPC-NAc pathway or vHPC-mPFC pathway) separately for c-Fos (new Figure 2 and Figure 2-Figure Supplement 1) or behaviours (new Figure 3 and Figure 3-Figure Supplement 1). Please see our responses to points 2, 4-5-6 and 9 in the “Essential Revision” section.

      2) Related to this, it is unclear how the pathways end up diverging for memory if they do not show any differences in cfos during training. Perhaps there are pathway-specific differences in cfos following the ORM and OLM tests? It is difficult to support the claim that there are pathway differences in memory following inactivation if we do not see any pathway-specific change in activity.

      We thank the Reviewer for this comment. Please see our answer to point 7 in the “Essential Revision” section above.

      3) Figure 2 and Figure 3 are also hard to interpret because of the usage of a 1-way ANOVA which is not the appropriate statistical test when there are two independent variables (HFD and DREADD manipulation). Indeed, noticing the statistical test also reveals that a critical control missing: HFD -, hM4di+CNO +. It is possible that inactivation simply brings down cfos levels regardless of diet. While this might benefit memory in the case of HFD, it is critical to know whether the manipulation is specific to the overactivation caused by HFD or just provides a general decrease in activity.

      Based on this comment we added new HFD-hM4di+CNO+ groups and modified statistical analyses accordingly. Indeed, inactivation of each pathway (vHPC-NAc or vHPC-mPFC) decreases c-Fos in both HFD+ and HFD- (CD+) groups (new Figure 2) whereas it has opposite effect on behaviors, improving memory performance in HFD+ groups but impairing or having no effect in HFD- (CD+) groups (new Figure 3). We have corrected this in the manuscript (please see our responses to points 2 and 9 of “Essential Revision” section).

    1. Author Response

      The following is the authors’ response to the original reviews.

      eLife assessment

      This paper reports the fundamental discovery of adrenergic modulation of spontaneous firing through the inhibition of the Na+ leak channel NALCN in cartwheel cells in the dorsal cochlear nucleus. This study provides unequivocal evidence that the activation of alpha-2 adrenergic or GABA-B receptors inhibit NALCN currents to reduce neuronal excitability. The evidence supporting the conclusions is compelling, the electrophysiological data is high quality and the experimental design is rigorous.

      Public Reviews:

      Reviewer #1 (Public Review):

      This study uses electrophysiological techniques in vitro to address the role of the Na+ leak channel NALCN in various physiological functions in cartwheel interneurons of the dorsal cochlear nucleus. Comparing wild type and glycinergic neuron-specific knockout mice for NALCN, the authors show that these channels 1) are required for spontaneous firing, 2) are modulated by noradrenaline (NA, via alpha2 receptors) and GABA (through GABAB receptors), 3) how the modulation by NA enhances IPSCs in these neurons.

      This work builds on previous results from the Trussell's lab in terms of the physiology of cartwheel cells, and from other labs in terms of the role of NALCN channels, that have been characterized in more and more brain areas somewhat recently; for this reason, this study could be of interest for researchers that work in other preparations as well. The general conclusions are strongly supported by results that are clearly and elegantly presented.

      I have a few comments that, in my opinion, might help clarify some aspects of the manuscript.

      1. It is mentioned throughout the manuscript, including the abstract, that the results suggest a closed apposition of NALCN channels and alpha2 and GABAB receptors. From what I understand, this conclusion comes from the fact that GABAB receptors activate GIRK channels through a membrane-delimited mechanism. Is it possible that these receptors converge on other effectors, for example adenylate cyclase (see https://www.ncbi.nlm.nih.gov/pmc/articles/PMC6374141/).

      We have now tested the role of adenylyl cyclase modulation in the control of NALCN, by saturating the cells with a cAMP analogue 8-Br-cAMP and found no effect on the NA response. These data are included in the paper. While further experiments are necessary, these results argue in favor of a direct gating by G-proteins.

      1. In Figure 2G, the neurons from NALCN KO mice appear to reach a significantly higher frequency than those from WT (figure 2E, 110 vs. 70 spikes/s). Was this higher frequency a feature of all experiments? The results mention a rundown of peak firing rate due to whole-cell dialysis, but, from what I understand, the control conditions should be similar for all experiments.

      The peak firing rates in control solutions for WT and KO CWC are not statistically different.

      1. Also in Figure 2, the firing patterns for neurons from WT and NALCN KO mice appear to be quite different, with spikes appearing to be generated during the hyperpolarization of the bursts in the second half of the current step for WT neurons but always during the depolarization in KO neurons. Was this always the case? If so, could NALCN channels be involved in this type of firing? Along these lines, it would be interesting to show an example of a firing pattern of neurons from WT mice in the presence of NA, which inhibits NALCN channels.

      The specific pattern of spikes in CWC is quite variable from trial-to-trial or cell-to-cell, as it is dependent on multiple CaV and calcium dependent K channels subtypes, and is not dependent on the genotypes used here. The primary effects observed in the KO are in background firing and sensitivity to NA, both reflected alterations in rheobase. The firing pattern example requested was shown in the raster plot of fig 2B2.

      1. It might be interesting to discuss how the hyperpolarization induced by the activation of GIRK channels and inhibition of NALCN channels could have different consequences due to their opposite effect on the input resistance.

      We considered this as a point of discussion, but decided that making sense of it would depend on assumptions about the location of the channels (dendritic vs somatic, distance to AIS) that we do not have data for. For example, a dendritic increase in resistance through NALCN block, leading to a hyperpolarization of the soma, might have actions similar to a somatic hyperpolarizing conductance increase by GIRK, as far as the voltage at the AIS is concerned.

      Reviewer #2 (Public Review):

      This is a very interesting paper with several important findings related to the working mechanism of the cartwheel cells (CWC) in the dorsal cochlear nucleus (DCN). These cells generate spontaneous firing that is inhibited by the activation of α2-adrenergic receptors, which also enhances the synaptic strength in the cells, but the mechanisms underlying the spontaneous firing and the dual regulation by α2-adrenergic receptor activation have remained elusive. By recording these cells with the NALCN sodium-leak channel conditionally knocked, the authors discovered that both the spontaneous firing and the regulation by noradrenaline (NA) require NALCN. Mechanistically, the authors found that activation of the adrenergic receptor or GABAB receptor inhibits NALCN. Interestingly, these receptor activations also suppress the low [Ca2+] "activation" of NALCN currents, suggesting crosstalk between the pathways. The finding of such dominant contribution of the NALCN conductance to the regulation of firing by NA is somewhat surprising considering that NA is known to regulate K+ conductances in many other neurons.

      The studies reveal the molecular mechanisms underlying well known regulations of the neuronal processes in the auditory pathway. The results will be important to the understanding of auditory information processing in particular, and, more generally, to the understanding of the regulation of inhibitory neurons and ion channels. The results are convincing and are clearly presented.

      Reviewer #3 (Public Review):

      The study by Ngodup and colleagues describes the contribution of sodium leak NALCN conductance on the effects of noradrenaline on cartwheel interneurons of the DCN. The manuscript is very well-written and the experiments are well-controlled. The scope of the study is of high biological relevance and recapitulates a primary finding of the Khaliq lab (Philippart et al., eLife, 2018) in ventral midbrain dopamine neurons, that Gi/o-coupled receptors inhibit NALCN current to reduce neuronal excitability. Together these studies provide unequivocable evidence for NALCN as a downstream target of these receptors. There are no major concerns. I have only minor suggestions:

      Minor

      1. As introduced in the introduction, NALCN is inhibited by extracellular calcium which has led to some discourse of the relevance of NALCN when recorded in 0.1 mM calcium. A strength of this study is the effect of NA on NALCN is recorded in physiological levels of calcium (1.2 mM). I suggest including the concentration of extracellular calcium in the aCSF in the Results section instead of relying on the reader to look to the Methods.

      Done.

      1. It would be interesting to include the basal membrane properties of the KO compared to wildtype, including membrane resistance and resting membrane potential. From the example recording in Figure 2, one might think that the KOs have lower membrane resistance, so it is interesting that the 2 mV hyperpolarization produced similar effects on rheobase. In addition, from the example in Figure 2G, it appears that NA has an effect on firing frequency with large current injection in the KO. Is this true in grouped data and if so, is there any speculation into how this occurs?

      We have included in the text a comparison of the input resistance in WT and KO. These were not different. This should not be too surprising given the wide range of values between animals, and the necessity to compare populations. Measurements of resting potential are complicated by the fact that CWC are normally spontaneously active. As was discussed in the text, peak firing frequency declined with time during recording in both control and KO, necessitating normalization as shown in Fig 2E-H.

      1. Please expand on the rationale for why GABAB and alpha2 must be physically close to NALCN. To my knowledge, the mechanism by which these receptors inhibit NALCN is not known. Must it be membrane-delimited?

      Given the known membrane delimited modulation of GIRK by GABAB, and that alpha2 and GABAB receptors appear to share the same population of NALCN channels, and that alpha2 receptors do not appear to target GIRK channels, we felt the simplest explanation would be coupling through G-proteins, with spatial segregation of different receptor/channel pools providing the means for separating GIRK and NALCN effects. Given that the alpha2 receptor is a Gi/o GPCR, we have now included in the revision new experiments using 8-Br-cAMP, as discussed above. These showed no effect on the NA response, consistent with a direct effect membrane delimited of G-proteins. We acknowledge however that further experiments are warranted.

      Reviewer #1 (Recommendations For The Authors):

      1. I suggest labeling the voltage traces in Figure 2 with WT and KO for easier comprehension; in addition, I suggest adding the average data to the plots in Figure 2, as in Figure 2-supplementary Figure 1 panel F.

      We have added the figure labels as requested. We chose not to add the average data as we noticed that averaging the full FI plots led to a smearing of the curves and a distortion in the apparent rheobase. Thus, we instead measured the rheobase for individual cells and report their average.

      1. For readers that are not familiar with the field, more details should be given about the electrical stimulation to evoke IPSCs in cartwheel cells, and what they represent.

      Done.

      1. The methods should mention if and how the concentrations of divalents were adjusted in the experiments with 0.1 extracellular Ca2+

      Done.

      Reviewer #2 (Recommendations For The Authors):

      I only have several minor comments.

      1. The total lack of spontaneous firing in CWCs in the NALCN KO (Fig. 1) is interesting and provides an opportunity to probe the in vivo function of such spontaneous firing. Besides being a little smaller, do the mutant mice have any sign of abnormality in sound signal processing?

      Figure 1 – Figure supplement 1 showed that there are no effects on auditory brainstem responses in the KO.

      1. Figs. 3&4 (and several other figures with voltage-clamp recordings), a line indicating zero current level would be useful.

      Done

      1. page 7, "Outward current generated by suppression of NALCN": it might be better to state as "Outward response generated by suppression of NALCN", as the authors correctly pointed out that the NA-induced apparently outward current response is largely a result of an inhibition of NALCN-mediated inward Na+ current. One way to clarify this might be to record at the Nernst potential of K+ to isolate the contribution of Na+ currents (unclear if K+- or Cs+-based pipette was used in the experiment in Fig 3).

      Text has been modified.

      1. Figs. 5,6&7: do the dashed lines indicate initial current level or zero current level?

      Initial current. See legends.

      1. The labeling of some of the bar graphs can be made more clear. For example, in Fig. 2K, the right two columns should be labeled as WT as well. Fig. 3C & Fig. 4C, the left two columns should be labeled as WT and the right two as KO.

      Added labels to Fig 2 as requested.

      1. Figs. 5-7: The suppression of low extracellular [Ca2+]-induced NALCN-dependent current by NA and baclofen is very interesting. As the tonic inhibition of NALCN by extracellular Ca2+ is likely through a Ca2+-sensing GPCR (CaSR) and G-proteins (lowering [Ca2+] releases the inhibition and generates inward current) (Lu et al. 2010), the action of NA and baclofen may all converge onto the same G-protein dependent pathway of the Ca2+-sensing receptor. I'd include this in the discussion to provide a potential mechanistic explanation of the interesting observation.

      This is indeed an interesting idea. We prefer not to discuss here, as 1) the source of Ca2+ sensitivity of the channel seems to be controversial (Chua et al 2020), and 2) the effect of Ca2+ reduction is enormously slower than the effect of the modulators (Fig 5-7), implying distinct mechanisms.

      Reviewer #3 (Recommendations For The Authors):

      Typos/general comments

      1. Figure 2 would be easier to comprehend with WT and KO labels as in the other figures. Done

      2. Page 11, size of the IPSCs in NA is missing the minus sign.

      Corrected.

      1. Is the y-axis correct on Figure 8B? This looks like it is doubling the size of the IPSC.

      Thank you for catching this mistake. The formula used to calculate % change was in error. We have corrected all the data analysis in the figure, which fortunately did not change the conclusion. Regarding the axis, note that the measurement was % change, not ratio of drug vs control.

    1. Author Response

      The following is the authors’ response to the original reviews.

      We thank the reviewers and editors for their constructive comments on the manuscript. We have extensively revised the manuscript based on these concerns and comments. The followings are the specific answers.

      Public Reviews:

      Reviewer #1 (Public Review):

      In the manuscript "Long‐read single‐cell sequencing reveals expressions of hypermutation clusters of isoforms in human liver cancer cells", S. Liu et al present a protocol combining 10x Genomics single-cell assay with Element LoopSeq synthetic long-read sequencing to study single nucleotide variants (SNVs) and gene fusions in Hepatocellular carcinoma (HCC) at single‐cell level. The authors were the first to combine LoopSeq synthetic long‐read sequencing technology and 10x Genomics barcoding for single cell sequencing. For each cell and each somatic mutation, they obtain fractions of mutated transcripts per gene and per each transcript isoform. The manuscript states that these values (as well as gene fusion information) provide better features for tumor-normal classification than gene expression levels. The authors identified many SNVs in genes of the human major histocompatibility complex (HLA) with up to 25 SNVs in the same molecule of HLA‐DQB1 transcript. The analysis shows that most mutations occur in HLA genes and suggests evolution pathways that led to these hypermutation clusters. Yet, very little is said about novel isoforms and alternative splicing in HCC cells, differences in isoform ratio between cells carrying different mutations, or diversity of alternative isoforms across cells. While the manuscript by Liu et al. presents a promising combination of technologies, it lacks significant insights, a comprehensive introduction, and has significant problems with data description and presentation.

      Answer: Thanks for the precious suggestion. Our long-read single-cell sequencing has discovered an average of 442 novel isoform transcripts per benign liver cell and 450 novel isoform transcripts per HCC cell per SCANTI v1.2 analysis. These are stated in the revised manuscript. The alternative splicing was detected by differential isoform expression as demonstrated in supplemental figures 6 and 7 and supplemental tables 8-11. The examples of differences in isoform ratio between cells carrying different mutations are now shown by DOCK8 and STEAP4 (figure 5 in the revised manuscript). A new section was added in the results to discuss the mutation expression of these two genes. The diversity of isoforms of the selected genes is shown in Supplemental Figure 10.

      This study showed how mutations in the same allele evolved in liver cancer. In particular, HLA hypermutations were found to develop from some specific sites of the molecules into large clusters of mutations in the same molecules. A new paragraph of introduction was added about the role of mutations in human cancer development. We also revised the figures to present the information better. All the HLA genes expressed only one known isoform, as shown in Figure 4 and Supplemental Figure 3, regardless of mutations.

      Major comments:

      1. The introduction section is scarce. It lacks description of important previous works focused on clustered mutations in cancers (for example, PMID35140399), on deriving the process of cancer development through somatic evolution (PMID32025013, from single cell data PMID32807900). Moreover, some key concepts e.g. mutational gene expression and mutational isoform expression are not defined. The introduction and the abstract contain slang expressions e.g. "protein mutation', a combination of terms I teach my students not to use.

      Answer: We appreciate the reviewer for the idea of more solid background introduction and term definition. We added a new paragraph in the introduction section to introduce the role of mutations and hypermutations in human cancers. Some important work has been cited. We added a new section in the "Methods" to define "mutation gene expression share" and "mutation isoform expression share". "Protein mutation" has been replaced by "genetic mutation".

      1. In the results section, to select the mutations of interest, the authors apply UMAP dimensionality reduction to the mutation isoforms expression and cluster samples in UMAP space, then select the mutations that are present only in one cluster, then apply UMAP to the selected mutations only and cluster the samples again. The motivation for such a procedure seems unclear, could it be replaced with a more straightforward feature selection?

      Answer: Thanks for raising up this important question. The goal of the analysis is an unbiased classification of the cell populations in the samples. We found that by removal of mutated isoform expressions that were at similar levels of all cells, the UMAP clustering generated clear segregation of three population cells. When the unique mutated isoform expressions from each group were applied, it generated highly distinct 8 groups of cells, with each group having a distinct mutation isoform expression pattern. If we force known knowledge into the mix of the analysis, it may generate unwanted bias. Specifically, the first UMAP was performed in an unbiased way to cluster cells, while the second step is a supervised approach by selecting the unique mutations in each cluster to identify the classifiers. The second UMAP matches the Benign/HCC labeling well.

      1. As I understand, the first "mutated isoform"-based UMAP clustering was built from expression levels of 205 "mutational isoforms". What was the purpose and outcome of the second "mutated isoform"based UMAP clustering (Figure 2E)? In the manuscript the authors just describe the clusters and do not draw any conclusions or use the results of the clustering anywhere further.

      Answer: Thanks for pointing this out. Figure 2E was generated from unique mutation isoform expressions in groups A, B, and C from Figure 2D. The purpose of Figure 2E is to investigate whether these unique mutation isoforms can further classify the cell populations free of prior biological knowledge. We added a sentence in the revision to clarify the purpose of the clustering. The conclusion from this analysis, including Figure 2F and Figure 3 (which is an extension of Figure 2E), is that HLA mutation isoform expressions dominated the classifications of cell populations.

      1. The authors just cluster the data three times based on expression levels of different sets of "mutational isoforms" and describe the clusters. What do we need to gather from these clustering attempts besides the set of 113 mutations used for further analysis? What was the point of the reclusterings? Did the authors observe improvement of the classification at each step?

      Answer: Thanks for asking this important question. The improvement of re-clustering to classify cell populations is the obvious segregation of 8 different groups of cells without any manual classification through prior knowledge. The distances among groups were far apart in comparison to the first clustering (figure 2B). Detailed subclassifications were achieved on cell populations that otherwise could not be segregated based on the first clustering.

      1. The alignment of short reads generated from hypermutated transcriptomes is non-trivial. The proposed approach could address the issue without the need for whole genome sequencing and offer insights about the cancer development through somatic evolution. Why didn't the authors use modern phylogenetic approaches in the "Evolution of mutations in HLA molecules" section or at least utilize the already performed clustering to infer cell lineages?

      Answer: We appreciate for the great question. For a single molecule mutation evolution, single gene clustering may not produce a desirable and robust effect. A simple evolution snowball chart in Figure 4B may be easier to be understood.

      1. I am not sure I understood the definition of "mutated gene expression levels" and "mutated isoform expression levels" in the "Mutational gene expression and fusion transcript enhanced transcriptome clustering of benign hepatocytes and HCC" section. The authors mention that gene lists included all the isoforms within the same range of standard deviation. If I understand it correctly, they are equal if there is only one expressed transcript isoform. In that case, this overlap is not surprising at all.

      Answer: We thank the reviewer for the great question. The definition of mutation gene expression level, mutation isoform expression level, and fusion gene expression level are now defined in the "Methods" section. In all HLA mutation transcripts, there were multiple transcripts with or without mutations for a single dominant isoform.

      1. "To investigate the roles of gene expression alterations that were not accompanied with isoform expression changes, UMAP analyses were performed based on the non‐overlapped genes." Venn diagrams (Sup Figure 8) show that there are much less "non-overlapped genes" than "genes that showed both gene and isoform level changes" for each SD threshold (for example, for SD>=0.8 59 vs 275). Could that be the reason why clustering based on the former group is worse i.e the cancer and normal cells are separated less clearly?

      Answer: The number of (attributes) genes could be a contributing factor in the segregation of cell populations. However, the number of attributes is not the underlying reason for worse performance for gene only classifier because much smaller isoforms/genes (22) overlap in SD>=1 outperformed a large number of genes (59) with SD>=0.8. It suggested that 59 gene expression classifier is less efficient in segregating the cell populations. To address this concern, we took SD>=0.8 as an example for demonstration if we subsampled the 275 overlapped genes/isoforms to 59 (equal to 59 non-overlapped genes in terms of number), we can still get better separation than the 59 DEG only. We repeated this subsampling process for three times. Similar results were found. The new data were inserted into supplemental Figure 8

      Reviewer #2 (Public Review):

      In the present study, Liu et al present an analysis of benign and HCC liver samples which were subjected to a new technology (LOOP-Seq) and paired WES. By integrating these data, the authors find isoforms, fusions and mutations which uniquely cluster within HCC samples, such as in the HLA locus, which serve as candidate leads for further investigation. The main appeal of the study is in the potential of LOOPSeq as a method to present isoform-resolved data without actually performing long-read sequencing. While this presents an exciting new method, the current study lacks systematic comparisons with other technologies/data to test the robustness, reproducibility and utility of LOOPSeq. Further, this study could be further improved by giving more physiologic context and examples from the analyses, thus providing a new resource to the HCC community. A few suggestions based on these are below:

      Answer: We appreciate the reviewer to raise up all the important questions and the great suggestions. The LOOPseq technology was compared with Oxford nanopore and PacBio long-read sequencing in our previous study. We have cited analysis in the introduction section of the paper. HLA mutation clusters in the single molecules are our finding with major physiological significance since these mutations may help liver cancer cells evade immune surveillance. We have extensively discussed the potential impact of these mutations on cancer development in the discussion. In addition, we added a new section of DOCK8 and STEAP4 mutation expressions in the results (page 11, new Figure 5) that are highly relevant to the pathogenesis of HCC.

      1. A primary consideration is that this seems to be the first implementation of LOOP-Seq, where the technology, while intriguing, has not been evaluated systematically. It seems like a standard 10x workflow is performed, where exons are selectively pulled down and amplified. Subsequent ultra-deep sequencing is assumed to give isoform-resolution of the sc-seq data. To demonstrate the utility of the approach it would benefit the study to compare the isoform-resolved results with studies where long-read sequencing was actually performed (ex: https://journals.lww.com/hep/Fulltext/2019/09000/Long_Read_RNA_Sequencing_Identifies_Alternativ e.19.aspx, https://www.jhep-reports.eu/article/S2589-5559(22)00021-0/fulltext, https://journals.plos.org/plosgenetics/article?id=10.1371/journal.pgen.1010342). Presumably, a fair amount of overlap should occur to justify the usage.

      Answer: We have discussed the utility of the methodology in comparison with the previous studies by these three groups in the revision (results, page 12).

      1. Related to this point, the sc-seq cell types and benign vs HCC genes should be compared with the wealth of data available for HCC sc-seq (https://www.nature.com/articles/s41467-022-322833, https://www.nature.com/articles/s41598-021-84693-w). These seem to be important to benchmark the technology in order to demonstrate that the probe-based selection and subsequent amplification does not bias cell type definition and clustering. In particular, https://www.nature.com/articles/s41586021-03974-6 seems quite relevant to compare mutational landscapes from the data.

      Answer: This is a great point. The consistency probe-based analysis was demonstrated in our previous analyses and the analyses mentioned in the comments. We further discussed it in the results section of the paper (page 12).

      1. From the initial UMAP clustering, it will be important to know what the identities are of the cells themselves. Presumably, there is quite a bit of immune cells and hepatocytes, but without giving identities, downstream mechanistic interpretation is difficult.

      Answer: When mutation analyses were combined with cell marker analysis, i.e., immune marker positive but negative in HLA mutation, we found only one bona fide immune cell in the HCC sample. Thus, immune cells may not be significant in the current analysis.

      1. In general, there are a fair amount of broad analyses, such as comparisons of hierarchical clustering of cell types, but very little physiologic interpretations of what these results mean. For example, among the cell clusters from Fig 6, knowing the pathways and cell annotations would help to contextualize these results. Without more biologically-meaningful aspects to highlight, most of the current appeal for the manuscript is dependent on the robustness of LOOP-seq and its implementation.

      Answer: To address this comment, a new pathway analysis was performed on the cluster results of Figure 6. A new supplemental table was generated. The results are now discussed on page 13.

      1. Many of the specific analyses are difficult and the methods are brief. Especially given that this technology is new and the dataset potentially useful, I would strongly recommend the authors set up a git repository, galaxy notebook or similar to maximize utility and reproducibility

      Answer: The script file has been uploaded to GIT to facilitate the reproducibility of the analysis. We also added a new pipeline description script in the methods (pages 19-20).

      1. The authors claim that clustering between benign and HCC samples was improved by including isoform & gene (Suppl fig 8). This seems like an important conclusion if true, especially to justify the use of longread implementation. Given that the combination of isoform + gene presents ~double the number of variables on which to cluster, it would be important to show that the improved separation on UMAP distance is actually due to the isoforms themselves and not just sampling more variables from either gene or isoform

      Answer: The number of (attributes) genes could be a contributing factor in the segregation of cell populations. However, the number of attributes is not the underlying reason for worse performance for gene only classifier because much smaller isoforms/genes (22) overlap in SD>=1 outperformed a large number of genes (58) with SD>=0.8. It suggested that 58 gene expression classifier is less efficient in segregating the cell populations. To address this comment, we performed random subsampling to reduce the isoform/gene overlap iterates, similar results were obtained. A new supplemental figure was generated to reflect the new analyses.

      1. SQANTI implementation to identify fusions relevant for the HCC/benign comparison. How do the fusions compare with those already identified for HCC? These analyses can be quite messy when performed on WES alone so it seems that having such deep RNA-seq would improve the capacity to see which fused genes are strongly expressed/suppressed. This doesn't seem as evident from current analysis. There are quite a bit of WES datasets which could be compared: https://www.nature.com/articles/ng.3252, https://www.nature.com/articles/s41467-01803276-y

      Answer: Exome sequencing is not an ideal tool to identify fusion genes. Very few fusion genes have been discovered based on RNA sequencing so far. The fusion genes discovered in the study appeared mostly novel. No exome sequencing was involved in the identification of fusion genes.

      1. Figure 4 is fairly unclear. The matrix graphs showing gene position mutations are tough to interpret and make out. Usually, gene track views with bars or lollipop graphs can make these results more readily interpretable. Also, how Figure 4 B infers causal directions from mutations is unclear.

      Answer: We appreciate the reviewer for pointing this out. We have revised the diagram in Figure 4A to reflect the proper distance between the mutations in HLA-DQB1 NM_002123. Since these are the positions in the same alleles (protein), the gene track view or lollipop graph may not show that properly. The mutation clusters started from an isolated mutation, and mutation did not revert to wild type sequence after occurring. Based on these two principles, we showed several mutation accumulation pathways leading to hypermutation clusters.

      Reviewer #3 (Public Review):

      The Liu, et al. manuscript focuses on the interesting topic of evaluating in an almost genome-wide-scale, the number of transcriptional isoforms and fusion gene are present in single cells across the annotated protein coding genome. They also seek to determine the occurrences of single nucleotide variations/mutations (SNV) in the same isoform molecule emanating from the same gene expressed in normal and normal and hepatocellular carcinoma (HCC) cells. This study has been accomplished using modified LoopSeq long‐read technology (developed by several of the authors) and single cell isolation (10X) technologies. While this effort addresses a timely and important biological question, the reader encounters several issues in their report that are problematic.:

      1. Much of the analysis of the evolution of mutations results and the biological effects of the fusion genes is conjecture and is not supported by empirical data. While their conclusions leave the reader with a sense that the results obtained from the LoopSeq has substantive biological implications. However, they are extended interpretations of the data. For example: The fusion protein likely functions as a decoy interference protein that negatively impacts the microtubule organization activity of EML4.(pg 9)... and other statements presented in a similar fashion.

      Answer: We thank the reviewer for the helpful comment. The mutation results were experimentally validated by exome sequencing on the same samples. Furthermore, these mutations were filtered by requiring their presence in three different transcriptomes. The biological significance of these mutations is probably the subject of investigation in the next phase. Since a large number of HLA mutations did not occur overnight, the analysis of the accumulation pathways for these mutations was warranted, given the extensive evidence of such a process. The impact of mutations on HLA molecules appeared obvious and should be discussed. For ACTR2-EML4 fusion, we revised it as "The loss of microtubule binding domain may negatively impact the microtubule organization activity of EML4 domain of the fusion protein." We only discussed the obvious impact due to the loss of a large protein domain.

      2, LoopSeq has the advantage of using short read sequencing analyses to characterize the exome capture results and thus benefits from low error rate compared to standard long-read sequencing techniques. However, there is no evidence obtained from standard long read sequencing that the isoforms observed with LoopSeq are obtained with parallel technologies such as long read technologies. It is not made clear how much discordance there is in comparing the LoopSeq results are with either PacBio or ONT long read technologies.

      Answer: The comparative analyses among LOOPSeq, Oxford nanopore, and PacBio sequencing were performed in our previous study. We have cited the study in our introduction.

      1. There is no proteome evidence (empirically derived or present in proteome databases) from the HCC and normal samples that confirms the presence or importance of the identified novel isoforms, nor is there support that indicate that changes in levels HLA genes translate to effects observed at the protein level. Since the stability and transport differences of isoforms from the same gene are often regulated at the post-transcriptional level, the biological importance of the isoform variations is unclear.

      Answer: Given the transcriptome sequencing data, we can only focus on the isoform variation analysis but not directly link to the protein level variation because of the post-transcriptional level regulation. We discussed this in the revised manuscript (page 14).

      4 It is unclear why certain thresholds were chosen for standard deviation (SD) <0.4 (page 5), SD >1.0 (pg 11).

      Answer: The threshold is flexible and arbitrary. We showed different thresholds, and the same conclusion holds. We just choose the thresholds with better separation and a reasonable number of genes/isoforms for the downstream analysis. (Supplemental Figure 6-7 with different thresholds and supplemental tables 4-12).

      1. HLA is known to accumulate considerable somatic variation. Of the many non-immunological genes determined to have multiple isoforms what are the isoform specific mutation rates in the same isoform molecule? Are the HLA genes unique in the number of mutations occurring in the same isoform?

      Answer: We thank the reviewer for this important suggestion. We now show mutation expression patterns in isoforms of DOCK8 and STEAP4 in Figure 5. A new section is added to discuss the mutation expression of these two genes. As shown in supplemental figure 10, HLA-DQB1, HLA-DRB1, HLA-B, and HLA-C, have only one known isoform detected,

      Editorial comments:

      The present study pairs single-cell seq with LoopSeq synthetic long-read sequencing on samples of HCC and benign liver to identify mutations and fusion transcripts specific to cancer cells. The authors present a potentially important resource; however the overall support remains incomplete.

      While the approach of evaluating isoform-specific changes at the cellular level to cancer seeks to address a timely and important topic, there is currently incomplete evidence in support of the major claims in the manuscript. In particular, major recommendations to provide stronger support for the combination of technologies and interpretation regarding cancer-associated genomic changes include: 1) systematic evaluation of UMAP-based clustering methods, to what subsets of data they are applied and subsequent interpretations, 2) direct comparisons of results with additional methods to quantify long-read sequencing data and those evaluating mutational consequences of HCC progression and 3) detailed expansion of the description of methods and rationale for selecting specific parameters and cell types for further analyses. Including these changes would significantly strengthen the support for utility of combining 10x single-cell with Loop-seq and provide compelling evidence for usage of this resource in dissecting HCC-associated molecular changes.

      Answer: We appreciate the frank and constructive comments. The goal of UMAP is to obtain biological knowledge through unbiased data selection. Systematically, we select classifiers without any prior knowledge (blind to the samples). In our case, classifiers with high standard deviation across all the cells were chosen. We stressed this in the result section. The comparison among LOOPSeq, PacBio, and Oxford nanopore was made in our previous study. We cited that analysis in this paper. Analysis detail and pipelines were added in the revised manuscript to improve the reproducibility. The mutation expression analysis was quite clear-cut. The clustering classified the HCC and benign liver cells by itself and identified a few cancer cells in the benign liver sample. All these were accomplished without applying any knowledge.

      Reviewer #1 (Recommendations For The Authors):

      Overall, there are numerous problems with data presentation and insufficient description, which authors could fix.

      1. Figure 4. A. It would be more clear if the figure showed the distribution of mutations in the molecule. Otherwise, it's hard to see if we see clusters of mutations or just 25 mutations spread uniformly across the transcript. B. It's unclear what the reader needs to take away from these columns of numbers.

      Answer: The mutation positions are now presented as proportion to the location in a molecule. Column B is the distribution of mutation molecules from left panel in each cluster of cells (from Figure 3A) and their sample origin (HCC or benign liver). We clarify it a little more in the legend of Figure 4A.

      1. As a reader, I did not understand how "mutated gene expression levels" and "mutated isoform expression levels" were calculated in terms of sequenced long reads

      Answer: We defined the term and calculations in the methods section of the revised manuscript.

      1. Page 6 "genes involving antigen presentation"

      Answer: The full sentence of the subtitle is" Mutations of genes involving antigen presentation dominated the mutation expression landscape."

      1. Page 6 "These unique mutational isoforms" - how are these isoforms unique?

      Answer: We take away most of the "unique" adjectives to describe the non-redundant mutations.

      1. Page 6. Unclear "All but one clusters contained cells co‐migrated with cells of their sources."

      "Among 113 mutation isoforms, the major histocompatibility complex (HLA) was the most prominent with 68 iterations (60.2%) (Supplemental Table 3, Figure 3B)" There is nothing about HLA in Figure 3B.

      Answer: We revised the sentence as "Cells in all but one clusters co-migrated with cells of their sources". The mutation isoform expressions were listed in supplemental Table 3. They are too small and become unreadable when put in the figure.

      1. Page 10 "genes or isoforms that across all samples had with expression standard deviations less than" - probably "with" should not be there.

      Answer: We correct the error and thank the reviewer for the comment.

      1. Page 11 "UMAP analysis was performed using genes with standard deviations {greater than or equal to} 1.0 (182 wild‐type genes) and standard deviations >0.4 (282 mutated genes)". What do "wild-type" and "mutated" mean here?

      Answer: We edited as "UMAP analysis was performed using gene expressions with standard deviations ≥ 1.0 (182 non-mutated genes) and gene mutation expression with standard deviations 0.4 (282 mutated genes)."

      1. I could not find the description of Supplementary Tables.

      Answer: The supplemental table legends are added in the revised manuscript.

      1. In the Discussion section, the authors mention that mutations were mainly expressed in a specific isoform of a gene for a given cell. I suggest to emphasize this point in the Results section and illustrate it with a comparison of abundance of mutated and non-mutated isoforms

      Answer: For HLA molecules, their expression appeared to be restricted to one known isoform, regardless of mutation status. This sentence is removed in the revision. A new section of DOCK8 and STEAP4 mutation expression is added to the result.

      1. It is also mentioned that mutations may have an impact on the RNA splicing process. The authors should compare the observed isoform ratio to a prediction of the effect of variants on splicing by SpliceAI or similar tools

      Answer: This sentence was removed from the discussion.

      1. Figure 3c: triangles corresponding to HLA-positive cells are hard to distinguish

      Answer: We provide a larger representation of the triangle and circle in figure 3c in the revision.

      Reviewer #2 (Recommendations For The Authors):

      Many of my comments could be addressed by spending time to provide the code/data and a walkthrough of analyses so that other users would be able to answer these questions on their own.

      Answer: We have included a script section in the revision to ensure the reproducibility of the analysis. The raw data had been uploaded to GEO (see Methods).

    1. Author Response

      The following is the authors’ response to the original reviews.

      Reviewer #1:

      1. The results that TF binding produces microdomains at medium and long linker DNA but not short linker is very interesting. Although the differences can be observed from the figure, it still lacks of quantitative comparison. It is not clear the exact definition of the microdomain observed from simulations and what numbers of microdomains can be identified under different conditions. A quantitative comparison of different conditions could also be provided.

      We thank the reviewer for this suggestion. Our intent was to show qualitatively how TF binding locations that we design can direct fiber folding and create microdomains, which we define in the paper as high frequency contact regions in the contact maps, similar to the TADs observed in HiC maps. Together with the fiber configurations, contact maps allow us to identify formation of such microdomains, and to observe how these microdomains change depending on the conditions we build into the model, such as TF binding region or linker DNA length.

      To address your point, we have added a clustering analysis of the contact matrices with nucleosome resolution and assign each contact along the genome position (nucleosome index) to a cluster. In Supporting Figure S6, we show how DBSCAN clustering provides a clustering distribution that quantitatively describes the microdomains observed in the matrices and estimates the number of microdomains. For example, in the 44 and 62 bp systems, the contacts along the genomic distance separate into 5, 2, and 1 nucleosome groups for topologies 1 to 3, and into 2 and 1 group for topology 4, respectively. In the 26 bp and Life-Like systems, where microdomains are more diffuse due to fiber rigidity or polymorphism, we see that the clustering results are not as TF-topology-dependent as in the 44 and 62 bp systems. We also decomposed the contact matrices into one dimensional plots that depict the magnitude of 𝑖, 𝑖 ± 𝑘 internucleosome interactions. We see that internucleosome patterns change with the TF binding topology, and that the 26 bp and Life-Like systems show the least changes.

      1. When increasing TF concentration, from 0 to 100%, it seems that both packing ratio and sedimentation coefficients are not sensitive to the TF concentrations after 25%. Is it due to the saturation of TF binding? How many TF binding sites are considered at each concentration?

      Yes, in most cases, at TF concentrations higher than 25%, the fiber compaction does not change due to saturation of TF binding. Although the TF concentrations are reached, such as 50%, 70%, or 100%, these do not influence the fiber architecture. A higher order folding and compaction cannot be reached due to excluded volume interactions that impede overlapping of beads in the model.<br /> We have clarified this in the manuscript.

      As stated in the Methods section, the TF concentration refers to the number of linker DNA beads that can engage in a constraint compared to the total number of linker DNA beads. Thus, at 25% TF, 25% of linker DNA beads are engaged in TF constraints. We have added a comment on this in the Results section.

      1. It is shown that the contact maps that reveal microdomains are ensemble-based maps and single trajectories do not show clear formation of microdomains. Does the formation of microdomains increase with the number of combined trajectories?

      The formation of microdomains occurs in each single trajectory. However, the microdomains formed in each trajectory can be different. That is why ensemble-based maps show clearer trends of microdomains that might not be as visible in single-trajectory maps. If we increase the number of trajectories, the macrodomains will be more visible and there will be more macrodomains in the contact map, but the formation of microdomains will not increase in each single trajectory.

      1. "As we see from Figure 4A, when the linker DNA is short, such as 26 and 35 bp, TF binding does not increase the packing ratio of the fiber." The results of 35bp cannot be found in Figure 4A. In addition, the color of 44 and 62 bp should be changed since they are very similar in the figure.

      Thank you for catching this. The results corresponding to the 35 bp system are presented in the Supporting Figure 7. We have changed the text to read “As we see from Figure 4A and Figure S7..”.

      We have changed the color of the 62 bp trace to blue in the plots of Figure 4. Consistently, we have also changed the color of the 62 bp fiber in Figure 2 and Figure 5.

      1. For modelling of TF binding at increasing concentrations, it is mentioned that in these three conditions, TFs are allowed to bind to any region. Do you mean TF can also bind to nucleosomal DNA? Nucleosome structure prevents the binding of many TFs.

      In our model, only linker DNA beads can engage in the constraints (bind TF).<br /> We have changed the text to read “TFs are allowed to bind to any linker DNA region”.

      1. The details of the Mnase-seq dataset and how NFRs are identified should be provided, such as the coverage of the data and what read fragments are selected for NFR mapping.

      MNase data in bedgraph format were downloaded from the Genome Expression Omnibus (GSM2083107) repository and loaded without further processing into the Genome Browser. NFRs were visually inspected and detected as genomic regions without peaks. As detailed in the GEO repository, the sequenced paired-end reads were mapped to the mm9 genome. Only uniquely mapped reads with no more than two mismatches were retained and reads with insert sizes less than 50 or larger than 500 bp were discarded.

      We have clarified this in the manuscript.

      1. The calculations of volume and area of the Eed promoter region should be further elucidated.

      Thank you. We now elaborate upon these calculations. In particular, the Eed promoter region is defined between cores 123 and 129. The x,y or x,y,z coordinates of those cores are used to create the bounding area or volume by defining the shape’s vertices.

      1. In Figure 3, it is not clear how different topology are identified.

      In Figure 3 the topology, or TF binding regions, is the same for each of the 10 contact maps as these emerge from trajectory replicas of the same system which we named Topology 1. Different microdomains are formed in each individual trajectory as the high-frequency regions appear in different locations on each contact map. However, when these 10 maps are summed, the ensemble contact map clearly shows consensus microdomains in each region where TF binds.

      Reviewer #2:

      To further improve the manuscript, I have the following suggestions/comments.

      1. While most of the conclusions in this paper follow from the evidence provided by the ximulations, the result in section 3.3 title "Gene locus repression is medicated by TF finding," may not follow from the results. In my opinion, repression is a more complex process, and many more factors (such as nucleosome positioning, nucleosome sliding, histone methylation, and other proteins such as PRC or HP1, etc) may be involved in repression. While compaction is often associated with repressed chromatin (heterochromatin), recent studies have shown that heterochromatin fibers are highly diverse, and compaction alone may not be the criteria for repression (eg. see Spracklin et al. Nat. Struct. Mol. Biol. 30, 38-51 (2023).). In this light, I would recommend slightly modifying the title to say, "TF binding-mediated compaction can help in gene locus repression" or something similar.

      Yes! We completely agree that gene repression is a very complex phenomenon that involves many factors that we are approaching by modeling starting from the simplest strategy. Thus, we have changed the subtitle to read “TF binding-mediated compaction as possible mechanism of gene locus repression”.

      1. Authors could also present the contact probability versus genomic distance. This may provide some generic features at nucleosome resolution, given the variability in linker length and LH density.

      We thank the reviewer for this suggestion. We have now calculated the contact probability for the EED gene with and without TF binding (Supporting Figure 8). We see that the contact probability corresponding to short range interactions (i ± 2, 3, 4, 5, and 6) is slightly lower for the EED gene upon TF binding. However, a striking increase in the contact probability upon TF binding is seen in the genomic region between 3 and 5 kb, which corresponds to local loop interactions. Thus, TF binding slightly decreases local interactions but increases chromatin loops. Such changes are not observed for the EED system with LH density 0.8 (Supporting Figure 9), further supporting the idea that an increase in LH density hampers the effect of TF binding for the EED gene architecture. <br /> We have now added these results to the manuscript.

      1. Write a short paragraph about the limitations of the model/study. For example, one of the limitations could be that, as of now, it has only the effect of a few proteins, but to predict repression, one may need to incorporate the effect of several proteins.

      We agree with the reviewer that our model is a simple, first-step approach. Nonetheless, even the simplest mathematical model can be enlightening in helping dissect essential factors. Here, our model clearly shows how TF binding location modulates fiber architecture and the interplay between TF binding and other chromatin elements, like linker DNA length, LH density, and histone acetylation. We have now stated in the Discussion section that although limited due to being implicit and not considering other protein partners, our model can provide insights on the regulation of chromatin architecture by protein binding. Future modeling with explicit protein binding or combination of several proteins will further help us understand genome folding regulation.

      1. The radius of gyration of 26 kb chromatin is around ~60nm in this paper. Is there any experimental measurement to compare (approximate order of magnitude)? While I do not know any measurement for Eed gene locus, I am aware of the results in the Boettiger et al. paper from Xiaowei Zhuang lab (Nature 2016). There, they find that the Rg of a 26 kb region is above 100nm. But that is for a different organism, a different set of genes. Also, see Sangram Kadam et al. Nature Communications 14 (1), 4108, 2023.

      Thank you for this suggestion. To the best of our knowledge, there are no radius of gyration measurements for the EED gene. Regarding the two papers you cite, in the paper from Boettiger et al. (1) they determine by microscopy experiments that Rg ∝ 𝐿! where 𝐿 is the genomic length and 𝑐 is 0.37 ± 0.02 for active chromatin (Figure 1d of the paper). In such case, the Rg for a 26 kb region would be 43 ± 9 nm. Considering that these are Drosophila cells, our value of 62 nm is in good agreement with that estimate. Regarding the Kadam et al. paper (2), by coarse grained modeling they find an Rg of around 100 nm for different genes. Considering that the radius of gyration depends on cell type and fiber configuration (see for example (3) for the dependency of Rg on loop number and persistence length), we believe that our measurements in the same ball park as experimental results and other theoretical modeling studies are good indicators of our model’s reasonableness.

      We have added this comparison to the manuscript.

      1. The reason why it is useful to compare some distance measurements (physical dimension) with experiments is the following: The contact map in Hi-C only gives relative contact probabilities. It does not give absolute contact probabilities. To convert a Hi-C map into a physical distance, one requires comparison with some experimentally measured 3D distance. The radius of gyration is an ideal quantity to compare. From my experience, the contact probability is often much smaller than 1, suggesting that the chromatin is more expanded. But this could be due to the effect of many other proteins in vivo and the crowding, etc. I do not expect this work to incorporate all those effects. However, it may be useful to make a comment about it in the manuscript.

      Thank you. We have added to the discussion a comment on our first-generation model of TF binding to chromatin and the neglect of many associated protein and RNA cofactors that certainly influence chromosome folding and domain formation on higher scales. Some distance measures are also added to the Results as mentioned above.

      References

      1. Boettiger,A.N., Bintu,B., Moffitt,J.R., Wang,S., Beliveau,B.J., Fudenberg,G., Imakaev,M., Mirny,L.A., Wu,C. and Zhuang,X. (2016) Super-resolution imaging reveals distinct chromatin folding for different epigenetic states. Nature, 529, 418–422.

      2. Kadam,S., Kumari,K., Manivannan,V., Dutta,S., Mitra,M.K. and Padinhateeri,R. (2023) Predicting scale-dependent chromatin polymer properties from systematic coarsegraining. Nat. Commun., 14, 4108.

      3. Wachsmuth,M., Knoch,T.A. and Rippe,K. (2016) Dynamic properties of independent chromatin domains measured by correlation spectroscopy in living cells. Epigenetics Chromatin, 9, 57.

    1. Author Response

      The following is the authors’ response to the original reviews.

      Reviewer #1 (Recommendations For The Authors):

      I have only a few very minor suggestions for improvement.

      • the text repeatedly uses the terms "central nervous system" and "enteric nervous system", which are not in standard use in the field. These terms are not defined until the bottom of p. 12 even though they are used earlier. It would be useful for the authors to explicitly describe their definitions of these terms earlier in the paper.

      Fixed.

      • the inclusion of four pre-trained models is a powerful and useful aspect of WormPsyQi. Would it be possible to develop a simple tool that, when given the user's images, could recommend which of the four models would be most appropriate?

      We appreciate the reviewer for bringing this up. To address this, we have now added an additional function in the pipeline to test all pre-trained models on representative input images. Before processing an entire dataset, users can view all segmentation results for images in Fiji to assess which model performed best, judged by the user. The GUI, running guide document, and manuscript have been modified accordingly.

      In addition, we would like to emphasize that the pre-trained models were developed by iterative analyses of many reporters, often with multiple rounds of parameter tuning; the results were validated post hoc to choose the optimal model for each reporter, and we have listed this information in Supplemental Table 1 to inform the choice of the pre-trained model for commonly used reporter types.

      • On p. 11 (and elsewhere), the differences in the performance of WormPsyQi and human experimenters are called "statistically insignificant". This statement is not particularly informative (absence of evidence is not evidence of absence). Can the authors provide a more rigorous analysis here - or provide an estimate of the typical effect size of the machine-vs-human difference?

      To address this, we have included additional analysis in Figure 2 – figure supplement 3. For two reporters - I5 GFP::CLA-1 and M4 GFP::RAB-3 - we compare WormPsyQi vs. labelers and inter-labeler puncta quantification. A high Pearson correlation coefficient (r2) reflects greater correspondence between two independent scoring methods. We chose these two test cases to demonstrate that the machine-vs-human effect size is reporter-dependent. For I5, where the CLA-1 signal is very discrete and S/N ratio is high, the discrepancy between WormPsyQi, labeler 1, and labeler 2 is minimal (r2=0.735); moreover, scoring correspondence depends on the labeler (r2=0.642 and 0.942, respectively). In other words, WormPsyQi mimics some labelers better than others, which is to be expected. For M4, where the RAB-3 signal is diffuse and synapse density is high in the ROI, the inter-labeler discrepancy is high (r2=0.083) and WormPsyQi vs labeler (1 or 2) discrepancy is slightly reduced (r2=0.322 and 0.116, respectively). The problematic regions for the M4 RAB-3 reporter are emphasized in Figure 6 - figure supplement 1A. Overall, the additional analysis suggests that the effect size is contingent on the reporter type and image quality, and importantly for scoring difficult strains WormPsyQi may average out inter-labeler scoring variability.

      • p. 12: "Again, relying on alternative reporters where possible..." This is an incomplete sentence - are some words missing?

      Edited.

      Reviewer #2 (Recommendations For The Authors):

      1. The authors effectively validated the sexually dimorphic synaptic connectivity by comparing the synapse puncta numbers of PHB>AVA, PHA>AVG, PHB>AVG, and ADL>AVA. However, these differences appear to be quite robust. It would be beneficial for the authors to test whether WormPsyQi can detect more subtle changes at the synapses, such as 10-20% changes in puncta number and fluorescence intensity.

      While the dimorphic strains were used to first validate WormPsyQi based on the ground truth of very well-characterized reporters, the reviewer reasonably asks whether our pipeline can pick up on more subtle differences. To address this, we have now included an additional figure (Figure 9 – figure supplement 2), where we performed pairwise comparisons between L4 and adult timepoints for the reporter M3 GFP::RAB-3. As reflected in panels A and C, although the difference between puncta number and mean intensity between L4 and adult is marginal (22% increase in puncta number and 13% increase in mean intensity from L4 to adult), WormPsyQi can pick it up as statistically significant.

      1. On page 10, the authors mentioned that "cell-specific RAB-3 reporters have a more diffuse synaptic signal compared to the punctate signal in CLA-1 reporters for the same neuron, as shown for the neuron pair ASK (Figure 4 -figure supplement 1B, C)". It is important to note that in this case, the reporter gene expressing RAB-3 is part of an extrachromosomal array, whereas the reporter gene expressing CLA-1 is integrated into the chromosome. It's possible that the observed difference in pattern may arise from variations in the transgenic strategies employed.

      To emphasize the difference in puncta features inherent to the reporter type, we have now added WormPsyQi segmentation results for ASK CLA-1 extrachromosomal reporter (otEx7455) next to the ASK CLA-1 integrant (otIs789) and ASK RAB-3 reporter (otEx7231) in Figure 4 – figure supplement 1C. Importantly, otEx7455 was integrated to generate otIs789, so they belong to the same transgenic line. Literature shows that RAB-3 and CLA-1 have different localization patterns and corresponding functions at presynaptic specializations, and this is qualitatively and quantitatively shown by the significant difference in puncta area size between RAB-3 and both CLA-1 reporters, i.e., both CLA-1 reporters have smaller, discrete puncta compared to RAB-3 (Figure 4 – figure supplement 1C). Quantitatively, in the case of ASK - where the synapse density is sparse enough that even diffuse RAB-3 puncta can be segmented without confounding adjacent puncta – overall puncta number between otEx7231 and otIs789 are similar. However, RAB-3 signal is diffuse and this poses quantification problems in cases where the synapse density is higher (e.g. AIB, SAA in Figure 4 – figure supplement 1D) and WormPsyQi fails to score puncta in these reporters since the signal is not punctate. As far as integrated vs. extrachromosomal reporters go, the reviewer is right in pointing out that some differences may be stemming from reporter type as our additional analysis between otIs789 and otEx7455 indeed shows fewer puncta in the latter owing to variable expressivity.

      1. The authors mentioned that having a cytoplasmic reporter in the background of the synaptic reporter enhanced performance. It would be more informative to provide comparative results with and without cytoplasmic reporters, particularly for scenarios involving dim signals or densely distributed signals.

      The presence of a cytoplasmic marker is critical in two specific scenarios: 1) images where the S/N ratio is poor, and 2) when the image S/N ratio is good, but the ROI is large, which would make the image processing computationally expensive.

      To demonstrate the first scenario, we have included an additional panel in Figure 4 – figure supplement 1(B) to show how WormPsyQi performs on the PHB>AVA GRASP reporter with and without the channel having cytoplasmic marker. The original image was processed as-is in the former case with both the synaptic marker in green and cytoplasmic marker in red; for comparison, only the green channel having synaptic marker was used to simulate a situation where the strain does not have a cytoplasmic marker. As shown in the figure, in the presence of background autofluorescence signal from the gut (which can be easily confounded with GRASP puncta depending on the worm’s orientation), WormPsyQi quantified GRASP puncta much more robustly with the cytoplasmic label; without the cytoplasmic marker, gut puncta are incorrectly segmented as synapses (highlighted with red arrows) while some dim synaptic puncta are not picked up (highlighted with yellow arrows).

      To demonstrate the second scenario, we now highlight the case of ASK CLA-1 in Figure 2 - figure supplement 4E. Additionally, we have emphasized in the manuscript that in cases where the S/N ratio is good and the image is restricted to a small ROI, WormPsyQi will perform well even in the absence of a cytoplasmic marker. This is equally important to note as having a specific cytoplasmic marker in the background may not always be feasible and, in fact, if the cytoplasmic marker is discontinuous or dim relative to puncta signal, using a suboptimal neurite mask for synapse segmentation would result in undercounting synapses.

      1. On page 12, the author stated "We also note that in several cases, GRASP quantification differed from EM scoring". However, the EM scoring is primarily based on a single sample, making it challenging to conduct a statistical analysis for the purpose of comparison.

      This is correct and is indeed a limitation of EM for this type of analysis. We have now reworded this sentence (page 14) to emphasize the reviewer’s point, and it is also elaborated further in the limitations section.

      1. In Figure 6F, the discrepancy between WormPsyQi and human quantification in the analysis of RAB-3 is observed. The author stated that "the RAB-3 signal was too diffuse to resolve all puncta". To better illustrate this discrepancy, it would be beneficial to include images highlighting the puncta that WormPsyQi cannot score, providing direct evidence that diffusing signals are not able to automatically detectable.

      To highlight puncta that were not segmented by WormPsyQi but were successfully scored manually, we have included arrows in Figure 6. In addition, for reporter M4p::GFP::RAB-3, we have included magnified insets in Figure 6 - figure supplement 1A to highlight the region where human annotator scores more puncta than WormPsyQi owing to the high synapse density. In future implementations, additional functionality can be built for separating these merged puncta into instances based on geometrical features such as shape and intensity contour.

      1. In Figure 9 S1D, the results from WormPsyQi and the manual are totally different. To address this notable discrepancy, the authors should highlight and illustrate the areas of discrepancy in the images. This visual representation can assist future users in identifying signal types that may not be well-suited for WormPsyQi analysis and inspire the development of new strategies to tackle such challenges.

      This is now addressed in additional figure panels in Figure 4 – figure supplement 1B and Figure 6 - figure supplement 1A.

      Reviewer #3 (Recommendations For The Authors):

      I found the comparison between manual quantification and WormPsyQi-based quantification to be very informative. In my opinion, quantifying the number of puncta is not the most tedious/difficult quantification even when done manually. Would the authors be able to include manual-WormPsyQi comparison for more time-consuming and potentially more prone to human error/bias quantifications such as puncta size or distribution patterns using a few markers with some inter/intra animal variabilities?

      To address this point, we have now included an additional figure supplement to Figure 2 (Figure 2 – figure supplement 4). We focused on the ASK GFP::CLA-1 reporter and had two human annotators manually label the masks of puncta for each worm by scanning Z-stacks and drawing all pixels belonging to each puncta in Fiji, which were then processed by WormPsyQi’s quantification pipeline to score puncta number, volume, and distribution. We also included a comparison of overall image processing time for each annotator and WormPsyQi. For features analyzed, the difference between WormPsyQi and human annotators for ASK CLA-1 is not statistically significant for multiple puncta features. Importantly, WormPsyQi reduces overall processing time by at least an order of magnitude, and while this is already advantageous for counting puncta, it is especially useful for other important puncta features since a) they may not be easily discernible, and b) it is extremely laborious to quantify them manually in large datasets when pixel-wise labels are required.

      The authors listed minimum human errors and biases as one of the benefits of WormPsyQi. For the markers with discrepancies in quantifications between human and WormPsyQi, have the authors encountered or considered human errors/biases as potential reasons for such discrepancies?

      This is the same point brought up by reviewer 1. We added Figure 2- figure supplement 3 to compare WormPsyQi to different human labelers, and show that because human labels can introduce systematic bias, WormPsyQi reduces such bias by scoring images using the same metric.

      The authors noted that WormPsyQi would be useful for comparing different genotypes/environments. Some mutants have known changes in synapse patterning/number. It would be helpful if the authors could validate WormPsyQi using some of the mutants with known synapse defects. For instance, zig-10 mutant increases the cholinergic synapse density just by a bit (Cherra and Jin, Neuron 2016), and nlr-1 mutant disrupts punctated localization of UNC-9 gap junction in the nerve ring (Meng and Yan, Neuron 2020), which could only be detectable by experts' eyes. It would be interesting to see if WormPsyQi picks up such subtle phenotypes.

      We agree that our pipeline would need to be tested in multiple paradigms to test its performance on detecting additional subtle phenotypes. In the context of this paper, we note that the developmental analysis of puncta in Figure 8 was performed to validate the ground truth from previous EM-based analyses (Witvliet et al., 2021), albeit the latter was limited by sample size. We extended this developmental analysis to the pharyngeal reporters, and in some cases the difference across timepoints was marginal (as emphasized by additional Figure 9 - figure supplement 2), but still detected by WormPsyQi. Lastly, our synapse localization analysis in Figure 10 assigns the probability of finding a synapse at a particular location along a neurite, which is not easily discernible by manual scoring.

      One of the benefits of the automated data analysis program is to be able to notice the differences you do not expect. For example, there are situations where you feel that in certain genotypes there is something different from wild type with their synapses but you can't tell what's different from wild type. In such cases, you may not know what to quantify. I think it would be beneficial if there were more parameters to be included in the default qualifications such as puncta number/size/intensity/distributions in the pipeline, so that the users may find unexpected phenotypes from one of the default quantifications.

      We apologize if this was not clearer in the manuscript where we first describe the pipeline in detail. To clarify, the output of WormPsyQi is a CSV file which includes several quantitative features, such as mean/max/min fluorescence intensity, puncta volume, and position. While most of our analyses are focused on puncta count, the user can perform downstream statistical analyses on all additional features scored to infer which features are most significantly variable across conditions. To make this clearer, we have elaborated the text when we first describe our pipeline, and along with the new Figure 2 - figure supplement 4, we hope that this point is clearer now.

      In addition, most proof-of-principle analysis we performed was focused on an ROI where we expect the synapses to localize. In practice, the user can input images and perform quantification across the entire image without biasing toward an ROI (this can be done in the GUI synapse corrector window) to also evaluate synaptic changes in regions outside the usual ROI.

      The authors stated that WormPsyQi could mitigate the problems stemming from scoring images with low signal-to-noise ratio or in regions with high background autofluorescence, laboriousness of scoring large datasets, and inter-dataset variability. Other than the 'laboriousness of scoring large datasets' it appeared to me that WormPsyQi does not do better than manual quantifications, especially inter-dataset variability, as the authors noted variability among the transgenes as one of the limitations of the toolkits. If two datasets are taken with completely different setups such as two independent arrays taken with two distinct confocal microscopes, would WormPsyQi make these two datasets comparable?

      We have included additional figure supplements to address the reviewer’s point. A significant advantage WormPsyQi offers over manual scoring is that it provides a standardized method of quantifying synapse features. As shown in Figure 2 – figure supplement 3, human labelers can introduce systematic bias (e.g. some over count puncta, while some undercount). In addition, while puncta number may be relatively easy to quantify, especially in a high-quality dataset, more subtle puncta features such as size, intensity, and distribution are much more laborious to quantify and require a priori knowledge of signal localization (Figure 2 – figure supplement 4, Figure 10). Altogether, our pipeline facilitates multiple measurements while also enabling robust quantification in hard-to-score cases such as the example shown for PHB>AVA reporter (Figure 4 - figure supplement 1B).

      Minor comments:

      Limitations are not quite specific to this work but those are general limitations to the concatemeric trans genes and fluorescently labeled synaptic proteins. I'd appreciate discussing specific limitations to WormPsyQi related to image acquisitions. For instance, for neurons with 3D structures would WormPsyQi be able to handle z-stacks closer to coverslip and stacks that are deeper side in a similar manner? Would the users need to be aware of such limitations when comparing different genotypes?

      To address the reviewer’s comment, we have elaborated the last paragraph in the limitations section to explicitly discuss where the user should exercise caution. The reviewer reasonably points out that the fluorescent signal away from the cover slip is typically dimmer, and neurite masking in this case is indeed compromised if dim to start with. In such cases, we recommend that the user either performs some preprocessing such as deconvolution, denoising, or contrast enhancement to boost the neurite signal, or segment synapses without the neurite mask if the puncta signal is brighter than that of the cytoplasmic marker. We hope that our additional figure supplements will clarify that WormPsyQi’s performance is contingent on reporter type and image quality, thus making it easier for the user to discern where automated quantification falls short and alternative reporters should be explored. In general, if puncta are not discernible to the user due to very poor S/N ratio, for instance, we do not recommend using WormPsyQi to process such datasets; this will be manifest in the results of the new “test all models” feature we added in the revised version.

      Some Rab-3 fusion proteins are described as RAB-3::GFP(BFP). Do these represent the C-terminal fusion of the fluorescent proteins? RAB-3 is a small GTPase with a lipid modification site at its C-terminus essential for its localization and function. Is it possible that the diffuse signal of some RAB-3 markers is caused by c-terminal fusion of the fluorescent protein?

      While we do have reporters with N- and C-terminal RAB-3 fusions for different neurons, we do not have both for the same neuron to perform a fair comparison. However, as noted in response to a previous comment by reviewer 2, RAB-3 and CLA-1 have distinct localization patterns at the synapse and this aligns with their distinct functions: while RAB-3 localizes at synaptic vesicles, CLA-1 is an active zone protein required for synaptic vesicle clustering. Accordingly, we have observed diffuse RAB-3 signal in reporters irrespective of where the protein is tagged, and while this is not problematic for ROIs with a low synapse density, it confounds quantification in synapse-dense regions. In contrast, CLA-1 puncta are typically easier to quantify more discretely, which is particularly relevant for features such synapse distribution, size, and intensity.

    1. Author Response

      The following is the authors’ response to the original reviews.

      Public Reviews:

      Reviewer #1 (Public Review):

      In this very strong and interesting paper the authors present a convincing series of experiments that reveal molecular mechanism of neuronal cell type diversification in the nervous system of Drosophila. The authors show that a homeodomain transcription factor, Bsh, fulfills several critical functions - repressing an alternative fate and inducing downstream homeodomain transcription factors with whom Bsh may collaborate to induce L4 and L5 fates (the author's accompanying paper reveals how Bsh can induce two distinct fates). The authors make elegant use of powerful genetic tools and an arsenal of satisfying cell identity markers.

      Thanks!

      I believe that this is an important study because it provides some fundamental insights into the conservation of neuronal diversification programs. It is very satisfying to see that similar organizational principles apply in different organisms to generate cell type diversity. The authors should also be commended for contextualizing their work very well, giving a broad, scholarly background to the problem of neuronal cell type diversification.

      Thanks!

      My one suggestion for the authors is to perhaps address in the Discussion (or experimentally address if they wish) how they reconcile that Bsh is on the one hand: (a) continuously expressed in L4/L4, (b) binding directly to a cohort of terminal effectors that are also continuously expressed but then, on the other hand, is not required for their maintaining L4 fate? A few questions: Is Bsh only NOT required for maintaining Ap expression or is it also NOT required for maintaining other terminal markers of L4? The former could be easily explained - Bsh simply kicks of Ap, Ap then autoregulates, but Bsh and Ap then continuously activate terminal effector genes. The second scenario would require a little more complex mechanism: Bsh binding of targets (with Notch) may open chromatin, but then once that's done, Bsh is no longer needed and Ap alone can continue to express genes. I feel that the authors should be at least discussing this. The postmitotic Bsh removal experiment in which they only checked Ap and depression of other markers is a little unsatisfying without further discussion (or experiments, such as testing terminal L4 markers). I hasten to add that this comment does not take away from my overall appreciation for the depth and quality of the data and the importance of their conclusions.

      Great suggestions, we will discuss these two hypotheses as requested.

      Bsh initiates Ap expression in L4 neurons which then maintain Ap expression independently of Bsh expression, likely through Ap autoregulation. During the synaptogenesis window, Ap expression becomes independent from Bsh expression, but Bsh and Ap are both still required to activate the synapse recognition molecule DIP-beta. Additionally, Bsh also shows putative binding to other L4 identity genes, e.g., those required for neurotransmitter choice, and electrophysiological properties, suggesting Bsh may initiate L4 identity genes as a suite of genes. The mechanism of maintaining identity features (e.g., morphology, synaptic connectivity, and functional properties) in the adult remains poorly understood. It is a great question whether primary HDTF Bsh maintains the expression of L4 identity genes in the adult. To test this, in our next project, we will specifically knock out Bsh in L4 neurons of the adult fly and examine the effect on L4 morphology, connectivity, and function properties.

      Reviewer #2 (Public Review):

      Summary:

      In this paper, the authors explore the role of the Homeodomain Transcription Factor Bsh in the specification of Lamina neuronal types in the optic lobe of Drosophila. Using the framework of terminal selector genes and compelling data, they investigate whether the same factor that establishes early cell identity is responsible for the acquisition of terminal features of the neuron (i.e., cell connectivity and synaptogenesis).

      Thanks for the positive words!

      The authors convincingly describe the sequential expression and activity of Bsh, termed here as 'primary HDTF', and of Ap in L4 or Pdm3 in L5 as 'secondary HDTFs' during the specification of these two neurons. The study demonstrates the requirement of Bsh to activate either Ap and Pdm3, and therefore to generate the L4 and L5 fates. Moreover, the authors show that in the absence of Bsh, L4 and L5 fates are transformed into a L1 or L3-like fates.

      Thanks!

      Finally, the authors used DamID and Bsh:DamID to profile the open chromatin signature and the Bsh binding sites in L4 neurons at the synaptogenesis stage. This allows the identification of putative Bsh target genes in L4, many of which were also found to be upregulated in L4 in a previous single-cell transcriptomic analysis. Among these genes, the paper focuses on Dip-β, a known regulator of L4 connectivity. They demonstrate that both Bsh and Ap are required for Dip-β, forming a feed-forward loop. Indeed, the loss of Bsh causes abnormal L4 synaptogenesis and therefore defects in several visual behaviors. The authors also propose the intriguing hypothesis that the expression of Bsh expanded the diversity of Lamina neurons from a 3 cell-type state to the current 5 cell-type state in the optic lobe.

      Thanks for the excellent summary of our findings!

      Strengths:

      Overall, this work presents a beautiful practical example of the framework of terminal selectors: Bsh acts hierarchically with Ap or Pdm3 to establish the L4 or L5 cell fates and, at least in L4, participates in the expression of terminal features of the neuron (i.e., synaptogenesis through Dip-β regulation).

      Thanks!

      The hierarchical interactions among Bsh and the activation of Ap and Pdm3 expression in L4 and L5, respectively, are well established experimentally. Using different genetic drivers, the authors show a window of competence during L4 neuron specification during which Bsh activates Ap expression. Later, as the neuron matures, Ap becomes independent of Bsh. This allows the authors to propose a coherent and well-supported model in which Bsh acts as a 'primary' selector that activates the expression of L4specific (Ap) and L5-specific (Pdm3) 'secondary' selector genes, that together establish neuronal fate.

      Thanks again!

      Importantly, the authors describe a striking cell fate change when Bsh is knocked down from L4/L5 progenitor cells. In such cases, L1 and L3 neurons are generated at the expense of L4 and L5. The paper demonstrates that Bsh in L4/L5 represses Zfh1, which in turn acts as the primary selector for L1/L3 fates. These results point to a model where the acquisition of Bsh during evolution might have provided the grounds for the generation of new cell types, L4 and L5, expanding lamina neuronal diversity for a more refined visual behaviors in flies. This is an intriguing and novel hypothesis that should be tested from an evo-devo standpoint, for instance by identifying a species when L4 and L5 do not exist and/or Bsh is not expressed in L neurons.

      Thanks for the appreciation of our findings!

      To gain insight into how Bsh regulates neuronal fate and terminal features, the authors have profiled the open chromatin landscape and Bsh binding sites in L4 neurons at mid-pupation using the DamID technique. The paper describes a number of genes that have Bsh binding peaks in their regulatory regions and that are differentially expressed in L4 neurons, based on available scRNAseq data. Although the manuscript does not explore this candidate list in depth, many of these genes belong to classes that might explain terminal features of L4 neurons, such as neurotransmitter identity, neuropeptides or cytoskeletal regulators. Interestingly, one of these upregulated genes with a Bsh peak is Dip-β, an immunoglobulin superfamily protein that has been described by previous work from the author's lab to be relevant to establish L4 proper connectivity. This work proves that Bsh and Ap work in a feed-forward loop to regulate Dip-β expression, and therefore to establish normal L4 synapses. Furthermore, Bsh loss of function in L4 causes impairs visual behaviors.<br /> Thanks for the excellent summary of our findings.

      Weaknesses:

      ● The last paragraph of the introduction is written using rhetorical questions and does not read well. I suggest rewriting it in a more conventional direct style to improve readability.

      We agree and have updated the text as suggested.

      ● A significant concern is the way in which information is conveyed in the Figures. Throughout the paper, understanding of the experimental results is hindered by the lack of information in the Figure headers. Specifically, the genetic driver used for each panel should be adequately noted, together with the age of the brain and the experimental condition. For example, R27G05-Gal4 drives early expression in LPCs and L4/L5, while the 31C06-AD, 34G07-DBD Split-Gal4 combination drives expression in older L4 neurons, and the use of one or the other to drive Bsh-KD has dramatic differences in Ap expression. The indication of the driver used in each panel will facilitate the reader's grasp of the experimental results.

      We agree and have updated the figure annotation.

      ● Bsh role in L4/L5 cell fate: o It is not clear whether Tll+/Bsh+ LPCs are the precursors of L4/L5. Morphologically, these cells sit very close to L5, but are much more distant from L4.

      Our current data show L4 and L5 neurons are generated by different LPCs. However, currently, we don’t have tools to demonstrate which subset of LPCs generate which lamina neuron type. We are currently working on a follow-up manuscript on LPC heterogeneity, but those experiments have just barely been started.

      ● Somatic CRISPR knockout of Bsh seems to have a weaker phenotype than the knockdown using RNAi. However, in several experiments down the line, the authors use CRISPR-KO rather than RNAi to knock down Bsh activity: it should be explained why the authors made this decision. Alternatively, a null mutant could be used to consolidate the loss of function phenotype, although this is not strictly necessary given that the RNAi is highly efficient and almost completely abolishes Bsh protein.

      The reason we chose CRISPR-KO (L4-specific Gal4, uas-Cas9, and uas-Bsh-sgRNAs) is that it effectively removed Bsh expression from the majority of L4 neurons. However, it failed to knock down Bsh in L4 neurons using L4-split Gal4 and Bsh-RNAi because L4-split Gal4 expression depends on Bsh. We have updated this explanation in the text.

      ● Line 102: Rephrase "R27G05-Gal4 is expressed in all LPCs and turned off in lamina neurons" to "is turned off as lamina neurons mature", as it is kept on for a significant amount of time after the neurons have already been specified.

      Thanks; we have made that change.

      ● Line 121: "(a) that all known lamina neuron markers become independent of Bsh regulation in neurons" is not an accurate statement, as the markers tested were not shown to be dependent on Bsh in the first place.

      Good point. We have rephrased it as “that all known lamina neuron markers are independent of Bsh regulation in neurons”.

      ● Lines 129-134: Make explicit that the LPC-Gal4 was used in this experiment. This is especially important here, as these results are opposite to the Bsh Loss of Function in L4 neurons described in the previous section. This will help clarify the window of competence in which Bsh establishes L4/L5 neuronal identities through ap/pdm3 expression.

      Thanks! We have updated Gal4 information in the text for every manipulation.

      ● DamID and Bsh binding profile:

      ● Figure 5 - figure supplement 1C-E: The genotype of the Control in (C) has to be described within the panel. As it is, it can be confused with a wild type brain, when it is in fact a Bsh-KO mutant.

      Great point! Thank you for catching this and we have updated it.

      ● It Is not clear how L4-specific Differentially Expressed Genes were found. Are these genes DEG between Lamina neurons types, or are they upregulated genes with respect to all neuronal clusters? If the latter is the case, it could explain the discrepancy between scRNAseq DEGs and Bsh peaks in L4 neurons.

      We did not use “L4-specific Differentially Expressed Genes”. Instead, we used all genes that are significantly transcribed in L4 neurons (line 209-213).

      ● Dip-β regulation:

      ● Line 234: It is not clear why CRISPR KO is used in this case, when Bsh-RNAi presents a stronger phenotype.

      As we explained above, the reason we chose CRISPR-KO (L4-specific Gal4, uas-Cas9, and uas-BshsgRNAs) is that it effectively removed Bsh expression from the majority of L4 neurons. However, it failed to knock down Bsh in L4 neurons using L4-split Gal4 and Bsh-RNAi because L4-split Gal4 expression depends on Bsh. We have updated this explanation in the text.

      ● Figure 6N-R shows results using LPC-Gal4. It is not clear why this driver was used, as it makes a less accurate comparison with the other panels in the figure, which use L4-Split-Gal4. This discrepancy should be acknowledged and explained, or the experiment repeated with L4-Split-Gal4>Ap-RNAi.

      I think you mean 6J-M shows results using LPC-Gal4. We first tried L4-Split-Gal4>Ap-RNAi but it failed to knock down Ap because L4-Split-Gal4 expression depends on Ap. We have added this to the text.

      ● Line 271: It is also possible that L4 activity is dispensable for motion detection and only L5 is required.

      Thanks! Work from Tuthill et al, 2013 showed that L5 is not required for any motion detection. We have included this citation in the text.

      ● Discussion: It is necessary to de-emphasize the relevance of HDTFs, or at least acknowledge that other, non-homeodomain TFs, can act as selector genes to determine neuronal identity. By restricting the discussion to HDTFs, it is not mentioned that other classes of TFs could follow the same PrimarySecondary selector activation logic.

      That is a great point, thank you! We have included this in the discussion.

    1. Author Response:

      We thank all reviewers for their comments and effort to improve our paper. We appreciate that the writing can be clarified overall, and some sections need more elaboration. We will provide these in the next revision within the coming months. Particularly, we will focus on some common themes identified by all reviewers:

      1. We will clarify that the coarse-grained brain surfaces are an output of our algorithm alone and not to be directly/naively likened to actual brain surfaces, e.g. in terms of the location or shape of the folds. Our analysis purely focuses on the likeliness in terms of whole-brain morphometrics between actual brains and coarse-grained brains. Specifically on the point of “thickening” of the brain: this is anatomically well-founded, as less folded brains have a “thicker” cortex than more folded brains, when they are all normalised to the same size. This is fundamentally why the universal scaling law also applies to these coarse-grained brains. We will provide more detail to highlight this.

      2. We will clarify the motivation behind our coarse-graining procedure better: mathematically, this is directly inspired by box-counting algorithms in fractal geometry; but this algorithm also has elegant parallels with other algorithms which we will highlight.

      3. The age effects are demonstrated here in a small sample as a proof-of-principle, but we will update our latest results using ~100 subjects from the CamCAN data demonstrating the same effect. We have additionally described and verified these age effects in more detail in a separate preprint (https://arxiv.org/abs/2311.13501) with ~1500 subjects, and additionally showed that scale-dependent metrics substantially improve understanding and applications such as brain age prediction.

      4. We have independently also received the feedback that we need to clarify how our method interacts with different resolution of the original MRI. We will add this as a new set of results, demonstrating that the MRI acquisition resolution (within a reasonable range) has a very small effect, as our method takes the reconstructed surfaces as a starting point.

      5. We agree that it may be confusing to emphasise a constant K in the first set of results across species, and then later highlight a changing K in the human ageing results. We will clarify that in the first set of results, we find a “constant” K relative to a changing S: The range in K across melted primate brains is approx 0.1, whereas in S it is over 1.2. In other words, S changes are an order of magnitude higher than K changes. Hence, we described K as “constant” relative to S. Nevertheless, K shows subtle changes within individuals, which is what we are describing in the human ageing results. These changes are within the range of K values described in the across species results.

      6. Finally, we will also make sure to summarise our specific contributions beyond existing work:

        (i) Showing for the first time that representative primate species follow the exact same fractal scaling – as opposed to previous work showing that they have a similar fractal dimension, i.e. slope, but not necessarily the same offset, as previous methods had no consistent way of comparing offsets.

        (ii) Previous work could also not show direct agreement in morphometrics between the coarse-grained brains of primate species and other non-primate mammalian species.

        (iii) Demonstrating in proof-of-principle that multiscale morphometrics, in practice, can have much larger effect sizes for classification applications. This moves beyond our previous work where we only showed the scaling law across and within species, but all on one (native) scale with comparable effect sizes for classification applications.

    1. Author Response

      Reviewer #2 (Public Review):

      Weaknesses:

      The paper contains multiple instances of non-scientific language, as indicated below. It would also benefit from additional details on the cryo-EM structure determination in the Methods and inclusion of commonly accepted requirements for cryo-EM structures, like examples of 2D class averages, raw micrographs, and FSC curves (between half-maps as well as between rigid-body fitted (or refined) atomic models of the different polymorphs and their corresponding maps). In addition, cryo-EM maps for the control experiments F1 and F2 should be presented in Figure 9.

      We will include the suggested data on the Cryo-EM analyses in a revised version of the preprint. We did not collect data on the sample used for the seeds in the cross seeding experiments because we had already confirmed in multiple datasets that the conditions in F1 and F2 reproducibly produce fibrils of Type 1 and Type 3, respectively. In a revised version we will include the analyses of several more datasets at the F1 and F2 conditions to support this statement.

      Reviewer #3 (Public Review):

      Weaknesses:

      1. The authors reveal that both Type 1 monofilament fibril polymorph (reminiscent of JOS-like polymorph) and Type 5 polymorph (akin to tissue-amplified-like polymorph) can both form under the same condition. Additionally, this condition also fosters the formation of flat ribbon-like fibril across different batches. Notably, at pH 5.8, variations in experimental groups yield disparate abundance ratios between polymorph 3B and 3C, indicating a degree of instability in fibrillar formation. The variability would potentially pose challenges for replicability in subsequent research. In light of these situations, I propose the following recommendations:

      (1) An explicit elucidation of the factors contributing to these divergent outcomes under similar experimental conditions is warranted. This should include an exploration of whether variations in purified protein batches are contributing factors to the observed heterogeneity.

      We are in complete agreement that understanding the factors that lead to polymorph variability is of utmost importance (and was the impetus for the manuscript itself). However the number of variables to explore is overwhelming and we will continue to investigate this in our future research. Regarding the variability between batches of purified protein, we also think that this could be a factor in the polymorph variability observed for otherwise “identical” aggregation conditions, particularly at pH 7 where the largest variety of polymorphs have been observed. While our data still indicates that Type 1,2 and 3 polymorphs are strongly selected by pH, the selection between interface variants 3B vs. 3C and 2A vs. 2B might also be affected by protein purity. Our standard purification protocol produces a single band by coomassie-stained SDS-PAGE however minor truncations and other impurities below a few percent would go undetected and, given the proposed roles of the N and C-termini in secondary nucleation, could have a large effect on polymorph selection and seeding. In line with the reviewer’s comments we now include a batch number for each EM dataset. While no new conclusions can be drawn from the inclusion of this additional data, we feel that it is important to acknowledge the possible role of batch to batch variability.

      (2) To enhance the robustness of the conclusions, additional replicates of the experiments under the same condition should be conducted, ideally a minimum of three times.

      The pH 5.8 conditions that yield Type 3 fibrils has already been repeated several times in the original manuscript. The pH 7.4 conditions were only mentioned twice, once as an unseeded and once as a cross-seeded fibrilization. We solved a second Type 1 structure from a second dataset from the same protein batch fibrillized under similar conditions at pH 7.4 but with the addition of inositol trisphosphate in the hopes that we could replicate one of the in vivo polymorphs. However only the Type 1 polymorphs were observed and so we will add this data point to the revised manuscript. We are currently screening more fibrils produced at pH 7.0 and will include any replicates of Type 5 or the Type 1M polymorphs or of new structures that are obtained at these conditions… however, as noted in the original manuscript, reproducibility at this pH might be difficult because there appears to be a wider range of accessible polymorphs. As will be mentioned in the revised version, the Type 5 structure was solved from a manually picked set of fibers that represented 10-20% of the observed fibrils. The remaining fibers in the sample comprised polymorphs that could not be analyzed due to their inhomogeneity or lack of twist.

      (3) Further investigation into whether different polymorphs formed under the same buffer condition could lead to distinct toxicological and pathology effects would be a valuable addition to the study.

      The correlation of toxicity with structure would in principle be interesting. However the Type 1 and Type 3 polymorphs formed at pH 5.8 and 7.4 are not likely to be biologically relevant. The pH 7 polymorphs (Type 5 and 1M) would be more interesting because they form under the same conditions and might be related to some disease relevant structures. Still, it is rare that a single polymorph appears at 7.0 (the Type 5 represented only 10-20% of the fibrils in the sample and the Type 1M also had unidentified double-filament fibrils in the sample). We plan to pursue this line of research and hope to include it in a future publication.

      1. The cross-seeding study presented in the manuscript demonstrates the pivotal role of pH conditions in dictating conformation. However, an intriguing aspect that emerges is the potential role of seed concentration in determining the resultant product structure. This raises a critical question: at what specific seed concentration does the determining factor for polymorph selection shift from pH condition to seed concentration? A methodological robust approach to address this should be conducted through a series of experiments across a range of seed concentrations. Such an approach could delineate a clear boundary at which seed concentration begins to predominantly dictate the conformation, as opposed to pH conditions. Incorporating this aspect into the study would not only clarify the interplay between seed concentration and pH conditions, but also add a fascinating dimension to the understanding of polymorph selection mechanisms.

      A more complete analysis of the mechanisms of aggregation, including the effect of seed concentration and the resulting polymorph specificity of the process, are all very important for our understanding of the aggregation pathways of alpha-synuclein and are currently the topic of ongoing investigations in our lab.

      Furthermore, the study prompts additional queries regarding the behavior of cross-seeding production under the same pH conditions when employing seeds of distinct conformation. Evidence from various studies, such as those involving E46K and G51D cross-seeding, suggests that seed structure plays a crucial role in dictating polymorph selection. A key question is whether these products consistently mirror the structure of their respective seeds.

      We thank the reviewer for reminding us to include a reference to these studies as a clear example of polymorph selection by cross-seeding which we will do in the revised version. Unfortunately, it is not 100% clear from the G51D cross seeding manuscript (https://doi.org/10.1038/s41467-021-26433-2) what conditions were used in the cross-seeding since different conditions were used for the seedless wild-type and mutant aggregations… however it appears that the wild-type without seeds was Tris pH 7.5 (although at 37C the pH could have dropped to 7-ish) and the cross-seeded wild-type was in Phosphate buffer at pH 7.0. In the E46K cross-seeding manuscript, it appears that pH 7.5 Tris was used for all fibrilizations (https://doi.org/10.1073/pnas.2012435118). In any event, both results point to the fact that at pH 7.0-7.5 under low-seed conditions (0.5%) the Type 4 polymorph can propagate in a seed specific manner.

      1. In the Results section of "The buffer environment can dictate polymorph during seeded nucleation", the authors reference previous cell biological and biochemical assays to support the polymorph-specific seeding of MSA and PD patients under the same buffer conditions. This discussion is juxtaposed with recent research that compares the in vivo biological activities of hPFF, ampLB as well as LB, particularly in terms of seeding activity and pathology. Notably, this research suggests that ampLB, rather than hPFF, can accurately model the key aspects of Lewy Body Diseases (LBD) (refer to: https://doi.org/10.1038/s41467-023-42705-5). The critical issue here is the need to reconcile the phenomena observed in vitro with those in in-vivo or in-cell models. Given the low seed concentration reported in these studies, it is imperative for the authors to provide a more detailed explanation as to why the possible similar conformation could lead to divergent pathologies, including differences in cell-type preference and seeding capability.

      We thank the reviewer for bring this recent report to our attention. The findings that ampLB and hPFF have different PK digestion patterns and that only the former is able to model key aspects of Lewy Body disease are in support of the seed-specific nature of some types of alpha-synuclein aggregation. We will add more discussion regarding the significant role that seed type and seed conditions likely play in polymorph selection.

      1. In the Method section of "Image processing", the authors describe the helical reconstruction procedure, without mentioning much detail about the 3D reconstruction and refinement process. For the benefit of reproducibility and to facilitate a deeper understanding among readers, the authors should enrich this part to include more comprehensive information, akin to the level of detail found in similar studies (refer to: https://doi.org/10.1038/nature23002).

      As suggested by reviewer #2, we will add more comprehensive information on the 3D reconstruction and refinement process to a revised version.

      1. The abbreviation of amino acids should be unified. In the Results section "On the structural heterogeneity of Type 1 polymorphs", the amino acids are denoted using three-letter abbreviation. Conversely, in the same section under "On the structural heterogeneity of Type 2 and 3 structures", amino acids are abbreviated using the one-letter format. For clarity and consistency, it is essential that a standardized format for amino acid abbreviations be adopted throughout the manuscript.
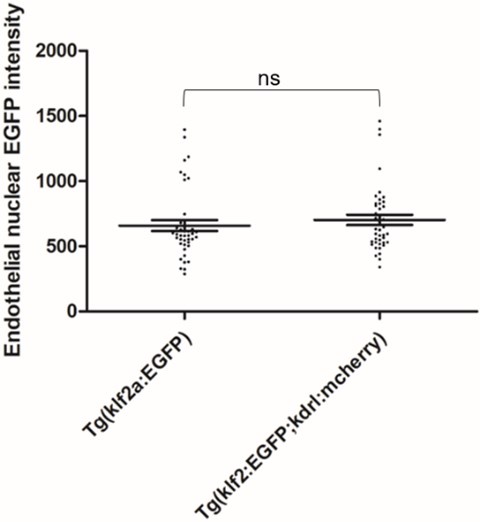
      That makes perfect sense and will be corrected in a revised version.

      Reviewing Editor:

      After discussion among the reviewers, it was decided that point 2 in Reviewer #3's Public Review (about the experiments with different concentrations of seeds) would probably lie outside the scope of a reasonable revision for this work.

      We agree as stated above and will continue to work on this important point.

    1. Author Response

      The following is the authors’ response to the original reviews.

      Public Reviews:

      Reviewer #1 (Public Review):

      Strengths

      This paper is well situated theoretically within the habit learning/OCD literature.

      Daily training in a motor-learning task, delivered via smartphone, was innovative, ecologically valid and more likely to assay habitual behaviors specifically. Daily training is also more similar to studies with non-humans, making a better link with that literature. The use of a sequential-learning task (cf. tasks that require a single response) is also more ecologically valid.

      The in-laboratory tests (after the 1 month of training) allowed the researchers to test if the OCD group preferred familiar, but more difficult, sequences over newer, simpler sequences.

      The authors achieved their aims in that two groups of participants (patients with OCD and controls) engaged with the task over the course of 30 days. The repeated nature of the task meant that 'overtraining' was almost certainly established, and automaticity was demonstrated. This allowed the authors to test their hypotheses about habit learning. The results are supportive of the authors' conclusions.

      Response: We truly appreciate the positive assessment of referee 1, particularly the consideration that our study is theoretically strong and that ‘the results are supportive of the authors' conclusions’. This is an important external endorsement of our conclusions, contrasting somewhat with the views of referee 2.

      Weaknesses

      The sample size was relatively small. Some potentially interesting individual differences within the OCD group could have been examined more thoroughly with a bigger sample (e.g., preference for familiar sequences). A larger sample may have allowed the statistical testing of any effects due to medication status. The authors were not able to test one criterion of habits, namely resistance to devaluation, due to the nature of the task

      Response: We agree with the reviewer that the proof of principle established in our study opens new avenues for research into the psychological and behavioral determinants of the heterogeneity of this clinical population. However, considering the study timeline and the pandemic constraints, a bigger sample was not possible. Our sample can indeed be considered small if one compares it with current online studies, which do not require in-person/laboratory testing, thus being much easier to recruit and conduct. However, given the nature of our protocol (with 2 demanding test phases, 1-month engagement per participant and the inclusion of OCD patients without comorbidities only) and the fact that this study also involved laboratory testing, we consider our sample size reasonable and comparable to other laboratory studies (typically comprising on average between 30-50 participants in each group).

      This article is likely to be impactful -- the delivery of a task across 30 days to a patient group is innovative and represents a new approach for the study of habit learning that is superior to an inlaboratory approach.

      An interesting aspect of this manuscript is that it prompts a comparison with previous studies of goal-directed/habitual responding in OCD that used devaluation protocols, and which may have had their effects due to deficits in goal-directed behavior and not enhanced habit learning per se.

      Response: Thank you for acknowledging the impact of our study, in particular the unique ability of our task to interrogate the habit system.

      Reviewer #2 (Public Review):

      In this study, the researchers employed a recently developed smartphone application to provide 30 days of training on action sequences to both OCD patients and healthy volunteers. The study tested learning and automaticity-related measures and investigated the effects of several factors on these measures. Upon training completion, the researchers conducted two preference tests comparing a learned and unlearned action sequences under different conditions. While the study provides some interesting findings, I have a few substantial concerns:

      1. Throughout the entire paper, the authors' interpretations and claims revolve around the domain of habits and goal-directed behavior, despite the methods and evidence clearly focusing on motor sequence learning/procedural learning/skill learning. There is no evidence to support this framing and interpretation and thus I find them overreaching and hyperbolic, and I think they should be avoided. Although skills and habits share many characteristics, they are meaningfully distinguishable and should not be conflated or mixed up. Furthermore, if anything, the evidence in this study suggests that participants attained procedural learning, but these actions did not become habitual, as they remained deliberate actions that were not chosen to be performed when they were not in line with participants' current goals.

      Response: We acknowledge that the research on habit learning is a topic of current controversy, especially when it comes to how to induce and measure habits in humans. Therefore, within this context referee’s 2 criticism could be expected. Across distinct fields of research, different methodologies have been used to measure habits, which represent relatively stereotyped and autonomous behavioral sequences enacted in response to a specific stimulus without consideration, at the time of initiation of the sequence, of the value of the outcome or any representation of the relationship that exists between the response and the outcome. Hence these are stimulus-bound responses which may or may not require the implementation of a skill during subsequent performance. Behavioral neuroscientists define habits similarly, as stimulus-response associations which are independent of reward or outcome, and use devaluation or contingency degradation strategies to probe habits (Dickinson and Weiskrantz, 1985; Tricomi et al., 2009). Others conceptualize habits as a form of procedural memory, along with skills, and use motor sequence learning paradigms to investigate and dissect different components of habit learning such as action selection, execution and consolidation (Abrahamse et al., 2013; Doyon et al., 2003; Squire et al., 1993). It is also generally agreed that the autonomous nature of habits and the fluid proficiency of skills are both usually achieved with many hours of training or practice, respectively (Haith and Krakauer, 2018).

      We consider that Balleine and Dezfouli (2019) made an excellent attempt to bring all these different criteria within a single framework, which we have followed. We also consider that our discussion in fact followed a rather cautious approach to interpretation solely in terms of goaldirected versus habitual control.

      Referee 2 does not actually specify criteria by which they define habits and skills, except for asserting that skilled behavior is goal-directed, without mentioning what the actual goal of the implantation of such skill is in the present study: the fulfillment of a habit? We assume that their definition of habit hinges on the effects of devaluation, as a single criterion of habit, but which according to Balleine and Dezfouli (2019) is only 1 of their 4 listed criteria. We carefully addressed this specific criterion in our manuscript: “We were not, however, able to test the fourth criterion, of resistance to devaluation. Therefore, we are unable to firmly conclude that the action sequences are habits rather than, for example, goal-directed skills. Regardless of whether the trained action sequences can be defined as habits or goal-directed motor skills, it has to be considered…”. Therefore, we took due care in our conclusions concerning habits and thus found the referee’s comment misleading and unfair.

      We note that our trained motor sequences did in fact fulfil the other 3 criteria listed by Balleine and Dezfouli (2019), unlike many studies employing only devaluation (e.g. Tricomi et al 2009; Gillan et al 2011). Moreover, we cited a recent study using very similar methodology where the devaluation test was applied and shown to support the habit hypothesis (Gera et al., 2022).

      Whether the initiation of the trained motor sequences in experiment 3 (arbitration) is underpinned by an action-outcome association (or not) has no bearing on whether those sequences were under stimulus-response control after training (experiment 1). Transitions between habitual and goal-directed control over behavior are quite well established in the experimental literature, especially when choice opportunities become available (Bouton et al (2021), Frölich et al (2023), or a new goal-directed schemata is recruited to fulfill a habit (Fouyssac et al, 2022). This switching between habits and goal-directed responding may reflect the coordination of these systems in producing effective behavior in the real world.

      • Fouyssac M, Peña-Oliver Y, Puaud M, Lim NTY, Giuliano C, Everitt BJ, Belin D. (2021).Negative Urgency Exacerbates Relapse to Cocaine Seeking After Abstinence. Biological Psychiatry. doi: 10.1016/j.biopsych.2021.10.009

      • Frölich S, Esmeyer M, Endrass T, Smolka MN and Kiebel SJ (2023) Interaction between habits as action sequences and goal-directed behavior under time pressure. Front. Neurosci. 16:996957. doi: 10.3389/fnins.2022.996957

      • Bouton ME. 2021. Context, attention, and the switch between habit and goal-direction in behavior. Learn Behav 49:349– 362. doi:10.3758/s13420-021-00488-z

      1. Some methodological aspects need more detail and clarification.

      2. There are concerns regarding some of the analyses, which require addressing.

      Response: We thank referee 2 for their detailed review of the methods and analyses of our study and for the helpful feedback, which clearly helps improve our manuscript. We will clarify the methodological aspects in detail and conduct the suggested analysis. Please see below our answers to the specific points raised.

      Introduction:

      1. It is stated that "extensive training of sequential actions would more rapidly engage the 'habit system' as compared to single-action instrumental learning". In an attempt to describe the rationale for this statement the authors describe the concept of action chunking, its benefits and relevance to habits but there is no explanation for why sequential actions would engage the habit system more rapidly than a single-action. Clarifying this would be helpful.

      Response: We agree that there is no evidence that action sequences become habitual more readily than single actions, although action sequences clearly allow ‘chunking’ and thus likely engage neural networks including the putamen which are implicated in habit learning as well as skill. In our revised manuscript we will instead state: “we have recently postulated that extensive training of sequential actions could be a means for rapidly engaging the ‘habit system’ (Robbins et al., 2019)]”

      DONE in page 2

      1. In the Hypothesis section the authors state: “we expected that OCD patients... show enhanced habit attainment through a greater preference for performing familiar app sequences when given the choice to select any other, easier sequence”. I find it particularly difficult to interpret preference for familiar sequences as enhanced habit attainment.

      Response: We agree that choice of the familiar response sequence should not be a necessary criterion for habitual control although choice for a familiar sequence is, in fact, not inconsistent with this hypothesis. In a recent study, Zmigrod et al (2022) found that 'aversion to novelty' was a relevant factor in the subjective measurement of habitual tendencies. It should also be noted that this preference was present in patients with OCD. If one assumes instead, like the referee, that the familiar sequence is goal-directed, then it contravenes the well-known 'egodystonia' of OCD which suggests that such tendencies are not goal-directed.

      To clarify our hypothesis, we will amend the sentence to the following: “Finally, we expected that OCD patients would generally report greater habits, as well as attribute higher intrinsic value to the familiar app sequences manifested by a greater preference for performing them when given the choice to select any other, easier sequence”.

      DONE in page 5. We have now rephrased it: “Additionally, we hypothesized that OCD patients would generally display stronger habits and assign greater intrinsic value to the familiar app sequences, evidenced by a marked preference for executing them even when presented with a simpler alternative sequence.”

      A few notes on the task description and other task components:

      1. It would be useful to give more details on the task. This includes more details on the time/condition of the gradual removal of visual and auditory stimuli and also on the within practice dynamic structure (i.e., different levels appear in the video).

      Response: These details will be included in the revised manuscript. Thank you for pointing out the need for further clarification of the task design.

      Done in page 7

      1. Some more information on engagement-related exclusion criteria would be useful (what happened if participants did not use the app for more than one day, how many times were allowed to skip a day etc.).

      Response: This additional information will be added to the revised manuscript. If participants omitted to train for more than 2 days, the researcher would send a reminder to the participant to request to catch up. If the participant would not react accordingly and a third day would be skipped, then the researcher would call to understand the reasons for the lack of engagement and gauge motivation. The participant would be excluded if more than 5 sequential days of training were missed. Only 2 participants were excluded given their lack of engagement.

      Done in page 8

      1. According to the (very useful) video demonstrating the task and the paper describing the task in detail (Banca et al., 2020), the task seems to include other relevant components that were not mentioned in this paper. I refer to the daily speed test, the daily random switch test, and daily ratings of each sequence's enjoyment and confidence of knowledge.

      If these components were not included in this procedure, then the deviations from the procedure described in the video and Banca al. (2020) should be explicitly mentioned. If these components were included, at least some of them may be relevant, at least in part, to automaticity, habitual action control, formulation of participants' enjoyment from the app etc. I think these components should be mentioned and analyzed (or at least provide an explanation for why it has been decided not to analyze them).

      This is also true for the reward removal (extinction) from the 21st day onwards which is potentially of particular relevance for the research questions.

      Response: The task procedure was indeed the same as detailed in Banca et al., 2020. We did not include these extra components in this current manuscript for reasons of succinctness and because the manuscript was already rather longer than a common research article, given that we present three different, though highly inter-dependent, experiments in order to answer key interrelated questions in an optimal manner. However, since referee 2 considers this additional analysis to be important, we will be happy to include it in the supplementary material of the revised manuscript.

      These additional components of the task as well as the respective analysis are now described in the Supplementary Materials.

      Training engagement analysis:

      1. I find referring to the number of trials including successful and unsuccessful trials as representing participants "commitment to training" (e.g. in Figure legend 2b) potentially inadequate. Given that participants need at least 20 successful trials to complete each practice, more errors would lead to more trials. Therefore, I think this measure may mostly represent weaker performance (of the OCD patients as shown in Figure 2b). Therefore, I find the number of performed practice runs, as used in Figure 2a (which should be perfectly aligned with the number of successful trials), a "clean" and proper measure of engagement/commitment to training.

      Response: We acknowledge referee’s concern on this matter and agree to replace the y-axis variable of Figure 2b to the number of performed practices (thus aligning with Figure 2a). This amendment will remove any potential effect of weaker performance on the engagement measurement and will provide clearer results.

      We have now decided to remove this figure as it does not add much to figure 2a. Instead, we replaced figure 2b and 2c for new plots, following new analysis linked to the next reviewer request (point 10)

      1. Also, to provide stronger support for the claim about different diurnal training patterns (as presented in Figure 2c and the text) between patients and healthy individuals, it would be beneficial to conduct a statistical test comparing the two distributions. If the results of this test are not significant, I suggest emphasizing that this is a descriptive finding.

      Response: Done, see revised Figure 2b and 2c. We have assessed the diurnal training patterns within each group using circular statistics, followed by independent-sample statistical testing of those circular distributions with the Watson’s U2 test ( Landler et al., 2021). While OCD participants have a group effect of practice with a significant peak at ~18:00, and HV participants have an earlier significant peak at ~15:00, the Watson’s U test did not find statistical betweengroup differences.

      • Landler L, Ruxton GD, Malkemper EP. Advice on comparing two independent samples of circular data in biology. Scientific reports. 2021 Oct 13;11(1):20337.

      Learning results:

      1. When describing the Learning results (p10) I think it would be useful to provide the descriptive stats for the MT0 parameter (as done above for the other two parameters).

      Response: Thank you for pointing this out. The descriptive stats for MT0 will be added to the revised version of the manuscript.

      Done page 11

      1. Sensitivity of sequence duration and IKI consistency (C) to reward:

      I think it is important to add details on how incorrect trials were handled when calculating ∆MT (or C) and ∆R, specifically in cases where the trial preceding a successful trial was unsuccessful. If incorrect trials were simply ignored, this may not adequately represent trial-by-trial changes, particularly when testing the effect of a trial's outcome on performance change in the next trial.

      Response: This is an important question. Our analysis protocol was designed to ensure that incorrect trials do not contaminate or confound the results. To estimate the trial-to-trial difference in ∆MT (or C) and ∆R, we exclusively included pairs of contiguous trials where participants achieved correct performance and received feedback scores for both trials. For example, if a participant made a performance error on trial 23, we did not include ∆R or ∆MT estimates for the pairs of trials 23-22 and 24-23. Instead of excluding incorrect trials from our analyses, we retained them in our time series but assigned them a NaN (not a number) value in Matlab. As a result, ∆R and ∆MT was not defined for those two pairs of trials. Similarly for C. This approach ensured that our analyses are not confounded by incremental or decremental feedback scores between noncontiguous trials. In the past, when assessing the timing of correct actions during skilled sequence performance, we also considered events that were preceded and followed by correct actions. This excluded effects such as post-error slowing from contaminating our results (Herrojo Ruiz et al., 2009, 2019). Therefore, we do not believe that any further reanalysis is required.

      • Ruiz MH, Jabusch HC, Altenmüller E. Detecting wrong notes in advance: neuronal correlates of error monitoring in pianists. Cerebral cortex. 2009 Nov 1;19(11):2625-39.

      • Bury G, García-Huéscar M, Bhattacharya J, Ruiz MH. Cardiac afferent activity modulates early neural signature of error detection during skilled performance. NeuroImage. 2019 Oct 1;199:704-17.

      1. I have a serious concern with respect to how the sensitivity of sequence duration to reward is framed and analyzed. Since reward is proportional to performance, a reduction in reward essentially indicates a trial with poor performance, and thus even regression to the mean (along with a floor effect in performance [asymptote]) could explain the observed effects. It is possible that even occasional poor performance could lead to a participant demonstrating this effect, potentially regardless of the reward. Accordingly, the reduced improvement in performance following a reward decrease as a function of training length described in Figure 5b legend may reflect training-induced increased performance that leaves less room for improvement after poor trials, which are no longer as poor as before. To address this concern, controlling for performance (e.g., by taking into consideration the baseline MT for the previous trial) may be helpful. If the authors can conduct such an analysis and still show the observed effect, it would establish the validity of their findings."

      Response: Thank you for raising this point. This has been done, see updated Figures 5 and 6. After normalizing the ∆MT(n+1) := MT(n+1) – MT(n) difference values by dividing them with the baseline MT(n) at trial n, we obtain the same results. Similar results are also obtained for IKI consistency (C).

      See below our initial response from June 2023.

      Thank you for raising this point. Figure 5b illustrates two distinct effects of reward changes on behavioral adaptation, which are expected based on previous research.

      I. Practice effects: Firstly, we observe that as participants progress across bins of practice, the degree of improvement in behavior (reflected by faster movement time, MT) following a decrease in reward (∆R−) diminishes, consistent with our expectations based on previous work. Conversely, we found that ∆MT does not change across bins of practices following an increase in reward (∆R+).

      We appreciate the reviewer’s suggestion regarding controlling for the reference movement time (MT) in the previous trial when examining the practice effect in the p(∆T|∆R−) and p(∆T|∆R+) distributions. In the revised manuscript, we will conduct the proposed control analysis to better understand whether the sensitivity of MT to score decrements changes across practice when normalising MT to the reference level on each trial. But see below for a preliminary control analysis.

      II. Asymmetry of the effect of ∆R− and ∆R+ on performance: Figure 5b also depicts the distinct impact of score increments and decrements on behavioural changes. When aggregating data across practice bins, we consistently observed that the centre of the p(∆T|∆R−) distribution was smaller (more negative) than that of p(∆T|∆R+). This suggests that participants exhibited a greater acceleration following a drop in scores compared to a relative score increase, and this effect persisted throughout the practice sessions. Importantly, this enhanced sensitivity to losses or negative feedback (or relative drops in scores) aligns with previous research findings (Galea et al., 2015; Pekny et al., 2014; van Mastrigt et al., 2020).

      We have conducted a preliminary control analysis to exclude the potential impact that reference movement time (MT) values could have on our analysis. We have assessed the asymmetry between behavioural responses to ∆R− and ∆R+ using the following analysis: We estimated the proportion of trials in which participants exhibited speed-up (∆T < 0) or slow-down (∆T > 0) behaviour following ∆R− and ∆R+ across different practice bins (bins 1 to 4). By discretising the series of behavioural changes (∆T) into binary values (+1 for slowing down, -1 for speeding up), we can assess the type of changes (speed-up, slow-down) without the absolute ∆T or T values contributing to our results. We obtained several key findings:

      • Consistent with expectations (sanity check), participants exhibited more instances of speeding up than slowing down across all reward conditions.

      • Participants demonstrated a higher frequency of speeding up following ∆R− compared to ∆R+, and this asymmetry persisted throughout the practice sessions (greater proportion of -1 events than +1 events). 53% events were speed-up events in the in the p(∆T|∆R+) distribution for the first bin of practices, and 55% for the last bin. Regarding p(∆T|∆R-), there were 63% speed-up events throughout each bin of practices, with this proportion exhibiting no change over time.

      • Accordingly, the asymmetry of reward changes on behavioural adaptations, as revealed by this analysis, remained consistent across the practice bins.

      Thus, these preliminary findings provide an initial response to referee 2 and offer valuable insights into the asymmetrical effects of positive/negative reward changes on behavioural adaptations. We plan to include these results in the revised manuscript, as well as the full control analysis suggested by the referee. We will further expand upon their interpretation and implications.

      1. Another way to support the claim of reward change directionality effects on performance (rather than performance on performance), at least to some extent, would be to analyze the data from the last 10 days of the training, during which no rewards were given (pretending for analysis purposes that the reward was calculated and presented to participants). If the effect persists, it is less unlikely that the effect in question can be attributed to the reward dynamics.

      Response: The reviewer’s concern is addressed in the previous quesQon. Also, this analysis would not be possible because our Gaussian fit analyses use the Qme series of conQnuous reward scores, in which ∆R− or ∆R+ are embedded. These events cannot be analyzed once reward feedback is removed because we do not have behavioral events following ∆R− or ∆R+ anymore.

      Done

      1. This concern is also relevant and should be considered with respect to the sensitivity of IKI consistency (C) to reward. While the relationship between previous reward/performance and future performance in terms of C is of a different structure, the similar potential confounding effects could still be present.

      Response: We will conduct this analysis for the revised manuscript, similarly to the control analysis suggested by referee 2 on MT. Our preliminary control analysis, as explained above, suggests that the fundamental asymmetry in the effect of ∆R+ and ∆R+ on behavioral changes persists when excluding the impact of reference performance values in our Gaussian fit analysis.

      Done. See updated Figure 6. The results are very similar once we normalize the IKI consistency index C with the IKI of the baseline performance at trial n.

      1. Another related question (which is also of general interest) is whether the preferred app sequence (as indicated by the participants for Phase B) was consistently the one that yielded more reward? Was the continuous sequence the preferred one? This might tell something about the effectiveness of the reward in the task.

      Response: We have now conducted this analysis. There is in fact no evidence to conclude that the continuously rewarded sequence was the preferred one. The result shows that 54.5% of HV and 29% of the OCD sample considered the continuous sequence to be their preferred one, a nonstatistically significant difference. Note that this preference may not necessarily be linked simply to programmed reward. The overall preference may be influenced by many other factors, such as, for example, the aesthetic appeal of particular combinations of finger movements.

      Regarding both experiments 2 and 3:

      1. The change in context in experiment 2 and 3 is substantial and include many different components. These changes should be mentioned in more detail in the Results section before describing the results of experiments 2 and 3.

      Response: Following referee’s advice, we will move these details (currently written in the Methods section) to the Results section, when we introduce Phase B and before describing the results of experiments 2 and 3.

      Done in page 21

      Experiment 2:

      1. In Experiment 2, the authors sometimes refer to the "explicit preference task" as testing for habitual and goal-seeking sequences. However, I do not think there is any justification for interpreting it as such. The other framings used by the authors - testing whether trained action sequences gain intrinsic/rewarding properties or value, and preference for familiar versus novel action sequences - are more suitable and justified. In support of the point I raised here, assigning intrinsic rewarding properties to the learned sequences and thereby preferring these sequences can be conceptually aligned with goal-directed behavior just as much as it could be with habit.

      Response: We clearly defined the theoretical framing of experiment 2 as a test of whether trained action sequences gain intrinsic value and we are pleased to hear that the referee agrees with this framing. If the referee is referring to the paragraph below (in the Discussion), we actually do acknowledge within this paragraph that a preference for the trained sequences can either be conceptually aligned with a habit OR a goal-directed behavior.

      “On the other hand, we are describing here two potential sources of evidence in favor of enhanced habit formation in OCD. First, OCD patients show a bias towards the previously trained, apparently disadvantageous, action sequences. In terms of the discussion above, this could possibly be reinterpreted as a narrowing of goals in OCD (Robbins et al., 2019) underlying compulsive behavior, in favor of its intrinsic outcomes”

      This narrowing of goals model of OCD refers to a hypothetically transiQonal stage of compulsion development driven by behavior having an abnormally strong, goal-directed nature, typically linked to specific values and concerns.

      If the referee is referring to the penulQmate sentence of hypothesis secQon, this has been amended in response to Q5. We cannot find any other possible instances in this manuscript stating that experiment 2 is a test of habitual or goal-directed behavior.

      Experiment 3:

      1. Similar to Experiment 2, I find the framing of arbitration between goal-directed/habitual behavior in Experiment 3 inadequate and unjustified. The results of the experiment suggest that participants were primarily goal-directed and there is no evidence to support the idea that this reevaluation led participants to switch from habitual to goal-directed behavior.

      Also, given the explicit choice of the sequence to perform participants had to make prior to performing it, it is reasonable to assume that this experiment mainly tested bias towards familiar sequence/stimulus and/or towards intrinsic reward associated with the sequence in value-based decision making.

      Response: This comment is aligned with (and follows) the referee’s criticism of experiment 1 not achieving automatic and habitual actions. We have addressed this matter above, in response 1 to Referee 2.

      Mobile-app performance effect on symptomatology: exploratory analyses:

      1. Maybe it would be worth testing if the patients with improved symptomatology (that contribute some of their symptom improvement to the app) also chose to play more during the training stage.

      Response: We have conducted analysis to address this relevant question. There is no correlation between the YBOCS score change and the number of total practices, meaning that the patients who improved symptomatology post training did not necessarily chose to play the app more during the training stage (rs = 0.25, p = 0.15). Additionally, we have statistically compared the improvers (patients with reduced YBOCS scores post-training) and the non-improvers (patients with unchanged or increased YBOCS scores post-training) in their number of app completed practices during the training phase and no differences were observed (U = 169, p = 0.19).

      The result from the correlational analysis has been added to the revised manuscript (page 28).

      Discussion:

      1. Based on my earlier comments highlighting the inadequacy and mis-framing of the work in terms of habit and goal-directed behavior, I suggest that the discussion section be substantially revised to reflect these concerns.

      Response: We do not agree that the work is either "inadequate or mis-framed" and will not therefore be substantially revising the Discussion. We will however clarify further the interpretation we have made and make explicit the alternative viewpoint of the referee. For example, we will retitle experiment 3 as “Re-evaluation of the learned action sequence: possible test of goal/habit arbitration” to acknowledge the referee’s viewpoint as well as our own interpretation.

      Done

      1. In the sentence "Nevertheless, OCD patients disadvantageously preferred the previously trained/familiar action sequence under certain conditions" the term "disadvantageously" is not necessarily accurate. While there was potentially more effort required, considering the possible presence of intrinsic reward and chunking, this preference may not necessarily be disadvantageous. Therefore, a more cautious and accurate phrasing that better reflects the associated results would be useful.

      Response: We recognize that the term "disadvantageously" may be semantically ambiguous for some readers and therefore we will remove it.

      Done

      Materials and Methods:

      1. The authors mention: "The novel sequence (in condition 3) was a 6-move sequence of similar complexity and difficulty as the app sequences, but only learned on the day, before starting this task (therefore, not overtrained)." - for the sake of completeness, more details on the pre-training done on that day would be useful.

      Response: Details of the learning procedure of the novel sequence (in condition 3, experiment 3) will be provided in the methods of the revised version of the manuscript.

      Done in page 40

      Minor comments:

      1. In the section discussing the sensitivity of sequence duration to reward, the authors state that they only analyzed continuous reward trials because "a larger number of trials in each subsample were available to fit the Gaussian distributions, due to feedback being provided on all trials." However, feedback was also provided on all trials in the variable reward condition, even though the reward was not necessarily aligned with participants' performance. Therefore, it may be beneficial to rephrase this statement for clarity.

      Response: We will follow this referee’s advice and will rephrase the sentence for clarity.

      Done. See page 16.

      1. With regard to experiment 2 (Preference for familiar versus novel action sequences) in the following statement "A positive correlation between COHS and the app sequence choice (Pearson r = 0.36, p = 0.005) further showed that those participants with greater habitual tendencies had a greater propensity to prefer the trained app sequence under this condition." I find the use of the word "further" here potentially misleading.

      Response: The word "further" will be removed.

      Done

      Reviewer #1 (Recommendations For The Authors):

      This is a very interesting manuscript, which was a pleasure to review. I have some minor comments you may wish to consider.

      1. I believe that it is possible to include videos as elements in eLife articles - please consider if you can do this to demonstrate the action sequence on the smartphone. I followed the YouTube video, and it was very helpful to see exactly what participants did, but it would be better to attach the video directly, if possible.

      Response: This is a great idea and we will definitely attach our video demonstrating the task to the revised manuscript (Version of Record) if the eLife editors allow.

      We ask permission to the editor to add the video

      1. The abstract states that the study uses a "novel smartphone app" but is the same one as described in Banca et al. Suggest writing simply "smartphone app".

      Response: We will remove the word novel.

      Done

      1. Some of the hypotheses described in the second half of the Hypothesis section could be stated more explicitly. For example: "We also hypothesized that the acquisition of learning and automaticity would differ between the two action sequences based on their associated rewarded schedule (continuous versus variable) and reward valence (positive or negative)." The subsequent sentence explains the prediction for the schedule but what is the hypothesized direction for reward valence? More detail is subsequently given on p. 14, Results, but it would be better to bring these details up to the Introduction. "We additionally examined differential effects of positive and negative feedback changes on performance to build on previous work demonstrating enhanced sensitivity to negative feedback in patients with OCD (Apergis-Schoute et al 2023, Becker et al., 2014; Kanen et al., 2019)." In general, the second part of the Hypothesis section is a bit dense, sometimes with two predictions per sentence. It could be useful for the reader if hypotheses were enumerated and/or if a distinction was made among the hypotheses with respect to their importance.

      We fully revised the hypothesis section, on page 5, following this reviewer’s suggestion. We think this section is much clearer now, in our revised manuscript.

      Response: Thank you for pointing out the need for clarity in our hypothesis section. This is a very important point and we will carefully rewrite our hypothesis in the revised manuscript to make them as clear as possible.

      1. Did medication status correlate with symptom severity in the OCD group (e.g., higher symptoms for the 6 participants on SSRI+antipsychotics?). Could this, or SSRI-only status, have impacted results in any way? I appreciate that there is no way to test medication status statistically but readers may be interested in your thoughts on this aspect.

      Response: We have now conducted exploratory analysis to assess the potential effect of medication in the following output measures: app engagement (as measured by completed practices), explicit preference and YBOCS change post-training. The patients who were on combined therapy (SSRIs + antipsychotic) did not perform significantly different in these measures as compared to the remaining patients and no other effects of interest were observed. Their symptomatology was indeed slightly more severe but not statistically significant [Y-BOCS combined = 26.2 (6.5); Y-BOCS SSRI only = 23.8 (6.1); Y-BOCS No Med = 23.8 (2.2), mean(std)]. Only one patient showed symptom improvement after the app training, another became worse and the remaining patients on combined therapy remain stable during the month.

      Palminteri et al (2011) found that unmedicated OCD patients exhibited instrumental learning deficits, which were fully alleviated with SSRI treatment. Therefore, it is possible that the SSRI medication (present in our sample) may have reduced habit formation and facilitated behavioral arbitration. However, since the effect goes against the habit hypothesis, it has is unlikely that it has confounded our measure of automaticity. If anything, medication rendered experiment 2 and 3 more goal-oriented. We agree that further studies are warranted to address the effect of SSRIs on these measures.

      1. You could explain earlier why devaluation could not be tested here (it is only explained in the Limitations section near the end)

      Response: The revised manuscript will be amended to account for this note.

      Done in page 25.

      1. Capitalize 'makey-makey', I didn't realize there was a product called Makey Makey until I Googled it.

      Response: Sure. We will capitalize 'Makey-Makey'. Thank you for pointing this out!

      Done

      Reviewer #2 (Recommendations For The Authors):

      Recommendations for the authors (ordered by the paper sections):

      In the introduction

      1. regarding this part "We used a period of 1-month's training to enable effective consolidation, required for habitual action control or skill retention to occur. This acknowledged previous studies showing that practice alone is insufficient for habit development as it also requires off-line consolidation computations, through longer periods of time (de Wit et al., 2018) and sleep (Nusbaum et al., 2018; Walker et al., 2003)." I advise the authors to re-check whether what is attributed here to de Wit et al. (2018) is indeed justified (if I remember correctly they have not mentioned anything about off-line consolidation computations).

      Response: When we revise the manuscript, we will remove the de Wit et al. (2018) citation from this sentence.

      Done

      in the Outline paragraph

      1. it stated: "We continuously collected data online, in real time, thus enabling measurements of procedural learning as well as automaticity development." I think this wording implies that the fact that the data was collected online in real time was advantageous in that it enabled to assess measurements of procedural learning and automaticity development, which in my understanding is not the case.

      Response: To make this sentence clearer, we will change it to the following: ‘We continuously collected data online, to monitor engagement and performance in real time and to enable acquisition of sufficient data to analyze, à posteriori, procedural learning and automaticity development’.

      Done in page 4: ‘We collected data online continuously to monitor engagement and performance in real-time. This approach ensured we acquired sufficient data for subsequent analysis of procedural learning and automaticity development’.

      1. In the final sentence of this paragraph "or and" should be changed to "or/end".

      Response: This was a typo. The word ‘and’ will be removed.

      Done

      1. In Figure 1c - Note that in the figure legend it says "Each sequence comprises 3 single press moves, 2 two-finger moves..." whereas in the example shown in the figure it's the other way around (2 single press moves and 3 two-finger moves).

      Response: Thank you so much for spotting this! The example shown in the figure is incorrect. We apologize for the mistake. It should depict 3 single press moves, 2 two-finger moves and 1 three- finger move. The figure will be amended.

      Done

      In the results section:

      1. Regarding the "were followed by a positive ring tone and the unsuccessful ones by a negative ring tone", I suggest mentioning that there was also a positive visual (rewarding) effect.

      Response: Thank you. A mention to the visual effect will be added for both the positive (successful) and negative (unsuccessful) trials. Done in page 7

      1. p 10. - Note a typo in the following sentence where the word "which" appears twice consecutively:

      "Furthermore, both groups exhibited similar motor durations at asymptote which, which combined with the previous conclusion, indicates that OCD patients improved their motor learning more than controls, but to the same asymptote."

      Response: Thank you for spotting this typo. The second word will be removed. Done

      1. I have a few suggestions with respect to Figure 3:

      2. keeping the y-axes scale similar in all subplots would be more visually informative.

      Here we kept the y-axes scale similar in all subplots, except one of them, which was important to keep to capture all the data.

      1. For the subplots in 3b I would recommend for the transparent regions, instead of the IQR, to use the median +/- 1.57 * IQR/sqrt(n) which is equivalent to how the notches are calculated in a box-plot figure (It is referred to as an approximate 95% confidence interval for the median). This should make the transparent area narrower and thus better communicate the results.

      Done

      1. I think the significant levels mentioned in figure legend 3b (which are referring to the group effect measured for each reward schedule type separately) is not mentioned in the text. While not crucial, maybe consider adding it in the text.

      We don’t think this is necessary and may actually lead to confusion because in the text we report a Kruskal–Wallis H test (which is the most appropriate statistical test), including their H and p values for the group and reward effects. Since in the figure we separated the analysis and plots for variable and continuous reward schedules (for visual purposes) , we reported a U test separated for each reward schedule. Therefore, we consider that the correct statistics are reported in the appropriate places of the manuscript.

      Response: Thank you for this very helpful suggestion. We will amend figure 3 accordingly.

      1. In the Automaticity results (pp. 12 and 13) when describing the Descriptive stats the wrong parameter indicator are used (DL instead of CL and nD instead of nC.

      Response: Thank you for noticing it. We will amend.

      Done

      1. In Sensitivity of IKI consistency (C) to reward results:

      In Figure 6a legend: with respect to "... and for reward increments (∆R+, purple) and decrements (∆R-, green)" - note that there are also additional colors indicating these ∆Rs.

      Response: Done. We had used a 2 x 2 color scheme: green hues for ∆R-, and purple hues for ∆R+. Then, OCD is denoted by dark colors, and HV by light colors. This represents all four colors used in the figure. For instance, OCD and ∆R- is dark green, whereas OCD and ∆R+ is denoted by dark purple.

      1. p.21 - the YBOCS abbreviation appears before the full form is spelled out in the text.

      Response: In the revised version, we will make sure the YBOCS abbreviation will be spelled out the first time it is mentioned.

      Done in page 24

      Experiments 2 and 3:

      1. If there is a reason behind presenting the conditions sequentially rather than using intermixed trials in experiments 2 and 3, it would be useful to mention it in the text.

      Response: Experiment 2 could have used intermixed trials. However, we were concerned that the use of intermixed trials in experiment 3 would increase excessively the memory load of the task, which could then be a confound.

      Done in page 41

      1. I wonder whether the presentation order of the conditions in experiments 2 and 3 affected participants' results? Maybe it is worth adding this factor to the analysis.

      Response: As we mentioned both in the methods and results sections, we counterbalanced all the conditions across participants, in both experiments 2 and 3. This procedure ensures no order effects.

      Experiment 2:

      1. Regarding this sentence (pp. 21-22): "However, some participants still preferred the app sequence, specifically those with greater habitual tendencies, including patients who considered the app training beneficial." I think the part that mentions that there are "patients who considered the app training beneficial" appears below and it may confuse the reader. I suggest either providing a brief explanation or indicating that further details will be provided later in the text ("see below in...").

      Response: We will clarify this section.

      We added “see below exploratory analyses of “Mobile-app performance effect on symptomatology”” in the end of the sentence so that the reader knows this is further explained below. Page 25

      1. Finally, in addition to subgrouping maybe it is worth testing whether there is a correlation between the YBOCS score change and the app-sequences preference (as to learn if the more they change their YBOCS the more they prefer the learned sequences and vice versa?)

      Response: Thank you for suggesting this relevant correlational analysis, which we have now conducted. Indeed, there is a correlation between the YBOCS score change and the preference for the app-sequences, meaning that the higher the symptom improvement after the month training, the greater the preference for the familiar/learned sequence. This is particularly the case for the experimental condition 2, when subjects are required to choose between the trained app sequence and any 3-move sequence (rs = 0.35, p=0.04). A trend was observed for the correlation between the YBOCS score change and the preference for the app-sequences in experimental condition 1 (app preferred sequence versus any 6-move sequence): rs = 0.30, p=0.09.

      This finding represents an additional corroboration of our conclusion that the app seems to be more beneficial to patients more prone to routine habits, who are somewhat more averse to novelty.

      This analysis was added in page 24, 25 and page 35.

      Experiment 3:

      1. You mention "The task was conducted in a new context, which has been shown to promote reengagement of the goal system (Bouton, 2021)." In my understanding this observation is true also for experiment 2. In such case it should be stated earlier (probably under: "Phase B: Tests of actionsequence preference and goal/habit arbitration").

      Response: As answered above in (Q17), we will follow this referee 2’s suggestion and describe the contextual details of experiments 2 and 3 in the Results section, when we introduce Phase B.

      Done in page 21.

      1. w.r.t this sentence - "...that sequence (Figure 8b, no group effects (p = 0.210 and BF = 0.742, anecdotal evidence)" I would add what the anecdotal evidence refers (as done in other parts of the paper), to prevent potential confusion.

      Response: OK, this will be added.

      Added on page 27

      Discussion:

      1. w.r.t. "Here we have trained a clinical population with moderately high baseline levels of stress and anxiety, with training sessions of a higher order of magnitude than in previous studies (de Wit et al., 2018, 2018; Gera et al., 2022) (30 days instead of 3 days)." The Gera et al. 2022 (was more than 3 days), you probably meant Gera et al. 2023 ("Characterizing habit learning in the human brain at the individual and group levels: a multi-modal MRI study", for which 3 days is true).

      Response: Thank you for pointing this out. We will keep the citation to Gera et al 2022 given its relevance to the sentence but we will remove the information inside the parenthesis. This amendment will solve the issue raised here.

      Done in page 32

      1. w.r.t "to a simple 2-element sequence with less training (Gera et al., 2022)" - it's a 3-element sequence in practice.

      Response: Thank you for this correction. We will amend this sentence accordingly.

      Done in page 32

      1. (p.30) w.r.t "and enhanced error-related negativity amplitudes in OCD" - a bit more context of what the negative amplitudes refer to would be useful (So the reader understands it refers to electrophysiology).

      Response: We will add a sentence in our revised manuscript addressing this matter. This sentence has been removed in the revised manuscript

      Supplementary materials:

      1. under "Sample size for the reward sensitivity analysis":

      It is stated "One practice corresponded to 20 correctly performed sequences. We therefore split the total number of correct sequences into four bins." I was not able to follow this reasoning here (20 correct trials in practice => splitting the data the 4 bins). More clarity here would be useful.

      Response: We will clarify this procedure of our analysis in the revised version of the manuscript. Thanks.

      Done. See Supplementary materials.

      1. Also, maybe I am missing something, but I couldn't understand why the number of sequences available per bin is different for the calculation of ∆MT and C. Aren't any two consecutive sequences that are good for the calculation of one of these measures also good for the calculation of the other?

      Response: Thank you for pointing this out. Indeed, the number of trials was the same for both analyses, ∆MT and C. We had saved an incorrect variable as number of trials. We will amend the text.

      We have re-analyzed the trial number data. The average number of trials per bin both for the ∆MT and C analyses was 109 (9) in the HV and 127 (12) in OCD groups. Although the number was on average larger in the patient group, we did not find significant differences between groups (p = 0.47).

      When assessing the p(∆T|∆R+) and p(∆T|∆R-) separately, more trials were available for p(∆T|∆R+), 107 (10) , than for p(∆T|∆R-), and 98 (8). These trial numbers differed significantly (p = 0.0046), but were identical for ∆MT and C analyses.

      Done. Included in Supplementary materials.

      Minor comments:

      1. Not crucial, but maybe for the sake of consistency consider merging the "Self-reported habit tendencies" section and the "Other self-reported symptoms" section, preferably where the latter is currently placed.

      Response: We fully understand the referee’s rationale underlying this suggestion. We indeed considered initially presenting the self-reported questionnaires all together, in a last, single section of the results, as suggested by the referee. However, we decided to report the higher habitual tendencies of OCD as an initial set of results, not only because it is a novel and important finding (which justifies it to be highlighted) but also because it is essential to the understanding of some of the remaining results presented.

      1. In some figure legends the percentage of the interval of the mentioned confidence intervals (probably 95%) is missing. I suggest adding it.

      Response: OK, this will be added.

      Done

      1. The NHS abbreviation appears without spelling out the full form.

      Response: This will be amended accordingly.

      I removed NHS as it is not relevant.

      1. In p.38 the citation (Rouder et al., 2012) is duplicated (appears twice consecutively).

      Response: Thank you for pointing this out. We will amend accordingly.

      Done

      In the results section:

      1. The authors mention: "To promote motivation, the total points achieved on each daily training sessions were also shown, so participants could see how well they improved across days". Yet, if the score is based on the number of practices, it may not represent participants improvement in case in some days more practices are performed. I suggest to clarify this point.

      Response: The goal of providing the scoring feedback was, as explained in the sentence, to gauge motivation and inform the subject about their performance. Having this goal in mind, it does not really matter if one day their scoring would be higher simply because they would have done more practice on that day. Participants could easily understand that the scoring reflected their performance on each practice so they would realize that the more practice, the greater their improvement and that the scoring would increase across days of practice. We will amend the sentence to the following: "To promote motivation, the total points achieved on each training session (i.e. practice) was also shown, so participants could see how well they improved across practice and across days".

      Done in page 7 and 8.

    1. Author Response

      We thank the reviewers for their fair assessment of our work and will submit a revised version edited for clarity of presentation and precision of interpretations.

    1. Author Response

      Reviewer #3 (Public Review):

      [...] Weaknesses:

      The study produces a large amount of data that is in general cohesive and support the main conclusions, but more thorough considerations on some of their findings may be helpful, as exemplified by the following:

      1) the effect of microglial ablation on chloral hydrate-induced RORR in Fig. 1B appears to be not the same as other anesthetics. what does this mean?

      2) Macrophage ablation impedes anesthesia emergence from pentobarbital (Fig. 3C). how may this occur?

      3) examination of the potential effect of microglial depletion on dendritic spine density is interesting but the experimental design does not seem to align well with the PPR and eEPSC data, which indicate a reduction in presynaptic release (Fig.10E) and increase of postsynaptic function (Fig. 10H), respectively. The PPR data seems to suggest a presynaptic effect of microglia; ablation.

      This reviewer may confused the brain regions between our spine quantification (Figure 11) and patch-clamp recording (Figure 10). In our spine quantification, all evaluations were conducted in the mPFC. However, the patch-clamp recording were performed in SON (Figure 10 B-F) and LC (Figure 10 G-K), different brain regions from our spine quantification. As one of our conclusion, microglia differentially modulate the activity of neuronal network in a brain region-specific manner, neurons in different brain regions may exhibit different electrophysiological alterations upon microglial depletion. Therefore, this comment might be a factual error.

    1. Author Response

      The following is the authors’ response to the original reviews.

      Public Reviews:

      Reviewer #1 (Public Review):

      This is an interesting, timely and informative article. The authors used publicly available data (made available by a funding agency) to examine some of the academic characteristics of the individuals recipients of the National Institutes of Health (NIH) k99/R00 award program during the entire history of this funding mechanism (17 years, total ~ 4 billion US dollars (annual investment of ~230 million USD)). The analysis focuses on the pedigree and the NIH funding portfolio of the institutions hosting the k99 awardees as postdoctoral researchers and the institutions hiring these individuals. The authors also analyze the data by gender, by whether the R00 portion of the awards eventually gets activated and based on whether the awardees stayed/were hired as faculty at their k99 (postdoctoral) host institution or moved elsewhere. The authors further sought to examine the rates of funding for those in systematically marginalized groups by analyzing the patterns of receiving k99 awards and hiring k99 awardees at historically black colleges and universities.

      The goals and analysis are reasonable and the limitations of the data are described adequately. It is worth noting that some of the observed funding and hiring traits are in line with the Matthew effect in science (https://www.science.org/doi/10.1126/science.159.3810.56) and in science funding (https://www.pnas.org/doi/10.1073/pnas.1719557115). Overall, the article is a valuable addition to the research culture literature examining the academic funding and hiring traits in the United States. The findings can provide further insights for the leadership at funding and hiring institutions and science policy makers for individual and large-scale improvements that can benefit the scientific community.

      Thank you for these comments. We have incorporated the articles referenced on the Matthew effect into the first paragraph of the Discussion our revised preprint.

      Reviewer #2 (Public Review):

      Early career funding success has an immense impact on later funding success and faculty persistence, as evidenced by well-documented "rich-get-richer" or "Matthew effect" phenomena in science (e.g., Bol et al. 2018, PNAS). Woitowich et al. examined publicly available data on the distribution of the National Institutes of Health's K99/R00 awards - an early career postdoc-to-faculty transition funding mechanism - and showed that although 85% of K99 awardees successfully transitioned into faculty, disparities in subsequent R01 grant obtainment emerged along three characteristics: researcher mobility, gender, and institution. Men who moved to a top-25 NIH funded institution in their postdoc-to-faculty transition experienced the shortest median time to receiving a R01 award, 4.6 years, in contrast to the median 7.4 years for women working at less well-funded schools who remained at their postdoc institutions. This result is consistent with prior evidence of funding disparities by gender and institution type. The finding that researcher mobility has the largest effect on subsequent funding success is key and novel, and enhances previous work showing the relationship between mobility and ones' access to resources, collaborators, or research objects (e.g., Sugimoto and Larivière, 2023, Equity for Women in Science (Harvard University Press)).

      These results empirically demonstrate that even after receiving a prestigious early career grant, researchers with less mobility belonging to disadvantaged groups at less-resourced institutions continue to experience barriers that delay them from receiving their next major grant. This result has important policy implications aimed at reducing funding disparities - mainly that interventions that focus solely on early career or early stage investigator funding alone will not achieve the desired outcome of improving faculty diversity.

      The authors also highlight two incredible facts: No postdoc at a historically Black college or university (HBCU) has been awarded a K99 since the program's launch. And out of all 2,847 R00 awards given thus far, only two have been made to faculty at HBCUs. Given the track record of HBCUs for improving diversity in STEM contexts, this distribution of awards is a massive oversight that demands attention.

      At no fault of the authors, the analysis is limited to only examining K99 awardees and not those who applied but did not receive the award. This limitation is solely due to the lack of data made publicly available by the NIH. If this data were available, this study would have been able to compare the trajectory of winners versus losers and therefore could potentially quantify the impact of the award itself on later funding success, much like the landmark Bol et al. (2018) paper that followed the careers of winners of an early career grant scheme in the Netherlands. Such an analysis would also provide new insights that would inform policy.

      Although data on applications versus awards for the K99/R00 mechanism are limited, there exists data for applicant race and ethnicity for the 2007-2017 period, which were made available by a Freedom of Information Act request through the now defunct Rescuing Biomedical Research Initiative: https://web.archive.org/web/20180723171128/http://rescuingbiomedicalresearch.org/blog/examining-distribution-k99r00-awards-race/. These results are not presently discussed in the paper, but are highly relevant given the discussion of K99 award impacts on the sociodemographic composition of U.S. biomedical faculty. From 2007 to 2017, the K99 award rate for white applicants was 31.0% compared to 26.7% for Asian applicants and 16.2% for Black applicants. In terms of award totals, these funding rates amount to 1,384 awards to white applicants, 610 to Asian applicants, and 25 to Black applicants for the entire 2007-2017 period. And in terms of R00 awards, or successful faculty transitions: whereas 77.0% of white K99 awardees received an R00 award, the conversion rate for Asian and Black K99 awardees was lower, at 76.1% and 60.0%, respectively. Regarding this K99-to-R00 transition rate, Woitowich et al. found no difference by gender (Table 2). These results are consistent with a growing body of literature that shows that while there have been improvements to equity in funding outcomes by gender, similar improvements for achieving racial equity are lagging.

      The conclusions are well-supported by the data, and limitations of the data and the name-gender matching algorithm are described satisfactorily.

      One aspect that the authors should expand or comment on is the change in the rate of K99 to R00 conversions. Since 2016, while the absolute number of K99 and R00 awards has been increasing, the percentage of R00 conversions appears to be decreasing, especially in 2020 and 2021. This observation is not clearly stated or shown in Figure 1 but is an important point - if the effectiveness of the K99/R00 mechanism for postdoc-to-faculty transitions has been decreasing lately, then something is undermining the purpose of this mechanism. This result bears emphasis and potentially discussion for possible reasons for why this is happening.

      Thank you for these insightful comments. We now calculate a rolling conversion rate for K99 to R00 awards which shows there is not as much of a decline in conversion from K99 to R00 (Fig 1B). We still see a slight decline in 2021 and 2022. 468 K99 awards are from 2020 or later so they may still convert to the R00 phase. Thus it is difficult to draw conclusions about 2021/2022 yet. As more time passes, we may better be able to determine whether or not significant alteration from normal occurred in these years, presumably due to pressures from the Covid-19 pandemic. We also thank you for providing the details of the FOIA request. We have included a discussion of these data in the discussion.

      Reviewer #3 (Public Review):

      The researchers aim add to the literature on faculty career pathways with particular attention to how gender disparities persist in the career and funding opportunities of researchers. The researchers also examine aspects of institutional prestige that can further amplify funding and career disparities. While some factors about individuals' pathways to faculty lines are known, including the prospects of certain K award recipients, the current study provides the only known examination of the K99/R00 awardees and their pathways.

      Strengths:

      The authors establish a clear overview of the institutional locations of K99 and R00 awardees and the pathways for K99-to-R00 researchers and the gendered and institutional patterns of such pathways. For example, there's a clear institutional hierarchy of hiring for K99/R00 researchers that echo previous research on the rigid faculty hiring networks across fields, and a pivotal difference in the time between awards that can impact faculty careers. Moreover, there's regional clusters of hiring in certain parts of the US where multiple research universities are located. Moreover, documenting the pathways of HBCU faculty is an important extension of the Wapman et al. study (among others from that research group), and provides a more nuanced look at the pathways of faculty beyond the oft-discussed high status institutions. (However, there is a need for more refinement in this segment of the analyses as discussed further below.). Also, the authors provide important caveats throughout the manuscript about the study's findings that show careful attention to the complexity of these patterns and attempting to limit misinterpretations of readers.

      Weaknesses:

      The authors reference institutional prestige in relation to some of the findings, but there's no specific measure of institutional prestige included in the analyses. If being identified as a top 25 NIH-funded institution is the proximate measure for prestige in the study, then more justification of how that relates to previous studies' measures of institutional prestige and status are needed to further clarify the interpretations offered in the manuscript.

      The identification of institutional funding disparities impacting HBCUs is an important finding and highlights another aspect of how faculty at these institutions are under resourced and arguably undervalued in their research contributions. However, a lingering question exists: why compare HBCUs with Harvard? What are the theoretical and/or methodological justifications for such comparisons? This comparison lends itself to reifying the status hierarchy of institutions that perpetuate funding and career inequalities at the heart of the current manuscript. If aggregating all HBCU faculty together, then a comparable grouping for comparison is needed, not just one institution. Perhaps looking at the top 25 NIH funded institutions could be one way of providing a clearer comparison. Related to this point is the confusing inclusion of Gallaudet in Figure 6 as it is not an officially identified HBCU. Was this institution also included in the HBCU-related calculations?

      Thank you for this comment. We agree this comparison perpetuates the perception of the prestige hierarchy and is problematic. We now compare all institutions in the top 25 NIH funding category to all HBCUs. Thank you also for identifying our error in mis-coding Gallaudet as an HBCU. We have corrected this in the current version.

      There is a clear connection that is missed in the current iteration of the manuscript derived from the work of Robert Merton and others about cumulative advantages in science and the "Matthew effect." While aspects of this connection are noted in the manuscript such as well-resourced institutions (those with the most NIH funding in this circumstance) hire each others' K99/R00 awardees, elaborating on these connections are important for readers to understand the central processes of how a rigid hierarchy of funding and career opportunities exist around these pathways. The work the authors build on from Daniel Larremore, Aaron Clauset, and their colleagues have also incorporated these important theoretical connections from the sociology of knowledge and science, and it would provide a more interdisciplinary lens and further depth to understanding the faculty career inequalities documented in the current study.

      Reviewer #1 (Recommendations For The Authors):

      Comments to authors:

      1. For the benefit of general reader, it would be informative to mention the amount of annual NIH investment in the k99 funding mechanism in the text (230 awards representing a ~ 230 million US dollars investment).

      Thank you for this suggestion. We have added that this is ~$25 million investment annually.

      1. It is worth noting that some of the observed funding and hiring traits resemble the Matthew effect, discussed in: The Matthew effect in science: https://www.science.org/doi/10.1126/science.159.3810.56

      The Matthew effect in science funding: https://www.pnas.org/doi/10.1073/pnas.1719557115

      It would be of value to cite these for further context for the readers.

      Thank you for this suggestion. We have included these references and briefly discussed the Matthew effect in the first paragraph of the Discussion.

      1. Figs 3, 6 and Fig S1 are hard to read without zooming in due to their format and don't work great within a letter size page but can work if they are also linked to a zoomable web version. It would make sense to have an online navigable/searchable/selectable version. But when the reader zooms out, there are patterns that reflect what points the authors are making (though those could be illustrated differently). These figures are really made for online webapp visualization (such as Shiny in R).

      We agree with this comment and have used the “googleVis()” package in R to put together interactive Sankey diagrams. These can be found at: https://dantyrr.github.io/K99-R00-analysis/ and they are referenced in the manuscript.

      1. The abstract states 85% of awardees get R00 awards. That appears to come from 198/234 (page 6) though it's not explicitly stated, and other ratios give different answers (e.g., 1-304/3475 = 91%) but the 85% seems to be the right one. That first paragraph of the results could be clearer. Also, in the middle of page three the number given is 90% so something is inconsistent. For Figure 1A, given the methodology it should be possible to calculate a rolling conversion rate as "R00(t) / K99(t-1)" (and a similarly-calculated cumulative rate).

      Thank you for catching these errors. These were introduced because there are R00 awardees that did not have extramural K99 awards. These are intramural NIH K99 awardees but there is no public data on these awardees. The correct number is 78% of K99 awardees that transitioned to the R00 phase. We have also calculated the rolling conversion rate which is 89% if you exclude the first 2 years of the program (when the first awardees were within the 2-yr K99 period) and final 2 years (when most recent K99 awardees were still within their first 2 years of the K99 period).

      1. Assuming that 85% is the correct number, is there any information/insight into why ~1/6 of awardees do not continue to R00, which seems high given that only two years passes - that's a lot of awardees not getting R00 positions.

      We are unsure of why these don’t convert. In the revised version of the manuscript, we speculate on this in the 4th paragraph of the discussion:

      The factors that prevented the other 302 K99 awardees from 2019 and earlier unable to convert their K99-R00 grants is cause for concern within our greater academic community. Possible explanations include leaving the biomedical workforce, accepting tenure-track positions or other positions abroad, or by simply not successfully securing a tenable tenure-track offer.

      1. It looks like perhaps a non-zero number of K99s are just one year and not two (e.g., see 2006 in Fig 1A, which should not appear if all 2006 awards were 2 years). What is the typical percentage of K99s not activated for a second year, and is this a sizable % of the 15% not converting to R00?

      This is an interesting question. We didn’t originally look into this and the dataset that we originally downloaded from NIH reporter included a significant number of duplicates for the grants because year 1 of the K99 was listed on its own line and year 2 was listed on a different line. The first step in curating the data was to delete the duplicate values so we only had one entry per person. Unfortunately based on sorting of the data tables, sometimes the year 1 appeared above year 2 and at other times year 2 appeared before year 1. Because none of the data we were interested in are benchmarked to K99 start date, we removed the duplicate values non-specifically. With the dataset we currently have, we would not be able to tell which individuals dropped out (didn’t convert to R00) during the first or second year of the K99. In order to do this we would have to download the raw data from NIH reporter again and curate it again. We may do this in the future but for the purpose of publishing the current manuscript we prefer to focus our efforts on other aspects of the revision.

      1. Further down page 3, the authors state that "men typically experience 2-3% greater funding success rates" is ambiguous, as rates are themselves a percentage. So, is it 2-3% greater as in 23% vs 20%, or is it 2-3% greater as in 20.6% vs 20%? Please clarify the language.

      Thank you for asking for this clarification. We have updated the text here to reflect that we mean “23% vs 20%”.

      1. Metrics such as time to first R01 are compared internally within the study set, which yields interesting insights, but more could be done to benchmark these metrics to non-K99 scientists.

      We agree with the reviewer that this would be ideal; however, we feel that it is out of the scope of this manuscript. We may examine this in the future.

      1. In the text, several times percentages are being referred to when the figures cited do not show percentages. For example (page 6) 'proportion of awardees that stayed at the same institution declined to about 20% where it has remained consistent (Fig 1B)' - Figure 1B does not show percentages, instead the reader would need to work out from the raw numbers what the pattern of percentages might look like. It's fine (great even) to provide the raw numbers, but would be great to show the percentages as well. This happened for multiple graphs.

      Thank you for this comment. We agree that showing the percentage would be beneficial so we have included the percentages in Figure 1 for the conversion rate. We also added a standalone figure panel for the rolling conversion rate for Figure 1. For Figure 4, we have also included a right Y-axis to better indicate the % women.

      1. Figure 4 - putting the %women on a 0-250 scale makes it difficult to see the changes in that curve. Please replot it as a separate graph with an appropriate scale (30-50%? 30-70%?)

      Thank you for this comment. We have made this edit.

      1. Figure 5 - The table appears inconsistent - the Moved/Stayed HR is 1.411 suggesting that moving is better for reducing time to R01, but then Woman/Man is 1.208, so one of these pairs needs to be written in the opposite order to have the table make sense (intended to be listed as 'better/worse'?)

      Thank you for noticing this. In the revised manuscript we have re-run the cox proportional hazard model using the R package “survival” and the function “coxph()”. There were minor differences in the hazard ratios using this package instead of Graphpad prism; however, the R package is much more widely used compared to prism for these types of analysis. We present the new data in the table in Figure 5B in the revised manuscript. We now present the “detrimental” cox hazard value for each variable (i.e. 0.7095 for the mobility [moved/stayed]). We also underlined the variable which was detrimental to receiving an R01 award earlier.

      1. Figure 5's graph appears strange. All the lines have an appearance of stochasticity but are actually multiples of each other, rising exactly in sync. Are these actually modeled lines? If so, why not instead actually draw the lines based on the real data from the real groups depicted, and give the n for each group?

      Thank you for picking this up. The software we originally used to plot the graphs did plot modeled lines instead of the actual data. We have re-run the cox proportional hazard model using the R “survival” package v3.5-5 and the coxph() and survfit() functions. The updated data are in Figure 5 of the revised manuscript.

      1. Table 1 should note that each column sums to 100%.

      This is a good suggestion. In the revised manuscript, we have added a row to the table to indicate the column total N and %.

      1. The authors discuss how k99/R00 grant reviewing process may have to change but the k99 awards also impact the faculty hiring ecosystem as well. There are faculty hiring job ads explicitly requesting or indicating preference towards k99 holders and the results described in this article show that k99 awarding is biased towards particular demographics at select wealthy institutions. Of course, collective/central action is almost always more effective/impactful (especially in shorter time line) than individual elective action. In other words, NIH changing granting patterns would likely work better than encouraging faculty searches to change the weight they give to K99s, because there are many searches and just one NIH. But these are not mutually exclusive and individual action can still help when central action isn't done (if the NIH does not change the k99/R00 grant review process for more inclusive funding and does not increase the number of annual k99 awards hence the annual budget for this award mechanism) and it would be good to have this discussed in the manuscript.

      Thank you for this comment and thoughtful insights. We have included additional discussion on this in the final paragraph of the discussion.

      Reviewer #2 (Recommendations For The Authors):

      Thank you for conducting this important work. On top of some thoughts I have described in the public review (in particular, Chris Pickett's FOIA data on K99/R00 outcomes by applicant race and ethnicity), I only have a few comments for potential improvements to this paper:

      1. The comparison of K99-R00 transition rates by gender was interesting. However, I missed the analysis on the K99-R00 transition rates by institution (by type or by top-25 NIH funded institution versus not). I think this analysis may be buried somewhere in the more nuanced descriptions about faculty flows from one institution type to another, but I was not able to locate it. I wonder if the authors could consider dedicating a subsection to specifically describing the transition rate by institution type, creating a table equivalent to Table 2. This section would probably fit best somewhere before the authors dive into the nuances of self-hires and faculty flows.

      Said another way: As I was reading, I felt I was missing an answer to a simple question - are there differences in conversion rates by institution type (however you define institution type, as an MSI or non MSI, or top-25 NIH funded versus not)?

      Thank you for this suggestion. We have created the table (Table 3 and Table 4) in the revised manuscript. We also made a new figure (now figure 5 in the revised manuscript). This was an interesting way to look at the data and it is very clear that the number of K99 and R00 awards is heavily concentrated within the institutions that have the highest NIH funding. We have added a paragraph in the results in a new section entitled “K99 and R00 awards are concentrated within the highest funded institutions”.

      1. Regarding the comparison of HBCUs and Harvard: this analysis was elucidating, but I am not sure if the framing of this analysis as pertaining to "systematically marginalized groups" - see second sentence in the section, "Faculty doctorates differ between Harvard and HBCUs" is appropriate. While it is true that proportionally more faculty at HBCUs are from marginalized groups, there are also many faculty at HBCUs who are from privileged or advantaged backgrounds (e.g., white, men, educated at elite institutions). It would be more accurate to rephrase the second sentence to say something along the lines of, "We sought to examine the rates of funding for those at historically under-funded institutions." I recommend that the authors comb the paper for any other potential places in the text that conflate systemic marginalization with institution type, and rephrase as needed for accuracy.

      Thank you for pointing this out. This is an extremely important point and we have removed any instances we could find where we conflate systemically marginalized groups with institution type.

      1. I strongly recommend Sugimoto and Larivière (2023)'s new book, Equity for Women in Science, which has an entire section dedicated to previous work investigating how researcher mobility impacts access to resources, collaborations, et cetera (Chapter 5 on Mobility; other chapters on Funding are also relevant but I hone in on Mobility since this is such a key result of this work). I think this chapter would provide significant food-for-thought and background that could strengthen the Discussion section of the paper.

      Thank you for this suggestion. We have added some discussion of mobility in the first paragraph of the Discussion.

      1. I appreciated the subsection headings that described key results (e.g., "Institutions with the most NIH funding tend to hire K99/R00 awardees from other institutions with the most funding"; "K99/R00 awardee self-hires are more common at institutions with the top NIH funding.") This paper structure made it easier for me to ensure that I was getting the intended takeaway from a figure or section. But partway through the paper, the subheadings changed to being less declarative and therefore less informative (e.g., "Gender of K99/R00 awardees"; "Factors influencing K99/R00 awardee future funding success"). It would be great to rephrase these boilerplate subsection headers to be more declarative, like earlier subsection headings. For example, maybe say "Men receive the majority of K99 awards" or "No gender difference in the rate of conversion from K99 to R00" or something to that effect, depending on what result the authors wish to emphasize.

      Thank you for this comment. This is a very good point. We have re-worded the more generic headings in the revised version.

      1. Lastly, I would like to share a question that came to my mind that involves an additional analysis, but is work that is (probably) out-of-the-scope of this paper, but could instead be a separate paper or product. Circling back to Chris Pickett's FOIA-ed data on K99/R00 funding outcomes by applicant race and ethnicity (https://web.archive.org/web/20180723171128/http://rescuingbiomedicalresearch.org/blog/examining-distribution-k99r00-awards-race/): Given that Pickett's numbers provide incontrovertible information on the number of awards to various racial and ethnic groups, I wonder if it is possible to use this information as an "answer key" to (1) check the accuracy of an algorithm that assigns race based on name for applications in your analysis but for 2007-2017 period, and, (2) if the results are reasonable, then examine the dataset with race and ethnicity information. Some recent papers performing large-scale bibliometric analyses have applied such algorithms (e.g., see Kozlowski et al. 2022 PNAS Intersectional inequalities in science) and I wonder if they could be useful, or at least tested, here. Again, Pickett's data would serve as the benchmark to see if the algorithm produces numbers that are consistent with the actual funding outcomes; if they're not wildly off, or perhaps accurate for some groups but not others, there might be something here.

      This is a really insightful comment. We have discussed whether we could assign ethnicity based on an algorithm and check based on Chris Pickett’s data. We agree that it is beyond the scope of this article, but has potential for future research.

      Reviewer #3 (Recommendations For The Authors):

      -In the methods section, it would be helpful to provide an overview of the number of universities, departments, and faculty represented in the data analyzed in the study.

      Thank you for this comment. We agree with the reviewer. We have added a section to the results discussing the distribution of different types of institutions. We also added Table 3 and Table 4 and a new Figure 5 describing these. Regarding the faculty, we have discussed the demographics of the K99 and R00 awardees as best as we could. We do not have data on which faculty laboratories the K99 awardees were in when they received their awards. This information is not available through NIH reporter.

      -I would consider incorporating, or at least citing, Jeff Lockhart and colleagues' recent paper Nature Human Behavior article "Name-based demographic inference and the unequal distribution of misrecognition" about to provide readers with an additional resource and more information about the likelihood of misattribution and general cautionary notes about using gender and race/ethnicity ascription/imputation approaches and tools for research.

      Thank you for bringing this reference to our attention. We have incorporated this into the methods section describing our name-based gender determination.

      -In the next to last sentence under the final paragraph of the methods section, there looks to be a typo as it should read "K99 or R00," not "K00" as currently written.

      Thank you for catching this. We have now corrected it.

      -Clarifying some of the data and measures used are necessary to limit confusion and misinterpretations of the study's findings.

      Thank you. We have significantly updated the revised manuscript and hope that it is more clear.

      -Elaborating more on the gender inequality notable in the Cox proportional hazard model would strengthen the authors' point about persistent gender inequalities within the K99/R00 funding mechanism and pathways. In its current iteration, the findings are somewhat buried by the discussion of institutional differences, but when we look at the findings and the plot associated with the model, we notice that men have more advantages than women in funding and institutional location.

      Thank you for highlighting this. This is true and we have elaborated on the gender inequality in the revised version of the manuscript.

      -Also for the Cox proportional hazard model, I would consider exploring the inclusion of data that can further clarify the biomedical research infrastructure of institutions. For example, in the conversation about the differences between Princeton and other universities including other Ivies, it's important to note that Princeton does not have a medical school. Moreover, other institutions do not operate or are affiliated with a hospital. Adding more data to the model that can better contextualize the research infrastructure around researchers with NIH awards beyond the size of the NIH portfolio can shed light on possibly other important institutional differences that undergird these inequalities.

      Thank you for this comment. We have added additional details about the institutional type; however, to examine whether institutions are attached to a hospital (or are themselves as hospital like MGH etc.) or whether institutions include a medical school may be difficult. We would have to manually code these and then determine whether or not the award recipient was affiliated with a department within that entity or not. We believe that this is a fascinating question but that it is out of the scope of the present manuscript. This is something that we will look into for potential future publications.

      -Throughout the manuscript there's usage of "elite" and "prestigious" that are somewhat ambiguous regarding what exactly they are referring to about institutional characteristics. This is a common issue in the literature, but trying to clarify what these terms specifically mean for the current study and checking for consistent usage with limited interchangeability that can add confusion for readers about what is being referred to would give added strength to the conversation provided by the authors.

      Thank you for this suggestion. Based on these comments and those by the other reviewers, in the revised version of the manuscript, we have limited the use of “elite” and “prestigious” to describe institutions in order not to perpetuate biases toward certain institutions.

      -In relation to the discussion at the end of the manuscript of the longer time to award noted for researchers who stay at the same institutions, another possibility for the disparity could be their reliance for service work (e.g., hiring committees, departmental committees, supporting graduate students through mentoring and/or dissertation committee work, etc.) in their institutions given their knowledge of and experience within it.

      Thank you for this suggestion. We have added 2 sentences to the discussion reflecting this possibility.

      -Engaging with how STEM professional cultures can perpetuate these funding disparities and related hiring and career outcomes could enhance the contributions of the study. In relation to STEM professional cultures, engaging with the work of Mary Blair-Loy and Erin Cech in their recent book, Misconceiving Merit, could help provide additional insights for readers.

      Thank you for these comments. We have incorporated edits to the revised manuscript reflecting the work of Erin Cech and Mary Blair-Loy.

    1. Author Response

      Reviewer #1 (Public Review):

      Summary:

      In this study, the authors showed that activation of RelA and Stat3 in hepatocytes of DSS-treated mice induced CYPs and thereby produced primary bile acids, particularly CDCA, which exacerbated intestinal inflammation.

      Strengths:

      This study reveals the RelA/Stat3-dependent gene program in the liver influences intestinal homeostasis.

      Weaknesses:

      Additional evidence will strengthen the conclusion.

      1) In Fig. 1C, photos show that phosphorylation of RelA and Stat3 was induced in only a few hepatocytes. The authors conclude that activation of both RelA and Stat3 induces inflammatory pathways. Therefore, the authors should show that phosphorylation of RelA and Stat3 is induced in the same hepatocytes during DSS treatment.

      Experiments in progress and data will be submitted in the revised manuscript- Co-staining of pRela and pStat3(727) on treated liver sections.

      2) In Fig. 5, the authors treated mice with CDCA intraperitoneally. In this experiment, the concentration of CDCA in the colon of CDCA-treated mice should be shown.

      Experiments in progress and data will be submitted in the revised manuscript - Supplementation of CDCA to knockout animals and estimation of CDCA in the colon of DSS treated and untreated animals.

      Reviewer #2 (Public Review):

      Singh and colleagues employ a methodic approach to reveal the function of the transcription factors Rela and Stat3 in the regulation of the inflammatory response in the intestine.

      Strengths of the manuscript include the focus on the function of these transcription factors in hepatocytes and the discovery of their role in the systemic response to experimental colitis. While the systemic response to induce colitis is appreciated, the cellular and molecular mechanisms that drive such systemic response, especially those involving other organs beyond the intestine are an active area of research. As such, this study contributes to this conceptual advance. Additional strengths are the complementary biochemical and metabolomics approaches to describe the activation of these transcription factors in the liver and their requirement - specifically in hepatocytes - for the production of bile acids in response to colitis.

      Some weaknesses are noted in the presentation of the data, including a lack of comprehensive representation of findings in all conditions and genotypes tested.

      These will be incorporated in the revised version.

      Reviewer #3 (Public Review):

      Summary:

      The authors try to elucidate the molecular mechanisms underlying the intra-organ crosstalks that perpetuate intestinal permeability and inflammation.

      Strengths:

      This study identifies a hepatocyte-specific rela/stat3 network as a potential therapeutic target for intestinal diseases via the gut-liver axis using both murine models and human samples.

      Weaknesses:

      1) The mechanism by which DSS administration induces the activation of the Rela and Stat3 pathways and subsequent modification of the bile acid pathway remains clear. As the authors state, intestinal bacteria are one candidate, and this needs to be clarified. I recommend the authors investigate whether gut sterilization by administration of antibiotics or germ-free condition affects 1. the activation of the Rela and Stat3 pathway in the liver by DSS-treated WT mice and 2. the reduction of colitis in DSS-treated relaΔhepstat3Δhep mice.

      Experiments in progress and data will be submitted in the revised manuscript - Antibiotic treatment for 2/4 weeks, subsequently mice will be treated with DSS and the Rela and Stat3 phosphorylation will be tested using western blotting.

      2) It has not been shown whether DSS administration causes an increase in primary bile acids, represented by CDCA, in the colon of WT mice following activation of the Rela and Stat3 pathways, as demonstrated in Figure 6.

      We have demonstrated a enhanced level of CDCA in the colon following DSS treatment in the wild type animals in figure 4B.

      3) The implications of these results for IBD treatment, especially in what ways they may lead to therapeutic intervention, need to be discussed.

      These will be incorporated in the revised version.

    1. Author Response

      We decided to address the comments of the reviewers with additional experiments and modification of the text with the aim of submitting a new version of the report.

      We would like to underline that the current study is an extension of the work published in eLife (Atze et al., 2021). For this reason, and in agreement with eLife guidelines, we did not repeat all the background information on the method used to identify PG subunit isotopologues using mass spectrometry.

      Reviewer #1 (Public Review):

      Summary:

      Liang et. al., uses a previously devised full isotope labeling of peptidoglycan followed by mass spec to study the kinetics of Lpp tethering to PG and the hydrolysis of this bond by YafK.

      Strengths:

      -The labeling and mass spec analysis technique works very well to discern differentially labelled Tri-KR muropeptide containing new and old Lpp and PG.

      Weaknesses:

      -Only one line of experimentation using mass spec based analysis of labeled PG-Lpp is used to make all conclusions in the paper. The evidence is also not enough to fully deleanate the role of YafK.

      Our approach based on heavy isotope labelling and mass spectrometry has the power to identify and kinetically characterize the specific products of the reaction leading to the tethering of Lpp to PG and the hydrolysis of the corresponding bond. We therefore advocate that our experimentation is sufficient to obtain meaningful results without combining other lines of experimentation.

      -Only one mutant (YafK) is used to make the conclusion.

      The aim of the study is to determine the effect of the hydrolysis of the PG→Lpp bond on the dynamics of the tethering of Lpp to PG. Since YafK is the only enzyme catalyzing this reaction, it is appropriate to compare the wild-type strain to an isogenic yafK deletion mutant. Nonetheless, we carefully consider this comment and will investigate the dynamics of the tethering of Lpp to PG in mutants deficient in the production of the L,D-transpeptidases responsible for tethering Lpp to PG.

      -The paper makes a lot of 'implications' with minimal proof to support their hypothesis. Other lines of experimentations must be added to fully delineate their claims.

      See our answer to the first comment.

      -Time points to analyse Tri-KR isotopologues in Wt (0,10,20,40,60 min) and yafK mutant (0,15, 25, 40, 60 min) are not the same.

      The purpose of the experiments is to compare the kinetics of formation and hydrolysis of the PG→Lpp bond in the WT versus ΔyafK strains. Comparison of the kinetics is therefore possible even though the kinetics are not based on the exact same time points. Nonetheless, we will reproduce the kinetics experiment (see also answers to Reviewer 2) and use the same time points in these additional experiments.

      -Experiments to define physiological role of YafK are also missing

      We will investigate the effect of the yafK deletion on the formation of outer membrane vesicles.

      Reviewer #2 (Public Review):

      Summary:

      The authors of this study have sought to better understand the timing and location of the attachment of the lpp lipoprotein to the peptidoglycan in E. coli, and to determine whether YafK is the hydrolase that cleaves lpp from the peptidoglycan.

      Strengths:

      The method is relatively straightforward. The authors are able to draw some clear conclusions from their results, that lpp molecules get cleaved from the peptidoglycan and then re-attached, and that YafK is important for that cleavage.

      Weaknesses:

      However, the authors make a few other conclusions from their data which are harder to understand the logic of, or to feel confident in based on the existing data. They claim that their 5-time point kinetic data indicates that new lpp is not substantially added to lipidII before it is added to the peptidoglycan, and that instead lpp is attached primarily to old peptidoglycan. I believe that this conclusion comes from the comparison of Fig.s 3A and 3C, where it appears that new lpp is added to old peptidoglycan a few minutes before new lpp is added to new peptidoglycan. However, the very small difference in the timing of this result, the minimal number of time points and the complete lack of any presentation of calculated error in any of the data make this conclusion very tenuous. In addition, the authors conclude that lpp is not significantly attached to septal peptidoglycan. The logic behind this conclusion appears to be based on the same data, but the authors do not provide a quantitative model to support this idea.

      The reviewer is correct in stating that we claim that Lpp is not substantially added to lipid II before incorporation of the disaccharide-pentapeptide subunit into the expanding PG network. This conclusion is based on the paucity of PG-Lpp covalent adducts containing light PG and Lpp moieties at the earliest time points. To substantiate more thoroughly this finding, we will reproduce the kinetic experiments with more early time points. The paucity of the new→new PG-Lpp isotopologues also implies that Lpp might not be extensively tethered to septal peptidoglycan since the latter is assembled from newly synthesized PG (see our previous publication Atze et al. 2021 and references therein). Quantitatively, septal synthesis roughly accounts for one third of the total PG synthesis. It is therefore expected that tethering of Lpp to septal PG would represent one third of the total number of newly synthesized Lpp molecules tethered to PG. We therefore proposed that the paucity of new→new PG- Lpp isotopologues at early time points of the kinetics implies that Lpp is preferentially tethered to the side wall. This is only one of several conclusions that we reach in the present study and we were very careful in the wording of our results.

      -This work will have a moderate impact on the field of research in which the connections between the OM and are being studied in E. coli. Since lpp is not widely conserved in gram negatives, the impact across species is not clear. The authors do not discuss the impact of their work in depth.

      We respectfully disagree with this reviewer’s comment. The work reported in this article for E. coli opens the way to the analysis and comparison of the mechanisms of the tethering of proteins to PG in various bacteria. In addition, we would like to stress that the Gram-negative bacteria that produce Lpp-related proteins and tether them to the PG include other major pathogens such as Pseudomonas aeruginosa (DOI: 10.1128/spectrum.05217-22).

    1. Author Response

      eLife assessment

      The manuscript presents valuable evidence of temporal correlations during specific oscillatory activity between the prefrontal cortex, thalamic nucleus reuniens, and the hippocampus, in naturally sleeping animals. Such correlations represent solid evidence to support the notion that the thalamic nucleus reuniens participates in the hippocampal and prefrontal cortex dialogue subserving memory processes.

      Thank you for your assessment.

      Public Reviews:

      Reviewer #1 (Public Review):

      Summary:

      In this study, Basha and colleagues aim to test whether the thalamic nucleus reuniens can facilitate the hippocampus/prefrontal cortex coupling during sleep. Considering the importance of sleep in memory consolidation, this study is important to understand the functional interaction between these three majorly involved regions. This work suggests that the thalamic nucleus reuniens has a functional role in synchronizing the hippocampus and prefrontal cortex.

      Strengths:

      The authors performed recordings in naturally sleeping cats, and analysed the correlation between the main slow wave sleep oscillatory hallmarks: slow waves, spindles, and hippocampal ripples, and with reuniens' neurons firing. They also associated intracellular recordings to assess the reuniens-prefrontal connectivity, and computational models of large networks in which they determined that the coupling of oscillations is modulated by the strength of hippocampal-thalamic connections.

      Thank you for your positive evaluation.

      Weaknesses:

      The authors' main claim is made on slow waves and spindle coupling, which are recorded both in the prefrontal cortex and surprisingly in reuniens. Known to be generated in the cortex by cortico-thalamic mechanisms, the slow waves and spindles recorded in reuniens show no evidence of local generation in the reuniens, which is not anatomically equipped to generate such activities. Until shown differently, these oscillations recorded in reuniens are most likely volume-conducted from nearby cortices. Therefore, such a caveat is a major obstacle to analysing their correlation (in time or frequency domains) with oscillations in other regions.

      1. We fully agree with the reviewer that reuniens likely does not generate neither slow waves nor spindles. We do not make such claim, which we clearly stated in the discussion (lines 319-324). We propose that Reuniens neurons mediate different forms of activity. In the model, we introduced MD nucleus only because without MD we were unable to generate spindles. While the slow waves and spindles are generated in other thalamocortical regions, the REU neurons show these rhythms due to long-range projections from these regions to REU as has been shown in the model.

      2. Definitely, we cannot exclude some influence of volume conductance on obtained LFP recordings in REU nucleus. However, we show modulation of spiking activity within REU by spindles. Spike modulation cannot be explained by volume conductance but can be explained by either synaptic drive (likely the case here) or some intrinsic neuronal processes (like T-current).

      3. In our REU recordings for spike identification we used tetrode recordings. If slow waves and spindles are volume conducted, then slow waves and spindles recorded with tetrodes should have identical shape. Following reviewer comment, we took these recordings and subtracted one channel from another. The difference in signal during slow waves is in the order 0.1 mV. Considering that the distance between electrodes is in the order of 20 um, such a difference in voltage is major and can only be explained by local extracellular currents, likely due to synaptic activities originating in afferent structures.

      Finally, the choice of the animal model (cats) is the best suited one, as too few data, particularly anatomical ones regarding reuniens connectivity, are available to support functional results.

      1. Thalamus of majority of mammals (definitely primates and carnivores, including cats) contain local circuit interneurons (about 30 % of all neurons). A vast majority of studies in rodents (except LGN nucleus) report either absence or extremally low (i.e. Jager P, Moore G, Calpin P, et al. Dual midbrain and forebrain origins of thalamic inhibitory interneurons. eLife. 2021; 10: e59272.) number of thalamic interneurons. Therefore, studies on other species than rodents are necessary, and bring new information, which is impossible to obtain in rodents.

      2. Cats’ brain is much larger than the brain of mice or rats, therefore, the effects of volume conductance from cortex to REU are much smaller, if not negligible. The distance between REU and closest cortical structure (ectosylvian gyrus) in cats is about 15 mm.

      3. Indeed, there is much less anatomical data on cats as opposed to rodents. This is why, we performed experiments shown in the figure 1. This figure contains functional anatomy data. Antidromic responses show that recorded structure projects to stimulated structure. Orthodromic responses show that stimulated structure projects to recorded structure.

      Reviewer #2 (Public Review):

      Summary:

      The interplay between the medial prefrontal cortex and ventral hippocampal system is critical for many cognitive processes, including memory and its consolidation over time. A prominent idea in recent research is that this relationship is mediated at least in part by the midline nucleus reuniens with respect to consolidation in particular. Whereas the bulk of evidence has focused on neuroanatomy and the effects of temproary or permanent lesions of the nucleus reuniens, the current work examined the electrophysiology of these three structures and how they inter-relate, especially during sleep, which is anticipated to be critical for consolidation. They provide evidence from intercellular recordings of the bi-directional functional connectivity among these structures. There is an emphasis on the interactions between these regions during sleep, especially slow-wave sleep. They provide evidence, in cats, that cortical slow waves precede reuniens slow waves and hippocampal sharp-wave ripples, which may reflect prefrontal control of the timing of thalamic and hippocampal events, They also find evidence that hippocampal sharp wave ripples trigger thalamic firing and precede the onset of reuniens and medial prefrontal cortex spindles. The authors suggest that the effectiveness of bidirectional connections between the reuniens and the (ventral) CA1 is particularly strong during non-rapid eye movement sleep in the cat. This is a very interesting, complex study on a highly topical subject.

      Strengths:

      An excellent array of different electrophysiological techniques and analyses are conducted. The temporal relationships described are novel findings that suggest mechanisms behind the interactions between the key regions of interest. These may be of value for future experimental studies to test more directly their association with memory consolidation.

      We thank this reviewer for very positive evaluation of our study.

      Weaknesses:

      Given the complexity and number of findings provided, clearer explanation(s) and organisation that directed the specific value and importance of different findings would improve the paper. Most readers may then find it easier to follow the specific relevance of key approaches and findings and their emphasis. For example, the fact that bidirectional connections exist in the model system is not new per se. How and why the specific findings add to existing literature would have more impact if this information was addressed more directly in the written text and in the figure legends.

      Thank you for this comment. In the revised version, we will do our best to simplify presentation and more clearly explain our findings.

    1. Author Response

      The following is the authors’ response to the original reviews.

      Public Reviews:

      Reviewer #1 (Public Review):

      Activity has effects on the development of neural circuitry during almost any step of differentiation. In particular during specific time periods of circuit development, so-called critical periods (CP), altered neural activity can induce permanent changes in network excitability. In complex neural networks, it is often difficult to pinpoint the specific network components that are permanently altered by activity, and it often remains unclear how activity is integrated during the CP to set mature network excitability. This study combines electrophysiology with pharmacological and optogenetic manipulation in the Drosophila genetic model system to pinpoint the neural substrate that is influenced by altered activity during a critical period (CP) of larval locomotor circuit development. Moreover, it is then tested whether and how different manipulations of synaptic input are integrated during the CP to tune network excitability.

      Strengths:

      Based on previous work, during the CP, network activity is increased by feeding the GABA-AR antagonist PTX. This results in permanent network activity changes, as highly convincingly assayed by a prolonged recovery period following induced seizure and by altered intersegmental locomotor network coordination. This is then used to provide two important findings: First, compelling electro- and optophysiological experiments track the site of network change down to the level of single neurons and pre- versus postsynaptic specializations. In short, increased activity during the CP increases both the magnitude of excitatory and inhibitory synaptic transmission to the aCC motoneuron, but excitation is affected more strongly. This results in altered excitation inhibition ratios. Fine electrophysiology shows that excitatory synapse strengthening occurs postsynaptically. High-quality anatomy shows that dendrite size and numbers of synaptic contacts remain unaltered. It is a major accomplishment to track the tuning of network excitability during the CP down to the physiology of specific synapses to identified neurons.

      Second, additional experiments with single neuron resolution demonstrate that during the CP different forms of activity manipulation are integrated so that opposing manipulations can rescue altered setpoints. This provides novel insight into how developing neural network excitability is tuned, and it indicates that during the CP, training can rescue the effects of hyperactivity.

      Weaknesses:

      There are no major weaknesses to the findings presented, but the molecular cause that underlies increased motoneuron postsynaptic responsiveness as well as the mechanism that integrates different forms of activity during the CP remain unknown. It is clear that addressing these experimentally is beyond the scope of this study, but some discussion about different candidates would be helpful.

      We discuss likely mechanisms that underpin the increase in postsynaptic responsiveness below (Reviewer #1 (Recommendations For The Authors):, point 2). To address possible mechanisms that integrate different forms of activity we now include a new paragraph in the discussion.

      Reviewer #2 (Public Review):

      Summary:

      In this study, the authors use the tractable Drosophila embryonic/larval motor circuit to determine how manipulations of activity during a critical period (CP) modify the circuit in ways that persist into later developmental stages. Previously, this group demonstrated that manipulations to the aCC/MN-Ib neuron in embryonic stages enhance (or can rescue) susceptibility to seizures at later larval stages. Here, the authors demonstrate that following enhanced excitatory drive (by PTX feeding), the aCC neuron acquires increased sensitivity to cholinergic excitatory transmission, presumably due to increased postsynaptic receptor abundance and/or sensitivity, although this is not clarified. Although locomotion is not altered at later developmental larval stages, the authors suggest there is reduced "robustness" to induced seizures. The second part of the study then goes on to enhance inhibition during the CP in an attempt to counteract the enhanced excitation, and show that many aspects of the CP plasticity are rescued. The authors conclude that "average" E/I activity is integrated during the CP to determine the excitability of the mature locomotor network.

      Overall, this study provides compelling mechanistic insight into how a final motor output neuron changes in response to enhanced excitatory drive during a CP to change the functionality of the circuit at later mature developmental stages. The first part of this study is strong, clearly showing the changes in the aCC neuron that result from enhanced excitatory input. This includes very nice electrophysiology and imaging data that assess synaptic function and structure onto aCC neurons from pre-motor inputs resulting from PTX exposure during development. However, the later experiments in Figures 6 and 7 designed to counteract the CP plasticity are somewhat difficult to interpret. In particular, the specificity of the manipulations of the ch neuron intended to counteract the CP plasticity is unclear, given the complexities of how these changes impact the excitability of all neurons during development. It is clear that CP plasticity is largely rescued in later stages, but it is hard to know if downstream or secondary adaptations may be masking the PTX-induced plasticity normally observed. Nonetheless, this study provides an important advance in our understanding of what parameters change during CPs to calibrate network dynamics at later developmental stages.

      Reviewer #3 (Public Review):

      Summary:

      In Hunter, Coulson et al, the authors seek to expand our understanding of how neural activity during developmental critical periods might control the function of the nervous system later in life. To achieve increased excitation, the authors build on their previous results and apply picrotoxin 17-19 hours after egg-laying, which is a critical period of nervous system development. This early enhancement of excitation leads to multiple effects in third-instar larvae, including prolonged recovery from electroshock, increased synchronization of motor neuron networks, and increased AP firing frequency. Using optogenetics and whole-cell patch clamp electrophysiology, the authors elegantly show that picrotoxin-induced over-excitation leads to increased strength of excitatory inputs and not loss of inhibitory inputs. To enhance inhibition, the authors chose an approach that involved the stimulation of mechanosensory neurons; this counteracts picrotoxin-induced signs of increased excitation. This approach to enhancing inhibition requires further control experiments and validation.

      Strengths:

      • The authors confirm their previous results and show that 17-19 hours after egg laying is a critical period of nervous system development.

      • Using Ca2+/Sr2+ substitutions, the authors demonstrate that synaptic connections between A18a  aCC show increased mEPSP amplitudes. The authors show that this aCC input is what is driving enhanced excitation.

      • The authors demonstrate that the effects of over-excitation attributed to picrotoxin exposure are generalizable and also occur in bss mutant flies.

      Weaknesses:

      • The authors build on their previous work and argue that the critical period (17-19h after egg-laying) is a uniquely sensitive period of development. Have the authors already demonstrated that exposure to picrotoxin at L1 or L2 (and even early L3 if experimentally possible) does not lead to changes in induced seizure at L3? This would further the authors' hypothesis of the uniqueness of the 17-19h AEL period. If this has already been established in prior publications, then this needs to be further explained. I do note in Gaicehllo and Baines (2015) that Fig 2E shows the identification of the 17-19h window.

      This is a pertinent comment. We now have evidence that activity manipulation (in this instance by increasing temperature, which recapitulates the effect of PTX) is not effective at larval stages (L1 to L3) but remains effective between 17-19hrs AEL. This observation forms part of a separate study where we explore the role of circadian activity on embryonic and larval neuronal development. We include a brief statement to address this comment in the revision (first paragraph of Results).

      • Regarding experiments in Fig 2, authors only report changes in AP firing frequency. Can the authors also report other metrics of excitability, including measures of intrinsic excitability with and without picrotoxin exposure (including RMP, Rm)? Was a different amount of current injection needed to evoke stable 5-10 Hz firing with and without picrotoxin? In the representative figure (Fig. 2A), it appears that the baseline firing frequencies are different prior to optogenetic stimulation.

      No differences in RM, Rin or capacitance were observed due to PTX. This is now included in the revision along with an explanation that different levels of current injection were used to measure effects to excitatory vs inhibitory synaptic drive. We did not specifically monitor the amount of current required to maintain stable firing.

      • The ch-related experiments require further controls and explanation. Regarding experiments in Fig 6, what is the effect of ch neuron stimulation alone on time lag and AP frequency? Can the authors further clarify what is known about connections between aCC and ch neurons? It is difficult for this reviewer to conceptualize how enhancing ch-mediated inhibition would worsen seizures. While the cited study (Carreira-Rosario et al 2021) convincingly shows that inhibition of mechanosensory input leads to excessive spontaneous network activity, has it been shown that the converse - stimulation of ch neurons - indeed enhances network inhibition?

      • The interpretation of ch-related experiments is further complicated by the explanation in the Discussion that ch neuron stimulation depolarizes aCC neurons; this seems to undercut the authors' previous explanation that the increased E:I ratio is corrected by enhanced inhibition from ch neurons. The idea that ch neurons are placing neurons in a depolarized refractory state is not substantiated by data in the paper or citations.

      To respond to these two points combined: The reviewer is correct in stating that additional experiments will be required to fully understand mechanism. We believe that cholinergic (excitatory) chordotonal input to aCC may be an important component for setting the rhythm of the locomotor CPG. Indeed, it may be that CPG rhythm is a key factor during the CP. Our observations suggest optogenetic stimulation of Ch neurons alone is sufficient to induce large, ~400-, currents that resemble endogenous spontaneous rhythmic currents (SRCs) associated with CPG activity. SRCs occur with a characteristic frequency of ~1Hz, and we have some unpublished data that suggests it is possible to change this frequency using ch stimulation. This data therefore unifies prior work (Carreira-Rosario et al., 2021 description of a brake) with our own (observation that ch depolarize aCC). However, we do not include this speculation in the Discussion because the experiments we have conducted were pilots. They may be expanded upon and included in future work.

      • In the Discussion, the authors suggest that enhanced proprioception leading to seizures is reminiscent of neurological conditions. This seems to be an oversimplification. Connecting abnormal proprioception to seizures is quite different from connecting abnormal proprioception to disorders of coordination. This should be revised.

      Because this is peripheral to our main study, we have deleted this from the revision.

      Reviewer #1 (Recommendations For The Authors):

      1. Although the authors have to be commended for the scrutiny with which they pinpoint a site of circuit change, it cannot be excluded that other parts of the circuit also undergo adjustments in response to activity manipulation during the CP, e.g. the membrane properties of the interneurons. This is not a problem but should be discussed.

      We agree with this comment and have added the following text to the discussion……’However, we recognise that other parts of the locomotor network may also undergo change due to CP manipulation. The advantage of this system is that most of these elements are now open to specific manipulation through cell-specific genetic drivers’. (Discussion paragraph 3)

      1. It is surprising that there is no discussion of the potential molecular cause for the observed increases in postsynaptic responses to SV release from cholinergic neurons. Given that there are no differences in postsynaptic structure, puncta number etc., the subunit composition of the nAChR seems an obvious guess. What is known about the nAChRs subunit composition on aCC, and when during development do the receptors/different subunits become expressed? A paragraph in the discussion on this issue would be highly relevant to the manuscript.

      Our own work (unpublished) together with a recent paper from the Littleton lab (https://www.sciencedirect.com/science/article/pii/S0896627323005810?via%3Dihub#mmc2) suggests that aCC expresses the majority, if not all, of the 7 alpha and 3 beta subunits that compromise nAChRs. The situation is further complicated by the fact that these receptors are pentameric and are composed of various subunits – the composition significantly altering channel kinetics. Less is known about expression timelines for each receptor subunit, and certainly not in aCC. We already include the following sentence in the results text……’ A change in the frequency of mini excitatory postsynaptic potentials (mEPSPs, a.k.a. minis) would suggest the adaptation is primarily presynaptic (e.g. increased probability of release), whilst a change in distribution and/or amplitude of minis is more consistent with a mechanism acting postsynaptically (e.g. increased or altered receptor subunits).’ Given that we know next to nothing about the nAChR subunit composition in aCC and how this might change due to CP manipulation, we feel it better not to speculate further. To help the reader, we include the following sentence in the discussion……’The precise mechanism contributing to increased mini amplitude remains to be determined, but a plausible scenario may involve change in cholinergic subunit composition.’ (Discussion paragraph 3)

      1. It would be important to provide the p-values for Figures 1B and C, especially because it seems that the inhibition also becomes stronger upon PTX treatment during the CP. There is no statistical testing mentioned, was no test done or was it not significant? It is agreed that the effect size is clearly stronger for the increased excitation than for the increased inhibition, but looking at the data suggests that the effect on excitation is not much more significant than the effect on inhibition.

      The reviewer is referring to Fig 2B&C. P values have been added to both main text and to the figure legend.

      1. Associated with the point above, in the discussion line 407 and below the authors come back to this point and reason that it is surprising that increased excitation is not compensated for by homeostatic mechanisms. It is concluded that homeostatic compensation brings the system back to a setpoint that is defined during the critical period, but the setpoint is set higher in this case. However, an alternative explanation is that GABA administration during the critical period causes the excitation set point to be too high, but this is then partially counteracted in a homeostatic manner by increasing inhibition. If the p-values in Figures 2B and C are rather similar, this might even be the favorable interpretation.

      We believe the reviewer means ‘PTX administration’ and not GABA. This is an interesting idea and one we had not really considered. We address this comment by adding the following text………. ‘Alternatively, whilst the increased inhibition we observe is not statistically significant (p = 0.15), it is close and has a medium effect size (Cohen’s d = 0.78), and thus may be indicative of an attempt by the locomotor network to rebalance activity back towards a genetically pre-determined level. In this regard, it may just not have sufficient range to be able to counter the increase in excitation due to CP manipulation.’ (Discussion paragraph 5)

      1. To asses the magnitudes of A18a-mediated excitation and A31k-mediated inhibition to aCC, changes in aCC firing frequency were measured. For this aCC was injected with current to fire at all. However, the current injections were chosen to cause firing at 5-10 Hz. During a crawling burst, aCC fires well above 100Hz (Kadas et al., 2017). Are the effects also visible at such firing frequencies, or at least across different firing frequencies? I am not asking for additional experiments, but maybe the data are there and can be referred to?

      Spiking in aCC occurs as burst firing, evoked by cholinergic synaptic drive, that lasts for ~300ms and achieving firing frequencies of between 50-100Hz (Kadas et al., 2017 and our own unpublished data). We did not test for effects to excitation or inhibition at these higher frequencies. We now make this explicit in the discussion by adding the following sentence……’The firing frequencies that we imposed (1-10Hz) are also lower than seen during fictive locomotion (Kadas et al., 2017), which shows burst firing lasting for ~300 ms and achieving spike frequencies of up to 100Hz.’ (Discussion paragraph 3)

      1. In Figure 3B some minis are demarked by green arrows and others are not. Were the non-marked ones not included in the analysis, and what were the criteria to mark some and others not? This is particularly important because the cumulative distribution of minis is analyzed in Figure 3D, and this depends crucially on what qualifies as mini and what does not.

      All mini’s are marked by green arrows. The events not marked are not mini’s. Drosophila neurons are small and have an unfavourable dendritic structure for recording minis. Thus, we carefully analyse traces by eye taking only events that show very rapid rise times and slower, exponential decay (the typical mini shape). There are, however, other events which are most likely single/multiple channel openings, which due to filtering are rounded. We now include this same trace, greatly expanded, as Fig S1D to show how we identified minis from non-minis.

      1. The asynchronous release experiment under Sr2+ seems an elegant way to analyze minis upon optogenetic stimulation of an identified presynaptic cholinergic neuron. I suggest being a little more conservative with the term asynchronous release (or replacing it), which is usually the release of many single vesicles that follow AP-mediated synaptic transmission and has nicely been demonstrated at the Drosophila NMJ (Besse et al., 2007). Also, please show the trace in Figure S2A under Sr2+ at a higher pA magnification, it is really hard to see the minis there.

      We have adopted a previously published technique that, in our view, correctly uses the term ‘asynchronous release’. This is not to say that all asynchronous release occurs via the same mechanism. Indeed, the papers that report the technique we use predate Besse 2007. We also expand the trace in Fig S1A (not S2A as wrongly indicated).

      Reviewer #2 (Recommendations For The Authors):

      1. Can the authors explain what they think is the parameter of "activity" being measured in the locomotor circuit (mainly aCC) during the CP? Is the aCC neuron simply summing (perhaps through a proxy like Ca2+) total excitation/inhibition over time during the CP?

      Reviewer #1 also requests that we discuss how activity is ‘measured’ and thus we now include a dedicated paragraph in the discussion to address this concern. Whether aCC sums ‘average’ activity or perhaps is influenced by activity extremes remains uncertain. Our data is consistent with the former but further work is required to validate our conclusion. This work will be published in due course.

      Related to understanding this concept, could the authors' silence activity (using Kir2.1, TNT, or BoNT) from each of the monosynaptic premotor inputs in otherwise wildtype and following PTX exposure to determine how the circuit responds when each of the monosynaptic inputs are silenced? This might inform the role they play in instructing how activity is measured over time during the CP.

      This is an excellent suggestion and, indeed, we have planned such experiments. Silencing specific neurons, whilst manipulating the CP, may well result in more significant network instability due to the setting of multiple (and physiologically inappropriate) homeostatic set points. Such studies go beyond the scope of the present study and thus we prefer not to speculate at this early stage, but to wait for experimental data.

      On a related note, the authors focus on just 2 premotor inputs, presumably due to the availability of specific drivers. But do the authors know how many other inputs (other ACh, Gaba, and glutamate) onto aCC there are, and to what extent do the authors think these are changed in similar or distinct ways? Is it implied that all neurons are similarly altered by the manipulations?

      The connectome details the number and types of neurons that directly contact the aCC motoneuron (Zarin et al., 2019). In terms of cholinergic excitors, the results present in Figure 3 suggest that most (all?) inputs are strengthened following embryonic PTX exposure. However, to conclude this would be highly speculative and thus we refrain from doing so in the manuscript. As other single-neuron driver lines become available, such expts will hopefully be possible.

      1. If PTX treatment does indeed increase CPG synchronicity, shouldn't there be a readout of this effect on larval locomotion? While the speed of locomotion wasn't significantly impacted, perhaps another parameter was altered.

      It is quite possible that other aspects of locomotion are being altered (turning, rearing, etc), but we have not analysed for these more subtle behaviours. Indeed, although not statistically significant, there is a modest reduction in average velocity in larvae derived from PTX-exposed embryos. We see similar reductions in characterised seizure mutants which also show increased synchronicity (Streit et al., 2016).

      1. In Figure 2 and elsewhere, what is the baseline level of AP firing rate in each aCC neuron, before optogenetic stimulation? Is this informative about how PTX exposure alters excitability to begin with, perhaps by changing intrinsic excitability.

      We now include this data in the relevant results section. Interestingly, following exposure to PTX, basal firing was significantly increased in A18a (excitatory premotor) but not in A31k (inhibitory premotor). This reflects our experiment in which we conclude that excitatory drive to aCC is increased relative to inhibitory synaptic drive. Thus, this measure seemingly validates our conclusion that E:I balance has been altered following activity-manipulation during the CP.

      1. Figure 3: The apparent increase in mini amplitude is very small (4.1 vs 4.5 pA); is this physiologically meaningful? Although the authors say the decrease in mini freq is not significant in Fig. 3B after PTX, it does appear rather large, a 40% reduction (5 vs 3 Hz).

      We must be guided by statistics in drawing conclusions, but the reader can interpret our data as they wish. Minis measure quantal release and thus to appreciate how small change can, when combined over the many receptors present, influence cell physiology, one needs to compare spiking activity. We show in Fig 2 that such change is sufficient to increase the excitatory synaptic drive provided by the A18a neuron. The seemingly larger reduction in mini frequency is intriguing and may reflect additional change, but without further experiments we cannot draw firm conclusions.

      1. The clever vibration assay is a good one to induce the activation of mechanosensory neurons, but the specificity of the changes induced by this is difficult to ascertain. One possibility would be to silence the output of the ch neurons (by expression to tetanus or botulinum toxin) and still put the larvae through the same vibration during the CP to see if the rescue is lost.

      We agree that further experiments are required to fully understand underlying mechanism(s). However, we will not be able to complete such follow-on expts in a timely manner and thus, these must wait and form the basis of future studies.

      Minor points 1. Typos - there are numerous areas where it seems a comma is used inappropriately (e.g. lines 28, 69, 77, 104, 348, 365, etc). Suggest line editing the final "version of record".

      Checked and corrected.

      1. It would be of benefit to show the genotypes of the larvae in the various experimental manipulations in the relevant figure legends. This reviewer could not follow exactly how each experiment was done as it was not always clear which driver was being used to express which transgene in what genetic background.

      Done

      Reviewer #3 (Recommendations For The Authors):

      • Please provide sample videos of electroshock-induced seizures (e.g. Fig 1B). Is it clear that the period of immobility after electroshock is a seizure (perhaps defined as hyperactivity originating from the brain)? I acknowledge the Baines group is quite skilled in this technique and perhaps there is a straightforward answer or citation to include.

      We refer the reader to Marley and Baines 2011 which contains videos of seizure activity (first paragraph of Results).

      • Seizures are generated in the brain and travel to the periphery. Do the authors think it is possible that the peripheral manipulations in this manuscript might be controlling the behavioral readout of seizures without affecting hypersynchronous activity in the brain?

      We include the following statement (in methods) to provide our best understanding for how peripheral electroshock induces seizure………. ‘Strong peripheral stimulation likely causes excessive and synchronous synaptic excitation within the CNS resulting in seizure. However, the precise mechanism of this effect remains to be determined.’ Moreover, we feel it unlikely that manipulation of Ch neurons, by vibration, would suppress the effects we observe via peripheral mechanisms. Indeed, the Ch manipulation is limited to the embryonic CP, whilst our seizure assays are recorded many days later at L3.

      • How might enhancement of inhibition lead to worsened seizures? Is the enhancement of ch-related inhibition selectively affecting inhibitory circuits, thereby leading to a net increase in excitation?

      This is a difficult point to respond to at present. Enhanced inhibition per se might similarly disturb the encoding of an appropriate homeostatic setpoint(s) thus leaving a network open to being destabilized by a strong stimulus. Indeed, we have previously shown that increased inhibition during the CP results in the same effect (seizure) as increasing excitation (Giachello and Baines, 2015). Thus, presuming activation of Ch neurons during the CP translates to increased inhibition, then worsened seizure behaviour is a predictable effect. How this is achieved remains unknown and we prefer not to speculate here.

    1. Author Response

      The following is the authors’ response to the previous reviews.

      We are pleased that Reviewers 1 and 3 have recommended that the revised paper be published.

      Reviewer #2

      For point A: Their preliminary simulation in 3D looks also nice, although it’s referenced in the discussion but not actually included in manuscript - I would advise adding it even under the mention of preliminary.

      We appreciate the reviewer for liking our 3D results and suggesting to include them in the manuscript. However, these are preliminary results of our ongoing work. We are yet to establish the corresponding viscosity results quantitatively in the 3D simulations. Because the relationship between viscosity and relaxation time is not (always) linear in glass forming systems, we hesitate to report our results for publication. We hope to report the new results as part of a separate work.

      For point B/C: I see some of the points of the authors - although not all of it made it in the main text. I still have some points that puzzle me. For instance, the authors mention that a single value of viscosity (from Green-Kubo) is ”valid for all time scales and amplitude”. This sounds very surprising to me for a complex fluid even at equilibrium: doesn’t it for instance assume linear response (hence small amplitudes)? Fast vs slow probing of a complex medium should also matter (see refs previously mentioned). Related to this, it’s not clear how can self-propulsion not matter if one would shear the system at a finite time scale, given past work on motility-driven unjamming and the mechanism of the authors from facilitation ( wouldn’t shearing at time scales larger vs smaller than the typical time for given cells to spontaneously rearrange from self-propulsion change drastically the effective complex modulus of the system?)

      There might be a slight misunderstanding between the reviewer and us when

      we say ‘single value of viscosity is valid for all time-scales and amplitude’. Let us explain this point more carefully. In our problem, we are studying the dynamics of a many body system which is undergoing Brownian dynamics where the fluctuation-dissipation theorem need not be valid (as the friction and the selfpropulsion noise strength are not related via Fluctuation-Dissipation Theorem). Now, for us to use the concepts of linear-response (which in the present study are the Green-Kubo relations for the transport coefficients in terms of timecorrelations functions), we need to show that the within the simulation time, the system has reached state that could be described using an “equilibrium” probability measure. This is the precise reason we calculated the ergodicity measure, which is a way to show that all the phase-space have been sampled uniformly under the given Brownian dynamics. This suggests (does not prove) that the system has attained a stationary probability measure (i.e, near equilibrium) for the value of self-propulsion used. Now for this value of self-propulsion, the Green-Kubo relations hold for ‘any time-scale of the simulations’ so that we can perform a time average over the trajectories of the particles (which is an alias of the stationary probability measure under the values of self-propulsion used). If we change the amplitude of the self-propulsion, we need to again compute the ergodicity measure and show the stationarity of the probability measure. If the system is ergodic with respect to the new self-propulsion, we can again use Green-Kubo for the simulations. Note that we will definitely get a different value of viscosity under the new self-propulsion as the shear-stresses generated will be different but the Green-Kubo holds. If the system is not ergodic, for the self-propulsion with the new amplitude, we cannot use Green-Kubo relations. Also a priori, one cannot say what is a large/small amplitude of self-propulsion because it has to be compared with the intrinsic energy scale, which is encoded in the energy function, which is difficult to say without explicit calculations.

      This is what we meant when we said, ‘single value of viscosity is valid for all time-scales and amplitude’. It is valid for time-scales of the simulations for a given amplitude of self-propulsion only if the system is ergodic. Note that if the system is not ergodic, then the results of Ref. [14] (in the main text) could be questioned on theoretical grounds, because they were analyzed using 3 the equilibrium rigidity percolation theory. Nevertheless, the authors of Ref. [14] showed that equilibrium phase transition theory works in tissues. For these reasons, we have been, just like the Reviewer, puzzled that equilibrium ideas appear to be valid in the cell system. Additional theoretical work has to be done to clarify these links in tissues. Although this is not the last word, we hope this clarifies our view point.

      For point D: I agree with the simplicity argument, although the added sentence from the discussion “Furthermore, the physics of the dynamics in glass forming materials does not change in systems with and without attractive forces” seems a bit strong given works like Lois et al., PRL, 2008 or Koeze et al, PRL, 2018 finding fundamentally different physics of jamming with or without adhesion. In the two cited papers the authors only consider equilibrium transitions in systems with attraction using computer simulations. Apparently, jamming properties depend on the strength of attraction. There are no attempts to characterize the dynamics, the focus of our work.

      What we meant is that any universal relations, such as the Vogel-FulcherTammann relation, would still be valid. Of course, non-universal quantities such as glass transition temperature Tg or fragility will change. In our case, changing the adhesion strength would change ϕS, and the parameters in the VFT. However, our contention is that the overall finding that increase in viscosity followed by saturation is unlikely to change. We have added some clarifying statements in the manuscript to make this clear.

    1. Author Response

      We would like to thank the reviewers for their encouraging comments and useful feedback, which will enable us to improve the manuscript. We would like to briefly comment on some of the points they raised.

      1. We agree this is a fairly specialized pipeline that has some requirements in terms of photographic setup. We are working hard to make these requirements as minimal as possible. However, given the huge variability in camera angles, backgrounds, arrangement of brain slices, etc., making the pipeline fully automated for unconstrained photos is extremely challenging.

      2. In principle, it should be possible to extend our method to sagittal slices of the cerebellum or axial slices f the brainstem, but this would require collecting and labeling additional training data and thus remains as future work.

      3. Producing accurate surfaces with sparse photographs is a very challenging problem and also remains as future work. We have a conference article producing surfaces on MRI scans with sparse slices (https://doi.org/10.1007/978-3-031-43993-3_4) but we haven’t gotten it to work well on photographs yet.

      4. Another challenging issue that remains as future work is getting the pipeline to work well with nonlinear deformations, e.g., slices of fresh tissue. While incorporating nonlinear deformation into the model is trivial from the coding perspective, we have not been able to make it work at the level of robustness that we achieve with affine transformations. This is because the nonlinear model introduces huge ambiguity in the space of solutions: for example, if one adds identical small nonlinear deformations to every slice, the objective function barely changes.

      5. As we acknowledge in the manuscript, the validation of the reconstruction error (in mm) with synthetic data is indeed optimistic, but informative in the sense that they reflect the trends of the error as a function of slice thickness and its variability (“jitter”).

      6. Since we use a single central coronal slice in the direct evaluation, SAMSEG yields very high Dice scores for large structures with strong contrast (e.g., the lateral ventricles). However, Photo-SynthSeg provides better average results across the board, particularly when considering 3D analysis out of the coronal plane (see qualitative results in Figure 2 and results on volume correlations).

    1. Author Response:

      We would like to thank the editor and the three reviewers for their time and effort taken in reviewing our manuscript and providing constructive feedback. Unfortunately, the first author of this manuscript is no longer involved in academia, and does not wish to further revise this manuscript. However, we agree with the entirety of the feedback and critiques provided by the referees, and feel these points should be taken into account when interpreting our results and conclusions.

    1. Author Response

      The following is the authors’ response to the original reviews.

      Reviewer #1 (Public Review):

      This work challenges previously published results regarding the presence and abundance of 6mA in the Drosophila genome, as well as the claim that the TET or DMAD enzyme serves as the "eraser" of this DNA methylation mark and its roles in development. This information is needed to clarify these questions in the field. I am less familiar with the biochemical approaches in this work, so my comments are mainly on the genetic analyses. Generally speaking, the methods for fly husbandry and treatment seem to be in accordance with those established in the field.

      Response : We thank the reviewer for his/her work and positive assessment of our manuscript.

      Reviewer #2 (Public Review):

      DNA adenine methylation (6mA) is a rediscovered modification that has been described in a wide range of eukaryotes. However, 6mA presence in eukaryote remains controversial due to the low abundance of its modification in eukaryotic genome. In this manuscript, Boulet et al. re-investigate 6mA presence in drosophila using axenic or conventional fly to avoid contaminants from feeding bacteria. By using these flies, they find that 6mA is rare but present in the drosophila genome by performing LC/MS/MS. They also find that the loss of TET (also known as DMAD) does not impact 6mA levels in drosophila, contrary to previous studies. In addition, the authors find that TET is required for fly development in its enzymatic activity-independent manner.

      The strength of this study is, that compared to previous studies of 6mA in drosophila, the authors employed axenic or conventional fly for 6mA analysis. These fly strains make it possible to analyze 6mA presence in drosophila without bacterial contaminant. Therefore, showing data of 6mA abundance in drosophila by performing LC-MS/MS in this manuscript is more convincing as compared with previous studies. Intriguingly, the authors find that the conserved iron-binding motif required for the catalytic activity of TET is dispensable for its function. This finding could be important to reveal TET function in organisms whose genomic 5mC levels are very low.

      The manuscript in this paper is well written but some aspects of data analysis and discussion need to be clarified and extended.

      1. It is convincing that an increase in 6mA levels is not observed in TETnull presented in Fig1. But it seems 6mA levels are altered in Ax.TET1/2 compared with Ax.TETwt and Ax.TETnull presented in Fig1f (and also WT vs TET1/2 presented in Fig1g). Is it sure that no statistically significant were not observed between Ax.TET1/2 and Ax.TETwt?

      2. The representing data of in vitro demethylation assay presented in Fig.3 is convincing, but it is not well discussed and analyzed why these results are contrary to previous reports (Yao et al., 2018 and Zhang et al., 2015).

      We thank the reviewer for his/her work and positive assessment of our manuscript.

      (1) We repeated our statistical analyses and confirmed that there is no significant difference between wildtype and tet1/2 mutant embryos in axenic conditions (Welch two sample t-test : p=0.075).

      (2) We added some elements in the revised manuscript to discuss the possible reasons for the discrepancies with previous reports. Notably both studies performed the in vitro demethylation assays over a much longer time course and with different sources of recombinant proteins. Zhang et al. purified TET catalytic domain from human cells (HEK293T) and observed around 2.5% of 6mA demethylation at 30 min and less than 25% after 10 hours of incubation as measured by HPLC-MS/MS analyses. Yao et al. incubated recombinant TET catalytic domain with 6mA DNA for 3h and observed a 25% decrease in 6mA levels as measured by dot blot. These results suggest that drosophila TET may oxidize 6mA, but with a much lower affinity than 5mC since with observed a near complete oxidation of 5mC after 1 minute and no decrease in 6mA levels after 30 minutes of reaction (for identical concentrations of substrate and enzyme). It is possible too that the preparation of TET catalytic domain in different systems changes its enzymatic activity, potentially in relation with distinct post-translational modifications. Still, as already mentioned in our manuscript, extensive biochemical analyses of the distant TET homolog from the fungus Coprinopsis cinerea (Mu et al., Nature Chem Biol 2022) strongly argue that TET enzymes do not harbor the residues required to serve as 6mA demethylase.

      Reviewer #1 (Recommendations For The Authors):

      Here are one comment (#1) and a couple of questions (#2-3) that could be addressed in the future, in order to understand the roles of 6mA and TET. Even though #2 and #3 are likely beyond the scope of this paper, #1 should be addressed within the scope of this work and compared with previous reports.

      1. The phenotypic analyses in Fig. 4 should use tet_null/Deficiency and tet_CD/Deficiency for their potential phenotypes. This needs to be addressed since both the tet_null and the tet_CD were generated using the same starting fly line (GFP knock-in). Using a deficiency chromosome and testing these alleles in hemizygotes would be helpful to eliminate any secondary effects due to genetic background issues.

      Thanks for this comment. Actually, tet_null and tet_CD were not generated using the same starting lines. Whereas tet_cd was generated (by CRISPR) using the tet-GFP knock-in line, tet_null was generated by FRT site recombination between two PBac insertions (Delatte et al. 2016). As for tet1 and tet2 (used in allelic combination in Fig 4 J-L), they correspond to two distinct mutant alleles generated by CRISPR (Zhang et al. 2015). We have clarified this in the M&M (page 9).

      1. Regarding the estimated "200 to 400 methylated adenines per haplogenome", is there any insight into where are they located in the genome?

      It is an interesting question and we initially used SMRT-seq sequencing to obtain this kind of information. As it turned out that this technique gives a high level of false positive, we should consider with caution the interpretation of these data and we decided not to include them in the manuscript. Still, we characterized the genomic features of the 6mA detected using stringent criteria (mQV>100, cov>25x in the fusion dataset and triplicated across samples of the same genotype). Both in wild type and tet_null, 6mA were dispersed along each chromosome although few of them were found on chromosome X. In both cases there appeared to be a higher accumulation of 6mAs on the histone locus and the transposon-rich tip of chromosome X, but 6mA density remained below 1.3/kb in other genomic regions. Comparisons with annotated genomic regions indicated that 6mA were enriched in long interspersed nuclear elements (LINEs) and satellite repeats, and depleted in 3’UTR and exons, but there was no significant difference in their repartition between the two genetic contexts. Besides, motif analyses showed similar enrichments in both conditions, with GAG triplet accounting for more than one quarter of all the sites. Whether this reflects the specificity of a putative adenine methylase or a technical bias associated the with SMTR-seq technology remains to be established.

      1. The TET-GFP and TET-CD-GFP knock-in lines give proper nuclear localization and could be used to identify genomic regions bound with full-length TET and TET-CD using anti-GFP for ChIP-seq or CUT&RUN (or CUT&TAG).

      Indeed, this is a line of research that we are following up and will be part of another study. Actually, our ChIP-seq experiments indicate that they bind on the same genomic regions.

      Reviewer #2 (Recommendations For The Authors):

      • I think the major findings of this paper are showing 6mA present in drosophila by using xenic or conventional breeding conditions and finding that TET function independently of its catalytic activity is essential for fly development. The authors could have been more precise in title and abstract to emphasize these findings.

      We have now modified the abstract to try to emphasize these findings.

      • The authors claim that any increase of 6mA levels was not observed in both TETnull and TET1/2, but it is not sufficiently convincing. Because it seems 6mA levels were increased in Ax. tet1/2 embryo as compared with in Ax.wt embryo (Fig.1). In this scenario, 6mA abundance in both TETnull and TET1/2 mutant are supposed to be the same. It would be better to re-analyze data carefully and discuss if 6mA levels were significantly increased in TET1/2, and why 6mA levels are different between TETnull and TET1/2. Additionally, the authors describe that the TET null mutant is pupal lethal, while the TET1/2 survivor is available. The text suggests that TET1/2 could have partial functionality on fly development (Fig.4). It would be better to check whether the N-terminus of TET is expressed in the TET1/2 mutant.

      Indeed, the increase in 6mA levels in Ax. tet1/2 embryo seems consequent (although it is not statistically significant) and no increase was observed in Ax tet_null embryos. Thus, the putative effect on 6mA levels in tet1/2 embryos may not be directly due to the absence of TET function. We now mention in the revised manuscript (page 6) that “the apparent increase in 6mA levels in tet1/2 axenic embryos was not reproduced in tet_null embryos, suggesting that it does not simply reflect the tet loss of function, and that it was not statistically significant”. Besides, we do not have an antibody to check whether the N-terminus of TET is expressed in the tet1/2 mutants, but the western blot published by Zhang et al 2015 shows that tet2 mutation leads to the expression of TET N-terminal domain. This N-terminal domain could have partial TET functionality and/or interfere with the function of other factors (notably those implicated in 6mA metabolism).

      • The authors show that SMRT-seq data did not reveal an increase in 6mA levels in loss of TET (Fig.2). It is convincing that total 6mA abundance was not altered by loss of TET. But were 6mA-accumulated locus/regions observed in WT not altered by loss of TET?

      Please refer to our answer to reviewer 1 on that point.

      • It remains unclear that the TET proteins the authors prepared do not exhibit 6mA demethylate activity in vitro, contrary to what was reported in previous papers (Fig.3). I think the preparation of recombinant proteins may make different results between this and previous papers. Yao et al., 2018 and Zhang et al., 2015 used recombinant proteins purified from Human cells or insect cells, while the author purified them from E.Coli. Additionally, it's mentioned that VK Rao et al., 2020 demonstrated cdk5-mediated phosphorylation of Tet3 increases its in catalytic activity in vitro. These previous reports suggest modification of TET could change demethylase activity. More analysis and discussion are needed to support the conclusion.

      Thanks for your insights. This in an important point and we added the following elements in the revised manuscript to discuss possible reasons for the discrepancies with previous reports (pages 7-8): “Our results contrast with previous reports showing that recombinant drosophila TET demethylates 6mA on dsDNA in vitro (Yao et al. 2018; Zhang et al., 2015a). However, both studies ran much longer reactions (up to 10 hours) and used different sources of recombinant protein (drosophila TET catalytic domain purified from human HEK293T cells). Notably, Zhang et al. (2015a) only found around 2.5% of 6mA demethylation at 30 min and less than 25% after 10 hours of incubation as measured by HPLC-MS/MS analyses. These results suggest that drosophila TET may oxidize 6mA, but with a much lower affinity than 5mC since with observed a near complete oxidation of 5mC after 1 min. and no significant decrease in 6mA levels after 30 min. of reaction (for identical concentrations of substrate and enzyme). It is possible too that the preparation of TET catalytic domain in different systems changes its enzymatic activity, potentially in relation to distinct post-translational modifications.”

    1. Author Response

      1. Reviewer 1 raised the concern that the images shown in the figures seem inconsistent with the quantitative data.

      Our provisional response: The quantitative data are based on many samples and the photographs are just supposed to show illustrations of example data. Because of the volume containing P1a cells, is impossible to present a single confocal image that covers all P1a neurons and would therefore correspond more closely to the quantitative data. We chose to illustrate the quantitative data using single confocal images which contain both Hr38+/GFP+ and Hr38-/GFP+ neurons, to demonstate that we can distinguish clearly which P1a neurons are positive or negative for for Hr38 expression. This can be clarified in the figure legends. If it is imperative to show images(s) to reflect the statistics, we can do that but will need to present multiple confocal images for each condition, which could be messy and confusing.

      1. Reviewer 2 states: "the major weakness is the calibration of the temporal resolution of HI-CatFISH in Figure 4 and Figure Supplement 4. According to Figure Supplement 4C, close to 100% of the Hr38-positive cells are already labeled with the exonic probe 30min post-stimulation, which is not reflected in Figure 4B (there, the expression level of the exonic probe peaks 60min post-induction)”.

      The confusion may arise because we drew the illustration diagram (Fig. 4B) based on the quantitative data in Fig.S4B, which plots the intensity of Hr38 exonic ISH signals, while the reviewer may be comparing the illustration to the time course based on Fig.S4C, which shows the % positive cells, a binary measure. In the illustration (fig.4B), we wrote 'Hr38 expression level', not '%Hr38 positive cells.’ We can clarify this in the figure legend. If the reviewers prefer, we can add a threshold line in the diagram corresponding to the % positive cells at maximum.

    1. Author Response

      The following is the authors’ response to the original reviews.

      Reviewer #1

      The study provides a complete comparative interactome analysis of α-arrestin in both humans and drosophila. The authors have presented interactomes of six humans and twelve Drosophila α-arrestins using affinity purification/mass spectrometry (AP/MS). The constructed interactomes helped to find α-arrestins binding partners through common protein motifs. The authors have used bioinformatic tools and experimental data in human cells to identify the roles of TXNIP and ARRDC5: TXNIP-HADC2 interaction and ARRDC5-V-type ATPase interaction. The study reveals the PPI network for α-arrestins and examines the functions of α-arrestins in both humans and Drosophila.

      Comments

      I will like to congratulate the authors and the corresponding authors of this manuscript for bringing together such an elaborate study on α-arrestin and conducting a comparative study in drosophila and humans.

      Introduction:

      The introduction provides a rationale behind why the comparison between humans and Drosophila is carried out.

      • Even though this is a research manuscript, including existing literature on similar comparison of α-arrestin from other articles will invite a wide readership.

      Results:

      The results cover all the necessary points concluded from the experiments and computational analysis.

      1) The authors could point out the similarity of the α-arrestin in both humans and Drosophila. While comparing α-arrestin in both humans and Drosophila If percentage homology between α-arrestin of both Drosophila and humans needs to be calculated.

      Thank you for your insightful feedback. As suggested by reviewer, we determined percentage homology of α-arrestin protein sequences from human and Drosophila using Clustal Omega. This homology is now illustrated as a heatmap in revised Figure S5. Please note that only the values with percentage homology of 40% or higher are selectively labeled.

      • Citing the direct connecting genes from the network in the text will invite citations and a wider readership.

      Figures:

      The images are elaborate and well-made.

      2) The authors could use a direct connected gene-gene network that pointing interactions. This can be used by other readers working on the same topic and ensure reproducibility and citations.

      We appreciate your valuable comment. Based on the reviewer’s suggestion, we have developed a new website in which one can navigate the gene-gene networks of α-arrestins. These direct connected gene-gene networks are housed in the network data exchange (NDEx) project. Additionally, we have included gene ontology and protein class details for α-arrestins’ interactors in these set of networks, offering a more comprehensive view of α-arrestins’ interactomes.

      On page 24 lines 15-18, we have revised the manuscript to introduce the newly developed website, as follows.

      “Lastly, to assist the research community, we have made comprehensive α-arrestin interactome maps on our website (big.hanyang.ac.kr/alphaArrestin_PPIN). Researchers can search and download their interactomes of interest as well as access information on potential cellular functions and protein class associated with these interactomes.”  

      3-1) The co-expression interactions represented as figures should reveal interaction among the α-arrestin and other genes. Which are the sub-network genes does the α- arrestin interact to/ with from the sub-network? The arrows are only pointing at the sub-networks. The figures do not reveal their interaction. Kindly reveal the interaction in the figure with the proper nodes in the figure.

      3-2) Figure 2: the network attached in both human and drosophila is well represented. The green lines from α-arrestin indicate the strength of the interaction. Several smaller expression networks are seen. But "α-arrestin" in both organisms seems highly disconnected from all the genes. Connected genes have edges, not arrows. If α-arrestin can be shown connected to these gene-gene networks will help in identifying which genes connect with which gene through α-arrestin. This can be used by other readers working on the same topic and ensure reproducibility and citations.

      Thank you for your valuable comment. In response to the reviewer’s recommendation, we’ve added supplementary figure, Figure S4, which illustrates direct interaction between α-arrestin and protein components of clustered complexes (or sub-networks) in addition to the associations shown between α-arrestins and the clustered complexes in Figure 2. We believe that this newly incorporated information regarding direct protein interactions will invite citations and wider readership as the reviewer pointed out.

      On page 12 line 27 to page 13 line 5, we have revised the manuscript to cite the direction interactions between ARRDC3 and proteins involved in ubiquitination-dependent proteolysis, as follows.

      “While the association of ARRDC3 with these ubiquitination-dependent proteolysis complexes is statistically insignificant, ARRDC3 does interact with individual components of these complexes such as NEDD4, NEDD4L, WWP1, and ITCH (Figure S4A). This suggest their functional relevance in this context, as previously reported in both literatures and databases (Nabhan et al., 2010; Shea et al., 2012; Szklarczyk et al., 2015; Warde-Farley et al., 2010) (Puca & Brou, 2014; Xiao et al., 2018).”

      Direct interaction between α-arrestins and protein components of clustered complexes are illustrated in the newly added figure, Figure S4.

      4-1) Figure 4. The Protein blot image was blurred. Kindly provide a higher-resolution image.

      4-2) Figure 5. B. - The authors can provide images with higher resolution blot images. The bands were not visible.

      We appreciate for valuable comment. Unfortunately, the protein blot image was scanned from the original film and the images we provided in the figure represent the highest resolution that we have obtained to date. Raw, uncropped images are shown in Author response image 1 and 2.

      Author response image 1.

      Raw image of Figure 4B

      Author response image 2.

      Raw image of Figure 5B

      5) Figure: 5. A. - I see non-specific amplifications in the gel images. Are these blotting images? or the gel images that were changed to "Grayscale"? Non-specific amplification may imply that the experiment was not repeated and standardized. Was it gel images or blot images?

      We appreciate your insightful comment. The images in Figure 5A represent western blot bands from co-immunoprecipitation assay for analysis of the interaction between TXNIP and HDAC2 proteins. Since immunoblotting using immunoprecipitates can usually detect some non-specific bands from heavy (~ 50 kDa) and light (~25 kDa) chains of the target antibody or from multiple co-immunoprecipitated proteins, we assume that the vague non-specific bands in Figure 5A might be a heavy chain of TXNIP or HDAC2 antibody or an unclear non-specific band. Because target bands showed strong intensity and very clear pattern compared to the non-specific bands in the co-immunoprecipitation assay, we believe that this data is sufficient to support the interaction of TXNIP with HDAC2. Finally, In the revised Figure 5A, we’ve modified the labeling for different experimental conditions, namely siCon and siTXNIP treatments, and added expected size of proteins (kDa), as shown below.

      6) Figure 5. A. RT-PCR analysis: What was your expected size of the amplifications? the ladder indicated is in KDa. Is that right?

      We appreciate your insightful questions. As mentioned above, Figure 5A shows the blotting images of co-immunoprecipitation analysis, and the ladder indicates the molecular weight (kDa) of protein markers. For clearer interpretation, the expected size of target proteins has been added in Figure 5A in the revised manuscript.

      7) How were the band intensities determined?

      Thank you for your question. For quantification of immunoblot results, the densities of target protein bands were analyzed with Image J, as we described in the Materials and Methods.

      Discussion:

      The authors have utilized and discussed the conclusion they draw from their study. But could highlight more on ARRDCs and why it was selected out of the other arrestins. The authors have provided future work directions associated with their work.

      8) Why were only ARRDCs presented amongst all the arrestin in the main part of the manuscript?

      We’re grateful for your valuable feedback. The reason we focused on α-arrestins was that α-arrestins have been discovered relatively recently, especially when compared to more established visual/ β-arrestin proteins in the same arrestin family but the biological functions of many α-arrestins remain largely unexplored, with notable exceptions in the budding yeast model and a few α-arrestins in mammals and invertebrate species. Most importantly, comparative study highlighting the shared or unique features of α-arrestins is yet to be undertaken. To gain a more comprehensive understanding of these unexplored α-arrestins across multiple species, we’ve centered our research on the ARRDCs within the arrestin protein family.

      On page 21 lines 8-17, we’ve edited the manuscript to emphasize the importance of a comparative study on α-arrestins, as detailed below.

      “According to a phylogenetic analysis of arrestin family proteins, α-arrestins were shown to be ubiquitously conserved from yeast to human (Alvarez, 2008). However, compared to the more established visual/ β-arrestin proteins, α-arrestins have been discovered more recently and much of their molecular mechanisms and functions remain mostly unexplored except for budding yeast model (Zbieralski & Wawrzycka, 2022). Based on the high-confidence interactomes of α-arrestins from human and Drosophila, we identified conserved and specific functions of these α-arrestins. Furthermore, we uncovered molecular functions of newly discovered function of human specific α-arrestins, TXNIP and ARRDC5. We anticipate that the discovery made here will enhance current understanding of α-arrestins.”

      9) The discussion could be elaborated more by utilizing the data.

      We appreciate your insightful feedback. Based on the reviewer’s suggestion, we’ve enhanced the discussion in the manuscript to provide a clearer interpretation of our results. First, we’ve added description of conserved protein complexes significantly associated with α-arrestins, stated on page 22 lines 5-12 and lines 23-26.

      Page 22 lines 5-12: “The integrative map of protein complexes also highlighted both conserved and unique relationships between α-arrestins and diverse functional protein complexes. For instance, protein complexes involved in ubiquitination-dependent proteolysis, proteasome, RNA splicing, and intracellular transport (motor proteins) were prevalently linked with α-arrestins in both human and Drosophila. To more precisely identify conserved PPIs associated with α-arrestins, we undertook ortholog predictions within the α-arrestins’ interactomes. This revealed 58 orthologous interaction groups that were observed to be conserved between human and Drosophila (Figure 3).”

      Page 22 lines 23-26: “Additionally, interaction between α-arrestins and entities like motor proteins, small GTPase, ATP binding proteins, and endosomal trafficking components were identified to be conserved. Further validation of these interactions could unveil molecular mechanisms consistently associated with these cellular functions.”

      Secondly, we’ve added description of role of ARRDC5 in osteoclast maturation, as stated on page 23 lines 22-24.

      “Conversely, depletion of ARRDC5 reduces osteoclast maturation, underscoring the pivotal role of ARRDC5 in osteoclast development and function (Figure S9A and B).”

      Lastly, we examined the association between α-arrestins’ interactomes and human diseases, incorporating our findings into the discussion. The newly introduced figure based on the result is Figure S10.

      On page 24 lines 10-14, we’ve added discussion on Figure S10 as follows.

      “We further explored association between α-arrestins’ interactomes and disease pathways (Figure S10). Notably, the interactomes of α-arrestins in human showed clear links to specific diseases. For instance, ARRDC5 is closely associated with disease resulting from viral infection and cardiovascular conditions. ARRDC2, ARRDC4, and TXNIP share common association with certain neurodegenerative diseases, while ARRDC1 is implicated in cancer.”

      Supplementary figures:

      The authors have a rigorous amount of work added together for the success of this manuscript.

      10) The reference section needs editing before publication. Maybe the arrangement was disturbed during compiling.

      Thank you for your valuable comment. Based on the reviewer’s suggestion, we have rearranged the reference section to enhance its clarity. Below are excerpts from the update reference section in the manuscript.

      “Adenuga, D., & Rahman, I. (2010). Protein kinase CK2-mediated phosphorylation of HDAC2 regulates co-repressor formation, deacetylase activity and acetylation of HDAC2 by cigarette smoke and aldehydes. Arch Biochem Biophys, 498(1), 62-73. doi:10.1016/j.abb.2010.04.002

      Adenuga, D., Yao, H., March, T. H., Seagrave, J., & Rahman, I. (2009). Histone Deacetylase 2 Is Phosphorylated, Ubiquitinated, and Degraded by Cigarette Smoke. American Journal of Respiratory Cell and Molecular Biology, 40(4), 464-473. doi:10.1165/rcmb.2008-0255OC

      Akalin, A., Franke, V., Vlahovicek, K., Mason, C. E., & Schubeler, D. (2015). Genomation: a toolkit to summarize, annotate and visualize genomic intervals. Bioinformatics, 31(7), 1127-1129. doi:10.1093/bioinformatics/btu775

      Alvarez, C. E. (2008). On the origins of arrestin and rhodopsin. BMC Evol Biol, 8, 222. doi:10.1186/1471-2148-8-222”

      11) many important references were missing.

      We appreciate and agree with the reviewer’s comment. In response to the reviewer’s recommendation, we’ve thoroughly reviewed the manuscript and below are sections of the manuscript where around 20 new references have been added.

      On page 8 lines 12-14:

      “Utilizing the known affinities between short linear motifs in α-arrestins and protein domains in interactomes(El-Gebali et al., 2019; UniProt Consortium, 2018) “

      On page 8 lines 19-22:

      “One of the most well-known short-linear motifs in α-arrestin is PPxY, which is reported to bind with high affinity to the WW domain found in various proteins, including ubiquitin ligases (Ingham, Gish, & Pawson, 2004; Macias et al., 1996; Sudol, Chen, Bougeret, Einbond, & Bork, 1995)”

      On page 9 lines 3-6:

      “Next, we conducted enrichment analyses of Pfam proteins domains (El-Gebali et al., 2019; Huang da, Sherman, & Lempicki, 2009b) among interactome of each α-arrestin to investigate known and novel protein domains commonly or specifically associated (Figure S3A; Table S5).”

      On page 9 lines 7-10:

      “HECT and C2 domains are well known to be embedded in the E3 ubiquitin ligases such as NEDD4, HECW2, and ITCH along with WW domains (Ingham et al., 2004; Melino et al., 2008; Rotin & Kumar, 2009; Scheffner, Nuber, & Huibregtse, 1995; Weber, Polo, & Maspero, 2019)”

      On page 10 lines 12-16:

      “In fact, the known binding partners, NEDD4, WWP2, WWP1, and ITCH in human and CG42797, Su(dx), Nedd4, Yki, Smurf, and HERC2 in Drosophila, that were detected in our data are related to ubiquitin ligases and protein degradation (C. Chen & Matesic, 2007; Ingham et al., 2004; Y. Kwon et al., 2013; Marin, 2010; Melino et al., 2008; Rotin & Kumar, 2009) (Figure 1E; Figure S2F).”

      On page 13 lines 20-21:

      “Given that α-arrestins are widely conserved in metazoans (Alvarez, 2008; DeWire, Ahn, Lefkowitz, & Shenoy, 2007), “

      On page 14 lines 12-17:

      “The most prominent functional modules shared across both species were the ubiquitin-dependent proteolysis, endosomal trafficking, and small GTPase binding modules, which are in agreement with the well-described functions of α-arrestins in membrane receptor degradation through ubiquitination and vesicle trafficking (Dores et al., 2015; S. O. Han et al., 2013; Y. Kwon et al., 2013; Nabhan et al., 2012; Puca & Brou, 2014; Puca et al., 2013; Shea et al., 2012; Xiao et al., 2018; Zbieralski & Wawrzycka, 2022) (Figure 3).”  

      Reviewer #2

      In this manuscript, the authors present a novel interactome focused on human and fly alpha-arrestin family proteins and demonstrate its application in understanding the functions of these proteins. Initially, the authors employed AP/MS analysis, a popular method for mapping protein-protein interactions (PPIs) by isolating protein complexes. Through rigorous statistical and manual quality control procedures, they established two robust interactomes, consisting of 6 baits and 307 prey proteins for humans, and 12 baits and 467 prey proteins for flies. To gain insights into the gene function, the authors investigated the interactors of alpha-arrestin proteins through various functional analyses, such as gene set enrichment. Furthermore, by comparing the interactors between humans and flies, the authors described both conserved and species-specific functions of the alpha-arrestin proteins. To validate their findings, the authors performed several experimental validations for TXNIP and ARRDC5 using ATAC-seq, siRNA knockdown, and tissue staining assays. The experimental results strongly support the predicted functions of the alpha-arrestin proteins and underscore their importance. `

      I would like to suggest the following analyses to further enhance the study:

      1) It would be valuable if the authors could present a side-by-side comparison of the interactomes of alpha-arrestin proteins, both before and after this study. This visual summary network would demonstrate the extent to which this work expanded the existing interactome, emphasizing the overall contribution of this study to the investigation of the alpha-arrestin protein family.

      We greatly appreciate your insightful feedback. In response to the reviewer’s suggestion, we’ve depicted a network of known PPIs associated with α-arrestins (Figure S2C and D). Furthermore, by comparing our high-confidence PPIs to these known sets, we found that the overlaps are statistically significant and the high-confidence PPIs of α-arrestins broaden the existing interactome (Figure S2E).

      From page 7 line 26 to page 8 line 8, we’ve detailed this side-by-side comparisons of existing interactome and newly discovered high-confidence PPIs of α-arrestins, as outline below.

      “As a result, we successfully identified many known interaction partners of α-arrestins such as NEDD4, WWP2, WWP1, ITCH and TSG101, previously documented in both literatures and PPI databases (Figure S2C-F) (Colland et al., 2004; Dotimas et al., 2016; Draheim et al., 2010; Mellacheruvu et al., 2013; Nabhan et al., 2012; Nishinaka et al., 2004; Puca & Brou, 2014; Szklarczyk et al., 2015; Warde-Farley et al., 2010; Wu et al., 2013). Additionally, we greatly expanded repertoire of PPIs associated with α-arrestins in human and Drosophila, resulting in 390 PPIs between six α-arrestins and 307 prey proteins in human, and 740 PPIs between twelve α-arrestins and 467 prey proteins in Drosophila (Figure S2E). These are subsequently referred to as ‘high-confidence PPIs’ (Table S3).”

      2) While the authors conducted several analyses exploring protein function, there is a need to further explore the implications of the interactome in human diseases. For instance, it would be beneficial to investigate the association of the newly identified interactome members with specific human diseases. Including such investigations would strengthen the link between the interactome and human disease contexts.

      Thank you for your valuable comment. As suggested by the reviewer, we examined the association between α-arrestins’ interactomes and human diseases, incorporating our findings into the discussion. The newly introduced figure based on the result is Figure S10.

      On page 24 lines 10-14, we’ve added discussion on Figure S10 as follows.

      “We further explored association between α-arrestins’ interactomes and disease pathways (Figure S10). Notably, the interactomes of α-arrestins in human showed clear links to specific diseases. For instance, ARRDC5 is closely associated with disease resulting from viral infection and cardiovascular conditions. ARRDC2, ARRDC4, and TXNIP share common association with certain neurodegenerative diseases, while ARRDC1 is implicated in cancer.”

      Reviewer #3:

      Lee, Kyungtae and colleagues have discovered and mapped out alpha-arrestin interactomes in both human and Drosophila through the affinity purification/mass spectrometry and the SAINTexpress method. They found the high confident interactomes, consisting of 390 protein-protein interactions (PPIs) between six human alpha-arrestins and 307 preproteins, as well as 740 PPIs between twelve Drosophila alpha-arrestins and 467 prey proteins. To define and characterize these identified alpha-arrestin interactomes, the team employed a variety of widely recognized bioinformatics tools. These included protein domain enrichment analysis, PANTHER for protein class enrichment, DAVID for subcellular localization analysis, COMPLEAT for the identification of functional complexes, and DIOPT to identify evolutionary conserved interactomes. Through these analyses, they confirmed known alpha-arrestin interactors' role and associated functions such as ubiquitin ligase and protease. Furthermore, they found unexpected biological functions in the newly discovered interactomes, including RNA splicing and helicase, GTPase-activating proteins, ATP synthase. The authors carried out further study into the role of human TXNIP in transcription and epigenetic regulation, as well as the role of ARRDC5 in osteoclast differentiation. This study holds important value as the newly identified alpha-arrestin interactomes are likely aiding functional studies of this group of proteins. Despite the overall support from data for the paper's conclusions, certain elements related to data quantification, interpretation, and presentation demand more detailed explanation and clarification.

      1) In Figure 1B, it is shown that human alpha-arrestins were N-GFP tagged (N-terminal) and Drosophila alpha-arrestins were C-GFP (C-terminal). However, the rationale of why the authors used different tags for human and fly proteins was not explained in the main text and methods.

      We appreciate your valuable comment. Both N- and C-terminally tagged α-arrestins have been used previously. Given that our study aims to increase the repertoire of α-arrestin interacting proteins, where GFP is added might not be a concern. We note that GFP is a relatively bulky tag, and tagging a protein with GFP can potentially abolish the interaction with some of the binding proteins. Follow-up studies utilizing different approaches for detecting protein-protein interactions, such as BioID and yeast two-hybrid, will allow us to build more comprehensive α-arrestin interactomes.

      2) In Figure 2A, there seems to be an error for labeling the GAL4p/GAL80p complex that includes NOTCH2, NOTCH1 and TSC2.

      Thank you for comment. We double-checked COMPLEAT (protein COMPLex Enrichment Analysis Tool) database for the name of protein complex consisting of NOTCH1, NOTCH2, AND TSC2. The database indeed labeled this complex as the “GAL4p/GAL80p complex”. However, given the potential for mis-annotation (since we could not ascertain the relevance of these proteins to the “GAL4p/GAL80p complex”), we chose to exclude this protein complex from the network. The update protein complex network is illustrated in the revised Figure 2A.

      3) In Figure 5, given that knockdown of TXNIP did not affect the levels and nuclear localization of HDAC2, the authors suggest that TXNIP might modulate HDAC2 activity. However, the ChiP assay suggest a different model - TXNIP-HDAC2 interaction might inhibit the chromatin occupancy of HDAC2, reducing histone deacetylation and increasing global chromatin accessibly. The authors need to propose a model consistent with these sets of all data.

      We greatly appreciate your detailed feedback. Our data indicates a global decrease in chromatin accessibility (Figure 4C-G) and a diminished interaction between TXNIP and HDAC2 under depletion of TXNIP (Figure 5A). Additionally, we observed an increased occupancy of HDAC2 and subsequent histone deacetylation at TXNIP-target promoter regions (Figure 5C) without any changes in the HDAC2 expression level (Figure 5A) in TXNIP- knockdown cells. From these observations, we infer that the interaction between TXNIP-HDAC2 might suppress the function of HDAC2, a major gene silencer affecting the formation of condensed or accessible chromatin by deacetylating activity. Although we checked whether TXNIP could induce cytosolic retention of HDAC2 to inhibit nuclear function of HDAC2, TNXIP knockdown did not alter its subcellular localization (Figure 5B).

      To elucidate the mechanism by which TXNIP inhibits the function of HDAC2, we further investigated the effect of TXNIP on the levels of HDAC2 phosphorylation, which is known to be crucial for its deacetylase activity and the formation of transcriptional repressive complex. However, as shown in the Figure S8C and D, the knockdown of TXNIP did not affect the HDAC2 phosphorylation status, as well as the interaction between HDAC2 and other components in NuRD complex in the immunoblotting and co-IP assays, respectively. The results suggest that TXNIP may inhibit the function of HDAC2 independently of these factors.

      Following the reviewer’s suggestion, we carefully provided a proposed model describing the possible role of TXNIP in transcriptional regulation through interaction with HDAC2 and co-repressor complex in Figure S8E.

      Description of these newly added figures can be found in the revised manuscript from page 18 line 7 to 27, as outlined below.

      “HDAC2 typically operates within the mammalian nucleus as part of co-repressor complexes as it lacks ability to bind to DNA directly (Hassig, Fleischer, Billin, Schreiber, & Ayer, 1997). The nucleosome remodeling and deacetylation (NuRD) complex is one of the well-recognized co-repressor complexes that contains HDAC2 (Kelly & Cowley, 2013; Seto & Yoshida, 2014) and we sought to determine if depletion of TXNIP affects interaction between HDAC2 and other components in this NuRD complex. While HDAC2 interacted with MBD3 and MTA1 under normal condition, the interaction between HDAC2 and MBD3 or MTA1 was not affected upon TXNIP depletion (Figure S8C). Next, given that HDAC2 phosphorylation is known to influence its enzymatic activity and stability (Adenuga & Rahman, 2010; Adenuga, Yao, March, Seagrave, & Rahman, 2009; Bahl & Seto, 2021; Tsai & Seto, 2002), we tested if TXNIP depletion alters phosphorylation status of HDAC2. The result indicated, however, that phosphorylation status of HDAC2 does not change upon TXNIP depletion (Figure S8D). In summary, our findings suggest a model where TXNIP plays a role in transcriptional regulation independent of these factors (Figure S8E). When TXNIP is present, it directly interacts with HDAC2, a key component of transcriptional co-repressor complex. This interaction suppresses the HDAC2 ‘s recruitment to target genomic regions, leading to the histone acetylation of target loci possibly through active complex including histone acetyltransferase (HAT). As a result, transcriptional activation of target gene occurs. In contrast, when TXNIP expression is diminished, the interaction between TXNIP and HDAC2 weakens. This restores histone deacetylating activity of HDAC2 in the co-repressor complex, leading to subsequent repression of target gene transcription.”

      4) The authors showed that ectopic expression of ARRDC5 increased osteoclast differentiation and function. Does loss of ARDDC5 lead to defects in osteoclast function and fate determination?

      We appreciate your valuable comment. We have confirmed the endogenous expression of ARRDC5 in osteoclasts and conducted a loss-of-function study using shARRDC5. As determined by qPCR, ARRDC5 was endogenously expressed very low in osteoclasts. Even during RANKL-induced osteoclast differentiation, the CT value (29-31) for ARRDC5 expression was high in osteoclasts compared to the CT value (17-24) for the expression of marker genes Cathepsin K, TRAP, and NFATc1. Even though its endogenous expression was very low, we generated ARRDC5 knockdown cells by infecting BMMs with lentivirus expressing shRNA of ARRDC5 and subsequently differentiated the cells into mature osteoclasts. After five days of differentiation, we observed a significant decrease in the total number of TRAP-positive multinucleated cells (No. of TRAP+ MNCs) in shARRDC5 cells compared to that in the control cells. This result indicates that the loss of ARRDC5 leads to defects in osteoclast differentiation. Result of this loss-of-function study using shARRDC5 is depicted in Figure S9A and B.

      In the revised manuscript, following sentence explaining Figure S9A and B was added on page 19 lines 15-17 as follows.

      “Depletion of ARRDC5 using short hairpin RNA (shRNA) impaired osteoclast differentiation, further affirming its crucial role in this differentiation process (Figure S9A and B).”

      5) From Figure 6D, the authors argued that ARRDC5 overexpression resulted in more V-ATPase signals: however, there is no quantification. Quantification of the confocal images will foster the conclusion. Also, western blots for V-ATPase proteins will provide an alternative way to determine the effects of ARRDC5.

      We appreciate your insightful feedback. As suggested by the reviewer, we quantified V-type ATPase signals using confocal images, which were shown in Figure 6D. The ImageJ program was employed for integrated density measurements, and the integrated density of GFP-GFP overexpressing osteoclasts was set to 1 for relative comparison. The result in the revised Figure 6D revealed a significant increase in V-type ATPase signals in GFP-ARRDC5 overexpressing osteoclasts compared to that in GFP-GFP overexpressing osteoclasts, as outlined below.

      We also agree with the reviewer’s comment that Western blot for V-ATPase proteins will be an alternative way to determine the effects of ARRDC5 in osteoclast differentiation. We have confirmed no different expression of V-type ATPase between GFP-GFP and GFP-ARRDC5 overexpressing osteoclasts using qPCR and western blot analysis. The corresponding western blot result is shown in the revised Figure S9C.

      In addition, the corresponding qPCR that measures the expression level of V-type ATPase between GFP-GFP and GFP-ARRDC5 overexpressing osteoclasts is shown in Author response image 3.

      Author response image 3.

      Moreover, based on the references, the V-type ATPase is localized at the plasma membrane during osteoclast differentiation (Toyomura et al., 2003). Although mRNA and protein expression levels were similar in both cells, localization of V-ATPase in plasma membrane was significantly increased in GFP-ARRDC5 overexpressing osteoclasts compared to that in GFP-GFP osteoclasts, as shown in the revised Figure 6D above.

      6) The results from Figure 6D did not support the authors' argument that ARRDC5 might control the membrane localization of the V-ATPase, as bafilomycin is the V-ATPase inhibitor. ARRDC5 knockdown experiments will help to determine whether ARRDC5 can control the membrane localization of the V-ATPase in osteoclast.

      Thank you for your insightful comment. V-type ATPase has been reported to play an important role in the differentiation and function of osteoclasts (Feng et al., 2009; Qin et al., 2012). Given that various subunits of the V-type ATPase interact with ARRDC5 (Figure 6A), we speculated that ARRDC5 might be involved in the function of this complex and play a role in osteoclast differentiation and function. As answered above, GFP-ARRDC5 overexpressing osteoclasts showed a similar expression level of V-type ATPase to GFP-GFP cells but exhibited increased V-type ATPase signals at the cell membrane compared to those in GFP-GFP cells (Figure 6D). Additionally, co-localization of ARRDC5 and V-type ATPase was observed in the osteoclast membrane (Figure 6D), as predicted by the human ARRDC5-centric PPI network. On the other side, bafilomycin A1, a V-type ATPase inhibitor, not only blocked localization of V-type ATPase to plasma membrane in GFP-ARRDC5 overexpressing osteoclasts, but also reduced ARRDC5 signals (Figure 6D). These results indicate that ARRDC5 plays a role in osteoclast differentiation and function by interacting with V-type ATPase and promoting the localization of V-type ATPase to plasma membrane in osteoclasts.

      V-type ATPase present in osteoclast membrane is important to cell fusion, maturation, and function during osteoclast differentiation (Feng et al., 2009; Qin et al., 2012). GFP-ARRDC5 overexpressing osteoclasts showed a significant increase of V-type ATPase signals in the cell membrane compared to GFP-GFP cells (Figure 6D), and also significantly increased cell fusion (No. of TRAP+ MNCs in Figure 6B) and resorption activity (resorption pit formation in Figure 6C). However, ARRDC5 knockdown in osteoclasts (shARRDC5 cells) showed a significant decrease in No. of TRAP+ MNCs compared to that in the control cells, indicating that the loss of ARRDC5 leads to defects in cell fusion during osteoclast differentiation (Figure S9A and B). As described above, the endogenous expression of ARRDC5 was very low in osteoclasts and could be specifically expressed in a certain timepoint during the differentiation. Therefore, to better understand the interaction with V-type ATPase of ARRDC5 in osteoclasts, ARRDC5 overexpression is more suitable than its knockdown.

      Part of the manuscript on page 19 line 21 to page 20 line 6 was edited to support our statement, as outlined below.

      “The V-type ATPase is localized at the osteoclast plasma membrane (Toyomura et al., 2003) and its localization is important for cell fusion, maturation, and function during osteoclast differentiation (Feng et al., 2009; Qin et al., 2012). Furthermore, its localization is disrupted by bafilomycin A1, which is shown to attenuate the transport of the V-type ATPase to the membrane (Matsumoto & Nakanishi-Matsui, 2019). We analyzed changes in the expression level and localization of V-type ATPase, especially V-type ATPase V1 domain subunit (ATP6V1), in GFP-GFP and GFP-ARRDC5 overexpressing osteoclasts. The level of V-type ATPase expression did not change in osteoclasts regardless of ARRDC5 expression levels (Figure S9C). GFP signals were detected at the cell membrane when GFP-ARRDC5 was overexpressed, indicating that ARRDC5 might also localize to the osteoclast plasma membrane (Figure 6D; Figure S9D). In addition, we detected more V-type ATPase signals at the cell membrane in the GFP-ARRDC5 overexpressing osteoclasts, and ARRDC5 and V-type ATPase were co-localized at the osteoclast membrane (Figure 6D; Figure S9D).”

      7) The tables (excel files) do not have proper names for each table S numbers. Please correct the name of excel files for readers.

      We appreciate your valuable comments. In response to the reviewer’s suggestion, we’ve renamed excel files to more appropriate titles for easier readability. List of renamed tables (excel files) are shown below.

      Table S1. List of α-arrestins from human and Drosophila Table S2. Evaluation sets of α-arrestins PPIs Table S3. Summary tables of SAINTexpress results Table S4. Protein domains and short linear motifs in the α-arrestin interactomes Table S5. Enriched Pfam domains in the α-arrestin interactomes Table S6. Subcellular localizations of α-arrestin interactomes Table S7. Summary of protein complexes and cellular components associated with α-arrestin Table S8. Orthologous relationship of α-arrestin interactomes between human and Drosophila Table S9. Summary of ATAC- and RNA-seq read counts before and after processing Table S10. Differential accessibility of ACRs and gene expression Table S11. Summary of ATAC-seq peaks located in promoters and gene expression level Table S12. List of primer sequences used in this study

      8) http://big.hanyang.ac.kr/alphaArrestin_Fly link does not work. Please fix the link.

      We appreciate your comment. In response to the reviewer’s comment, we have made comprehensive α-arrestin interactome maps on our new website (big.hanyang.ac.kr/alphaArrestin_PPIN) and confirmed that users can be re-directed to networks housed in NDEx.

      Author response image 4.

      Screen shot of the first page of the newly developed website.

      Website address: big.hanyang.ac.kr/‌‌‌‌‌‍‍‍‌‌alphaArrestin_PPIN

      Author response image 5.

      Screen shot of the gene-gene network involving α-arrestin in human.

    1. Author Response

      eLife assessment

      This study presents valuable insights into the epigenetic landscape in adult kidney podocytes. A series of solid experiments demonstrate that genes that are regulated by a key kidney transcription factor, Mafb, are essential for H3K4me3 methylation and recruitment of Wt1 to Nphs1 and Nphs2. This new information provides insights into the potential relationship and coordination of transcription factors in regulating target genes in podocytes in glomerular diseases, although the conclusion that MafB is generally required for Wt1 to bind to podocyte-specific promoters is incomplete and should be extended beyond two or three genes.

      We thank the reviewers and editors for critically reading our manuscript and their insightful comments. We will strive to revise

      Reviewer #1 (Public Review):

      Summary:

      In their manuscript, Massa and colleagues provide a map of the epigenetic landscape in podocytes and analyze the role of the transcription factor MafB in podocyte gene expression. They initially map the histone profile in adult podocytes of the mouse by assaying three different histone methylation marks, namely H3K4me3, H3K4me1, and H3K27me3 for active, primed, and repressed states. They then perform Wt1- and MafB-ChIP-Seq analysis to identify respective direct targets of those transcription factors. Subsequently, they employ an inducible MafB knockout model and show that homozygous knockout mice show proteinuria and FSGS, suggesting an important role for MafB in podocyte homeostasis. RNA-Seq analysis in mice two daysafter tamoxifen application identified direct and indirect MafB target genes. Finally, the authors turn to a constitutive MafB knockout model, carry out anti-H3K4me3 and anti-Wt1 ChIP experiments, and examine selected promoters. One main conclusion from this work is that MafB opens chromatin and thus facilitates the binding of other transcription factors like Wt1 to podocyte-specific genes.

      Strengths and weaknesses:

      The authors have performed an impressive number of experiments and generated very valuable data. They use state-of the-art technology and the data are presented well and are sound. This being said the manuscript contains significant novel data, but also experiments that are already available in some sort. The histone profile in adult mouse podocytes is novel and provides an interesting map of epigenetic marks in this particular cell type. It is maybe not too surprising that podocyte-differentiation genes have different chromatin accessibility than genes associated with general development. The Wt1-ChIP has been done before by several labs but is certainly an important control in this work. The MafB-ChIP is new. The inducible MafB knockout model including the identification of Tcf21 as a target gene has been published by others in 2020 (and is acknowledged by the authors). The experiments addressing the potential role of MafB in chromatin opening are new. I find that the data are certainly compatible with the model put forward by the authors, but they are not compelling.

      We agree that additional data on changes in chromatin accessibility in the absence of Mafb would help to support our model and we will be working towards this data for a revised version of the manuscript.

      Reviewer #2 (Public Review):

      Summary:

      The authors investigate the role of MafB in regulating podocyte genes. Mafb is required for podocyte differentiation and maintenance. Mutations of this gene cause FSGS in mice and humans. They profiled MafB binding genome-wide in isolated glomeruli and defined overlap with Wt1. They provide evidence that Mafb is required for Wt1 binding and H3K4me3 methylation at the promoters of two essential podocyte genes, Nphs1 and Nphs2 Understanding how the action of different transcription factors is coordinated to control gene expression - the main goal of this paper - is an important line of investigation.

      While the main conclusion of the paper is supported by their data, the scope is limited. Additional ChIP-seq experiments and data analysis are needed to solidify and extend their conclusions.

      Strengths:

      1) Performing ChIP-seq for histone modifications on isolated podocytes provides valuable cell-type-specific information. Similarly, profiling Mafb and Wt1 in isolated glomeruli provides podocyte-specific binding patterns because these transcription factors (TFs) are not expressed in other cell types in glomeruli. The significant overlap of their Wt1 binding genome-wide withthat of prior published work is reassuring. RNA-seq on isolated podocytes provides the appropriate cell-type specific gene expression data to integrate with ChIP-seq data. Together, the RNA-seq and ChIP-seq data are valuable resources for other investigators examining gene regulation in mouse podocytes.

      2) The phenotype analysis of their FSGS model is convincing and well done.

      3) Testing how Wt1 binding is affected by loss of Mafb provides insight into how these key podocyte TFs may cooperate to regulate genes.

      Weaknesses:

      1) The conclusion that Mafb is required for Wt1 binding and H3K4me3 methylation is based solely on ChIP-PCR at two gene promoters (Nphs1, Nphs2). This result should be validated and extended by ChIP-seq. Mafb and Wt1 binding overlap at more than 200 sites. If their model is correct, it is likely that Wt1 binding would be affected at other genomic sites. This result would add strong support to their model of how Wt1 and Mafb cooperate to regulate genes in podocytes. Moreover, ChIP-seq would define whether the dependence of Wt1 on Mafb is also evident at distal regulatory regions (defined H3K4me1, which is typically found at predicted enhancers).

      We agree that a genome wide analysis of chromatin accessibility would help corroborating our model and will work towards this data for a revised version.

      2) The FSGS model generated by the authors involved conditional deletion of Mafb in podocytes at 8 weeks of age. They found that this resulted in reduced expression of Nphs1 and Nphs2 within 48 hours post-deletion. However, they investigated Wt1 binding and H3K4me3 genomic binding in Mafb homozygous null embryos. While this result provides information about podocyte differentiation, it does not address the maintenance of expression of these essential podocyte genes in the adult kidney. Because post-natal deletion of Mafb led to FSGS and reduced expression of Nphs1/2, ChIP-seq should be performed on the adult conditional mutants in order to provide mechanistic information about the disease.

      The fact that the phenotype in Mafb conditional mutant animals is progressive means that epigenetic changes are also likely to be quantitative. Indeed, Nphs1/Nphs2 are still expressed 6 weeks after Mafb deletion, albeit at lower levels. Since ChIP-seq experiments are not necessarily quantitative, we believe it may be difficult to detect statistically significant changes in this model. We will discuss this limitation of our study in a revised version of our manuscript.

      3) H3K4me1 binds enhancer regions. The authors performed ChIP-seq to profile H3K4me1 in isolated podocytes. However, there was no analysis reported of these results. It would be valuable to determine if Wt1 and Mafb co-localize at predicted enhancers in podocytes and if Wt1 binding is lost at these regions in Mafb mutant glomeruli.

      We well reanalyse the data taking the reviewer’s comments into account.

    1. Author Response

      The following is the authors’ response to the current reviews.

      For the final Version of Record the following changes will be included: 1. Figure 4: Example traces replaced with a more representative simulation run that is more similar to the mean. 2. Methods: Description of the alignment procedure expanded to explain the algorithm steps better.


      The following is the authors’ response to the previous reviews

      We are grateful for the positive and insightful feedback from the editors and reviewers. These constructive comments have contributed to the enhancement of our work. We have revised the manuscript, addressing each of the comments raised. In addition, based on the commentary provided, we have introduced two new figures that offer a deeper understanding of our research findings:

      In new Figure 7, we present the analysis of the difference in onset times between motion and flash responses. This figure also includes a simple illustration elucidating the origins of these differences, highlighting the varying engagement of receptive fields by these stimuli. The data presented in this figure were initially featured in the main text of the original manuscript. Figure 11 offers a detailed comparison of the temporal and spatial characteristics of the synthetic presynaptic signals driving optimal DS in SACs. We compare these characteristics with the properties extracted from recorded glutamate release. Our analysis suggests that the sluggish dynamics observed in biological signals impede effective directional integration. Below are the detailed point-by-point responses to reviewers comments.

      Reviewer #1 (Public Review):

      Summary:

      Direction selectivity (DS) in the visual system is first observed in the radiating dendrites of starburst amacrine cells (SACs). Studies over the last two decades have aimed to understand the mechanisms that underlie these unique properties. Most recently, a 'space-time' model has garnered special attention. This model is based on two fundamental features of the circuit. First, distinct anatomical types of bipolar cells (BCs) are connected to proximal/distal regions of each of the SAC dendritic sectors (Kim et al., 2014). Second, that input across the length of the starburst is kinetically diverse, a hypothesis that has been only recently demonstrated experimentally using iGluSnFR imaging (Srivastava et al., 2022). However, the stark kinetic distinctions, i.e., the sustained/transient nature of BC input to SACs dendrites appear to be present mainly in responses to stationary stimuli. When BC receptive field properties are probed using white noise stimuli, the kinetic differences between BCs are relatively subtle or nonexistent (Gaynes et al., 2022; Strauss et al., 2022, Srivastava et al., 2022). Thus, if and how BCs contribute to direction selectivity driven by moving spots that are commonly used to probe the circuit remains to be clarified. To address this issue, Gaynes et al., combine evolutionary computational modeling (Ankri et al., 2020) with two-photon iGluSnFR imaging to address to what degree BCs contribute to the generation of direction selectivity in the starburst dendrites in response to stimuli that are commonly used experimentally.

      Strengths:

      Combining theoretical models and iGluSnFR imaging is a powerful approach as it first provides a basic intuition on what is required for the generation of robust DS, and then tests the extent to which the experimentally measured BC output meets these requirements.

      The conclusion of this study builds on the previous literature and comprehensively considers the diverse BC receptive field properties that may contribute to DS (e.g. size, lag, rise time, decay time).

      By 'evolving' bipolar inputs to produce robust DS in a model network, these authors provide a sound framework for understanding which kinetic properties could potentially be important for driving downstream DS. They suggest that response delay/decay kinetics, rather than the center/surround dynamics are likely to be most relevant (albeit the latter could generate asymmetric responses to radiating/looming stimuli).

      Weaknesses:

      Finally, these authors report that the experimentally measured BC responses are far from optimal for generating DS. Thus, the BC-based DS mechanism does not appear to explain the robust DS observed experimentally (even with mutual inhibition blocked). Nevertheless, I feel the comprehensive description of BC kinetics and the solid assessment of the extent to which they may shape DS in SAC dendrites, is a significant advancement in the field.

      Reviewer #2 (Public Review):

      Summary:

      In this study, the authors sought to understand how the receptive fields of bipolar cells contribute to direction selectivity in starburst amacrine cell (SAC) dendrites, their post synaptic partners. In previous literature, this contribution is primarily conceptualized as the 'space-time wiring model', whereby bipolar cells with slow-release kinetics synapse onto proximal dendrites while bipolar cells with faster kinetics synapse more distally, leading to maximal summation of the slow proximal and fast distal depolarizations in response to motion away from the soma. The space-time wiring contribution to SAC direction selectivity has been extensively tested in previous literature using connectomic, functional, and modeling approaches. However, the authors argue that previous functional studies of bipolar cell kinetics have focused on static stimuli, which may not accurately represent the spatiotemporal properties of the bipolar cell receptive field in response to movement. Moreover, this group and others have recently shown that bipolar cell signal processing can change directionally when visual stimuli starts within the receptive field rather than passing through it, complicating the interpretation of moving stimuli that start within a bipolar cell of interest's receptive field (e.g. stimulating only one branch of a SAC or expanding/contracting rings). Thus, the authors choose to focus on modeling and functionally mapping bipolar cell kinetics in response to moving stimuli across the entire SAC dendritic field.

      General Comments

      There have been several studies that have addressed the contribution of space-time wiring to SAC process direction selectivity. The impact of this project is to show that this contribution is limited. First, the optimal solution obtained by the evolutionary algorithm to generate DS processes is slow proximal and fast distal inputs - exactly what is predicted by space-time wiring, which is exactly what is required of the HRC model. Hence, this result seems expected and it's not clear what the alternative hypothesis is. Second, the experimental results based on glutamate imaging to assess the kinetics of glutamate release under conditions of visual stimulation across a large region of retina confirm previous observations but were important to test. Third, by combining their model model with this experiment data, they conclude that even the optimal space-time wiring is not sufficient to explain the SAC process DS. The results of this approach might be more impactful if the authors come to some conclusion as to what factors do determine the direction selectivity of the SAC process since they have argued that all the current models are not sufficient.

      Reviewer #3 (Public Review):

      Gaynes et al. investigated the presynaptic and postsynaptic mechanisms of starburst amacrine cell (SAC) direction selectivity in the mouse retina by computational modeling and glutamate sensitivity (iGluSnFR) imaging methods. Using the SAC computational simulation, the authors initially tested bipolar cell contributions (space-time wiring model, presynaptic effect) and SAC axial resistance contributions (postsynaptic effect) to the SAC DS. Then, the authors conducted two-photon iGluSnFR imaging from SACs to examine the presynaptic glutamate release, and found seven clusters of ON-responding and six clusters of OFF-responding bipolar cells. They were categorized based on their response kinetics: delay, onset phase, decay time, and others. Finally, the authors generated a model consisting of multiple clusters of bipolar cells on proximal and distal SAC dendrites. When the SAC DS was measured using this model, they found that the space-time wiring model accounted for only a fraction of SAC DS.

      The article has many interesting findings, and the data presentation is superb. Strengths and weaknesses are summarized below.

      Major Strengths:

      • The authors utilized solid technology to conduct computational modeling with Neuron software and a machine-learning approach based on evolutionary algorithms. Results are effectively and thoroughly presented.

      • The space-time wiring model was evaluated by changing bipolar cell response properties in the proximal and distal SAC dendrites. Many response parameters in bipolar cells are compared, and DSI was compared in Figure 3.

      • Two-photon microscopy was used to measure the bipolar cell glutamate outputs onto SACs by conducting iGluSnFR imaging. All the data sets, including images and transients, are elegantly presented. The authors analyzed the response based on various parameters, which generated more than several response clusters. The clustering is convincing.

      Major Weaknesses:

      • In Figure 9, the authors generated the bipolar cell cluster alignment based on the space-time wiring model. The space-time wiring model has been proposed based on the EM study that distinct types of bipolar cells synapse on distinct parts of SAC dendrites (Green et al 2016, Kim et al 2014). While this is one of the representative Reicardt models, it is not fully agreed upon in the field (see Stincic et al 2016). While the authors' approach of testing the space-time wiring model and conclusions is interesting and appreciated, the authors could address more issues: mainly two clusters were used to generate the model, but more numbers of clusters should be applied. Although the location of each cluster on the SAC dendrites is unknown, the authors should know the populations of clusters by iGluSnFR experiments. Furthermore, the authors could provide more suggestive mechanisms after declining postsynaptic factors and the space-time wiring model.

      The reviewer is correct that the proximal and more distal SAC dendrites sample from different IPL depths. It should be theoretically possible to match the functional clusters we measured with anatomical bipolar cell identities. However, the stratifications of these cells have significant overlaps (Figure 6-S2), and previous attempts to match iGluSnFR signals to anatomy proved to be challenging (Franke et al., 2017; Gaynes et al., 2022; Matsumoto et al., 2019; Srivastava et al., 2022; Strauss et al., 2022). In the revised version of the manuscript, we reorder the functional clusters based on their transiency, which has a higher correlation to stratification depth (Franke et al., 2017).

      We have examined a scenario in which the presynaptic population comprises more than two clusters. We constructed synthetic models whose input structure was as in Figure 10 (old Figure 9). The optimal configuration for the most proximal and distal inputs closely resembled the proximal-distal model reported in Figure 2. However, we observed a nearly linear variation in the shape of the optimal mid-range inputs, transitioning from proximal-like to distal-like responses as the distance increased. We consider this outcome to be expected based on the structure of the space-time wiring model (Kim et al., 2014). Interestingly, this was not the case with models incorporating physiologically recorded signals. As we show in Figure 10, the most common optimal directional tuning was seen when the bipolar drive consisted of two main populations, both in the ON and OFF SACs.

      Finally, we believe that uncovering additional mechanisms that underlie directional selectivity in SACs represents a crucial challenge for the field to tackle. It is highly probable that achieving directional selectivity involves a complex interplay of multiple factors. This includes the organization of the presynaptic circuit, which we have partially addressed in this study, as well as the influence of postsynaptic active conductances and feedback loops involving other SACs and presynaptic cells. We have expanded the discussion section to describe the possible mechanisms

      • The computational modeling demonstrates intriguing results: SAC dendritic morphology produces dendritic isolation, and a massive input overcomes the dendritic isolation (Figure 1). This modeling seems to be generated by basic dendritic cable properties. However, it has been reported that SAC dendrites express Kv3 and voltage-gated Ca channels. It seems to be that these channels are not incorporated in this model.

      The reviewer's observation is accurate; the model depicted in Figure 1 did not include voltage-gated channels. Our goal was to study electrotonic isolation, which is often measured in passive models. However, while we did not incorporate voltage-gated potassium channels implicitly in the models, our simulations are rooted in previous models that were fine-tuned using empirical data. As potassium channels are expected to influence the experimentally recorded input resistance, we have indirectly accounted for their impact on the interdendritic signal propagation.

      In subsequent model iterations, we have integrated voltage-gated calcium channels into our simulations to assess the signal responsible for driving synaptic release. We show that nonlinear voltage dependence of the calcium currents enhances compartmentalization of the local calcium levels (Figure 2), but did not significantly influence local voltages. Therefore, calcium channels do not appear to have a major impact on electrotonic distances.

      • In Figure 5B, representative traces are shown responding to moving bars in horizontal directions. These did not show different responses to two directional stimuli. It is unclear whether directional preference was not detected, which was shown by Yonehara's group recently (Matsumoto et al 2021). Or that was not investigated as described in the Discussion.

      Indeed, we observed no discernible directional differences in bipolar responses. This phenomenon can be primarily attributed to the fact that the signals originating from the limited number of directionally-tuned release sites are overshadowed by the release from non-directionally-tuned units (Matsumoto et al., 2021). In the revised discussion, we have acknowledged this limitation in our recorded data.

      • The authors found seven ON clusters and six OFF clusters, which are supposed to be bipolar cell terminals. However, bipolar cells reported to provide synaptic inputs are T-7, T-6, and multiple T-5s for ON SACs and T-1, T-2, and T-3s for OFF SACs. The number of types is less than the number of clusters. Potentially, clusters might belong to glutamatergic amacrine cells. These points are not fully discussed.

      We have expanded the discussion section to address these points.

      Reviewer #1 (Recommendations For The Authors):

      Major comments

      1. One of the main conclusions of this study is that diverse BC kinetics contribute to DS (Fig. 9). The authors nicely demonstrate using modeling that the experimentally measured BC kinetics are far from ideal. However, this conclusion is based on a model that almost exclusively relies on just two of the 7 putative BC types (e.g., C1 & C6 for On SACs) placed optimally along the dendrites, which raises two important caveats.

      First, given that other BC types are likely to contribute, the effects of two distinct types are likely to be diluted. Thus, the contribution of BCs to DS is likely to be significantly overestimated. Second, given that the dendrites of 10-30 SACs cross each point in the honeycomb, for the given model to work, each BC would need to connect extremely selectively to SACs. i.e., at a given point, a sustained input must only connect to the more proximal dendritic segments, while avoiding entirely the distal segments of overlapping SAC dendrites. Thus, their model requires extremely selective wiring for which there is no evidence. In fact, there is evidence to the contrary provided by Ding et al. 2016, which showed that the type 7 (proximally biased) and type 5 (distally biased) populations had a substantial overlap (assuming these BC types correspond to kinetically diverse clusters).

      We wholeheartedly concur with the reviewer's perspective that our findings have led to an overestimation of the space-time wiring mechanism's role in SAC directional selectivity (DS). We have adjusted our discussion to emphasize this point. In light of this, our assertion that, even with the most favorable distribution of synaptic inputs, the space-time wiring model still does not fully account for the experimentally-determined directional tuning in SAC, remains valid.

      With regard to the model, it would also be worth comparing results to previous starburst models (e.g., Tukker et al,. 2004), which demonstrated a robust DS in SAC dendrites in the absence of kinetically diverse BC input. Why is the cell-intrinsic DS so weak in the present model?

      We have directly explored this question in the synthetic model (Figures 2, 3). Despite variances in the anatomy of SACs and the distribution of bipolar inputs between our model and the study by (Tukker et al., 2004), we observed remarkably similar levels of directional selectivity index computed from the voltage response (approximately 10%, as shown in Figure 3, 'Identical BCs').

      The primary distinction emerged in the degree of DS amplification mediated by calcium currents. Tukker et al., 2004 reported considerably higher DS compared to our findings, despite employing similar formulations for voltage-gated calcium channel models. The key factor driving this difference lies in the fact that Tukker et al., 2004 measured amplification in proximity to the threshold of calcium channel activation. Even minor variations in membrane potentials near this threshold can lead to substantial differences in calcium influx, especially when outward stimulation results in a calcium spike. In fact, recently, Robert Smith’s group revisited the threshold-based mechanism and concluded that it often fails to produce robust DS due to the heterogeneity of membrane potentials among different terminal dendrites (Wu et al., 2023).

      Our models were trained on five different stimuli velocities whose synaptic integration produced substantially different peak amplitudes. Consequently, the spike threshold alone couldn't reliably distinguish between inward and outward directions across all five conditions, resulting in reduced directional performance in our simulations. In the revised Figure 2-S2 we directly explore the performance of the model with identical BC formulations, trained on a single velocity. We find a dramatic enhancement of calcium DS (DSI=66%) in this condition compared to an identical model trained on 5 velocities (DSI=17%). Thus, evolutionary search is capable of finding the threshold-based solution, but only when the training is performed on a single stimulus velocity (Figure 2-S2). This solution did not generalize to multiple stimuli speeds because, as mentioned above, they lead to different postsynaptic depolarization levels (Figure 2, 2-S1). Instead, the algorithm converged on a set of postsynaptic paraments leading to less nonlinear calcium channel activation over a broader voltage range, ensuring effective DS performance over multiple velocities and heterogenous local potentials (Wu et al., 2023).

      1. Functionally distinct responses across different regions of interest (ROIs) were used to classify BC input. ROIs were obtained from multiple scan fields and retinas and combined into a single dataset for functional clustering. However, the consistency of the cluster distribution across these replicates has not been addressed. As BCs can exhibit different functional properties dependant on the state/health of the retina, it is important to know whether certain functional clusters may originate disproportionately from a particular experiment, as it implies that each cluster does not represent a different stable functional/anatomical population.

      We acknowledge that the state of the preparation can significantly impact signal dynamics. In response to this important consideration, we have incorporated details about the distribution of functional clusters in various experiments in the revised version of the manuscript (Figure 6-S1, and discussion).

      Other comments:

      1. Interpreting iGluSnFR signals: Since the sensor is expressed uniformly across the SAC dendrite, it is important to clarify why the measured F signals are considered synaptic responses. Could spillover contribute to the generation of slower responses?

      We do not believe spillover can explain slower responses because the sluggish clusters often responded significantly (up to 500ms) sooner to moving bars (Figures 6, 6-S3). We acknowledge and discuss this possibility of spillover in the revised discussion.

      1. One striking finding is the diversity of BCs RF sizes (Fig. 7C). Some BCs have RF that are far larger than their dendritic fields. It will be useful to discuss the potential mechanisms that may underlie large BC RFs.

      We changed the discussion to address this question.

      1. SAC DS is independent of dendritic isolation: The authors claim that dendritic isolation does not significantly impact DS. However, while this might be true for a linear motion through the receptive field, dendritic isolation probably matters for more dynamic stimuli. For example, DSGCs can encode rapid changes in objection direction, as DS is computed over fine spatiotemporal scales relying on SACs (Murphy-Baum et al., 2022). This could not occur if SAC dendrites were not well electrically isolated from each other.

      We believe that this is an accurate interpretation of our findings. Our research suggests that dendritic isolation is likely not a critical factor in the space-time wiring mechanism. However, as we demonstrate that this particular mechanism cannot fully account for the observed levels of DS in SACs, other mechanisms must be important. As previous studies revealed that dendritic isolation enhances SAC DS (for example, Koren et al., 2017), dendritic independence likely contributes to directional performance within SACs by these additional mechanisms.

      1. Figure 4: From what I understand, the BC inputs for the electrotonic connectivity variations evolved much like they were for the original model without axial resistance constraints. This makes sense, since stronger/weaker inputs with different temporal kernels may be appropriate for each condition, hence why the axial resistance wasn't changed post-evolution, which would have likely caused the DS to drop. If that is the case, however, I wonder how the best DS attainable by the final model which is constrained to the radial arrangement of realistic BC inputs (without being able to fit much more optimal sustained-transient BCs to their circumstance) would be impacted. Is dendritic isolation similarly unimportant when the pre-synaptic story isn't ideal?

      We have explored this question directly by allowing the evolutionary algorithm to modify the passive and active characteristics of the postsynaptic SAC. Our findings are summarized in Figure 9-S1. We observed a correlation between DSI levels and membrane/axial resistance values in SACs in the evolved models. Better DS was seen with leaky membranes (higher isolation) and lower axial resistance (lower isolation). While it is clear that postsynaptic parameters can influence synaptic integration, they can not fully compensate for inadequate presynaptic dynamics.

      1. BC are shown to contribute to DS across velocities (Fig. 9), which contrasts with results from Srivastava et al., (2022) that showed BCs contribute to DS at lower velocities. However, this discrepancy can easily be explained by the choice of moving spots. In this study, the sweeping bars had dynamic width (targeting pixel dwell time of 2s), which means for higher velocities the bar is significantly wider. While in the previous study, the width of the stimulus was kept constant, and thus for higher velocities, the sustained/transient kinetic differences of BCs are less clear (Srivastava et al., 2021). The author's should discuss this explicitly, to avoid discrepancies between these two studies the reader might otherwise perceive.

      We value reveiwer’s feedback, and in response, we have included an additional paragraph in the manuscript addressing the distinctions in directional tuning that arise from the space-time model presented in this work, in comparison to earlier studies.

      1. Methods: It will be good to discuss how ROIs sizes and positions were selected (pixel correlations?)

      We have included a more detailed explanation of the clustering procedure

      • Lines 614 describe whole-cell patch clamp techniques, which are not used in this study.

      We used patch-clamp to record the waveforms shown in Figure 2-S2

      1. Figure 6: Diversity of Glut responses to motion in ON and OFF SACs, caption typos?

      2. "Left:" without "Right:" to describe the population (I presume) viewed as an image

      3. If there should still be A,C and B,D to group the ON and OFF halves, maybe it should be mentioned in the caption

      Thank you for bringing this to our attention, the legends were fixed.

      References:

      Kim, J. S., Greene, M. J., Zlateski, A., Lee, K., Richardson, M., Turaga, S. C., Purcaro, M., Balkam, M., Robinson, A., Behabadi, B. F., Campos, M., Denk, W., Seung, H. S., & EyeWirers (2014). Space-time wiring specificity supports direction selectivity in the retina. Nature, 509(7500), 331-336. https://doi.org/10.1038/nature13240

      Gaynes, J. A., Budoff, S. A., Grybko, M. J., Hunt, J. B., & Poleg-Polsky, A. (2022). Classical center-surround receptive fields facilitate novel object detection in retinal bipolar cells. Nature communications, 13(1), 5575. https://doi.org/10.1038/s41467-022-32761-8

      Murphy-Baum B. and Awatramani GB (2022). Parallel processing in active dendrites during periods of intense spiking activity, Cell Reports, Volume 38, Issue 8,

      Srivastava P, de Rosenroll G., MatsumotoA., Michaels T., Turple Z., Jain V, Sethuramanujam S, Murphy-Baum B, Yonehara K., Awatramani, G.B. (2022) Spatiotemporal properties of glutamate input support direction selectivity in the dendrites of retinal starburst amacrine cells eLife 11:e81533

      Strauss, S., Korympidou, M. M., Ran, Y., Franke, K., Schubert, T., Baden, T., Berens, P., Euler, T., & Vlasits, A. L. (2022). Center-surround interactions underlie bipolar cell motion sensitivity in the mouse retina. Nature communications, 13(1), 5574. https://doi.org/10.1038/s41467-022-32762-7

      Tukker, J. J., Taylor, W. R., & Smith, R. G. (2004). Direction selectivity in a model of the starburst amacrine cell. Visual neuroscience, 21(4), 611-625. https://doi.org/10.1017/S0952523804214109

      Reviewer #2 (Recommendations For The Authors):

      Specific comments

      1. Line 223. The statement a model trained on only optimal DSI would produce "negligible absolute differences in calcium levels." is unclear. This needs to be better explained.

      We have modified and expanded this paragraph to make it more clear

      1. Figure 4. The authors use this model to test the hypothesis that space time wiring contribution to SAC process DS requires dendritic isolation. They do this by increasing axial resistance around the soma of their model neuron to isolate each dendrite. They found comparable DS was achieved in both conditions, indicating that the space-time wiring model works in two cases of high and low dendritic isolation. However, to test the claim that "specific details of postsynaptic integration appear to play a lesser role" (line 274) the authors may consider allowing the axial resistance to change as a part of the model rather than testing two extreme states.

      Membrane and axial resistances (and active parameters) were allowed to change as part of model evolution in most simulations presented in this manuscript. We have added the information on the final resistance values reached in the evolved models in Figure 9-S1

      1. Figure 6: To study glutamatergic input onto SACs, the authors expressed iGLuSnFR in ChAT-Cre mice and grouped similarly responding pixels into ROIs and separated these responses into functional groups based on cluster analysis (Figure 5). The alignment of the responses in Figure 6A was confusing. It appears that average responses for each cluster are aligned based on the peak observed during the stimulus in each direction, but it is unclear how they are aligned relative to each other or what this timing is relative to location of the stimulus (i.e. what is time 0 in 6A?).

      The displayed traces represent the average responses to horizontally moving bars (speed = 0.5mm/s), either moving to the left or right. To achieve this alignment, we employed a procedure consistent with our recent publication (Gaynes et al., 2022), which we have now detailed more comprehensively. Here's the step-by-step process we followed:

      1. Determination of half-maximum rise times: Initially, we calculated the half-maximum rise times for glutamate signals recorded in response to left and right-moving stimuli.

      2. Calculation of mean rise time: We then computed the mean of these rise times, which served as a reference point for alignment.

      3. Alignment procedure: To illustrate the alignment process, consider an example. Suppose the 50% rise time for responses to left-moving stimuli occurs at 3 seconds, while responses to right-moving stimuli occur 4 seconds after stimulation onset. This discrepancy suggests that the RF of the cell is shifted to the right from the center of the display (assuming a stimulation speed of 0.5mm/s on the retina, the RF's position would be approximately 250μm from the midline). To align these responses, we shifted both waveforms by 500ms so that their 50% rise times coincided at 3.5 seconds. Importantly, 3.5 seconds would represent the 50% rise time of the ROI if it were precisely centered on the display. This alignment effectively removed any spatial position dependence from the ROIs.

      4. Comparative analysis and clustering: With the responses now aligned, we were able to compare their shapes and subsequently cluster the ROIs into distinct functional clusters. For clarity, we opted to highlight the time of response peak for cluster 1. Although this peak closely aligned with the calculated time of stimulus motion over the center of the 'shifted RF' in the adjusted time frame, it provided a more straightforward comparison between response dynamics.

      1. The authors need to do a better job explaining how their results differ from Ezra-Tsur et al 2021, which uses the same sort of model to address the same question. The discussion about this study (lines 425-435) are based on how a more constrained version of these models work better but they do not directly address the difference in conclusion with regards to mechanisms that contribute to SAC process direction selectivity.

      We have expanded the discussion related to mechanisms that contribute to DS in SACs and discuss the differences between our studies.

      Minor point: The authors use the word "probe" to refer to visual stimulus. This is confusing because "probe" is also used to refer to sensors.

      In the revised manuscript, we minimized the usage of ‘probe’ to reference visual stimuli

      Reviewer #3 (Recommendations For The Authors):

      Writing and figure presentations are excellent.

      Thank you!

      References:

      Franke, K., Berens, P., Schubert, T., Bethge, M., Euler, T., & Baden, T. (2017). Inhibition decorrelates visual feature representations in the inner retina. Nature, 542(7642), 439-444. https://doi.org/10.1038/nature21394

      Gaynes, J. A., Budoff, S. A., Grybko, M. J., Hunt, J. B., & Poleg-Polsky, A. (2022). Classical Center-Surround Receptive Fields Facilitate Novel Object Detection in Retinal Bipolar Cells. Nat Commun, 13(1), 5575. https://doi.org/https://doi.org/10.1038/s41467-022-32761-8

      Kim, J. S., Greene, M. J., Zlateski, A., Lee, K., Richardson, M., Turaga, S. C., Purcaro, M., Balkam, M., Robinson, A., Behabadi, B. F., Campos, M., Denk, W., Seung, H. S., & EyeWirers. (2014). Space-time wiring specificity supports direction selectivity in the retina. Nature, 509(7500), 331-336. https://doi.org/10.1038/nature13240

      Matsumoto, A., Agbariah, W., Nolte, S. S., Andrawos, R., Levi, H., Sabbah, S., & Yonehara, K. (2021). Direction selectivity in retinal bipolar cell axon terminals. Neuron. https://doi.org/10.1016/j.neuron.2021.07.008

      Matsumoto, A., Briggman, K. L., & Yonehara, K. (2019). Spatiotemporally Asymmetric Excitation Supports Mammalian Retinal Motion Sensitivity. Curr Biol. https://doi.org/10.1016/j.cub.2019.08.048

      Srivastava, P., de Rosenroll, G., Matsumoto, A., Michaels, T., Turple, Z., Jain, V., Sethuramanujam, S., Murphy-Baum, B. L., Yonehara, K., & Awatramani, G. B. (2022). Spatiotemporal properties of glutamate input support direction selectivity in the dendrites of retinal starburst amacrine cells. Elife, 11. https://doi.org/10.7554/eLife.81533

      Strauss, S., Korympidou, M. M., Ran, Y., Franke, K., Schubert, T., Baden, T., Berens, P., Euler, T., & Vlasits, A. L. (2022). Center-surround interactions underlie bipolar cell motion sensing in the mouse retina. Nat Commun, 13(1), 5574. https://doi.org/https://doi.org/10.1038/s41467-022-32762-7

      Tukker, J. J., Taylor, W. R., & Smith, R. G. (2004). Direction selectivity in a model of the starburst amacrine cell. Vis Neurosci, 21(4), 611-625. http://www.ncbi.nlm.nih.gov/entrez/query.fcgi?cmd=Retrieve&db=PubMed&dopt=Citation&list_uids=15579224

      Wu, J., Kim, Y. J., Dacey, D. M., Troy, J. B., & Smith, R. G. (2023). Two mechanisms for direction selectivity in a model of the primate starburst amacrine cell. Vis Neurosci, 40, E003. https://doi.org/10.1017/S0952523823000019

    1. Author Response

      The following is the authors’ response to the original reviews.

      Public Reviews:

      Reviewer #1 (Public Review):

      The authors sought to understand the neurocomputational mechanisms of how acute stress impacts human effortful prosocial behavior. Functional neuroimaging during an effort-based decision task and computational modeling were employed. Two major results are reported: 1) Compared to controls, participants who experienced acute stress were less willing to exert effort for others, with a more prominent effect for those who were more selfish; 2) More stressed participants exhibited an increase in activation in the dorsal anterior cingulate cortex and anterior insula that are critical for self-benefiting behaviour. The authors conclude that their findings have important insights into how acute stress affects prosociality and its associated neural mechanisms.

      Overall, there are several strengths in this well-written manuscript. The experimental design along with acute stress induction procedures were well controlled, the data analyses were reasonable and informative, and the results from the computational modeling provide important insights (e.g., subjective values). Despite these strengths, there were some weaknesses regarding potential confounding factors in both the experimental design and methodological approach, including selective reporting of only some aspects of this complex dataset, and the interpretation of the observations. These detract from from the overall impact of the manuscript. In particular, the stress manipulation and pro-social task are both effortful, raising the possibility that stressed participants were more fatigued. Other concerns include the opportunity for social dynamics or cues during task administration, the baseline social value orientation (SVO) in each group, and the possibility of a different SVO in individuals with selfish tendencies. Finally, Figure 4 should specify whether the depicted prosocial choices include all five levels of effort.

      We thank the reviewer for their comments and suggestions. In our response to the recommendations for the author below, we have dealt with the reviewer’s concerns: - we added additional analysis on the role of fatigue and block effects to the supplementary materials. - we provided further information about the role of social cues and dynamics during task administration. - we showed there were no baseline group differences in SVO angle. - we clarified that Figure 4 refers to the proportion of prosocial choices across all effort levels.

      Reviewer #2 (Public Review):

      This manuscript describes an interesting study assessing the impact of acute stress on neural activity and helping behavior in young, healthy men. Strengths of the study include a combination of neuroimaging and psychoneuroendocrine measures, as well as computational modeling of prosocial behavior. Weaknesses include complex, difficult to understand 3-way interactions that the sample size may not be large enough to reliably test. Nonetheless, the study and results provide useful information for researchers seeking to better understand the influence of stress on the neural bases of complex behavior.

      The stressor was effective at eliciting physiological and psychological stress responses as shown in Figure 2.

      Higher perceived stress in more selfish participants (lower social value orientation (SVO) angle) was associated with lower prosocial responding (Figure 4). How can we reconcile this finding with the finding (presented on page 15) that those with a more prosocial SVO showed a significant decline in dACC activation to subjective value at increasing levels of perceived stress? This seems contrary to the behavioral response.

      A larger issue with the study is that the power analysis presented on page 23 is based on a 2 (between: stress v. control) by 2 (within: self v. other) design. Most of the reported findings come from analyses of 3-way interactions. How can the readers have confidence in the reliability of results from 3-way interaction analyses, which were not powered to detect such effects?

      We thank the reviewer for their comments and suggestions. When considering the influence of dACC activation on the behavioural response (i.e., proportion of prosocial choices), it is important to consider the difference in activation to SVself relative to SVother: - The difference in activation to SVself relative to SVother negatively predicted the proportion of prosocial choices, so more activation to SVself relative to SVother predicted a lower proportion of prosocial choices. - Similarly, SVO angle negatively predicted the difference in activation to SVself relative to SVother, so more activation to SVself relative to SVother was related to a lower (more individualistic) SVO angle (this is shown by the interaction between Recipient and SVO angle in Figure 4; right panel). In both cases, differences in prosociality (i.e. SVO angle or the proportion of prosocial choices) were related to differences in dACC activation to SVself relative to SVother.

      Thus, we agree the finding that those participants with a more prosocial SVO showed a significant decline in dACC activation to SV overall (across SVself and SVother) at increasing levels of perceived stress is difficult to interpret. We expected a three-way interaction between Recipient, SVO angle and Perceived Stress to mirror the behavioural results, rather than a two-way interaction between SVO angle and Perceived Stress. We have now acknowledged this in the Discussion, whilst also highlighting the work of Schulreich et al. (2022) who report a related finding.

      We have now added the following section to the results:

      “When linking activation difference in dACC and AI to behaviour, we found that – independent of the stress manipulation – the difference in activation between SVself and SVother in the dACC predicted the proportion of prosocial choices. Thus, greater activation to SVself relative to SVother predicted a lower proportion of prosocial choices (B=-0.704, SE=0.339, P=0.041). This relationship was not present in the AI (B=-0.423, SE=0.332, P=0.205).”

      And we have added the following to the discussion:

      “Additionally, participants with a more prosocial SVO showed reduced responses in the dACC to SV (across both self and other trials) at greater levels of perceived stress (Figure 4; middle panel). This suggests that more prosocial individuals may become less sensitive to SV overall following stress, whilst the responses of more individualistic participants to SV do not change under stress. Trying to link these activation differences to changes in effortful prosocial behaviour is difficult given the absence of the three-way interaction between SVO angle, Perceived Stress and Recipient, which would have mirrored the behavioural results. Overall, differences in activation between SVself and SVother in the dACC predicted the proportion of prosocial choices, so greater activation to SVself relative to SVother predicted a lower proportion of prosocial choices. Thus, it remains unclear how activation differences to SV across both self trials and other trials relates to changes in prosocial behaviour under stress. Schulreich et al. (2022) found that a decline in charitable donations following increases in cortisol in high mentalisers was related to a reduced representation of value for donations in the right dlPFC. Whilst there are important differences between the present study and Schulriech et al. (2022), such as the way in which prosocial behaviour was measured, both studies suggest that existing differences in social preferences and abilities (i.e., mentalising, SVO) can have a detrimental effect on the neural representations of value following acute stress. Establishing how these changes in neural representations of value impact behaviour following acute stress is a challenge for future work.”

      Concerning the power calculation, we have acknowledged this as a limitation in the discussion.

      “Our power calculation was based on a 2 x 2 design (Group x Recipient), however, several of our key findings involved three-way interactions (e.g. between Group, Recipient and Effort). Thus, future studies should aim to replicate our effects with larger sample sizes to ensure the robustness of these effects.

      Recommendations for the authors

      Reviewer #1 (Recommendations For The Authors):

      1. The authors employed an integrative approach on inducing acute stress by combining the strengths of MIST and TSST, as shown by a robust stress response in cortisol. However, some concerns regarding the stress manipulation and the effort-based task need to be addressed. The authors justified the order of deployment as necessary to maintain stress responses throughout the scanning period. It is unclear whether and how potential order effects were controlled, and whether the effort-task performance in the front and back of the line might have different effects in a 90-minute experiment.

      Moreover, the stress manipulation itself involved a complex mental arithmetic task, which might have influenced participants' willingness to exert effort for others in the prosocial task. As shown in Figure 3, the proportion of participants working decreases as the effort levels increase for both self and other conditions in the stress and control groups. It is thus possible that participants could consider the prosocial task as an opportunity to take a break from the demanding arithmetic task. It would be helpful to present results from the different runs, particularly for the pre and post three runs.

      We thank the reviewer for highlighting this potential issue. We have added several analyses to the supplementary analysis to explore potential block effects and fatigue effects. Here we provide a summary of the key findings.

      Firstly, we investigated participants’ ratings of the effort levels, which they experienced immediately before and after the study, to investigate potential fatigue effects. We found that following the experiment compared to the before, participants in the stress group rated squeezing to the required effort levels as more physically demanding compared to the control group (p=.037). There were no group differences in how much more effort they reported exerting (p=.824) or how uncomfortable it was (p=.351) compared to before the experiment. Thus, overall the stress group found it more physically demanding to squeeze to the effort levels following the experiment. Crucially, however, increases in how physically demanding participants found it to squeeze to the required effort levels were not correlated with the number of effortful choices in the Self and Other condition in either group (all Ps >0.4). This suggests that whilst stressed participants rated squeezing to the required effort level as more physically demanding following the task relative to before, this was not related to how often participants exerted effort for self or other rewards.

      Secondly, we investigated potential block effects. We repeated the mixed effects logistic regression reported in the manuscript but included the interaction between the factors Group, Recipient and Block (1:6) in the model. Although both groups showed a decline in the number of effortful choices during the experiment, the two-way interaction between Group and Block (p=.188) nor the three-way interaction between Group, Recipient and Block were significant (p=.138). This shows that whilst there was a decline in the number of effortful choices throughout the experiment, this was not more pronounced in the stress group, nor was it more pronounced in the stress group for self relative to other effortful choices compared to the control group. Additionally, the key three-way interaction between Group, Recipient and Block was unaffected when controlling for potential block effects. We now also plot the data by block in the supplementary materials (Figure S3).

      Please see the section in the Supplementary Material and a summary of these analyses also appears in the manuscript in the Results section

      “We conducted additional analyses to rule out the influence of potential fatigue and block effects (see Fatigue and block effects in the Supplementary Materials). In short, the stress group rated squeezing to the required effort level as more physically demanding immediately after the experiment compared to before, which was not seen in the control group (Figure S2). However, this was not related to the number of effortful choices for self or other rewards (Table S2). Moreover, when we conducted the same mixed effects logistic regression on participants’ choices but also included the interaction between Group, Recipient and Block, there was no significant three-way interaction between these factors, nor a significant two-way interaction between Group and Block (Figure S3). Additionally, the three-way interaction between Group, Recipient and Effort was unaffected when controlling for potential block effects (Type III Wald test χ2[4]=22.06, P<0.001). Thus, whilst the stress group rated squeezing to the required effort level as more physically demanding following the experiment, this was not related to the number of effortful choices (for self or other) and the effects of Block on effortful choices (for self or other) did not differ between the group. Thus, changes in how physically demanding participants rated squeezing to the effort levels did not influence decisions to exert effort.”

      1. It would be useful to know whether the authors controlled for factors such as familiarity or gender among participants that might influence their choices on the task. If participants were able to interact or observe each other, it is possible that social dynamics played a role in their behavior, which could confound the interpretation of their results. It would be beneficial if the authors could provide further information on how the task was administered and whether any social cues were present.

      For the experimental design, although salivary samples and subjective pressure were measured, did the authors measure participants' subjective ratings of other negative emotions?

      Participants did not have the chance to see or interact with the participants in the “other” condition. Participants were told at the start of the experiment that they would be earning money for the next participant in the study, called Thomas. Thus, as all participants were men, the name of the participants was gender matched. Moreover, as they did not see or interact with the next participant, familiarity was controlled across participants.

      We have now added a section p. 8 to clarify this:

      “As all participants were men, the name of the next participant was gender matched (all participants were told he was called Thomas; see Methods). Moreover, as participants did not see or interact with the next participant, familiarity was controlled across participants.”

      We have now added a plot to the supplementary materials (Figure S4) showing the changes in the ratings of the emotions. Apart from the emotions anxious and disgusted, all other emotions (calm, happy, bad, sad, surprised, angry) showed a significant sample timepoint (1:8) by group (stress, control) interaction, thus mirroring the results for the perceived stress ratings. We now refer to this figure in the manuscript on p. 8:

      “for changes in other emotions during the experiment please see Figure S4”

      1. Regarding the data analysis section, the authors' analysis is careful overall and the results about SVO are interesting. It would be interesting to know if baseline SVO was similar across both stress and control groups, and if there were any differences in SVO among participants with more individualistic or selfish tendencies. Regarding Figure 4, it would be helpful if the authors clarified whether the vertical coordinate "prosocial choices" is a combination of the five levels of effort or if it is specific to one level. Additionally, it would be useful to explore whether there is a correlation between SVO and prosocial choices and whether effort level could be used as a covariate to control for potential confounding effects. These suggestions could improve the clarity and strength of their contributions.

      There were no differences in SVO angle between the control group and stress group (p=.956). There was also a significant correlation between SVO angle and the proportion of prosocial choices across the whole sample. This has now been reported in the manuscript on p. 13:

      “There were no existing differences in SVO angle between the groups (control group mean = 19.33, SD = 8.67; stress group mean = 19.23, SD=8.14; p=0.956). We found that across the whole sample – independent of the stress manipulation – there was a significant correlation between SVO angle and the proportion of prosocial choices (r=0.225, P=0.032). So, as expected, those with a more prosocial SVO angle showed a higher proportion of prosocial choices in the task.

      To clarify, the variable “% prosocial choices” is a combination of all the five effort levels. In other words, we took the total number of prosocial choices (‘work’ for other) across all effort levels relative to the total number of effortful choices. We have now clarified this in the manuscript on p. 13. As this was a combination of all effort levels (and reward levels), it was not possible to include effort level as a covariate.

      “This measure combined all reward and effort levels.”

      1. It is noteworthy that in the dACC, an effect was observed with regard to the interaction between perceived stress and SVO angle. Considering this observation, another suggestion would be for the authors to include visualization in Figure 4 to present the results of this interaction. This could help readers better comprehend the findings and provide a clearer representation of the results.

      We have now updated Figure 4 so that it has three panels showing the behavioural and neural results concerning SVO angle as well as the relationship between SVO angle and activation to SVself and SVother in the dACC.

      1. It would be helpful for readers if the authors could label all statistical plots with appropriate statistical values, effect sizes, and their respective significance levels. By doing so, readers would be able to quickly identify major findings of this study and gauge the degree of significance associated with each plot. The authors should consider including such information in their statistical plots to enhance the comprehensibility of the study results.

      We have added statistical values (e.g., beta estimates), including indicators of significance to the plots.

      1. The authors selected ROIs based on previous work on stress-related and effort-based decision making (i.e., AI and dACC). While other brain regions may also play a role in decision making and social cognition, the authors could choose to focus on these specific ROIs due to their relevance to the experimental question and hypotheses of this study such as prosocial, mentalizing and subjective values.

      We agree that several other ROIs may have also been of interest. However, we decided to restrict our analysis to the dACC and the AI as these two ROIs were the focus of a previous study using the same prosocial effort paradigm (Lockwood et al. 2022) and multiple studies suggest these regions are sensitive to stress effects.

      1. The authors chose to use one sample t-test with AUC as a covariate to examine brain activations across all participants regardless of their stress or control condition. This approach could identify brain regions that are associated with perceived stress. However, the authors didn't conduct a simple two sample t-test between stress and control groups since their research question and hypotheses focused on the neurocomputational mechanisms underlying prosocial decision-making during stress. Regarding the different stages of decision-making, such as offer, force, and outcome, the authors did not conduct specific analyses for each stage. Instead, they used the computational model to estimate the subjective value of each option at each stage, which allowed them to examine the neural correlates of different value-related parameters across the entire decision-making process. However, it would be interesting to examine the role of different stages as well.

      Our design matrix modelled three events during each trial: the offer, force, and outcome phase (as per Lockwood et al. 2022). However, our hypotheses and research question for the effects of acute stress concerned the offer phase, i.e. when participants were deciding whether to exert effort or not (work vs. rest). Therefore, we decided to limit our reporting to this event. We have clarified this on p. 32 in the Methods:

      “Our hypotheses and research questions concerning the effects of acute stress concerned the offer phase, i.e., when participants were deciding whether to exert effort or not (work vs. rest). Therefore, we limited our reporting to this event.”

      1. The authors' findings pertaining to individual differences are intriguing, particularly for individuals with selfish tendencies to exhibit lower pro-social tendencies under stress. Additionally, group variations in effortful behavior related to benfitting others, relative to oneself, are more evident at lower effort levels rather than higher ones. The authors could dedicate more space in the discussion section to discuss the potential mechanisms involved and address the absence of pertinent theoretical support.

      We have now extended the discussion to further outline potential mechanisms. Broadly, we interpret our findings in terms of compromised executive functioning under acute stress: “downregulation of the brain’s ‘executive control network’ (Hermans et al., 2014)”. In the original submission, we focused on changes in inhibition and shifts to habitual/automatic processing. We have now expanded this to include a section on cognitive flexibility (see below). Note that changes in executive functioning have been widely reported following stress (see Shields et al., 2016 for a meta-analyses). However, which specific executive functions influenced our observed changes in prosocial behaviour is an exciting avenue for future work.

      We have added this section on p. 20-21 concerning cognitive flexibility:

      “The dlPFC has also been implicated in cognitive flexibility under acute stress. For example, Kalia et al. (2018) used functional near infrared spectroscopy to show that reduced cognitive flexibility under stress was related to changes in activation in the dlPFC in men. In our study, participants in the control group were more likely to exert effort for self rewards compared to other rewards at higher, but not at lower, levels of effort. Whilst participants in the stress group favoured exerting effort for self rewards at every effort level (Figure 3). This consistent preference for self rewards compared to other rewards at all effort level suggests that stressed participants did not adapt their social behaviour in response to changing contextual information. This supports multiple studies showing reduced cognitive flexibility under stress (Goldfarb et al., 2017; Kalia et al., 2018; Raio et al., 2017; Shields et al., 2016). An exciting avenue for future work is to test whether individual differences in executive functions, such as inhibition and cognitive flexibility, predict changes in social behaviour following acute stress. This would be analogous to the finding in non-social domains, where greater working memory capacity protects against stress-induced changes in learning (Otto et al., 2013).

      Reviewer #2 (Recommendations For The Authors):

      The manuscript suggests that the stress group made more selfish responses than the control group at lower, but not higher, levels of effort (as shown in Figure 3). I recommend that Figure 3, showing these data, be modified for clarity. Currently, data for the between-subjects comparison (Control and Stress groups) are linked by a dashed line. This linkage (at least in my mind) connotes that these data points are from the same people at different times. In fact, the within-subjects data are not linked by a line, but are noted by different colored symbols. Please reconsider how these data are presented.

      We have redrawn Figure 3. For each effort level, the self vs. other manipulation is shown on the x axis and the two groups (Control vs. Stress) are shown by black and grey lines. For each group, the lines are connected to show that the Self vs. Other manipulation is a within-subject manipulation.

    1. Author Response

      The following is the authors’ response to the original reviews.

      Thank you for the response and reviews of our manuscript eLife-RP-RA-2023-86638 “Energetics of the Microsporidian Polar Tube Invasion Machinery”. We are grateful for the comments and constructive criticism from all three reviewers, which have helped us to improve our manuscript.

      As a summary to the editor, we here provide a list of the major revisions we have implemented to address all the comments provided by the referees.

      1. We added Supplementary Section A.9 and Figure S4 to explain the details of calculation and have magnified sketches of flow fields.

      2. We clarified the term "required pressure" to "required pressure differences", and explained that the same pressure differences can be achieved by either positive or negative pressure. We invoke the fact that the spore wall buckled inward to deduce that germination is a negative pressure process.

      3. We only rank the hypotheses based on calculation of total energy requirement. The peak pressure and peak power requirement calculations are now just for quantitative reference. The ranking of hypotheses does not change.

      4. We clarified the definition of topological connections in Section "Systematic evaluation of possible topological configurations of a spore," making it explicit that the topological questions listed only involved the "original PT content" (not PT space at all time).

      Thank you again for the opportunity to revise our work. We attach a point-by-point response to the referees below.

      Public Reviews:

      Reviewer #1 (Public Review):

      1. The authors used mathematical models to explore the mechanism(s) underlying the process of polar tube extrusion and the transport of the sporoplasm and nucleus through this structure. They combined this with experimental observations of the structure of the tube during extrusion using serial block face EM providing 3 dimensional data on this process. They also examined the effect of hyperosmolar media on this process to evaluate which model fit the predicted observed behavior of the polar tube in these various media solutions.

      We thank the reviewer for their accurate summary of our work. One subtle point, however, is that we examine the effect of hyperviscous media on the polar tube extrusion process, rather than hyperosmolar media. In Supplementary Section A.6 of our updated manuscript, we have shown that the changes in osmolarity due to methylcellulose is negligible.

      1. Overall, this work resulted in the authors arriving at a model of this process that fit the data (model 5, E-OE-PTPV-ExP). This model is consistent with other data in the literature and provides support for the concept that the polar tube functions by eversion (unfolding like a finger of a glove) and that the expanding polar vacuole is part of this process. Finally, the authors provide important new insights into the buckling of the spore wall (and possible cavitation) as providing force for the nucleus to be transported via the polar tube. This is an important observation that has not been in previous models of this process.

      We thank the reviewer for acknowledging the novelty and importance of our study.

      Reviewer #2 (Public Review):

      1. Microsporidia has a special invasion mechanism, which the polar tube (PT) ejects from mature spores at ultra-fast speeds, to penetrate the host and transfer the cargo to host. This work generated models for the physical basis of polar tube firing and cargo transport through the polar tube. They also use a combination of experiments and theory to elucidate possible biophysical mechanisms of microsporidia. Moreover, their approach also provided the potential applications of such biophysical approaches to other cellular architecture.

      We thank the reviewer for their accurate summary and acknowledging the potential applications on other organisms.

      1. The conclusions of this paper are mostly well supported by data, but some analyses need to be clarified. According to the model 5 (E-OE-PTPV-ExP) in P42 Fig. 6, is the posterior vacuole connected with the polar tube? If yes, how does the nucleus unconnected with the posterior vacuole enter the polar tube?

      As we mentioned in our glossary and detailed in Section "Systematic evaluation of possible topological configurations of a spore", Model 5 requires the "original PT content" (any material inside the PT prior to cargo entering the tube) to permit fluid flow to posterior vacuole and external environment post anchoring disc rupture, but cannot permit fluid flow to the sporoplasm that is transported through the tube. As the the germination process progresses, our model does not require the connection between PT and posterior vacuole to be maintained afterwards, and that creates space allowing sporoplasm (including nucleus) sporoplasm (including nucleus) to enter PT space through fluid entrainment. We have clarified the definitions in Section "Systematic evaluation of possible topological configurations of a spore" and have additional clarification in the caption of Fig. 6 in the updated manuscript.

      1. In Fig. 6, would the posterior vacuole become two parts after spore germination? One part is transported via the polar tube, and the other is still in the spore. I recommend this process requires more experiments to prove.

      According to our Model 5, the membrane connection between PT and posterior vacuole must be broken for the infectious cargo to extrude. However, our current data does not allow us to prove nor disprove the membrane fission event. In theory, the membrane content in PT can potentially be severed into multiple parts by Plateau-Rayleigh instability, an interfacial-tension-driven fluid thread breakup mechanism. Note that it is possible to have membrane fission at the time scale of germination process, as when the time scale of shearing is faster than the viscoelastic time of lipid membranes (roughly 10 msec), membrane fission can happen (Morlot & Roux 2013). For time scale longer than viscoelastic time of lipid membrane, protein complexes like dynamin would be required for membrane fission. Future cryo-EM study of the vacuole-PT connection at the anterior tip (and in the spore as a whole) is needed to clarify the physical process. We added this discussion in Section "Predictions and proposed future experiments".

      Reviewer #3 (Public Review):

      Abstract:

      The paper follows a recent study by the same team (Jaroenlak et al Plos Pathogens 2020), which documented the dramatic ejection dynamics of the polar tube (PT) in microsporidia using live-imaging and scanning electron microscopy. Although several key observations were reported in this paper (the 3D architecture of the PT within the spore, the speed and extent of the ejection process, the translocation dynamics of the nucleus during germination), the precise geometry of the PT during ejection remain inaccessible to imaging, making it difficult to physically understand the phenomenon.

      This paper aims to fill this gap with an indirect "data-driven" approach. By modeling the hydrodynamic dissipation for different unfolding mechanisms identified in the literature and by comparing the predictions with experiments of ejection in media of various viscosities, authors shows that data are compatible with an eversion (caterpillar-like) mechanism but not compatible with a "jack-in-the-box" scenario. In addition, the authors observe that most germinated spores exhibit an inward bulge, which they attribute to buckling due to internal negative pressure and which they suggest may be a mean of pushing the nucleus out of the PT during the final stage of ejection.

      We thank the reviewer for their accurate summary of our work.

      Major strengths:

      Probably the most impressive aspect of the study is the experimental analysis of the ejection dynamics (velocity, ejection length) in medium of various viscosities over 3 orders of magnitudes, which, combined with a modeling of the viscous drag of the PT tube, provides very convincing evidence that the unfolding mechanism is not a global displacement of the tube but rather an apical extension mechanism, where the motion is localized at the end of the tube. The systematic classification of the different unfolding scenarios, consistent with the previous literature, and their confrontation with data in terms of energy, pressure and velocity also constitute an original approach in microbiology where in-situ and real time geometry is often difficult to access.

      We thank the reviewer for acknowledging the novelty and importance of our study.

      Major weaknesses:

      1a. While the experimental part of the paper is clear, I had (and still have) a hard time understanding the modeling part. Overall, the different unfolding mechanisms should be much better explained, with much more informative sketches to justify the dissipation and pressure terms, magnifying the different areas where dissipation occurs, showing the velocity field and pressure field, etc.

      We thank the reviewer for their comments and suggestions. In the Figure S4 and SI Section A.9 of the updated manuscript, we have magnified the sketches with flow field, and added a detailed explanation of the derivations of dissipation terms.

      1b. In particular, a key parameter of eversion models is the geometry of the lubrication layers inside and outside the spore (h_sheath, h_slip). Where do the values of h_sheath and h_slip come from? What is the physical process that selects these parameters?

      As we described in SI Section A.9, h_sheath was set to be 25 nm based on the observed translucent space around PT in activated spores (Lom 1972), and h_slip was set to be 6 nm based on the observed gap thickness between PT and cargo (Takovarian et al. 2020). Although we don't expect these numbers to be the same for each spore, the uncertainty in these two parameters are much less than the uncertainty in cytoplasmic viscosity (which varies several orders of magnitude) and boundary slip length. Our sensitivity testing on cytoplasmic viscosity and boundary slip length thus covers any uncertainty in h_sheath or h_slip already.

      1c. For clarity, the figures showing the unfolding mechanics in the different scenarios should be in the main text, not in the supplemental materials.

      We have added Figure S4 and SI Section A.9 to explain the details of our sketches. We believe, however, putting all the details of the mechanics and how each term is derived in the main text may detract from the flow of the manuscript, and result in it being less accessible to readers who are not as familiar with the physics. We therefore decided to keep this information in supplemental materials.

      2a. The authors compute and discuss in several places "the pressure" required for ejection, but no pressure is indicated in the various sketches and no general "ejection mechanism" involving this pressure is mentioned in the paper.

      In the updated manuscript, we have changed the term “pressure” to “pressure difference” or “required pressure difference”. We did not calculate the detailed pressure field around each structure, but only estimated the required pressure difference to overcome the drag force and drive fluid flow in various spaces. We also clarified this point in Section "Developing a mathematical model for PT energetics".

      Also, as we mentioned in Section “Posterior vacuole expansion and the role of osmotic pressure”, we made no assumptions on how the pressure difference is generated in this paper. The unfolding mechanism of polar tube, how eversion is sustained, and the driving mechanism are ongoing research projects, and we decided not to make premature comments on that without strong support from experiments or simulation results.

      2b. What is this "required pressure" and to what element does it apply?

      The “required pressure” in the manuscript indicates the required pressure difference between the spore and the tip of the polar tube for it to push the tip forward and sustain the fluid flow within the polar tube. In the updated manuscript, we thus changed the term “required pressure” to “required pressure difference”. We also added this clarification to Section "Developing a mathematical model for PT energetics".

      2c. I understand that the article focuses on the dissipation required to the deployment of the PT but I find it difficult to discuss the unfolding mechanism without having any idea on the driving mechanism of the movement. How could eversion be initiated and sustained?

      As we mentioned in Section “Posterior vacuole expansion and the role of osmotic pressure”, we made no assumptions on how the energy, pressure or power is generated in this paper. We agree that the unfolding mechanism of the polar tube, how eversion is sustained, and the driving mechanism are important questions, and these are ongoing research projects. As no assumptions about this are required for our models, we decided not to comment on these aspects without strong support from experiments or simulation results. We have clarified this in Section “Posterior vacuole expansion and the role of osmotic pressure” of the updated manuscript.

      1. Finally, the authors do not explain how pressure, which appears to be a positive, driving quantity at the beginning of the process, can become negative to induce buckling at the end of ejection. Although the hypothesis of rapid translocation induced by buckling is interesting, a much better mechanistic description of the process is needed to support it.

      As discussed in Point 2-b above, the “required pressure” actually means “required pressure difference”. The same pressure difference can possibly be achieved by either positive pressure (the spore has a higher pressure than the ambient, pushing the fluid into PT) or negative pressure (the PT tip has a lower pressure than the ambient, sucking the fluid from the spore). Hydrodynamic dissipation analysis alone cannot tell the differences between positive or negative pressure, as it only tells you the required pressure differences between the spore and the polar tube tip. It will have to be inferred from the implied mechanisms or other evidence. We added these discussions in the 4th paragraph of Section "Developing a mathematical model for PT energetics" in the updated manuscript.

      That being said, from our observations of buckled spore walls, it is still sufficient to deduce that the polar tube ejection process is a negative pressure driven process. For the spore wall to buckle inwards, the ambient pressure has to be higher than the pressure within the spore, but that would contradict with the positive pressure hypothesis as elaborated above. We added these clarifications in the 2nd paragraph of Section "Models for the driving force behind cargo expulsion".

      References:

      Lom, J. (1972). On the structure of the extruded microsporidian polar filament. Zeitschrift Für Parasitenkunde, 38(3), 200–213.

      Takvorian, P. M., Han, B., Cali, A., Rice, W. J., Gunther, L., Macaluso, F., & Weiss, L. M. (2020). An Ultrastructural Study of the Extruded Polar Tube of Anncaliia algerae (Microsporidia). The Journal of Eukaryotic Microbiology, 67(1), 28–44.

      Morlot, S., & Roux, A. (2013). Mechanics of dynamin-mediated membrane fission. Annual Review of Biophysics, 42, 629–649.

      Reviewer #1 (Recommendations For The Authors):

      The work is solid and supported by the experimental data presented, the literature and the biophysical modeling.

      1. The model (Model 5) indicates that the polar tube is connected to the posterior vacuole and that the contents of this vacuole may be transported by the polar tube before the sporoplasm. This needs experimental validation in the future, which will require the identification of posterior vacuole markers (i.e. proteins specific to this structure). I find the topology of this idea difficult to understand. If the polar tube is outside of the sporoplasm membrane then how does it connect to the posterior vacuole? If the expanded posterior vacuole is still in the spore at the end of germination then how does the sporoplasm get out?

      Model 5 requires the "original PT content" (any material inside the PT prior to cargo entering the tube) to permit fluid flow to posterior vacuole and external environment post anchoring disc rupture, but cannot permit fluid flow to sporoplasm. As the germination process progresses, our model does not require the connection between PT and posterior vacuole to be maintained afterwards, and that creates space allowing sporoplasm (including nucleus) to enter PT space through fluid entrainment.

      We agree with the reviewer that the specific predictions from Model 5 need to be experimentally validated in the future, and identification of posterior vacuole markers is a good direction. We have mentioned this in Section "Predictions and proposed future experiments".

      1. I have always thought that the polaroplast was the initial cargo in the polar tube and that this formed the limiting membrane of the sporoplasm and nucleus after passage through the polar tube (i.e., the limiting membrane of the sporont).

      In this manuscript, we only analyze the possible topology of the organelles that are relevant for energy dissipation calculations. Our final hypothesis (E-OE-PTPV-ExP) indicates that there is a limiting membrane of the infectious cargo as they pass through PT, but the energy calculation cannot tell you where this membrane comes from. That being said, our final hypothesis is consistent with the common belief that polaroplast provides the limiting membrane of the sporoplasm, even though our analysis neither proved nor disproved it.

      1. I understand that the model indicates that during eversion the end of the PT moves away from the posterior vacuole allowing the sporoplasm access to the PT lumen, however, I am not clear how this process occurs (although I understand the reason that this model was the best fit for the available data). Does the model distinguish between connected (as in the PV is in the polar tube lumen) to the idea of it being in proximity (i.e. the PT is at the PV at the start of eversion)?

      As we mentioned in our reply to Point 1 of the same reviewer above, "connectivity" simply means whether fluid flow is permitted across the end connections among organelles and sub-spaces within the spores. For Model 5, the content of posterior vacuole can pass to the original PT content and to the external environment post anchoring disc disruption through fluid flow, but not to sporoplasm. However, as the germination progresses, the PT does not have to maintain its spatial proximity or membrane connection to posterior vacuole, as the topological connectivity questions are pertaining to the "original PT content". We clarified this point in Section "Systematic evaluation of possible topological configurations of a spore" in the updated manuscript.

      Reviewer #2 (Recommendations For The Authors):

      1. The connection of polar tube and posterior vacuole need to be analyzed by Cryo -EM.

      We thank the reviewer for their comments. This work is underway.

      Reviewer #3 (Recommendations For The Authors):

      1a. As stated in the public review, the explanation and description of the unfolding mechanism should be much better described and associated with clear sketches, magnifying all the areas where the flow shear rate is concentrated (surrounding zone, lubrication inside and outside the spore, etc) and drawing the velocity field, the boundary solid motion and pressure distribution in order to clearly understand, for each model, the dissipation and pressure terms given in figs. S2 and S3.

      In the updated manuscript, we added Figure S4 to enlarge all the regions where fluid shear is considered, with sketches of velocity fields.

      1b. This is particularly important for explaining the eversion models (see comment in the Public Review) but even the "jack-in-the-box" model sketched in Fig. S2 is confusing: Why does the blue tube disappear outside the spore? What happens to the tube in this case?

      The blue tube in the sketch of Model 1 in Fig. S2 is the fluid between the two outermost layers of PT, not the PT itself. We have clarified that in the newly added Fig. S4.

      1. Many ejection mechanisms based on the deployment of invaginated appendages have been described in the literature (e.g. Zuckerkandl Biol. Bull. 1950, Karabulut et al Nat. Com. 2022) and also mimicked for robotic applications (e.g. Hawkes et al Science Robotics 2017). Although this is not the main topic of the paper, it would be very useful if the authors could discuss in the introduction the most acceptable theory for motion generation (eversion driven by an overpressure in the spore?). In the current version, this comes too late in the discussion.

      As we discussed in Section “Lack of biophysical models explaining the microsporidian infection process”, PT eversion is the most widely accepted hypothesis because of experimental evidence (e.g. microscopic observations of PT extrusions, and pulse-labeling of half-ejected tubes). However, whether or not it is driven by an overpressure in the spore remains controversial. In fact, our observations of inwardly buckled spores indicates that the ejection process likely involves negative pressure.

      In our work, we thus take a data-driven approach to generate models for the physical basis of PT extrusion process, without immediately assuming that eversion is the correct hypothesis. It would therefore not make sense to have elaborated discussion on other eversion mechanisms in Introduction.

      1. About the physical constraints, I understand that the stored energy must be the same when the viscosity is changed (by conservation of energy), but what physical basis do you have for requiring that the power and pressure also be the same (lines 295-298)? For e.g. when a spring is stretched and released in a very viscous fluid without inertia, the total energy dissipated is the same whatever the viscosity but the power is not the same. The formulation of the chosen physical constraints should be better justified.

      We thank the reviewer for their feedback. In our updated manuscript, we only use total energy requirement for the ranking, and the peak pressure difference requirement and peak power requirements are calculated just for quantitative reference. The ranking of the 5 hypotheses does not change.

      1. About the mechanism for cargo translocation, authors should explain the physical origin of the hypothetical negative pressure. How could the initial positive pressure become negative?

      As we mentioned in our reply to Point 3 of the same reviewer in the public review, the “required pressure” actually means “required pressure difference”. The same pressure difference can possibly be achieved by either positive pressure (the spore has a higher pressure than the ambient, pushing the fluid into PT) or negative pressure (the PT tip has a lower pressure than the ambient, sucking the fluid from the spore). Hydrodynamic dissipation analysis alone cannot tell the differences between positive or negative pressure, as it only tells you the required pressure differences between the spore and the polar tube tip. It will have to be inferred from the implied mechanisms or other evidence. We added these discussions in the 4th paragraph of Section "Developing a mathematical model for PT energetics" in the updated manuscript.

      That being said, from our observations of buckled spore walls, it is still sufficient to deduce that the polar tube ejection process is a negative pressure driven process. For the spore wall to buckle inwards, the ambient pressure has to be higher than the pressure within the spore, but that would contradict with the positive pressure hypothesis as elaborated above. We added these clarifications in the 2nd paragraph of Section "Models for the driving force behind cargo expulsion".

      More minor comments:

      1. The videos are amazing but it is not clear if the PT is ejected through a bulk fluid or if the spores (and ejected PT) are in contact with a solid.

      As described in Supplementary Section A.6, purified spores were spotted on a coverslip and let water evaporate. 2.0 μL of germination buffer (10 mM Glycine-NaOH buffer pH 9.0 and 100 mM KCl) with different concentration (0%, 0.5%, 1%, 2%, 3%, 4%) of methylcellulose was added to the slide and place the coverslip on top. So the spore is attached to the coverslip and ejected through a bulk liquid of germination buffer.

      1. S2 caption: please be precise that H is the Heaviside step function.

      We have updated the captions for both Figure S2 and S3 to make it explicit.

      1. Line 233 a pi is missing, no?

      We thank the reviewer for their careful read. We have corrected that.

      1. The notations are quite unfortunate and confusing. In fluid mechanics capital D usually refers to the dissipation, capital C to the drag coefficient. It would be much clearer to call D the dissipation power (in Watt) and P the pressure requirement (in Pa), whatever the mechanism and put the different contribution (drag, lubrication, cytoplasm flow) in subscript.

      We thank the reviewer for their feedback. The notation of this paper is challenging as there are many symbols while keeping everything relatively intuitive to both people with biology background and physics background. We will keep these feedback in mind in our future work.

      1. Fig S2: what is D (in the formula of the total dissipation power)? Why not use R instead?

      D is the PT diameter, as we mentioned in the caption. We keep that as it is used in the definition of the shape factor.

      1. Fig S3 why the pressure requirement for the "jack-in-the-box" hypothesis is 2\mu (vLf(epsilon)/R^2)?

      We have now elaborated the calculation in SI Section A.9.

      1. Lines 486-497: Although shear thinning fluids have their viscosity that decreases with the shear rate, in most cases the resistance (stress) still increases with speed with these fluids. Is mucin a "velocity-weakening" fluid, i.e. a fluid in which stress decreases when shear rate increases.

      We agree that stress still increases with speed for most shear thinning fluids. The mechanical properties of mucin solution strongly depend on its compositions and buffers. In our discussion, we thus simply mention this possibility without claiming whether mucin (or other biopolymer environment that microsporidia species actually experience in vivo) is a velocity-weakening fluid or not.

    1. Author Response

      The following is the authors’ response to the original reviews.

      Reviewer #1 (Public Review):

      In this study, the authors investigated the role of MAM and the Notch signaling pathway in the onset of the atrophic phenotype in both in vivo and in vitro models. The rationale used to obtain the data is one of the main strengths of the study. Already from the reading, the reasoning scheme used by the authors in setting up the study and evaluating the data obtained is clear. Using both cellular and mouse models in vivo consolidates the data obtained. The authors also methodologically described all the choices made in the supplementary section. A weakness, on the other hand, is the failure to include averages and statistical data in the results that would give a quantifiable idea of the data obtained. To complete the picture, the authors could also investigate the possible involvement of the intrinsic apoptosis pathway as well as describe probable metabolic shifts to muscle cells in atrophic conditions. The rationale used by the authors to obtain the result is linear. The data obtained are useful for understanding the onset and characterization of the atrophic phenotype under disuse and microgravity conditions. The methods used are in line with those used in the field and can be a starting point for other studies. The cellular models are well described in the Materials and methods section. The selected mouse models followed a logical rationale and were in line with the intended aim.

      We thank this reviewer for comments that have led us to clarify several points.

      Reviewer #1 (Recommendations For The Authors):

      • In order to reinforce and justify the results obtained, I would suggest that the authors include numerical and statistical data in the results obtained.

      Answer) As the reviewer suggested, we have incorporated actual numerical and statistical data into each graph in all figures.

      • With the aim of better framing the picture of an atrophic muscle phenotype caused by microgravity or disuse, I would advise the authors to also focus on the possible involvement of the intrinsic apoptosis pathway. To this end, it would be interesting to assess a possible relationship between MAM and apoptosis. It would be useful to integrate this part into the discussion.

      Answer) It has been shown that suppression of Mfn2 expression attenuates calcium influx into mitochondria during apoptosis-inducing stimuli, thereby inhibiting apoptosis (Martins de Brito & Scorrano, Nature 2008), however, in our study, we found that apoptotic pathways, including Caspase3 or p-AKT were not significantly altered in differentiated human myocytes by microgravity for 7 days in culture, suggesting that microgravity-induced apoptosis is not an initial pathway to MAM. We have added these data in the new supplementary file 3 and mentioned it in the results.

      • In addition to TA, did the authors investigate what was seen in other muscles impacted by microgravity? If so, I would recommend supplementing what is available or, on the contrary, justifying the exclusivity of the choice of TA.

      Answer) It has been reported that the soleus, a slow-type muscle is more susceptible than the fast-type tibialis anterior muscle during gravity changes, so it makes more sense for the content of this study to analyze the soleus muscle. However, we chose the tibialis anterior muscle as our target because it provides the most stable results as a site for stem cell transplantation to observe muscle regeneration.

      • The authors affirm that there is an altered distribution and morphology of mitochondria under microgravity conditions. To corroborate this assertion, I would recommend including a morphological image that confirms it.

      Answer) The morphology of mitochondria in cultured myotubes, as observed by mitotracker staining in Figure 4G, varied widely, from finely divided to fused even within a single fiber compared to MFN2-mutated human iPS cells, making it difficult to conclude whether these changes were brought about by microgravity. Therefore, in this study, we have shown that they are reduced in microgravity by the difference in fluorescence intensity of mitotracker, which is directly proportional to mitochondrial activity.

      • It would be interesting if the authors would show whether there are changes in myosin expression or metabolic changes in cells subjected to microgravity and in the cell model with Mnf2 deletion. It would also be interesting to evaluate this in the presence of DAPT.

      Answer) As the reviewer’s suggestion, we have checked MYH1, MYH3, and MYH7 transcripts in differentiated myotubes under microgravity, with or without DAPT in the new supplementary file 12. We have added the data showing that not MYH1 but MYH7 transcript was partially recovered in the Results.

      A detailed description of the metabolic analyses with myogenic cells cultured in microgravity conditions will be published elsewhere (Sugiura et al., “Mitochondria aconitase is a main target for unloading-mediated mitochondria dysfunction toward muscle atrophy”, in preparation). We have described it in the Materials and methods of the manuscript.  

      Reviewer #2 (Public Review):

      In this study, the authors examined how the maintenance of mitochondrial-associated endoplasmic reticulum membranes (MAM) is critical for the prevention of muscle atrophy under microgravity conditions. They observed, a reduction in MAM in myotubes placed in a microgravity condition; in addition, MFN2-deficient human iPS cells showed a decrease in the number of MAM, similar to in myotubes differentiated under microgravity conditions, in addition to the activation of the Notch signaling pathway. The authors, moreover, observed that treatment with the gamma-secretase inhibitor with DAPT preserved the atrophic phenotype of differentiated myotubes in microgravity and improve the regenerative capacity of Mfn2-deficient muscle stem cells in dystrophic mice. The entire study was well conducted, bringing an interesting analysis in vitro and in vivo of aging conditions. In my opinion, it is necessary to improve the analysis of both genes and proteins to better support the conclusions

      The study can contribute to a better understanding of one of the major problems of aging, such as muscle atrophy and inhibition of muscle regeneration, emphasizing the importance of the NOTCH pathway in these pathological situations. The work will be of interest to all scientists working on aging

      We thank this reviewer for the positive comments and remarks that we have attempted to address.

      Reviewer #2 (Recommendations For The Authors):

      Results:

      In Figure 1b authors observed an increase in the transcripts of MuRF1 and FBXO32 after 7 days of microgravity condition. I suggest to investigate the protein expression of these genes to give more validation to this data.

      Answer) As the reviewer’s suggestion, we have investigated the western blotting with atrophic markers in microgravity samples. These data have been added in Figure 1D.

      Moreover, I suggest investigating not only Myogenin as an earlier gene of myotubes formation but also MRF4.

      Methods:

      I suggest when doing real-time PCR not to use a single gene as housekeeping but the average of three genes, to avoid the influence of a single housekeeping gene affecting the results.

      Answer) As the reviewer’s suggestion, we have investigated MRF4 expression by qPCR experiments with 3 different housekeeping genes (RPL13a, GAPDH, and ACTB). Our experiments showed no significant differences among these three housekeeping genes. We have added these data to Figure 1C and Methods in the manuscript.

    1. Author Response

      We thank the reviewers and editor for their careful evaluation of our manuscript, and we appreciate their favorable assessment of our work. Below, we clarify a few points concerning the relationship between our study and previous studies evaluating ligand docking to protein models.

      As reviewer 2 correctly notes, several previous assessments of AF2 models have simply excluded templates above a sequence identity cutoff when using AF2 to predict structures. Such AF2 predictions are still informed by all structures in the PDB before April 30, 2018, because these structures were used to train AF2—that is, to determine the tens of millions of parameters (“weights”) in the AF2 neural network. Machine learning methods nearly always perform better when evaluated on the data used to train them than when evaluated on other data. For this reason, we consider AF2 models only for proteins whose structures were not used to train AF2—that is, for proteins whose structures were not available in the PDB before April 30, 2018.

      Previous papers (including Beuming and Sherman, 2012, https://doi.org/10.1021/ci300411b) have shown a clear correlation between the binding pocket RMSD of a protein model and pose prediction accuracy based on that model. Our main findings are unexpected in light of these previous reports: we find that AF2 models yield pose prediction accuracy similar to that of traditional homology models despite having much better binding pocket RMSDs, and that AF2 models yield substantially worse pose prediction accuracy than experimentally determined structures with different ligands bound despite having similar binding pocket RMSDs.

      Reviewer 2 also correctly notes that previous papers have described AF2 models as “apo models,” because these models do not include coordinates for bound ligands. As noted by the AF2 developers (e.g., https://alphafold.ebi.ac.uk/faq), however, AF2 is designed to predict coordinates of protein atoms as they might appear in the PDB, and AF2 models are thus frequently consistent with structures in the presence of ligands even though those ligands are not included in the models. GPCR structures in the PDB, including those used to train AF2, nearly always contain a ligand in the orthosteric binding pocket. An AF2 model of a GPCR should thus not be viewed as an attempt to predict the GPCR’s structure in the unliganded (apo) state.

      Finally, we did not apply flexible docking in this study because previous work has found that standard flexible docking protocols typically improve pose prediction performance only when given prior information on which amino acid residues to treat as flexible. For example, previous studies that performed successful flexible docking to AF2 models generally used prior knowledge of the ligand’s experimentally determined binding pose to identify the residues to treat as flexible.

    1. Author Response

      Reviewer #3 (Public Review):

      Summary:

      The manuscript from Tariq and Maurici et al. presents important biochemical and biophysical data linking protein phosphorylation to phase separation behavior in the repressive arm of the Neurospora circadian clock. This is an important topic that contributes to what is likely a conceptual shift in the field. While I find the connection to the in vivo physiology of the clock to be still unclear, this can be a topic handled in future studies.

      Strengths: The ability to prepare purified versions of unphosphorylated FRQ and P-FRQ phosphorylated by CK-1 is a major advance that allowed the authors to characterize the role of phosphorylation in structural changes in FRQ and its impact on phase separation in vitro.

      Weaknesses: The major question that remains unanswered from my perspective is whether phase separation plays a key role in the feedback loop that sustains oscillation (for example by creating a nonlinear dependence on overall FRQ phosphorylation) or whether it has a distinct physiological role that is not required for sustained oscillation.

      The reviewer raises the key question regarding data suggesting LLPS and phase separated regions in circadian systems. To date condensates have been seen in cyanobacteria (Cohen et al, 2014, Pattanayak et al, 2020) where there are foci containing KaiA/C during the night, in Drosophila (Xiao et al, 2021) where PER and dCLK colocalize in nuclear foci near the periphery during the repressive phase, and in Neurospora (Bartholomai et al, 2022) where the RNA binding protein PRD-2 sequesters frq and ck1a transcripts in perinuclear phase separated regions. Because the proteins responsible for the phase separation in cyanobacteria and Drosophila are not known, it is not possible to seamlessly disrupt the separation to test its biological significance (Yuan et al, 2022), so only in Neurospora has it been possible to associate loss of phase separation with clock effects. There, loss of PRD-2, or mutation of its RNA-binding domains, results in a ~3 hr period lengthening as well as loss of perinuclear localization of frq transcripts. A very recent manuscript (Xie et al., 2024) calls into question both the importance and very existence of LLPS of clock proteins at least as regards to mammalian cells, noting that it may be an artefact of overexpression in some places where it is seen, and that at normal levels of expression there is no evidence for elevated levels at the nuclear periphery. Artefacts resulting from overexpression plainly cannot be a problem for our study nor for Xiao et al. 2021 as in both cases the relevant clock protein, FRQ or PER, was labeled at the endogenous locus and expressed under its native promoter. Also, it may be worth noting that although we called attention to enrichment of FRQ[NeonGreen] at the nuclear periphery, there remained abundant FRQ within the core of the nucleus in our live-cell imaging.

      Cohen SE, et al.: Dynamic localization of the cyanobacterial circadian clock proteins. Curr Biol 2014, 24:1836–1844, https://doi.org/10.1016/j.cub.2014.07.036.

      Pattanayak GK, et al.: Daily cycles of reversible protein condensation in cyanobacteria. Cell Rep 2020, 32:108032, https://doi.org/10.1016/j.celrep.2020.108032.

      Xiao Y, Yuan Y, Jimenez M, Soni N, Yadlapalli S: Clock proteins regulate spatiotemporal organization of clock genes to control circadian rhythms. Proc Natl Acad Sci U S A 2021, 118, https://doi.org/10.1073/pnas.2019756118.

      Bartholomai BM, Gladfelter AS, Loros JJ, Dunlap JC. 2022 PRD-2 mediates clock-regulated perinuclear localization of clock gene RNAs within the circadian cycle of Neurospora. Proc Natl Acad Sci U S A. 119(31):e2203078119. doi: 10.1073/pnas.2203078119.

      Yuan et al., Curr Biol 78: 102129, 2022. https://doi.org/10.1016/j.ceb.2022.102129

      Pancheng Xie, Xiaowen Xie, Congrong Ye, Kevin M. Dean, Isara Laothamatas , S K Tahajjul Taufique, Joseph Takahashi, Shin Yamazaki, Ying Xu, and Yi Liu (2024). Mammalian circadian clock proteins form dynamic interacting microbodies distinct from phase separation. Proc. Nat. Acad. Sci. USA. In press.

    1. Author Response

      The following is the authors’ response to the original reviews.

      We thank the reviewers and editors for their time and careful consideration of this study. Nearly every comment proved to be highly constructive and thoughtful, and as a result, the manuscript has undergone major revisions including the title, all figures, associated conclusions and web app. We feel that the revised resource provides a more systematic and comprehensive approach to correlating inter-individual transcript patterns across tissues for analysis of organ cross-talk. Moreover, the manuscript has been restructured to highlight utility of the web tool for queries of genes and pathways, as opposed to focused discrete examples of cherry-picked mechanisms. A few key revisions include:

      • Manuscript: All figures have been revised to place to explore broad pathway representation. These analyses have replaced the previous circadian and muscle-hippocampal figures to emphasize ability to recapitulate known physiology and remove the discovery portion which has not been validate experimentally.

      • Manuscript: The term “genetic correlation” or “genetically-derived” has been replaced throughout with “transcriptional”, “inter-individual”, or mostly just “correlations”.

      • Manuscript: A new figure (revised fig 2) has been added to evaluate the innate correlation structure of data used for common metabolic pathways, in addition an exploration of which tissues generally show more co-correlation and centrality among correlations.

      • Manuscript: A new figure (revised fig 4) has been added to highlight the utility of exploring gene ~ trait correlations in mouse populations, where controlled diets can be compared directly. These highlight sex hormone receptor correlations with the large amount of available clinical traits, which differ entirely depending on the tissue of expression and/or diet in mouse populations.

      • Web tool: Addition of a mouse section to query expression correlations among diverse inbred strains and associated traits from chow or HFHS diet within the hybrid mouse diversity panel.

      • Web tool: Overrepresentation analysis for pathway enrichments have been replaced with score-based gene set enrichment analyses and including network topology views for GSEA outputs.

      • Web tool: Associated github repository containing scripts for apps now include a detailed walk-through of the interface and definitions for each query and term.

      Public Reviews:

      Reviewer #1 (Public Review):

      Zhou et al. have set up a study to examine how metabolism is regulated across the organism by taking a combined approach looking at gene expression in multiple tissues, as well as analysis of the blood. Specifically, they have created a tool for easily analyzing data from GTEx across 18 tissues in 310 people. In principle, this approach should be expandable to any dataset where multiple tissues of data were collected from the same individuals. While not necessary, it would also raise my interest to see the "Mouse(coming soon)" selection functional, given that the authors have good access to multi-tissue transcriptomics done in similarly large mouse cohorts.

      Summary

      The authors have assembled a web tool that helps analyze multiple tissues' datasets together, with the aim of identifying how metabolic pathways and gene regulation are connected across tissues. This makes sense conceptually and the web tool is easy to use and runs reasonably quickly, considering the size of the data. I like the tool and I think the approach is necessary and surprisingly under-served; there is a lot of focus on multi-omics recently, but much less on doing a good job of integrating multi-tissue datasets even within a single omics layer.

      What I am less convinced about is the "Research Article" aspect of this paper. Studying circadian rhythm in GTEx data seems risky to me, given the huge range in circadian clock in the sample collection. I also wonder (although this is not even remotely in my expertise) whether the circadian rhythm also gets rather desynchronized in people dying of natural causes - although I suppose this could be said for any gene expression pathway. Similarly for looking at secreted proteins in Figure 4 looking at muscle-hippocampus transcript levels for ADAMTS17 doesn't make sense to me - of all tissue pairs to make a vignette about to demonstrate the method, this is not an intuitive choice to me. The "within muscle" results look fine but panels C-E-G look like noise to me...especially panel C and G are almost certainly noise, since those are pathways with gene counts of 2 and 1 respectively.

      I think this is an important effort and a good basis but a significant revision is necessary. This can devote more time and space to explaining the methodology and for ensuring that the results shown are actually significant. This could be done by checking a mix of negative controls (e.g. by shuffling gene labels and data) and a more comprehensive look at "positive" genes, so that it can be clearly shown that the genes shown in Fig 1 and 2 are not cherry-picked. For Figure 3, I suspect you would get almost an identical figure if instead of showing pan-tissue circadian clock correlations, you instead selected the electron transport chain, or the ribosome, or any other pathway that has genes that are expressed across all tissues. You show that colon and heart have relatively high connectivity to other tissues, but this may be common to other pathways as well.

      Response: We are thankful to the reviewer in their detailed assessment of the manuscript. The comments raised in both the public and suggested reviews clearly improved the revised study and helped to identify limitations. In general, we have removed data suggesting “discovery” using these generalized analyses, such as removing figures evaluating circadian rhythm genes and muscle-hippocampus correlations. These have been replaced with more thorough investigations of tissue correlation structure and potentially identified regions of data sparsity which are important for users to consider. Also, we have added a similar full detailed pipeline of mouse (HMDP) data and highlighted in the manuscript by showing transcript ~ trait correlations of sex hormone receptor genes which differ between organs and diets. Further responses to individual points are also provided below.

      Reviewer #2 (Public Review):

      Summary:

      Zhou et al. use publicly available GTEx data of 18 metabolic tissues from 310 individuals to explore gene expression correlation patterns within-tissue and across-tissues. They detect signatures of known metabolic signaling biology, such as ADIPOQ's role in fatty acid metabolism in adipose tissue. They also emphasize that their approach can help generate new hypotheses, such as the colon playing an important role in circadian clock maintenance. To aid researchers in querying their own genes of interest in metabolic tissues, they have developed an easy-to-use webtool (GD-CAT).

      This study makes reasonable conclusions from its data, and the webtool would be useful to researchers focused on metabolic signaling. However, some misconceptions need to be corrected, as well as greater clarification of the methodology used.

      Strengths:

      GTEx is a very powerful resource for many areas of biomedicine, and this study represents a valid use of gene co-expression network methodology. The authors do a good job of providing examples confirming known signaling biology as well as the potential to discover promising signatures of novel biology for follow-up and future studies. The webtool, GD-CAT, is easy to use and allows researchers with genes and tissues of interest to perform the same analyses in the same GTEx data.

      Weaknesses:

      A key weakness of the paper is that this study does not involve genetic correlations, which is used in the title and throughout the manuscript, but rather gene co-expression networks. The authors do mention the classic limitation that correlation does not imply causation, but this caveat is even more important given that these are not genetic correlations. Given that the goal of their study aligns closely with multi-tissue WGCNA, which is not a new idea (e.g., Talukdar et al. 2016; https://doi.org/10.1016/j.cels.2016.02.002), it is surprising that the authors only use WGCNA for its robust correlation estimation (bicor), but not its latent factor/module estimation, which could potentially capture cross-tissue signaling patterns. It is possible that the biological signals of interest would be drowned out by all the other variation in the data but given that this is a conventional step in WGCNA, it is a weakness that the authors do not use it or discuss it.

      Response: Thank you for the helpful and detailed suggestions regarding the study. The review raised some important points regarding methodological interpretations (ex. bicor-exclusive application as opposed to module-based approaches), as well as clarification of “genetic” inferences throughout the study. The comparison to module-based approaches has also now been discussed directly, pointing our considerations and advantages to each. We hope that the reviewer with our corrections to the misconceptions posed, many of which we feel were due to our insufficient description of methodological details and underlying interpretations. The revised manuscript, web portal and associated github provide much more detail and many more responses to specific points are provided below.

      Reviewer #3 (Public Review):

      Summary: A useful and potentially powerful analysis of gene expression correlations across major organ and tissue systems that exploits a subset of 310 humans from the GTEx collection (subjects for whom there are uniformly processed postmortem RNA-seq data for 18 tissues or organs). The analysis is complemented by a Shiny R application web service.

      The need for more multisystems analysis of transcript correlation is very well motivated by the authors. Their work should be contrasted with more simple comparisons of correlation structure within different organs and tissues, rather than actual correlations across organs and tissues.

      Strengths and Weaknesses: The strengths and limitations of this work trace back to the nature of the GTEx data set itself. The authors refer to the correlations of transcripts as "gene" and "genetic" correlations throughout. In fact, they name their web service "Genetically-Derived Correlations Across Tissues". But all GTEx subjects had strong exposure to unique environments and all correlations will be driven by developmental and environmental factors, age, sex differences, and shared and unshared pre- and postmortem technical artifacts. In fact we know that the heritability of transcript levels is generally low, often well under 25%, even studies of animals with tight environmental control.

      This criticism does not comment materially detract for the importance and utility of the correlations-whether genetic, GXE, or purely environmental-but it does mean that the authors should ideally restructure and reword text so as to NOT claim so much for "genetics". It may be possible to incorporate estimates of chip heritability of transcripts into this work if the genetic component of correlations is regarded as critical (all GTEx cases have genotypes).

      Appraisal of Work on the Field: There are two parts to this paper: 1. "case studies" of cross-tissue/organ correlations and 2. the creation of an R/Shiny application to make this type of analysis much more practical for any biologist. Both parts of the work are of high potential value, but neither is fully developed. My own opinion is that the R/Shiny component is the more important immediate contribution and that the "case studies" could be placed in the context of a more complete primer. Or Alternatively, the case studies could be their own independent contributions with more validation.

      Response: We thank the reviewer for their supportive and helpful comments. The discussion of usage of the term “genetic” has been removed entirely from the manuscript as this point was made by all reviewers. Further, we have revised the previous study to focus on more detailed investigations of why transcript isoforms seemed correlated between tissues and areas where datasets are insufficient to provide sufficient information (ex. Kidney in GTEx). As the reviewer points out, the previous “case studies” were unvalidated and incomplete and as a result, have been replaced. Additional points below have been revised to present a more comprehensive analyses of transcript correlations across tissues and improved web tool.

      (Recommendations For The Authors):

      As this manuscript is focused on the analytical process rather than the biological findings, the reviewer concerns are not a fundamental issue to subsequent acceptance of the paper, but some of the examples will need to be replaced or double-checked to ensure their biological and statistical relevance. To raise the scope and interest of the method developed, it would be seen very positively to include additional datasets, as the authors seem to have intended to have done, with a non-functional (and highlighted as such) selection for mouse data. Establishing that the authors can easily - and will easily - add additional datasets into their tool would greatly raise the reviewers' confidence in the methodology/resource aspect of this paper. This may also help address the significant concerns that all three reviewers raised with the biological examples, e.g. that GTEx data is so uncontrolled that studying environmentally-influenced traits such as circadian rhythm may be challenging or even impossible to do properly. Adding in a more highly controlled set of cross-tissue mouse data may be able to address both these concerns at once, i.e. the resource concern (can the website easily be updated with new data) and the biological concern (are the results from these vignettes actually statistically significant).

      Reviewer #1 (Recommendations For The Authors):

      Comments, in approximately reverse order of importance

      1. Some figure panels are not referenced in the text, e.g. Fig 1B and Figure 2E. Response: Thank you for pointing this out. We have revised every figure in the manuscript and additionally gone through to make sure every panel is referenced in the text.

      2. The authors mention "genetic data" several times but I don't see anything about DNA. By "genetic data" do you mean "transcriptome expression data," or something else?

      Response: This is an important point, also raised by all 3 reviewers. We have clarified in the abstract, results and discussion that correlations are between transcripts. As a result, all mentions of “genetics” or “genetic data” has been removed, with the exception of introducing mouse genetic reference panels.

      1. For Figure 3, the authors look at circadian clock data, but the GTEx data is from all sorts of different times of day from across the patient cohort depending on when the donor died, and I don't see this metadata actually mentioned anywhere. I see Arntl Clock and all the other circadian genes are highly coexpressed in each tissue (except not so strong in liver) but correlation across tissue seems more random. Also hypothalamus seems to be very strongly negatively correlated with spleen, but this large green block doesn't have significance? That is surprising to me, since the sample sizes are all equivalent I would expect any correlation remotely close to -1.0 to be highly significant.

      Response: The reviewer raises several important points with regard to the source of data and underlying interpretations. We have added a revised Fig 2, suggesting that representation of gene expression between tissues can be strongly biased by nature of samples (ex. differences in data that is available for each tissue) and also discussed considerations of the nature of sample origin in the limitations section. We have also used some of these points when introducing rationale for using mouse population data. As a result of comments from this reviewer and others, we have removed the circadian rhythm analysis and muscle-hippocampal figures from the revised study; however, specifically mentioned these cohort differences in the discussion section (lines 294-298). Circadian rhythm terms are also evaluated in Fig 2 and consistent with the reviewers concerns, less overall correlations are observed between transcripts across tissues when compared to other common GO terms assessed.

      1. Figure 4, this is all transcript-level data, so it is confusing to see protein nomenclature used, e.g. "expression of muscle ADAMTS17" should be "expression of muscle ADAMTS17" (ADAMTS17 the transcript should be in italics, in case the formatting is removed by the eLife portal). Same for FNDC5. In the figures you do have those in italics, so it is just an issue in the manuscript text. In general please look through the text and make sure whether you are referring really to a "gene," "transcript," or "protein." For instance, Figure 1 legend I think should be "A, All transcripts across the ... with local subcutaneous and muscle transcript expression." I know people still sometimes use "gene expression" to refer to transcripts, but now that proteomics is pretty mainstream, I would push for more careful vocabulary here.

      Response: Thank you for pointing these out. While we have replaced Fig 4 entirely as to limit the unvalidated discovery or research aspects of the paper, we have gone through the text and figures to check that the correct formatting is used for references to human genes (capitalized italics) or the newly-included mouse genes (lower-case italics).

      1. "Briefly, these data were filtered to retain genes which were detected across individuals where individuals were required to show counts > 0 in 1.2e6 gene-tissue combinations across all data." I don't quite understand the filtering metric here - what is 1.2 million gene-tissue combinations referring to? 20k genes times 18 tissues times 310 people is ~100 million measurements, but for a given gene across 310 people * 18 tissues that is only ~6000 quantifications per gene.

      Response: We apologize for this oversight, as the numbers were derived from the whole GTEx dataset in total and not the tissues used for the current study. We have clarified this point in the revised manuscript (methods section in Datasets used) and also removed confusing references to specific numbers of transcripts and tissues unless made clear.

      1. Generally I think your approach makes sense conceptually but... for the specific example used in e.g. figure 4, this only makes sense to me if applied to proteins and not to transcripts. Looking at the transcript levels per tissue for genes which are secreted could be interesting but this specific example is confusing, as is the tissue selected. I would not really expect much crosstalk between the hippocampus and the muscle, especially not in terms of secreted proteins.

      Response: This is a valid point, also raised by other reviewers. While we wanted to highlight the one potentially-new (ADAMTS7) and two established proteins (FNDC5 and ERFE) and their correlations, the fact that this direct circuit remains to be validated led us to replace the figure entirely. The point raised about inference of protein secretion compared to action; however, has been expanded upon in the results and discussion. We now show that complexities arise when using this approach to infer mechanisms of proteins which are primarily regulated post-transcriptionally. We provide a revised Supplemental Fig 4 showing that this general framework, when applied to expression of INS (insulin), almost exclusively captured pathways leading to its secretion and not action.

      1. It's not clear to me how correction for multiple testing is working in the analyses used in this manuscript. You mention q-values so I am sure it was done, I just don't see the precise method mentioned in the Methods section.

      Response: We apologize for this oversight and have included a specific mention of qvalue adjustment using BH methods, where our reasoning was the efficiency in run-time (compared to other qvalue methods). In addition, we provide a revised Fig 2 which suggests that innate correlation structure exists between tissues for a variety of pathways which should be considered. We also compare several empirical bicor pvalues and qvalue adjustments directly between these large pathways where much of the innate tissue correlation structure does appear present when BH qvalue adjustments are applied (revised Fig 2A).

      1. The piecharts in Figure 1 are interesting - I would actually be curious which tissues generally have closer coexpression. This would be an absolutely massive number of pairwise correlations to test, but maybe there is a smarter way to do it? For instance, for ADIPOQ, skeletal muscle has the best typical correlation, but would that be generally true just that many adipose genes have closer relationship between the two tissues?

      Response: This comment inspired us to perform a more systematic query of global gene-gene correlation structures, which is now shown as the revised Fig 2A. With respect to ADIPOQ, the reviewer is correct in that there does appear to be a general pattern of muscle genes showing stronger correlation with adipose genes. We emphasize and discuss there in the revised manuscript to point out that global trends of tissue correlation structure should be taken into account when looking at specific genes. Much of this innate co-correlation structure could be normalized by the BH qvalue adjustment (above); however, strongly correlated pathways like mitochondria showed selective patterns throughout thresholds (revised Fig 2A). Further, we analyze KEGG terms and general correlation structures (revised Fig 2B) to point out the converse, that some tissues are just poorly represented. Interpretation of correlated genes from these organ and pathway combinations should be especially considered in the framework that their poor representation in the dataset clearly impacted the global correlation structures. We have added these points to both results and discussion. In sum, we feel that this was a critical point to explore and attempted to provide a framework to identify/consider in the revised manuscript.

      1. The pathway enrichments in Figure 1 are more difficult for me to interpret, e.g. for ADIPOQ, the scWAT pathways make sense, but the enriched skeletal muscle pathways are less clearly relevant (rRNA processing?? Not impossible but no clear relevance either). What are the significances for these pathway enrichments? Is it even possible to select a gene that has no peripheral pathway enrichment, e.g. if you take some random Gm#### or olfactory receptor gene and run the analysis, are you also going to see significant pathways selected, as pathway enrichment often has a trend to overfit? The "within organ" does seem to make sense, but I am also just looking at 4 anecdotes here and it is unclear whether they are cherry picked because they did make sense. That is, it's unclear why you selected ADIPOQ and not APOE or HMGCR or etc. I also don't figure out how I can make these pathway enrichment plots using your website. I do get the pie chart but when I try the enrichment analysis block (NB: typo on your website, it says "Enrich-E-ment Analysis" with an extra E) I always get that "the selected tissue do not contain enough genes to generate positive the enrichment." (Also two typos in that phrase; authors should check and review extensively for improvements to the use of English.) After trying several genes I eventually got it to work. I think there is some significant overfitting here, as I am pretty sure that XIST expression in the white adipose tissue has nothing to do with olfactory signalling pathways, which are the top positive network (but with an n = 4 genes).

      Response: Several good points within this comment. 1) the pathway enrichments have been revised completely. The reviewer provided a helpful suggestion of a rank-based approach to query pathways, as opposed to the previous over-representation tests. After evaluating several different pathway enrichment tools based on correlated tissue expression transcripts, a rank- and weight-based test (GSEA) captured the most physiologic pathways observed from known actions of select secreted proteins. Therefore, revised pathway enrichments and web-tool queries unitize a GSEA approach which accounts for the rank and weight determined by correlation coefficient. In implementing these new pathway approaches, we feel that pathway terms perform significantly better at capturing mechanisms. 2) With respect to the selection genes, we wanted to provide a framework for investigating genes which encode secreted proteins that signal as a result of the abundance of the protein alone. This is a group-bias; however, and not necessarily reflective of trying to tackle the most important physiologic mechanisms underlying human disease. We agree with the reviewer in those evaluating genes such as APOE and cholesterol synthesis enzymes present an exciting opportunity, our expertise in interpretation and mechanistic confirmation is limited. 3) We have gone through the revised manuscript and attempted to correct all grammatical and/or spelling mistakes.

      1. The network figures I get on your website look actually more interesting than the ones you have in Figure 2, which only stay within a tissue. Making networks within a tissue is pretty easy I think for any biologist today, but the cross-tissue analysis is still fairly hard due to the size of the datasets and correlation matrices.

      Response: We greatly appreciate the reviewer’s enthusiasm for the network model generation aspect. We have tried to improve the figure generation and expanded the gene size selection for network generation in the web tool, both within and across tissues. We are working toward allowing users to select specific pathway terms and/or tissue genes to include in these networks as well, but will need more time to implement.

      1. I get a bug with making networks for certain genes, e.g. XIST - Liver does not work for plotting network graphs. Maybe XIST is a suppressed gene because it has zero expression in males? It is an interesting gene to look at as a "positive control" for many analyses, since it shows that sample sexing is done correctly for all samples.

      Response: The reviewer recognized a key consideration in underlying data structure for GTEx. In the revised manuscript, we evaluated tissue representation (or lack thereof) being a crucial factor in driving where significant relationships cannot be observed in tissues such as kidney, liver and spleen (Fig 2). Moreover, the representation of females (self-reported) in GTEx is less-than half of males (100 compared to 210 individuals). We have emphasized this point in the discussion where we specifically pointed out the lack of XIST Liver correlation being a product of data structure/availability and not reflecting real biologic mechanisms. We expanded on this point by highlighting the clear sex-bias in terms of representation.

      1. On the network diagram on your website, there doesn't seem to be any way to zoom in on the website itself? You can make a PDF which is nice but the text is often very small and hard to read.

      Response: We have revised the web interface plot parameters to create a more uniform graph.

      1. On a related note, is it possible to output the raw data and gene lists for the network graph? I would want to know what are those genes and their correlation coefficient.

      Response: We have enabled explore as .pdf or .svg graphics for the network and all plots. In addition, following pie chart generation at the top of the web app, users now have the ability to download a .csv file containing the bicor coefficients, regression pvalues and adjusted qvalues for all other gene-tissue combinations.

      1. Some functionality issues, e.g. on the "Scatter plot" block, I input a gene name again here. Shouldn't this use the same gene selected already at the top of the page? It seems confusing to again select the gene and tissue here, but maybe there is a reason for that.

      Response: It would be more intuitive to only display genes from a given selected tissue for scatterplots; however, we chose to keep all possible combinations with the [perhaps unnecessary] option of reselecting a tissue to allow users to query any specific gene without having to wait to run the pathways for all that correspond to a given tissues.

      1. Figure 4H should also probably be Figure 1A.

      Response: Good point, the revised Fig 1A is now a summary of the web tool

      I realize I have written a fairly critical review that will require most of the figures to be redone, but I think the underlying method is sound and the implementation by and end-user is quite simple, so I think your group should have no trouble addressing these points.

      Response: Your comments were really helpful and we feel that the tool has significantly improved as a result. So, we are thankful to the time and effort put toward helping here.

      Reviewer #2 (Recommendations For The Authors)

      Comments on the use of "genetic correlation"

      • The use of "genetic correlation" in title and throughout the manuscript is misleading. Should broadly be replaced with "gene expression correlation". Within genetics, "genetic correlation" generally refers to the correlation between traits due to genetic variation, as would be expected under pleiotropy (genetic variation that affects multiple traits). Here, I think the authors are somewhat conflating "genetic" (normally referring to genetic variation) with "gene" (because the data are gene expression phenotypes). I don't think they perform any genetic analysis in the manuscript. I hope I don't sound too harsh. I think the paper still has merit and value, but it is important to correct the terminology.

      Response: This was an important clarification raised by all reviewers. We apologize for the oversight. As a result, all mentions of “genetics” or “genetic data” has been removed, with the exception of introducing mouse genetic reference panels. These have generally been replaced with “transcript correlations”, “correlations” or “correlations across individuals” to avoid confusion.

      • The authors note an important limitation in the Discussion that correlations don't imply a specific causal model between two genes, and furthermore note that statistical procedures (mediation and Mendelian randomization) are dependent on assumptions and really only a well-designed experiment can completely determine the relationship. This is a very important point that I greatly appreciate. I think they could even further expand this discussion. The potential relationships between gene A and gene B are more complex than causal and reactive. For example, a genetic variant or environmental exposure could regulate a gene that then has a cascade of effects on other genes, including A and B. They belong to a shared causal pathway (and are potentially biologically interesting), but it's good to emphasize that correlations can reflect many underlying causal relationships, some more or less interesting biologically.

      Response: We thank the reviewer for pointing this out. We have expanded both the results and discussion sections to mention specifically how correlation between two genes can be due to a variety of parameters, often and not just encompassing their relationship. We mention the importance of considering genetic and environmental variables in these relationships as well which we feel will be an important “take-home message” for the reader. These points were also explored in the revised Fig 2 in terms of investigating broad pathway gene-gene correlation structures. As noted by the reviewer, contexts such as circadian rhythm or other variables in the data which are not fixed show much less overall significance in terms of broad relationships across organs.

      • It would be good for the authors to provide more context for the methods they use, even when they are fully published. For example, stating that biweight midcorrelation (bicor) is an approach for comparing to variables that is more robust to outliers than traditional correlations and is commonly used with gene co-expression correlation.

      Response: Thank you for pointing this out. A lack of method description was also an important reason for lack of clarity on other aspects so we have done our best to detail what exact approaches are being implemented and why. In the revised manuscript, we mention the usage if bicor values to limit influence of outlier individuals in driving regressions, but also point out that it is still a generalized linear model to assess relationships. We hope that the revised methods and expanded git repositories which detail each analysis provide much more transparency on what is being implemented.

      • Performing a similar analysis based on genetic correlation is an interesting idea, as it would potentially simplify the underlying causal models (removing variation that doesn't stem from genetic variants). I don't expect the authors to do this for this paper because it would be a significant amount of work (fitting and testing genetic correlations are not as straightforward). But still, an interesting idea to think about, and individuals in GTEx are genotyped I believe. Could be mentioned in the Discussion.

      Response: Absolutely. While we did not implement and models of genetic correlation (despite misusing the term) in this analysis. We have added to the discussion on how when genetic data is available, these approaches offer another way to tease out potentially causal interactions among the large amount of correlated data occurring for a variety of reasons.

      Comments on use of the term "local" and "regression"

      • "Local" is largely used to mean within-tissue, so how correlated gene X in tissue Y is with other genes in tissue Y. I think this needs to be defined explicitly early in the manuscript or possibly replaced with something like "within-tissue".

      Response: We have replaced al “local” mentions with “within-tissue” or simply name the tissue that the gene is expressed to avoid confusion with other terms of local (ex a transcript in proximity to where it is encoded on the genome).

      • "Regression" is also used frequently throughout, often when I think "correlation" would be more accurate. It's true that the regression coefficient is a function of the correlation between X and Y, but I don't think actual regression (the procedure) applies here. The coefficients being used are bicor, which I don't think relates as cleanly to linear regression.

      Response: Thank you for pointing this out. A lack of method description was also an important reason for lack of clarity on other aspects so we have done our best to detail what exact approaches are being implemented and why. In the revised manuscript, we mention the usage if bicor values to limit influence of outlier individuals in driving correlations, but also point out that it is still a generalized linear model to assess relationships. Further, we have removed usage of “regression” when referencing bicor values. We hope that the revised methods and expanded git repositories which detail each analysis provide much more transparency on what is being implemented.

      • "Further, pan-tissue correlations tend to be dominated by local regressions where a given gene is expressed. This is due to the fact that within-tissue correlations could capture both the regulatory and putative consequences of gene regulation, and distinguishing between the two presents a significant challenge" (lines 219-223). This sentence includes both "local" and "regressions" (and would be improved by my suggested changes I think), but I also don't fully understand the argument of "regulatory and putative consequences". I think the authors should elaborate further. In the examples, the within-tissue correlations do look stronger, suggesting within-tissue regulation that is quite strong and potentially secondary inter-tissue regulation. If that's the idea, I think it can be stated more clearly.

      Response: Thank you for pointing this out. We have revised the sentence to state the following:

      Further, many correlations tend to be dominated by genes expressed within the same organ. This could be due to the fact that, within-tissue correlations could capture both the pathways regulating expression of a gene, as well as potential consequences of changes in expression/function, and distinguishing between the two presents a significant challenge. For example, a GD-CAT query of insulin (INS) expression in pancreas shows exclusive enrichments in pancreas and corresponding pathway terms reflect regulatory mechanisms such as secretion and ion transport (Supplemental Fig 4).

      We feel that this point might not be intuitive, so have included a new figure (Supplemental Fig 4) which contains the tissue correlations and pathways for INS expression in pancreas. These analyses show an example where co-correlation structure seems almost entirely dominated by genes within the same organ (pancreas) and GSEA enrichments highlight many known pathways which are involved in regulating the expression/secretion of the gene/protein. We hope that this makes the point more clearly to the reader.

      Additional comments on Results:

      • I would break the titled Results sections into multiple paragraphs. For example, the first section (lines 84-129) has a few natural breakpoints that I noticed that would potentially make it feel less over-whelming to the reader.

      Response: We have broken up the results section into separate paragraphs in the revised manuscript. In addition, we have gone through to try and make sure that the amount of information per block/sentence focuses on key points.

      • "Expression of a gene and its corresponding protein can show substantial discordances depending on the dataset used" (line 224 of Results). This is a good point, and the authors could include citations here of studies that show discordance between transcripts and proteins, of which there are a good number. They could also add some biological context, such as saying differences could reflect post-translational regulation, etc.

      Response: Thank you for the supportive comment. We have referenced several comprehensive reviews of the topic, each of which contain tables summarizing details of mRNA-protein correlation. The revised discussion sentence is as follows:

      Expression of a gene and its corresponding protein can show substantial discordances depending on the dataset used. These have been discussed in detail39–41, but ranges of co-correlation can vary widely depending on the datasets used and approaches taken. We note that for genes encoding proteins where actions from acute secretion grossly outweigh patterns of gene expression, such as insulin, caution should be taken when interpreting results. As the depth and availability of tissue-specific proteomic levels across diverse individuals continues to increase, an exciting opportunity is presented to explore the applicability of these analyses and identify areas when gene expression is not a sufficient measure.

      1. Liu, Y., Beyer, A. & Aebersold, R. On the Dependency of Cellular Protein Levels on mRNA Abundance. Cell 165, 535–550 (2016).

      2. Maier, T., Güell, M. & Serrano, L. Correlation of mRNA and protein in complex biological samples. FEBS Letters 583, 3966–3973 (2009).

      3. Buccitelli, C. & Selbach, M. mRNAs, proteins and the emerging principles of gene expression control. Nat Rev Genet 21, 630–644 (2020).

      • In many ways, this work has similar goals to many studies that have performed multi-tissue WGCNA (e.g., Talukdar et al. 2016; https://doi.org/10.1016/j.cels.2016.02.002). In this manuscript, WGCNA's conventional approach to estimating robust correlations (bicor) is used, but they do not use WGCNA's data reduction/clustering functionality to estimate modules. Perhaps the modules would miss the signaling relationships of interest, being sort of lost in the presence of stronger signals that aren't relevant to the biological questions here. But I think it would be good for the authors to explain why they didn't use the full WGCNA approach.

      Response: This is an important point and we also feel that the previous lack of methodological details and discussion did a poor job at distinguishing why module-based approaches were not used. We wanted to be careful not to emphasize one approach being superior/inferior to another, rather point out the different considerations and when a direct correlation might inform a given question. As the reviewer points out, our general feeling is that adopting a simple gene-focused correlation approach allows users to view mechanisms through the lens of a single gene; however, this is limited in that these could be influenced by cumulative patterns of correlation structure (for example mitochondria in revised Fig 2A) which would be much more apparent in a module-based approach. This comment, in combination with the other listed above, was our motivation in exploring cumulative patterns of gene-gene correlations in the revised Fig 2. In the revised manuscript, we expanded on the results and discussion section to highlight utility of these types of approaches compared to module-based methods:

      The queries provided in GD-CAT use fairly simple linear models to infer organ-organ signaling; however, more sophisticated methods can also be applied in an informative fashion. For example, Koplev et al generated co-expression modules from 9 tissues in the STARNET dataset, where construction of a massive Bayesian network uncovered interactions between correlated modules6. These approaches expanded on analysis of STAGE data to construct network models using WGCNA across tissues and relating these resulting eigenvectors to outcomes42. The generalized approach of constructing cross-tissue gene regulatory modules presents appeal in that genes are able to be viewed in the context of a network with respect to all other gene-tissue combinations. In searching through these types of expanded networks, individuals can identify where the most compelling global relationships occur. One challenge with this type of approach; however, is that coregulated pathways and module members are highly subjective to parameters used to construct GRNs (for example reassignment threshold in WGCNA) and can be difficult in arriving at a “ground truth” for parameter selection. We note that the WGCNA package is also implemented in these analyses, but solely to perform gene-focused correlations using biweight midcorrelation to limit outlier inflation. While the midweight bicorrelation approach to calculate correlations could also be replaced with more sophisticated models, one consideration would be a concern of overfitting models and thus, biasing outcomes.

      Additional comments on Discussion:

      • In the second paragraph of the Discussion (lines 231-244), the authors mention that GD-CAT uses linear models to compare data between organs and point to other methods that use more complex or elaborate models. It's good to cite these methods, but I think they could more directly state that there are limitations to high complexity models, such as over-fitting.

      Response: Thank you for this suggestion. We have added a line (above) mentioning the overfitting concern.

      Comments on Methods:

      • The described gene filtration in the Methods of including genes with non-zero expression for 1.2e6 gene-tissue combinations is confusing. If there are 310 individuals and 18 tissues, for a given gene, aren't there only 5,580 possible data points? Might be helpful to contextualize the cut-off in terms of like the average number of individuals with non-zero expression within a tissue.

      Response: We apologize for this error. This number was pasted from a previous dataset used and not appropriate for this manuscript. In general, we have removed specific mentions of total number of gene_tissue correlation combinations, as these numbers reflect large but almost meaningless quantifications. Instead, we expanded the methods in terms of how individuals and genes filtered.

      • More details should be given about the gene ontology/pathway enrichment analysis. I suspect that a set-based approach (e.g., hypergeometric test) was used, rather than a score-based approach. The authors don't state what universe of genes were used, i.e., the overall set of genes that the reduced set of interest is compared to. Seems like this could or should vary with the tissues that are being compared. A score-based approach could be interesting to consider (https://www.biorxiv.org/content/10.1101/060012v3), using the genetic correlations as the score, as this would remove the unappealing feature of sets being dependent on correlation thresholds. This isn't something that I would demand of the published paper, but it could be an appealing approach for the authors to consider and confirm similar results to the set-based analysis.

      Response: This is an important point. Following this suggestion, we evaluated several different rank- and weight-based pathway enrichment tools, including FGSEA and others. Ultimately, we concluded that GSEA performed significantly better at 1) recapitulating known biology of select secreted protein genes and 2) leveraging the large numbers of genes occurring at qvalue cutoffs without having to further refine (ex. in the previous overrepresentation tests). For this reason, all pathway enrichments in the web tools and manuscripts not contain GSEA outputs and corresponding pathway enrichments or network graph visualizations. Thank you for this suggestion.

      Comments on figures:

      • I think there is a bit of a missed opportunity to use the figures to introduce and build up the story for readers. For example, in Figure 1, plotting ADIPOQ expression against a correlated gene in adipose (local) as well as peripheral tissues. This doesn't need to be done for every example, but I think it would help readers understand what the data are, and what's being detected before jumping into higher level summaries.

      Response: Thank you, this point also builds on others which recommended to restructure the manuscript and figures. In the revised manuscript, we first introduce the web tool (which was last previously), and immediately highlight comparisons of within- and across-organ correlations, such as ADIPOQ. We feel that the revised manuscript presents a superior structure in terms of demonstrating the key points and utility of looking at gene-gene correlations across tissues.

      • Figures 1 and 4 are missing the color scale legend for the bar plots, so it's impossible to tell how significant the enrichments are.

      Response: We apologize for the oversight. The pathways in the revised Fig 1 detail pathway network graphs among the top pathways which should make interpretation more intuitive. We have also gone through and made sure that GSEA enrichment pvalues are now present for all figures including pathways (revised Fig 1, Fig 3 and supplemental Fig 4).

      • The Figure 2 caption says that edges are colored based on correlation sign? Are there any negative correlations (red)? They all look blue to me. The caption could also state that edge weight reflects correlation magnitude (I assume). It would be ideal to include a legend that links a range of the depicted edge weights to their genetic correlation, though I don't know how feasible that may be depending on the package being used to plot the networks.

      Response: Good catch. We included in the revised manuscript the network edge parameters: Network edges represent positive (blue) and negative (red) correlations and the thicknesses are determined by coefficients. They are set for a range of bicor=0.6 (minimum to include) to bicor=0.99

      Related to seeing a dominant pattern of positive correlations, we agree that this observation is fascinating and gene-gene correlations being dominated by positive coefficients will be the topic of a closely-following manuscript from the lab

      • Figure 4A would be more informative as boxplots, which could still include Ssec score. This would allow the reader to get a sense of the variation in correlation p-value across all hippocampus transcripts.

      Response: Related to comments from this reviewer and others, we have removed the previous Fig 4 entirely from the manuscript to emphasize the ability of these gene-gene correlations to capture known biology and limit the extend of unvalidated “suggested” new mechanisms.

      Comments on GD-CAT

      • The online webtool worked nicely for me. It was easy to use and produce figures like in the manuscript. One suggestion is show data points in the scatter plot rather than just the regression line (if that's possible currently, I didn't figure it out). A regression line isn't that interesting to look at, but seeing how noisy the data look around it is something humans can usually interpret intuitively.

      Response: Thank you so much. We are excited that the web tool works sufficiently. We have also revised the individual gene-gene correlation tab to show individual data points instead of simple regression lines.

      Minor comments:

      Response: Thank you for these detailed improvements

      • This sentence is awkwardly constructed: "Here, we surveyed gene-gene genetic correlation structure for ~6.1x10^12 gene pairs across 18 metabolic tissues in 310 individuals where variation of genes such as FGF21, ADIPOQ, GCG and IL6 showed enrichments which recapitulate experimental observations" (lines 68-70). It's an important sentence because it's where in the Abstract/Introduction the authors succinctly state what they did, thus I would re-work it to something like: "Here, we surveyed gene expression correlation structure..., identifying genes, such as FGF21, ADIPOQ, GCG and IL6, that possess correlation networks that recapitulate known biological pathways."

      Response: The numbers of pairs examined and dataset size have been removed for clarity and we have revised this statement and results as a whole

      • Prefer swapping "signal" for "signaling" in line 53 of Abstract/Introduction.

      Response: Done

      • Remove extra period in line 208 of Results.

      Response: Removed

      • Change "well-establish" to "well-established" in line 247 of Discussion.

      Response: Replaced

      • Missing commas in line 302 of Methods.

      Response: added

      • Missing comma in line 485 of Figure 3 caption.

      Response: The previous Fig 3 has been removed

      • Typo in title of Figure 3E (change "Perihperal" to "Peripheral")

      Response: Thank you, changed

      • Add y-axis label to y-axis labels (relative cell proportions) to Supplemental Figures 1-3.

      Response: These labels have been added

      Reviewer #3 (Recommendations For The Authors):

      Minor technical comment: The authors refer to correlations between genes when they actually mean correlations between GTEX transcript isoform models. It is exceedingly important to keep this distinction clear in the reader's mind, a fact that is emphasized by the authors themselves when they comment on the potential value of similar proteomic assays to evaluate multiorgan system communication. GTEx has tried to do proteomics but I do not know of any open data yet.

      Response: Thank you for this point. We have gone through the manuscript and replaced “gene correlations” with “transcript” or other similar mentions. Related to the comment on GTEx proteomics, this is an important point as well. As the reviewer mentions, proteomics has been performed on GTEx data; however, given that this dataset contains only 6 sparsely-represented individuals, analyses such as the ones highlighted in our study remain highly limited. We have added the following to the discussion: As the depth and availability of tissue-specific proteomic levels across diverse individuals continues to increase, an exciting opportunity is presented to explore the applicability of these analyses and identify areas when gene expression is not a sufficient measure. For example, mass-spec proteomics was recently performed on GTEx42; however, given that these data represent 6 individuals, analyses utilizing well-powered inter-individual correlations such as ours which contain 310 individuals remain limited n applications.

      The R/Shiny companion application: The community utility of this application would be greatly improved by a link to a primer and more basic functionality. The Github site is a "work in progress" and does not include a readme file or explanation (that I could find) on the license.

      Response: Thank you, we are excited that the apps operate sufficiently. We have revised the github repository entirely to contain a full walk-through of app details and parameter selections. These are meant to walk users through each step of the pipeline and discuss what is being done at each step. We agree that this updated github repository allows users to understand the details of the R/Shiny app in much more detail. We also made all the app scripts, datasets, markdown/walkthrough files and docker image fully available to enhance accessibility.

    1. Author Response

      We appreciate the reviewers’ and editors’ advice on further improving this manuscript. We have provided point by point responses to the reviewers’ comments mentioned below. A revised version of this manuscript will be uploaded within a few weeks.

      Authors’ response to Reviewer 1 comments:

      • We appreciate the reviewer’s time in highlighting the strengths and weaknesses of this manuscript.

      • Per the reviewer’s advice, we will provide further description of the methods in a revised version of this manuscript.

      • The interpretation about the biological threat in response to elevated glycosuria in renal Glut2 KO mice is based on our observation that these mice exhibit changes in acute phase proteins measured using plasma proteomics. We will further discuss this in a revised version of this manuscript.

      • We acknowledge that this manuscript provides a resource for future mechanistic studies. Because multiple secreted proteins are changed between the control and experimental groups, some of them could be causal and others corelative in the context of enhancing compensatory glucose production in response to elevated glycosuria. Through future studies we will determine the causal proteins that trigger the increase in glucose production and identify the tissues that secrete these proteins.

      • We have shown previously (Cordeiro et al., Diabetologia 2022) that renal Glut2 deficiency doesn’t change insulin sensitivity (i.e. renal Glut2 KO mice don’t exhibit insulin resistance despite the activation of the HPA axis). It is likely that the massive glycosuria in renal Glut2 KO mice may overcome or mask the phenotype of insulin resistance potentially induced by an increase in the stress hormones.

      • In this manuscript, our major goal was to determine how elevated glycosuria leads to an increase in compensatory glucose production. We are not suggesting renal Glut2 as a therapeutic in this manuscript (that was already demonstrated in our previously published manuscript, Cordeiro et al., Diabetologia 2022).

      Authors’ response to Reviewer 2 comments:

      1) Renal Glut2 KO mice didn’t exhibit sex differences for the variables reported in our previous manuscript (Cordeiro et al., Diabetologia 2022). Therefore, in the present manuscript we decided to use male or female mice depending on their availability for each reported experiment. Per the reviewer’s advice, we will describe these details including age and sexes in each figure legend.

      2) For the method description, we have cited previous publications and mentioned ‘as described previously’. Based on the reviewer’s suggestion we will further describe the methods in detail to clarify the reviewer’s concerns. In addition, we will include age and sexes in the legends of each figure.

      3) For littermate controls, we had used Glut2loxp/loxp mice (which are like WT controls as described in Cordeiro et al., Diabetologia 2022) that were injected with tamoxifen exactly in the same way as the experimental mice. Het mice for Cre were not used as controls because they would have confounded the results as pointed out by the reviewer.

      4) Because elevated HPA activity is known to increase blood glucose levels, we suggested ‘the HPA axis may…..’. Given the nature of this manuscript, we agree the secreted proteins identified using plasma proteomics could contribute to enhanced glucose production directly or through secondary mechanisms. Afferent renal denervation using capsaicin reduced blood glucose levels concomitant with the suppression of the HPA axis in renal Glut2 KO mice. Based on these findings we speculated that the HPA axis may be partly responsible for increasing glucose production in renal Glut2 KO mice.

      We had considered using CRF antagonist and glucocorticoid receptor antagonists to determine the causal role of the HPA axis in contributing to the increase in glucose production in renal Glut2 KO mice. However, these drugs activate compensatory mechanisms including changes in insulin sensitivity. Therefore, use of these drugs would further confound the results instead of providing a clarity on the causal role of the HPA axis in enhancing glucose production in renal Glut2 KO mice.

      5) We understand the reviewer’s concerns whether the results reported here are translatable to humans. Please note that expression of SGLT2 is not kidney-specific; therefore, pleiotropic effects of SGLT2 inhibition in tissues other than the kidney cannot be excluded in animal models and humans. In contrast, the mouse model reported in this manuscript is kidney-specific Glut2 KO mice. Therefore, phenotype produced in renal Glut2 KO mice cannot be directly compared with that produced after SGLT2 inhibition. It may be too early to speculate whether the results reported in this manuscript are translatable to humans.

      In the referred research papers by the reviewer, the authors have used either models of different types of diabetes or included individuals with diabetes in their study. Notedly, diabetes itself affects the HPA axis independently of SGLT2 or GLUT2 inhibition. Therefore, it may not be appropriate to compare results obtained from animals or individuals with diabetes with that reported in this manuscript from renal Glut2 KO mice.

      6) Yes, we are currently performing mechanistic studies including assessment of mitochondrial function in renal Glut2 KO mice to determine whether and how the kidneys sense loss of glucose in urine.

      7) We apologize for the lack of methods description. We will provide additional method details in a revised version of this manuscript. All the assays were performed as per manufacturer’s instructions. Aliquots of the same samples were used for analyses of the hormones and for consistency across different assays.

    1. Author Response

      We highly appreciate the constructive feedback provided by the reviewers, which we believe will greatly improve the quality of our work. We were encouraged to see that our manuscript was considered to be “important”, of “great interest” as well as to “yield valuable results”.

      We also highly appreciate the overall positive eLife assessment. However, we were surprised to read that our “results range from solid from inadequate”. This especially applies given the positive and engaging nature of the reviews which seem to mainly concern the results interpretation being “inadequate” rather than the results themselves. Hence, we kindly request a reconsideration of this aspect of the assessment.

      Moreover, there is one Reviewer comment we would like to address directly. Reviewer #3 pointed out that “this study did not conduct a direct association analysis between MetS and cognitive levels without considering subgroup comparisons.” and that “After a thor-ough review of the methods and results sections” she/he “found no direct or strong evidence supporting the authors' claim that the identified latent variables were related to more severe MetS to worse cognitive performance. While a sub-group comparison was conducted, it did not adequately account for confounding factors such as educational level.”.

      We appreciate the observations of Reviewer #3 regarding the absence of a direct association analysis between Metabolic Syndrome (MetS) and cognitive levels without subgroup comparisons, and the lack of evidence linking latent variables to MetS severity and cognitive performance. Our apologies for any confusion caused by unclear presentation. Our study incorporated association analyses between MetS, brain structure, and cognition using MetS components, regional cortical thickness, and cognitive performance data in a PLS. These analyses were separately performed on the UK Biobank and HCHS datasets, due to their distinct cognitive assessments. We adjusted for age, sex, and education in the subgroup analyses by removing their effects from the input variables. The primary latent variables demonstrated significant associations with MetS components, cortical thickness, and cognitive scores, indicating that higher obesity, blood pressure, lipidemia, and glycemia levels correlate with lower cognitive performance. These relationships are detailed in supplementary figures S15b and S16b, with negligible loadings for age, sex, and education, confirming effective deconfounding. We acknowledge the reviewer's constructive feedback and will enhance the clarity of the Methods and Results sections, including conducting a mediation analysis.

      Furthermore, we strive to incorporate the Reviewers’ other suggestions into the analysis. The revision will include major changes to the manuscript.

      In response to Reviewer #1:

      • We will revise considering non-fasting plasma glucose as a surrogate marker of insuline resistance.

      • We will report Field IDs of the used UK Biobank variables.

      • We aim to moderate causal interpretations and reword the indicated passages for clarity.

      In response to Reviewer #2:

      • We will reconsider claims of binarizing vascular dementia and Alzheimer’s dementia pathophysiology.

      • We will further explore the cell type associations of the other latent variables.

      • We will expand the discussion regarding conclusions from our results and the future outlook.

      In response to Reviewer #3.

      • We will add an additional flowchart to detail the virtual histology analysis.

      • We will add a discussion of the second latent variable.

      • We will conduct a mediation analysis to statistically assess the mediation effect of brain structure on the relationship between MetS and cognitive performance.

      We are convinced that with these revisions, our manuscript will align even more closely with the high standards of eLife and make a strong contribution to its distinguished portfolio. We thank you for your consideration.

    1. Author Response

      The following is the authors’ response to the original reviews.

      We are grateful to the reviewers for their remarks, which significantly improved the paper. We repeated the biochemical assay concerning SIRT6 activity on H3-K27Ac and quantified the results as requested. Please find our detailed answers bellow each recommendation of the reviewers.

      Major recommendations:

      1. Grammatical errors are still common; the authors may need to consider an external editing service if they intend to fix the problems as they indicate that they believe the errors have been removed. The Results section is relatively clean, but parts of the Abstract, Introduction, and Discussion are more difficult to understand, and errors are especially common in the Methods section and those parts of the manuscript that are new in this revision.

      We corrected the grammatical errors.

      1. The introduction doesn't mention the other structures published; this is considered to be a serious deficiency as it prevents the reader from understanding the context for the contributions described here. Withholding the comparison with (or mention of) the previously published work to the last sentence of the Discussion seems misleading and does not give the reader adequate ability to judge the novelty of the results presented in this manuscript.

      A paragraph comparing our paper to the other structures published appear at the end of the discussion. We feel this is still the right place for such a paragraph.

      1. The addition of the assay for deacetylation is a significant improvement over the initial submission. This is important both for validating the importance of the acidic patch contacts and for helping to resolve the conflicting reports regarding activity on H3-K27Ac. Given the importance of this assay for the impact of the manuscript, it is not clear why the authors chose to 1) put the data in the supplement instead of in the main manuscript, and 2) provide only single samples without quantitation. These both seem to be significant limitations.

      We repeated the experiment and provided quantification of the results. We placed the figure in the main manuscript.

      1. The authors should add text or a table to the Methods section explaining which maps were used for each figure. By our count, there are 8 maps and 5 models (plus MD models) based on two datasets, but the relationships among them are not clearly stated, and the names of the maps (such as "Zn-finger focused" and "Rossman-Fold-Focused") might be changed to be more helpful to the reader (for example, the latter includes more than the Rossman fold and might be renamed "Sirt6-focused"). The authors should also explain how the maps were validated, which data were deposited in public repositories, and why some data were not deposited. For example, no statistics or methods regarding how particles were separated into integrated vs. non-integrated motion are provided for the CryoDRGN models. Further, the "two principle movements" described are depicted in 4 maps from two CryoDRGN runs using two separate sets of particles, but the relationships among them are not defined clearly. Finally, the connectivity of densities in Fig 8 are not obvious in the submitted maps. Until these points are addressed, the work is considered incomplete.

      AND

      1. The PDB model provided for review and submitted to the PDB database shows loosely bound DNA at the nucleosomal entry/exit points near the binding site of SIRT6, but the maps provided for review and submitted to the EMDB show stronger density for the canonical location of the DNA expected at these sites. The CryoDRGN maps support a more extended conformation, but these maps were not deposited or provided for review so their validity cannot be assessed.

      We added a section to the methods listing the different maps used for the figures. We deposited the map we used to trance the H2A N-terminal tail (EMD-18497). Unfortunately, we couldn’t deposit the cryoDRGN maps as the deposition system either accepts composite maps, where the consensus should be deposited too or experimental maps, where the deposition of half maps are mandatory. Nevertheless, the cryoDRGN maps are available upon request. We also added a supplementary figure (Supplementary Fig 6) to show how the cryoDRGN analyses were performed.

      1. The orientation, angle and threshold used in Fig 1 make it difficult to see the multiple DNA orientations that are visible in the deposited consensus map. Examination of the map suggests that the DNA model submitted to PDB corresponds to a weaker DNA conformation than is present in the map where both DNA conformations are visible. The authors should consider modeling both conformations in their deposited model to provide a more complete, accurate representation of the data. It is concerning that a key conclusion of the manuscript is that the DNA conformation changes upon SIRT6 binding, but density for the canonical position is observable in Fig 8a.

      Figure 1 is showing the overall representation of the SIRT6 bound nucleosome structure. We show the DNA linker orientations in the subsequent figure. Figure 8 (now Figure 9) shows the rearrangement of the SIRT6 Rossmann fold domain not the DNA linker.

      1. Figure 4 needs a more complete legend, indicating that it is a hybrid of the consensus structure (one color) and the MD simulations (another color). In general, the colors used in the figure should be changed to make the main points more accessible.

      As there is a color code for the histones, changing colors might be confusing. The figure legend mentions that panels c, d and e are from MD simulations.

      Minor recommendations:

      1. Figures 2c, e, and f are not referenced in the text.

      We now referenced all figure panels in the text.

      1. Consider moving Supp. 5C to Fig. 2 as the models in that figure come from the CryoDRGN maps and not the consensus map.

      Supplemental Figure 5c show the DNA linker deviation upon SIRT6 binding from another angle. We prefer to keep it there.

      1.) Supp Fig 3 is labeled "ZnF-nucleosome" refinement, but this appears to come from Data Set #2 processing. The map might be labeled ZnF-nucleosome but then a mask should be shown that excludes the Rossman Fold. It is not clear if this is a focused refinement or just a 2.9 A map that was merged with the "Rossman-fold" map.

      We changed both supplemental figures accordingly.

      1. The orientation of Fig 2 b and e do not show the differences in these models as well as panels c and f. Panels b and e could be replaced with the 4 CryoDRGN maps.

      The models reflect the cryoDRGN maps and panels c and f were added to clarify the movement.

      1. The MD description should emphasize that the H3 tails are moving with respect to the active site, as it currently suggests the active site is moving.

      In the results and in the discussion section we mention that we observe new conformations of the H3 tail, not of the active site.

      1. The authors refer to the "flexibility of the Rossmann fold domain," but the Rossman Fold domain isn't flexible, the linkage to the ZnF is flexible. Perhaps "observed conformational space" or "dynamic Rossman-fold domain position" are meant.

      The text was changed accordingly.

      1. The H2A C-terminal tail present in Fig 1 (bottom right) and Figure 3e is not present in the model in Fig 4a,b.

      The H2A tails conformation was not resolved in the cryoDRGN maps so we didn’t model it.

      1. The crosslinking agent used is not specified.

      The crosslinking agent used is specified more clearly in the methods.

      1. Supp Table 1 and EM methods do not agree on the magnification for Dataset #1. Verify nominal versus binned magnification and reported pixel size.<br /> The magnification in the methods was changed.

      2. Fig 3F showing the difference between affinity for H2A and H2A.Z-containing nucleosomes would be more convincing with a titration rather than the current comparison of a single concentration.

      We agree with this remark however, we find single concentration comparison is convincing enough for the purposes of this paper as it is not a central finding.

      1. Fig S1 legend; both the Zn-finger and helix bundle are stated to be shown in green.

      Figure S1 legend was changed.

    1. Author Response

      The following is the authors’ response to the original reviews.

      Response to Reviewers:

      Thank you for taking the time to review our manuscript and provide us with helpful comments. Your comments enabled us to improve the clarity of the manuscript, in particular:

      1. We improved the organization of the figures by associating each supplemental figure with a main-text figure using the eLife “figure supplements” format.

      2. We reduced the length of figure captions where possible.

      3. We improved organizational clarity by adding a brief organizational summary statement at the beginning of the results section which outlines the contents of the results subsections in the context of the introduction. We took particular care to use the same language, so the parallelism is clearer.

      4. In addition, we made various modifications to the main text to improve clarity for the reader. For this we asked specific help of our biologist co-authors to indicate which aspects would benefit from further clarification to enable the broad biology readership of eLife to comprehend our research better.

      Reviewer #1 (Public Review):

      The authors sought to resolve the coordinated functions of the two muscles that primarily power flight in birds (supracoracoideus and pectoralis), with particular focus on the pectoralis. Technology has limited the ability to resolve some details of pectoralis function, so the authors developed a model that can make accurate predictions about this muscle's function during flight. The authors first measured aerodynamic forces, wing shape changes, and pectoralis muscle activity in flying doves. They used cutting-edge techniques for the aerodynamic and wing shape measurements and they used well-established methods to measure activity and length of the pectoralis muscle. The authors then developed two mathematical models to estimate the instantaneous force vector produced by the pectoralis throughout the wing stroke. Finally, the authors applied their mathematical models to other-sized birds in order to compare muscle physiology across species.

      The strength of the methods is that they smoothly incorporate techniques from many complementary fields to generate a comprehensive model of pectoralis muscle function during flight. The high-speed structured-light technique for quantifying surface area during flight is novel and cutting-edge, as is the aerodynamic force platform used. These methods push the boundaries of what has historically been used to quantify their respective aspects of bird flight and their use here is exciting. The methods used for measuring muscle activation and length are standard in the field. Together, these provide both a strong conceptual foundation for the model and highlight its novelty. This model allows for estimations of muscle function that are not feasible to measure in live birds during flight at present. The weakness of this approach is that it relies heavily on a series of assumptions. While the research presented in this paper makes use of powerful methods from multiple fields, those methods each have assumptions inherent to them that simplify the biological system of study. This reduction in the complexity of phenomena allows the specific measurements to be made. In joining the techniques of multiple fields to study the greater complexity of the phenomenon of interest, the assumptions are all incorporated also. Furthermore, assumptions are inherent to mathematical modeling of biological phenomena. That being said, the authors acknowledge and justify their assumptions at each step and their model seems to be quite good at predicting muscle function.

      Indeed, the authors achieve their aims. They effectively integrate methods from multiple disciplines to explore the coordination and function of the pectoralis and supracoracoideus muscles during flight. The conclusions that the authors derive from their model address the intended research aim.

      The authors demonstrate the value of such interdisciplinary research, especially in studying complex behaviors that are difficult or infeasible to measure in living animals. Additionally, this work provides predictions for muscle function that can be tested empirically. These methods are certainly valuable for understanding flight but also have implications for biologists studying movement and muscle function more generally.

      Thank you for your thorough and positive review. We appreciate that you read our manuscript carefully and gave detailed feedback.

      Recommendations For The Authors:

      I thought that your manuscript was very interesting and your integration of techniques from multiple fields was effective. You address the weaknesses I highlighted in the public review well throughout the manuscript.
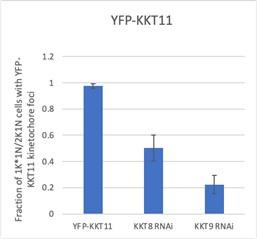
      Thank you for your well-measured feedback on this weakness and how we addressed it.

      I sometimes found that the manuscript was difficult to follow. With the interdisciplinary nature of your work, your manuscript has a lot of complexity. Your introduction is clear and I think that the last paragraph outlines your study very well. In the subsequent sections, the sub-headings are helpful, but I think your manuscript could be improved by indicating where those subsections fit into the phases you outline in your introduction (namely, muscle function, kinematics and aerodynamics, and mathematical modeling).

      Complied: throughout the manuscript we made modifications to improve the clarity. We also added a brief organizational summary statement at the beginning of the results section which outlines the contents of the results section in the context of the language introduced in the introduction. Finally, we reorganized the supplemental figures into eLife’s favored format of “figure supplements”, so that each extra figure is now associated with a figure in the main text. This should help the reader access information in an easier, hierarchical manner.

      Reviewer #2 (Public Review):

      In this work, the authors investigated the pectoralis work loop and the function of the supracoracoideus muscle in the down stroke during slow flight in doves. The aim of this study was to determine how aerodynamic force is generated, using simultaneous high-speed measurements of the wings' kinematics, aerodynamics, and activation and strain of pectoralis muscles during slow flight. The measurements show a reduction in the angle of attack during mid-downstroke, which induces a peak power factor and facilitates the tensioning of the supracoracoideus tendon with pectoralis power, which then can be released in the up-stroke. By combining the data with a muscle mechanics model, the timely tuning of elastic storage in the supracoracoideus tendon was examined and showed an improvement of the pectoralis work loop shape factor. Finally, other bird species were integrated into the model for a comparative investigation.

      The major strength of the methods is the simultaneous application of four high-speed techniques - to quantify kinematics, aerodynamics and muscle activation and strain - as well as the implementation of the time-resolved data into a muscle mechanics model. With a thorough analysis which supports the conclusions convincingly, the authors achieved their goal of reaching an improved understanding of the interplay of the pectoralis and supracoracoideus muscles during slow flight and the resulting energetic benefits.

      Thank you for your helpful and positive review. We appreciate that you summarized our manuscript accurately in a way that can help the reader.

      Recommendations For The Authors:

      The manuscript is very detailed and appears a bit long, including all the supplementary materials. It seems that the manuscript could easily have been separated into several publications, especially the comparative investigation including other extant bird species into the new model could have been a separate publication. This would have reduced the length of the supplements.

      Thank you for your feedback on our manuscript; we made numerous improvements to improve the readability. Hence, we decided to not cut the supplement short or split it into more papers. We chose eLife because we wanted to publish this study in one complete manuscript. This has three benefits: (1) The reader can find all information in one well-edited paper at one publisher that is open-access and high-quality. (2) The first author works in industry and gets no benefits from publishing multiple papers, and hence he opted to publish one with support of the author team. (3) The senior author is not interested in fragmented publishing. Rather, he writes fewer, more comprehensive integrative papers because that is ultimately more informative for the reader: one trusted published source has all that is important to know based on this completed research project. Overall, we weren’t able to find technical information that shouldn't go in the paper using the lens of reproducibility, so the supplement is relatively long. Combining three methods (kinematics, forces, muscles), of which two are only available in the senior author’s lab, and extensive math (two new integrative models plus scaling laws) requires sharing the information needed for replication for all approaches we combine.

      Also, some figure captions are very long and some of the content might have been included in the main text.

      Complied: thank you for helping us streamline the captions. We reviewed all the figure captions and removed material that is repeated in the main text, but not essential to understanding the figures. However, because of the length of the manuscript and our desire to make the manuscript readable and clear, we left all other text in the captions intact so they remain readable independently of the main text. This way, the reader does not have to go searching for information in the main text just to make sense of the figures. This is especially important because readers often read the figures first before deciding if they want to read the main text completely. In addition, we moved two panels from Figure 2 into its associated figure supplement, because it was not a main point in the text, and hence this helped reduce the length of the caption in figure 2.

    1. Author Response

      The authors wish to thank the Reviewers for valuable and constructive comments that will help up improve the paper’s quality.

      Public Reviews:

      Reviewer #1 (Public Review):

      Summary:

      This manuscript builds upon the authors' previous work on the cross-talk between transcription initiation and post-transcriptional events in yeast gene expression. These prior studies identified an mRNA 'imprinting' phenomenon linked to genes activated by the Rap1 transcription factor (TF), a surprising role for the Sfp1 TF in promoting RNA polymerase II (RNAPII) backtracking, and a role for the non-essential RNAPII subunits Rpb4/7 in the regulation of mRNA decay and translation. Here the authors aimed to extend these observations to provide a more coherent picture of the role of Sfp1 in transcription initiation and subsequent steps in gene expression. They provide evidence for (1) a physical interaction between Sfp1 and Rpb4, (2) Sfp1 binding and stabilization of mRNAs derived from genes whose promoters are bound by both Rap1 and Sfp1 and (3) an effect of Sfp1 on Rpb4 binding or conformation during transcription elongation.

      Strengths:

      This study provides evidence that a TF (yeast Sfp1), in addition to stimulating transcription initiation, can at some target genes interact with their mRNA transcripts and promote their stability. Sfp1 thus has a positive effect on two distinct regulatory steps. Furthermore, evidence is presented indicating that strong Sfp1 mRNA association requires both Rap1 and Sfp1 promoter binding and is increased at a sequence motif near the polyA track of many target mRNAs. Finally, they provide compelling evidence that Sfp1-bound mRNAs have higher levels of RNAPII backtracking and altered Rpb4 association or conformation compared to those not bound by Sfp1.

      Weaknesses:

      The Sfp1-Rpb4 association is supported only by a two-hybrid assay that is poorly described and lacks an important control. Furthermore, there is no evidence that this interaction is direct, nor are the interaction domains on either protein identified (or mutated to address function).

      Indeed, our two hybrid, immunoprecipitation and imaging results do not allow us to conclusively discern whether the interaction between Rpb4 and Sfp1 is direct or indirect. While the interaction holds significance, we consider the direct versus indirect distinction to be of secondary importance in the context of this paper. We intend to give more attention to this matter in our revised paper. In addition, we will make an effort to investigate an in vitro interaction between Sfp1 and Rpb4 by employing purified Sfp1 and Rpb4 proteins.

      The contention that Sfp1 nuclear export to the cytoplasm is transcription-dependent is not well supported by the experiments shown, which are not properly described in the text and are not accompanied by any primary data.

      We note that this assay has been developed and published in prior research by Lee, M. S., M. Henry, and P. A. Silver. (G&D, 1996) and was reported in a number of subsequent papers. Reassuringly, our conclusion is supported by the observation that Sfp1 binds to Pol II transcripts co-transcriptionally suggesting that Sfp1 is exported in the context of the mRNA.

      The presence of Sfp1 in P-bodies is of unclear relevance and the authors do not ask whether Sfp1-bound mRNAs are also present in these condensates.

      In the revised paper, we will indicate that we do not know whether RP mRNAs are present in the actual foci shown in Fig. 1B.

      Further analysis of Sfp1-bound mRNAs would be of interest, particularly to address the question of whether those from ribosomal protein genes and other growth-related genes that are known to display Sfp1 binding in their promoters are regulated (either stabilized or destabilized) by Sfp1.

      Fig. 4A, C and D show that RP mRNAs become destabilized in sfp1Δ cells.

      The authors need to discuss, and ideally address, the apparent paradox that their previous findings showed that Rap1 acts to destabilize its downstream transcripts, i.e. that it has the opposite effect of Sfp1 shown here.

      We would like to thank Reviewer 1 for this valuable comment. In the revised paper, we will delve into our hypothesis suggesting that Rap1 is likely responsible for regulating the imprinting of other proteins, that, in turn, lead to the destabilization of mRNAs, such as Rpb4.

      Finally, recent studies indicate that the drugs used here to measure mRNA stability induce a strong stress response accompanied by rapid and complex effects on transcription. Their relevance to mRNA stability in unstressed cells is questionable.

      Half-lives were determined mainly by the GRO analysis of optimally proliferating cells. This method does not requires any drug or stressful treatment. The results obtained by this method were consistent with the those obtained after thiolutin addition. Nevertheless, in our revised manuscript, we plan to supplement the half-life data with results obtained by subjecting cells to a temperature shift to 42°C, a natural method to block transcription in wild-type (WT) cells. This approach to determine half-lives has been previously reported in our publications, such as Lotan et al. (2005, 2007) and Goler Baron et al. (2008). This may rule out effects of the drug on halfe-life.

      Reviewer #2 (Public Review):

      Summary:

      The manuscript by Kelbert et al. presents results on the involvement of the yeast transcription factor Sfp1 in the stabilisation of transcripts whose synthesis it stimulates. Sfp1 is known to affect the synthesis of a number of important cellular transcripts, such as many of those that code for ribosomal proteins. The hypothesis that a transcription factor can remain bound to the nascent transcript and affect its cytoplasmic half-life is attractive, but the methods used to demonstrate the half-life effects and the association of Sfp1 with cytoplasmic transcripts remain to be fully validated, as explained in my comments on the results below:

      Comments on methodology and results:

      1. A two-hybrid-based assay for protein-protein interactions identified Sfp1, a transcription factor known for its effects on ribosomal protein gene expression, as interacting with Rpb4, a subunit of RNA polymerase II. Classical two-hybrid experiments depend on the presence of the tested proteins in the nucleus of yeast cells, suggesting that the observed interaction occurs in the nucleus. Unfortunately, the two-hybrid method cannot determine whether the interaction is direct or mediated by nucleic acids.

      Please see our response to comment 1 of Reviewer 1.

      1. Inactivation of nup49, a component of the nuclear pore complex, resulted in the redistribution of GFP-Sfp1 into the cytoplasm at the temperature non-permissive for the nup49-313 strain, suggesting that GFP-Sfp1 is a nucleo-cytoplasmic shuttling protein. This observation confirmed the dynamic nature of the nucleo-cytoplasmic distribution of Sfp1. For example, a similar redistribution to the cytoplasm was previously reported following rapamycin treatment and under starvation (Marion et al., PNAS 2004). In conjunction with the observation of an interaction with Rpb4, the authors observed slower nuclear import kinetics for GFP-Sfp1 in the absence of Rpb4 when cells were transferred to a glucose-containing medium after a period of starvation. Since the redistribution of GFP-Sfp1 was abolished in an rpb1-1/nup49-313 double mutant, the authors concluded that Sfp1 localisation to the cytoplasm depends on transcription. The double mutant yeast cells may show a variety of non-specific effects at the restrictive temperature, and whether transcription is required for Sfp1 cytoplasmic localisation remains incompletely demonstrated.

      We concur with Reviewer 2 that any heat inactivation of a temperature-sensitive (ts) protein can result in non-specific effects. In the instance of rpb1-1, these non-specific effects are anticipated because of the transcriptional arrest, which can eventually lead to a reduction in protein content. However, it is worth noting that this process takes some time, whereas the impact on export is more rapid. We note that that this assay has been developed and published in prior research by Pam Silver (op. cit.) and was reported in a number of subsequent papers. Reassuringly, our conclusion is supported by the observation that Sfp1 binds to Pol II transcripts co-transcriptionally.

      1. Under starvation conditions, which led to the presence of Sfp1 in the cytoplasm and have previously been correlated with a decrease in the transcription of Sfp1 target genes, the authors observed that a plasmid-based expressed GFP-Sfp1 accumulated in cytoplasmic foci. These foci were also labelled by P-body markers such as Dcp2 and Lsm1. The quality of the microscopic images provided does not allow to determine whether Rpb4-RFP colocalises with GFP-Sfp1.

      The submitted PDF figure is of low quality. We believe that high quality figure will be convincing.

      1. To understand to which RNA Sfp1 might bind, the authors used an N-terminally tagged fusion protein in a cross-linking and purification experiment. This method identified 264 transcripts for which the CRAC signal was considered positive and which mostly correspond to abundant mRNAs, including 74 ribosomal protein mRNAs or metabolic enzyme-abundant mRNAs such as PGK1. The authors did not provide evidence for the specificity of the observed CRAC signal, in particular, what would be the background of a similar experiment performed without UV cross-linking. In a validation experiment, the presence of several mRNAs in a purified SFP1 fraction was measured at levels that reflect the relative levels of RNA in a total RNA extract. Negative controls showing that abundant mRNAs not found in the CRAC experiment were clearly depleted from the purified fraction with Sfp1 would be crucial to assessing the specificity of the observed protein-RNA interactions. The CRAC-selected mRNAs were enriched for genes whose expression was previously shown to be upregulated upon Sfp1 overexpression (Albert et al., 2019). The presence of unspliced RPL30 pre-mRNA in the Sfp1 purification was interpreted as a sign of co-transcriptional assembly of Sfp1 into mRNA, but in the absence of valid negative controls, this hypothesis would require further experimental validation.

      We argue that the 264 CRAC+ genes represent a distinct group with many unique features. Moreover, many CRAC+ genes do not fall into the category of highly transcribed genes.

      The biological significance of the 264 CRAC+ mRNAs was demonstrated by various experiments; all are inconsistent with technical flaws. Some examples are:

      1. Fig. 2a and B show that most reads of CRAC+ mRNA were mapped to specific location – close the pA sites.
      2. Fig. 2C shows that most reads of CRAC+ mRNA were mapped to specific RNA motif.

      3. Most RiBi CRAC+ promoter contain Rap1 binding sites (p= 1.9x10⁻²²), whereas the vast majority of RiBi CRAC- promoters do not contain Rap1 binding site. (Fig. 3C).

      4. Fig. 4A shows that RiBi CRAC+ mRNAs become destabilized due to Sfp1 deletion, whereas RiBi CRAC- mRNAs do not. Fig. 4B shows similar results due to

      5. Fig. 6B shows that the impact of Sfp1 on backtracking is substantially higher for CRAC+ than for CRAC- genes. This is most clearly visible in RiBi genes.

      6. Fig. 7A shows that the Sfp1-dependent changes along the transcription units is substantially more rigorous for CRAC+ than for CRAC-.

      7. Fig. S4B Shows that chromatin binding profile of Sfp1 is different for CRAC+ and CRAC- genes

      Moreover, only a portion of the RiBi mRNAs binds Sfp1, despite similar expression of all RiBi.

      Most importantly, these genes do not all fall into the category of highly transcribed genes. On the contrary, as depicted in Figure 6A (green dots), it is evident that CRAC+ genes exhibit a diverse range of Rpb3 ChIP and GRO signals. Furthermore, as illustrated in Figure 7A, when comparing CRAC+ to Q1 (the most highly transcribed genes), it becomes evident that the Rpb4/Rpb3 profile of CRAC+ genes is not a result of high transcription levels. In our revised paper, we will give increased attention to this matter in the Discussion section.

      1. To address the important question of whether co-transcriptional assembly of Spf1 with transcripts could alter their stability, the authors first used a reporter system in which the RPL30 transcription unit is transferred to vectors under different transcriptional contexts, as previously described by the Choder laboratory (Bregman et al. 2011). While RPL30 expressed under an ACT1 promoter was barely detectable, the highest levels of RNA were observed in the context of the native upstream RPL30 sequence when Rap1 binding sites were also present. Sfp1 showed better association with reporter mRNAs containing Rap1 binding sites in the promoter region. However, removal of the Rap1 binding sites from the reporter vector also led to a drastic decrease in reporter mRNA levels. Whether the fraction of co-purified RNA is nuclear and co-transcriptional or not cannot be inferred from these results.

      The proposed co-transcriptional binding of Sfp1 is based on the findings presented in Figure 5C and Figure S2D, as well as the observed binding of Sfp1 to transcripts containing introns, as shown in Figures 2D and 3B. Our conclusion, which we still uphold, was drawn from the results presented in Figure 3. These results led us to the assertion that the "RNA-binding capacity of Sfp1 is regulated by Rap1-binding sites located at the promoter." We maintain our stance on this conclusion. Indeed, the Rap1 binding site does impact mRNA levels, as highlighted by Reviewer 2. However, "construct E," which possesses a promoter with a Rap1 binding site, exhibits lower transcript levels compared to "construct F," which lacks such a binding site in its promoter. Despite this difference in transcript levels, Sfp1 was able to pull down the former transcript but not the latter, even though expression of the former gene is relatively low. Thus, the results appear to be more reliant on the specific capacity of Sfp1 to interact with the transcript rather than on the transcript's expression level.

      1. To complement the biochemical data presented in the first part of the manuscript, the authors turned to the deletion or rapid depletion of SFP1 and used labelling experiments to assess changes in the rate of synthesis, abundance, and decay of mRNAs under these conditions. An important observation was that in the absence of Sfp1, mRNAs encoding ribosomal protein genes not only had a reduced synthesis rate but also an increased degradation rate. This important observation needs careful validation, as genomic run-on experiments were used to measure half-lives, and this particular method was found to give results that correlated poorly with other measures of half-life in yeast (e.g. Chappelboim et al., 2022 for a comparison). Similarly, the use of thiolutin to block transcription as a method of assessing mRNA half-life has been reported to be problematic, as thiolutin can specifically inhibit the degradation of ribosomal protein mRNA (Pelechano & Perez-Ortin, 2008). Specific repressible reporters, such as those used by Baudrimont et al. (2017), would need to be tested to validate the effect of Sfp1 on the half-life of specific mRNAs. Also, it would be very difficult to infer from the images presented whether the rate of deadenylation is altered by Sfp1.

      Various methods exist for assessing mRNA half-lives (HLs), and each of them carries its own set of challenges and biases. Consequently, it becomes problematic to directly compare HL values of a specific mRNA when different methods are employed. The superiority of one particular method over others remains unclear. However, they all exhibit a high degree of reliability when it comes to comparing different strains under the identical conditions using a single method.

      Estimating half-lives through the GRO approach is a non-invasive method, applied on optimally proliferating cells, which has been employed in numerous publications. While no method is without its limitations, we consider this approach to be among the most dependable. Our HL determination using thiolutin to block transcription provided results that were consistent with the values obtained by the GRO approach.

      Nevertheless, in our revised manuscript, we plan to supplement the HL data, obtain by thiolutin, with results obtained by subjecting cells to a temperature shift to 42°C, a natural method to block transcription in wild-type (WT) cells. This approach to determine HLs has been previously reported in our publications, such as Lotan et al. (2005, 2007) and Goler Baron et al. (2008).

      1. The effects of SFP1 on transcription were investigated by chromatin purification with Rpb3, a subunit of RNA polymerase, and the results were compared with synthesis rates determined by genomic run-on experiments. The decrease in polII presence on transcripts in the absence of SFP1 was not accompanied by a marked decrease in transcript output, suggesting an effect of Sfp1 in ensuring robust transcription and avoiding RNA polymerase backtracking. To further investigate the phenotypes associated with the depletion or absence of Sfp1, the authors examined the presence of Rpb4 along transcription units compared to Rpb3. One effect of spf1 deficiency was that this ratio, which decreased from the start of transcription towards the end of transcripts, increased slightly. The results presented are largely correlative and could arise from the focus on very specific types of mRNAs, such as those of ribosomal protein genes, which are sensitive to stress and are targeted by very active RNA degradation mechanisms activated, for example, under heat stress (Bresson et al., 2020).

      Figure 7A illustrates a significant reduction in Rpb4/Rpb3 ratios along the transcription unit in WT cells. This reduction is notably more pronounced in CRAC+ genes compared to the highly transcribed quartile (Q1), which includes all ribosomal protein (RP) genes, and it is completely absent in sfp1∆ cells. Furthermore, it's important to highlight that the CRAC+ gene group displays a wide range of transcription rates, as measured by either Rpb3 ChIP or GRO (Figure 6A). Given these observations, it is challenging to reconcile how the heightened sensitivity of RP mRNA degradation in response to stress could account for the more pronounced differences in the configuration of the Pol II elongation complex that are detected in CRAC+ genes under standard culture conditions in wt cells.

      Correlative studies are particularly informative when a gene mutation eliminates a correlation, and this is precisely the type of study depicted in Figure 7B-C. The configuration of elongating Pol II (as reflected by Rpb4/Rpb3 ratios) and the backtracking index are both transcriptional outputs. It is difficult to envision how stress-induced destabilization of RP mRNAs could explain the twofold higher correlation between these two parameters observed in CRAC+ genes under non-stressful conditions in WT cells (Figure 7B).

      Furthermore, it's worth noting that in WT cells, CRAC+ genes did not display any apparent unusual destabilization, but rather exhibited higher (not lower) mRNA stability compared to CRAC- genes (Figure 7C).

      Strengths: - Diversity of experimental approaches used - Validation of large-scale results with appropriate reporters

      Weaknesses: - Choice of evaluation method to test mRNA half-life - Lack of controls for the CRAC results

    1. Author Response

      The following is the authors’ response to the original reviews.

      Reviewer #1 (Recommendations For The Authors):

      Weaknesses: One minor weakness in this study is the conclusion that the guide RNAs didn't seem to have unique effects on GnRH cFos expression or the reproductive phenotypes. Though the data indicate a 60-70% knockdown for both gRNA2 and gRNA3, 3 of the 4 gRNA2 mice had no cFos expression in GnRH neurons during the time of the LH surge, whereas all mice receiving gRNA3 had at least some cFos/GnRH co-expression. In addition, when mice were re-categorized based on reduction (>75%) in kisspeptin expression, most of the mice in the unilateral or bilateral groups received gRNA2, whereas many of the mice that received gRNA3 were in the "normal" group with no disruption in kisspeptin expression. Thus, additional experiments with increased sample sizes are needed, even if the efficacy of the ESR1 knockdown was comparable before concluding these 2 gRNAs don't result in unique reproductive effects.

      Response: A draw back of the CRISPR approach is the substantial mosaicism in gene knockdown that is unavoidable due to the nature of DNA repair in each cell relying on several competing pathways. As such, variable knockdown occurs in each mouse as shown in Fig.1C. In the case of the correlation between RP3V ESR1 knockdown and cFos in GnRH neurons (Fig.4C), three gRNA3 and four 4 gRNA2 mice look to be very similar with two gRNA3 mice having knockdown but normal cFos activation. The reasons for this are not known and it is very likely chance that these two (of nine) mice happened to have received gRNA3. This issue becomes exacerbated when animal group numbers unintentionally become smaller with the re-grouping on the basis of kisspeptin expression. The key point here is that each “kisspeptin grouping” remains mixed in terms of gRNA2 and gRNA3 mice so that gRNA3 mice did contribute to the “bilateral group” even if it was only one of four mice. The practicalities of repeating this work are substantial and we do not think justified. We would note that we have previously used Kiss-Cre mice to undertake CRISPR knockdown of ESR1 in RP3V kisspeptin neurons but this failed to target sufficient cells with Cas9 to be experimentally useful.

      In Figure 2B (gRNA2), there appear to be 4 mice (4 lines) that have a normal cycle length and then drop to 0 for the cycle length. However, in the Figure legend, it states that there were 3 gRNA2 mice that had a cycle length of 0. Can the authors clarify if it was 4 mice (as indicated in Figure 2B) or 3 mice (as indicated in the legend) that received gRNA2 and exhibited constant estrus?

      Response: We have now clarified in the text that 3 gRNA2 mice went into constant estrus, the other mouse was in constant diestrus, also scored as “0” cycles.

      In Figure 3H, there is one green data point that has an LH level of around 0.15 and % VGAT with ESR1 around 10%. However, that data point does not appear in Figures 3I and 3J, when you would expect it to be in a similar place (~10%) on the x-axis in those Figures. Was it excluded? If so, please elaborate on the justification for excluding that data point. Response: This was one of the three mice that exhibited no LH pulses so we were only able to report on mean LH levels.

      Similarly, in Figure 3K, there is a blue data point that is almost at 0 for both the x-axis and the y-axis. However, that data point does not show up in Figures 3L and 3M around 0 on the x-axis as you would expect. Can the authors clarify where this data point went in Figures 3L and 3M?

      Response: This was one of the three mice that exhibited no LH pulses so we were only able to report on mean LH levels.

      Reviewer #2 (Recommendations For The Authors):

      Finally, the study leaves unanswered the role of GABA itself. As there was no evident phenotype for the ESR1 knockdown in GABA neurons that do not coexpress kisspeptin, this suggests that GABA neurotransmission in the preoptic area is not involved in the estrogen regulation of LH secretion.

      Response: The current evidence for no substantial role of GABA from RP3V neurons in the LH surge agrees with our prior in vivo work showing that low frequency optogenetic stimulation of RP3V kisspeptin neurons (only GABA release) has no impact on LH secretion (doi: 10.1523/JNEUROSCI.0658-18.2018).

      1. Title. The present data do not clearly demonstrate the blockade of the LH surge. Thus, the statement that "abolishes the preovulatory surge" is an overinterpretation of the findings.

      Response: We agree and now use “suppresses the preovulatory surge”.

      1. Fig. 3. The numbers of individual data points per group change for the different LH pulse parameters, but they should not (Fig. 3 E-G).

      Response: This occurs because one mouse in each group had no LH pulses so that only a mean value was available for these mice.

      1. Fig. 4. (4B) The use of only one terminal blood collection (4B) is insufficient to comprehensively characterize the LH surge. It is not possible to conclude what was the actual effect on the LH surge, whether a blockade or altered amplitude or timing. Serial blood samples at 30- or 60-minute intervals should be used. For comparative purposes, the pulsatile LH secretion, which does not seem to be a major outcome in the study, was fully characterized (Fig. 3). (4C) The linear correlation between c-Fos/GnRH and RP3V/ESR1 appears to be well-fitted for gRNA2 (blue) but not gRNA3 (green). Although this is interpreted as an important result of the study, its description and consistency are not so clear. Authors should perform an Anova/ Kruskal-Wallis analysis of these data as a column graph (as in Fig. 4A, B) and discuss the discrepancies between gRNA2 and gRNA3.

      Response: As noted in the manuscript, we agree that a single point LH measurement is a relatively inaccurate assessment of the LH surge and very likely underlies much of the substantial variability between mice. However, the extended duration of cFos expression in GnRH neurons at the time of the surge is a much more accurate “single point” indicator and we feel that these results better reflect the state of surge activation. This was noted in the original manuscript.

      The linear correlations for the different preoptic regions are undertaken on the complete data set not on individual gRNA groups due to low N numbers in the sub-divided groups. However, column graphs of the RP3V and MPN look the same as Fig.4A and would not change the current interpretation. Please see comments to Reviewer 1 on discrepancies between gRNA2 and 3.

      1. Table. It is unclear why the % VGAT with ESR1 was not statistically reduced in the "bilateral" animals. Would this mean that the ESR1 knockdown was not effective in this subgroup with the more consistent effects?

      Response: Yes, this would be a reasonable interpretation suggesting that mice with kisspeptin ablation may have had a slightly different overall impact on ESR1 in VGAT neurons. However, this was not discernable from examining the anatomical distribution of AAV.

      1. Discussion 1st paragraph. It is interpreted that mice lacking kisspeptin expression "failed to exhibit an LH surge". This should be revised.

      Response: We believe that this is a correct statement. Mice lacking kisspeptin had LH surge values between 0.8 and 2.1 ng/ml that we would not consider consistent with being a surge.

      1. Immunohistochemistry. It is not clear in the text how a cross-reaction between goat antirabbit 568 (ERa) and goat antirabbit/streptavidin 647 (mChery) was avoided when used in the same reaction.

      Response: We were forced into this option due to the lack of different primary antisera to ESR1 and mCherry. We first stained for rabbit ESR1 detected by biotin anti-rabbit/ strep647 which resulted in confined nuclear staining (pseudo-blue; far red). The subsequent staining for rabbit mCherry was detected by goat anti-rabbit 568 that will indeed cross-react by binding to any free epitopes on the rabbit ESR1 primary antibody. However, this would not compromise interpretation as additional 568 labelling to the nucleus is essentially irrelevant when examining far red 647 nm emission and only mCherry cytoplasmic immunoreactivity was used to define the anatomical locations of the AAV spread. This is now clearly explained in the Methods section.

      1. Statistical analysis. It is unclear when repeated measures Wilcoxon tests were used in the manuscript.

      Response: Thank you for pointing this out. Only Wilcoxon paired test were used. Amended.

      1. Data Availability. Further reference to supplementary information files was not found in the manuscript.

      Response: A supplementary file with individual data for each mouse is now attached.

      Reviewer #3 (Recommendations For The Authors):

      Weaknesses:

      One aspect for which I have ambiguous feelings is the minimal level of detail regarding the HPG axis and its regulation by estrogens. This limited amount of detail allows for an easy read with the well-articulated introduction quickly presenting the framework of the study. Although not presenting the axis itself nor mentioning the position of GnRH neurons in this axis or its lack of ERα expression is not detrimental to the understanding of the study, presenting at least the position of GnRH neurons in the axis and their critical role for fertility would likely broaden the impact of this work beyond a rather specialist audience.

      Response: We agree that this would provide a more complete picture and have modified the Introduction.

      The expression of kisspeptin constitutes a key element for the analysis and conclusion of the present work. However, the quality of the kisspeptin immunostaining seems suboptimal based on the representative images. The staining primarily consists of light punctuated structures and it is very difficult to delineate cytoplasmic immunoreactive material defining the shape of neurons in LacZ animals. For some of the cells marked by an arrow, it is also sometimes difficult to determine whether the staining for ESR1 and Kp are in the same focal plane and thus belong to the same neurons. Although this co-expression is not critical for the conclusions of the study, this begs the question of whether Kp expression was determined directly at the microscope (where the focal plan can be adjusted) or on the picture (without possible focal adjustment). Moreover, in the representative image of Kp loss, several nuclei stained for fos (black) show superimposed brown staining looking like a dense nucleus (but smaller than an actual nucleus). This suggests some sort of condensed accumulation of Kp immunoproduct in the nucleus which is not commented. Given the critical importance of this reported change in Kp expression for the interpretation of the present results, it is important to provide strong evidence of the quality/nature of this staining and its analysis which may help interpret the observed functional phenotype.

      Response: The kisspeptin immunoreactivity represents both fiber and cytoplasmic staining that can be difficult to discern in some cases. The reviewer can be assured that all counts were undertaken “live” on the microscope so that the plane of focus was adjusted to establish co-labelling. Please note that the nuclear immunoreactivity is for ESR1 and not cFos. Regardless, we struggle to see condensed brown staining over the black nuclei as suggested by the Reviewer. The kisspeptin staining is light brown and confined to just a few fibers in Fig.5B.

      As acknowledged in the introduction, this study is not the first to use in vivo Crisp-Cas editing to demonstrate the role of kisspeptin neurons in the control of positive feedback. Although the present work achieved this indirectly by targeting VGAT neurons, I was surprised that the paper did not include more comparison of their results with those of Wang et al., 2019. In particular, why was the present approach more successful in achieving both lack of surge and complete acyclicity?

      Response: Wang et al., reported an ~60% reduction in ESR1 expression in Kiss1-Cre (Elias) driven Cas9-expressing cells in the AVPV. As they did not examine kisspeptin expression itself it is unknown to what degree their editing impacted upon kisspeptin neurons. The other differentiating factor was that Wang focussed on the AVPV that only contains a minority of the preoptic kisspeptin population whereas we targeted the AVPV and PeN together. Thus, we suspect that the Wang phenotype arises from insufficient ESR1 knockdown in just the AVPV sub-population of preoptic kisspeptin neurons. We have added a comment to the Discussion as requested.

      Moreover, why is it that targeting ESR1 in a selected fraction of GABAergic neurons can lead to a near-complete absence of Kp expression in this region? This is briefly discussed in the penultimate paragraph but mostly focuses on the non-kisspeptinergic GABA neurons rather than those co-expressing the two markers.

      Response: We have modified this section to try and make it clear that it is very likely that all RP3V kisspeptin neurons would have been targeted to express Cas9 in this mouse model. Our very recent unpublished RNA scope data show that >80% of RP3V kisspeptin neurons express Vgat mRNA in adult mice.

      • Unless I have missed it, the target sequence of the guide RNAs is not mentioned. For reproducibility purposes and to allow comparison with Wang et al., 2019, this information should be provided.

      Response: The target sequences for gRNA2 and gRNA3 were around exon 3 and are provided in the Supplementary files of McQuillan et al., 2022 (https://doi.org/10.1038/s41467-022-35243-z). The Wang et al study used the unusual strategy of designing sense and antisense gRNAs against the same sequence in Exon1.

      • The first result section is devoted to the design and validation of the guide RNA reports data that were recently published (McQuillan et al., 2022). It is actually acknowledged that the design was reported previously but as written it is not clear whether the actual validation was already reported. This should be said more clearly.

      Response: Clarified as requested.

      • What was the rationale for choosing gRNA 2 and 3 and not 3 and 6 like in the McQuillan study?

      Response: As all three gRNAs worked equally well, the choice of 2 and 3 was entirely pragmatic and only based upon quantities of packaged AAVs that we had produced and were available at the time.

      • Introduction, 4th paragraph: It would be clearer if GABAa receptor dynamics was replaced by GABAa receptors mediated neurotransmission or any other verbiage avoiding possible confusion with receptor mobility.

      Response: Clarified as requested.

      • The section reporting the location of ESR1 knockdown is really clear about the number of animals included in the functional analyses. This is less clear for the number of mice involved in the evaluation of the extent of ESR1 knockdown in the previous section. Specifically, the text reports that 8 and 9 mice received gRNA3 in PVpo and MPN respectively, but the figure shows 7 and 8. This is likely explained by the mouse that was excluded due to normal ESR1 despite the correct positioning of the injection site. It is thus unclear whether this mouse was included in the calculation of the mean percentage of neurons reported in the previous page. Logically, this mouse should have been removed from this analysis and it is assumed that the sample size reported in the text is incorrect.

      Response: thank you for picking this up - you are correct. In reviewing this point we realized that the gRNA-lacZ RP3V N numbers also were incorrect and have re-analyzed the data set completely resulting in even stronger significance levels.

      • In the section « CRISPR knockdown ESR1 in RP3V GABA-kisspeptin neurons », the extent of ESR1 knockdown is expressed in a counterintuitive manner as « <20% » which is thought to represent the percentage of cells expressing ESR1 rather than the actual knockdown (>80%). This should be clarified.

      Response: Corrected as noted.

      • Page 6, 3rd line before the last paragraph, there is a mismatch between the highest p value reported in the text (0.242) and the value reported in the table (0.0242).

      Response: Corrected thank you.

      • Similar to presenting F values for ANOVAs, H values should also be presented for Kruskal Wallis tests.

      Response: Values have been added.

      • Immunohistochemistry : Origin and reference numbers of all primary antibodies should be reported as well as citation of studies where they have been validated. Although these protocols are standard, information regarding the duration of incubation is necessary to allow replication or for comparison purposes.

      Response: We have included the RRID numbers for each of these antisera and added information on incubation times.

      • The section on data availability mentions the existence of supplementary files, but I see none.

      Response: These have now been attached.

      • There are several typos or redundancies to be corrected. Here are a few examples but the manuscript should be carefully double-checked.

      Introduction, 3rd paragraph, line 4: upregulated

      Introduction, 4th paragraph, 4th line: « to » or « through » not both.

      Page 7, line 11 : Kruskal

      Page 7, 6th line to the end: does this indicate 'the' general utility?

      Page 8, 2nd paragraph, line 13: Crispr

      Response: Thank you for these edits.

    1. Author Response

      The following is the authors’ response to the original reviews.

      Reviewer #1 (Recommendations for the Authors):

      The authors provide their data and code via Github, and that shiny apps allow easy access to their data. However, spending a few minutes with the snRNAseq app I could not figure out how to search for individual genes (e.g. DBH) on their web interface. Some changes could help to make this app more user-friendly.

      While it was not possible to easily modify the user interface of the snRNA-seq app itself, we have instead added two additional supplementary figures displaying screenshots and schematics with sequential instructions that provide a short tutorial showing how to search for individual genes and display either spatial gene expression (for the Visium SRT data) or gene expression by cluster or population (for the snRNA-seq data) in each interactive web app (Figure 3-figure supplement 20-21). We hope this makes the apps more accessible and assists users to more easily query specific genes that they are interested in.

      The first sentence of the abstract and line 70 on page 2 need to be revised for language / grammar / clarity.

      We have revised these two sentences. Line 70 on page 2 contained a typo / copy-paste error. Thank you for pointing this out.

      Reviewer #2 (Recommendations For The Authors):

      While the efforts of the authors to identify NE neurons in the LC is appreciated, the data fall a little short of conclusively calling these neurons solely noradrenergic as there is an apparent lack of overlap between TH and SLC6A2 in the spots. Undoubtedly, some spots contain both which is consistent with the RNA scope results, but there is clearly a pattern that shows spots that don't contain both. It would be worth testing the presence of other catecholamines in some of these certain spots particularly dopamine (Kempadoo et al. 2016, Takeuchi et al., 2016, Devoto et al. 2005).

      We agree this is an important point. To more rigorously investigate whether TH is co-expressed within cells that produce other catecholamines, particularly dopamine (DA) in addition to norepinephrine (NE), we have included additional analyses of the snRNA-seq and Visium data, as well as generated additional RNAscope data in the revised manuscript, as follows.

      (i) We investigated the spatial expression of DA neuron marker genes besides TH, including SLC6A3 (encoding the dopamine transporter), ALDH1A1, and SLC26A7 in the Visium samples (Figure 3-figure supplement 15), which shows that these genes are not strongly expressed within the manually annotated LC regions in the Visium samples (see Figure 2-figure supplement 1).

      (ii) We investigated expression of DA neuron marker genes SLC6A3, ALDH1A1, and SLC26A7 in the snRNA-seq clustering (updated heatmap in Figure 3-figure supplement 8), which shows minimal expression of these genes within the NE neuron cluster (cluster 6).

      (iii) Despite the data above suggesting little expression of markers for DA neurons within the human LC, we wanted to investigate this question more thoroughly with an orthogonal method given that relatively lower coverage in the sequencing approaches may miss expression, particularly for more lowly expressed transcripts. We generated new high-resolution RNAscope smFISH images at 40x magnification for samples from 3 additional donors (Br8689, Br5529, and Br5426) showing expression of NE neuron marker genes (DBH and TH), a 5-HT neuron marker gene (TPH2), and a DA neuron marker gene (SLC6A3) within individual cells within the LC regions in these samples. Expression of SLC6A3 within individual NE neurons (identified by co-expression of DBH and TH) was not apparent in these RNAscope images (Figure 3-figure supplement 16).

      Together with the previous high-magnification RNAscope images showing co-expression of NE neuron marker genes (DBH, TH, and SLC6A2) within individual NE neurons (Figure 3-figure supplement 4), these new results further strengthen the conclusion that the observed TH+ cells we profiled in the LC are NE-producing neurons. In our view, the lack of observed co-expression of TH and SLC6A2 within some individual Visium spots is likely due to sampling variability and relatively lower sequencing coverage in the Visium data, rather than a true lack of co-expression. We have included additional text in the Results and Discussion further discussing this issue.

      Likewise, given the low throughput of RNA scope, and the fact that it was not done in a systematic manner, it does not conclusively identify the cell types in the region. It might be worth a systematic survey of the cells in the region with both NE and DA markers. Otherwise, it is suggested that the authors be more conservative with their annotations.

      As discussed above, we have now generated additional high-magnification RNAscope images for 3 independent donors (Br8689, Br5529, and Br5426), visualizing expression of two NE neuron marker genes (DBH and TH), one 5-HT neuron marker gene (TPH2), and one DA neuron marker gene (SLC6A3, encoding the dopamine transporter) within individual cells within the LC region in each sample (Figure 3-figure supplement 16). Expression of the DA neuron marker gene (SLC6A3) within individual NE neuron cell bodies (identified by co-expression of DBH and TH) was not apparent in these RNAscope images. Together with our previous RNAscope images showing co-expression of DBH, TH, and SLC6A2 within individual cells (Figure 3-figure supplement 4), in our view, these results provide strong evidence that the observed TH+ cells in the LC are NE-producing neurons, and the data do not provide supporting evidence for the existence of DA-synthesizing neurons in the human LC.

      For the manual annotation, it would be useful to include HE tissue images to better understand how the annotations were derived especially because the annotations are not well corroborated by the clustering.

      We have now included the H&E stained histology images for the Visium samples in Figure 2-figure supplement 2A, which can be compared with the previous figures showing the manual annotations for the LC regions (Figure 2-figure supplement 1). The histology images can also be viewed at higher resolution through the Shiny web app (https://libd.shinyapps.io/locus-c_Visium/).

      The unsupervised clustering is certainly contingent on the number of genes detected, which is in turn dependent on the quality of the material and the success of the experiment. It is unclear from the methods whether the samples were pooled for clustering. If they were pooled, the author might consider using only the samples with UMIs > 500. The low UMI may represent free-floating RNA, suggesting issues with tissue permeabilization in turn influencing the ability to confidently associate genes with spots. Sticking with the higher quality sample may improve the ability to perform unsupervised clustering.

      For the spot-level unsupervised clustering using BayesSpace, our aim was to demonstrate whether it is feasible to segment the LC and non-LC regions in the Visium samples in a data-driven manner using a spatial clustering algorithm, instead of relying on manual annotations. We performed clustering across samples (i.e. pooled) -- we have included additional wording in the text and figure caption to clarify this. We agree with the reviewer there may be further optimizations possible, such as filtering out spots or samples with low UMI counts. However, filtering out low-UMI spots may also confound the clustering if low-UMI spots are associated with biological signal (e.g. preferentially located in white matter regions).

      Overall, we found that applying data-driven methods such as BayesSpace to segment the LC and non-LC regions did not perform sufficiently to rely on for our downstream analyses (Figure 2-figure supplement 6), and, in our view, further incremental optimizations were unlikely to reach sufficient performance and robustness, so we chose to rely on the manual annotations instead. In addition, as noted in the Results, this avoids potentially inflated false discoveries due to issues of circularity when performing differential gene expression testing between regions defined by unsupervised clustering on the same sets of genes (Gao et al. 2022). We included the BayesSpace results (Figure 2-figure supplement 6) to provide information and ideas to method developers interested in using this dataset as a test case for further development of spatial clustering algorithms. However, further adapting or optimizing these spatial clustering algorithms ourselves was not within the scope of our current work.

      It is not entirely clear why the authors used FANS, especially with the scored tissue. Do the authors think this could have negatively influenced the capture of the desired cell type since FANS can compromise the integrity of the nuclei? In other words, have the authors considered that this may have resulted in a loss rather than enrichment? The proportion of "NE" neurons in the snRNA-Seq data is less than 2% in all cases and at its lowest in sample 6522 which does not correspond well with the proportion of tissue that was manually annotated as containing NE cells, even when taken into consideration the potential size difference of cells. In the same vein, in some samples, there are more "5-HT" neurons in the region than "NE" according to the numbers.

      As noted in our initial response to reviewers (“Response to Public Review Comments”), we used FANS to enrich for neurons based on our previous success with this approach to identify relatively rare neuronal populations in other brain regions (e.g. nucleus accumbens and amygdala; Tran and Maynard et al. 2021). Based on this previous work, our rationale was that without neuronal enrichment, we could potentially miss the LC-NE population, given the relative scarcity and low absolute number of this neuronal population (e.g. estimates of ~50K total in the entire human LC).

      We do not have a definitive answer to the question of whether our use of FANS to enrich for neurons may have led to damage and contributed to the low recovery rate of LC-NE neurons (as well as the relatively increased levels of mitochondrial contamination compared to other brain regions / preparations in the human brain in our hands). Due to our limited tissue resources for this study, we did not have sufficient tissue to perform a direct comparison with non-sorted data. However, we agree with the reviewer that this is plausible, and warrants further investigation in future work. In particular, the relatively large size and fragility of LC-NE neurons, as well as our use of a standard cell straining approach (70 µm, which may not be ideal for this population), may also be contributing factors.

      Systematically optimizing the preparation to attempt to increase recovery rate (and decrease mitochondrial contamination) are important avenues for future work, and we have decided to share our data and experiences now to assist other groups performing related work. We have included additional wording in the Discussion to further highlight these issues.

      The majority of the snRNA-seq remained unannotated "ambiguous" neurons. It would be highly advantageous to include an annotation for these numerous cells.

      These nuclei were unidentifiable due to ambiguous marker gene expression profiles, i.e. expression of pan-neuronal marker genes without clear expression of either excitatory or inhibitory neuronal marker genes (see Figure 3A and Figure 3-figure supplement 8). Since we were not able to clearly identify these clusters, and due to our additional concerns regarding the data quality (e.g. low recovery rate of the NE neuron population of interest, potential cell damage, and mitochondrial contamination), we decided to label these neuronal clusters as “ambiguous” instead of assigning low-confidence cluster labels. We have included additional wording in the Results section to explain this issue.

      The most likely explanation for identifying serotonergic neurons in these samples is the inclusion of the Raphe Nucleus within the dissection, especially since these cells do not map to the LC per se. As such, is there a way to neuroanatomically define the potential inclusion of this region from these tissue blocks used? Or to the contrary, definitively demonstrate the exclusion of the Raphe?

      As noted in our initial response to reviewers (“Response to Public Review Comments”), our dissection strategy in this initial study precluded the ability to keep track of the exact orientation of the tissue sections on the Visium arrays with respect to their location within the brainstem. Therefore, it is not possible to definitively answer the question of whether the dissections included the raphe nucleus, and if so, which portion of it, based on neuroanatomy from the tissue blocks.

      However, during the course of this study and in parallel, ongoing work for other small, challenging brain regions, we developed a number of specialized technical and logistical strategies for keeping track of orientation and mounting serial sections from the same tissue block onto a single spatial array, which is extremely technically challenging. We are now well-prepared for addressing these issues in future studies, e.g. keeping track of the orientation of the dissections and potential inclusion of adjacent neuroanatomical structures. We have included additional details on this issue in the Discussion.

      Given that one sample (Visium capture area) was excluded as it did not seem to contain a representation of the LC for the profiling of "NE" cells, does it make sense to include this sample in the analysis of 5HT cells given the authors are trying to make claims about the cell composition in and around the LC? Since there appears to be little 5HT contribution from this sample and its inclusion results in inconsistency across experiments and not any notable advantages, the authors might want to reconsider its inclusion in the results.

      We identified a cluster of 5-HT neurons in the snRNA-seq data (Figure 3) and used the Visium samples to further investigate the spatial distribution of this population (Figure 3-figure supplement 9). For the enrichment analyses in the Visium data (Figure 3-figure supplement 9C), we used only the 8 Visium samples that passed quality control (QC). We included the 9th sample (which did not pass QC) in the spot plot visualizations (Figure 3-figure supplement 9A-B) for completeness, but did not base our main conclusions on this sample (in this sample, the tissue resource was likely depleted during earlier sections, so the section for the Visium sample was taken slightly past the extent of the LC within this tissue block). We have included additional wording in the Results section and figure captions to clarify this issue.

      For the RNAscope images, it would be useful to include (draw) the manual annotation of the LC to facilitate interpretation. This is especially useful for demonstrating the separate populations of 5HT and "NE" cells. In general, it would be useful to keep a hashed line perimeter for all sections processed by Visium.

      We have now added a dashed outline indicating the manually annotated LC region in the RNAscope image showing the full tissue section (Figure 3-figure supplement 11). The high-magnification RNAscope images (Figure 3-figure supplement 4, 16, and 17) show regions entirely within the LC regions -- we have included additional wording to note this in the figure captions. For the Visium spot

      plots, we either labeled spots within the annotated regions within the figures or included additional wording in the figure captions to refer to the figures showing the annotations (Figure 2-figure supplement 1).

      The authors state that they successfully mapped the NE neuron population from snRNA-seq to the manually annotated regions on the Visium slides. Based on the color-coded map, these results are not very convincing since the abundance of the given transcript profile is extremely low. Here again, it would help to draw a hashed line perimeter on the slide to denote the manually annotated region. Perhaps the authors could try a different strategy for mapping snRNA signal to the slide? However, it appears that the mapping worked better for the capture areas with higher UMI/genes counts. Perhaps the authors should consider using only the slides with high gene/UMI counts.

      We agree that the performance of these analyses (Figure 3-figure supplement 14) was not clearly described in the previous version of the manuscript. We have rewritten the corresponding paragraph in the Results section to make it more clear that the mapping (spot-level deconvolution) performance was relatively poor overall, and that we did not use these results for further downstream analyses. We did however want to include these results from the cell2location algorithm to provide information and data for method developers on the challenges of these types of analyses in our dataset (e.g. due to the presence of rare populations, relatively subtle differences in expression profiles between neuronal subpopulations, and potential issues due to large nuclei size and high transcriptional activity for NE neurons). While further approaches for these types of analyses exist, and additional optimizations such as subsetting samples or spots with high UMI counts could also be investigated, in our view, these further optimizations lie outside the scope of our current work. We have also added wording in the figure caption to refer to Figure 2-figure supplement 1, which displays the corresponding annotated LC regions per sample.

      It is hard to see if the RNA scope image Supplementary Figure 11 shows co-localization of SLC6A2, TH, and DBH. Having the individual image from each microscope filter along with the merged image is required to properly assess the colocalization of the signals.

      We updated the multi-channel RNAscope images to show both the merged channels and individual channels in separate panels (Figure 3-figure supplement 4, 16, and 17), which makes the visualization more clear. Thank you for this suggestion. (Note that the previous Supplementary Figure 11 has been re-numbered to Figure 3-figure supplement 4.)

      The heatmap showing the level of marker transcripts shows a much lower expression of specific markers, TH, DBH, SLC6A2 in NE vs other clusters looks surprisingly low (particularly TH), while the much broader marker SLC18A2 (monoamine transporter) is considerably more differential. What do the authors make of this finding?

      This is correct. In the snRNA-seq data, we observed that SLC18A2 is one of the most highly differentially expressed (DE) genes in the NE neuron cluster vs. other neuronal clusters, with a high level of expression in the NE neuron cluster (Figure 3C). Note that this heatmap shows the top 70 DE genes (excluding mitochondrial genes) out of the full list of 327 statistically significant DE genes with elevated expression in the NE neuron cluster (the full list of 327 genes is provided in Supplementary File 2C). While all four of these genes (DBH, TH, SLC6A2, and SLC18A2) are identified as statistically significant DE genes, SLC18A2 is the most highly DE out of these and has an especially high level of expression in the NE neuron cluster, as noted by the reviewer (Figure 3C). This could be due to the fact that SLC18A2 transcripts are expressed at higher absolute levels in these neurons than the transcripts that are more specific to LC-NE neurons. While it is true that SLC18A2 is a “broader” marker in the sense that it is found in more cell types -- e.g. cell types within brain nuclei that contain monoaminergic as well as brain nuclei that contain catecholaminergic cells -- expression of SLC18A2 within the LC is highly specific to the catecholaminergic LC-NE neurons given its specialized functional role within monoamine and catecholamine neurons in packaging amine neurotransmitters into synaptic vesicles. We note that SLC18A2 plays a specialized role that is critical to the core function of LC-NE neurons, and hence we are not particularly surprised with this finding and think that one possibility is that this differential expression appears more robustly due to higher absolute levels of the marker.

      While it is understandable that the authors decided to include cells/nuclei with high mitochondrial reads, further work is needed to ensure these cells are of sufficient quality to use in an unbiased way knowing that a high percentage of mitochondrial reads in nuclei sequencing is usually indicative of low-quality nuclei. This can be assessed by evaluating the quality of the nuclei with GWA, which stains an intact nuclear membrane acting as a measure of the integrity of the nuclei.

      To further investigate these results, we added additional analyses evaluating quality control (QC) metrics for the NE neuron cluster in the snRNA-seq data, which had an unusually high proportion of mitochondrial reads (Figure 3-figure supplement 2, shown also below in comments for Reviewer 3) (see also related Figure 3-figure supplement 1, 3, which were included in the manuscript previously). These additional QC analyses do not show any other problematic values for this cluster, other than the high mitochondrial proportion, so we do not believe this is purely a data quality issue. We are aware that this is an unexpected result -- in most cell populations, a high proportion of mitochondrial reads would be indicative of cell damage and poor data quality. However, we have recently also observed high mitochondrial proportions in other relatively rare neuronal populations characterized by large size and high metabolic demand. As discussed below for Reviewer 3, we believe that this is mitochondrial “contamination”, as there should be no mitochondrial reads per se within the nuclear compartment.

      However, it may be possible that in cell populations that have abundant levels of mitochondria and high transcript expression of mitochondrial transcripts in the cell body, that the likelihood of ambient RNA capture of mitochondrial transcripts during nuclear preparation may be higher than for other cell types that have lower expression of mitochondrial transcripts. Hence, we believe that our interpretation is likely correct, i.e. that a combination of technical and biological factors contributes to the inclusion of a relatively high amount of mitochondrial RNA within the droplets for these nuclei. We agree with the reviewer that this finding warrants further investigation in future work. However, in our current study, the tissue resource is depleted for any further experimental validation of this question, so we preferred to provide our data to the community in its current form, while transparently noting this unexpected finding in our results. We have included additional text in the Results section describing the new QC analyses shown in Figure 3-figure supplement 2.

      Minor comments:

      Line 319-321 could be written more clearly to indicate that due to the lack of resolution in a given spot, there are "contaminating reads" that reduce the precision of the cell profile. This reduced precision is likely what results in the "lack of conservation" across species.

      We have added additional wording to this sentence to clarify this point.

      In the discussion, the authors write that the analyses "unbiasedly identified a number of genes enriched in human LC", however, given the manual annotation of the region for each capture area, this resulted in a biased assessment of the spots.

      We have replaced this wording to refer to “untargeted, transcriptome-wide” analyses (i.e. analyses that are not based on a targeted panel of genes) instead of “unbiased”. We agree that the meaning of “unbiased” is ambiguous in this context.

      Reviewer #3 (Recommendations For The Authors):

      Major points:

      Overall, the discovery of some cells in the LC region that express serotonergic markers is intriguing. However, no evidence is presented that these neurons actually produce 5-HT. Perhaps more conservative language would be appropriate (i.e. "cells that possess mRNA signatures of serotonergic neurons" or something like that). Did these cells co-express other markers one would expect in 5-HT neurons like 5-HT autoreceptors and SLC6A18? Also would be useful to compare expression profiles of these putative 5-HT neurons with any published material on bona fide dorsal raphe 5-HT neurons. For the RNAscope confirmation in the supplementary material, it would be helpful to show each marker separately as well as the overlay, and to include representative higher magnification images like were provided for the ACH markers.

      Thank you for this comment. In order to further investigate the identity of these cells, we have investigated the expression of several additional genes including SLC6A18, 5-HT autoreceptor genes (HTR1A, HTR1B), marker genes for 5-HT neurons (SLC18A2, FEV), and marker genes for 5-HT neuronal subpopulations within the dorsal and median raphe nuclei from the literature (Ren et al. 2019), in both the Visium and the snRNA-seq data.

      We observed some expression of SLC18A2 and FEV within the same areas as SLC6A4 and TPH2 in the Visium samples (Figure 3-figure supplement 10A-B, reproduced below; note that SLC18A2 is also a marker gene for NE neurons located within the LC regions), consistent with Ren et al. (2019). However, we did not observe a strong or consistent expression signal for the 5-HT autoreceptors (HTR1A, HTR1B) (Figure 3-figure supplement 10C-D, reproduced below), and we observed zero expression of SLC6A18 in the Visium samples. In the snRNA-seq data, within the cluster identified as 5-HT neurons, we observed some expression of SLC18A2, low expression of FEV, and almost zero expression of SLC6A18 (Figure 3-figure supplement 8, reproduced below; note that SLC6A18 is not shown since it was removed during filtering for low-expressed genes). Similarly, we observed very low expression of the 5-HT autoreceptors (HTR1A, HTR1B) and the additional marker genes for 5-HT neuronal subpopulations from Ren et al. (2019) -- with the possible exception of the neuropeptide receptor gene HCRTR2, which was identified by Ren et al. (2019) within several clusters in both the dorsal and median raphe in mice (Figure 3-figure supplement 8, reproduced below).

      Overall, these additional results give us some further confidence that these are likely 5-HT neurons (due to expression of SLC18A2 and FEV), while also raising further questions (due to the absence of 5-HT autoreceptor genes HTR1A, HTR1B and 5-HT neuronal subpopulation marker genes). While we believe that the most likely explanation is the inclusion of 5-HT neurons from the edges of the adjacent dorsal raphe nuclei in our samples, we acknowledge that the evidence presented is not fully conclusive and does not identify specific subpopulations of 5-HT neurons. In addition, the limited size of our dataset (number of samples and cells) and the lack of information on sample orientation precludes any definitive identification of subpopulations based on their association with specific anatomical regions within the dorsal raphe nuclei. We have updated the manuscript by (i) adjusting our language in the Results and Discussion, (ii) including the additional analyses, supplementary figures, and reference to the literature (Ren et al. 2019) discussed above, and (iii) including additional wording in the Discussion on improvements to the dissection strategy that would allow these questions to be addressed in future studies via a focused molecular profiling of the dorsal raphe nuclei across the rostral-caudal axis.

      Regarding the RNAscope images, we have included additional images showing channels side-by-side and higher magnification, as suggested (and also discussed above for Reviewers 1 and 2). In addition, we have added an outline highlighting the LC region in Figure 3-figure supplement 11 (as suggested above by Reviewer 2), and included an additional high-magnification RNAscope image demonstrating co-expression of 5-HT neuron marker genes (TPH2 and SLC6A4) within individual cells (Figure 3-figure supplement 12).

      Concerning the snRNA-seq experiments, why were only 3 of the 5 donors used, particularly given the low number of LC-NE nuclear transcriptomes obtained? How were the 3 donors chosen from the 5 total donors and how many 100 um sections were used from each donor? Are the 295 nuclei obtained truly representative of the LC population or are they just the most resilient LC nuclei? How many LC nuclei would be estimated to be captured from staining the 100 um tissue sections?

      As discussed in our previous response to reviewers (“Response to Public Review Comments”), the reason we included only 3 of the 5 donors for the snRNA-seq assays was due to tissue availability on the tissue blocks. In this study, we were working with a finite tissue resource. Due to the logistics and thickness of the required tissue sections for Visium (10 μm) and snRNA-seq (100 μm), running Visium first allowed us to ensure that we could collect data from both assays -- if we ran snRNA-seq first and captured no neurons, the tissue block would be depleted. Due to resource depletion, we did not have sufficient available tissue remaining on all tissue blocks to run the snRNA-seq assay for all donors. We have conducted extensive piloting in other brain regions on the amount (mg) of tissue that is needed from various sized cryosections, and the LC is particularly difficult since these are small tissue blocks and the extent of the structure is small. Hence, in some of the subjects, we did not have sufficient tissue available for the snRNA-seq assay.

      We have included details on the number of 100 μm sections used for each donor in Methods -- this varied between 10-15 sections per donor, approximating 50-80 mg of tissue per donor.

      Regarding the question about the representativeness / resilience of the LC nuclei -- as discussed in our previous response to reviewers (“Response to Public Review Comments”) and above for Reviewer 2, we agree that this is a concern. As discussed above for Reviewer 2, it is plausible that our use of FANS may have contributed to cell damage and the low recovery rate of LC-NE neurons. The relatively large size and fragility of LC-NE neurons, as well as our use of a standard cell straining approach (70 µm, which may not be ideal for this population), may also be contributing factors. Due to our limited tissue resource, we did not have sufficient tissue to perform a direct comparison with non-sorted data.

      Systematically optimizing the preparation to attempt to increase recovery rate is an important avenue for future work. We have included additional discussion of this issue in the Discussion.

      Regarding the question about the number of expected nuclei, we have now included estimates of the number of cells per spot within the LC regions in the Visium data (see also related point below, and Figure 2-figure supplement 2B reproduced below), based on the H&E stained histology images and use of cell segmentation software (VistoSeg; Tippani et al. 2022). While we do not have any confident estimates of the number of expected nuclei in the snRNA-seq data, these estimates of cell density from the Visium data could, together with information on additional factors such as the accuracy of the tissue scoring and the effectiveness of FANS, be used to help derive an an expected number of nuclei in future studies. We have included additional wording in the Discussion to note that these estimates could be used in this manner during future studies.

      The LC displays rostral/caudal and dorsal/ventral differences, including where they project, which functions they regulate, and which parts are vulnerable in neurodegenerative disease (e.g. Loughlin et al., Neuroscience 18:291-306, 1986; Dahl et al., Nat Hum Behav 3:1203-14, 2019; Beardmore et al., J Alzheimer's Dis 83:5-22, 2021; Gilvesy et al., Acta Neuropathol 144:651-76, 2022; Madelung et al., Mov Disord 37:479-89, 2022). Which part(s) of the LC was captured for the SRT and snRNAseq experiments?

      As discussed in our previous response to reviewers (“Response to Public Review Comments”), a limitation of this study was that we did not record the orientation of the anatomy of the tissue sections, precluding our ability to annotate the tissue sections with the rostral/caudal and dorsal/ventral axis labels. We agree with the reviewer that additional spatial studies, in future work, could offer needed and important information about expression profiles across the spatial axes (rostral/caudal, ventral/dorsal) of the LC. Our study provides us with insight about optimizing the dissections for spatial assays, as well as bringing to light a number of technical and logistical issues that we had not initially foreseen. For example, during the course of this study and parallel, ongoing work in other, small, challenging regions, we have now developed a number of specialized technical and logistical strategies for keeping track of orientation and mounting serial sections from the same tissue block onto a single spatial array, which is extremely technically challenging. We are now well-prepared for addressing these issues in future studies with larger numbers of donors and samples in order to make these types of insights. We have included additional details in the Discussion to further discuss this point.

      The authors mention that in other human SRT studies, there are typically between 1-10 cells per expression spot. I imagine that this depends heavily on the part of the brain being studied and neuronal density. In this specific case, can the authors estimate how many LC cells were contained in each expression spot?

      We have now performed additional analyses to provide an estimate of the number of cells per spot in the Visium data (Figure 2-figure supplement 2B), based on the application of cell segmentation software (VistoSeg; Tippani et al. 2022) to identify cell bodies in the H&E stained histology images. We applied this methodology and calculated summary statistics within the annotated LC regions for 6 samples (see Methods), and found that the median number of cells per spot within the LC regions ranged from 2 to 5 per sample. We note that these estimates include both NE neurons and other cell types within the LC regions, and that applying cell segmentation software in this brain region is particularly challenging due to the wide range in cell body sizes, with NE neurons being especially large. We have included these updated estimates in the Results and Discussion, and additional details in Methods.

      Regarding comparison of human LC-associated genes with rat or mouse LC-associated genes (Fig. 2D-F), the authors speculate that the modest degree of overlap may be due to species differences between rodent and human and/or methodological differences (SRT vs microarray vs TRAP). Was there greater overlap between mouse and rat than between mouse/rat and human? If so, that is evidence for the former. If not, that is evidence for the latter. Also would be useful for more in-depth comparison with snRNA-seq data from mouse LC. https://www.biorxiv.org/content/10.1101/2022.06.30.498327v1

      Our comparisons with the mouse (Mulvey et al. 2018) and rat (Grimm et al. 2004) data showed that we observed a relatively higher overlap between the human vs. mouse data than the human vs. rat data (Figures 2F-G and 3D-E). However, we note that the substantially different technologies used (TRAP-seq in mouse vs. laser capture microdissection and microarrays in rat) make it difficult to confidently interpret the degree of overlap between the two studies, and a direct comparison of these alternative platforms (TRAP-seq vs. LCM / microarray) or species (mouse vs. rat) lies outside the scope of our study. We have included updated wording in the Results and Discussion to explain this issue and help interpret these results.

      Regarding the newer mouse study using snRNA-seq (Luskin and Li et al. 2022), we have extended our analyses to perform a more in-depth comparison with this study. Specifically, we have evaluated the expression of an additional set of GABAergic neuron marker genes from this study within our secondary clustering of inhibitory neurons in the snRNA-seq data (Figure 3-figure supplement 13B). We observe some evidence of cluster-specific expression of several genes, including CCK, PCSK1, PCSK2, PCSK1N, PENK, PNOC, SST, and TAC1. We have also included additional text describing these results in the Results section.

      The finding of ACHE expression in LC neurons is intriguing. Susan Greenfield has published a series of papers suggesting that ACHE has functions independent of ACH metabolism that contributes to cellular vulnerability in neurodegenerative disease. This might be worth mentioning.

      We thank the reviewer for pointing this out. We were very surprised too by the observed expression of SLC5A7 and ACHE in the LC regions (Visium data) and within the LC-NE neuron cluster (snRNA-seq data), coupled with absence of other typical cholinergic marker genes (e.g. CHAT, SLC18A3), and we do not have a compelling explanation or theory for this. Hence, the work of Susan Greenfield and colleagues suggesting non-cholinergic actions of ACHE, particularly in other catecholaminergic neuron populations (e.g. dopaminergic neurons in the substantia nigra) is very interesting. We have included references to this work and how it could inform interpretation of this expression (Greenfield 1991; Halliday and Greenfield 2012) in the Discussion.

      High mitochondrial reads from snRNA-seq can indicate lower quality. Can the authors comment on this and explain why they are confident in the snRNA-seq data from presumptive LC-NE neurons?

      As mentioned above for Reviewer 2, we have included additional analyses to further compare quality control (QC) metrics for the NE neuron cluster (which had an unusually high proportion of mitochondrial reads) against other neuronal and non-neuronal clusters and nuclei in the snRNA-seq data (Figure 3-figure supplement 2). These additional QC analyses do not show any other problematic values for this cluster. Specifically, we show that the QC metric values for sum UMIs and detected genes per droplet for the NE neuron cluster fall within the range for (A) other neurons and (B) all other nuclei (excluding droplets with ambiguous / unidentifiable neuronal signatures). In addition, we observe that the droplets with the highest mitochondrial percentages (>75%) (C-D), which also have unusually low number of detected genes (D), tend to be from the ambiguous category (droplets with ambiguous / unidentifiable neuronal signatures), suggesting that true low-quality droplets are correctly identified and included within the ambiguous category (e.g. consisting of a mixture of debris from partial damaged nuclei) instead of as NE neurons. Since our QC analyses for the NE neuron cluster do not show any problems other than the high mitochondrial percentage, we do not believe these are simply mis-classified low-quality droplets. We also note that we have recently observed high mitochondrial proportions in other relatively rare neuronal populations characterized by large size and high metabolic demand in human data. We believe that our interpretation is correct -- i.e. that a combination of technical and biological factors has led to the inclusion of a relatively high amount of mitochondrial RNA within the droplets for these nuclei. We have included these additional QC analyses (Figure 3-figure supplement 2) and further discussion of this issue in the Results section.

      The Discussion could be expanded. Because there is a lot known and/or assumed about the LC, discussing all of it is certainly beyond the scope of this manuscript. However, perhaps the authors could pick a few more for confirmation and hypothesis generation. For example, one of the most well studied and important aspects of the LC is its regulation by neuromodulatory inputs. It would be interesting for the authors to discuss the expression of receptors for CRF, cannabinoids, orexin, galanin, 5-HT, etc, particularly when compared with the available rodent TRAP and snRNA-seq data (https://www.biorxiv.org/content/10.1101/2022.06.30.498327v1) contained some surprises, such as very low expression of CRF1 in LC-NE neurons, suggesting that the powerful activation of LC cells by CRF is indirect. Does this hold up in humans?

      We have expanded the Discussion to include additional discussion and references on several points, as discussed also above. Indeed these are interesting questions and these neuromodulatory systems are all of interest in the context of signaling within the LC in terms of function of the LC-NE system. We note that the manuscript serves primarily as a data resource and will be useful in many different ways depending on the different goals and interests of the readers. This is precisely why we wanted to take the time to make accessible and easy to use tools to interrogate and visualize the data. We have provided screenshots in Author response image 1-4 from the Shiny visualization app for the Visium data (https://libd.shinyapps.io/locus-c_Visium/) querying several main receptors of the neuromodulatory systems that this reviewer is particularly interested in to illustrate how the visualization apps can readily be used to query specific genes and systems of interest.

      Author response image 1.

      CRHR1:

      Author response image 2.

      CNR1:

      Author response image 3.

      OXR1:

      Author response image 4.

      GALR1:

      Minor points:

      Line 46 add stress responses to the key functions of LC neurons

      We have added this point and included additional references to support the findings.

      Line 47 add that the LC was so named "blue spot" because of its signature production of neuromelanin pigment

      We have added this point.

      Line 49 LC's capacity to synthesize NE is not "unique" - several other brainstem/medullary nuclei also synthesize NE (e.g. A1-A7; LC is A6)

      We have updated this wording.

      Line 54 Although prior evidence indicated age-related LC cell loss in people without frank neurodegenerative disease, recent studies that are better powered and used unbiased stereological methods have refuted the idea that LC neurons die during normal aging (reviewed in Matchett et al., Acta Neuropathologica 141:631-50, 2021)

      We have updated this part of the Introduction to focus on cell loss in the LC in neurodegenerative disease and removed the older references describing studies that suggested LC neurons die in normal aging.

      Line 62 Would also be worth mentioning the role of the LC in other mood disorders where adrenergic drugs are often prescribed, such as PTSD (e.g. prazosin), opioid withdrawal (e.g. lofexidine), anxiety and depression (e.g. NE reuptake inhibitors).

      We have added additional references to these disorders and their treatment with noradrenergic drugs in the Introduction.

      Additional updates from Public Review Comments:

      We have also included the following updates, in response to additional reviewer comments received during the initial round of “Public Review Comments” and which are not already described in the responses to the “Recommendations for the Authors” above.

      ● We included updated wording in the Results section and Figure 1C caption to more clearly describe the number of donors included in the final SRT and snRNA-seq data used for analyses after all quality control (QC) steps (4 donors for SRT data, 3 donors for snRNA-seq data).

      ● Figure 3-figure supplement 1D (number of nuclei per cluster in unsupervised clustering of snRNA-seq data) has been updated to show percentages of nuclei per cluster.

      ● We have added comparisons between the lists of differentially expressed (DE) genes identified in the Visium and snRNA-seq data. To make these sets comparable, we have added (i) snRNA-seq DE testing results between the NE neuron cluster and all other clusters (instead of other neuronal clusters only, as shown in the main results in Figure 3) (excluding ambiguous neuronal) (Figure 3-figure supplement 6 and Supplementary File 2D), and (ii) calculated overlaps and comparisons between the sets of DE genes between the Visium data (pseudobulked LC vs. non-LC regions) and the snRNA-seq data (NE neuron cluster vs. all other clusters excluding ambiguous neuronal). This comparison generated a list of 51 genes that were identified as statistically significant DE genes (FDR < 0.05 and FC > 2) in both the Visium and the snRNA-seq data (Figure 3-figure supplement 7 and Supplementary File 2E).

      Other additional updates:

      We have added an additional data repository (Globus). Raw data files (FASTQ sequencing data files and high-resolution TIF image files) are now available via Globus from the WeberDivecha2023_locus_coeruleus data collection from the jhpce#globus01 Globus endpoint, which is also listed at http://research.libd.org/globus/. The Globus repository is not publicly accessible due to individually identifiable donor genetic variants in the FASTQ files. Approved users may request access from the corresponding authors. This data repository is listed in the Data Availability section.

    1. Author Response

      We thank the editors and reviewers for their supportive comments onto our manuscript. We will revise the manuscript according to their helpful recommendations.

    1. Author Response

      The following is the authors’ response to the original reviews.

      Reviewer #1 (Recommendations For The Authors):

      It is not clear if the cost-effectiveness cited refers exactly to the PAVE protocol. No line item costings are given. As far as I know, the AmpFire test is very expensive (some 6 USD) and AI-assisted colposcopy has at least formerly been very expensive.

      Response: As mentioned in the section on "Cost-effectiveness analysis," the cost-effectiveness results refer to "an early exercise to approximate the potential costs and benefits of a highly effective screening campaign delivered to women aged 30-49 years in the ~65 highest burden LMIC (Figure 1; Suppl Materials) and an HPV vaccination program delivered to girls aged 9-14 years". Because this modeling was intended to be a high-level approximation prior to the availability of micro-costing and use of a new microsimulation model reflecting the epidemiology of HPV in PAVE study sites, we used a bundled cost of US$15 per woman screened and managed appropriately, including the ~$6 cost of the ScreenFire test, triage with AVE for women with HPV positivity, and treatment based on risk stratification. Micro-costing and microsimulation model development for PAVE sites are ongoing alongside the study and will have the capability to reflect setting-specific differences in delivery costs, as well as different burdens of HPV and precancer. These refinements of costing and cost-effectiveness estimates are a high priority of the PAVE consortium

      Reviewer #2 (Recommendations For The Authors):

      As mentioned above, the description of phase 2 could be improved. I suggest that the inclusion of Implementation Science frameworks and tools could contribute to strengthening methods to measure implementation outcomes. Perhaps if the protocol and scope of the study allows it, I suggest that the authors evaluate the incorporation of the assessment of barriers and facilitators of implementation to inform future scaling up of the PAVE strategy. To do this, for example, some Implementation Science Frameworks, such as Conceptual Framework of Implementation Research (CFIR)1-2 could be useful. In addition, as the authors mentioned, future dissemination will need an effective communication strategy and to design it they will carry out a pilot study. The inclusion of CFIR framework or other similar framework, could contribute to identifying contextual factors that might affect implementation and contribute to designing an accurate implementation and dissemination strategy.

      The authors also mentioned that if the PAVE strategy is effective, it could replace the current standard of care. This fact would lead to the need to carry out a des-implementation process. This process needs stakeholders' engagement and political will, among other contextual factors (e.g., human resources, organizational changes, etc.). Implementation of new strategies needs that implementers perceive it as acceptable, adaptable, compatible and with greater advantages than the usual practice. In this sense, the analysis of implementation outcomes guided by CFIR framework could play an important role in this future des-implementation process.

      1. Damschroder, et al. Fostering implementation of health services research findings into practice: a consolidated framework for advancing implementation science. Implementation Sci 4, 50 (2009) https://doi.org/10.1186/1748-5908-4-50.

      2. Damschroder, L.J., Reardon, C.M., Widerquist, M.A.O. et al. The updated Consolidated Framework for Implementation Research based on user feedback. Implementation Sci 17, 75 (2022). https://doi.org/10.1186/s13012-022-01245-0

      Response: Phase 2 refers to limited aspects of PAVE implementation, mainly introducing the management algorithms and evaluating the acceptability by providers and patients. Based on preliminary results of PAVE in the efficacy analysis a more comprehensive implementation intervention is being planned.

      Reviewer #3 (Recommendations For The Authors):

      This is a very strong protocol and obviously the synthesis of many years' of work. I have some minor suggestions only.

      The issue raised as a weakness could be addressed by specifying that biopsy adequacy is evaluated by the local histopathologist. Those cases that don't contain at least some stroma and only superficial strips of epithelium should probably be assessed as "unsatisfactory" and excluded from triage performance calculations.

      While endocervical curettage is commonly performed in North America, resulting in good quality samples, there is considerable global variation in this practice. The procedure yielding high quality samples is usually somewhat painful due to the cervical dilation and may in fact be more painful than small biopsies.

      Response: We are undertaking a thorough evaluation of histology assessment together with the on-site pathologists and an external expert reviewer. It is critical that the study material be of good quality and that the diagnosis be highly accurate as these elements are critical for patient management but also for an adequate training of the AI algorithm. We are recommending to use for endocervical sampling a soft tissue by Histologics that provides excellent material and it is reported to be less painful than regular curette. Pathologists are requested to verify the quality of the sampling of this approach.

      The sentence starting at line 311 could add that, clinicians also record transformation type and/ or colposcopy adequacy.

      Response: Added

      The clinicians are reporting the VIA or the colposcopy impression and also the visibility of the SCJ.

      The manuscript could be strengthened by specifying what will happen to people who have HPV detected and are triage negative. Will they be recalled for follow-up HPV test at around 12 months or some other interval?

      Finally, will those who have been treated be recalled for a follow-up HPV test at around 12 months, particularly those treated with thermal ablation? Follow-up of people in whom HPV is detected, whether triage negative or positive (and treated) would strengthen the study and enhance participant safety. If this is already planned it would strengthen the manuscript to cover these aspects.

      Response: The PAVE strategy runs under a Consortium agreement and thus we cannot dictate specific protocols for follow-up. We are very eager to promote an adequate follow-up for those with a triage test negative, but the monitoring of its implementation is beyond PAVE. All settings have under their guidelines a yearly follow-up for any woman receiving thermal ablation and shorter intervals for those getting LEEP (LLETZ).

    1. Author Response

      The following is the authors’ response to the original reviews.

      eLife assessment

      This study offers an inventory of proteins and their phosphorylated sites that are up- and down-regulated in the adipose tissue and skeletal muscle of women with PCOS. The data were collected and analyzed using rigorous and validated methodology, making it a useful resource for identifying targets and strategies for future PCOS treatments. However, even though some of the predicted targets are compelling, further functional validation is required to ensure the accuracy of these identified targets. If confirmed, the findings of this study would be of significant interest to a wide range of readers.

      Thank you very much for the opportunity to carry out some final revisions to our manuscript and for the invitation to submit a revised version of our work for further consideration in eLife. We are grateful for the very constructive and thorough feedback provided. Consequently, our manuscript has undergone revisions to address the issues raised, providing additional data from mouse models showing that androgen receptor signaling has a direct effect on muscle fiber type.

      Public Reviews:

      Reviewer #1 (Public Review):

      In the manuscript, the authors tried to explore the molecular alterations of adipose tissue and skeletal muscle in PCOS by global proteomic and phosphorylation site analysis. In the study, the samples are valuable, while there are no repeats for MS and there are no functional studies for the indicted proteins, phosphorylation sites. The authors achieved their aims to some extent, but not enough.

      Response: Indeed, the samples are valuable but given the relatively high sensitivity and specificity of the method we don’t see why repeats for MS would increase the power of the study. The number of tissue samples analyzed would however do so. Although no functional studies have been done, we do show that hyperandrogenism is associated with a shift towards fewer type I fibers in skeletal muscle. In the revised manuscript we have added data showing that androgens (dihydrotestosterone, DHT) have a direct effect on reducing the number of type I muscle fibers in a PCOS-like mouse model. Prepubertal DHT exposure led to a dramatic decrease in type I fibers, and this effect was partly prevented by the androgen receptor antagonist flutamide (Fig. 4A). Moreover, while skeletal muscle specific AR knockout mice presented with fewer type I muscle fibers, they were protected against the DHT-induced type I muscle fiber loss (Fig. 4B).

      Reviewer #2 (Public Review):

      This study provides the proteomic and phosphoproteomics data for our understanding of the molecular alterations in adipose tissue and skeletal muscle from women with PCOS. This work is useful for understanding of the characteristics of PCOS, as it may provide potential targets and strategies for the future treatment of PCOS. While the manuscript presents interesting findings on omics and phenotypic research, the lack of in-depth mechanistic exploration limits its potential impact.

      The study primarily presents findings from omics and phenotypic research, but fails to provide a thorough investigation into the underlying mechanisms driving the observed results. Without a thorough elucidation of the mechanistic underpinnings, the significance and novelty of the study are compromised.

      Response: We do provide solid evidence that women with PCOS have a lower expression of proteins specific for type I muscle fibers. A comprehensive exploration of the mechanism driving the observed results is not within the scope of this paper. However, we have included experimental data from a PCOS-like mouse model to strengthen our results that hyperandrogenism has a direct effect on lowering the number of type I fibers. Prepubertal dihydrotestosterone (DHT) exposure led to a dramatic decrease in type I fibers, and this effect was abolished in DHT-exposed mice with skeletal muscle-specific deletion of the androgen receptor (Fig. 4B). Moreover, the decrease in type I fibers was partly prevented by the androgen receptor antagonist flutamide in wild-type mice (Fig. 4A). Notably, unchallenged skeletal muscle specific AR knockout mice had fewer type I muscle fiber. These data indicate that muscle AR signaling is important for normal muscle development, but that exaggerated muscle AR signaling leads to decreased abundance of type I muscle fibers in adult females.

      Reviewer #1 (Recommendations For The Authors):

      1. For participant recruitment the age should be considered.

      Response: The age of the women is shown in Table 1, the mean age was around 30 years. Cases and controls were matched for age, weight, and BMI at recruitment.

      1. The current method is that biopsies from 10 participants are collected as a sample, biopsy from 1 participant for MS and comprehensive analysis in the group may be better.

      Response: The skeletal muscle biopsies from the 10 controls and 10 women with PCOS at baseline and after 5 weeks of treatment were collected and analyzed as individual samples. For MS each sample was handled as individual samples with subsequent comprehensive analysis of each group. This has now been further clarified in the methods; paragraph Proteomic sample preparation and LC-MS/MS analysis.

      1. Figure 2C, it is not convincing that "The increased expression of perilipin-1 was confirmed by immunofluorescence staining of muscle biopsies".

      Response: we have quantified perilipin-1 staining in skeletal muscle cells from control and PCOS using ImageJ software (National Institutes of Health, Bethesda, MD, USA). The channels of the images were split and converted into 8-bit. The minimum and maximum thresholds were adjusted and kept constant for all the images. Regions of interest were drawn around the cells and empty space for background intensity measurement. The mean perilipin-1 intensity was measured and corrected by deducting the background. A total of 28 PCOS and 33 control cells were quantified. The quantification of perilipin-1 staining is included in Fig. 2D. Perilipin-1 staining was more abundant in skeletal muscle cells from women with PCOS.

      1. Figs.3F,4C,5C,6B, methods for the quantification are needed respectively.

      Response: For each of the graphs, a detailed description of how the stainings were quantified has been included in the Methods section; Histological analyses and immunofluorescence.

      Fig.3F; Fiber cross-sectional area was automatically determined using MyoVision v1.0 and the proportion of type I fibers was manually counted on ImageJ. A total of 579 fibers from seven controls (60-150 fibers per muscle section) and 177 fibers (15-80 fibers per muscle section) from women with PCOS were quantified. Data are expressed as mean ± SD and graphically depicted with each individual fiber quantified.

      Fig. 4C and 6B; Quantification of picrosirius red staining of adipose tissue before and after treatment with electrical stimulation was performed using a semi-automatic macro in ImageJ software. This macro allows for calculation of the total area (m2) and the % of collagen staining from each area adjusting the minimum and maximum thresholds.. Three different random pictures per section (4-5 sections/subject) were taken at 10x or 20x magnification using a regular bright field microscope (Olympus BX60 & PlanApo, 20x/0.7, Olympus, Japan). All images were analyzed on ImageJ software v1.47 (National Institutes of Health, Bethesda, MD, USA) using this protocol https://imagej.nih.gov/ij/docs/examples/stained-sections/index.html with the following modification; threshold min 0, max 2.

      Fig. 5C; Quantification of picrosirius red staining of skeletal muscle before and after treatment with electrical stimulation was performed using a semi-automatic macro in ImageJ software v1.47 (National Institutes of Health, Bethesda, MD, USA) using the same protocol as for adipose tissue described above. % of collagen staining was calculated on 8 – 10 images of different microscopic fields from each muscle sample.

      Reviewer #2 (Recommendations For The Authors):

      While the study presents some valuable research findings, it falls short in terms of providing a comprehensive understanding of the mechanistic basis of the observed outcomes. Further exploration and elucidation of the mechanisms involved would greatly enhance the quality and impact of the study. For example, the authors need to provide sufficient evidence to elucidate why PCOS patients exhibit changes in these proteins and phosphorylation sites, as well as how these changes may impact PCOS patients, such as whether they are related to fertility. It would be valuable to provide further mechanistic insights to enhance the scientific rigor of the study.

      I encourage the authors to further refine their research and resubmit the manuscript with a more robust and comprehensive exploration of the mechanistic aspects to strengthen its scientific merit.

      Response: PCOS is characterized by reproductive and metabolic features. Changes in protein expression and phosphorylation sites in skeletal muscle and adipose tissue likely impact metabolic function to a larger degree than fertility. With that said, altered muscle function may affect insulin resistance and inflammation, thereby potentially aggravating reproductive status including ovulatory cyclicity and fertility potential. We found that aldo-keto reductase family 1 members C1 (AKR1C1) and C3 (AKR1C3), which for example can convert androstenedione to testosterone, had a higher expression in skeletal muscle. Expression of AKR1C1 was strongly correlated to higher circulating testosterone levels (Spearman rho=0.65, P=0.002), suggesting that muscle may produce testosterone via the backdoor pathway (added to the second paragraph of the results section). Moreover, a lower expression of the mitochondrial acetyl-CoA synthetase 2 correlated with a higher HOMA-IR (Spearman rho=-0.46, P=0.04), suggesting that an impaired mitochondrial fatty acid beta-oxidation contributes to insulin resistance. There was indeed a lower expression of various mitochondrial matrix proteins, some involved in mitochondrial fatty acid beta-oxidation; enoyl acyl carrier protein reductase; enoyl-CoA delta isomerase 1, and acyl-CoA thioesterase 11 (R-HSA-77289, q=0.0008) in PCOS muscle (this has been added to the discussion).

      A comprehensive exploration of the mechanism driving these changes is not within the scope of this paper. However, we have added data from PCOS-like mice to strengthen the paper. This mouse model supports our hypothesis that androgens drive the shift towards less type I muscle fibers, an effect that can be partly reversed by blocking the androgen receptor with the antagonist flutamide (Fig. 4A). Prepubertal DHT exposure led to a dramatic decrease in type I fibers but this effect was not observed in DHT-exposed mice with skeletal muscle-specific deletion of the androgen receptor (Fig. 4B). These data strongly indicate that AR signaling is driving the decrease in type I muscle fibers in females.

  3. Nov 2023
    1. Author Response

      The following is the authors’ response to the original reviews.

      Response to Editor and Reviewers

      Terzioglu et al, Mitochondrial temperature homeostasis resists external metabolic stresses

      Editor:

      We greatly appreciate the specific direction of the editors in guiding us as to what experiments are needed to strengthen the manuscript for publication. We here summarize how we have handled this advice (please refer to response to specific reviewer points, below, for the details). Changes to the text are indicated by red text and marginal red boxes numbered as per the responses below.

      Benchmarking: we now include a direct calibration of MTY against temperature. Performing experiments on temperature probes localized to different subcellular and submitochondrial compartments would be interesting and potentially informative, but is a whole new study that would require a great deal of validation. Hopefully it will be implemented, but it would not change the basic conclusions from the current study.

      Probe localization: In addition to referring to previously published literature, and the existing Figures 3B, 4 and S4 indicating that both MTY and mito-gTEMP are localized in mitochondria (the latter in the matrix), we have conducted some simple experiments to determine the intramitochondrial localization of MTY, applying standard subfractionation protocols. The findings confirm our previous assumption that MTY is inner membrane-associated.

      Expected outcomes: Since, in most cases, it is not possible to do this simultaneously with fluorescence measurements, we rely mostly on previous literature which is fully cited, or on measurements conducted in parallel (e.g. respirometry, Fig. S5) or previously in our own laboratories (e.g. flow cytometry on TMRM-stained cells). We accept that specific inferences on causality, e.g. that the effect of anisomycin is mediated by decreased ATP usage, or that the effects of Gal medium are to enforce dependence on OXPHOS, are arguably an over-reach. We have therefore toned down these statements so as to focus on the mt temperature response to the treatments, rather than to the imputed downstream physiological effects thereof.

      Confounding factors: We tested (and excluded) possible confounding factors affecting MTY and report the findings in an expanded supplementary figure.

      Discussion of the model(s) proposed by Matta: We have now included this, as far as we considered appropriate for the eLife readership. However, not being theoretical physicists, we would greatly welcome a careful scrutiny of what we have written, by both the reviewer and handling editor.

      Reviewer #1:

      A1. Causality: We agree with the reviewer in that we cannot formally distinguish, in this study, whether metabolism is adjusted to maintain mitochondrial temperature, or whether mitochondrial temperature maintenance is a secondary consequence of metabolic changes induced by stress. We have added a note to the Discussion to this effect. On balance, we would argue that the many cases that we have documented here tend to favour the former assertion, although this does not constitute proof. Identification of a sensor of mitochondrial temperature changes and an associated signal transduction machinery to orchestrate responses to it would be needed to settle this, but we are obviously very far from this at present. We have added this point to the Discussion, as well.

      A2. Metabolic correlates: We concede that the reviewer has a valid point, although exploring its ramifications in detail is not straightforward. The effects of AOX on respiration and resistance to OXPHOS inhibitors are documented previously and are also included in the paper as a check (Fig. S5). Our starting assumptions were that cells grown in low glucose/galactose would depend more upon mitochondrial as opposed to glycolytic ATP production, whilst net ATP production in anisomycin-treated cells should be attenuated, due to decreased ATP demand. Nevertheless, there are a number of ways this could be achieved, especially if our suggestion that altered ATP production is balanced by decreased or increased futile ATP turnover geared to maintenance of mitochondrial temperature. For example, measuring total oxygen consumption, P to O ratio or steady-state levels of ATP (or any other metabolite) would not be definitive. To accommodate the reviewer’s point, we have made clear that the various treatments we applied are predicted to alter metabolism in the specified ways, based upon theoretical arguments and previous data. To establish the exact details of the metabolic changes that accompany these treatments would require tracer-based metabolomics over time (see Jang 2018, 10.1016/j.cell.2018.03.055), followed up by measurements of specified enzyme activities. Whilst this would be very useful data that may illuminate our observations, it is obviously beyond the scope of the present paper. We hope that future studies will eventually unravel the relationship between metabolic adaptation and mitochondrial temperature.

      A3. Combinations of inhibitors: We were (and remain) reluctant to cram the paper too full of unsubstantiated speculations. Most, though not all, of the combinations of OXPHOS inhibitors that failed to give a stable reading of MTY fluorescence involved oligomycin plus an inhibitor of respiration. Since we already know that a complete loss of membrane potential leads to leakage of the dye, we surmise that this is the most likely reason for the fluorescence instability. In the presence of oligomycin alone, the minimal respiratory electron flow sustained should suffice to maintain a membrane potential if balanced against proton leakage. Conversely, even when respiration is inhibited, ATP synthase alone should be able to generate a membrane potential. However, the membrane potential may collapse when both oligomycin and a respiratory chain inhibitor are simultaneously applied. We expanded our comment on this issue in the Discussion and referred to it, briefly, in the legend of Fig. S3A.

      A4. Figure 4A: We added the panel indicators to the figure.

      A5. Fig.7C: We have tried to tighten up the wording, for clarity. Yes, the blue trace was the relevant data, but we were comparing the effect of rotenone on cells treated with anisomycin for 1, 2….18 hours with cells not treated with anisomycin at all (i.e. blue trace, zero h time-point).

      A6. Meaning of ‘control iMEFS’ (Fig. 7C): We meant iMEFs not expressing AOX. We have made the statement more precise, accordingly.

      A7. Supplementary Movie S1: The movie was sent, to accompany the submission. If it is not accessible for review, please contact the handling editor.

      Reviewer #2:

      B1. Theoretical considerations (‘mitochondrial paradox’): Since we are not theoretical physicists, we have deferred to the reviewer’s expertise in these matters and quoted the suggested literature as succinctly as possible for the largely biological audience of eLife, sticking closely to the reviewer’s own words. In this light, we would invite the reviewer to scrutinize our added text (in a short additional section of the Discussion, for both this and point B3, below), and suggest any rewording that they consider appropriate.

      B2. Biological implications: We appreciate the point, but since the Discussion section is already long, we have just referred the reader to the treatment of Fahimi et al. We hope to expand on these issues in a separate paper, to be published elsewhere.

      B3. Theoretical considerations (Landauer’s principle and ATP synthase electrostatics): Once again, we have mentioned the issue as suggested, but would ask the reviewer to check the exact language we have used and propose any amendments they consider necessary.

      Reviewer #3:

      C1. Benchmark comparisons: We acknowledge that there are limitations to the use of each method of mitochondrial temperature assessment, and we now explain them more thoroughly in a new section of the Discussion. However, the fact that the two methods give approximately the same result constitutes a crucial validation. In addition, we verified the temperature-responsiveness of MTY fluorescence in free solution at physiological pH (see new supplementary figure panel, Fig. S2D), showing that the response is almost linear over the temperature range inferred in the experiments (35-65 ºC). Note, however, that the response curve generated cannot be used directly for calibration, due to the unknown contributions in vivo from cellular autofluorescence and quenching under OXPHOS-inhibited conditions, which may modify the signal, and will vary according to the amount of dye taken up in a given experiment. Because of this, the internal calibration used in each experiment is a far more reliable way of relating observed fluorescence changes to temperature. Note, however, that if the slight deviation from linearity seen at higher temperatures in the MTY fluorescence temperature-response curve (dotted line in Fig. S2D) reflects how the dye responds in vivo, MTY-based estimations of mitochondrial temperature may be over-estimated by ~2 ºC. This is now made clear in the text.

      C2. Basal temperature: The basal mitochondrial temperature (no inhibitors) as inferred from the mitogTEMP calibration curve was already in the paper (zero time points for iMEF(P) and iMEF(AOX) cells, Fig. 7A, 7B.

      C3. Other organelles: In principle, gTEMP could be targeted to other organelles, such as the nucleus, peroxisomes, ER, plasma membrane and so on, which would be highly informative in profiling intracellular temperature heterogeneities. However, this would require further rounds of recloning and expression, followed in each case by verification of intracellular targeting; obviously quite a large study beyond the scope of our present work. In any case, it would now best be undertaken using the improved, next-generation ratiometric probes (B-gTEMP), which is under way. We agree that this is an important question for future experimentation and have added a short extra section to the Discussion, accordingly.

      C4. Variation with external temperature: We implemented additional experiments to test this, subjecting cells to a mild heat- or cold-shock, and tracking MTY fluorescence both before and after the subsequent addition of oligomycin, with final internal calibration as before. The results were again qualitatively reproducible, but suggested that the combination of external temperature shock and bioenergetic stress. We show the details of the results of these experiments here, for the reviewer and others to inspect and consider. However, since they are not straightforwardly interpretable, we feel that they should be reserved for a future study which investigates the effects of external temperature changes on intramitochondrial temperature and bioenergetics in much greater detail. For these reasons we show the data here only, and not in the revised paper.

      Both cold shock (38→32 ºC) and heat shock (38→41 ºC) produced immediate shifts of mt temperature, but by lesser amounts than the external stresses applied, i.e. a cooling of 2-4 ºC in the first case and a warming of 0-2 ºC in the second. Over the following 10 min the mt temperature of the temperature-shocked cells held steady or drifted only slightly. These observations are broadly consistent with the general conclusions of the paper that mitochondrial temperature resists external stresses. However, the effect of then adding oligomycin was intriguingly different from that seen in control cells. In cold-shocked cells the mt temperature shift produced by oligomycin was several degrees less than in control cells and mitochondrial temperature then gradually readjusted upwards to near the starting value, suggesting the induction of thermogenic pathways to compensate for the decreased external temperature. In heat-shocked cells, the response to oligomycin was reproducibly triphasic: the initial cooling effect was less pronounced than in control cells, but was followed by rewarming and then by a prolonged and progressive cooling. This is obviously much harder to interpret, and will require substantial further studies to parse.

      C5. Other factors: Although this point is addressed in previous literature, we measured effects directly in solution (for MTY). Note, however, that it is not feasible to measure membrane potential simultaneously, due to the spectral overlap between e.g. TMRM and MTY. Nevertheless we were able to test the effects on MTY fluorescence of incremental changes in Ca2+, pH and ROS within the physiological range (see doi: 10.1073/pnas.95.12.6803, doi: 10.1074/jbc.M610491200 and doi: 10.3390/antiox10050731). The results clearly indicate that changes in any of these parameters has no effect on MTY fluorescence (new supplementary figure panels S3E, S3F and S3G).

      C6. Localization of probes: The existing Figures 3B, 4 and S4, as well as previous literature, indicate a mitochondrial localization both for MTY and mito-gTEMP. The matrix localization of proteins of the GFP reporter family tagged with the COX8 matrix-directed targeting signal used here is well established (e.g. see doi: 10.1016/S0076-6879(09)05016-2). To investigate the sub-mitochondrial localization of MTY we conducted a standard series of fractionation steps, using detergents, centrifugation and sonication. Whilst these do not provide absolute purity, they clearly indicate that MTY in energized mitochondria resides in or closely associated with the inner mitochondrial membrane. In two trials, in which mitochondria were fractionated into mitoplasts versus outer membrane/inter-membrane space fractions, an average 92% of the MTY fluorescence was retained in the mitoplast fraction (after subtracting autofluorescence from control samples not treated with MTY). After sonication, which should render most of the inner membrane pelletable as ‘inside out’ submitochondrial particles (SMPs), leaving most of the matrix contents in solution, 90% of the MTY fluorescence signal (again based on two trials, with background subtracted) was recovered in the SMP fraction, supporting the proposition that the dye is inner-membrane associated. These findings are now reported in the Results section and commented on in the appropriate section of the Discussion. We agree with the reviewer that it would be useful to target temperature probes, e.g. B-gTEMP, to specific sub- and extra-mitochondrial compartments (cytosol, MAMs, outer membrane, IMS, inner membrane or even specific protein complexes therein), so as to gauge the nature of intramitochondrial heat conduction between compartments and its radiation to the extramitochondrial environment. However, because it would be an extensive study in its own right, requiring careful validation of targeting, we feel this should be attempted as a follow-up study.

      C7. Use of probes in isolated mitochondria: In principle we see no reason why this should not work, but any result would be non-physiological, since the external environment of isolated mitochondria is not the complex protein- and organelle-rich environment of the cytoplasm, which must play a crucial role in modulating heat diffusion from the organelle. Such an experiment may be useful to assess how much temperature buffering is provided by the rest of the cytoplasm, even though it does not directly address the internal temperature of mitochondria in vivo. Accordingly, we added a sentence to the Discussion foreshadowing such an experiment.

      C8. Other probes and methods: See points C1 and C3 above. The reviewer’s suggestion could best be addressed using the superior B-gTEMP reporters engineered for specific expression in the nucleus and cytosol. This would be part of an extensive new study beyond the scope of the present work, but would of course be a further validation of its conclusions. We agree that multiple approaches are needed to address the issue of temperature differences within cells, in light of the surprising findings both of ourselves and of others, such as the study of Okabe et al (2012) to which the reviewer refers. This point too is now added to the Discussion.

      C9. Theoretical considerations: The critiques referred to are now briefly addressed in the revised Discussion, along with those raised by Reviewer 2. However, since we are not theoretical physicists we do not feel qualified to enter the debate further. As Baffou and colleagues point out, in https://doi.org/10.1038/nmeth.3552, “In order for the community to come to a consensus, we believe some effort will be required to identify the actual origin of the signal measured in these studies, both theoretically and experimentally“. Our experimental findings provide source data for this debate but do not resolve it.

    1. Author Response

      The following is the authors’ response to the original reviews.

      eLife assessment

      This study reports important findings regarding the systemic function of hemocytes controlling whole-body responses to oxidative stress. The evidence in support of the requirement for hemocytes in oxidative stress responses as well as the hemocyte single-nuclei analyses in the presence or absence of oxidative stress are convincing. In contrast, the genetic and physiological analyses that link the non-canonical DDR pathway to upd3/JNK expression and high susceptibility, and the inferences regarding the function of hemocytes in systemic metabolic control are incomplete and would benefit from more rigorous approaches. The work will be of interest to cell and developmental biologists working on animal metabolism, immunity, or stress responses.

      We would like to thank the editorial team for these positive comments on our manuscript and the constructive suggestions to improve our manuscript. We are now happy to send you our revised manuscript, which we improved according to the suggestions and valuable comments of the referees.

      Public Reviews:

      Reviewer #1 (Public Review):

      The study examines how hemocytes control whole-body responses to oxidative stress. Using single cell sequencing they identify several transcriptionally distinct populations of hemocytes, including one subset that show altered immune and stress gene expression. They also find that knockdown of DNA Damage Response (DDR) genes in hemocytes increases expression of the immune cytokine, upd3, and that both upd3 overexpression in hemocytes and hemocyte knockdown of DDR genes leads to increased lethality upon oxidative stress.

      Strengths

      1. The single cell analyses provide a clear description of how oxidative stress can cause distinct transcriptional changes in different populations of hemocytes. These results add to the emerging them in the field that there functionally different subpopulations of hemocytes that can control organismal responses to stress.

      2. The discovery that DDR genes are required upon oxidative stress to limit cytokine production and lethality provides interesting new insight into the DDR may play non-canonical roles in controlling organismal responses to stress.

      We are grateful to referee 1 to point out the importance and novelty of our snRNA-seq data and our findings on the role of DNA damage-modulated cytokine release by hemocytes during oxidative stress. We further extended these analyses in the revised manuscript by looking deeper into the transcriptomic alterations in fat body cells upon oxidative stress (Figure 4, Figure S4). We further provide additional data to support the connection of DNA damage signaling and regulation of upd3 release from hemocytes (Figure 6F). Here we show that upd3-deficiency can abrogate the increased susceptibility of flies with mei41 and tefu knockdown in hemocytes. In line with this finding, we also show that upd3null mutants show a reduced but not abolished susceptibility to oxidative stress overall (Figure 6F), underlining the role of upd3 as a mediator of oxidative stress response.

      Weaknesses

      1. In some ways the authors interpretation of the data - as indicated, for example, in the title, summary and model figure - don't quite match their data. From the title and model figure, it seems that the authors suggest that the DDR pathway induces JNK and Upd3 and that the upd3 leads to tissue wasting. However, the data suggest that the DDR actually limits upd3 production and susceptibility to death as suggested by several results:

      According to the referee’s suggestion, we revised the manuscript and adjusted our title, abstract and graphical summary to be more precise that DNA damage signaling seem to have a modulatory or regulatory effect on upd3 release. Furthermore, we provide now additional data to support the connection between DNA damage signaling and upd3 release. For example, we added several genetic “rescue” experiments to strengthen the epistasis that modulation of DNA damage signaling and the higher susceptibility of the fly is connected to altered upd3 levels (Figure 6F). We now provide additional data showing that the loss of upd3 rescues the susceptibility to oxidative stress in flies, which are deficient for DDR components in hemocytes.

      a. PQ normally doesn't induce upd3 but does lead to glycogen and TAG loss, suggesting that upd3 isn't connected to the PQ-induced wasting.

      Even though in our systemic gene expression analysis of upd3 expression, we could not detect a significant induction of upd3 upon PQ feeding. However, we found upd3 expression within our snRNAseq data in a distinct cluster of immune-activated hemocytes (Figure 3B, Cluster 6). Upon knockdown of the DNA damage signaling in hemocytes, the levels then increase to a detectable level in the whole fly. This supports our assumption that upd3 is needed upon oxidative stress to induce energy mobilization from the fat body, but needs to be tightly controlled to balance tissue wasting for energy mobilization. Furthermore, we found evidence in our new analysis of the snRNA-seq data of the fat body cells, that indeed we can find Jak/STAT activation in one cell cluster here, which could speak for an interaction of Cluster 6 hemocytes with cluster 6 fat body cells. A hypothesis we aim to explore in future studies.

      b. knockdown of DDR upregulates upd3 and leads to increased PQ-induced death. This would suggest that activation of DDR is normally required to limit, rather than serve as the trigger for upd3 production and death.

      Our data support the hypothesis that DDR signaling in hemocytes “modulates” upd3 levels upon oxidative stress. We now carefully revised the text and the graphical summary of the manuscript to emphasize that oxidative stress causes DNA damage, which subsequently induces the DNA damage signaling machinery. If this machinery is not sufficiently induced, for example by knockdown of tefu and mei-41, non-canonical DNA damage signaling is altered which induces JNK signaling and induces release of pro-inflammatory cytokines, including upd3. Whereas DNA damage itself is only slightly increase in the used DDR deficient lines (Figure 5C) and hemocytes do not undergo apoptosis (unaltered cell number on PQ (Figure 5B)), we conclude that loss of tefu, mei-41, or nbs1 causes dysregulation of inflammatory signaling cascades via non-canonical DNA damage signaling. However, oxidative stress itself seems to also induce upd3 release and DNA damage signaling in the same cell cluster, as shown by our snRNA-seq data (Figure 3B). Hence, we think that DNA damage signaling is needed as a rate-limiting step for upd3 release.

      c. hemocyte knockdown of either JNK activity or upd3 doesn't affect PQ-induced death, suggesting that they don't contribute to oxidative stress-induced death. It’s only when DDR is impaired (with DDR gene knockdown) that an increase in upd3 is seen (although no experiments addressed whether JNK was activated or involved in this induction of upd3), suggesting that DDR activation prevents upd3 induction upon oxidative stress.

      Whereas the double knockdown of upd3 or bsk and DDR genes was resulting in insufficient knockdown efficiencies, we added a rescue experiment where we combined upd3null mutants with knockdown of tefu and mei-41 in hemocytes and found a reduced susceptibility of DDR-deficient flies to oxidative stress.

      1. The connections between DDR, JNK and upd3 aren't fully developed. The experiments show that susceptibility to oxidative stress-induced death can be caused by a) knockdown of DDR genes, b) genetic overexpression of upd3, c) genetic activation of JNK. But whether these effects are all related and reflect a linear pathway requires a little more work. For example, one prediction of the proposed model is that the increased susceptibility to oxidative stress-induced death in the hemocyte DDR gene knockdowns would be suppressed (perhaps partially) by simultaneous knockdown of upd3 and/or JNK. These types of epistasis experiments would strengthen the model and the paper.

      As mentioned before, we had some technical difficulties combining the knockdown of bsk or upd3 with DDR genes. However, we added a new experiment in which we show that upd3null mutation can rescue the higher susceptibility of hemocytes with tefu and mei41 knockdown.

      1. The (potential) connections between DDR/JNK/UPD3 and the oxidative stress effects on depletion of nutrient (lipids and glycogen) stores was also not fully developed. However, it may be the case that, in this paper, the authors just want to speculate that the effects of hemocyte DDR/upd3 manipulation on viability upon oxidative stress involve changes in nutrient stores.

      In the revised version of the manuscript, we now provide a more thorough snRNA-seq analysis in the fat body upon PQ treatment to give more insights on the changes in the fat body upon PQ treatment. We added additional histological images of the abdominal fat body on control food and PQ food, to demonstrate the elimination of triglycerides from fat body with Oil-Red-O staining (Figure S1). We also analyzed now hemocyte-deficient (crq-Gal80ts>reaper) flies for their levels of triglycerides and carbohydrates during oxidative stress, to support our hypothesis that hemocytes are key players in the regulation of energy mobilization during oxidative stress. Loss of hemocytes (and therefore also their regulatory input on energy mobilization from the fat body) results in increased triglyceride storage in the fat body during steady state with a decreased consumption of these triglycerides on PQ food compared to control flies (Figure 1J). In contrast, glycogen storage and mobilization, which is mostly done in muscle, is not altered in these flies during oxidative stress (Figure 1L). Interestingly, free glucose levels are drastically reduced in hemocyte-deficient flies, which could be due to insufficient energy mobilization from the fat body and subsequently results in a higher susceptibility of these flies on oxidative stress (Figure 1K). Additionally, we aim to point out here that “functional” hemocytes are needed for effective response to oxidative stress, but this response has to be tightly balanced (see also new graphical abstract).

      Reviewer #2 (Public Review):

      Hersperger et al. investigated the importance of Drosophila immune cells, called hemocytes, in the response to oxidative stress in adult flies. They found that hemocytes are essential in this response, and using state-of-the-art single-cell transcriptomics, they identified expression changes at the level of individual hemocytes. This allowed them to cluster hemocytes into subgroups with different responses, which certainly represents very valuable work. One of the clusters appears to respond directly to oxidative stress and shows a very specific expression response that could be related to the observed systemic metabolic changes and energy mobilization. However, the association of these transcriptional changes in hemocytes with metabolic changes is not well established in this work. Using hemocyte-specific genetic manipulation, the authors convincingly show that the DNA damage response in hemocytes regulates JNK activity and subsequent expression of the JAK/STAT ligand Upd3. Silencing of the DNA damage response or excessive activation of JNK and Upd3 leads to increased susceptibility to oxidative stress. This nicely demonstrates the importance of tight control of JNK-Upd3 signaling in hemocytes during oxidative stress. However, it would have been nice to show here a link to systemic metabolic changes, as the authors conclude that it is tissue wasting caused by excessive Upd3 activation that leads to increased susceptibility, but metabolic changes were not analyzed in the manipulated flies.

      We thank the referee for the suggestion to better connect upd3 cytokine levels to energy mobilization from the fat body. We agree that this is an important point to support our hypothesis. First, we added now a detailed analysis of fat body cells in our snRNA-seq data to evaluate the changes induced in the fat body upon oxidative stress. We further added additional metabolic analyses of hemocyte-deficient flies (crq-Gal80ts>reaper) to support our hypothesis that hemocytes are key players in the regulation of energy mobilization during oxidative stress (see also answer to referee 1). Loss of the regulatory role of hemocytes in the energy mobilization and redistribution leads to a decreased consumption of these triglycerides on PQ food compared to control flies (Figure 1J). In contrast, glycogen storage and mobilization from muscle, is not affected in hemocyte-deficient flies during oxidative stress (Figure 1L). Interestingly, free glucose levels are drastically reduced in hemocyte-deficient flies compared to controls, which could be due to insufficient energy mobilization from the fat body resulting in a higher susceptibility to oxidative stress (Figure 1K). This data supports our assumption that “functional” hemocytes are needed for effective response to oxidative stress, but this response has to be tightly balanced (see also new graphical summary).

      The overall conclusion of this work, as presented by the authors, is that Upd3 expression in hemocytes under oxidative stress leads to tissue wasting, whereas in fact it has been shown that excessive hemocyte-specific Upd3 activation leads to increased susceptibility to oxidative stress (whether due to increased tissue wasting remains a question). The DNA damage response ensures tight control of JNK-Upd3, which is important. However, what role naturally occurring Upd3 expression plays in a single hemocyte cluster during oxidative stress has not been tested. What if the energy mobilization induced by this naturally occurring Upd3 expression during oxidative stress is actually beneficial, as the authors themselves state in the abstract - for potential tissue repair? It would have been useful to clarify in the manuscript that the observed pathological effects are due to overactivation of Upd3 (an important finding), but this does not necessarily mean that the observed expression of Upd3 in one cluster of hemocytes causes the pathology.

      We agree with the referee that the pathological effects and increased susceptibility to oxidative stress are mediated by over-activated hemocytes and enhanced cytokine release, including upd3 during oxidative stress. We edited the revised manuscript accordingly to imply a “regulatory” role of upd3, which we suspect and suggest as an important mediator for inter-organ communication between hemocytes and fat body. Whereas our used model for oxidative stress (15mM Paraquat feeding) is a severe insult from which most of the flies will not recover, we could not account and test how upd3 might influence tissue repair after injury, insults and infection. We believe that this is an important factor, we aim to explore in future studies.

      Reviewer #3 (Public Review):

      In this study, Kierdorf and colleagues investigated the function of hemocytes in oxidative stress response and found that non-canonical DNA damage response (DDR) is critical for controlling JNK activity and the expression of cytokine unpaired3. Hemocyte-mediated expression of upd3 and JNK determines the susceptibility to oxidative stress and systemic energy metabolism required for animal survival, suggesting a new role for hemocytes in the direct mediation of stress response and animal survival.

      Strength of the study:

      1. This study demonstrates the role of hemocytes in oxidative stress response in adults and provides novel insights into hemocytes in systemic stress response and animal homeostasis.

      2. The single-cell transcriptome profiling of adult hemocytes during Paraquat treatment, compared to controls, would be of broad interest to scientists in the field.

      We are grateful to these positive comments on our data and are excited that the referee pointed out the importance of our provided snRNA-seq analysis of hemocytes and other cell types during oxidative stress. In the revised, version we now extended this analysis and looked not only into hemocytes but also highlighted induced changes in the fat body (Figure 4).

      Weakness of the study:

      1. The authors claim that the non-canonical DNA damage response mechanism in hemocytes controls the susceptibility of animals through JNK and upd3 expression. However, the link between DDR-JNK/upd3 in oxidative stress response is incomplete and some of the descriptions do not match their data.

      In the revised manuscript, we aimed to strengthen the weaknesses pointed out by the referee. We now included additional genetic crosses to validate the connection of DDR signaling in hemocytes with upd3 release. For example, we added now survival studies where we show that upd3null mutation can rescue the higher susceptibility of flies with tefu and mei41 knockdown in hemocytes during oxidative stress. Furthermore, we added additional data to highlight the importance of hemocytes themselves as essential regulators of susceptibility to oxidative stress. We analyzed the hemocyte-deficient flies (crq-Gal80ts>reaper) for their triglyceride content and carbohydrate levels during oxidative stress (Figure 1 I-L). As outlined above, loss of hemocytes leads to a decreased consumption of these triglycerides on PQ food compared to control flies (Figure 1J). In contrast, glycogen storage and mobilization from muscle, is not affected in hemocyte-deficient flies during oxidative stress (Figure 1L). Interestingly, free glucose levels are drastically reduced in hemocyte-deficient flies, which could be due to insufficient energy mobilization from the fat body resulting in a higher susceptibility to oxidative stress (Figure 1K).

      1. The schematic diagram does not accurately represent the authors' findings and requires further modifications.

      We carefully revised the text throughout the manuscript describing our results and edited the graphical abstract to display that upd3 levels and hemocytes are essential to balance and modulate response to oxidative stress.

      Reviewer #1 (Recommendations For The Authors):

      The summary doesn't say too much about what the specific discoveries and results of the study are. The description is limited to just one sentence saying, "Here we describe the responses of hemocytes in adult Drosophila to oxidative stress and the essential role of non-canonical DNA damage repair activity in direct "responder" hemocytes to control JNK-mediated stress signaling, systemic levels of the cytokine upd3 and subsequently susceptibility to oxidative stress" which doesn't provide sufficient explanation of what the results were.

      In the revised version of our manuscript, we now provide further information for the reader to outline the findings of our study in a concise way in the summary.

      Reviewer #2 (Recommendations For The Authors):

      1. To strengthen the conclusion that the DDR response suppresses JNK, and thus Upd3, rescue of DDR by upd3 null mutation would help (knockdown by Hml>upd3IR might not work, RNAi seems problematic).

      We would like to thank the referee for this suggestion and included now a genetic experiment where we combined upd3null mutants with hemocyte-specific knockdown of mei-41 and tefu to test their susceptibility to oxidative stress. Our data indeed provide evidence that loss of upd3 rescues the higher susceptibility of flies with hemocyte-specific knockdown for tefu and mei-41 (Figure 6F). Furthermore, we see that upd3null mutants show a diminished susceptibility to oxidative stress compared to control flies (Figure 6F).

      1. To link the observed effects to systemic metabolic changes, it would be useful to measure glycogen and triglycerides in these flies as well:
      2. crq-Gal80ts>reaper to see what role hemocytes play in the observed metabolic changes.

      3. Hml-Upd3 overexpression and Upd3 null mutant (Upd3 RNAi seems to be problematic, we have similar experiences) to see if Upd3 overexpression leads to even more profound changes as suggested, and if Upd3 mutation at least partially suppresses the observed changes.

      We agree with the referee that analyzing the connection of hemocyte activation to metabolic changes should be demonstrated in our manuscript to support our claim that hemocytes are important regulators of energy mobilization during oxidative stress. Hence, we analyzed triglycerides and carbohydrate levels in hemocyte-deficient flies (crq-Gal80ts>reaper) during oxidative stress. Indeed, we found substantial differences in energy mobilization in these flies supporting the assumption that the higher susceptibility of hemocyte-deficient flies could be caused by substantial decrease in free glucose and inefficient lysis of triglycerides from the fat body (Figure 1I-K).

      1. To test whether the cause of the increased susceptibility to oxidative stress is due to Upd3 overactivation induced by DDR silencing, the authors should attempt to rescue DDR silencing with an Upd3 null mutation.

      The suggestion of the reviewer was included in the revised manuscript and as outlined above we now added this data set to our manuscript (Figure 6F). Indeed, we can now provide evidence that upd3null mutation rescues the higher susceptibility of flies with DDR knockdown in hemocytes.

      1. Lethality after PQ treatment varies widely (sometimes from 10 to 90%! as in Figure 5D) - is this normal? In some experiments the variability was much lower. In particular, Figure 5D is very problematic and for example the result with upd3 null mutant compared to control is not very convincing. This could be an important result to test whether Upd3, with normal expression likely coming from cluster 6, actually plays a beneficial role, whereas overexpression with Hml leads to pathology.

      We agree with the referee that it would be more convincing if the variation cross of survival experiments would be less. However, we included a lot of flies and vials in many individual experiments to test our hypothesis and variation in these survivals was always the case. These effects can be caused by many factors for example the amount of food intake by the flies, genetic background or inserted transgenes. The n-number is quite high across our survivals; so that we are convinced, the seen effects are valid. This reflects also the power of using Drosophila melanogaster as a model organism for such survivals. The high n-number in our data falls into a normal Gauss distribution with a distinct mean susceptibility between the genotypes analyzed.

      1. I like the conclusion at the end of the results: line 413: "We show that this oxidative stressmediated immune activation seems to be controlled by non-canonical DNA damage signaling resulting in JNK activation and subsequent upd3 expression, which can render the adult fly more susceptible to oxidative stress when it is over-activated." This is actually a more appropriate conclusion, but in the summary, introduction and discussion along with the overall schematic illustration, this is not actually stated as such, but rather as Upd3 released from cluster 6 causes the pathology. For example: line 435 "Hence, we postulate that hemocyte-derived upd3, most likely released by the activated plasmatocyte cluster C6 during oxidative stress in vivo and subsequently controlling energy mobilization and subsequent tissue wasting upon oxidative stress."

      We thank the referee for this suggestion and edited our manuscript and conclusions accordingly.

      Reviewer #3 (Recommendations For The Authors):

      1. In Figure 2, the authors claim showed that PQ treatment changes the hemocyte clusters in a way that suppresses the conventional Hml+ or Pxn+ hemocytes (cluster1) while expanding hemocyte clusters enriched with metabolic genes such as Lpin, bmm etc. It is not clear whether these cells are comparable to the fat body and if these clusters express any of previously known hemocyte marker genes to claim that these are bona fide hemocytes.

      We now included a new analysis of our snRNA-seq data in Figure S4, where we clearly show that all identified hemocyte clusters do not have a fat body signature and are hemocytes, which seem to undergo metabolic adaptations (Figure S4A). Furthermore, we show that the identified fat body cells have a clear fat body signature (Figure S4B) and do not express specific hemocyte markers (Figure S4C).

      1. In Figure 4C, the authors showed that comet assays of isolated hemocytes result in a statistically significant increase in DNA damage in DDR-deficient flies before and after PQ treatment. However, the authors conclude that, in lines 324-328, the higher susceptibility of DDR-deficient flies is not due to an increase in DNA damage. To explicitly conclude that "non-canonical" DNA damage response, without any DNA damage, is specifically upregulated during PQ treatment, the authors require further support to exclude the potential activation of canonical DDR.

      The referee is correct that we do not provide direct evidence for non-canonical DNA damage signaling. Therefore, we also decided to tune down our statement here a bit and removed that claim from the title. Increase in DNA damage can of course also increase the non-canonical DNA damage signaling pathway, loss of DNA damage signaling genes such as tefu and mei-41 seem to only have minor impacts on the overall amount of DNA damage acquired in hemocytes by oxidative stress. We therefore concluded that the induction in immune activation is most unlikely only caused by increased DNA damage but might be connected to dysregulation in non-canonical DNA damage signaling. Canonical DNA damage signaling leads essentially to DDR, which could be slow in adult hemocytes because they post-mitotic, or to apoptosis, which we could not observe in the analyzed time window in our experiments. Hemocyte number remained stable over the 24h PQ treatment without reduction in cell number (Figure 1H).

      1. From Figure 4D-F, the authors showed that loss of DDR in hemocytes induces the expression of unpaired 2 and 3, Socs36E, which represent the JAK/STAT pathway, and thor, InR, Pepck in the InR pathway, and a JNK readout, puc. These results indicate that the DDR pathway normally inhibits the upd-mediated JAK/STAT activation upon PQ treatment, compared to wild-type animals during PQ treatment in Figure 1B-C, which in turn protects the animal during oxidative stress responses. However, the authors claim that "enhanced DNA damage boosts immune activation and therefore susceptibility to oxidative stress (lines 365-366); we show that this oxidative stress-mediated immune activation seems to be controlled by non-canonical DNA damage signaling resulting in JNK activation and subsequent upd3 expression (line 413-416)". These conclusions are not compatible with the authors' data and may require additional data to support or can be modified.

      In the revised manuscript, we carefully revised now the text and our statements that it seems that DNA damage signaling in hemocytes has regulatory or modulatory effect on the immune response during oxidative stress. Accordingly, we also adjusted our graphical summary. We agree with the referee and used the term “non-canonical” DNA damage signaling more carefully throughout the manuscript. The slight increase in DNA damage seen after PQ treatment can contribute to immune activation but seems to be not correlative to the induced cytokine levels or the susceptibility of the flies to oxidative stress.
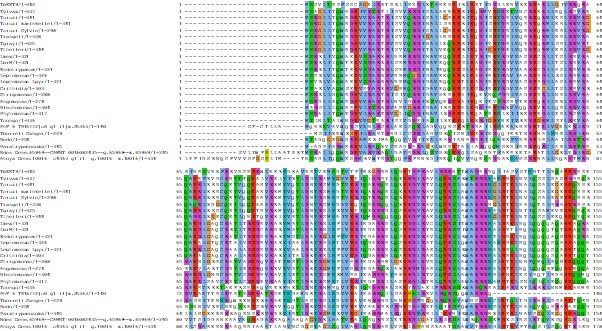
      1. In Fig 1I, the authors showed that genetic ablation of hemocytes using UAS-repear induces susceptibility to PQ treatment. It is possible that inducing cell death in hemocytes itself causes the expression of cytokine upd3 or activates the JNK pathway to enhance the basal level of upd3/JNK even without PQ treatment. If this phenotype is solely mediated by the loss of hemocytes, the results should be repeated by reducing the number of hemocytes with alternative genetic backgrounds.

      In the different genotypes analyzed across our manuscript we did not detect cell death of hemocytes or a dramatic reduction in hemocytes number (see Figure 1H, Figure 5B, Figure 6C). The higher susceptibility if hemocyte-deficient flies during oxidative stress is most likely caused by the loss of their regulatory role during energy mobilization. We tested triglyceride levels in hemocyte-deficient flies and found a decreased triglyceride consumption (lipolysis), with reduced levels of circulating glucose levels. This findings support our hypothesis that hemocytes are needed to balance the response to oxidative stress. In contrast, the flies with DDR-deficient hemocytes show higher systemic cytokine levels, which most likely enhance energy mobilization from the fat body and therefore result in a higher susceptibility of the fly to oxidative stress. Hence, we claim that hemocytes and their regulation of systemic cytokine levels are important to balance the response to oxidative stress and guarantee the survival of the organism.

      1. Lethality of control animals in PQ treatment is variable and it is hard to estimate the effect of animal susceptibility during 15mM PQ feeding. For example, Fig1A shows that control animals exhibit ~10% death during 15mM PQ which is further enhanced by crq-Gal80>reaper expression to 40% (Fig 1I). However, in Fig 5D-E, the basal lethality of wild-type controls already reaches 40~50%, which makes them hard to compare with other genetic manipulations. Related to this, the authors demonstrated that the expression of upd3 in hemocytes is sufficient to aggravate animal survival upon PQ treatment; however, upd3 null mutants do not rescue the lethality, which indicates that upd3 is not required for hampering animal mortality. These data need to be revisited and analyzed.

      As outlined above, we find the variability of susceptibility to oxidative stress across all of our experiments. This could be due to different effects such as food intake but also transgene insertion and genetic background. Crq-gal80ts>reaper flies are healthy, but show a shortened life span on normal food (Kierdorf et al., 2020) due to enhanced loss of proteostasis in muscles. We show in the revised manuscript that these flies have a higher susceptibility to oxidative stress and that this effect could be mediated by defects in energy mobilization and redistribution as shown by less triglyceride lysis from the fat body and decreasing levels in free glucose. This would explain the high mortality rate of these flies at 7 days after eclosion. Paraquat treatment (15mM) is a severe inducer of oxidative stress, which results in death of most flies when they are maintained for longer time windows on PQ food. Hence, it is a model, which is not suitable to examine and monitor recovery from this detrimental insult. upd3null mutants were extensively reexamined in this manuscript, and even though we could not see a full protection of these flies from oxidative stress induced death, we found a reduced susceptibility compared to control flies (Figure 6F). Furthermore, when we combined upd3null mutants with flies deficient for tefu and mei-41 in hemocytes, the increased susceptibility to oxidative stress was rescued.

    1. Author Response

      The following is the authors’ response to the original reviews.

      Reviewer #1

      1) IR reduced mature spines (mushroom) but not immature spines (filopodia) in vitro at 14 days post-2 Gy IR. Please check previous reports by C. Limoli and J. Fike groups (in vivo dendritic spine characterization following proton or photon irradiation).

      We appreciate the reviewer's comments. Although IR did not reduce filopodia in the previous study, there are no prior studies using the same time points as ours, 4 days post-2 Gy IR. Additionally, according to other previous studies, PAK3 inhibition led to an increase in filopodia (J Neurosci. 2004 Dec 1;24(48):10816-25), and IR increased thin-type spines and decreased mushroom-type spines at the 7 days after 2 Gy IR (PLoS One. 2012;7(7):e40844). Considering these findings, we believe that the increase in filopodia observed in our study is due to the short-term effects of IR and the consequent PAK3 downregulation. We added the description regarding time point in “Materials and Methods”.

      Page 20, line 439-440; "In the analysis of molecular alterations, cultured neurons were sampled 4 days after irradiation."

      2) Does IR (2 Gy or 5 x 2 Gy) affect the viability in vitro? This could be linked with reduced dendritic structure and F/G-actin ratios.

      As the reviewer mentioned, we evaluated neuronal viability following 2 Gy IR exposure. Consequently, approximately 80% of the cells survived after the IR exposure (Fig. 4A). Although we agree that cognitive abilities may decrease due to the neuron death after IR, we identified that PAK3 overexpression restores the F/G-actin ratio in surviving neurons after IR, suggesting the IR-induced alterations at least in neuronal plasticity are mainly regulated by PAK3 rather than IR itself. Additionally, neurons that survive after IR maintain similar levels of NeuN, a mature neuron marker (Fig. S5A). We added the description regarding additional experiments in “Results”.

      Page 10, line 206-209; "IR decreased neuronal viability in human differentiated neurons, with approximately 80% survival (Fig 4A). However, IR did not alter the mature neuronal marker, NeuN (Fig S5A). These results indicate that IR-induced disruption of PAK3 signaling occurs in surviving neurons following irradiation. Consistent with previous murine neuron data, IR reduced the F/G-actin ratio (Fig. 4B)."

      3) The authors state, "Overall, these results indicated that IR could induce cognitive impairment by disrupting dendritic spine maturation." Dendritic spine damage may not be the only factor contributing to cognitive dysfunction (neural circuit function, neuroinflammation, astrogliosis, etc., needs to be discussed).

      We agree with the reviewer's comment that dendritic spine damage may not be the only factor contributing to cognitive impairment. Since our study has only confirmed the effects on dendritic spines as part of the complex impact of radiation, we added the description of the necessity for further research on various factors related to IR-induced cognitive dysfunction in “Discussion”.

      Page 15, line 317-324; >The dendritic spine is one of the major factors influencing cognitive function. In our study, we observed changes in dendritic spines due to radiation exposure, followed by subsequent cognitive impairment. Additionally, we established that regulating PAK3, which affects dendritic spine maturation, can modulate radiation-induced cognitive dysfunction. However, considering that radiation can impact the entire nervous system and that neural circuit function, neuroinflammation, and astrogliosis can also influence cognitive function (Makale et al., 2017), future studies is needed to investigate the mechanisms of factors beyond dendritic spine changes caused by radiation.>

      4) Fig 2 and Suppl Fig S2. The in vivo results should be placed in the manuscript Fig 2 as this would provide relevant physiological information on PAK3 downregulation and reduced dendritic spines and cognition.

      We appreciated the reviewer's comment. As the reviewer mentioned, we rearranged Fig S2C to Fig 2H.

      Page 33, line 825-827; "(H) Left: the protein levels of phosphorylated LIMK1, LIMK1, phosphorylated cofilin, and cofilin after IR in frontal cortex and hippocampus. Right: each western blot bands are quantified by ImageJ."

      5) miR-206-3p expression was found to be elevated post-IR in the human and mouse neurons in vitro. This was correlated with IR-induced downregulation of PAK3 using an antagonist miR experiment, wherein PAK3, LIMK1, and downstream makers were restored in the irradiated neurons. MiR-206-3p upregulation data should also be confirmed in vivo using an irradiated mouse brain to correlate the cognitive dysfunction timepoint.

      We observed IR-induced miR-206-3p upregulation (Fig 6D) and consequent PAK3 downregulation (Fig 6G) in vivo at 4 days after IR. Considering that the antagomiR significantly restores cognitive dysfunction (Fig 6E) at 1-3 days after IR, we suppose the expression of miR-206-3p would be consistently increased by IR, suppressing the PAK3 signaling pathway and leading to cognitive dysfunction.

      Page 33, line 825-827; "(H) Left: the protein levels of phosphorylated LIMK1, LIMK1, phosphorylated cofilin, and cofilin after IR in frontal cortex and hippocampus. Right: each western blot bands are quantified by ImageJ."

      6) Fig 5 shows that in vivo administration of antago-miR-206 reversed IR-induced upregulation of miR-206, reductions in PAK3 and downstream markers, and, importantly, reversed cognitive deficits induced by IR. This data should be supported by in vivo staining for important dendritic markers, including cofillin/p-cofilin, PSD-95, F- and G-actin within the hippocampal and PFC regions.

      We appreciated the reviewer's comment. Based on previous studies on intranasal administration, the substance is delivered to the PFC and hippocampus through the olfactory pathway in both humans and mice (Exp Neurobiol. 2020 Dec 31;29(6):453-469, Stem Cells. 2021 Dec;39(12):1589-1600). Even though we did not show direct evidence that antagomiR-206 is delivered to both regions, we confirmed its actual delivery to the brain using Cy5 fluorescence and examined PAK3 signaling (Fig. 6G) and the F/G-actin ratio (Fig. 6H) in both regions. To show the reliability of the tissue separation, we added a detailed description of the tissue separation method in “Materials and Methods”.

      Page 19, line 410-423; "Dissection of prefrontal cortex and hippocampus. The dissection of mouse brain regions was performed following a previous study (Spijker, 2011). First, to obtain the hippocampal region, we gently held the brain and opened the forceps, slowly separating the cortical halves. Once an opening had been created along the midline for approximately 60%, we directed the forceps (in the closed position) counterclockwise by 30–40° to expose the left cortex from the hippocampus, repeatedly opening the forceps as necessary. We then repeated the same procedure for the right cortex by pointing the forceps in a 30–40° clockwise direction until the upper part of the hippocampus became visible. At the most caudal part of the hippocampus/cortex boundary, we moved the small forceps through the cortex and used them to separate the hippocampus from the fornix. After removing the hippocampus, we used the large forceps to fold the cortex back into its original position. Subsequently, we placed the brain with the dorsal side and cut coronal sections to reveal the prefrontal cortex and striatum at different levels. Using a sharp razor blade, we made the first cut to remove the olfactory bulb and cut the section containing the prefrontal cortex."

      7) Does this change in the F/G actin ratios, Cofillin, and/or p-Cofillin impact any particular neuronal subtypes, including excitatory, inhibitory or any particular layers of major neurons? This point can't be appreciated from the WB data.

      The excitatory and inhibitory neurons do play crucial roles in cognitive function. In terms of response to radiation, excitatory neurons are more likely to be responsive. A previous study showed that spike firing and excitatory synaptic input were reduced by cranial irradiation, while inhibitory input was increased (Neural Regen Res. 2022 Oct;17(10):2253-2259). Additionally, PSD-95 is localized to dense specialized regions within the dendritic spines of excitatory synapses and is associated with synaptic plasticity (Neuron. 2001 Aug 2;31(2):289-303). Indeed, IR decreases the mRNA level of PSD-95 in differentiated human neurons (Fig S5A). Considering the previous research and our data, IR-induced PAK3 downregulation may occur primarily in excitatory neurons.

      8) Discussion: "In this study, we investigated the effect of cranial irradiation on cognitive function and the underlying mechanisms in a mouse model." Please change this statement to "....underlying neuronal mechanisms using in vivo and in vitro models."

      We appreciate the reviewer’s comment. We replaced ‘mechanisms in a mouse model’ with ‘neuronal mechanisms using in vivo and in vitro models.’ in the manuscript.

      Page 14, line 283; "In this study, we investigated the effect of cranial irradiation on cognitive function and the underlying neuronal mechanisms using in vivo and in vitro models."

      9) Discussion: "Furthermore, our study identifies a potential mechanism underlying the cognitive impairment associated with cranial irradiation, which downregulates PAK3 expression." This statement should be supported by the in vivo immunofluorescence data for the synaptic markers, including cofilin, p-cofillin, PSD-95, and F/G-actin staining.

      Even though we did not show the in vivo immunofluorescence data for the synaptic markers, we examined PAK3 signaling (Fig. 6G) and the F/G-actin ratio (Fig. 6H) in the hippocampal and PFC regions. Additionally, according to The Allen Mouse Brain Atlas, PAK3 is mainly expressed in the PFC and hippocampus regions (Fig S2A), suggesting that IR-induced PAK3 downregulation in both regions may have a significant impact on the cognitive impairment. Considering these data, we strongly believe that cranial irradiation downregulates PAK3 levels in the PFC and hippocampus, thus inducing cognitive impairment.

      10) miR modulate function by affecting multiple targets. The other potential neuronal and non-neuronal targets for miR-206-3p were not discussed. This possibility should be confirmed using relevant markers.

      According to the reviewer’s comment, we performed real-time PCR to examine whether miR-206-3p affects the expressions of neuronal and non-neuronal markers (Fig S5A and S5B). As a result, the post-synaptic marker, PSD-95, was reduced by miR-206-3p treatment. However, a mature neuronal marker (NeuN) and non-neuronal markers (GFAP and IBA-1) did not change upon miR-206-3p treatment. We added the related description in “Results”.

      Page 12, line 240-243; "Additionally, the post-synaptic marker, PSD-95, was decreased by miR-206-3p treatment. However, a mature neuronal marker (NeuN) and non-neuronal markers (GFAP and IBA-1) were not alterd upon miR-206-3p treatment (Fig. S5A and S5B)."

      11) Irradiation procedure: Please confirm that sham (0 Gy)-irradiated mice were also anesthetized for a similar procedure carried out for the 2 Gy or fractionated irradiation.

      According to the reviewer's comment, we added a description of sham (0 Gy)-irradiated mice in “Materials and Methods”.

      Page 17, line 359-360; "All mice, including those in the sham (0 Gy) group, were anesthetized with an intraperitoneal (i.p.) injection of zoletil (5 mg/10 g) daily for five days."

      12) 24 mL volume (antagomir treatment) via intra-nasal delivery is a rather unusually high volume. Please clarify if such a procedure was approved by the regulatory committee and if 24 mL volume led to any hemodilution.

      We appreciate the reviewer's comment. We referred to the protocol of intranasal administration from a previous study (Mol Ther. 2021 Dec 1;29(12):3465-3483), and made an error in specifying the miRNA unit. We corrected it from mL to μL.

      Page 19, line 399-402; "According to the manufacturer’s instructions and previous study (Zhou et al., 2021), 40 nmol of antagomiR-206-3p (sequence: 5’-CCACACACUUCCUUACAUUCCA -3’) or antagomiR-NC (the antagomiR negative control, its antisense chain sequence: 5’-UCUACUCUUUCUAGGAGGUUGUGA-3’) was dissolved in 1 mL of RNase-free water."

      Page 19, line 402-403; "A total of 24 μL of the solution (1 nmol per one mouse) was instilled with a pipette, alternately into the left and right nostrils (1 μL/time), with an interval of 3–5 min."

      Reviewer #2

      1) To show the relevance of PAK3 in Radiation-induced neurocognitive decrements, I suggest using 10 Gy WBI, group of 15-16 animals and long-term follow up >2 months post-RT.

      We appreciate the reviewer's comment. Biologically Effective Dose (BED) represents the most accurate quantitative prediction of biological effects of radiation. However, our study aimed to analyze the mechanisms underlying cognitive dysfunction induced not by a total dose of 10 Gy but rather by repeating 2 Gy fractions, which is used in clinical practice such as prophylactic cranial irradiation. In this regard, the administration of 2 Gy fractions holds significant relevance in our research.

      In statistical analysis, a larger sample size tends to be more accurate. However, we determined the sample size based on ethical considerations in animal research, taking into account the parameter (Effect size: 1.2 / alpha value: 0.05 / Group: 3 groups), resulting in a total sample size of 15, five mice per group (G Power 3.1 software). Despite the relatively small sample size, radiation exposure significantly reduced PAK3 expression with marginal variance, thereby inducing cognitive impairment.

      As the reviewer mentioned, the long-term effect (>2 months) of WBI may show more severe cognitive impairment, considering results from the previous studies. Nevertheless, previous research has revealed a correlation between mouse age and human age, suggesting that 2 months in mice is roughly equivalent to 5 years in humans (Life Sci. 2020 Feb 1;242:117242). Due to the substantial difference in biological time between humans and mice, 2 months in mice might be an excessive long-term period. Additionally, our study aims to investigate short-term changes rather than long-term effects. It is clear that IR-induced PAK3 downregulation induces cognitive impairment at least in the short-term period, and we believe that our findings may contribute to preventing serious neuronal dysfunction as the long-term side effects of PCI.

    1. Author Response

      The following is the authors’ response to the original reviews.

      Public Reviews:

      Reviewer #1 (Public Review):

      “Peng et al develop a computational method to predict/rank transcription factors (TFs) according to their likelihood of being pioneer transcription factors--factors that are capable of binding nucleosomes--using ChIP-seq for 225 human transcription factors, MNase-seq and DNase-seq data from five cell lines. The authors developed relatively straightforward, easy to interpret computational methods that leverage the potential for MNase-seq to enable relatively precise identification of the nucleosome dyad. Using an established smoothing approach and local peak identification methods to estimate positions together with identification of ChIP-seq peaks and motifs within those peaks which they referred to as "ChIP-seq motifs", they were able to quantify "motif profiles" and their density in nucleosome regions (NRs) and nucleosome free regions (NFRs) relative to their estimated nucleosome dyad positions. Using these profiles, they arrived at an odd-ratio based motif enrichment score along with a Fisher's exact test to assess the odds and significance that a given transcription factor's ChIP-seq motifs are enriched in NRs compared to NFRs, hence, its potential to be a pioneer transcription factor. They showed that known pioneer transcription factors had among the highest enrichment scores, and they could identify 32 relatively novel pioneer TFs with high enrichment scores and relatively high expression in their corresponding cell line. They used multiple validation approaches including (1) calculating the ROC-AUC associated with their enrichment score based on 16 known pioneer TFs among their 225 TFs which they used as positives and the remaining TFs (among the 225) as negatives; (2) use of the literature to note that known pioneer TFs that acted as key regulators of embryonic stem cell differentiation had a highest enrichment scores; (3) comparison of their enrichments scores to three classes of TFs defined by protein microarray and electromobility shift assays (1. strong binder to free and nucleosomal DNA, 2. weak binder to free and nucleosomal DNA, 3. strong binding to free but not nucleosomal DNA); and (4) correlation between their calculated TF motif nucleosome end/dyad binding ratio and relevant data from an NCAP-SELEX experiment. They also characterize the spatial distribution of TF motif binding relative to the dyad by (1) correlating TF motif density and nucleosome occupancy and (2) clustering TF motif binding profiles relative to their distance from the dyad and identifying 6 clusters.

      The strengths of this paper are the use of MNase-seq data to define relatively precise dyad positions and ChIP-seq data together with motif analysis to arrive at relatively accurate TF binding profiles relative to dyad positions in NRs as well as in NFRs. This allowed them to use a relatively simple odds ratio based enrichment score which performs well in identifying known pioneer TFs. Moreover, their validation approaches either produced highly significant or reasonable, trending results.

      The weaknesses of the paper are relatively minor. The most significant one is that they used ROC-AUC to assess the prediction accuracy of their enrichment score on a highly imbalanced dataset with 16 positives and 209 negatives. ROC-AUC is known to be a misleading prediction measure on highly imbalanced data. This is mitigated by the fact that they find an AUC = 0.94 for their best case. Thus, they're likely to find good results using a more appropriate performance measure for imbalanced data. Another minor point is that they did not associate their enrichment score (focus of Figure 2) with their correlation coefficients of TF motif density and nucleosome occupancy (focus of Figure 3). Finally, while the manuscript was clearly written, some parts of the Methods section could have been made more clear so that their approaches could be reproduced. The description of the NCAP-SELEX method could have also been more clear for a reader not familiar with this approach.”

      Reviewer #2 (Public Review):

      “In this study, the authors utilize a compendium of public genomic data to identify transcription factors (TF) that can identify their DNA binding motifs in the presence of nuclosome-wrapped chromatin and convert the chromatin to open chromatin. This class of TFs are termed Pioneer TFs (PTFs). A major strength of the study is the concept, whose premise is that motifs bound by PTFs (assessed by ChIP-seq for the respective TFs) should be present in both "closed" nucleosome wrapped DNA regions (measured by MNase-seq) as well as open regions (measured by DNAseI-seq) because the PTFs are able to open the chromatin. Use of multiple ENCODE cell lines, including the H1 stem cell line, enabled the authors to assess if binding at motifs changes from closed to open. Typical, non-PTF TFs are expected to only bind motifs in open chromatin regions (measured by DNaseI-seq) and not in regions closed in any cell type. This study contributes to the field a validation of PTFs that are already known to have pioneering activity and presents an interesting approach to quantify PTF activity.

      For this reviewer, there were a few notable limitations. One was the uncertainty regarding whether expression of the respective TFs across cell types was taken into account. This would help inform if a TF would be able to open chromatin. Another limitation was the cell types used. While understandable that these cell types were used, because of their deep epigenetic phenotyping and public availability, they are mostly transformed and do not bear close similarity to lineages in a healthy organism. Next, the methods used to identify PTFs were not made available in an easy-to-use tool for other researchers who may seek to identify PTFs in their cell type(s) of interest. Lastly, some terms used were not defined explicitly (e.g., meaning of dyads) and the language in the manuscript was often difficult to follow and contained improper English grammar.”

      Reviewer #3 (Public Review):

      Peng et al. designed a computational framework for identifying pioneer factors using epigenomic data from five cell types. The identification of pioneer factors is important for our understanding of the epigenetic and transcriptional regulation of cells. A computational approach toward this goal can significantly reduce the burden of labor-intensive experimental validation. Nevertheless, there are several caveats in the current analysis which may require some modification of the computational methods and additional analysis to maximize the confidence of the pioneer factor prediction results.

      A key consideration that arises during this review is that the current analysis anchors on H1 ESC and therefore may have biased the results toward the identification of pioneer factors that are relevant to the four other differentiated cell types. The low ranking of Yamanaka factors and known pioneer factors of NFYs and ESRRB may be due to the setup of the computational framework. Analysis should be repeated by using each of every cell type as an anchor for validating the reproducibility of the pioneer factors found so far and also to investigate whether TFs related to ESC identity (e.g. Yamanaka factors, NFYs and ESRRB) would show significant changes in their ranking. Given the potential cell type specificity of the pioneer factors, the extension to more cell types appears to be important for further demonstrating the utility of the computational framework.

      Author Response: We thank all reviewers for their thoughtful and constructive comments and suggestions, which helped us to strengthen our paper. Following the suggestions, we have performed additional analysis to address the reviewer’s comments and the detailed responses are itemized below.

      Reviewer #1 (Recommendations For The Authors):

      1. The authors should generate precision-recall curves in addition to (or replacing) the ROC-AUC curves shown Figure 2c. They should also calculate the precision-recall AUC and use that as their measure of enrichment score predication accuracy. Precision-recall curves and AUC are more appropriate for imbalanced positive-negative data as is the case in this study.

      Response: Following the reviewer’s suggestion, we have performed precision-recall analysis and calculated Matthews correlation coefficients (MCC) (Figure 2). We have further expanded our validation set to 32 known pioneer transcription factors (Supplementary Table 5) and compared the performance of enrichment score using different test sets (Supplementary Table 10). We have attained the highest ROC = 0.71, pr-ROC-AUC = 0.37 and MCC = 0.31 for Test set1 and ROC = 0.92, pr-ROC-AUC = 0.45 and MCC=0.49 for Test set2 (Supplementary Table 11).

      1. The authors should generate scatter plots of their TF enrichment scores (focus of Figure 2) and motif-density nucleosome occupancy Pearson correlation coefficients (focus of Figure 3) and calculate the corresponding correlation coefficient and p-value.

      Response: We observed a weak but statistically significant correlation between the enrichment scores and the correlation coefficient values (R=0.32 and p-value=1e-9)).

      1. The authors should write their computational methods in the Methods section in such a way that a skilled bioinformatician could reproduce their results. This does not require a major rewrite. They are very close. One example of this is that a minimum distance between neighboring local maxima of the smoothed dyad counts was set to 150 bps. How was this algorithmically done? Suppress/ignore weaker local maxima that are within 150bp of other stronger local maxima?

      Response: We have revised the Methods section to make it easier to follow and to reproduce the results. For identifying the local maxima, we have used the bwtool with the parameters ‘‘find local-extrema -maxima -min-sep=150’’ so that local maxima located within 150 bp of another neighboring maxima was ignored to avoid local clusters of extrema.

      1. Describe the NCAP-SELEX method more clearly so that a reader not familiar with this approach doesn't have to look it up. This can be brief.

      Response: Following the reviewer’s suggestion, we have added a detailed description of the NCAP-SELEX method.

      Reviewer #2 (Recommendations For The Authors):

      To improve the manuscript:

      1. The grammar in the manuscript should be read for accuracy to improve readability and clarify the exact meaning.

      Response: We have improved the grammar and have clarified the meaning of terms.

      1. The exact meaning of dyads needs to be defined up front. In some places seems to mean pairs of reads and others seems to refer to nucleosome positioning.

      Response: The meaning of “dyads” has been clarified. The dyad positions were determined by the midpoints of the mapped reads in MNase-seq data and refer to the center of the nucleosomal DNA.

      1. Meaning of NCAP-SELEX needs to be defined before use of acronym.

      Response: We have defined it in the manuscript.
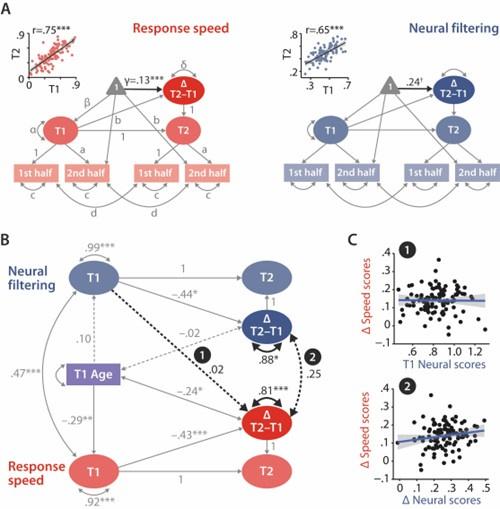
      Reviewer #3 (Recommendations For The Authors):

      1. The authors found that Yamanaka factors and several other known pioneer factors (e.g. NFY-A, NFY-B, and ESRRB) are lowly ranked in their pioneer factor analysis. Since the analysis was performed by anchoring on H1 ESCs and comparing them to the other four cell lines, the results may only be relevant to differentiated cell types. It is therefore not unexpected that the Yamanaka factors which are important for iPSC reprogramming and the NFYs which have been experimentally shown to replace nucleosomes for maintaining ESC identity from differentiation (PMID: 25132174; PMID: 31296853) would not be enriched in the analysis. I suggest the authors repeat their analysis by anchoring on differentiated cell types and validate the reproducibility of the pioneer factors found so far and also investigate whether TFs related to ESC identity (e.g. Yamanaka factors, NFYs, and ESRRB) would show significant changes in their ranking as pioneer factors.

      Response: Following reviewer’s suggestions, we have repeated the enrichment analysis by redefining differentially open regions as those closed in differentiated cell lines (HepG2, HeLa-S3, MCF-7 and K562) and open in H1 embryonic cell line (Supplementary Figure 6). The results indicate that most known PTFs still showed significantly higher enrichment scores compared with other TFs especially for FOXA, GATA and CEBPB families. Interestingly, ESSRB and Yamanaka pioneer factor POU5F1 (OCT4) have also shown significantly high enrichment scores in this analysis (Supplementary Figure 6). This could be explained by the roles of Yamanaka factors in cellular reprogramming – they reprogram somatic differentiated cells into induced pluripotent stem cells.

      1. The authors mentioned the cell-type-specificity of TFs been pioneer factors and the example of CTCF was given. This point relates closely to above point 1 and, in particular, the correlation analysis of Yamanaka factors and NFYs supports their binding to nucleosomes. Together, these results highlight potential caveats of the current analysis in that the analysis is likely to be limited to the available cell types and may be affected by which cell type was used as the anchor cell type.

      Response: Differentiated and embryonic cell lines were used to ask specific question about the functional roles of PTFs for cell differentiation and stem cell reprogramming. In the revised manuscript, we have clarified this point and separated our data set into three different sets of PTFs with different functions (Supplementary table 10). We agree with the reviewer, it would be nice to have more data from other cell lines but unfortunately the matching between different Chip-seq, DNAase-seq and Mnase-seq data sets imposes strict limitations.

      1. The differential and conserved open chromatin regions are defined based on overlaps found between five cell types using their DNase-seq mapping profiles. The limitation of this definition is its lack of quantitativeness. For example, a chromatin region can have more than 80% overlaps between H1 and another cell type but the level of accessibility (e.g. number of reads mapped to this region) can be quite different between cell types. In such a case, I think it is still more appropriate to define such a region as a differential open chromatin region. The author should explore whether using a more quantitative definition would improve the identification and categorization of differential and conserved open chromatin regions.

      Response: we thank the reviewer for these suggestions. In the revised version, we have clarified the definition and further explored different thresholds in defining the differentially and conserved open chromatin regions in enrichment analysis (Supplementary Figure 8). Our results were not significantly affected when different thresholds are applied.

      1. While it is mentioned that H3K27ac and H3K4me1 ChIP-seq data from the five human cell lines were used in the study, the information on how enhancers are mapped/defined in these cell types is lacking.

      Response: We have clarified the definition in the text. The enhancer regions were identified as the open chromatin regions overlapped with both H3K27ac and H3K4me1 ChIP-seq narrow peaks. We have elucidated the how enhancers are defined in the methods sections. In addition, we have performed additional enrichment analysis using NRs located on differentially active enhancer regions and NDRs located on conserved active enhancer regions (Supplementary Figure 7) between H1 embryonic cell line and any other differentiated cell lines and the performance of enrichment scores in PTF classification was slightly worse compared with those calculated from differentially and conserved open chromatin regions

      1. The description of "genome-wide mapping of transcription factor binding sites" is unclear. For example, what does it mean by "In total, ChIP-seq data for 225 transcription factors could be matched with MNase-seq data" and why is this step needed? I would assume that a typical approach for mapping TF binding sites in the five cell types is to obtain the ChIP-seq data for each TF in each cell type and perform sequence alignment to the reference genome. The procedure described by the authors needs a clearer motivation and justification.

      Responses: This sentence refers to matching between the ChIP-seq and MNase-seq data from the same cell type. We explain in detail how ChIP-seq data is processed. We have clarified this in the paper.

      1. I also suggest the authors clearly justify the use of ROC analyses given that only a ground truth of positive (e.g. 16 known pioneer factors) is available and the "other transcription factors" considered as negative in the analysis in fact are expected to contain unknown pioneer factors and their identification should not be minimized (which lead to the maximization of ROC) by the analysis procedure.

      Responses: (This is also pointed by review 1). The fact that unknown transcription factors are treated as negatives actually leads to the lower reported ROC scores (more hits considered to be false positives), not to their maximization. That is the reason we mentioned in the paper that the obtained ROC scores can be considered as lower bound estimates. In addition, we have expanded our validation sets to 32 known pioneer factors and compiled three sets of PTFs for validations. Following the reviewers’ suggestions, we have further performed precision-recall (PR) analysis and calculated the Matthews correlation coefficient (MCC) using three sets of PTFs for validation (Supplementary Table 11 and Supplementary Figure 2).

      1. The analysis of pioneer transcription factor binding sites lacks insight. What can we learn these this analysis other than TFs from the same families are likely to be clustered in the same group?

      Responses: We thank the review for pointing out it and have added a more detailed discussion of these results in the revised manuscript. Very few PTF-nucleosome structural complexes have currently been solved so far and the binding modes of majority of PTFs with nucleosomes still remain unknow. Our analysis has identified six distinctive clusters of TF binding profiles with nucleosomal DNA, which could provide insight into the binding modes of PTFs with nucleosome. These clusters point to the diversity of binding motifs where transcription factors belonging to the same cluster may also exhibit potential competitive binding.

    1. Author Response

      The following is the authors’ response to the original reviews.

      The co-authors and I would like to thank you for overseeing the review, and to thank you and the reviewers for your constructive feedback about the manuscript. Below, we have summarized each suggestion for improving the manuscript and provided our response. In addition, the abstract was revised to include findings from physiological studies of mice with a single Numb cKO and to provide a more concise and conservative concluding statement.
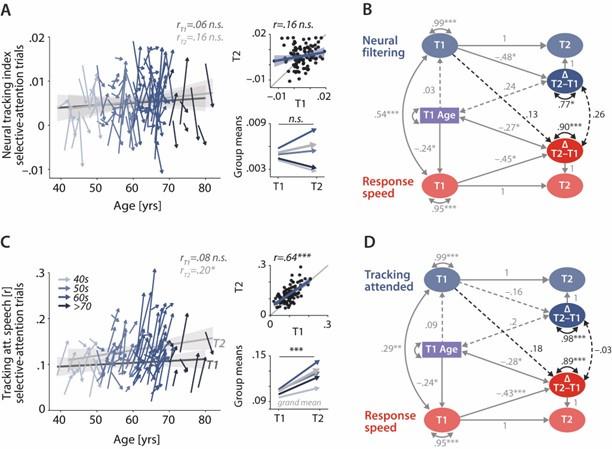
      Reviewer #1 (Recommendations for The Authors):

      1. While the specificity of the observed muscle phenotypes seems clear, the subsequent molecular analysis of Numb protein interactors does not seem to consider the potential involvement of Numb-like. The authors should demonstrate the relative expression levels of Numb and Numb-like in the models used, and establish the specificity of the antibodies used in IP, western and staining experiments.

      Response: Perhaps the most convincing evidence that the anti-Numb antibody did not pull down Numb-like is that this protein was not detected among immunoprecipitated protein complexes pulled down by the anti-Numb antibody used. The antibody used in the immunoprecipitation was validated by the supplier and was previously reported to immunoprecipitate Numb [1, 2]. We previously demonstrated that a morpholino against Numb mRNA almost completely eliminated the band detected by this antibody and that this band was at the expected molecular weight [ref]. In our hands, mRNA levels for Numb-like in skeletal muscle are 5-10-fold lower than those for Numb [3]. We have been unable to detect Numb-like protein in healthy adult skeletal muscle by immunoblotting or immunofluorescence staining. Taking all of these findings together, it seems unlikely that the antibodies used for immunoprecipitating Numb-protein complexes pulls down Numb-like.

      1. The authors use PCR to investigate Numb isoform expression and conclude that p65 is likely the dominant protein isoform expressed. While this agrees with the single band observed in Supp Figure 4A, a positive control for exon 9 excluded and included isoforms in the PCR reactions would strengthen this conclusion.

      Response: The amplicons shown in Supplemental 4 were sequenced. The clones corresponded to the isoforms with the exon 3 present or removed. No amplicons containing exon 9 were detected. The following sentence was added to the Analysis of Splice Variants section of Methods to address this point: “PCR products were cloned using the TOPO TA cloning system (ThermoFisher) and multiple resulting clones were sequenced to confirm that the expected products were generated.”

      1. PCR analysis of total Numb and Numb-like expression levels are not shown. This is important given the specificity of the Numb antibodies used for AP-MS experiments are not described and some Numb antibodies are well known to also recognize Numb-like. Two different Numb antibodies were used for Western and immunoprecipitation but the specificity for Numb and Numb-like is not described. In particular, does the antibody used in the AP-MS experiment recognize both Numb and Numb-like? Supplementary Table 1 does not list Numb or Numb-like, but presumably peptides were identified?

      Response: As noted above, the specificity of anti-Numb antibodies was confirmed in previous studies [3]. Importantly, Numb-like mRNA levels are 5-10-fold lower than Numb mRNA, and NumbL protein is undetectable in healthy adult skeletal muscle by Western. The physiology data reported in this manuscript supports the conclusion that a single KO of Numb is sufficient to recapitulate the physiological phenotype of Numb/Numb-like KO . We therefore reason that the majority, if not all, of the physiological contribution of these proteins to muscle contractility due to Numb (Fig. 1).

      1. The validation experiment used the same Numb antibody for immunoprecipitation, immunoblotted with Septin 7. A reciprocal IP of Septin 7 and blotted with Numb should be performed. In addition, a Numb-like IP or immunoblot would also be useful to demonstrate the specificity of the interaction. Efforts to map the interaction between Numb and Septin 7 would be useful to demonstrate specificity of the interaction and strategies to establish the biological relevance of the interaction.

      Response: We agree with the reviewer and attempted several IPs with anti-Septin7 antibodies. These were unsuccessful. In a new collaboration, Dr. Italo Cavini (University of Sao Paulo) has used machine-learning-based approaches to model binding between Numb and several septins, including Septin 7. The analysis suggests that binding of Numb with septins involves a domain of Numb that has not yet been ascribed a function in protein-protein interactions. These computational predictions require experimental validation but provide rational starting point for experiments to define the domains responsible for these interactions. Such experiments were included in our recent NIH R01 renewal application. We hope to be able to report on results of confirmatory experiments of these computational models in the future.

      1. Other septins were identified in the AP-MS experiment and might have been anticipated to also be disrupted by Numb/Numb-like deletion. Are these septins known to interact in a complex?

      Response: This is an excellent question. Septins have conserved motifs providing a clear reason to imagine that many different mammalian septins could directly interact with Numb. Septins form heterooligomers consisting of complexes formed by 3, 6 or 8 septins [4]. It is likely that when Numb binds to one septin, antibodies against Numb pull down other septins present in the septin oligomer to which Numb is bound. The following paragraph was added to the discussion: “Our findings suggest that Numb may also interact with other septins such as septins 2, 9 and 10, which were also identified with a high level of confidence as Numb interacting proteins by our LC/MS/MS analysis. Our data to not allow us to determine if Numb binds directly to these septins. Septins contain highly conserved regions, and, consequently, if one such region of septin 7 interacts with Numb, then many septins would be expected to directly bind Numb through the same domain. However, because septins self-oligomerize, is possible that when Numb binds to one septin, antibodies against Numb could also pull down other septins present in the septin oligomer to which Numb is bound regardless of whether or not they are also bound by Numb. “

      1. The text for Figure 5 describes analysis of Septin localization in inducible Numb/Numb-like cKO muscle, but the figure indicates only Numb is knocked out. Please clarify.

      Response: We apologize for this oversight on our part. The Legend to Figure 5 has been corrected.

      1. Supplementary Figure 2 seems to show that TAM treatment increases Numb expression. Please clarify. Also, please correct reference 9.

      Response: The figure was incorrectly labeled. We apologize for this oversight and have corrected the figure in the revised manuscript.

      Reviewer #2 (Recommendations for The Authors):

      Overall, the manuscript is well written. I do have a few minor issues/concerns, which are detailed below.

      Abstract: Please be a little more specific regarding which where the tissue came from (i.e. humans, mice, cell) when referring to your previous studies.

      Response: The abstract has been revised as requested.

      Introduction: Please be more specific regarding the technique used for detecting ultrastructural changes. I assume it was done with TEM, but the reference is listed as an "invalid citation" in your reference list.

      Response: The introduction was revised as requested and the citation was updated to reference a valid citation.

      Methods / Numb Co-Immunoprecipitation: Please indicated the level of confluency of the C2C12 cells as this will alter gene expression.

      Response: As indicated in the updated Methods section, confluent C2C12 cells were switched to differentiation media (low serum) for seven days. When harvested, the cells had differentiated and fused into myotubes.

      Methods / Immunohistochemical Staining: The first sentence needs to be edited regarding plurality and grammar.

      Response: Thank you for this comment. The text was revised accordingly.

      Results / GWAS and WGS Identify...: Please spell out phosphodiesterase (I assume) for PDE4D

      Response: This change was incorporated in the text.

      References cited:

      1. Wu, M., et al., Epicardial spindle orientation controls cell entry into the myocardium. Dev Cell, 2010. 19(1): p. 114-25.

      2. Garcia-Heredia, J.M. and A. Carnero, The cargo protein MAP17 (PDZK1IP1) regulates the immune microenvironment. Oncotarget, 2017. 8(58): p. 98580-98597.

      3. De Gasperi, R., et al., Numb is required for optimal contraction of skeletal muscle. J Cachexia Sarcopenia Muscle, 2022.

      4. Neubauer, K. and B. Zieger, The Mammalian Septin Interactome. Front Cell Dev Biol, 2017. 5: p. 3.

    1. Author Response

      The following is the authors’ response to the previous reviews

      Reviewer #1 (Public Review):

      In countries endemic for P vivax the need to administer a primaquine (PQ) course adequate to prevent relapse in G6PD deficient persons poses a real dilemma. On one hand PQ will cause haemolysis; on the other hand, without PQ the chance of relapse is very high. As a result, out of fear of severe haemolysis, PQ has been under-used.

      In view of the above, the Authors have investigated in well-informed volunteers, who were kept under close medical supervision in hospital throughout the study, two different schedules of PQ administration: (1) escalating doses (to a total of 5-7 mg/kg); (2) single 45 mg dose (0.75 mg/kg).

      It is shown convincingly that regimen (1) can be used successfully to deliver within 3 weeks, under hospital conditions, the dose of PQ required to prevent P vivax relapse.

      As expected, with both regimens acute haemolytic anaemia (AHA) developed in all cases. With regimen (2), not surprisingly, the fall in Hb was less, although it was abrupt. With regimen (1) the average fall in Hb was about 4 G. Only in one subject the fall in Hb mandated termination of the study.

      Since the data from the Chicago group some sixty years ago, there has been no paper reporting a systematic daily analysis of AHA in so many closely monitored subjects with G6PD deficiency. The individual patient data in the Supplementary material are most informative and more than precious.

      Having said this, I do have some general comments.

      1. Through their remarkable Part 1 study, the Authors clearly wish to set the stage for a revision of the currently recommended PQ regimen for G6PD deficient patients. They have shown that 5-7 mg/kg can be administered within 3 weeks, whereas the currently recommended regimen provides 6 mg/kg over no less than 8 weeks.

      We state in the abstract: “The aim was to explore shorter and safer primaquine radical cure regimens compared to the currently recommended 8-weekly regimen (0.75 mg/kg once weekly), potentially obviating the need for G6PD testing”. This is the primary goal of the study.

      1. Part 2 aims to show that, as was known already, even a single PQ dose of 0.75 mg/kg causes a significant degree of haemolysis: G6PD deficiency-related haemolysis is characteristically markedly dose-dependent. Although they do not state it explicitly in these words (I think they should), the Authors want to make it clear that the currently recommended regimen does cause AHA.

      We also wanted to compare the extent of haemolysis following single dose with the extent of haemolysis following the ascending dose regimens, in the same patients.

      1. Regulatory agencies like to classify a drug regimen as either SAFE or NOT-SAFE; they also like to decide who is 'at risk' and who is 'not at risk'. A wealth of data, including those in this manuscript, show that it is not correct to say that a G6PD deficient person when taking PQ is at risk of haemolysis: he or she will definitely have haemolysis. As for SAFETY, it will depend on the clinical situation when PQ is started and on the severity of the AHA that will develop.

      We agree completely. Haemolysis following primaquine is inevitable. What matters is the rate and extent of haemolysis, and the compensatory response. Importantly the extent of the haemolysis, even within a specific genotype and for a given drug dose, appears to be highly variable.

      The above three issues are all present in the discussion, but I think they ought to be stated more clearly.

      We have tried to clarify these points in a revised discussion.

      Finally, by the Authors' own statement on page 15, the main limitation is the complexity of this approach. The authors suggest that blister packed PQ may help; but to me the real complexity is managing patients in the field versus the painstaking hospital care in the hands of experts, of which volunteers in this study have had the benefit. It is not surprising that a fall in Hb of 4 g/dl is well tolerated by most non-anaemic men; but patients with P vivax in the field may often have mild to moderate to severe anaemia; and certainly they will not have their Hb, retics and bilirubin checked every day. In crude approximation, we are talking of a fall in Hb of 4 G with regimen (1), as against a fall in Hb of 2 G with regimen (2), that is part of the currently recommended regimen: it stands to reason that, in terms of safety, the latter is generally preferable (even though some degree of fall in Hb will recur with each weekly dose). In my view, these difficult points should be discussed deliberately.

      As above we have tried to clarify these important points in a revised discussion

      Reviewer #1 (Recommendations For The Authors):

      Page 2 para 3. The decreased haemolysis upon continued PQ administration (that originally was named the 'resistance phase' is explained by two additive factors. First, the reticulocytosis (cells with higher G6PD activity pour into circulation from the bone marrow); second, the early doses of PQ has caused selective haemolysis of the oldest red cells, that had the lowest G6PD activity. This dual phenomenon is hinted at, but I think it should be stated clearly.

      Thank you. We have added to the Introduction (fourth paragraph in revised version):

      “Continued primaquine administration to G6PD deficient subjects resulted in "resistance" to the haemolytic effect. The selective haemolysis of the older red cells resulted in a compensatory increase in the number of reticulocytes. Thus, the red cell population became progressively younger and increasing resistant to oxidant stress, so overall haemolysis decreased and a steady state was reached.”

      Page 4 and elsewhere. In the 'Hillmen scale' for haemoglobinuria a value >6 was named a 'paroxysm'; but any value of 2 and above is already frank haemoglobinuria. Incidentally, the chart was published not in ref 17, but in NEJM 350:552, 2004.

      We have changed the reference (now ref 19) to the 2004 paper by Hillmen. We used the value of 6 as clinical criterion for stopping primaquine. While >2 is detectable in dilute urine, >6 refers to clearly red/black urine.

      In Table 1 and throughout the paper I am surprised that retics are given as %: absolute retic counts are more informative.

      We showed these as % counts as the majority of measurements were taken from blood slide readings where it is not possible to get an absolute count.

      Page 10, Attenuated hemolysis with continued or recurrent doses of PQ was shown convincingly for G6PD A-. There is also one report in which the time course of AHA was extensively investigated upon deliberate administration of PQ to a subject with G6PD Mediterranean (Blood 25: 92, 1965): there was little or no evidence for a 'resistance phase'.

      We agree that this suggests it might not be possible to attenuate haemolysis with the Mediterranean variant (or variants of similar severity) as even the youngest circulating red cells may be susceptible to haemolysis. More evidence is needed.

      S6, S7. Reticulocytes remain high until PQ is stopped; they return to normal some 17 days after stopping PQ. This should be stated in the main text.

      This has been added to the main text (section “Haemolysis and reticulocyte response”):

      “It took around 2 weeks for the reticulocyte counts to re-normalise.”

      In subject 11 haemoglobinuria was slight on day 12; what was it before?

      We have changed the caption of this Figure (Appendix 5) to:

      “Day 10 urine sample from subject 11 showing slight haemoglobinuria (Hillmen score of 4). The subject had a maximum Hillmen score varying between 2 and 3 on days 4 to 9.”

      I found individual patient data in S5 and S6 most interesting, especially since the G6PD variant was identified in each case. It would be helpful if in each case the total PQ dose were also shown, and in the interest of visual comparability the abscissa scale ought to be the same for all cases.

      We have amended Figures S5 and S6 to make them consistent with each other (now Appendix 5). We also amended the figures showing the individual subject data for consistency.

    1. Author Response

      Reviewer #1 (Public Review):

      In this manuscript, the authors identified compound heterozygous mutations in CFAP52 recessively cosegregating with male infertility status in a non-consanguineous family. The Cfap52-mutant patient exhibits a mixed acephalic spermatozoa syndrome (ASS) and multiple morphological abnormalities of the sperm flagella (MMAF) phenotype. The influence of mutations on CFAP52 protein function is well validated by in vitro cell experiments and immunofluorescence staining. Cfap52-KO mice are further constructed and perfectly resemble the Cfap52-mutant patient's infertile phenotype, also showing a mixed ASS and MMAF phenotype. The phenotype and underlying mechanisms of the disruption of sperm head-tail connection and flagella development are carefully analyzed by TEM, Western blotting, and immunofluorescence staining. The data presented revealed a prominent role for CFAP52 in sperm development, suggesting that CFAP52 is a novel diagnostic target for male infertility with defects of sperm head-tail connection and flagella development.

      Thank you for your positive comments.

      Reviewer #2 (Public Review):

      Summary:

      The authors tried to identify the genetic factors for asthenoteratozoospermia. Using whole-exome sequencing, they analyzed a family with an infertile male and identified CFAP52 variants. They further knockout mouse Cfap52 gene and the homozygous mice phenocopied the patient. CFAP52 interacts with several other sperm proteins to maintain normal sperm morphology. Finally, CFAP52-associated male infertility in humans and mice could be overcome by using intracytoplasmic sperm injections (ICSI).

      Strengths:

      The major strength of this study is to identify genetic factors contributing to asthenoteratozoospermia, and to generate a mouse knockout model to validate the factor.

      Thank you for your positive comments.

      Weaknesses:

      The authors did not use the OMICS to dissect the potential mechanisms. Instead, they took the advantage of direct co-IP experiment to fish the binding partners. They also did not discuss in detail why other motile cilia have different behavior.

      Dear reviewer, thank you for your comments and we tried to answer your two questions as follows.

      In this study, we did not choose omics technologies to explore the binding partners for CFAP52 (e.g., IP-MS) and differentially expressed proteins after the loss of CFAP52 (e.g., proteomics). For IP-MS, we feel sorry that all available antibodies of CFAP52 could not be used to perform protein immunoprecipitation experiments. Another reason is that there are only dozens of proteins that have been reported to regulate the head-tail coupling apparatus (HTCA) of sperm. Accordingly, we used Western blotting to examine the expression of ten acephalic sperm syndrome (ASS)-associated proteins and found that only SPATA6 expression was significantly reduced in the testis protein lysates of Cfap52-KO mice (Fig. 6A). We further carefully examined the regulation of the stability of SPATA6 by its binding partner CFAP52 (Fig. 6 and Figure 6—figure supplement 2).

      In addition to male infertility, Cfap52-KO mice suffered from hydrocephalus; the ependymal cilia was sparse under SEM observation and disrupted axonemal structures were identified by TEM analysis (Figure 4—figure supplement 2). However, no obvious abnormalities of tracheal cilia were identified by SEM and TEM analyses (Figure 4—figure supplement 2). Although flagella and motile cilia exhibit quite similar “9+2” axoneme structure, they have some their unique proteins and the requirement of some axonemal proteins may be different. For example, IQUB expression is detected in tissues other than the testis, such as the lung and brain; however, IQUB deletion only affects beating of sperm flagella but not respiratory cilia (Cell Rep, 2022). Cfap43-KO mice exhibited both sperm flagella disordor and early-onset hydrocephalus (Dev Biol, 2020), and CFAP206 is required for sperm motility, mucociliary clearance of the airways and brain development (Development, 2020).

      Reviewer #3 (Public Review):

      Summary:

      In this study, Jin et al. report the first evidence of CFAP52 mutations in human male infertility by identifying deleterious compound heterozygous mutations of CFAP52 in infertile human patients with acephalic and multiple morphological abnormalities in flagella (MMAF) phenotypes but without other abnormalities in motile cilia. They validated the pathogenicity of the mutations by an in vitro minigene assay and the absence of proteins in the patient's spermatozoa. Using a Cfap52 knockout mouse model they generated, the authors showed that the animals are hydrocephalic and the sperm have coupling defects, head decapitation, and axonemal structure disruption, supporting what was observed in human patients.

      Strengths:

      The major strengths of the study are the rigorous phenotypic and molecular analysis of normal and patient spermatozoa and the demonstration of infertility treatment by ICSI. The authors demonstrated the interaction between CFAP52 and SPATA6, a head-tail coupling regulator and structural protein, and showed that CFAP52 can interact with components of the microtubule inner protein (MIP), radial spoke, and outer dynein arm proteins.

      Thank you for your positive comments.

      Weaknesses:

      The weakness of the study is some inconsistency in the localization of the CFAP52 protein in human spermatozoa in the figures and the lack of such localization information completely missing in mouse spermatozoa. Putting their findings in the context of the newly available structural information from the recent series of unambiguous and unequivocal identification of CFAP52 as an MIP in the B tubule will not only greatly benefit the interpretation of the study, but also resolve the inconsistent sperm phenotypes reported by an independent study. Since the mouse model is not designed to exactly recapitulate the human mutations but a complete knockout and the knockout mice show hydrocephaly phenotype as well, some of the claims of causality and ICSI as a treatment need to be tempered. Discussing the frequency of acephaly and MMAF in primary male infertility will be beneficial to justify CFAP52 as a practical diagnostic tool.

      Dear reviewer, thank you for your comments and we tried to answer your questions as follows.

      By immunofluorescence staining, we showed that CFAP52 was localized at both HTCA and full-length flagella from the normal control; in contrast, CFAP52 signals were barely detected in the patient’s spermatozoa (Figure 3F). Given that CFAP52 staining did not occur in other figures, no inconsistency exists in the localization of the CFAP52 protein in human spermatozoa in the figures. We did not perform the CFAP52 staining in mouse spermatozoa; however, we have shown that CFAP52 protein was completely absent in the Cfap52-KO testes compared with the WT testes (Figure 4C).

      We appreciate the reviewer’s suggestion to put our findings of CFAP52 in the context of the newly available axoneme architecture. Given that these cryo-EM studies focus on doublet microtubules (DMTs), a broader expression pattern of CFAP52 in cilia/flagella could not be excluded. In mammals, CFAP52 seems to interact with a broad range of axonemal proteins, including MIP (CFAP45), ODAs (DNAI1 and DNAH11), and DRC (DRC10) (Dougherty et al., 2020). We have mentioned that ‘a lack of FAP52 in Chlamydomonas causes an instability of microtubules and detachment of the B-tubule from the A-tubule and shortened flagella are observed in Chlamydomonas when both FAP52 and FAP20 are absent (Owa et al., 2019). Unlike a specific regulation of the stability of B-tubules by FAP52 in Chlamydomonas (Owa et al., 2019), Cfap52-KO mice and CFAP52-mutant patient showed a serious disorder of the axoneme and its accessory structures.’

      Before our study, Cfap52-KO mice have not yet been generated. To explore the physiological roles of CFAP52, we decided to construct Cfap52-KO mice. During our manuscript is under preparation, an independent group also generated the Cfap52-KO mice and explored their phenotype (Wu et al., 2023). We quite agree with this reviewer that Cfap52-mutant mice will be exact models to recapitulate the human variants. Cfap52-mutant mice were not included in our current manuscript due to i) the two identified variants were ‘nonsense’ variant and ‘frameshift’ variants, respectively, which are expected to damage the CFAP52 expression and function; ii) the influence of two variants on CFAP52 protein function has been well validated by in vitro cell experiments and iii) research funding is limited for us. The assisted reproductive technology (ART) outcomes were also reported for the CFAP52-mutant patient and Cfap52-KO mice, which will be potential useful for further clinical studies. However, it is not suggested to be over-interpreted because it is only a case study.

      Quantitative analyses showed that the decapitated spermatozoa, abnormal head-tail connecting spermatozoa, and spermatozoa with deformed flagella accounted for approximately 40%, 25%, and 30% of the total spermatozoa in Cfap52-KO mice, respectively (Figure 4I). Regarding the CFAP52-mutant patient, the frequency of acephaly and MMAF were not counted and now we feel sorry that we don’t have enough samples (repeats) to perform quantitative analyses.

    1. Author Response

      The following is the authors’ response to the original reviews.

      Reviewer #1 (Recommendations For The Authors):

      Major concerns:

      1. In lines 41-43, there seems to be some confusion about the terminology regarding "sporadic ALS". ALS is subdivided into familial and sporadic forms. Familial ALS simply indicates that the patient has a family history of ALS and presumably has a genetic predisposition for developing this disease. In many families, the identity of the mutation remains unknown. Sporadic ALS patients do not have a family history of this disease. However, this does not imply that they lack mutations that caused disease. In fact, 5-10% of these patients have the hexanucleotide repeat expansion in C9orf72. This mutation is also found in about 40% of familial ALS cases.

      We have now amended the manuscript to be more accurate in our description of underlying genetics of ALS. This changes to this section are as follows:

      Lines 39-47:

      "...The median survival time in ALS, from initial onset of symptoms to death, typically as a result of respiratory complications, is only 20-48 months Chiò et al. (2009) and ALS has an estimated global mortality of 30,000 patients per year Mathis et al. (2019).

      ALS is typically classified into either familial (fALS) or sporadic (sALS) forms of the disease, based on whether or not patients have an identified family history of the disease; between 5-10% of total ALS cases fall into the former category, fALS, with the remaining 90-95% consisting of sALS cases Mathis et al. (2019). To date, over 20 monogenic mutations that cause ALS have been identified, however these still only account for 45% of fALS cases and only 7% of sALS cases Mejzini et al. (2019)..."

      1. In Fig. 4-supplement 1, 7DD and 5DD are not defined. I assume one is the fast-firing and one is the slow-firing motor neurons. I am also a bit confused as to why the 5DD neurons produce greater muscle force than the 7DD neurons when electrically stimulated. It seems to suggest that there is some difference between the two types of neurons or the groups of mice used to test them.

      We have now defined these terms and the amended figure legend now reads as follows:

      "(A) Fast-firing motor neurons (produced using a 7-day differentiation protocol thus labelled as “7DD”) or slow-firing ChR2+ motor neurons (produced using a 5-day differentiation protocol thus labelled as “5DD”) were engrafted in age matched SOD1G93A mice… Our expectation was that fast-firing motor neurons, which normally innervate larger numbers (>100) of stronger fast-twitch muscle fibres per motor unit would elicit significantly greater contractile force when optically stimulated, compared to slow-firing motor neurons that innervate small numbers (<10) of weaker, slow-twitch muscle fibres per motor unit. Surprisingly, our data did not show any difference when using grafts consisting of fast-firing motor neurons, versus slow-firing motor neurons, at least in response to optical stimulation. The factors underlying this surprising result, and the apparent discrepancy between electrically-evoked muscle contractions in nerves that had bene engrafted with either fast or slow firing motor neurons, are likely to be highly complex; we hope to further explore this as part of a separate follow up study."

      1. Along those lines, do these two subpopulations of motor neurons innervate the same set of muscle fibers? More generally, are certain types of muscle fibers preferentially innervated by this approach? Answering these questions could point to additional ways to enhance the effectiveness of this treatment approach. This should be discussed.

      This point is partially addressed in our response to Point 2 above, but to further extrapolate: certainly, the phenotype of individual muscle fibres is largely dictated by the firing properties of the motor neuron that innervates it. Slow-twitch muscle fibres tend to produce less contractile force but are more fatigue resistant, whereas fast-twitch muscle fibres produce more force but fatigue rapidly. There is evidence that expression of the chemorepellent molecule ephrin-A3 prevents the inappropriate innervation of slow-twitch muscle fibres by fast-firing motor neurons, which express the cognate receptor EphA8 [PMID: 26644518]. Importantly, fast-firing motor neurons are preferentially susceptible to disease mechanisms in ALS and the fast-twitch muscle fibres that they innervate are therefore more likely to undergo denervation and atrophy. Surprisingly, in this study we clearly show that grafts consisting of slow-firing motor neurons are able to innervate all regions of the triceps surae muscle group, including the normally exclusively fast-twitch superficial regions of the gastrocnemius and the exclusively slow-twitch soleus muscle. This finding strongly suggests that the normal developmental pairing of motor neuron and muscle fibre properties is not essential in this therapeutic context. Indeed, the use of more disease-resistant slow-firing motor neurons may provide some advantages. Again, we hope to be able to further explore this relationship in forthcoming follow-up studies.

      1. The authors state that exercise programs are likely to accelerate disease progression. This is not supported by the current body of clinical data. In fact, current guidelines are for moderate (not strenuous) exercise, and mouse studies have demonstrated a protective effect of moderate exercise on disease progression.

      We apologise for the lack of clarity on this point, as it was not our intention to imply that voluntary exercise accelerates disease progression. We have now amended the manuscript to specify “ENS-based exercise programs” to avoid any confusion.

      1. It is unclear what the experimental endpoint is. Page 25 defines it as 135 days of age, but ranges are given the figure legends, suggesting that some other criteria were used. It also seems unclear at what determined the age at which each animal was treated since they were also not treated at the same age.

      We hope that our response in the Public Reviews section above has fully addressed this point.

      1. I am a little confused by Figure 5 - figure supplement 5, panel D. Why do the authors give specific p-values here but not in the other panels? The sample sizes in D are very low, in some cases with only 1 animal in a group, and performing statistical tests under these conditions seems futile. The statistical power is nearly zero.

      For the purposes of consistency, we have now replaced the specific p-values in panel D with “ns”. The low n-values for the MUNE analysis data is due to the extremely difficult nature of identifying the contribution of individual motor units to the total muscle contractile response, when the maximal muscle force is extremely weak. In the absence of optical stimulation training, the extremely weak force elicited by acute optical stimulation precluded our ability to separate out the contribution of individual motor units and, often, in animals where this was not possible, we did not always perform electrically-evoked MUNE analysis. Unfortunately, we are not currently in a position to increase the n-values for this component of the study. Our ongoing research to enhance the amplitude of the muscle response to optical stimulation will hopefully help to more clearly address this in the future.

      1. One concern about this approach is that the procedure could accelerate the denervation of the target muscle. Figure 5 - figure supplement 6, panel B, indicates a significant reduction in force on the ipsilateral side relative to the contralateral side, at least under electrical stimulation of the nerve. This would be consistent with the hypothesis that the procedure does enhance disease progression in the treated limb. Is there a reduction in voluntary motor activity in these animals, such as in grip strength or the position of the foot while walking?

      We hope that this important point has been satisfactorily addressed in the Public Reviews section. Unfortunately, we did not undertake any behavioural analysis relating to voluntary motor function of the engrafted (or contralateral) hindlimbs, which may have provided useful data to address this point. As described above, the most likely explanation for this finding is due to physical nerve damage caused by the intraneural injection procedure; in our efforts to refine our strategy and move it towards clinical translation, we will take this into consideration in our future research.

      1. Based on Fig. 6D, it seems that the vast majority of innervated NMJs at endpoint are innervated by cells from the graft. And yet, electrical stimulation evokes substantially greater muscle force. This may suggest that optical control of engrafted motor neurons will not yield enough force for routine tasks or that the few remaining endogenous motor neurons are much more effective at generating force. These potential limitations and ways to overcome them should be discussed.

      There appears to be a slight misunderstanding, since our aim here was to sample a sufficiently powered number of motor end-plates innervated by YFP+ for statistical analysis. To do this we specifically chose regions of interest containing at least 1 YFP+ NMJ and the adjacent muscle fibres were included at random, whatever their innervation status. Had we sampled regions of interest at random, we would have been likely to capture only a very few YFP+ terminal as they occupy a very small volume of the total muscle section and the maximum scanning area for each high-resolution z-confocal stack is relatively small, so we feel that this selection was warranted.

      Minor comments:

      1. The donor mouse strain should be described as 129S1/SvImJ.

      We have now corrected this.

      1. The first time the supplementary figures show up in the manuscript, they seem to have two titles each, such as "Figure 1-figure supplement 1. (Figure 4 - figure supplement 1)". The second seems to be the correct one.

      This was caused by an issue with the Latex template, which has now been resolved.

      1. PCB is not defined the first time it is used (page 8, line 332).

      We have now defined this term on first use: printed circuit board (PCB)

      1. CNI is not defined in the text (page 12, line 432).

      We have now defined this abbreviation at the first usage on Page 4, Line 158

      1. Some of the fonts on the graphs are very small, such as Fig. 5J.

      We have increased the font size as much as possible for Fig. 5.

      1. Figure 6 - figure supplement 1 does not include a key to indicate which antigens are stains and which color refers to which antigen. This is also needed for the videos.

      We have now included a key on this figure supplement to indicate the relevant antigens and stain and we have also done the same for the videos.

      1. Video 5 seems to indicate that there is a dead zone in the back of the chamber. Does this raise any concerns about the consistency of training from animal to animal?

      This is an extremely astute observation. However, the intermittent activation of the implantable LED devices is not due to a dead zone; rather, it is due to the orientation of the power receiving coil within the device and it’s alignment with the resonance frequency chamber that transmits the power to the device. As the animals move around, and particularly when they rear up, the power receiving coil occasionally becomes misaligned and fails to receive sufficient power to activate the LED. Since the pulses are delivered every 2 seconds, for 1 hour per day, we feel that the animals, on average, receive sufficient numbers of pulses to implement the training regimen. Indeed, we feel that the results speak for themselves.

    1. Author Response

      The following is the authors’ response to the original reviews.

      We appreciate the reviewers’ detailed corrections and insightful comments. We have revised our manuscript per reviewers’ recommendations by including new data and clarifications/expansion of the discussion on our findings. Please see below for details.

      Reviewer #1 (Recommendations For The Authors):

      1. The introduction notes that CD1d KO mice show reduced levels of Va3.2 T cells (Ruscher et al.), which is interesting because innate memory T cell development in the thymus often requires IL-4 production by NKT cells. Have the authors explored QFL T cells in CD1d KO and/or IL-4 KO mice? Since their QFL TCR Tg mice still develop QFL T cells (and these animals likely have very few thymic NKT cells), NKT cells may not be required for the intrathymic development of QFL T cells?

      Answer: We agree that investigation on the role of NKT cells or IL-4 in QFL T cell development will greatly further our understanding of these cells.

      We validated the finding that expression of the QFL TCR transgene largely repressed the expression of endogenous TCRα, as indicated by the low levels of endogenous Vα2 on mature CD8SP T cells in both thymus and spleen. However, the frequencies of Vα2 usage in CD4 SP thymocytes and splenocytes from QFL transgenic mice were similar to non-transgenic mice, confirming that they underwent positive selection using endogenous TCR rather than the QFL TCR. We thus do not exclude the possible presence of NKT cells in QFLTg mouse and their potential involvement in the QFL T cells development. Our manuscript here is mainly focused on investigating the peripheral phenotype of QFL T cells and their association with the gut microbiota environment. Investigations into the role of CD1d/IL-4 will be best addressed in our future studies.

      1. The finding that Qa-1 expression is not required for the development of QFL T cells raises questions about other MHC products that may be involved. In this context, it is interesting that TAP-deficient mice develop few QFL T cells, for reasons that are unclear, but the authors may speculate a bit. In this context, it may be helpful for the authors to note whether TAP is required for QFL presentation to QFL T cells. Since Qa-1 is not required, and CD1d is still expressed in TAP KO mice, what then could be responsible for their defect in QFL T cell development?

      Answer: This is a great point. Figure 2 (from (Valerio et al., 2023) on the development of QFL T cells) tested whether QFL TCR cross-react with other MHC I molecules.

      We assessed the activation of pre-selection QFLTg thymocytes in response to various MHC I deficient DC2.4 cell lines. While the QFL thymocytes showed partially reduced activation when stimulated with Qa-1b deficient APCs, triple knock-out (KO) of Qa-1b, Kb, and Db in DC2.4 cells reduced activation close to background levels. However, double knock-out of Qa-1b with either Kb, or Db led to stimulation that was intermediate between the triple KO and Qa-1b-KO cell lines. These data suggest that Kb and Db may contribute to the positive selection of QFL T cells in Qa-1b-KO mice.

      TAP is required for FL9 peptide presentation and is very likely needed for presentation of the yet unidentified MHC Ia presented peptide(s) that are essential to QFL T positive selection. While CD1d/NKT cells/IL-4 may be involved in supporting the maturation of QFL T cells, we think in the TAP-KO mice the absence of TAP led to deletion/altered selection of the QFL T population at early developmental stage. We have added clarification on this point in the revised manuscript (line 412~418).

      1. It may be worthwhile for the authors to note that Qa-1 was also dispensable for the intrathymic selection of another Qa-1-restricted TCR (Doorduijn et al. 2018. Frontiers Immunol.), although this is presumably not the case for others (Sullivan et al. 2002. Immunity 17, 95).

      Answer: We appreciate this recommendation. We have noted this point in the resubmitted manuscript (line 412~418).

      1. Lines 122-124: The sentence "Interesting ..." seemed confusing to me; are the numbers (60 and 30%) correct?

      Answer: The numbers 60% and 30% were referring to the largest number we have detected for percentages of Va3.2 QFL T cells and Va3.2 CD8 T cell respectively. Here in the revised version, we replaced these numbers with average percentages (20.1% and <10%) to avoid confusion (line 134).

      1. Qa-1/peptide complexes may also be recognized by CD94/NKG2 receptors, which may complicate the interpretation of the data (e.g., staining of the dextramers). From their previous work, it appears that Qa-1/QFL does not bind CD94/NKG2, which would be helpful to note in the text.

      Answer: We have noted this point in the revised manuscript (line 117~121).

      1. It would be helpful to add a few comments about the potential relevance to HLA-E.

      Answer: We have included discussion on this point (line 391~401).

      1. Figure legends: Most legends note the total number of replicates, which is usually quite high. It would also be helpful to indicate the total number of independent experiments performed and, when relevant, that the data are pooled from multiple independent experiments.

      Answer: Thank you for raising the concern. We have clarified the experimental repeats in figure legends.

      Reviewer #2 (Recommendations For The Authors):

      1. The work of Nilabh Shastri was the foundation of the present study. Unfortunately, he passed away in 2021. Since he can no longer assume the responsibilities of a senior author, I wonder if it would be more appropriate to dedicate this paper to him than to list him as a co-author.

      Answer: We have removed Dr. Shastri’s name as a co-senior author and have dedicated this work to his memory.

      1. The official symbol for ERAAP is Erap1.

      Answer: We have replaced ERAAP with ERAP1.

      1. Please refrain from editorializing. For example, "strikingly" appears eight times and "interestingly" 9 times in the manuscript. Most readers believe they do not need to be said when something is striking or interesting.
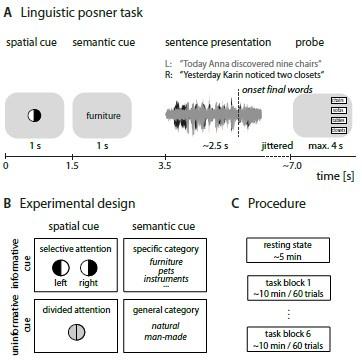
      Answer: We appreciate the Reviewer’s suggestion and have removed ‘strikingly’ and ‘interestingly’ from the manuscript.

      1. In WT mice, are there some cell types that express Qa-1b but not Erap1 and could therefore present the FL9 peptide?

      Answer: This is a great question. Using our highly sensitive QFL T cell hybridoma line BEko8Z (sensitivity shown in Fig. 6b), we have so far not been able to detect steady-state FL9 presentation by cells isolated from the spleen, lymph nodes, various gut associated lymphoid tissues or intestinal epithelial cells (Supplementary Fig. 8 a left panel). However, we do not exclude the possibility of FL9 peptide being transiently presented under certain conditions (i.e. ER stress/transformed cells) at particular locations or within certain time windows, which is of great importance for understanding the function of these cells but is beyond the scope of this study.

      1. Since you have not tested substitutions at other positions, could you explain your reasoning that P4 and P6 are the critical residues (lines 271-272)?

      Answer: Thank you for raising the concern. We have expanded on explanation of our strategy for determining peptide homology (line 272~313) in the revised manuscript. We have also included data on the structure the QFL TCR: FL9-Qa-1b complex predicted by Alphafold2, conformation alignment of FL9 and Qdm (Figure 6. a, b) and the NetMHCpan prediction of Qa1b binding of Qdm, FL9 and various FL9 mutant peptides (Supplementary Fig. 8 c) to help readers visualize the reasoning behind our strategy.
      1. Readers might appreciate having a Figure summarizing the differences between spleen and gut QFL T cells.

      Answer: This is a great suggestion. We have added a table summarizing the characteristic features of the splenic and IEL QFL T cells (Table 1).

      1. In the discussion, readers would like to know what plan you might have to elucidate the function of QFL T cells.

      Answer: We appreciate the recommendation. We have elaborated on our opinions and future directions in the resubmitted manuscript (line 393~401, 446~455).  

      Reviewer #3 (Public Review):

      1. For most of the report, the authors use a set of phenotypic traits to highlight the unique features of QFL-specific CD8+ T cells - specifically, CD44high, CD8aa+ve, CD8ab-ve. In Supp. Fig. 4, however, completely distinct phenotypic characteristics are presented, indicating that IEL QFL-specific T cells are CD5low, Thy-1low. No explanation is provided in the text about whether this is a previously reported phenotype, whether any elements of this phenotype are shared with splenic QFL T cells, what significance the authors ascribe to this phenotype (and to the fact that Qa1-deficiency leads to a more conventional Thy-1+ve, CD5+ve phenotype), and whether this altered phenotype is also seen in ERAAP-deficient mice. At least some explanation for this abrupt shift in focus and integration with prior published work is needed. On a related note, CD5 expression is measured in splenic QFL-specific CD8+ T cells from GF vs SPF mice (Supp. Fig. 9), to indicate that there is no phenotypic impact in the GF mice - but from Supp. Fig. 4, it would seem more appropriate to report CD5 expression in QFL-specific cells from the IEL, not the spleen.

      Answer: Expression of CD8αα and lack of CD4, CD8αβ, CD5 and CD90 expression was indeed reported as the characteristic phenotype of natIELs. We have clarified this point in the resubmitted manuscript (line 80). The CD8αα+ IEL QFL T cells have consistently showed CD5CD90- phenotype. While CD8αα expression was sufficient to describe their natIEL phenotype, we showed the CD5-CD90- data in Supplementary figures only to provide additional evidence.

      The CD5 molecule by itself reflects the TCR signaling strength and high CD5 level is associated with self-reactivity of T cells (Azzam et al., 2001; Fulton et al., 2015). The implication of CD5 expression on QFLTg cells is discussed in our other manuscript where we investigate the development of these cells (Valerio et al., 2023). In Supplementary Fig. 9, because the donor splenic QFLTg cell have consistently showed comparable CD5 level between the GF and SPF group, we reasoned that it would not interfere with our interpretation of the CD44 expression.

      1. The authors suggest the finding that QFL-specific cells from ERAAP-deficient mice have a more "conventional" phenotype indicates some form of negative selection of high-affinity clones (this result being somewhat unexpected since ERAAP loss was previously shown to increase the presentation of Qa-1b loaded with FL9, confirmed in this report). It is not clear how this argument aligns with the data presented, however, since the authors convincingly show no significant reduction in the number of QFL-specific cells in ERAAP-knockout mice (Fig. 3a), and their own data (e.g. Fig. 2a) do not suggest that CD44 expression correlates with QFL-multimer staining (as a surrogate for TCR affinity/avidity). Is there some experimental basis for suggesting that ERAAP-deficient lacks a subset of high affinity QFL-specific cells?

      Answer: We think the presence of QFL T cells in ERAAP-KO mice is a result of the unconventional developmental mechanism of these cells which is better addressed in our complementary manuscript on the development of QFL T cells(Valerio et al., 2023). Valerio et al. found that the most predominant QFL T clone which expresses Vα3.2Jα21, Vβ1Dβ1Jβ2-7 received relatively strong TCR signaling and underwent agonist selection during thymic development, indicating that the QFL ligand is involved in selection of the innate-like QFL T population.

      We agree that there is so far no direct evidence showing the QFL T cells that were absent in the ERAAP-KO mice were high-affinity clones. We have removed ‘high-affinity’ from the manuscript (line 180). While CD44 expression has been associated the antigen-experiences phenotype of T cells, it is yet unclear whether expression level of this molecule directly reflects TCR affinity/avidity. identification of clones of different affinities/avidities require high precision technologies that are not currently available to the research community. While we do have zMovi, a newly developed (developing) technology, in the lab claimed to measure relative avidity/affinity of different cell types for ligands, during the past two years working with this instrument has taught us that the technology is not yet advanced enough; it can only produce reliable data on extreme differences of single clones, i.e., high numbers of homogeneous cell types expressing very high affinity receptors.

      1. The rationale for designing FL9 mutants, and for using these data to screen the proteomes of various commensal bacteria needs further explanation. The authors propose P4 and P6 of FL9 are likely to be "critical" but do not explain whether they predict these to be TCR or Qa-1b contact sites. Published data (e.g., PMID: 10974028) suggest that multiple residues contribute to Qa-1b binding, so while the authors find that P4A completely lost the ability to stimulate a QFL-specific hybridoma, it is unclear whether this is due to the loss of a TCR- or a Qa-1-contact site (or, possibly, both). This could easily be tested - e.g., by determining whether P4A can act as a competitive inhibitor for FL9-induced stimulation of BEko8Z (and, ideally, other Qa-1b-restricted cells, specific for distinct peptides). Without such information, it is unclear exactly what is being selected in the authors' screening strategy of commensal bacterial proteomes. This, of course, does not lessen the importance of finding the peptide from P. pentosaceus that can (albeit weakly) stimulate QFL-specific cells, and the finding that association with this microbe can sustain IEL QFL cells.

      Answer: Thank you for raising the concern. We have expanded on explanation of our strategy for determining peptide homology (line 272~313) in the revised manuscript. We have also included data on the structure the QFL TCR: FL9-Qa-1b complex predicted by Alphafold2, conformation alignment of FL9 and Qdm (Figure 6. a, b) and the NetMHCpan prediction of Qa1b binding of Qdm, FL9 and various FL9 mutant peptides (Supplementary Fig. 8 c) to help readers visualize the reasoning behind our strategy.
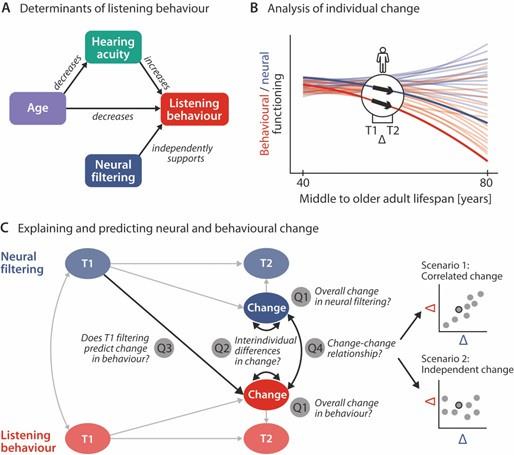
      References

      Azzam, H.S., DeJarnette, J.B., Huang, K., Emmons, R., Park, C.S., Sommers, C.L., El-Khoury, D., Shores, E.W., and Love, P.E. (2001). Fine tuning of TCR signaling by CD5. J Immunol 166, 5464- 5472.10.4049/jimmunol.166.9.5464, PMID:11313384

      Fulton, R.B., Hamilton, S.E., Xing, Y., Best, J.A., Goldrath, A.W., Hogquist, K.A., and Jameson, S.C. (2015). The TCR's sensitivity to self peptide-MHC dictates the ability of naive CD8(+) T cells to respond to foreign antigens. Nat Immunol 16, 107-117.10.1038/ni.3043, PMID:25419629

      Valerio, M.M., Arana, K., Guan, J., Chan, S.W., Yang, X., Kurd, N., Lee, A., Shastri, N., Coscoy, L., and Robey, E.A. (2023). The promiscuous development of an unconventional Qa1b-restricted T cell population. bioRxiv, 2022.2009.2026.509583.10.1101/2022.09.26.509583,

    1. Author Response

      The following is the authors’ response to the original reviews.

      Reviewer 1

      Public Review

      R1.1) Randomized clinical trials use experimental blinding and compare active and placebo conditions in their analyses. In this study, Fassi and colleagues explore how individual differences in subjective treatment (i.e., did the participant think they received the active or placebo treatment) influence symptoms and how this is related to objective treatment. The authors address this highly relevant and interesting question using a powerful method by (re-)analyzing data from four published neurostimulation studies and including subjective treatment in statistical models explaining treatment response. The major strengths include the innovative and important research question, the inclusion of four different studies with different techniques and populations to address this question, sound statistical analyses, and findings that are of high interest and relevance to the field.

      We thank the reviewer for this summary and the overall appreciation for our work.

      R1.2) My main suggestion is that authors reconsider the description of the main conclusion to better integrate and balance all findings. Specifically, the authors conclude that (e.g., in the abstract) "individual differences in subjective treatment can explain variability in outcomes better than the actual treatment", which I believe is not a consistent conclusion across all four studies as it does not appropriately consider important interactions with objective treatment observed in study 2 and 3. In study 2, the greatest improvement was observed in the group that received TMS but believed they received sham. While subjective treatment was associated with improvement regardless of objective active or sham treatment, improvement in the objective active TMS group who believed they received sham suggests the importance of objective treatment regardless of subjective treatment. In Study 3, including objective treatment in the model predicted more treatment variance, further suggesting the predictive value of objective treatment.

      We thank the reviewer for this comment and agree that the interpretation of findings requires a more nuanced and balanced description. We, therefore, implemented changes in both the abstract and discussion of the manuscript, as reported below (additions are highlighted in grey and deletions are shown in strikethrough):

      Abstract

      “Our findings consistently show that the inclusion of subjective treatment can provide a better model fit when accounted for alone or in an interaction term with objective treatment (defined as the condition to which participants are assigned in the experiment). These results demonstrate the significant contribution of subjective experience in explaining the variability of clinical, cognitive and behavioural outcomes. Based on these findings, We advocate for existing and future studies in clinical and non-clinical research to start accounting for participants’ subjective beliefs and their interplay with objective treatment when assessing the efficacy of treatments. This approach will be crucial in providing a more accurate estimation of the treatment effect and its source, allowing the development of effective and reproducible interventions.” (p. 3)

      Discussion

      “We demonstrate that participants’ subjective beliefs about receiving the active vs control (sham) treatment are an important factor that can explain variability in the primary outcome and, in some cases, fits the observed data better than the actual treatment participants received during the experiment.” (p. 21)

      “We demonstrate that participants’ subjective beliefs about receiving the active vs control (sham) treatment are an important factor that can explain variability in the primary outcome and, in some cases, fits the observed data better than the actual treatment participants received during the experiment. Specifically, in Studies 1, 2 and 4, the fact that participants thought to be in the active or control condition explained variability in clinical and cognitive scores to a more considerable extent than the objective treatment alone. Notably, the same pattern of results emerged when we replaced subjective treatment with subjective dosage in the fourth experiment, showing that subjective beliefs about treatment intensity also explained variability in research results better than objective treatment. In contrast to Studies 1 and 4, Studies 2 and 3 showed a more complex pattern of results. Specifically, in Study 2 we observed an interaction effect, whereby the greatest improvement in depressive symptoms was observed in the group that received the active objective treatment but believed they received sham. Differently, in Study 3, the inclusion of both subjective and objective treatment as main effects explained variability in symptoms of inattention. Overall, these findings suggest the complex interplay of objective and subjective treatment. The variability in the observed results could be explained by factors such as participants’ personality, type and severity of the disorder, prior treatments, knowledge base, experimental procedures, and views of the research team, all of which could be interesting avenues for future studies to explore.” (p. 22)

      R1.3) In addition to updating the conclusions to better reflect this interaction, I suggest authors include the proportion of participants in each subjective treatment group that actually received active or sham treatment to better understand how much of the subjective treatment is explained by objective treatment. I think it is particularly important to better integrate and more precisely communicate this finding, because the conclusions may otherwise be erroneously interpreted as improvements after treatment only being an effect of subjective treatment or sham.

      We thank the reviewer for this comment. The information about how many participants are included in each group is provided in the every each codebooks under the section “Count of Participants by Treatment Condition and Their Subjective Guess” which is in the project’s OSF link (https://osf.io/rztxu/). Additionally, we added these tables to the supplementary material in tables S1, S8, S15, and S18, and we referred to these tables throughout the Methods section. Further, we added this information to the manuscript results, as follows:

      • “Further details on participant groupings based on objective treatment and their subjective treatment can be found in the codebook corresponding to each of the four studies as well as S1.” (p. 8).

      • “The breakdown of participants to objective treatment and subjective treatment in the sample can be found in S8.” (p. 13).

      • “The breakdown of participants to objective treatment and subjective treatment in the sample can be found in S15.” (p. 17).

      • “The breakdown of participants to objective treatment and subjective treatment in the sample can be found in S18.” (p. 19).

      R1.4) The paper will have significant impact on the field. It will promote further investigation of the effects of sham vs active treatment by the introduction of the terms subjective treatment vs objective treatment and subjective dosage that can be used consistently in the future. The suggestions to assess the expectation of sham vs active earlier on in clinical trials will advance the understanding of subjective treatment in future studies. Overall, I believe the data will substantially contribute to the design and interpretation of future clinical trials by underscoring the importance of subjective treatment.

      We thank the reviewer for this positive comment.

      Review for authors

      R1.4) Abstract

      "Here we show that individual differences in subjective treatment.. can explain variability in outcomes better than the actual treatment". "Our findings consistently show that the inclusion of subjective treatment provides a better model fit than objective treatment alone" - these two statements could be interpreted as two different conclusions, authors should be more consistent.

      We thank the reviewer for this comment and have now changed the abstract to be consistent, as also highlighted in R1.1:

      Abstract

      “Our findings consistently show that the inclusion of subjective treatment can provides a better model fit when accounted for alone or in an interaction term with objective treatment (defined as the condition to which participants are assigned in the experiment). These results demonstrate the significant contribution of subjective experience in explaining the variability of clinical, cognitive and behavioural outcomes. Based on these findings, We advocate for existing and future studies in clinical and non-clinical research to start accounting for participants’ subjective beliefs and their interplay with objective treatment when assessing the efficacy of treatments. This approach will be crucial in providing a more accurate estimation of the treatment effect and its source, allowing the development of effective and reproducible interventions.” (p. 3)

      R1.5) Introduction

      This is an odd sentence given it is 2023: "As a result, the global neuromodulation device industry is expected to grow to $13.3 billion in 2022 (Colangelo, 2020)."

      We have now removed this sentence as indeed not applicable and instead added a reference for the previous sentence:

      “In recent years, neuromodulation has been studied as one of the most promising treatment methods (De Ridder et al., 2021).”

      Reference

      De Ridder, D., Maciaczyk, J., & Vanneste, S. (2021). The future of neuromodulation: Smart neuromodulation. Expert Review of Medical Devices, 18(4), 307–317. https://doi.org/10.1080/17434440.2021.1909470

      R1.6) Figures

      • Lines of Figure 1 are vague.

      • Figure 5 color scheme is confusing. It would be better to use green/blue colors for one, (e.g.) sham in both subjective and objective treatment and orange/red colors for active treatment.

      • For Figure 6 it would be better to use the same color for sham as subjective dosage none.

      • Relatedly, it would be easier to keep color scheme consistent across the paper and for example use green/blue colors for sham throughout.

      We thank the reviewer for this comment. Following these comments, all the figures of the paper has remade for better clarity.

      • Figure 1, the individual lines are now shown stronger, there is also a connecting line between the averages.

      • Figure 5, sham is now on cold colours (blue and green), and active treatment on warm colours (red and orange)

      • Figure 6, the same colour for sham as subjective dosage none is now applied.

      Further, we also edited Figures 2 and 4 by removing the percentages between 0% and 100% on the y-axis. Given that the outcome variable was binary coded, we implemented this change to avoid confusion.

      Reviewer 2

      Public Review

      R2.1) This manuscript focuses on the clinical impact of subjective experience or treatment with transcranial magnetic stimulation and transcranial direct current stimulation studies with retrospective analyses of 4 datasets. Subjective experience or treatment refers to the patient level thought of receiving active or sham treatments. The analyses suggest that subjective treatment effects are an important and under appreciated factor in randomized controlled trials. The authors present compelling evidence that has significance in the context of other modalities of treatment, treatment for other diseases, and plans for future randomized controlled trials. Other strengths included a rigorous approach and analyses. Some aspects of the manuscript are underdeveloped and the findings are over interpreted. Thank you for your efforts and the opportunity to review your work.

      We thank the reviewer for their overall appreciation of this work. We address the comment on the overinterpretation of findings in response to reviewer 1 (see R1.2) above, and we expand on the underdeveloped explanation of sham procedures (see R2.2) below.

      Review for authors

      R2.2) One concern is that the findings are consistently over interpreted and presented with a polarizing framework. This is a complicated area of study with many variables that are not understood or captured. For example, subjective experience effects likely varies with personality dimensions, disease, prior treatments, knowledge base, view of the research team, and disease severity. Framing subjective experience with a more balanced tone, as an important consideration for future trial design and study execution would enhance the impact of the paper.

      We thank the reviewer for this comment. We reframed our interpretation of results in both the manuscript abstract and discussion, as highlighted in response to reviewer 1 (see R1.2) above.

      R2.3) The discussion of sham approaches for transcranial magnetic stimulation and transcranial direct current stimulation is underdeveloped. There are approaches that are not discussed. The tilt method is seldom used for modern studies for example.

      We thank the reviewer for this comment, and we now rewrote a paragraph elaborating more on different practices to apply sham procedures in the introduction section:

      “Participants that take part in TMS and tES studies consistently report various perceptual sensations, such as audible clicks, visual disturbances, and cutaneous sensations (Davis et al., 2013) Consequently, they can discern when they have received the active treatment, making subjective beliefs and demand characteristics potentially influencing performance (Polanía et al., 2018). To account for such non-specific effects, sham (placebo) protocols have been employed. For transcranial direct current stimulation (tDCS), the most common form of tES, various sham protocols exist. A review by Fonteneau et al., 2019 shows 84% of 173 studies used similar sham approaches to an early method by Gandiga et al., 2005. This initial protocol had a 10s ramp-up followed by 30s of active stimulation at 1mA before cessation, differently from active stimulation that typically lasts up to 20 minutes.. However, this has been adapted in terms of intensity and duration of current, ramp-in/out phases, and the number of ramps during stimulation. Similarly, in sham TMS, the TMS coil may be tilted or replaced with purpose-built sham coils equipped with magnetic shields, which produce auditory effects but ensure no brain stimulation (Duecker & Sack, 2015). By using surface electrodes, the somatosensory effects of actual TMS are also mimicked. Overall, these types of sham stimulation aim to mimic the perceptual sensations associated with active stimulation without substantially affecting cortical excitability (Fritsch et al., 2010; Nitsche & Paulus, 2000). As a result, sham treatments should allow controlling for participants’ specific beliefs about the type of stimulation received.” (p.6)

      References

      Fonteneau, C., Mondino, M., Arns, M., Baeken, C., Bikson, M., Brunoni, A. R., Burke, M. J., Neuvonen, T., Padberg, F., Pascual-Leone, A., Poulet, E., Ruffini, G., Santarnecchi, E., Sauvaget, A., Schellhorn, K., Suaud-Chagny, M.-F., Palm, U., & Brunelin, J. (2019). Sham tDCS: A hidden source of variability? Reflections for further blinded, controlled trials. Brain Stimulation, 12(3), 668–673. https://doi.org/10.1016/j.brs.2018.12.977

      Gandiga, P. C., Hummel, F. C., & Cohen, L. G. (2006). Transcranial DC stimulation (tDCS): A tool for double-blind sham-controlled clinical studies in brain stimulation. Clinical Neurophysiology, 117(4), 845–850. https://doi.org/10.1016/j.clinph.2005.12.003

    1. Author Response

      The following is the authors’ response to the original reviews.

      eLife assessment:

      This study reports a meta-analysis of published data to address an issue that is topical and potentially useful for understanding how the sites of initiation of DNA replication are specified in human chromosomes. The work focuses on the role of the Origin Recognition Complex (ORC) and the Mini-Chromosome Maintenance (MCM2-7) complex in localizing origins of DNA replication in human cells. While some aspects of the paper are of interest, the analysis of published data is in parts inadequate to allow for the broad conclusion that, in contrast to multiple observations with other species, sites in the human genome for binding sites for ORC and MCM2-7 do not have extensive overlap with the location of origins of DNA replication.

      Public Reviews:

      Reviewer #1 (Public Review):

      In the best genetically and biochemically understood model of eukaryotic DNA replication, the budding yeast, Saccharomyces cerevisiae, the genomic locations at which DNA replication initiates are determined by a specific sequence motif. These motifs, or ARS elements, are bound by the origin recognition complex (ORC). ORC is required for loading of the initially inactive MCM helicase during origin licensing in G1. In human cells, ORC does not have a specific sequence binding domain and origin specification is not specified by a defined motif. There have thus been great efforts over many years to try to understand the determinants of DNA replication initiation in human cells using a variety of approaches, which have gradually become more refined over time.

      In this manuscript Tian et al. combine data from multiple previous studies using a range of techniques for identifying sites of replication initiation to identify conserved features of replication origins and to examine the relationship between origins and sites of ORC binding in the human genome. The authors identify a) conserved features of replication origins e.g. association with GC-rich sequences, open chromatin, promoters and CTCF binding sites. These associations have already been described in multiple earlier studies. They also examine the relationship of their determined origins and ORC binding sites and conclude that there is no relationship between sites of ORC binding and DNA replication initiation. While the conclusions concerning genomic features of origins are not novel, if true, a clear lack of colocalization of ORC and origins would be a striking finding.

      Response: Thank you. That is where the novelty of the paper lies.

      However, the majority of the datasets used do not report replication origins, but rather broad zones in which replication origins fire. Rather than refining the localisation of origins, the approach of combining diverse methods that monitor different objects related to DNA replication leads to a base dataset that is highly flawed and cannot support the conclusions that are drawn, as explained in more detail below.

      Response: We are using the narrowly defined SNS-seq peaks as the gold standard origins and making sure to focus in on those that fall within the initiation zones defined by other methods. The objective is to make a list of the most reproducible origins. Unlike what the reviewer states, this actually refines the dataset to focus on the SNS origins that have also been reproduced by the other methods in multiple cell lines. We have changed the last box of Fig. 1A to make this clearer: Shared origins = reproducible SNS-seq origins that are contained in initiation zones defined by Repli-seq, OK-seq and Bubble-seq. This and the Fig. 2B (as it is) will make our strategy clearer.

      Methods to determine sites at which DNA replication is initiated can be divided into two groups based on the genomic resolution at which they operate. Techniques such as bubble-seq, ok-seq can localise zones of replication initiation in the range ~50kb. Such zones may contain many replication origins. Conversely, techniques such as SNS-seq and ini-seq can localise replication origins down to less than 1kb. Indeed, the application of these different approaches has led to a degree of controversy in the field about whether human replication does indeed initiate at discrete sites (origins), or whether it initiates randomly in large zones with no recurrent sites being used. However, more recent work has shown that elements of both models are correct i.e. there are recurrent and efficient sites of replication initiation in the human genome, but these tend to be clustered and correspond to the demonstrated initiation zones (Guilbaud et al., 2022).

      These different scales and methodologies are important when considering the approach of Tian et al. The premise that combining all available data from five techniques will increase accuracy and confidence in identifying the most important origins is flawed for two principal reasons. First, as noted above, of the different techniques combined in this manuscript, only SNS-seq can actually identify origins rather than initiation zones. It is the former that matters when comparing sites of ORC binding with replication origin sites if a conclusion is to be drawn that the two do not co-localise.

      Response: We agree. So the reviewer should agree that our method of finding SNS-seq peaks that fall within initiation zones actually refines the origins to find the most reproducible origins. We are not losing the spatial precision of the SNS-seq peaks.

      Second, the authors give equal weight to all datasets. Certainly, in the case of SNS-seq, this is not appropriate. The technique has evolved over the years and some earlier versions have significantly different technical designs that may impact the reliability and/or resolution of the results e.g. in Foulk et al. (Foulk et al., 2015), lambda exonuclease was added to single stranded DNA from a total genomic preparation rather than purified nascent strands), which may lead to significantly different digestion patterns (ie underdigestion). Curiously, the authors do not make the best use of the largest SNS-seq dataset (Akerman et al., 2020) by ignoring these authors separation of core and stochastic origins. By blending all data together any separation of signal and noise is lost. Further, I am surprised that the authors have chosen not to use data and analysis from a recent study that provides subsets of the most highly used and efficient origins in the human genome, at high resolution (Guilbaud et al., 2022).

      Response: 1) We are using the data from Akerman et al., 2020: Dataset GSE128477 in Supplemental Table 1. We have now separately examined the core origins defined by the authors to check its overlap with ORC binding (Supplementary Fig. S8b).

      2) To take into account the refinement of the SNS-seq methods through the years, we actually included in our study only those SNS-seq studies after 2018, well after the lambda exonuclease method was introduced. Indeed, all 66 of SNS-seq datasets we used were obtained after the lambda exonuclease digestion step. To reiterate, we recognize that there may be many false positives in the individual origin mapping datasets. Our focus is on the True positives, the SNS-seq peaks that have some support from multiple SNS-seq studies AND fall within the initiation zones defined by the independent means of origin mapping (described in Fig. 1A and 2B). These True positives are most likely to be real and reproducible origins and should be expected to be near ORC binding sites.

      We have changed the last box of Fig. 1A to make this clearer: Shared origins = reproducible SNS-seq origins that are contained in initiation zones defined by Repli-seq, OK-seq or Bubble-seq.

      Ini-seq by Torsten Krude and co-workers (Guillbaud, 2022) does NOT use Lambda exonuclease digestion. So using Ini-seq defined origins is at odds with the suggestion above that we focus only on SNS-seq datasets that use Lambda exonuclease. However, Ini-seq identifies a much smaller subset of SNS-seq origins, so, as requested, we have also done the analysis with just that smaller set of origins, and it does show a better proximity to ORC binding sites, though even then the ORC proximate origins account for only 30% of the Ini-seq2 origins (Supplementary Fig. S8d). Note Ini-seq2 identifies DNA replication initiation sites seen in vitro on isolated nuclei.

      References:

      Akerman I, Kasaai B, Bazarova A, Sang PB, Peiffer I, Artufel M, Derelle R, Smith G, Rodriguez-Martinez M, Romano M, Kinet S, Tino P, Theillet C, Taylor N, Ballester B, Méchali M (2020) A predictable conserved DNA base composition signature defines human core DNA replication origins. Nat Commun, 11: 4826

      Foulk MS, Urban JM, Casella C, Gerbi SA (2015) Characterizing and controlling intrinsic biases of lambda exonuclease in nascent strand sequencing reveals phasing between nucleosomes and G-quadruplex motifs around a subset of human replication origins. Genome Res, 25: 725-735

      Guilbaud G, Murat P, Wilkes HS, Lerner LK, Sale JE, Krude T (2022) Determination of human DNA replication origin position and efficiency reveals principles of initiation zone organisation. Nucleic Acids Res, 50: 7436-7450

      Reviewer #2 (Public Review):

      Tian et al. perform a meta-analysis of 113 genome-wide origin profile datasets in humans to assess the reproducibility of experimental techniques and shared genomics features of origins. Techniques to map DNA replication sites have quickly evolved over the last decade, yet little is known about how these methods fare against each other (pros and cons), nor how consistent their maps are. The authors show that high-confidence origins recapitulate several known features of origins (e.g., correspondence with open chromatin, overlap with transcriptional promoters, CTCF binding sites). However, surprisingly, they find little overlap between ORC/MCM binding sites and origin locations.

      Overall, this meta-analysis provides the field with a good assessment of the current state of experimental techniques and their reproducibility, but I am worried about: (a) whether we've learned any new biology from this analysis; (b) how binding sites and origin locations can be so mismatched, in light of numerous studies that suggest otherwise; and (c) some methodological details described below.

      Major comments:

      • Line 26: "0.27% were reproducibly detected by four techniques" -- what does this mean? Does the fragment need to be detected by ALL FOUR techniques to be deemed reproducible?

      Response: If the reproducible SNS-seq peaks are included in the reproducible initiation zones found by the other methods, then we consider it reproducible across datasets. The strategy is to focus our analysis on the most reproducible SNS-seq peaks that happen to be in reproducible initiation zones. It is the best way to confidently identify a very small set of true positive origins. We have re-stated this in the abstract: “only 0.27% were reproducibly obtained in at least 20 independent SNS-seq datasets and contained in initiation zones identified by each of three other techniques (20,250 shared origins),...”

      And what if the technique detected the fragment is only 1 of N experiments conducted; does that count as "detected"?

      Response: A reproducible SNS-seq origin has been reproduced above a statistical threshold of 20 reproductions of SNS-seq datasets. A threshold of reproduction in 20 datasets out of 66 SNS-seq datasets gives an FDR of <0.1. This is explained in Fig. 2a and Supplementary Fig. S2. For the initiation zones, we considered a Zone even if it appears in only 1 of N experiments, because N is usually small. This relaxed method for selecting the initiation zones gives the best chance of finding SNS-seq peaks that are reproduced by the other methods.

      Later in Methods, the authors (line 512) say, "shared origins ... occur in sufficient number of samples" but what does sufficient mean?

      Response: “Sufficient” means that SNS-seq origin was reproducibly detected in ≥ 20 datasets and was included in any initiation zone defined by three other techniques.

      Then on line 522, they use a threshold of "20" samples, which seems arbitrary to me. How are these parameters set, and how robust are the conclusions to these settings? An alternative to setting these (arbitrary) thresholds and discretizing the data is to analyze the data continuously; i.e., associate with each fragment a continuous confidence score.

      Response: We explained Fig. 2a and Supplementary Fig. S2 on line 192 as follows: The occupancy score of each origin defined by SNS-seq (Supplementary Fig. 2a) counts the frequency at which a given origin is detected in the datasets under consideration. For the random background, we assumed that the number of origins confirmed by increasing occupancy scores decreases exponentially (see Methods and Supplementary Table 2). Plotting the number of origins with various occupancy scores when all SNS-seq datasets published after 2018 are considered together (the union origins) shows that the experimental curve deviates from the random background at a given occupancy score (Fig. 2a). The threshold occupancy score of 20 is the point where the observed number of origins deviates from the expected background number (with an FDR < 0.1) (Fig. 2a).

      In the Methods: We have revised the section, “Identification of shared origins” to better describe our strategy. The number of observed origins with occupancy score greater than 20 (out of 66 measures) is 10 times more than expected from the background model. This approach is statistically sound and described by us in (Fang et al. 2020).

      • Line 20: "50,000 origins" vs "7.5M 300bp chromosomal fragments" -- how do these two numbers relate? How many 300bp fragments would be expected given that there are ~50,000 origins? (i.e., how many fragments are there per origin, on average)? This is an important number to report because it gives some sense of how many of these fragments are likely nonsense/noise. The authors might consider eliminating those fragments significantly above the expected number, since their inclusion may muddle biological interpretation.

      Response: We confused the reviewer by the way we wrote the abstract. The 50,000 origins that are mentioned in the abstract is the hypothetical expected number of origins that have to fire to replicate the whole 6x10^9 nt diploid genome based on the average inter-origin distance of 100 kb (as determined by molecular combing). The 7.5M 300 bp fragments are the genomic regions where the 7.5M union SNS-seq-defined origins are located. Clearly, that is a lot of noise, some because of technical noise and some due to the fact that origins fire stochastically. Which is why our paper focuses on a smaller number of reproducible origins, the 20,250 shared origins. Our analysis is on the 20,250 shared origins, and not on all 7.5M union origins. Thus, we are not including the excess of non-reproducible (stochastic?) origins in our analysis.

      The revised abstract in the revised paper will say: “Based on experimentally determined average inter-origin distances of ~100 kb, DNA replication initiates from ~50,000 origins on human chromosomes in each cell-cycle. The origins are believed to be specified by binding of factors like the Origin Recognition Complex (ORC) or CTCF or other features like G-quadruplexes. We have performed an integrative analysis of 113 genome-wide human origin profiles (from five different techniques) and 5 ORC-binding site datasets to critically evaluate whether the most reproducible origins are specified by these features. Out of ~7.5 million union origins identified by all the SNS-seq datasets, only 0.27% were reproducibly obtained in at least 20 independent SNS-seq datasets and contained in initiation zones identified by any of three other techniques (20,250 shared origins), suggesting extensive variability in origin usage and identification in different circumstances.”

      • Line 143: I'm not terribly convinced by the PCA clustering analysis, since the variance explained by the first 2 PCs is only ~25%. A more robust analysis of whether origins cluster by cell type, year etc is to simply compute the distribution of pairwise correlations of origin profiles within the same group (cell type, year) vs the correlation distribution between groups. Relatedly, the authors should explain what an "origin profile" is (line 141). Is the matrix (to which PCA is applied) of size 7.5M x 113, with a "1" in the (i,j) position if the ith fragment was detected in the jth dataset?

      Response: The reviewer is correct about how we did the PCA and have now included the description in the Methods. We have now done the pairwise correlations the way the reviewer suggests, and it is clear that each technique correlates best with itself (though there are some datasets that do not correlate as well as the others even with the same technique) (Supp. Fig. S3). We have also done the PCA by techniques (Fig. 1c), by cell types for all techniques (Supp. Fig. S1c), by cell-types for SNS-seq only (Supp. Fig. S1d), and by year of publication of SNS-seq data (Supp. Fig. S1e). Our conclusions remain the same: in general, origins defined from the same cell lineage are more similar to each other than across lineages, though this similarity within a lineage is more pronounced when we focus on SNS-seq alone. However, even when we look at SNS-seq alone, there is not a perfect overlap of origins determined by different studies on the same lineage. Finally, although we looked only at SNS-seq data after 2018, by which time lamda exonuclease had become the accepted way of defining SNS-seq, there is surprising clustering around each year.

      • It's not clear to me what new biology (genomic features) has been learned from this meta-analysis. All the major genomic features analyzed have already been found to be associated with origin sites. For example, the correspondence with TSS has been reported before:

      https://www.ncbi.nlm.nih.gov/pmc/articles/PMC6320713/

      https://www.ncbi.nlm.nih.gov/pmc/articles/PMC6547456/

      So what new biology has been discovered from this meta-analysis?

      Response: The new biology can be summarized as: (a) We can identify a set of reproducible (in multiple datasets and in multiple cell lines) SNS-seq origins that also fall within initiation zones identified by completely independent methods. These may be the best origins to study in the midst of the noise created by stochastic origin firing. (b) The overlap of these Shared origins (True Positive Origins) with known ORC binding sites is tenuous. So either all the origin mapping data, or all the ORC binding data has to be discarded, or this is the new biological reality in mammalian cancer cells: on a genome-wide scale the most reproduced origins are not in close proximity to ORC binding sites, in contrast to the situation in yeast. (c) Several of the features reported to define origins (CTCF binding sites, G quadruplexes etc.) could simply be from the fact that those features also define transcription start sites (TSS), and the origins may prefer to locate to these parts of the genome because of the favorable chromatin state, instead of the sequence or the structural features of CTCF binding sites or G quadruplexes specifically locating the origins.

      • Line 250: The most surprising finding is that there is little overlap between ORC/MCM binding sites and origin locations. The authors speculate that the overlap between ORC1 and ORC2 could be low because they come from different cell types. Equally concerning is the lack of overlap with MCM. If true, these are potentially major discoveries that butts heads with numerous other studies that have suggested otherwise. More needs to be done to convince the reader that such a mis-match is true. Some ideas are below:

      Idea 1) One explanation given is that the ORC1 and ORC2 data come from different cell types. But there must be a dataset where both are mapped in the same cell type. Can the authors check the overlap here? In Fig S4A, I would expect the circles to not only strongly overlap but to also be of roughly the same size, since both ORC's are required in the complex. So something seems off here.

      Response: We agree with the reviewer that there is something “off here”. Either the techniques that report these sites are all wrong, or the biology does not fit into the prevailing hypothesis. As shown in Supplementary Fig. S6C, we do not have ORC1 and ORC2 ChIP-seq data from the same cell-type. We have ORC1 ChIP-seq and SNS-seq data from HeLa cells and ORC2 ChIP seq and origins from K562 cells, and so have now done the overlap of the binding sites to the shared origins in the same cell-type in the new Figure S5e and S5f. Out of 9605 shared origins in K562 cells, 12.8% overlap with ORC2 and 5.4% overlap with MCM3-7 binding sites also defined in K562 cells. Out of 8305 shared origins in HeLa cells, 4.4% overlap with ORC1 binding sites defined in HeLa cells.

      There is nothing in the Literature that shows that various ORC subunits ChiP-seq to the same sites, and we have unpublished data that shows very poor overlap in the CHiP binding sites of different ORC subunits. The poor overlap between the binding sites of subunits of the same complex either suggests that the subunits do not always bind to the chromatin as a six-subunit complex or that all the ORC subunit ChIP-seq data in the Literature is suspect. We provide in the supplementary figure S6A examples of true positive complexes (SMARCA4/ARID1A, SMC1A/SMC3, EZH2/SUZ12), whose subunits ChIP-seq to a large fraction of common sites.

      Idea 2) Another explanation given is that origins fire stochastically. One way to quantify the role of stochasticity is to quantify the overlap of origin locations performed by the same lab, in the same year, in the same experiment, in the same cell type -- i.e., across replicates -- and then compute the overlap of mapped origins. This would quantify how much mis-match is truly due to stochasticity, and how much may be due to other factors.

      Response: A given lab may have superior reproducibility with its own results compared to the entire field, and the finding that origins published in the same year tend to be clustered together could be because a given lab publishes a number of origin sets in a single paper in a given year. But the notion of stochasticity is well accepted in the field because of this observation: the average inter-origin distance measured by single molecule techniques like molecular combing is ~100 kb, but the average inter-origin distance measure on a population of cells (same cell line) is ~30 kb. The only explanation is that in a population of cells many origins can fire, but in a given cell on a given allele, only one-third of those possible origins fire. This is why we did not worry about the lack of reproducibility between cell-lines, labs etc, but instead focused on those SNS-seq origins that are reproducible over multiple techniques and cell lines.

      Idea 3) A third explanation is that MCMs are loaded further from origin sites in human than in yeast. Is there any evidence of this? How far away does the evidence suggest, and what if this distance is used to define proximity?

      Response: MCMs, of course, have to be loaded at an origin at the time the origin fires because MCMs provide the core of the helicase that starts unwinding the DNA at the origin. Thus, the lack of proximity of MCM binding sites with origins can be because the most detected MCM sites (where MCM spends the most time in a cell-population) does not correspond to where it is first active to initiate origin firing. This has been discussed. MCMs may be loaded far from origin site, but because of their ability to move along the chromatin, they have to move to the origin-site at some point to fire the origin.

      Idea 4) How many individual datasets (i.e., those collected and published together) also demonstrate the feature that ORC/MCM binding locations do not correlate with origins? If there are few, then indeed, the integrative analysis performed here is consistent. But if there are many, then why would individual datasets reveal one thing, but integrative analysis reveal something else?

      Response: In the revised manuscript we have now discussed Dellino, 2013; Kirstein, 2021; Wang, 2017; Mas, 2023. None of them have addressed what we are addressing, which is whether the small subset of the most reproducible origins proximal to ORC or MCM binding sites, but the discussion is essential.

      Idea 5) What if you were much more restrictive when defining "high-confidence" origins / binding sites. Does the overlap between origins and binding sites go up with increasing restriction?

      Response: We have made SNS-seq origins more restrictive by selecting those reproduced by 30, 40, or 50 datasets, in addition to the FDR-determined cutoff of 20. The number of origins fall, but when we do not see any significant increase in the % of origins that overlap with or are proximal to with all ORC or MCM binding sites or Shared ORC or MCM binding sites. This analysis is now included in Supp. Fig. S9 and discussed.

      Overall, I have the sense that these experimental techniques may be producing a lot of junk. If true, this would be useful for the field to know! But if not, and there are indeed "unexplored mechanisms of origin specification" that would be exciting. But I'm not convinced yet.

      • It would be nice in the Discussion for the authors to comment about the trade-offs of different techniques; what are their pros and cons, which should be used when, which should be avoided altogether, and why? This would be a valuable prescription for the field.

      Response: Thanks for the suggestion. We have done what the reviewer suggested in the new Supp. Fig. S4.

      Among the 20,250 high-confidence shared origins, 9,901 (48.9%) overlapped with SNS-seq origins in K562; 3,872 (19.1%) overlapped with OK-seq IZs; 1,163 (5.7%) overlapped with Repli-seq IZs.

      In the reciprocal direction, we asked which method best picks out the highly reproducible shared origins. 2.7% of SNS-seq origins, 17.2% of OK-seq initiation zones and 7.7% of Repli-seq initiation zones overlapped with the 20,250 shared origins

      Thus SNS-seq identifies more of the reproducible origins, but it comes with a high false positive rate.

      ORC ChIP-seq and MCM ChIP-seq data do not define origins: they define the binding sites of these proteins. Thus we have discussed why the ChIP-seq sites of these protein complexes should not be used to define origins.

      Reviewer #3 (Public Review):

      Summary: The authors present a thought-provoking and comprehensive re-analysis of previously published human cell genomics data that seeks to understand the relationship between the sites where the Origin Recognition Complex (ORC) binds chromatin, where the replicative helicase (Mcm2-7) is situated on chromatin, and where DNA replication actually beings (origins). The view that these should coincide is influenced by studies in yeast where ORC binds site-specifically to dedicated nucleosome-free origins where Mcm2-7 can be loaded and remains stably positioned for subsequent replication initiation. However, this is most certainly not the case in metazoans where it has already been reported that chromatin bindings sites of ORC, Mcm2-7, and origins do not necessarily overlap, likely because ORC loads the helicase in transcriptionally active regions of the genome and, since Mcm2-7 retains linear mobility (i.e., it can slide), it is displaced from its original position by other chromatin-contextualized processes (for example, see Gros et al., 2015 Mol Cell, Powell et al., 2015 EMBO J, Miotto et al., 2016 PNAS, and Prioleau et al., 2016 G&D amongst others). This study reaches a very similar conclusion: in short, they find a high degree of discordance between ORC, Mcm2-7, and origin positions in human cells.

      Strengths: The strength of this work is its comprehensive and unbiased analysis of all relevant genomics datasets. To my knowledge, this is the first attempt to integrate these observations and the analyses employed were suited for the questions under consideration.

      Response: Thank you for recognizing the comprehensive and unbiased nature of our analysis. The fact that the major weakness is that the comprehensive view fails to move the field forward, is actually a strength. It should be viewed in the light that we cannot find evidence to support the primary hypothesis: that the most reproducible origins must be near ORC and MCM binding sites. This finding will prevent the unwise adoption of ORC or MCM binding sites as surrogate markers of origins and will stimulate the field to try and improve methods of identifying ORC or MCM binding until the binding sites are found to be proximal to the most reproducible origins. The last possibility is that there are ORC- or MCM-independent modes of defining origins, but we have no evidence of that.

      Weaknesses: The major weakness of this paper is that this comprehensive view failed to move the field forward from what was already known. Further, a substantial body of relevant prior genomics literature on the subject was neither cited nor discussed. This omission is important given that this group reaches very similar conclusions as studies published a number of years ago. Further, their study seems to present a unique opportunity to evaluate and shape our confidence in the different genomics techniques compared in this study. This, however, was also not discussed.

      Response: We have done what the reviewer suggested: use K562 cell type-specific data where origins have been defined by three methods and reporting the percent of shared origins identified by each method (Supp. Fig. S4). Thanks for the suggestion. We have discussed now that SNS-seq identifies more of the reproducible origins, but it comes with a high false positive rate. ORC ChIP-seq and MCM ChIP-seq data do not define origins: they define the binding sites of these proteins. Thus, we have discussed that the ChIP-seq sites of these protein complexes as we now have them should not be used to define origins.

      We do not cite the SNS-seq data before 2018 because of the concerns discussed above about the earlier techniques needing improvement. We have discussed other genomics data that we failed to discuss.

      We have cited the papers the reviewer names:

      Gros, Mol Cell 2015 and Powell, EMBO J. 2015 discuss the movement of MCM2-7 away from ORC in yeast and flies and will be cited. MCM2-7 binding to sites away from ORC and being loaded in vast excess of ORC was reported earlier on Xenopus chromatin in PMC193934, and will also be cited.

      Miotto, PNAS, 2016: publishes ORC2 ChIP-seq sites in HeLa (data we have used in our analysis), but do not measure ORC1 ChIP-seq sites. They say: “ORC1 and ORC2 recognize similar chromatin states and hence are likely to have similar binding profiles.” This is a conclusion based on the fact that the ChIP seq sites in the two studies are in areas with open chromatin, it is not a direct comparison of binding sites of the two proteins.

      Prioleau, G&D, 2016: This is a review that compared different techniques of origin identification but has no primary data to say that ORC and MCM binding sites overlap with the most reproducible origins. It has now been referenced in the context of epigenetic marks and origins.

      Reviewing Editor:

      While there is some disagreement between the reviewers about the analysis performed, there are relevant concerns about the data analyzed (reviewers 1 and 2) and the biological significance of the observation (all three reviewers). There is also concern raised about the ORC ChIP-Seq data and the lack of overlap between published data for ORC1 and ORC2, which, if they were in a complex, the overlap in binding sites should be much better that reported.

      Given the high overlap of ChIP-seq data for subunits of three other complexes shown in Supp. Fig. S6A, the most likely explanation is that ORC1 and ORC2 do not necessarily bind to DNA only as part of a complex. In other words, other protein complexes that contain one subunit or the other also bind DNA. This is not entirely unexpected. Biochemically the ORC2-3-4-5 complex is more stable and more abundant than the six subunit ORC.

      Reviewer #2 (Recommendations For The Authors):

      Minor comments:

      • Line 44, missing spaces near references: "origins(Hu". Repeated issue throughout the manuscript.
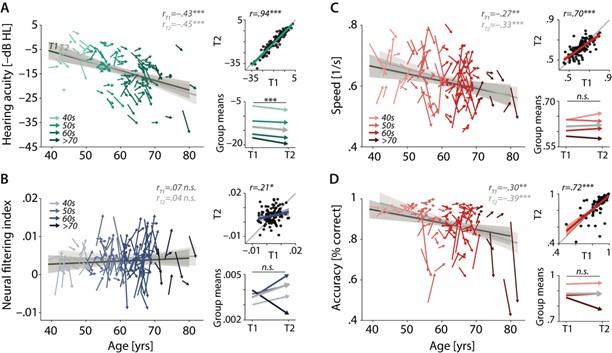
      • Line 82: "Notably any technical biases are uniquely associated with each assay" -- how do you know the biases are unique to each assay and orthogonal to each other?

      • Line 135: typo: "using pipeline"

      • Line 136: "All the 113 datasets" -> "Each of the 113 datasets"?

      • Line 156: "differences among different techniques" -> "different" can be removed.

      • Figure 4F: I don't see any difference in 4F amongst shared *. What is the y-axis anyways?

      We have addressed these issues in the revised manuscript.
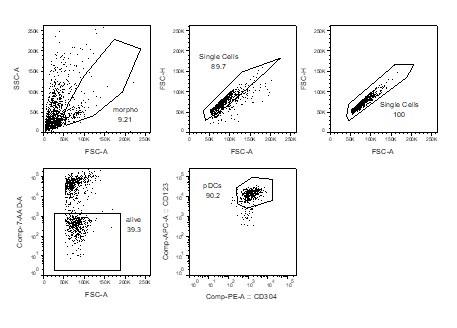
      Reviewer #3 (Recommendations For The Authors):

      The most significant omission is a contextualization of the results in the discussion and an explanation of why these results matter for the biology of replication, disease, and/or our confidence in the genomic techniques reported on in this study. As written, the discussion simply restates the results without any interpretation towards novel insight. I suggest that the authors revise their discussion to fill this important gap.

      A second important, unresolved point is whether replication origins identified by the various methods differ due to technical reasons or because different cell types were analyzed. Given the correlation between TSS and origins (reported in this study but many others too), it is somewhat expected that origins will differ between cell types as each will have a distinct transcriptional program. This critique is partly addressed in Figure S1C. However, given the conclusion that the techniques are only rarely in agreement (only 0.27% origins reproducibly detected by the four techniques), a more in-depth analysis of cell type specific data is warranted. Specifically, I would suggest that cell type-specific data be reported wherever origins have been defined by at least two methods in the same cell type, specifically reporting the percent of shared origins amongst the datasets. This type of analysis may also inform on whether one or more techniques produces the highest (or lowest) quality list of true origins.

      We have done what has been suggested: used K562 cell type-specific data because here the origins have been defined by at least two methods in the same cell type, and reported the percent of shared origins amongst the datasets (Supp. Fig. S4).

      Other MINOR comments include:

      • Line 215: the authors show that shared origins overlap with TF binding hotspots more often than union origins, which they claim suggests "that they are more likely to interact with transcription factors." As written, it sounds like the authors are proposing that ORC may have some direct physical interaction with transcription factors. Is this intended? If so, what support is there for this claim?

      The reviewer is correct. We have rephrased because we have no experimental support for this claim.

      • In the text, Figure 3G is discussed before Figure 3F. I suggest switching the order of these panels in Figure 3.

      Done.

      • It's not clear what Figure 5H to Figure 6 accomplishes. What specifically is added to the story by including these data? Is there something unique about the high confidence origins? If there is nothing noteworthy, I would suggest removing these data.

      We want to keep them to highlight the small number of origins that meet the hypothesis that ORC and MCM must bind at or near reproducible origins. These would be the origins that the field can focus in on for testing the hypothesis rigorously. They also show the danger of evaluating proximity between ORC or MCM binding sites with origins based on a few browser shots. If we only showed this figure we could conclude that ORC and MCM binding sites are very close to reproducible origins.

      • Line 394: "Since ORC is an early factor for initiating DNA replication, we expected that shared human origins will be proximate to the reproducible ORC binding sites." This is only expected if one disbelieves the prior literature that shows that ORC and origins are not, in many cases, proximal. This statement should be revised, or the previous literature should be cited, and an explanation provided about why this prior work may have missed the mark.

      We do not know of any genome-wide study in mammalian cell lines where ORC binding sites and MCM binding have been compared to highly reproducible origins, or that show that these binding sites and highly reproducible origins are mostly not proximal to each other. Most studies cherry pick a few origins and show by ChIP-PCR that ORC and/or MCM bind near those sites. Alternatively, studies sometimes show a selected browser shot, without a quantitative measure of the overlap genome wide and without doing a permutation test to determine if the observed overlap or proximity is higher than what would be expected at random with similar numbers of sites of similar lengths. In the revised manuscript we have discussed Dellino, 2013; Kirstein, 2021; Wang, 2017; Mas, 2023. None of them have addressed what we are addressing, is the small subset of the most reproducible origins proximal to ORC or MCM binding sites?

      • Line 402-404: given the lack of agreement between ORC binding sites and origins the authors suggest as an explanation that "MCM2-7 loaded at the ORC binding sites move much further away to initiate origins far from the ORC binding sites, or that there are as yet unexplored mechanisms of origin specification in human cancer cells". The first part of this statement has been shown to be true (Mcm2-7 movement) and should be cited. But what do the authors mean by the second suggestion of "unexplored mechanisms"? Please expand.

      We have addressed this point in the revised manuscript.
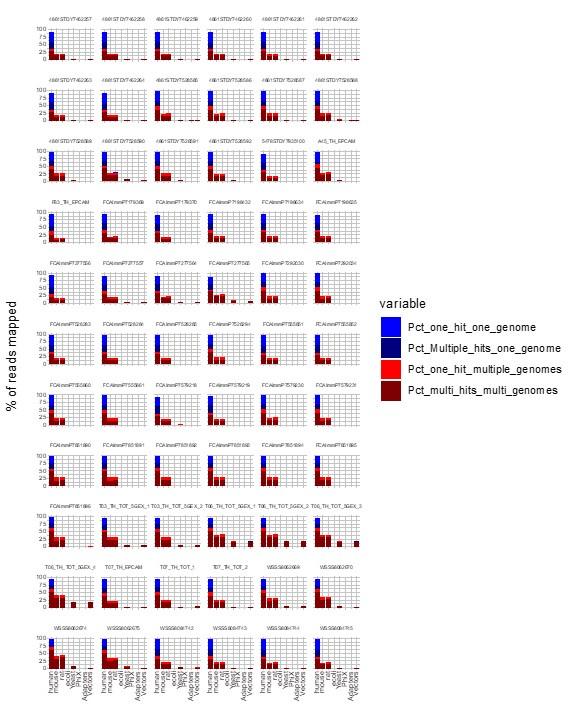
      • The authors should better reference and discuss the previous literature that relates to their work, some of these include Gros et al., 2015 Mol Cell, Powell et al., 2015 EMBO J, Miotto et al., 2016 PNAS, but likely there are many others.

      We have addressed this point in the revised manuscript.
    1. Author Response

      The following is the authors’ response to the original reviews.

      We are very grateful for your time and efforts spent on our manuscript. Your feedback has been very valuable. Please see below a point-by-point response to each suggestion and actions taken to address each point in the manuscript.
      eLife assessment

      In this fundamental study, the authors propose analytical methods for inferring evolutionary parameters of interest from sequencing data in healthy tissue relevant to hematopoiesis. By combining analyses of single cell and bulk sequencing data, the authors can use a stochastic process to inform different aspects of genetic heterogeneity. The strength of evidence in support of the authors' claim is thus compelling. The work will be of broad interest to cell biologists and theoretical biologists.

      Public Reviews:

      Reviewer #1 (Public Review):

      Summary:

      Authors propose mathematical methods for inferring evolutionary parameters of interest from bulk/single cell sequencing data in healthy tissue and hematopoiesis. In general, the introduction is well-written and adequately references the relevant and important previous literature and findings in this field (e.g. the power laws for well-mixed exponentially growing populations). The authors consider 3 phases of human development: early development, growth and maintenance, and mature phase. In particular, time-dependent mutation rates in Figure 2d is an intriguing and strong result, and the process underlying Figures 3 and 4 are generally wellexplained and convincing.

      Thank you for your positive comments.

      Notes & suggestions:

      1. The explanation of Figure 2 in Lines 101 - 111 should be expanded for clarity. First, is Figure 2a derived from stochastic simulation (line 101 suggests) or some theoretical analysis? Second, the gradual transition from f-2 to f-1 is appreciated, but the shape of the intermediates is not addressed in detail. The power laws are straight lines, and the simulations provide curved lines -- please expand in what range (low or high frequency variants) the power law approximations apply.

      Figure 2a was obtained from a numerical solution of equation 1, which describes the time dynamics of the expected VAF distribution. This is indeed unclear from the text, and we thank the reviewer for pointing out this discrepancy.

      We thank the reviewer for this suggestion and have now adjusted this in the text (102-110):

      “Numerical solutions of Eq.(1) show that the expected VAF distribution exhibits a gradual transition from the f-2 (growing population) to the f-1 (constant population) power law (Fig.2). These transitional states themselves do not adhere to some intermediate power-law (e.g. f for 1<<2), but instead present a sigmoidal shape, with the low frequency portion following f-1 and the high frequencies f-2 . Over time the shape changes as a wavelike front traveling from low to high frequency, with the constant-size equilibrium establishing earliest at the lowest frequencies and moving to higher frequency over time. Interestingly, the convergence towards equilibrium slows down over time -- for evenly-spaced observation times the solutions lie increasingly closer together -- further decreasing the speed at which the high frequency portion of the spectrum approaches equilibrium.”

      We also changed the caption of Figure 2 to make this clearer as

      “(a) Expected VAF distributions from evolving Eq1 to different time points for a population with an initial exponential growth phase and subsequent constant population phase (mature size N=103). Once the population reaches the maximum carrying capacity, the distribution moves from a 1/f2 growing population shape (purple) to a 1/f constant population shape (green). Note that the shift slows considerably at older age.”

      In addition, we have also added annotations to Figure 2a and 2b to further clarify which line (green or purple) is f-1 and f-2.

      Additionally, I do not understand the claim in line 108, that the transition is fast for low frequency variants, as the low frequency (on the left of the graph) lines are all close together, whereas the high frequency lines are far apart.

      The lines are closer together in the low frequency portion (left of the plot) because they are already very close to the constant-size equilibrium (f-1/green line) and these frequencies approached equilibrium very fast. On the contrary, in the high frequency portion (right side of plot) they are still very far from equilibrium and approached equilibrium much slower.

      It would be helpful to reiterate in this paragraph that these power laws are derived based on exponentially growing populations and are expected to break down under homeostatic conditions.

      We have adjusted the relevant paragraph in the text to make the validity of the power laws clearer (90-94):

      “For a well-mixed exponentially growing population without cell death the VAF spectrum 𝑣(𝑓) is given by 2𝜇/(𝑓 + 𝑓2 )$ (a 𝑓−2 power law) and is independent of time. In contrast, for a population of constant size – i.e. where birth and death rates are equal – the spectrum obeys 𝑣(𝑓) ∝ 2𝜇/ 𝑓 (a 𝑓−1 power law; see also SI), though this solution is only valid at sufficiently long times.”

      1. The sample vs population (blue vs orange) in Figure 3 is under-explained. How is it that the mutational burden and inferred mutation rate in A and B roughly match, but the VAF distributions in C are so different? How was the sampled set chosen? Perhaps this is an unimportant distinction based on the particular sample set, but the divergence of the two in C may serve as a distraction, here.

      This is an important question, and the answer was perhaps underemphasized in the caption. The sampling was performed as a uniform random sampling with replacement, and the same sample set was used for both the mutational burden and the VAF distribution. The reason for this stark contrast is that while the expectation of the burden distribution is not affected by sampling (i.e. sampling only affects the resolution/amount of stochasticity), the expectation of the VAF distribution changes due to sampling. While this was discussed in the section "Sparse sampling, single cell derived VAF spectra and evolutionary inferences", we have added note of this (indeed surprising) effect in the caption as well:

      “(b) Distribution of estimated mutation rates from 10'000 individual simulations, obtained from burden distributions of the complete populations (blue) as well as sampled sets of cells (orange). Because the expected mutational burden distribution is unaltered by sampling, the expected estimate of the mutation rate from (5) remains unchanged: 𝐸(𝜇̃𝑝𝑜𝑝) = 𝐸(𝜇̃𝑠𝑎𝑚𝑝𝑙𝑒). However, sampling increases the noise on the observed burden distribution, which results in a higher errormargin of the estimate: 𝜎(𝜇̃𝑝𝑜𝑝) < 𝜎(𝜇̃𝑠𝑎𝑚𝑝𝑙𝑒).”

      “(c) VAF spectra measured in the complete population (blue) and a sampled set of cells (orange). In contrast with the mutational burden distribution, strong sampling changes the shape of the expected distribution. A single simulation result is shown (diamonds) alongside the theoretically predicted expected values for both the total and sampled populations (Eqs. (1) and (6))(dashed line) and the average across 100 simulations (solid line).”

      1. The comparison of results herein to claims by Mitchell (ref. 12) are quite important results within the paper. I appreciate the note in the final paragraph of the discussion, and I suggest adding a sentence referencing the result noted in line 248-249 to the abstract, as well.

      We agree with the reviewer. We have extended the abstract now to reference the result in more detail:

      “However, the single cell mutational burden distribution is over-dispersed compared to a model of Poisson distributed random mutations suggesting. A time-associated model of mutation accumulation with a constant rate alone cannot generate such a pattern. At least one additional source of stochasticity would be needed. Possible candidates for these processes may be occasional bursts of stem cell divisions, potentially in response to injury, or non-constant mutation rates either through environmental exposures or cell intrinsic variation.”

      Reviewer #2 (Public Review):

      Summary: The authors provide a nice summary on the possibility to study genetic heterogeneity and how to measure the dynamics of stem cells. By combining single cell and bulk sequencing analyses, they aim to use a stochastic process and inform on different aspects of genetic heterogeneity.

      Strengths: Well designed study and strong methods

      Thank you for your positive comments.

      Weaknesses: Minor

      Further clarification to Figure 3 legend would be good to explain the 'no association' of number of samples and mutational burden estimate as per line 180-182 p.8.

      We have added a note to the caption of Figure 3b to explain more clearly how sampling affects the burden distribution and the mutation rate inferred from it (see also previous response to Reviewer 1):

      “Because the expected mutational burden distribution is unaltered by sampling, the expected estimate of the mutation rate from (5) remains unchanged: 𝐸(𝜇̃𝑝𝑜𝑝) = 𝐸(𝜇̃𝑠𝑎𝑚𝑝𝑙𝑒). However, sampling increases the noise on the observed burden distribution, which results in a higher errormargin of the estimate: 𝜎(𝜇̃𝑝𝑜𝑝) < 𝜎(𝜇̃𝑠𝑎𝑚𝑝𝑙𝑒).”

      Reviewer #1 (Recommendations For The Authors):

      Minor/editorial suggestions:

      1. Equation 1, please define \partial_t and \partial_K, for clarity.

      These have now been defined in the text (between line 85-86): “where 𝜅 = 𝑓𝑁(𝑡) denotes the number of cells sharing a variant (the variant frequency f times the total population size N), 𝛿(x) is the Dirac impulse function, 𝜕𝑡 and 𝜕𝜅 are the partial derivatives with respect to time and variant size.”

      1. Figure 2: It would be helpful to label the green and purple lines with the corresponding 1/f and 1/f^2 rule, in addition to the growing/fixed label, for clarity.

      We agree and have now added the corresponding labels to each line.

      Reviewer #2 (Recommendations For The Authors):

      Minor suggestions are given below:

      It would be nice for the authors to comment on whether the results could be extended/modified to account for possible fitness advantage of mutations which would be clinically relevant, for instance in the case of CHIP mutations and difference in time to myeloid malignancies transformation between CHIP/No CHIP individuals.

      This is an important point. We agree with the reviewer that CHIP mutations play an important role in shaping mutational diversity especially in older individuals. Evidence is now emerging that CHIP mutations are almost universally present in individuals 60+. Interestingly, in individuals younger than 60, a neutral model (as presented here), does capture the observed effective dynamics well. For the purpose of the analysis underlying this manuscript, a neutral model seems reasonable.

      The techniques we use here can be adjusted to include selection. How the results extend or modify will critically depend on the actual model of selection (rare or frequent CHIP mutations, strong vs weak selection etc.) that is realized in human hematopoiesis. Here we would say, the underlying biology currently is mostly unknown and is subject to (by others and in part by us) ongoing investigations, which extend beyond the scope of this manuscript.
      We now make note of this point in the manuscript and added a small paragraph in page 11 to the discussion:

      “Another open question is the role of selection and how it shapes intra-tissue genetic heterogeneity. Evidence is emerging that positively selected variants in blood are almost universally present in individuals above 60, while the effective observable dynamics in younger individuals is well described by neutral dynamics. How results presented here generalize or modify will critically depend on the model of selection realized in human hematopoiesis, e.g. a models of rare or frequent driver events. Details of the underlying biology are currently unknown.”

      It would be nice to see if any significant differences in parameter estimates occur between loci with/without linkage disequilibrium, for instance HLA region. Could the number of single-cell samples be 'more' relevant when studying the VAF distribution in HLA region?

      This is a good suggestion. We might be wrong or missing an important point, but somatic evolution as we use it in our modeling here is solely driven by asexual reproduction of cells. As such the entire genome of the cell is in linkage disequilibrium, independent of the precise genomic region (somatic evolution is in first approximation blind to germline mutations, as they are present in every single cell of the organism and therefore do not carry any information on the somatic evolutionary dynamics).

      We thank all editors and reviewers again for your constructive comments.

    1. Author Response

      I would like to express my thorough gratitude to the editors and reviewers, for the helpful comments and valuable suggestions, which provided us an opportunity to further address our research. Prior to submitting our final revision, here we provide our preliminary responses for the comments. Please find our detailed responses to the reviewers’ recommendations below.

      Reviewer #1 (Public Review):

      Summary:

      The authors were trying to understand the relationship between the development of large trunks and longirrostrine mandibles in bunodont proboscideans of Miocene, and how it reflects the variation in diet patterns.

      Strengths:

      The study is very well supported, written, and illustrated, with plenty of supplementary material. The findings are highly significant for the understanding of the diversification of bunodont proboscideans in Asia during Miocene, as well as explaining the cranial/jaw disparity of fossil lineages. This work elucidates the diversification of paleobiological aspects of fossil proboscideans and their evolutionary response to open environments in the Neogene using several methods. The authors included all Asian bunodont proboscideans with long mandibles and I suggest that they should use the expression "bunodont proboscideans" instead of gomphotheres.

      Weaknesses:

      I believe that the only weakness is the lack of discussion comparing their results with the development of gigantism and long limbs in proboscideans from the same epoch.

      Response: Thank you for your comprehensive review and positive feedback on our study regarding the co-evolution of feeding organs in bunodont proboscideans during the Miocene. We appreciate your suggestion, and have decided to use the term "bunodont elephantiforms" (for more explicit clarification, we use elephantiforms to exclude some early proboscideans, like Moeritherium, ect.) instead of "gomphotheres," and we will make this change in our revised manuscript. We also appreciate the potential weakness you mentioned regarding the lack of discussion comparing our results with the development of gigantism and long limbs in proboscideans from the same epoch. We agree with the reviewer’s suggestion, and we are aware that gigantism and long limbs are potential factors for trunk development. Gigantism resulted in the loss of flexibility in elephantiforms, and long limbs made it more challenging for them to reach the ground. A long trunk serves as compensation for these limitations. limb bones were rare to find in our material, especially those preserved in association with the skull.
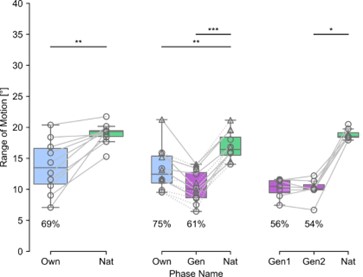
      Reviewer #2 (Public Review):

      This study focuses on the eco-morphology, the feeding behaviors, and the co-evolution of feeding organs of longirostrine gomphotheres (Amebelodontidae, Choerolophodontidae, and Gomphotheriidae) which are characterised by their distinctive mandible and mandible tusk morphologies. They also have different evolutionary stages of food acquisition organs which may have co-evolve with extremely elongated mandibular symphysis and tusks. Although these three longirostrine gomphothere families were widely distributed in Northern China in the Early-Middle Miocene, the relative abundances and the distribution of these groups were different through time as a result of the climatic changes and ecosysytems.

      These three groups have different feeding behaviors indicated by different mandibular symphysis and tusk morphologies. Additionally, they have different evolutionary stages of trunks which are reflected by the narial region morphology. To be able to construct the feeding behavior and the relation between the mandible and the trunk of early elephantiformes, the authors examined the crania and mandibles of these three groups from the Early and Middle Miocene of northern China from three different museums and also made different analyses.

      The analyses made in the study are:

      1. Finite Element (FE) analysis: They conducted two kinds of tests: the distal forces test, and the twig-cutting test. With the distal forces test, advantageous and disadvantageous mechanical performances under distal vertical and horizontal external forces of each group are established. With the twig-cutting test, a cylindrical twig model of orthotropic elastoplasity was posed in three directions to the distal end of the mandibular task to calculate the sum of the equivalent plastic strain (SEPS). It is indicated that all three groups have different mandible specializations for cutting plants.

      2. Phylogenetic reconstruction: These groups have different narial region morphology, and in connection with this, have different stages of trunk evolution. The phylogenetic tree shows the degree of specialization of the narial morphology. And narial region evolutionary level is correlated with that of character-combine in relation to horizontal cutting. In the trilophodont longirostrine gomphotheres, co-evolution between the narial region and horizontal cutting behaviour is strongly suggested.

      3. Enamel isotopes analysis: The results of stable isotope analysis indicate an open environment with a diverse range of habitats and that the niches of these groups overlapped without obvious differentiation.

      The analysis shows that different eco-adaptations have led to the diverse mandibular morphology and open-land grazing has driven the development of trunk-specific functions and loss of the long mandible. This conclusion has been achieved with evidence on palaecological reconstruction, the reconstruction of feeding behaviors, and the examination of mandibular and narial region morphology from the detailed analysis during the study.

      All of the analyses are explained in detail in the supplementary files. The 3D models and movies in the supplementary files are detailed and understandable and explain the conclusion. The conclusions of the study are well supported by data.

      Response: We appreciate your detailed and insightful review of our study. Your summary accurately captures the essence of our research, and we are pleased to note that multiple research methods were used to demonstrate our conclusions. Your recognition of the evidence-based conclusions from palaeoecological, feeding behavior reconstruction, and morphological analyses reinforces the validity of our findings. Once again, we appreciate your time and thoughtful reviews.

    1. Author Response

      Reviewer #1 (Public Review):

      Summary:

      This study presents careful biochemical experiments to understand the relationship between LRRK2 GTP hydrolysis parameters and LRRK2 kinase activity. The authors report that incubation of LRRK2 with ATP increases the KM for GTP and decreases the kcat. From this, they suppose an autophosphorylation process is responsible for enzyme inhibition. LRRK2 T1343A showed no change, consistent with it needing to be phosphorylated to explain the changes in G-domain properties. The authors propose that phosphorylation of T1343 inhibits kinase activity and influences monomer-dimer transitions.

      Strengths: The strengths of the work are the very careful biochemical analyses and the interesting result for wild-type LRRK2.

      Weaknesses:

      A major unexplained weakness is why the mutant T1343A starts out with so much lower activity--it should be the same as wild-type, non-phosphorylated protein. Also, if a monomer-dimer transition is involved, it should be either all or nothing. Other approaches would add confidence to the findings.

      We thank the reviewer for these suggestions. We are aware that the T1343A has generally a lower activity compared to the wild type. Therefore, we would like to emphasize that this mutant is the only one not showing an increase in Km values after ATP treatment. Other mutants, also having lower kcat values like T1503A, still show this characteristic change in Km. Our favored explanation for the lower kcat of T1343A is that this mutation lays within a critical region, the so-called ploop, of the Roc domain and is very likely structurally not neutral. Concerning the dimer-monomer transition, we are convinced that there is more than one factor involved in this equilibrium. Most likely, including, but not limited to other LRRK2 domains (e.g. the WD40 domain), binding of co-factors (e.g. Rab29/Rab32 or 14-3-3) and membrane binding. Consistently, also n with stapled peptides targeting the Roc or Cor domains we were not able to shift the equilibrium completely to the monomer (Helton et al., ACS Chem Biol. 2021, 16:2326-2338; Pathak et al. ACS Chem Neurosci. 2023, 14(11):1971-1980) We will address these points in a revised version of the manuscript.

      Reviewer #2 (Public Review):

      This study addresses the catalytic activity of a Ras-like ROC GTPase domain of LRRK2 kinase, a Ser/Thr kinase linked to Parkinson's disease (PD). The enzyme is associated with gain-of-function variants that hyper-phosphorylate substrate Rab GTPases. However, the link between the regulatory ROC domain and activation of the kinase domain is not well understood. It is within this context that the authors detail the kinetics of the ROC GTPase domain of pathogenic variants of LRRK2, in comparison to the WT enzyme. Their data suggest that LRRK2 kinase activity negatively regulates the ROC GTPase activity and that PD variants of LRRK2 have differential effects on the Km and catalytic efficiency of GTP hydrolysis. Based on mutagenesis, kinetics, and biophysical experiments, the authors suggest a model in which autophosphorylation shifts the equilibrium toward monomeric LRRK2 (locked GTP state of ROC). The authors further conclude that T1343 is a crucial regulatory site, located in the P-loop of the ROC domain, which is necessary for the negative feedback mechanism. Unfortunately, the data do not support this hypothesis, and further experiments are required to confirm this model for the regulation of LRRK2 activity.

      Specific comments are below:

      • Although a couple of papers are cited, the rationale for focusing on the T1343 site is not evident to readers. It should be clarified that this locus, and perhaps other similar loci in the wider ROCO family, are likely important for direct interactions with the GTP molecule.

      To clarify this point: We, have not only have focused on this specific locus, but instead systematically mutated all known auto-phosphorylation sites with the RocCOR domain (see. supplemental information). Furthermore, it has been shown that this site, at least in the RCKW (Roc to WD40) construct, is quantitatively phosphorylated (Deniston et al., Nature 2020, 588:344-349). We are aware that the T1343 residue is located within the p-loop and that this can impact nucleotide binding capacities (see response to reviewer 1). We will clarify and address these points in a revised version of the manuscript.

      • Similar to the above, readers are kept in the dark about auto-phosphorylation and its effects on the monomer/dimer equilibrium. This is a critical aspect of this manuscript and a major conceptual finding that the authors are making from their data. However, the idea that auto-phosphorylation is (likely) to shift the monomer/dimer equilibrium toward monomer, thereby inactivating the enzyme, is not presented until page 6, AFTER describing much of their kinetics data. This is very confusing to readers, as it is difficult to understand the meaning of the data without a conceptual framework. If the model for the LRRK2 function is that dimerization is necessary for the phosphorylation of substrates, then this idea should be presented early in the introduction, and perhaps also in the abstract. If there are caveats, then they should be discussed before data are presented. A clear literature trail and the current accepted (or consensus) mechanism for LRRK2 activity is necessary to better understand the context for these data.

      We agree on the reviewer’s opinion. We will address this point in a revised version of the manuscript.

      • Following on the above concepts, I find it interesting that the authors mention monomeric cytosolic states, and kinase-active oligomers (dimers??), with citations. Again here, it would be useful to be more precise. Are dimers (oligomers?) only formed at the membrane? That would suggest mechanisms involving lipid or membrane-attached protein interactions. Also, what do the authors mean by oligomers? Are there more than dimers found localized to the membrane?

      There are multiple studies that have shown that LRRK2 is mainly monomeric in the cytosol while it forms mainly dimeric or higher oligomeric states at membrane (James et al., Biophys. J. 2012, 102, L41–L43; Berger et al., Biochemistry, 2010, 49, 5511–5523). However, we agree with the reviewer that it remains to be determined if the dimeric form is the most active state at the membrane, or a higher oligomeric state. Especially since a recent study shows that LRRK2 can form active tetramers only when bound to Rab29 (Zhu et al., bioRxiv, 2022, DOI: 10.1101/2022.04.26.489605). We will clarify and address these points in the introduction of a revised version of the manuscript.

      • Fig 5 is a key part of their findings, regarding the auto-phosphorylation induced monomer formation of LRRK2. From these two bar graphs, the authors state unequivocally that the 'monomer/dimer equilibrium is abolished', and therefore, that the underlying mechanism might be increased monomerization (through maintenance of a GTP-locked state). My view is that the authors should temper these conclusions with caveats. One is that there are still plenty of dimers in the auto-phosphorylated WT, and also in the T1343A mutant. Why is that the case? Can the authors explain why only perhaps a 10% shift is sufficient? Secondly, the T1343A mutant appears to have fewer overall dimers to begin with, so it appears to readers that 'abolition' is mainly due to different levels prior to ATP treatment at 30 deg. I feel these various issues need to be clarified in a revised manuscript, with additional supporting data. Finally, on a minor note, I presume that there are no statistically significant differences between the two sets of bar graphs on the right panel. It would be wise to place 'n.s.' above the graphs for readers, and in the figure legend, so readers are not confused.

      Starting with the monomer-dimer equilibrium we are convinced that there is more than the phosphorylation of T1343 (see response to reviewer 1). Therefore a 10% shift in our assay most likely underestimate the effect seen in cells.

      Consistently, the T1343A mutants show a similar increase in Rab10 phosphorylation assay as the G2019S mutant. This thus shows that the identified feedback mechanism plays an important role in a cellular context. We will explain this in more detail in a revised version of the manuscript. Concerning the bar diagram, we will add the “n.s.” indication in a future version of the manuscript.

      • Figure 6B, Westerns of phosphorylation, the lanes are not identified and it is unclear what these data mean.

      We apologize for this mistake and will add the correct labeling in a revised version of the manuscript.

    1. Author Response:

      Reviewer #1 (Public Review):

      [...] Major concerns/weakness:

      1) All the results in Fig. 2 utilized two glioma lines SF188 and Res259. The authors should repeat all these experiments in a couple of H3.3K27M DMG lines by deleting the H3.3K27M mutation first.

      We thank the referee for his/her comments that will help us to strengthen our conclusions.

      The reviewer's proposal is interesting, but this approach to deletion of the K27M mutation rather answers the question of the role of the BMP pathway in maintaining the phenotype of DMG cells. Our aim in the first part of this article (with Res and SF188) is rather to study how the BMP pathway can participate in installing a particular cellular state at the time of expression of the K27M mutation. In other words, the underlying idea is to define the phenotypic changes specifically associated with activation of the BMP pathway when epigenetic modifications are induced by expression of the K27M mutation. We have chosen the SF188 and Res259 models to remain in a glial context, but it would indeed be interesting to test the effect of this synergy in other models, closer to the cells of origin of DMG. In any case, these models should make it possible to answer the question of the cellular state transition at the moment of K27M expression, even if the reciprocal question of the reversibility of this state proposed by the reviewer is also of interest for understanding the oncogenic synergy between BMP/K27M.

      2) Fig. 3. The experiments of BMP2 treatment should be repeated in other H3.3K27M DMG lines using H3.1K27M ACVR1 mutant tumor lines as controls.

      We will provide the results of these experiments in a revised version. The use of mutant ACVR1 lines is interesting, but their control status seems questionable, as the addition of BMPs could have a cumulative effect on the effect of the mutation, notably by activating other receptors in the pathway.

      Minor concerns:

      Fig.2A. BMP2 expression increased in H3.3K27M SF188 cells. Therefore, the statement "whereas BMP2 and BMP4 expressions are not significantly modified (Figure 2A and Figure 2-figure supplement A-B)" is not accurate.

      The referee is absolutely right and we will correct this statement in the revised version.

      Reviewer #2 (Public Review):

      [...] The paper is well-written and easy to follow with a robust experimental plan and datasets supporting the claims. While previous work (acknowledged by the authors) indicated activation of BMP in H3K27M tumors, wild type for the ACVR1 mutation this paper is a nice addition and provides further mechanistic cues as to the importance of the BMP pathway and specific members in these deadly brain cancers. The effect of these BMPs in quiescence and invasion is of particular interest.

      We thank the referee for his/her supportive comments.

      A few suggestions to clarify the message are provided below:

      1- In thalamic diffuse midline gliomas, the BMP pathway should not be activated as it is in the pons. The authors should identify thalamic tumors in the datasets they explored and patients-derived cell lines from thalamic tumors available to investigate whether this pathway is active across all H3.3K27M mutants in the brain midline or specifically in tumors from the pons.

      The referee's question is an interesting one, and we will try to see if we can determine tumor’s location from the public data we've used. We will nevertheless try to determine whether the inter-patient variability observed in the level of activation of the BMP pathway may be due, in particular, to different tumor locations.

      2 - There are ~20% H3.3K27M tumors that carry an ACVR1 mutation and similar numbers of H3.1K27M that are wild type for this gene. Can the authors identify these outliers in their datasets and assess the activation of BMP2 and 7 or other BMP pathway members in this context?

      Indeed, defining the level of activation of the pathway in this type of H3.3K27M ACVR1 mutant or H3.1K27M ACVR1 wt tumors would be extremely interesting, but no samples of this type are a priori included in the datasets analyzed. Instead, we will try to define the phenotype of cell lines of this type in response to BMP.

    1. Author Response

      The following is the authors’ response to the original reviews.

      Reviewer #1 (Public Review):

      1. The manuscript study would be improved by further discussion of the mechanistic relationship between this class of sex-biased DHS and the other 2/3 of liver DHS that also show male-biased accessibility but whose chromatin does not respond directly to GH-stimulated STAT5.

      Response: We added a new paragraph to the Discussion (lines 608-618) discussing our novel finding that sex-biased H3K36me3 marks uniquely distinguish Static sex-biased DHS from Dynamic sex-biased DHS (see Fig. 6C) in light of a recent study in a different biological system showing that H3K36me3 marks comprise an important mechanism for maintaining cell type-specific identity by inhibiting the spread of H3K27me3 repressive marks at cell type-specific enhancers [Nat Cell Biol, 25 (2023) 1121-1134]. Further, we now discuss the potential mechanistic significance of this mark in insuring the sex-biased chromatin accessibility at Static sex-biased DHS:

      “Finally, we discovered that sex-biased H3K36me3 marks are a unique distinguishing feature of static sex-biased DHS, with male-biased H3K36me3 marks being highly enriched at static male-biased DHS but not at dynamic male-biased DHS, and female-biased H3K36me3 marks highly enriched at static female-biased DHS (Fig. 6C). H3K36me3 marks are classically associated with the demarcation of actively transcribed genes [50] but are also used to maintain cell type identity by inhibiting the spread of H3K27me3 repressive marks at cell type-specific enhancers [35, 51]. The enrichment of H3K36me3 marks at static male-biased DHS described here could thus be an important mechanism to maintain sex-dependent hepatocyte identity by keeping static male-biased enhancers constitutively open and free of H3K27me3 repressive marks in male liver, and similarly for H3K36me3 marks enriched at static female-biased DHS in female liver. Further study is needed to elucidate the underlying mechanisms whereby these and the other sex-specific histone marks discussed above are deposited on chromatin in a sex-dependent and site-specific manner and the roles that GH plays in regulating these epigenetic events”.

      1. Previous studies, including those in the Waxman lab (PMIDs: 26959237, 18974276, 35396276) suggest castration of males or gonadectomy of both sexes eliminates most sex differences in mRNA expression in mouse liver, and/or that androgens such as DHT or testosterone administered in adulthood potentially reverses the effects of gonadectomy and/or masculinizes liver gene expression. It is not clear from the present discussion whether the GH/STAT5 cyclic effects to masculinize chromatin status require the presence of androgens in adulthood to masculinize pituitary GH secretion. Are there analyses of the present (or past) data that might provide evidence about a dual role for GH and androgen acting on the same genes? For example, are sex-biased DHS bound by androgen-dependent factors or show other signs of androgen sensitivity? Are histone marks associated with DHS regulated by androgens? Moreover, it would help if the authors indicate whether they believe that the "constitutive" static sex differences in the larger 2/3 set of male-biased DHS are the result of "constitutive" (but variable) action of testicular androgens in adulthood. Although the present study is nicely focused on the GH pulse-sensitive DHS, is there mechanistic overlap in sex-biasing mechanisms with the larger static class of sex-biased liver DHS?

      Response: The Reviewer poses an intriguing set of question regarding the potential role of androgens in directly regulating, perhaps by working together with GH or GH-activated STAT5 at the level of chromatin, to co-regulate the set of Static male-biased DHS. We have now addressed these questions in full in a new Discussion paragraph, entitled, “Pituitary GH secretory patterns vs. gonadal steroids as regulators of sex-biased liver chromatin accessibility and gene expression” (lines 640-661), as follows:

      “While testosterone has a well-established role in programming hypothalamic control of pituitary GH secretory patterns [9-11], it is also possible that androgens and estrogens could regulate sex differences in hepatocytes directly at the epigenetic or transcriptional level. However, our findings support the proposal that plasma GH patterns, and not gonadal steroids, dominate epigenetic control of liver sex differences. First, the ability of a single exogenous plasma GH pulse to rapidly reopen dynamic male-biased DHS closed by hypophysectomy – in the face of ongoing ablation of pituitary stimulated gonadal steroid production and secretion – implicates GH signaling per se in the direct regulation of chromatin accessibility for this class of male-biased DHS. Second, GH regulates the sex bias of static male-biased DHS as well, as evidenced by their widespread closure in male liver following continuous GH infusion (Table S2E). It is important to note, however, that hepatocyte-specific knockout of androgen receptor (AR) does, in fact, dysregulate ~15% of sex-biased genes, albeit with a much lower effect size than global AR knockout [52] due to the systemic disruption of the somatotropic axis and circulating GH secretory profiles [53, 54]. Conceivably, AR could regulate these genes by a direct binding mechanism, acting either alone or in concert with GH-activated STAT5 to keep chromatin open constitutively at a subset of static male-biased DHS, of which 32% undergo at least partial closure in male liver following hypophysectomy (Fig. 4C). Estrogen receptor (ERa) likely plays only a minor role in regulating sex-biased liver DHS enhancers, given the lack of effect of hepatocyte-specific ERa knockout on sex-biased liver gene expression [22] and our finding that only 12% of static female-biased DHS close in female liver following hypophysectomy, which decreases circulating estradiol levels [55].”.

      Reviewer #2 (Public Review):

      The Reviewer did not raise any points of criticism.

      Reviewer #2 Recommendations:

      Line 121. "highly enriched for genes of the corresponding sex bias" is unclear. Does this mean that the genes near the DHS have the same bias in level of transcription as the bias in open chromatin? Please clarify.

      Response: Text was changed to: “were highly enriched for mapping to genes showing the corresponding sex bias in the level transcription, but not for genes whose expression shows the opposite sex bias”.

      Line 161. "STAT5 activity-dependent patterns" seems not to be supported by the data. The patterns correlate with STAT5 activity, but the authors can't conclude that they depend on STAT5 activity based on these data alone.

      Response: Text was changed to: “patterns of DNase-released fragments that correlate with STAT5 activity”

      Line 171. "identify genomic regions where chromatin dynamically opens or closes in male mouse liver in response to GH pulse activation of STAT5" This statement assumes a causal relationship between STAT5 and the status of differential sites. The data do not support this assumption of causality, because the data correlate STAT5 with status of the differential sites.

      Response: Text was changed to: “identify genomic regions where chromatin dynamically opens or closes in male mouse liver in close association with GH pulse activation of STAT5”.

      Line 176. The "binary pattern" in figure 2D seems not to be as binary as the authors suggest. The blue and red samples overlap in their distribution, and the lower green samples are intermediate between most of the blue and red samples. The "arbitrary" dotted line suggests the binary status, but this line is less convincing because it is arbitrary and drawn by eye; some samples don't obey the binary dichotomy.

      Response: Text was changed to: “This pattern, where individual male mouse livers largely show either high or low DNase-seq read count distributions at the top differential genomic sites, was also seen…”.

      Line 224 "independent" also implies causality.

      Response: No changes were made.

      Line 284. The effects of hypophysectomy on liver chromatin accessibility is attributed here to the loss of GH secretions. Hypophysectomy will also reduce testicular androgen secretion. To what extent can the results of Hypox be attributed to STAT5-dependent mechanisms as opposed to the loss of androgens?

      Response: This question is now discussed in full in the new Discussion section, entitled, “Pituitary GH secretory patterns vs. gonadal steroids as regulators of sex-biased liver chromatin accessibility and gene expression” (lines 640-661), as noted above.

      Line 505. "euthanized between plasma GH pulses". The authors are making an inference here because I do not think they measured GH levels. It would be more accurate to say that the time of euthanasia is inferred to be between GH pulses based on the measurement of STAT5 which is GH-dependent.

      Response: Text was changed to: “a time inferred to be between plasma GH pulses”.

      Reviewer #3 Recommendations:

      In Figure 1A the differences between female-biased enhancers and sex-independent enhancers seem greater than those comparing female-biased insulators and sex-independent insulators, and yet only the latter are significant. Please could you clarify?

      Response: Figure legend was corrected to indicate that Enhancers + Weak Enhancers were analyzed as a single group. Furthermore, the location of the Enhancer asterisks above the bars on the figure was adjusted to reflect this.

      Line 257, I could not find Table S1B.

      Response: Text in Figure legend was corrected to specify Table S7A as the source of this data.

      Line 265 "BCL6 binding was also enriched at dynamic sex-independent DHS (Table S7B)." The p-value of this enrichment was particularly high. Could this have a biological correlation?

      Response: We cannot rule out that possibility.

      Line 277 "identified a Fox family factor as a close match for one of the top enriched motifs in the set of 278 static but not in the set of dynamic male-biased DHS", Maybe authors could add that this holds true for FOXI1 and not for FOXD1.

      Response: Text was changed to specify FOXI1 as the factor.

      Line 368, please clarify the affirmation because in Table 1A we do not see the data of dynamic and static male-biased DHS, but only male-biased, female-biased, and sex-independent DHS subsets.

      Response: Text was corrected to read: “Our initial analyses revealed no major differences between dynamic and static male-biased DHS regarding the distribution of enhancer vs insulator vs promoter classifications (Fig. S7A) or their overall chromatin state distributions (Fig. S7B)”.

      Figure 7A and 7B. It would visually help the reader if in E1, E2, etc. you could include the short definitions (as in Figure 1B: Inactive, Inactive, Low signal, etc.)

      Response: We thank the reviewer for this suggestion, and have now added the X-axis labels suggested by the Reviewer.

      Line 570 The sentence was difficult to read "similar to E6, but unlike E6," Maybe removing the comma after "unlike E6" would help.

      Response: Text has been edited to avoid this cumbersome construct. It now reads: “…characterized by a high frequency of same activating chromatin marks as chromatin state E6, i.e., H3K27ac and H3K4me1 (E9) or H3K27ac alone (E10), but unlike E6 they are both deficient in…”.

      Other changes include revisions to the Abstract to take into account the new discussion concerning the impact of sex-biased H3K36me3 marks along with related and other revisions to the Discussion, and a revision to the manuscript Title to better capture its main message.

    1. Author Response

      The following is the authors’ response to the original reviews.

      We thank the reviewers for their time and effort to review our manuscript. We have provided a response to their thoughtful questions below. In our revised manuscript, we have expanded the Discussion to comment on the significance of reversible modification of APC with polyubiquitin, and how the APC transport defect might be rescued (lines 335 to 346). A new Supplementary Figure 3 has been added to show a replicate DUB assay and the uncropped gel of Figure 1C in the main text.

      Reviewer #1 (Recommendations For The Authors):

      To address the weaknesses outlined below, I have the following comments and suggestions for experiments:

      1) Functional link between mouse phenotypes and proposed mechanism: could the authors rescue neuron/glia cell density or motor defects by restoring axonal trafficking of APC?

      We have shown that inhibition of glycogen synthase kinase 3 (GSK3) abolished APC ubiquitylation (PMID 22761442). Etienne-Manneville and Hall have reported that GSK3 inactivation promotes APC association with microtubule plus ends to drive polarised astrocyte migration (PMID 12610628). It is therefore conceivable that treating Trabid mutant neurons with a GSK3 inhibitor could suppress APC ubiquitylation, restore APC transport, and rescue the defective axon growth. GSK3 has multiple targets so there are caveats to using potent inhibitors of this kinase. But such an experiment is integral to a future study aimed at rescuing Trabid mutant mouse phenotypes by GSK3 inhibition.

      Does perturbation of APC trafficking phenocopy the defects of TRABID p.R438W and p.A451V knock in mice during neurodevelopment? I appreciate that these experiments might not be easily feasible.

      Presently we do not know how to directly perturb APC transport (besides generating a Trabid mutation). Speculatively, APC phosphosite mutants which mimic constitutive phosphorylation by GSK3 might accumulate polyubiquitin, aggregate, and exhibit disrupted axonal transport. We predict that such APC mutants will cause neurodevelopmental abnormalities in mouse models.

      Thus, alternatively, could the authors provide evidence from unbiased proteomic approaches that APC is a major substrate of TRABID- and STRIPAK-dependent deubiquitylation during neurodevelopment? E.g., what are the changes in the ubiquitylome of neural progenitor cells isolated from mouse embryos with TRABID mutant alleles and is APC amongst the top dysregulated hits? What are the changes in the interactome of TRABID p.A451V and is the STRIPAK complex a major interactor that is lost?

      We are generating antibodies capable of immunoprecipitating endogenous Trabid from mouse cells. This antibody tool will allow us to characterise the Trabid-STRIPAK complex using advanced ubiquitin proteomic approaches to determine interactors and changes to the ubiquitylome of Trabid mutant cells.

      2) Related to the point 1, given that TRABID has been reported to be a regulator of immune signaling pathways (PMID: 26808229, 37237031), can the authors exclude a contribution of this function to the observed phenotypes during neurodevelopment?

      We have not observed any cellular or tissue phenotypes in young or aged Trabid mutant mice indicative of immune system dysregulation. We and others have shown that Trabid deficiency has no impact on the transcription of interferon and NF-B-stimulated genes or cytokine production in mouse and human cells (PMID 18281465; 17991829; unpublished). Nevertheless, a formal investigation is required to determine any changes to immune signalling pathways in our Trabid mutant mice.

      3) Based on previously published interactions, the authors propose that TRABID uses the STRIPAK complex to recruit its substrate APC. Could the authors provide experimental evidence for this by using their cellular model in Figure 4? Would depleting components of the STRIPAK complex in HEK 293T cells stably transfected with DOX-inducible WT-TRABID stabilize APC ubiquitylation upon dox induction?

      We have demonstrated that RNAi-mediated depletion of all 3 striatin proteins in HEK293T cells increased the levels of ubiquitin-modified APC (PMID 23277359). Moreover, depleting Trabid and the 3 Striatins together strongly increased the ubiquitin-modified APC pool, consistent with our model that Trabid and STRIPAK function together to deubiquitylate APC. In our inducible system, we would likely need to eliminate the expression of the STRIPAK component that directly recruits Trabid to achieve a null effect of Trabid overexpression on APC deubiquitylation. Experiments are in progress to determine which STRIPAK component binds directly to Trabid.

      4) Related to point 3, given that A451, the residue that mediates STRIPAK binding is in close proximity to the catalytic cysteine residue, how do the authors envision STRIPAK binding and OTU-dependent cleavage activity to work together at a structural level?

      A451 resides at the back of the active site in a pocket hypothesised to accommodate a short peptide from an interacting protein. The A451V mutant AnkOTU domain purified from bacteria retained full DUB activity, suggesting that Trabid’s ability to cleave polyubiquitin is independent of its ability to bind STRIPAK. Striatin proteins contain WD40 repeats which is a protein fold that binds ubiquitin (PMID 21070969). While the DUB- and STRIPAK-binding activities of Trabid might not be coupled structurally, it is plausible that Striatin could modulate Trabid’s ubiquitin linkage specificity in cells through allosteric interactions with the ubiquitin chain on the substrate.

      5) Is it known why APC needs to be reversibly modified with ubiquitin to be transported in axons and how increased APC ubiquitylation leads to impaired transport or could the authors speculate on this?

      We have shown that APC ubiquitin modification correlated with its binding to Axin in the -catenin destruction complex (PMID 22761442). Conversely, non-ubiquitin-modified APC accumulates in membrane protrusions (PMID 23277359). From this we have proposed that ubiquitin regulates the distribution of APC between its two major functional pools in cells. Chronic APC ubiquitylation in Trabid deficient/mutant neurons might result in increased APC sequestration into Axin destruction complexes and/or promote spurious interactions with ubiquitin binding proteins that cause APC to aggregate, and therefore retard its transport in axons.

      Additional minor comments to consider:

      • Figure 1C: What are the protein smears in the in vitro assays of A541V 15min and CS 120min? I would assume that contaminants from the protein preparations should be the same across different conditions and in particular across different time points of the same Trabid mutant.

      In replicate DUB assays using the same AnkOTU protein preparations we did not detect any smears (Supplementary Figure 3A). It is unclear what caused the smears in Figure 1C, but it is plausible that contaminants in specific tubes/assays are contributing factors.

      • Figure 1D: why is the amount of AnkOTU protein reduced for WT, R438W, and A541 in a time-dependent manner?

      With increasing incubation time in DUB assays, adducts of various molecular weights may form between ubiquitin and the AnkOTU domain. It is plausible that some of these adducts are non-gel-resolved high molecular weight aggregates that sequester some of the AnkOTU proteins. These aggregates, which could have been retained in the loading wells, were presumably washed away during our silver staining procedure hence we do not see them in the full-length gel (Supplementary Figure 3B).

      Reviewer #2 (Recommendations For The Authors):

      • The partial penetrance of the mouse knockin phenotype is confusing, especially as this is evident on an apparently inbred background. Can authors explain the factors that contribute to these differences?

      Low mutant Trabid protein expression in distinct neural crest or progenitor populations could contribute to the reduced penetrance of the cell number phenotype. APC dysfunction in Trabid mutant cells might also impact its role as a negative regulator of the Wnt signalling pathway which regulates neuronal and glial cell fates in the developing brain (PMID 9845073). It is conceivable that in some Trabid mutant mice where APC dysfunction is mild (due to low levels of mutant Trabid protein expression), compensatory mechanisms overcome APC’s reduced function in Wnt signalling and cytoskeleton organization to permit normal brain development. A future study to investigate perturbations of Wnt signalling pathways in Trabid mutant mice is warranted.

      • The use of the term 'hemizygous' is confusing, as it typically refers to when one copy of a gene is present as in X-linked conditions. Might the authors mean 'heterozygous'?

      All instances of ‘hemizygous’ in the manuscript have been amended to ‘heterozygous’.

      • Fig. 3A y-axis units is confusing. Do the authors mean number of TH+ SNc neurons evident per section?

      We have amended the y-axis in Fig. 3A to indicate number of TH+ neurons evident per section.

      • Since the TH phenotype is one of the phenotypes that is partially penetrant, did authors include both penetrant and non-penetrant mice in Fig. 3 and other figures? Shouldn't there be error bars in Fig. 3A, since multiple mice were presumably used for analysis for each condition?

      Each data point in Fig. 3A represents one mouse in a set of littermate mice with the indicated age, sex, and genotype. Generating midbrain SNc sections at similar bregma positions across wild-type and mutant littermate brains for accurate IHC comparison proved challenging. Unanticipated technical issues limited the quantification of equivalent midbrain sections to 3 sets of littermate mice from each respective R438W or A451V mutant colony. The cell number reduction is more obvious in some mutants than others, but the effect is observed across all ages and gender, providing confidence that the phenotype is robust. In Fig. 2 we have included only mutant mice with clearly fewer brain cells than wild-type littermates. We have not performed comprehensive IHC analysis of brains from all the mice used for the rotarod assay in Fig. 3E, but predict that mutant mice have a spectrum of neural/glial cell deficits in one or more brain areas that adversely impacted the motor circuitry causing their impaired motor function.

    1. Author Response

      We thank the Editors and the Reviewers for their comments on the importance of our work “showing a new role of caveolin-1 as an individual protein instead of the main molecular component of caveolae” in building membrane rigidity and also for constructive and thoughtful remarks that shall allow to improve the manuscript.

      Indeed, we here establish the contributing role of caveolin-1 to membrane mechanics by a molecular mechanism that needs to be further addressed. To that respect, we thank the reviewers for suggesting avenues to improve the presentation and discussion of our hypotheses based on results of theoretical model and independent biophysical measurements in tube pulling from plasma membrane spheres, which concur to support the key role of caveolin-1 in building membrane rigidity.

      To fulfill the recommendations of the reviewers we will amend the manuscript as discussed below.

      Public Reviews:

      Reviewer #1 (Public Review):

      Summary:

      Because of the role of membrane tension in the process, and that caveloae regulate membrane tension, the authors looked at the formation of TEMs in cells depleted of Caveolin1 and Cavin1 (PTRF): They found a higher propensity to form TEMs, spontaneously (a rare event) and after toxin treatment, in both Caveolin 1 and Cavin 1. They show that in both siRNA-Caveolin1 and siRNA-Cavin1 cells, the cytoplasm is thinner. They show that in siCaveolin1 only, the dynamics of opening are different, with notably much larger TEMs. From the dynamic model of opening, they predict that this should be due to a lower bending rigidity of the membrane. They measure the bending rigidity from Cell-generated Giant liposomes and find that the bending rigidity is reduced by approx. 50%.

      Strengths:

      They also nicely show that caveolin1 KO mice are more susceptible to death from infections with pathogens that create TEMs.

      Overall, the paper is well-conducted and nicely written. There are however a few details that should be addressed.

      Reviewer #2 (Public Review):

      Summary:

      The manuscript by Morel et al. aims to identify some potential mechano-regulators of transendothelial cell macro-aperture (TEM). Guided by the recognized role of caveolar invaginations in buffering the membrane tension of cells, the authors focused on caveolin-1 and associated regulator PTRF. They report a comprehensive in vitro work based on siRNA knockdown and optical imaging approach complemented with an in vivo work on mice, a biophysical assay allowing measurement of the mechanical properties of membranes, and a theoretical analysis inspired by soft matter physics.

      Strengths:

      The authors should be complimented for this multi-faceted and rigorous work. The accumulation of pieces of evidence collected from each type of approach makes the conclusion drawn by the authors very convincing, regarding the new role of cavolin-1 as an individual protein instead of the main molecular component of caveolae. On a personal note, I was very impressed by the quality of STORM images (Fig. 2) which are very illuminating and useful, in particular for validating some hypotheses of the theoretical analysis.

      Weaknesses:

      While this work pins down the key role of caveolin-1, its mechanism remains to be further investigated. The hypotheses proposed by the authors in the discussions about the link between caveolin and lipids/cholesterol are very plausible though challenging. Even though we may feel slightly frustrated by the absence of data in this direction, the quality and merit of this paper remain.

      In the current study, we did not find the technical conditions allowing us to properly address the role of cholesterol in the dynamics of TEM due to adverse effects of cholesterol depletion with methyl-beta-cyclodextrin on the morphology of HUVEC. To answer the Reviewer remark, we will mention our attempts to address a role of cholesterol in the dynamics of TEM in the results section. Moreover, we will thoroughly discuss in the section related to data of tube pulling experiments from PMS that caveolin-1 by controlling membrane lipid composition, may indirectly affect membrane rigidity (see comments below about the presence or absence of caveolin-1 in the tubes pulled from PMS and our hypotheses about a direct or indirect role of caveolin-1 in the control of membrane rigidity).

      The analogy with dewetting processes drawn to derive the theoretical model is very attractive. However, although part of the model has already been published several times by the same group of authors, the definition of the effective membrane rigidity of a plasma membrane including the underlying actin cortex, was very vague and confusing.

      In the revised manuscript, we will clearly define the membrane bending rigidity parameter, which was missing in the current version. The membrane bending rigidity is defined as the energy required to locally bend the membrane surface. In a liposome, a rigorous derivation leads to a relationship between the membrane tension relation and the variation of the projected area, which are related by the bending rigidity: this relationship is known as the Helfrich law. This statistical physics approach is only rigorously valid for a liposome, whereas its application to a cell is questionable due to the presence of cytoskeletal forces acting on the membrane. Nevertheless, application of the Helfrich law to cell membranes may be granted on short time scales, before active cell tension regulation takes place (Sens P and Plastino J, 2015 J Phys Condens Matter), especially in cases where cytoskeletal forces play a modest role, such as red blood cells (Helfrich W 1973 Z Naturforsch C). The fact that the cytoskeletal structure and actomyosin contraction are significantly disrupted upon cell intoxication-driven inhibition of the small GTPase RhoA supports the applicability of Helfrich law to describe TEM opening. Because of the presence of proteins, carbohydrates, and the adhesion of the remaining actin meshwork after toxin treatment, we expect the Helfrich relationship to somewhat differ from the case of a pure lipidic membrane. We account for these effects via an “effective bending rigidity”, a term used in the detailed discussion of the model hypotheses, which corresponds to an effective value describing the relationship between membrane tension and projected area variation in our cells. These considerations will be included in the revised manuscript.

      Here, for the first time, thanks to the STORM analysis, the authors show that HUVECs intoxicated by ExoC3 exhibit a loose and defective cortex with a significantly increased mesh size. This argues in favor of the validity of Helfrich formalism in this context. Nonetheless, there remains a puzzle. Experimentally, several TEMs are visible within one cell. Theoretically, the authors consider a simultaneous opening of several pores and treat them in an additive manner. However, when one pore opens, the tension relaxes and should prevent the opening of subsequent pores. Yet, experimentally, as seen from the beautiful supplementary videos, several pores open one after the other. This would suggest that the tension is not homogeneous within an intoxicated cell or that equilibration times are long. One possibility is that some undegraded actin pieces of the actin cortex may form a barrier that somehow isolates one TEM from a neighboring one.

      As pointed by the Reviewer, we expect that membrane tension is neither a purely global nor a purely local parameter. Opening of a TEM will relax membrane tension over a certain distance, not over the whole cell. Moreover, once the TEM closes back, membrane tension will increase again. This spatial and temporal localization of membrane tension relaxation explains that the opening of a first TEM does not preclude the opening of a second one. On the other hand, membrane tension is not a purely local property. Indeed, we observe that when two TEMs enlarge next to each other, their shape becomes anisotropic, as their enlargement is mutually hampered in the region separating them. We account for this interaction by treating TEM membrane relaxation in an additive fashion. We emphasize that this simplified description is used to predict maximum TEM size, corresponding to the time at which TEM interaction is strongest. As the reviewer points out, it would be more questionable to use this additive treatment to predict the likelihood of nucleation of a new TEM, which is not done here.

      Could the authors look back at their STORM data and check whether intoxicated cells do not exhibit a bimodal population of mesh sizes and possibly provide a mapping of mesh size at the scale of a cell?

      To address the question raised by the Reviewer we decided to plot the whole distribution of mesh sizes in addition to the average value per cell. We did not observe a bimodal distribution but rather a very heterogeneous distribution of mesh size going up to a few microns square in all conditions of siRNA treatments. Moreover, we did not observe a specific pattern in the distribution of mesh size at the scale of the cell, with very large mesh sizes being surrounded by small ones. We also did not observe any specific pattern for the localization of TEM opening, as described in the paper, making the correlation between mesh size and TEM opening difficult.

      In particular, it is quite striking that while bending rigidity of the lipid membrane is expected to set the maximal size of the aperture, most TEMs are well delimited with actin rings before closing. Is it because the surrounding loose actin is pushed back by the rim of the aperture? Could the authors better explain why they do not consider actin as a player in TEM opening?

      Actin ring assembly and stiffening is indeed a player in TEM opening, and it is included in our differential equation describing TEM opening dynamics (second term on the left-hand side of Eq. 3). In some cases, actin ring assembly is the dominant player, such as in TEM opening after laser ablation (ex novo TEM opening), as we previously reported (Stefani et al. 2017 Nat comm). In contrast, here we investigate de novo TEM opening, for which we expect that bending rigidity can be estimated without accounting for actin assembly, as we previously reported (Gonzalez-Rodriguez et al. 2012 Phys Rev Lett). Such a bending rigidity estimate (Eq. 5) is obtained by considering two different time scales: the time scale of membrane tension relaxation, governed by bending rigidity, and the time scale of cable assembly, governed by actin dynamics. We expect the first-time scale to be shorter, and thus the maximum size of de novo TEMs to be mainly constrained by membrane tension relaxation. The discussion of these two different time scales will be added to the revised manuscript.

      Instead of delegating to the discussion the possible link between caveolin and lipids as a mechanism for the enhanced bending rigidity provided by caveolin-1, it could be of interest for the readership to insert the attempted (and failed) experiments in the result section. For instance, did the authors try treatment with methyl-beta-cyclodextrin that extracts cholesterol (and disrupts caveolar and clathrin pits) but supposedly keeps the majority of the pool of individual caveolins at the membrane?

      We will state in the results section that we could not find appropriate experimental conditions allowing us to deplete cholesterol with methyl-beta cyclodextrin without interfering with the shape of HUVECs, thereby preventing the proper analysis of TEM dynamics.

      Tether pulling experiments on Plasma membrane spheres (PMS) are real tours de force and the results are quite convincing: a clear difference in bending rigidity is observed in controlled and caveolin knock-out PMS. However, one recurrent concern in these tether-pulling experiments is to be sure that the membrane pulled in the tether has the same composition as the one in the PMS body. The presence of the highly curved neck may impede or slow down membrane proteins from reaching the tether by convective or diffusive motion. Could the authors propose an experiment to demonstrate that caveolin-1 proteins are not restricted to the body of the PMS and can access to the nanometric tether?

      As pointed out by the reviewer, a concern with tube pulling experiments is related to the dynamics of equilibration of membrane composition between the nanotube and the rest of the membrane. In our experiments, we have waited about 30 seconds after tube pulling and after changing membrane tension. We have checked that after this time, the force remained constant, implying that we have performed experiments of tube pulling from PMS in technical conditions of equilibrium that ensure that lipids and membrane proteins had enough time to reach the tether by convective or diffusive motion. We will add a representative example of force vs time plot in our revision. In principle, this could be further checked using cells expressing GFP-caveolin-1 to generate PMS as done in Sinha et al., 2011: a steady protein signal in the tube will further confirm the equilibration, provided that caveolin is recruited in the nanotube due to mechanical reasons. Indeed, since caveolin-1 is inserted in the cytosolic leaflet of the plasma membrane, when a nanotube is pulled towards the exterior of the cell as in our experiments, we can expect 2 situations depending on the ability of caveolin-1 to deform membranes, which is not clear, in particular after the paper of Porta et al, Sci. Adv., 2022. i) If caveolin-1 (Cav1) does not bend membranes, it could be recruited in the nanotubes, at a density similar to the PMS body. The tube force measurement in this case would reflect the bending rigidity of the PMS membrane. Then, Cav1 could stiffen membrane either as a stiff inclusion at high density or/and by affecting lipid composition, as suggested in our text. ii) If Cav1 bends the membrane (i.e. it has a non-zero spontaneous curvature), it should create a positive curvature considering the geometry of the caveolae, opposite to the curvature of the nanotubes that we pull, and thus be excluded of the nanotubes. In this case, the force would reflect the bending rigidity of the membrane depleted of Cav1 and should be the same in both types of experiments (WT and Cav1 depleted conditions) if the lipid composition remains unchanged upon Cav1 depletion. Our measurements suggest again that Cav1 depletion affects the plasma membrane composition, probably by reducing the quantity of sphingomyelin and cholesterol. Note that the presence of a very reduced concentration of Cav1 as compared to the plasma membrane has been reported in tunneling nanotubes (TNT) connecting two neighboring cells (A. Li et al., Front. Cell Dev. Biol., 2022). These TNTs have typical diameters of similar scale than diameters of tubes pulled from PMS. Some of us have addressed these specific questions related to Cav-1 spontaneous curvature and its effect on the lipid composition of the plasma membrane in two separate manuscripts (in preparation). They represent comprehensive studies by themselves that clarify these points. We propose to add this discussion in the manuscript, with perspectives on future studies, but stressing the point that the presence of Cav1 stiffens plasma membranes, and that the exact origin of this effect must be further investigated.

    1. Author Response

      Public Reviews:

      Reviewer #1 (Public Review):

      Summary:

      The authors characterize S. enterica WbaP biochemically and structurally. The enzyme catalyzes the initial step in O antigen biosynthesis by transferring a phospho-galactosyl unit from UDP-galactose to undecaprenyl-phosphate. This initial primer is then extended by other glycosyltransferases to form the O antigen repeat unit.

      To preserve the biologically functional unit of WbaP, the authors chose a 'detergent-free' purification method based on membrane extraction using SMALP polymers. The obtained material was characterized biochemically and by single-particle cryo-electron microscopy.

      Strengths:

      The authors were able to isolate WbaP in a catalytically active and oligomeric form and determined a low-resolution cryo-EM structure of the dimeric complex. Using a disulfide cross-linking approach and other biophysical methods, the authors validated an AlphaFold predicted WbaP model used to interpret the experimental cryo-EM map.

      Weaknesses:

      The rationale for using SMALP to extract WbaP from the membrane was to 'preserve' the native lipid bilayer surrounding the protein. However, the physical properties of the lipids co-purifying with the protein are unclear. The volume of the EM map assigned to the SMALP polymers suggests a more micellar character.

      Overall, the obtained cryo-EM map appears to be at fairly low resolution. Based on Figure 6, individual helices are not resolved, suggesting an overall resolution significantly below the stated 4.1 Å. Thus, the presented structure is the one of an AlphaFold WbaP model.

      I believe the UMP titration analysis could be improved. The authors assume that a 'domain of unknown function (DUF)' binds UMP and regulates the enzyme's activity. UMP, a reaction product of WbaP, may also inhibit the enzyme competitively. Therefore, deleting the DUF for the UMP inhibition studies could help with data interpretation.

      We appreciate the reviewer’s careful analysis of our manuscript, and their attention to detail regarding the structural data. In a revised version of this manuscript, we will modify the discussion section to include a brief section focused on the liponanoparticle itself, comparing to other experimental structures in SMALP. Investigating the lipid microenvironment in SMALPs around both Lg- and Sm-PGTs is of great interest to our group. We have published initial data related to PglC from Campylobacter, but a systematic analysis of co-purified lipids from the growing number of SMALP-solubilized PGTs is an exciting future direction for this project. Expression and analysis of truncated constructs containing the catalytic domain of Lg-PGTs (including WbaP) has been attempted in our laboratory, with no success. This limits our ability to decouple DUF-mediated modulation of activity from interactions in the catalytic domain. Efforts to address this challenge are underway but will be the focus of future publications. Regarding the overall resolution – for transparency - we will add a new figure that shows the local resolution throughout the experimental map.

      Reviewer #2 (Public Review):

      Summary:

      The authors focused on delivering a comprehensive structural characterization of WbaP, a membrane-bound phosphoglycosyl transferase from Salmonella that is instrumental in bacterial glycoconjugate synthesis. Notably, the authors employed SMALP-200, an amphipathic copolymer, to extract WbaP in the form of native lipid bilayer nanodiscs. They then determined its oligomerization state through cross-linking and procured higher-resolution structural data via cryo-electron microscopy (cryo-EM). While the authors successfully characterized WbaP in a native-like lipid bilayer setting, and their findings support this, the paper's claim of introducing a novel methodology is not robust. The real contribution of this work lies in the newfound insights about WbaP's structure.

      Strengths:

      The manuscript provides novel insights into WbaP's structure and oligomerization state, highlighting potentially significant interactions. The methodologies employed represent state-of-the-art practices in the field. Most of the drawn conclusions are well-supported by either experimental or computational data, with a few exceptions noted below.

      Weaknesses:

      • Organization: The manuscript's organization lacks clarity. The authors seem to describe their processes in the sequence they occurred rather than a logical flow, leading to potential confusion. For instance, the authors delve into a series of inconclusive experiments to determine the oligomerization state of WbaP, utilizing techniques like SEC, SEC-MALS, mass photometry, and mass spectrometry. They then transition to cryo-EM but subsequently return to address the oligomerization issue, which they conclusively resolve using cross-linking experiments. Following this, they shift their focus to interpreting and discussing the structural features obtained from the cryo-EM data.

      • Ambiguous and incorrect statements: There are instances of vague and at times inaccurate statements. Using more precise terminology like "native nanodiscs" or "lipid bilayer nanodiscs" would enhance clarity compared to the term "liponanoparticles." The claim on page 8 concerning the refractive index increment of SMA polymers needs rectification. The real reason why SEC-MALS cannot provide absolute particle masses in this case is that using two independent concentration detectors (typically, absorbance and refractive index), the decomposition of elution profiles is necessarily limited to two chemical species of a known molar or specific absorbance and refractive index. Thus, it is clear that nanodiscs containing a protein, a polymer, and a chemically undefined mixture of native lipids cannot be analyzed by this technique.

      • Overstating of technical aspects: The technical aspects seem overstated. While the extraction of membrane proteins into native lipid bilayer nanodiscs and their characterization by cross-linking and cryo-EM are standard (and were published before by the same authors in ref. 29), the authors appear to promote them as groundbreaking. The statement that this study presents a novel, universal strategy and toolkit for examining small membrane proteins within liponanoparticles seems overstated, especially given the previous existence of similar methods.

      We appreciate the reviewer’s careful consideration of the steps that were taken and how they were presented. However, we need to reinforce that although the initial biophysical experiments do not provide the exact oligomeric state of the WbaP, they provide important new data. Together these data support that the intact liponanoparticle is large enough to accommodate a higher order oligomerization state along with native lipids and stabilizing SMA polymer – this was not known at the outset and led to Fig 2D showing the first demonstration of dimer that was then validated via XLMS and disulfide crosslinking. The process was logical and essential to this work. We recognize the reviewer’s point on the SEC-MALs experiment and will adjust the text accordingly.

      We sought to distinguish the stabilization method used here from canonical MSP nanodiscs by using the term styrene maleic acid liponanoparticle (SMALP). The term SMALP is widely used in literature utilizing this technology, thus the use of other terms may lead to confusion.

      Our manuscript in PExpPur was focused on enabling expression of sufficient quality and quantity for sophisticated downstream biophysical applications – that MS was intended to be enabling to the greater membrane protein community and is highly recognized and appreciated in “its own right.” This work presents the first in class structure of the large monoPGTs. Further only a single structure of the PGT domain itself has been solved and appears as an experimental structure in the PDB (also from our group) addressing the enigmatic additional domains and potential physiological relevance. It is also noteworthy that the Lg-monoPGTs dominate the superfamily. This is also the first time that any protein in SMALP has been characterized using direct mass technology, which provided the most accurate mass determination of the intact liponanoparticle/protein complex.

    1. Author Response

      Reviewer #1 (Public Review):

      The authors present a detailed analysis of a set of molecular dynamics computer simulations of several variants of a T-cell receptor (TCR) in isolation and bound to a Major Histocompatibility Complex with peptide (pMHC), with the aim of improving our understanding of the mechanism T cell activation in immunity. By analyzing simulations of peptide mutants and partially truncated TCRs, the authors find that native peptide agonists lead to a so-called catch-bond response, whereby tensile force applied in the direction of separation between TCR/pMHC appears to strengthen the TCR/pMHC interface, whereas mutated peptides exhibit the more common slip-bond response, in which applied force destabilizes the binding interface. Using various computational metrics and simulation statistics, the authors propose a model in which tensile force preferentially suppresses thermal fluctuations in the variable α domain of the TCR (vs the β domain) in a peptide-dependent manner, which orders and strengthens the binding interface by bringing together the complementarity-determining regions (CDRs) in the TCR variable chains, but only if the peptide is correctly matched to the TCR.

      R1-0. The study is detailed and written clearly, and conclusions appear convincing and are supported by the simulation data. However, the actual motions at the molecular or amino-acid level of how the catch-bond vs slip bond response originates remain somewhat unclear, and will probably warrant further investigations. Specific hypotheses that could be testable in experiments, such as predictions of which peptide (or TCR) mutations or which peptides could generate a catch-vs-slip response or activation, would have especially strengthened this study.

      Catch bonds have been observed in different αβ TCRs that differ in sequence when paired with their matching pMHC. Thus, there should be a general principle that apply irrespective of particular TCR sequences, as summarized in Fig. 8. The predictive capacity of this model in terms of understanding experiments is explained in our reply R0-3. Here, we discuss about designing specific point mutations to TCR that have not been studied previously. In our simulations, we can identify high-occupancy contacts that are present mainly in the high-load case as target for altering the catch bond behavior. An example is V7-G100 between the peptide and Vβ (Fig. 2C, bottom panel). The V7R mutant peptide is a modified agonist that we have already studied, where R7 forms hydrogen bonds and nonpolar contacts with residues other than βG100, albeit with lower occupancy (page 11, lines 280–282 and page 32, Fig. 5–figure supplement 2B). Instead of the V7R mutation to the peptide, mutating βG100 to other residues may lead to different effects. For example, compared to G100A, mutation to a bulkier residue such as G100F may cause opposing effects: It may induce steric mismatch that destabilizes the interface. Conversely, a stronger hydrophobic effect might increase the baseline bond lifetime. Also, mutating G100 to a polar residue may have even greater effect, leading to a slip bond or absence of measurable binding.

      As the reviewer suggested in R1-5, it will also be interesting to crosslink Vα and Cα by a disulfide bond to suppress its motion. Again, there are different possible outcomes. The lack of Vα-Cα motion could stabilize the interface with pMHC, resulting in a longer bond lifetime. Conversely, if the disulfide bond alters the V-C angle, it would have an opposite effect of destabilizing the interface by tilting it relative to the loading direction, similar to the dFG mutant in Appendix 1 (page 24).

      To make better predictions, simulations of such mutants should to be performed under different conditions and analyzed, which would be beyond the scope of the present study.

      Change made:

      • Page 14, Concluding Discussion, lines 395–402: We added a discussion about using simulations for designing and testing point mutants.

      Reviewer #2 (Public Review):

      In this work, Chang-Gonzalez and co-workers investigate the role of force in peptide recognition by T-cells using a model T-cell/peptide recognition complex. By applying forces through a harmonic restraint on distances, the authors probe the role of mechanical pulling on peptide binding specificity. They point to a role for force in distinguishing the different roles played by agonist and antagonist peptides for which the bound configuration is not clearly distinguishable. Overall, I would consider this work to be extensive and carefully done, and noteworthy for the number of mutant peptides and conditions probed. From the text, I’m not sure how specific these conclusions are to this particular complex, but I do not think this diminishes the specific studies.

      I have a couple of specific comments on the methodology and analysis that the authors could consider:

      R2-1. 1) It is not explained what is the origin of force on the peptide-MHC complex. Although I do know a bit about this, it’s not clear to me how the force ends up applied across the complex (e.g. is it directional in any way, on what subdomains/residues do we expect it to be applied), and is it constant or stochastic. I think it would be important to add some discussion of this and how it translates into the way the force is applied here (on terminal residues of the complex).

      As explained in our reply R0-1, force on the TCRαβ-pMHC complex arises during immune surveillance where the T-cell moves over APC. Generated by the cellular machinery such as actin retrograde flow and actomyosin motility, the applied force fluctuates, which would be on top of spontaneous fluctuation in force by thermal motion. This has been directly measured for the T-cell using a pMHC-coated bead via optical tweezers (see Feng et al., 2017, Fig. 1) and by DNA tension sensors (Liu, et al., 2016, Fig. 4; already cited in the manuscript). The direction of force also fluctuates that is longitudinal on average (see R1-6). How force distributes across the molecule is a great question, for which we plan to develop a computational method to quantify.

      Changes made.

      • Pages 3–4, newly added Results section ‘Applying loads to TCRαβ-pMHC complexes:’ We included the origin of force and its fluctuating nature, and the question of how loads are distributed across the molecule.

      • The reference (Feng et al., 2017) has been added in the above section.

      R2-2. 2) In terms of application of the force, I find the use of a harmonic restraint and then determining a distance at which the force has a certain value to be indirect and a bit unphysical. As just mentioned, since the origin of the force is not a harmonic trap, it would be more straightforward to apply a pulling force which has the form -F*d, which would correspond to a constant force (see for example comment articles 10.1021/acs.jpcb.1c10715,10.1021/acs.jpcb.1c06330). While application of a constant force will result in a new average distance, for small forces it does so in a way that does not change the variance of the distance whereas a harmonic force pollutes the variance (see e.g. 10.1021/ct300112v in a different context). A constant force could also shift the system into a different state not commensurate with the original distance, so by applying a harmonic trap, one could be keeping ones’ self from exploring this, which could be important, as in the case of certain catch bond mechanisms. While I certainly wouldn’t expect the authors to redo these extensive simulations, I think they could at least acknowledge this caveat, and they may be interested in considering a comparison of the two ways of applying a force in the future.

      Thanks for the suggestions and references. The paper by Stirnemann (2022) is a review including different computational methods of applying forces, mainly constant force and constant pulling velocity (steered molecular dynamics; SMD). The second one by Gomez et al., (2021) is a rather broad review of mechanosensing where discussion about computer simulation was mainly on SMD. In the third one by Pitera and Chodera (2012), potential limitations of using harmonic potentials in sampling nonlinear potential of mean force (PMF) are discussed.

      In the above references, loads or restraints are used to study conformational transitions or to sample the PMF, which are different from the use of positional restraints in our work. As explained in R0-1, positional restraint better mimics reality where the terminal ends of TCR and pMHC are anchored on the membranes of respective cells. Also, the concern raised by the reviewer about ruling out different states would be applicable to the case when there are multiple conformational states with local free energy minima at different extensions. Here, we are probing changes in the conformational dynamics (deformation and conformational fluctuation), rather than transitions between well-defined states.

      In Pitera and Chodera (2012) and also in other approaches such as umbrella sampling, the spring constant of the harmonic potential should be chosen sufficiently soft so that sampling around the neighborhood of the center of the potential can be made. On the other hand, if the harmonic potential is much stiffer than the local curvature of the PMF, although sampling may suffer, local gradient of the PMF, i.e, the force about the center of the potential, can be made. This has been studied earlier by one of us in Hwang (2007), which forms the basis for using a stiff harmonic potential for measuring the load on the TCRαβ-pMHC complex. The 1-kcal/(mol·˚A2) spring constant used in our study (page 17, line 540) was selected such that the thermally driven positional fluctuation is on the order of 0.8 ˚A. Hence, it is sufficiently stiff considering the much larger size of the TCRαβ-pMHC complex and the flexible added strands.

      Changes made:

      • Page 4, lines 117–119, newly added Results section ‘Applying loads to TCRαβ-pMHC complexes:’ The above explanation about the use of stiff harmonic restraint for measuring forces is added.

      • The 4 references mentioned above have been added to the above section.

      R2-3. 3) For the PCA analysis, I believe the authors learn separate PC vectors from different simulations and then take the dot product of those two vectors. Although this might be justified based on the simplified coordinate upon which the PCA is applied, in general, I am not a big fan of running PCA on separate data sets and then comparing the outputs, as the meaning seems opaque to me. To compare the biggest differences between many simulations, it would make more sense to me to perform PCA on all of the data combined, and see if there are certain combinations of quantities that distinguish the different simulations. Alternatively and probably better, one could perform linear discriminant analysis, which is appropriate in this case because one already knows that different simulations are in different states, and hence the LDA will directly give the linear coordinate that best distinguishes classes.

      As explained in R0-2, triads and BOC models are assigned to the same TCR across different simulations in identical ways. For the purpose of examining the relative Vα-Vβ and V-C motions, we believe comparing them across different simulations is a valid approach. When the motions are very distinct, it would be possible to combine all data and perform PCA or LDA to classify them. However, when behaviors differ subtly, analysis on the combined data may not capture individual behaviors. By analogy, consider two sets of 2-dimensional data obtained for the same system under different conditions. If each set forms an elliptical shape with the major axis differing slightly in direction, performing PCA separately on the two sets and comparing the angle between the major axes informs the difference between the two sets. If PCA were performed on the combined data (superposition of two ellipses forming an angle), it will be difficult to find the difference. LDA would likewise be difficult to apply without a very clear separation of behaviors.

      As also explained in R0-2, PCA is just one of multiple analyses we carried out to establish a coherent picture. The main use of PCA to this end was to compare directions of motion and relative amplitude of the motion among the subdomains.

      Changes made:

      • Page 6, lines 171–175 and page 8, lines 226–227: The rationale for applying PCA on triads and BOC models in different simulations are explained.

    1. Author Response

      Reviewer #1 (Public Review):

      This work introduces a novel framework for evaluating the performance of statistical methods that identify replay events. This is challenging because hippocampal replay is a latent cognitive process, where the ground truth is inaccessible, so methods cannot be evaluated against a known answer. The framework consists of two elements:

      1) A replay sequence p-value, evaluated against shuffled permutations of the data, such as radon line fitting, rank-order correlation, or weighted correlation. This element determines how trajectory-like the spiking representation is. The p-value threshold for all accepted replay events is adjusted based on an empirical shuffled distribution to control for the false discovery rate.

      2) A trajectory discriminability score, also evaluated against shuffled permutations of the data. In this case, there are two different possible spatial environments that can be replayed, so the method compares the log odds of track 1 vs. track 2.

      The authors then use this framework (accepted number of replay events and trajectory discriminability) to study the performance of replay identification methods. They conclude that sharp wave ripple power is not a necessary criterion for identifying replay event candidates during awake run behavior if you have high multiunit activity, a higher number of permutations is better for identifying replay events, linear Bayesian decoding methods outperform rank-order correlation, and there is no evidence for pre-play.

      The authors tackle a difficult and important problem for those studying hippocampal replay (and indeed all latent cognitive processes in the brain) with spiking data: how do we understand how well our methods are doing when the ground truth is inaccessible? Additionally, systematically studying how the variety of methods for identifying replay perform, is important for understanding the sometimes contradictory conclusions from replay papers. It helps consolidate the field around particular methods, leading to better reproducibility in the future. The authors' framework is also simple to implement and understand and the code has been provided, making it accessible to other neuroscientists. Testing for track discriminability, as well as the sequentiality of the replay event, is a sensible additional data point to eliminate "spurious" replay events.

      However, there are some concerns with the framework as well. The novelty of the framework is questionable as it consists of a log odds measure previously used in two prior papers (Carey et al. 2019 and the authors' own Tirole & Huelin Gorriz, et al., 2022) and a multiple comparisons correction, albeit a unique empirical multiple comparisons correction based on shuffled data.

      With respect to the log odds measure itself, as presented, it is reliant on having only two options to test between, limiting its general applicability. Even in the data used for the paper, there are sometimes three tracks, which could influence the conclusions of the paper about the validity of replay methods. This also highlights a weakness of the method in that it assumes that the true model (spatial track environment) is present in the set of options being tested. Furthermore, the log odds measure itself is sensitive to the defined ripple or multiunit start and end times, because it marginalizes over both position and time, so any inclusion of place cells that fire for the animal's stationary position could influence the discriminability of the track. Multiple track representations during a candidate replay event would also limit track discriminability. Finally, the authors call this measure "trajectory discriminability", which seems a misnomer as the time and position information are integrated out, so there is no notion of trajectory.

      The authors also fail to make the connection with the control of the false discovery rate via false positives on empirical shuffles with existing multiple comparison corrections that control for false discovery rates (such as the Benjamini and Hochberg procedure or Storey's q-value). Additionally, the particular type of shuffle used will influence the empirically determined p-value, making the procedure dependent on the defined null distribution. Shuffling the data is also considerably more computationally intensive than the existing multiple comparison corrections.

      Overall, the authors make interesting conclusions with respect to hippocampal replay methods, but the utility of the method is limited in scope because of its reliance on having exactly two comparisons and having to specify the null distribution to control for the false discovery rate. This work will be of interest to electrophysiologists studying hippocampal replay in spiking data.

      We would like to thank the reviewer for the feedback.

      Firstly, we would like to clarify that it is not our intention to present this tool as a novel replay detection approach. It is indeed merely a novel tool for evaluating different replay detection methods. Also, while we previously used log odds metrics to quantify contextual discriminability within replay events (Tirole et al., 2021), this framework is novel in how it is used (to compare replay detection methods), and the use of empirically determined FPR-matched alpha levels. We have now modified the manuscript to make this point more explicit.

      Our use of the term trajectory-discriminability is now changed to track-discriminability in the revised manuscript, given we are summing over time and space, as correctly pointed out by the reviewer.

      While this approach requires two tracks in its current implementation, we have also been able to apply this approach to three tracks, with a minor variation in the method, however this is beyond the scope of our current manuscript. Prior experience on other tracks not analysed in the log odds calculation should not pose any issue, given that the animal likely replays many experiences of the day (e.g. the homecage). These “other” replay events likely contribute to candidate replay events that fail to have a statistically significant replay score on either track.

      With regard to using a cell-id randomized dataset to empirically estimate false-positive rates, we have provided a detailed explanation behind our choice of using an alpha level correction in our response to the essential revisions above. This approach is not used to examine the effect of multiple comparisons, but rather to measure the replay detection error due to non-independence and a non-uniform p value distribution. Therefore we do not believe that existing multiple comparison corrections such as Benjamini and Hochberg procedure are applicable here (Author response image 1-3). Given the potential issues raised with a session-based cell-id randomization, we demonstrate above that the null distribution is sufficiently independent from the four shuffle-types used for replay detection (the same was not true for a place field randomized dataset) (Author response image 4).

      Author response image 1.

      Distribution of Spearman’s rank order correlation score and p value for false events with random sequence where each neuron fires one (left), two (middle) or three (right) spikes.

      Author response image 2.

      Distribution of Spearman’s rank order correlation score and p value for mixture of 20% true events and 80% false events where each neuron fires one (left), two (middle) or three (right) spikes.

      Author response image 3.

      Number of true events (blue) and false events (yellow) detected based on alpha level 0.05 (upper left), empirical false positive rate 5% (upper right) and false discovery rate 5% (lower left, based on BH method)

      Author response image 4.

      Proportion of false events detected when using dataset with within and cross experiment cell-id randomization and place field randomization. The detection was based on single shuffle including time bin permutation shuffle, spike train circular shift shuffle, place field circular shift shuffle, and place bin circular shift shuffle.

      Reviewer #2 (Public Review):

      This study proposes to evaluate and compare different replay methods in the absence of "ground truth" using data from hippocampal recordings of rodents that were exposed to two different tracks on the same day. The study proposes to leverage the potential of Bayesian methods to decode replay and reactivation in the same events. They find that events that pass a higher threshold for replay typically yield a higher measure of reactivation. On the other hand, events from the shuffled data that pass thresholds for replay typically don't show any reactivation. While well-intentioned, I think the result is highly problematic and poorly conceived.

      The work presents a lot of confusion about the nature of null hypothesis testing and the meaning of p-values. The prescription arrived at, to correct p-values by putting animals on two separate tracks and calculating a "sequence-less" measure of reactivation are impractical from an experimental point of view, and unsupportable from a statistical point of view. Much of the observations are presented as solutions for the field, but are in fact highly dependent on distinct features of the dataset at hand. The most interesting observation is that despite the existence of apparent sequences in the PRE-RUN data, no reactivation is detectable in those events, suggesting that in fact they represent spurious events. I would recommend the authors focus on this important observation and abandon the rest of the work, as it has the potential to further befuddle and promote poor statistical practices in the field.

      The major issue is that the manuscript conveys much confusion about the nature of hypothesis testing and the meaning of p-values. It's worth stating here the definition of a p-value: the conditional probability of rejecting the null hypothesis given that the null hypothesis is true. Unfortunately, in places, this study appears to confound the meaning of the p-value with the probability of rejecting the null hypothesis given that the null hypothesis is NOT true-i.e. in their recordings from awake replay on different mazes. Most of their analysis is based on the observation that events that have higher reactivation scores, as reflected in the mean log odds differences, have lower p-values resulting from their replay analyses. Shuffled data, in contrast, does not show any reactivation but can still show spurious replays depending on the shuffle procedure used to create the surrogate dataset. The authors suggest using this to test different practices in replay detection. However, another important point that seems lost in this study is that the surrogate dataset that is contrasted with the actual data depends very specifically on the null hypothesis that is being tested. That is to say, each different shuffle procedure is in fact testing a different null hypothesis. Unfortunately, most studies, including this one, are not very explicit about which null hypothesis is being tested with a given resampling method, but the p-value obtained is only meaningful insofar as the null that is being tested and related assumptions are clearly understood. From a statistical point of view, it makes no sense to adjust the p-value obtained by one shuffle procedure according to the p-value obtained by a different shuffle procedure, which is what this study inappropriately proposes. Other prescriptions offered by the study are highly dataset and method dependent and discuss minutiae of event detection, such as whether or not to require power in the ripple frequency band.

      We would like to thank the reviewer for their feedback. The purpose of this paper is to present a novel tool for evaluating replay sequence detection using an independent measure that does not depend on the sequence score. As the reviewer stated, in this study, we are detecting replay events based on a set alpha threshold (0.05), based on the conditional probability of rejecting the null hypothesis given that the null hypothesis is true. For all replay events detected during PRE, RUN or POST, they are classified as track 1 or track 2 replay events by comparing each event’s sequence score relative to the shuffled distribution. Then, the log odds measure was only applied to track 1 and track 2 replay events selected using sequence-based detection. Its important to clarify that we never use log odds to select events to examine their sequenceness p value. Therefore, we disagree with the reviewer’s claim that for awake replay events detected on different tracks, we are quantifying the probability of rejecting the null hypothesis given that the null hypothesis is not true.

      However, we fully understand the reviewer’s concerns with a cell-id randomization, and the potential caveats associated with using this approach for quantifying the false positive rate. First of all, we would like to clarify that the purpose of alpha level adjustment was to facilitate comparison across methods by finding the alpha level with matching false-positive rates determined empirically. Without doing this, it is impossible to compare two methods that differ in strictness (e.g. is using two different shuffles needed compared to using a single shuffle procedure). This means we are interested in comparing the performance of different methods at the equivalent alpha level where each method detects 5% spurious events per track rather than an arbitrary alpha level of 0.05 (which is difficult to interpret if statistical tests are run on non-independent samples). Once the false positive rate is matched, it is possible to compare two methods to see which one yields more events and/or has better track discriminability.

      We agree with the reviewer that the choice of data randomization is crucial. When a null distribution of a randomized dataset is very similar to the null distribution used for detection, this should lead to a 5% false positive rate (as a consequence of circular reasoning). In our response to the essential revisions, we have discussed about the effect of data randomization on replay detection. We observed that while place field circularly shifted dataset and cell-id randomized dataset led to similar false-positive rates when shuffles that disrupt temporal information were used for detection, a place field circularly shifted dataset but not a cell-id randomized dataset was sensitive to shuffle methods that disrupted place information (Author response image 4). We would also like to highlight one of our findings from the manuscript that the discrepancy between different methods can be substantially reduced when alpha level was adjusted to match false-positive rates (Figure 6B). This result directly supports the utility of a cell-id randomized dataset in finding the alpha level with equivalent false positive rates across methods. Hence, while imperfect, we argue cell-id randomization remains an acceptable method as it is sufficiently different from the four shuffles we used for replay detection compared to place field randomized dataset (Author response image 4).

      While the use of two linear tracks was crucial for our current framework to calculate log odds for evaluating replay detection, we acknowledge that it limits the applicability of this framework. At the same time, the conclusions of the manuscript with regard to ripples, replay methods, and preplay should remain valid on a single track. A second track just provides a useful control for how place cells can realistically remap within another environment. However, with modification, it may be applied to a maze with different arms or subregions, although this is beyond the scope of our current study.

      Last of not least, we partly agree with the reviewer that the result can be dataset-specific such that the result may vary depending on animal’s behavioural state and experimental design. However, our results highlight the fact that there is a very wide distribution of both the track discriminability and the proportion of significant events detected across methods that are currently used in the field. And while we see several methods that appear comparable in their effectiveness in replay detection, there are also other methods that are deeply flawed (that have been previously been used in peer-reviewed publications) if the alpha level is not sufficiently strict. Regardless of the method used, most methods can be corrected with an appropriate alpha level (e.g. using all spikes for a rank order correlation). Therefore, while the exact result may be dataset-specific, we feel that this is most likely due to the number of cells and properties of the track more than the use of two tracks. Reporting of the empirically determined false-positive rate and use of alpha level with matching false-positive rate (such as 0.05) for detection does not require a second track, and the adoption of this approach by other labs would help to improve the interpretability and generalizability of their replay data.

      Reviewer #3 (Public Review):

      This study tackles a major problem with replay detection, which is that different methods can produce vastly different results. It provides compelling evidence that the source of this inconsistency is that biological data often violates assumptions of independent samples. This results in false positive rates that can vary greatly with the precise statistical assumptions of the chosen replay measure, the detection parameters, and the dataset itself. To address this issue, the authors propose to empirically estimate the false positive rate and control for it by adjusting the significance threshold. Remarkably, this reconciles the differences in replay detection methods, as the results of all the replay methods tested converge quite well (see Figure 6B). This suggests that by controlling for the false positive rate, one can get an accurate estimate of replay with any of the standard methods.

      When comparing different replay detection methods, the authors use a sequence-independent log-odds difference score as a validation tool and an indirect measure of replay quality. This takes advantage of the two-track design of the experimental data, and its use here relies on the assumption that a true replay event would be associated with good (discriminable) reactivation of the environment that is being replayed. The other way replay "quality" is estimated is by the number of replay events detected once the false positive rate is taken into account. In this scheme, "better" replay is in the top right corner of Figure 6B: many detected events associated with congruent reactivation.

      There are two possible ways the results from this study can be integrated into future replay research. The first, simpler, way is to take note of the empirically estimated false positive rates reported here and simply avoid the methods that result in high false positive rates (weighted correlation with a place bin shuffle or all-spike Spearman correlation with a spike-id shuffle). The second, perhaps more desirable, way is to integrate the practice of estimating the false positive rate when scoring replay and to take it into account. This is very powerful as it can be applied to any replay method with any choice of parameters and get an accurate estimate of replay.

      How does one estimate the false positive rate in their dataset? The authors propose to use a cell-ID shuffle, which preserves all the firing statistics of replay events (bursts of spikes by the same cell, multi-unit fluctuations, etc.) but randomly swaps the cells' place fields, and to repeat the replay detection on this surrogate randomized dataset. Of course, there is no perfect shuffle, and it is possible that a surrogate dataset based on this particular shuffle may result in one underestimating the true false positive rate if different cell types are present (e.g. place field statistics may differ between CA1 and CA3 cells, or deep vs. superficial CA1 cells, or place cells vs. non-place cells if inclusion criteria are not strict). Moreover, it is crucial that this validation shuffle be independent of any shuffling procedure used to determine replay itself (which may not always be the case, particularly for the pre-decoding place field circular shuffle used by some of the methods here) lest the true false-positive rate be underestimated. Once the false positive rate is estimated, there are different ways one may choose to control for it: adjusting the significance threshold as the current study proposes, or directly comparing the number of events detected in the original vs surrogate data. Either way, with these caveats in mind, controlling for the false positive rate to the best of our ability is a powerful approach that the field should integrate.

      Which replay detection method performed the best? If one does not control for varying false positive rates, there are two methods that resulted in strikingly high (>15%) false positive rates: these were weighted correlation with a place bin shuffle and Spearman correlation (using all spikes) with a spike-id shuffle. However, after controlling for the false positive rate (Figure 6B) all methods largely agree, including those with initially high false positive rates. There is no clear "winner" method, because there is a lot of overlap in the confidence intervals, and there also are some additional reasons for not overly interpreting small differences in the observed results between methods. The confidence intervals are likely to underestimate the true variance in the data because the resampling procedure does not involve hierarchical statistics and thus fails to account for statistical dependencies on the session and animal level. Moreover, it is possible that methods that involve shuffles similar to the cross-validation shuffle ("wcorr 2 shuffles", "wcorr 3 shuffles" both use a pre-decoding place field circular shuffle, which is very similar to the pre-decoding place field swap used in the cross-validation procedure to estimate the false positive rate) may underestimate the false positive rate and therefore inflate adjusted p-value and the proportion of significant events. We should therefore not interpret small differences in the measured values between methods, and the only clear winner and the best way to score replay is using any method after taking the empirically estimated false positive rate into account.

      The authors recommend excluding low-ripple power events in sleep, because no replay was observed in events with low (0-3 z-units) ripple power specifically in sleep, but that no ripple restriction is necessary for awake events. There are problems with this conclusion. First, ripple power is not the only way to detect sharp-wave ripples (the sharp wave is very informative in detecting awake events). Second, when talking about sequence quality in awake non-ripple data, it is imperative for one to exclude theta sequences. The authors' speed threshold of 5 cm/s is not sufficient to guarantee that no theta cycles contaminate the awake replay events. Third, a direct comparison of the results with and without exclusion is lacking (selecting for the lower ripple power events is not the same as not having a threshold), so it is unclear how crucial it is to exclude the minority of the sleep events outside of ripples. The decision of whether or not to select for ripples should depend on the particular study and experimental conditions that can affect this measure (electrode placement, brain state prevalence, noise levels, etc.).

      Finally, the authors address a controversial topic of de-novo preplay. With replay detection corrected for the false positive rate, none of the detection methods produce evidence of preplay sequences nor sequenceless reactivation in the tested dataset. This presents compelling evidence in favour of the view that the sequence of place fields formed on a novel track cannot be predicted by the sequential structure found in pre-task sleep.

      We would like to thank the reviewer for the positive and constructive feedback.

      We agree with the reviewer that the conclusion about the effect of ripple power is dataset-specific and is not intended to be a one-size-fit-all recommendation for wider application. But it does raise a concern that individual studies should address. The criteria used for selecting candidate events will impact the overall fraction of detected events, and makes the comparison between studies using different methods more difficult. We have updated the manuscript to emphasize this point.

      “These results emphasize that a ripple power threshold is not necessary for RUN replay events in our dataset but may still be beneficial, as long as it does not excessively eliminate too many good replay events with low ripple power. In other words, depending on the experimental design, it is possible that a stricter p-value with no ripple threshold can be used to detect more replay events than using a less strict p-value combined with a strict ripple power threshold. However, for POST replay events, a threshold at least in the range of a z-score of 3-5 is recommended based on our dataset, to reduce inclusion of false-positives within the pool of detected replay events.”

      “We make six key observations: 1) A ripple power threshold may be more important for replay events during POST compared to RUN. For our dataset, the POST replay events with ripple power below a z-score of 3-5 were indistinguishable from spurious events. While the exact ripple z-score threshold to implement may differ depending on the experimental condition (e.g. electrode placement, behavioural paradigm, noise level and etc) and experimental aim, our findings highlight the benefit of using ripple power threshold for detecting replay during POST. 2) ”

    1. Author Response

      Reviewer #1 (Public Review):

      In this exciting and well-written manuscript, Alvarez-Buylla and colleagues report a fascinating discovery of an alkaloid-binding protein in the plasma of poison frogs, which may help explain how these animals are able to sequester a diversity of alkaloids with different target sites. This work is a major advance in our knowledge of how poison frogs are able to sequester and even resist such a panoply of alkaloids. Their study also adds to our understanding of how toxic animals resist the effects of their own defenses. Although target site insensitivity and other mechanisms acting to prevent the binding of alkaloids to their targets (often ion channels) are well characterized now in poison frogs, less is known regarding how they regulate the movement of toxins throughout the animal and in blood in particular. In the fugu (pufferfish) a protein binds saxitoxin and tetrodotoxin and in some amphibians possibly the protein saxiphilin has been proposed to be a toxin sponge for saxitoxin. However, little is known about poison frogs in particular and if toxin-binding proteins are involved in their sequestration and auto-resistance mechanisms.

      The authors use a clever approach wherein a fluorescently labeled probe of a pumiliotoxin analog (an alkaloid toxin sequestered by some poison frogs) is able to be crosslinked to proteins to which it binds. The authors then use sophisticated mass spectroscopy to identify the proteins and find an outlier 'hit' that is a serpin protein. A competition assay, as well as mutagenesis studies, revealed that this ~50-60 kDa plasma protein is responsible for binding much of the pumiliotoxin and a few other alkaloids known to be sequestered in the in vivo assay, but not nicotine, an alkaloid not sequestered by these frogs.

      In general, their results are convincing, their methods and analyses robust and the writing excellent. Their findings represent a major breakthrough in the study of toxin sequestration in poison frogs. Below, a more detailed summary and both major and minor constructive comments are given on the nature of the discoveries and some ways that the manuscript could be improved.

      Many thanks for this positive summary of our work! We greatly appreciate your time and thoroughness in giving us feedback.

      Detailed Summary

      The authors functionally characterize a serine-protease inhibitor protein in Oophaga sylvatica frog plasma, which they name O. sylvatica alkaloid-binding globulin (OsABG), that can bind toxic alkaloids. They show that OsABG is the most highly expressed serpin in O. sylvatica liver and that its expression is higher than that of albumin, a major small molecule carrier in vertebrates. Using a toxin photoprobe combined with competitive protein binding assays, their data suggest that OsABG is able to bind specific poison frog toxins including the two most abundant alkaloids in O. sylvatica skin. Their in vitro isolation of toxin-bound OsABG shows that the protein binds most free pumiliotoxin in solution and suggests that OsABG may play an important role in its sequestration. The authors further show that mutations in the binding pocket of OsABG remove its ability to bind toxins and that the binding pocket is structurally similar to that of other vertebrate serpins.

      These results are an exciting advance in understanding how poison frogs, which make and use alkaloids as chemical defenses, prevent self-intoxication. The authors provide convincing evidence that OsABG can function as a toxin sponge in O. sylvatica which sets a compelling precedent for future work needed to test the role of OsABG in vivo.

      The study could be improved by shifting the focus to O. sylvatica specifically rather than the convergent evolution of sequestration among different dendrobatid species. The reason for this is that most of the results (aside from some of the photoprobe binding results presented in Fig. 1 and Fig. 4) and the proteomics identification of OsABG itself are based on O. sylvatica. It's unclear whether ABG proteins are major toxin sponges in D. tinctorius or E. tricolor since these frogs may contain different toxin cocktails. The competitive binding results suggest that putative ABG proteins in D. tinctorius and E. tricolor have reduced binding affinity at higher toxin concentrations than ABG proteins in O. sylvatica. Although molecular convergence in toxin sponges may be at play in the dendrobatid poison frogs, more work is needed in non-O. sylvatica species to determine the extent of convergence.

      We understand and appreciate you raising this concern. As is partially described in the “essential revisions” section above, we have been more cautious throughout the results and discussion to not describe the plasma binding in E. tricolor and D. tinctorius as definitively due to ABG proteins, and to shift the overall focus to O. sylvatica.

      Major constructive comments:

      Although the protein gels in Fig.1-2 show clearly the role of ABG, a ~50 kDa protein, it's unclear whether transferrin-like proteins, which are ~80 kDa, may also play a role because the gels show proteins between 39-64 kDa (Fig.1). The gel in Fig.2A is specific to one O. sylvatica and extends this range, but the gel does not appear to be labeled accordingly, making it unclear whether other larger proteins could have been detected in addition to ABG. Clarifying this issue would facilitate the interpretation of the results.

      Thank you for this suggestion, please see our response above in the “essential revisions” section.

      There is what seems to be a significant size difference between the O. sylvatica bands and bands from the other toxic frog species, namely D. tinctorius and E. tricolor. Could the photoprobe be binding to other non-ABG proteins of different sizes in different frog species? Given that O. sylvatica bands are bright and this species was the only one subject to proteomics quantification, a possible conclusion may be that the ABG toxin sponge is a lineage-specific adaptation of O. sylvatica rather than a common mechanism of toxin sequestration among multiple independent lineages of poison frogs. It would be helpful if the authors could address this observation of their binding data and the hypothesis flowing from that in the manuscript.

      Thank you for this suggestion, please see our response above in the “essential revisions” section.

      Figure 1B: The species names should be labeled alongside the images in the phylogeny. In addition, please include symbols indicating the number of times toxicity has evolved (for example, once in the ancestors of O. sylvatica and D. tinctorius frogs and once in the ancestors of E. tricolor frogs).

      These suggested changes have been added to Figure 1B. We were not able to fit the full species names into the figure, instead we added an abbreviated version that is spelled out completely in the figure caption.

      Figure 4B-C: Photoprobe binding results in the presence of epi and nicotine appear to be missing for D. tinctorius and those in the presence of PTX and nicotine are missing for D. tricolor. Adding these results would make for a more complete picture of alkaloid binding by ABG in non-O. sylvatica species.

      Thank you for this suggestion, please see our response above in the “essential revisions” section.

      Using recombinant proteins with mutations at residues forming the binding pocket of O. sylvatica ABG (as inferred from docking simulations), the authors found that all binding pocket mutations disrupted photoprobe binding completely in vitro (L221-222, Fig. 4E). However, there is no information presented on non-binding pocket mutations. Mutations outside of the binding pocket would presumably maintain photoprobe binding - barring any indirect structural changes that might disrupt binding pocket interactions with the photoprobe. This result is important for the conclusion that the binding pocket itself is the sole mediator of toxin interactions. The authors do show that one binding pocket mutation (D383A) results in some degree of photoprobe binding (Fig. 4E) but more detail on the mutations in the binding pocket per se being causal would be helpful.

      Thank you for this suggestion, please see our response above in the “essential revisions” section.

      Please include concentrations in the descriptions of gel lanes in the main figures. The relative concentrations of the photoprobe and other toxins (eg., PTX, DHQ, epi, and nic) are essential for interpreting the competitive binding images. For example, this was done in Fig. S1 (e.g., PB + 10x PTX).

      The photoprobe and competitor concentrations have been added beneath the gels in Figures 1, 4, and 6 as suggested. Additionally, in the crosslinking experiments involving purified protein the amount of protein per well has been added to the top of the TAMRA gel.

      For clarity, the section "OsABG sequesters free PTX in solution with high affinity" could be presented directly after the section titled "Proteomic analysis identifies an alkaloid-binding globulin". The former highlights in vitro experiments confirming the binding affinity of the ABG protein identified in the latter.

      While we see how this rearrangement might work, we think that the current order of figures creates a more compelling story and provides the evidence in a more intuitive manner. For instance, it is necessary to show that recombinant protein recapitulates the plasma photoprobe results and that binding pocket mutants disrupt photoprobe binding (Figure 4), prior to showing the direct binding assays with the recombinant wild type and mutant proteins. For this reason, we believe that this rearrangement might cause confusion, and are leaving it as is.

      Fig. 6E-F should be included as part of Fig. 1 or 2. Although complementary to the RNA sequencing data, these protein results are more closely related to the results in the first two figures which show the degree of competitive binding affinity of PB in the presence of different toxins. The expanded competitive binding results for total skin alkaloids and the two most abundant skin alkaloids from wild samples are most appropriate here.

      We understand the reasoning behind this, however we feel that including these results in Figure 6 is more appropriate and that moving it would disrupt the flow of the story. The identification of ABG and its binding activity happened before we fully understood the alkaloid profiles of wild-collected O. sylvatica, therefore we did not think to test additional alkaloids like histrionicotoxin and indolizidines till we saw that these were very abundant on the skin of field collected poison frogs. Furthermore, we would like to leave this section at the end because we feel it contributes important ecological relevance that we want to leave readers with.

    1. Author Response

      Reviewer #1 (Public Review):

      This work aims to evaluate the use of pressure insoles for measurements that are traditionally done using force platforms in the assessment of people with knee osteoarthritis and other arthropathies. This is vital for providing an affordable assessment that does not require a fully equipped gait lab as well as utilizing wearable technology for personalized healthcare.

      Towards these aims, the authors were able to demonstrate that individual subjects can be identified with high precision using raw sensor data from the insoles and a convolutional neural network model. The authors have done a great job creating the models and combining an already available public dataset of force platform signals and utilizing them for training models with transferable ability to be used with data from pressure insoles. However, there are a few concerns, regarding substantiating some of the goals that this manuscript is trying to achieve.

      In addressing these concerns, if the results are further corroborated using the suggestions provided to the authors, this provides an exciting tool for identifying an individual's gait patterns out of a cluster of data, which is extremely useful for providing identifiable labels for personalized healthcare using wearable technologies.

      Thank you for this enthusiasm for our work, and we hope that our responses are adequate to address what we can of these comments. Please note that we have made every effort to address comments that we can and appreciated the detailed feedback you provided.

      Reviewer #2 (Public Review):

      The authors aimed to investigate whether digital insoles are an appropriate alternative to laboratory assessment with force plates when attempting to identify the knee injury status. The methods are rigorous and appropriate in the context of this research area. The results are impressive, and the figures are exceptional. The findings of this study can have a great impact on the field, showing that digital insoles can be accurately used for clinical purposes. The authors successfully achieved their aims.

      We thank the reviewer for this enthusiasm and hope our edits adequately address the points the reviewer made to strengthen the manuscript.

      Reviewer #3 (Public Review):

      In this manuscript, the authors describe the development of a machine-learning model to be used for gait assessment using insole data. They first developed a machine learning model using an existing, large data set of ground reaction forces collected during walking with force plates in a lab, from healthy adults and a group of people with knee injuries. Subsequently, they tested this model on ground reaction forces derived from insoles worn by a group of 19 healthy adults and a group of n=44 people with knee osteoarthritis (OA). The model was able to accurately identify individuals belonging to the knee OA group or the healthy group using the ground reaction forces during walking. Note: I do not have expertise on machine learning and will therefore refrain from reviewing the ML methods that were applied in this paper.

      Strengths: The authors successfully externally validated the trained model for GRF on insole data. Insole data carries potentially rich information, including the path of the CoP during the stance phase. The additional value of insoles over force plates in itself is clear, as insoles can be used independently of laboratory facilities. Moreover, insoles provide information on the COP path, which can have added value over other mobile assessment methods such as inertial sensors.

      Limitations: The second ML model, using only insole data to identify knee arthropathy from healthy subjects, was trained on a small sample of subjects. Although I have no background in ML, I can imagine that external validation in an independent and larger sample is needed to support the current findings.

      Gait speed has a major influence on the majority of gait-related outcomes. Slow or more cautious gait, due to pain or other causes, is reflected in vertical GRF's with less pronounced peaks. A difference in gait speed between people with pain in their knee (due to injury) and healthy subjects can be expected. This raises the question of what the added value of a model to estimate vertical GRF is over a simpler output (e.g. gait speed itself). Moreover, the paper does not elucidate what the added value of machine learning is over a simpler statistical model.

      This is a good point, however, clinically we are interested in weight bearing and difference in pressure related metrics in this musculoskeletal group, which speed will simply not provide. So we are looking at additional metrics.

      There are numerous publications suggesting that non-speed related metrics are important to predict disease progression in a variety of conditions (e.g., D’Lima DD, Fregly BJ, Pail S, Steklov N, Colwell CW. Knee joint forces: prediction, measurement and significance. Proc Inst Mech Eng H. 2012:226:95–102. https://www.ncbi.nlm.nih.gov/pmc/articles/PMC3324308/). In OA, the vector on ground force in medial knee OA (not vertical) creates torque and that is correlated with disease progression. We have modified the text throughout to address these points.

      In line with this issue, the current analyses are not strongly convincing me that the model described resulted in an identification of knee arthropathy-specific signature. Only knee arthropathy vs healthy (relatively young) subjects was compared, and we cannot rule out that this group only reflects general cautious, slow, or antalgic gait. As such, the data does not provide any evidence that the tool might be valuable to identify people with more or less severity of symptoms, or that the tool can be used to discriminate knee osteoarthritis from hip, or ankle osteoarthritis, or even to discriminate between people with musculoskeletal diseases and people with neurological gait disorders. This substantially limits the relevance for clinical (research) practice. In short, the output of the model seems to be restricted to "something is going on here", without further specification. Further development towards more specific aims using the insole data may substantially amplify clinical relevance.

      While no dataset (or model) is perfect, we feel that this is the first time that this model has been developed and applied in this cohort/clinical context, and of course acknowledge that future work is needed to further validate and examine how clinically meaningful this model is.

      We have broken out and added to a Study limitations section within the manuscript to reflect these caveats more clearly.

    1. Author Response

      The following is the authors’ response to the original reviews.

      eLife assessment

      This important paper exploits new cryo-EM tomography tools to examine the state of chromatin in situ. The experimental work is meticulously performed and convincing, with a vast amount of data collected. The main findings are interpreted by the authors to suggest that the majority of yeast nucleosomes lack a stable octameric conformation. Despite the possibly controversial nature of this report, it is our hope that such work will spark thought-provoking debate, and further the development of exciting new tools that can interrogate native chromatin shape and associated function in vivo.

      We thank the Editors and Reviewers for their thoughtful and helpful comments. We also appreciate the extraordinary amount of effort needed to assess both the lengthy manuscript and the previous reviews. Below, we provide our point-by-point response in bold blue font. Nearly all comments have been addressed in the revised manuscript. For a subset of comments that would require us to speculate, we have taken a conservative approach because we either lack key information or technical expertise: Instead of adding the speculative replies to the main text, we think it is better to leave them in the rebuttal for posterity. Readers will thereby have access to our speculation and know that we did not feel confident enough to include these thoughts in the Version of Record.

      Reviewer #1 (Public Review):

      This manuscript by Tan et al is using cryo-electron tomography to investigate the structure of yeast nucleosomes both ex vivo (nuclear lysates) and in situ (lamellae and cryosections). The sheer number of experiments and results are astounding and comparable with an entire PhD thesis. However, as is always the case, it is hard to prove that something is not there. In this case, canonical nucleosomes. In their path to find the nucleosomes, the authors also stumble over new insights into nucleosome arrangement that indicates that the positions of the histones is more flexible than previously believed.

      Please note that canonical nucleosomes are there in wild-type cells in situ, albeit rarer than what’s expected based on our HeLa cell analysis and especially the total number of yeast nucleosomes (canonical plus non-canonical). The negative result (absence of any canonical nucleosome classes in situ) was found in the histone-GFP mutants.

      Major strengths and weaknesses:

      Personally, I am not ready to agree with their conclusion that heterogenous non-canonical nucleosomes predominate in yeast cells, but this reviewer is not an expert in the field of nucleosomes and can't judge how well these results fit into previous results in the field. As a technological expert though, I think the authors have done everything possible to test that hypothesis with today's available methods. One can debate whether it is necessary to have 35 supplementary figures, but after working through them all, I see that the nature of the argument needs all that support, precisely because it is so hard to show what is not there. The massive amount of work that has gone into this manuscript and the state-of-the art nature of the technology should be warmly commended. I also think the authors have done a really great job with including all their results to the benefit of the scientific community. Yet, I am left with some questions and comments:

      Could the nucleosomes change into other shapes that were predetermined in situ? Could the authors expand on if there was a structure or two that was more common than the others of the classes they found? Or would this not have been found because of the template matching and later reference particle used?

      Our best guess (speculation) is that one of the class averages that is smaller than the canonical nucleosome contains one or more non-canonical nucleosome classes. However, we do not feel confident enough to single out any of these classes precisely because we do not yet know if they arise from one non-canonical nucleosome structure or from multiple – and therefore mis-classified – non-canonical nucleosome structures (potentially with other non-nucleosome complexes mixed in). We feel it is better to leave this discussion out of the manuscript, or risk sending the community on wild goose chases.

      Our template-matching workflow uses a low-enough cross-correlation threshold that any nucleosome-sized particle (plus minus a few nanometers) would be picked, which is why the number of hits is so large. So unless the noncanonical nucleosomes quadrupled in size or lost most of their histones, they should be grouped with one or more of the other 99 class averages (WT cells) or any of the 100 class averages (cells with GFP-tagged histones). As to whether the later reference particle could have prevented us from detecting one of the non-canonical nucleosome structures, we are unable to tell because we’d really have to know what an in situ non-canonical nucleosome looks like first.

      Could it simply be that the yeast nucleoplasm is differently structured than that of HeLa cells and it was harder to find nucleosomes by template matching in these cells? The authors argue against crowding in the discussion, but maybe it is just a nucleoplasm texture that side-tracks the programs?

      Presumably, the nucleoplasmic “side-tracking” texture would come from some molecules in the yeast nucleus. These molecules would be too small to visualize as discrete particles in the tomographic slices, but they would contribute textures that can be “seen” by the programs – in particular RELION, which does the discrimination between structural states. We are not sure what types of density textures would side-track RELION’s classification routines.

      The title of the paper is not well reflected in the main figures. The title of Figure 2 says "Canonical nucleosomes are rare in wild-type cells", but that is not shown/quantified in that figure. Rare is comparison to what? I suggest adding a comparative view from the HeLa cells, like the text does in lines 195-199. A measure of nucleosomes detected per volume nucleoplasm would also facilitate a comparison.

      Figure 2’s title is indeed unclear and does not align with the paper’s title and key conclusion. The rarity here is relative to the expected number of nucleosomes (canonical plus non-canonical). We have changed the title to:

      “Canonical nucleosomes are a minority of the expected total in wild-type cells”.

      We would prefer to leave the reference to HeLa cells to the main text instead of as a figure panel because the comparison is not straightforward for a graphical presentation. Instead, we now report the total number of nucleosomes estimated for this particular yeast tomogram (~7,600) versus the number of canonical nucleosomes classified (297; 594 if we assume we missed half of them). This information is in the revised figure legend:

      “In this tomogram, we estimate there are ~7,600 nucleosomes (see Methods on how the calculation is done), of which 297 are canonical structures. Accounting for the missing disc views, we estimate there are ~594 canonical nucleosomes in this cryolamella (< 8% the expected number of nucleosomes).”

      If the cell contains mostly non-canonical nucleosomes, are they really non-canonical? Maybe a change of language is required once this is somewhat sure (say, after line 303).

      This is an interesting semantic and philosophical point. From the yeast cell’s “perspective”, the canonical nucleosome structure would be the form that is in the majority. That being said, we do not know if there is one structure that is the majority. From the chromatin field’s point of view, the canonical nucleosome is the form that is most commonly seen in all the historical – and most contemporary – literature, namely something that resembles the crystal structure of Luger et al, 1997. Given these two lines of thinking, we added the following clarification as lines 312 – 316:

      “At present, we do not know what the non-canonical nucleosome structures are, meaning that we cannot even determine if one non-canonical structure is the majority. Until we know the non-canonical nucleosomes’ structures, we will use the term non-canonical to describe all the nucleosomes that do not have the canonical (crystal) structure.”

      The authors could explain more why they sometimes use conventional the 2D followed by 3D classification approach and sometimes "direct 3-D classification". Why, for example, do they do 2D followed by 3D in Figure S5A? This Figure could be considered a regular figure since it shows the main message of the paper.

      Since the classification of subtomograms in situ is still a work in progress, we felt it would be better to show one instance of 2-D classification for lysates and one for lamellae. While it is true that we could have presented direct 3-D classification for the entire paper, we anticipate that readers will be interested to see what the in situ 2-D class averages look like.

      The main message is that there are canonical nucleosomes in situ (at least in wild-type cells), but they are a minority. Therefore, the conventional classification for Figure S5A should not be a main figure because it does not show any canonical nucleosome class averages in situ.

      Figure 1: Why is there a gap in the middle of the nucleosome in panel B? The authors write that this is a higher resolution structure (18Å), but in the even higher resolution crystallography structure (3Å resolution), there is no gap in the middle.

      There is a lower concentration of amino acids at the middle in the disc view; unfortunately, the space-filling model in Figure 1A hides this feature. The gap exists in experimental cryo-EM density maps. See Author response image 1 for an example (pubmed.ncbi.nlm.nih.gov/29626188). The size of the gap depends on the contour level and probably the contrast mechanism, as the gap is less visible in the VPP subtomogram averages. To clarify this confusing phenomenon, we added the following lines to the figure legend:

      “The gap in the disc view of the nuclear-lysate-based average is due to the lower concentration of amino acids there, which is not visible in panel A due to space-filling rendering. This gap’s visibility may also depend on the contrast mechanism because it is not visible in the VPP averages.”

      Author response image 1.

      Reviewer #2 (Public Review):

      Nucleosome structures inside cells remain unclear. Tan et al. tackled this problem using cryo-ET and 3-D classification analysis of yeast cells. The authors found that the fraction of canonical nucleosomes in the cell could be less than 10% of total nucleosomes. The finding is consistent with the unstable property of yeast nucleosomes and the high proportion of the actively transcribed yeast genome. The authors made an important point in understanding chromatin structure in situ. Overall, the paper is well-written and informative to the chromatin/chromosome field.

      We thank Reviewer 2 for their positive assessment.

      Reviewer #3 (Public Review):

      Several labs in the 1970s published fundamental work revealing that almost all eukaryotes organize their DNA into repeating units called nucleosomes, which form the chromatin fiber. Decades of elegant biochemical and structural work indicated a primarily octameric organization of the nucleosome with 2 copies of each histone H2A, H2B, H3 and H4, wrapping 147bp of DNA in a left handed toroid, to which linker histone would bind.

      This was true for most species studied (except, yeast lack linker histone) and was recapitulated in stunning detail by in vitro reconstitutions by salt dialysis or chaperone-mediated assembly of nucleosomes. Thus, these landmark studies set the stage for an exploding number of papers on the topic of chromatin in the past 45 years.

      An emerging counterpoint to the prevailing idea of static particles is that nucleosomes are much more dynamic and can undergo spontaneous transformation. Such dynamics could arise from intrinsic instability due to DNA structural deformation, specific histone variants or their mutations, post-translational histone modifications which weaken the main contacts, protein partners, and predominantly, from active processes like ATP-dependent chromatin remodeling, transcription, repair and replication.

      This paper is important because it tests this idea whole-scale, applying novel cryo-EM tomography tools to examine the state of chromatin in yeast lysates or cryo-sections. The experimental work is meticulously performed, with vast amount of data collected. The main findings are interpreted by the authors to suggest that majority of yeast nucleosomes lack a stable octameric conformation. The findings are not surprising in that alternative conformations of nucleosomes might exist in vivo, but rather in the sheer scale of such particles reported, relative to the traditional form expected from decades of biochemical, biophysical and structural data. Thus, it is likely that this work will be perceived as controversial. Nonetheless, we believe these kinds of tools represent an important advance for in situ analysis of chromatin. We also think the field should have the opportunity to carefully evaluate the data and assess whether the claims are supported, or consider what additional experiments could be done to further test the conceptual claims made. It is our hope that such work will spark thought-provoking debate in a collegial fashion, and lead to the development of exciting new tools which can interrogate native chromatin shape in vivo. Most importantly, it will be critical to assess biological implications associated with more dynamic - or static forms- of nucleosomes, the associated chromatin fiber, and its three-dimensional organization, for nuclear or mitotic function.

      Thank you for putting our work in the context of the field’s trajectory. We hope our EMPIAR entry, which includes all the raw data used in this paper, will be useful for the community. As more labs (hopefully) upload their raw data and as image-processing continues to advance, the field will be able to revisit the question of non-canonical nucleosomes in budding yeast and other organisms. 

      Reviewer #1 (Recommendations For The Authors):

      The manuscript sometimes reads like a part of a series rather than a stand-alone paper. Be sure to spell out what needs to be known from previous work to read this article. The introduction is very EM-technique focused but could do with more nucleosome information.

      We have added a new paragraph that discusses the sources of structural variability to better prepare readers, as lines 50 – 59:

      “In the context of chromatin, nucleosomes are not discrete particles because sequential nucleosomes are connected by short stretches of linker DNA. Variation in linker DNA structure is a source of chromatin conformational heterogeneity (Collepardo-Guevara and Schlick, 2014). Recent cryo-EM studies show that nucleosomes can deviate from the canonical form in vitro, primarily in the structure of DNA near the entry/exit site (Bilokapic et al., 2018; Fukushima et al., 2022; Sato et al., 2021; Zhou et al., 2021). In addition to DNA structural variability, nucleosomes in vitro have small changes in histone conformations (Bilokapic et al., 2018). Larger-scale variations of DNA and histone structure are not compatible with high-resolution analysis and may have been missed in single-particle cryo-EM studies.”

      Line 165-6 "did not reveal a nucleosome class average in..". Add "canonical", since it otherwise suggests there were no nucleosomes.

      Thank you for catching this error. Corrected.

      Lines 177-182: Why are the disc views missed by the classification analysis? They should be there in the sample, as you say.

      We suspect that RELION 3 is misclassifying the disc-view canonical nucleosomes into the other classes. The RELION developers suspect that view-dependent misclassification arises from RELION 3’s 3-D CTF model. RELION 4 is reported to be less biased by the particles’ views. We have started testing RELION 4 but do not have anything concrete to report yet.

      Line 222: a GFP tag.

      Fixed.

      Line 382: "Note that the percentage .." I can't follow this sentence. Why would you need to know how many chromosome's worth of nucleosomes you are looking at to say the percentage of non-canonical nucleosomes?

      Thank you for noticing this confusing wording. The sentence has been both simplified and clarified as follows in lines 396 – 398:

      “Note that the percentage of canonical nucleosomes in lysates cannot be accurately estimated because we cannot determine how many nucleosomes in total are in each field of view.”

      Line 397: "We're not implying that..." Please add a sentence clearly stating what you DO mean with mobility for H2A/H2B.

      We have added the following clarifying sentence in lines 412 – 413:

      “We mean that H2A-H2B is attached to the rest of the nucleosome and can have small differences in orientation.”

      Line 428: repeated message from line 424. "in this figure, the blurring implies.."

      Redundant phrase removed.

      Line 439: "on a HeLa cell" - a single cell in the whole study?

      Yes, that study was done on a single cell.

      A general comment is that the authors could help the reader more by developing the figures and making them more pedagogical, a list of suggestions can be found below.

      Thank you for the suggestions. We have applied all of them to the specific figure callouts and to the other figures that could use similar clarification.

      Figure 2: Help the reader by avoiding abbreviations in the figure legend. VPP tomographic slice - spell out "Volta Phase Plate". Same with the term "remapped" (panel B) what does that mean?

      We spelled out Volta phase plate in full and explained “remapped” the additional figure legend text:

      “the class averages were oriented and positioned in the locations of their contributing subtomograms”.

      Supplementary figures:

      Figure S3: It is unclear what you mean with "two types of BY4741 nucleosomes". You then say that the canonical nucleosomes are shaded blue. So what color is then the non-canonical? All the greys? Some of them look just like random stuff, not nucleosomes.

      “Two types” is a typo and has been removed and “nucleosomes” has been replaced with “candidate nucleosome template-matching hits” to accurately reflect the particles used in classification.

      Figure S6: Top left says "3 tomograms (defocus)". I wonder if you meant to add the defocus range here. I have understood it like this is the same data as shown in Figure S5, which makes me wonder if this top cartoon should not be on top of that figure too (or exclusively there).

      To make Figures S6 (and S5) clearer, we have copied the top cartoon from Figure S6 to S5.

      Note that we corrected a typo for these figures (and the Table S7): the number of template-matched candidate nucleosomes should be 93,204, not 62,428.

      The description in the parentheses (defocus) is shorthand for defocus phase contrast and was not intended to also display a defocus range. All of the revised figure legends now report the meaning of both this shorthand and of the Volta phase plate (VPP).

      To help readers see the relationship between these two figures, we added the following clarifying text to the Figure S5 and S6 legends, respectively:

      “This workflow uses the same template-matched candidate nucleosomes as in Figure S6; see below.”

      “This workflow uses the same template-matched candidate nucleosomes as in Figure S5.”

      Figure S7: In the first panel, it is unclear why the featureless cylinder is shown as it is not used as a reference here. Rather, it could be put throughout where it was used and then put the simulated EM-map alone here. If left in, it should be stated in the legend that it was not used here.

      It would indeed be much clearer to show the featureless cylinder in all the other figures and leave the simulated nucleosome in this control figure. All figures are now updated. The figure legend was also updated as follows:

      “(A) A simulated EM map from a crystal structure of the nucleosome was used as the template-matching and 3-D classification reference.”

      Figure S18: Why are there classes where the GFP density is missing? Mention something about this in the figure legend.

      We have appended the following speculations to explain the “missing” GFP densities:

      “Some of the class averages are “missing” one or both expected GFP densities. The possible explanations include mobility of a subpopulation of GFPs or H2A-GFPs, incorrectly folded GFPs, or substitution of H2A for the variant histone H2A.Z.”

      Reviewer #2 (Recommendations For The Authors):

      My specific (rather minor) comments are the following:

      1) Abstract:

      yeast -> budding yeast.

      All three instances in the abstract have been replaced with “budding yeast”.

      It would be better to clarify what ex vivo means here.

      We have appended “(in nuclear lysates)” to explain the meaning of ex vivo.

      2) Some subtitles are unclear.

      e.g., "in wild-type lysates" -> "wild-type yeast lysates"

      Thank you for this suggestion. All unclear instances of subtitles and sample descriptions throughout the text have been corrected.

      3) Page 6, Line 113. "...which detects more canonical nucleosomes." A similar thing was already mentioned in the same paragraph and seems redundant.

      Thank you for noticing this redundant statement, which is now deleted.

      4) Page 25, Line 525. "However, crowding is an unlikely explanation..." Please note that many macromolecules (proteins, RNAs, polysaccharides, etc.) were lost during the nuclei isolation process.

      This is a good point. We have rewritten this paragraph to separate the discussion on technical versus biological effects of crowding, in lines 538 – 546:

      “Another hypothesis for the low numbers of detected canonical nucleosomes is that the nucleoplasm is too crowded, making the image processing infeasible. However, crowding is an unlikely technical limitation because we were able to detect canonical nucleosome class averages in our most-crowded nuclear lysates, which are so crowded that most nucleosomes are butted against others (Figures S15 and S16). Crowding may instead have biological contributions to the different subtomogram-analysis outcomes in cell nuclei and nuclear lysates. For example, the crowding from other nuclear constituents (proteins, RNAs, polysaccharides, etc.) may contribute to in situ nucleosome structure, but is lost during nucleus isolation.”

      5) Page 7, Line 126. "The subtomogram average..." Is there any explanation for this?

      Presumably, the longer linker DNA length corresponds to the ordered portion of the ~22 bp linker between consecutive nucleosomes, given the ~168 bp nucleosome repeat length. We have appended the following explanation as the concluding sentence, lines 137 – 140:

      “Because the nucleosome-repeat length of budding yeast chromatin is ~168 bp (Brogaard et al., 2012), this extra length of DNA may come from an ordered portion of the ~22 bp linker between adjacent nucleosomes.”

      6) "Histone GFP-tagging strategy" subsection:

      Since this subsection is a bit off the mainstream of the paper, it can be shortened and merged into the next one.

      We have merged the “Histone GFP-tagging strategy” and “GFP is detectable on nucleosome subtomogram averages ex vivo” subsections and shortened the text as much as possible. The new subsection is entitled “Histone GFP-tagging and visualization ex vivo”

      7) Page 16, Line 329. "Because all attempts to make H3- or H4-GFP "sole source" strains failed..." Is there a possible explanation here? Cytotoxic effect because of steric hindrance of nucleosomes?

      Yes, it is possible that the GFP tag is interfering with the nucleosomes interactions with its numerous partners. It is also possible that the histone-GFP fusions do not import and/or assemble efficiently enough to support a bare-minimum number of functional nucleosomes. Given that the phenotypic consequences of fusion tags is an underexplored topic and that we don’t have any data on the (dead) transformants, we would prefer to leave out the speculation about the cause of death in the attempted creation of “sole source” strains.

    2. Author Response

      eLife assessment

      This important paper exploits new cryo-EM tomography tools to examine the state of chromatin in situ. The experimental work is meticulously performed and convincing, with a vast amount of data collected. The main findings are interpreted by the authors to suggest that the majority of yeast nucleosomes lack a stable octameric conformation. Despite the possibly controversial nature of this report, it is our hope that such work will spark thought-provoking debate, and further the development of exciting new tools that can interrogate native chromatin shape and associated function in vivo.

      We thank the Editors and Reviewers for their thoughtful and helpful comments. We also appreciate the extraordinary amount of effort needed to assess both the lengthy manuscript and the previous reviews. Below, we provide our provisional responses in bold blue font. The majority of the comments are straightforward to address. We have taken a more conservative approach with the subset of comments that would require us to speculate because we either lack key information or we lack technical expertise. Instead of adding the speculative replies to the main text, we think it will be better to leave them in the rebuttal for posterity. Readers will therefore have access to our speculation and know that we did not feel confident enough to include these thoughts in the Version of Record.

      Reviewer #1 (Public Review):

      This manuscript by Tan et al is using cryo-electron tomography to investigate the structure of yeast nucleosomes both ex vivo (nuclear lysates) and in situ (lamellae and cryosections). The sheer number of experiments and results are astounding and comparable with an entire PhD thesis. However, as is always the case, it is hard to prove that something is not there. In this case, canonical nucleosomes. In their path to find the nucleosomes, the authors also stumble over new insights into nucleosome arrangement that indicates that the positions of the histones is more flexible than previously believed.

      We want to point out that canonical nucleosomes are there in wild-type cells in situ, albeit rarer than what’s expected based on our HeLa cell analysis. The negative result (absence of any canonical nucleosome classes in situ) was found in the histone-GFP mutants.

      Major strengths and weaknesses:

      Personally, I am not ready to agree with their conclusion that heterogenous non-canonical nucleosomes predominate in yeast cells, but this reviewer is not an expert in the field of nucleosomes and can't judge how well these results fit into previous results in the field. As a technological expert though, I think the authors have done everything possible to test that hypothesis with today's available methods. One can debate whether it is necessary to have 35 supplementary figures, but after working through them all, I see that the nature of the argument needs all that support, precisely because it is so hard to show what is not there. The massive amount of work that has gone into this manuscript and the state-of-the art nature of the technology should be warmly commended. I also think the authors have done a really great job with including all their results to the benefit of the scientific community. Yet, I am left with some questions and comments:

      Could the nucleosomes change into other shapes that were predetermined in situ? Could the authors expand on if there was a structure or two that was more common than the others of the classes they found? Or would this not have been found because of the template matching and later reference particle used?

      Our best guess (speculation) is that one of the class averages that is smaller than the canonical nucleosome contains one or more non-canonical nucleosome classes. We do not feel confident enough to single out any of these classes precisely because we do not yet know if they arise from one non-canonical nucleosome structure or from multiple – and therefore mis-classified – non-canonical nucleosome structures (potentially with other non-nucleosome complexes mixed in). We feel it is better to leave this discussion out of the manuscript, or risk sending the community on wild goose chases.

      Our template-matching workflow uses a low-enough cross-correlation threshold that any nucleosome-sized particle (plus minus a few nanometers) would be picked, which is why the number of hits is so large. So unless the noncanonical nucleosomes quadrupled in size or lost most of their histones, they should be grouped with one or more of the other 99 class averages (WT cells) or any of the 100 class averages (cells with GFP-tagged histones). As to whether the later reference particle could have prevented us from detecting one of the non-canonical nucleosome structures, we are unable to tell because we’d really have to know what an in situ non-canonical nucleosome looks like first.

      Could it simply be that the yeast nucleoplasm is differently structured than that of HeLa cells and it was harder to find nucleosomes by template matching in these cells? The authors argue against crowding in the discussion, but maybe it is just a nucleoplasm texture that side-tracks the programs?

      Presumably, the nucleoplasmic “side-tracking” texture would come from some molecules in the yeast nucleus. These molecules would be too small to visualize as discrete particles in the tomographic slices, but they would contribute textures that can be “seen” by the programs – in particular RELION, which does the discrimination between structural states. We do not know the inner-workings of RELION well enough to say what kinds of density textures would side-track its classification routines.

      The title of the paper is not well reflected in the main figures. The title of Figure 2 says "Canonical nucleosomes are rare in wild-type cells", but that is not shown/quantified in that figure. Rare is comparison to what? I suggest adding a comparative view from the HeLa cells, like the text does in lines 195-199. A measure of nucleosomes detected per volume nucleoplasm would also facilitate a comparison.

      Figure 2’s title is indeed unclear and does not align with the paper’s title and key conclusion. The rarity here is relative to the expected number of nucleosomes (canonical plus non-canonical). We have changed the title to “Canonical nucleosomes are a minority of the expected total in wild-type cells”. We would prefer to leave the reference to HeLa cells to the main text instead of as a figure panel because the comparison is not straightforward for a graphical presentation. Instead, we will report the total number of nucleosomes estimated for this particular tomogram (~7,600) versus the number of canonical nucleosomes classified (297; 594 if we assume we missed half of them).

      If the cell contains mostly non-canonical nucleosomes, are they really non-canonical? Maybe a change of language is required once this is somewhat sure (say, after line 303).

      This is an interesting semantic and philosophical point. From the yeast cell’s “perspective”, the canonical nucleosome structure would be the form that is in the majority. That being said, we do not know if there is one structure that is the majority. From the chromatin field’s point of view, the canonical nucleosome is the form that is most commonly seen in all the historical – and most contemporary – literature, namely something that resembles the crystal structure of Luger et al, 1997. Given these two lines of thinking, we will add the following clarification after line 303:

      “At present, we do not know what the non-canonical nucleosome structures are, meaning that we cannot even determine if one non-canonical structure is the majority. Until we know what the family of non-canonical nucleosome structures are, we will use the term non-canonical to describe the nucleosomes that do not have the canonical (crystal) structure”.

      The authors could explain more why they sometimes use conventional the 2D followed by 3D classification approach and sometimes "direct 3-D classification". Why, for example, do they do 2D followed by 3D in Figure S5A? This Figure could be considered a regular figure since it shows the main message of the paper.

      Because the classification of subtomograms in situ is still a work in progress, we felt it would be better to show one instance of 2-D classification for lysates and one for lamellae. While it is true that we could have presented direct 3-D classification for the entire paper, we anticipate that readers will be interested to see what the in situ 2-D class averages look like.

      The main message is that there are canonical nucleosomes in situ (at least in wild-type cells), but they are a minority. Therefore, the conventional classification for Figure S5A should not be a main figure because it does not show any canonical nucleosome class averages in situ.

      Figure 1: Why is there a gap in the middle of the nucleosome in panel B? The authors write that this is a higher resolution structure (18Å), but in the even higher resolution crystallography structure (3Å resolution), there is no gap in the middle.

      There is a lower concentration of amino acids at the middle in the disc view; unfortunately, the space-filling model in Figure 1A hides this feature. The gap exists in experimental cryo-EM density maps. See below for an example. The size of the gap depends on the contour level and probably the contrast mechanism, as the gap is less visible in the VPP subtomogram averages. To clarify this confusing phenomenon, we will add the following lines to the figure legend:

      “The gap in the disc view of the nuclear-lysate-based average is due to the lower concentration of amino acids there, which is not visible in panel A due to space-filling rendering. This gap’s size may depend on the contrast mechanism because it is not visible in the VPP averages.”

      Reviewer #2 (Public Review):

      Nucleosome structures inside cells remain unclear. Tan et al. tackled this problem using cryo-ET and 3-D classification analysis of yeast cells. The authors found that the fraction of canonical nucleosomes in the cell could be less than 10% of total nucleosomes. The finding is consistent with the unstable property of yeast nucleosomes and the high proportion of the actively transcribed yeast genome. The authors made an important point in understanding chromatin structure in situ. Overall, the paper is well-written and informative to the chromatin/chromosome field.

      We thank Reviewer 2 for their positive assessment.

      Reviewer #3 (Public Review):

      Several labs in the 1970s published fundamental work revealing that almost all eukaryotes organize their DNA into repeating units called nucleosomes, which form the chromatin fiber. Decades of elegant biochemical and structural work indicated a primarily octameric organization of the nucleosome with 2 copies of each histone H2A, H2B, H3 and H4, wrapping 147bp of DNA in a left handed toroid, to which linker histone would bind.

      This was true for most species studied (except, yeast lack linker histone) and was recapitulated in stunning detail by in vitro reconstitutions by salt dialysis or chaperone-mediated assembly of nucleosomes. Thus, these landmark studies set the stage for an exploding number of papers on the topic of chromatin in the past 45 years.

      An emerging counterpoint to the prevailing idea of static particles is that nucleosomes are much more dynamic and can undergo spontaneous transformation. Such dynamics could arise from intrinsic instability due to DNA structural deformation, specific histone variants or their mutations, post-translational histone modifications which weaken the main contacts, protein partners, and predominantly, from active processes like ATP-dependent chromatin remodeling, transcription, repair and replication.

      This paper is important because it tests this idea whole-scale, applying novel cryo-EM tomography tools to examine the state of chromatin in yeast lysates or cryo-sections. The experimental work is meticulously performed, with vast amount of data collected. The main findings are interpreted by the authors to suggest that majority of yeast nucleosomes lack a stable octameric conformation. The findings are not surprising in that alternative conformations of nucleosomes might exist in vivo, but rather in the sheer scale of such particles reported, relative to the traditional form expected from decades of biochemical, biophysical and structural data. Thus, it is likely that this work will be perceived as controversial. Nonetheless, we believe these kinds of tools represent an important advance for in situ analysis of chromatin. We also think the field should have the opportunity to carefully evaluate the data and assess whether the claims are supported, or consider what additional experiments could be done to further test the conceptual claims made. It is our hope that such work will spark thought-provoking debate in a collegial fashion, and lead to the development of exciting new tools which can interrogate native chromatin shape in vivo. Most importantly, it will be critical to assess biological implications associated with more dynamic - or static forms- of nucleosomes, the associated chromatin fiber, and its three-dimensional organization, for nuclear or mitotic function.

      Thank you for putting our work in the context of the field’s trajectory. We hope our EMPIAR entry, which includes all the raw data used in this paper, will be useful for the community. As more labs (hopefully) upload their raw data and as image-processing continues to advance, the field will be able to revisit the question of non-canonical nucleosomes in budding yeast and other organisms.

    1. Author Response

      The following is the authors’ response to the original reviews.

      Public Reviews:

      Reviewer #1 (Public Review):

      Trebino et al. investigated the BRAF activation process by analysing the interactions of BRAF N-terminal regulatory regions (CRD, RBD, and BSR) with the C-terminal kinase domain and with the upstream regulators HRAS and KRAS. To this end, they generated four constructs comprising different combinations of N-terminal domains of BRAF and analysed their interaction with HRAS as well as conformational changes that occur. By HDX-MS they confirmed that the RBD is indeed the main mediator of interaction with HRAS. Moreover, they observed that HRAS binding leads to conformational changes exposing the BSR to the environment. Next, the authors used OpenSPR to determine the binding affinities of HRAS to the different BRAF constructs. While BSR+RBD, RBD+CRD, and RBD bound HRAS with nanomolar affinity, no binding was observed with the construct comprising all three domains. Based on these experiments, the authors concluded that BSR and CRD negatively regulate binding to HRAS and hypothesised that BSR may confer some RAS isoform specificity. They corroborated this notion by showing that KRAS bound to BRAF-NT1 (BSR+RBD+CRD) while HRAS did not. Next, the authors analysed the autoinhibitory interaction occurring between the N-terminal regions and the kinase domain. Through pulldown and OpenSPR experiments, they confirm that it is mainly the CRD that makes the necessary contacts with the kinase domain. In addition, they show that the BSR stabilizes these interactions and that the addition of HRAS abolishes them. Finally, the D594G mutation within the KD of BRAF is shown to destabilise these autoinhibitory interactions, which could explain its oncogenic potential.

      Overall, the in vitro study provides new insights into the regulation of BRAF and its interactions with HRAS and KRAS through a comprehensive in vitro analysis of the BRAF N-terminal region. Also, the authors report the first KD values for the N- and C-terminal interactions of BRAF and show that the BSR might provide isoform specificity towards KRAS. While these findings could be useful for the development of a new generation of inhibitors, the overall impact of the manuscript could probably be enhanced if the authors were to investigate in more detail how the BSR-mediated specificity of BRAF towards certain RAS isoforms is achieved. Moreover, though the very "clean" in vitro approach is appreciated, it also seems useful to examine whether the observed interactions and conformational changes occur in the full-length BRAF molecule and in more physiological contexts. Some of the results could be compared with studies including full-length constructs.

      Public Response: We would like to express our gratitude for your valuable feedback on our manuscript. Your insightful suggestions have significantly improved the quality and completeness of our research. In response to your comments, we have conducted additional experiments and incorporated new data into the revised manuscript.

      To gain a deeper understanding of how the BSR-mediated specificity of BRAF towards certain RAS isoforms is achieved, we performed HDX-MS to investigate the impact of KRAS interactions on the BSR. Our findings indicate that when KRAS is bound to BRAF NT2, there is no significant difference in hydrogen-deuterium exchange rates in the BSR compared to the apo-NT2 state (Figure 4). This observation contrasts with the effect of HRAS binding, where peptides from the BRAF-BSR exhibit an increased rate change, suggesting that HRAS induces a conformationally more dynamic state (Figure 2).

      Our results align with the conclusions of Terrell et al. in their 2019 publication, which propose that isoform preferences in the RAS-RAF interaction are driven by opposite charge attractions between BRAF-BSR and KRAS-HVR, promoting the interaction.1 Our data offers a potential mechanistic explanation, suggesting that HRAS disrupts the conformational stability of the BSR provided by the RBD, while KRAS-HVR restores stability and enhances interaction favorability. It is important to note that our results do not directly confirm a long-lasting interaction between the BRAF-BSR and KRAS-HVR, but they do not rule out the possibility of a transient, low-affinity interaction or close proximity between the two.

      Furthermore, our binding kinetics measurements conducted using OpenSPR support these findings. Particularly, in the case of NT1, when the CRD accompanies the BSR and RBD, no interactions with HRAS were observed. Additionally, we quantified the binding affinities between NT3:KRAS and NT4:KRAS, demonstrating that they are equally strong and that the presence of the BSR or CRD does not singularly affect the primary RBD interaction, consistent with HRAS. The BSR appears to exert an inhibitory effect on HRAS when the entire N-terminal region (BSR+RBD+CRD) is present. The BSR-mediated specificity is achieved through a coordinated interplay with the CRD.

      Moreover, we have addressed your concern regarding the physiological relevance of our conclusions. In response, we utilized active, full-length (FL) BRAF purified from HEK293F cells in OpenSPR experiments. Our findings indicate that FL-BRAF behaves similarly to BRAF-NT1, as it does not bind to HRAS but binds to KRAS with a deviation comparable to NT1. We have demonstrated that post-translational modifications or native intramolecular interactions do not alter our initial results. Several literature sources, employing cell systems or expressing proteins from insect or mammalian cells, further support the findings presented in our study.2–5

      Thank you once again for your constructive feedback, which has contributed significantly to the refinement of our work.

      For the author:

      Major points:

      1. Figure 1D: Negative control is missing.

      Response: We have incorporated the negative control into this figure as suggested.

      1. Figure 3F and G: negative controls (GST only) are missing.

      Response: We have incorporated the negative control into this figure as suggested.

      1. The authors demonstrate that BRAF NT1 (BSR+RBD+CRD) interacts with KRAS but not HRAS in SPR experiments (Figure 4). What about the conformational change that affects the positioning of BSR when NT2 (BSR+RBD) binds to HRAS (Figure 2)? Does it also occur with KRAS or not? When a rate change is observed between free protein and bound protein in HDX, particularly when this rate change results in a sigmoidal curve that closely parallels the reference curve, it signifies that all residues within the peptide share a uniform protection factor. This suggests that they collectively undergo conformational changes at the same rate, likely due to a concerted opening as a cohesive unit. In the context of our time plots, we observe this distinctive characteristic in the curves derived from the BSR peptides, indicating that HRAS binding perturbs this region, alters its flexibility, and induces a coordinated conformational shift. This compelling evidence strongly supports our assertion that HRAS instigates a reorientation of the BSR.

      Response: In response to the reviewer's comments, we conducted additional experiments to explore whether KRAS elicits any comparable alterations in the H-D exchange of the BSR within BRAF-NT2. Our findings indicate that KRAS does not induce a similar conformational change in the BSR. We have detailed these results in the Results section under the heading "BSR Differentiates the BRAF-KRAS Interaction from the BRAF-HRAS Interaction" and have included corresponding panels in Figure 4 to visually illustrate these observations.

      1. Related to point 3: The authors mention that the HVR domain is responsible for isoform-specific differences. Does the BSR interact with the HVR domain of KRAS (but not HRAS)?

      Response: It has been suggested by Terrell and colleagues1 that the BRAF-BSR and KRASHVR are directly responsible for the isoform specific interactions. We have no direct evidence confirming an interaction between the HVR and BSR. However, we deduce the possibility of such interaction based on previous research findings. Our HDX-MS experiments have demonstrated that the BRAF-BSR does not engage with HRAS. In our new HDX-MS experiments involving KRAS, we observed that the presence of KRAS does not lead to any discernible increase or decrease in the rate of deuterium exchange within the BRAF-BSR. It is important to emphasize that the absence of a rate change does not necessarily negate the occurrence of binding; rather, it might indicate a transient interaction with an affinity level below the detection threshold of HDX-MS.

      Given that the only major difference between H- and K-RAS isoforms is the HVR, we hypothesize that binding differences between BRAF and RAS isoforms can be attributed to the HVR. Notably, BRAF-NT3 resembles CRAF, which also behaves in line with the findings from Terrell et al. in which the BSR is not present to impact RAS-RAF association. We have updated some of the discussion section to include the new results and draw relevant conclusion.

      We mention in the text in the results section, “The HVR is an important region for regulating RAS isoform differences, like membrane anchoring, localization, RAS dimerization, and RAF interactions6… These results, combined with HDX-MS results, which showed that the BSR is exposed when bound to HRAS, suggest that the electrostatic forces surrounding the BSR promote BRAF autoinhibition and the specificity of RAF-RAS interactions.”

      We also write in the discussion, “However, BRET assays suggest that CRAF does not show preference for either H- or KRAS, while BRAF appears to prefer KRAS.1 This preference is suggested to result from the potential favorable interactions between the negatively charged BSR of BRAF and the positively charged, poly-lysine region of the HVR of KRAS1… Our binding data provide additional examples of isoform-specific activity. We speculate that diminished BRAF-NT1 binding to HRAS and increased BSR exposure upon HRAS binding may be due to electrostatic repulsion between HRAS and the BSR. Our full-length KRAS and its interaction with NT1 support the hypothesis that the BSR attenuates fast binding to HRAS but not to KRAS.”

      1. The authors might consider including NRAS in their study to give more weight to this interesting aspect.

      Response: While this suggestion is intriguing and could contribute to the expanding body of literature on RAS signaling, particularly in the context of NRAS-mutant tumors, we believe that delving into this topic would be beyond the scope of the present manuscript.

      1. Figure 6A: In this pulldown experiment the authors wish to demonstrate that binding of HRAS abolishes the autoinhibitory binding between NT1 and the kinase domain. However, the experimental design (i.e., pulldown of RAS) does not allow us to assess whether NT1 and KD are bound to each other in these conditions at all. The authors should rather pull down the KD and show that the interaction with NT1 is abolished when RAS is added.

      Response: We appreciate your suggestion. The experimental design for this study was intentionally structured to focus on the specific subset of NT1 that interacts with HRAS. The BRAF N-terminal region has the capacity to bind both HRAS and KD, resulting in two distinct populations within BRAF-NT1: NT1:KD and NT1:HRAS, although we believe the ratio between those two populations is not 1:1. If we were to design the experiment by isolating either the KD or NT1, it would lead to the observation of both populations simultaneously, making it challenging to distinguish between them. Our pulldown experiments are performed under the same conditions (i.e. all the proteins were maintained in a molar ratio of 1:1 and exposed to the same buffer components), and we rely on pulldown assays, such as those depicted in Figure 5, to clearly demonstrate the binding interactions between NT1 and KD.

      1. The authors have chosen a purely in vitro approach for their interaction studies, which initially makes sense for the addressed questions. However, since the BRAF constructs studied are only fragments and neither BRAF nor K/HRAS has any posttranslational modifications, the question arises to what extent the findings obtained hold up in vivo. Therefore, the manuscript would greatly benefit from monitoring the described interactions in full-length proteins and in cells or at least with proteins purified from cells.

      Response: Thank you for your valuable suggestion, which we take very seriously to enhance the quality of our manuscript. Upon carefully reviewing your comments, we conducted additional experiments involving full-length, wild-type BRAF (FL-BRAF) that was purified from mammalian cells, encompassing the post-translational modifications and scaffolding proteins such as 14-3-3 (Supplementary Fig 8A). We have incorporated the findings from these OpenSPR experiments into the revised manuscript within the Results Section titled "BSR Differentiates the BRAF-KRAS Interaction from the BRAFHRAS Interaction" and Figure 4. In summary, our results with FL-BRAF affirm the extension of our initial observations. Both NT1 and FL-BRAF interact with KRAS with comparable affinities, and neither NT1 nor FL-BRAF demonstrates an interaction with HRAS using OpenSPR. These results underscore that BRAF fragments accurately represent active, fully processed BRAF, lending support to our in vitro approach.

      Moreover, the conserved interactions we report in this manuscript are supported by literature. The interaction between RAF-RBD and RAS has been extensively documented, spanning investigations conducted in both insect and mammalian cell lines. For instance, Tran et al. (2021) utilized mammalian expression systems to explore the role of RBD in mediating BRAF activation through RAS interaction, identifying the same binding surfaces that we highlighted using HDX-MS.2 They quantified the KRAS-CRAF interaction yielding binding affinities in the low nanomolar range, similar to our findings for BRAF-NT:KRAS OpenSPR.2 In the manuscript text, we compared the binding affinity of BRAF residues 1245 purified from insect cells3 to our BRAF 1-227 (NT2 from E. coli), noting that the published value falls within the standard deviation of our experimental value. Additionally, our results align with the autoinhibited FL-BRAF:MEK:14-3-3 structure, which was expressed in Sf9 insect cells and reveals the central role of the CRD in maintaining autoinhibition through interactions with KD.4 In 2005, Tran and colleagues revealed specific domains within the BRAF N-terminal region are involved in binding to KD through Co-IP experiments conducted in mammalian cells.5

      While we are fully aware of the limitations of taking a purely in vitro approach to study the role of BRAF regulatory domains in RAS-RAF interactions and autoinhibition, as well as to quantify the affinity of these interactions, we emphasize that this approach enables us to dissect and examine the specific regions of RAF that are under investigation. As we write in the manuscript: “Our in vitro studies were conducted using proteins purified from E. coli, which lack the membrane, post-translational modifications, and regulatory, scaffolding, or chaperone proteins that are involved in BRAF regulation. Nonetheless, our study provides a direct characterization of the intra- and inter-molecular protein-protein interactions involved in BRAF regulation, without the complications that arise in cell-based assays.” We have added the following comment to clarify the advantages of our in vitro approach and the challenges associated with cell-based assays: “… without the complications and false-positives that can arise in cell-based assays, which often cannot distinguish between proximity and biochemical interactions.”

      Once again, we appreciate your insight feedback, which has contributed significantly to the improvement of our manuscript.

      Minor:

      1. Page 7, paragraph 2, line 6: It should probably read "BRAF autoinhibition" not "BRAF autoinhibitory".

      Response: Thank you for bringing this to our attention. We have fixed this typo.

      1. Figure 3G: In the first lane (time point 0 min) there is no input band for His/MBP-NT1. Probably a mistake when cropping the image from the original photo.

      Response: We sincerely appreciate your diligence in identifying cropping errors, and we have taken comprehensive measures to review the manuscript and correct any such errors. Regarding this specific figure, it is important to note that NT1 was not added at the "0" minute time point, which explains the absence of an input band at that stage. To avoid any confusion, we have revised the notation from "0" to "-" for clarity.

      Reviewer #2 (Public Review):

      In the manuscript entitled 'Unveiling the Domain-Specific and RAS Isoform-Specific Details of BRAF Regulation', the authors conduct a series of in vitro experiments using Nterminal and C-terminal BRAF fragments (SPR, HDX-MS, pull-down assays) to interrogate BRAF domain-specific autoinhibitory interactions and engagement by H- and KRAS GTPases. Of the three RAF isoforms, BRAF contains an extended N-terminal domain that has yet to be detected in X-ray and cryoEM reconstructions but has been proposed to interact with the KRAS hypervariable region. The investigators probe binding interactions between 4 N-terminal (NT) BRAF fragments (containing one more NT domain (BRS, RBD, and CRD)), with full-length bacterial expressed HRAS, KRAS as well as two BRAF C-terminal kinase fragments to tease out the underlying contribution of domainspecific binding events. They find, consistent with previous studies, that the BRAF BSR domain may negatively regulate RAS binding and propose that the presence of the BSR domain in BRAF provides an additional layer of autoinhibitory constraints that mediate BRAF activity in a RAS-isoform-specific manner. One of the fragments studied contains an oncogenic mutation in the kinase domain (BRAF-KDD594G). The investigators find that this mutant shows reduced interactions with an N-terminal regulatory fragment and postulate that this oncogenic BRAF mutant may promote BRAF activation by weakening autoinhibitory interactions between the N- and C-terminus.

      While this manuscript sheds light on B-RAF specific autoinhibitory interactions and the identification and partial characterization of an oncogenic kinase domain (KD) mutant, several concerns exist with the vitro binding studies as they are performed using taggedisolated bacterial expressed fragments, 'dimerized' RAS constructs, lack of relevant citations, controls, comparisons and data/error analysis. Detailed concerns are listed below.

      1. Bacterial-expressed truncated BRAF constructs are used to dissect the role of individual domains in BRAF autoinhibition. Concerns exist regarding the possibility that bacterial expression of isolated domains or regions of BRAF could miss important posttranslational modifications, intra-molecular interactions, or conformational changes that may occur in the context of the full-length protein in mammalian cells. This concern is not addressed in the manuscript.

      Response: Reviewer 1 raised a similar concern, and we have duplicated our response below for your reference:

      Thank you for your valuable suggestion, which we take very seriously to enhance the quality of our manuscript. Upon carefully reviewing your comments, we conducted additional experiments involving full-length, wild-type BRAF (FL-BRAF) that was purified from mammalian cells, encompassing the post-translational modifications and scaffolding proteins such as 14-3-3 (Supplementary Fig 8A). We have incorporated the findings from these OpenSPR experiments into the revised manuscript within the Results Section titled "BSR Differentiates the BRAF-KRAS Interaction from the BRAF-HRAS Interaction" and Figure 4. In summary, our results with FL-BRAF affirm the extension of our initial observations. Both NT1 and FL-BRAF interact with KRAS with comparable affinities, and neither NT1 nor FL-BRAF demonstrates an interaction with HRAS using OpenSPR. These results underscore that BRAF fragments accurately represent active, fully processed BRAF, lending support to our in vitro approach.

      Moreover, the conserved interactions we report in this manuscript are supported by literature. The interaction between RAF-RBD and RAS has been extensively documented, spanning investigations conducted in both insect and mammalian cell lines. For instance, Tran et al. (2021) utilized mammalian expression systems to explore the role of RBD in mediating BRAF activation through RAS interaction, identifying the same binding surfaces that we highlighted using HDX-MS.2 They quantified the KRAS-CRAF interaction yielding binding affinities in the low nanomolar range, similar to our findings for BRAF-NT:KRAS OpenSPR.2 In the manuscript text, we compared the binding affinity of BRAF residues 1245 purified from insect cells3 to our BRAF 1-227 (NT2 from E. coli), noting that the published value falls within the standard deviation of our experimental value. Additionally, our results align with the autoinhibited FL-BRAF:MEK:14-3-3 structure, which was expressed in Sf9 insect cells and reveals the central role of the CRD in maintaining autoinhibition through interactions with KD.4 In 2005, Tran and colleagues revealed specific domains within the BRAF N-terminal region are involved in binding to KD through Co-IP experiments conducted in mammalian cells.5

      While we are fully aware of the limitations of taking a purely in vitro approach to study the role of BRAF regulatory domains in RAS-RAF interactions and autoinhibition, as well as to quantify the affinity of these interactions, we emphasize that this approach enables us to dissect and examine the specific regions of RAF that are under investigation. As we write in the manuscript: “Our in vitro studies were conducted using proteins purified from E. coli, which lack the membrane, post-translational modifications, and regulatory, scaffolding, or chaperone proteins that are involved in BRAF regulation. Nonetheless, our study provides a direct characterization of the intra- and inter-molecular protein-protein interactions involved in BRAF regulation, without the complications that arise in cell-based assays.” We have added the following comment to clarify the advantages of our in vitro approach and the challenges associated with cell-based assays: “… without the complications and false-positives that can arise in cell-based assays, which often cannot distinguish between proximity and biochemical interactions.”

      Once again, we appreciate your insight feedback, which has contributed significantly to the improvement of our manuscript.

      1. The experiments employ BRAF NT constructs that retain an MBP tag and RAS proteins with a GST tag. Have the investigators conducted control experiments to verify that the tags do not induce or perturb native interactions?

      Response: Thank you for highlighting this important issue. We have conducted control experiments whenever feasible, particularly in cases where tags were not required for visualization, immobilization, or where cleave sites were present. We have subsequently included these control experiments in the supplementary figures and accompanying text within the manuscript.

      It is essential to note that many of the techniques employed in this manuscript rely on tags, such as immobilizing proteins onto NTA OpenSPR sensors and employing various resins/beads for pulldown assays. Utilizing tags for protein immobilization in OpenSPR applications offers distinct advantages, including homogeneous and site-specific immobilization of the protein, ensuring that binding sites remain accessible for the study of protein-protein interactions (PPIs) of interest. Furthermore, in all BRAF-RAS SPR experiments, the MBP protein serves as the reference channel "blocking" protein. This reference channel is instrumental in mitigating any potential false-positive signals resulting from binding interactions with the MBP protein. Any such signal is subsequently subtracted out during data analysis.

      To provide a comprehensive understanding of these aspects, we have incorporated these details into the manuscript text for clarity:

      “Maltose bind protein (MBP) is immobilized on the OpenSPR reference channel, which accounts for any non-specific binding or impacts to the native PPIs that may result from the presence of tags. Kinetic analysis is performed on the corrected binding curves, which subtracts any response in the reference channel.”

      We describe the control experiment to examine whether His/MBP-tag affects NT1 binding with BRAF-KD: “Similarly, we removed the His/MBP-tag from BRAF-NT1 through a TEV protease cleavage reaction and flowed over untagged NT1. Kinetic analysis confirmed that the interaction is preserved with the KD=13 nM (Supplemental Figure 6F).”

      We show that the GST-tag does not affect KRAS interactions with NTs in supplemental figure 6. We purified full-length, His/MBP-KRAS and subsequently removed the tag through TEV cleavage. BRAF-NT interactions are preserved with untagged KRAS. GST alone, also does not interact with BRAF-NTs. We updated the text in the results section “BSR differentiates the BRAF-KRAS interaction from the BRAF-HRAS interaction.”

      Additionally, Vojtek and colleagues used the same fusion-protein combinations (GSTRAS and MBP-RAF) in pulldown experiments and also found no perturbations from these tags.8

      1. The investigators state that the GST tag on the RAS constructs was used to promote RAS dimerization, as RAS dimerization is proposed to be key for RAF activation. However, recent findings argue against the role of RAS dimers in RAF dimerization and activation (Simanshu et al, Mol. Cell 2023). Moreover, while GST can dimerize, it is unclear whether this promotes RAS dimerization as suggested. In methods for the OpenSPR experiments probing NT BRAF:RAS interactions, it is stated that "monomeric KRAS was flowed...". This terminology is a bit confusing. How was the monomeric state of KRAS determined and what was the rationale behind the experiment? Is there a difference in binding interactions between "monomeric vs dimeric KRAS"?

      Response: Thank you for conducting such a comprehensive review of our manuscript and for identifying the mention of "monomeric KRAS" in the experimental section, which was inadvertently included and should not have been present. This terminology originally referred to a series of experiments involving "monomeric" KRAS that were initially considered for inclusion in the main body of the manuscript but were subsequently removed before submission. Furthermore, we adjusted the terminology to prevent any confusion or unwarranted implications.

      To clarify, this "monomeric" construct refers to the tagless, full-length KRAS variant that was confirmed to exist in a monomeric state through Size Exclusion Chromatography, eluting at a volume equivalent to 21 kDa. We have incorporated the findings from experiments involving this untagged KRAS variant into the supplementary figures to provide supporting evidence, particularly in response to comment #2, that the GST-tag does not interfere with native interactions. Supplementary Figure 1 illustrates that both GST-HRAS (45 kDa) and GST-KRAS (45 kDa) elute as dimers in solution, at approximately 90 kDa. It is important to note that the main text figures primarily feature the GST-tagged, "dimeric" RAS constructs. Our research results do not suggest any significant differences between "monomeric," untagged KRAS and "dimeric" GST-tagged KRAS, indicating that the binding kinetics between RAS and RAF are not influenced by oligomerization state (Supplementary Fig 6). To mitigate any potential confusion, we have made the necessary distinctions in the text and have revised the methods description to accurately reflect these aspects.

      While the recent findings summarized by Simanshu and colleagues were published concurrently with our manuscript submission, we would like to address this comment in the following manner. The authors assert that RAS does not engage in dimerization through the G domain, a hypothesis that contrasts with certain prior research findings. Instead, they propose that the plasma membrane plays a pivotal role in the clustering of RAS. Furthermore, the authors mention the involvement of RAS "dimerization" in RAF dimerization and activation in the subsequent statements:

      “Recruitment of two RAF proteins by RAS proteins in close proximity facilitate RAF activation but are not required for RAF dimerization.”

      “However, the PM recruitment of two RAF proteins by two non-dimerized but co- localized RAS proteins would serve equally well to promote RAF dimerization. Moreover, recent work on the activation cycle of RAF dimers (ref 20–23) argues strongly against a role for RAS dimers while revealing regulation by the 14-3-3 and SHOC2-MRAS- PP1C complexes. (Ref 24)”

      The primary focus of our study centers on elucidating the intricate details of the RAS-RAF interaction and the mechanisms underlying RAF autoinhibition, rather than emphasizing RAF dimerization as the sole pathway to RAF activation. It is important to recognize that RAF activation encompasses multiple steps, including RAS-mediated relief of RAF autoinhibition.

      To mimic physiological conditions as closely as possible, we employed a GST-tag on RAS in our experiments. It's worth noting that GST has a dimerization property,9 which brings RAS molecules into close proximity to one another, effectively emulating conditions akin to the plasma membrane. Our primary objective is not solely to facilitate interactions by bringing RAS into close proximity. Instead, our aim is to replicate cellular conditions to the greatest extent feasible, especially within the predominantly in vitro framework of our studies. Furthermore, we have revised the sentence pertaining to HRAS as follows: “As verified by size exclusion chromatography (Supplementary Fig 1A), the GST-tag dimerizes and forces HRAS into close proximity to recapitulate physiological conditions. (ref. 35)”

      1. The investigators determine binding affinities between GST-HRAS and NT BRAF domains (NT2 7.5 {plus minus} 3.5; NT3 22 {plus minus} 11 nM) by SPR, and propose that the BRS domain has an inhibitory role HRAS interactions with the RAF NT. However, it is unclear whether these differences are statistically meaningful given the error.

      Response: Thank you for bringing up this matter for further discussion. We are fully aware that these distinctions (NT2 and NT3), considering the overlapping error, lack statistical significance. Our conclusion points toward the most notable differences occurring when comparing NT1 to either NT2 or NT3, highlighting that the presence of the BSR has an inhibitory effect, particularly when the CRD is also present. It's important to note that we did not directly compare NT2 and NT3 to each other. Our comparison primarily elucidates that BSR without the CRD, and conversely, CRD without the BSR, do not exhibit the inhibitory effect. This collective evidence leads to the conclusion that all three domains collaboratively play a role in negatively regulating BRAF against HRAS.

      1. It is unclear why NT1 (BSR+RBD+CRD) was not included in the HDX experiments, which makes it challenging to directly compare and determine specific contributions of each domain in the presence of HRAS. Including NT1 in the experimental design could provide a more comprehensive understanding of the interplay between the domains and their respective roles in the HRAS-BRAF interaction. Further, excluding certain domains from the constructs, such as the BSR or CRD, may overlook potential domain-domain interactions and their influence on the conformational changes induced by HRAS binding.

      Response: We acknowledge that incorporating NT1 into the HDX experiments would have provided clearer insights into the specific contributions of each domain. Originally, it was our intention to include NT1 in these experiments. Unfortunately, we encountered challenges with the HDX experiments when it came to BRAF-NT1, as it yielded a significantly low sequence coverage after MS/MS analysis. We made multiple attempts to address this issue, which included additional protein purifications involving reducing agents, increasing the concentration of reaction buffer components, and extending the incubation time with reducing agents before injection. Despite these efforts, we were unable to obtain the desired sequence coverage for NT1. Consequently, we switched our approach to analyze NT2 and NT3 as the next best alternative.

      1. The authors perform pulldown experiments with BRAF constructs (NT1: BSR+RBD+CRD, NT2: BSR+RBD, NT3: RBD+CRD, NT4: RBD alone), in which biotinylated BRAF-KD was captured on streptavidin beads and probed for bound His/MBP-tagged BRAF NTs. Western blot results suggest that only NT1 and NT3 bind to the KD (Figure 5). However, performing a pulldown experiment with an additional construct, CRD alone, it would help to determine whether the CRD alone is sufficient for the interaction or if the presence of the RBD is required for higher affinity binding. This additional experiment would strengthen the authors' arguments and provide further insights into the mechanism of BRAF autoinhibition.

      Response: We are grateful for this valuable suggestion, and in response, we have taken the initiative to clone and purify a CRD-only construct (NT5) to strengthen our arguments. Subsequently, we conducted OpenSPR experiments to measure the binding affinity between NT5 and KD. Our findings clearly indicate that the CRD alone is not sufficient to mediate the autoinhibitory interactions and that the presence of the RBD is indeed necessary. These results have been incorporated into Figure 5 and are described within the Results Section for enhanced clarity and support.

      1. While the investigators state that their findings indicate that H- and KRAS differentially interact with BRAF, most of the experiments are focused on HRAS, with only a subset on KRAS. As SPR & pull-down experiments are only conducted on NT1 and NT2, evidence for RAS isoform-specific interactions is weak. It is unclear why parallel experiments were not conducted with KRAS using BRAF NT3 & NT4 constructs.

      Response: We sincerely appreciate your suggestion, which has contributed to enhancing the overall robustness of the evidence regarding isoform-specific differences between H- and K-RAS. In response, we performed additional experiments involving NT3 and NT4. The outcomes of these experiments have been integrated into Figure 4, and we have provided a comprehensive description of these results within the Results section “BSR differentiates the BRAF-KRAS interaction from the BRAF-HRAS interaction” of the manuscript.

      1. The investigators do not cite the AlphaFold prediction of full-length BRAF (AFP15056-F1) or the known X-ray structure of the BRAF BRS domain. Hence, it is unclear how Alpha-Fold is used to gain new structural information, and whether it was used to predict the structure of the N-terminal regulatory or the full-length protein.

      Response: We greatly appreciate the reviewer’s commitment to upholding good scientific practices and ensuring the inclusion of relevant citations in publications. In our original manuscript, we employed the UniProt ID P15056 to reference the specific AlphaFold structure used in our study. This was clarified as follows: "Since the full-length structure of BRAF is still unresolved, we applied the AlphaFold Protein Structure Database for a model of BRAF to display the conformation of the N-terminal domains and the HDX-MS results.40,41” Additionally, we referenced AlphaFold using the two citations recommended on their website (references 35 and 36 in the original manuscript). To prevent any potential confusion in the future, we have incorporated "AF-P15056-F1," as suggested.

      We are sorry for any misunderstanding that may have arisen regarding the use of AlphaFold for gaining new structural insights. Our sole intention was to utilize AlphaFold as a tool for modeling HDX, as a full-length structure of BRAF, encompassing the entire N-terminal domain, remains unavailable. We have taken steps to clarify our objectives in the manuscript to ensure the purpose of our AlphaFold utilization is unambiguous.

      Furthermore, we wish to emphasize that our utilization of AlphaFold was never intended to exclude the known X-ray structure of the BRAF-BSR domain. In our revised text, we have added clarity to our purposes and cited the Lavoie et al. Nature publication from 2018, which provides alignment between the X-ray structure and the AlphaFold model, thereby enhancing the confidence in the latter.

      1. In HDX-MS experiments, it is unclear how the authors determine whether small differences in deuterium uptake observed for some of the peptide fragments are statistically significant, and why for some of the labeling reaction times the investigators state " {plus minus} HRAS only" for only 3 time points?

      Response: First, in reference to the question about " ‘{plus minus} HRAS only’ for only 3 time points,” we write:

      “Both constructs were incubated with and without GMPPNP-HRAS in D2O buffer for set labeling reaction times (NT3: 2 sec [NT3 ± HRAS only], 6 sec [NT3 ± HRAS only], 20 sec, 30 sec [NT3 ± HRAS only], 60 sec, 5 min, 10 min, 30 min, 90 min, 4.5 h, 15 h, and 24 h)...”

      We realize how this can be confusing. To avoid such confusion, we fixed the text to read instead:<br /> “Both constructs were incubated with and without GMPPNP-HRAS in D2O buffer for set labeling reaction times (NT3: 2 sec, 6 sec, 20 sec, 30 sec, 60 sec, 5 min, 10 min, 30 min, 90 min, 4.5 h, 15 h, 45 h and 24 h at RT; NT2: 20 sec, 60 sec, 5 min, 10 min, 30 min, 90 min, 4.5 h, 15 h, and 24 h at RT)...”

      Next, with regard to assessing significance, we determine it by closely examining a consistent trend in smooth time course plots. To establish this trend, we rely on the presence of more than four overlapping peptides, each with multiple charge states, within a specific sequence range. When we observe multiple peptides showing even a small difference in rate exchange, we can confidently infer that structural changes have taken place. This confidence stems from the inherent reliability and redundancy in the data analysis approach we have employed.11,12 It is noteworthy that our focus is primarily on reporting the binding or no binding, rather than quantifying the magnitude of exchange. As such, conducting multiple replicates or statistical testing is not deemed necessary.13,14 This is true for multiple reasons:

      1) Instead of small deuterium changes (y-axis), we are focusing on the x-axis changes, which provides a slowing factor and how much that H-D exchange rate has changed.

      • In a publication investigating the ideal HDX-MS data set, the author explains, “with the availability of high resolution HDX-MS raw data, it may be the time to shift the data analysis paradigm from determination of centroid values and presentation of deuteration levels to deconvolution of isotope envelopes and presentation of exchange rates.” 15

      • Presentation of data through rate changes provides a physical chemistry measurement, as opposed to a relative measurement with percent deuteration. For example, slowing with a factor of 10 equates to the energy in 1 kCal. By quick visual estimation, we see a slowing factor of about 2 when RAS is bound to the BRAF-RBD.

      • We made some changes to the text to clear up any confusion about measuring D uptake vs rate.

      2) Looking at sigmoidal curves only—the “smooth time course” shows that the timedependent deuterium changes are not random, artifacts, or false positives/negatives. When parallel sigmoidal curves are present, any x-axis change is a measure of H-D exchange. Only plots with a smooth time course are used to make conclusions about BRAF’s conformational changes or binding interfaces.

      3) Wide time range- the extended time also confirms that any observed difference is reliable and accurate. This extended time frame provides coverage for deuteration levels from 0 to 100% for peptides. A smooth time course is present in complete coverage.

      • A narrow time window is a common flaw in HDX-MS studies14,15

      4) The rate change is observed at multiple time points (at least 4 for each peptide), which are all independent reactions, and show reproducibility of change

      5) Many overlapping peptides show the same pattern- the exchange rate difference is observed in at least 4 peptide time plots without contradictory evidence within the sequence range.

      • We included the complete set of peptide time plots in the supplemental materials.

      6) The many other peptide time plots that do not show any difference with and without RAS is a form of reproducibility, that no difference means no difference.

      1. The investigators find that KRAS binds NT1 in SPR experiments, whereas HRAS does not. However, the pull-down assays show NT1 binding to both KRAS and HRAS. SI Fig 5 attributes this to slow association, yet both SPR (on/off rates) and equilibrium binding measurements are conducted. This data should be able to 'tease' out differences in association.

      Response: Thank you for bringing up this important point. It's crucial to note that the experiments conducted at slow flow rates generated low responses, making it challenging to perform kinetic analyses effectively. Consequently, we are unable to provide accurate equilibrium binding measurements (on/off rates) for NT1 and HRAS. Regrettably, comparing the association rates between KRAS and HRAS is not feasible due to the differing flow rates employed. We have addressed this limitation in the manuscript as follows:

      “We therefore immobilized NT1 and flowed over HRAS at a much slower flow rate (5 µL/min), during which we saw minimal but consistent binding (Supplementary Fig 5A). The low response and long timeframe of each injection, however, makes the dissociation constant (KD) unmeasurable and incomparable to our other NT-HRAS OpenSPR results.”

      1. The model in Figure 7B highlights BSR interactions with KRAS, however, BSR interactions with the KRAS HVR (proximal to the membrane) are not shown, as supported by Terrell et al. (2019).

      Response: Thank you for the suggestion. We reoriented the BSR closer to HVR of KRAS rather than G-domain.

      1. The investigators state that 'These findings demonstrate that HRAS binding to BRAF directly relieves BRAF autoinhibition by disrupting the NT1-KD interaction, providing the first in vitro evidence of RAS-mediated relief of RAF autoinhibition, the central dogma of RAS-RAF regulation. However, in Tran et al (2005) JBC, they report pulldown experiments using N-and C-terminal fragments of BRAF and state that 'BRAF also contains an N-terminal autoinhibitory domain and that the interaction of this domain with the catalytic domain was inhibited by binding to active HRAS'. This reference is not cited.

      Response: We appreciate the concern raised regarding our statement. We want to clarify that it was never our intention to disregard this JBC publication, and we apologize for any misunderstanding caused by our phrasing. We recognize that our initial statement was contentious, and we have removed the word "first" from the phrase "first in vitro evidence." In the section of the discussion where we originally cited the Tran et al. (2005) publication, we have revised the language to eliminate "first" and have rephrased the sentence, as provided below:

      “Our in vitro binding studies align with previous implications that RAS relieves RAF autoinhibition shown through cell-based coIP’s.5”

      1. In Fig 2, panels A and C, it is unclear what the grey dotted line in is each plot.

      Response: Thank you for drawing our attention to the additional explanation needed here. The gray dotted lines represent the maximum deuterium exchange. We added the following description to the figure 2 legend:

      “Gray dotted lines represent the theoretical exchange behavior for specified peptide that is fully unstructured (top) or for specified peptide with a uniform protection factor (fraction of time the residue is involved in protecting the H-bond) of 100 (lower).”

      1. In Fig 3, error analysis is not provided for panel E.

      Response: We added the standard deviation values to this panel. We additionally added these for Fig 4C and Fig 5B.

      1. How was RAS GMPPNP loading verified?

      Response: Ras loading is a well-established protocol with a solid foundation in the literature.16– 21 We followed this accepted method for nucleotide exchange. Our controls, as evident in pulldown and OpenSPR experiments (fig 1C, 4E), unequivocally demonstrate that GMPPNPloaded RAS is active, while unloaded RAS is inactive, as evidenced by the absence of no binding. We also added supplemental figure 6E to show that inactive (unloaded) GST-KRAS does not bind to BRAF during OpenSPR analysis. To exemplify this, we included binding curves of 1 µM GST-KRAS- GMPPNP and -GDP flowed over NTA-immobilized BRAF-NT2 at a flow rate of 30 µl/min.

      References

      (1) Terrell, E. M.; Durrant, D. E.; Ritt, D. A.; Sealover, N. E.; Sheffels, E.; Spencer-Smith, R.; Esposito, D.; Zhou, Y.; Hancock, J. F.; Kortum, R. L.; Morrison, D. K. Distinct Binding Preferences between Ras and Raf Family Members and the Impact on Oncogenic Ras Signaling. Mol. Cell 2019, 76 (6), 872-884.e5. https://doi.org/10.1016/j.molcel.2019.09.004.

      (2) Tran, T. H.; Chan, A. H.; Young, L. C.; Bindu, L.; Neale, C.; Messing, S.; Dharmaiah, S.; Taylor, T.; Denson, J. P.; Esposito, D.; Nissley, D. V.; Stephen, A. G.; McCormick, F.; Simanshu, D. K. KRAS Interaction with RAF1 RAS-Binding Domain and Cysteine-Rich Domain Provides Insights into RAS-Mediated RAF Activation. Nat. Commun. 2021, 12 (1176), 1–16. https://doi.org/10.1038/s41467-021-21422-x.

      (3) Fischer, A.; Hekman, M.; Kuhlmann, J.; Rubio, I.; Wiese, S.; Rapp, U. R. B- and C-RAF Display Essential Differences in Their Binding to Ras: The Isotype-Specific N Terminus of B-RAF Facilitates Ras Binding. J. Biol. Chem. 2007, 282 (36), 26503–26516. https://doi.org/10.1074/jbc.M607458200.

      (4) Park, E.; Rawson, S.; Li, K.; Kim, B. W.; Ficarro, S. B.; Pino, G. G. Del; Sharif, H.; Marto, J. A.; Jeon, H.; Eck, M. J. Architecture of Autoinhibited and Active BRAF–MEK1–14-3-3 Complexes. Nature 2019, 575 (7783), 545–550. https://doi.org/10.1038/s41586-0191660-y.

      (5) Tran, N. H.; Wu, X.; Frost, J. A. B-Raf and Raf-1 Are Regulated by Distinct Autoregulatory Mechanisms. J. Biol. Chem. 2005, 280 (16), 16244–16253. https://doi.org/10.1074/jbc.M501185200.

      (6) Prior, I. A.; Hancock, J. F. Ras Trafficking, Localization and Compartmentalized Signalling. Semin. Cell Dev. Biol. 2012, 23 (2), 145–153.

      (7) Herrmann, C.; Martin, G. A.; Wittinghofer, A. Quantitative Analysis of the Complex between P21 and the Ras-Binding Domain of the Human Raf-1 Protein Kinase. J. Biol. Chem. 1995, 270 (7), 2901–2905. https://doi.org/10.1074/jbc.270.7.2901.

      (8) Vojtek, A. B.; Hollenberg, S. M.; Cooper, J. A. Mammalian Ras Interacts Directly with the Serine/Threonine Kinase Raf. Cell 1993, 74 (1), 205–214. https://doi.org/10.1016/00928674(93)90307-C.

      (9) Parker, M. W.; Bello, M. Lo; Federici, G. Crystallization of Glutathione S-Transferase from Human Placenta. J. Mol. Biol. 1990, 213 (2), 221–222. https://doi.org/10.1016/S00222836(05)80183-4.

      (10) Inouye, K.; Mizutani, S.; Koide, H.; Kaziro, Y. Formation of the Ras Dimer Is Essential for Raf-1 Activation. J. Biol. Chem. 2000, 275 (6), 3737–3740. https://doi.org/10.1074/JBC.275.6.3737.

      (11) Z. Y. Kan, X. Ye, J. J. Skinner, L. Mayne, S. W. E. ExMS2: An Integrated Solution for Hydrogen-Deuterium Exchange Mass Spectrometry Data Analysis. Anal Chem 2019, 91 (11), 7474–7481.

      (12) Mayne, L.; Kan, Z. Y.; Sevugan Chetty, P.; Ricciuti, A.; Walters, B. T.; Englander, S. W. Many Overlapping Peptides for Protein Hydrogen Exchange Experiments by the Fragment Separation-Mass Spectrometry Method. J. Am. Soc. Mass Spectrom. 2011, 22 (11), 1898–1905. https://doi.org/10.1007/S13361-011-0235-4.

      (13) Ye, X.; Lin, J.; Mayne, L.; Shorter, J.; Englander, S. W. Hydrogen Exchange Reveals Hsp104 Architecture, Structural Dynamics, and Energetics in Physiological Solution. Proc. Natl. Acad. Sci. 2019, 116 (15), 7333–7342. https://doi.org/10.1073/pnas.1816184116.

      (14) Ye, X.; Lin, J.; Mayne, L.; Shorter, J.; Englander, S. W. Structural and Kinetic Basis for the Regulation and Potentiation of Hsp104 Function. Proc. Natl. Acad. Sci. 2020, 117 (17), 9384–9392. https://doi.org/10.1073/pnas.1921968117.

      (15) Hamuro, Y. Determination of Equine Cytochrome c Backbone Amide Hydrogen/Deuterium Exchange Rates by Mass Spectrometry Using a Wider Time Window and Isotope Envelope. J. Am. Soc. Mass Spectrom. 2017, 28 (3), 486–497. https://doi.org/10.1007/s13361-016-1571-1.

      (16) Herrmann, C.; Horn, G.; Spaargaren, M.; Wittinghofer, A. Differential Interaction of the Ras Family GTP-Binding Proteins H-Ras, Rap1A, and R-Ras with the Putative Effector Molecules Raf Kinase and Ral-Guanine Nucleotide Exchange Factor. J. Biol. Chem. 1996, 271 (12), 6794–6800. https://doi.org/10.1074/jbc.271.12.6794.

      (17) Miller, A. F.; Halkides, C. J.; Redfield, A. G. An NMR Comparison of the Changes Produced by Different Guanosine 5’-Triphosphate Analogs in Wild-Type and Oncogenic Mutant P21ras. Biochemistry 1993, 32 (29), 7367–7376. https://doi.org/10.1021/bi00080a006.

      (18) Amendola, C. R.; Mahaffey, J. P.; Parker, S. J.; Ahearn, I. M.; Chen, W. C.; Zhou, M.; Court, H.; Shi, J.; Mendoza, S. L.; Morten, M. J.; Rothenberg, E.; Gottlieb, E.; Wadghiri, Y. Z.; Possemato, R.; Hubbard, S. R.; Balmain, A.; Kimmelman, A. C.; Philips, M. R. KRAS4A Directly Regulates Hexokinase 1. Nature 2019. https://doi.org/10.1038/s41586019-1832-9.

      (19) John, J.; Sohmen, R.; Feuerstein, J.; Linke, R.; Wittinghofer, A.; Goody, R. S. Kinetics of Interaction of Nucleotides with Nucleotide-Free H-Ras P21. Biochemistry 1990, 29 (25), 6058–6065. https://doi.org/10.1021/bi00477a025.

      (20) Dharmaiah, S.; Tran, T. H.; Messing, S.; Agamasu, C.; Gillette, W. K.; Yan, W.; Waybright, T.; Alexander, P.; Esposito, D.; Nissley, D. V.; McCormick, F.; Stephen, A. G.; Simanshu, D. K. Structures of N-Terminally Processed KRAS Provide Insight into the Role of N-Acetylation. Sci. Reports 2019 91 2019, 9 (1), 1–15. https://doi.org/10.1038/s41598-019-46846-w.

      (21) Rathinaswamy, M. K.; Gaieb, Z.; Fleming, K. D.; Borsari, C.; Harris, N. J.; Moeller, B. E.; Wymann, M. P.; Amaro, R. E.; Burke, J. E. Disease-Related Mutations in PI3Kγ Disrupt Regulatory C-Terminal Dynamics and Reveal a Path to Selective Inhibitors. Elife 2021, 10. https://doi.org/10.7554/eLife.64691.

    1. Author Response

      The following is the authors’ response to the original reviews.

      Thank you again to the reviewers and editors for all constructive feedback. We have made several edits to the manuscript and data to address concerns raised during the initial review and strengthen the completeness of this study. Please find below our response to each, with referee comments in black and our responses in blue.

      eLIFE Assessment:

      The authors report that Dbp5 functions in parallel with Los1 in tRNA export, in a manner dependent on Gle1 and requiring the ATPase cycle of Dbp5, but independent of Mex67, Dbp5's partner in mRNA export. The evidence for this conclusion is still incomplete, as is the biochemical evidence that Dbp5 interacts directly with tRNA in vitro with Gle1 and co-factor InsP6 triggering Dbp5 ATPase activity in the Dbp5-tRNA complex. The evidence that Dbp5 interacts with tRNA in cells independently of Los1, Msn5 and Mex67 is, however, solid.”

      Thank you for the constructive feedback and assessment of our article. We have made several improvements to the quality of data (Figure 1E, Figure 3C, Figure 4), added additional tRNA Northern Blot/FISH targets to further generalize observed phenotypes beyond pre-tRNAIleUAU (Supplement 1C/D/E/F), provided growth assays for los1Δ/msn5 Δ/dbp5R423A (Supplement 1B), add added data showing gle1-4/los1Δ double mutants phenocopy los1Δ/dbp5R423A to further support the involvement of Gle1 and the Dbp5 ATPase cycle in tRNA export (Figure 5D).

      Additionally, we added quantification to assess the extent of overexpression of Dbp5 mutants in Figure 3 and a discussion of how these mutants alter the localization of the protein to better assess how they may impact tRNA export (lines 211-226). Furthermore, several minor edits to the text/figures have been made to remove typos and improve readability (e.g., labels of FISH/Northern data in Figure 1). Additional edits include adjusting the text and the model presented in Figure 6 to improve conclusions drawn from our data. This includes lines 106-107 and lines 366-371 which clarifies that the Dbp5 mediated tRNA export pathway may not be entirely independent of Mex67.

      Reviewer #1 (Public Review):

      "At least one result suggests that the idea of these pathways in parallel may be too simplistic as deletion of the LOS1 gene, which is not essential decreases the interaction of tRNA export substrate with Dbp5 (Figure 2A). If the two pathways were working in parallel, one might have expected removing one pathway to lead to an increase in the use of the other pathway and hence the interaction with a receptor in that pathway…. The obvious missing experiment here with respect to genetics is the test of whether deletion of the MSN5 gene in the cells, which combines deletion of LOS1 and the dbp5_R423A allele, shown in Figure 1D would be lethal…. The authors provide evidence of a model where the helicase Dbp5 plays a role in tRNA export from the nucleus. Further evidence is required to determine whether Dbp5 could function in the same pathway as the previously defined tRNA export receptors, Los1 and Msn5. There are genetic tests that could be performed to explore this question. Some of the biochemistry presented would show when Los1 is absent that the interaction of Dbp5 with tRNA decreases, which could support a model where Dbp5 plays a role in coordination with Los1”

      Author Response: We thank the reviewers for this suggestion and consideration. We have added data showing growth phenotypes for the los1Δ/msn5Δ/dbp5R423A triple mutants. We discuss possible explanations and alternative hypothesis for why these triple mutants are viable and the observed reduction in Dbp5-pre-tRNA interaction in the context of los1Δ (lines 128131; lines 172-174).

      Reviewer #1 (Public Review):

      “While some of the binding assays show rather modest band shifts (Figure 4B for example), the data in Figure 4A showing that there is no binding detected unless a non-hydrolyzable ATP analogue is employed, argues for specificity in nucleic acid binding. The question that does arise is whether the binding is specific for tRNA.”

      Author Response: We have adjusted brightness/contrast of the EMSAs in Figure 4 to allow for better visualization of band shifts. Additionally, a discussion of the specificity of Dbp5-nucleic acid binding and the observed tRNA binding has been added (lines 313-322)

      Reviewer #1 (Public Review):

      “With the exception of the binding studies, which also employ a mixture of yeast tRNAs, this study relies primarily on a single tRNA species to come to the conclusions drawn. Many other studies have used multiple tRNAs to explore whether pathways characterized are generalizable to other tRNAs.“

      Author Response: We have added additional tRNA targets for FISH/Northerns in Supplement 1C/D/E/F)

      Reviewer #2 (Public Review):

      “There are some pieces of data that are misinterpreted. (Figure 1A and B look the same; in Fig 1E, the DAPI staining is abnormal; in Fig 4 the bands can't be seen.)”

      Author Response: Thank you for your constructive feedback. We have replaced FISH images to improve DAPI staining (Figure 1E), adjusted EMSAs to allow for better visualization of band shifts. (Figure 4), improved Northern Blots for quality (Figure 3C), and rearranged Figure 1A/B for readability. We maintain that the results from Figure 1A/B are not misinterpreted but agree that the readability of the figure was poor and have adjusted labels/formatting accordingly. The results of these experiments show that the deletion of Los1 does not alter Dbp5 localization and conversely loss of Dbp5 does not alter Los1 localization. As such the localization patterns under loss-of-function conditions look the same as wild-type for each protein respectively.

    1. Author Response

      The following is the authors’ response to the original reviews.

      We thank the reviewers for their service and are pleased to see that they were positive about the overall study. The reviewers provided several very good suggestions that we feel have improved the revised manuscript. In response to their suggestions, we have added four new figures of additional data (Figure 1, Supplement 2; Figure 2, Supplement 2; Figure 3, Supplements 1 and 2) in this revision. We have addressed the specific review comments/suggestions point-by-point below. Text changes in the manuscript are indicated in red with line numbers indicated.

      Public Reviews:

      Reviewer #1 (Public Review):

      This important study from Jahncke et al. demonstrates inhibitory synaptic defects and elevated seizure susceptibility in multiple models of dystroglycanopathy. A strength of the paper is the use of a wide range of genetic models to disrupt different aspects of dystroglycan protein or glycosylation in forebrain neurons. The authors use a combination of immunohistochemistry and electrophysiology to identify cellular migration, lamination, axonal targeting, synapse formation/function, and seizure phenotypes in forebrain neurons. This is an elegant study with extensive data supporting the conclusions. The role of dystroglycan and the dystrophin glycoprotein complex (DGC) in cellular migration and synapse formation are of broad interest.

      • A strength of this paper is the use of several transgenic mouse lines with mutations in genes involved in glycosylation of dystroglycan. Knockout of POMT2 abolishes the majority of dystroglycan glycosylation, while point mutations in B4GAT and FKRP presumably produce more minor changes in glycosylation. This is a powerful approach to inves5gate the role of glycosylation in dystroglycan function. However, the authors do not address how mutations in these genes may affect glycosylation or expression of proteins other than dystroglycan. It is possible, even likely, that some of the phenotypes observed are due to changing glycosylation in any number of other proteins. The paper would be strengthened by addressing this possibility more directly.

      We are glad to see that the reviewer appreciated the range of transgenic models used to define the role of Dag1 glycosylation. It is certainly possible that glycosylation of proteins other than Dag1 is affected by deletion of Pomt2, B4Gat1 and/or FKRP. Indeed, Cadherin and Plexin proteins undergo Omannosylation in the brain. However, recent work has shown that these proteins are not dependent on Pomt1/2 for their O-mannosylation, and use an alternative glycosylation pathway. Therefore, they unlikely to contribute to the phenotypes we observed in our Pomt2, B4Gat1 and/or FKRP mutants. Furthermore, we did not observe any phenotypes in these models that was not also observed in the Dag1 conditional knockouts. We have clarified this point in the results section (lines 117-121) with additional references, and added the caveat that Pomt2, B4gat1, and Fkrp could play a role in the glycosylation of proteins other than Dag1.

      • It would be helpful to have a more clear description of how dystroglycan glycosylation is altered in B4GAT1M155T or FKRPP448L mice. For example, Figure 1 makes it appear that the distal sugar moieties are missing, however, the IIH6 antibody, which binds to terminal matriglycan repeats on the glycan chain, recognizes dystroglycan in these mutants.

      We apologize for the confusion caused by our schematic in Figure 1. We have adjusted the opacity of the schematic in Figure 1A to better illustrate that the matriglycan chain is s5ll present, albeit at reduced levels, in the B4Gat1 and FKRP mutants. In addition, this is directly shown in the western blot in Figure 1B.

      • In Figure 1, the authors use the IIH6 antibody, which recognizes the terminal portion of the dystroglycan glycan chain, to label dystroglycan in the hippocampus. As expected, Emx1Cre,POMT2cKO mice, which lack glycosylation of dystroglycan, do not show any labelling. However, this experiment does not reveal anything about dystroglycan expression, only that the IIH6 antibody no longer recognizes dystroglycan. It would be very helpful in interpreting the later results to know whether the level and pattern of dystroglycan expression is normal or absent in the POMT2cKO mice, perhaps using another antibody that does not target the glycosylated region. For example, figure 3 shows reduced axon targeting to the cell body layer in POMT2cKO, however, it is unclear whether this is due to absence/mislocalization of dystroglycan at the cell surface, or if dystroglycan expression is normal, but glycosylation is directly required for axon targeting.

      Addressed in the “Recommendation for Authors” section below

      • In Figures 3 and 5, the authors use CB1R labelling to measure axon targeting and synapses formation. However, it is not clear how the authors measure axon targeting and synapses number separately using the same CB1R antibody. In addition, figure 3 shows reduced CB1R labelling in Dag1cyto pyramidal cell layer, but Figure 5 shows no change in CB1R labelling in the same mice. These results would appear to be contradictory.

      In Figure 3, the data reflects fluorescent intensity of CB1R+ axons measured across the en5re hippocampal depth. In contrast, the synapse number in Figure 5 is measured as VGat+ and CB1R+ puncta (axonal swellings) within the pyramidal cell layer (SP). The discrepancy between these measurements in the Dag1Cyto mutants likely reflects a change in the distribution of the synaptic contacts in SP (ie: increased contacts in the upper portion of the SP relative to the bottom). This is clarified in the text, lines 315-319.

      • The authors measure spontaneous IPSCs (sIPSC) in CA1 pyramidal neurons to measure inhibitory synaptic function. This measure assesses inhibitory synaptic input from all sources, but dystroglycan mutations primarily impairs synapses arising from CCK+/CB1R interneurons, leaving synapses arising from PV or other interneurons relatively unchanged. To assess changes in CCK+/CB1R interneurons the authors apply the cholinergic receptor agonist Carbachol (which selectively activates CCK+/CB1R interneurons) and measure the change in sIPSC amplitude and frequency. While this is an interesting and reasonable experiment, the observed effects could be due to altered carbachol sensitivity in the transgenic mice. Control experiments showing that the effect of Carbachol on excitability of CCK+/CB1R interneurons is similar across mouse lines is missing.

      The reviewer is correct that we did not show that CCK/CB1R+ interneurons have the same sensitivity to CCh in controls and the various mutants. Indeed, this is something we have struggled with over the course of the study, and is an inherent limitation of the current study. Unfortunately, these cells are relatively sparse in the CA1, and therefore patching onto presumptive CCK/CB1R+ INs at random to test this directly is not feasible. There are also no genetic or viral tools that we are aware of at this time to fluorescently label these cells for targeted recordings (this would need to be a Cre-independent transgenic mouse line since we are using Cre to delete Dag1 and Pomt2). We tried to assess this by measuring c-fos immunohistochemistry staining as a proxy for activity in response to CCh. Briefly, we incubated acute slices with NBQX, SR95531, and Kynurenic Acid to block synaptic activity, and added CCh in the bath for 30, 60, and 90 minutes to induce CCK/CB1R+ INs firing. Slices were then fixed and stained for c-fos and NECAB1 to identify the CCK/CB1R+ interneurons.

      Unfortunately, we had a very difficult time imaging these slices, and we were not confident in our ability to localize c-fos+/NECAB1+ cells. We have clarified that this is an inherent limitation to the study in the text, lines 394-396.

      • Earlier work has shown that selective deletion of dystroglycan from pyramidal neurons produces near complete loss of CCK+/CB1R interneurons and synapse formation, a more severe deficit than observed here using a more widespread Cre-driver. This finding is surprising, as generally more wide-spread gene deletion results in more severe, not less severe, phenotypes. The authors make the reasonable claim that more wide-spread gene deletion better mimics human pathologies. However, possible speculation on why this is the case for dystroglycan could provide insight into the nature of CNS deficits in different forms of dystroglycanopathies.

      The reviewer is correct that previous work from both our lab and others have shown that deletion of Dag1 from only pyramidal neurons with NEX-cre leads to a complete loss of CCK/CB1R+ INs, and is thus more severe than the phenotype seen with the broader deletion of Dag1 with Emx1-Cre. We were also surprised by this result, so we also generated Dag1;Nestin-Cre mice. These mice show an iden5cal phenotype as the Dag1;Emx1-Cre mutants (new data; Figure 3, Supplement 1; text lines 226-233). This makes us confident in the validity of the Dag1;Emx-Cre mutants with regards to modeling the human disease. We do not know why the NEX-Cre line shows a more severe phenotype; it is possible that this is due to an unknown epistatic interaction between Dag1 and NEX-Cre.

      Reviewer #2 (Public Review):

      The manuscript by Jahncke and colleagues is centered on the CCK+ synaptic defects that are a consequence of Dystroglycanopathy and/or impaired dystroglycan-related protein function. The authors use conditional mouse models for Dag1 and Pomt2 to ablate their function in mouse forebrain neurons and demonstrate significant impairment of CCK+/CB1R+ interneuron (IN) development in addition to being prone to seizures. Mice lacking the intracellular domain of Dystroglycan have milder defects, but impaired CCK+/CB1R+ IN axon targeting. The authors conclude that the milder dystroglycanopathy is due to the par5ally reduced glycosylation that occurs in the milder mouse models as opposed to the more severe Pomt2 models. Additionally, the authors postulate that inhibitory synaptic defects and elevated seizure susceptibility are hallmarks of severe dystroglycanopathy and are required for the organization of functional inhibitory synapse assembly.

      The manuscript is overall, fairly well-written and the description of the phenotypic impact of disruption of Dystroglycan forebrain neurons (and similar glycosyltransferase pathway proteins) demonstrate impairment in axon targeting and organization.

      There are some questions with regards to interpretation of some of the results from these conditional mouse models.

      • The study is mostly descriptive, and some validation of subunits of the dystroglycanglycoprotein complex and laminin interactions would go towards defining the impact of disruption of dystroglycan's function in the brain.

      Addressed in the “Recommendation for Authors” section below

      • The statistics and basic analysis of the manuscript appear to be appropriate and within parameters for a study of this nature.

      • Some clarification between the discrepancies between the Walker Warburg Syndrome (WWS) patient phenotypes and those observed in these conditional mouse models is warranted. This manuscript has the potential to be impactful in the Dystroglycanopathy and general neurobiology fields.

      Addressed in the “Recommendation for Authors” section below

      Reviewer #3 (Public Review):

      The study presents a systematic analysis of how a range of dystroglycan mutations alter CCK/CB1 axonal targeting and inhibition in hippocampal CA1 and impact seizure susceptibility. The study follows up on prior literature identifying a role for dystroglycan in CCK/CB1 synapse formation. The careful assay includes comparison of 5 distinct dystroglycan mutation types known to be associated with varying degrees of muscular dystrophy phenotypes: a forebrain specific Dag1 knockout in excitatory neurons at 10.5, a forebrain specific knockout of the glycosyltransferase enzyme in excitatory neurons, mice with deletion of the intracellular domain of beta-Dag1 and 2 lines with missense mutations with milder phenotypes. They show that forebrain glutamatergic deletion of Dag1 or glycosyltransferase alters cortical lamination while lamination is preserved in mice with deletion of the intracellular domain or missense mutation.

      The study extends prior works by identifying that forebrain deletion of Dag1 or glycosyltransferase in excitatory neurons impairs CCK/CB1 and not PV axonal targeting and CB1 basket formation around CA1 pyramidal cells. Mice with deletion of the intracellular domain or missense mutation show limited reductions in CCK/CB1 fibers in CA1. Carbachol enhancement of CA1 IPSCs was reduced both in forebrain knockouts. Interestingly, carbachol enhancement of CA1 IPSCs was reduced when the intracellular domain of beta-Dag1was deleted, but not I the missense mutations, suggesting a role of the intracellular domain in synapse maintenance. All lines except the missense mutations, showed increased susceptibility to chemically induced behavioral seizures. Together, the study, is carefully designed, well controlled and systematic. The results advance prior findings of the role for dystroglycans in CCK/CB1 innervations of PCs by demonstrating effects of more selective cellular deletions and site specific mutations in extracellular and intracellular domains. The interesting finding that deletion of intracellular domain reduces both CB1 terminals in CA1 and carbachol modulation of IPSCs warrants further analysis. Lack of EEG evaluation of seizure latency is a limitation.

      Specific comments

      • Whether CCK/CB1 cell numbers in the CA1 are differentially affected in the transgenic mice is not clarified.

      This is a good point; we have now addressed this in Figure 3, Supplement 2 (new data; text lines 234-245). In brief, using two different markers (NECAB1 and NECAB2), we see no change in the number of CCK+/CB1R+ INs in the mutant mice.

      • 2. Whether basal synaptic inhibition is altered by the changes in CCK innervation is not examined.

      We apologize for the confusion. This is addressed in the text, lines 371-375:

      “Notably, even baseline sIPSC frequency was reduced in Dag1cyto/- mutants (2.27±1.70 Hz) compared to WT controls (4.46±2.04 Hz, p = 0.002), whereas baseline sIPSC frequencies appeared normal in all other mutants when compared to their respective controls.”

      Reviewer #1 (Recommendations For The Authors):

      Line 321- CCH-mediated CHANGE in sIPSC amplitude...

      This has been corrected (now line 356)

      Reviewer #2 (Recommendations For The Authors):

      Major Comments:

      • Disruption of the dystroglycan (and subsequent glycosyltransferase proteins) in the brain would likely impact laminin localization and cytoskeletal stability of the dystroglycanprotein complex. The authors should assess (via immunolabeling) the disruption laminin using laminin IF in the various conditional mouse model forebrain sections.

      We have stained brains from Dag1, Pomt2, and Dag1cyto mutants with an antibody to Laminin (new data; Figure 2, Supplement 2; text lines 191-205). Briefly, the data clearly shows that laminin staining is abnormal on the pial surface and in the blood vessels of the Dag1;Emx1-cre mutants. This is less severe in the Pomt2;Emx1 mutants, and normal in the Dag1cyto mutants. We also examined higher magnification of laminin staining in hippocampal SP around the pyramidal cells. Laminin in the region was diffuse (not synaptically localized) and there was no difference between any of the mutants and their respective controls (data not shown).

      • 2. The biggest question(s) I have is if the synaptic defects that were measured (Fig 6) in the spontaneous inhibitory post-synaptic currents (sIPSCs) could be rescued as a function of the glycosylation of dystroglycan? While ribitol/CDP-ribose has been shown to enhance alpha-dystroglycan glycosylation and total glycosylation, it might be appropriate here. NADplus exogenous supplementation has been (Ortez-Cordero et al., eLife, 2021) has a faster acting effect on glycosylation of dystroglycan and may work in this context. Can the authors add NADplus prior to their CCK+/CB1R+ IN recordings and evaluate synaptic current effects to determine if glycosylation rescue can actually occur?

      We are very much interested in the potential to rescue synaptic defects in the various mutants, and this is an active area of study for us going forward. However, we do not think the suggested experiments involving ribitol/NADplus supplementation are likely to work in our specific experiments with these models. In Dag1;Emx1-Cre and Pomt2;Emx1-Cre mice, which show the most dramatic phenotype, there is no O-mannosyl chain ini5ated for ribitol to act upon. In the Dag1Cyto mice, matriglycan is normal and therefore ribitol supplementation is unlikely to have an effect. In B4Gat1 and FKRP mutants, while matriglycan is reduced, there is no significant functional synaptic defect observed. Therefore, even if ribitol was able to increase matriglycan in these two mutants, we would be unable to detect a functional difference. As a side note, while the NADplus supplementation is an interesting idea, the previous study cited did these experiments in vitro in cell lines, so it is not clear if this would have the same effect in vivo. In addition, the time frame that they analyzed was following 24-72 hours of supplementation in cultured cells, which led to ~10% increase in IIH6 at 24 hours. We are unable to incubate acute slices for that amount of time prior to our recordings.

      • 3. Minor point. Genetic abbreviation for POMT2 should be "Pomt2", unless some other justification is provided by the authors. I believe the other mutations introduced (e.g. FKRP P448L are humanized mutations).

      This has been corrected throughout

      • 4. While dystroglycan glycosylation using the IIHC6 antibody is important for proper localization, the core DAG-6F4 monocloncal antibody (DSHB Iowa Hybridoma Bank) would inform you if there is actual disruption in the amount of dystroglycan protein translation and/or production in the forebrain. Can the authors address this question on total dystroglycan production?

      This is a great suggestion. We obtained both the DAG-6F4 monoclonal antibody from DSHB and a monoclonal antibody to alpha-Dag1 from Abcam (45-3) and tried using them for immunostaining, but they did not work with brain tissue. However, we were able to use an antibody to beta-Dag1 (Leica, B-DG-CE) for immunostaining. This new data is included in Figure 1, Supplement 2 (text lines 134-140) and shows that as expected, beta-Dag1 is completely gone in Dag1;Emx1-Cre and Dag1Cyto mutants. In the Pomt2;Emx1-Cre mutants, betaDag1 is present but no longer has the punctate appearance consistent with synaptic localization. We have added a section in the discussion expanding on the interpretation of the data, lines 449-462.

      • 5. Please comment more on the structural changes in the forebrain and the presence or lack thereof cobblestone (e.g. lissencephaly) in the POMT2 mutant mice (and the other dystroglycanopathy models)? There appears to be some discordance with that and the human Walker Warburg Syndrome (WWS) patients.

      The Pomt2;Emx1-cre mutants show a cobblestone phenotype (identical to the Dag1;Emx1-Cre mutants), see Figure 2. This is consistent with these two models having a complete loss of Dag1 function, and therefore modeling the most severe forms of dystroglycanopathy (WWS, MEB). In contrast, the B4Gat1 and FKRP mutants show relatively normal cortical migration because these mutants are hypomorphic and therefore retain some degree of functional Dag1. These two mice model a milder form of dystroglycanopathy. We have clarified this on lines 188-190 and 573-578.

      • 6. Line 577. Minor typo, statement ended in a comma, versus a period.

      Done

      • 7. Methods. Please report on the sex of the mice used in the experiments.

      Mice of both sexes were used throughout the study. This has been clarified in the methods section, and we have added information regarding how many mice of each sex were used in each experiment in supplemental table 1

      Reviewer #3 (Recommendations For The Authors):

      Additional Specific Comments,

      • Although authors include n slice/animals and other details in the methodology, including data as % changes and n (slices/animals) in results will greatly improve the readability.

      We have clarified that only one cell per slice was used for physiological recordings (Figure 6) in the methods section, as CCh does not wash out.

      • 2. IPSCs are measured as inward currents in high chloride with AMPA blockers which is appropriate. However, Mg was appears to be low (1 mM) in cutting solution. Was this the case in the recording solution. If so, why were NMDA blockers not used.

      To clarify, 10mM Mg was included in the cutting solution, and 1mM Mg was included in the recording solution. When the cell is clamped at -70mV, 1mM Mg2+ is sufficient to block NMDA receptors: haps://www.nature.com/ar5cles/309261a0

    1. Author Response

      Reviewer 1:

      1. The missing mouse gender information will be incorporated into the revised manuscript. For flow cytometry, two male and two female mice of each genotype were used. For single cell RNA sequencing, two female and one male mouse of each genotype were used. For the bulk RNA sequencing four male cd47−/− mice and four male wildtype mice were used.

      2. The bulk RNA sequencing analysis identified elevated expression of erythropoietic genes in CD8+ spleen cells from cd47−/− versus wildtype mice that were obtained using magnetic bead depletion of all other lineages. Therefore, we used the same Miltenyi negative selection kit as the first step to prepare the cells for single cell RNA sequencing. These untouched cells were then depleted of most mature CD8 T cells using a Miltenyi CD8a(Ly2) antibody positive selection kit. An important consideration underlying this approach was recognizing that the commercial magnetic bead depletion kits used for preparing specific immune cell types are optimized to give relatively pure populations of the intended immune cells using wildtype mice. Our previous experience studying NK cell development in the cd47−/− mice taught us that NK precursors, which are rare in wildtype mouse spleens, accumulate in cd47−/− spleens and were not removed by the antibody cocktail optimized for wildtype spleen cells (Nath et al Front Immunol 2018). The present data indicate that erythroid precursors behave similarly.

      3. Anemia is a prevalent side effect of several CD47 therapeutic antibodies being developed for cancer therapy. Anemia would be expected to induce erythropoiesis in bone marrow and possibly at extramedullary sites. Human spleen cells are not accessible to directly evaluate extramedullary erythropoiesis in cancer patients, but analysis of circulating erythroid precursors or liquid biopsy methods could be useful to detect induction of extramedullary erythropoiesis by these therapeutics. We are currently investigating the ability of CD47 antibodies to directly induce erythropoiesis using a human in vitro model.

      Reviewer 2:

      1. The reviewer asked, “whether the increased splenic erythropoiesis is a direct consequence of CD47-KO or a response to the anemic stress in this mouse model.” Our data supports both a direct role for CD47 and an indirect role resulting from the response to anemic stress. We cited our previous publications describing increased Sox2+ stem cells in spleens of Cd47 and Thbs1 knockout mice, but we neglected to emphasize another study where we found that bone marrow from cd47−/− mice subjected to the stress of ionizing radiation exhibited more colony forming units for erythroid (CFU-E) and burst-forming unit-erythroid (BFU-E) progenitors compared to bone marrow from irradiated wildtype mice (Maxhimer Sci Transl Med 2009). Taken together, our published data demonstrates that loss of CD47 results in an intrinsic protection of hematopoietic stem cells from genotoxic stress. This function of CD47 is thrombospondin-1-dependent and is consistent with the up-regulation of early erythroid precursors in the spleens of both knockout mice but cannot explain why the Thbs1−/− mice have fewer committed erythroid precursors than wildtype. We cited studies that documented increased red cell turnover in cd47−/− mice but less red cell turnover in Thbs1−/− mice compared to wildtype mice. Increased red cell clearance in cd47−/− mice is mediated by loss of the “don’t eat me” function of CD47 on red cells. In wildtype mice, clearance is augmented by thrombospondin-1 binding to the clustered CD47 on aging red cells (Wang, Aging Cell 2020). Thus, anemic stress in the mouse strains studied here decreases in the order cd47−/− > WT > Thbs−/−. This is consistent with the increased committed erythroid progenitors reported here in cd47−/− spleens and decreased committed progenitors in the Thbs1−/− spleens.

      2. The cd47−/− mice used for the current study are the same strain as those reported by Lindberg et al in 1996, with additional backcrossing onto a C57BL/6 background.

    1. Author Response

      We are grateful to the editor and the reviewers for recognizing the importance of our theoretical study on the mechanisms of centrosome size control. We appreciate their thoughtful critiques and suggested improvements, all of which we intend to address in the revised manuscript as outlined below. We acknowledge that the experimental evidence supporting the proposed theory is currently incomplete. We anticipate that our study will serve as inspiration for future experiments aimed at testing the proposed theory.

      As noted by both reviewers, our model is built on the assumption that the diffusion of molecular components is much faster than any reactive time scales. To explore the impact of diffusion on centrosome size regulation, we are presently working on a spatial model of centrosome growth within a spatially extended system. Our objective is to analyze the influence of diffusion, and we plan to integrate these findings into the revised manuscript.

      To address the concerns raised by both the reviewers regarding the applicability of our model to various organisms, we plan to revise the manuscript to clearly delineate the parameter ranges within which our model could be relevant for different organisms such as C. elegans or Drosophila. While centrosomal components may vary among different organisms, the underlying pathways of interactions exhibit similarities. Leveraging the generality of our theory, it has the capability to capture diverse centrosomal growth behaviors contingent on the parameter choices. Our objective is to emphasize these distinctions, illustrating how the modulation of growth cooperativity and enzyme concentration can influence size regulation and size scaling behaviors. Given the limited availability of quantitative experimental data across diverse organisms, we recognize the challenge in directly comparing our theory with data. Nevertheless, we are committed to presenting a thorough motivation for such comparisons to prevent any confusion or readability issues.

      We acknowledge the reviewers' concerns regarding the limited details provided on the simulation methods and the rationale behind the choice of model parameters. To address this, we will provide detailed explanations on the stochastic simulations, how the model parameters were calibrated, accompanied by appropriate references for the selected parameter values. Additionally, we thank reviewer 1 for the excellent suggestion to incorporate a linear stability analysis of the ordinary differential equations underlying the model. This analysis will offer valuable insights into how the physical parameters of the model influence the tendency to produce equal-sized centrosomes, and we are committed to including this in the revised manuscript. Additionally, we thank reviewer 2 for proposing the use of Polo pulse dynamics to more precisely constrain the parameter regime for centrosome growth dynamics in Drosophila. We will strive to incorporate this into the revised manuscript, recognizing the challenge of quantitatively interpreting centrosome size or subunit concentration values from experimental data on fluorescence intensities. We also plan to discuss enzyme pulse dynamics in C. elegans in the revised manuscript, as it presents a valuable prediction from our model.

      We disagree with reviewer 1's assertion that Reference 8 (Zwicker et al., PNAS 2014) effectively addresses the robustness of centrosome size equality in the presence of positive feedback. The linear stability analysis presented in Figure 5 of Reference 8 demonstrates stability of centrosome size around the fixed point, leading to the inference that Ostwald ripening can be inhibited by the catalytic activity of the centriole. In our manuscript (see Supplementary Figure 3), we demonstrate that the existence of the stable fixed point does not necessarily give rise to equal-sized centrosomes due to the slow dynamics of the solution around the fixed point. With an appreciable amount of positive feedback in the growth dynamics, the solution moves very slowly around the fixed point (similar to a line attractor), and cannot reach the fixed point within a biologically relevant timescale leaving the centrosomes at unequal sizes. Therefore, we argue that the model in Reference 8 lacks a robust mechanism for size control in the presence of autocatalytic growth. Additionally, we wish to emphasize that the choice of initial size difference in our model does not qualitatively alter the results for robustness in centrosome size equality, as shown in Supplementary Figure 3. Nevertheless, we acknowledge the need for a quantitative analysis of the dependence of size regulation on the initial discrepancy in centrosome size. We will incorporate such an analysis into the revised manuscript to strengthen our conclusions. Reviewer 2 has questioned the dismissal of the non-cooperative growth model, suggesting that minor adjustments in that model, such as incorporating size-dependent addition or loss rates due to surface assembly/disassembly, could potentially maintain equally sized organelles with sigmoidal growth dynamics. However, this conclusion is inaccurate. Any auto-regulatory positive feedback would result in size inequality, unless the positive feedback is shared between the organelles. The introduction of size-dependent addition rates due to surface-mediated assembly, would result in auto-regulatory positive feedback, leading to unequal sizes. We have explored a similar scenario of growth dynamics involving assembly and disassembly throughout the pericentriolic material volume in Supplementary Section II, demonstrating significant size inequality in that model and a lack of robustness in size control. We will provide a detailed response to this point in our reply, along with an explicit examination of the surface assembly model.

      In addition to the aforementioned modifications, we will revise the section discussing the predictions of the proposed model in the revised manuscript to rectify any lack of clarity in testable model predictions. We aim to provide clearer demonstrations of how our model predictions differ from those of previous models.

    1. Author Response

      The following is the authors’ response to the original reviews.

      We are grateful to the 3 reviewers and the editorial team for agreeing that our work is rigorous and valuable for the fields of olfaction and developmental biology. We provide a revised version of the manuscript that addresses major concerns raised by the reviewers and adheres to their suggestions.

      Specifically:

      -We clarify what is novel in this work and we cover the appropriate literature.

      -We tone down the language and interpretation of our data

      -We clarify the categorization of zones and improve the readability to the best of our ability.

      We have also made every effort to address minor points raised by the 3 reviewers and made clarifications wherever requested.

    1. Author Response

      The following is the authors’ response to the original reviews.

      Public Reviews:

      Reviewer #1 (Public Review):

      In order to find small molecules capable of enhancing regenerative repair, this study employed a high throughput YAP-activity screen method to query the ReFRAME library, identifying CLK2 inhibitor as one of the hits. Further studies showed that CLK2 inhibition leads to AMOTL2 exon skipping, rendering it unable to suppress YAP.

      The novelty of the study is that it showed that inhibition of a kinase not previously associated with the HIPPO pathway can influence YAP activity through modification of mRNA splicing. The major arguments appear solid.

      We thank the Reviewer for their thoughtful assessment of this work. We have fully addressed each comment below in a point-by-point fashion.

      There are several noteworthy points when assessing the results. In Figure S1C, 100nM drug was toxic to cells at 72 hours and 1nM drug suppressed cell proliferation by 60%. Yet such concentrations were used in Figure 1B and C to argue CLK2 inhibition liberates YAP activity (which one would assume will increase cellular proliferation). In Figure 1C it appears that 1nM drug treatment led to some kind of cellular stress, as cells are visibly enlarged. In Figure 1D, 1nM drug, which would have suppressed cell growth by 60%, did not affect YAP phosphorylation. Taken together, it appears even though CLK2 inhibitor (at high concentrations) liberates YAP activity, its toxicity may override the potential use of this drug as a YAP-activator to salve tissue regenerative repair, which was one of the goals hinted in the background section.

      We do not claim that CLK2 inhibition is useful as a YAP activator, either as a precise pharmacological tool or as a therapeutic mechanism for inducing regenerative repair. Instead, the key finding of this work is to describe a novel, unanticipated cellular mechanism for activating YAP, one that should be considered when optimizing pharmacological candidates that modulate alternative splicing for diseases where potential proliferation is undesirable.

      However, to address this point, we have included additional experimentation. Specifically, we show that cytotoxicity with compound treatment at 24 hours, a timepoint at which we perform most evaluation of alternative splicing induced by compound, is considerably less than that observed at 72 hours. Now included as Figure S1C, this panel shows while the compound displays some cytotoxicity at ~1 nM at 72 hours, the half maximal inhibitory potency at 24 hours is ~300 nM. As such, we believe there is not incongruity between YAP activity, cellular proliferation, and SM04690-induced cytotoxicity. It is simply such that higher concentrations of compound, and thus increased engagement of CLK2 and other targets of the inhibitor, result in a cumulative cytotoxic effect over time.

      In Figure 2D, at 100nM concentration, the drug did not appear to affect AMOTL2 splicing. Even though at higher concentrations it did, this potentially put into question whether YAP activity liberated by this drug at 1nM (Fig 2A), 10-50nM (Fig 2C) concentrations is caused by altered AMOTL2 splicing. Discussions should be provided on the difference in drug concentrations in these experiments. Does the drug decay very fast, and is that why later studies required higher dose?

      We believe this comment is in reference to Fig. 3D, and we argue that, while faint, there is the presence of AMOTL2 splicing at 100 nM SM04690 treatment as seen by a faint lower molecular weight band. However, to further understand the extent to which AMOTL2 is alternatively spliced in response to compound treatment, we performed RT-qPCR analysis of AMOTL2 splicing with an expanded concentration response. These results indicate that high magnitude exon skipping of AMOTL2 occurs starting at 10 nM with 24-hour treatment of compound (now in the manuscript as Fig. S4A). This result matches with our data in Fig. 2C, wherein YAP phosphorylation begins decreasing at 10 nM SM04690 treatment.

      Likely impact of the work on the field: this study presented a high throughput screen method for YAP activators and showed that such an approach works. The hit compound found from ReFRAME library, a CLK2 inhibitor, may not be actually useful as a YAP activator, given its clear toxicity. Applying this screen method on other large compound libraries may help find a YAP activator that helps regenerative repair. The finding that CLK2 inhibition could alter AMOTL2 splicing to affect HIPPO pathway could bring a new angle to understanding the regulation of HIPPO pathway.

      Reviewer #2 (Public Review):

      In this manuscript, the authors have screened the ReFRAME library and identified candidate small molecules that can activate YAP. The found that SM04690, an inhibitor of the WNT signaling pathway, could efficiently activate YAP through CLK2 kinase which has been shown to phosphorylate SR proteins to alter gene alternative splicing. They further demonstrated that SM04690 mediated alternative splicing of AMOTL2 and rendered it unlocalized on the membrane. Alternatively spliced AMOTL2 prevented YAP from anchoring to the cell membrane which results in decreased YAP phosphorylation and activated YAP. Previous findings showed that WNT signaling more or less activates YAP. The authors revealed that an inhibitor of WNT signaling could activate YAP. Thus, these findings are potentially interesting and important. However, the present manuscript provided a lot of indirect data and lacked key experiments.

      We thank the Reviewer for their thorough review of this work. We have responded to each comment below.

      Major points:

      1. In Figure S3, since inhibition of CLK2 resulted in extensive changes in alternative splicing, why did the authors choose AMOTL2? How to exclude other factors such as EEF1A1 and HSPA5, do they affect YAP activation? Angiomotin-related AMOTL1 and AMOTL2 were identified as negative regulators of YAP and TAZ by preventing their nuclear translocation. It has been reported that high cell density promoted assembly of the Crumbs complex, which recruited AMOTL2 to tight junctions. Ubiquitination of AMOTL2 K347 and K408 served as a docking site for LATS2, which phosphorylated YAP to promote its cytoplasmic retention and degradation. How to determine that alternative splicing rather than ubiquitination of AMOTL2 affects YAP activity? Does AMOTL2 Δ5 affect the ubiquitination of AMOTL2? Does overexpression of AMOTL2 Δ5Δ9 cause YAP and puncta to co-localize?

      AMOTL2 is the relevant cellular target, because among the entire transcriptome it was the third most alternatively spliced in response to CLK2 inhibition (Fig. S3). No other targets relevant to the Hippo pathway were identified.

      We have shown that overexpression of exon skipped AMOTL2 (Fig. 3F) recapitulates the effect of compound, indicating that splicing per se is what drives the YAP activation phenotype. While AMOTL2 is ubiquitinated, these established sites of ubiquitination do not lie within exons 5 or 9. Thus, we anticipate that ubiquitination is less likely a driving factor in the observed phenotype. The manuscript is written as not to exclude this as a possibility, but it is downstream of what we describe, and we believe out of scope to explore this further in this preliminary report.

      1. The author proposed that AMOTL2 splicing isoform formed biomolecular condensates. However, there was no relevant experimental data to support this conclusion. AMOTL2 is located not only on the cell membrane but also on the circulating endosome of the cell, and the puncta formed after AMOTL2 dissociation from the membrane is likely to be the localization of the circulating endosome. The author should co-stain AMOTL2 with markers of circulating endosomes or conduct experiments to prove the liquidity of puncta to verify the phase separation of AMOTL2 splicing isoform.

      We do not claim AMOTL2 forms biomolecular condensates. Instead, we hypothesize in the Discussion section that AMOTL2 could possibly phase separate into biomolecular condensates based on its similarity to AMOT, which has been shown to phase separate and form cytoplasmic puncta (PMID: 36318920). AMOT has also been shown to colocalize with endosomes (PMID: 25995376), which also appear as puncta.

      1. The localization of YAP in cells is regulated by cell density, and YAP usually translocates to the nucleus at low cell density. In Figure 2E, the cell densities of DMSO and SM04690-treated groups are inconsistent. In Figure 4A, the magnification of t DMSO and SM04690-treated groups is inconsistent, and the SM04690treated group seems to have a higher magnification.

      In immunofluorescence experiments, cells were plated at the same density and grown for the same amount of time before treatment. Additionally, within an experiment, images were taken at the same magnification. Any apparent differences in cell density are due to effects of the compound.

      1. There have been many reports that the WNT signaling pathway and the Hippo signaling pathway can crosstalk with each other. The authors should exclude the influence of the WNT signaling pathway by using SM04690.

      While the WNT pathway has been shown to influence Hippo pathway activity, we have shown a direct effect of CLK2 inhibition by SM04690. Any WNT potential pathway effects are in addition to the splicing-based mechanism we described.

      Reviewer #3 (Public Review):

      This study on drug repurposing presents the identification of potent activators of the Hippo pathway. The authors successfully screen a drug library and identify two CLK kinase inhibitors as YAP activators, with SM04690 targeting specifically CLK2. They further investigate the molecular basis of SM04690-induced YAP activity and identify splicing events in AMOTL2 as strongly affected by CLK2 inhibition. Exon skipping within AMOTL2 decreases the interactions with membrane bound proteins and is sufficient to induce YAP target gene expression. Overall the study is well designed, the conclusions are supported by sufficient data and represent an exciting connection between alternative splicing and the HIPPO pathway. The specificity of the inhibitor towards CLK2 and the mode of action via AMOTL2 could be supported by further data:

      We thank the Reviewer for their close examination of our work. We respond below.

      1. The inconsistent inhibitor concentrations and varying results reported in the paper can be distracting. For instance, the response of endogenous targets to 100 nM concentration is described as a >5-fold increase in Figure 2B, whereas it is reported as a 1-1.5-fold response to 1000 nM in Figure 2D. This inconsistency should be addressed and clarified to provide a more accurate and reliable representation of the findings.

      In Figure 2D, we have transduced cells with lentivirus, which most likely suppresses their responsiveness to compound treatment. We have addressed the issue of varying inhibitor concentrations in response to Reviewer 1.

      1. In the absence of a strong inhibitor induced YAP target gene expression (Figure 2D), it is difficult to conclude the dependency on YAP expression, as investigated by siRNA mediated knockdown. In a similar experiment, the dependency of the inhibitor on CLK2 expression could be confirmed

      While the sample with Scramble virus does not respond to the same extent that WT HEK293A cells do (e.g., Fig. 2B), there is still responsiveness to compound. Likewise, YAP knockdown cells display statistically significant decreases in YAP-controlled transcripts. This decrease of transcript is therefore sufficient evidence that SM04690 requires YAP for its activity. We have shown that multiple CLK2 inhibitors recapitulate the effect of SM04690, abrogating the need to show dependency of CLK2.

      1. To further support the conclusion that CLK2 is the direct target of SM04690, it would be informative to investigate the effects of CLK1/4 inhibition on AMOTL2 exons (for example within RNA-seq data). If CLK1/4 inhibitors do not induce changes in AMOTL2 exons, it would strengthen the evidence for CLK2's role as the direct target. Including the results in the discussion would enhance the comprehensiveness of the study.

      We showed that CLK1/4 inhibition with small molecules ML167 and TG003 does not affect YAP activity in our luciferase reporter assay (Fig. S2D), which we believe is sufficient evidence that CLK1/4 is neither the direct target of SM04690 nor relevant to the splicing mechanism we describe.

      1. It would be important to determine the specific dose of SM04690 required to induce changes in AMOTL2 splicing. The authors observe that AMOTL2 protein levels appear unaffected at doses below 50 nM in Figure 3D, while YAP target genes are already affected at 20 nM in Figure 3G. Although Western blotting may not be the most sensitive method to detect minor changes in splicing, performing PCR experiments at lower doses could provide more insight into the splicing changes. Therefore, it is suggested that the authors include PCR experiments at lower doses to determine if changes in splicing are visible and to better establish the relationship between splicing and gene expression changes.

      We agree with the Reviewer that this experiment is essential to better understand splicing changes with SM04690 treatment. Accordingly, we have added RT-qPCR-based analysis of AMOTL2 exon inclusion at lower concentrations between 10 nM and 100 nM (Fig. S4A). We included a similar discussion in response to a point from Reviewer 1.

      Reviewer #1 (Recommendations For The Authors):

      As stated in the public review section, it will be helpful to discuss the differences in drug concentration. Although no one should require or expect a perfect drug dose match throughout any study, in this study the drug dose clearly demarcated when CLK2 inhibitor help/hurt proliferation, when CLK2 inhibitor was able to affect YAP phosphorylation, and when CLK2 inhibitor was able to affect AMOTL2 splicing. This is not to challenge the major conclusions of the paper, but it is hard to ignore if no discussion is provided.

      Several suggestions on data presentation:

      1. Scale bar information is missing in Fig. 2E, 4A and 4B.

      We have corrected this mistake in the revised manuscript.

      1. For Fig.3 D and 3E, it's better if kD information was labeled alongside the AMOTL2 Western blot.

      Thank you for the suggestion; we have added the appropriate labeling.

      1. It's better to label Figure2D as sh YAP-1, sh YAP-2; Figure 3A as sh CLK2-1, sh CLK2-2 etc. Currently they are all labeled shRNA-1, shRNA-2, which can be confusing.

      We have altered the labeling for clarity as requested.

      Reviewer #3 (Recommendations For The Authors):

      1. The use of asterisks in Figure 2D is unclear, especially their placement on the "Scramble" sample.

      We have amended the asterisks and have also added more detail to the figure legend.

      1. When designing primers for splicing-sensitive PCR, it is recommended that the skipping isoform is larger than 100 bp. This will help to avoid quantitative issues with ethidium bromide staining. In the results part, the text reads as if only the skipping isoform is present after SM04690 treatment.

      This experiment was performed to confirm the presence of exon skipping in the treated samples. Accordingly, we did not optimize the ethidium bromide staining of the lower bp bands. We will take the size of the isoform into consideration in any future experiments. We thank the reviewer for catching the textual error and have amended the text in the manuscript.

    1. Author Response

      The following is the authors’ response to the original reviews.

      Reviewer #1 (Recommendations For The Authors):

      My main request is to show the phylogeny in the main text, so the reader knows what nodes are being compared.

      Full phylogeny was added to the main text as Fig. 2. Additionally, phylogenetic tree in Newick format is presented as a Supplementary file 2.

      I also suggest the authors check their figure legends carefully. At least in figure one, I think there is some mix-up with the letter labelling of the panels.

      Our mistake. Figure legend was corrected. In this version of the manuscript Figure 1 was split into Fig. 1 and Fig. 3. Corrected version is presented in the legend to Fig. 3.

      And lastly, I urge the authors to deposit the tree, alignment, and reconstructed sequences in a public repository.

      Alignment in fasta format and phylogenetic tree in Newick format were added as supplementary files to the publication (supplementary file 1 and supplementary file 2, respectively). Reconstructed sequences (both Most likely and AltAll variants) were shown as a figure supplement (Figure 3 – figure supplement 2). Posterior probabilities for all positions of the reconstructed sequences were added as a supplementary file (supplementary file 3).

      Reviewer #2 (Recommendations For The Authors):

      -I find the term "secondarily single sHsp" to be a little confusing, especially because it is often used in relation to IbpA/B, but it is just IbpA in another species. I think it would be more clear for the reader to consistently refer to it as Erwiniaceae IbpA vs Escherichia IbpA, or something similar.

      In the introduction we clarified (page 4 lines 11-13) that the term “secondarily single” IbpA refers to IbpA that lacks partner protein as a result of ibpB gene loss. This is in opposition to “single-protein” IbpA from a clade in which gene duplication leading to creation of two – protein sHsp system did not occur (like Vibrionaceae or Aeromonadaceae) - see Obuchowski et al., 2019.

      -Figure 1B. The labels are not defined. What is L? A and B refer to IbpA and IbpB but this should be made more clear to the reader. Why is this panel only referred to in the Introduction and not the Results? Why is there a second panel for E.amy, rather than including it in the same panel, as for other experiments? What are the error bars? (That goes for every error bar in the paper, none are defined).

      Labels in Fig.1B were corrected; “L” was used in reference to “luciferase alone” and it has been corrected for consistency to “no sHsp”. The sHsps activity measurements (obtained in the same experiment) were split into two separate panels as a correspondence to the two branches of the simplified tree in Fig. 1. The figure was modified to make it clearer and avoid confusion. Definitions of error bars were added to this and other figures.

      -"AncA0 exhibited sequestrase activity on the level comparable to IbpA from Escherichia coli (IbpAE.coli). AncA1 was moderately efficient in this process and IbpA from Erwinia amylovora (IbpAE.amyl) was the least efficient sequestrase (Fig. 1D)." - First, this should be referring to Fig. 1C. Second, the text doesn't quite match the panel. A0 appears to have the strongest sequestrase activity over most concentrations. Can the authors comment on in what concentration range these differences are most meaningful?

      Figure legend was corrected. Descriptions of panels C and D were fixed. Now these data are presented in panels A and B of a new Fig. 3. In our opinion differences in sequestration are most meaningful at lower sHsp concentrations (in this case lower than 5 µM), as with high enough sHsp concentration even less effective sequestrases seem to be able to effectively sequester aggregated proteins. Comment about it was added to the main text (page 5, line 6)

      -"Ancestral proteins' interaction with the aggregated substrates was stronger than in the case of extant E. amylovora IbpA, but weaker than in the case of extant E. coli IbpA (Fig. 1C)." - Is this referring to Fig. 1C, or to the unlabelled panel on the bottom right panel of Fig 1 (that is not referred to in the legend)? Can the authors comment on why they think the 2 ancestral proteins are much more similar to each other than they are to either of the native IbpAs?

      Due to our mistake descriptions of panels C and D were switched.

      Figure 1 was rearranged and split into Figures 1 and 3. Former figure S1 (full phylogeny) was inserted into the main text, as Fig. 2, per request of reviewer #1. Former panel 1D (now 3B) was rearranged, as graph was not apparent to be a part of that panel and looked as if it was unlabeled.

      The fact that the two ancestral proteins are more similar to each other than to the extant E. coli and E. amylovora proteins in their interaction with model substrate might be caused by higher sequence identity between the two ancestral proteins than between ancestral and extant proteins (10 amino acid differences between AncA0 and AncA1 compared to 20 differences between AncA1 and IbpA from E. amylovora or 11 differences between AncA0 and IbpA from E. coli). One also has to remember that this property is only one aspect of sHsp activity – proteins AncA0 and AncA1 are much less similar to each other if other activities such as sequestrase activity are considered. Substrate affinity and sequestrase activity are connected to each other, but there isn’t a strict correlation, as can be seen in the case of free ACD domains, which strongly bind aggregated substrate while effectively lacking sequestrase activity (fig. 5 A, fig. 5 – figure supplement 4 A,B).

      -Figure 1E should have E. coli IbpA and IbpB, by themselves, included for comparison. Strangely, it seems, by comparison to Fig 1B, that the "inhibitory" activity of A0 is not present in the E. coli protein, and the authors should comment on this. Similarly, A1 disaggregation looks like it might not be significantly different than the E. coli protein. Can the authors comment on why disaggregation might be so low in A1 compared to E.amy?

      E. coli IbpA alone was added to Fig. 1E (Fig. 3C in the new version) as suggested.

      AncA1 indeed exhibits similar activity to extant IbpA from E. coli, which, at the conditions of the experiment, does not possess inhibitory effect observed for AncA0. This suggests that:

      -There was an additional increase in ability to stimulate luciferase disaggregation between AncA1 and extant IbpA from E. amylovora

      -There was also an increase of ability to stimulate luciferase refolding between AncA0 and extant E. coli IbpA, albeit to a significantly lesser degree than in the Erwiniaceae branch.

      It is quite likely that after separation of Erwiniaceae and Enterobacteriaceae sHsp systems, they underwent further optimization through evolution. This might have led to observed higher effectiveness of modern IbpAs from both clades in refolding stimulation in comparison to the reconstructed ancestral proteins.

      Despite the above, effects of substitutions on positions 66 and 109 on activities of the extant E. coli and E. amylovora proteins suggests that the two identified positions still play key role in differentiating extant IbpAs from Erwiniaceae and Enterobacteriaceae.

      Nevertheless, additional mutations that lead to increased ability to stimulate luciferase reactivation must have occurred in both Erwiniaceae and Enterobacteriaceae branches of the phylogeny during evolution. These substitutions would be a worthwhile subject of further study.

      -Fig 1D - lizate should be lysate.

      The typo was corrected.

      -What is the bottom right panel in Fig 1? It doesn't seem to be referred to in the legend.

      This panel was intendent to be the part of figure 1D, but it was not clearly visible. This figure was rearranged to make it clearer. Now these data are presented as Fig. 3B.

      -Sequences are provided for the ancestral proteins, but I don't see them anywhere for the alternative ancestral proteins. How similar are the Anc proteins to the AltAlls? If they are very similar, this may not tell us anything about "robustness".

      Sequences of alternative proteins are added as a figure supplement (Fig. 3 - figure supplement 2). Full sequences of ML and alternative ancestors with posterior probabilities for each reconstructed position are presented in supplementary file 3

      The testing of the robustness to statistical uncertainty was intended to test to what extent properties of reconstructed ancestral proteins could be influenced by uncertainty present in a given reconstruction due to probabilistic nature of the process. Relatively high similarity between ML and AltAll sequences would indicate low uncertainty of the reconstruction (most likely due to high conservation during evolution). In such a case similar properties of AltAll and ML proteins would simply indicate that they are robust to the level of uncertainty present in a given reconstruction (which may be low). It would not tell us much about “general” robustness to mutations, but it was not relevant to research questions considered.

      -If the functional gain by IbpA comes down to only two amino acid substitutions, I'm not convinced this would be meaningfully reflected in any tests of positive selection.

      After considering Reviewer #1’s comments about limitations of models used for selection analysis we added acknowledgment in the discussion (page 9, line 9 - 13) that results indicating positive selection in our dataset should not be considered conclusive (see answer to Reviewer #1’s public review below).

      -The full MSA should be provided as supplemental material.

      The full MSA in fasta format is presented in the supplementary file 1.

      -For the aggregate binding panels in Figs 3 and 4, it would be helpful to show the native and ancestral proteins for comparison. I know this is a bit redundant, as they're present in Fig 1, but I find it hard to judge the scale of change. This is especially important because A0 and A1 are very similar in Fig 1, so I want to see what kind of difference the 2 mutations make.

      Data presented in Fig. 3C (Fig. 5C in the new version) refer to the binding of α-crystallin domains (A0ACD and A0ACD Q66H G109D) and not full length sHsps to E. coli proteins aggregated on a BLI sensor. Our intention was to show the influence of the two crucial substitutions (Q66H G109D) on the properties of A0 ancestral α-crystallin domain.

      Figure 4 (Fig. 6 in the new version) represent the effects of the substitutions on the identified positions 66 and 109 on the properties of extant IbpA orthologs from E. coli and E. amylovora, showing that these two positions play a key role in differentiating properties of those extant proteins. Changes in binding to aggregated substrate caused by those substitutions, as shown in Figure 6 B,C (new version), are indeed larger than observed between AncA0 and AncA1, as shown in Fig. 3B (new version).

      One has to remember, however, that the experiment shown in Fig.3 (new version) shows the effects of all 10 amino acid changes between the nodes A0 and A1 and not only the two analyzed substitutions, as was the case in experiment shown in Fig. 6 B,C (new version). Moreover, due to relatively large number of differences between ancestral and extant sequences (11 differences between AncA0 and E. coli IbpA, 20 differences between AncA1 and E. amylovora IbpA), substitutions in the two experiments are introduced into different sequence context.

      Because of the above, we believe that direct comparison of the results obtained for ancestral proteins with the results obtained for substitutions introduced into extant proteins would not meaningfully contribute to answering the question of the role of analyzed substitution in the context of extant proteins, while decreasing clarity of presented information.

      -Some of the luciferase plots show a time course, but others just show a single %. What is the time point used for the single % plots?

      Information was added to appropriate figure legends that for experiments showing a single timepoint the luciferase activity was measured after 1h of refolding.

      Reviewer #3 (Recommendations For The Authors):

      1. In the Introduction, it would be beneficial to explore additional instances where this evolutionary simplification process has been observed in nature. Investigating the prevalence of this phenomenon and identifying other multi-protein systems that have undergone simplification could enhance the understanding of its significance and implications.

      The section of the introduction concerning gene loss and differential paralog retention was expanded with additional examples of gene loss that is considered adaptive (page 3 lines 1 - 12).

      1. I am intrigued by the reasons why certain organisms continue to maintain a two-protein system despite the viability of a single-protein system. This aspect is particularly relevant for bacteria, considering the fitness cost associated with maintaining extra gene copies. Do you have any hypotheses or theories that may shed light on this intriguing observation?

      Refolding of proteins from aggregates requires the functional cooperation of sHsps and chaperones from Hsp70 system and Hsp100 disaggregase. In two protein sHsps system one sHsp (IbpA) is specialized in substrate binding, while the second one (IbpB) possesses low substrate binding potential and enhances sHps dissociation from substrates (Obuchowski et al, 2019). Thus, the presence of IbpB reduces the amount of chaperones from Hsp70 system required to outcompete sHsps from aggregated substrates to initiate refolding process. The cost associated with maintaining extra sHsp gene copy (ibpB) in bacteria might be compensated by lower requirement for Hsp70 chaperones for efficient and fast protein refolding following stress conditions.

      In this study we have demonstrated how such a system could have been simplified to a single – protein system capable of efficient substrate sequestration as well as stimulation of reactivation. This indeed leads to the question why such single – protein system isn’t more prevalent in Enterobacterales.

      One possibility may be that there are very specific requirements for efficient reactivation by a single – protein sHsp system. We have shown that new, more efficient IbpA functionality observed in Erwiniaceae required at least two separate mutations. It is possible, that such combinations of two substitutions simply did not occur in Enterobacteriaceae clade, in which IbpA still required partner protein for efficient reactivation stimulation.

      One must also remember that experiments performed in this study were performed in vitro in a specific set of conditions, which most likely does not represent whole spectrum of challenges faced by different bacteria. It is possible that two – protein system has some other additional adaptive effects, counterbalancing the additional cost of gene maintenance. It was for example recently shown (Miwa & Taguchi, PNAS, 120 (32) e2304841120) that bacterial sHsps play an important role in regulation of stress response. Two – protein system could potentially allow for more complex regulation.

      1. Incorporating X-ray crystallization as an additional technique in the methodology would offer detailed molecular insights into the effects of Q66H and G109D substitutions on ACD-C-terminal peptide and ACD-substrate interactions. The inclusion of such data would further strengthen the results section and provide robust support for your findings. Since the x-ray data might be difficult to collect, the authors might think to get alphafold model or some rosetta score for the model to discuss the finding further.

      In response to reviewer comment we added the comparison of the structural models of AncA0 and AncA0 Q66H G109D ACD dimers complexed with the C-terminal peptides, representing middle structures of largest clusters obtained from equilibrium molecular dynamics simulation trajectories based on the AlphaFold2 prediction and in silico mutagenesis (Fig. 5 – figure supplement 2). Model comparison as well as C-terminal peptide – ACD contact analysis did not reveal any major changes in mode of peptide binding or α-crystallin domain conformation, although we do acknowledge that simulation timescale limits the conformational sampling.

      Reviewer #1 (Public Review):

      The work in this paper is in general done carefully. Reconstructions are done appropriately and the effects of statistical uncertainty are quantified properly. My only slight complaint is that I couldn't find statistics about posterior probabilities anywhere and that the sequences and trees do not seem to be deposited.

      Posterior probabilities for all positions of reconstructed proteins were added as a supplementary file 3. MSA of all sequences used for ancestral reconstruction as well as phylogenetic tree in Newick format were added as supplementary files 1 and 2, respectively.

      I would also have preferred to have the actual phylogeny in the main text. This is a crucial piece of data that the reader needs to see to understand what exactly is being reconstructed.

      Full phylogeny was added to the main text as Fig. 2.

      The paper identifies which mutations are crucial for the functional differences between the ancestors tested. This is done quite carefully - the authors even show that the same substitutions also work in extant proteins. My only slight concern was the authors' explanation of what these substitutions do. They show that these substitutions lower the affinity of the C-terminal peptide to the alpha-crystallin domain - a key oligomeric interaction. But the difference is very small - from 4.5 to 7 uM. That seems so small that I find it a bit implausible that this effect alone explains the differences in hydrodynamic radius shown in Figure S8. From my visual inspection, it seems that there is also a noticeable change in the cooperativity of the binding interaction. The binding model the authors use is a fairly simple logarithmic curve that doesn't appear to consider the number of binding sites or potential cooperativity. I think this would have been nice to see here.

      The binding model we used is equivalent to the Hill equation as it accounts for the variable slope of sigmoid function by inclusion of input scaling factor k, which is equivalent to the hill coefficient. Simple one site binding model and two site binding model were also considered but provided worse fits to the data than model including binding cooperativity. Not providing values of fitted parameter k was our mistake, and it was corrected (Fig. 5. with a legend). Additionally, output scaling parameter L is not necessary as fraction bound takes values from 0 to 1, therefore we have fitted the curves again without this parameter. The new values of fitted parameters are very similar to the previous ones. To make text more accessible to the reader, we have used a conventional form of Hill equation. Indeed, AncA0 Q66H G109D ACD displays higher binding cooperativity than more ancestral AncA0 ACD (hill coefficient 2.3 for AncA0 vs 3.7 for AncA0 Q66H G109D). Fitted values of Hill coefficients are higher than one can expect for 2-site ACD dimer, which is probably caused by an experimental setup of BLI, where C-terminal peptide is immobilized on the sensor and ACD is present in solution as bivalent analyte leading to emergence of avidity effects. Both cooperativity and avidity are reflected in the value of Hill coefficient, however as ligand density on the sensor is the same in all experiments only change in ACD binding cooperativity can account for observed difference in the value of Hill coefficients. Difference in the C-terminal peptide binding cooperativity may influence the process of sHsp oligomerization and assembly formation despite similar binding affinity, especially if avidity of multiple binding sites within oligomer is considered.

      In addition, we changed the legend to Figure S8 (now called Fig. 5 – figure supplement 4A ) to clarify the fact that the differences in average hydrodynamic radius are in fact ferly small. To highlight the observation that there are two populations of particles in AncA0 and AncA0 Q66H G109D measured at 25, 35 and 45 °C with different hydrodynamic diameters, we used % of intensity in DLS measurement. It allows us to show the change in the hydrodynamic diameter distribution that is relatively small. We recognize it was not properly explained in the article and added a clarification in figure description.

      Lastly, the authors use likelihood methods to test for signatures of selection. This reviewer is not a fan of these methods, as they are easily misled by common biological processes (see PMID 37395787 for a recent critique). Perhaps these pitfalls could simply be acknowledged, as I don't think the selection analysis is very important to the impact of the work.

      We thank the reviewer for pointing to the recent research about limitations of methods used in our work in selection analysis. As per recommendation we added acknowledgment of limitations of methods used to discussion (page 9, line 9 - 13), modifying wording of our conclusions to deemphasize significance of selection analysis results.

    1. Author Response:

      We thank the editors and reviewers for their time in reviewing our manuscript. We would like to post a brief response to the peer reviews at this stage, and we will revise the manuscript and re-post at a later time.

      The main concerns regarding our molecular dating approach consist of the limited number of marker genes used for phylogenetic reconstruction, the molecular clock model employed, and the calibrations used. Firstly, regarding the marker genes that we used in our phylogenetic reconstruction, we will point out that we have extensively benchmarked these methods in a previous study (Martinez-Gutierrez and Aylward, 2021). We initially planned on presenting all of these results together in the same manuscript, but we decided that benchmarking phylogenetic marker genes across all Bacteria and Archaea together with an extensive molecular dating analysis was too much for a single study, and we therefore divided the results into two papers. In short, we agree with R1 that the use of different marker genes will lead to marked differences in the posterior ages of our Bayesian molecular dating analysis; however, we demonstrated that several of the few marker genes shared between Bacteria and Archaea lack of a strong phylogenetic signal and therefore introduce topological biases in the final phylogeny (i.e., long branch attraction). Consequently, using poorly-performing marker genes for molecular dating does not add valuable information to the overall analysis.

      Secondly, regarding the autocorrelated Log-normal model used in our study (-ln on Phylobayes), we believe this is appropriate. Besides being biologically meaningful for our study, it represents a compromise between a relaxed model with rate variation across branches and the assumption of correlation between parent and descent branches (Thorne et al., 1998). In contrast, a fully uncorrelated model that assumes rate independence across branches would make our analysis extremely time-consuming and intractable given our study encompasses all of Bacteria and Archaea. Nonetheless we understand the concerns raised, and in a future manuscript we will include age estimates resulting from the CIR and UGAM models in order to explore the potential effect of model selection in posterior dates.

      Thirdly and lastly, we will point out that calibrations for molecular dating of Bacteria and Archaea are always highly controversial, and there are essentially no calibrations for the early evolution of life on Earth that would not be contested to some degree. Researchers are therefore left to use their best judgment and provide reasonable rationale, which we have done here. We understand that strong opinions abound in this area, and many researchers will disagree with our approach, but that alone does not invalidate our study. Moreover, the main novelty of our approach is the use of a large tree that combines Bacteria and Archaea; extensive benchmarking of different calibration points on such a large tree is not possible here as it may be on a smaller set. One of the main concerns is the use of the age estimate of the Great Oxidation Event (GOE, 2.4 Ga) as minimum and maximum constraints for oxygenic Cyanobacteria, and Ammonia Oxidizing Archaea and aerobic Marinimicrobia, respectively. We agree that oxygen may have existed before the GOE as proposed previously (e.g., Ostrander et al., 2021), however; the strongest geochemical evidence so far (Mass Independent Fractionation of Sulfur, MIFs, (Farquhar et al., 2000)) indicates a significant accumulation of oxygen around that time. We therefore feel that this is a reasonable calibration to use for microbial lineages that have a physiology that is tightly linked to the production or consumption of oxygen. Similar reasoning has been used in other molecular dating studies, so our logic is not out of step with much research in the field (Liao et al., 2022; Ren et al., 2019).

      Due to the limitations of molecular dating studies of microorganisms, we have been very careful to avoid strong conclusions based on the absolute dates we calculated, and the primary interest of readers will likely be the relative divergence times of the marine clades we study (i.e., the overall timeline of microbial diversification in the ocean). We will provide a more in-depth assessment of models and calibrations for Bacteria and Archaea in a future draft, but in the meantime we hope to convey that our study is not without merit despite the substantial challenges of research in this area.

      References:

      • Farquhar J, Bao H, Thiemens M. 2000. Atmospheric influence of Earth’s earliest sulfur cycle. Science 289:756–759.
      • Liao T, Wang S, Stüeken EE, Luo H. 2022. Phylogenomic Evidence for the Origin of Obligate Anaerobic Anammox Bacteria Around the Great Oxidation Event. Mol Biol Evol 39. doi:10.1093/molbev/msac170
      • Martinez-Gutierrez CA, Aylward FO. 2021. Phylogenetic Signal, Congruence, and Uncertainty across Bacteria and Archaea. Mol Biol Evol 38:5514–5527.
      • Ren M, Feng X, Huang Y, Wang H, Hu Z, Clingenpeel S, Swan BK, Fonseca MM, Posada D, Stepanauskas R, Hollibaugh JT, Foster PG, Woyke T, Luo H. 2019. Phylogenomics suggests oxygen availability as a driving force in Thaumarchaeota evolution. ISME J 13:2150–2161.
      • Ostrander CM, Johnson AC, Anbar AD. 2021. Earth's first redox revolution. Annu Rev Earth Planet Sci. 49, 337-366.
      • Thorne JL, Kishino H, Painter IS. 1998. Estimating the rate of evolution of the rate of molecular evolution. Mol Biol Evol 15:1647–1657.
    2. Author Response

      The following is the authors’ response to the original reviews.

      Thank you for your time and effort in handling and reviewing our manuscript. We have responded to all comments below.

      Reviewer #1 (Public Review):

      Martinez-Gutierrez and colleagues presented a timeline of important bacteria and archaea groups in the ocean and based on this they correlated the emergence of these microbes with GOE and NOE, the two most important geological events leading to the oxygen accumulation of the Earth. The whole study builds on molecular clock analysis, but unfortunately, the clock analysis contains important errors in the calibration information the study used, and is also oversimplified, leaving many alternative parameters that are known to affect the posterior age estimates untested. Therefore, the main conclusion that the oxygen availability and redox state of the ocean is the main driver of marine microbial diversification is not convincing.

      We do not conclude that “oxygen availability and redox state of the ocean is the main driver of marine microbial diversification”. Our conclusion is much more nuanced. We merely discuss our findings in light of the major oxygenation events and oxygen availability (among other things) given the important role this molecule has played in shaping the redox state of the ocean.

      Regarding the methodological concerns, to address them we have provided additional analyses to account for different clock models and calibration points.

      Basically, what the molecular clock does is to propagate the temporal information of the nodes with time calibrations to the remaining nodes of the phylogenetic tree. So, the first and the most important step is to set the time constraints appropriately. But four of the six calibrations used in this study are debatable and even wrong.

      (1) The record for biogenic methane at 3460 Ma is not reliable. The authors cited Ueno et al. 2006, but that study was based on carbon isotope, which is insufficient to demonstrate biogenicity, as mentioned by Alleon and Summons 2019.

      Thank you for pointing out the limitations of using the geochemical evidence of methane as calibrations. Indeed, several commentaries have suggested that the biotic and abiotic origin of the methane reported by Ueno et al. are equally plausible (Alleon and Summons, 2019; Lollar and McCollom, 2006), however; we used that calibration as a minimum for the presence of life on Earth, not methanogenesis. Despite the controversy regarding the origin of methane, there are other lines of evidence suggesting the presence of life around ~3.4 Ga. For example stromatolites from the Dresser Formation, Pilbara, Western Australia (Djokic et al., 2017; Walter et al., 1980; Buick and Dunlop, 1990), and more recently (Hickman-Lewis et al., 2022). To avoid confusion, we have added a more extended explanation for the use of that calibration and additional evidence of life around that time in Table 1 and lines 100-104.

      (2) Three calibrations at Aerobic Nitrososphaerales, Aerobic Marinimicrobia, and Nitrite oxidizing bacteria have the same problem - they are all assumed to have evolved after the GOE where the Earth started to accumulate oxygen in the atmosphere, so they were all capped at 2320 Ma. This is an important mistake and will significantly affect the age estimates because maximum constraint was used (maximum constraint has a much greater effect on age estimates and minimum constraint), and this was used in three nodes involving both Bacteria and Archaea. The main problem is that the authors ignored the numerous evidence showing that oxygen can be produced far before GOE by degradation of abiotically-produced abundant H2O2 by catalases equipped in many anaerobes, also produced by oxygenic cyanobacteria evolved at least 500 Ma earlier than the onset of GOE (2500 Ma), and even accumulated locally (oxygen oasis). It is well possible that aerobic microbes could have evolved in the Archaean.

      We appreciate the suggestion of assessing the validity of the calibrations used in our analyses. We initially evaluated the informative power of the priors used for the Bayesian molecular dating (Supplemental File 5), and found that the only calibration that lacked enough information for the purposes of our study was Ammonia Oxidizing Archaea (AOA). In contrast to previous evidence (Ren et al., 2019; Yang et al., 2021), we associate this finding to the potential earlier diversification of AOA. Due to the limitations of several of the calibrations used, we performed an additional molecular dating analysis on 1000 replicate trees using a Penalized Likelihood strategy. This analysis consisted in excluding the calibrations that assumed the presence of oxygen as a maximum constraint. Our analysis shows similar age estimates of the marine microbial clades regardless of the exclusion of these calibrations (Supplemental File 8; TreePL Priors set 2). Our findings thus suggest that the age estimates reported in our study are consistent regardless of whether or not the presence of oxygen is used to calibrate several nodes in the tree. We describe the results of this analysis in lines 490-499 and include estimates in Supplemental File 8. Our results are therefore robust regardless of the use of these somewhat controversial calibrations.

      Once the phylogenetic tree is appropriately calibrated with fossils and other time constraints, the next important step is to test different clock models and other factors that are known to significantly affect the posterior age estimates. For example, different genes vary in evolutionary history and evolutionary rate, which often give very different age estimates. So it is very important to demonstrate that these concerns are taken into account. These are done in many careful molecular dating studies but missing in this study.

      We agree that the selection of marker genes will have a profound impact on the final age estimates. First, it is important to understand that very few genes present in modern Bacteria and Archaea can be traced back to the Last Universal Common Ancestor, so there are very few genes to use for this purpose. Studies that focus on particular groups of Bacteria and Archaea may have larger selections of genes to choose from, but for our purposes there are only about ~40 different genes - mostly encoding for ribosomal proteins, RNA polymerase subunits, and tRNA synthetases - that can be use for this purpose (Creevey et al., 2011; Wu and Scott, 2012). In a previous study we have extensively benchmarked methods for the reconstruction of high-resolution phylogenetic trees of Bacteria and Archaea using these genes (Martinez-Gutierrez and Aylward, 2021). Our analyses demonstrated that some of these genes (mainly tRNA synthetases) have undergone ancient lateral gene transfer events and are not suitable for deep phylogenetics or molecular dating. In this previous study we also evaluated different sets of marker genes to examine which provide the most robust phylogenetic inference. We arrived at a set of ribosomal proteins and RNA polymerase subunits that performs best for phylogenetic reconstruction, and we have used that in the current study.

      Furthermore, we tested the role of molecular dating model selection on the final Bayesian estimates by running four independent chains under the models UGAM and CIR, respectively. Overall, the results did not vary substantially compared with the ages obtained using the log-normal model reported on our manuscript (Supplemental File 8). The additional results are described in lines 478-488 and shown in Supplemental File 8. The clades that showed more variation when using different Bayesian models were SAR86, SAR11, and Crown Cyanobacteria (Supplemental File 8). Despite observing some differences in the age estimates when using different molecular models, the conclusion that the different marine microbial clades presented in our study diversified during distinct periods of Earth’s history remains. Moreover, the main goal of our study is to provide a relative timeline of the diversification of abundant marine microbial clades without focusing on absolute dates.

      Reviewer #2 (Public Review):

      In this paper, Martinez-Gutierrez and colleagues present a dated, multidomain (= Archaea+Bacteria) phylogenetic tree, and use their analyses to directly compare the ages of various marine prokaryotic groups. They also perform ancestral gene content reconstruction using stochastic mapping to determine when particular types of genes evolved in marine groups.

      Overall, there are not very many papers that attempt to infer a dated tree of all prokaryotes, and this is a distinctive and up-to-date new contribution to that oeuvre. There are several particularly novel and interesting aspects - for example, using the GOE as a (soft) maximum age for certain groups of strictly aerobic Bacteria, and using gene content enrichment to try to understand why and how particular marine groups radiated.

      Thank you for your thorough evaluation and comments on our manuscript.

      Comments

      One overall feature of the results is that marine groups tend to be quite young, and there don't seem to be any modern marine groups that were in the ocean prior to the GOE. It might be interesting to study the evolution of the marine phenotype itself over time; presumably some of the earlier branches were marine? What was the criterion for picking out the major groups being discussed in the paper? My (limited) understanding is that the earliest prokaryotes, potentially including LUCA, LBCA and LACA, was likely marine, in the sense that there would not yet have been any land above sea level at such times. This might merit discussion in the paper. Might there have been earlier exclusively marine groups that went extinct at some point?

      Thank you for pointing this out - this is a very interesting idea.<br /> Firstly, the major marine lineages that we study here have largely already been defined in previous studies and are known to account for a large fraction of the total diversity and biomass of prokaryotes in the ocean. For example, Giovannoni and Stingl described most of these groups previously when discussing cosmopolitan and abundant marine lineages (Giovannoni and Stingl, 2005). The main criteria to select the marine clades studied here are 1) these groups have large impacts in the marine biogeochemical cycles and represent a large fraction of the microbial biomass in the open ocean, 2) they have an appropriate representation on genomic databases such that they can be confidently included in a phylogenetic tree, 3) the clades included can be confidently classified as being marine, in the sense that consequently the last common ancestor had a marine origin. This is explained in lines 83-86. We were primarily interested in lineages that encompassed a broad phylogenetic breadth, and we therefore did not include many groups that can be found in the ocean but are also readily isolated from a range of other environments (i.e., Pseudomonas spp., some Actinomycetes, etc.).

      We agree that some of the earlier microbial branches in the Tree of Life were likely marine. The study of the marine origin of LUCA, LBCA, LACA, although interesting, is out of the scope of our study, and our results cannot offer any direct evidence of their habitat. We have therefore sought to focus on the origins of extant marine lineages.

      What do the stochastic mapping analyses indicate about the respective ancestors of Gracilicutes and Terrabacteria? At least in the latter case, the original hypothesis for the group was that they possessed adaptations to life on land - which seems connected/relevant to the idea of radiating into the sea discussed here - so it might be interesting to discuss what your analyses say about that idea.

      Thank you for your recommendation to perform additional analysis regarding the characterization of the ancestor of the superphyla Gracilicutes and Terrabacteria. We agree that this analysis would be very interesting, but we wish to focus the manuscript primarily on the marine clades in question, and other supergroups are listed in Figure 2 mainly for context. However, we did check the results of the stochastic mapping analysis and we now report the list of genes predicted to be gained and lost at the ancestor of the Gracilicutes and Terrabacteria clades, however; it is out of the scope of this study.

      I very much appreciate that finding time calibrations for microbes is challenging, but I nonetheless have a couple of comments or concerns about the calibrations used here:

      The minimum age for LBCA and LACA (Nodes 1 and 2 in Fig. 1) was calibrated with the earliest evidence of biogenic methane ~3.4Ga. In the case of LACA, I suppose this reflects the view that LACA was a methanogen, which is certainly plausible although perhaps not established with certainty. However, I'm less clear about the logic of calibrating the minimum age of Bacteria using this evidence, as I am not aware that there is much evidence that LBCA was a methanogen. Perhaps the line of reasoning here could be stated more explicitly. An alternative, slightly younger minimum age for Bacteria could perhaps be obtained from isotope data ~3.2Ga consistent with Cyanobacteria (e.g., see https://pubmed.ncbi.nlm.nih.gov/30127539/).

      Thank you for pointing this out. We used the presence of methane as a minimum for life on Earth, not as a minimum for methanogenesis. Despite using this calibration as a minimum for the root of Bacteria and not having methanogenic representatives within this domain, there are independent lines of evidence that point to the presence of microbial life around the same time (~3.5 Ga, for example stromatolites from the Dresser Formation, Pilbara, Western Australia (~3.5 Ga) (Djokic et al., 2017; Walter et al., 1980; Buick and Dunlop, 1990), and more recently (Hickman-Lewis et al., 2022). We added a rationale for the use of the evidence of methane as a minimum age for life on Earth to the manuscript (Table 1 and 100104).

      I am also unclear about the rationale for setting the minimum age of the photosynthetic Cyanobacteria crown to the time of the GOE. Presumably, oxygen-generating photosynthesis evolved on the stem of (photosynthetic) Cyanobacteria, and it therefore seems possible that the GOE might have been initiated by these stem Cyanobacteria, with the crown radiating later? My confusion here might be a comprehension error on my part - it is possible that in fact one node "deeper" than the crown was being calibrated here, which was not entirely clear to me from Figure 1. Perhaps mapping the node numbers directly to the node, rather than a connected branch, would help? (I am assuming, based on nodes 1 and 2, that the labels are being placed on the branch directly antecedent to the node of interest)?

      Thank you so much for your suggestion. As pointed out, the calibrations used were applied at the crown node of existing Cyanobacterial clades, not at the stem of photosynthetic Cyanobacteria. We agree that photosynthesis and therefore the production of molecular oxygen may have been present in more ancient Cyanobacterial clades, however; these groups have not been discovered yet or went extinct. We have improved Fig. 1 to avoid confusion and now it is part of the updated version of our manuscript.

      Alleon J, Summons RE. 2019. Organic geochemical approaches to understanding early life. Free Radic Biol Med 140:103–112.

      Buick R, Dunlop JSR. 1990. Evaporitic sediments of Early Archaean age from the Warrawoona Group, North Pole, Western Australia. Sedimentology 37: 247-277.

      Creevey CJ, Doerks T, Fitzpatrick DA, Raes J, Bork P. 2011. Universally distributed single-copy genes indicate a constant rate of horizontal transfer. PLoS One 6:e22099.

      Djokic T, Van Kranendonk MJ, Campbell KA, Walter MR, Ward CR. 2017. Earliest signs of life on land preserved in ca. 3.5 Ga hot spring deposits. Nat Commun 8:15263.

      Giovannoni SJ, Stingl U. 2005. Molecular diversity and ecology of microbial plankton. Nature 437: 343-348. Hickman-Lewis K, Cavalazzi B, Giannoukos K, D'Amico L, Vrbaski S, Saccomano G, et al. 2023. Advanced two-and three-dimensional insights into Earth's oldest stromatolites (ca. 3.5 Ga): Prospects for the search for life on Mars. Geology 51: 33-38.

      Lollar BS, McCollom TM. 2006. Geochemistry: biosignatures and abiotic constraints on early life. Nature. Martinez-Gutierrez CA, Aylward FO. 2021. Phylogenetic Signal, Congruence, and Uncertainty across Bacteria and Archaea. Mol Biol Evol 38:5514–5527.

      Ren M, Feng X, Huang Y, Wang H, Hu Z, Clingenpeel S, Swan BK, Fonseca MM, Posada D, Stepanauskas R, Hollibaugh JT, Foster PG, Woyke T, Luo H. 2019. Phylogenomics suggests oxygen availability as a driving force in Thaumarchaeota evolution. ISME J 13:2150–2161.

      Walter M R, R Buick, JSR Dunlop. 1980. Stromatolites 3,400–3,500 Myr old from the North pole area, Western Australia. Nature 284: 443-445.

      Wu M, Scott AJ. 2012. Phylogenomic analysis of bacterial and archaeal sequences with AMPHORA2. Bioinformatics 28:1033–1034.

      Yang Y, Zhang C, Lenton TM, Yan X, Zhu M, Zhou M, Tao J, Phelps TJ, Cao Z. 2021. The Evolution Pathway of Ammonia-Oxidizing Archaea Shaped by Major Geological Events. Mol Biol Evol 38:3637–3648.

    1. Author Response

      Reviewer #1 (Public Review):

      Summary:

      This work successfully identified and validated TRLs in hepatic metastatic uveal melanoma, providing new horizons for enhanced immunotherapy. Uveal melanoma is a highly metastatic cancer that, unlike cutaneous melanoma, has a limited effect on immune checkpoint responses, and thus there is a lack of formal clinical treatment for metastatic UM. In this manuscript, the authors described the immune microenvironmental profile of hepatic metastatic uveal melanoma by sc-RNAseq, TCR-seq, and PDX models. Firstly, they identified and defined the phenotypes of tumor-reactive T lymphocytes (TRLs). Moreover, they validated the activity of TILs by in vivo PDX modeling as well as in vitro co-culture of 3D tumorsphere cultures and autologous TILs. Additionally, the authors found that TRLs are mainly derived from depleted and late-activated T cells, which recognize melanoma antigens and tumor-specific antigens. Most importantly, they identified TRLs-associated phenotypes, which provide new avenues for targeting expanded T cells to improve cellular and immune checkpoint immunotherapy.

      Strengths:

      Jonas A. Nilsson, et al. has been working on new therapies for melanoma. The team has also previously performed the most comprehensive genome-wide analysis of uveal melanoma available, presenting the latest insights into metastatic disease. In this work, the authors performed paired sc-RNAseq and TCR-seq on 14 patients with metastatic UM, which is the largest single-cell map of metastatic UM available. This provides huge data support for other studies of metastatic UM.

      We thank the reviewer for these kind words about our work.

      Weaknesses:

      Although the paper does have strengths in principle, the weaknesses of the paper are that these strengths are not directly demonstrated. That is, insufficient analyses are performed to fully support the key claims in the manuscript by the data presented. In particular:

      The author's description of the overall results of the article should be logical, not just a description of the observed phenomena. For example, the presentation related to the results of TRLs lacked logic. In addition, the title of the article emphasizes the three subtypes of hepatic metastatic UM TRLs, but these three subtypes are not specifically discussed in the results as well as the discussion section. The title of the article is not a very comprehensive generalization and should be carefully considered by the authors.

      We thank the reviewer for the critical reading of our work. We agree that there is need of more discussion and will do this in a revised version.

      The authors' claim that they are the first to use autologous TILs and sc-RNAseq to study immunotherapy needs to be supported by the corresponding literature to be more convincing. This can help the reader to understand the innovation and importance of the methodology.

      We will go through the manuscript and literature to see where there might be missing references.

      In addition, the authors argue that TILs from metastatic UM can kill tumor cells. This is the key and bridging point to the main conclusion of the article. Therefore, the credibility of this conclusion should be considered. Metastatic UM1 and UM9 remain responsive to autologous tumors under in vitro conditions with their autologous TILs.

      UM1 responds also in vivo in the subcutaneous model in the paper. We have also finished an experiment where we show that this model also responds in a liver metastasis model. These data will be added in next version of the paper.

      In contrast, UM22, also as a metastatic UM, did not respond to TIL treatment. In particular, the presence of MART1-responsive TILs. The reliability of the results obtained by the authors in the model of only one case of UM22 liver metastasis should be considered. The authors should likewise consider whether such a specific cellular taxon might also exist in other patients with metastatic UM, producing an immune response to tumor cells. The results would be more comprehensive if supported by relevant data.

      The reviewer has interpreted the results absolutely right, the allogenic and autologous MART1-specific TILs cells while reactive in vitro against UM22, cannot kill this tumor either in a subcutaneous or liver metastases model. We hypothesize this has to do with an immune exclusion phenotype and show weak immunohistochemistry that suggest this. We hope the addition of more UM1 data can be viewed as supportive of tumor-reactivity also in vivo.

      In addition, the authors in that study used previously frozen biopsy samples for TCR-seq, which may be associated with low-quality sequencing data, high risk of outcome indicators, and unfriendly access to immune cell information. The existence of these problems and the reliability of the results should be considered. If special processing of TCR-seq data from frozen samples was performed, this should also be accounted for.

      We agree with the reviewers and acknowledge we never anticipated the development of single-cell sequencing techniques when we started biobank 2013. We performed dead cell removal before the 10x Genomics experiment. We have also done extensive quality controls and believe that the data from the biopsies should be viewed as a whole and that quantitative intra-patient comparisons cannot be done.

      Reviewer #2 (Public Review):

      Summary:

      The study's goal is to characterize and validate tumor-reactive T cells in liver metastases of uveal melanoma (UM), which could contribute to enhancing immunotherapy for these patients. The authors used single-cell RNA and TCR sequencing to find potential tumor-reactive T cells and then used patient-derived xenograft (PDX) models and tumor sphere cultures for functional analysis. They discovered that tumor-reactive T cells exist in activated/exhausted T cell subsets and in cytotoxic effector cells. Functional experiments with isolated TILs show that they are capable of killing UM cells in vivo and ex vivo.

      Strengths:

      The study highlights the potential of using single-cell sequencing and functional analysis to identify T cells that can be useful for cell therapy and marker selection in UM treatment. This is important and novel as conventional immune checkpoint therapies are not highly effective in treating UM. Additionally, the study's strength lies in its validation of findings through functional assays, which underscores the clinical relevance of the research.

      We thank the reviewer for these kind words about our work.

      Weaknesses:

      The manuscript may pose challenges for individuals with limited knowledge of single-cell analysis and immunology markers, making it less accessible to a broader audience.

      The first draft of the manuscript (excluding methods) was written by a person (J.A.N) who is not a bioinformatician. It has been corrected to include the correct nomenclature where applicable but overall it is written with the aim to be understandable. We will make an additional effort for the next version.

    1. Author Response

      The following is the authors’ response to the previous reviews

      We would like to thank you again for your thorough review of the manuscript. We have taken all comments into account in the revised version of the manuscript. Please find below our detailed responses to your comments.

      Reviewing Editor

      The manuscript has been improved, but there are some remaining issues that need to be addressed, as outlined in the reviewers' comments. In particular, please pay attention to Figures 1A and 2A as they appear to be the same. Moreover, the original gel images for Western blots should be made available given the concerns raised by Reviewer #1.

      Thank you for your recommendations. We have carefully considered all comments and made the requested revisions to improve the manuscript.

      Reviewer #1 (Public Review):

      In this manuscript, the authors aimed to compare, from testis tissues at different ages from mice in vivo and after culture, multiple aspects of Leydig cells. These aspects included mRNA levels, proliferation, apoptosis, steroid levels, protein levels, etc. A lot of work was put into this manuscript in terms of experiments, systems, and approaches. The technical aspects of this work may be of interest to labs working on the specific topics of in vitro spermatogenesis for fertility preservation.

      Second review:

      The authors should be commended for substantial improvement in their manuscript for resubmission.

      Thank you very much for this second review and your help to improve this manuscript.

      Recommendations For The Authors:

      Going forward, the authors would be well-served to put a similar amount of effort on first drafts as well, which would both increase reviewer enthusiasm and reduce reviewer workload to document all the deficiencies! Abstract is much improved, and clearly articulates the point of the study.

      We are very grateful for all your constructive comments, which have greatly contributed to the improvement of our manuscript.

      1) 54 - replace "could be" with was

      “could be” was replaced by “was”

      2) 75 - delete "being"

      “being” was deleted.

      3) 103 - would say "indirectly promotes" since Rhox5 is a transcription factor that presumably activates genes in Sertoli cells whose products then affect neighboring germ cells, either by direct action or by influencing Sertoli cell behavior changes

      “indirectly” was added in the sentence.

      4) 139, 155, elsewhere - haven't seen dpp italicized before, certainly not the norm

      In dpp (days post-partum), “pp” is italicized as it is a Latin word.

      5) 265 - delete "found"

      “found” was deleted.

      6) 263-273 - Is the CYP19 protein referred to encoded by the Cyp19a1 gene (line 263)? Should standardize nomenclature...

      The CYP19 protein (aromatase) is indeed encoded by the Cyp19a1 gene. The nomenclature was standardized: “CYP19” was replaced by “CYP19A1” in the entire manuscript.

      7) 280 - "homolog" doesn't seem like the right word, as it has a very specific meaning with regards to the evolutionary genetic relatedness of genes. Maybe analog?

      “homolog” was replaced by “analog”.

      8) 306 - would reword to something like "proportions of seminiferous tubules containing round and elongating spermatids" - the because the tubules don't reach spermatid stages

      This sentence was reworded as suggested.

      9) 310 - delete "resulted in", unnecessary

      “resulted in” was deleted.

      10) Why are the images shown in Figures 1A and 2A the same? That seems odd - was that intentional? Curious overall why the data is presented in such a way that it's done twice...

      We mistakenly presented immunofluorescence images twice. Duplicate images have been removed. In the modified version of this manuscript, Figure 1A shows 3-HSD immunofluorescence staining in cultures of fresh testicular tissues and in their in vivo counterparts while Figure 1 – figure supplement 1A (not Figure 2A) shows 3-HSD immunofluorescence staining in cultures of frozen/thawed testicular tissues.

      11) In all the western blots, the cropping is done awfully close to the bands - why is this? Can full gels be shown in a Supplement? And especially in the westerns in Fig. 5C, esp for CYP17A1, the cropping is unacceptable. This reviewer is wondering whether this is an oversight, or whether there is another band below that one that is being masked? Again, should show whole blot for transparency and to ensure Rigor and Reproducibility.

      Full gels are shown in the Supplementary File 2. For CYP17A1, we have shown that only one band of the expected molecular weight is obtained with the antibody (Please see photo below). After this verification, the nitrocellulose membranes were cut at the 55 kDa molecular weight band in order to reveal CYP17A1 expression in the upper part of the membranes and the protein used for normalization in the lower part of the membranes.

      Author response image 1.

      12) For all figures, wondering why the font sizes are so disparate? This will need to be addressed before publication so it looks more professional.

      All figures have been reworked as requested.

      Reviewer #3 (Public Review):

      Moutard, Laura, et al. investigated the gene expression and functional aspects of Leydig cells in a cryopreservation/long-term culture system. The authors found that critical genetic markers for Leydig cells were diminished when compared to the in-vivo testis. The testis also showed less androgen production and androgen responsiveness. Although they did not produce normal testosterone concentrations in basal media conditions, the cultured testis still remained highly responsive to gonadotrophin exposure, exhibiting a large increase in androgen production. Even after the hCG-dependent increase in testosterone, genetic markers of Leydig cells remained low, which means there is still a missing factor in the culture media that facilitates proper Leydig cell differentiation. Optimizing this testis culture protocol to help maintain proper Leydig cell differentiation could be useful for future human testis biopsy cultures, which will help preserve fertility and child cancer patients.

      Overall, the authors addressed most comments and questions from the previous review. The additional data regarding the necrotic area is helpful for interpreting the quality of the cultures. The authors did not conduct a multiple comparison tests although there are multiple comparisons conducted on for a single dependent variable (Fig 2J, Fig 3F, among many others), however, the addition of this multiple comparison is unlikely to change the conclusions of the paper or the figure and, thus is a minor technical detail in this case.

      Thank you very much for this second review and your help to improve this manuscript.

    1. Author Response

      eLife assessment

      This work describes new validated conditional double KO (cDKO) mice for LRRK1 and LRRK2 that will be useful for the field, given that LRRK2 is widely expressed in the brain and periphery, and many divergent phenotypes have been attributed previously to LRRK2 expression. The manuscript presents solid data demonstrating that it is the loss of LRRK1 and LRRK2 expression within the SNpc DA cells that is not well tolerated, as it was previously unclear from past work whether neurodegeneration in the LRRK double Knock Out (DKO) was cell autonomous or the result of loss of LRRK1/LRRK2 expression in other types of cells. Future studies may pursue the biochemical mechanisms underlying the reason for the apoptotic cells noted in this study, as here, the LRRK1/LRRK2 KO mice did not replicate the dramatic increase in the number of autophagic vacuoles previously noted in germline global LRRK1/LRRK2 KO mice.

      We thank the editors for handling our manuscript and for the succinct summary that recognizes the significance of our findings and points out interesting directions for future studies. We also thank the reviewers for their helpful comments and positive evaluation of our work. Below, we have provided point-by-point responses to the reviewers’ comments.

      Reviewer #1 (Public Review):

      Summary:

      This is an important work showing that loss of LRRK function causes late-onset dopaminergic neurodegeneration in a cell-autonomous manner. One of the LRRK members, LRRK2, is of significant translational importance as mutations in LRRK2 cause late-onset autosomal dominant Parkinson's disease (PD). While many in the field assume that LRRK2 mutant causes PD via increased LRRK2 activity (i.e., kinase activity), it is not a settled issue as not all disease-causing mutant LRRK2 exhibit increased activity. Further, while LRRK2 inhibitors are under clinical trials for PD, the consequence of chronic, long-term LRRK2 inhibition is unknown. Thus, studies evaluating the long-term impact of LRRK deficit have important translational implications. Moreover, because LRRK proteins, particularly LRRK2, are known to modulate immune response and intracellular membrane trafficking, the study's results and the reagents will be valuable for others interested in LRRK function.

      Strengths:

      This report describes a mouse model where the LRRK1 and LRRK2 gene is conditionally deleted in dopaminergic neurons. Previously, this group showed that while loss of LRRK2 expression does not cause brain phenotype, loss of both LRRK1 and LRRK2 causes a later onset, progressive degeneration of catecholaminergic neurons and dopaminergic (DAergic) neurons in the substantia nigra (SN), and noradrenergic neurons in the locus coeruleus (LC). However, because LRRK genes are widely expressed with some peripheral phenotypes, it was unknown if the neurodegeneration in the LRRK double knockout (DKO) was cell autonomous. To rigorously test this question, the authors have generated a double conditional (cDKO) allele where both LRRK1 and LRRK2 genes were targeted to contain loxP sites. In my view, this was beyond what is usually required, as most investigators might might combine one KO allele with another floxed allele. The authors provide a rigorous validation showing that the Driver (DAT-Cre) is expressed in most DAergic neurons in the SN and that LRRK levers are decreased selectively in the ventral midbrain. Using these mice, the authors show that the number of DAergic neurons is normal at 15 but significantly decreased at 20 months of age. Moreover, the authors show that the number of apoptotic neurons is increased by ~2X in aged SN, demonstrating increased ongoing cell death, as well as an increase in activated microglia. The degeneration is limited to DAergic neurons as LC neurons are not lost as this population does not express DAT. Overall, the mouse genetics and experimental analysis were performed rigorously, and the results were statistically sound and compelling.

      Weaknesses:

      I only have a few minor comments. First is that in PD and other degenerative conditions, loss of axons and terminals occurs prior to cell bodies. It might be beneficial to show the status of DAergic markers in the striatum. Second, previous studies indicate that very little, if any, LRRK1 is expressed in SN DAergic neurons. This also the case with the Allen Brain Atlas profile. Thus, authors should discuss the discrepancy as authors seem to imply significant LRRK1 expression in DA neurons.

      We appreciate the reviewer’s recognition of the importance of the study as well as our rigorous experimental approaches and compelling results. Our responses to the reviewer's two minor comments are below.

      1) DAergic markers in the striatum:

      We performed TH immunostaining in the striatum and quantified TH+ DA terminals in the striatum of DA neuron-specific LRRK cDKO and littermate control mice at the ages of 15 and 24 months. We found similar levels of TH immunoreactivity in the striatum of LRRK cDKO and littermate control mice at the age of 15 months (p = 0.6565, unpaired Student’s t-test) and significantly reduced levels of TH immunoreactivity in the striatum of LRRK cDKO, compared to control mice at the age of 24 months (~19%, p = 0.0215), suggesting an age-dependent loss of dopaminergic terminals in the striatum of DA neuron-specific LRRK cDKO mice. These results are now included as Figure 5 of the revised manuscript.

      2) LRRK1 expression in the SNpc:

      It is shown in the Mouse brain RNA-seq dataset and the Allen Mouse brain ISH dataset (https://www.proteinatlas.org/ENSG00000154237-LRRK1/brain) that LRRK1 is broadly expressed in the mouse brain and is expressed at modest levels in the midbrain, comparable to the cerebral cortex. Indeed, our Western analysis also showed that levels of LRRK1 detected in the dissected ventral midbrain and the cerebral cortex of control mice are similar (40µg total protein loaded per lane; Figure 2E). Furthermore, we previously demonstrated that deletion of LRRK2 (or LRRK1) alone does not cause age-dependent loss of DA neurons in the SNpc, but deletions of both LRRK1 and LRRK2 result in age-dependent loss of DA neurons in LRRK DKO mice, indicating the functional importance of LRRK1 in the protection of DA neuron survival in the aging mouse brain (Tong et al., PNAS 2010, 107: 9879-9884, Giaime et al., Neuron 2017, 96: 796-807).

      Reviewer #2 (Public Review):

      Summary:

      In this manuscript, Shen and collaborators described the generation of cDKO mice lacking LRRK1 and LRRK2 selectively in DAT-positive DAergic neurons. The Authors asked whether selective deletion of both LRRK isoforms could lead to a Parkinsonian phenotype, as previously reported by the same group in germline double LRRK1 and LRRK2 knockout mice (PMID: 29056298). Indeed, cDKO mice developed a late reduction of TH+ neurons in SNpc that partially correlated with the reduction of NeuN+ cells. This was associated with increased apoptotic cell and microglial cell numbers in SNpc.

      Unlike the constitutive DKO mice described earlier, however, cDKO mice did not replicate the dramatic increase in the number of autophagic vacuoles. The study supports the authors' hypothesis that loss of function rather than gain of function of LRRK2 leads to PD.

      Strengths:

      The study described for the first time a model where both the PD-associated gene LRRK2 and its homolog LRRK1 are deleted selectively in DAergic neurons, offering a new tool to understand the physiopathological role of LRRK2 and the compensating role of LRRK1 in modulating DAergic cell function.

      Weaknesses:

      The model has no construct validity since loss of function mutations of LRRK2 are well-tolerated in humans and do not lead to PD. The evidence of a Parkinsonian phenotype in these cDKO mice is limited and should be considered preliminary.

      We thank the reviewer for commenting on the usefulness of this new PD mouse model.

      The reviewer did not include a reference citation for the statement "loss of function mutations of LRRK2 are well-tolerated in humans and do not lead to PD." It is possible that the reviewer was referring to a human population study (Whiffin et al., Nat Med 2020, 26: 869-877), entitled "The effect of LRRK2 lossof-function variants in humans." In this study, the authors analyzed 141,456 individuals sequenced in the Genome Aggregation Database, 49,960 exome-sequenced individuals from the UK Biobank, and more than 4 million participants in the 23andMe genotyped dataset, and they looked for human genetic variants predicted to cause loss-of-function of protein-coding genes (pLoF variants). The reported findings were interesting, and the authors were careful in stating their conclusions. However, this is not a linkage study of large pedigrees carrying a single, clear-cut loss-of-function mutation (e.g. large deletions of most exons and coding sequences). Therefore, the experimental evidence is not compelling enough to conclude whether loss-of-function mutations in LRRK2 cause PD or do not cause PD.

      The current report is an unbiased genetic study in an effort to reveal the normal physiological role of LRRK in dopaminergic neurons. It was not intended to produce Parkinsonian phenotypes in LRRK cDKO mice, which would be a biased effort. However, the unequivocal discovery of the cell intrinsic role of LRRK in the protection of DA neurons from age-dependent degeneration and apoptotic cell death should be considered seriously, while we contemplate the disease mechanism and how LRRK2 mutations may cause DA neuron loss and PD.

      Reviewer #3 (Public Review):

      Kang, Huang, and colleagues investigated the impact of LRRK1 and LRRK2 deletion, specifically in dopaminergic neurons, using a novel cDKO mouse model. They observed a significant reduction in DAergic neurons in the substantia nigra in their conditional LRRK1 and LRRK2 KO mice and a corresponding increase in markers of apoptosis and gliosis. This work set out to address a longstanding question within the field around the role and importance of LRRK1 and LRRK2 in DAergic neurons and suggests that the loss of both proteins triggers some neurodegeneration and glial activation.

      The studies included in this work are carefully performed and clearly communicated, but additional studies are needed to strengthen further the authors' claims around the consequences of LRRK2 deletion in DAergic neurons.

      1. In Figures 2E and F, the authors assess the protein levels of LRRK1 and LRRK2 in their cDKO mouse model to confirm the deletion of both proteins. They observe a mild loss of LRRK1 and LRRK2 signals in the ventral midbrain compared to wild-type animals. While this is not surprising given other cell types that still express LRRK1 and LRRK2 would be present in their dissected ventral midbrain samples, it does not sufficiently confirm that LRRK1 and LRRK2 are not expressed in DAergic neurons. Additional data is needed to more directly demonstrate that LRRK1 and LRRK2 protein levels are reduced in DAergic neurons, including analysis of LRRK1 and LRRK2 protein levels via immunohistochemistry or FACS-based analysis of TH+ neurons.

      We thank the reviewer for highlighting this incredibly important but often overlooked issue. We agree that the data in Figure 2E, F alone would be inadequate to validate DA neuron-specific LRRK cDKO mice.

      Cell type-specific conditional knockouts are a mosaic with KO cells mixed with other cell types expressing the gene normally. DA neuron-specific cDKO is particularly challenging, as DA neurons are a subset of cells embedded in the ventral midbrain. Rather than using immunostaining, which relies upon specific, good LRRK1 and LRRK2 antibodies for IHC, or FACS sorting of TH+ neurons followed by Western blotting (few cells, mixed cell populations, etc.), we chose a clean genetic approach by generating germline mutant mice carrying the deleted LRRK1 and LRRK2 alleles in all cells from the floxed LRRK1 and LRRK2 alleles. This approach permits characterization of these deletion mutations in germline mutant mice using molecular approaches that yield unambiguous results.

      We crossed CMV-Cre deleter mice with floxed LRRK1 and LRRK2 mice to generate respective germline LRRK1 KO and LRRK2 KO mice, in which all cells carry the LRRK1 or LRRK2 deleted alleles that are identical to those in DA neurons of cDKO mice. We then performed Northern, extensive RTPCR followed by sequencing, and Western analyses to show the absence of the full length LRRK1 and LRRK2 mRNA (Figure 1G, H, Figure 1-figure supplement 8 and 10), and the expected truncation of LRRK1 and LRRK2 mRNA (Figure 1-figure supplement 9 and 11), and the absence of LRRK1 and LRRK2 proteins (Figure 1I). These analyses together demonstrate that in the presence of Cre, either CMV-Cre expressed in all cells or DAT-Cre expressed selectively in DA neurons, the floxed LRRK1 and LRRK2 exons are deleted, resulting in null alleles. We further demonstrated the specificity of DAT-Cremediated recombination (deletion) by crossing DAT-Cre mice with a GFP reporter, showing that 99% TH+ DA neurons in the SNpc are also GFP+ (Figure 2A, B), indicating that DAT-Cre-mediated recombination of the floxed alleles occurs in essentially all TH+ DA neurons in the SNpc.

      1. The authors observed a significant but modest effect of LRRK1 and LRRK2 deletion on the number of TH+ neurons in the substantia nigra (12-15% loss at 20-24 months of age). It is unclear whether this extent of neuron loss is functionally relevant. To strengthen the impact of these data, additional studies are warranted to determine whether this translates into any PD-relevant deficits in the mice, including motor deficits or alterations in alpha-synuclein accumulation/aggregation.

      Yes, the reduction of DA neurons in the SNpc of cDKO mice at the age of 20-24 months is modest. At 15 months of age, the number of TH+ DA neurons in the SNpc is similar between LRRK cDKO mice (10,000 ± 141) and littermate controls (10,077 ± 310, p > 0.9999). At 20 months of age, the number of DA neurons in the SNpc of LRRK cDKO mice (8,948 ± 273) is significantly reduced (-12.7%), compared to control mice (10,244 ± 220, F1,46 = 16.59, p = 0.0002, two-way ANOVA with Bonferroni’s post hoc multiple comparisons, p = 0.0041). By 24 months of age, the number of DA neurons in the SNpc of LRRK cDKO mice (8,188 ± 452) relative to controls (9,675 ± 232, p = 0.0010) is further reduced (15.4%).

      Similar results were obtained by an independent quantification by another investigator, also conducted in a genotype blind manner, using the fractionator and optical dissector method, by which TH+ cells were quantified in 25% areas. These results are included as Figure 3-figure supplement 1 in the revised manuscript. Because of the more limited sampling, the quantification data are more variable, compared to quantification of TH+ cells in all areas of the SNpc, shown in Figure 3. With both methods, we quantified TH+ cells in every 10th sections encompassing the entire SNpc (3D structure), as sampling using every 5th or every 10th sections yielded similar results.

      We also performed behavioral analysis of LRRK cDKO mice and littermate controls at the ages of 10 and 25 months using the beam walk test (10 mm and 20 mm beam) and the pole test, which are sensitive to impairment of motor coordination. We found that LRRK cDKO mice at 10 months of age showed significantly more hindlimb errors (p = 0.0005, unpaired two-tailed Student’s t-test) and longer traversal time (p = 0.0075) in the 10mm beam walk test, compared to control mice, though their performance is similar in the 20 mm beam walk (hindlimb slips: p = 0.0733, traversal time: p = 0.9796) and in the pole test. At 22 months of age, the performance of LRRK cDKO mice and littermate controls is more variable and worse, compared to the younger mice, and is not significantly different between the genotypic groups. These results are now included as Figure 9 of the revised manuscript.

      1. The authors demonstrate that, unlike in the germline LRRK DKO mice, they do not observe any alterations in electron-dense vacuoles via EM. Given their data showing increased apoptosis and gliosis, it remains unclear how the loss of LRRK proteins leads to DAergic neuronal cell loss. Mechanistic studies would be insightful to understand better potential explanations for how the loss of LRRK1 and LRRK2 may impair cellular survival, and additional text should be added to the discussion to discuss potential hypotheses for how this might occur.

      We agree that this phenotypic difference between germline DKO and DA neuron-specific cDKO mice is intriguing, suggesting a non-cell autonomous contribution of LRRK in age-dependent accumulation of autophagic and lysosomal vacuoles in SNpc neurons of germline LRRK DKO mice. We will discuss the phenotypic difference further in the revised manuscript. We are generating microglial specific LRRK cDKO mice to investigate the role of LRRK in microglia and whether microglia contribute in a cell extrinsic manner to the regulation of the autophagy-lysosomal pathway in DA neurons.

      1. The authors discuss the potential implications of the neuronal cell loss observed in cDKO mice for LRRK1 and LRRK2 for therapeutic approaches targeting LRRK2 and suggest this argues that LRRK2 variants may exert their effects through a loss-of-protein function. However, all of the data generated in this work focus on a mouse in which both LRRK1 and LRRK2 have been deleted, and it is therefore difficult to make any definitive conclusions about the consequences of specifically targeting LRRK2. The authors note potential redundancy between the two LRRK proteins, and they should soften some of their conclusions in the discussion section around implications for the effects of LRRK2 variants. Human subjects that carry LRRK2 loss-of-function alleles do not have an increased risk for developing PD, which argues against the author's conclusions that LRRK2 variants associated with PD are loss-offunction. Additional text should be included in their discussion to better address these nuances and caution should be used in terms of extrapolating their data to effects observed with PD-linked variants in LRRK2.

      We will modify the discussion accordingly in the revised manuscript.

    1. Author Response

      Reviewer #1 (Public Review):

      Weaknesses: There appears to be a lack of basic knowledge of the process of spermatogenesis. For instance, the statement that "During the first week of postnatal life, a population of SCs continues to proliferate to give rise to undifferentiated Asingle (As), Apaired (Apr) and Aaligned (Aal) cells. The remaining SCs differentiate to form chains of daughter cells that become primary and secondary permatocytes around postnatal day (PND) 10 to 12." is inaccurate. The Aal cells are the spermatogonial chains, the two are not distinct from one another. In addition, the authors fail to mention spermatogonial stem cells which form the basis for steady-state spermatogenesis. The authors also do not acknowledge the well-known fact that, in the mouse, the first wave of spermatogenesis is distinct from subsequent waves. Finally, the authors do not mention the presence of both undifferentiated spermatogonia (aka - type A) and differentiating spermatogonia (aka - type B). The premise for the study they present appears to be the implication that little is known about the dynamics of chromatin during the development of spermatogonia. However, there are published studies on this topic that have already provided much of the information that is presented in the current manuscript.

      We acknowledge the reviewer’s criticism about the inaccuracy and incompleteness of some of the statements about spermatogonial cells and spermatogenesis. We will be improve the text accordingly in the reviewed manuscript. We will also clarify the premise of the study which was to complement existing datasets on spermatogonial cells by providing parallel transcriptomic and chromatin accessibility maps of high resolution from the same cell populations at early postnatal, late postnatal and adult stages collected from single individuals (for adults). These features make our datasets comprehensive and an important additional resource for people in the community. We will also revise the description of published studies to be more inclusive.

      It is not clear which spermatogonial subtype the authors intended to profile with their analyses. On the one hand, they used PLZF to FACS sort cells. This typically enriches for undifferentiated spermatogonia. On the other hand, they report detection in the sorted population of markers such as c-KIT which is a well-known marker of differentiating spermatogonia, and that is in the same population in which ID4, a well-known marker of spermatogonial stem cells, was detected. The authors cite multiple previously published studies of gene expression during spermatogenesis, including studies of gene expression in spermatogonia. It is not at all clear what the authors' data adds to the previously available data on this subject.

      The authors analyzed cells recovered at PND 8 and 15 and compared those to cells recovered from the adult testis. The PND 8 and 15 cells would be from the initial wave of spermatogenesis whereas those from the adult testis would represent steady-state spermatogenesis. However, as noted above, there appears to be a lack of awareness of the well-established differences between spermatogenesis occurring at each of these stages.

      The reviewer correctly points that our samples contain both undifferentiated spermatogonial stem cells and differentiated spermatogonia, which is expected from the chosen FACS strategy. We clearly mention the fact that our populations are mixed and that our samples are 85-95% PLZF+ enriched. We also acknowledge the possible presence of contaminating cells that may influence the results and data interpretation in the section “Limitations”. We believe that this does not diminish the value of the datasets. But to further increase their usefulness and improve their interpretation, we will conduct new analyses and apply computational methods to deconvolute our bulk RNA-seq datasets in silico (PMID: 37528411) using publicly available single-cell RNA-seq datasets. Such analyses shall correct for cell-type heterogeneity and provide information about the cellular composition of our cell preparations clarifying the representation of undifferentiated and differentiated spermatogonial cells and the possible presence of somatic cells.

      In general, the authors present observational data of the sort that is generated by RNA-seq and ATAC-seq analyses, and they speculate on the potential significance of several of these observations. However, they provide no definitive data to support any of their speculations. This further illustrates the fact that this study contributes little if any new information beyond that already available from the numerous previously published RNA-seq and ATAC-seq studies of spermatogenesis. In short, the study described in this manuscript does not advance the field.

      We acknowledge that RNA-seq and ATAC-seq datasets like ours are observational and that their interpretation can be speculative. Nevertheless, our datasets represent an additional useful resource for the community because they are comprehensive and high resolution, and can be exploited for instance, for studies in environmental epigenetics and epigenetic inheritance examining the immediate and long-term effects of postnatal exposure and their dynamics. The depth of our RNA sequencing allowed detect transcripts with a high dynamic range, which has been limited with classical RNA sequencing analyses of spermatogonial cells and with single-cell analyses (which have comparatively low coverage). Further, our experimental pipeline is affordable (more than single cell sequencing approaches) and in the case of adults, provides data per animal informing on the intrinsic variability in transcriptional and chromatin regulation across males. These points will be discussed in the revised manuscript.

      The phenomenon of epigenetic priming is discussed, but then it seems that there is some expression of surprise that the data demonstrate what this reviewer would argue are examples of that phenomenon. The authors discuss the "modest correspondence between transcription and chromatin accessibility in SCs." Chromatin accessibility is an example of an epigenetic parameter associated with the primed state. The primed state is not fully equivalent to the actively expressing state. It appears that certain histone modifications along with transcription factors are critical to the transition between the primed and actively expressing states (in either direction). The cell types that were investigated in this study are closely related spermatogenic, and predominantly spermatogonial cell types. It is very likely that the differentially expressed loci will be primed in both the early (PND 8 or 15) and adult stages, even though those genes are differentially expressed at those stages. Thus, it is not surprising that there is not a strict concordance between +/- chromatin accessibility and +/- active or elevated expression.

      The reviewer is right that a strict concordance between chromatin accessibility and transcription is not necessarily expected. The text of the revised manuscript will be modified accordingly. However, we would like to note that our data strengthen the observations made by others that in cells from the same lineage, the global landscape of chromatin accessibility is more stable than their transcriptional programs over developmental time.

      Reviewer #2 (Public Review):

      The objective of this study from Lazar-Contes et al. is to examine chromatin accessibility changes in "spermatogonial cells" (SCs) across testis development. Exactly what SCs are, however, remains a mystery. The authors mention in the abstract that SCs are undifferentiated male germ cells and have self-renewal and differentiation activity, which would be true for Spermatogonial STEM Cells (SSCs), a very small subset of total spermatogonia, but then the methods they use to retrieve such cells using antibodies that enrich for undifferentiated spermatogonia encompass both undifferentiated and differentiating spermatogonia. Data in Fig. 1B prove that most (85-95%) are PLZF+, but PLZF is known to be expressed both by undifferentiated and differentiating (KIT+) spermatogonia (Niedenberger et al., 2015; PMID: 25737569). Thus, the bulk RNA-seq and ATAC-seq data arising from these cells constitute the aggregate results comprising the phenotype of a highly heterogeneous mixture of spermatogonia (plus contaminating somatic cells), NOT SSCs. Indeed, Fig. 1C demonstrates this by showing the detection of Kit mRNA (a well-known marker of differentiating spermatogonia - which the authors claim on line 89 is a marker of SCs!), along with the detection of markers of various somatic cell populations (albeit at lower levels).

      The reviewer is correct that our spermatogonial cell populations are mixed and include undifferentiated and differentiated cells, hence the name of spermatogonia (SCs), and probably also contain some somatic cells. We acknowledge that this is a limitation of our isolation approach. To circumvent this limitation, we will conduct in silico deconvolution analysis using publicly available single cell RNA sequencing datasets to obtain information about markers corresponding to undifferentiated and differentiated spermatogonia cells, and somatic cells. These additional analyses will provide information about the cellular composition of the samples and clarify the representation of undifferentiated and differentiated spermatogonial cells and other cells.

      This admixture problem influences the results - the authors show ATAC-seq accessibility traces for several genes in Fig. 2E (exhibiting differences between P15 and Adult), including Ihh, which is not expressed by spermatogenic cells, and Col6a1, which is expressed by peritubular myoid cells. Thus, the methods in this paper are fundamentally flawed, which precludes drawing any firm conclusions from the data about changes in chromatin accessibility among spermatogonia (SCs?) across postnatal testis development.

      The reviewer raises concern about the lack of correspondence between chromatin accessibility and expression observed for some genes, arguing that this precludes drawing firm conclusions. However, a dissociation between chromatin accessibility and gene expression is normal and expected since chromatin accessibility is only a readout of protein deposition and occupancy e.g. by transcription factors, chromatin regulators, nucleosomes, at specific genomic loci that does not give functional information of whether there is ongoing transcriptional activity or not. A gene that is repressed or poised for expression can still show clear signal of chromatin accessibility at regulatory elements. The dissociation between chromatin accessibility and transcription has been reported in many different cells and conditions (PMID: 36069349, PMID: 33098772) including in spermatogonial cells (PMID: 28985528) and in gonads in different species (PMID: 36323261). Therefore, the dissociation between accessibility and transcription is not a reason to conclude that our data are flawed.

      In addition, there already are numerous scRNA-seq datasets from mouse spermatogenic cells at the same developmental stages in question.

      This is true but full transcriptomic profiling like ours on cell populations provides different transcriptional information that is deeper and more comprehensive. Our datasets identified >17,000 genes while scRNA-seq typically identifies a few thousands of genes. Our analyses also identified full length transcripts, variants, isoforms and low abundance transcripts. These datasets are therefore a valuable addition to existing scRNA-seq.

      Moreover, several groups have used bulk ATAC-seq to profile enriched populations of spermatogonia, including from synchronized spermatogenesis which reflects a high degree of purity (see Maezawa et al., 2018 PMID: 29126117 and Schlief et al., 2023 PMID: 36983846 and in cultured spermatogonia - Suen et al., 2022 PMID: 36509798) - so this topic has already begun to be examined. None of these papers was cited, so it appears the authors were unaware of this work.

      We apologize for not mentioning these studies in our manuscript, we will do so in the revised version.

      The authors' methodological choice is even more surprising given the wealth of single-cell evidence in the literature since 2018 demonstrating the exceptional heterogeneity among spermatogonia at these developmental stages (the authors DID cite some of these papers, so they are aware). Indeed, it is currently possible to perform concurrent scATAC-seq and scRNA-seq (10x Genomics Multiome), which would have made these data quite useful and robust. As it stands, given the lack of novelty and critical methodological flaws, readers should be cautioned that there is little new information to be learned about spermatogenesis from this study, and in fact, the data in Figures 2-5 may lead readers astray because they do not reflect the biology of any one type of male germ cell. Indeed, not only do these data not add to our understanding of spermatogonial development, but they are damaging to the field if their source and identity are properly understood. Here are some specific examples of the problems with these data:

      1. Fig. 2D - Gata4 and Lhcgr are not expressed by germ cells in the testis.

      2. Fig. 3A - WT1 is expressed by Sertoli cells, so the change in accessibility of regions containing a WT1 motif suggests differential contamination with Sertoli cells. Since Wt1 mRNA was differentially high in P15 (Fig. 3B) - this seems to be the most likely explanation for the results. How was this excluded?

      3. Fig. 3D - Since Dmrt1 is expressed by Sertoli cells, the "downregulation" likely represents a reduction in Sertoli cell contamination in the adult, like the point above. Did the authors consider this?

      We acknowledge that concurrent scATAC-seq and scRNA-seq analyses have been done by others but our datasets add to these analyses by providing concurrent chromatin and expression analyses at high resolution in spermatogonial populations at 2 postnatal stages and in adulthood and from individual males (for adult cells). This provides a set of information that adds to the current literature. Doing such analyses in single cells is not tractable financially so we offer an economical alternative that delivers high resolution datasets for these different time points. Our analyses were not meant to study spermatogenesis but to provide a thorough and comprehensive profiling of chromatin accessibility and transcription in postnatal and adult spermatogonial cells.

      Our data need careful interpretation to avoid any misleading conclusions. Fig. 2D does not show expression but accessibility which does not tell if a particular locus or gene is expressed or not. Thus, candidates like Gata4 and Lhcgr shown in Fig. 2D are simply associated with DARs but this does not mean that they are expressed. Likewise in Fig. 3A, motifs refer to decreased accessibility and not to expression. Fig. 1C indicates that PND15 cells have low to no expression of 3 Sertoli cells markers (Vim, Tspan17 and Rhox), suggesting little contamination by Sertoli cells. The presence of WT1 in PND15 cells will however be examined more carefully and re-analysed by in silico deconvolution methods using single cell datasets for the revised manuscript. In Fig. 3D, differential contamination by Sertoli cells is possible, this will also be examined by deconvolution methods.

      Reviewer #3 (Public Review):

      In this study, Lazar-Contes and colleagues aimed to determine whether chromatin accessibility changes in the spermatogonial population during different phases of postnatal mammalian testis development. Because actions of the spermatogonial population set the foundation for continual and robust spermatogenesis and the gene networks regulating their biology are undefined, the goal of the study has merit. To advance knowledge, the authors used mice as a model and isolated spermatogonia from three different postnatal developmental age points using a cell sorting methodology that was based on cell surface markers reported in previous studies and then performed bulk RNA-sequencing and ATAC-sequencing. Overall, the technical aspects of the sequencing analyses and computational/bioinformatics seem sound but there are several concerns with the cell population isolated from testes and lack of acknowledgment for previous studies that have also performed ATAC-sequencing on spermatogonia of mouse and human testes. The limitations, described below, call into question the validity of the interpretations and reduce the potential merit of the findings.

      I suggest changing the acronym for spermatogonial cells from SC to SPG for two reasons. First, SPG is the commonly used acronym in the field of mammalian spermatogenesis. Second, SC is commonly used for Sertoli Cells.

      We thank the reviewer for the suggestion and will rename SCs into SPGs in the revised manuscript.

      The authors should provide a rationale for why they used postnatal day 8 and 15 mice.

      We will provide a rationale for the use of postnatal 8 and 15 stages in the revised manuscript. Briefly, these stages are interesting to study because early to mid postnatal life is a critical window of development for germ cells during which environmental exposure can have strong and persistent effects. The possibility that changes in germ cells can happen during this period and persist until adulthood is an important area of research linked to disciplines like epigenetic toxicology and epigenetic inheritance.

      The FACS sorting approach used was based on cell surface proteins that are not germline-specific so there were undoubtedly somatic cells in the samples used for both RNA and ATAC sequencing. Thus, it is essential to demonstrate the level of both germ cell and undifferentiated spermatogonial enrichment in the isolated and profiled cell populations. To achieve this, the authors used PLZF as a biomarker of undifferentiated spermatogonia. Although PLZF is indeed expressed by undifferentiated spermatogonia, there have been several studies demonstrating that expression extends into differentiating spermatogonia. In addition, PLZF is not germ-cell specific and single-cell RNA-seq analyses of testicular tissue have revealed that there are somatic cell populations that express Plzf, at least at the mRNA level. For these reasons, I suggest that the authors assess the isolated cell populations using a germ-cell specific biomarker such as DDX4 in combination with PLZF to get a more accurate assessment of the undifferentiated spermatogonial composition. This assessment is essential for the interpretation of the RNA-seq and ATAC-seq data that was generated.

      The reviewer is right that our cell populations likely contain undifferentiated and differentiated spermatogonial cells and a small percentage of somatic cells including Sertoli cells. As suggested, we examined the expression of the germ-cell marker Ddx4 in our datasets and observed that Ddx4 is highly expressed. It is indeed more highly expressed than the SSC marker Id4 (average log2CPM of 5 vs 8, respectively). We will include this information in the revised manuscript. Further, the deconvolution analyses that will be conducted are expected to clarify the cellular composition of our cell populations.

      A previous study by the Namekawa lab (PMID: 29126117) performed ATAC-seq on a similar cell population (THY1+ FACS sorted) that was isolated from pre-pubertal mouse testes. It was surprising to not see this study referenced in the current manuscript. In addition, it seems prudent to cross-reference the two ATAC-seq datasets for commonalities and differences. In addition, there are several published studies on scATAC-seq of human spermatogonia that might be of interest to cross-reference with the ATAC-seq data presented in the current study to provide an understanding of translational merit for the findings.

      We thank the reviewer for pointing out this study as well as other studies in human spermatogonia. We will cross-reference all of them in the revised manuscript.

    1. Author Response

      The following is the authors’ response to the original reviews.

      Reviewer 1

      We thank the reviewer for their thoughtful comments. We have addressed them below, and we believe that have significantly strengthened the clarity of the manuscript.

      Main Comments:

      In Fig. 2C-D, I am not sure I understand why ≈ 100 mutations fix with β = 0. In the absence of epistasis, and since the coefficients hi are sampled from a symmetric distribution centered at zero, it is to be expected that roughly half of the mutations will have positive fitness effects and thus will eventually fix in the population. With L = 250, I would have expected to see the number of fixed mutations approach ≈ 125 for β = 0. Perhaps I am missing something?

      • In our simulations, we initialize all populations from a state where there are only 100 available beneficial mutations (i.e., the initial rank is always 100). Without epistasis, these initial beneficial mutations are the only beneficial mutations that will be present throughout the entire trajectory. Hence, for β = 0, only 100 beneficial mutations can fix. Previously, this information could be found in the “Materials and methods” section of the SI. To make this aspect of our simulation more clear in the revision, we have added a discussion of the initial rank to the “Landscape structure” subsection of the model definition section. In addition, we have merged “Materials and methods” with “Further simulation details” in the SI into one section, and have listed the values for the simulation parameters in the model definition section.

      Along these lines, the authors show that increasing β leads to a higher number of fixed mutations. I am not sure I understand their explanation for this. In line 209 they write that as β increases, “mutations are needed to cease adaptation”. The way I see it, in the absence of epistasis the fitness peak should correspond to a genotype with ≈ L/2 mutations (the genotype carrying all mutations with hi > 0). Increasing the magnitude of microscopic epistasis (i.e., increasing β ), and assuming that there is no bias towards positive epistasis (which there shouldn’t be based on the model formulation, i.e., section "Disorder statistics" on page 4), can change the “location” of the fitness peak, such that it now corresponds to a different genotype. Statistically speaking, however, there are more genotypes with L/2 mutations than with any other number of mutations, so I would have expected that, on average, the number of mutations fixed in the population would still have been ≈ L/2 (naturally with somewhat large variation across replicates, as seems to be the case).

      • With epistasis, the situation becomes more complex. The structure of our model imposes significant sign epistasis in general (i.e. mutations can be beneficial on one background genotype and deleterious on another). This means that in the presence of epistasis, more than 100 mutations can be required to reach a local optimum even when the initial rank was 100. Intuitively, this occurs because mutations that were deleterious on the ancestral background genotype can become beneficial on future genotypes. We find that this occurs consistently throughout adaptation, leading to the accumulation of more mutations with increasing epistasis.

      • Please note that we use the value L = 1000 in our simulations. We have also made the fact that we use L = 1000 more clear by moving the description of the simulation parameters to the main text.

      I do see how, in the clonal interference regime, there can be multiple genotypes in the population at a given time (each with a different mutational load), thus making the number of fixed mutations larger than L/2 when aggregating over all genotypes in the population. But this observation makes less intuitive sense to me in the SSWM regime. In lines 207-208, the authors state that “as beta increases, a greater number of new available beneficial mutations are generated per each typical fixation event”. While this is true, it is also the case that a greater number of mutations that would have been beneficial in the absence of epistasis are now deleterious due to negative epistasis (if I am understanding what the authors mean correctly).

      • The reviewer is correct to note that in the strong clonal interference regime, there will be more accumulated mutations across the entire population than in any single strain. However, we report the number mutations that have fixed, i.e., become present in the entire population.

      • We find that the typical decrease in rank (per fixation event) of the population decreases with increasing epistasis — i.e., the number of available beneficial mutations that are “consumed” when a mutation fixes is typically lower in systems with stronger epistasis.

      Similarly, I am not sure I understand how one goes from equation (6) to equation (7). In particular, it would seem to me that the term 4αiαj Ji j in equation (6) should be equally likely to be positive or negative (again assuming no bias towards positive Ji j). I thus do not see why ηi j in equation (7) is sampled from a normal distribution with mean µβ instead of just mean zero.

      • The reviewer is correct that, for a uniformly random initial state, αi , αj , and Ji j will be uncorrelated so that the distribution of 4αiαj Ji j can be computed exactly (and has mean zero). However, we initialize from a state with rank 100, so that we need to compute the distribution of the random variable E[αiαj Ji j|αiαj Ji j > 0, R = 100]. This is mathematically very challenging, because there are nontrivial correlations between spins even at initialization. For these reasons, we found the uniformly random approximation insufficient. This is described in the paragraph following Equation (7) in the resubmission.

      Minor Comments:

      The authors use a model including terms up to second-order epistasis. To be clear, I think this choice is entirely justified: as they mention in their manuscript, this structure allows to approximate any fitness model defined on a Boolean hypercube. As I understand it, the reason for not incorporating higher-order terms (as in e.g. Reddy and Desai, eLife 2021) has to do with computational efficiency, i.e., accommodating higher-order terms in equation (10) may lead to a substantial increase in computation time. Is this the case?

      • The author is correct that the incorporation of higher-order terms leads to significantly more expensive computation. It’s an interesting direction of future inquiry to see if our adaptive fast fitness computation method can be extended to higher-order interactions.

      Reviewer 2

      We would like to thank the reviewer for their careful reading and their useful comments connecting our work to spin glass physics. We believe the resulting additions to the paper have made our contributions stronger, and that they reveal some novel connections between the substitution trajectory and correlation functions in spin glasses. A summary of our investigation is provided below, and we have added two paragraphs to the discussion section under the heading “Connections to spin glass physics”.

      Main Comments:

      In spin glasses, slowdown of dynamics could have contributions from stretched exponential relaxation of spin correlations as well as aging, each of which are associated with their own exponents. In the present model, these processes could be quantified by computing two-point correlations associated with genomic overlap, as a function of lag time as well as waiting time (generation number). The population dynamics of competing strains makes the analysis more complicated. But it should be possible to define these correlations by separately averaging over lineages starting from a single parent genome, and over distinct parent genomes. It would be interesting to see how exponents associated with these correlations relate to the exponent c associated with asymptotic fitness growth.

      • To investigate this point, we first considered the two-point correlation function 〈αi (tw)αi (tw+ ∆t)〉 for waiting time tw and lag time ∆t. Because all spins are statistically identical, it is natural to average this over the spin index i, leading to the quantity

      Viewed as a function of ∆t for any fixed tw, it is clear that . If m mutations with respect to α(tw) have fixed at time tw + ∆t, a similar calculation shows that . Surprisingly, this simple derivation reveals that the two-spin correlation function commonly studied in spin glass physics is an affine transformation of the substitution trajectory commonly studied in population genetics. Moreover, it shows that the effect of tw is to change the definition of the ancestral strain, so that we may set tw = 0 without loss of generality and study the correlation function χ2(t) = 1 − 2m(t) where m(t) is the mean substitution trajectory of the population. Much of our analysis proceeds by analyzing the effect of epistasis on the accumulation of mutations. This relation provides a novel connection between this analysis and the analysis of correlation functions in the spin glass literature.

      • It is well known that in the SSWM limit without epistasis, the substitution trajectory follows a power law similar to the fitness trajectory with relaxation exponent 1.0 [1]. Informed by this identity, we performed simulations in the SSWM limit and fit power laws to the correlation function χ2 as a function of time. We have verified that χ2(t) obeys a power- law relaxation with exponent roughly 1.0 for β = 0; moreover, as anticipated by the reviewer, the corresponding exponent decreases with increasing β . Nevertheless, we find that these relaxation exponents are distinct from those found for the fitness trajectory, despite following the same qualitative trend. This point is particularly interesting, as it highlights that the dynamics of fixation induce a distinct functional form at the level of the correlation functions when compared to, for example, the Glauber dynamics in statistical physics.

      The strength of dynamic correlations in spin glasses can be characterized by the four-point susceptibility, which contains information about correlated spin flips. These correlations are maximized over characteristic timescales. In the context of evolution, such analysis may provide insights on the correlated accumulation of mutations on different sets of loci over different timescales. It would be interesting to see how these correlations change as a function of the mutation rate as well as the strength of epistasis.

      • To study this point, we considered the four-point correlation function

      Because spins are statistically identical, we found numerically that the genotype average is roughly equivalent to the angular average over trajectories. Inter-changing the order of the summation and the angular averaging, we then find that

      so that the information contained in the four-point correlation function is the same as the information contained in the two-point correlation function.

      Fig. 2E and Fig. 5 together suggests an intriguing possibility when interpreted in the spin glass context. It is clear that in the absence of epistasis, clonal interference accelerates fitness growth. Fig. 2E additionally suggests that this scenario will continue to hold even in the presence of weak, but finite epistasis, but disappears for sufficiently strong epistasis. I wonder if the two regimes are separated by a phase transition at some non-trivial strength of epistasis. Indeed, the qualitative behavior appears to change from that of a random field Ising spin glass for small β , to that of a zero field Sherrington-Kirkpatrick spin glass for sufficiently large β . While the foregoing comments are somewhat speculative, perhaps a discussion along these lines, and what it means in the context of evolution could be a useful addition to the discussion section of the paper.

      • We thank the reviewer for this interesting suggestion, and we have added a discussion of this point to the text in the future directions section, lines 483–489.

      Minor Comments:

      1. In the abstract (line 17-18), I recommend use of the phrase "a simulated evolving population" to avoid a possible misinterpretation of the work as experimental as opposed to numerical.

      • We have added the word “simulated”.

      1. In line 70, the word "the" before "statistical physics" is redundant.

      • We have removed “the”.

      1. To make the message in lines 294-295 visually clear, I recommend keeping the Y-axis scale bars constant across Fig. 4A and Fig. 4B.

      • We appreciate the suggestion. However, we found that when putting the two figures on the same scale, because the agreement is only qualitative and not quantitative (as emphasized in the text), it becomes difficult to view the trend in both systems. For this reason, we have chosen to keep the figure as-is.

      1. Fig. 6 caption states: "Without epistasis, the rank decreases with increasing µ". It should be "rank increases".

      • We have fixed this.

      1. In the last sentence in the caption to Fig. 8, the labels "(A, β =0)" and "(B, β =0.25)" need to be swapped.

      • We have fixed this.

      Editor Comments

      We thank the editor for pointing our attention towards these three interesting references, in particular the second, which appears most relevant to our work. We have added a discussion of reference 2 in the future directions section (lines 471–482), commenting on how to determine the contribution of within-path clonal interference to the fitness dynamics in our model. We have also added a reference to article 3 in the model description, commenting on the importance of sign epistasis and the prevalence of sign epistasis in our model with β > 0.

      References:

      1. Good BH, Desai MM. The impact of macroscopic epistasis on long-term evolutionary dynamics. Genetics. 2015.
    1. Author Response

      The following is the authors’ response to the original reviews.

      Public Reviews:

      Reviewer #1 (Public Review):

      Summary:

      This study aims to further resolve the history of speciation and introgression in Heliconius butterflies. The authors break the data into various partitions and test evolutionary hypotheses using the Bayesian software BPP, which is based on the multispecies coalescent model with introgression. By synthesizing these various analyses, the study pieces together an updated history of Heliconius, including a multitude of introgression events and the sharing of chromosomal inversions.

      Strengths:

      Full-likelihood methods for estimating introgression can be very computationally expensive, making them challenging to apply to datasets containing many species. This study provides a great example of how to apply these approaches by breaking the data down into a series of smaller inference problems and then piecing the results together. On the empirical side, it further resolves the history of a genus with a famously complex history of speciation and introgression, continuing its role as a great model system for studying the evolutionary consequences of introgression. This is highlighted by a nice Discussion section on the implications of the paper's findings for the evolution of pollen feeding.

      Weaknesses:

      The analyses in this study make use of a single method, BPP. The analyses are quite thorough so this is okay in my view from a methodological standpoint, but given this singularity, more attention should be paid to the weaknesses of this particular approach.

      In the Discussion, we have now added a discussion of the limitations of our approach in the section 'Approaches for estimating species phylogeny with introgression from whole-genome sequence data: advantages and limitations.'

      Additionally, little attention is paid to comparable methods such as PhyloNet and their strengths and weaknesses in the Introduction or Discussion.

      We have also mentioned other methods (PhyloNet and starBEAST) in our Discussion. Our attempts to obtain usable estimates from PhyloNet were unsuccessful. In another study, the full likelihood version of PhyloNet (comparable in intent to the BPP methodology used here) could run with only small datasets of ~100 loci; see Edelman et al. (2019).

      BPP reduces computational burden by fixing certain aspects of the parameter space, such as the species tree topology or set of proposed introgression events. While this approach is statistically powerful, it requires users to make informed choices about which models to test, and these choices can have downstream consequences for subsequent analyses. It also might not be as applicable to systems outside of Heliconius where less previous information is available about the history of speciation and introgression. In general, it is likely that most modelling decisions made in the study are justified, but more attention should be paid to how these decisions are made and what the consequences of them could be, including alternative models.

      We agree with the reviewer that inferring the species tree topology and placing introgression events on the species tree, although well justified here, may be challenging in many groups of organisms and may affect downstream analyses. We now discuss this as a limitation of our approach in the Discussion. In general, the initial MSC analysis without gene flow should provide information about possible species trees and introgression events. We can construct multiple introgression models and perform parameter estimation and model comparison to decide which best fits the data. This is summarized in the last paragraph of the section 'Approaches for estimating species phylogeny with introgression from whole-genome sequence data: advantages and limitations.' It would, of course, be nice to have a completely unsupervised method that could work with large phylogenies, but this is currently computationally impossible.

      • Co-estimating histories of speciation and introgression remains computationally challenging. To circumvent this in the study, the authors first estimate the history of speciation assuming no gene flow in BPP. While this approach should be robust to incomplete lineage sorting and gene tree estimation, it is still vulnerable to gene flow. This could result in a circular problem where gene flow causes the wrong species tree to be estimated, causing the true species tree to be estimated as a gene flow event.

      The goal of this initial analysis is to obtain a list of possible species trees with introgression events. We assume that gene flow results in a topology that is informative about the lineages involved. We also focus on common MAP trees with high posterior probabilities as less frequent trees or trees with low posterior probabilities reflect high uncertainty and are more likely to be erroneous. A difficulty is to decide which tree topology is most likely to be the true species tree. We summarize our approach in the Discussion.

      This is a flaw that this approach shares with summary-statistic approaches like the D-statistic, which also require an a-priori species tree.

      In a sense, this is true, but BPP is more flexible because it can be used to explore an arbitrary introgression model on any type of tree, while summary methods like D-statistic assume a specific species phylogeny with a particular introgression between nonsister lineages as well as fixed sampling configurations. Furthermore, as shown in the paper, we can compare different assumed trees, and test between them; we do this repeatedly in the paper for difficult branch placement issues. In contrast, summary methods such as the D-statistic works with species quartets only and do not work with either smaller or larger species trees.

      Enrichment of particular topologies on the Z chromosome helps resolve the true history in this particular case, but not all datasets will have sex chromosomes or chromosome-level assemblies to test against.

      Yes, we have the privilege of having chromosome-level assemblies available for Heliconius. In general, a spatial pattern of species tree estimates across genomic blocks can be informative about possible topologies that could represent the true species relationship. Then these candidate species trees can be tested by fitting different introgression models (as in Figure 1D,E) or by using the recombination rate argument (Figure 1F), which prefers trees common in low recombination rate regions of the genome, although this requires knowing a recombination rate map. In our case, we used a chromosome-level recombination rate per base pair, which is negatively correlated with the chromosome size. We have clarified this in the text. Ultimately, multiple lines of evidence should be examined before deciding on the most likely species tree. We now mention these potential difficulties with applying our methods to other datasets as limitations of our approach in the Discussion.

      • The a-priori specification of network models necessarily means that potentially better-fitting models to the data don't get explored. Models containing introgression events are proposed here based on parsimony to explain patterns in gene tree frequencies. This is a reasonable and common assumption, but parsimony is not always the best explanation for a dataset, as we often see with phylogenetic inference. In general, there are no rigorous approaches to estimating the best-fitting number of introgression events in a dataset.

      Joint inference of species topologies and possible introgression events remains computationally challenging. PhyloNet implements this joint inference but is limited to small datasets (<100 loci) and we found it to be unreliable.

      Likewise, the study estimates both pulse and continuous introgression models for certain partitions, though there is no rigorous way to assess which of these describes the data better.

      The Bayes factor can be used to compare different models fitted to the same data, for example, different MSC-I models with different introgression events, or MSC-I models with gene flow in pulses versus MSC-M models with continuous gene flow. We did not attempt this as it was clear to us that a better model would include both modes of gene flow, but such an option is not currently implemented in any software. Rather, we relied on our exploratory analysis (BPP MSC and 3s) and previous knowledge to inform a likely introgression model. In the case of groups that we fitted the MSC-M models, we chose to provide an intuitive justification as to why they might be more realistic than the MSC-I model without formally performing model selection.

      • Some aspects of the analyses involving inversions warrant additional consideration. Fewer loci were able to be identified in inverted regions, and such regions also often have reduced rates of recombination. I wonder if this might make inferences of the history of inverted regions vulnerable to the effects of incomplete lineage sorting, even when fitting the MSC model, due to a small # of truly genealogically independent loci.

      We agree with the reviewer that it is challenging to infer the history of a small region of the genome, such as the inversions studied here. Indeed, the presence of only a few loci in the 15b inversion means there is only limited information in the data for the species tree, as reflected in the low posterior probabilities for the MAP tree (Figure 3A). The effect of using tightly linked loci in the inversion should be increased uncertainty in the estimates, but not a systematic bias towards any particular species tree topology. Since major patterns of species relationships in each of the 15a, 15b and 15c regions are clear, we do not expect these effects to strongly influence our conclusions.

      Additionally, there are several models where introgression events are proposed to explain the loss of segregating inversions in certain species. It is not clear why these scenarios should be proposed over those in which the inversion is lost simply due to drift or selection.

      We know that the 15b inversion is absent in most species except for H. numata and H. pardalinus, at least, and that introgression of the inversion occurred between these two species, based on previous studies such as Jay et al (2018) and our own analysis. Polymorphism at this inversion forms a well-known “supergene” that affects mimicry, and is maintained by documented balancing selection in H. numata. Given this information, we propose a few possible scenarios of how the inversion might have originated, and when and where the introgression might have occurred, shown in Figure 3. In particular, the direction of introgression is something we test specifically. One way to test among these scenarios is to date the origin and introgression event of the inversion, but doing so properly is beyond the scope of this work. Nonetheless, we argue that it is at least likely that one difference between H. pardalinus and its sister species H. elevatus is the presence of the 15b inversion. Since other evidence shows that colour patterning loci in H. elevatus originated from an unrelated species, H. melpomene (i.e. the 15b and other non-inverted colour patterning loci), it is indeed likely that the inversion was “swapped out” by an uninverted sequence from H. melpomene during the formation of H. elevatus.

      We are aware that hypotheses such as these might appear highly elaborate and unparsimonious. But these are the conclusions where the data lead us. In the melpomene-silvanform clade, many speciation and introgression events occurred in short succession, and wild-caught hybrids prove that occasional hybridizations can occur across all 15 or so species in the group. We now detail how we have looked only for the major introgression patterns using a limited number of key speces. We leave fuller analyses for future work.

      In the main text, we have revised our discussion of the four proposed scenarios for 15b to improve clarity. We have also updated the introgression model from the melpomene-cydno clade to H. elevatus to be unidirectional based on the BPP results in Figure S18.

      Reviewer #2 (Public Review):

      Thawornwattana et al. reconstruct a species tree of the genus Heliconius using the full-likelihood multispecies coalescent, an exciting approach for genera with a history of extensive gene flow and introgression. With this, they obtain a species tree with H. aoede as the earliest diverging lineage, in sync with ecological and morphological characters. They also add resolution to the species relationships of the melpomene-silvaniform clade and quantify introgression events. Finally, they trace the origins of an inversion on chromosome 15 that exists as a polymorphism in H. numata, but is fixed in other species. Overall, obtaining better species tree resolutions and estimates of gene flow in groups with extensive histories of hybridization and introgression is an exciting avenue. Being able to control for ILS and get estimates between sister species are excellent perks. One overall quibble is that the paper seems to be best suited to a Heliconius audience, where past trees are easily recalled, or members of the different clades are well known.

      We thank the reviewer for the accurate summary and positive comments. Although our data and some of the discussion are specific to Heliconius, we believe our analysis framework will be useful to study species phylogeny and introgression in other taxa as well.

      Overall, applying approaches such as these to gain greater insight into species relationships with extensive gene flow could be of interest to many researchers. However, the conclusions could be strengthened with a bit more clarity on a few points.

      1) The biggest point of concern was the choice of species to use for each analysis. In particular the omission of H. ismenius in the resolution of the BNM clade species tree. The analysis of the chromosome 15 inversion seems to rely on the knowledge that H. ismenius is sister to H. numata, so without that demonstrated in the BNM section the resulting conclusions of the origin of that inversion are less interruptible.

      The choice of species to be included was mainly based on available high-quality genome resequence data from Edelman et al (2019), which were chosen to cover most of the major lineages within the genus. We agree that inclusion of H. ismenius would strengthen the analysis of the melpomene-silvaniform clade. In particular, it would be interesting to know which of only H. numata or H. numata+H. ismenius are responsible for the main source of genealogical variation across the genome in this group in Figure 2. The reviewer is correct in saying that we do assume that H. ismenius and H. numata are sister species. This relationship is supported by our analysis (Figure 3A) and previous analyses of genomic data, e.g. Zhang et al (2016), Cicconardi et al. (2023) and Rougemont et al. (2023). We made this clearer in the text:

      "Although this conclusion assumes that H. numata and H. ismenius are sister species while H. ismenius was not included in our species tree analysis of the melpomene-silvaniform clade (Figure 2), this sister relationship agrees with previous genomic studies of the autosomes and the sex chromosome (Zhang et al. 2016; Cicconardi et al. 2023; Rougemont et al. 2023)."

      2) An argument they make in support of the branching scenario where H. aoede is the earliest diverging branch is based on which chromosomes support that scenario and the key observation that less introgression is detected in regions of low recombination. Yet, they go no further to understand the relationship between recombination rate and species trees produced.

      We believe Figure 1F does examine this relationship, showing that trees under scenario 2 are more common in regions of the genome with lower recombination rates (i.e. in longer chromosomes). We added more clarification in the text where Figure 1F is mentioned. The relationship between recombination and introgression in Heliconius was earlier discovered and shown using windowed estimated gene trees in Martin et al. (2019) and in Edelman et al. (2019), so we did not re-test this here.

      3) How the loci were defined could use more clarity. From the methods, it seems like each loci could vary quite a bit in total bp length and number of informative sites. Understanding the data processing would make this paper a better resource for others looking to apply similar approaches.

      We added a new supplemental figure, Figure S20, to illustrate how coding and noncoding loci were extracted from the genome.

      Reviewer #3 (Public Review):

      The authors use a full-likelihood multispecies coalescent (MSC) approach to identify major introgression events throughout the radiation of Heliconius butterflies, thereby improving estimates of the phylogeny. First, the authors conclude that H. aoede is the likely outgroup relative to other Heliconius species; miocene introgression into the ancestor of H. aoede makes it appear to branch later. Topologies at most loci were not concordant with this scenario, though 'aoede-early' topologies were enriched in regions of the genome where interspecific introgression is expected to be reduced: the Z chromosome and larger autosomes. The revised phylogeny is interesting because it would mean that no extant Heliconius species has reverted to a non-pollen-feeding ancestral state. Second, the authors focus on a particularly challenging clade in which ancient and ongoing gene flow is extensive, concluding that silvaniform species are not monophyletic. Building on these results, a third set of analyses investigates the origin of the P1 inversion, which harbours multiple wing patterning loci, and which is maintained as a balanced polymorphism in H. numata. The authors present data supporting a new scenario in which P1 arises in H. numata or its ancestor and is introduced to the ancestor of H. pardilinus and H. elevatus - introgression in the opposite direction to what has previously been proposed using a smaller set of taxa and different methods.

      The analyses were extensive and methodologically sound. Care was taken to control for potential sources of error arising from incorrect genotype calls and the choice of a reference genome. The argument for H. aoede as the earliest-diverging Heliconius lineage was compelling, and analyses of the melpomene-silvaniform clade were thorough.

      The discussion is quite short in its current form. In my view, this is a missed opportunity to summarise the level of support and biological significance of key results. This applies to the revised Melpomenesilvaniform phylogeny and, in particular, the proposed H. numata origin of P1. It would be useful to have a brief overview of the relationships that remain unclear, and which data (if any) might improve estimates.

      We added a paragraph in the Discussion to summarize our key findings in 'An updated phylogeny of Heliconius', and discuss issues that remain uncertain.

      It was good to see the authors reflect on the utility of full-likelihood approaches more generally, though the discussion of their feasibility and superiority was at times somewhat overstated and reductive. Alternative MSC-based methods that use gene tree frequencies or coalescence times can be used to infer the direction and extent of introgression with accuracy that is satisfactory for a wide variety of research questions. In practice, a combination of both approaches has often been successful. Although full-likelihood approaches can certainly provide richer information if specific parameter estimates are of interest, they quickly become intractable in large species complexes where there is extensive gene flow or significant shifts in population size. In such cases, there may be hundreds of potentially important parameters to estimate, and alternate introgression scenarios may be impossible to disentangle. This is particularly challenging in systems, unlike Heliconius where there is little a priori knowledge of reproductive isolation, genome evolution, and the unique life history traits of each species. It would be useful for the authors to expand on their discussion of strategies that can simplify inference problems in such systems, acknowledging the difficulties therein.

      We agree that approximate methods based on summary statistics (e.g. gene tree topologies) are computationally much cheaper and are sometimes useful. We now discuss limitations of our approach regarding strategies for constructing possible introgression models, computational cost and analysis of large phylogenies, and modeling assumptions in the MSC framework in the first section of the Discussion.

      Reviewer #1 (Recommendations For The Authors):

      In addition to the comments raised in the public review, I have some minor suggestions:

      • In the Introduction, "Those methods have limited statistical power" implies summary-statistic methods have a high false negative rate for inferring the presence of introgression, which I don't think is true.

      We removed 'statistical' as we used the term power loosely to mean ability to estimate more parameters in the model by making a better use of information in the sequence data and not in the sense of a true positive rate.

      • When discussing full-likelihood approaches in a general sense, please cite additional methods than just BPP, such as PhyloNet.

      We added references for PhyloNet (Wen & Nakhleh, 2018) and starBEAST (Zhang et al., 2018) in the Introduction and Discussion.

      • Consider explicitly labelling chromosomal region 21 as the Z chromosome in relevant Figures, for ease of interpretation.

      In the main figures, we changed the chromosome label from 21 to Z.

      • From reading the main text it's not clear what a "3s analysis" is

      The 3s analysis estimates pairwise migration rates between two species by fitting an MSC-withmigration (MSC-M) model, also known as isolation-with-migration (IM), for three species, where gene flow is allowed between the two sister species while the outgroup is used to improve the power but does not involved in gene flow. We changed the text from

      "We use estimates of migration rates between each pair of species with a 3s analysis under the IM model of species triplets ..."

      to

      "We use estimates of migration rates between each pair of species under the the MSC-withmigration (MSC-M or IM) model of species triplets (3s analysis) ..."

      • "This agrees with the scenario in which H. elevatus is a result of hybrid speciation between H. pardalinus and the common ancestor of the cydno-melpomene clade [42, 43]." I don't think this model provides any support for hybrid speciation in particular, over a standard post-speciation introgression scenario.

      We took the finding that the introgression from the melpomene-cydno clade into H. elevatus occurs almost right after H. elevatus split off from H. pardalinus as evidence for hybrid speciation. We revised the text to make this clearer:

      "Our finding that divergence of H. elevatus and introgression from the cydno-melpomene clade occurred almost simultaneously provides evidence for a hybrid speciation origin of H. elevatus resulting from introgression between H. pardalinus and the common ancestor of the cydno-melpomene clade (Rosser et al. 2019; Rosser et al. 2023)."

      In particular, the Rosser et al. (2023) paper has now been submitted, and is the main paper to cite for the hybrid speciation hypothesis for H. elevatus.

      • "while clustering with H. elevatus would suggest the opposite direction of introgression" careful with terminology here; is this about direction (donor vs. recipient species) or taxa involved (which is not direction)?

      This is about the direction of introgression, not the taxa involved. We modified the text to make this clearer:

      "By including H. ismenius and H. elevatus, sister species of H. numata and H. pardalinus respectively, different directions of introgression should lead to different gene tree topologies. Clustering of (H. numata with the inversion, H. pardalinus) with H. numata without the inversion would suggest the introgression is H. numata → H. pardalinus while clustering of (H. numata with the inversion, H. pardalinus) with H. elevatus would suggest H. pardalinus → H. numata introgression."

      Reviewer #3 (Recommendations For The Authors):

      The work is methodologically sound and rigorous but could have been reported and discussed with greater clarity.

      It was difficult to assess the level of support for the proposed P1 introgression scenario without digging through the extensive supplementary materials. The discussion would ideally be used to clarify and summarise this.

      We have substantially revised the section on the P1 inversion. We also mention in the Results (in the final paragraph of the inversion section) and Discussion that our data provided robust evidence that the introgression of the inversion is from H. numata into H. pardalinus while its precise origin (in which lineage and when it originated) remains uncertain.

      The authors may also wish to compare their results to the recent work by Rougemont et al. on introgression between H. hecale and H. ismenius in the discussion.

      We now mention Rougemont et al. (2023) in the Discussion as an example of introgression of small regions of the genome involved in wing patterning. We also acknowledge that our updated phylogeny does not include this kind of local introgression.

      It was not initially obvious which number corresponded to the Z chromosome in any of the figures, even though this is critical to their interpretation.

      We changed the label for chromosome 21 to Z in the main figures.

      The supplementary tables should be described in more detail. For example, what is 'log_bf_check' and 'prefer_pred' in supplementary table S11?

      We added more details explaning necessary quantities in the table heading in both SI file and in the spreadsheet.

      Minor comments:

      First paragraph of 'Complex introgression in the 15b inversion region (P locus):' Rephrase "This suggests another introgression between the common...".

      We modified the text as follows:

      "Another feature of this 15b region is that among the species without the inversion, the cydnomelpomene clade clusters with H. elevatus and is nested within the pardalinus-hecale clade (without H. pardalinus). This is contrary to the expectation based on the topologies in the rest of the genome (Figure 2A, scenarios a–c) that the cydno-melpomene clade would be sister to the pardalinus-hecale clade (without H. pardalinus). One explanation for this pattern is that introgression occurred between the common ancestor of the cydno-melpomene clade and either H. elevatus or the common ancestor of H. elevatus and H. pardalinus together with a total replacement of the non-inverted 15b in H. pardalinus by the P1 inversion from H. numata (Jay et al. 2018). We confirm and quantify this introgression below."

      Second paragraph of 'Major Introgression Patterns in the melpomene-silvaniform clade:' "cconclusion" should be "conclusion."

      Corrected.

      Paragraph preceding discussion: sentences toward the end of the paragraph should be rephrased for clarity. E.g. "different tree topologies are expected under different direction of introgression."

      We revised this paragraph. The sentence now says:

      "By including H. ismenius and H. elevatus, sister species of H. numata and H. pardalinus respectively, different directions of introgression should lead to different gene tree topologies.<br /> Clustering of (H. numata with the inversion, H. pardalinus) with H. numata without the inversion would suggest the introgression is H. numata → H. pardalinus while clustering of (H. numata with the inversion, H. pardalinus) with H. elevatus would suggest H. pardalinus → H. numata introgression."

      I enjoyed reading this paper and I am certain it will generate discussion and future research.

    1. Author Response

      The following is the authors’ response to the original reviews.

      Reviewer #1 (Public Review):

      While the manuscript was reasonably clearly written and the methodology and results sound, it is not clear what the real contribution of the work is. The authors' findings - that ultrasonic stimulation is capable of altering intracellular Ca2+ to effect an increase in EV secretion from cells as long as the irradiation does not affect cell viability-is well established (see, for example, Ambattu et al., Commun Biol 3, 553, 2020; Deng et al., Theranostics, 11, 9 2021; Li et al., Cell Mol Biol Lett 28, 9, 2023). Moreover, the authors' own work (Maeshige et al., Ultrasonics 110, 106243, 2021) using the exact same stimulation (including the same parameters, i.e., intensity and frequency) and cells (C2C12 skeletal myotubes) reported this. Similarly, the authors themselves reported that EV secretion from C2C12 myotubes has the ability to regulate macrophage inflammatory response (Yamaguchi et al., Front Immunol 14, 1099799, 2023). It would then stand to reason that a reasonable and logical deduction from both studies is that the ultrasonic stimulation would lead to the same attenuation of inflammatory response in macrophages through enhanced secretion of EVs from the myotubes.

      We appreciate your comments and suggestions. Ambattu et al. in their report stated that the high frequency acoustic stimulation they used has a less effect on cell membranes than the 1 MHz ultrasound that we used in this study. Deng et al. and Li et al. applied low intensity pulsed ultrasound (LIPUS) (about 300 mW/cm2) in their studies. In this study, we assumed that ultrasound induced increase in EV secretion via increased Ca2+ influx into the cell by enhancing cell membrane permeability, and since it has been reported that the effect of ultrasound-induced enhancement in cell membrane permeability increases in an intensity-dependent manner (Zeghimi et al., 2015), we applied intensities of 1-3 W/cm2. While previous studies using LIPUS have used 15 minutes of irradiation, the high intensity employed in this study was capable to promote EV release after 5 minutes of stimulation. We have added the above explanation to the introduction in the revised version of the manuscript. Furthermore, while the previous studies used other types of cells, the main purpose of this study was to determine the optimal ultrasound intensity to promote EV release from skeletal muscle and to determine whether ultrasound-induced EVs are qualitatively altered compared to those released under normal conditions, thereby validating the anti-inflammatory effects of ultrasound-induced muscle EVs. Our previous study (Maeshige et al. 2021) used the same muscle cells but did not investigate an intensity dependence, so this is the first study to show that ultrasound irradiation promotes EV release in an intensity-dependent manner in muscle. In addition, we would like to emphasize that this study also goes beyond our previous study in the method of stimulation. Specifically, the present study a more efficient 5-minute irradiation protocol was used, whereas the previous study have adopted a 9-minute intervention.

      We understand that the results of this study are predictable from two of our previous studies, but since stimulus-induced EVs may be qualitatively different compared to EVs released under normal conditions (Kawanishi et al., 2023; Li et al., 2023), it is worthwhile to examine the effects of stimulus-induced EVs. This explanation has been added in the introduction of revised version of the manuscript.

      The authors' claim that 'the role of Ca2+ in ultrasound-induced EV release and its intensity-dependency are still unclear', and that the aim of the present work is to clarify the mechanism, is somewhat overstated. That ultrasonic stimulation alters intracellular Ca2+ to lead to EV release, therefore establishing their interdependency and hence demonstrating the mechanism by which EV secretion is enhanced by the ultrasonic stimulation, was detailed in Ambattu et al., Commun Biol 3, 553, 2020. While this was carried out at a slightly higher frequency (10 MHz) and slightly different form of ultrasonic stimulation, the same authors have appeared to since establish that a universal mechanism of transduction across an entire range of frequencies and stimuli (Ambattu, Biophysics Rev 4, 021301, 2023).

      In this study, we showed that Ca2+ is involved in ultrasound-induced EV release using Ca2+-depleted culture medium, but since we did not examine the mechanism in more detail than that, we modified the introduction to avoid overstating.

      Similarly, the anti-inflammatory effects of EVs on macrophages have also been extensively reported (Li et al., J Nanobiotechnol 20, 38, 2022; Lo Sicco et al., Stem Cells Transl Med 6, 3, 2017; Hu et al., Acta Pharma Sin B 11, 6, 2021), including that by the authors themselves in a recent study on the same C2C12 myotubes (Yamaguchi et al., Front Immunol 14, 1099799, 2023). Moreover, the authors' stated aim for the present work - clarifying the mechanism of the anti-inflammatory effects of ultrasound-induced skeletal muscle-derived EVs on macrophages - appears to be somewhat redundant given that they simply repeated the microRNA profiling study they carried out in Yamaguchi et al., Front Immunol 14, 1099799, 2023. The only difference was that a fraction of the EVs (from identical cells) that they tested were now a consequence of the ultrasound stimulation they imposed.

      That the authors have found that their specific type of ultrasonic stimulation maintains this EV content (i.e., microRNA profile) is novel, although this, in itself, appears to be of little consequence to the overall objective of the work which was to show the suppression of macrophage pro-inflammatory response due to enhanced EV secretion under the ultrasonic irradiation since it was the anti-inflammatory effects were attributed to the increase in EV concentration and not their content.

      In comparison with the current study, our previous study observed EVs secreted only from muscle in normal condition. However, the purpose of the current study is to answer the question whether ultrasound treatment could enhance the effect of EVs and change the encapsuled miRNAs. Although we identified several miRNAs which are specifically induced by ultrasound, further studies are needed to demonstrate the effect of those miRNAs derived from ultrasound-treated muscles on macrophages. We have mentioned this limitation in the discussion of the revised manuscript.  

      Reviewer #1 (Recommendations For The Authors):

      This reviewer felt that there was a lack of novelty in the manuscript and that the results of the work confirm conclusions that could have been logically deduced from a combination of the authors' preceding work (Maeshige et al., Ultrasonics 110, 106243, 2021 and Yamaguchi et al., Front Immunol 14, 1099799, 2023). The contribution of the work could perhaps be elevated if the authors were to focus more on whether the 0.01% of altered miRNA has any impact on cellular activity.

      As mentioned above, the present study is novel compared to our previous studies for examining the effects of ultrasound-induced EVs. In addition, the fact that EV content is maintained after ultrasound stimulation rather indicates that ultrasound can be used as a highly stable and effective method of promoting EV release.

      A further, albeit more minor, recommendation is to omit lines 73-80 in the manuscript. The discussion on physical exercise for promoting EV secretion together with the non-invasive nature of ultrasound therapy is very misleading as it creates the impression that the authors' work can be applied as a direct intervention on a patient. This was not shown in the work, which was limited to irradiating cells ex vivo.

      We agree and have edited the introduction.

      Reviewer #2 (Public Review):

      1. The exploration of output parameters for US induction appears limited, with only three different output powers (intensities) tested, thus narrowing the scope of their findings.

      We appreciate your comments and suggestions. The intensity of LIPUS is basically in the ~0.3 W/cm2 range, and in clinical practice, ~2.5 W/cm2 is considered to be a safe intensity to irradiate the human body (Draper, 2014). Therefore, 3.0 W/cm2 is also a fairly high intensity for the human body, so 3.0 W/cm2 was set as the maximum intensity in this study.

      1. Their claim of elucidating mechanisms seems to be only partially met, with a predominant focus on the correlation between calcium responses and EV release.

      The focus of this study was to examine the effects of ultrasound-induced EVs on the inflammatory responses of macrophages and not on the detailed mechanism of calcium involvement. We revised the introduction to make the purpose of this study clearer.

      1. While the intracellular calcium response is a dynamic activity, the method used to measure it could risk a loss of kinetic information.

      Although we did not examine the kinetic action of calcium, we believe that Ca2+ is at least proven to be involved to the EV-promoting effect of ultrasound on muscle, since the enhancement of EV release by ultrasound was canceled by elimination of calcium from the culture medium. Furthermore, real-time measurement of Ca2+ after ultrasound irradiation has shown that ultrasound irradiation promotes Ca2+ influx into cells immediately after the irradiation. (Fan et al., 2010).  

      1. The inclusion of miRNA sequencing is commendable; however, the interpretation of this data fails to draw clear conclusions, diminishing the impact of this segment.

      Although we identified several miRNAs which are specifically induced by ultrasound, further studies are needed to demonstrate the effect of those miRNAs derived from US-treated muscles on macrophages. We have mentioned this limitation in the discussion of the revised version of manuscript.

      While the authors have shown the anti-inflammatory effects of US-induced EVs on macrophages, there are gaps in the comprehensive understanding of the mechanisms underlying US-induced EV release. Certain aspects, like the calcium response and the utility of miRNA sequencing, were not fully explored to their potential. Therefore, while the study establishes some findings, it leaves other aspects only partially substantiated.

      As stated above, the main purpose of this study was to examine the effects of ultrasound-induced EVs on the inflammatory responses of macrophages. We set detailed investigation on the mechanism of ultrasound-induced EV release as our next step and have revised the introduction and discussion of the revised manuscript to make the purpose and limitation of this study clearer.  

      Reviewer #2 (Recommendations For The Authors):

      The author's exploration into the role of Ca2+ in the context of US-induced EV release is a timely endeavor, especially given the growing interest in understanding the cellular dynamics associated with external stimulants like ultrasound. Nevertheless, the manuscript does not unambiguously define the mechanism of action and its broader implications.

      Ca2+ has long been established as a versatile intracellular messenger, governing a myriad of cellular processes. There is a wealth of methodologies, from specific inhibitors to specialized assays, tailored to dissect the role of Ca2+ in diverse contexts. In the specific case of US-induced Ca2+ activity, the expectation would be for a clear, mechanistic delineation of how this ionic surge drives EV release. Yet, this study stops short of providing those details. It is imperative for the authors to dig deeper, employing a diverse set of tools at their disposal, to fill this knowledge gap.

      Recently, it was reported that increased Ca2+ influx causes an increase in EV secretion via the plasma membrane repair protein annexin A6 (Williams et al. 2023). However, the full mechanism of how an increase in intracellular Ca2+, let alone ultrasound-induced Ca2+, promotes EV release has not yet been understood yet, and it is beyond the scope of this study to elucidate this part of the mechanism.

      Furthermore, the paper raises another important question: Which specific proteins are pivotal in orchestrating the US-induced Ca2+ entry in myotubes? Addressing this would not only enhance the manuscript's novelty but would also contribute a vital piece to the puzzle of understanding US-cellular interactions.

      Ultrasound increases Ca2+ uptake by increasing cell membrane permeability by sonoporation, rather than via protein reactions (Fan et al., 2010). We added this explanation to the introduction in the revised version of manuscript.  

      Lastly, while the report touches upon the influence of varying US output power on EV concentrations, it piques curiosity about potential effects beyond the 3W/cm2 threshold. It's observed that cell viability isn't compromised at this intensity, suggesting room for further exploration. Would a higher intensity yield a proportionally increased EV release, or is there a saturation point? Conversely, could intensities beyond 3W/cm2 begin to have deleterious effects on the cells? These are crucial considerations that merit investigation to realize the full potential of US as a modulatory tool, both for research and therapeutic applications.

      As mentioned above, 3.0 W/cm2 was adopted as the maximum intensity in this study with reference to the intensity used in clinical practice. In addition, since the cytotoxicity and therapeutic effects of ultrasound depend not only on intensity but also on other parameters such as duty cycle, acoustic frequency, pulse repetition frequency and duration, so a comprehensive analysis of the effects of ultrasound on cells at various parameter settings would be valuable as an independent study.

    1. Author Response

      The following is the authors’ response to the original reviews.

      We greatly appreciate your positive assessment and the comments by the two reviewers on the previous version of our manuscript, all of which are very helpful and greatly improved our manuscript. We have incorporated all changes and corrections requested by these reviewers and we believe their suggestions have enhanced the overall quality of our manuscript.

      As for Reviewer #1.

      We thank Reviewer 1 very much for her/his very positive and detailed remarks, all of which have been introduced into the revised version of our manuscript.

      We have added the information about the biological control on the development of phosphatic-shelled brachiopod columns in the introduction, so that our late narrative can be more understandable. The Cambrian Explosion is the innovation of metazoan body plans and radiation of animals during a relatively short geological time. The expansion of new body plans in different groups of brachiopods in the early Cambrian was likely driven by the Cambrian Explosion. The columnar architectures are not developed in living lingulate brachiopods, and thus it is important to get a better understanding of this extinct shell architecture from the fossil records on a global scale in order to study the evolutionary trend of shell architectures and compositions in brachiopods. We hope the current comparison study of columnar shell architectures from some of the oldest known brachiopods will help to pursue this goal. Furthermore, the adaptive innovation of biomineralized columnar architecture in early brachiopods is discussed in the revised manuscript.

      As for Reviewer #2.

      We thank Reviewer 2 very much for her/his very constructive and detailed remarks. All the comments have been thoroughly considered, and introduced into the revised version of the manuscript.

      The current information on the shell structures of early linguliform brachiopods is unclear, which has been introduced in the revised manuscript and the supplementary Appendix 1. We also state that more detailed studies of the complexity and diversity of linguliform brachiopod architectures (especially their early fossil representatives) require further investigations. As the shell structure and biomineralization process are crucial to unravel the poorly resolved phylogeny and early evolution of Brachiopoda, in this paper, we undertake a primary study of exquisitely well-preserved brachiopods from the Cambrian Series 2. The shapes and sizes of microscopic cylindrical columns are described in detail in this research, and this work will be useful for further comparative studies on brachiopod shell architecture. The important reference paper on brachiopod shells by Butler et al. (2015) has been added to the revised manuscript. The structure and language of the manuscript are revised based on the very helpful suggestions.

      Concerning the families Eoobolidae and Lingulellotretidae, we are aware of the current problematic situation of these families, and we have added more discussion about the detailed characters of Eoobolidae in the Systematic Palaeontology part of the manuscript. However, the revision of the families Eoobolidae and Lingulellotretidae falls outside the scope of this paper. We prefer to leave it now as it will be part of an upcoming publication based on more global materials from China, Australia, Sweden and Estonia that we are currently working on.

      On behalf of my co-authors, I thank you for taking the time to consider our manuscript for publication in eLife and I hope that with the changes we have made to our paper, it is now suitable for publication. If you have any further questions about our revised manuscript, please do not hesitate to get in contact. Thank you very much for your time and consideration.

    1. Author Response

      The following is the authors’ response to the original reviews.

      The authors deeply appreciate the reviewer’s constructive criticism.

      Answers to the public review from Reviewer 1

      1. The pathogenesis of truncating LRRC23 in asthenozoospermia needs to be further considered. The molecular mechanism of LRRC23 demonstrated in mice should be tested in patients with the LRRC23 variant. As it may be difficult to determine the structures of RS3 in the infertile male sperm, the LRRC23 localization should be observed in the sperm from patients with the LRRC23 variant.

      We understand the reviewer’s point. Unfortunately, the patients declined to continue in the project after the initial clinical evaluation and blood draw, so we were unable to follow up.

      1. The absence of the RS3 head in LRRC23Δ/Δ mouse sperm is not sufficient to support the specific localization of LRRC23 in RS3 head. Although LRRC23 might bind to RS head protein RSPH9, the authors state that "RSPH9 is a head component of RS1 and RS2 like in C. reinhardtii (Gui et al, 2021), but not of RS3" as the protein level and the localization of RSPH9 is not altered in LRRC23Δ/Δ sperm. Thus, the specific localization of LRRC23 in RS3 head should be further confirmed.

      Thank you for your comment. We agree with the reviewer that the specific localization of LRRC23 within the RS3 head needs to be further confirmed, but this requires an atomic resolution structure of the RS3 head, which is beyond the scope of the current study. We will pursue this direction in our future study.

      3) The interaction between LRRC23 and RSPH9 needs to be defined. AlphaFold models could help determine the likelihood of a direct interaction. In addition, the structure of the 96-nm modular repeats of axonemes from the flagella of human respiratory cilia has been determined (PMID: 37258679), and the localization of LRRC23 in RS could be further predicted.

      We appreciate the comment. We are pursuing an atomic resolution structure of the RS3 head, and thus leave the prediction and detailed localization to future studies.

      4) The ortholog of the RSP15 may also be predicted or confirmed by using the reported structure in human respiratory cilia (PMID: 37258679). Whether the LRCC34 in RS2 is LRRC34?

      Based on the amino acid sequence and AlphaFold predicted structure comparison, we proposed LRRC34 as the RSP15 orthologue. We agree that further clarification of whether the reported RSP15 structure in human respiratory cilia is LRRC34 is valuable, but we would like to focus the current study on re-annotating LRRC23 function to RS3 and male infertility.

      Answers to the public review from Reviewer 2

      1. While the author generated mutant mice expressing truncated LRRC23 proteins, the expression of these truncated proteins was not detected in sperm. This implies that, in terms of sperm structure, the mutant LRRC23 protein behaves similarly to the complete knockout of the LRRC23 protein, which has been previously reported and characterized (Zhang et al., 2021).

      We partially agree with the reviewer’s comments. Indeed, the spermatozoa from truncated mutant LRRC23 mice may be similar to those from the complete knockout. However, the truncated LRRC23 in the testis could in part contribute to the assembly and structural organization of the RS3 head and/or bridge during spermatogenesis, and thus it is possible that complete absence of the LRRC23 could result in more severe structural defects in the RS3 and bridge structure. Therefore, to simply infer the same defects requires a direct comparison.

      1. This reviewer questions the proposal that LRRC23 is an integral component of RS3, as the results indicate not only the loss of the RS3 head structure but also an incomplete RS2-RS3 junction structure. In addition, the interaction of LRRC23 with RSPH9 alone does not fully explain its involvement solely in RS3 assembly. Additional evidence is required to examine the influence of LRRC23 on the RS2-RS3 junction.

      Thank you for the reviewer’s point. In a previous study, LRRC23 was detected in tracheal cilia that lack the bridge structure. Thus, we concluded that LRRC23 is a component in the RS3 head, but not necessarily in the RS2-RS3 bridge structure, although the bridge structure is also affected. Broad structural defects due to single protein loss of function are often observed in sperm flagella. For example, deficiency of RSPH6A, an RS head component, affects not only the RS structure but the entire flagellar structure in a non-uniform manner, resulting in multiple morphological flagellar abnormalities. We anticipate that our future study to determine the molecular architecture in the RS3 head and bridge structure will provide further insights into this question.

      1. The article does not explore how these mutations affect the flagella structure in human sperm, which needs further study. Expanding the study to include human sperm structure would undoubtedly enhance the quality of the article.

      We agree with the importance of further pursuing the effect of these mutations in human samples, but faced practical difficulties. As responded to reviewer 1, the patients not only dropped out of the project, but also are distantly located in remote region of Pakistan, making the application of cryo-ET not feasible.

      Answers to the recommendations of Reviewer 1

      1. The statistics analysis should be performed in Figures 2E and 2F.

      We appreciate the reviewer’s recommendation. For 2E, since the standard deviations for two groups are equal to 0, it is not possible to perform appropriate statical analyses. For 2F, since the knockout males do not sire, it is not possible to know the number of litters in this case. Therefore, litter size information is not available for knockout males, and statistical analyses are not applicable.

      1. In Figure 3A, the human sperm RS structures (PMID: 36593309) should be provided.

      Thanks for the suggestion. We have included human sperm RS structures as suggested.

      1. The molecular weight markers should also be added in Figure 3F (left), EV4B, and EV5B (AKAP3, RSPH9, AcTub).

      In the original Figure 3F, the markers were shown as the white lines in the blot images due to the space limitations. Since the previous markers are not clearly visible, we have changed the color to yellow. The marker information in EV4B and 5B has also been updated.

      Answers to the recommendations of Reviewer 2

      1. Line 119, Table S1 is incorrectly shown.

      We have corrected the Table nomenclature to Table EV1.

      1. Line 132, the author suggests that LRRC23 mutations do not affect female reproduction based on the fertility of the mother. However, this conclusion may lack rigor since it overlooks the sterility of IV-4. To address this, the author needs to examine the fertility of female mice more comprehensively. Additionally, considering the higher expression level of LRRC23 in the oviduct, the author should investigate any potential changes in the oviduct cilia.

      Thank you for the reviewer’s comment. As described in line 134, the mother of IV-4, who also carries the homozygous mutant allele like IV-4, was fertile. In addition, Lrrc23Δ/Δ female mice are fertile (now added in lines 173-174). In fact, we maintain the mouse line by crossing Lrrc23Δ/Δ females with heterozygous males. Thus, our initial conclusion that the LRRC23 mutation does not cause female fertility is still valid. However, LRRC23 has a function in the regulation of oviductal cilia requires further study, so we have softened down the corresponding sentence.

      1. In the article, the author mentions that there are some morphological differences observed in the sperm, which are not clearly depicted in Fig.1B. It is essential to specify the specific changes in sperm morphology that the author identified.

      Thank you for your comment. The morphological variations (e.g., the sperm in the lower left corner of Fig.1B has more a rounded sperm head) meant overall normal morphology with the normal range of occurrence in abnormal sperm morphology in normal fertile men, not necessarily caused by the LRRC23 mutation. To avoid confusion, we have rephrased the sentence (see lines 122-124).

      1. In Fig.3F, the previous study confirmed an interaction between LRRC23 and RSPH3 (Zhang et al., 2021), but the current manuscript does not demonstrate such an interaction; the author should explain the text.

      We appreciate your point. This could be due to the different interaction condition in vitro, and we described the possibility in main text (See Lines 200-201).

      1. In the case of the interaction between LRRC23 and RSPH9, the author utilizes human protein to detect but conducts phenotype verification in mice. Thus, discussing the relevance and potential limitations of extrapolating these findings from human protein interactions to the phenotypic effects

      Thank you for the reviewer’s suggestion. We added discussion for that part (lines 336-341).

      1. The authors needed to detect changes in LRRC23 protein and mRNA levels at different stages of spermatogenesis.

      We agree that expression profiling of LRRC23 protein levels in developing male germ cells will be helpful to further understand LRRC23 function in spermatogenesis, but we do not perceive that it is not critical in this study as LRRC23 mRNA expression profiling from scRNA database (Fig. EV4) hints at the protein profiles.

      1. In Figure 4C of the article, the author should provide a clear and detailed explanation in the text of how they distinguish RS1, RS2, and RS3.

      We added the information in figure legends (lines 1034-1037).

      1. Zoom in on the RS structure in Fig.EV5D for precise observation.

      In TEM images with limited resolution, we could not tell which RS (RS1, 2, or 3) we have in the cross-section, and simple zoom-in does not provide a better and/or more accurate observation (the main reason, we moved forward with cryo-ET).

      1. By utilizing computational modeling and bioinformatics tools, the authors gain insights into the potential interactions, binding sites, and structural features of LRRC23 within the RS3 complex. This approach provides a deeper understanding of LRRC23's function and role in the assembly and stability of the RS3 complex. To enhance the clarity and visualization of the findings, the authors should generate a schematic diagram that illustrates the proposed interactions and structural organization of LRRC23 within the RS3 complex.

      We appreciate the reviewer’s suggestion to speculate the molecular position and interaction of LRRC23 within the RS3 complex. For the level of computational modeling and bioinformatics, we believe that purification of RS3 complex and LRRC23 interactome study is required, which is one of our future directions. Given the limitation of our current data, we choose to stay conservative and not to suggest detailed structural information of LRRC23 in RS3 complex.

    1. Author Response

      The following is the authors’ response to the original reviews.

      Re: Revised author response for eLife-RP-RA-2023-90135 (“The white-footed deermouse, an infection-tolerant reservoir for several zoonotic agents, tempers interferon responses to endotoxin in comparison to the mouse and rat” by Milovic, Duong, and Barbour”)

      The revised manuscript has taken into account all the comments and questions of the two reviewers. Our responses to each of the comments are detailed below. In brief, the modifications or additional materials for the revision each specifically address a reviewer comment. These modifcations or materials include the following….

      • a more in-depth consideration of sample sizes

      • a better explanation of what p values signify for a GO term analysis

      • a more detailed account of the selection of the normalization procedure for cross-species targeted RNA-seq (including a new supplemental figure)

      • several more box plots in supplementary materials to complement the scatterplots and linear regressions of the figures of the primary text

      • provision in a public access repository of the complete data for the RNA-seq analyses as well as primary data for figures and tables as new supplementary tables

      • the expansion of description of the analysis done for the revision of Borrelia hermsii infection of P. leucopus. This included a new table (Table 10 of the revision) • development of the possible relevance of finding for longevity studies by citing similarities of the findings in P. leucopus with those in the naked mole-rat

      • what we think is a better assessment of differences between female and male P. leucopus for this particular study, while still keeping focus on DEGs in common for females and males. This included a new figure (Figure 4 of the revision).

      • removal of reference to a “inverse” relationship between Nos2 and Arg1 while still retaining ratios of informative value

      We note that in the interval between uploading the original bioRxiv preprint and now we learned of the paper of Gozashti, Feschotte, and Hoekstra (reference 32), which supports our conception of the important place of endogenous retroviruses in the biology and ecology of deermice. This is the only addition or modification that was not a direct response to a reviewer comment or question, but it was germane to one of Reviewer #1’s comments (“Regarding..”).

      Reviewer #1:

      Supplemental Table 1 only lists genes that passed the authors statistical thresholds. The full list of genes detected in their analysis should be included with read counts, statistics, etc. as supplemental information.

      We agree that provision of the entire lists of reference transcripts and the RNA-seq results for each of the 40 animals is merited. These datasets are too large for what the journal’s supplementary materials resource was intended for, so we have deposited them at the Dryad public access repository.

      While P. leucopus is a critical reservoir for B. burgdorferi, caution should be taken in directly connecting the data presented here and the Lyme disease spirochete. While it's possible that P. leucopus have a universal mechanism for limiting inflammation in response to PAMPs, B. burgdorferi lack LPS and so it is also possible the mechanisms that enable LPS tolerance and B. burgdorferi tolerance may be highly divergent.

      The impetus for the study was the phenomenon of tolerance of infection of P. leucopus by a number of different kinds of pathogens, not just B. burgdorferi. We take the reviewer’s point, though. Certainly, the white-footed deermouse is probably most notable at-large for its role as a reservoir for the Lyme disease agent. We doubt that the species responses to LPS and to the principal agonists of B. burgdorferi are “highly divergent”, though. Other than the TLR itself-TLR4 for LPS vs the heterodimer TLR2/TLR1 for the lipoproteins of these spirochetes--the downstream signaling is generally similar for amounts comparable in their agonist potency.

      We had thought that we had addressed this distinction for B. burgdorferi and other Borreliaceae members by referring to the earlier study. But we agree with the reviewer that what was provided on this point was insufficient in the context of the present work. Accordingly, for the revision we have added a new analysis of the data on experimental infection of P. leucopus with Borrelia hermsii, which lacks LPS and for which the TLR agonists eliciting inflammation are lipoproteins. We do this in a format (new Table 6) that aids comparison with the LPS experimental data elsewhere in the article. As the manuscript references, B. burgdorferi infection of P. leucopus elicits comparatively little inflammation in blood even at the height of infection. While this phenomenon with the Lyme disease agent was part of the rationale driving these studies, the better comparison with LPS was 5 days into B. hermsii infection when the animals are spirochetemic.

      Statistical significance is binary and p-values should not be used as the primary comparator of groups (e.g. once a p-value crosses the deigned threshold for significance, the magnitude of that p-value no longer provides biological information). For instance, in comparing GO-terms, the reason for using of high p-value cutoffs ("None of these were up-regulated gene GO terms with p values < 1011 for M. musculus.") to compare species is unclear. If the authors wish to compare effect sizes, comparing enrichment between terms that pass a cutoff would likely be the better choice. Similarly, comparing DEG expression by p-value cutoff and effect size is more meaningful than analyses based on exclusively on p-value: "Of the top 100 DEGs for each species by ascending FDR p value." Description in later figures (e.g. Figure 4) is favored.

      Effect sizes--in this case, fold-changes--were taken into account for GO term analysis and were specified in the settings that are described. So, any gene that was “counted” for consideration for a particular GO term would have passed that threshold and with a falsediscovery corrected p value of a specified minimum. There is no further scoring of the “hit” based upon the magnitude of the p value beyond that point. It is, as the reviewer writes, binary at that point. We are in agreement on those principles.

      As we understand the comment above, though, the p-values referred to are in regard to the GO term analysis itself. The objective was discovery followed by inference. The situation was more like a genome-wide association study (GWAS) study. This is not strictly speaking a hypothesis test, because there was no stated hypothesis ahead of time or one driving the design. The “p value” for something like GO term analysis or GWAS provides an estimate of the strength of the association. It is not binary in that sense. The lower the p value, the greater confidence about the association. In a GWAS of a human population an association of a trait with a particular SNP or indel is usually not taken seriously unless the p value is less than 10^-7 or 10^-8. In the case of GO terms, the p value approximates (but is not equivalent to) the number of genes that are differentially expressed that belong to a GO cluster out of the total number of genes that define that cluster. The higher the proportion of the genes in the cluster that are associated with a treatment (LPS vs. saline), the lower the p value. Thus, it provides information beyond the point at which it would be rightly deemed of little additional value in many hypothesis testing circumstances.

      That said, we agree that the original manuscript could have been clearer on this point and have for the revision expanded the description of the GO term analysis in the Methods, including some explanation for a reader on what the p value signifies here. We also refrain from specifying a certain p value for special attention and merely list 20 by ascending p value.

      The ability to use of CD45 to normalize data is unclear. Authors should elaborate both on the use of the method and provide some data how the data change when they are normalized. For instance, do correlations between untreated Mus and Peromyscus gene expression improve? The authors seem to imply this should be a standard for interspecies comparison and so it would be helpful to either provide data to support that or, if applicable, use of the technique in literature should be referenced.

      The reviewer brings up an important point that we considered addressing in more depth for the original manuscript but in the end deferred to considerations about length and left it out.

      But we are glad to address this here, as well as in the revised manuscript.

      We did not intend to imply either that this particular normalization approach had been done before by others or that it “should” be a standard. We are not aware of another report on this, and it would be up to others whether it would be useful or not for them. We made no claim about its utility in another model or circumstance. The challenge before us was to do a comparative analysis of transcription in the blood not just for animals of one species under different conditions but animals of two different genera under different conditions. A notable difference between the animals was in their white blood cell counts, as this study documents. White cells would be the source of a majority of transcripts of potential relevance here, but there would also be mRNA for globins, from reticulocytes, from megakaryocytes, and likely cell-free RNA with origins in various tissues. If the white cell numbers differed, but the non-white cell sources of RNA did not, then there could be unacknowledged biases.

      It would be like comparing two different kinds of tissues and assuming them to be the same in the types and numbers of cells they contained. Four hours after a dose of LPS the liver cells (or brain cells) would differ in their transcriptional profiles from untreated the livers (or brains) of untreated animals for sure, but there would not be much if any change in the numbers of different kinds of cells in the liver (or brain) within 4 hours. The blood can change a lot in composition within that time frame under these same conditions. Some sort of accounting for differing white cell numbers in the blood in different outbred animals of two species seemed to be called for.

      The normalization that was done for the genome-wide analysis was not based on a particular transcript, but instead was based on the total number of reads, the lengths of the reference transcripts, and the distributions of reads matching to the tens of thousands of references for each sample. This was done according to what are standard procedures by now for bulk RNAseq analyses. Because the reference transcript sets for P. leucopus and M. musculus differed in their numbers and completeness of annotation, we did not attempt any cross-species comparison for the same set of genes at that point. That would not be possible because they were not entirely commensurate.

      The GO term analysis of those results provided the leads for the more targeted approach, which was roughly analogous to RT-qPCR. For a targeted assay of this sort, it is common to have a “housekeeping gene” or some other presumably stably transcribed gene for normalization. A commonly used one is Gapdh, but we had previously found that Gapdh was a DEG itself in the blood in P. leucopus and M. musculus at the four hour mark after LPS. The aim was to provide for some adjustment so datasets for blood samples differing in white blood cell counts could be compared. Two options were the 12S ribosomal RNA of the mitochondria, which would be in white cells but not mature erythrocytes, and CD45, which has served an approximately similar function for flow cytometry of the blood. As described in what has been added for the revision and the supplementary materials, we compared these different approaches to normalization. Ptprc and 12S rRNA were effectively interchangeable as the denominator with identifying DEGs of P. leucopus and M. musculus and cross-species comparisons.

      Regarding the ISG data-is a possible conclusion not that Peromyscus don't upregulate the antiviral response because it's already so high in untreated rodents? It seems untreated Peromyscus have ISG expression roughly equivalent to the LPS mice for some of the genes. This could be compared more clearly if genes were displayed as bar plots/box and whisker plots rather than in scatter plots. It is unclear why the linear regression is the key point here rather than normalized differences in expression.

      In answer to the question: yes, that is possible. In the interval between uploading of the manuscript and this revision, we became aware of a study by Gozashti and Hoekstra published this year in Molecular Biology and Evolution (reference 32) and reporting on the “massive invasion” of endogenous retroviruses in P. maniculatus and the defenses deployed in response to achieve silencing. We cite this work and discuss it, including related findings for P. leucopus, in the revision.

      We had originally intended to include box plots as well as scatterplots with regressions for the data, but thought it would be too much and possibly considered redundant. But with this encouragement from the reviewer we provide additional box plots in supplementary materials for the revision.

      Some sections of the discussion are under supported:

      The claim that low inflammation contributes to increased lifespan is stated both in the introduction and discussion. Is there justification to support this? Do aged pathogen-free mice show more inflammation than aged Peromyscus?

      We respectively point out that there was not a claim of this sort. We stated a fact about P. leucopus’ longevity. We made no statement connecting longevity and inflammation beyond the suggestion in the introduction that the explanation(s) for infection tolerance might have some bearing for studies on determinants of life span.

      But the reviewer’s comment prompted further consideration of this aspect of Peromyscus biology. This led eventually to the literature on the naked mole-rat, which seems to be the rodent with the longest known life span and the subject of considerable study. The discussion section of the revision has an added paragraph on some of the similarities of P. leucopus and the naked mole-rat in terms of neutrophils, expression of nitric oxide synthase 2 in response to LPS, and type 1 interferon responses. While this is far from decisive, it does serve to connect some of the dots and, hopefully, is considered at least partially responsive to the reviewer’s question.

      The claim that reduced Peromyscus responsiveness could lead to increased susceptibility to infection is prominently proposed but not supported by any of the literature cited.

      There was not this claim. In fact, it was framed as a question, not a statement. Nevertheless, we think we understand what the comment is getting at and acknowledge in the revision that there may be unexamined circumstances in which P. leucopus may be more vulnerable.

      References to B. burgdorferi, which do not have LPS, in the discussion need to ensure that the reader understands this and the potential that responses could be very different.

      We think we addressed this comment in a response above.

      Reviewer #2:

      1. How were the number of animals for each experiment selected? Was a power analysis conducted?

      A power analysis of any meaning for bulk RNA-seq with tens of thousands of reference transcripts, each with their own variance, and a comparison of animals of two different genera is not straight forward. Furthermore, a specific hypothesis was not being tested. This was a broad, forward screen. But the question about sample sizes is one that deserves more attention than the original manuscript provided. This now provided in added text in two places in Methods ( “RNA-seq” and “Genome-wide different gene expression”) in the revision.

      1. The authors conducted a cursory evaluation of sex differences of P. leucopus and reported no difference in response except for Il6 and Il10 expression being higher in the males than the females in the exposed group. The data was not presented in the manuscript. Nor was sex considered for the other two species. A further discussion of the role that sex could play and future studies would be appreciated.

      We agree that the limited analysis of sex differences and the undocumented remark about Il6 and Il10 expression in females and males warranted correction. For the revision we removed that analysis of targeted RNA-seq of P. leucopus from the two different studies. For this study we were looking for differences that applied to both species. This was the reason that there were equal numbers of females and males in the samples. We agree that further investigation of differences between sexes in their responses is of interest but is probably best left for “future studies”.

      But in revision we do not entirely ignore the question of sex of the animal and provide an additional analysis of the bulk RNA-seq for P. leucopus with regard to differences between females and males. This basically demonstarted an overall commensurability between sexes, at least for the purposes of the GO term analysis and subsequent targeted RNA-seq, but did reveal some exceptions that are candidate genes for those future studies.

      In the revision, we also add for the discussion and its “study limitations” section a disclaimer about possibly missing sex associated differences because the groups were mixed sexes.

      1. The ratio of Nos2 and Arg1 copies for LPS treated and control P. leucopus and M.musculus in Table 3 show that in P. leucopus there is not a significant difference but in M.musculus there is an increase in Nos2 copies with LPS treatment. The authors then used a targeted RNA-seq analysis to show that in P. leucopus the number of Arg1 reads after LPS treatment is significantly higher than the controls. These results are over oversimplified in the text as an inverse relationship for Nos2/Arg1 in the two species.

      We agree. In addition to providing box plots for Arg1 and Nos2, as suggested by Reviewer #1, we also replaced “ratio” in commenting on Arg1 and Nos2, with “differences in Nos2 and Arg1 expresssion” replacing “ratio of Nos2 to Arg1 expression” at one place. At another place we have removed “inverse” with regard to Nos2 and Arg1. But we respectfully decline to remove Nos2/Arg1 from Figure 5 (now Figure 6) or inclusion of Nos2/Arg1 ratios elsewhere. According to our understanding there need not be an inverse relationship for a ratio to have informative value.

      Recommendations For the Authors

      We thank the two reviewers for their constructive recommendations and suggestions, in some case pointing out errors we totally missed. For the great majority, the recommendations were followed. Where we decline or disagree we explain this in the response.

      Reviewer #1 (Recommendations For The Authors):

      • How was the FDR < 0.003 cutoff chosen for DEG? All cutoffs are arbitrary but there should be some justification.

      We agree and have provided the rationale at that point in the paper (before Figure 3) in R2: "For GO term analysis the absolute fold-change criterion was ≥ 2. Because of the ~3-fold greater number of transcripts for the M. musculus reference set than the P. leucopus reference set, application of the same false-discovery rate (FDR) threshold for both datasets would favor the labeling of transcripts as DEGs in P. leucopus. Accordingly, the FDR p values were arbitrarily set at <5 x 10⁻⁵ for P. leucopus and <3 x 10⁻³ for M. musculus to provide approximately the same number of DEGs for P. leucopus (1154 DEGs) and M. musculus (1266 DEGs) for the GO term comparison."

      • It would be helpful to include a figure demonstrating the correlation between CD45 and WBC ("Pearson's continuous and Spearman's ranked correlations between log-transformed total white blood cell counts and normalized reads for Ptprc across 40 animals representing both species, sexes, and treatments were 0.40 (p = 0.01) and 0.34 (p = 0.03), respectively.")

      In both the first version of the revision (R1) and in R2 we provide a fuller explanation of the choice of CD45 (Ptprc) for normalization as detailed in the response to Reviewer #1's public comment. In the revision only Pearson's correlation and p value is given. We did not think another figure was justified after there was additional space devoted to this in both R1 and R2.

      • Unclear what the following paragraph is referring to-is this from the previous paper? Was this experiment introduced somewhere? "Low transcription of Nos2 and high transcription of Arg1 both in controls and LPS-treated P. leucopus was also observed in the experiment where the dose of LPS was 1 µg/g body mass instead of 10 µg/g and the interval between injection and assessment was 12 h instead of 4 h (Table 4)."

      This experiment is described in the Methods in the original and subsequent versions, but we agree that it is not clear whether it was from present study or previous one. Here is the revised text for R2: "Low transcription of Nos2 in both in controls and LPS-treated P. leucopus and an increase in Arg1 with LPS was also observed in another experiment for the present study where the dose of LPS was 1 µg/g body mass instead of 10 µg/g and the interval between injection and assessment was 12 h instead of 4 h (Table 4)."

      • Regarding the differences in IFNy between outbred and BALB/c mice-are there any other RNA-seq datasets you can mine where other inbred mice (B/6, C3H, etc) have been injected with LPS and probed roughly the same amount of time later? Do they look like BALB/c or the outbreds?

      In both the original and R1 and R2 we cite two papers on the difference of BALB/c mice. While this is of interest for follow-up in the future, we did not think additional content on a subject that mainly pertains to M. musculus was warranted here, where the main focus is Peromyscus.

      • Figure 8 and its legend are difficult to follow. The top half of the figure is not well explained and it's unclear what species this is. Decreased use of abbreviations would help. Consider marking each R2 value as Mus or Peromyscus (As done in Fig 9). There are some typographical errors in the legend ("gree," incomplete sentence missing the words LPS or treatment AND Mus: "Co-variation between transcripts for selected PRRs (yellow) and ISGs (gree) in the blood of P. leucopus (P) or (M) with (L") or without (C)."

      This is now Figure 9 in both R1 and R2. We revised it for R1 to include references to the box plots in supplementary materials, but agree with Reviewer #1's recommendation to correct the typos and make the legend less confusing. We did not think that further labeling of the R2 values in the scatterplots with the species names was necessary. The data points are not just colors but also different symbols, so it should be fairly easy for readers to distinguish the regression lines by species. For R2 this is the revised legend with additions in response to the recommendation underlined:

      "Figure 9. Co-variation between transcripts for selected PRRs and ISGs in the blood of P. leucopus (P) or M. musculus (M) with (L) or without (C) LPS treatment. Top panel: matrix of coefficients of determination (R2) for combined P. leucopus and M. musculus data. PRRs are indicated by yellow fill and ISGs by blue fill on horizontal and vertical axes. Shades of green of the matrix cells correspond to R2 values, where cells with values less than 0.30 have white fill and those of 0.90-1.00 have deepest green fill. Bottom panels: scatter plots of log-transformed normalized Mx2 transcripts on Rigi (left), Ifih1 (center), and Gbp4 (right). The linear regression curves are for each species. For the right-lower graph the result from the General Linear Model (GLM) estimate is also given. Values for analysis are in Table S4; box plots for Gbp4, Irf7, Isg15, Mx2, and Oas1 are provided in Figure S6."

      • Discussion section could benefit from editing for clarity. Examples listed: o Unclear what effect is described here "The bacterial infection experiment indicated that the observed effect in P. leucopus was not limited to a TLR4 agonist; the lipoproteins of B. hermsii are agonists for TLR2 (Salazar et al. 2009)."

      Both R1 and R2 include the new section on the B. hermsii infection model. This was added in response to Reviewer #1 public comment. So the expanded consideration of this aspect should address the reviewer's recommendation for more clarity and context here. For R2 we modified the text in the discussion of R1:

      "The analysis here of the B. hermsii infection experiment also indicated that the phenomenon observed in P. leucopus was not limited to a TLR4 agonist."

      o Unclear what the takeaway from this paragraph is: "Reducing the differences between P. leucopus and the murids M. musculus and R. norvegicus to a single all-embracing attribute may be fruitless. But from a perspective that also takes in the 2-3x longer life span of the whitefooted deer mouse compared to the house mouse and the capacity of P. leucopus to serve as disease agent reservoir while maintaining if not increasing its distribution (Moscarella et al. 2019), the feature that seems to best distinguish the deer mouse from either the mouse or rat is its predominantly anti-inflammatory quality. The presentation of this trait likely has a complex, polygenic basis, with environmental (including microbiota) and epigenetic influences. An individual's placement is on a spectrum or, more likely, a landscape rather than in one or another binary or Mendelian category."

      We agree that modification, simplication, and clarification was called for. In response to a public comment of Reviewer #1 we had changed that section, leaving out reference to longevity here. Here is the revised text in both R1 and R2:

      "Reducing differences between P. leucopus and murids M. musculus and R. norvegicus to a single attribute, such as the documented inactivation of the Fcgr1 gene in P. leucopus (7), may be fruitless. But the feature that may best distinguish the deermouse from the mouse and rat is its predominantly anti-inflammatory quality. This characteristic likely has a complex, polygenic basis, with environmental (including microbiota) and epigenetic influences. An individual’s placement is on a spectrum or, more likely, a landscape rather than in one or another binary or Mendelian category."

      Minor comments:

      • Use of blue and red in figures as the -only- way to easily distinguish between groups is a poor choice-both in terms of how inclusivity of color-blind researchers and enabling grayscale printing. Most detrimental in Figure 2, but also slightly problematic in Figure 1. Use of color and shape (as done in other figures) is a much better alternative.

      We agree. Both figures have been modified to include an additional characteristic for denoting the data point. For Figure 1 it is a black filling, and for Figure 2 it is the size of symbol in additon to the color. This should enable accurate visualization by color blind individuals and printing in gray scale. We have added definitions for the symbols within the graph itself, so there is no need to refer to the legend to interpret what they mean.

      • Note the typo where it should read P leucopus: "The differences between P. musculus and M. musculus in the ratios of Nos2/Arg1 and IL12/IL10 were reported before (BalderramaGutierrez et al. 2021),"

      We thank the reviewer for pointing this typo out, which also carried over to R1. It has been corrected for R2.

      • Optional: Can the relationship between the ratios in figure 5 and macrophage "types" be displayed graphically alongside the graphs? It's a little challenging to go back and forth between the text and the figure to try to understand the biological implication.

      We considered something like this but in the end decided that we were not yet comfortable assigning “types” in this fashion for Peromyscus.

      Reviewer #2 (Recommendations For The Authors):

      • Be consistent with nomenclature for your species/treatment groups in the text, figures, and tables. For example, you go back and forth between "P. leucopus" and "deermouse" in the text. And in figures you use "P," "Peromyscus", or "Pero".

      In the Methods section of the original and revisions R1 and R2 we indicate that "deermouse" is synonymous with "Peromyscus leucopus" and "mouse" is synonymous with "Mus musculus" in the context of this paper. We think that some alternation in the terms relieves the text of some of its repetitiveness and that readers should not have a problem with equating one with the other. The use of "deermouse" also reinforces for readers that Peromyscus is not a mouse. With regard to the abbreviations for P. leucopus, those were used to accommodate design and space issues of the figures or tables. In all cases, the abbreviations referred to are defined in the legends of the figures. So, we respectfully decline to follow this recommendation.

      • Often the sentence structure and/or word choice is irregular and makes quick/easy comprehension difficult. Several examples are:

      o The third paragraph of the introduction

      We agree that the first and second sentences are unclear. Here is the revision for R2:

      “As a species native to North America, P. leucopus is an advantageous alternative to the Eurasian-origin house mouse for study of natural variation in populations that are readily accessible (9, 53). A disadvantage for the study of any Peromyscus species is the limited reagents and genetic tools of the sorts that are applied for mouse studies.”

      o The first line after Figure 5 on page 9.

      We agree. The long sentence which we think the reviewer is referring to has been in split into two sentences for R2.

      “An ortholog of Ly6C (13), a protein used for typing mouse monocytes and other white cells, has not been identified in Peromyscus or other Cricetidae family members. Therefore, for this study the comparison with Cd14 is with Cd16 or Fcgr3, which deermice and other cricetines do have.”

      o The sentence that starts "Our attention was drawn to..." on page 14.

      We agree that the sentence was awkward and split into two sentences.

      “Our attention was drawn to ERVs by finding in the genome-wide RNA-seq of LPS-treated and control rats. Two of the three highest scoring DEGs by FDR p value and fold-change were a gagpol polyprotein of a leukemia virus with 131x fold-change from controls and a mouse leukmia virus (MLV) envelope (Env) protein with 62x fold-change (Dryad Table D5).”

      • For figures with multiple panels, use A), B) etc then indicate which panel you are discussing in your text. This is a very data heavy study and your readers can easily get lost.

      We agree and have added pointers in the text to the panels we are referring to. But we prefer to use easily understood descriptors like “left” and “upper” over assigned letters.

      • For all the figures, where are the stats from the t-tests? Why didn't you do a two-way ANOVA? Instead of multiple t-tests?

      Where we are not hypothesis testing and we are able to show all the data points in box-whisker plots with distributions fully revealed, our default position is not to apply significance tests in a post hoc fashion. If a reader or other investigator wants to do this for other purposes, e.g. a meta-analysis, the data is provided in public repository for them to do this. We are not sure what the reviewer means by "multiple t-tests" for "all figures". Where we do 2-tailed t-tests for presentation of data for many genes in a table for the targeted RNA (where individual values cannot shown in the table), there is always correction for multiple testing, as indicated in Methods. The p values shown as "FDR" are after correction.

      • Results paragraph "LPS experiment and hematology studies"

      o List the two species for the first description to orient the reader since you eventually include rat data.

      We agree that this is warranted and followed this recommendation for R2.

      o Not all the mice experienced tachypnea, but the text makes it seem like 100% did.

      We are not sure what the reviewer is referring to here. This is what is in the text on tachypnea: "By the experiment’s termination at 4 h, 8 of 10 M. musculus treated with LPS had tachypnea, while only one of ten LPS-treated P. leucopus displayed this sign of the sepsis state (p = 0.005)." The only other mention of "tachypnea" was in Methods.

      • Figure 1: Why was the M. musculus outlier excluded? Where any other outliers excluded?

      That data point for the mouse was not "excluded" from the graph. It is identified (MM17) for reference with Table 1, and there is the graph for all to see where it is. It was only excluded from the regression curve for control mice. There was no significance testing. There were no other outliers excluded.

      • Figure 3: explain the colors and make the scales the same for all the panels or at least for the upregulated DEGs and the downregulated DEGs.

      We have modified the legend for Figure 3 to include fuller definitions of the x-axes and a description of the color spectrum. We decline to make the x-axis scale the same for all the panels because the horizontal bars in “transcription down” panels would take up only a small fraction of the space. The x-axes are clearly defined and the colors of the bars also indicate the differences in p-values. We doubt that readers will be misled. Here is the revised legend: “Figure 3. Gene Ontology (GO) term clusters associated with up-regulated genes (upper panels) and down-regulated genes (lower panels) of P. leucopus (left panels) and M. musculus (right panels) treated with LPS in comparison with untreated controls of each species. The scale for the x-axes for the panels was determined by the highest -log10 p values in each of the 4 sets. The horizontal bar color, which ranges from white to dark brown through shades of yellow through orange in between, is a schematic representation of the -log10 p values.”

      • Results paragraph "Targeted RNA seq analysis"

      o In the third paragraph, an R2 of 0.75 is not close enough to 1 to call it "~1"

      What the reviewer is referring to is no longer in either R1 and R2, as detailed in the authors' response to public comments.

      o In the 4th paragraph, where are your stats?

      We have replaced terms like "substantially" and "marginally" with simple descriptions of relationships in the graphs.

      "For the LPS-treated animals there was, as expected for this selected set, higher expression of the majority genes and greater heterogeneity among P. leucopus and M. musculus animals in their responses for represented genes. In contrast to the findings with controls, Ifng and Nos2 had higher transcription in treated mice. In deermice the magnitude of difference in the transcription between controls and LPS-treated was less."

      • Figure 4: The colors are hard to see, I suggest making all the up regulated reads one color, the down regulated reads a different color, and the reads that aren't different black or gray.

      This is now Figure 5 in R1 and R2. The selected genes that are highlighted in the panels are denoted not only by color but also by type of symbol. We do not think that readers will have a problem telling one from another even if color blind. The purpose of this figure was to provide an overview and a visual representation with calling out of selected genes, some of which will be evaluated in more detail later. We thought that this was necessary before diving deeper into the data of Table 2. We do not think further discriminating between transcripts in the categorical way that the reviewer suggests is warranted at this point. So, we respectfully decline to follow this suggestion.

      • Results paragraph " Alternatively- activated macrophages...."

      o Include a brief description of Nos2 and Arg1

      We have defined what enzymes these are genes for in R2.

      o How do you explain the lack of a difference in P. leucopus Arg1? Your text says the RT-qPCR confirms the RNA-seq findings.

      There was a difference in P. leucopus Arg1 by RT-qPCR between control and LPS treated by about 3-fold. By both RNA-seq and RT-qPCR Arg1 transcription is higher in P. leucopus than in M. musculus under both conditions. But we have modified the sentence so that does not imply more than what the data and analysis of the table reveal.

      "While we could not type single cells using protein markers, we could assess relative transcription of established indicators of different white cell subpopulations in whole blood. The present study, which incorporated outbred M. musculus instead of an inbred strain, confirmed the previous finding of differences in Nos2 and Arg1 expression between M. musculus and P. leucopus (Figure 5; Table 2). Results similar to the RNA-seq findings were obtained with specific RT-qPCR assays for Nos2 and Arg1 transcripts for P. musculus and M. musculus (Table 3)."

      • Figure 5: reorganize the panels to make the text description and label with letters, where are the stats?

      We thought the figure (now Figure 6) was self-explanatory, but agree that further explanation in the legend was indicated. We prefer to use descriptions of locations (“upper left”) over labels, like “panel C”, which do not obviously indicate the location of the panel. Of course, if the journal’s style mandates the other format we will do so. Our response about “stats” for boxplot figures is the same as what we provided above.

      • Results paragraph "Interferon-gamma and interleukin-1 beta..."

      o Either add the numbers or direct the viewer to where Ifng is in Table 2. The table is very big and Ifng is all the way at the bottom!

      We agree that this table is large, but we thought it better to err on the side of inclusiveness by having a single table, rather than have some genes in the main article and other results in a supplementary table. We thought that it would make it easier for reviewers and readers to find a gene of interest, but we also acknowledge the challenge to locate the genes we highlight. We follow for R2 that reviewer's recommendation to provide some guidance for readers trying to locate a featured gene by pointing relative locations. While adding a column of numbers to already complex table seems more than what is called for, we are depositing an Excel spreadsheet of the table at the Dryad repository to facilitate searching by an interested reader for a particular gene.

      • Figure 6: stats? The pink and red are hard to easily distinguish from each other. I also suggest not using red and green together for color blind readers.

      With regard to the box-plots and significance testing, please see response above to an earlier recommendation. We have removed an interpretative adjective (i.e. "marked") from the description of the graph. Different symbols as well as colors are used, so we do not think that this will pose a problem for readers, even those with complete red-green color blindness. For what it’s worth, with regard to the "red" and "pink" issue, according to the figure on our displays the colors of the two symbols appear to be red and purple. They are also applied to different species and different conditions for those species.

      • Figure 8: In the legend it says "... PRRs (yellow) and ISGs (gree)" which is a typo, but don't you mean blue not green anyways?

      See response above to Reviewer #1's recommendation. This has been corrected.

    1. Author Response

      Reviewer #1 (Public Review):

      Summary: The authors investigated the function of Microrchidia (MORC) proteins in the human malaria parasite Plasmodium falciparum. Recognizing MORC's implication in DNA compaction and gene silencing across diverse species, the study aimed to explore the influence of PfMORC on transcriptional regulation, life cycle progression and survival of the malaria parasite. Depletion of PfMORC leads to the collapse of heterochromatin and thus to the killing of the parasite. The potential regulatory role of PfMORC in the survival of the parasite suggests that it may be central to the development of new antimalarial strategies.

      Strengths: The application of the cutting-edge CRISPR/Cas9 genome editing tool, combined with other molecular and genomic approaches, provides a robust methodology. Comprehensive ChIP-seq experiments indicate PfMORC's interaction with sub-telomeric areas and genes tied to antigenic variation, suggesting its pivotal role in stage transition. The incorporation of Hi-C studies is noteworthy, enabling the visualization of changes in chromatin conformation in response to PfMORC knockdown.

      We greatly appreciate the overall positive feedback . Our application of CRISPR/Cas9 genome editing tools coupled with complementary cellular and functional approaches shed light on the importance ofPfMORC in maintaining chromatin structural integrity in the parasite and highlight this protein as a promising target for novel therapeutic intervention.

      Weaknesses: Although disruption of PfMORC affects chromatin architecture and stage-specific gene expression, determining a direct cause-effect relationship requires further investigation.

      Our conclusions were made on the basis of multiple, unbiased molecular and functional assays that point to the relevance of the PfMORC protein in maintaining the parasite’s chromatin landscape. Although we do not claim to have precise evidence on the step-by-step pathway to which PfMORC is involved, we bring forth first-hand evidence of its overall function in heterochromatin binding and gene-regulation, its association with major TF regulatory players, and essentiality for parasite survival. We however agree with the comment regarding the lack of direct effects of PfMORC KD and will provide additional evidence by performing ChIP-seq experiments against additional histone marks in WT and PfMORC KD lines.

      Furthermore, while numerous interacting partners have been identified, their validation is critical and understanding their role in directing MORC to its targets or in influencing the chromatin compaction activities of MORC is essential for further clarification. In addition, the authors should adjust their conclusions in the manuscript to more accurately represent the multifaceted functions of MORC in the parasite.

      We do agree with the reviewer's comment. Validation of the identified interacting partners is critical and most likely essential to understanding their role in directing MORC to its targets. However, our protein pull down experiments have been done using biological replicates. Several of the interacting partners have also been identified and published by other labs. A direct comparison of our work together with previous published work will be incorporated in a revised version of the manuscript to further validate the identified interacting partners and the accuracy of the data we obtained in this manuscript. Molecular validation of all proteins identified in our protein may take a few more years and will be submitted for publication in futur manuscripts.

      Reviewer #2 (Public Review):

      Summary: This paper, titled "Regulation of Chromatin Accessibility and Transcriptional Repression by PfMORC Protein in Plasmodium falciparum," delves into the PfMORC protein's role during the intra-erythrocytic cycle of the malaria parasite, P. falciparum. Le Roch et al. examined PfMORC's interactions with proteins, its genomic distribution in different parasite life stages (rings, trophozoites, schizonts), and the transcriptome's response to PfMORC depletion. They conducted a chromatin conformation capture on PfMORC-depleted parasites and observed significant alterations. Furthermore, they demonstrated that PfMORC depletion is lethal to the parasite.

      Strengths: This study significantly advances our understanding of PfMORC's role in establishing heterochromatin. The direct consequences of the PfMORC depletion are addressed using chromatin conformation capture.

      We appreciate the Reviewer’s comments and reflection on the importance of our work.

      Weaknesses: The study only partially addressed the direct effects of PfMORC depletion on other heterochromatin markers.

      Here again, we agree with the reviewer’s comment and intend to perform additional experiments to delve deeper into the multifaceted roles of PfMORC. We have begun to explore the effects of PfMORC depletion on heterochromatin marks using ChIP-seq experiments at distinct stages of parasite development. We hope our new results will shed light on the direct implications of PfMORC in heterochromatin regulation.

    1. Author Response:

      We would like to thank you very much for handling and reviewing our manuscript so carefully and to be so positive about our work. We are indeed grateful about these very concise and constructive reviews as well as about the Editorial Assessment. We basically agree with all reviewers' comments. Besides addressing all formal suggestions, we also decided to do some more experiments.

      The main concern, the role of the transcription factor NF-YA1 during rhizobial infections, is indeed an absolut valid one. While the CDEL system has its beauties it certainly has its limitations as well. Thus, we will try to assess the role of NF-YA1 during symbiotic infections in Medicago more specifically. We will place NF-YA1 expression under the control of infection-specific promoters to limit pleiotropic effects of ectopic over-expression and assess rhizobial infections as well as cell cycle patterns in tranformed hairy roots producing the H3.1/H3.3 marker. Infection-inducible promoters will also be used to drive the ectopic expression of CYCD3;1 on the cortical infection thread trajectory to locally increase mitotic cycles, in order to test the functional importance of cell cycle exit on cortical infections.

      We hope that we will be able to conclude more firmly on NF-YA1 function prior to locking the version of record and to deliver these experiments in a time frame of about 4-6 months, which is the minimum time we need for cloning the respective constructs, doing all hairy root transformations in sufficient numbers and quantitative microscopy.

    1. Author Response:

      Reviewer #1 (Public Review):

      [...] Overall the manuscript is well written, and the successful generation of the new endogenous Cac tags (Td-Tomato, Halo) and CaBeta, stj, and stolid genes with V5 tags will be powerful reagents for the field to enable new studies on calcium channels in synaptic structure, function, and plasticity. There are also some interesting, though not entirely unexpected, findings regarding how Brp and homeostatic plasticity modulate calcium channel abundance. However, a major concern is that the conclusions about how "molecular and organization diversity generate functional synaptic heterogeneity" are not really supported by the data presented in this study. In particular, the key fact that frames this study is that Cac levels are similar at Ib and Is active zones, but that Pr is higher at Is over Ib (which was previously known). While Pr can be influenced by myriad processes, the authors should have first assessed presynaptic calcium influx - if they had, they would have better framed the key questions in this study. As the authors reference from previous studies, calcium influx is at least two-fold higher per active zone at Is over Ib, and the authors likely know that this difference is more than sufficient to explain the difference in Pr at Is over Ib. Hence, there is no reason to invoke differences in "molecular and organization diversity" to explain the difference in Pr, and the authors offer no data to support that the differences in active zone structure at Is vs Ib are necessary for the differences in Pr. Indeed, the real question the authors should have investigated is why there are such differences in presynaptic calcium influx at Is over Ib despite having similar levels/abundance of Cac. This seems the real question, and is all that is needed to explain the Pr differences shown in Fig. 1. The other changes in active zone structure and organization at Is vs Ib may very well contribute to additional differences in Pr, but the authors have not shown this in the present study, and rely on other studies (such as calcium-SV coupling at Is vs Ib) to support an argument that is not necessitated by their data. At the end of this manuscript, the authors have found an interesting possibility that Stj levels are reduced at Is vs Ib, that might perhaps contribute to the difference in calcium influx. However, at present this remains speculative.

      Overall, the authors have generated powerful reagents for the field to study calcium channels and how they are regulated, but draw conclusions about active zone structure and organization contributing to functional heterogeneity that are not strongly supported by the data presented.

      Reviewer 1 raises an interesting question that we agree will form the basis of important studies. Here, we set out to address a different question, which we will work to better frame. While we and others had previously found a strong correlation between calcium channel abundance and synaptic release probability (Pr (Akbergenova et al., 2018; Gratz et al., 2019; Holderith et al., 2012; Nakamura et al., 2015; Sheng et al., 2012)), more recent studies found that calcium channel abundance does not necessarily predict synaptic strength (Aldahabi et al., 2022; Rebola et al., 2019). Our study explores this paradox and presents findings that provide an explanation: calcium channel abundance predicts Pr among individual synapses of either low-Pr type-Ib or high-Pr type-Is inputs where modulating channel number tunes synaptic strength, but does not predict Pr between the two inputs, indicating an inputspecific role for calcium channel abundance in promoting synaptic strength. Thus, we propose that calcium channel abundance predictably modulates synaptic strength among individual synapses of a single input or synapse subtype, which share similar molecular and spatial organization, but not between distinct inputs where the underlying organization of active zones differs. Consistently, in the mouse, calcium channel abundance correlates strongly with release probability specifically when assessed among homogeneous populations of connections (Aldahabi et al., 2022; Holderith et al., 2012; Nakamura et al., 2015; Rebola et al., 2019; Sheng et al., 2012).

      As Reviewer 1 notes, the two-fold difference in calcium influx at type-Is synapses is certainly an important difference underlying three-fold higher Pr. However, growing evidence indicates that calcium influx alone, like calcium channel abundance, does not reliably predict synaptic strength between inputs. For example, Rebola et al. (2019) compared cerebellar synapses formed by granule and stellate cells and found that lower Pr granule synapses exhibit both higher calcium channel abundance and calcium influx. In another example, Aldahabi et al. (2023) demonstrate that even when calcium influx is greater at high-Pr synapses, it does not necessarily explain differences in synaptic strength between inputs. Studying excitatory hippocampal CA1 synapses onto distinct interneuronal targets, they found that raising calcium entry at low-Pr inputs to high-Pr synapse levels is not sufficient to increase synaptic strength to high-Pr synapse levels. Similarly, at the Drosophila NMJ, the finding that type-Ib synapses exhibit loose calcium channel-synaptic vesicle coupling whereas type-Is synapses exhibit tight coupling suggests factors beyond calcium influx also contribute to differences in Pr between the two inputs (He et al., 2023). Consistently, a two-fold increase in external calcium does not induce a three-fold increase in release at low-Pr type-Ib synapses (He et al., 2023). Thus, upon finding that calcium channel abundance is similar at type-Ib and -Is synapses, we focused on identifying differences beyond calcium channel abundance and calcium influx that might contribute their distinct synaptic strengths. We agree that these studies, ours included, cannot definitively determine the contribution of identified organizational differences to distinct release probabilities because it is not currently possible to specifically alter subsynaptic organization, and will ensure that our language is tempered accordingly. However, in addition to the studies cited above and our findings, recent work demonstrating that homeostatic potentiation of neurotransmitter release is accompanied by greater spatial compaction of multiple active zone proteins (Dannhauser et al., 2022; Mrestani et al., 2021) and decreased calcium channel mobility (Ghelani et al., 2023) provide support for the interpretation that subsynaptic organization is a key parameter for modulating Pr.

      Reviewer #2 (Public Review):

      The authors aim to investigate how voltage-gated calcium channel number, organization, and subunit composition lead to changes in synaptic activity at tonic and phasic motor neuron terminals, or type Is and Ib motor neurons in Drosophila. These neuron subtypes generate widely different physiological outputs, and many investigations have sought to understand the molecular underpinnings responsible for these differences. Additionally, these authors explore not only static differences that exist during the third-instar larval stage of development but also use a pharmacological approach to induce homeostatic plasticity to explore how these neuronal subtypes dynamically change the structural composition and organization of key synaptic proteins contributing to physiological plasticity. The Drosophila neuromuscular junction (NMJ) is glutamatergic, the main excitatory neurotransmitter in the human brain, so these findings not only expand our understanding of the molecular and physiological mechanisms responsible for differences in motor neuron subtype activity but also contribute to our understanding of how the human brain and nervous system functions.

      The authors employ state-of-the-art tools and techniques such as single-molecule localization microscopy 3D STORM and create several novel transgenic animals using CRISPR to expand the molecular tools available for exploration of synaptic biology that will be of wide interest to the field. Additionally, the authors use a robust set of experimental approaches from active zone level resolution functional imaging from live preparations to electrophysiology and immunohistochemical analyses to explore and test their hypotheses. All data appear to be robustly acquired and analyzed using appropriate methodology. The authors make important advancements to our understanding of how the different motor neuron subtypes, phasic and tonic-like, exhibit widely varying electrical output despite the neuromuscular junctions having similar ultrastructural composition in the proteins of interest, voltage gated calcium channel cacophony (cac) and the scaffold protein Bruchpilot (brp). The authors reveal the ratio of brp:cac appears to be a critical determinant of release probability (Pr), and in particular, the packing density of VGCCs and availability of brp. Importantly, the authors demonstrate a brp-dependent increase in VGCC density following acute philanthotoxin perfusion (glutamate receptor inhibitor). This VGCC increase appears to be largely responsible for the presynaptic homeostatic plasticity (PHP) observable at the Drosophila NMJ. Lastly, the authors created several novel CRISPRtagged transgenic lines to visualize the spatial localization of VGCC subunits in Drosophila. Two of these lines, CaBV5-C and stjV5-N, express in motor neurons and in the nervous system, localize at the NMJ, and most strikingly, strongly correlate with Pr at tonic and phasic-like terminals.

      1) The few limitations in this study could be addressed with some commentary, a few minor follow-up analyses, or experiments. The authors use a postsynaptically expressed calcium indicator (mhcGal4>UAS -GCaMP) to calculate Pr, yet do not explore the contribution that glutamate receptors, or other postsynaptic contributors (e.g. components of the postsynaptic density, PSD) may contribute. A previous publication exploring tonic vs phasic-like activity at the drosophila NMJ revealed a dynamic role for GluRII (Aponte-Santiago et al, 2020). Could the speed of GluR accumulation account for differences between neuron subtypes?

      We did observe that GCaMP signals are higher at type Is synapses, where synapses tend to form later but GluRs accumulate more rapidly upon innervation (Aponte-Santiago et al., 2020). However, because we are using our GCaMP indicator as a plus/minus readout of synaptic vesicle release at mature synapses, we do not expect differences in GluR accumulation to have a significant effect on our measures. Consistently, the difference in Pr we observe between type-Ib and -Is inputs (Fig. 1C) is similar to that previously reported (He et al., 2023; Lu et al., 2016; Newman et al., 2022).

      2) The observation that calcium channel density and brp:cac ratio as a critical determinant of Pr is an important one. However, it is surprising that this was not observed in previous investigations of cac intensity (of which there are many). Is this purely a technical limitation of other investigations, or are other possibilities feasible? Additionally, regarding VGCC-SV coupling, the authors conclude that this packing density increases their proximity to SVs and contributes to the steeper relationship between VGCCs and Pr at phasic type Is. Is it possible that brp or other AZ components could account for these differences. The authors possess the tools to address this directly by labeling vesicles with JanellaFluor646; a stronger signal should be present at Is boutons. Additionally, many different studies have used transmission electron microscopy to explore SVs location to AZs (t-bars) at the Drosophila NMJ.

      To date, the molecular underpinnings of heterogeneity in synaptic strength have primarily been investigated among individual type-Ib synapses. However, a recent study investigating differences between type-Ib and -Is synapses also found that the Cac:Brp ratio is higher at type-Is synapses (He et al., 2023).

      At this point, we do not know which active zone components are responsible for the organizational (Figs. 1, 2) and coupling (now demonstrated by He et al., 2023) differences between type-Ib and -Is synapses or what establishes the differences in active zone protein levels we observe (Figs. 3,6), although Brp likely plays a local role. We find that Brp is required for dynamically regulating calcium channel levels during homeostatic plasticity and plays distinct roles at type-Ib and -Is synapses (Figs. 3, 4). Brp regulates a number of proteins critical for the distribution of docked synaptic vesicles near T bars of type Ib active zones, including Unc13 (Bohme et al., 2016). Extending these studies to type-Is synapses will be of great interest.

      3) In reference to the contradictory observations that VGCC intensity does not always correlate with, or determine Pr. Previous investigations have also observed other AZ proteins or interactors (e.g. synaptotagmin mutants) critically control release, even when the correlation between cac and release remains constant while Pr dramatically precipitates.

      This is an important point as a number of molecular and organizational differences between high- and low-Pr synapses certainly contribute to baseline functional differences. The other proteins we (Figs. 3,6) and others (Dannhauser et al., 2022; Ehmann et al., 2014; He et al., 2023; Jetti et al., 2023; Mrestani et al., 2021; Newman et al., 2022) have investigated are less abundant and/or more densely organized at type-Is synapses. Investigating additional active zone proteins, including synaptic proteins, and determining how these factors combine to yield increased synaptic strength are important next steps.

      4) To confirm the observations that lower brp levels results in a significantly higher cac:brp ratio at phasic-like synapses by organizing VGCCs; this argument could be made stronger by analyzing their existing data. By selecting a population of AZs in Ib boutons that endogenously express normal cac and lower brp levels, the Pr from these should be higher than those from within that population, but comparable to Is Pr. I believe the authors should also be able to correlate the cac:brp ratio with Pr from their data set generally; to determine if a strong correlation exists beyond their observation for cac correlation.

      We do not have simultaneous measures of Pr and Cac and Brp abundance. However, our findings suggest that distinct Cac:Brp ratios at type Ib and Is inputs reflect underlying organizational differences that contribute to distinct release probabilities between the two synaptic subtypes. In contrast, within either synaptic subtype, release probability is positively correlated with both Cac and Brp levels. Thus, the mechanisms driving functional differences between synaptic subtypes are distinct from those driving functional heterogeneity within a subtype, so we do not expect Cac:Brp ratio to correlate with Pr among individual type-Ib synapses. We will work to clarify this point in the revised text.

      5) For the philanthotoxin induced changes in cac and brp localization underlying PHP, why do the authors not show cac accumulation after PhTx on live dissected preparations (i.e. in real time)? This also be an excellent opportunity to validate their brp:cac theory. Do the authors observe a dynamic change in brp:cac after 1, or 5 minutes; do Is boutons potentiate stronger due to proportional increases in cac and brp? Also regarding PhTx-induced PHP, their observations that stj and α2δ-3 are more abundant at Is synapses, suggests that they may also play a role in PhTx induced changes in cac. If either/both are overexpressed during PhTx, brp should increase while cac remains constant. These accessory proteins may determine cac incorporation at AZs.

      As we have previously followed Cac accumulation in live dissected preparations and found that levels increase proportionally across individual synapses (Gratz et al., 2019), we did not attempt to repeat these challenging experiments at smaller type-Is synapses. We will reanalyze our data to investigate Cac:Brp ratio at individual active zones post PhTx. However, as noted above, we do not expect changes in the Cac:Brp ratio to correlate with Pr among individual synapses of single inputs as this measure reflects organization differences between inputs and PhTx induces an increase in the abundance of both proteins at both inputs.

      Determining the effect of PhTx on Stj levels at type-Ib and -Is active zones is an excellent idea and might provide insight into how lower Stj levels correlate with higher Pr at type-Is synapses. While prior studies have demonstrated critical roles for Stj in regulating Cac accumulation during development and in promoting presynaptic homeostatic potentiation (Cunningham et al., 2022; Dickman et al., 2008; Kurshan et al., 2009; Ly et al., 2008; Wang et al., 2016), its regulation during PHP has not been investigated.

      Taken together this study generates important data-driven, conceptional, and theoretical advancements in our understanding of the molecular underpinnings of different motor neurons, and our understanding of synaptic biology generally. The data are robust, thoroughly analyzed, appropriately depicted. This study not only generates novel findings but also generated novel molecular tools which will aid future investigations and investigators progress in this field.

      References

      Akbergenova, Y., K.L. Cunningham, Y.V. Zhang, S. Weiss, and J.T. Littleton. 2018. Characterization of developmental and molecular factors underlying release heterogeneity at Drosophila synapses. eLife. 7.

      Aldahabi, M., F. Balint, N. Holderith, A. Lorincz, M. Reva, and Z. Nusser. 2022. Different priming states of synaptic vesicles underlie distinct release probabilities at hippocampal excitatory synapses. Neuron. 110:4144-4161 e4147.

      Aponte-Santiago, N.A., K.G. Ormerod, Y. Akbergenova, and J.T. Littleton. 2020. Synaptic Plasticity Induced by Differential Manipulation of Tonic and Phasic Motoneurons in Drosophila. The Journal of neuroscience : the official journal of the Society for Neuroscience. 40:6270-6288.

      Bohme, M.A., C. Beis, S. Reddy-Alla, E. Reynolds, M.M. Mampell, A.T. Grasskamp, J. Lutzkendorf, D.D. Bergeron, J.H. Driller, H. Babikir, F. Gottfert, I.M. Robinson, C.J. O'Kane, S.W. Hell, M.C. Wahl, U. Stelzl, B. Loll, A.M. Walter, and S.J. Sigrist. 2016. Active zone scaffolds differentially accumulate Unc13 isoforms to tune Ca(2+) channel-vesicle coupling. Nature neuroscience. 19:1311-1320.

      Cunningham, K.L., C.W. Sauvola, S. Tavana, and J.T. Littleton. 2022. Regulation of presynaptic Ca(2+) channel abundance at active zones through a balance of delivery and turnover. Elife. 11.

      Dannhauser, S., A. Mrestani, F. Gundelach, M. Pauli, F. Komma, P. Kollmannsberger, M. Sauer, M. Heckmann, and M.M. Paul. 2022. Endogenous tagging of Unc-13 reveals nanoscale reorganization at active zones during presynaptic homeostatic potentiation. Front Cell Neurosci. 16:1074304.

      Dickman, D.K., P.T. Kurshan, and T.L. Schwarz. 2008. Mutations in a Drosophila alpha2delta voltagegated calcium channel subunit reveal a crucial synaptic function. The Journal of neuroscience : the official journal of the Society for Neuroscience. 28:31-38.

      Ehmann, N., S. Van De Linde, A. Alon, D. Ljaschenko, X.Z. Keung, T. Holm, A. Rings, A. Diantonio, S. Hallermann, U. Ashery, M. Heckmann, M. Sauer, and R.J. Kittel. 2014. Quantitative super-resolution imaging of Bruchpilot distinguishes active zone states. Nature Communications. 5.

      Ghelani, T., M. Escher, U. Thomas, K. Esch, J. Lützkendorf, H. Depner, M. Maglione, P. Parutto, S. Gratz, T. Matkovic-Rachid, S. Ryglewski, A.M. Walter, D. Holcman, K. O‘Connor Giles, M. Heine, and S.J. Sigrist. 2023. Interactive nanocluster compaction of the ELKS scaffold and Cacophony Ca<sup>2+</sup> channels drives sustained active zone potentiation. Science Advances. 9:eade7804.

      Gratz, S.J., P. Goel, J.J. Bruckner, R.X. Hernandez, K. Khateeb, G.T. Macleod, D. Dickman, and K.M. O'Connor-Giles. 2019. Endogenous tagging reveals differential regulation of Ca<sup>2+</sup> channels at single AZs during presynaptic homeostatic potentiation and depression. The Journal of Neuroscience:3068-3018.

      He, K., Y. Han, X. Li, R.X. Hernandez, D.V. Riboul, T. Feghhi, K.A. Justs, O. Mahneva, S. Perry, G.T. Macleod, and D. Dickman. 2023. Physiologic and Nanoscale Distinctions Define Glutamatergic Synapses in Tonic vs Phasic Neurons. The Journal of neuroscience : the official journal of the Society for Neuroscience. 43:4598-4611.

      Holderith, N., A. Lorincz, G. Katona, B. Rózsa, A. Kulik, M. Watanabe, and Z. Nusser. 2012. Release probability of hippocampal glutamatergic terminals scales with the size of the active zone. Nature neuroscience. 15:988-997.

      Jetti, S.K., A.B. Crane, Y. Akbergenova, N.A. Aponte-Santiago, K.L. Cunningham, C.A. Whittaker, and J.T. Littleton. 2023. Molecular Logic of Synaptic Diversity Between Drosophila Tonic and Phasic Motoneurons. bioRxiv:2023.2001.2017.524447.

      Kurshan, P.T., A. Oztan, and T.L. Schwarz. 2009. Presynaptic alpha2delta-3 is required for synaptic morphogenesis independent of its Ca2+-channel functions. Nature neuroscience. 12:1415-1423.

      Lu, Z., A.K. Chouhan, J.A. Borycz, Z. Lu, A.J. Rossano, K.L. Brain, Y. Zhou, I.A. Meinertzhagen, and G.T. Macleod. 2016. High-Probability Neurotransmitter Release Sites Represent an Energy-Efficient Design. Current biology : CB. 26:2562-2571.

      Ly , C.V., C.-K. Yao , P. Verstreken , T. Ohyama , and H.J. Bellen 2008. straightjacket is required for the synaptic stabilization of cacophony, a voltage-gated calcium channel α1 subunit. Journal of Cell Biology. 181:157-170.

      Mrestani, A., M. Pauli, P. Kollmannsberger, F. Repp, R.J. Kittel, J. Eilers, S. Doose, M. Sauer, A.-L. Sirén, M. Heckmann, and M.M. Paul. 2021. Active zone compaction correlates with presynaptic homeostatic potentiation. Cell Reports. 37:109770.

      Nakamura, Y., H. Harada, N. Kamasawa, K. Matsui, Jason S. Rothman, R. Shigemoto, R.A. Silver, David A. DiGregorio, and T. Takahashi. 2015. Nanoscale Distribution of Presynaptic Ca2+ Channels and Its Impact on Vesicular Release during Development. Neuron. 85:145-158.

      Newman, Z.L., D. Bakshinskaya, R. Schultz, S.J. Kenny, S. Moon, K. Aghi, C. Stanley, N. Marnani, R. Li, J. Bleier, K. Xu, and E.Y. Isacoff. 2022. Determinants of synapse diversity revealed by superresolution quantal transmission and active zone imaging. Nature Communications. 13:229.

      Rebola, N., M. Reva, T. Kirizs, M. Szoboszlay, A. Lőrincz, G. Moneron, Z. Nusser, and D.A. Digregorio. 2019. Distinct Nanoscale Calcium Channel and Synaptic Vesicle Topographies Contribute to the Diversity of Synaptic Function. Neuron. 104:693-710.e699.

      Sheng, J., L. He, H. Zheng, L. Xue, F. Luo, W. Shin, T. Sun, T. Kuner, D.T. Yue, and L.-G. Wu. 2012. Calcium-channel number critically influences synaptic strength and plasticity at the active zone. Nature neuroscience. 15:998-1006.

      Wang, T., R.T. Jones, J.M. Whippen, and G.W. Davis. 2016. alpha2delta-3 Is Required for Rapid Transsynaptic Homeostatic Signaling. Cell Rep. 16:2875-2888.

    1. Author Response:

      We sincerely appreciate the recognition from both reviewers regarding the innovative gradual activity-blocking design employing NBQX, as well as the robustness of our approach that integrates experimental and computational approaches to investigate the interplay between homeostatic functional and structural plasticity in response to activity deprivation.

      Acknowledging the raised concerns and insightful advice shared by the reviewers, we provide the the following provisional response:

      Why did we focus on activity silencing? Our decision to focus on chronic activity deprivation stems from a robust body of evidence—summarised in the recent review by Moulin and colleagues (2022)—that highlights the consistent occurrence of homeostatic spine loss alongside synaptic downscaling in response to prolonged excitation. In contrast, chronic silencing studies, as outlined in the same review, exhibit inconsistencies and contradictions, with spine loss often manifesting as non-homeostatic. After carefully reviewing the available data, we formulated two hypotheses to account for this heterogeneity: (i) the non-linear nature of activity-dependent structural plasticity, and (ii) the intricate interplay between homeostatic synaptic scaling and structural plasticity influenced by factors such as the extend of activity deprivation, specific dendritic segments, cell phenotypes, brain regions, and even across species. The intricate exploration of these hypotheses necessitated a systematic approach through computational simulations (and suitable experiments). The present manuscript intentionally confines the discussion of heightened activity to a proof-of-concept computer simulation, underscoring our deliberate emphasis on the central theme of activity silencing. Nevertheless, we do concur with the reviewers that an intriguing avenue for future exploration lies in extending the model to encompass homeostatic synaptic downscaling triggered by augmented activity.

      Why did we choose NBQX and why didn't we extensively characterise it? We utilised NBQX, a competitive antagonist targeting AMPA receptors, enabling us to finely modulate network activity via dosages (as elucidated by Wrathall et al., 2007), surpassing the control attainable with TTX. Despite its atypical role in studying homeostatic synaptic plasticity, NBQX boasts commendable efficacy in regulating network activity, substantiated by our electrophysiological recordings as well as in vivo and in vitro studies (Follett et al., 2000; Wrathall et al., 2007). However, it's worth noting that NBQX selectively binds to GluA2-containing AMPA receptors, pivotal for TTX-triggered synaptic scaling (Gainey et al., 2009) and glutamate-induced spine protrusion in the presence of TTX (Richards et al., 2005). Importantly, there's no conclusive evidence suggesting that NBQX, when applied in isolation (without TTX), hinders the synthesis or insertion of AMPA receptors. While we acknowledge the interest and value in characterising NBQX separately, such an endeavour extends beyond the immediate scope of our current study.

      It's pertinent to also note that the models we employed—activity (calcium) dependent homeostatic synaptic scaling and structural plasticity—are inherently phenomenological in nature. In essence, these models refrain from delving into intricate molecular mechanisms beyond the regulation of calcium concentration by firing rates. Given the highly phenomenological nature of our models, introducing a detailed molecular characterization of NBQX, or expanding into a chronic increase in network activity scenarios targeting different molecular pathways, could potentially create misleading expectations among our readers, implying a level of molecular pathway implementation that is not our immediate focus.

      Did the model successfully replicate the experimental findings? Achieving a strong agreement between computer simulations and empirical data is often a sought-after outcome, particularly when both aspects are integrated within a single study. However, this congruence is not always the primary intent. In our present investigation, we introduced three distinct ways in which experimental data merged with computational studies: to provide informative input, to validate hypotheses, and to stimulate novel ideas.

      Our experiments primarily aimed to inform the computational model through an analysis of spine density. The computational framework was envisioned to yield insights that could be broadly applicable, extending beyond the mere replication of conducted experiments. In this context, our modelling outcomes effectively mirrored the heterogeneous alterations in synapse numbers observed in various in vivo and in vitro studies following activity deprivation—ranging from homeostatic increases to non-homeostatic synapse loss.

      Our model also proposed a plausible mechanism illustrating how synaptic scaling might propel the transition from non-homeostatic synapse loss to the restoration of synapse levels, achieved by maximising inputs from active spines. This supposition found partial confirmation when considering both our experimentally obtained spine sizes and those detailed in the existing literature—pointing to a reduction in spine numbers but a conservation of larger spine sizes during complete activity blockade.

      Moreover, our experimental observations unveiled certain aspects that, while not entirely encompassed by our model, have the potential to inspire future modelling studies. For instance, we observed size-dependent changes in spine sizes under complete activity blockade; we also observed inconsistent combinations of spine density and size changes across dendritic segments upon activity deprivation. The prospect of reconfiguring the interplay between structural plasticity and synaptic scaling rules to elucidate the observed heterogeneity in outcomes stands as an intriguing avenue worth revisiting, particularly as the modelling of structural plasticity within a network of intricately detailed neurons becomes feasible.

      In summary, while the aspiration to faithfully replicate experimental outcomes exists, achieving an exact correspondence between a purposefully simplified system, like the point neural network we employed in our study, and real-world data should be approached with caution. Striving for such a match carries the risk of overfitting and prematurely advancing conclusions that might not stand the test of broader applications.

      Why did we establish strict definitions for functional and structural plasticity? The rationale behind this strategic decision lies in the historical breadth of the term "structural plasticity," encompassing a wide array of high-dimensional alterations in neural morphology throughout development and adulthood. This expansive interpretation contributed to the delayed development of computational models specifically targeting structural plasticity. Moreover, certain elements, like spine sizes, blur the boundaries with the functional facet of synapses as also mentioned by the reviewers. We hope the reviewers and readers concur with our perspective that implementing structural plasticity through the manipulation of synapse numbers—effectively enabling dynamic (re)wiring—provides a high degree of freedom and robustness. Synaptic size seamlessly translates into synaptic weights within the modelling framework. While the distinction between synaptic weight and synapse number may seem stringent, it meticulously prepares the groundwork for addressing a fundamental question: How does the gradual modification of synapse numbers, juxtaposed with the swift modulation of synaptic weights, interact within a perpetually evolving dynamic system? In this respect our study serves as a panoramic vista, unveiling possibilities wherein distinct combinations of these two governing principles can engender divergent outcomes. This contribution not only stands as a benchmark but also extends a welcoming embrace to forthcoming structural plasticity models that embrace the concept of continuous size and number alterations.

    1. Author Response

      The following is the authors’ response to the original reviews.

      Reviewer #1 (Public Review):

      The manuscript describes an interesting experiment in which an animal had to judge a duration of an interval and press one of two levers depending on the duration. The Authors recorded activity of neurons in key areas of the basal ganglia (SNr and striatum), and noticed that they can be divided into 4 types.

      The data presented in the manuscript is very rich and interesting, however, I am not convinced by the interpretation of these data proposed in the paper. The Authors focus on neurons of types 1 & 2 and propose that their difference encodes the choice the animal makes. However, I would like to offer an alternative interpretation of the data. Looking at the description of task and animal movements seen in Figure 1, it seems to me that there are 4 main "actions" the animals may do in the task: press right lever, press left lever, move left, and move right. It seems to me that the 4 neurons authors observed may correspond to these actions, i.e. Figure 1 shows that Type 1 neurons decrease when right level becomes more likely to be correct, so their decrease may correspond to preparation of pressing right lever - they may be releasing this action from inhibition (analogously Type 2 neurons may be related to pressing left lever). Furthermore, comparing animal movements and timing of activity of neurons of type 3 and 4, it seems to me that type 3 neurons decrease when the animal moves left, while type 4 when the animal moves right.

      I suggest Authors analyse if this interpretation is valid, and if so, revise the interpretation in the paper and the model accordingly.

      We thank the reviewer for the general appreciation of the study. Regarding to the interpretation of each SNr subtypes, we have compared firing activities of the same SNr neurons in both standard 2-8 s task and reversed 2-8 s task (Figure 2G-R, Figure S4). Type 1 and Type 2 neurons are related to right and left choices respectively in the standard task (Figure 2G, M, N), and this is even more evident in the reversed 2-8 s task (Figure 2J), because when the movement trajectories of the same mice in 8-s trials were reversed from left-then-right in the control task (Figure 2I) to right-then-left in the reversed task (Figure 2L), the Type 1 SNr neurons which showed monotonic decreasing dynamics in the control 2-8 s task (Figure 2M) reversed their neuronal dynamics to a monotonic increase in the reversed 2-8 s task (Figure 2P). The same reversal of neuronal dynamics was also observed in Type 2 SNr neurons in the reversed version of standard task (Figure 2N vs Figure 2Q). Therefore, Type 1 and Type 2 neurons are related to the action selection. Furthermore, Type 3 and Type 4 SNr neurons exhibiting transient change when mice switching either from left to right, or from left to right maintained the same neuronal dynamics in both standard 2-8 s task and reversed 2-8 s task (Figure S4C-F), indicating that Type 3 and Type 4 neurons are related to the switch between choices but not the specific upcoming choice to be made.

      Reviewer #1 (Recommendations For The Authors):

      Suggest to clarify if SNr neurons recorded just from a single hemisphere or bilaterally.

      We have described the recording hemisphere in our Methods (page 46, lines 974-976) as follows “For striatum recording, we implanted 11 mice in the left hemisphere and 8 mice in the right hemisphere. For the SNr recording, we implanted 5 mice in the left hemisphere and 4 mice in the right hemisphere.”

      Suggest to analyse if type 1/2/3/4 neurons are preferrably located in hemispheres contra/ipsi lateral to a particular lever or movement.

      We have addressed this issue in Figure S3 and Figure S6. In fact, we have implanted electrodes in both left and right hemispheres with mirror M-L coordinates. For striatum recording, we implanted 11 mice in the left hemisphere and 8 mice in the right hemisphere. For the SNr recording, we implanted 5 mice in the left hemisphere and 4 mice in the right hemisphere. We have analyzed the striatal and SNr neuronal activity in left vs. right hemisphere respectively, in relation to action selection. We found that SNr neurons recorded in either left or right hemisphere exhibited the same four types of neural dynamics with similar proportions (Fig. S3). Specially, the Type 1 neurons are dominant in both hemispheres. Similar in striatum, SPNs from left and right hemispheres showed the same four types of neural dynamics with similar proportions (Fig. S6). Therefore, there is no significant difference between hemispheres regarding to the proportion of neuron subtypes.

      Suggest to investigate if type 1/2 neurons are involved in preparation for lever press, please investigate if these neurons are also changing their activity during the lever press.

      In Figure S1L, we have showed the neuronal activities of example Type 1 and Type 2 SNr neurons to rewarded and non-rewarded lever presses. Type 1 SNr neuron shows higher firing activities when pressing the left lever than pressing the right lever, whereas Type 2 SNr neuron shows higher firing activities when pressing the right lever than pressing the left lever, indicating that Type 1 and Type 2 neurons firing activities are action choice dependent.

      Suggest investigating if Type 3/4 neurons are controlling movement from one location to another, please analyse if their activity is correlated with the movement on trial by trial bases.

      In Figure S2C-D, we showed firing activities of example Type 3 and Type 4 neurons on trial-by-trial bases. Type 3 neuron showed increased firing activities between 3-4 s during the 8s lever retraction period when the animal switched from left side to right side, whereas Type 4 neuron showed decreased firing activities between 3-4 s during as the animal switching from left to right. We further showed in Figure S4C-F, Type 3 and Type 4 neurons Type 3 and Type 4 neurons are related to the switch between choices but not the specific upcoming choice to be made.

      Suggest also performing analogous analyses for striatal neurons.

      We showed 4 types of SPNs on the on trial-by-trial bases as follows. Due to the limitation of the number of figures, these data were not included in the manuscript. We have now included these results in Fig. S2(E-H).

      Typo: l. 68: "can bidirectionally regulates" -> "can bidirectionally regulate"

      Thanks, we have now corrected the typos.

      Reviewer #2 (Public Review):

      In this valuable manuscript Li & Jin record from the substantial nigra and dorsal striatum to identify subpopulations of neurons with activity that reflects different dynamics during action selection, and then use optogenetics in transgenic mice to selectively inhibit or excite D1- and D2- expressing spiny projection neurons in the striatum, demonstrating a causal role for each in action selection in an opposing manner. They argue that their findings cannot be explained by current models and propose a new 'triple control' model instead, with one direct and two indirect pathways. These findings will be of broad interest to neuroscientists, but lacks some direct evidence for the proposal of the new model.

      Overall there are many strengths to this manuscript including the fact that the empirical data in this manuscript is thorough and the experiments are well-designed. The model is well thought through, but I do have some remaining questions and issues with it.

      Weaknesses:

      1) The nature of 'action selection' as described in this manuscript is a bit ambiguous and implies a level of cognition or choice which I'm not sure is there. It's not integral to the understanding of the paper really, but I would have liked to know whether the actions are under goal-directed/habitual or even Pavlovian control. This is not really possible to differentiate with this task as there are a number of Pavlovian cues (e.g. lever retraction interval, house light offset) that could be used to guide behavior.

      Sorry for the confusion of task description in the manuscript. We appreciate reviewer’s deep understanding about the complexity of the 2-8 s task we designed. Indeed, the 2-8 s task can’t be simply categorized as goal-directed/habitual or Pavlovian task. There are several behavioral aspects in this task. Lever retraction is served as a Pavlovian cue for mice to start performing the left-then-right sequential movement, but once levers are retracted, there is no cue available to mice during the lever retraction period, and mice have to make a decision to switch choice solely based on its internal estimation of the passage of time, which is considered as a cognitive process. The house light stays on for the entire training session (2 – 3 hours), and will be turned off when the task is done, so house light will not be used as a guidance for choice behavior. The behavior and neural activities during the lever retraction period is our main focus in this manuscript. The main advantage of such task design is that the animal is engaged in a self-determined, dynamic switch of action selection process, which offers a unique opportunity for investigating the role of various neuronal populations in the basal ganglia pathways during action selection.

      2) In a similar manner, the part of the striatum that is being targeted (e.g. Figures 4E,I, and N) is dorsal, but is central with regards to the mediolateral extent. We know that the function of different striatal compartments is highly heterogeneous with regards to action selection (e.g. PMID: 16045504, 16153716, 11312310) so it would have been nice to have some data showing how specific these findings are to this particular part of dorsal striatum.

      We thank the reviewer for bringing up this point. We are targeting dorsal-central part of striatum. In Figure S5G-L, we showed the specific location we targeted in striatum. Also as specified in Methods (lines 965-970), the craniotomies for electrode implantation were made at the following coordinates: 0.5 mm rostral to bregma and 1.5 mm laterally, and ~ 2.2 mm from the surface of the brain for dorsal striatum. For the virus injection and optic fiber implantation (lines 997-998), the craniotomies was made bilaterally at 0.5 mm rostral to bregma, 2 mm laterally and ~ 2.2 mm from the surface of the brain.

      3) I'm not sure how I feel about the diagrams in Figure 4S. In particular, the co-activation model is shown with D2-SPNs represented as a + sign (which is described as "having a facilitatory effect to selection" in the caption), but the co-activation model still suggests that D2-SPNs are largely inhibitory - just of competing actions rather than directly inhibiting actions. Moreover, I am not sure about these diagrams because they appear to show that D2-SPNs far outnumbers D1-SPNs and we know that this isn't the case. I realize the diagrams are not proportionate, but it still looks a bit misrepresented to me.

      We appreciate the reviewer’s comments about the diagram. We borrowed and extended the “center-surround” layout from the receptive field of neurons in the early visual system, as an intuitive analogy in describing the functional interaction among striatal pathways (also see Mink 2003 Archives of Neurology). In the co-activation model, if D2-SPNs inhibit the competing action, then the target action will be more likely to be selected due to the reduced competition, which means D2-SPNs actually facilitate the target action in an indirect way. And this is why we define the effect of D2-SPNs in the co-activation model as facilitatory. The area of each region does not represent the amount of cells but mainly qualitative functional role. To make it clearer, we have now added more explanation in the manuscript (page 17, lines 338-341).

      4). There are a number of grammatical and syntax errors that made the manuscript difficult to understand in places.

      We have now gone through the text carefully and corrected the typos.

      5) I wondered if the authors had read PMID: 32001651 and 33215609 which propose a quite different interpretation of direct/indirect pathway neurons in striatum in action selection. I wonder if the authors considered how their findings might fit within this framework.

      We appreciate the reviewer’s comments and suggestion. Miriam Matamales et al. (2020, PMID: 32001651) found that dynamic D2- to D1-SPNs transmodulation across the striatum that is necessary for updating previously learned behavior, which highlights the importance of collateral modulations between D1- and D2-SPNs as an additional layer of behavior control besides the classic direct and indirect pathways. This finding is compatible with our “Triple control” model emphasizing the influence of collateral modulations within striatum on behavior choice. James Peak et al. (2020, PMID: 33215609) demonstrated that D2-SPNs are critical to maintain the flexibility of behavior, which is reflected in our “Triple-control” model that activation of D2-SPNs could trigger the behavioral switch from the current action to another action. Although the two studies mentioned above mainly investigate the roles of striatal D1- and D2-SPNs in action learning and behavioral strategies, their functions in general fit within our new ‘Triple-control’ model of basal ganglia pathways for action selection.

      6) There is no direct evidence of two indirect pathways, although perhaps this is beyond the scope of the current manuscript and is a prediction for future studies to test.

      As accumulating RNA-seq and physiological data implying the heterogeneity of D2-SPNs, the further investigation of the subtypes of D1- and D2-SPNs and their functionality are likely a direction the field will continue to explore. On the other hand, we have discussed other possible anatomical circuits within basal ganglia circuitry that could fulfill the functional role of a third pathway in our new ‘Triple-control’ model, together with or independent of the second indirect pathway (page 32-33, lines 689-700). We certainly hope that our new model will inspire future work to identify and dissect the additional functional pathways in the basal ganglia circuits for action control.

      Reviewer #2 (Recommendations For The Authors):

      Suggestions for authors:

      1) Consider how specific to the dorso-central striatum these findings are, possibly in the discussion.

      We have specified in the Discussion that the study is targeting dorsal-central part of striatum (page 29, lines 609-612).

      2) Modify the diagrams in 4S to make them more representative of the model's features.

      We have responded this comment above.

      3) Consider whether the findings here might fit within the role for direct pathway in excitatory action-outcome learning and the indirect pathway in response flexibility more generally.

      The current study is mainly focus on selection and execution of actions. It will definitely be important to continue exploring the functionality of direct vs. indirect pathways in the action learning process.

      4) Correct typos and grammatical errors including (but not limited to):

      a) Line 62-64 - explain why this is controversial? Is it because we don't know which one applies?

      In the “Go/No-go” model, indirect pathway inhibits the desired action and function as gain modulation, while in the “Co-activation” model, indirect pathway inhibits the competing action and in turn facilitates the desired action in an indirect manner, therefore these two existing models disagree with each other on the explanation the function of indirect pathway in its targeting action and the net outcome of behavior.

      b) Line 68 - Regulates should be regulate.

      This has been corrected in the revised manuscript.

      c) Line 86 - should read "there are neuronal populations in either the direct or indirect pathway that are activated..."

      This has been corrected in the revised manuscript.

      d) Line 146-147 - "these types of neuronal dynamics in Snr only appeared in the correct but not incorrect trials" - It seems the authors are suggesting this only for Types 1 and 2 neurons, but this confused me the first time I read it and I suggest it is made clearer.

      Line 146-147 now reads “These four types of neuronal dynamics in SNr only appeared…”

      e) Line 346 - significant should be significantly.

      This has been corrected in the revised manuscript.

      f) Line 360 "contrast" should be "contrasting".

      This has been corrected in the revised manuscript.

    1. Author Response

      The following is the authors’ response to the original reviews.

      We thank the reviewers for their positive remarks. We have addressed the reviewers’ recommendations in the point-by-point response below to improve our revised manuscript.

      Reviewer #1 (Recommendations For The Authors):

      1. The authors carry out their HDX-MS work on Prestin (and SLC26A9) solubilized in glycol-diosgenin. The authors should carefully rationalize their choice of detergent and discuss how their key findings are also pertinent to the native state of Prestin when residing in an actual phospholipid bilayer. More native membrane mimetic models are available, for instance, nano-discs etc. While I am not insisting that the authors have to repeat their measurements in a more native membrane system, it would be a very nice control experiment, and in any case, a detailed discussion of the limitations of the approach taken and possible caveats should be included - possibly with additional references to other studies.

      Response: We have added a paragraph rationalizing the choice of detergent in lines 174-176. We have also added requested HDX data comparing prestin reconstituted in nanodisc to prestin solubilized in micelle (Fig 5). The HDX for prestin under these two membrane mimetics were indistinguishable, including the anion-binding site, suggesting that our major findings are likely pertinent to prestin residing in a lipid bilayer. The only major HDX difference we observed was that a lipid-facing helix TM6 is more dynamic for prestin in nanodisc compared to in micelles. In our previous structural studies, we identified TM6 as the “eletromotile elbow” that is important for prestin’s mechanical expansion (Bavi et al., Nature, 2021). We are currently conducting a more thorough investigation to understand the role of TM6 in prestin’s electromotility.

      1. As far as I understand, the HEPES state represents the apo-state and thus assumes that HEPES does not bind to Prestin - the authors should support this assumption or include a discussion of the possible effect of HEPES on Prestin. Also, the HEPES state has fewer time-points - this should also be discussed.

      Response: We have included a discussion of the possible effects of HEPES in lines 331-345. In fact, in an attempt to support our assumption that HEPES does not bind to prestin, we set out to determine the structure of prestin in the HEPES-based buffer using single particle cryo-EM. However, we did not find evidence that HEPES binds to prestin. Details are discussed in lines 331-345 and Supporting Information Text 3.

      We employed a denser sampling of HDX labeling times for prestin in Cl- because it is critical for fitting and ∆G calculation. The earlier time points are used mainly to evaluate the dynamics of the less stable cytosolic domain. Since the cytosolic domain does not directly participate in prestin’s voltage-sensing mechanism and electromotility, we only measured the HEPES states with longer time points which mainly probe the dynamics of the transmembrane domain.

      1. Overall, the HDX-MS data provided and the statistical analysis done is in my view sufficiently detailed and well done - the authors are advised to make reference to and include a HDX Summary table and HDX Data Table according to the HDX-MS community-guidelines (Masson et al. Nature Methods 2019).

      Response: An HDX summary table was provided in Table S1 and referred in lines 81 and 388. We have included a reference to Masson et al., Nature Methods, 2019, in line 389.

      1. Figure 5 - I like the detailed analysis of the helix folding - but in my experience, one can provide a great fit of many HDX curves to a 4 -term exponential function - I think the authors would need more time-points to provide a more convincing case. But it does provide a compelling theory - even if the data strictly does not prove it. The authors should discuss this in more detail - including limitations etc.

      Response: We presented a statistical analysis describing the accuracy of the fitting in Fig 6A. We acknowledge that the values of the exponentials may not be precisely determined, but the fundamental result is robust – TM3 exchanges through fraying from the N-terminal end of the helix while TM6 exchanges much more cooperatively. Collecting additional time points may reduce the error on the rates but would not contribute to additional mechanistic insights.

      Reviewer #2 (Recommendations For The Authors):

      1. I suggest toning down more speculative/ hypothetical aspects. Specifically, I believe that the following sentence should not be in the abstract in its present form: "This event shortens the TM3-TM10 electrostatic gap, thereby connecting the two helices such that TM3-anion-TM10 is pushed upwards by forces from the electric field, resulting in reduced cross-sectional area."

      Response: The sentence has been rephrased.

      1. The "nuance" between helix fraying and helix unfolding is an important aspect of the author's hypothesis but this should be explained better. In that regard, have the authors performed HDX-MS analysis of the mutant P136T? That would nicely support their claim regarding the importance of helix fraying as being foundational to allow electromotility.

      Response: More explanation for helix fraying and unfolding has been provided in the main text. We have not performed HDX-MS analysis of the mutant P136T. However, we performed molecular dynamics simulations using Upside, and consistently, showed that a P136T mutation in prestin results in a highly stabilized TM3 (Fig. S4B).

      1. Why do measurements at two pDs? Did the authors observe any differences?

      Response: The purpose of two pDs is to increase the effective dynamic range of the HDX measurement by two orders of magnitude because the intrinsic exchange rate scales with pD & Temp. This allows us to determine the stability of both the highly and minimally stable regions within the protein. We have rephrased lines 83-87 to better rationalize this choice of pDs. With the time points performed in this study, we did not observe noticeable differences for HDX performed under the two pDs when corrected for the changes in the intrinsic rates (Fig. S7A).

      1. I can't help but wonder what is the interest in doing HDX-MS measurements after 27h of incubation. Membrane proteins are known for their instability once purified and a few odd HDX profiles at that specific timepoint (especially in the 80-100 residues area) make one question whether local unfolding preceding aggregation could happen. This actually weakens the author's claims about cooperative unfolding and localized and directional helix fraying. Could they provide some evidence (CD, thermostability measurements such as trp fluorescence quenching, or SEC analysis) that the prestin is still folded after 27h in GDN.

      Response: We appreciate reviewer’s comments on membrane proteins can be unstable once purified. In our system, we did not observe evidence of unfolding or aggregation caused by long-term incubation after purification. This is mostly supported by the fact that our HDX reactions were initiated and injected to MS in random order, yet are still highly reproducible among biological and technical replicates. A specific example included HDX on freshly purified SLC26A9 gave the same deuteration levels as SLC26A9 purified in GDN after 4 days. For prestin, although we don’t have direct comparison between fresh samples and old samples (24-27h post-purification) due to the lack of samples, 30s HDX in SO42- performed 24h post-purification gave a %D that fell between 10s and 90s of labeling done on fresh sample. Additionally, HDX on prestin in Cl- performed on freshly purified sample gave the sample %D as prestin in the presence of 1M urea labeled after 24~48h of purification, suggesting that prestin is relatively resistant to aggregation at least within 48h after purification even in the presence of 1 M urea (data not shown).

      Furthermore, the HDX for prestin in nanodisc are essentially identical to prestin in micelles except for a functionally important helix (TM6), suggesting minimal aggregation or misfolding.

      We think the “a few odd HDX profiles” at 27h time points for residues 80-100 are caused by two reasons. Firstly, TM1 unfolds cooperatively and its stability in HEPES falls within the detection range when long labeling time points were employed (within one log unit of 27h). Secondly, we observed two non-interconverting and structurally distinct populations for TM1 (Supporting Information Text 1 & Fig. S8), and in long labeling times, the two isotope distributions merge and sometimes can skew the %D calculations. Nevertheless, the HDX differences we observed comparing across conditions are clear and such %D calculation skewing, if present, should be minimal and does not change our main conclusions.

    1. Author Response

      Reviewer #1 (Public Review):

      Summary:

      This work describes the mechanism of protein disaggregation by the ClpL AAA+ protein of Listeria monocytogenes. Using several model substrate proteins the authors first show that ClpL possesses a robust disaggregase activity that does not further require the endogenous DnaK chaperone in vitro. In addition, they found that ClpL is more thermostable than the endogenous L. monocytogenes DnaK and has the capacity to unfold tightly folded protein domains. The mechanistic basis for the robust disaggregase activity of ClpL was also dissected in vitro and in some cases, supported by in vivo data performed in chaperone-deficient E. coli strains. The data presented show that the two AAA domains, the pore-2 site and the N-terminal domain (NTD) of ClpL are critical for its disaggregase activity. Remarkably, grafting the NTD of ClpL to ClpB converted ClpB into an autonomous disaggregase, highlighting the importance of such a domain in the DnaK-independent disaggregation of proteins. The role of the ClpL NTD domain was further dissected, identifying key residues and positions necessary for aggregate recognition and disaggregation. Finally, using sets of SEC and negative staining EM experiments combined with conditional covalent linkages and disaggregation assays the authors found that ClpL shows significant structural plasticity, forming dynamic hexameric and heptameric active single rings that can further form higher assembly states via their middle domains.

      Strengths:

      The manuscript is well-written and the experimental work is well executed. It contains a robust and complete set of in vitro data that push further our knowledge of such important disaggregases. It shows the importance of the atypical ClpL N-terminal domain in the disaggregation process as well as the structural malleability of such AAA+ proteins. More generally, this work expands our knowledge of heat resistance in bacterial pathogens.

      Weaknesses:

      There is no specific weakness in this work, although it would have helped to have a drawing model showing how ClpL performs protein disaggregation based on their new findings. The function of the higher assembly states of ClpL remains unresolved and will need further extensive research. Similarly, it will be interesting in the future to see whether the sole function of the plasmid-encoded ClpL is to cope with general protein aggregates under heat stress.

      We thank the reviewer for the positive evaluation. We agree with the reviewer that it will be important to test whether ClpL can bind to and process non-aggregated protein substrates. Our preliminary analysis suggests that the disaggregation activity of ClpL is most relevant in vivo, pointing to protein aggregates as main target.

      We also agree that the role of dimers or tetramers of ClpL rings needs to be further explored. Our initial analysis suggests a function of ring dimers as a resting state. It will now be important to study the dynamics of ClpL assembly formation and test whether substrate presence shifts ClpL assemblies towards an active, single ring state.

      Reviewer #2 (Public Review):

      The manuscript by Bohl et al. is an interesting and carefully done study on the biochemical properties and mode of action of potent autonomous AAA+ disaggregase ClpL from Listeria monocytogenes. ClpL is encoded on plasmids. It shows high thermal stability and provides Listeria monocytogenes food-pathogen substantial increase in resistance to heat. The authors show that ClpL interacts with aggregated proteins through the aromatic residues present in its N-terminal domain and subsequently unfolds proteins from aggregates translocating polypeptide chains through the central pore in its oligomeric ring structure. The structure of ClpL oligomers was also investigated in the manuscript. The results suggest that mono-ring structure and not dimer or trimer of rings, observed in addition to mono-ring structures under EM, is an active species of disaggregase.

      Presented experiments are conclusive and well-controlled. Several mutants were created to analyze the importance of a particular ClpL domain.

      The study's strength lies in the direct comparison of ClpL biochemical properties with autonomous ClpG disaggregase present in selected Gram-negative bacteria and well-studied E. coli system consisting of ClpB disaggregase and DnaK and its cochaperones. This puts the obtained results in a broader context.

      We thank the reviewer for the detailed comments. There are no specific weaknesses indicated in the public review.

      Reviewer #3 (Public Review):

      Summary:

      This manuscript details the characterization of ClpL from L. monocytogenes as a potent and autonomous AAA+ disaggregase. The authors demonstrate that ClpL has potent and DnaK-independent disaggregase activity towards a variety of aggregated model substrates and that this disaggregase activity appears to be greater than that observed with the canonical DnaK/ClpB co-chaperone. Furthermore, Lm ClpL appears to have greater thermostability as compared to Lm DnaK, suggesting that ClpL-expressing cells may be able to withstand more severe heat stress conditions. Interestingly, Lm ClpP can provide thermotolerance to E. coli that have been genetically depleted of either ClpB or in cells expressing a mutant DnaK103. The authors further characterized the mechanisms by which ClpL interacts with protein aggregates, identifying that the N-terminal domain of ClpL is essential for disaggregase function. Lastly, by EM and mutagenesis analysis, the authors report that ClpL can exist in a variety of larger macromolecular complexes, including dimer or trimers of hexamers/heptamers, and they provide evidence that the N-terminal domains of ClpL prevent dimer ring formation, thus promoting an active and substrate-binding ClpL complex. Throughout this manuscript the authors compare Lm ClpL to ClpG, another potent and autonomous disaggregase found in gram-negative bacteria that have been reported on previously, demonstrating that these two enzymes share homologous activity and qualities. Taken together this report clearly establishes ClpL as a novel and autonomous disaggregase.

      Strengths:

      The work presented in this report amounts to a significant body of novel and significant work that will be of interest to the protein chaperone community. Furthermore, by providing examples of how ClpL can provide in vivo thermotolerance to both E. coli and L. gasseri the authors have expanded the significance of this work and provided novel insight into potential mechanisms responsible for thermotolerance in food-borne pathogens.

      Weaknesses:

      The figures are clearly depicted and easy to understand, though some of the axis labeling is a bit misleading or confusing and may warrant revision. While I do feel that the results and discussion as presented support the authors' hypothesis and overall goal of demonstrating ClpL as a novel disaggregase, interpretation of the data is hindered as no statistical tests are provided throughout the manuscript. Because of this only qualitative analysis can be made, and as such many of the concluding statements involving pairwise comparisons need to be revisited or quantitative data with stats needs to be provided. The addition of statistical analysis is critical and should not be difficult, nor do I anticipate that it will change the conclusions of this report.
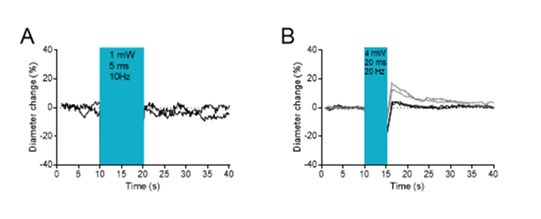
      We thank the reviewer for the valid criticism. We addressed the major concern of the reviewer and added the requested statistical analysis to all relevant figures. The analysis confirms our conclusions. We also followed the advice of the reviewer and revised axis labeling to increase clarity.

    1. Author Response

      The following is the authors’ response to the original reviews.

      Public Reviews:

      Reviewer #1 (Public Review):

      Anderson, Henikoff, Ahmad et al. performed a series of genomics assays to study Drosophila spermatogenesis. Their main approaches include (1) Using two different genetic mutants that arrest male germ cell differentiation at distinct stages, bam and aly mutant, they performed CUT&TAG using H3K4me2, a histone modification for active promoters and enhancers; (2) Using FACS sorted pure spermatocytes, they performed CUT&TAG using antibodies against RNA PolII phosphorylated Ser 2, H4K16ac, H3K9me2, H3K27me3, and ubH2AK118. They also compare these chromatin profiling results with the published single-cell and single-nucleus RNA-seq data. Their analyses are across the genome but the major conclusions are about the chromatin features of the sex chromosomes. For example, the X chromosome is lack of dosage compensation as well as inactivation in spermatocytes, while Y chromosome is activated but enriched with ubH2A in spermatocytes. Overall, this work provides high-quality epigenome data in testes and in purified germ cells. The analyses are very informative to understand and appreciate the dramatic chromatin structure change during spermatogenesis in Drosophila. Some new analyses and a few new experiments are suggested here, which hopefully further take advantage of these data sets and make some results more conclusive.

      Major comments: 1. The step-wise accumulation of H3K4me2 in bam, aly and wt testes are interesting. Is it possible to analyse the cis-acting sequences of different groups of genes with distinct H3K4me2 features, in order to examine whether there is any shared motif(s), suggesting common trans-factors that potentially set up the chromatin state for activating gene expression in a sequential manner?

      While the histone H3K4me2 mark is low and more widespread at genes active in late spermatocytes and in spermatids (shown in Figure 2C and some examples in Figure 1C-D), we suggest that this may be due to a general decrease in the importance of this modification in late spermatogenesis rather than a specific feature of those genes. We point this out in lines 146-152. This idea is supported by the widespread change in RNAPII distribution in all genes in the germline, shown in Figure 3F and supplementary Figure 2.

      1. Pg. 4, line 141-142: "we cannot measure H3K4me2 modification at the bam promoter in bam mutant testes or at the aly promoter in aly mutant testes", what are the allelic features of the bam mutant and aly mutant? Are the molecular features of these mutations preventing the detection of H3K4me2 at the endogenous genes' promoters? Also, the references cited (Chen et al., 2011) and (Laktionov et al., 2018) are not the original research papers where these two mutants were characterized.

      We have corrected these citations to the original papers. We clarified in the text that the bamΔ86 allele is a deletion of almost all of the coding sequence (reported in Bopp, D., Horabin, J.I., Lersch, R.A., Cline, T.W., Schedl, P. (1993). Expression of the Sex-lethal gene is controlled at multiple levels during Drosophila oogenesis. Development 118(3): 797--812.). The aly1 allele is also a P element-induced mutation; it is not molecularly characterized (it was first described here: Lin, T.Y., Viswanathan, S., Wood, C., Wilson, P.G., Wolf, N., Fuller, M.T. (1996). Coordinate developmental control of the meiotic cell cycle and spermatid differentiation in Drosophila males. Development 122(4): 1331--1341.) We noticed a lack of reads for various histone modifications in aly mutants in part of the gene, suggesting that the deletion is limited to the promoter and the first exon. Signal for the H3K4me2 modification is at background levels for the distal portion of aly, suggesting that the deletion inactivates the gene.

      1. The original paper that reported the Pc-GFP line and its localization is: Chromosoma 108, 83 (1999).

      We are citing the first published description of this marker in the male germline (lines 291-293).

      The Pc-GFP is ubiquitously expressed and almost present in all cell types. In Figure 6B, there is no Pc-GFP signals in bam and aly mutant cells.

      We apologize, our labeling of the figure was easily overlooked - the bam and aly genotypes do not carry the PcGFP marker, since we didn’t need it for staging the germline nuclei. We have clarified this in the figure.

      According to the Method "one testis was dissected", does it mean that only one testis was prepared for immunostaining and imaging? If so, definitely more samples should be used for a more confident conclusion.

      We corrected the text to make it clear that all cytological examinations were repeated at least times (lines 438-439).

      Also, why use 3rd instar larval testes instead of adult testes?

      Generally, we find that immunostaining of the larval testes is cleaner, and we now mention this in the Methods (lines 439-440). We have immunostained both larval and adult testes for these markers with consistent results.

      Finally, it is better to compare fixed tissue and live tissue, as the Pc-GFP signal could be lost during fixation and washing steps. Please refer to the above paper [Chromosoma 108, 83 (1999)] for Pc-GFP in spermatogonial cells and Development 138, 2441-2450 (2011) for Pc-GFP localization in aly mutant.

      We are using PcGFP staining for staging with antibody detection of other chromatin features, which requires fixed material, although we have compared PcGFP signal in both live and fixed tissue. We have added the 1999 reference for nuclear staging in the male germline.

      1. Ubiquitinylation of histone H2A is typically associated with gene silencing, here it has been hypothesized that ubH2A contributes to the activation of Y chromosome. This conclusion is strenuous, as it entirely depends on correlative results.

      We agree that this is a correlation. We cite in the text examples where uH2A is associated with gene activation. We have added a comment to clarify that this is a correlation (lines 318-320), and now present an alternative that uH2A on the Y chromosome may be moderating expression from these highly active genes (lines 405-407).

      For example, the lack of co-localization of ubH2A immunostaining and Pc-GFP are not convincing evidence that ubH2A is not resulting from PRC1 dRing activity. It would be a lot stronger conclusion by using genetic tools to show this. For example, if dRing is knocked down (using RNAi driven by a late-stage germline driver such as bam-Gal4) or mutated in spermatocytes (using mitotic clonal analysis), would they detect changes of ubH2A levels?

      We have tested multiple constructs to knockdown dRING using the bam-GAL4 driver although we have not reported it in the manuscript. These knockdowns have no effect on uH2A staining in the testis, on motile sperm production, or on male fertility, although these RNAi constructs do produce Polycomb phenotypes when expressed in somatic cells from an en-GAL4 driver. This is the reason why we point out in the text that there are multiple alternative candidates for an H2A ubiquitin ligase in the Drosophila genome and that in other species RING1 is not responsible for sex body uH2A in the male germline (lines 394-396).

      1. Regarding "X chromosome of males is thought to be upregulated in early germline cells", it has been shown that male-biased genes are deprived on the X chromosome [Science 299:697-700 (2003); Genome Biol 5:R40 (2004); Nature 450:238-241 (2007)], so are the differentiation genes of spermatogenesis [Cell Research 20:763-783 (2010)]. It would be informative to discuss the X chromatin features identified in this work with these previous findings.

      We now mention that the Drosophila X chromosome is moderately depleted of male germline-expressed genes (lines 362-363).

      For example, the lack of RNAPII on X chromosome in spermatocytes could be due to a few differentiation genes expressed in spermatocytes located on the X chromosome.

      We show in Figure 3B that there is a minor non-significant reduction in RNAPII on the X chromosome in spermatocytes. This small reduction might be due to the moderate paucity of male germline-expressed genes on this chromosome, but since it is non-significant we have not discussed it.

      Reviewer #2 (Public Review):

      Anderson et al profiled chromatin features, including active chromatin marks, RNA polymerase II distribution, and histone modifications in the sex chromosomes of spermatogenic cells in Drosophila. The results are new and the experiments and analyses look well done, including with appropriate numbers of replicates. Results were parsed by comparing them among two arrest mutants and wildtype, as well as in FACS-sorted spermatocytes. The authors also profiled larval wing discs to serve as reference-somatic cells, which allowed them to focus only on features in their testis data that were associated with germ cells. Their results were further refined by categorizing the genes of interest based on available single nucleus RNA seq expression profiles. The authors document interesting phenomena, such as differences in the distribution of RNAPIIS2p on some genes in germ cells vs somatic cells, the presence of a uH2A body beginning in early spermatocytes, and high levels of uH2A on the Y chromosome and little or none on the X. The former is intriguing because this modification is usually associated with silencing, yet the Y chromosome is active in spermatogenic cells. The authors interpret some of their data as implying a lack of dosage compensation of the X chromosome in spermatocytes.

      The data are believable and new, but it is not fully clear how to interpret them. The paper's interpretations rely on subtractive logic to parse results from mixtures of cells down to cell type, extracting spermatogonia, spermatocyte, etc. features by comparing bam mutants (only spermatogonia) to aly mutants (spermatogonia and early spermatocytes but no later stages) to wildtype (all spermatogenic stages), and extracting testis germline data by comparison to wing disc soma; their FACS sorted spermatocytes also have heterogeneity. I recognize that the present paper was a lot of work and am not suggesting that the authors redo their study using methods that give more purity and precision of stage (https://doi.org/10.1126/science.aal3096, https://doi.org/10.1101/gad.335331.119), but they should be aware of them and of their results.

      The pulse-release system that the reviewer points to is an interesting system, but more limited in material and in useable markers than the systems we used here. We have added to our discussion of the the limitations of subtractive comparisons between arrest genotypes, both in regards to using mutants that may alter gene expression programs, and to how subtractive comparisons may limit our detection of differences between cell types (lines 143-147).

      The conclusions about dosage compensation are indirect, but are consistent with the current model documented in the studies cited by the authors, as well as earlier studies (doi: 10.1186/jbiol30).

      We disagree; our data directly speaks to the molecular mechanisms at play. Our profiling of the H4K16acetylation mark and RNAPII in isolated spermatocytes (Figure 4) demonstrates that current models are correct, and so are useful for settling this point in the literature.

      Reviewer #1 (Recommendations For The Authors):

      Throughout the manuscript, it is better to cite the original research papers.

      We have added citations for the original characterizations of bam and aly alleles used, for the descriptions of PCGFP in spermatocytes, and for issues raised by reviewer comments.

      Minor comments:

      Pg.2, line 70-71: "Germline stem cells at the apical tip of the testis asymmetrically divide to birth spermatogonia", should be gonialblast.

      Fixed (line 71).

      Pg.2, line 71: "four rapid mitotic divisions", the spermatogonial cell cycle lasts several hours-- "rapid" is subjective and relative, better to leave this word out.

      Fixed (line 71).

      Reviewer #2 (Recommendations For The Authors):

      Other than the major issue raised in the public review this paper only needs a few minor modifications, listed by line number below. The first one would be considered essential by this reviewer.

      27: In the sentence that ends on this line, please add the word testis after Drosophila.

      Fixed (line 27).

      119: It must be known from the Fly Cell Atlas data whether these genes do begin to express in spermatogonia.

      Collated expression values from the FCA are provided in Supplementary Table 2. In many cases there is detectable expression of these genes in spermatogonia, although transcript abundance peaks in early spermatocytes.

      198: remove "distribution of".

      Fixed (line 200).

      311: enrichment relative to what?

      Fixed (line 313). It is relative to signal in wing discs.

      344: other aspects could be regulated such as elongation, termination.

      We have added caveats to our speculations in this sentence (lines 340-356). The increased signal we see in gene bodies could be due to slower RNAPII elongation, but we don’t see a way that changes in termination would produce this pattern.

      369: This part of the paper seems overly speculative, given the many molecular differences between dosage compensation mechanisms of Drosophila vs mammals, and studies that indicate that MSCI does occur in Drosophila (DOI: 10.3390/genes12111796).

      We disagree, and this is a central point in our manuscript. The paper referred to here does not directly assess MSCI in Drosophila, instead they argue that MSCI could be the force driving the evolutionary depletion of male-germline-expressed genes they describe. These and many studies in the literature have conflated the effects of a lack of X dosage compensation and of MSCI in the male germline. Our direct measurements of RNAPII in spermatocytes demonstrates that there is no dosage compensation nor is there MSCI. Further, profiling of histone modifications associated with Drosophila somatic dosage compensation (H4K16ac) or with mammalian MSCI (uH2A, H3K9me2) show that the molecular mechanisms found in these other settings are not in play in the Drosophila male germline. As we have established these biological differences between mammals and Drosophila, it is appropriate to now speculate on why these differences may be, which we do on lines 374-384.

      (several lines): Can the authors justify their assumption that chromatin features of larval wing disc cells will match those of somatic cells of adult testes?

      We don’t only compare germline features to somatic cells of the wing disc, but also to genes with somatic expression in the testes annotated by FCA expression data (H3K4me2 in Figure 2C, RNAPII in Figure 3F). Note in Supplementary Figure 2 the distribution of RNAPII in whole testes (which includes somatic cells) is similar to that of larval wing discs, confirming that the differences we describe are specific to germline cells.

    1. Author Response

      The following is the authors’ response to the previous reviews

      Point-to-Point Responses to Reviewers’ Comments

      We are a bit surprised by the comments of Reviewer 1, but that our further responses can help communications with Reviewer 1. We have also responded to comments of Reviewers 2 and 3.

      Public Reviews:

      *Reviewer #1 (Public Review):

      The overall tone of the rebuttal and lack of responses on several questions was surprising. Clearly, the authors took umbrage at the phrase 'no smoking gun' and provided a lengthy repetition of the fair argument about 'ticking boxes' on the classic list of criteria. They also make repeated historical references that descriptions of neurotransmitters include many papers, typically over decades, e.g. in the case of ACh and its discovery by Sir Henry Dale. While I empathize with the authors' apparent frustration (I quote: '...accept the reality that Rome was not built in a single day and that no transmitter was proven by a one single paper') I am a bit surprised at the complete brushing away of the argument, and in fact the discussion. In the original paper, the notion of a receptor was mentioned only in a single sentence and all three reviewers brought up this rather obvious question. The historical comparisons are difficult: Of course many papers contribute to the identification of a neurotransmitter, but there is a much higher burden of proof in 2023 compared to the work by Otto Loewi and Sir Henry Dale: most, if not all, currently accepted neurotransmitter have a clear biological function at the level of the brain and animal behavior or function - and were in fact first proposed to exist based on a functional biological experiment (e.g. Loewi's heart rate change). This, and the isolation of the chemical that does the job, were clear, unquestionable 'smoking guns' a hundred years ago. Fast forward 2023: Creatine has been carefully studied by the authors to tick many of the boxes for neurotransmitters, but there is no clear role for its function in an animal. The authors show convincing effects upon K+ stimulation and electrophysiological recordings that show altered neuronal activity using the slc6a8 and agat mutants as well as Cr application - but, as has been pointed out by other reviewers, these effects are not a clear-cut demonstration of a chemical transmitter function, however many boxes are ticked. The identification of a role of a neurotransmitter for brain function and animal behavior has reasonably more advanced possibilities in 2023 than a hundred years ago - and e.g. a discussion of approaches for possible receptor candidates should be possible.

      Again, I reviewed this positively and agree that a lot of cumulative data are great to be put out there and allow the discovery to be more broadly discussed and tested. But I have to note, that the authors simply respond with the 'Rome was not built in a single day' statement to my suggestions on at least 'have some lead' how to approach the question of a receptor e.g. through agonists or antagonists (while clearly stating 'I do not think the publication of this manuscript should not be made dependent' on this). Similarly, in response to reviewer 2's concerns about a missing receptor, the authors' only (may I say snarky) response is ' We have deleted this sentence, though what could mediate postsynaptic responses other than receptors?' The bullet point by reviewer 3 ' • No candidate receptor for creatine has been identified postsynaptically.' is the one point by that reviewer that is simply ignored by the authors completely. Finally, I note that my reivew question on the K stimulation issues (e.g. 35 neurons that simply did not respond at all) was: ' Response: To avoid the disadvantage of K stimulation, we also performed optogenetic experiments recently and obtained encouraging preliminary results.' No details, not data - no response really.

      In sum, I find this all a bit strange and the rebuttal surprising - all three reviewers were supportive and have carefully listed points of discussion that I found all valid and thoughtful. In response, the authors selectively responded scientifically to some experimental questions, but otherwise simply rather non-scientifically dismissed questions with 'Rome was not built in a day'-type answers, or less. I my view, the authors have disregarded the review process and the effort of three supportive reviewers, which should be part of the permanent record of this paper.

      Response:

      We were very surprised by the tone of Reviewer 1 in the second round of reviewing. The corresponding author has spent some time including a long holiday to cool down and re-read our earlier responses. The following is entirely by the correspond author.

      I have finally checked the term “smoking gun”, and found out that I interpreted it wrongly while I had thought that Reviewer 1 was wrong. This came from a long story in that I was lectured by a native speaker for my English when submitting the first paper from my own paper. In that case, the Reviewer was wrong (in arguing that only adjectives but not nouns can be used to define nouns), I was quite offended and remembered it vividly. In the case of “smoking gun”, I wrongly believed that it meant a hint (while the definite evidence would be “the final nail in the coffin”). By interpreting is as a hint, I was then rebutting Reviewer 1 for negating all our experimental results as “not a single piece of suggestive evidence”.

      For the above, I apologize.

      I have another disagreement about “smoking gun”. For a transmitter, multiple criteria have to be met. For example, finding a receptor for a small molecule would not be definitive for a transmitter because if it is not present in the SVs, it is unlikely to be a typical transmitter. If a molecule has a receptor but they are not even in the nervous system, it is definitely no a transmitter.

      The title of our paper is “Evidence suggesting creatine as a new central neurotransmitter”, not “Evidence proving creatine as a new central neurotransmitter”. In the Abstract, after “Our biochemical, chemical, genetic and electrophysiological results are consistent with the possibility of Cr as a neurotransmitter”, we are adding “though not yet reaching the level of proof for the now classic transmitters”. In the last sentence of the introduction, we have now added “though the discovery of a receptor for Cr would prove it”.

      I do, however, believe that, however strong the wordings are, criticisms and rebuttals in science are normal and should be conducted even when emotions are involved.

      One of my major point of differences with at least two of the reviewers is that the criteria for neurotransmitters should be those listed in major textbooks. While everyone can have one’s own opinions, the textbooks, especially those accepted by readers of the field for more than 40 years, should be the standards. Kandel has listed the 4 criteria not only 40 years ago but also just 2 years ago in their latest 6th edition. The reviewers have asked for more, while discounting Kandel et al. (2021). So, in essence, the Reviewer is not shy in scientific criticisms when stating “The identification of a role of a neurotransmitter for brain function and animal behavior has reasonably more advanced possibilities in 2023 than a hundred years ago”.

      Reviewer 1 raised another new criterion: brain function and behavior, while this is not in any textbook lists. However, lack of Cr caused behavioral problems, as cited by us in the introduction: both humans and mice were defective in brain function with loss of function mutations in the gene for the specific Cr transporter SLC6A8. If the reviewer meant behavioral abnormalities caused by Cr injection, that was unclear. But that criterion may not be met by other transmitters which is the likely reason that it was not a criterion in any textbook.

      Reviewer #2 (Public Review):

      Summary:

      Bian et al studied creatine (Cr) in the context of central nervous system (CNS) function. They detected Cr in synaptic vesicles purified from mouse brains with anti-Synaptophysin using capillary electrophoresis-mass spectrometry. Cr levels in the synaptic vesicle fraction was reduced in mice lacking the Cr synthetase AGAT, or the Cr transporter SLC6A8. They provide evidence for Cr release within several minutes after treating brain slices with KCl. This KCl-induced Cr release was partially calcium dependent and was attenuated in slices obtained from AGAT and SLC6A8 mutant mice. Cr application also decreased the excitability of cortical pyramidal cells in one third of the cells tested. Finally, they provide evidence for SLC6A8-dependent Cr uptake into synaptosomes, and ATP-dependent Cr loading into synaptic vesicles. Based on these data, the authors propose that Cr may act as neurotransmitter in the CNS.

      Strengths: 1. A major strength of the paper is the broad spectrum of tools used to investigate Cr. 2. The study provides evidence that Cr is present in/loaded into synaptic vesicles.

      Weaknesses: 1. There is no significant decrease in Cr content pulled down by anti-Syp in AGAT-/- mice when normalized to IgG controls. Hence, blocking AGAT activity/Cr synthesis does not affect Cr levels in the synaptic vesicle fraction, arguing against a Cr enrichment.

      Response: Evidence for Cr enrichment in the SVS was obtained robustly with wild type mice. When brain Cr is very low in AGAT-/- mutant mice, because there is little Cr, there is also little Cr in the SVs. One does not require that as a criterion: it does not argue against the normal levels of Cr could be transported into the SVs even if when the much reduced levels of AGAT-/- Cr in mutant mice could be enriched in SVs.

      1. There is no difference in KCl-induced Cr release between SLC6A8-/Y and SLC6A8+/Y when normalizing the data to the respective controls. Thus, the data are not consistent with the idea that depolarization-induced Cr release requires SLC6A8.

      Response: This comment of Reviewer 2 was based on Figure 5D. But if one carefully examines Figure 5G, it was clear that the Ca++ dependent component of KCl -induced Cr release was lower in SLC6A8-/Y than that in SLC6A8+/Y.

      1. The rationale of grouping the excitability data into responders and non-responders is not convincing because the threshold of 10% decrease in AP rate is arbitrary. The data do therefore not support the conclusion that Cr reduces neuronal excitability.

      Response: Comparison of the same neuron, before and after Cr did show effects on neuronal excitability though that would have no statistics if one does not group multiple cells into the same categories.

      Reviewer #3 (Public Review):

      SUMMARY:

      The manuscript by Bian et al. promotes the idea that creatine is a new neurotransmitter. The authors conduct an impressive combination of mass spectrometry (Fig. 1), genetics (Figs. 2, 3, 6), biochemistry (Figs. 2, 3, 8), immunostaining (Fig. 4), electrophysiology (Figs. 5, 6, 7), and EM (Fig. 8) in order to offer support for the hypothesis that creatine is a CNS neurotransmitter.

      STRENGTHS:

      There are many strengths to this study. • The combinatorial approach is a strength. There is no shortage of data in this study. • The careful consideration of specific criteria that creatine would need to meet in order to be considered a neurotransmitter is a strength. • The comparison studies that the authors have done in parallel with classical neurotransmitters is helpful. • Demonstration that creatine has inhibitory effects is another strength. • The new genetic mutations for Slc6a8 and AGAT are strengths and potentially incredibly helpful for downstream work.

      WEAKNESSES: • Some data are indirect. Even though Slc6a8 and AGAT are helpful sentinels for the presence of creatine, they are not creatine themselves. Of note, these molecules themselves are not essential for making the case that creatine is a neurotransmitter.

      Response: We agree, but those data are not inconsistent with the possibility.

      • Regarding Slc6a8, it seems to work only as a reuptake transporter - not as a transporter into SVs. Therefore, we do not know what the transporter into the TVs is.

      Response: SLC6A8 is not the transporter on the SVs, but is an excellent candidate for the transporter on the presynaptic cytoplasmic membrane for uptake of Cr into the presynaptic structure.

      • Puzzlingly, Slc6a8 and AGAT are in different cells, setting up the complicated model that creatine is created in one cell type and then processed as a neurotransmitter in another. This matter will likely need to be resolved in future studies.

      Response: We agree.

      • No candidate receptor for creatine has been identified postsynaptically. This will likely need to be resolved in future studies.

      Response: We agree.

      • Because no candidate receptor has been identified, it is important to fully consider other possibilities for roles of creatine that would explain these observations other than it being a neurotransmitter? There is some attention to this in the Discussion.

      Response: We agree.

      There are several criteria that define a neurotransmitter. The authors nicely delineated many criteria in their discussion, but it is worth it for readers to do the same with their own understanding of the data.

      By this reviewer's understanding (and combining some textbook definitions together) a neurotransmitter: 1) must be present within the presynaptic neuron and stored in vesicles; 2) must be released by depolarization of the presynaptic terminal; 3) must require Ca2+ influx upon depolarization prior to release; 4) must bind specific receptors present on the postsynaptic cell; 5) exogenous transmitter can mimic presynaptic release; 6) there exists a mechanism of removal of the neurotransmitter from the synaptic cleft.

      Response: While any of us can come up with a list according to our own understanding, the paper copies lists from textbooks, especially from Kandel et al. (2021), which lists the same 4 criteria as Kandel et al. (1983), providing consistency and consensus.

      For a paper to claim that the published work has identified a new neurotransmitter, several of these criteria would be met - and the paper would acknowledge in the discussion which ones have not been met. For this particular paper, this reviewer finds that condition 1 is clearly met.

      Conditions 2 and 3 seem to be met by electrophysiology, but there are caveats here. High KCl stimulation is a blunt instrument that will depolarize absolutely everything in the prep all at once and could result in any number of non-specific biological reactions as a result of K+ rushing into all neurons in the prep. Moreover, the results in 0 Ca2+ are puzzling. For creatine (and for the other neurotransmitters), why is there such a massive uptick in release, even when the extracellular saline is devoid of calcium?

      Response: Classic transmitters are released in a Ca++ dependent manner when stimulated by KCl, though they also had a Ca++ independent component as also shown in our Figure 5 E and F.

      Condition 4 is not discussed in detail at all. In the discussion, the authors elide the criterion of receptors specified by Purves by inferring that the existence of postsynaptic responses implies the existence of receptors. True, but does it specifically imply the existence of creatinergic receptors? This reviewer does not think that is necessarily the case. The authors should be appropriately circumspect and consider other modes of inhibition that are induced by activation or potentiation of other receptors (e.g., GABAergic or glycinergic).

      Response: Kandel et al. did not list this.

      Condition 5 may be met, because authors applied exogenous creatine and observed inhibition. However, this is tough to know without understanding the effects of endogenous release of creatine. if they were to test if the absence of creatine caused excess excitation (at putative creatinergic synapses), then that would be supportive of the same. Nicely, Ghirardini et al., 2023 study cited by the reviewers does provide support for this exact notion in pyramidal neurons.

      Response: For most commonly accepted transmitters, this criterion has never been met. For example, the simplest case would be ACh at the neuromuscular junction. Howver, we have now found that choline is clearly present in SVs. So, how does anyone be sure that only ACh is released only, or how does anyone rule out effects of choline on postsynaptic cells when cholinergic neurons are stimulated?

      Many synapses are now known to release more than one transmitter, making it difficult to define the effect of one transmitter released endogenously.

      These are perhaps reasons why some textbooks do not emphasize similarities of endogenously released vs exogenously applied molecules.

      For condition 6, the authors made a great effort with Slc6a8. This is a very tough criterion to understand or prove for many synapses and neurotransmitters.

      Response: SLC6A8 is a transporter on the cytoplasmic membrane, thus a good candidate for removal of Cr from the synaptic cleft.

      In terms of fundamental neuroscience, the story should be impactful. There are certainly more neurotransmitters out there than currently identified and by textbook criteria, creatine seems to be one of them taking all of the data in this study and others into account.

      Response: We hope that more will join our lonely efforts in trying to discover more transmitters.

      Recommendations for the authors:

      Reviewer #1 (Recommendations For The Authors):

      Since the authors largely disregarded questions in the review process, I do not see a point in listing recommendation for the authors again.

      Reviewer #2 (Recommendations For The Authors):

      1. The different sections of the manuscript are not separated by headers.

      Response: We do have separate subheadings.

      1. The beginning of the results section either does not reference the underlying literature or refers to unpublished data.

      Response: We have a very long introduction which was criticized for being too long and with too much historical citations. We therefore refrained from citation again in the beginning part of the Results section.

      1. The text contains many opinions and historical information that are not required (e.g., "It has never been easy to discover a new neurotransmitter, especially one in the central nervous system (CNS). We have been searching for new neurotransmitters for 12 years."; l. 17).

      Response: We would like to keep these because most readers are young and do not know the history and difficulties of discovering transmitters.

      1. Almeida et al. (2008; doi: 10.1002/syn.20280) provided evidence for electrical activity-, and Ca2+-dependent Cr release from rat brain slices. This paper should be introduced in the introduction.

      Response: Done.

      1. Fig. 7: A Y-scale for the stimulation protocol is missing.

      Response: Done.

      Reviewer #3 (Recommendations For The Authors):

      The main suggestion by this reviewer (beyond the details in the public review) was to consider the full spectrum of biology that is consistent with these results. By my reading, creatine could be a neurotransmitter, but other possibilities also exist. The authors have highlighted some of those for their Discussion.

    1. Author Response

      The following is the authors’ response to the previous reviews

      eLife assessment

      The manuscript offers important findings on the potential influence of maternally derived extracellular vesicles on embryo metabolism. However, while the content is convincing, the title appears to overstate the study's conclusions due to its speculative nature on the DNA transmission and embryo bioenergetics connection. A more measured title would better represent the evidence presented.

      We want to extend our heartfelt appreciation to the editors and reviewers for their invaluable comments on our research. Their feedback has played a crucial role in improving the quality of our manuscript.

      We acknowledge the concern regarding the manuscript's title and are fully open to making modifications. Following the recommendation of Reviewer 2, the proposed new title of the manuscript will be “Vertical transmission of maternal DNA through extracellular vesicles associates with altered embryo bioenergetics during the periconception period.”

      Reviewer #1 (Public Review):

      Q1. Bolumar et al. isolated and characterized EV subpopulations, apoptotic bodies (AB), Microvesicles (MV), and Exosomes (EXO), from endometrial fluid through the female menstrual cycle. By performing DNA sequencing, they found the MVs contain more specific DNA sequences than other EVs, and specifically, more mtDNA were encapsulated in MVs. They also found a reduction of mtDNA content in the human endometrium at the receptive and post-receptive period that is associated with an increase in mitophagy activity in the cells, and a higher mtDNA content in the secreted MVs was found at the same time. Last, they demonstrated that the endometrial Ishikawa cell-derived EVs could be taken by the mouse embryos and resulted in altered embryo metabolism.

      This is a very interesting study and is the first one demonstrating the direct transmission of maternal mtDNA to embryos through EVs.

      A1. Thank you for your kind comments.

      Reviewer #2 (Public Review):

      Q2. In Bolumar, Moncayo-Arlandi et al. the authors explore whether endometrium-derived extracellular vesicles contribute DNA to embryos and therefore influence embryo metabolism and respiration. The manuscript combines techniques for isolating different populations of extracellular vesicles, DNA sequencing, embryo culture, and respiration assays performed on human endometrial samples and mouse embryos.

      Vesicle isolation is technically difficult and therefore collection from human samples is commendable. Also, the influence of maternally derived DNA on the bioenergetics of embryos is unknown and therefore novel. However, several experiments presented in the manuscript fail to reach statistical significance, likely due to the small sample sizes. This manuscript is a good but incomplete start as to the potential function of maternal DNA transfer via vesicles.

      In my opinion the manuscript supports the following of the authors' claims:

      1. Different amounts of nDNA and mtDNA are shed in human endometrial extracellular vesicles during different phases of the menstrual cycle.
      2. Endometrial microvesicles are more enriched for mitochondrial DNA sequences compared to other types of vesicles present in the human samples.
      3. Fluorescently labelled DNA from extracellular vesicles derived from an endometrial adenocarcinoma cell line can be incorporated into hatched mouse embryos.
      4. Culture of mouse embryos with endometrial extracellular vesicles can influence embryo respiration and the effect is greater when cultured with isolated exosomes compared to other isolated microvesicles.

      My main concerns with the manuscript:

      1. Several experiments presented fail to reach statistical significance or are qualitative.
      2. The definitive experiments presented in the manuscript are limited to the transfer of DNA in general not mtDNA. Therefore a strong connection with metabolism is missing, diminishing the significance of the findings.

      A2. We thank you for your detailed feedback. While we acknowledge the reviewer's concerns regarding sample sizes, we emphasize that this study was intentionally designed as a pilot study and was approved by the IRB with a specific sample size to serve as proof of concept. We fully agree that further research is essential for a more comprehensive understanding of the novel biological process described in this manuscript. When this manuscript is finally accepted, we can submit a new IRB application to obtain a larger sample size, allowing us to delve deeper into demonstrating the connection with metabolism

      Recommendations for the authors:

      Reviewer #1 (Recommendations For The Authors):

      Q3. The authors have made significant improvements, and the manuscript now is appropriate for eLife.

      A3. Thank you for your consideration.

      Reviewer #2 (Recommendations For The Authors):

      The authors have made several changes that have improved the manuscript. However, I still have some concerns.

      Q4. The title is still too definitive. Something like "Vertical transmission of maternal DNA through extracellular vesicles is associated with changes in embryo bioenergetics during the periconception period" would be more appropriate.

      A4. As mentioned earlier in the response to the editors, we acknowledge the concerns regarding the manuscript's title.

      Following your recommendation, the proposed new title of the manuscript is “Vertical transmission of maternal DNA through extracellular vesicles associates with altered embryo bioenergetics during the periconception period.”

      Q5. I am confused by the incorporation of the new experiment (supplementary figure 7) where embryos are cultured in free-floating synthesized mtDNA. If these sequences were not encapsulated in vesicles I don't think the experiment is relevant. If they were similarly prepared as in the section "Tagged-DNA production and EV internalization by murine embryos" I stand corrected but please clarify or omit. Otherwise, the new data/figure in response to Q11 showing co-localization of mitochondria and EdU-tagged DNA from MVs from Ishikawa cells is more compelling. However, this doesn't separate the uptake of mtDNA alone from the potential uptake of mitochondria, which this manuscript is not focused on.

      A5. We apologize for any confusion that may have arisen for the reviewer. We conducted this experiment in response to question Q4 posed by the same reviewer, which specifically inquired about the detection of internalized mtDNA by the embryos.

      As previously stated in the revised manuscript, the EdU system does not selectively label mtDNA; instead, it labels any newly synthesized DNA, both nuclear and mitochondrial. We have not found a system that specifically labels mtDNA for subsequent tracing inside EVs or for encapsulation within artificial EVs (which falls outside our expertise). Therefore, we employed labeled mtDNA that we could trace after the embryos' internalization.

      While we acknowledge that this approach is not perfect, it does demonstrate the internalization of mtDNA sequences within the embryo. We have revised the manuscript to eliminate any potential sources of confusion. If the reviewer or editors still have concerns about the experiment's suitability, we are open to removing it from the final version of the manuscript. Please refer to page 9 and lines 234-238 for more details."

    1. Author Response

      The following is the authors’ response to the original reviews.

      General comments:

      To reviewer 1 and 3: The following sentences below were added at the beginning of the result section to clarify that the Gr gene expression analysis was performed using bimodal expression systems and to provide a reference that these expression profiles can generally be expected to represent endogenous Gr expression.

      "Note that this and all previous Gr expression studies were performed using bimodal expression systems, mostly GAL4/UAS, whereby Gr promotors driving GAL4 are assumed to faithfully reproduce expression of the respective Gr genes. Importantly, we analyzed two or more Gr28-GAL4 insertion lines for each transgene, and at least two generated the same expression profiles (Mishra et al., 2018; Thorne and Amrein, 2008) providing evidence that the drivers reflect a fairly accurate expression profile of respective endogenous genes."

      Specific comments:

      Reviewer #1 (Recommendations For The Authors):

      The important chemogenetic behavioral data would benefit from a clearer presentation including a cartoon to explain what the behavior is and how it is scored. Figure 2 is the key figure in this paper and it would be helpful if the figure were reorganized to guide the non-expert reader to the key result. I recommend labeling the positive controls Gr43a as "sweet" and Gr66a as "bitter" and perhaps organize the presentation to have the negative control at the left, then Gr28ba that had no effect, then group Gr28a with Gr43a for positive valence and Gr28bc with Gr66a for negative valence. I'm not sure what the value is of showing both 0.1 mM and 0.5 mM capsaicin, the text does not explain. The experiment in Figure 2B is important but non-experts will not understand what is being done here - can the authors please provide a cartoon like those in Figure 1 showing what cells are being subjected to chemogenetics and how this differs from Figure 2A?

      The reviewer is correct that much can be improved, which we hope to have accomplished with the modifications in Figure 2. We re-organized it to deliver the key result to non-expert readers in an easy way. We added cartoons both explaining how the two-choice preference assays were conducted and indicating which cells express UAS-VR1. The cartoon in Figure 1E and Figure 2A are now directly relatable and should clarify what cells express VR1 (in Figure 2). Positive and negative control experiments using Gr43aGAL4 (a GAL4 knock-in; Miyamoto et al., 2013) and Gr66a-GAL4 are highlighted in the Figure and mentioned upfront in the text to make clear to what the experimental larvae can be compared. We also excluded larvae responses to 0.5 mM capsaicin.

      1. The AlphaFold ligand docking in Figure 8 is conducted with Gr28bc monomers, which are unlikely to be the in vivo relevant structure, given that the related OR/ORCO ancestor structures are tetramers. I recommend that this component of the paper either be removed entirely or that the authors redo the in silico work using the AlphaFold-Multimer package reported by Hassabis and Jumper in 2022 https://www.biorxiv.org/content/10.1101/2021.10.04.463034v2. It will be interesting to see what a tetramer structure looks like with the ligand.

      We tried but were able to use the recommended package. Even if it were, the problem is that we do not know the partner of Gr28b.c. And while it is not clear whether and how extensive changes in the ligand binding pockets occur when using the monomer prediciton vs a multimer package, we followed the reviewer’s suggestion and removed the modeling from the manuscript.

      Minor points:

      1. Line 80: I do not think it is biophysically or biochemically plausible that GRs and IRs would assemble into functional heteromeric channels and suggest that the authors either explain how that would work or remove this speculative comment.

      We have removed this sentence.

      1. Line 246-248: I would tone down the speculation about GR subunit composition - it's still too early days to understand the stoichiometry or the extent that any of the broadly expressed GRs is a co-receptor.

      We did not indulge in the possible stoichiometry of Gr complexes, but merely mention that they are composed in general of two or more Gr subunits, for which clear genetic evidence exists: Up to three different putative bitter Gr genes are necessary to elicit responses to bitter compounds, and at least two putative sugar Gr genes are necessary to restore behavioral responses to any sweet tasting chemicals (sugars). Regardless, we have toned down the language, stating now:

      “Given the multimeric nature of bitter taste receptors (Sung et al., 2017), one possibility is that the absence of a Gr subunit not required for the detection of denatonium (Gr66a) could favor formation of multimeric complexes containing Gr subunits that recognize this compound (Gr28b.a and/or Gr28b.c).”

      1. Line 284: I don't think that co-expression necessarily means that GRs form heteromultimeric channels. It's equally possible that the cell controls subunit assembly to avoid mixing and matching ligand-selective subunits at will. I would tone this down - it's still speculative at this stage. We don't even know yet how this works for OR-Orco, where we do have structures. There is not yet an OR-Orco Cryo-EM structure, so we do not know what the subunit stoichiometry is.

      We are not sure what the reviewer’s concern is. While direct biochemical or biophysical evidence is currently lacking, there is strong genetic evidence for heteromeric composition of Gr complexes, both from studies of bitter and sweet receptors/neurons (see response above). It is likely that intrinsic properties facilitate assembly of certain Grs within a taste receptor complex. We have refrained from any speculation about stoichiometry, though given the relatedness of Grs and Ors, it would not be far-fetched to propose that taste receptor complexes are also tetrameric in nature, which was recently proposed for a homomeric channel of the bombyx mori homolog of Gr43a, BmGr9 (Morinaga et al., 2022).

      1. Line 305: the work of Emily Troemel and Cori Bargmann PMID: 9346234 should be cited in the Discussion. Theirs was the first experiment to show that valence was a feature of the neuron and not the receptor(s) it expresses.

      We have now cited this work in the discussion to acknowledge this important discovery.

      1. Figure 1 - the clarity of the organization of the figure could be improved for non-experts. For instance, can the key for the abbreviations be written out at the right of Figure 1A? Second, it is confusing to talk about DOG/TOG neurons "projecting" to the DO/TO - I think the authors mean dendritic innervation, not axons projecting. Maybe having a diagram that cartoons a closeup of the DOG/TOG neurons and how they innervate the cuticular structures would make this clearer. I struggled to go from the pretty staining at the left of B and C to the schematics at the right that colored in which neurons express which receptors.

      We appreciate these comments regarding clarity and have amended Figure 1 and made necessary changes in the text and the Figure legend.

      1. Figure 3 would benefit from a summary cartoon relating back to the cartoons in Figure 1 to summarize what neurons the authors think are necessary for bitter avoidance.

      We very much appreciate this suggestion and have increased clarity by referring to the carton in Figures 1 and 2.

      1. Figure 4B - the lowercase letters indicating Gr28 subunits that are being expressed under UAS control (bottom row of table "UAS-Gr28") are easily confused for the lowercase letters a, b used throughout to signify significant differences. I recommend that the authors write out the gene names in this figure to clarify the genes in the rescue experiment.

      We changed the text in the Figure accordingly.

      1. For non-experts it would be helpful to have a map of the Gr28 gene locus so that people understand the arrangement of the genes and how the Gal4 driver lines map onto the locus.

      We have now included such a map in Figure 1B.

      Reviewer #2 (Recommendations For The Authors):

      1. In the title and multiple times in the text (e.g. lines 121-122), the authors make the claim that different Gr28 genes mediate opposing behaviors. At first, I was not convinced of this claim, but I now believe it may be warranted if integrating the present results with results from Mishra et al., 2018. In the present study, the authors show that different neurons drive opposing behaviors, but they did not show that the genes themselves mediate opposing behaviors. They show evidence for the role of Gr28bc and Gr28ba in aversion, but not the role of Gr28a in attraction. I was thinking that there could be other receptors in Gr28a-expressing neurons that mediate attraction. However, Mishra et al. showed that mutation of all Gr28 genes abolishes preference for RNA/ribose as well as detection of these compounds by Gr28a+ neurons of the terminal organ, an impairment that could be rescued by expressing Gr28a (although Gr28b genes seem to have similar functions), and the present study shows that the other Gr28 genes are not co-expressed with Gr28a in the terminal organ. Is this the line of reasoning that we must take to come to the conclusion in the title? If so, I don't believe it comes through clearly in the paper.

      We appreciate this observation. We have modified language in the abstract and the introduction to reflect previous reports of Gr28a as an RNA/ribose receptor (Mishra et al., 2018) and its conversation across dipteran insects (Fujii et al., 2023) where we showed that appetitive behavior for RNA can be mediated via the mosquito homologs in transgenic Drosophila larvae. The reviewer is correct in that there are other appetitive neurons, namely those expressing Gr43a, which defines a set distinct from and non-overlapping with Gr28a neurons (Mishra 2018). This additional information is included in the Figure 1, summarizing expression of the Gr28 genes, Gr66a and Gr43a.

      1. The Figure 6 schematic does not show Gr66a+ Gr28- cells as being connected to avoidance behavior. This seems misleading because it seems likely that these cells do promote avoidance (based on known functions of other Gr66a cells). Also, it is not clear what the red dashed line represents.

      The Gr66a neurons are indeed also avoidance mediating, but it is not clear which subgroup of these neurons is necessary. Our analysis in Figure 2 using Gr28b.c driving Kir2.1 suggests that a small subset of Gr66a neurons is sufficient to mediate avoidance. It is, however, possible that other subsets not including Gr28b.c can also mediate avoidance. The figure has been modified accordingly, as has the model in Figure 7.

      1. I would suggest including the description of Figures 7-8 in the Results instead of the Discussion. In Figure 8, it would be helpful to superimpose labels for the transmembrane domains and extracellular/intracellular sides to better interpret the models.

      The modeling was removed from the manuscript (see response above to reviewer 1).

      1. The finding that Gr66a mutants show increased denatonium and quinine avoidance (Figure 4 - figure supplement 1) seems like a non sequitur, as it does not relate to the analysis of Gr28 genes. I support the inclusion of these interesting results, but perhaps it could be stated why this experiment was conducted (e.g. as a positive control).

      We have reworded this section to make clear why Gr66a mutants were tested (possibly being part of a denatonium receptor complex).

      1. An introduction to the nomenclature and gene structure for the Gr28 genes would be helpful. It's not clear how they're all related, e.g. that the Gr28b genes share some exons whereas Gr28a is separate. The Results section alludes to "the high level of similarity between these receptors", and some sort of reference or quantification for this statement would be useful. I also think naming the Gr28b genes with a period (e.g. "Gr28b.c") may be more consistent with the literature.

      We have added the structure of the Gr28 genes in the Figure 1B, which was also a suggestion by reviewer 1, and we have amended the naming of the genes.

      1. Lines 79-80 state "some GRNs express members of both families", but no citation is provided.

      As this sentence was deleted, based on a comment by reviewer 1, this point becomes mute.

      1. There are several typos or grammatical mistakes that the authors may wish to correct (e.g. lines 73, 75, 91, 232, 334, 780, 788).

      We appreciate the reviewer pointing these errors out to us. The mistakes were corrected.

      Reviewer #3 (Recommendations For The Authors):

      • Silencing experiments suggest a role for Gr28bc in the avoidance of quinine (Figure 3), while imaging experiments do not support this role (Figure 5G). An explanation is needed to reconcile these findings.

      The imaging experiments do support a role for Gr28b proteins in quinine detection in the specific TOG GRN used for all live imaging (Figure 5). This GRN in DGr28 larvae has a significantly lower Ca2+ responses to quinine compared to controls. However, the Ca2+ response could not be rescued to wild type levels by supplementing single Gr28b subunits, suggesting multiple Gr28b proteins are present in a quinine specific receptor complex in this GRN. Also note that Ca2+ responses of DGr28 larvae to quinine is not completely abolished, suggesting some redundancy, possible via Gr33a (Apostolopoulou et al., 2014), also supported by DGr28 larvae, which have still a robust avoidance to quinine. We are confident we have been clearer in arguing this point, both the result and especially the discussion section.

      • Silencing experiments specifically targeted neurons expressing Gr28bc and Gr28be (Figure 3). It is important to note why other neurons expressing different members of the Gr28 family were not included in this analysis.

      • Inconsistency is observed in the use of different reagents across the experiments. Specifically, all six Gal4 lines were utilized in the Chemical Activation experiments, while only two lines were employed in the silencing experiments.

      The silencing experiments asked the specific questions as to what neurons are necessary for avoidance of bitter chemicals. Gr28a-GAL4 and Gr28b.a-GAL4 neurons were omitted because the former mediate feeding preference and not avoidance, and the latter is expressed in the same neurons as Gr28b.e (Figure 1). The remaining two Gr28b genes, Gr28b.b-GAL4 and Gr28b.d-GAL4 are not expressed in the larval taste system (Mishra et al., 2018) as we stated in the introduction/result section, and they were therefore not included in the chemogenetic or Kir2.1 inactivation experiments. We included these genes in rescue experiments, simply to test whether or not they can restore function for sensing denatonium.

      As for the chemogenetic activation experiments: two of the GAL4 lines are controls (Gr66a-GAL4 and Gr43GAL4), that were needed to show what can be expected from these experiments.

      • The authors did not acknowledge that neurons expressing members of the GR28 family also express other Gr family members, which could potentially contribute to the detection and behavioral responses to the tested bitter compounds.

      We believe we did, but we have made that much more explicit in the revised manuscript.

      • Gal4 lines from various studies exhibit varying expression patterns, highlighting the necessity for improved reagents. These findings also suggest the importance of employing different Gal4 lines for each receptor to validate the results of the current study.

      See response at the beginning of our rebuttal.

      • Activating or silencing neurons pertains to the function of the neurons rather than the receptors.

      We agree and nothing in the manuscript states otherwise.

    1. Author Response

      The following is the authors’ response to the original reviews.

      REPLIES TO REVIEWERS

      For instance, The DynaMut2 and thermal shift assays point towards less stable variants than wild type, with Tm values slightly lower. On the other hand, the Kd value of variants reported stronger binding of NSP10 with NSP16. How do authors explain this, as the change due to point mutation may not fall within error range?

      Concerning the lower Tm values for the mutants compared to wild type NSP10, the errors of the measurements conducted in triplicate are very low (0.1 degrees) indicating that they do not fall into the error range, in particular as the changes in Tm are significant with changes of up to 4 degrees. This is consistent with the DynaMut23 calculations. Furthermore, the differences in Kd values between wild type and mutants are partially significant. Whereas one of the mutants did not display any changes in Kd value. Compared to wild-type NSP10 for both NSP14 and NSP16, the other show a 2 to 3 fold better Kd, with reasonable errors and we consider those as small but significant, and not within error range.

      For instance, the conformational ensemble could be utilized for docking with NSP16 and NSP14. There could be a potential alternative pathway for explaining the above changes in Kd. This should be attempted for understanding the role in its functional activity.

      We agree with the reviewer. We are working on a follow up manuscript exclusively looking into the NSP10-NSP14/16 interfacial interactions. Our preliminary results from biophysical and biochemical analysis suggests a range of Kd values observed between the mutants and the NSP14/NSP16. We are also investigating changes in the interfacial interactions via crystallography.

      Therefore, more quantitative analysis is required to explain structural changes. The free energy landscape reported in the paper may not capture rare transition events or slight rearrangements in side chain dynamics, both these could offer better understanding of mutations.

      We agree with the point raised by the reviewer. As mentioned above, we are exclusively looking into these interfacial interactions and binding between different partners, which will be reported in a follow up manuscript.

      Recommendations for the authors: please note that you control which, if any, revisions, to undertake

      1. Line 206, V104 need to be corrected to A104.

      done

      1. Line333, does it mean the Kd value of NSP10 binding to NSP16 similar to the Kd value of binding to NSP14?

      Yes. Overall, they are in about the same range with a Kd value of around 1 µM for the NSP10-NSP16 complex and 4 µM for the NSP10-NSP14 complex.

      1. Figure 3, the colors corresponding to different variants or native NSP10 could be consistent for easier reading and understanding.

      The colors have been edited.

      1. The data presented in Figure 3d are not clear enough to draw conclusions about the Kd Value in the main text.(Values of variants are smaller than that of wild-type NSP10, indicating a slightly stronger binding to NSP16)

      The measured differences are small with 2 to 3 fold differences, but significant and are not within the error range as can be derived from the data and calculated Kd values and their errors.

      1. Are there other mutations in the sequence with the top 3 mutations? If yes, is it possible to do the same experiments with that protein? Why not choose the NSP10 of the popular strain for the determination of the binding ability to NSP14 and NSP16.

      No, the top three were single point mutations.

      1. Enzyme activity assays like ExoN activity detection of NSP14 and vitro activity detection of NSP16 2′-O-MTase could be performed to characterize the effect of these three mutations on biological function.

      Yes, it would be good to consider these. We are considering these assays in the follow up manuscript as mentioned above.

      1. More details on image acquisition and writing errors need to be clarified and corrected.

      Done.

      1. Typo in Results section T12, T102, V104 should be A104

      Done.

      1. DynaMut analysis is extrapolated to explain that "Mutation to a hydrophobic side chain such as Ile, results in a loss of this interaction." There is no data to support this as complexes have not been studied. Perhaps this is speculative at best.

      We have changed this sentence to “Mutation to a hydrophobic side chain such as Ile, is predicted to result in the loss of this interaction”, since this was a prediction

    1. Author Response

      The following is the authors’ response to the original reviews.

      Public Reviews:

      Reviewer #1 (Public Review):

      Summary: Hansen et al. dissect the molecular mechanisms of bacterial ice nucleating proteins mutating the protein systematically. They assay the ice nucleating ability for variants changing the R-coils as well as the coil capping motifs. The ice nucleation mechanism depends on the integrity of the R-coils, without which the multimerization and formation of fibrils are disrupted.

      Strengths: The effects of mutations are really dramatic, so there is no doubt about the effect. The variants tested are logical and progressively advance the story. The authors identify an underlying mechanism involving multimerization, which is plausible and compatible with EM data. The model is further shown to work in cells by tomography.

      Weaknesses: The theoretical model presented for how the proteins assemble into fibrils is simple, but not supported by much data.

      Agreed. This theoretical INP multimer model was introduced to promote discussion and elicit ideas on how to prove or disprove it. The length and width of the fibres are defined by cryo-ET results, in which the narrow width is just sufficient to accommodate a dimer of the INPs, and the long length requires that several INPs are joined end to end. Their antiparallel arrangement produces identical ends to the dimer and avoids steric clash of the C-terminal cap structures as well as the C-terminal GFP tag. This model can accommodate the wide range of INPs lengths seen in nature (due to different numbers of water-organizing coils) and introduced in mutagenesis experiments (Forbes et al. 2022). It defines a critical role for the R-coil subdomain in joining the dimers together and explains why this region cannot be shortened by more than a few coils either in nature or by experimentation.

      In response to specific criticisms of the model (Fig. 9), we have redesigned this to be less schematic and to incorporate several copies of the AlphaFold-predicted structure.

      Reviewer #2 (Public Review):

      Summary:

      This paper further investigates the role of self-assembly of ice-binding bacterial proteins in promoting ice-nucleation. For the P. borealis Ice Nucleating Protein (PbINP) studied here, earlier work had already determined clearly distinct roles for different subdomains of the protein in determining activity. Key players are the water-organizing loops (WO-loops) of the central beta-solenoid structure and a set of non-water-organizing C-terminal loops, called the R-loops in view of characteristically located arginines. Previous mutation studies (using nucleation activity as a read-out) had already suggested the R-loops interact with the WO loops, to cause self-assembly of PbINP, which in turn was thought to lead to enhanced ice-nucleating activity. In this paper, the activities of additional mutants are studied, and a bioinformatics analysis on the statistics of the number of WO- and R-loops is presented for a wide range of bacterial ice-nucleating proteins, and additional electron-microscopy results are presented on fibrils formed by the non-mutated PbINP in E coli lysates.

      Strengths:

      -A very complete set of additional mutants is investigated to further strengthen the earlier hypothesis.

      -A nice bioinformatics analysis that underscores that the hypothesis should apply not only to PbINP but to a wide range of (related) bacterial ice-nucleating proteins.

      -Convincing data that PbINP overexpressed in E coli forms fibrils (electron microscopy on E coli lysates).

      Weaknesses:

      -The new data is interesting and further strengthens the hypotheses put forward in the earlier work. However, just as in the earlier work, the proof for the link between self-assembly and ice-nucleation remains indirect. Assembly into fibrils is shown for E coli lysates expressing non-mutated pbINP, hence it is indeed clear that pbINP self-associates. It is not shown however that the mutations that lead to loss of ice-nucleating activity also lead to loss of self-assembly. A more quantitative or additional self-assembly assay could shine light on this, either in the present or in future studies.

      The control cryo-ET experiment where the R-coils were deleted and INP fibres were not seen is consistent with a link between the loss of ice-nucleating activity and the loss of self-assembly. However, we agree that a more direct measurement of the physical state of INP molecules is needed to prove the link.

      -Also the "working model" for the self-assembly of the fibers remains not more than that, just as in the earlier papers, since the mutation-activity relationship does not contain enough information to build a good structural model. Again, a better model would require different kinds of experiments, that yield more detailed structural data on the fibrils.

      Reviewer #1 also raised these criticisms of the model, which we have responded to (above). Testing the model is a focus of our continuing experiments on INPs.

      Reviewer #3 (Public Review):

      Summary: in this manuscript, Hansen and co-authors investigated the role of R-coils in the multimerization and ice nucleation activity of PbINP, an ice nucleation protein identified in Pseudomonas borealis. The results of this work suggest that the length, localization, and amino acid composition of R-coils are crucial for the formation of PbINP multimers.

      Strengths: The authors use a rational mutagenesis approach to identify the role of the length, localisation, and amino acid composition of R-coils in ice nucleation activity. Based on these results, the authors hypothesize a multimerization model. Overall, this is a multidisciplinary work that provides new insights into the molecular mechanisms underlying ice nucleation activity.

      Weaknesses: Several parts of the work appear cryptic and unsuitable for non-expert readers. The results of this work should be better described and presented.

      In revising the manuscript for reposting we have rewritten sections to make it more accessible to the non-expert. Incorporating the detailed recommendations of the reviewers has been helpful in this effort.

      Recommendations for the authors: please note that you control which revisions to undertake from the public reviews and recommendations for the authors

      Reviewer #1 (Recommendations For The Authors):

      Introduction: Curiously, there is no mention at all in the introduction of what the biological function of these ice-nucleating proteins is.

      We added the following text to the first paragraph of the Introduction: ”INP-producing bacteria are widespread in the environment where they are responsible for initiating frost (4) and atmospheric precipitation (5). As such, these bacteria play a significant role in the Earth’s hydrological cycle and in agricultural productivity.”

      Line 70: TXT, SLT, and Y motifs are mentioned, but only the first is described. Also, TXT name alternates between TXT and TxT in the manuscript. (I think the latter is more correct).

      These putative water-organizing motifs are introduced in the preceding paper (new ref 8). We now use TxT consistently throughout the manuscript and have converted SLT to SxT because L is an inward-pointing residue that is not directly involved in water organization.

      Line 236: A construct with repeats deleted is tested for thermostability, but it is not really explained what hypothesis this experiment is supposed to test.

      This is an observation that adds information about the stability of the INP multimers and will need to be explained by the structure.

      Line 267: The authors test a mutant where the N-terminal coil is disrupted and find a big effect. Nevertheless, no conclusion is drawn. What does this result mean?

      On the contrary, INP activity is not appreciably affected by N-terminal deletion.

      Line 269: The CryoEM begins rather abruptly with technical details. Consider introducing the paragraph with a brief statement about what you want to investigate. Also, the analysis seems a little half-hearted.

      Given that the authors describe other EM studies of fibrils of the same protein it would be nice with a clear statement about what is new in their study and how it compares to previous studies.

      We have added this statement about why we used Cryo-EM: “The idea that INPs must assemble into larger structures to be effective at ice nucleation has persisted since their discovery (6). In the interim the resolving power of cryo-EM has immensely improved. Here we elected to use cryo-electron tomography to view the INP multimers in situ and avoid any perturbation of their superstructure during isolation.”

      Fig. 7B: Single-letter amino acid codes are always capitalized.

      We have revised this figure to use capital letters for the amino acids.

      Fig. 9: This figure is really hard to read even though it is very simplistic. I would consider making a figure with several copies of the AlphaFold model instead. Especially panel D, I do not know what is supposed to show.

      We have followed this advice and have completely revised the figure using copies of the AlphaFold model. Panel D (now C) shows two cross-sections through the AlphaFold model.

      Line 355 onwards: The model of the INP is the weakest part of the manuscript. This reviewer considers that the model is crude and it is unclear what information the model is supported by. The authors might want to consider running an AlphaFold multimer to get a better model of at least the dimer.

      Our objective now is to validate or disprove the model by experimentation using protein-protein cross-linking in conjunction with mass spectrometry, and higher resolution cryo-EM methods.

      Reviewer #2 (Recommendations For The Authors):

      I would suggest more frankly discussing the weaknesses mentioned in my public review, as well as approaches that could be used in the future to address these.

      In the cryo-ET analysis, INP mutations of the R-coils that lead to loss of ice-nucleating activity fail to show fibres in the bacteria (Fig. S4), which is consistent with the loss of self-assembly. We are working on physical methods that can assess the degree of assembly of the different INP constructs and mutations. We are working to validate and improve the working model of INP multimers.

      Reviewer #3 (Recommendations For The Authors):

      Abstract

      Line 18. Below 0 Celsius should be < 0 {degree sign}C.

      Done

      Line 25. E. coli should be Escherichia coli

      Done

      Line 29. E. coli should be in italics.

      Done

      Introduction

      The introduction is weak and not suitable for non-expert readers. Moreover, in some parts it is cryptic and it is not clear whether the authors are describing INP in general or PbINP. The introduction should be reorganized to highlight the novelty of this paper compared to Forbes et al. 2022.

      The changes we have made to the Introduction can be seen in the ‘documents compared’ version where the changes are tracked.

      Line 45. It is unclear whether this paragraph is a result reported in the literature or the result of this work. Please clarify.

      These are results reported in the literature as indicated by the references cited in the paragraph.

      Line 54. It is not clear whether this paragraph describes PbINP or INP in general.

      This paragraph begins with INPs in general and then focuses on PbINP.

      Results

      Line 109. This section would benefit from a paragraph in which the authors describe the rationale for this bioinformatic analysis.

      We added the following Statement: “A bioinformatic analysis of bacterial INPs was undertaken to identify their variations in size and sequence to understand what is common to all that could guide experiments to probe higher order structure and help develop a collective model of the INP multimer.”

      Some information is needed on the selected sequences such as sequence identity, what do the authors mean by nr database?

      The abbreviation nr has been replaced by ‘non-redundant’. As explained in that same paragraph the sequences selected were those from long-read sequences that could be relied on to accurately count the number of solenoid coils.

      Line 144. The standard deviation is necessary to understand whether these differences are statistically significant.

      These have been added as p values.

      Figure 2. I noticed that the authors used GFP-tagged PbINP. Why? In addition, panel C is never mentioned in the manuscript.

      The GFP tag was used to confirm expression of the PbINP in E. coli. We have added this sentence: “As previously described these constructs were tagged with GFP as an internal control for INP production, and its addition had no measured effect on ice nucleation activity (8).”The GFP tag was also useful as in internal control for the heat denaturation experiments featured in Fig. 6, where it lost its fluorescence between 65 and 75 °C.

      Fig. 2C is now cited alongside Fig. 2B.

      Figure 3. In my opinion, the results of the R-coil deletion should also be shown in Figure 2. Line 171. This section is cryptic. A logo sequence or an alignment of WO-coils and R-coils of PbINP could be helpful for the reader. Instead of the architecture of the whole protein, it would be useful to have the sequence of the R-coils with the residues that the authors mutagenised.

      The logo sequences are available in Fig. 1.

      Line 202. Here, the authors describe a new experimental setup. As the Materials and Methods section follows the Discussion, the authors should state in the first paragraph of the Results section that IN activity was measured on whole cells.

      We have now modified the introductory sentence to read: “Ice nucleation assays were performed on intact E. coli expressing PbINP to assess the activity of the incremental replacement mutants.”

      Line 202. The authors investigated the effects of pH and temperature (Line 223) on the IN activity. The authors should better introduce the rationale for these experiments and how they fit within the work.

      We have now modified the following sentence to provide the rationale: “To see how important electrostatic interactions were in the multimerization of PbINP as reflected by its ice nucleation activity, it was necessary to lyse the E. coli to change the pH surrounding the INP multimers.”

      Line 245. This work is supported by a model provided by Alphafold. I wonder how reliable this model is; the authors should indicate the quality of the model and provide the accuracy values of the residuals.

      This information is now provided in Figure S1.

      Line 259. Typically in mutagenesis studies, a key residue is substituted with alanine to create a loss of function variant. In this case, the authors have made the following substitutions F1204D, D1208L, and Y1230D, it is not clear to me why the authors have replaced an aromatic residue with one of aspartic acid that is negatively charged.

      We have justified these more extreme changes as follows: “For an enhanced effect of the mutations hydrophobic residues were replaced with charged ones and vice versa.”

      Line 269. This paragraph seems completely unrelated to the section entitled: The β-solenoid of INPs is stabilized by a capping structure at the C terminus, but not at the N terminus.

      We had omitted the sub-heading “Cryo-electron tomography reveals INPs multimers form bundled fibres in recombinant cells”, which is now in place.

      Discussion

      Overall, the discussion is too long and some parts appear cryptic, this section should be reorganized.

      The changes we have made to the Discussion can be seen in the ‘documents compared’ version where the changes are tracked.

      Line 354. It is not clear what experimental evidence supports this model. In the results, this model is never mentioned and it is not clear whether it was obtained by computational analysis or not.

      The model is presented in the Discussion because it was not arrived at by experimentation but is an attempt to integrate the observations made in the Results section. The experimental evidence that supports this model is reviewed in the Discussion section: “Working model of the INP multimer is consistent with the properties of INPs and their multimers.”

      Line 354. The authors used GFP-tagged PbINP. The Authors should discuss the role of GFP in this model and IN activity. A measurement of IN activity on PbINP without GFP would be useful.

      We have previously shown in Ref 8 that the GFP tag has no detrimental effect on ice nucleation activity. Our model for the INP multimer can accommodate this C-terminal tag without any steric hindrance.

      Line 364. The Authors hypothesize that electrostatic interactions stabilize end-to-end dimer associations. To test this hypothesis, the authors should measure the activity of IN at increasing concentrations of NaCl. It is known that high salt concentrations shield charges by preventing the formation of electrostatic intermolecular interactions.

      We have added this sentence to the Discussion: “Another useful test of the electrostatic component to the multimer model would be to study the effects of increasing salt concentration on ice nucleation activity of the E. coli extracts.”

      Line 439. Conclusions should be useful for the reader.

      Material and Methods

      In several sections, the authors refer to what has already been published in Forbes et al. However, the minimum information should also be described in this work. In addition, the Authors should indicate the number of replicates.

      The ice nucleation assays on whole cells were done on the WISDOM apparatus, which integrates 100’s of individual measurements to obtain a T50 value. These T50 values were confirmed by assays on the nanoliter osmometer apparatus. The numbers of replicates used on the nanoliter osmometer apparatus are indicated by box and whisker plots in Figs. 5 & 6 with boxes and bars showing quartiles, with medians indicated by a centre line.

      Line 500. This paragraph should be removed as the results are not described in the manuscript.

      This is a Methods section that describes how that INPs were expression in E. coli. It has details that are important for researchers who want to repeat our findings, such as the use of the Arctic Express strain for producing INP.

    1. Author Response

      The following is the authors’ response to the original reviews.

      Thank you for the e-mail of 27th September that includes the eLife assessment and reviewers comments on manuscript eLife-RP-RA-2023-91861. We have considered these, added additional data and made various changes to the text as detailed below. We now submit a modified version that we would be happy to view as the ‘Version of Record’.

      We are very pleased to note the highly positive reports from the reviewers. The major change we have made is to alter the Introduction to include further consideration of the development of the ‘bar-code’ hypothesis. As highlighted by reviewer 2 the Lefkowitz/Duke University Group have been major proponents of this concept. However, as with many topics their views did not emerge in isolation. Indeed we (specifically Tobin) were developing similar ideas in the same period (see Tobin et al., (2008) Trends Pharmacol Sci 29, 413-420). Moreover, other groups, particularly that of Clark and collaborators at University of Texas, were developing similar ideas using the beta2-adrenoceptor as a model at least as early as this (e.g. Tran et al., (2004) Mol Pharmacol 65, 196-206). As such we have re-written parts of the Introduction to reflect these early studies whilst retaining information on more recent studies that have greatly expanded such early work. This has resulted in the addition of extra references and re-numbering of the Reference section. We have also provided statistical analysis of agonist-induced arrestin interactions with the receptor as requested by a reviewer and performed additional studies to assess the effect of the GRK2/3 inhibitor in agonist-regulation of phosphorylation of the hFFA2-DREADD receptor. This has led to an additional author (Aisha M. Abdelmalik) being added to the paper.

      To address first the ‘public reviews’

      Reviewer 1

      1. We agree that we do not at this point explore the implications of the tissue specific barcoding we observe and report. However, as noted by the reviewer these will be studies for the future.

      2. The question of why these are only 2 widely expressed arrestins and very many GPCRs is not one we attempt to address here and groups using various arrestin ‘conformation’ sensors are probably much better placed to do so than we are.

      Reviewer 2

      1. It is difficult to address the potential low level of ‘background’ staining in some of the immunocytochemical images versus the ‘cleaner’ background in some of the immunoblotting images. The methods and techniques used are very distinct. However, it should be apparent that the immunoblotting studies are performed (both using cell lines and tissues) post-immunoprecipitation and this is likely to reduce such background to a minimum. This is obviously not the case in the immunocytochemical studies. It is also likely, even though the antisera are immune-selected against the peptide target, there may be some level of immune-recognition this is not limited to the phosphorylated residues.

      2. Whilst this reviewer has commented in detail in the ‘recommendations’ section on the use of English, the other reviewers have not, and we do not find the manuscript challenging to follow or read.

      Reviewer 3

      1. We agree that the mass-spectrometry presented is not quantitative. The intention was for the mass spec to be a guide for the development of the antisera used in the study. We have re-written the initial part of the Results section (page 7) to state that phosphorylation of Ser297 was evident in the basal and agonist-stimulated receptor whilst phosphorylation of Ser296 was only evident following agonist addition.

      2. Immunoblotting is intrinsically variable as parameters of antiserum titre in re-used samples is not assessed and although we are aware that FFA2 displays a degree of constitutive activity (see for example Hudson et al., (2012) J Biol Chem. 287(49):41195-209) we did not make any specific effort to supress this by, for example, including an inverse agonist ligand. Agonist-regulation of phosphorylation of the receptor, as detected in cell lines by the anti- pThr306/pThr310antiserum, is exceptionally clear cut in all the images displayed, and as we note for the pSer296/pSer297 antiserum this was always, in part, agonist-independent.

      The point about compound 101 not being tested directly in the immunoblotting studies performed on the cell line-expressed receptor is a good one. We have now performed such studies which are shown as Figure 2E. These illustrate that the GRK2/3 inhibitor compound 101 does not reduce substantially agonist-induced phosphorylation of the receptor at least as detected by the pThr306/pThr310antiserum or by the pSer296/pSer297 antiserum. Equally this compound had little effect on recognition of the receptor. As the PD2 mutations which correspond to the targets for the pThr306/pThr310antiserum have no significant effect on recruitment of arrestin 3 in response to MOMBA (please see additional statistical analysis in modified Figure 2C) this is perhaps not surprising. Moreover, the PD1 mutations that correspond to the pSer296/pSer297antiserum also, in isolation, only have a partial effect of MOMBA-induced interactions with arrestin 3.

      1. The use of phosphatase inhibitors is an integral part of these studies. As noted in Materials we used PhosSTOP (Roche, 4906837001). However, we failed to make it sufficiently clear that this reagent was present throughput sample preparation for both cell lines and tissue studies. This had been specified previously by two of us (SS, FN, see Fritzwanker S, Nagel F, Kliewer A, Stammer V, Schulz S. In situ visualization of opioid and cannabinoid drug effects using phosphosite-specific GPCR antibodies. Commun Biol. 6, 419 (2023)) but we agree this was insufficient and we now correct this oversight by making this explicit in Results.

      Recommendations

      Reviewer 1

      Competing interest: We apologise for this typographic error. It is now corrected.

      Figures: We have upgraded the figure images to 300dpi and this markedly improves readability

      Reviewer 2

      Revisiting writing: We thank the reviewer for their assessment of the text. However, we do not feel that ‘every sentence in the entire manuscript could be clarified’ is a reasonable statement. Neither of the other reviewers commented on this. Each of the authors read and approved the manuscript.

      Figures: see response to Reviewer 1. We have greatly enhanced image quality at this part of the process.

      Statistics on Figure 2: We apologise for this oversight. Although there were no significant differences in potency for MOMBA to promote interactions with arrestin-3 to each of the PD mutants versus wild type receptor, there were in terms of maximal effect. Statistical analysis was performed via one-way ANOVA followed by Dunnett’s multiple comparisons test. This is now detailed directly in Figure 2C and its associated legend. As noted by the reviewer there was indeed a highly significant effect of the GRK2/3 inhibitor compound 101 and this is now also noted in Figure 2D and its associated legend.

      Units on page 9: pEC50 is considered as Molar by default but we have now specified this. PD1-4: It would be cumbersome to write out (and to read) 8 mutations that make up PD1-4 and hence we think this is specified appropriately in the Figure.

      Reviewer 3

      1. Mass spec: Please see comment point 1 to reviewer 3.

      2. Immunoblotting and compound 101: We have done so.

      3. Phosphatase inhibition: see public comments, reviewer 3.

    1. Author Response

      The following is the authors’ response to the original reviews.

      We are grateful to all the reviewers for their thoughtful comments and the efforts they put into reviewing our manuscript. These are highly positive and constructive reviews. Thank you! We have updated our manuscript to include further discussion of several important points (as suggested by reviewers) and addressed reviewer suggestions individually below.

      Reviewer #1 (Public Review):

      This remarkable and creative study from the Asbury lab examines the extent to which mechanical coupling can coordinate the growth of two microtubules attached to isolated kinetochores. The concept of mechanical coupling in kinetochores was proposed in the mid-1990s and makes sense intuitively (as shown in Fig. 1B). But intuitive concepts still need experimental validation, which this study at long last provides. The experiments described in this paper will serve as a foundation for the transition of an intuitive concept into a robust, quantitative, and validated model.

      The introduction cites at least 5 papers that proposed mechanical coupling in kinetochores, as well as 5 theoretical studies on mechanical coupling within microtubule bundles, so it's clear that this manuscript will be of considerable interest to the field. The intro is very well written (as is the manuscript in general), but I recommend that the authors include a brief review of the variable size of k-fibers across species, to help the reader contextualize the problem.

      We agree with the reviewer’s suggestion and have added a brief review of variable k-fiber sizes to the Introduction section (lines 30-35).

      For example, budding yeast kinetochores are built around a single microtubule (Winey 1995), so mechanical coupling is not relevant for this species.

      Indeed, the use of yeast kinetochores to study mechanical coupling is an odd fit, because these structures did not evolve to support such coupling. There is no doubt that yeast kinetochores are useful for demonstrating mechanical coupling and for measuring the stiffnesses necessary to achieve coupling, but I recommend that the authors include a caveat somewhere in the manuscript, perhaps in the place where they discuss their use of simple elastic coupling as compared to viscoelastic coupling or strain-stiffening. It's easy to imagine that kinetochores with large k-fibers might require complex coupling mechanisms, for example.

      Even though yeast kinetochores are built around single microtubules, mechanical coupling has still been proposed to help coordinate the dynamics of sister kinetochores in yeast (Gardner et al. 2005, see main text for full reference). We have added this important point to the Introduction section of the manuscript (lines 33-35). The microtubules attached to sister kinetochores are oriented oppositely to one another, in an anti-parallel arrangement that differs from the parallel arrangement we studied here. Nevertheless, it seems likely to us that coordination of anti-parallel microtubule growth between the single microtubules attached to sister kinetochores in yeast relies at least partly on mechanical coupling. One of the many ways we foresee our dual-trap assay being useful in the future is to test how anti-parallel microtubule growth and shortening can be coordinated via mechanical coupling. Of course, since kinetochores can change the dynamics of their attached microtubules (Umbreit et al., 2012, “The Ndc80 kinetochore complex directly modulates microtubule dynamics”), the kinetochores from different species may have also evolved unique mechanisms of modifying microtubule tension-dependent dynamics to achieve coordination of their attached microtubules. Thus far, in vitro reconstitutions using kinetochore assemblies from metazoans have not yet achieved the coupling stability that we routinely achieve with isolated yeast kinetochores. As reconstitutions with kinetochores from other species improve, it will be very interesting to test for species-specific differences in how the kinetochores influence microtubule dynamics and in how effectively they can coordinate microtubules via mechanical coupling.

      We note that the (visco)elastic properties of yeast kinetochores, and their relative simplicity compared to other kinetochores, shouldn’t significantly affect our primary experimental results. Yeast kinetochores are relatively small and the force on each bead changes very slowly in our experiments (see Figure S3-1 for examples), so the kinetochore’s change in length over time is very slow and very small. We have added this point to the Methods section of the manuscript (lines 479-484). We agree that mechanical coupling in species with large k-fibers might rely on more complex material properties, such as viscoelasticity or strain-stiffening. In principle, that type of complexity could be incorporated into our dual-trap experiments by altering the simulated linker. We view this as an interesting area for future study.

      And is mechanical coupling relevant for holocentric kinetochores like those found in C. elegans?

      This is a very interesting question. While holocentric kinetochores do not form k-fiber bundles (O’Toole et al., 2003, “Morphologically distinct microtubule ends in the mitotic centrosome of Caenorhabditis elegans” and Redemann et al., 2017, C. elegans chromosomes connect to centrosomes by anchoring into the spindle network), mechanical coupling could be even more important for them compared to monocentric kinetochores because tip-attached microtubules both near each other AND at opposite ends of the same chromosome must grow at similar enough rates to stay attached to the same chromosome. In C. elegans prometaphase, opposite chromosome ends move towards the same pole as the chromosome itself oscillates, suggesting that microtubule plus ends attached to the same chromosome are growing in the same direction at the same time (Maddox et al., 2004, ““Holo”er than thou: Chromosome segregation and kinetochore function in C. elegans”). Microtubules appear to stop growing or shortening after chromosome alignment is complete (Redemann et al., 2017), at which time the plus ends of kinetochore microtubules are in close proximity to the chromosome surface (O’Toole et al., 2003, Redemann et al., 2017). The tight clustering of kinetochore microtubule tips near the chromosome at metaphase, as well as the coordinated movement of chromosome arms preceding metaphase, suggests a high level of inter-microtubule coordination in the congression leading up to metaphase. We propose this coordination could be achieved by mechanical coupling through the kinetochore proteins on the surface of holocentric chromosomes and through the underlying chromosome itself.

      The paper shows considerable rigour in terms of experimental design, statistical analysis, and presentation of results. My only comment on this topic relates to the bandwidth of the dual-trap assay, which I recommend describing in the main text in addition to the methods. For example, the authors note that the stage position is updated at 50 Hz. The authors should clearly explain that this bandwidth is sufficiently fast relative to microtubule growth speeds.

      Thank you for this suggestion. We have added to the Results section (lines 131-133) that updating the stage position at 50 Hz is sufficient to maintain the desired force. We also modified the Methods section (lines 488-491) to clarify that the stage position is sampled at 200 Hz, which is more than sufficient to accurately show the growth variability present in dual-trap experiments.

      After describing their measurements, the authors use Monte Carlo simulations to show that pauses are essential to a quantitative explanation of their coupling data. Apparently, there is a history of theoretical approaches to coupling, as the introduction cites 5 theoretical studies. I would have appreciated it if the authors had engaged with this literature in the Results section, e.g. by describing which previous study most closely resembles their own and/or comparing and contrasting their approach with the previous work.

      Thank you for this excellent suggestion. We have added a brief comparison of our work to previous theoretical studies examining the role of mechanical coupling in k-fiber coordination to the Results section (lines 179-185).

      Overall, this paper is rigorous, creative, and thought-provoking. The unique experimental approach developed by the Asbury lab shows great promise, and I very much look forward to future iterations.

      Reviewer #2 (Public Review):

      Leeds et al. investigated the role of mechanical coupling in coordinating the growth kinetics of microtubules in kinetochore-fibers (k-fibers). The authors developed a dual optical-trap system to explore how constant load redistributed between a pair of microtubules depending on their growth state coordinates their growth.

      The main finding of the paper is that the duration and frequency of pausing events during individual microtubule growth are decreased when tension is applied at their tips via kinetochore particles coupled to optically trapped beads. However, the study does not offer any insight into the possible mechanism behind this dependency. For example, it is not clear whether this is a specific property of the kinetochore particles that were used in this experiment, whether it could be attributed to specific proteins in these particles, or if this could potentially be an inherent property of the microtubules themselves.

      We agree that the experiments described in our work do not distinguish between tension-dependence inherent to the microtubule itself and tension-dependence conferred by the kinetochore. We speculate about reasons why tension might disfavor pausing in paragraph 5 of the discussion (lines 356-366). Given that microtubule growth is suppressed by compression without the presence of kinetochores or other microtubule-associated proteins (Dogterom & Yurke, 1997, Janson et al., 2003, see main text for full reference), it seems plausible to us that tension-dependent dynamics, including pausing behaviors, might be inherent to microtubules. However, experiments with different tension-bearing plus-end couplers will be required to test this idea rigorously. We view this as an interesting area for future study.

      The authors simulate the coordination between two microtubules and show that by using the parameters of pausing and variability in growth rates both measured experimentally they can explain coordination between two microtubules measured in their experiments. This is a convincing result, but k-fibers typically have many more microtubules, and it seems important to understand how the ability to coordinate growth by this mechanism scales with the number of microtubules. It is not obvious whether this mechanism could explain the coordination of more than two microtubules.

      We wholeheartedly agree, it is of vital importance to understand how the coordination of growth via mechanical coupling scales with the number of microtubules. Indeed, we have already begun studying simulations of bundles of ten to twenty microtubules based on the pausing model developed in this paper. Simulated microtubule tips appear significantly limited when linked by mechanical couplers of similar stiffnesses to those used in the dual-trap assay, supporting the idea that mechanical coupling may be able to explain much of the coordination between microtubules in growing k-fiber bundles. We hope to use these simulations to continue exploring the degree to which mechanical coupling can coordinate k-fiber microtubules in future publications.

      The range of stiffnesses chosen to simulate the microtubule coupling allows linkers to stretch hundreds of nanometers linearly. However, most proteins including those at kinetochore must have finite size and therefore should behave more like worm-like chains rather than linear springs. This means they may appear soft for small elongations, but the force would increase rapidly once the length gets close to the contour length. How this more realistic description of mechanics might affect the conclusions of the work is not clear.

      While the worm-like chain is likely a better model for individual linker molecules, deformation of the underlying centromeric chromatin is also likely to be important, with viscoelastic properties that are still poorly understood. Rather than using a complicated (viscoelastic or worm-like-chain-based) model with many unconstrained parameters, we felt a simple model with a single stiffness parameter to characterize the coupling material was a better starting point, allowing a straightforward comparison between stiffer and softer coupling. In future work, simulations could be used to study the effects of strain-stiffening and viscoelasticity and ask if these effects might further improve (or degrade) the efficacy of mechanical coupling for coordinating kinetochore microtubules.

      The novel dual-bead assay is interesting. However, it only provides virtual coupling between two otherwise independently growing microtubules. Since the growth of one affects the growth of the other only via software, it is unclear whether the same insight can be gained from the single-bead setup, for example, by moving the bead at a constant speed and monitoring how microtubule growth adjusts to the fixed speed. The advantages of the double-bead setup could have been demonstrated better.

      Thank you for your suggestion to clarify the advantages of our dual-trap approach compared to single-trap experiments. We have added a paragraph to the Discussion section (lines 315-327) to explain the following points: In a real k-fiber bundle, each microtubule can dynamically adjust its growth speed to the current force being applied. In the same way, the dual-trap assay allows us to examine how both leading and lagging tips dynamically adjust to the other’s growth speed simultaneously. In addition, in our dual-trap assay each microtubule in the pair is grown at the same time relative to preparing the slide and comes from an identical batch of kinetochore-bead and tubulin-containing growth buffer. Any differences in growth speeds between paired microtubules can be attributed to intrinsic microtubule variability, rather than prep-to-prep or sample-to-sample differences in microtubule dynamics.

      Reviewer #3 (Public Review):

      Leeds et al. employ elegant in vitro experiments and sophisticated numerical modeling to investigate the ability of mechanical coupling to coordinate the growth of individual microtubules within microtubule bundles, specifically k-fibers. While individual microtubules naturally polymerize at varying rates, their growth must be tightly regulated to function as a cohesive unit during chromosome segregation. Although this coordination could potentially be achieved biochemically through selective binding of polymerases and depolymerases, the authors demonstrate, using a novel dual laser trap assay, that mechanical coupling alone can also coordinate the growth of in vitro microtubule pairs.

      By reanalyzing recordings of single microtubules growing under constant force (data from their own previous work), the authors investigate the stochastic kinetics of pausing and show that pausing is suppressed by tension. Using a constant shared load, the authors then show that filament growth is tightly coordinated when pairs of microtubules are mechanically coupled by a material with sufficient stiffness. In addition, the authors develop a theoretical model to describe both the natural variability and force dependence of growth, using no freely adjustable parameters. Simulations based on this model, which accounts for stochastic force-dependent pausing and intrinsic variability in microtubule growth rate, fit the dual-trap data well.

      Overall, this study illuminates the potential of mechanical coupling in coordinating microtubule growth and offers a framework for modeling k-fibers under shared loads. The research exhibits meticulous technical rigor and is presented with exceptional clarity. It provides compelling evidence that a minimal, reconstituted biological system can exhibit complex behavior. As it currently stands, the paper is highly informative and valuable to the field.

      To provide further clarity regarding the implications of their study, the authors may wish to address the following points in more detail:

      • Considering the authors' understanding of the quantitative relationship between forces, microtubule growth, and coordination, is the dual trap assay necessary to demonstrate this coordination? What advantages does the (semi)experimental system offer compared to a purely in silico treatment?

      Thank you for your suggestion to explain the advantages of our dual-trap approach compared to simulations based on previous recordings of individual microtubules growing under tension. We have added a paragraph about this to the Discussion section (lines 315-327). Previously we knew that a shared load should theoretically tend to coordinate a growing microtubule pair, but we did not know how well, nor did we know the degree of variability that would need to be overcome to achieve coordination. Moreover, there are myriad ways one could model the variability and force dependence in microtubule growth, but not all of them can successfully explain the tip separations we now measure between real microtubule pairs. For instance, our non-pausing model, although entirely derived from force-clamp data, had too much variability and too little coordination between microtubule pairs when we compared simulation results to our dual-trap measurements. Thus, the dual-trap assay allows us to test our assumptions about how variability in microtubule growth arises and how mechanical coupling affects it using real microtubules. Reviewer 2 likewise asked about the advantages of the dual-trap approach relative to single-trap experiments, and we suggest also examining our response to their comment above.

      • What are the limitations of studying a system comprising only two individual microtubules? How might the presence of crosslinkers, which are typically present in vivo between microtubules, influence their behavior in this context?

      This is a very interesting question. K-fiber microtubules in many organisms are subject to forces along their lattices from crosslinkers that attach them to each other and to other microtubules outside the k-fiber. Bridging fibers, for example, are pushed apart at the spindle equator by kinesin motors like Eg5, and are thought to maintain tension on k-fiber microtubule tips by sliding them towards the pole (Vukusic et al., 2017, “Microtubule Sliding within the Bridging Fiber Pushes Kinetochore Fibers Apart to Segregate Chromosomes"). Passive crosslinkers can also produce diffusion-like forces that drive microtubules to move relative to one another (although to our knowledge this has only been demonstrated with antiparallel microtubules—see Braun et al., 2017, “Changes in microtubule overlap length regulate kinesin-14-driven microtubule sliding”). Testing how these various lattice-based forces might affect k-fiber coordination is of great interest to us, but it is not easy to envision how it could be done in our dual-trap setup, where the two coupled microtubules only interact through mechanical forces and are biochemically isolated from one another (in separate assay chambers). Perhaps a clever new assay could be devised in the future to study the role of crosslinkers in combination with mechanical coupling on the coordination of growing microtubules in parallel.

      • How dependent are the results on the chosen segmentation algorithm? Can the distributions of pause and run durations truly be fitted by "simple" Gaussians, as indicated in Figure S5-2? Given the inherent limitations in accurately measuring short durations and the application of threshold durations, it is likely that the first bins in the histograms underestimate events. Cumulative plots could potentially address this issue.

      The qualitative trends of tension suppressing pause entrance and promoting pause exit seemed to be insensitive to the choices we made in our segmentation algorithm. We have added a paragraph to the Methods section (lines 558-569) to explain how other choices we tried (a smoothing window of 5 s compared to 2 s and a minimum event duration of 0.01 s compared to 1 s) had only mild effects on the measured force sensitivities but did not affect their signs. This suggests that while imposing a threshold duration almost certainly underestimates the number of shorter events, it does not substantially affect our overall conclusion that tension reduces the rate of pause entry, accelerates pause exit, and speeds assembly during the ‘runs’ between pauses.

      For segmenting each position-vs-time record into pause and run intervals, we fit the velocity distribution for each individual recording with a mixture of Gaussians. The distributions from some recordings fit quite well to a sum of Gaussians, while others did not fit as well. However, we found that the exact threshold used to separate runs from pauses (typically between 2 and 4 nm/s) had a surprisingly small effect on what the algorithm differentiated as a pause or a run. The segmentation algorithm and its performance on every record we analyzed can be directly viewed by downloading and running our force-clamp viewer, publicly available at https://doi.org/10.5061/dryad.6djh9w16v.

      Reviewer #2 (Recommendations For The Authors):

      In Figure 3a it would be helpful to see the traces of forces applied to individual microtubules. This would help to understand both, how the force is distributed between individual microtubules depending on their dynamic state and also to see the fluctuations of individual forces.

      We completely agree that understanding how force is distributed between microtubules in our dual-trap assay is both interesting and of great value. Although we decided not to include force vs time traces in the main figures, please refer to Figure S3-1, which shows the force-vs-time curves corresponding to the example position-vs-time traces displayed in Figure 3a, plus examples from two additional microtubule pairs.

    1. Author Response

      The following is the authors’ response to the original reviews.

      Reviewer #1 (Public Review):

      The paper offers some potentially interesting insight into the allosteric communication pathways of the CTFR protein. A mutation to this protein can cause cystic fibrosis and both synthetic and endogenous ligands exert allosteric control of the function of this pivotal enzyme. The current study utilizes Gaussian Network Models (GNMs) of various substrate and mutational states of CFTR to quantify and characterize the role of individual residues in contributing to two main quantities that the authors deem important for allostery: transfer entropy (TE) and cross correlation. I found the TE of the Apo system and the corresponding statistical analysis particularly compelling. I found it difficult, however, to assess the limitations of the chosen model (GNM) and thus the degree of confidence I should have in the results. This mainly stems from a lack of a proposed mechanism by which allostery is achieved in the protein. Proposing a mechanism and presenting logical alternatives in the introduction would greatly benefit this manuscript. It would also allow the authors to place the allosteric mechanism of this protein in the broader context of protein allostery.

      As detailed below, we went to great lengths to address these concerns, with an emphasis on the limitations of the model and a proposed mechanism. These revisions should hopefully warrant a re-evaluation of our manuscript.

      Reviewer #1 (Recommendations For The Authors):

      1. It would greatly benefit the paper to state a proposed mechanism by which allostery is achieved in this protein. Is this through ensemble selection, ensemble induction, or a purely dynamic mechanism? What is the rationale for choosing the proposed mechanism and what are reasonable alternative mechanisms? How does this mechanism fit in the broader context of protein allostery?

      Following this comment, we added a VERY extensive description of the proposed mechanism by which allostery is achieved in CFTR and present the rationale for choosing this mechanism (lines 445-97 and Figure 7). Briefly, based on previous experimental results and our results we propose that no single model can explain allostery in CFTR, and that its allosteric mechanism is a combination of induced fit, ensemble selection, and a dynamic mechanism.

      1. With a proposed mechanism in place, the choice of a GNM to investigate the mechanism and eliminate alternative mechanisms should be rationalized.

      The rational for choosing GNM (and ANM-LD) to study the proposed mechanism is now given in lines 498-510. Please note however, that as mentioned in the response to point 1 (and detailed in lines 445-97), the choice of allosteric mechanism, and ruling out other alternatives was not based solely on GNM and ANM-LD, but also on previous experimental results.

      1. A discussion of the strengths and limitations of the GNM are pivotal to understanding the limitations of the results shown. How sensitive are the results to specific details of the model(s)?

      a. A discussion of the strengths and limitations of the GNM have been added to the introduction. Please see lines 107-122.

      b. Sensitivity of the results to the specific details of GNM:

      GNM uses two parameters: the force constant of harmonic interactions and the cutoff distance within which the existence of the interactions is considered. The force constant is uniform for all interactions and is taken as unity. Its value affects only the absolute values of the fluctuations (i.e., their scale) but not their distribution. As we are only looking at fluctuations in relative terms our results are insensitive to its value. GNM uses a cutoff distance of 7-10 Å in which interactions are considered (10 Å used in this study). To test the sensitivity of the results to the cutoff distance we repeated the calculations using 7 Å. As now discussed in lines 170-73 and shown in Figure S2 the results remained largely unchanged.

      c. Sensitivity of the results to the specific details of TE: To identify cause-and-effect relations TE introduces a time delay (τ) between the movement of residues. The choice of τ is important: when τ is too small, only local cause-and-effect relations (between adjacent amino acids) will be revealed. if τ is too big, few (if any) cause-and-effect relations will manifest. This is analogous to the effects of a stone throne into a lake: look too soon, before the stone hits the water, and you’ll see no ripples. Look too late, the ripples will have already subsided. In a previous work (PMID 32320672), we studied in detail the effects of choosing different τ values and found that an optimal value of τ which maximizes the degree of collectivities of net TE values is in most cases 3× τopt (τopt is the time window in which the total TE of residues is maximized). Details of how τ was chosen were added to the methods section.

      In general, the limitations of the chosen model(s) is difficult to determine from the current manuscript because it is devoid of details of the model. While I understand that GNMs have been widely used to study protein systems, the specifics of the model are central to the current work and thus should be provided somewhere in the manuscript.

      a. As mentioned in our response above, the limitations of GNM are now presented (lines 107-122).

      b. The specifics of the model are now given in more detail in the methods section.

      c. In addition, as mentioned above, the results are largely independent of the values of the model’s parameters.

      b. Would changing the force constants to a more anisotropic model qualitatively change the results?

      a. GNM assumes isotropic fluctuations, and the calculations are based on this assumption. Therefore, GNM is inherently an isotropic model.

      b. Importantly, we complement the GNM-TE calculations with ANM-LD simulations, which predict the normal modes in 3D using an anisotropic network model.

      1. How repeatable is the difference between no ATP bound and ATP bound CFTR? I worry that the differences in TE in Figures 1 and 3A are mainly due to two different crystallization conditions. Is there evidence that two different structures of the same protein in the same ligand state lead to small changes in TE?

      To address this concern, we repeated the calculations using the structures of the ATP-free and bound forms of zebrafish CFTR. As now explained in text (lines 298-303) and shown in Figure S8 the effects of ATP are highly repeatable.

      1. Collective modes - why should we expect allostery to be in the most collective modes? Let alone the 10 most? Why not do a mode by mode analysis? Why, for example, were two modes removed page 9 first full paragraph?

      a. Collective modes: We have erroneously referred to the slow modes as collective modes. This has now been corrected throughout the manuscript.

      b. Let alone the 10 most?

      c. why should we expect allostery to be in the most collective modes? Residues that are allosterically coupled are expected to display correlated motions. The slow modes (formerly referred to as “collective modes”) are generally the most collective ones, i.e., display the greatest degree of concerted motions. We therefore expect these modes to contain the allosteric information.

      d. Furthermore, as now explained in the text (lines 163-69) and in Figure S1 the Eigenvalue decays of ATP-free and -bound CFTR demonstrate that the 10 slowest GNM modes sufficiently represent the entire dynamic spectrum (the distribution converges after the 10th slow mode).

      e. Why not do a mode by mode analysis? It is entirely possible to do a mode-by-mode analysis. However, our view is that the allosteric dynamics of a protein is best represented by an ensemble of modes, rather than by individual ones. We found (as detailed here PMID 32320672) that it is more informative to first use the complete set of modes that encompasses the dynamics (the 10 slowest modes in our case) and then gradually remove the dominant modes.

      f. As explained in text (lines 254-7) and more elaborately in our previous work (PMID 35644497), the large amplitude of the slowest modes may hide the presence of “faster” modes that may nevertheless be of functional importance. Removal of the 1-2 slowest modes often helps reveal such modes.

      g. Why, for example, were two modes removed page 9 first full paragraph? As explained for the ATP-free form (lines 257-60), removal of these two slowest modes allowed the “surfacing” of dynamic features which were hidden before. We propose that these dynamic features are functionally relevant (see lines 304-19). Removal of other modes did not provide additional insight.

      Minor issues:<br /> 1. Statements like "see shortly below" should be made more specific (or removed completely).

      Corrected as suggested

      1. "interfered" should be "inferred" page 10 middle of the first full paragraph

      Corrected as suggested

      1. End parenthesis after "(for an excellent explanation about the correlation between TE and allostery see (41)." Page 4 middle of first full paragraph

      Corrected as suggested

      Reviewer #2 (Public Review):

      In this study, the authors used ANM-LD and GNM-based Transfer Entropy to investigate the allosteric communications network of CFTR. The modeling results are validated with experimental observations. Key residues were identified as pivotal allosteric sources and transducers and may account for disease mutations.

      The paper is well written and the results are significant for understanding CFTR biology.

      Reviewer #2 (Recommendations For The Authors):

      Technical comments:

      p4 Please explain how is the time delay parameter tau chosen (ie. three times the optimum tau value...)? It seems this unknown time should depend on the separation between i and j. Is the TE result sensitive to the choice of tau? How does the choice of cutoff distance of GNM affect the TE result?

      a. The choice of τ is important: when τ is too small, only local cause-and-effect relations (between adjacent amino acids) will be revealed. if τ is too big, few (if any) cause-and-effect relations will manifest. This is analogous to the effects of a stone throne into a lake: look too soon, before the stone hits the water, and you’ll see no ripples. Look too late, the ripples will have already subsided. In a previous work (PMID 32320672), we studied in detail the effects of choosing different τ values and found that an optimal value of τ which maximizes the degree of collectivities of net TE values is in most cases 3× τopt (τopt is the time window in which the total TE of residues is maximized). Details of how τ was chosen were added to the methods section.

      b. To test the sensitivity of the results to the cutoff distance we repeated the calculations using 7 Å. As now discussed in lines 170-173 and shown in Figure S2 the results remained largely unchanged.

      It would be nice to directly validate the causal prediction by GNM-based TE. For example, is it in agreement with direct causal observation of MD simulation? If the dimer is too big for MD, perhaps MD is more feasible for the monomer (NBD1+TMD1).

      a. The causality we determined using GNM-based TE is in good agreement with conclusions drawn from single channel electrophysiological recordings and rate-equilibrium free-energy relationship analysis (Sorum et al; Cell 2015, and see lines 8691, and 364-70).

      b. To the best of our knowledge, causality relations in CFTR are yet to be determined by MD simulations (This is likely because the protein is too big and the conformational changes are very slow). We cannot therefore compare the causality.

      c. Conducting MD simulations on half of CFTR (NBD1+TMD1) is not likely to be very informative: the ATP binding sites are formed at the interface of NBD1 and NBD2, and the ion translocation pathway at the interface of the TMDs.

      p5 How are the TE peak positions different from other key positions as predicted by GNM, such as the hinge positions with minimal mobility of the dominant GNM modes?

      Following this comment, we compared the positions of the GNM-TE peaks and the hinge positions as determined by GNM. As now discussed in lines 173-178 and shown in Figure S3 we observed partial overlap which was nevertheless statistically significant (Figure S3).

      p7 How to select the 10 most collective GNM modes? Why not use the 10 slowest GNM modes?

      We have actually used the 10 slowest GNM modes, but in an attempt to cater for the non-specialist reader, we referred to them as the most collective ones. This has now been corrected throughout the manuscript and the terminology that is now used is “10 slowest modes”

      p9 There exist other ANM-based methods for conformational transition modeling. So it would be nice to discuss their similarity and differences from ANM-LD, and compare their predictions.

      Alternative ANM (and other elastic network models) -based methods are now mentioned and referenced in lines 144-50. These methods are different from ANM-LD in the details of the all atom simulations and in their integration with the elastic network model. It is not trivial to reanalyze CFTR’s allostery using these methods and is beyond the scope of this work.

      Regarding the prediction of order of residue motions, can one directly observe such order by superimposing some intermediate conformation of ANM-LD with the initial and end structure?

      This would indeed be very attractive approach to visualize the order of events and following this comment we have tried to do just so. Unfortunately, we failed: Superimposing pairs of frames provided little insight, and we therefore compiled a video comprising all frames, or videos based on averages of several time delayed frames. We found that it is next to impossible to discern (using the naked eye) the directionality of the fluctuations and follow the order of conformational changes. Therefore, at this point, we have abandoned this endeavor.

      Reviewer #3 (Public Review):

      This study of CFTR, its mutants, dynamics, and effects of ATP binding, and drug binding is well written and highly informative. They have employed coarse-grained dynamics that help to interpret the dynamics in useful and highly informative ways. Overall the paper is highly informative and a pleasure to read.

      The investigation of the effects of drugs is particularly interesting, but perhaps not fully formed.

      This is a remarkably thorough computational investigation of the mechanics of CFTR, its mutants, and ATP binding and drug binding. It applies some novel appropriate methods to learn much about structure's allostery and the effects of drug bindings. It is, overall, an interesting and well written paper.

      There are only two main questions I would like to ask about this quite thorough study.

      Reviewer #3 (Recommendations For The Authors):

      1. Is it possible that the relatively large exothermic ATP hydrolysis itself exerts a force that causes the observed transitions? Jernigan and others have explored this effect for GroEL and some other structures. The effects of ATP binding and hydrolysis are likely often confused, and both are likely to be important.

      It is well established by many studies that ATP hydrolysis is not required to drive the conformational changes or to open the channel, and that ATP binding per-se is sufficient (e.g., We have clarified this point in lines 521-30.

      1. For the case of ivacaftor, would a comparison of the motion's directions show that ivacaftor might be compensating simply by its mass being located in a site to compensate for the mass changes from the mutations (ENMs with masses needed to address this). We have observed such cases on opposite sides of a hinge.

      We do not think that this is the case, from the following reasons:

      a. Ivacaftor corrects many gating mutations (e.g., G551D, G178R, S549N, S549R, G551S, G970R, G1244E, S1251N, S1255P, G1349D) which are spread all over the protein. Ivacaftor binds to a single site in CFTR, and it is therefore unlikely that its mass contribution corrects all these diverse mass changes.

      b. The residues that comprise the Ivacaftor binding were identified as allosteric “hotspots” in both the ATP-free and -bound forms (Figures 2B, 3B, and 6A), also in the absence of the drug. This indicates that the dynamic traits of this site is intrinsic to it, and that once bound, the drug acts by modulating these dynamics

      The Abstract does not repeat some of the more interesting points made in the paper and would benefit from a substantial revision.

      Corrected as suggested

      There are just a few minor points (just words):

      P 3 line 2 of first full ¶: "effects" should be "affects"

      Corrected as suggested

      P 6 first lilne "per-se" should be "per se"

      Corrected as suggested

      Further down that page "two set" should be "two sets"

      Corrected as suggested

      Even further down that same page "testimony" should be "support"

      Corrected as suggested

      P 10, 5 lines from the bottom "impose that" is awkward

      Changed to “define”

    1. Author Response

      The following is the authors’ response to the original reviews.

      Public Reviews:

      Reviewer #1 (Public Review):

      The authors have previously employed micrococcal nuclease tethered to various Mcm subunits to the cut DNA to which the Mcm2-7 double hexamers (DH) bind. Using this assay, they found that Mcm2-7 DH are located on many more sites in the S. cerevisiae genome than previously shown. They then demonstrated that these sites have characteristics consistent with origins of DNA replication, including the presence of ARS consensus sequences, location of very inefficient sites of initiation of DNA replication in vivo, are free of nucleosomes, they contain a G-C skew and they locate to intergenic regions of the genome. The authors suggest, consistent with published single molecule results, that there are many more potential origins in the S. cerevisiae genome than previously annotated.

      The results are convincing and are consistent with prior observations. The analysis of the origin associated features is informative.

      Reviewer #2 (Public Review):

      By mapping the sites of the Mcm2-7 replicative helicase loading across the budding yeast genome using high-resolution chromatin endogenous cleavage or ChEC, Bedalov and colleagues find that these markers for origins of DNA replication are much more broadly distributed than previously appreciated. Interestingly, this is consistent with early reconstituted biochemical studies that showed that the ACS was not essential for helicase loading in vitro (e.g. Remus et al., 2009, PMID: 19896182). To accomplish this, they combined the results of 12 independent assays to gain exceptionally deep coverage of Mcm2-7 binding sites. By comparing these sites to previous studies mapping ssDNA generated during replication initiation, they provide evidence that at least a fraction of the 1600 most robustly Mcm2-7-bound sequences act as origins. A weakness of the paper is that the group-based (as opposed to analyzing individual Mcm2-7 binding sites) nature of the analysis prevents the authors from concluding that all of the 1,600 sites mentioned in the title act as origins. The authors also show that the location of Mcm2-7 location after loading are highly similar in the top 500 binding sites, although the mobile nature of loaded Mcm2-7 double hexamers prevents any conclusions about the location of initial loading. Interestingly, by comparing subsets of the Mcm2-7 binding sites, they find that there is a propensity of at least a subset of these sites to be nucleosome depleted, to overlap with at least a partial match to the ACS sequence (found at all of the most well-characterized budding yeast origins), and a GC-skew. Each of which is a characteristic of previously characterized origins of replication.

      Overall, this manuscript greatly broadens the number of sites that are capable of loading Mcm2-7 in budding yeast cells and shows that a subset of these additional sites act as replication origins. Although these sites do have a propensity to include a match to the ACS, these studies suggest that the mechanism of helicase loading in yeast and multicellular organisms is more similar than previously thought.

      Reviewer #1 (Recommendations For The Authors):

      Specific Comments:

      1. The proposal, based on this study, that replication in S. cerevisiae is similar to that in Human cells (mentioned in the abstract, introduction and end of discussion) is not supported by the evidence, either in this paper or elsewhere. The authors suggest that even these inefficient origins are directed by specific sequences that load Mcm2-7 DH, but there is no evidence that this occurs outside a limited clade of budding yeasts and certainly no in human cells. Furthermore, the distribution and efficiency of origins of replication Human cells has not been shown to parallel the findings in this paper. Thus, the conclusion should be removed since it makes a statement that S. cerevisiae and Human cells have similar mechanisms for origin location. This might confuse non-specialists who do not appreciate the subtleties.

      The reviewer's concern that we could confuse non-specialists is well-founded. We have made the following changes to emphasize the point that, while a wider distribution of origins makes S phase in yeast more like that in humans, the genome replication programs in the two organisms remain distinctly different:

      1) The last sentence of the abstract was changed as follows:

      a. These results shed light on recent reports that as many as 15% of replication events initiate outside of known origins, and they reveal S phase in yeast to be surprisingly similar to that in humans.

      b. These results shed light on recent reports that as many as 15% of replication events initiate outside of known origins, and this broader distribu5on of replica5on origins suggest that S phase in yeast may be less dis5nct from that in humans than is widely assumed.

      1. A sentence in the results was changed as follows:

      a. Another characteris5c of known origins that we could use as a criterion to assess the nature of Mcm binding sites is the presence of an ACS.

      b. Another characteris5c of known origins in S. cerevisiae (although not in most other organisms) that we could use as a criterion to assess the nature of Mcm binding sites is the presence of an ACS.

      1. We changed the last sentence of the Discussion as follows:

      a. On the other hand, the sharply focused nature of its replication origins made S phase in yeast appear distinct from that in other organisms. Our discovery that sites of replica5on ini5a5on in yeast are much more widely dispersed than previously believed, with at least 1600 and possibly as many as 5500 origins, emphasizes its continued relevance to understanding genome duplication in humans.

      b. On the other hand, the sharply focused nature of its replication origins made S phase in yeast appear dis?nct from that in other organisms. Although by no means elimina5ng this dis5nc5on, our discovery that sites of replication ini5a5on in yeast are much more widely dispersed than previously believed, with at least 1600 and possibly as many as 5500 origins, emphasizes yeast's continued relevance to understanding S phase in humans.

      1. The authors discuss in the introduction that origins in S. cerevisiae are equivalent to ARS sequences. Why didn't they ask if the inefficient origins also confer ARS activity? This would be a valuable addition and a very simple experiment.

      The inefficient origins are not expected to confer ARS activity, because origins that are not licensed in essentially every G1 will be diluted out by cell division. We confirmed the absence of our inefficiently licensed origins in a data set generated by high throughput sequencing of a genomic library that was selected for origin activity (PMID: 23241746), but we did not note the results of this analysis in our manuscript, because the low complexity of the library used made this negative result uninformative. To clarify this point, we added the bolded clauses to the following sentences in the Introduction and Discussion:

      1. Origins vary widely in their efficiency, with some being used in almost every cell cycle while others may be used in only one in one thousand S phases (Boos and Ferreira, 2019), with only the former being capable of supporting plasmid replication in the traditional ARS assay.
      2. "Thus, we can detect Mcm complexes that are loaded in as few as 1 in 500 cells (Foss et al., 2021), even though such low affinity Mcm binding sites are not expected to be capable of supporting autonomous replication of a plasmid."
      1. While the authors have shown that Mcm2-7 is loaded adjacent to the principal ARS consensus sequence, consistent with biochemical studies on pre-RC assembly, two reports have shown that the Mcm2-7 ChIP is dependent on the B2 element of ARS1, but the ORC ChIP is not, suggesting that Mcm2-7 is loaded there (See Lipford and Bell, Mol. Cell 2007 and Zou and Stillman, Mol. Cell. Biol. 2000).

      We have added the following two sentences in the Results section to note these reports:

      "Furthermore, in the case of ARS1, two reports have demonstrated a requirement for the B2 element for Mcm loading, though not for Orc binding, suggesting that Orc may bind to the ACS but then load Mcm at the B2 element (Zou and Stillman 2000; Lipford and Bell 2001). This would still leave Mcm loaded downstream of the ACS, but we note this result to emphasize that not all details of Mcm loading in vitro have been definitively established."

      **Reviewer #2 (Recommendations For The Authors):>>

      Specific points:

      1. The authors state "It is notable that the Mcm-ChEC panel of Figure 3A shows no obvious change in Mcm stoichiometry across the entire range, from low abundance, at the bottom, to high abundance, at the top." The ChEC method does not intrinsically measure stoichiometry so this conclusion needs more explanation. The authors appear to be referring to the distribution of Mcm2-7 reads being similar across all origins, but this does not measure how many double hexamers are present at an origin. If the stoichiometry argument is based on a finding that each origin has only a single 60 bp region that is protected by Mcm2-7 (rather than a distribution of 60 bp regions spread across the origin), then the authors should provide more compelling evidence than what is shown in Fig. 3A.

      We agree with the reviewer that our conclusion needs more explanation, and we have therefore made the following change, which we believe clarifies the point that we were trying to convey:

      We agree with the reviewer that our conclusion needs more explanation, and we have therefore made the following change, which we believe clarifies the point that we were trying to convey:

      1. Original version: It is notable that the Mcm-ChEC panel of Figure 3A shows no obvious change in Mcm stoichiometry across the entire range, from low abundance, at the bottom, to high abundance, at the top. This argues against models in which higher replication activity at more active origins reflect the loading of more Mcm double-hexamers at those origins within a single cell.

      2. Updated version: It is notable that, when Mcm is present, it is present predominantly as a single double-hexamer (right panel of Figure 3A), and that this remains true across the entire range of abundance shown in Figure 3A. This argues against models in which higher replication activity at more active origins is caused by the loading of more Mcm double-hexamers at those origins within a single cell, since such models predict that multiple Mcm footprints should be more prevalent at the top (high abundance) of the Mcm-ChEC heat map in Figure 3A than at the bottom.

      1. The authors state "we estimate that ~1-2 % cells have an Mcm complex loaded at the Mcm binding sites in the eighth cohort (ranks 1401-1600)" but it is not clear how this estimate is calculated. An explanation would help the reader to understand this statement.

      We have expanded on our earlier statement to clarify how we arrived at the estimate:

      1. Original version: Based on our previous analysis of MCM occupancy (Foss et al., 2021), which showed that approximately 90% cells have an MCM complex loaded at one of the most active known replication origins, we estimate that ~1-2 % cells have an Mcm complex loaded at the Mcm binding sites in the eighth cohort (ranks 1401-1600).

      2. Updated version: We have previously used Southern blodng to demonstrate that approximately 90% of the DNA at one of the most active known origins (ARS1103) is cut by Mcm-MNase (Foss et al., 2021), and to thereby infer that 90% of cells have a doublehelicase loaded at this origin. Using this as a benchmark, we estimate that ~1-2 % cells have an Mcm complex loaded at the Mcm binding sites in the eighth cohort (ranks 14011600).

      1. Although there is evidence that some subset of the CMBS sites exhibit nucleosome depletion, an ACS, and a GCskew, the authors should do a better job of making the reader aware that it is likely that a decreasing percentage of the individual origins in a group include these characteristic and that this is a likely factor explaining the increasingly rare use of these sites as Mcm2-7 loading sites and origins of replication.

      We have added the following text to the Discussion to draw the reader's attention to this possibility, while also noting that we do not believe it to be a major factor in the increasingly rare use of sites within the first 5,500 CMBSs as replication origins:

      Furthermore, it is possible that, as one moves to lower abundance groups of CMBSs within the most abundant 5500 sites, a smaller fraction of sites within those groups have any origin function at all. If one takes this model to the extreme, it would suggest that the continuous decline in replication activity seen in Figure 2B between the group comprised of ranks 1-200 and that comprised of ranks 1401-1600 reflects an ever increasing fraction of CMBSs with zero origin activity. At the other extreme, the decline in replication activity could be interpreted within a framework in which 100% of CMBSs in each group function as replication origins, but that their replication activity declines with rank, perhaps because continuously decreasing fractions of cells in the population contain a single double-hexamer. While the truth presumably lies between these two extremes, we favor a model that tilts toward the latter view, because of the abruptness of the transition that appears around rank 5,000 in (1) nucleosomal architecture (Figures 3A, 3B and S3); (2) intergenic versus genic localization and transcription levels (Figure 4A); (3) EACS position weight matrix scores (Figure 5B); and (4) GC skew (Figure 6B). By these criteria, the CMBSs below rank 5000 appear relatively homogeneous, while still showing a gradual decline in replication activity with MCM abundance within the range of detection (11600). Our assumption is that the qualitative homogeneity is more consistent with a quantitative, but not qualitative, change in CMBSs with declining MCM abundance among the top 5000 CMBSs.

      1. The argument that there are as many as 5,500 origins is not well justified. Similarly, the evidence that there are even 1,600 origins is not compelling. As the authors state, to see the peaks observed in the various analyses (ssDNA association, nucleosome depletion, etc.) of the increasingly less populated CMBSs (e.g. those with fewer ChEC reads), only a small subset of the CMBS are likely to have a given characteristic. Given that the loading of a Mcm2-7 double hexamer makes any site a potential origin, it would be more appropriate to say that there could be as many as 5,500 potential origins but many if not most are unlikely to ever direct initiation.

      The reviewer is correct that, because many of our analyses rely on group averages rather than individual measurements, we are oien unable to make statements that can be applied to every member of a group. We had tried to emphasize this point in our original manuscript with the following two sentences (in bold), which were in the Results and Discussion, respectively:

      1. First, clear peaks of ssDNA signal extend down to the eighth cohort (brown line), which corresponds to CMBSs ranked 1401-1600. Of course, this does not imply that all of these sites function as replication origins, and nor does it imply that no sites below that rank do so, since we have reached the limits of detection of this ssDNA-based assay. Nonetheless, it suggests that replication activity is common among sites extending at least down to rank 1600.

      2. Of course, we do not conclude that all CMBSs with ranks lower than 5500 function as replication origins, nor that none with ranks above 5500 do so, but only that the number of replication origins is likely to be approximately an order of magnitude higher than widely believed.

      We have now added a third sentence to further underline this point (in bold):

      Second, by averaging signals of replication from multiple Mcm binding sites, we were able to extract weak signals of replication. This is due to the fact that noise, which is randomly distributed, will tend to cancel itself out, while signals of replication will consistently augment the signal at the midpoint of the origin (Figure 2). An inevitable shortcoming to this approach is that it precludes analysis of specific sites; in other words, not every member of the group will share the average characteristic of that group.

      A separate issue that this touches on is the distinction between a replication origin and a site at which Mcm2-7 has been loaded. While it strikes us as unlikely that a loaded Mcm complex would be completely incalcitrant to activation, it is a formal possibility. To alert the reader to this issue, we have added the following clause, in bold, to the Abstract, and we have also added the sentence below that to the Discussion:

      We conclude that, if sites at which Mcm double-hexamers are loaded can function as replication origins, then DNA replication origins are at least 3-fold more abundant than previously assumed, and we suggest that replication may occasionally initiate in essentially every intergenic region.

      Finally, it is important to note that, in equating Mcm binding sites with potential replication origins, we are assuming that if an Mcm double-hexamer is loaded onto the DNA, then it is conceivable that that complex can be activated.

      1. The author's discussion of the relationship between Mcm2-7 location relative to the ACS and the mechanism of of Mcm2-7 loading does not consider that Mcm2-7 double hexamers can slide on DNA after loading (for example, Remus et al., 2009 PMID: 19896182). Thus, the authors are not looking at sites of loading only the distribution of Mcm2-7 molecules after loading. In addition, biochemical experiments do not predict a particular Mcm2-7 position relative to the ACS. Indeed, at ARS1, one would predict that the close proximity of the second weak match to the ACS (the B2 element) to the primary ACS would lead the Mcm2-7 double hexamer being initially formed at a site overlapping the ARS1 ACS. It is much more likely that the explanation for the distribution of Mcm2-7 locations relative to the ACS is that the ORC-bound ACS and the nucleosomes immediately flanking the origin prevents Mcm2-7 from occupying the right-side of the origin as illustrated in Fig. 5D.

      We have tried to emphasize this point more clearly. In our original manuscript, we had brought up the possibility of Mcms sliding after being loaded in the following context (see bolded clause):

      Specifically, in 112 out of 146 instances in which a peak of Mcm signal was within 100 base pairs of a known ACS, that peak was downstream of the ACS. The 34 exceptions may reflect (1) incorrect identification of the ACS; (2) incorrect inference of the directionality of the site; or (3) sliding of the Mcm complex after it has been loaded.

      We have now added the following to further emphasize the point:

      In interpreting the results above, it is important to remember that the locations at which we are detecting Mcm complexes by ChEC do not necessarily reflect the locations at which those complexes were loaded, since Mcm double-hexamers can slide along the DNA after loading (Remus et al. 2009; Gros et al. 2015; Foss et al. 2019).

      We have also softened the following conclusion by changing "confirmation of" to "support for":

      "...our results...provide in vivo support for in vitro predictions of the directionality of Mcm loading by Orc..."

      There are missing references in several places:

      1. "For example, 15 of the 56 genes that contained a high abundance site have been implicated in meiosis and sporulation and are not expressed during vegetative growth (~5 out of 56 expected from random sampling), consistent with previous observations (Mori and Shirahige, 2007)." Should include Blitzblau et al., 2012 (PMC3355065) which showed that Mcm2-7 loading was impacted by differences in meiotic and mitotic transcription.

      2. "In contrast to the low abundance sites, the most abundant 500 sites showed a preference for convergent over divergent transcription (left of vertical dotted line in Figure 4B), in agreement with a previous report (Li et al., 2014)." This preference was first pointed out in MacAlpine and Bell, 2005 (PMID: 15868424).

      3. "This sequence is recognized by the Origin Recognition Complex (Orc), a 6-protein complex that loads MCM (Broach et al., 1983; Deshpande and Newlon, 1992; Eaton et al., 2010; Kearsey, 1984; Newlon and Theis, 1993; Singh and Krishnamachari, 2016; Srienc et al., 1985)." This list should include a reference to Bell and Stillman, 1992 (PMID: 1579162), which first described ORC and showed that it recognized the ACS. It would also be more helpful to the reviewer to distinguish the references that identified that ACS from those concerning ORC binding to it.

      We thank the reviewer for pointing out these missing references, and we have added them. We have also separated the references that note the identification of the ACS sequence from those that demonstrate Orc binding to that sequence.

    1. Author Response

      The following is the authors’ response to the original reviews.

      Reviewer #1 (Public Review):

      "MAGIC" was introduced by the Rong Li lab in a Nature letters article in 2017. This manuscript is an extension of this original work and uses a genome wide screen the Baker's yeast to decipher which cellular pathways influence MAGIC. Overall, this manuscript is a logical extension of the 2017 study, however the manuscript is challenging to follow, complicated by the data often being discussed out of sequence. Although the manuscripts make claims of a mechanism being pinpointed, there are many gaps and the true mechanisms of how the factors identified in the screen influence MAGIC is not clear. A key issue is that there are many assumptions drawn on previous literature, but central aspects of the mechanisms being proposed are not adequately shown.

      Key comments:

      1. Reasoning and pipelines presented in the first two sections of the results are disordered and do not follow figure order. In some instances, the background to experimental analyses such as detailing the generation of spGFP constructs in the YKO mutant library, or validation of Snf1 activation are mentioned after respective results are discussed. This needs to be fixed.

      We thank the reviewer for pointing out potential confusion to readers. We have revised the first two sections according to reviewer’s suggestion. (Page 4-6)

      1. In general there is a lack of data to support microscopy data and supporting quantification analysis. The validity of this data could be significantly strengthened with accompanying western blots showing accumulation of a given constructs in mitochondrial sub compartments (as was the case in the lab’s original paper in 2017).

      We appreciate the reviewer’s suggestion on biochemical validations. However, the validity of this imaging-based assay for detecting import of cytosolic misfolded proteins into mitochondria, including the use of FlucSM as a model misfolding-prone protein, was carefully established in our previous study by using appropriate controls, super resolution imaging, APEX-based proximity labeling, and classical biochemical fractionation and protease protection assay (Ruan et al., 2017 Nature, ref. 10). We have reminded readers of these validation experiments in the previous study on Page 4, line 14-17.

      In recent years, advancements in imaging-based tools have allowed many protein interactions and dynamic processes, which were previously examined by using biochemical assays in lysates of populations of cells, to be observed with various level of quantitation in live cells with intact cellular compartments. Many of these assays, e.g., the RUSH assay for ER to Golgi transport, FRAP-based analysis for nuclear/cytoplasmic shuttling of proteins, or FRET-based assays for protein-protein interactions, have been well accepted and even embraced by the respective fields of study once validated with genetic and biochemical approaches. The advantages for live-cell imaging-based assays are often their unique ability to report dynamic processes or unstable molecular species with spatiotemporal sensitivity. Respectfully, it is our view, based on our own experience, that the traditional protease protection assay is not adequate or sufficiently quantitative for examining the presence of unstable misfolded proteins in mitochondrial sub-compartments, given the obligatorily lengthy in vitro cell lysis and mitochondrial isolation process, during which the unstable proteins are continuously being degraded. This likely explains our previous biochemical fractionation result that only weak protein signals were detected in the matrix fraction (Ruan et al., 2017 Nature, ref. 10). In addition, unlike stably folded, native mitochondrial matrix proteins, misfolded/unfolded proteins such as Lsg1 or FlucSM are highly susceptible to protease treatment. This sensitivity makes the assay unreliable for detecting such proteins if trace amount of the protease penetrates mitochondrial membranes during cell lysis even without detergent treatment.

      While we agree that protease protection assay is highly valuable for qualitative detection of the presence of a protein in certain mitochondrial compartments or determining its topology on membranes, this assay (regrettably in our hands) does not allow quantitative comparisons that were necessary for this study, because of inherent sample to sample variation, yet the laborious and low throughput nature of this assay makes it difficult for adequate statistical analysis. Furthermore, the level of protein detection in various fractions is highly sensitive to how the sample is treated with protease and detergent. Our imaging-based quantification, on the other hand, allows us to compare increased or decreased presence of GFP11-tagged proteins in mitochondria under different metabolic conditions or in different mutant or wild-type strains. Data from hundreds of cells and at least three independent biological replicates allowed us to apply adequate statistical analysis to aid our conclusion.

      1. Much of the mechanisms proposed relies on the Snf1 activation. This is however not shown but assumed to be taking place. Given that this activation is central to the mechanism proposed, this should be explicitly shown here - for example survey the phosphorylation status of the protein.

      Both REG1 deletion and low glucose conditions have been demonstrated extensively for Snf1 phosphorylation and activation in yeast (e.g., many seminal papers from Marian Carlson’s and other lab, such as ref. 24-28). In our study, we have indeed corroborated this by showing that Mig1 was exported from the nucleus in Δreg1 mutant and in low glucose conditions (Figure 1—figure supplement 2H and I. The mechanism of Snf1-mediated nuclear export of Mig1 has been characterized in detail as well (e.g., ref. 29-31).

      Recommendations for the authors: please note that you control which, if any, revisions, to undertake

      Reviewer #1 (Recommendations For The Authors):

      SPECIFIC COMMENTS

      Genetic Screen o Line 20 - the narrative moves to SNF1, but the reasoning for the selection of this Class I substrate is not defined. What was the basis for this selection - what happened to the other Class I substrates. It is stated in the text that the other Class I proteins show the same increase in spGFP signal. The data showing this should be included in the Supp Figure 1 for transparency.

      We have moved the narratives of Snf1 function to the second section and clarified that we were interested in this gene due to its central role in metabolism and mitochondrial functions that may influence MAGIC (Page 5: line 16-20). Other genes in class 1 were shown in Table S1. Detailed discussion of other genes in this category is beyond the scope of this study.

      Snf1/AMPK prevents MP accumulation in mitochondria:

      The FlucDM data in human RPE-1 mitochondria seems to be added to only increase the significance of the work. The mechanisms suggested here with Hap4 would not be possible in human cells as there is no homologue of this protein in human cells. Making generalisations that these pathways are conserved based on this one experiment is not appropriate.

      We appreciate this feedback. Although the focus of this study is the regulation of MAGIC by the yeast AMPK Snf1, we would like to share our initial observation that suggests a similar role of AMPK in human RPE-1 cells. We acknowledge that the underlying mechanisms regarding the downstream transcription factors and pathway for misfolded protein import could be different in mammalian cells, but the overall effect of AMPK in mitochondrial biogenesis is well known to resemble that of Snf1. To avoid making over-generalization, we changed our statement of conclusion to: ‘These results suggest that AMPK in human cells regulates MP accumulation in mitochondria following a similar trend as in yeast, although the underlying mechanisms might differ between these organisms.’ (Page 7: line 2-4)

      Mechanisms of MAGIC regulation by Snf1:

      While the lysosome is ruled out here the authors have not considered the proteasomes. Is there a reason for this? Given accumulation of aggregates outside of mitochondria, and previous connections of the proteasome to mitochondrial quality control this would be an obvious thing to check. We examined the role of lysosomal degradation here because it is known to be activated under Snf1active condition (ref. 37). We appreciate this feedback and have included a new analysis on MG132treated FlucSM spGFP strains in which PDR5 gene was deleted to avoid drug efflux.

      This result suggests that the proteosome inhibitor did not ablate the difference in FlucSM accumulation between these conditions. That MG132 promoted mitochondrial accumulation of FlucSM in both high glucose and low glucose conditions was not surprising, as FlucSM is also degraded by proteasome in the cytosol (Ruan et al., 2017 Nature, ref. 10), and preventing this pathway could divert more of such protein molecules toward MAGIC. (Page 7: line 26-29).

      Line 13 "we hypothesized that elevated expression of mitochondrial preproteins induced by the activation of Snf1-Hap4 axis (REF) may outcompete MPs for import channels". This statement has some assumptions. The authors have not shown that Snf1 is activated in thier models and more importantly that they have an accumulation of mitochondrial preproteins. The data that follows using the cytosolic domains of the receptors is hard to rationalise without seeing evidence that there is in fact pre-protein accumulation or impacts on the mitochondrial proteome in this system.

      As stated in our response to main point [3], Snf1 activation in reg1 mutant or in low glucose is evidenced by our data showing Mig1 export from nucleus to cytoplasm and had also been shown in many previous publications. A recent study (Tsuboi et al., 2020 eLife) also showed a dramatic increase in mitochondrial volume fraction in Δreg1 cells and wild-type cells in respiratory conditions, further supporting the role of Snf1 in mitochondrial biogenesis. We have provided relevant references in the manuscript (ref. 24-28).

      The ability of Tom70 cytosolic domain (Tom70cd), which can bind mitochondrial preproteins but not localize to mitochondria due to lack of N-terminal targeting sequence, to compete with endogenous Tom70 for mitochondrial preproteins has been well documented (ref. 47-49). However, we agree with the reviewer that a future quantitative proteomics study to measure changes in mitochondrial proteome under Tom70cd over-expression could allow more accurate interpretation of our experimental result.

      AMPK protects cellular fitness during proteotoxic stress:

      The inhibition of preprotein import by overexpressing the cytosolic domains of receptors is not supported with some proof of principle data. If this was working as the authors assume, it is not clear why only an effect with Tom70 is observed. The majority of the mitochondrial proteome is imported via Tom20/Tom22 so this does not align with what the authors are suggesting. Is the Tom70CD and any associated Hsp proteins facilitating the observed changes to the MPs?

      We thank the reviewer for raising this point. We expressed different TOM receptor cytosolic domains but found that Tom70cd had the strongest rescue on MAGIC under AMPK activation conditions. It is possible that certain Tom70 substrates or Tom70-assoicated heat shock proteins inhibit the import of MAGIC substrates. We admit that a clear explanation of this unexpected observation necessitates a better understanding of how native and MAGIC substrates are selected and imported by the outer-membrane channel. We can only offer our best interpretation based on the current state of the understanding, and we feel that we have been careful to acknowledge such in the manuscript.

      While the effect of AMPK inactivation reducing FUS accumulation was striking, this was all in the context of overexpression and may not be physiologically relevant - or may occur very transiently under basal conditions. Is GST an appropriate control here, why not use WT FUS? Likewise, one representative image is shown in Figure 5 - can the authors show western blotting that mitochondrial accumulation of FUS can be reduced with AMPK activation?

      We thank the reviewer for this suggestion, however, overexpressed FUS WT is also aggregation prone (Zhihui Sun et al., 2011, PloS Biology; Shulin Ju, 2011, PloS Biology; Jacqueline C. Mitchell et., 2013, Acta Neuro). We believe that GST, as a well-folded protein, is an appropriate control (Ruan et al., 2017 Nature, ref. 10). As we discussed in response to main point [1], the in vitro assay involving protease protection and western blots do not allow reliable quantitative comparison in our hands.

      In text changes.

      The analysis pipeline of the YKO mutant library should be introduced at the very start of the first paragraph, not the end.

      Addressed on Page 4, second paragraph

      "Fluc" should be introduced as "Firefly luciferase" within the first paragraph of the first section, also need to define SM and DM in FlucSM/FlucDM - these appear to be missing.

      Addressed in both Introduction (Page 2: line 29; Page 3: line 8-9) and re-clarified in Result (Page 5: line 27-29)

      The role of Reg1 should be explicitly stated in the text, not just in the figure.

      Addressed on Page 6: line 3-6

      Figure 1H legend states Reg1 (WT) is Snf1-inactive and Reg1 KO is Snf1-active. This wording is confusing and is not supported by data, but by assumption. If the authors want to use this wording then evidence needs to be provided - as suggested above.

      We have changed this and other legends to only show genotypes and medium conditions.

      "Tom70cd overexpression also exacerbated growth rate reduction due to FlucSM expression in HG medium (Figure 4A; Figure 4 - figure supplement 1A)" should be figure supplement 1B.

      Fixed on Page 10: line 10

      "These results suggest that glucose limitation protects mitochondria and cellular fitness during FlucSM induced proteotoxic stress through Snf1-dependent inhibition of MP import into mitochondria". The phrase "Snf1-dependent inhibition of MP import into mitochondria" may be misleading, as Snf1 isn't modulating import directly but is acting on transcriptional regulators to modulate mitochondrial import under stress.

      We restated the conclusion as follows: ‘These results suggest that Snf1 activation under glucose limitation protects mitochondrial and cellular fitness under FlucSM-associated proteotoxic stress.’ (Page 10: line 20- 21)

      "... Significantly increased the fraction of spGFP-positive and MMP-low cells in both HG and LG medium (Figure 4G-K)" should be (Figure 4J-K).

      Fixed on Page 11: line 3

      Reviewer #2 (Public Review):

      Work of Rong Li´s lab, published in Nature 2017 (Ruan et al, 2017), led the authors to suggest that the mitochondrial protein import machinery removes misfolded/aggregated proteins from the cytosol and transports them to the mitochondrial matrix, where they are degraded by Pim1, the yeast Lon protease. The process was named mitochondria as guardian in cytosol (MAGIC).

      The mechanism by which MAGIC selects proteins lacking mitochondrial targeting information, and the mechanism which allows misfolded proteins to cross the mitochondrial membranes remained, however, enigmatic. Up to my knowledge, additional support of MAGIC has not been published. Due to that, MAGIC is briefly mentioned in relevant reviews (it is a very interesting possibility!), however, the process is mentioned as a "proposal" (Andreasson et al, 2019) or is referred to require "further investigation to define its relevance for cellular protein homeostasis (proteostasis)" (Pfanner et al, 2019).

      Rong Li´s lab now presents a follow-up story. As in the original Nature paper, the major findings are based on in vivo localization studies in yeast. The authors employ an aggregation prone, artificial luciferase construct (FlucSM), in a classical split-GFP assay: GFP1-10 is targeted to the matrix of mitochondria by fusion with the mitochondrial protein Grx5, while GFP11 is fused to FlucSM, lacking mitochondrial targeting information. In addition the authors perform a genetic screen, based on a similar assay, however, using the cytosolic misfolding-prone protein Lsg1 as a read-out.

      My major concern about the manuscript is that it does not provide additional information which helps to understand how specifically aggregated cytosolic proteins, lacking a mitochondrial targeting signal could be imported into mitochondria. As it stands, I am not convinced that the observed FlucSM-/Lsg1-GFP signals presented in this study originate from FlucSM-/Lsg1-GFP localized inside of the mitochondrial matrix. The conclusions drawn by the authors in the current manuscript, however, rely on this single approach.

      In the 2017 paper the authors state: "... we speculate that protein aggregates engaged with mitochondria via interaction with import receptors such as Tom70, leading to import of aggregate proteins followed by degradation by mitochondrial proteases such as Pim1." Based on the new data shown in this manuscript the authors now conclude "that MP (misfolded protein) import does not use Tom70/Tom71 as obligatory receptors." The new data presented do not provide a conclusive alternative. More experiments are required to draw a conclusion.

      In my view: to confirm that MAGIC does indeed result in import of aggregated cytosolic proteins into the mitochondrial matrix, a second, independent approach is needed. My suggestion is to isolate mitochondria from a strain expressing FlucSM-GFP and perform protease protection assays, which are well established to demonstrate matrix localization of mitochondrial proteins. In case the authors are not equipped to do these experiments I feel that a collaboration with one of the excellent mitochondrial labs in the US might help the MAGIC pathway to become established.

      We thank Reviewer 2 for these suggestions, but we would like to respectfully offer our difference in opinion:

      a. Regarding the suggestion “to isolate mitochondria from a strain expressing FlucSM-GFP and perform protease protection assays”, in our previous study (Ruan et al., 2017 Nature, ref. 10), we have indeed applied two independent biochemical approaches: APEX-mitochondrial matrix proximity labeling and classic protease protection assay using non-spGFP strains, both consistently confirmed the entry of misfolded proteins into mitochondria under proteotoxic stress. Our super-resolution imaging further confirmed the import of the split GFP-labeled proteins to be inside mitochondria. Moreover, as we discussed in response to Reviewer 1’s main point [2], while the suggested biochemical assay is useful for validating topology within mitochondria, it is not quantitative and may not reliably report the in vivo accumulation of misfolded proteins in mitochondria due to the isolation process that takes hours, during which the unstable proteins could be continuously degraded within mitochondria.

      While we agree with the reviewer that we do not yet understand how misfolded proteins are imported into mitochondria, it would be unfair to state “as it stands, I am not convinced..” simply because the underlying mechanism remains to be elucidated. We would like to point out that targeting sequences for many well-established mitochondrial proteins are still not well defined. It is well known that mitochondrial targeting sequences are not as uniformly predictable as, for example, nuclear targeting sequences. Our finding that deletion of TOM6 enhances the import of misfolded proteins suggest that their import may involve the TOM channel in a more promiscuous conformation, which may reduce the requirement for a specific sequence-based targeting signal associated with the substrate.

      b. Regarding the role of Tom70, in our 2017 study, using proteomics and subsequently immunoprecipitation we validated the binding, albeit not necessarily direct, between misfolded protein FlucSM and Tom70. Therefore, “we speculate that protein aggregates engaged with mitochondria via interaction with import receptors such as Tom70”. Recent studies from different labs confirmed the interactions between Tom70 and aggregation prone proteins (Backes et al., 2021, Cell Reports; Liu et al., 2023, PNAS). In the current study, surprisingly, knockout of TOM70 did not block MAGIC, suggesting redundant components of mitochondria import system may facilitate the recruitment of misfolded proteins in the absence of Tom70, and this does not contradict the notion that Tom70 helps tether protein aggregates to mitochondria.

      c. Regarding other studies also showing the import of misfolding or aggregation-prone cytosolic proteins into mitochondria, there have been at least several recent studies in the literature for mammalian cells involving either model substrates or disease proteins (e.g., ref. 12-15; 56-58; Vicario, M. et al. 2019 Cell Death Dis.). The studies are briefly mentioned in Introduction (Page 3, paragraph 2). The present manuscript documents a major effort from our group using whole genome screen in yeast to understand the mechanism and regulation of MAGIC. Many of the screen hits have yet to be studied in detail. We full agree that much remains to be understood about whether and how this pathway affects proteostasis and what might be the evolutionary origin for such a mechanism.

      Additional comments:

      The genetic screen:

      The genetic screen identified five class 1 deletion strains, which lead to enhanced accumulation of Lsg1GFP and a larger set of class 2 mutants, which lead to reduced accumulation. Please note, in my opinion it is not clear that accumulation of the reporters occurs inside the mitochondria. In any case, the authors selected one single protein for further analysis: Snf1, the catalytic subunit of the yeast SNF complex, which is required for respiratory growth of yeast.

      The results of the screen are not discussed in any detail. The authors mention that ribosome biogenesis factors are abundant among class 2 mutants. Noteworthy, Lsg1 is involved in 60S ribosomal subunit biogenesis. As Lsg1-GFP11 is overexpressed in the screen this should be discussed. Class 2 mutants also .include several 40S ribosomal subunit proteins (only one of the 60S subunit). What does this imply for the MAGIC model? Also, it should be discussed that the screen did not identify reg1 and hap4, which I had expected as hits based on the data shown in later parts of the manuscript.

      We apologize for the confusion, but the GFP11 tag was in fact knocked into the C-terminus of Lsg1 in the endogenous LSG1 locus, and so Lsg1 was not overexpressed in the screen. We have made sure that this information is clearly conveyed in the revised manuscript (Page 4: line 20-22). How the ribosome small subunit affects MAGIC is beyond the focus of the current study and will be pursued in the future.

      Regarding why certain mutants did not come out of our initial screen, this is not unexpected as the YKO collection, although extremely valuable to the community, is known to be potentially affected by false knockouts, suppressor accumulation and cross contamination (for references, e.g., Puddu et al., 2019 Nature). Additionally, high-through screens can also miss real hits. In our experience using this collection in several studies, we often found additional hits from analysis of genes implicated by known genetic or biochemical interactions.

      Mutant yeast strains and growth assays:

      The Δreg1 strain grows poorly in all growth conditions and frequently accumulates extragenic suppressor mutations (Barrett et al, 2012). It would be good to make sure that this is not the case in the strains employed in this study. My suggestion is to do (and show) standard yeast plating assays with the relevant mutant strains including Δreg1, snf1, hap4, Δreg1Δhap4 without the split GFP constructs and also with them (i.e. the strains that were used in the assays).

      We thank the reviewer for the suggestion. We were indeed aware of potential accumulation of suppressor mutations from the YKO library. Therefore, deletion mutants like Δreg1 and loss of TFs downstream of Snf1 that we used in the study after the initial screen were all freshly made and validated. At least 3 independent colonies were analyzed for each mutant (mentioned in Methods & Materials; Page 33, line 57). Moreover, the plating assay suggested here may not reveal additional information other than growth, which was taken into consideration during our experiments.

      Activation of Snf1 in the relevant strains should be tested with the commercially available antibody recognizing active Snf1, which is phosphorylated at Snf1-T210.

      Snf1 activation was validated by the Mig1 exporting from the nucleus. We also noted above that many studies have clearly demonstrated Snf1 activation in reg1 mutant and under low glucose growth (e.g., ref. 24-28).

      Effects of Snf1, Reg1, Hap4 and respiratory growth conditions:

      The authors show that split GFP reporters show enhanced accumulation during fermentative growth, in Δsnf1, and Δreg1Δhap4 and fail to accumulate during respiratory growth, in Δreg1 and upon overexpression of HAP4. Analysis of Δhap4 should be included in Fig. 2. The suggestion that upon activation of Snf1 enhanced Hap4-dependent expression "outcompetes" misfolded protein import seems unlikely as only a fraction of mitochondrial genes is under control of Hap4. Without further experimental evidence I do not find that a valid assumption. More likely, the membrane potential plays a role: it is low during fermentative growth, in Δsnf1 and Δreg1Δhap4, and high during respiratory growth and in Δreg1 (Hübscher et al, 2016). Such an effect of the membrane potential seems to contradict the findings in the 2017 paper and the issue should be clarified and discussed. In any case, these data do not reveal that GFP reporters accumulate inside of the mitochondria. Based on the currently available evidence they may accumulate in close proximity/attached to the mitochondria. This has to be tested directly (see above).

      We have included our analysis of Δhap4 in Page 8: line 14-15 and Figure 2—figure supplement 1H. Consistent with our result for Δreg1Δhap4 in glucose-rich medium, HAP4 deletion also resulted in a significant increase in mitochondrial accumulation of FlucSM in low glucose medium compared to WT. It did not have effect in high glucose condition in which Snf1 is largely inactive.

      It is our view that the importance of Hap4 should not be judged by the number of nuclear encoded mitochondrial proteins they regulate. Still, this sub-group comprises a considerable number of proteins (at least 55 genes upregulated by Hap4 overexpression, ref. 43), and certain substrates may be more competitive with misfolded cytosolic proteins for import. Our genetic data strongly suggest that the inhibitory effect of active Snf1 on MAGIC is through Hap4, although we agree with the reviewer that detailed mechanism on how Hap4 substrates may compete with misfolded proteins need to be addressed in future studies.

      Membrane potential is important for mitochondrial import. During respiratory growth and in Δreg1, membrane potential is well known to be elevated comparing to fermentative condition (e.g., Figure 4C). Our observation that the import of misfolded proteins into mitochondria is reduced under these conditions simply suggests that this reduction is not due to a lack of membrane potential. This is not in any way contradictory to our 2017 finding that misfolded protein import requires membrane potential (ref. 10).

      Again, the accumulation of misfolded proteins in mitochondria, especially the model protein FlucSM, has been validated by using super resolution imaging (Figure 1—figure supplement 1A) in addition to the protease protection assay in our 2017 study.

      Introduction and Discussion:

      Both are really short, too short in my view. Please provide some background of the general principals of mitochondrial protein import and information of how exactly translocation of cytosolic, aggregated proteins (lacking targeting information) is supposed to work. I do not understand exactly how the authors actually envisage the process.

      We thank the reviewer for the suggestion. In the revised manuscript, we have extended both Introduction (Page 2-3) and Discussion section (Page 11-13)

      The results from the 2022 eLife paper (Liu et al, 2022), which suggests that Tom70 may "regulate both the transcription/biogenesis and import of mitochondrial proteins so the nascent mitochondrial proteins do not compromise cytosolic proteostasis or cause cytosolic protein aggregation" should be discussed with regard to the data obtained with overexpression of the Tom70 soluble domain.

      We thank the reviewer for pointing out that study and we have included a brief comment in Discussion section (Page 12: line 13-16). As the function of Tom70 appears to be complex, we cannot exclude the possibility that overexpression of the cytosolic domain has additional or indirect effects in addition to that due to preprotein binding.

      Andreasson, C., Ott, M., and Buttner, S. (2019). Mitochondria orchestrate proteostatic and metabolic stress responses. EMBO Rep 20, e47865.

      Barrett, L., Orlova, M., Maziarz, M., and Kuchin, S. (2012). Protein kinase A contributes to the negative control of Snf1 protein kinase in Saccharomyces cerevisiae. Eukaryot Cell 11, 119-128.

      Hubscher, V., Mudholkar, K., Chiabudini, M., Fitzke, E., Wolfle, T., Pfeifer, D., Drepper, F., Warscheid, B., and Rospert, S. (2016). The Hsp70 homolog Ssb and the 14-3-3 protein Bmh1 jointly regulate transcription of glucose repressed genes in Saccharomyces cerevisiae. Nucleic Acids Res. 44, 5629-5645.

      Liu, Q., Chang, C.E., Wooldredge, A.C., Fong, B., Kennedy, B.K., and Zhou, C. (2022). Tom70-based transcriptional regulation of mitochondrial biogenesis and aging. Elife 11

      Pfanner, N., Warscheid, B., and Wiedemann, N. (2019). Mitochondrial proteins: from biogenesis to functional networks. Nat Rev Mol Cell Biol 20, 267-284.

      Ruan, L., Zhou, C., Jin, E., Kucharavy, A., Zhang, Y., Wen, Z., Florens, L., and Li, R. (2017). Cytosolic proteostasis through importing of misfolded proteins into mitochondria. Nature 543, 443-446.

      I prefer to have "all in one", also due to time limitation.

      It would be great to be able to upload the review file as otherwise formatting and symbols get lost.

      Reviewer #3 (Public Review):

      In this study, Wang et al extend on their previous finding of a novel quality control pathway, the MAGIC pathway. This pathway allows misfolded cytosolic proteins to become imported into mitochondria and there they are degraded by the LON protease. Using a screen, they identify Snf1 as a player that regulates MAGIC. Snf1 inhibits mitochondrial protein import via the transcription factor Hap4 via an unknown pathway. This allows cells to adapt to metabolic changes, upon high glucose levels, misfolded proteins an become imported and degraded, while during low glucose growth conditions, import of these proteins is prevented, and instead import of mitochondrial proteins is preferred.

      This is a nice and well-structured manuscript reporting on important findings about a regulatory mechanism of a quality control pathway. The findings are obtained by a combination of mostly fluorescent protein-based assays. Findings from these assays support the claims well.

      While this study convincingly describes the mechanisms of a mitochondria-associated import pathway using mainly model substrates, my major concern is that the physiological relevance of this pathway remains unclear: what are endogenous substrates of the pathway, to which extend are they imported and degraded, i.e. how much does MAGIC contribute to overall misfolded protein removal (none of the experiments reports quantitative "flux" information). Lastly, it remains unclear by which mechanism Snf1 impacts on MAGIC or whether it is "only" about being outcompeted by mitochondrial precursors.

      We thank Reviewer 3 for the positive and encouraging comments on our manuscript. We agree with the reviewer that identifying MAGIC endogenous substrates and understanding what percentage of them are degraded in mitochondria are very important issues to be addressed. We are indeed carrying out projects to address these questions. We also agree with Reviewer 3 that the effect of Snf1 on MAGIC may have additional mechanisms in addition to precursors competition, such as Tom6 mediated conformational changes of TOM pores. In the revised manuscript, we had added a discussion to address these comments (Page 12: line 21-28).

      Reviewer #3 (Recommendations For The Authors):

      1. In their screen, the authors utilize differences in GFP intensity as a measure for import efficiency. However, reconstitution of the GFP from GFP1-10 and GFP11 in the matrix might also be affected (folding factors, differential degradation).

      Upon Snf1 activation, the protein abundance of mitochondrial chaperones such as Hsp10, Hsp60, and Mdj1, and mitochondrial proteases such as Pim1 are not significantly changed (ref. 35). Therefore, it is unlikely that the folding and degradation capacity of mitochondrial matrix is drastically affected by Snf1 activation.

      To examine the effect of Snf1 activation on spGFP reconstitution, Grx5 spGFP strain was constructed in which the endogenous mitochondrial matrix protein Grx5 was C-terminally tagged with GFP11 at its genomic locus, and GFP1-10 was targeted to mitochondria through cleavable Su9 MTS (MTS-mCherryGFP1-10) (ref. 10). Only modest reduction in Grx5 spGFP intensity was observed in LG compared to HG, and no significant difference after adjusting the GFP1-10 abundance (spGFP/mCherry ratio) (Figure 1— figure supplement 3A-D). These data suggest that any effect on spGFP reconstitution is insufficient to explain the drastic reduction of MP accumulation in mitochondria under Snf1 activation. Overall, our results demonstrate that Snf1 activation primarily prevents mitochondrial accumulation of MPs, but not that of normal mitochondrial proteins. (Page 6: line 17-25).

      We admit, however, that to fully rule out these factors, specific intra-mitochondrial folding or degradation reporter assays would be needed.

      1. Scoring of protein import always takes place using fluorescence-based assays. These always require folding of the "sensors" in the matrix. An additional convincing approach that would not rely on matrix folding could be pulse chase approaches coupled to fractionation assays and immunoprecipitation.

      We thank reviewer 3 for this suggestion. In our previous study, we applied two different biochemical assays: APEX proximity labeling, and mitochondrial fractionation followed by protease protection. Both confirmed the entry of misfolded proteins into mitochondria as observed by using split GFP. As we discussed in response to Reviewer 1’s main point [3], the fractionation assays are not quantitative enough for the comparisons made in our study. In particular, during the over 2-hour assay, misfolded proteins continue to be degraded within mitochondria. By using proper controls, our spGFP system provides quantitative comparisons for mitochondrial accumulation of misfolded proteins in non-disturbed physiological conditions.

      1. Could the pathway be reconstituted in vitro with isolated mitochondria to test for the "competition hypothesis"

      This is an excellent suggestion, but setting up such a reconstituted system is a project on its own. The study documented in this manuscript already encompasses a large amount of work that we feel should be published timely.

      1. Fluorescence figures are not colour blind friendly (red-green). This should be improved by changing the color scheme.

      We thank reviewer 3 for pointing this out and sincerely apologize for any inconvenience. However, we are unfortunately unable to change all images within a limited time. We will adopt another color scheme in future work.

      1. spGFP in human cells appears to form "spot-like" structures. What are these granules?

      We indeed observed granule-like structures by spGFP labeled FUS in mitochondria, which is interesting, but we did not investigate this further because it is a not a focus of this study.

    1. Author Response

      The following is the authors’ response to the original reviews.

      Response to Reviewers

      To whom it may concern, Thank you for your constructive feedback on our manuscript. I appreciate the time and effort that you and the reviewers have dedicated to providing your valuable feedback. We are grateful to the reviewers for their insightful comments and suggestions for our paper. I have been able to incorporate changes to reflect the majority of these suggestions provided. I have updated the analysis scripts (at https://github.com/neurogenomics/reanalysis_Mathys_2019) and have listed these changes in blue below:

      eLife assessment:

      This work is useful as it highlights the importance of data analysis strategies in influencing outcomes during differential gene expression testing. While the manuscript has the potential to enhance awareness regarding data analysis choices in the community, its value could be further enhanced by providing a more comprehensive comparison of alternative methods and discussing the potential differences in preprocessing, such as scFLOW. The current analysis, although insightful, appears incomplete in addressing these aspects.

      We thank the reviewing editors for this note. We agree that the differences in preprocessing will affect the results and conceal which step in our reanalysis resulted in the discrepancies we noted. To address this, we have split out our reanalysis into two separate parts - In the main body of the text we discuss the differences resulting from just changing the differential expression approach where we use the same processed data as the authors to enable a fair comparison. Secondly, we still provide the reprocessed data and perform differential expression analysis on it and discuss the cause and impact the differences in the processing steps made to the results.

      Reviewer 1:

      I think readers would be interested to learn more about the genes that were found "significant" by the original paper but sorted out by the authors. Did they just fall short of the cutoffs? If so, how many more samples would have been required to ascertain significance? This would yield a recommendation for future studies and an overall more positive/productive spirit to the manuscript. On the other hand, I suspect a fraction of DEGs were false positives due to differences in the proportions of cells from different individuals compared to the original analysis. Which percentage of DEGs does this apply to? Again, this would raise awareness of the issue and support the use of pseudobulk approaches.

      To investigate the relationship between the genes and how they differ across our analysis we have added a correlation analysis between our different DE approaches (using the same processed data), see paragraph 5 in the manuscript and supplementary table 3. In short, we find that there is a high correlation in the genes’ fold change values across our pseudobulk analysis and the author’s pseudoreplication analysis on the same dataset (pearson R of 0.87 for an adjusted p-value of 0.05) which is somewhat expected given the DE approaches are applied to the same dataset. However, the p-values, which pertain to the likelihood that a gene’s expressional changes is related to the case/control differences in AD, and resulting DEGs vary considerably due to the artificially inflated confidence of the author’s approach (Fig. 1c-e). Despite there being a correlation between the pseudoreplciation and pseudobulk approaches here, we do not think it makes sense to consider how many more samples would have been required to ascertain significance. The differences in results between the two approaches is not negatable with sample size as many DEGs identified by pseudoreplication will be false positives as highlighted in previous work1,2,3,4. However, perhaps we are misinterpreting the reviewer, who may have meant a power analysis which we have not conducted. Such an undertaking would require analysing a multitude of snRNA-Seq of large sample sizes to garner a confident estimate for power calculations based on pseudobulk approaches. Although we agree with the reviewer that this would be beneficial to the field, we do not believe it is in scope for this work. On the reviewer’s note regarding a fraction of DEGs being false positives due to differences in the proportions of cells from different individuals compared to the original analysis - We have analysed the same processed data the authors used to negate the differences caused by the differing processing steps. We thank the reviewer for this suggestion. We also give more insight into the cause of these differences, namely on filtering our nuclei with large proportions of mitochondrial reads and discuss their effect in paragraph 3 (also see Supplementary Figure 2).

      Given there are only a few DEGs, it would be good to show more data about these genes to allow better assessment of the robustness of the results, i.e., boxplots of the pseudobulk counts in the compared groups and perhaps heatmaps of the raw counts prior to aggregation. This could rule out concerns about outliers affecting the results.

      In Supplementary Figure 3, we have added boxplots of the sum pseudobulked, trimmed mean of M-values (TMM) normalised counts for three of our identified DEGs (b) and three of the authors’ DEGs which they discuss in their manuscript (a) to show the differences in counts across AD pathology and controls for these genes. We hope this gives some insight into the transcriptional changes highlighted by the differing approaches. In our opinion, there is a clear difference in the transcriptional signal in the genes identified from pseudobulk which is not present for the genes identified from the authors approach.

      Overall, I believe the paper would deliver a clearer message by mainlining the QC from the original study and only changing the DE analysis. However, if keeping the part about QC/batch correction:

      • Assess to which degree changes in cell type proportion are indeed due to batch correction (as suggested in the text) and not filtering by looking at the annotated cell types in the original publication and those in your analysis.

      • Also perform the analysis without changing QC and state the # of DEGs in both cases, to at least allow some disentanglement of the effect of different steps of the analysis.

      • Please state the number of cells removed by each QC step in the supplementary note.

      We thank the reviewer for this suggestion. We agree with performing the DE analysis on the same processed data as the original authors and have split out our reanalysis into two separate parts, primarily focussing on the discrepancies caused by the choice of differential expression (DE) approach. By splitting our analysis in this manner, we can identify the substantial differences in results caused by differing the DE approach in the study. Secondly, we can see how differences in preprocessing affects the DE results in isolation too – see paragraph 8 but in short, the fold change correlation between pseudobulk DE analyses on the reprocessed data vs authors processed data only had a moderate correlation (Pearson R of 0.57).

      In regards to the number of cells removed by each QC step, we have added an aggregated view for all samples in supplementary table 3 and also give the full statistics per sample in our Github repository: https://github.com/neurogenomics/reanalysis_Mathys_2019. Moreover, we investigated the root cause in the differences in nuclei numbers, uncovering filtering down to mitochondrial read proportions as the main culprit (Supplementary Figure 2).

      I recommend the authors read the following papers, assess whether their methodology agrees with them, and add citations as appropriate to support statements made in the manuscript.

      We thank the reviewer for this comprehensive list. We have updated our manuscript and supplementary file and main text throughout to cite many of these where appropriate. We believe this helps add context to our decisions for the differing tools and approaches used as part of the processing pipeline with scFlow and the differential expression approach.

      I believe the authors' intention was to show the results of their reanalysis not as a criticism of the original paper (which can hardly be faulted for their strategy which was state-of-the-art at the time and indeed they took extra measures attempting to ensure the reliability of their results), but primarily to raise awareness and provide recommendations for rigorous analysis of sc/snRNA-seq data for future studies.

      We thank the reviewer for this note, this was exactly our intent. Furthermore, we are based in a dementia research institute and our aim is to ensure that ensure that the Alzheimer’s disease research field does not focus on spuriously identified genes.We have updated the text of the manuscript (start paragraph 2) to explicitly state this so our message is not misconstrued.

      In my opinion, the purpose of the paper might be better served by focusing on the DE strategy without changing QC and instead detailing where/how DEGs were gained/lost and supporting whether these were false positives.

      We agree that the differences in preprocessing will affect the results and conceal which step in our reanalysis resulted in the discrepancies we noted. To address this, we have split out our reanalysis into two separate parts - In the main body of the text we discuss the differences resulting from just changing the differential expression approach where we use the same processed data as the authors to enable a fair comparison. Secondly, we still provide the reprocessed data and perform differential expression analysis on it and discuss the impact the differences in the processing steps made to the results. As previously mentioned, we have also added further investigation into the DEGs identified, looking at the correlation across the differing approaches and plotting the counts for selected genes.

      For instance, removal with a mitochondrial count of <5% seems harsh and might account for a large proportion of additional cells filtered out in comparison to the original analysis. There is no blanket "correct cutoff" for this percentage. For instance, the "classic" Seurat tutorial https://satijalab.org/seurat/articles/pbmc3k_tutorial.html uses the 5% threshold chosen by the authors, an MAD-based selection of cutoff arrived at 8% here https://www.sc-best-practices.org/preprocessing_visualization/quality_control.html, another "best practices" guide choses by default 10% https://bioconductor.org/books/3.17/OSCA.basic/quality-control.html#quality-control-discarded, etc. Generally, the % of mitochondrial reads varies a lot between datasets.

      Apologies, the 5% cut-off was a misprint – the actual cut-off used was 10% which, as the reviewer notes, is on the higher side of what is recommended. We have updated our manuscript to rectify this mistake and discuss the differences in the number of cells caused by the two approaches to mitochondrial filtering in the manuscript (paragraph 3). We found that over 16,000 nuclei that were removed in our QC pipeline were kept by the author’s (Supplementary Fig. 2), explaining the discrepancy in the number of nuclei after QC. Based on Supplementary Fig. 2, it is clear the author’s approach was ineffective at removing nuclei with high proportions of mitochondrial reads which is indicative of cell death5,6. We hope this alleviates the reviewer’s concerns around our alternative processing approach. Moreover, as mentioned, we swapped to compare the differences by DE approaches on the same data to avoid any effect by this.

      Reviewer 2:

      The paper would be better if the authors merged this work with the scFLOW paper so that they can justify their analysis pipeline and show it in an influential dataset.

      We thank the reviewer for this note. We would like to clarify that the purpose of our work was not to show the scFlow analysis pipeline on an influential dataset but rather to raise awareness and provide recommendations for rigorous analysis of single-cell and single-nucleus RNA-Seq data (sc/snRNA-Seq) for future studies and to help redirect the focus of the Alzheimer’s disease research field away from possible spuriously identified genes. We have updated our manuscript text to highlight this (see start paragraph 2). Furthermore, we are aware our original approach reprocessing the data with scFlow will affect the results and conceal which step in our reanalysis resulted in the discrepancies we noted. Thus, we have split out our reanalysis into two separate parts - In the main body of the text we discuss the differences resulting from just changing the differential expression approach where we use the same processed data as the authors to enable a fair comparison. Secondly, we still provide the reprocessed data so that the community can benefit from it and perform differential expression analysis on it and discuss the impact the differences in the processing steps made to the results. We have also added further references supporting the choice of steps and tools used in scFlow in the supplementary text which should address the reviewer’s concerns about justifying the analysis pipeline. Moreover, we identified the cause of the nuclei count differences caused by the two processing approaches, namely on filtering our nuclei with large proportions of mitochondrial reads and discuss their effect in paragraph 3 (also see Supplementary Figure 2).

      A major contribution is the use of the authors' own inhouse pipeline for data preparation (scFLOW), but this software is unpublished since 2021 and consequently not yet refereed. It isn't reasonable to take this pipeline as being validated in the field.

      We believe our answer to the previous point addresses these concerns - We have added references supporting the choice of steps and tools used in scFlow in the supplementary text which should address the reviewer’s concerns about justifying the analysis pipeline. Moreover, as a result of the pipeline we identified that 16,000 of the nuclei kept by the authors are likely of low quality and indicative of cell death with high mitochondrial read proportions5,6.

      They also worry that the significant findings in Mathys' paper are influenced by the number of cells of each type. I'm sure it is since power is a function of sample size, but is this a bad thing? It seems odd that their approach is not influenced by sample size.

      We thank the reviewer for highlighting this point. As they noted, we conclude that the original authors number of DEGs is just a product of the number of cells. However, the reviewer states that ‘It seems odd that their approach is not influenced by sample size’. An increase in the number of cells is not an increase in sample size since these cells are not independent from one another - they come from the same sample. Therefore, an increase in the number of cells should not result in an increase in the number of DEGs whereas an increase in the number of samples would. This point is the major issue with pseudoreplication approaches which over-estimate the confidence when performing differential expression due to the statistical dependence between cells from the same patient not being considered. See these references for more information on this point1,2,7,8. We have added a discussion of this point to our manuscript in paragraph 6.

      Moreover, recent work has established that the genetic risk for Alzheimer’s disease acts primarily via microglia9,10. Thus, it would be reasonable to expect that the majority of large effect size DEGs identified would be found in this cell type. This is what we found with our pseudobulk differential expression approach – 96% of all DEGs were in microglia. We have updated the text of our manuscript (paragraph 5) to highlight this last point.

      References 1. Murphy, A. E. & Skene, N. G. A balanced measure shows superior performance of pseudobulk methods in single-cell RNA-sequencing analysis. Nat. Commun. 13, 7851 (2022).

      1. Squair, J. W. et al. Confronting false discoveries in single-cell differential expression. Nat. Commun. 12, 5692 (2021).

      2. Crowell, H. L. et al. muscat detects subpopulation-specific state transitions from multi-sample multi-condition single-cell transcriptomics data. Nat. Commun. 11, 6077 (2020).

      3. Soneson, C. & Robinson, M. D. Bias, robustness and scalability in single-cell differential expression analysis. Nat. Methods 15, 255–261 (2018).

      4. Ilicic, T. et al. Classification of low quality cells from single-cell RNA-seq data. Genome Biol. 17, 29 (2016).

      5. Heumos, L. et al. Best practices for single-cell analysis across modalities. Nat. Rev. Genet. 24, 550–572 (2023).

      6. Zimmerman, K. D., Espeland, M. A. & Langefeld, C. D. A practical solution to pseudoreplication bias in single-cell studies. Nat. Commun. 12, 738 (2021).

      7. Lazic, S. E. The problem of pseudoreplication in neuroscientific studies: is it affecting your analysis? BMC Neurosci. 11, 5 (2010).

      8. Skene, N. G. & Grant, S. G. N. Identification of Vulnerable Cell Types in Major Brain Disorders Using Single Cell Transcriptomes and Expression Weighted Cell Type Enrichment. Front. Neurosci. 0, (2016).

      9. McQuade, A. & Blurton-Jones, M. Microglia in Alzheimer’s disease: Exploring how genetics and phenotype influence risk. J. Mol. Biol. 431, 1805–1817 (2019).

    1. Author Response

      The following is the authors’ response to the current reviews.

      eLife assessment

      The findings of this article provide valuable information on the changes of cell clusters induced by chronic periodontitis. The observation of a new fibroblast subpopulation, named AG fibroblasts, is interesting, and the strength of evidence presented is solid.

      We thank the Reviewing Editor and the Senior Editor for the positive assessment and strong support for our study.

      Public Reviews:

      Reviewer #1 (Public Review):

      In this article, the authors found a distinct fibroblast subpopulation named AG fibroblasts, which are capable of regulating myeloid cells, T cells and ILCs, and proposed that AG fibroblasts function as a previously unrecognized surveillant to orchestrate chronic gingival inflammation in periodontitis. Generally speaking, this article is innovative and interesting.

      We truly appreciate this public review.

      Reviewer #2 (Public Review):

      This study proposed the AG fibroblast-neutrophil-ILC3 axis as a mechanism contributing to pathological inflammation in periodontitis. In this study single-cell transcriptomic analysis was performed. But the signal mechanism behind them was not evaluated.

      The authors achieved their aims, and the results partially support their conclusions.

      We agree that we must conduct future studies to evaluate our hypothesis.

      The mouse ligatured periodontitis models differ from clinical periodontitis in human, this study supplies the basis for future research in human.

      This is an important subject. We have previously expressed a concern on the mouse ligature model that the microbial composition of the mouse ligature did not mirror the human oral microbial composition. Therefore, we developed the maxillary topical application (MTA) model, in which human oral biofilm was directly applied to the maxillary gingiva. In this study, the newly developed MTA model was further dissected by single cell RNA seq, which revealed that the extracellular substances of human oral biofilm might be an important trigger of gingival inflammation. RESULT has been revised.

      Recommendations for the authors:

      Reviewer #1 (Recommendations For The Authors):

      I appreciate the authors' efforts. I think it would be much better to simplify INTRODUCTION.

      INTRODUCTION has been simplified as suggested.

      Reviewer #2 (Recommendations For The Authors):

      1. Many host cells participate in immune responses, such as gingival epithelial cells. AG fibroblast is not the only cell involved in the immune response, and the weight of its role needs to be clarified. So the expression in the conclusion should be appropriate.

      RESPONSE: We agree with this comment. Our study identified the AG fibroblast–neutrophil–ILC3 axis as a previously unrecognized mechanism which could play an additional role in the complex interplay between oral barrier immune cells.

      1. The main results should be included in the Abstract.

      Abstract has been revised.


      The following is the authors’ response to the original reviews.

      We thank all reviewers for constructive critiques. We plan to perform new experiments and revise our manuscript accordingly. The text and Figures are currently undergoing the revision process. Below highlights our revision plan.

      eLife assessment

      The findings of this article provide valuable information on the changes of cell clusters induced by chronic periodontitis. The observation of a new fibroblast subpopulation, which was named as AG fibroblasts, was quite interesting, but needs further evidence. The strength of evidence presented is incomplete.

      We discovered a new subpopulation of gingival fibroblasts, named AG fibroblasts, using non-biased single cell RNA sequencing (scRNA-seq) of mouse gingival samples undergoing the development of ligature-induced periodontitis. AG fibroblasts exhibited a unique gene expression profile: [1] constitutive expression of type XIV collagen; and [2] ligatureinduced upregulation of Toll-Like Receptors and their downstream signals as well as chemokines such as CXCL12. Thus, we have hypothesized that AG fibroblasts initially sense the pathological stress including oral microbial stimuli and secrete inflammatory signals through chemokine expression.

      The current manuscript examined the relationship between AG fibroblasts and oral barrier immune cells focusing on the chemokines and other ligands derived from AG fibroblasts and their putative receptors in those immune cells. Using scRNA-seq data mining programs, our data demonstrated the compelling evidence that AG fibroblasts should play a critical role in orchestrating the oral barrier immunity, at least at the early stages of periodontal inflammation.

      We agree that it is important to explore the functional/pathological role of AG fibroblasts. In this revision, we further investigated the role of TLRs in the pathogen sensing mechanism of AG fibroblasts. To accomplish this goal, we applied a newly developed mouse model in which mice were exposed to the maxillary topical application (MTA) of oral microbial pathogens without the ligature placement. With 1 hr exposure with human oral biofilm, not with planktonic microbiota, the mice maxillary tissue exhibited measurable degradation as evidenced by the activation of cathepsin K. To dissect the role of TLRs, we applied the putative stimulants of TLR9 and TLR2/4 using the discrete MTA model. The scRNA-seq from the MTA model revealed that the application of unmethylated CpG oligonucleotide and P. gingivalis lipopolysaccharide (LPS), respectively, induced the activation of chemokines by AG fibroblast.

      The revised manuscript reported this critical data with the detailed information. As such the additional figures and corresponding results, discussion and materials & methods were included.

      Public Reviews:

      Reviewer #1 (Public Review):

      In this article, the authors found a distinct fibroblast subpopulation named AG fibroblasts, which are capable of regulating myeloid cells, T cells and ILCs, and proposed that AG fibroblasts function as a previously unrecognized surveillant to orchestrate chronic gingival inflammation in periodontitis. Generally speaking, this article is innovative and interesting, however, there are some problems that need to be addressed to improve the quality of the manuscript.

      We appreciate this comment. As suggested, we further investigated the surveillant function of AG fibroblasts by reanalyzing the scRNA-seq data for stress sensing receptors such as Toll-Like Receptors (TLR). In the revision, we addressed the role of TLR in the activation of AG fibroblasts using a newly developed mouse model employing the maxillary topical application (MTA) of putative TLR stimulants. The new information clearly demonstrated that AG fibroblasts play a pivotal role as the surveillant and translating the pathogenic stimulants to oral barrier inflammation through chemokine expression.

      Reviewer #2 (Public Review):

      This study proposed the AG fibroblast-neutrophil-ILC3 axis as a mechanism contributing to pathological inflammation in periodontitis. However, the immune response in the vivo is very complex. It is difficult to determine which is the cause and which is the result. This study explores the relevant issue from one dimension, which is of great significance for a deeper understanding of the pathogenesis of periodontitis. It should be fully discussed.

      We appreciate this comment. We expanded the current understanding of oral immune signal communication in Discussion and highlight how AG fibroblast may fit to it. To address this question, we expanded our investigation in the pathological signal detection by AG fibroblasts by employing the newly developed maxillary topical application (MTA) model. The revised manuscript contains the new information and expanded the discussion in the context of complex immune response.

      Reviewer #1 (Recommendations For The Authors):

      Detailed comments are listed below:

      Abstract:<br /> I am confused about the expression of "human periodontitis-like phenotype". How does the authors define this concept? Periodontitis is a complex disease, despite that alveolar bone resorption is a typical manifestation of periodontitis, its characteristics remain to be further studied. I hope the authors can provide some detailed information about this concept or describe it in another way.

      This is an important comment. Radiographically, human periodontitis is diagnosed by alveolar bone resorption from the cervical region, not from root apex. To highlight this, we present dental radiographs of human periodontitis as supplementary information. However, we agree with this comment, our statement should be limited to alveolar bone resorption pattern in Rag2KO and Rag2gcKO mice. Abstract be revised accordingly.

      Introduction:<br /> It is recommended to simplify the first to third paragraphs, and briefly explain the functions of various types of cells in different stages of periodontitis, as well as the role of different cluster markers play across the time course of periodontal inflammation development.

      Following this recommendation, INTRODUCTION has been simplified.

      Results:<br /> 1. It is recommended to add HE staining and immunohistochemistry staining to observe the inflammation, tissue damage, and repair status from 0 to 7 days, so that readers can understand cell phenotype changes corresponding to the periodontitis stage. The observation index can include inflammation and vascular related indicators.

      As recommended, representative histological figures were included. We further performed new immunohistochemistry experiment of mouse gingival tissue (D0, D1, D3, D7) highlighting the infiltration of CD45+ immune cells. We found that inflammatory vascular formation in the H&E histology, which was highlighted. To characterize the tissue damage, the histological sections were stained by picrosirius red to highlight the change in collagen connective tissue of PDL and gingiva.

      1. Figure 1A-1D can be placed in the supplementary figure.

      Combining the new data above, Figure 1 was revised as suggested.

      1. I suggest the authors to put the detection of the existence of AG fibroblasts before exploring its relationship with other types of cells.

      2. The layout of the picture should be closely related to the topic of the article. It is recommended to readjust the layout of the picture. Figure 1 should be the detection of AG cells and their proportion changes from 0 to 7 days. In other figures, the authors can separately describe the proportion changes of myeloid cells, T cells and ILCs, and explored the association between AG fibroblasts and these cell types.

      As suggested, the presentation order of Figures and text was revised to bring the information about AG fibroblasts first. The chemokine-receptor analysis was moved below.

      1. Please provide the complete form of "KT" in Line 162.

      KT fibroblasts (fibroblasts keeping typical phenotype) was described in the text.

      Methods:<br /> It is recommended to separately list the statistical methods section. The statistical method used in the article should be one-way ANOVA.

      A separate statistical method section is created. As pointed out, we used one-way ANOVA with post-hoc Tukey test (when multiple groups were compared).

      Discussion:<br /> I suggest the authors remove Figures 3-6 from the discussion section. For example, in Line 283, "(Figure 3 and 4)" should be removed.

      Revised as suggested.

      Reference:<br /> Some information for the references is missing. For example, "Lin P, et al. Application of Ligature-Induced Periodontitis in Mice to Explore the Molecular Mechanism of Periodontal Disease. Int J Mol Sci 22, (2021)" should be "Lin P, et al. Application of Ligature-Induced Periodontitis in Mice to Explore the Molecular Mechanism of Periodontal Disease. Int J Mol Sci 22, 8900 (2021)". It is necessary to recheck all references.

      The reference has been checked for the accuracy and the omission pointed out was corrected. Although we used EndNote program, we found some more inaccuracy in the references that were manually corrected. We appreciate your suggestion.

      Reviewer #2 (Recommendations For The Authors):

      1. Many host cells participate in immune responses, such as gingival epithelial cells. AG fibroblast is not the only cell involved in the immune response, and the weight of its role needs to be clarified. So the expression in the conclusion should be appropriate.

      Following this critique, we revised INTRODUCTION, DISCUSSION and CONCLUSION, to highlight how AG fibroblasts function within a comprehensive immune response network.

      1. This study cannot directly answer the issue of the relationship between periodontitis and systemic diseases.

      We agree with this critique. We either deleted or de-emphasized the relationship between periodontitis and systemic diseases throughout the text.

    1. Author response

      The following is the authors’ response to the current reviews.

      We thank the editor for the eLife assessment and reviewers for their remaining comments. We will address them in this response.

      First, we thank eLife for the positive assessment. Regarding the point of visual acuity that is mentioned in this assessment, we understand that this comment is made. It is not an uncommon comment when rodent vision is discussed. However, we emphasize that we took the lower visual acuity of rats and the higher visual acuity of humans into account when designing the human study, by using a fast and eccentric stimulus presentation for humans. As a result, we do not expect a higher discriminability of stimuli in humans. We have described this in detail in our Methods section when describing the procedure in the human experiment:

      “We used this fast and eccentric stimulus presentation with a mask to resemble the stimulus perception more closely to that of rats. Vermaercke & Op de Beeck (2012) have found that human visual acuity in these fast and eccentric presentations is not significantly better than the reported visual acuity of rats. By using this approach we avoid that differences in strategies between humans and rats would be explained by such a difference in acuity”

      Second, regarding the remaining comment of Reviewer #2 about our use of AlexNet:

      While it is indeed relevant to further look into different computational architectures, we chose to not do this within the current study. First, it is a central characteristic of the study procedure that the computational approach and chosen network is chosen early on as it is used to generate the experimental design that animals are tested with. We cannot decide after data collection to use a different network to select the stimuli with which these data were collected. Second, as mentioned in our first response, using AlexNet is not a random choice. It has been used in many previously published vision studies that were relatively positive about the correspondence with biological vision (Cadieu et al., 2014; Groen et al., 2018; Kalfas et al., 2018; Nayebi et al., 2023; Zeman et al., 2020). Third, our aim was not to find a best DNN model for rat vision, but instead examining the visual features that play a role in our complex discrimination task with a model that was hopefully a good enough starting point. The fact that the designs based upon AlexNet resulted in differential and interpretable effects in rats as well as in humans suggests that this computational model was a good start. Comparing the outcomes of different networks would be an interesting next step, and we expect that our approach could work even better when using a network that is more specifically tailored to mimic rat visual processing.

      Finally, regarding the choice to specifically chose alignment and concavity as baseline properties, this choice is probably not crucial for the current study. We have no reason to expect rats to have an explicit notion about how a shape is built up in terms of a part-based structure, where alignment relates to the relative position of the parts and concavity is a property of the main base. For human vision it might be different, but we did not focus on such questions in this study.


      The following is the authors’ response to the original reviews.

      We would like to thank you for giving us the opportunity to submit a revised draft our manuscript. We appreciate the time and effort that you dedicated to providing insightful feedback on our manuscript and are grateful for the valuable comments and improvements on our paper. It helped us to improve our manuscript. We have carefully considered the comments and tried our best to address every one of them. We have added clarifications in the Discussion concerning the type of neural network that we used, about which visual features might play a role in our results as well as clarified the experimental setup and protocol in the Methods section as these two sections were lacking key information points.

      Below we provide a response to the public comments and concerns of the reviewers.

      Several key points were addressed by at least two reviewers, and we will respond to them first.

      A first point concerns the type of network we used. In our study, we used AlexNet to simulate the ventral visual stream and to further examine rat and human performance. While other, more complex neural networks might lead to other results, we chose to work with AlexNet because it has been used in many other vision studies that are published in high impact journals ((Cadieu et al., 2014; Groen et al., 2018; Kalfas et al., 2018; Nayebi et al., 2023; Zeman et al., 2020). We did not try to find a best DNN model for rat vision but instead, we were looking for an explanation of which visual features play a role in our complex discrimination task. We added a consideration to our Discussion addressing why we worked with AlexNet. Since our data will be published on OSF, we encourage to researchers to use our data with other, more complex neural networks and to further investigate this issue.

      A second point that was addressed by multiple reviewers concerns the visual acuity of the animals and its impact on their performance. The position of the rat was not monitored in the setup. In a previous study in our lab (Crijns & Op de Beeck, 2019), we investigated the visual acuity of rats in the touchscreen setups by presenting gratings with different cycles per screen to see how it affects their performance in orientation discrimination. With the results from this study and general knowledge about rat visual acuity, we derived that the decision distance of rats lies around 12.5cm from the screen. We have added this paragraph to the Discussion.

      A third key point that needs to be addressed as a general point involves which visual features could explain rat and human performance. We reported marked differences between rat and human data in how performance varied across image trials, and we concluded through our computationally informed tests and analyses that rat performance was explained better by lower levels of processing. Yet, we did not investigate which exact features might underlie rat performance. As a starter, we have focused on taking a closer look at pixel similarity and brightness and calculating the correlation between rat/human performance and these two visual features.

      We calculated the correlation between the rat performances and image brightness of the transformations. We did this by calculating the difference in brightness of the base pair (brightness base target – brightness base distractor), and subtracting the difference in brightness of every test target-distractor pair for each test protocol (brightness test target – brightness test distractor for each test pair). We then correlated these 287 brightness values (1 for each test image pair) with the average rat performance for each test image pair. This resulted in a correlation of 0.39, suggesting that there is an influence of brightness in the test protocols. If we perform the same correlation with the human performances, we get a correlation of -0.12, suggesting a negative influence of brightness in the human study.

      We calculated the correlation between pixel similarity of the test stimuli in relation to the base stimuli with the average performance of the animals on all nine test protocols. We did this by calculating the pixel similarity between the base target with every other testing distractor (A), the pixel similarity between the base target with every other testing target (B), the pixel similarity between the base distractor with every other testing distractor (C) and the pixel similarity between the base distractor with every other testing target (D). For each test image pair, we then calculated the average of (A) and (D), and subtracted the average of (C) and (B) from it. We correlated these 287 values (one for each image pair) with the average rat performance on all test image pairs, which resulted in a correlation of 0.34, suggesting an influence of pixel similarity in rat behaviour. Performing the same correlation analysis with the human performances results in a correlation of 0.12.

      We have also addressed this in the Discussion of the revised manuscript. Note that the reliability of the rat data was 0.58, clearly higher than the correlations with brightness and pixel similarity, thus these features capture only part of the strategies used by rats.

      We have also responded to all other insightful suggestions and comments of the reviewers, and a point-by-point response to the more major comments will follow now.  

      Reviewer #1, general comments:

      The authors should also discuss the potential reason for the human-rat differences too, and importantly discuss whether these differences are coming from the rather unusual approach of training used in rats (i.e. to identify one item among a single pair of images), or perhaps due to the visual differences in the stimuli used (what were the image sizes used in rats and humans?). Can they address whether rats trained on more generic visual tasks (e.g. same-different, or category matching tasks) would show similar performance as humans?

      The task that we used is typically referred to as a two-alternative forced choice (2AFC). This is a simple task to learn. A same-different task is cognitively much more demanding, also for artificial neural networks (see e.g. Puebla & Bowers, 2022, J. Vision). A one-stimulus choice task (probably what the reviewer refers to with category matching) is known to be more difficult compared to 2AFC, with a sensitivity that is predicted to be Sqrt(2) lower according to signal detection theory (MacMillan & Creelman, 1991). We confirmed this prediction empirically in our lab (unpublished observations). Thus, we predict that rats perform less good in the suggested alternatives, potentially even (in case of same-different) resulting in a wider performance gap with humans.

      I also found that a lot of essential information is not conveyed clearly in the manuscript. Perhaps it is there in earlier studies but it is very tedious for a reader to go back to some other studies to understand this one. For instance, the exact number of image pairs used for training and testing for rats and humans was either missing or hard to find out. The task used on rats was also extremely difficult to understand. An image of the experimental setup or a timeline graphic showing the entire trial with screenshots would have helped greatly.

      All the image pairs used for training and testing for rats and humans are depicted in Figure 1 (for rats) and Supplemental Figure 6 (for humans). For the first training protocol (Training), only one image pair was shown, with the target being the concave object with horizontal alignment of the spheres. For the second training protocol (Dimension learning), three image pairs were shown, consisting of the base pair, a pair which differs only in concavity, and a pair which differs only in alignment. For the third training protocol (Transformations) and all testing protocols, all combination of targets and distractors were presented. For example, in the Rotation X protocol, the stimuli consisted of 6 targets and 6 distractors, resulting in a total of 36 image pairs for this protocol. The task used on rats is exactly as shown in Figure 1. A trial started with two blank screens. Once the animal initiated a trial by sticking its head in the reward tray, one stimulus was presented on each screen. There was no time limit and so the stimuli remained on the screen until the animal made a decision. If the animal touched the target, it received a sugar pellet as reward and a ITI of 20s started. If the animal touched the distractor, it did not receive a sugar pellet and a time-out of 5s started in addition to the 20s ITI.

      We have clarified this in the manuscript.

      The authors state that the rats received random reward on 80% of the trials, but is that on 80% of the correctly responded trials or on 80% of trials regardless of the correctness of the response? If these are free choice experiments, then the task demands are quite different. This needs to be clarified. Similarly, the authors mention that 1/3 of the trials in a given test block contained the old base pair - are these included in the accuracy calculations?

      The animals receive random reward on 80% on all testing trials with new stimuli, regardless of the correctness of the response. This was done to ensure that we can measure true generalization based upon learning in the training phase, and that the animals do not learn/are not trained in these testing stimuli. For the trials with the old stimuli (base pair), the animals always received real reward (reward when correct; no reward in case of error).

      The 1/3rd trials with old stimuli are not included in the accuracy calculations but were used as a quality check/control to investigate which sessions have to be excluded and to assure that the rats were still doing the task properly. We have added this in the manuscript.

      The authors were injecting noise with stimuli to cDNN to match its accuracy to rat. However, that noise potentially can interacted with the signal in cDNN and further influence the results. That could generate hidden confound in the results. Can they acknowledge/discuss this possibility?

      Yes, adding noise can potentially interact with the signal and further influence the results. Without noise, the average training data of the network would lie around 100% which would be unrealistic, given the performances of the animals. To match the training performance of the neural networks with that of the rats, we added noise 100 times and averaged over these iterations (cfr. (Schnell et al., 2023; Vinken & Op de Beeck, 2021)).  

      Reviewer #2, weaknesses:

      1) There are a few inconsistencies in the number of subjects reported. Sometimes 45 humans are mentioned and sometimes 50. Probably they are just typos, but it's unclear.

      Thank you for your feedback. We have doublechecked this and changed the number of subjects where necessary. We collected data from 50 human participants, but had to exclude 5 of them due to low performance during the quality check (Dimension learning) protocols. Similarly, we collected data from 12 rats but had to exclude one animal because of health issues. All these data exclusion steps were mentioned in the Methods section of the original version of the manuscript, but the subject numbers were not always properly adjusted in the description in the Results section. This is now corrected.

      2) A few aspects mentioned in the introduction and results are only defined in the Methods thus making the manuscript a bit hard to follow (e.g. the alignment dimension), thus I had to jump often from the main text to the methods to get a sense of their meaning.

      Thank you for your feedback. We have clarified some aspects in the Introduction, such as the alignment dimension.

      4) Many important aspects of the task are not fully described in the Methods (e.g. size of the stimuli, reaction times and basic statistics on the responses).

      We have added the size of the stimuli to the Methods section and clarified that the stimuli remained on the screen until the animals made a choice. Reaction time in our task would not be interpretable given that stimuli come on the screen when the animal initiates a trial with its back to the screen. Therefore we do not have this kind of information.

      Reviewer #1

      • Can the authors show all the high vs zero and zero vs high stimulus pairs either in the main or supplementary figures? It would be instructive to know if some other simple property covaried between these two sets.

      In Figure 1, all images of all protocols are shown. For the High vs. Zero and Zero vs. High protocols, we used a deep neural network to select a total of 7 targets and 7 distractors. This results in 49 image pairs (every combination of target-distractor).

      • Are there individual differences across animals? It would be useful for the authors to show individual accuracy for each animal where possible.

      We now added individual rat data for all test protocols – 1 colour per rat, black circle = average. We have added this picture to the Supplementary material (Supplementary Figure 1).

      • Figure 1 - it was not truly clear to me how many image pairs were used in the actual experiment. Also, it was very confusing to me what was the target for the test trials. Additionally, authors reported their task as a categorisation task, but it is a discrimination task.

      Figure 1 shows all the images that were used in this study. Every combination of every target-distractor in each protocol (except for Dimension learning) was presented to the animals. For example in Rotation X, the test stimuli as shown in Fig. 1 consisted of 6 targets and 6 distractors, resulting in a total of 36 image pairs for this test protocol.

      In each test protocol, the target corresponded to the concave object with horizontally attached spheres, or the object from the pair that in the stimulus space was closed to this object. We have added this clarification in the Introduction: “We started by training the animals in a base stimulus pair, with the target being the concave object with horizontally aligned spheres. Once the animals were trained in this base stimulus pair, we used the identity-preserving transformations to test for generalization.” as well as in the caption of Figure 1. We have changed the term “categorisation task” to “discrimination task” throughout the manuscript.
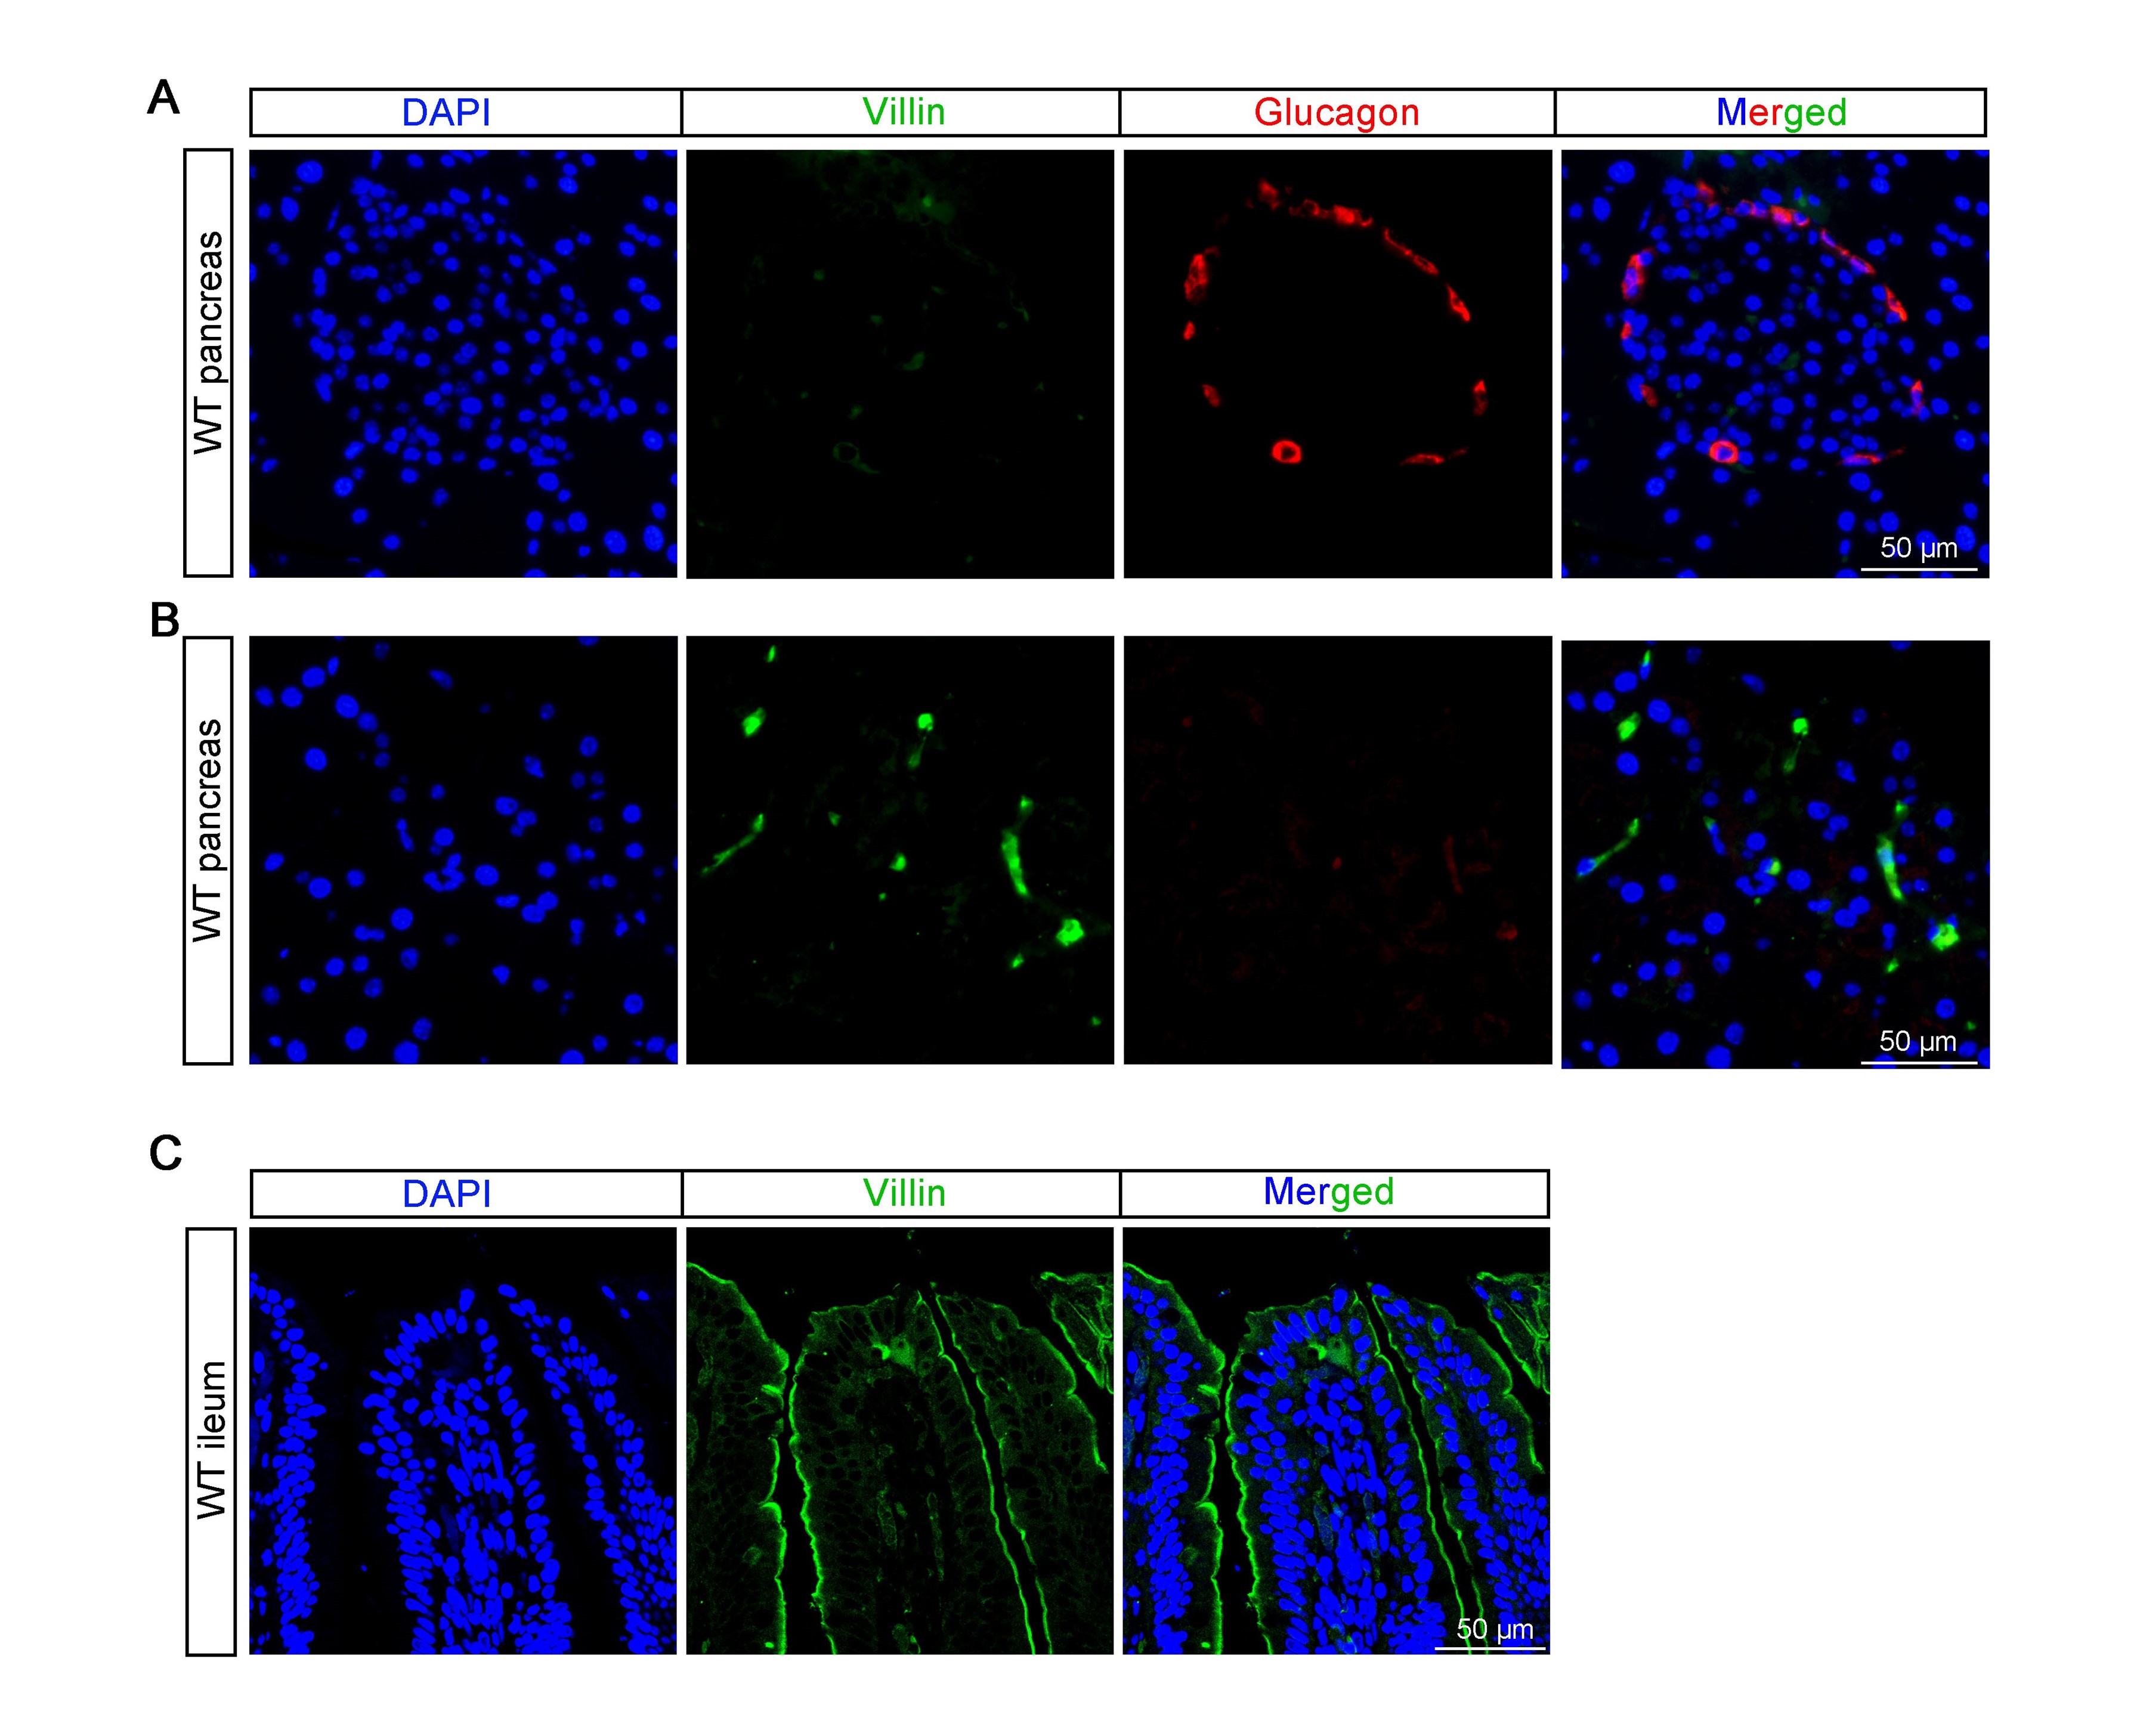
      • Figure 2 - what are the red and black lines? How many new pairs are being tested here? Panel labels are missing (a/b/c etc)

      We have changed this figure by adding panel labels, and clarifying the missing information in the caption. All images that were shown to the animals are presented on this figure. For Dimension Learning, only three image pairs were shown (base pair, concavity pair, alignment pair) and for the Transformations protocol, every combination of every target and distractor were shown, i.e. 25 image pairs in total.

      • Figure 3 - last panel: the 1st and 2nd distractor look identical.

      We understand your concern as these two distractors indeed look quite similar. They are different however in terms of how they are rotated along the x, y and z axes (see Author response image 1 for a bigger image of these two distractors). The similarity is due to the existence of near-symmetry in the object shape which causes high self-similarity for some large rotations.

      Author response image 1.

      • Line 542 – authors say they have ‘concatenated’ the performance of the animals, but do they mean they are taking the average across animals?

      It is both. In this specific analysis we calculated the performance of the animals, which was indeed averaged across animals, per test protocol, per stimulus pair. This resulted in 9 arrays (one for each test protocol) of several performances (1 for each stimulus pair). These 9 arrays were concatenated by linking them together in one big array (i.e. placing them one after the other). We did the same concatenation with the distance to hyperplane of the network on all nine test protocols. These two concatenated arrays with 287 values each (one with the animal performance and one with the DNN performance) were correlated.

      • Line 164 - What are these 287 image pairs - this is not clear.

      The 287 image pairs correspond to all image pairs of all 9 test protocols: 36 (Rotation X) + 36 (Rotation Y) + 36 (Rotation Z) + 4 (Size) + 25 (Position) + 16 (Light location) + 36 (Combination Rotation) + 49 (Zero vs. high) + 49 (High vs. zero) = 287 image pairs in total. We have clarified this in the manuscript.

      • Line 215 - Human rat correlation (0.18) was comparable to the best cDNN layer correlation. What does this mean?

      The human rat correlation (0.18) was closest to the best cDNN layer - rat correlation (about 0.15). In the manuscript we emphasize that rat performance is not well captured by individual cDNN layers.  

      Reviewer #2

      Major comments

      • In l.23 (and in the methods) the authors mention 50 humans, but in l.87 they are 45. Also, both in l.95 and in the Methods the authors mention "twelve animals" but they wrote 11 elsewhere (e.g. abstract and first paragraph of the results).

      In our human study design, we introduced several Dimension learning protocols. These were later used as a quality check to indicate which participants were outliers, using outlier detection in R. This resulted in 5 outlying human participants, and thus we ended with a pool of 45 human participants that were included in the analyses. This information was given in the Methods section of the original manuscript, but we did not mention the correct numbers everywhere. We have corrected this in the manuscript. We also changed the number of participants (humans and rats) to the correct one throughout the entire manuscript.

      • At l.95 when I first met the "4x4 stimulus grid" I had to guess its meaning. It would be really useful to see the stimulus grid as a panel in Figure 1 (in general Figures S1 and S4 could be integrated as panels of Figure 1). Also, even if the description of the stimulus generation in the Methods is probably clear enough, the authors might want to consider adding a simple schematic in Figure 1 as well (e.g. show the base, either concave or convex, and then how the 3 spheres are added to control alignment).

      We have added the 4x4 stimulus grid in the main text.

      • There is also another important point related to the choice of the network. As I wrote, I find the overall approach very interesting and powerful, but I'm actually worried that AlexNet might not be a good choice. I have experience trying to model neuronal responses from IT in monkeys, and there even the higher layers of AlexNet aren't that helpful. I need to use much deeper networks (e.g. ResNet or GoogleNet) to get decent fits. So I'm afraid that what is deemed as "high" in AlexNet might not be as high as the authors think. It would be helpful, as a sanity check, to see if the authors get the same sort of stimulus categories when using a different, deeper network.

      We added a consideration to the manuscript about which network to use (see the Discussion): “We chose to work with Alexnet, as this is a network that has been used as a benchmark in many previous studies (e.g. (Cadieu et al., 2014; Groen et al., 2018; Kalfas et al., 2018; Nayebi et al., 2023; Zeman et al., 2020)), including studies that used more complex stimuli than the stimulus space in our current study. […] . It is in line with the literature that a typical deep neural network, AlexNet and also more complex ones, can explain human and animal behaviour to a certain extent but not fully. The explained variance might differ among DNNs, and there might be DNNs that can explain a higher proportion of rat or human behaviour. Most relevant for our current study is that DNNs tend to agree in terms of how representations change from lower to higher hierarchical layers, because this is the transformation that we have targeted in the Zero vs. high and High vs. zero testing protocols. (Pinto et al., 2008) already revealed that a simple V1-like model can sometimes result in surprisingly good object recognition performance. This aspect of our findings is also in line with the observation of Vinken & Op de Beeck (2021) that the performance of rats in many previous tasks might not be indicative of highly complex representations. Nevertheless, there is still a relative difference in complexity between lower and higher levels in the hierarchy. That is what we capitalize upon with the Zero vs. high and High vs. zero protocols. Thus, it might be more fruitful to explicitly contrast different levels of processing in a relative way rather than trying to pinpoint behaviour to specific levels of processing.”

      • The task description needs way more detail. For how long were the stimuli presented? What was their size? Were the positions of the stimuli randomized? Was it a reaction time task? Was the time-out used as a negative feedback? In case, when (e.g. mistakes or slow responses)? Also, it is important to report some statistics about the basic responses. What was the average response time, what was the performance of individual animals (over days)? Did they show any bias for a particular dimension (either the 2 baseline dimensions or the identity preserving ones) or side of response? Was there a correlation within animals between performance on the baseline task and performance on the more complex tasks?

      Thank you for your feedback. We have added more details to the task description in the manuscript.

      The stimuli were presented on the screens until the animals reacted to one of the two screens. The size of the stimuli was 100 x 100 pixel. The position of the stimuli was always centred/full screen on the touchscreens. It was not a reaction time task and we also did not measure reaction time.

      • Related to my previous comment, I wonder if the relative size/position of the stimulus with respect to the position of the animal in the setup might have had an impact on the performance, also given the impact of size shown in Figure 2. Was the position of the rat in the setup monitored (e.g. with DeepLabCut)? I guess that on average any effect of the animal position might be averaged away, but was this actually checked and/or controlled for?

      The position of the rat was not monitored in the setup. In a previous study from our lab (Crijns & Op de Beeck, 2019), we investigated the visual acuity of rats in the touchscreen setups by presenting gratings with different cycles per screen to see how it affects their performance in orientation discrimination. With the results from this study and general knowledge about rat visual acuity, we derived that the decision distance of rats lies around 12.5cm from the screen. We have added this to the discussion.

      Minor comments

      • l.33 The sentence mentions humans, but the references are about monkeys. I believe that this concept is universal enough not to require any citation to support it.

      Thank you for your feedback. We have removed the citations.

      • This is very minor and totally negligible. The acronymous cDNN is not that common for convents (and it's kind of similar to cuDNN), it might help clarity to stick to a more popular acronymous, e.g. CNN or ANN. Also, given that the "high" layers used for stimulus selection where not convolutional layers after all (if I'm not mistaken).

      Thank you for your feedback. We have changed the acronym to ‘CNN’ in the entire manuscript.

      • In l.107-109 the authors identified a few potential biases in their stimuli, and they claim these biases cannot explain the results. However, the explanation is given only in the next pages. It might help to mention that before or to move that paragraph later, as I was just wondering about it until I finally got to the part on the brightness bias.

      We expanded the analysis of these dimensions (e.g. brightness) throughout the manuscript.
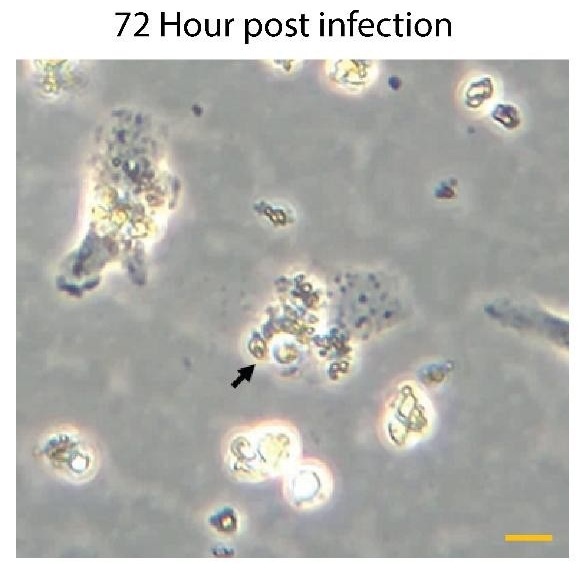
      • It would help a lot the readability to put also a label close to each dimension in Figures 2 and 3. I had to go and look at Figure S4 to figure that out.

      Figures 2 and 3 have been updated, also including changes related to other comments.

      • In Figure 2A, please specify what the red dashed line means.

      We have edited the caption of Figure 2: “Figure 2 (a) Results of the Dimension learning training protocol. The black dashed horizontal line indicates chance level performance and the red dashed line represents the 80% performance threshold. The blue circles on top of each bar represent individual rat performances. The three bars represent the average performance of all animals on the old pair (Old), the pair that differs only in concavity (Conc) and on the pair that differs only in alignment (Align). (b) Results of the Transformations training protocol. Each cell of the matrix indicates the average performance per stimulus pair, pooled over all animals. The columns represent the distractors, whereas the rows separate the targets. The colour bar indicates the performance correct. ”

      • Related to that, why performing a binomial test on 80%? It sounds arbitrary.

      We performed the binomial test on 80% as 80% is our performance threshold for the animals

      • The way the cDNN methods are introduced makes it sound like the authors actually fine-tuned the weights of AlexNet, while (if I'm not mistaken), they trained a classifier on the activations of a pre-trained AlexNet with frozen weights. It might be a bit confusing to readers. The rest of the paragraph instead is very clear and easy to follow.

      We think the most confusing sentence was “ Figure 7 shows the performance of the network after training the network on our training stimuli for all test protocols. “ We changed this sentence to “ Figure 8 shows the performance of the network for each of the test protocols after training classifiers on the training stimuli using the different DNN layers.“

      Reviewer #3

      Main recommendations:

      Although it may not fully explain the entire pattern of visual behavior, it is important to discuss rat visual acuity and its impact on the perception of visual features in the stimulus set.

      We have added a paragraph to the Discussion that discusses the visual acuity of rats and its impact on perceiving the visual features of the stimuli.

      The authors observed a potential influence of image brightness on behavior during the dimension learning protocol. Was there a correlation between image brightness and the subsequent image transformations?

      We have added this to the Discussion: “To further investigate to which visual features the rat performance and human performance correlates best with, we calculated the correlation between rat performance and pixel similarity of the test image pairs, as well as the correlation between rat performance and brightness in the test image pairs. Here we found a correlation of 0.34 for pixel similarity and 0.39 for brightness, suggesting that these two visual features partly explain our results when compared to the full-set reliability of rat performance (0.58). If we perform the same correlation with the human performances, we get a correlation of 0.12 for pixel similarity and -0.12 for brightness. With the full-set reliability of 0.58 (rats) and 0.63 (humans) in mind, this suggests that even pixel similarity and brightness only partly explain the performances of rats and humans.”

      Did the rats rely on consistent visual features to perform the tasks? I assume the split-half analysis was on data pooled across rats. What was the average correlation between rats? Were rats more internally consistent (split-half within rat) than consistent with other rats?

      The split-half analysis was indeed performed on data pooled across rats. We checked whether rats are more internally consistent by comparing the split-half within correlations with the split-half between correlations. For the split-half within correlations, we split the data for each rat in two subsets and calculated the performance vectors (performance across all image pairs). We then calculated the correlation between these two vectors for each animal. To get the split-half between correlation, we calculated the correlation between the performance vector of every subset data of every rat with every other subset data from the other rats. Finally, we compared for each animal its split-half within correlation with the split-half between correlations involving that animal. The result of this paired t-test (p = 0.93, 95%CI [-0.09; 0.08]) suggests that rats were not internally more consistent.

      Discussion of the cDNN performance and its relation to rat behavior could be expanded and clarified in several ways:

      • The paper would benefit from further discussion regarding the low correlations between rat behavior and cDNN layers. Is the main message that cDNNs are not a suitable model for rat vision? Or can we conclude that the peak in mid layers indicates that rat behavior reflects mid-level visual processing? It would be valuable to explore what we currently know about the organization of the rat visual cortex and how applicable these models are to their visual system in terms of architecture and hierarchy.

      We added a consideration to the manuscript about which network to use (see Discussion).

      • The cDNN exhibited above chance performance in various early layers for several test protocols (e.g., rotations, light location, combination rotation). Does this limit the interpretation of the complexity of visual behavior required to perform these tasks?

      This is not uncommon to find. Pinto et al. (2008) already revealed that a simple V1-like model can sometimes result in surprisingly good object recognition performance. This aspect of our findings is also in line with the observation of Vinken & Op de Beeck (2021) that the performance of rats in many previous tasks might not be indicative of highly complex representations. Nevertheless, there is still a relative difference in complexity between lower and higher levels in the hierarchy. That is what we capitalize upon with the High vs zero and the Zero vs high protocols. Thus, it might be more fruitful to explicitly contrast different levels of processing in a relative way rather than trying to pinpoint behavior to specific levels of processing. This argumentation is added to the Discussion section.

      • How representative is the correlation profile between cDNN layers and behavior across protocols? Pooling stimuli across protocols may be necessary to obtain stable correlations due to relatively modest sample numbers. However, the authors could address how much each individual protocol influences the overall correlations in leave-one-out analyses. Are there protocols where rat behavior correlates more strongly with higher layers (e.g., when excluding zero vs. high)?

      We prefer to base our conclusions mostly on the pooled analyses rather than individual protocols. As the reviewer also mentions, we can expect that the pooled analyses will provide the most stable results. For information, we included leave-one-out analyses in the supplemental material. Excluding the Zero vs. High protocol did not result in a stronger correlation with the higher layers. It was rare to see correlations with higher layers, and in the one case that we did (when excluding High versus zero) the correlations were still higher in several mid-level layers.

      Author response image 2.

      • The authors hypothesize that the cDNN results indicate that rats rely on visual features such as contrast. Can this link be established more firmly? e.g., what are the receptive fields in the layers that correlate with rat behavior sensitive to?

      This hypothesis was made based on previous in-lab research ((Schnell et al., 2023) where we found rats indeed rely on contrast features. In this study, we performed a face categorization task, parameterized on contrast features, and we investigated to what extent rats use contrast features to perform in a face categorization task. Similarly as in the current study, we used a DNN that as trained and tested on the same stimuli as the animals to investigate the representations of the animals. There, we found that the animals use contrast features to some extent and that this correlated best with the lower layers of the network. Hence, we would say that the lower layers correlate best with rat behaviour that is sensitive to contrast. Earlier layers of the network include local filters that simulate V1-like receptive fields. Higher layers of the network, on the other hand, are used for object selectivity.

      • There seems to be a disconnect between rat behavior and the selection of stimuli for the high (zero) vs. zero (high) protocols. Specifically, rat behavior correlated best with mid layers, whereas the image selection process relied on earlier layers. What is the interpretation when rat behavior correlates with higher layers than those used to select the stimuli?

      We agree that it is difficult to pinpoint a particular level of processing, and it might be better to use relative terms: lower/higher than. This is addressed in the manuscript by the edit in response to three comments back.

      • To what extent can we attribute the performance below the ceiling for many protocols to sensory/perceptual limitations as opposed to other factors such as task structure, motivation, or distractibility?

      We agree that these factors play a role in the overall performance difference. In Figure 5, the most right bar shows the percentage of all animals (light blue) vs all humans (dark blue) on the old pair that was presented during the testing protocol. Even here, the performance of the animals was lower than humans, and this pattern extended to the testing protocols as well. This was most likely due to motivation and/or distractibility which we know can happen in both humans and rats but affects the rat results more with our methodology.

      Minor recommendations:

      • What was the trial-to-trial variability in the distance and position of the rat's head relative to the stimuli displayed on the screen? Can this variability be taken into account in the size and position protocols? How meaningful is the cDNN modelling of these protocols considering that the training and testing of the model does not incorporate this trial-to-trial variability?

      We have no information on this trial-to-trial variability. We have information though on what rats typically do overall from an earlier paper that was mentioned in response to an earlier comment (Crijns et al.).

      We have added a disclaimer in the Discussion on our lack of information on trial-to-trial variability.

      • Several of the protocols varied a visual feature dimension (e.g., concavity & alignment) relative to the base pair. Did rat performance correlate with these manipulations? How did rat behavior relate to pixel dissimilarity, either between target and distractor or in relation to the trained base pair?

      We have added this to the Discussion. See also our general comments in the Public responses.

      • What could be the underlying factor(s) contributing to the difference in accuracy between the "small transformations" depicted in Figure 2 and some of the transformations displayed in Figure 3? In particular, it seems that the variability of targets and distractors is greater for the "small transformations" in Figure 2 compared to the rotation along the y-axis shown in Figure 3.

      There are several differences between these protocols. Before considering the stimulus properties, we should take into account other factors. The Transformations protocol was a training protocol, meaning that the animals underwent several sessions in this protocol, always receiving real reward during the trials, and only stopping once a high enough performance was reached. For the protocols in Figure 3, the animals were also placed in these protocols for multiple sessions in order to obtain enough trials, however, the difference here is that they did not receive real reward and testing was also stopped if performance was still low.

      • In Figure 3, it is unclear which pairwise transformation accuracies were above chance. It would be helpful if the authors could indicate significant cells with an asterisk. The scale for percentage correct is cut off at 50%. Were there any instances where the behaviors were below 50%? Specifically, did the rats consistently choose the wrong option for any of the pairs? It would be helpful to add "old pair", "concavity" and "alignment" to x-axis labels in Fig 2A .

      We have added “old”, “conc” and “align” to the x-axis labels in Figure 2A.

      • Considering the overall performance across protocols, it seems overstated to claim that the rats were able to "master the task."

      When talking about “mastering the task”, we talk about the training protocols where we aimed that the animals would perform at 80% and not significantly less. We checked this throughout the testing protocols as well, where we also presented the old pair as quality control, and their performance was never significantly lower than our 80% performance threshold on this pair, suggesting that they mastered the task in which they were trained. To avoid discussion on semantics, we also rephrased “master the task” into “learn the task”.

      • What are the criteria for the claim that the "animal model of choice for vision studies has become the rodent model"? It is likely that researchers in primate vision may hold a different viewpoint, and data such as yearly total publication counts might not align with this claim.

      Primate vision is important for investigating complex visual aspects. With the advancements in experimental techniques for rodent vision, e.g. genetics and imaging techniques as well as behavioural tasks, the rodent model has become an important model as well. It is not necessarily an “either” or “or” question (primates or rodents), but more a complementary issue: using both primates and rodents to unravel the full picture of vision.

      We have changed this part in the introduction to “Lately, the rodent model has become an important model in vision studies, motivated by the applicability of molecular and genetic tools rather than by the visual capabilities of rodents”.

      • The correspondence between the list of layers in Supplementary Tables 8 and 9 and the layers shown in Figures 4 and 6 could be clarified.

      We have clarified this in the caption of Figure 7

      • The titles in Figures 4 and 6 could be updated from "DNN" to "cDNN" to ensure consistency with the rest of the manuscript.

      Thank you for your feedback. We have changed the titles in Figures 4 and 6 such that they are consistent with the rest of the manuscript.
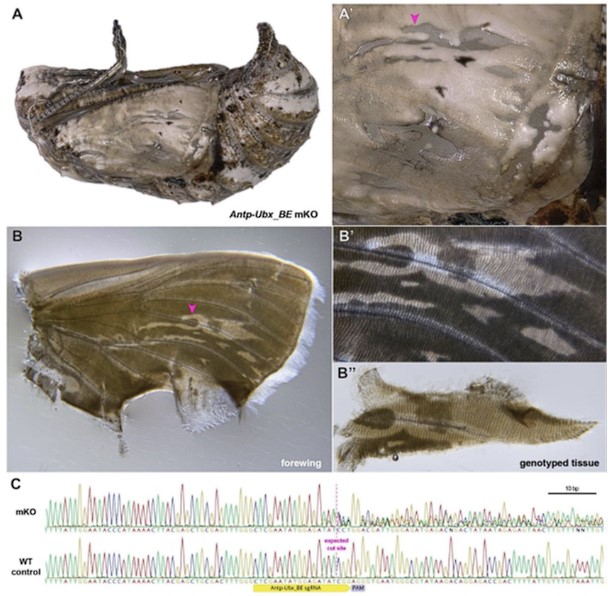
    1. Author Response

      The following is the authors’ response to the original reviews.

      eLife assessment

      This valuable manuscript attempts to identify the brain regions and cell types involved in habituation to dark flash stimuli in larval zebrafish. Habituation being a form of learning widespread in the animal kingdom, the investigation of neural mechanisms underlying it is an important endeavor. The authors use a combination of behavioral analysis, neural activity imaging, and pharmacological manipulation to investigate brain-wide mechanisms of habituation. However, the data presented are incomplete and do not show a convincing causative link between pharmacological manipulations, neural activity patterns, and behavioral outcomes.

      We thank the reviewers and editors for their careful reading and reviews of our work. We are grateful that they appreciate the value in our experimental approach and results. We acknowledge what we interpret as the major criticism, that in our original manuscript we focused too heavily on the hypothesized role of GABAergic neurons in driving habituation. This hypothesis will remain only indirectly supported until we can identify a GABAergic population of neurons that drives habituation. Therefore, we have revised our manuscript, decreasing the focus on GABA, and rather emphasizing the following three points:

      1) By performing the first Ca2+ imaging experiments during dark flash habituation, we identify multiple distinct functional classes of neurons which have different adaptation profiles, including non-adapting and potentiating classes. These neurons are spread throughout the brain, indicating that habituation is a complex and distributed process.

      2) By performing a pharmacological screen for dark flash habituation modifiers, we confirm habituation behaviour manifests from multiple distinct molecular mechanisms that independently modulate different behavioural outputs. We also implicate multiple novel pathways in habituation plasticity, some of which we have validated through dose-response studies.

      3) By combining pharmacology and Ca2+ imaging, we did not observe a simple relationship between the behavioural effects of a drug treatment and functional alterations in neurons. This observation further supports our model that habituation is a multidimensional process, for which a simple circuit model will be insufficient.

      We would like to point out that, in our opinion, there appears to be a factual error in the final sentence of the eLife assessment:

      “However, the data presented are incomplete and do not show a convincing causative link between pharmacological manipulations, neural activity patterns, and behavioral outcomes”.

      We believe that a “convincing causative link” between pharmacological manipulations and behavioural outcomes has been clearly demonstrated for PTX, Melatonin, Estradiol and Hexestrol through our dose response experiments. Similarly a link between pharmacology and neural activity patterns has also been directly demonstrated. As mentioned in (3), we acknowledge that our data linking neural activity and behaviour is more tenuous, as will be more explicitly reflected in our revised manuscript.

      Nevertheless, we maintain that one of the primary strengths of our study is our attempt to integrate analyses that span the behavioural, pharmacological, and neural activity-levels.

      In our revised manuscript, we have substantially altered the Abstract and Discussion, removed the Model figure (previously Figure 8), and changed the title from :

      “Inhibition drives habituation of a larval zebrafish visual response”

      to:

      “Functional and pharmacological analyses of visual habituation learning in larval zebrafish”

      Text changes from the initial version are visible as track changes in the word document: “LamireEtAl_2022_eLifeRevisions.docx”

      Reviewer #1 (Public Review):

      This manuscript addresses the important and understudied issue of circuit-level mechanisms supporting habituation, particularly in pursuit of the possible role of increases in the activity of inhibitory neurons in suppressing behavioral output during long-term habituation. The authors make use of many of the striking advantages of the larval zebrafish to perform whole brain, single neuronal calcium imaging during repeated sensory exposure, and high throughput screening of pharmacological agents in freely moving, habituating larvae. Notably, several blockers/antagonists of GABAA(C) receptors completely suppress habituation of the O-bend escape response to dark flashes, suggesting a key role for GABAergic transmission in this form of habituation. Other substances are identified that strikingly enhance habituation, including melatonin, although here the suggested mechanistic insight is less specific. To add to these findings, a number of functional clusters of neurons are identified in the larval brain that has divergent activity through habituation, with many clusters exhibiting suppression of different degrees, in line with adaptive filtration during habituation, and a single cluster that potentiates during habituation. Further assessment reveals that all of these clusters include GABAergic inhibitory neurons and excitatory neurons, so we cannot take away the simple interpretation that the potentiating cluster of neurons is inhibitory and therefore exerts an influence on the other adapting (depressing) clusters to produce habituation. Rather, a variety of interpretations remain in play.

      Overall, there is great potential in the approach that has been used here to gain insight into circuit-level mechanisms of habituation. There are many experiments performed by the authors that cannot be achieved currently in other vertebrate systems, so the manuscript serves as a potential methodological platform that can be used to support a rich array of future work. While there are several key observations that one can take away from this manuscript, a clear interpretation of the role of GABAergic inhibitory neurons in habituation has not been established. This potential feature of habituation is emphasized throughout, particularly in the introduction and discussion sections, meaning that one is obliged as a reader to interrogate whether the results as they currently stand really do demonstrate a role for GABAergic inhibition in habituation. Currently, the key piece of evidence that may support this conclusion is that picrotoxin, which acts to block some classes of GABA receptors, prevents habituation. However, there are interpretations of this finding that do not specifically require a role for modified GABAergic inhibition. For instance, by lowering GABAergic inhibition, an overall increase in neural activity will occur within the brain, in this case below a level that could cause a seizure. That increase in activity may simply prevent learning by massively increasing neural noise and therefore either preventing synaptic plasticity or, more likely, causing indiscriminate synaptic strengthening and weakening that occludes information storage. Sensory processing itself could also be disrupted, for instance by altering the selectivity of receptive fields. Alternatively, it could be that the increase in neural activity produced by the blockade of inhibition simply drives more behavioral output, meaning that more excitatory synaptic adaptation is required to suppress that output. The authors propose two specific working models of the ways in which GABAergic inhibition could be implemented in habituation. An alternative model, in which GABAergic neurons are not themselves modified but act as a key intermediary between Hebbian assemblies of excitatory neurons that are modified to support memory and output neurons, is not explored. As yet, these or other models in which inhibition is not required for habituation, have not been fully tested.

      This manuscript describes a really substantial body of work that provides evidence of functional clusters of neurons with divergent responses to repeated sensory input and an array of pharmacological agents that can influence the rate of a fundamentally important form of learning.

      We thank the reviewer for their careful consideration of our work, and we agree that multiple models of how habituation occurs remain plausible. As discussed above and below in more detail, we have revised our manuscript to better reflect this. We hope the reviewer will agree that this has improved the manuscript.
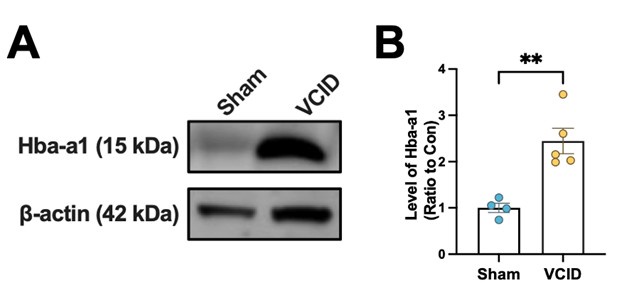
      Reviewer #2 (Public Review):

      In this study, Lamire et al. use a calcium imaging approach, behavioural tests, and pharmacological manipulations to identify the molecular mechanisms behind visual habituation. Overall, the manuscript is well-written but difficult to follow at times. They show a valuable new drug screen paradigm to assess the impact of pharmacological compounds on the behaviour of larval zebrafish, the results are convincing, but the description of the work is sometimes confusing and lacking details.

      We thank the reviewer for identifying areas where our description lacked details. We apologize for these omissions and have attempted to add relevant details as described below. We note that all of the analysis code is available online, though we appreciate that navigating and extracting data from these files is not straightforward.

      The volumetric calcium imaging of habituation to dark flashes is valuable, but the mix of responses to visual cues that are not relevant to the dark flash escape, such as the slow increase back to baseline luminosity, lowers the clarity of the results. The link between the calcium imaging results and free-swimming behaviour is not especially convincing, however, that is a common issue of head-restrained imaging with larval zebrafish.

      We agree with the reviewer that the design of our stimulus, and specifically the slow increase back to baseline luminosity, is perhaps confusing for the interpretation of some of the response profiles of neurons. We originally chose this stimulus type (rather than a square wave of 1s of darkness, for example) in order to better highlight the responses of the larvae to the onset of darkness (rather than the response to abruptly returning to full brightness). We therefore believe that the slow return to baseline is an important feature of the stimulus,, which better separates activity related to the fast offset from activity related to light onset. And since all of the foundational behavioural data (Randlett et al., Current Biology 2019), and pharmacological data, used this stimulus type, we did not change it for the Ca2+ imaging experiments. Our use of relatively slow nuclear-targeted GCaMP indicators also means that the temporal resolution of our imaging experiments is relatively poor, and therefore we felt that using a stimulus that highlighted light offset might be best.

      We also fully acknowledge in the Results section that the behaviour of the head embedded fish is not the same as that of free-swimming fish, and that therefore establishing a direct link between these types of experiments is complicated. This is an unavoidable caveat in the head-embedded style experiments. To further emphasize this, we have also added a paragraph to the discussion where this is acknowledged explicitly.

      “We also found that the same pharmacological treatments that result in strong alterations to habituation behaviour in freely swimming larvae ([fig:5]), resulted in relatively subtle and complex functional alterations in the circuit ([fig:6]). Making direct comparisons between freely-swimming behaviour and head-fixed Ca2+ imaging is always challenging due to the differences in behaviour observed in the two contexts, and therefore our failure to identify a clear logic in these experiments may have technical explanations that will require approaches to measure neural activity from unrestrained and freely-behaving animals to resolve . Alternatively, these results are again consistent with the idea that habituation is a multidimensional and perhaps highly non-linear phenomenon in the circuit, which cannot be captured by a simple model.”

      The strong focus on GABA seems unwarranted based on the pharmacological results, as only Picrotoxinin gives clear results, but the other antagonists do not give a consistent results. On the other hand, the melatonin receptor agonists, and oestrogen receptor agonists give more consistent results, including more convincing dose effects.

      We agree that our manuscript focused too strongly on GABA and have toned this down. We are currently performing genetic experiments aimed at identifying the Melatonin, Estrogen and GABA receptors that function during habituation, which we think will be necessary to move beyond pharmacology and the necessary caveats that such experiments bring.

      The pharmacological manipulation of the habituation circuits mapped in the first part does not arrive at any satisfying conclusion, which is acknowledged by the authors. These results do reinforce the disconnect between the calcium imaging and the behavioural experiments and undercut somewhat the proposed circuit-level model.

      We agree with this criticism and have toned down the focus on GABA specifically in the circuit, and have removed the speculative model previously in Figure 8.

      Overall, the authors did identify interesting new molecular pathways that may be involved in habituation to dark flashes. Their screening approach, while not novel, will be a powerful way to interrogate other behavioural profiles. The authors identified circuit loci apparently involved in habituation to dark flashes, and the potentiation and no adaptation clusters have not been previously observed as far as I know.

      The data will be useful to guide follow-up experiments by the community on the new pathway candidates that this screen has uncovered, including behaviours beyond dark flash habituation.

      We again thank the reviewer for both their support of our approach, and in pointing out where our conclusions were not well supported by our data.

      Reviewer #3 (Public Review):

      To analyze the circuit mechanisms leading to the habituation of the O-bed responses upon repeated dark flashes (DFs), the authors performed 2-photon Ca2+ imaging in larvae expressing nuclear-targeted GCaMP7f pan-neuronally panning the majority of the midbrain, hindbrain, pretectum, and thalamus. They found that while the majority of neurons across the brain depress their responsiveness during habituation, a smaller population of neurons in the dorsal regions of the brain, including the torus longitudinalis, cerebellum, and dorsal hindbrain, showed the opposite pattern, suggesting that motor-related brain regions contain non-depressed signals, and therefore likely contribute to habituation plasticity.

      Further analysis using affinity propagation clustering identified 12 clusters that differed both in their adaptation to repeated DFs, as well as the shape of their response to the DF.

      Next by the pharmacological screening of 1953 small molecule compounds with known targets in conjunction with the high-throughput assay, they found that 176 compounds significantly altered some aspects of measured behavior. Among them, they sought to identify the compounds that 1) have minimal effects on the naive response to DFs, but strong effects during the training and/or memory retention periods, 2) have minimal effects on other aspects of behaviors, 3) show similar behavioral effects to other compounds tested in the same molecular pathway, and identified the GABAA/C Receptor antagonists Bicuculline, Amoxapine, and Picrotoxinin (PTX). As partial antagonism of GABAAR and/or GABACR is sufficient to strongly suppress habituation but not generalized behavioral excitability, they concluded that GABA plays a very prominent role in habituation. They also identified multiple agonists of both Melatonin and Estrogen receptors, indicating that hormonal signaling may also play a prominent role in habituation response.

      To integrate the results of the Ca2+ imaging experiments with the pharmacological screening results, the authors compared the Ca2+ activity patterns after treatment with vehicle, PTX, or Melatonin in the tethered larvae. The behavioral effects of PTX and Melatonin were much smaller compared with the very strong behavioral effects in freely-swimming animals, but the authors assumed that the difference was significant enough to continue further experiments. Based on the hypothesis that Melatonin and GABA cooperate during habituation, they expected PTX and Melatonin to have opposite effects. This was not the case in their results: for example, the size of the 12(Pot, M) neuron population was increased by both PTX and Melatonin, suggesting that pharmacological manipulations that affect habituation behavior manifest in complex functional alterations in the circuit, making capturing these effects by a simple difficult.

      Since the 12(𝑃𝑜𝑡, 𝑀) neurons potentiate their responses and thus could act to progressively depress the responses of other neuronal classes, they examined the identity of these neurons with GABA neurons. However, GABAergic neurons in the habituating circuit are not characterized by their Adaptation Profile, suggesting that global manipulations of GABAergic signaling through PTX have complex manifestations in the functional properties of neurons.

      Overall, the authors have performed an admirably large amount of work both in whole-brain neural activity imaging and pharmacological screening. However, they are not successful in integrating the results of both experiments into an acceptably consistent interpretation due to the incongruency of the results of different experiments. Although the authors present some models for interpretation, it is not easy for me to believe that this model would help the readers of this journal to deepen the understanding of the mechanisms for habituation in DF responses at the neural circuit level.

      This reviewer would rather recommend the authors divide this manuscript into two and publish two papers by adding some more strengthening data for each part such as cellular manipulations, e.g. ablation to prove the critical involvement of 12(Pot, M) neurons in habituation.

      We thank the reviewer for their careful consideration of our manuscript, and we agree that our emphasis on a particular model of DF habituation, namely the potentiation of GABAergic synapses, was overly speculative. We hope they will agree that our revised manuscript better reflect the results from our experiments, and we have tried to more specifically emphasize the incongruency in our behavioural and Ca2+ imaging data after pharmacological treatment, which we agree shows that a simple model is insufficient to capture both of these sets of observations.

      We have opted not to split the paper into two, since we feel that the collective message of this paper and approach combining molecular and functional analysis will be of interest. Moreover, we feel that the molecular and functional analyses feed off of each other and provide a level of complementarity that would be lost if the manuscript would be split, even if the message in this particular case is rather complex

      Reviewer #1 (Recommendations For The Authors):

      There is much to commend about this manuscript. The advantages of studying habituation in the zebrafish larva are very clearly demonstrated, including the wonderful calcium imaging across the brain and the relatively high throughput screening of large numbers of different pharmacological agents. The habituation to dark flashes in freely moving larvae is also striking and the very large effect size serves the screening beautifully. Thus, if we take the really substantial amount of work of a very high standard that has been done here, there is clearly potential for an important new contribution to the literature. However, as you will see from my public review, I am of the opinion that a specific role for the modification of GABAergic inhibitory systems has not yet been established through this work. While the potential role for GABAergic inhibitory neurons in habituation, either as the key modifiable element or as an intermediary between memory and motor output, is an attractive theory with many strengths, your study as it currently stands does not categorically demonstrate that one of those two options holds. For instance, the more traditional view, that adaptive filtration is mediated by weakened synaptic connectivity between excitatory sensory systems and excitatory motor output or reduced intrinsic excitability in those same neurons, could still be in operation here. By lowering GABAergic influence over post-synaptic targets with picrotoxin, it is possible that motor output remains highly active, and even lower activity or synaptic drive from those excitatory sensory systems that feed into the output may still reliably produce behavioral output. Alternatively, it could be the formation of a memory of the familiar stimulus is disrupted by reduced inhibition that alters sensory coding either by introducing noise or reducing the selectivity of receptive fields. I believe that there are several options to address these concerns:

      1) You could change the emphasis of the manuscript so that it is less focused on inhibition and instead emphasizes the categorization of clusters of neurons that have divergent responses during habituation, including either strong suppression to potentiation. To this, you add a high throughput screening system with a wide range of different agents being tested, several of which produce a significant effect on habituation in either direction. These observations in themselves provide powerful building blocks for future work.

      2) If GABAergic neurons play a key role in habituation in this paradigm, then picrotoxin is having its effect by blocking receptors on excitatory neurons. Thus, it seems that selectively imaging GABAergic neurons before and after the application of these drugs is not likely to reveal the contribution of GABAergic synaptic influence on excitatory targets. More important is to get a stronger sense of how the GABAergic neurons change their activity throughout habituation and then influence the downstream target neurons of those GABAergic neurons (some of which may themselves be inhibitory and participating in disinhibition). For instance, you could interrogate whether anti-correlations in activity levels exist between presynaptic inhibitory neurons and putative post-synaptic targets. This analysis could be further bolstered by removing that relationship in the presence of Picrotoxin, thereby demonstrating a direct influence of inhibition from a GABAergic presynaptic partner on a postsynaptic target. While this would constitute a lot more work, it is likely to yield greater insight into a specific role for GABAergic neurons in habituation, and I suspect much of that information is in the existing datasets.

      3) To really reveal causal roles for inhibition in this form of habituation, it seems to me that there needs to be some selective intervention in GABAergic neuronal activity, ideally bidirectionally, to transiently interrupt or enhance habituation. Optogenetic or chemogenetic stimulation/inactivation is one option in this regard, which I imagine would be challenging to implement and certainly involves a lot of further work, particularly if you are then going to target specific subpopulations of GABAergic neurons. I appreciate that this option seems way beyond the scope of a review process and would probably constitute a follow-up study.

      We agree with the reviewer that we have not “categorically demonstrated” that GABAergic inhibitory neurons drive habituation by increasing their influence on the circuit, and appreciate the suggestions for how to reformulate our manuscript to better reflect this. We have opted to follow suggestion (1), and have considerably changed the focus of the manuscript.

      The additional analysis suggested in (2) is very interesting, but since we can not identify which cells are inhibitory in our imaging experiments with picrotoxinin treatment, nor which are pre- or post-synaptic, we feel that this analysis will be very unconstrained. Also, if GABA is acting as an inhibitory neurotransmitter, it therefore is expected to act to drive anticorrelations among pre and postsynaptic neurons through inhibition. Therefore, blockage of GABA through PTX would be expected to result in increased correlations, regardless of our hypothesized role of neurons during habituation. Our current efforts are aimed at identifying critical neurons driving habituation plasticity, and we will perform such analysis once we have mechanisms for identifying these neurons.

      Finally, we agree that (3) is the obvious and only way to demonstrate causation here, and this is where we are working towards. However, since we currently have no means of genetically targeting these neurons, we are not able to perform these suggested experiments today.

      I have some additional concerns that I would really appreciate you addressing:

      1) The behavioral habituation is striking in the freely moving larvae, but very hard to monitor in the larvae that are immobilized for calcium imaging. Are there steps that could be taken in the long run to improve direct observation of the habituation effect in these semi-stationary fish? For instance, is it possible to observe eye movements or some more subtle behavioral readout than the O-bend reflex? I apologize if this is a naïve question, but I am not entirely familiar with this specific experimental paradigm.

      In the Dark Flash paradigm, we do not have readouts beyond the “O-bend” response itself, which is characterized by a large-angle bend of the tail and turning maneuver. We have not observed other, more subtle behavioural responses, such as eye or fin movements, for example. If we would be able to identify alternative behavioural outputs that were more robustly performed during head-embedded preparations, this would indeed be an advantage allowing us to more directly interpret the Ca2+ imaging results with respect to behaviour.

      2) The dark flash as a stimulus to which the larvae habituate is obviously used as a powerful and ethologically relevant stimulus. However, it does leave an element of traditional habituation paradigms out, which is a novel stimulus that can be used to immediately re-instate the habituated response (otherwise known as dishabituation). Is there a way that you can imagine implementing that with zebrafish larvae, for instance through systematically altering a visual feature, such as spatial frequency or orientation? This would be a powerful development in my view as it would not only allow you to rule out motor or sensory fatigue as an underlying cause of reduced behavior but also it would provide an extra feature that strengthens your assessment of neuronal response profiles in candidate populations of inhibitory and excitatory neurons.

      We agree that identifying a dishabituating stimulus would be very powerful for our experiments. For short-term habituation of the acoustic startle response, Wolman et al demonstrated that dishabituation occurs after a touch stimulus (Wolman et al., PNAS, 2011; https://doi.org/10.1073/pnas.1107156108). We attempted to dishabituate the O-Bend response with tap and touch stimuli, and this unfortunately did not occur. Our understanding of dishabituation is that this generally requires a second stimulus that elicits the same behaviour as the habituated stimulus (e.g. both acoustic and touch-stimuli elicit the Mauthner-dependent C-bend response). In zebrafish the only stimulus that has been identified that elicits the O-bend is a dark-flash. This lack of an appropriate alternative stimulus is perhaps why we have been unsuccessful in identifying a dishabituating stimulus.

      3) You have written about the concept of 'short' and 'long' response shapes when using calcium imaging as a proxy for neural activity, surmising that the short response shape may reflect transient bursting. Although calcium imaging obviously has many advantages, this feature reveals one notable limitation of calcium imaging in contrast to electrophysiology, in that the time course of the signal is considerably longer and does not allow you with confidence to fully detect the response profile of neurons. Is there some kind of further deconvolution process that you could implement to improve the fidelity of your calcium imaging to the occurrence of action potentials? The burstiness of neurons is obviously important as it can indicate a particular type of neuron (for instance fast-spiking inhibitory neurons) or it might reveal a changing influence on post-synaptic neurons. For instance, bursting can be a response to inhibition due to the triggering of T-type calcium channels in response to hyperpolarization.

      One of the major limitations to Ca2+ imaging is the lack of temporal resolution. In our particular approach, using nuclear-targeted H2B-GCaMP indicators, further reduces our temporal resolution. Deconvolution approaches can be used in some instances to approximate spike rate, since the rise-time of Ca2+ indicators can be relatively fast. However, in our imaging we chose to image larger volumes at the expense of scan rate, where our imaging is performed at only 2hz. Therefore, deconvolution and spike-rate estimation is not appropriate. Considering these limitations, we would argue that the fact that we can observe differences in kinetics of the 'short' and 'long' response shapes indicates that they likely show very different response kinetics, which we hope to confirm by electrophysiology once we have established ways of targeting these neurons for recordings.

      4) I note that among the many substances you screened with is MK801. An obvious candidate mechanism in habituation is the NMDA receptor, given the importance of this receptor for so many forms of learning and bidirectional synaptic plasticity. If I am to understand correctly, this NMDA receptor blocker actually enhances habituation in the zebrafish larvae, similar to melatonin. That is a very surprising observation, which is worth looking into further or at least discussed in the manuscript. The finding would, at least, be consistent with the idea that plasticity is not occurring at excitatory synapses and could potentially bolster the argument that plasticity of inhibitory synapses is at play in this particular form of habituation.

      This is a very important point. We were also particularly interested in MK801, which has been shown to inhibit other forms of habituation, like short-term acoustic habituation (Wolman et al., PNAS, 2011; https://doi.org/10.1073/pnas.1107156108). In our experiments we did see that fish become even less responsive to dark flashes when treated with MK-801 (SSMD fingerprint data: Prob-Train = -0.39, Prob-Test = -1.58) which would indicate that MK-801 promotes dark flash habituation, similar to Melatonin. However, we also observed that MK-801 caused a decrease in the performance in the other visual assay we tested: the optomotor response (OMR-Perf = -0.93), indicating that MK-801 causes a generalized decrease in visual responses, perhaps by acting on circuits within the retina. Therefore, based on these experiments with global drug applications, we cannot determine if MK-801 influences the plasticity process in dark-flash habituation, and this is why we did not pursue it further in this project.

      Anyway, I hope that you take these suggestions as constructive and, in the spirit that they are intended, as possible routes for improving an already very interesting manuscript.

      We are very grateful for your suggestions, which we feel has helped us to improve our manuscript substantially.

      Reviewer #2 (Recommendations For The Authors):

      Overall, the manuscript is well-written, but confusing at times. The results are not always presented in a consistent way, and I found myself having to dig in the raw data or code to find answers. There is a certain disconnect between the free-swimming results, and the calcium imaging, which is somewhat inevitable based on other published work. But I am unsure of what they each bring to the other, as the results from Fig.6 do not match at all the changes observed in the behavioural assays, it almost feels like two separate studies and the inconsistencies make the model appear unlikely.

      We agree that there is a disconnect at the behavioural level in our free-swimming and head-embedded imaging experiments. However, this does not necessarily mean that the activity we observe during the imaging experiments cannot be informative about processes that are also occurring in freely-swimming fish. For example, it is possible that the dark-flash circuit is responding and habitating similarly in the head-embedded and freely-swimming preparations, but that in the latter context there is an additional blockade on motor output that massively decreases the propensity of the fish to initiate any movements. In such a case, the “disconnect between the free-swimming results, and the calcium imaging” would indicate that the relationship between neural activity and habituation behaviour is rather complex.

      Without a method to record activity from freely swimming fish at our disposal, we can not determine this, one way or the other.

      We hope that we now acknowledge these concerns appropriately in the discussion:

      “We also found that the same pharmacological treatments that result in strong alterations to habituation behaviour in freely swimming larvae ([fig:5]), resulted in relatively subtle and complex functional alterations in the circuit ([fig:6]). Making direct comparisons between freely-swimming behaviour and head-fixed Ca2+ imaging is always challenging due to the differences in behaviour observed in the two contexts, and therefore our failure to identify a clear logic in these experiments may have technical explanations that will require approaches to measure neural activity from unrestrained and freely-behaving animals to resolve . Alternatively, these results are again consistent with the idea that habituation is a multidimensional and perhaps highly non-linear phenomenon in the circuit, which cannot be captured by a simple model. “

      I am not convinced by the results surrounding GABA, from the inconsistent GABA receptor antagonist profile to the post hoc identification of GABAergic neurons as it is currently done in the manuscript. I think that the current focus on GABA does a disservice to the manuscript. However, the novel findings surrounding the potential role of Melatonin, and Estrogen, in habituation are quite interesting.

      We agree that we focused too heavily on our hypothesized role for GABA in our original manuscript, and we hope that the reviewer agrees that our updated manuscript is an improvement. We also thank the reviewer for their interest in our Melatonin and Estrogen results, for which follow up studies are ongoing to characterize the effects of these hormones and their receptors on habituation.

      There is an assumption that all the adaptation profiles are related to the DF (although that is somewhat alleviated in the discussions of the ON responses) and not to the luminosity changes. But there is no easy way to deconvolve those two in the current experiments. I would like the timing of the fluorescence rise to be quantified compared to the dark flash stimulus onset, potentially spike inference methods could help with giving a better idea of the timing of those responses. Based on the behavioural responses that were <500ms in Randlet O et al, eLife, 2019; we would expect only the fastest DF responses to be linked to the behaviour.

      We agree that we are unable to disambiguate responses to the dark flash that initiate the O-bend response, and those that are related to only changes in luminosity. As discussed above, our Ca2+ imaging approach is severely limited in temporal resolution and therefore spike inference methods are not appropriate.

      Major comments

      Fig.1: There seems to be a very variable lag between the motor events and DF responses, furthermore, it does not seem that the motor responses follow a similar habituation rate as in 1Bi. Although this only shows the smoothed 'movement cluster' from the rastermap, it could hide individual variability. It would be important to know what the 'escape' rate was in the embedded experiment, as

      Fig.1 sup.1 seems to indicate there was little to no habituation. It would also be needed to know which motor events are considered linked to the DF stimulus, and how that was decided. Was there a movement intensity threshold and lag limit in the response?

      We interpret this concern as relating to the data presented in Figure 6A, where we quantify the habituation rate in the head-embedded experiments. As we have discussed, both above and in the manuscript, we saw very strongly muted responses to DFs in the head-embedded preparation, but we neglected to describe our method of quantifying the responses. We have added the following description to the methods:

      “To quantify responses to the dark flash stimuli we used motion artifacts in the imaging data to identify frames associated with movements ([fig:1]-[fig:S1]). Motion artifact was quantified using the “corrXY” parameter from suite2p, which reflects the peak of phase correlation comparing each acquired frame and reference image used for motion correction. The “motion power” was quantified as the standard deviation of a 3-frame rolling window, which was smoothed in time using a Savitzky-Golay filter (window length = 15 frames, polyorder = 2). A response to a dark flash was defined as a “motion power” signal greater than 3 (z-score) occurring within 10-seconds of the dark-flash onset, and was used to quantify habituation in the head-embedded preparation ([fig:6]A).“

      Line 94: This seems to be a strong claim based on the sparse presence of non-habituating, or potentiating, neurons in downstream regions. However, these neurons appear to be extremely rare, and as mentioned in my comment above, the behavioural habituation appears minimal. These neurons could encode the luminosity and be part of other responses, such as light-seeking in Karpenko S et al, eLife, 2020 or escape directionality in Heap et al, Neuron, 2018. Furthermore, dimming information has been shown to have parallel processing pathways in Robles E et al, JCN, 2020; so it would make sense that not all the observed responses in this manuscript would be involved in behavioural habituation to dark flashes.

      We agree that without functional interventions, we do not know which of the neurons we have categorized are specifically involved in the dark flash response habituation. It is possible that the non-adapting and potentiating neurons are involved in other behaviours. We have therefore removed this statement.

      Line 103: It appears that several of those responses are to the changes in luminosity and not the DF itself, especially the ON and sustained responses. Based on the previous DF habituation study from Randlet O et al, eLife, 2019; the latency of the response is below 0.5s. So the behaviour-relevant responses must only include the shortest latency one, as discussed above.

      We appreciate the point that the reviewer is making here, but we are less clear about what the difference between “changes in luminosity” and a “dark flash” response are, since a dark flash consists of a change in luminosity. We take it that the reviewer means the difference between a luminance stimulus that elicits an O-bend, from one that does not. In order to disambiguate the two, one would likely need to use stimuli where the luminosity changes, but do not elicit O-bends.

      Perhaps due to the limited temporal resolution of our Ca2+ imaging data, we do not see a clear difference in the onset of the stimulus response for any of the functional clusters that would help us to determine which neurons are more relevant to the acute DF response.

      Fig.2B. It is very difficult to make out the actual average z-scored fluorescence, a supplementary figure would help by making these bigger. A plot to quantify the maximum response would also be useful to judge how it changes between the first few and few last DF. Another plot to give the time between the onset of the responses and the onset of the DF stimulus is also needed to judge which cluster may be relevant to the DF escapes observed in the free-swimming experiments.

      We agree with the reviewer that interpreting these datasets are challenging. We did include the actual average z-scored fluorescence in Figure 6—figure supplement 1, panel D. This figure also includes a comparison between the predicted Ca2+ response to the dark flash (the stimulus convolved with the approximate GCaMP response kernel), which shows that all OFF-responding neuronal classes show very similar rise time response kinetics, and thus this analysis does not help to judge whether a cluster is more or less relevant to O-bend responses in the free-swimming experiments. We appreciate that there are differences in opinion about the best way to present the data, but we have opted to leave our original presentation.

      Line 130: Is a correlation below 0.1 meaningful or significant? It does not seem like this cluster would be a motor or decision cluster.

      Our goal with this correlational analysis to motor signals was to identify if certain clusters of DF responsive neurons were more associated with motor output, and therefore may be more downstream in the sensori-motor cascade. Cluster 4 showed the highest median correlation across the population of cells. Whether a median correlation of ~0.1 is “meaningful” is impossible for us to answer, but it is highly “significant” in the statistical sense, as is evident by the 99.99999% confidence intervals plotted. We note that these cells were not selected based on their correlation to the motor stimulus, but only to the dark flash stimulus. There are “motor” clusters that show much higher correlations to the motors signals, as is evident in Figure 1G.

      Line 165: Did the changes observed for Pimozide fall below the significance threshold, were lethal, or were the results not repeated? It does not appear in source data 2.

      Pimozide was lethal in our screen and therefore does not appear in the source data file. Indeed, in our previous experiments with Pimozide we had already established that a 10uM dose is lethal, and that the maximal effective dose we tried was 1uM as reported in (Randlett et al., Current Biology, 2019).

      We have clarified this in the text:

      “While the false negative rate is difficult to determine since so little is known about the pharmacology of the system, we note that of the three small molecules we previously established to alter dark flash habituation that were included in the screen, Clozapine, Haloperidol and Pimozide , the first two were identified among our hits while Pimozide was lethal at the 10\muM screening concentration.”

      Fig.1B and Fig.3B are the same data, which is awkward and should be explicitly stated. But the legends do not match in terms of the rest period. Which is correct? It is also important to note the other behavioural assays in the 'rest' period.

      We thank the reviewer for pointing out this discrepancy in the legend. We have corrected the typo in the figure legend of Figure 3B :

      “Habituation results in a progressive decrease in responsiveness to dark flashes repeated at 1-minute intervals, delivered in 4 training blocks of 60 stimuli, separated by 1hr of rest (from 0:00-7:00).”

      We have also added a statement that the data is the same as that in Figure 1B.

      Figure 3-4: SSMD fingerprint, there is no description of the different behavioural parameters. What they represent is left to the reader's inference. There is no mention of SpontDisp in the GitHub for example, so it is hard to know how these different parameters were measured. Even referring to the previous manuscript on habituation (Randlet O et al, eLife, 2019) does not shed light on most of them, for example, I suppose TwoMvmt represents the 'double responses' from the previous manuscript. Furthermore, there are inconsistencies between 3C and 4B, some minor (SpontDisp becomes SpntDisp), but Curve-Tap has disappeared for example, and I suspect became BendAmp-Tap. A more thorough description of these measures, and making the naming scheme consistent, are essential for readers to know what they are looking at.

      We again thank the reviewer for their careful assessment of our data, and we apologize for this sloppiness. We have gone through and made the naming of these parameters consistent in both figures, and have added another supplementary table that describes in more detail what each parameter is, and how it relates to the analysis code (Figure3_sourcedata3_SSMDFingerprintParameters.xls). This was an essential missing piece of information from our original manuscript.

      Line 206: While this prioritization makes sense, how was it implemented, how was the threshold decided and which were they? A table, or supplementary figure, would help to clarify the reason behind the choices. Fig.4C being cropped only around the response probability makes it impossible to judge if the criteria were respected, as the main heatmap is too small. For example, the choice of GABA receptor antagonists is somewhat puzzling, as besides PTX it does not seem that the other compounds had strong effects, with Amoxapine for example having seemingly as much effect on Naive and Train, with little in Test. And Bicuculline gave negative SSMD for prob in the three cases. The dose-response for PTX does lend credence to its effect, but I would have liked the other compounds, especially bicuculline. The melatonin results, for example, are much more convincing and interesting in our opinion.

      While in hindsight it may have been possible to do the hit prioritization in a systematic way using thresholding and ranking, we did this manually by inspecting the clustered fingerprints. We have clarified this in the text: “This manual prioritization led to the identification of the GABAA/C Receptor antagonists…”

      While we agree that it is not possible to judge how well we performed this prioritization based on the images presented, we note that we do provide the full fingerprint data in the supplementary data, for which the reader is welcome to draw their own conclusions.

      We have not performed further experiments with amoxapine, so we can not comment further on this. We did perform additional experiments with bicuculline, for which we did see effects similar to those of PTX, were habituation was inhibited. However, the effects are weaker and more variable than what we observe with PTX, and bicuculline also inhibits the initial responses of the larvae, causing their Naive response to be lower. Therefore we did not include it in our manuscript. We include these data here in Author response image 1 to reassure the Reviewer that picrotoxinin is not the only GABA Receptor antagonist for which we see inhibitory effects on habituation.

      Author response image 1.

      Fig.6: Why was the melatonin concentration used only 1um instead of 10um on the screen?

      Based on dose response experiments (Figure 5B, and others not shown), we found that the effect of Melatonin on habituation saturates at about 1uM, and therefore we used this dose.

      Line 277: As the correlation with motor output is marginal at best, and the authors recognize the lack of behaviour in tethered animals, I would be careful about such speculation. Especially since the other changes are complex and go in all directions.

      While we appreciate the reviewer's caution, we feel that our statement is appropriately hedged using “might be”. We have also removed the statement “and thus is most closely associated with behavioural initiation”.

      We now state:

      “However, opposite effects of PTX and Melatonin were observed for 4_L^{strgD} neurons ([fig:6]C), which we found to be most strongly correlated with motor output ([fig:2]F). Therefore, this class might be most critical for habituation of response Probability.”

      Fig.7: I am not sure how convincing these results are. 7F may have been more convincing, but to be thorough the authors would need to register the Gad1b identity to the calcium imaging and use their outline to extract the neuron's fluorescence. As it is, in the tectum, it is hard to be sure that all the identified neurons are indeed Gad1b positive, as that population is intermingled with other neuronal populations. The authors should consider the approach of Lovett-Barron M et al, Nat Neuro, 2020. Alternatively, the authors can tone down the language used in this section to match the confidence level of the association they propose.

      Figure 7A-E are what can be considered “virtual colocalization” analyses, where we are comparing the localization of data acquired in different experiments using image registration to common atlas coordinates. We agree that these results alone will never be very strong evidence for the identification of individual cells. The MultiMAP approach of Lovett-Barron is a powerful approach, though it makes the assumption that registration accuracy will be subcellular, which in practice may often not be the case. We believe that a better approach is to label the cells of interest during the Ca2+ imaging experiment itself, as we did 7F and G. The challenge in this experiment is binarizing the ROIs and thus deciding what is and is not a Gad1b-positive cell. In our opinion, the fact that these two independent experiments came to the same conclusion regarding Cluster 10 and 11 is good evidence that these cell types are likely predominantly GABAergic.

      As discussed above, we have re-written the manuscript to tone down our claims about the role of GABA and GABAergic neurons in habituation, which we hope the reviewer will agree better reflects the limitations of the data in Figure 6 and 7.

      Line 317: Based on the somewhat inconsistent results of the other GABA antagonists, I would be careful. Picrotoxin has been reported to antagonize other receptors besides GABA, see Das P et al, Neuropharma, 2003. So the results may be explained by a complex set of effects on multiple pathways with PTX.

      Off target effects are an important concern with any pharmacological experiment, and perhaps especially in zebrafish where receptors and targets can be quite divergent from those in mammals where most drug targets have been characterized. We have added this sentiment to the discussion:

      “We cannot rule out the possibility that off-targets of PTX, or subtle non-specific changes in excitatory/inhibitory balance alter habituation behaviour.”

      Line 400-403, 430: There are some conflicting statements regarding the potential role of clusters 1 and 2 in DF habituation. Do the authors think they play a role in the behaviour measured in this manuscript? Could they clarify what they mean?

      We see how our original statement in line 429 about the presence of cluster 1 and 2 neurons in the TL implied a role in dark flash habituation. This was not our intent, and we have removed “which also contains high concentrations of on-responding neurons”.

      Our thoughts on these neurons are now stated in the discussion as:

      “We also observed classes exhibiting an On-response profile ( and ). These neurons fire at the ramping increase in luminance after the DF, making it unlikely that they play a role in aspects of acute DF behaviour we measured here. These neurons exist in both non-adapting and depressing forms suggesting a yet unidentified role in behavioural adaptation to repeated DFs.“

      Minor comments

      Line 73 (and elsewhere): Why use adaptation instead of habituation (also in the adaptation profile)? Do you suspect your observations do not reflect habituation, but a sensory adaptation mechanism?

      We have used the convention that “habituation” refers to observations at the behavioural level, while “depression” and “potentiation” refer to observations at the neuronal level. We use the term “adaptation” to refer to neuronal adaptations of either sign (depression or potentiation), as in line 73.

      We believe that our observations reflect neuronal adaptations that underlie habituation behaviour.

      Line 71: It is debatable that the strongest learning happens in the first block, the difference between the first and last response seems to grow larger with each successive block. What do the authors mean by 'strongest'

      We agree that “strongest” was ambiguous. We have changed this to “initial”:

      “We focused on a single training block of 60 DFs to identify neuronal adaptations that occur during the initial phase of learning ”

      Fig.1F: there is no rastermap call in the GitHub repository, was the embedding done in the GUI? If so, it should also be shared for reproducibility's sake.

      Yes, Fig.1F was created using the suite2p GUI, as we have now clarified in the methods:

      “The clustered heatmap image of neural activity (([fig:3]F) was generated using the suite2p GUI using the “Visualize selected cells” function, and sorting the neurons using the rastermap algorithm ”

      The image is available in the “Figure1 - Ca2Imaging.svg” file available here: https://github.com/owenrandlett/lamire_2022/tree/main/LamireEtAl_2022

      Line 101: while true that AffinityPropagation does not require input on the number of clusters, preference can influence the number of clusters. It seems that at least two values were tested in the search for the clusters, can the authors comment on how many clusters the other preference value converged (or failed to converge) on?

      Indeed, as with any clustering approach, the resultant clusters are highly dependent on the input parameters, in this case the “preference”, as well as “damping” and the choice of affinity metric. By varying these parameters one can arrive at anywhere between 2 and hundreds of clusters.

      It is for this reason that we feel that the anatomical analyses of these clusters is very important, making the assumption that neurons of differing functional types will have different localizations in the brain, as we explained in the Results:

      “While these results indicate the presence of a dozen functionally distinct neuron types, such clustering analyses will force categories upon the data irrespective of if such categories actually exist. To determine if our cluster analyses identified genuine neuron types, we analyzed their anatomical localization ([fig:2]C-E). Since our clustering was based purely on functional responses, we reasoned that anatomical segregation of these clusters would be consistent with the presence of truly distinct types of neurons.”

      We also acknowledge in the Results that the clustering approach has limitations:

      “These results highlight a diversity of functional neuronal classes active during DF habituation. Whether there are indeed 12 classes of neurons, or if this is an over- or under-estimate, awaits a full molecular characterization. Independent of the precise number of neuronal classes, we proceed under the hypothesis that these clusters define neurons that play distinct roles in the DF response and/or its modulation during habituation learning“

      Fig.2. My understanding is that the cluster numbers are arbitrary unless there is a meaning to them, which then should be explained. I would recommend grouping the clusters per functional category as in Fig.6 to make it easier for the reader.

      Cluster number reflects the ordering in the hierarchical clustering tree shown in Figure 2B. We feel that this is the most logical representation of their functional similarity. We have clarified this in the Methods:

      “ We then used the Affinity Propagation clustering from scikit-learn , with “affinity” computed as the Pearson product-moment correlation coefficients (corrcoef in NumPy ), preference=-9, and damping=0.9, and clustered using Hierarchical clustering (cluster.hierarchy in SciPy ). Cluster number was assigned based on the ordering of the hierarchical clustering tree. ”

      Fig.3 SSMD fingerprint, it would be much easier for the readers if the list of parameters was clearer and rotated 90 degrees. Maybe in a supplementary figure to show what each represents.

      We agree that the SSMD fingerprint is very difficult to interpret. As discussed above, we have now included a supplementary table (Figure3_sourcedata2_SSMDFingerprintParameters.xlsx) where we have clarified what each parameter represents.

      Fig.4: The use of the same colours across the clustering methods is confusing, especially after the use of colours for the SSMD fingerprint in Fig.3. and at the bottom of 4A. Fig.4A for example could have been colour coded according to the most affected behaviour in the fingerprint at the bottom.

      Fig.4B the coloured text is difficult to read, especially for the lighter colours.

      We agree that our use of color is not perfect, but we have attempted to use them consistently: for example when referring to a functional cluster, or a drug manipulation. We don’t think that there is a sufficient number of distinguishable colors for us to never use the same color twice.

      Fig.4C if the goal is to show similarity, the relevant drugs could be placed adjacent to each other. One could also report the Euclidean distance, or compute how correlated the different fingerprints are within one pharmacological target space.

      The goal of Fig 4C is to highlight where Bicuculline, Amoxapine, Picrotoxinin, Melatonin, Ethinyl Estradiol and Hexestrol lie within the clustered heatmap of the behavioural fingerprints (Fig 4A), and<br /> demonstrate how the probability of response to dark flashes is modulated by these drugs. In our analyses, “similarity” is a function of the clustering distance.

      Fig.6D 'Same data as M, ...' I assume should be 'Same data as C,...'

      Indeed, thank you for pointing out this error that we have corrected.

      Fig. 7 How many GCaMP6s double transgenic larvae were imaged?

      6 fish were imaged, as is stated in the legend to Fig 7G

      Line 407: all is repeated.

      We apologize, but we do not see what is repeated at line 407. Can you please clarify?

      Line 481: Would testing spontaneous activity after training for 7h be unbiased, could there be fatigue effects?

      We tested for fatigue effects in our previous study, comparing larvae that received the training for 7hrs and those that did not, and we saw no deficits in spontaneous activity, tap response, or OMR performance (Figure S1, Randlett et al., Current Biology, 2019).

      Line 610: There are some inconsistencies between the authors' contributions in the manuscript and the one provided to eLife.

      Thank you, we will double check this in the resubmission forms. The authors' contributions in the manuscript are correct.

      Reviewer #3 (Recommendations For The Authors):

      I would rather recommend the authors divide this manuscript into two and publish two papers by adding some more strengthening data for each part such as cellular manipulations, e.g. ablation to prove the critical involvement of 12(Pot, M) neurons in habituation.

      We thank the reviewer for their suggestion, but have opted not to split the paper into two. We feel that the collective message of this paper and approach combining molecular and functional analysis will be of interest, and we believe the incongruencies in our results reflects the complexity inherent within the system.

    1. Author Response

      The following is the authors’ response to the original reviews.

      Thank you for the detailed and constructive reviews. We revised the paper accordingly, and a point-by-point reply appears below. The main changes are:

      • An extended discussion section that places our work in context with other related developments in theory and modeling.

      • A new results section that demonstrates a substantial improvement in performance from a non-linear activation function. This led to addition of a co-author.

      • The mathematical proof that the resolvent of the adjacency matrix leads to the shortest path distances has been moved to a separate article, available as a preprint and attached to this resubmission. This allows us to present that work in the context of graph theory, and focus the present paper on neural modeling.

      Reviewer #1 (Public Review):

      This paper presents a highly compelling and novel hypothesis for how the brain could generate signals to guide navigation towards remembered goals. Under this hypothesis, which the authors call "Endotaxis", the brain co-opts its ancient ability to navigate up odor gradients (chemotaxis) by generating a "virtual odor" that grows stronger the closer the animal is to a goal location. This idea is compelling from an evolutionary perspective and a mechanistic perspective. The paper is well-written and delightful to read.

      The authors develop a detailed model of how the brain may perform "Endotaxis", using a variety of interconnected cell types (point, map, and goal cells) to inform the chemotaxis system. They tested the ability of this model to navigate in several state spaces, representing both physical mazes and abstract cognitive tasks. The Endotaxis model performed reasonably well across different environments and different types of goals.

      The authors further tested the model using parameter sweeps and discovered a critical level of network gain, beyond which task performance drops. This critical level approximately matched analytical derivations.

      My main concern with this paper is that the analysis of the critical gain value (gamma_c) is incomplete, making the implications of these analyses unclear. There are several different reasonable ways in which the Endotaxis map cell representations might be normalized, which I suspect may lead to different results. Specifically, the recurrent connections between map cells may either be an adjacency matrix, or a normalized transition matrix. In the current submission, the recurrent connections are an unnormalized adjacency matrix. In a previous preprint version of the Endotaxis manuscript, the recurrent connections between the map cells were learned using Oja's rule, which results in a normalized state-transition matrix (see "Appendix 5: Endotaxis model and the successor representation" in "Neural learning rules for generating flexible predictions and computing the successor representation", your reference 17). The authors state "In summary, this sensitivity analysis shows that the optimal parameter set for endotaxis does depend on the environment". Is this statement, and the other conclusions of the sensitivity analysis, still true if the learned recurrent connections are a properly normalized state-transition matrix?

      Yes, this is an interesting topic. In v.1 of our bioRxiv preprint we used Oja’s rule for learning, which will converge on a map connectivity that reflects the transition probabilities. The matrix M becomes a left-normalized or right-normalized stochastic matrix, depending on whether one uses the pre-synaptic or the post-synaptic version of Oja’s rule. This is explained well in Appendix 5 of Fang 2023.

      In the present version of the model we use a rule that learns the adjacency matrix A, not the transition matrix T. The motivation is that we want to explain instances of oneshot learning, where an agent acquires a route after traversing it just once. For example, we had found experimentally that mice can execute a complex homing route on the first attempt.

      An agent can establish whether two nodes are connected (adjacency) the very first time it travels from one node to the other. Whereas it can evaluate the transition probability for that link only after trying this and all the other available links on multiple occasions. Hence the normalization terms in Oja’s rule, or in the rule used by Fang 2023, all involve some time-averaging over multiple visits to the same node. This implements a gradual learning process over many experiences, rather than a one-shot acquisition on the first experience.

      Still one may ask whether there are advantages to learning the transition matrix rather than the adjacency matrix. We looked into this with the following results:

      • The result that (1/γ − A)−1 is monotonically related to the graph distances D in the limit of small γ (a proof now moved to the Meister 2023 preprint) , holds also for the transition matrix T. The proof follows the same steps. So in the small gain limit, the navigation model would work with T as well.

      • If one uses the transition matrix to compute the network output (1/γ − T)-1 then the critical gain value is γc = 1. It is well known that the largest eigenvalue of any Markov transition matrix is 1, and the critical gain γc is the inverse of that. This result is independent of the graph. So this offers the promise that the network could use the same gain parameter γ regardless of the environment.

      • In practice, however, the goal signal turned out to be less robust when based on T than when based on A. We illustrate this with the attached Author response image 1. This replicates the analysis in Figure 3 of the manuscript, using the transition matrix instead of the adjacency matrix. Some observations:

      • Panel B: The goal signal follows an exponential dependence on graph distance much more robustly for the model with A than with T. This holds even for small gain values where the exponential decay is steep.

      • Panel C: As one raises the gain closer to the critical value, the goal signal based on T scatters much more than when based on A.

      • Panels D, E: Navigation based on A works better than based on T. For example, using the highest practical gain value, and a readout noise of ϵ = 0.01, navigation based on T has a range of only 8 steps on this graph, whereas navigation based on A ranges over 12 steps, the full size of this graph.

      We have added a section “Choice of learning rule” to explain this. The Author response image 1 is part of the code notebook on Github.

      Author response image 1.

      Overall, this paper provides a very compelling model for how neural circuits may have evolved the ability to navigate towards remembered goals, using ancient chemotaxis circuits.

      This framework will likely be very important for understanding how the hippocampus (and other memory/navigation-related circuits) interfaces with other processes in the brain, giving rise to memory-guided behavior.

      Reviewer #2 (Public Review):

      The manuscript presents a computational model of how an organism might learn a map of the structure of its environment and the location of valuable resources through synaptic plasticity, and how this map could subsequently be used for goal-directed navigation.

      The model is composed of 'map cells', which learn the structure of the environment in their recurrent connections, and 'goal-cell' which stores the location of valued resources with respect to the map cell population. Each map cell corresponds to a particular location in the environment due to receiving external excitatory input at this location. The synaptic plasticity rule between map cells potentiates synapses when activity above a specified threshold at the pre-synaptic neuron is followed by above-threshold activity at the post-synaptic neuron. The threshold is set such that map neurons are only driven above this plasticity threshold by the external excitatory input, causing synapses to only be potentiated between a pair of map neurons when the organism moves directly between the locations they represent. This causes the weight matrix between the map neurons to learn the adjacency for the graph of locations in the environment, i.e. after learning the synaptic weight matrix matches the environment's adjacency matrix. Recurrent activity in the map neuron population then causes a bump of activity centred on the current location, which drops off exponentially with the diffusion distance on the graph. Each goal cell receives input from the map cells, and also from a 'resource cell' whose activity indicates the presence or absence of a given values resource at the current location. Synaptic plasticity potentiates map-cell to goal-cell synapses in proportion to the activity of the map cells at time points when the resource cell is active. This causes goal cell activity to increase when the activity of the map cell population is similar to the activity where the resource was obtained. The upshot of all this is that after learning the activity of goal cells decreases exponentially with the diffusion distance from the corresponding goal location. The organism can therefore navigate to a given goal by doing gradient ascent on the activity of the corresponding goal cell. The process of evaluating these gradients and using them to select actions is not modelled explicitly, but the authors point to the similarity of this mechanism to chemotaxis (ascending a gradient of odour concentration to reach the odour source), and the widespread capacity for chemotaxis in the animal kingdom, to argue for its biological plausibility.

      The ideas are interesting and the presentation in the manuscript is generally clear. The two principle limitations of the manuscript are: i) Many of the ideas that the model implements have been explored in previous work. ii) The mapping of the circuit model onto real biological systems is pretty speculative, particularly with respect to the cerebellum.

      Regarding the novelty of the work, the idea of flexibly navigating to goals by descending distance gradients dates back to at least Kaelbling (Learning to achieve goals, IJCAI, 1993), and is closely related to both the successor representation (cited in manuscript) and Linear Markov Decision Processes (LMDPs) (Piray and Daw, 2021, https://doi.org/ 10.1038/s41467-021-25123-3, Todorov, 2009 https://doi.org/10.1073/pnas.0710743106). The specific proposal of navigating to goals by doing gradient descent on diffusion distances, computed as powers of the adjacency matrix, is explored in Baram et al. 2018 (https://doi.org/10.1101/421461), and the idea that recurrent neural networks whose weights are the adjacency matrix can compute diffusion distances are explored in Fang et al. 2022 (https://doi.org/10.1101/2022.05.18.492543). Similar ideas about route planning using the spread of recurrent activity are also explored in Corneil and Gerstner (2015, cited in manuscript). Further exploration of this space of ideas is no bad thing, but it is important to be clear where prior literature has proposed closely related ideas.

      We have added a discussion section on “Theories and models of spatial learning” with a survey of ideas in this domain and how they come together in the Endotaxis model.

      Regarding whether the proposed circuit model might plausibly map onto a real biological system, I will focus on the mammalian brain as I don't know the relevant insect literature. It was not completely clear to me how the authors think their model corresponds to mammalian brain circuits. When they initially discuss brain circuits they point to the cerebellum as a plausible candidate structure (lines 520-546). Though the correspondence between cerebellar and model cell types is not very clearly outlined, my understanding is they propose that cerebellar granule cells are the 'map-cells' and Purkinje cells are the 'goal-cells'. I'm no cerebellum expert, but my understanding is that the granule cells do not have recurrent excitatory connections needed by the map cells. I am also not aware of reports of place-field-like firing in these cell populations that would be predicted by this correspondence. If the authors think the cerebellum is the substrate for the proposed mechanism they should clearly outline the proposed correspondence between cerebellar and model cell types and support the argument with reference to the circuit architecture, firing properties, lesion studies, etc.

      On further thought we agree that the cerebellum-like circuits are not a plausible substrate for the endotaxis algorithm. The anatomy looks compelling, but plasticity at the synapse is anti-hebbian, and - as the reviewer points out - there is little evidence for recurrence among the inputs. We changed the discussion text accordingly.

      The authors also discuss the possibility that the hippocampal formation might implement the proposed model, though confusingly they state 'we do not presume that endotaxis is localized to that structure' (line 564).

      We have removed that confusing bit of text.

      A correspondence with the hippocampus appears more plausible than the cerebellum, given the spatial tuning properties of hippocampal cells, and the profound effect of lesions on navigation behaviours. When discussing the possible relationship of the model to hippocampal circuits it would be useful to address internally generated sequential activity in the hippocampus. During active navigation, and when animals exhibit vicarious trial and error at decision points, internally generated sequential activity of hippocampal place cells appears to explore different possible routes ahead of the animal (Kay et al. 2020, https://doi.org/10.1016/j.cell.2020.01.014, Reddish 2016, https:// doi.org/10.1038/nrn.2015.30). Given the emphasis the model places on sampling possible future locations to evaluate goal-distance gradients, this seems highly relevant.

      In our model, the possible future locations are sampled in real life, with the agent moving there or at least in that direction, e.g. via VTE movements. In this simple form the model has no provision for internal planning, and the animal never learns any specific route sequence. One can envision extending such a model with some form of sequence learning that would then support an internal planning mechanism. We mention this in the revised discussion section, along with citation of these relevant articles.

      Also, given the strong emphasis the authors place on the relationship of their model to chemotaxis/odour-guided navigation, it would be useful to discuss brain circuits involved in chemotaxis, and whether/how these circuits relate to those involved in goal-directed navigation, and the proposed model.

      The neural basis of goal-directed navigation is probably best understood in the insect brain. There the locomotor decisions seem to be initiated in the central complex, whose circuitry is getting revealed by the fly connectome projects. This area receives input from diverse sensory areas that deliver the signal on which the decisions are based. That includes the mushroom body, which we argue has the anatomical structure to implement the endotaxis algorithm. It remains a mystery how the insect chooses a particular goal for pursuit via its decisions. It could be revealing to force a change in goals (the mode switch in the endotaxis circuit) while recording from brain areas like the central complex. Our discussion now elaborates on this.

      Finally, it would be useful to clarify two aspects of the behaviour of the proposed algorithm:

      1) When discussing the relationship of the model to the successor representation (lines 620-627), the authors emphasise that learning in the model is independent of the policy followed by the agent during learning, while the successor representation is policy dependent. The policy independence of the model is achieved by making the synapses between map cells binary (0 or 1 weight) and setting them to 1 following a single transition between two locations. This makes the model unsuitable for learning the structure of graphs with probabilistic transitions, e.g. it would not behave adaptively in the widely used two-step task (Daw et al. 2011, https://doi.org/10.1016/ j.neuron.2011.02.027) as it would fail to differentiate between common and rare transitions. This limitation should be made clear and is particularly relevant to claims that the model can handle cognitive tasks in general. It is also worth noting that there are algorithms that are closely related to the successor representation, but which learn about the structure of the environment independent of the subjects policy, e.g. the work of Kaelbling which learns shortest path distances, and the default representation in the work of Piray and Daw (both referenced above). Both these approaches handle probabilistic transition structures.

      Yes. Our problem statement assumes that the environment is a graph with fixed edge weights. The revised text mentions this and other assumptions in a new section “Choice of learning rule”.

      2) As the model evaluates distances using powers of adjacency matrix, the resulting distances are diffusion distances not shortest path distances. Though diffusion and shortest path distances are usually closely correlated, they can differ systematically for some graphs (see Baram et al. ci:ted above).

      The recurrent network of map cells implements a specific function of the adjacency matrix, namely the resolvent (Eqn 7). We have a mathematical proof that this function delivers the shortest graph distances exactly, in the limit of small gain (γ in Eqn 7), and that this holds true for all graphs. For practical navigation in the presence of noise, one needs to raise the gain to something finite. Figure 3 analyzes how this affects deviations from the shortest graph distance, and how nonetheless the model still supports effective navigation over a surprising range. The mathematical details of the proof and further exploration of the resolvent distance at finite gain have been moved to a separate article, which is cited from here, and attached to the submission. The preprint by Baram et al. is cited in that article.

      Reviewer #3 (Public Review):

      This paper argues that it has developed an algorithm conceptually related to chemotaxis that provides a general mechanism for goal-directed behaviour in a biologically plausible neural form.

      The method depends on substantial simplifying assumptions. The simulated animal effectively moves through an environment consisting of discrete locations and can reliably detect when it is in each location. Whenever it moves from one location to an adjacent location, it perfectly learns the connectivity between these two locations (changes the value in an adjacency matrix to 1). This creates a graph of connections that reflects the explored environment. In this graph, the current location gets input activation and this spreads to all connected nodes multiplied by a constant decay (adjusted to the branching number of the graph) so that as the number of connection steps increases the activation decreases. Some locations will be marked as goals through experiencing a resource of a specific identity there, and subsequently will be activated by an amount proportional to their distance in the graph from the current location, i.e., their activation will increase if the agent moves a step closer and decrease if it moves a step further away. Hence by making such exploratory movements, the animal can decide which way to move to obtain a specified goal.

      I note here that it was not clear what purpose, other than increasing the effective range of activation, is served by having the goal input weights set based on the activation levels when the goal is obtained. As demonstrated in the homing behaviour, it is sufficient to just have a goal connected to a single location for the mechanism to work (i.e., the activation at that location increases if the animal takes a step closer to it); and as demonstrated by adding a new graph connection, goal activation is immediately altered in an appropriate way to exploit a new shortcut, without the goal weights corresponding to this graph change needing to be relearnt.

      As the reviewer states, allowing a graded strengthening of multiple synapses from the map cells increases the effective range of the goal signal. We have now confirmed this in simulations. For example, in the analysis of Fig 3E, a single goal synapse enables perfect navigation only over a range of 7 steps, whereas the distributed goal synapses allow perfect navigation over the full 12 steps. This analysis is included in the code notebook on Github.

      Given the abstractions introduced, it is clear that the biological task here has been reduced to the general problem of calculating the shortest path in a graph. That is, no real-world complications such as how to reliably recognise the same location when deciding that a new node should be introduced for a new location, or how to reliably execute movements between locations are addressed. Noise is only introduced as a 1% variability in the goal signal. It is therefore surprising that the main text provides almost no discussion of the conceptual relationship of this work to decades of previous work in calculating the shortest path in graphs, including a wide range of neural- and hardwarebased algorithms, many of which have been presented in the context of brain circuits.

      The connection to this work is briefly made in appendix A.1, where it is argued that the shortest path distance between two nodes in a directed graph can be calculated from equation 15, which depends only on the adjacency matrix and the decay parameter (provided the latter falls below a given value). It is not clear from the presentation whether this is a novel result. No direct reference is given for the derivation so I assume it is novel. But if this is a previously unknown solution to the general problem it deserves to be much more strongly featured and either way it needs to be appropriately set in the context of previous work.

      As far as we know this proposal for computing all-pairs-shortest-path is novel. We could not find it in textbooks or an extended literature search. We have discussed it with two graph theorist colleagues, who could not recall seeing it before, although the proof of the relationship is elementary. Inspired by the present reviewer comment, we chose to publish the result in a separate article that can focus on the mathematics and place it in the appropriate context of prior work in graph theory. For related work in the area of neural modeling please see our revised discussion section.

      Once this principle is grasped, the added value of the simulated results is somewhat limited. These show: 1) in practical terms, the spreading signal travels further for a smaller decay but becomes erratic as the decay parameter (map neuron gain) approaches its theoretical upper bound and decreases below noise levels beyond a certain distance. Both follow the theory. 2) that different graph structures can be acquired and used to approach goal locations (not surprising) .3) that simultaneous learning and exploitation of the graph only minimally affects the performance over starting with perfect knowledge of the graph. 4) that the parameters interact in expected ways. It might have been more impactful to explore whether the parameters could be dynamically tuned, based on the overall graph activity.

      This is a good summary of our simulation results, but we differ in the assessment of their value. In our experience, simulations can easily demolish an idea that seemed wonderful before exposure to numerical reality. For example, it is well known that one can build a neural integrator from a recurrent network that has feedback gain of exactly 1. In practical simulations, though, these networks tend to be fickle and unstable, and require unrealistically accurate tuning of the feedback gain. In our case, the theory predicts that there is a limited range of gains that should work, below the critical value, but large enough to avoid excessive decay of the signal. Simulation was needed to test what this practical range was, and we were pleasantly surprised that it is not ridiculously small, with robust navigation over a 10-20% range. Similarly, we did not predict that the same parameters would allow for effective acquisition of a new graph, learning of targets within the graph, and shortest-route navigation to those targets, without requiring any change in the operation of the network.

      Perhaps the most biologically interesting aspect of the work is to demonstrate the effectiveness, for flexible behaviour, of keeping separate the latent learning of environmental structure and the association of specific environmental states to goals or values. This contrasts (as the authors discuss) with the standard reinforcement learning approach, for example, that tries to learn the value of states that lead to reward. Examples of flexibility include the homing behaviour (a goal state is learned before any of the map is learned) and the patrolling behaviour (a goal cell that monitors all states for how recently they were visited). It is also interesting to link the mechanism of exploration of neighbouring states to observed scanning behaviours in navigating animals.

      The mapping to brain circuits is less convincing. Specifically, for the analogy to the mushroom body, it is not clear what connectivity (in the MB) is supposed to underlie the graph structure which is crucial to the whole concept. Is it assumed that Kenyon cell connections perform the activation spreading function and that these connections are sufficiently adaptable to rapidly learn the adjacency matrix? Is there any evidence for this?

      Yes, there is good evidence for recurrent synapses among Kenyon cells (map cells in the model), and for reward-gated synaptic plasticity at the synapses onto mushroom body output cells (goal cells in our model). We have expanded this material in the discussion section. Whether those functions are sufficient to learn the structure of a spatial environment has not been explored; we hope our paper might give an impetus, and are exploring behavioral experiments on flies with colleagues.

      As discussed above, the possibility that an algorithm like 'endotaxis' could explain how the rodent place cell system could support trajectory planning has already been explored in previous work so it is not clear what additional insight is gained from the current model.

      Please see our revised discussion section on “theories and models of spatial learning”. In short, some ingredients of the model have appeared in prior work, but we believe that the present formulation offers an unexpectedly simple end-to-end solution for all components of navigation: exploration, target learning, and goal seeking.

      Reviewer #1 (Recommendations For The Authors):

      Major concern:

      See the public review. How do the results change depending on whether the recurrent connections between map cells are an adjacency matrix vs. a properly normalized statetransition matrix? I'm especially asking about results related to critical gain (gamma_c), and the dependence of the optimal parameter values on the environment.

      Please see our response above including the attached reviewer figure.

      Minor concerns:

      It is not always clear when the learning rule is symmetric vs asymmetric (undirected vs directed graph), and it seems to switch back and forth. For example, line 127 refers to a directed graph; Fig 2B and the intro describe symmetric Hebbian learning. Most (all?) of the simulations use the symmetric rule. Please make sure it's clear.

      For simplicity we now use a symmetric rule throughout, as is appropriate for undirected graphs. We mention that a directed learning rule could be used to learn directed graphs. See the section on “choice of learning rule”. M_ij is not defined when it's first introduced (eq 4). Consider labeling the M's and the G's in Fig 2.

      Done.

      The network gain factor (gamma, eq 4) is distributed over both external and recurrent inputs (v = gamma(u + Mv)), instead of local to the recurrent weights like in the Successor Representation. This notational choice is obviously up to the authors. I raise slight concern for two reasons -- first, distributing gamma may affect some of the parameter sweep results (see major concern), and second, it may be confusing in light of how gamma is used in the SR literature (see reviewer's paper for the derivation of how SR is computed by an RNN with gain gamma).

      In our model, gamma represents the (linear) activation function of the map neuron, from synaptic input to firing output. Because the synaptic input comes from point cells and also from other map cells, the gain factor is applied to both. See for example the Dayan & Abbott book Eqn 7.11, which at steady state becomes our Eqn 4. In the formalism of Fang 2023 (Eqn 2), the factor γ is only applied to the recurrent synaptic input J ⋅ f, but somehow not to the place cell input ϕ. Biophysically, one could imagine applying the variable gain only to the recurrent synapses and not the feed-forward ones. Instead we prefer to think of it as modulating the gain of the neurons, rather than the synapses. The SR literature follows conventions from the early reinforcement learning papers, which were unconstrained by thinking about neurons and synapses. We have added a footnote pointing the reader to the uses of γ in different papers.

      In eq 13, and simulations, noise is added to the output only, not to the activity of recurrently connected neurons. It is possible this underestimates the impact of noise since the same magnitude of noise in the recurrent network (map cells) could have a compounded effect on the output.

      Certainly. The equivalent output noise represents the cumulative effect of noise everywhere in the network. We argue that a cumulative effect of 1% is reasonable given the overall ability of animals at stimulus discrimination, which is also limited by noise everywhere in the network. This has been clarified in the text.

      Fig 3 E, F, it looks like the navigated distance may be capped. I ask because the error bars for graph distance = 12 are so small/nonexistent. If it's capped, this should be in the legend.

      Correct. 12 is the largest distance on this graph. This has been added to the caption.

      Fig 3D legend, what does "navigation failed" mean? These results are not shown.

      On those occasions the agent gets trapped at a local maximum of the goal signal other than the intended goal. We have removed that line as it is not needed to interpret the data.

      Line 446, typo (Lateron).

      Fixed.

      Line 475, I'm a bit confused by the discussion of birds and bats. Bird behavior in the real world does involve discrete paths between points. Even if they theoretically could fly between any points, there are costs to doing so, and in practice, they often choose discrete favorite paths. It is definitely plausible that animals that can fly could also employ Endotaxis, so it is confusing to suggest they don't have the right behavior for Endotaxis, especially given the focus on fruit flies later in the discussion.

      Good points, we removed that remark. Regarding fruit flies, they handle much important business while walking, such as tracking a mate, fighting rivals over food, finding a good oviposition site.

      Section 9.3, I'm a bit confused by the discussion of cerebellum-like structures, because I don't think they have as dense recurrent connections as needed for the map cells in Endotaxis. Are you suggesting they are analogous to the output part of Endotaxis only, not the whole thing?

      Please see our reply in the public review. We have removed this discussion of cerebellar circuits.

      Line 541, "After sufficient exploration...", clarify that this is describing learning of just the output synapses, not the recurrent connections between map cells?

      We have revised this entire section on the arthropod mushroom body.

      In lines 551-556, the discussion is confusing and possibly not consistent with current literature. How can a simulation prove that synapses in the hippocampus are only strengthened among immediately adjacent place fields? I'd suggest either removing this discussion or adding further clarification. More broadly, the connection between Endotaxis and the hippocampus is very compelling. This might also be a good point to bring up BTSP (though you do already bring it up later).

      As suggested, we removed this section.

      Line 621 "The successor representation (at least as currently discussed) is designed to improve learning under a particular policy" That's not actually accurate. Ref 17 (reviewer's manuscript, cited here) is not policy-specific, and instead just learns the transition statistics experienced by the animal, using a biologically plausible learning rule that is very similar to the Endotaxis map cell learning rule (see our Appendix 5, comparing to Endotaxis, though that was referencing the previous version of the Endotaxis preprint where Oja's rule was used).

      We have edited this section in the discussion and removed the reference to policyspecific successor representations.

      Line 636 "Endotaxis is always on" ... this was not clear earlier in the paper (e.g. line 268, and the separation of different algorithms, and "while learning do" in Algorithm 2).

      The learning rules are suspended during some simulations so we can better measure the effects of different parts of endotaxis, in particular learning vs navigating. There is no interference between these two functions, and an agent benefits from having the learning rules on all the time. The text now clarifies this in the relevant sections.

      Section 9.6, I like the idea of tracing different connected functions. But when you say "that could lead to the mode switch"... I'm a bit confused about what is meant here. A mode switch doesn't need to happen in a different brain area/network, because winnertake-all could be implemented by mutual inhibition between the different goal units.

      This is an interesting suggestion for the high-level control algorithm. A Lorenzian view is that the animal’s choice of mode depends on internal states or drives, such as thirst vs hunger, that compete with each other. In that picture the goal cells represent options to be pursued, whereas the choice among the options occurs separately. But one could imagine that the arbitrage between drives happens through a competition at the level of goal cells: For example the consumption of water could lead to adaptation of the water cell, such that it loses out in the winner-take-all competition, the food cell takes over, and the mouse now navigates towards food. In this closed-loop picture, the animal doesn’t have to “know” what it wants at any given time, it just wants the right thing. This could eliminate the homunculus entirely! Of course this is all a bit speculative. We have edited the closing comments in a way that leaves open this possibility.

      Line 697-704, I need more step-by-step explanation/derivation.

      We now derive the properties of E step by step starting from Eqn (14). The proof that leads to Eqn 14 is now in a separate article (available as a preprint and attached to this submission).

      Reviewer #3 (Recommendations For The Authors):

      • Please include discussion and comparison to previous work of graph-based trajectory planning using spreading activation from the current node and/or the goal node. Here is a (far from comprehensive) list of papers that present similar algorithms:

      Glasius, R., Komoda, A., & Gielen, S. C. (1996). A biologically inspired neural net for trajectory formation and obstacle avoidance. Biological Cybernetics, 74(6), 511-520.

      Gaussier, P., Revel, A., Banquet, J. P., & Babeau, V. (2002). From view cells and place cells to cognitive map learning: processing stages of the hippocampal system. Biological cybernetics, 86(1), 15-28.

      Gorchetchnikov A, Hasselmo ME. A biophysical implementation of a bidirectional graph search algorithm to solve multiple goal navigation tasks. Connection Science. 2005;17(1-2):145-166

      Martinet, L. E., Sheynikhovich, D., Benchenane, K., & Arleo, A. (2011). Spatial learning and action planning in a prefrontal cortical network model. PLoS computational biology, 7(5), e1002045.

      Ponulak, F., & Hopfield, J. J. (2013). Rapid, parallel path planning by propagating wavefronts of spiking neural activity. Frontiers in computational neuroscience, 7, 98.

      Khajeh-Alijani, A., Urbanczik, R., & Senn, W. (2015). Scale-free navigational planning by neuronal traveling waves. PloS one, 10(7), e0127269.

      Adamatzky, A. (2017). Physical maze solvers. All twelve prototypes implement 1961 Lee algorithm. In Emergent computation (pp. 489-504). Springer, Cham.

      Please see our reply to the public review above, and the new discussion section on “Theories and models of spatial learning”, which cites most of these papers among others.

      • Please explain, if it is the case, why the goal cell learning (other than a direct link between the goal and the corresponding map location) and calculation of the overlapping 'goal signal' is necessary, or at least advantageous.

      Please see our reply in the public review above.

      • Map cells are initially introduced (line 84) as getting input from "only one or a few point cells". The rest of the paper seems to assume only one. Does it work when this is 'a few'? Does it matter that 'a few' is an option?

      We simplified the text here to “only one point cell”. A map cell with input from two distant locations creates problems. After learning the map synapses from adjacencies in the environment, the model now “believes” that those two locations are connected. This distorts the graph on which the graph distances are computed and introduces errors in the resulting goal signals. One can elaborate the present toy model with a much larger population of map cells that might convey more robustness, but that is beyond our current scope.

      • (line 539 on) Please explain what feature in the mushroom body (or other cerebellumlike) circuits is proposed to correspond to the learning of connections in the adjacency matrix in the model.

      Please see our response to this critique in the public review above. In the mushroom body, the Kenyon cells exhibit sparse responses and are recurrently connected. These would correspond to map cells in Endotaxis. For vertebrate cerebellum-like circuits, the correspondence is less compelling, and we have removed this topic from the discussion.

    1. Author Response

      The following is the authors’ response to the original reviews.

      Public Reviews:

      Reviewer #1 (Public Review):

      Cell death plays a critical role on regulating organogenesis. During tooth morphogenesis, apoptosis of embryonic dental tissue plays critical roles on regulating tooth germ development. The current study focused on ferroptosis, another way of cell death which has rarely been investigated in tooth development, and showed it may also play an important role on regulating the tooth dimension. The topic is novel and interesting, but the experimental design has many flaws which significantly compromised the study.

      1. The entire study was based on ex vivo tooth germ explant culture. Mandibular tooth germs of E15.5 (bell stage) were isolated for ex vivo culture. Most tooth germ explant culture experiments were actually using tooth germ of much earlier stages (E11.5-E13.5) for organ culture. After E16.5, both the large size and initially formed enamel/dentin could prevent nutrition from penetrating inside. Also, using tooth germ of earlier stage will help identify impact of ferroptosis upon early tooth development.

      2. Due to limited penetration, the ex vivo culture in the study lasted for no more than 5 days. I would recommend the authors to perform kidney capsule transplantation as an alternative approach, which can support tooth germ development much longer even into root formation.

      3. The major justification of using tooth germ ex vivo culture as the model in the study was to "conduct high-throughput analysis". However, the study could hardly be qualified as a high-throughput analysis. I would recommend the authors perform RNA sequencing for comparing tooth germs before/after erastin treatment. Such experiments won't take too much time or resource.

      We are grateful for the insightful feedback on our ex vivo tooth germ culture model. We initially chose the E15.5 tooth germ over earlier stages due to peak Gpx4 expression and iron accumulation during molar development, which occurs between E15.5 and E17.5 (Figure 1A & 1B). This period may be the most sensitive to ferroptotic stress during tooth development. Our experiments also demonstrated that the tooth germ displays robust growth after seven days of ex vivo cultivation (Figure supplement 1B).

      Kidney capsule transplantation is indeed an ideal method for ex vivo tooth germ culture. However, in our studies, we used erastin – a classic ferroptosis inducer – which exhibits instability in vivo, thereby constraining our investigation using kidney capsule transplantation.

      Our results about Gpx4 expression in the tooth germ during development (Figure 1A) showed a spatiotemporal pattern. This pattern suggests that bulk RNA sequencing of the tooth germ might not yield accurate revelations about changes in ferroptosis-related genes. We are presently using transgenic mice to further study the impact of excessive in vivo ferroptotic stress on tooth development. In these experiments, we intend to conduct single-cell RNA sequencing to explore detailed alterations in the tooth germ.

      1. Although the study mostly used molars as the model, the in vivo iron concentration was only demonstrated on incisors, but not molars (Figure 1).

      We have updated Figure 1B to include images of molars, which illustrate the accumulation of iron during molar development. The iron concentration peaks at E17.5, then decreases at PN0. Interestingly, unlike Gpx4 expression, iron accumulation rebounds at PN3. To gain a more accurate understanding, further in vivo studies utilizing transgenic mice are required.

      1. Phenotype analysis in Figure 2 is too superficial. Only dimensional information was provided. Cusps number, cusps distribution pattern and rooth/furcation formation were not evaluated. Differentiation of ameloblast/odontoblast was not evaluated. The proliferation rate in the dental epithelium/mesenchyme was not analyzed.

      The cusps number/distribution pattern are not influenced by erastin treatment in recent model (Figure 2A & 2C). Recent ex vivo culture model of tooth germ is unable to investigate the possible function of ferroptotic stress in rooth/furcation formation since it mainly initiates from PN4 to PN7. The proliferation and differentiation of dental epithelium/mesenchyme will be analyzed using transgenic mice in vivo.

      1. Low magnification images should be included in Figure 3 to display the entire tooth germs.

      The emission spectrum of recent utilized iron probe will extend due to increasing concentration of iron. This property makes the counter staining of tissue samples unavailable. The structure of the ex vivo cultured tooth germ could only be recognized in high magnification. The calculation could represent the entire alternation.

      1. In Figure 4, does ferroptotic inhibitor eliminate the iron accumulation in the tooth germ? How about the expression level of several target genes shown in Figure 3?

      In Fig 5, Fer-1 reduced the iron accumulation in tooth germ. Different inhibitors suppressed ferroptosis via different ways, Lip-1 mainly inhibits lipid peroxidation, DFO is an iron chelator which reduces the labile iron pool, Fer-1 is reported to both inhibit lipid peroxidation and reduce the labile iron pool, their functions to the accumulation of iron might be varied. The core risk factors of ferroptosis are lipid peroxidation and iron accumulation, thus in Fig 5, we analyzed the expression of 4HNE and the accumulation of iron to illustrated the suppression o ferroptosis instead of detecting several regulatory genes.

      1. The manuscript has many typos and grammar mistakes. All "submandibular" should be simply "mandibular". "eastin" should be "erastin" (line 92). "partly" should be "partially" (line 611).

      We addressed all the gramma and typo errors.

      Reviewer #2 (Recommendations for The Authors):

      This is a very well done study. However, writing is absolutely substandard. The authors should check and review extensively for improvements to the use of English. This is not just about language but also about style of the paper and presentation. As written, the abstract is not concise at all, and the overall logic of the study is not well presented. Currently, the abstract reads like another introduction.

      We improved our presentation.

      Reviewer #3 (Recommendations for The Authors):

      This is an interesting work reporting ferroptosis that is involved in the tooth morphogenesis. The authors showed that Gpx4, the core anti-lipid peroxidation enzyme in ferroptosis, is upregulated in tooth development using ex vivo culture system. They convincingly demonstrated that ferroptosis, but apoptosis, was present in tooth morphogenesis. The findings are interesting and novel. The work represents one of the earliest works studying Ferroptosis in tooth morphogenesis. There are several minor concerns.

      1) The abstract is too long and should be shortened.

      We modified the abstract to make it concise.

      2) Can the Gpx4 quantitatively be measured by qRT-PCR?

      3) How is Gpx4 regulated during development? If unknown, the authors should discuss it at least

      4) Are there any tooth developmental defects associated with ferroptosis? If there is one, the authors should discuss it.

      Our research on Gpx4 expression in the tooth germ during development (Figure 1A) highlights a specific spatiotemporal pattern. This pattern suggests that bulk RNA sequencing of the tooth germ may not provide accurate insight into changes in ferroptosis-related genes.

      The developmental role of Gpx4 had been studied even before the ferroptosis was formally described (before 2012). In situ hybridization indicated expression of Gpx4 in all developing germ layers during gastrulation and in the somite stage in the developing central nervous system and in the heart, which made Gpx4 (-/-) mice die embryonically in utero by midgestation (E7.5) and are associated with a lack of normal structural compartmentalization. Specific deletion of Gpx4 during developmental process were found to participate in the maturation and survival of cerebral and photoreceptor cell. Recent years, more ferroptosis related function of Gpx4 were discovered in neutrophil and chondrocyte of adult mice, in which specific deletion will lead to ferroptosis-induced organ dysregulation and degeneration.

      At present, no systematic study has been conducted on ferroptosis or ferroptotic stress in relation to tooth developmental defects. However, as early as the 1930s, pioneering dental biologists had already identified the presence of iron in the teeth of various animals. They also found that some enamel defects in mice were related to abnormal iron metabolism. Lipid metabolism and lipid peroxidation, which are other key risk factors of ferroptosis, were also described in the initial stages of dental biology research.

      We are currently generating transgenic mice with dental epithelium/mesenchymal specific deletions of Gpx4. This will allow us to further investigate the developmental defects related to ferroptosis and ferroptotic stress.

    1. Author Response

      Reviewer #1 (Public Review):

      The authors performed an RNAi screen to identify epigenetic regulators involved in oxygen-glucose deprivation (OGD)-induced neuronal injury using immortalized mouse hippocampal neuronal cell line HT-22. They identified PRMT5 as a novel negative regulator of neuronal cell survival after OGD. Both in vitro and in vivo experiments were then performed to evaluate the roles of PRMT5 in OGD and ischemic stroke-induced injury. The authors found that genetic and pharmacological inhibition of PRMT5 protected against neuronal cell death in both in vitro and in vivo models. Furthermore, they found that in response to OGD and ischemia, PRMT5 was translocated from the cytosol to the nucleus, where PRMT5 bound to the chromatin and promoter regions of targeted genes to repress the expression of downstream genes. Further, they showed that silencing PRMT5 significantly altered the OGD-induced changes for a large-scale of genes. In a mouse model of middle cerebral artery occlusion (MCAO), PRMT5 inhibitor EPZ015666 protected against neuronal death in vivo. This study reveals a potential therapeutic target for the treatment of ischemic stroke. Overall, the authors have done elegant work showing the role of PRMT5 in neuronal cell survival. However, the essential mechanisms underlying PRMT5 nuclear translocation have not been investigated, and the in vivo animal studies should be further strengthened.

      Thank you very much for your comments and suggestions. While stroke stands as the second leading cause of death globally, and the burden of post-onset disability is substantial, particularly surging at a faster rate in low- and middle-income countries compared to high-income countries. The exploration of new drugs for stroke treatment holds profound societal implications. The concept of neuroprotective drug development is not novel; over the past half-century, considerable research and resources have been invested in this field. Yet, progress appears to be notably limited, and interest is currently waning.

      Our research team is dedicated to devising rapid and cost-effective functional screening strategies grounded in the nervous system. Through this forward research approach, we aim to delve into potential neuroprotective targets across various neurological diseases. This endeavor not only bears significance for acute stroke but also holds potential application value for a spectrum of generalized nerve injuries.

      Building on your insights, our upcoming studies will involve in vivo animal experiments, integrating the PRMT5 nuclear translocation mechanism. We anticipate that our continued research will benefit from further professional insights and guidance from your expertise.

      Reviewer #2 (Public Review):

      Haoyang Wu et al. have shown that the symmetric arginine methyltransferase PRMT5 binds to the promoter region of several essential genes and represses their expression, leading to neuronal cell death. Knocking down PRMT5 in HT-22 cells by shRNA leads to pertinent improvement in cell survival after oxygen-glucose deprivation (OGD) conditions. In another set of experiments, inhibition of the catalytic activity of PRMT5 by a specific inhibitor, EPZ015666, in a middle cerebral artery occlusion (MCAO) mice model also showed protective effects against neuronal cell death. In this manuscript, the authors have established the negative role of PRMT5 in cerebral ischemia both in vitro and in vivo.

      However, my primary concern is the novelty of the manuscript. It has already been reported that inhibition of PRMT5 attenuates cerebral ischemia/reperfusion condition (Inhibition of PRMT5 attenuates cerebral ischemia/reperfusion-induced inflammation and pyroptosis through suppression of NF-κB/NLRP3 axis. Xiang Wu et al. Neuroscience Letters, Volume 776, 2022, 136576, ISSN 0304-3940, https://doi.org/10.1016/j.neulet.2022.136576.). Even these authors have also shown that treatment of PRMT5 specific catalytic inhibitor, LLY-283, could rescue ischemia-induced over-expression of inflammation-related factors.

      However, it would be better to verify the specificity of the inhibitor, EPZ015666, using other methyltransferases to be sure that the rescue is indeed mediated by PRMT5 catalytic inhibition.

      Thank you sincerely for dedicating time from your busy schedule to review our papers. Your comments and suggestions hold immense value for us, contributing significantly to the enhancement of our work. We acknowledge with honesty that this research journey has been a prolonged and challenging experience.

      The major functional study, as indicated by the CHIP-seq data record, was concluded between 2017 and 2019. Since then, our efforts and resources have been devoted to conducting in-depth mechanism and regulation research for PRMT5. Notably, PRMT5 is involved in 4-5 types of histone arginine methylation, and it plays a role in complex modification effects for proteins in the cytoplasm. Despite employing a variety of investigative methods, understanding and controlling these intricate mechanisms in experimental design have proven quite challenging. This not only places us at a disadvantage compared to some competitors but also hinders the creative potential of our lab team.

      We firmly believe that there is ample room for further research on the role of PRMT5 in the nervous system. We aspire to collaborate with other research teams to explore this area collectively.

    1. Author Response

      Reviewer #1 (Public Review):

      Summary:

      In this work, the authors use an OT setup to measure the DNA gripping and DNA slipping dynamics of phage lambda terminase motor interaction with DNA. They discover major differences in the dynamics of these two events, in comparison to the phage T4 motor, which they previously investigated. They attribute these differences to the presence of the TerS (small terminase) subunit of the motor complex of phage lambda in addition to the TerL (large terminase) subunit in phage, while in T4 only the TerL subunit is present. By exposing the stalled phage lambda procapsid-DNA complex (stalled with ATP-gammaS) to solutions containing 1) no nucleotide, 2) poorly hydrolyzed ATP, and 3) ADP, they found that the gripping persistence is strongest with ATP, weaker with ADP, and weakest with no nucleotide. This demonstrates nucleotide-dependent DNA gripping and friction of the motor. However, both persistence of gripping and friction are dramatically stronger than in the T4 TerL motor, due to the presence of the TerS subunit. While TerS was believed to be essential for the initiation of packaging in vivo, its role during DNA translocation was unclear. This study reveals the key role played by TerS in DNA gripping and DNA-motor friction, highlighting its role in DNA translocation where TerS acts as a "sliding clamp".

      The study also provides a method to investigate factors affecting the stability of the initiation complex in viral packaging motors.

      Strengths:

      The experiments are well carried out and the conclusions are justified. These findings are of great significance and advance our understanding of viral motor function in the DNA packaging process and packaging dynamics.

      Weaknesses:

      While the collected OT data is quantitative, therefore is no further quantitative analysis of the motor packaging dynamics with regard to different motor subunit functions and the presence of nucleotides.

      We thank the reviewer for the feedback and we will address the additional recommendations in a revised manuscript. Regarding the comment about quantitative analysis of the packaging dynamics, we emphasize that the present study focuses only on analysis of the grip/slip dynamics in the absence of ATP, since we have already studied the packaging dynamics (DNA translocation dynamics) with ATP in prior studies (refs 34, 35, 39-43). Note that in the present paper we do relate the present studies to these prior studies (such as on p. 7-8 regarding the mechanism of DNA gripping/release during translocation, on p. 8 regarding the finding that the T4 motor (without TerS) exhibits more frequent slipping during packaging, and on p. 8-9 regarding the cause of pauses during packaging).

      Reviewer #2 (Public Review):

      Summary:

      In their paper Rawson et al investigate the nanomechanical properties of the lambda bacteriophage packaging motor in terms of its ability to allow either the slippage of DNA out of the capsid or exerting a grip on the DNA, thereby preventing the slipping. They use a fascinatingly elegant single-molecule biophysics approach, in which gentle forces, generated and controlled by optical tweezers, are used to pull on the DNA molecule about to be packaged by the virus. A microfluidic device is then used to change the nucleotide environment of the reaction, so that the packaging motor can be investigated in its nucleotide-free (apo), ADP-, and non-hydrolyzable ATP-analog-bound states. The authors show that the apo state is dominated by DNA slippage which is impeded by friction. The slippage is stochastically halted by gripping stages. In ADP the DNA-gripped state becomes overwhelming, resulting in a much slowed DNA slippage. In non-hydrolyzable ATP analogs, the DNA slippage is essentially halted and the gripped state becomes exclusive. The authors also show that the slipping and gripping states are controlled not only by nucleotides but also by the force exerted on DNA. Altogether, DNA transport through/by the lambda-phage packaging motor is regulated by nucleotides and mechanical force. Furthermore, the authors document an intriguingly interesting DNA end-clamping mechanism that prevents the DNA from slipping entirely out of the capsid, which would make the packaging process inefficient even on the statistical level. The authors claim that their findings are likely related to the function of a small terminase subunit (TerS) in the lambda-phage motor, which may act as a sliding clamp.

      Strengths:

      Altogether this is a very elegantly executed, thought-provoking, and interesting work with numerous significant practical implications. The paper is well-written and nicely documented.

      Weaknesses:

      There are really no major weaknesses, apart from a few minor issues detailed below in my recommendations.

      We thank the reviewer for the feedback and we will address the minor issues in a revised manuscript.
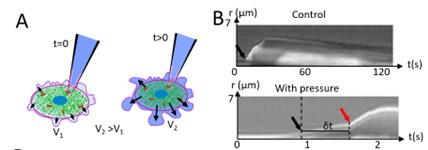
    1. Author Response

      The following is the authors’ response to the original reviews.

      We have substantially revised our manuscript based on the extensive and highly constructive comments of the reviewers. We have included new data, refined existing data, and revised the text. To do this, some figures had to be split and several figures had to be renumbered. The additional experiments presented at the end of the Results also led us to expand our discussion of current limitations of our story.

      Recommendations for the authors

      Reviewer #1:

      To improve the manuscript, I have some recommendations for the authors.

      1) The cell size was quantified using flow cytometry (forward scatter). While this approach provides a convenient way to measure cell size, it is only a relative way to compare the cell size. A 10% increase in FSC value does not necessarily mean a 10% increase in diameter, this depends on the instrument. Consequently, the claims of density changes such as based on the panel 5B may be incorrect. It would be useful also to perform some experiments with Coulter Counter or imaging based quantification of cell size.

      We agree and this is precisely why we had also measured cell diameters by imaging (reported at the bottom of page 7 and figure supplement 1D in the initial version of the manuscript). In the revised manuscript, we have added a cautionary note in the same context. Regarding density changes, those measurements by FRAP are independent of assumptions about cell diameter. When cell density is down and cells are larger by whatever factor, one can safely conclude that total protein did not scale.

      2) When the Hsp90a/b KOs are introduced on page 9, it would be helpful to know at this stage whether the double KO cells are viable to understand why the individual KOs rather than double knockout cells were used.

      We have now added a statement to indicate that total Hsp90 KOs are not viable in eukaryotes.

      3) How the following can be reconciled with previous work is a bit unclear and needs some clarification: Neurohr et al 2019 identifies cytoplasmic dilution in larger cells, but in this manuscript WT cells maintain the same cytoplasmic density while becoming larger under chronic stress while the Hsp90 KO cells have reduced cytoplasmic density. Does this mean that the cytoplasmic dilution does not relate to cell size but is indirect and related to heat stress? Or is this related to uncoupling of cell size and density only in excessively large cells as for example HEK cells only increase their diameter by 30% based on the flow cytometry analysis?

      Yes, indeed, beyond a certain threshold, excessively enlarged cells cannot scale protein anymore. In the revised manuscript, we not only look at cells exposed to stress for much longer (up to one month) (see last paragraph of revised Results). These cells become even bigger, and in agreement with Neurohr and colleagues, we find that protein scaling breaks down.

      4) Related to the previous, the authors state that "Hsp90 levels rather than a specific isoform are critical for maintaining the cytoplasmic density", but there is no direct evidence connecting Hsp90 levels to cell size. Given the number of proteomics experiments done in this work, can a correlation between Hsp90 levels and cell size/cell density be identified? Or is this related to the way cell size is increased in chronic stress as later the authors say that with the CDK4/6 inhibitor Hsp90α/β KO cells can scale the total protein.

      We have previously determined total Hsp90 levels quantitatively by mass spec (Bhattacharya et al., 2022; see Figure S8 there) (now explicitly mentioned in the same context as our revision related to point #2, see above), and we have now also added the quantitation, including that of total Hsp90 levels, in what is now Figure 9.

      5) Page 17 states "Hsp90α/β KO cells increase cell size while translation is still reduced. Thus, cell size and translation must be coupled for adaptation to chronic stress." This feels like an important conclusion of the paper, yet the direct evidence is rather limited and the authors are clearly not sure how the Hsp90 KO cells increase their size without increasing the translational capacity. Yes, a potential explanation is provided immediately afterward as the authors show that Hsp90α/β KO cells subjected to chronic HS also have reduced proteasomal activity. Reducing protein degradation allows cells to gain more protein even if the synthesis rate does not increase (steady-state protein levels is a balance between synthesis and degradation). As stated by the authors in the discussion, the KO cells "fail to couple cell size increase to translation" simply because they can increase total protein, and cell size, by reducing protein degradation.

      Yes, reducing protein turnover might be a viable strategy, but here, reduced protein degradation in the Hsp90 KOs is clearly not enough since total protein levels cannot keep up with the cell size increase.

      6) What is unclear to me is to what extent these results (where chronic heat stress increases cell size and cells proliferate) relate to large senescent cells which are arrested. The discussion speculates that a failure to adapt to stress leads to aging, but direct evidence is lacking.

      Even though we feel quite strongly that (some) speculation should be allowed, we now provide more direct evidence for senescence (see Figure 10 of revised manuscript and corresponding text). Moreover, we had already demonstrated in Bhattacharya et al. 2022 that senescence is triggered by below-threshold levels of Hsp90 (i.e. cells express senescence markers). But note that senescence is only manifest upon prolonged exposure to chronic mild stress, and that our standard protocol for chronic mild stress was established in such a way as to avoid much of an effect on viability and proliferation (see Figure 1). So no, at least for wild-type cells, except for the experiments of Figure 10, what we studied are not large senescent and arrested cells.

      7) The clarity and content of the figures need some improvement. For example, in Fig 1, it is difficult to see the small symbols specifying the cell lines as the replicates are often overlapping. The font for p values is also too small. For Fig 2, legend says "the statistical significance between the groups was analyzed by two-tailed unpaired Student's t-tests." but there are no statistics shown. The use of statistical testing is also inconsistent across different figures and panels, for example Fig 3 A vs 3C and 5A vs 5H. In Fig 4. the legend talks about p-value, but y axis in panels is q value. The authors need to clarify this by mentioning that these are adjusted p values. Fig 7. should also explain "Rapa" in the legend or state "Rapamycin" in the figure.

      To avoid overloading figures further with enlarged text, we prefer not to increase the font size of the p-values, and for graphs where data points are too small or overlap, we remind the reviewer that all original data will be available with the paper (and linked to from each figure). For Figure 2, we removed the indicated orphaned statement. We've now added stats for Figure 3C, and double checked all others; note that in most cases where the differences are really obvious, we did not add p-values. Wherever there were q-values as Y axis, we have now also added the term "adjusted p-value" in the legend. As for "Rapa", it was and still is defined in the legend.

      8) The data in Fig 5A looks curious as the 39C response is bimodal suggesting that only some cells adapt to the heat stress or could this be a technical issue with the measurements?

      The reason for this is that the data points are from 2 independent experiments. This means that the measurements were done on different days with a microscope that had to be calibrated again and may have been in a slightly different mode. This is not uncommon with this type of data. As an example of that, please see Fig. 3C of Persson et al. Cell 183:1572-1585 (https://doi.org/10.1016/j.cell.2020.10.017).

      Reviewer #2:

      Specific comments for authors:

      Major comments:

      1. Fig. 1F: if cells are not split for 7 days than they start growing in multi-layers. The density within a plate affects their proliferation rate as well as their translation rate. Therefore, a proliferation curve (with counting) when cells are kept for the duration of the 7 day experiment at sub-confluent density (ideally <90%) would be much more informative in this case, and also help to understand the dynamics within the timecourse. For example, if initially there is cell cycle arrest (at day1, as shown in Fig. 1d), then proliferation rates should reflect that.

      See next point.

      1. On a more general note: What is the confluence of the 4-7day experiments? Initial density can change the cell's behavior not only for RPE cells (as shown in fig. 7e), but HEK cells are sensitive to that as well. It is critical that experiments for translation, protein content, cell size, etc. be done in sub-confluent conditions, as the over-confluency alone could be a confounder for cell size, translation rates, etc. If this is indeed the way it was done, this should be clarified. Otherwise, this is a critical confounder which should be eliminated.

      The risk of the confounding effects of overcrowding is indeed an important point, which we avoided, unfortunately without explicitly mentioning it in the manuscript (assuming that it went without saying). While we had already mentioned the seeding density and type of plate in Materials and Methods, we now address it explicitly both with additional data (new figure supplement 1B) and clarifying additions in the text. In our experience, the most common problem with confluent plates is not that cells grow on top of each other, but that they come off the plate and die. Regarding the cell cycle analysis of Fig. 1D and the proliferation assays of Fig. 1G, note that in the latter, we standardized cell numbers to those of day 1.

      1. The speculations about the link to aging and senescence are very interesting, however since these are only hypothesis at this stage, the current phrasing in the abstract is a bit misleading. In fact, I was expecting at least one experiment to deal with aging/senescence, primed by the abstract.

      You are perfectly correct. We have now added new experimental evidence that shows cells display activity of the senscence marker SA-βgal after prolonged chronic stress (Figure 10). Please see our response to point #6 of reviewer #1 for further comments.

      1. Fig. 2D - nuclei are also getting much larger - what is the contribution of the nuclear increase to the overall cell increase? Does it scale linearly? Or does it contribute more/less compared to the entire cell?

      Good point! We now include additional data on nuclear size in Figure 2E and figure supplement 2D, and corresponding additions in Results and Discussion. And as you correctly spotted, nuclei become bigger, too. The data suggest that the ratio of cytoplasm to nuclear size is more or less maintained. One can speculate that nuclei are larger because of partial "unfolding" (opening) of chromatin, which might very well be driven by the activation of Hsf1. But that's for future studies to figure out.

      1. Fig 3a-c: in fig. 2a it looks like the knockout of one isoform leads to a basal increase in the expression of the other. However, since different antibodies are used for alpha and beta, the question of whether this increase leads to complete compensation of the total levels of hsp90 cannot be answered. qPCR for common regions could help answer this question, and this could help explain the increased hsf1 activity in the knockouts.

      As pointed out in response to reviewer #1, point #4, we had previously determined total Hsp90 levels quantitatively by mass spec (Bhattacharya et al., 2022; see Figure S8 there), and we now mention that explicitly. Moreover, we have now added new data including the quantitation of total Hsp90 levels in Figure 9. RT-PCR might not be of much help considering that we had shown in Bhattacharya et al. 2022 that below-threshold Hsp90 levels (even less than what happens here) trigger translation through an IRES in the Hsp90β mRNA, whose levels don't change.

      1. What is the HSE-luc construct used for the hsf1 activity? Is that an artificial HSE? Or the Hspa7 promoter? It would be interesting to check the activity with respect to the hsp90 promoter using a similar assay, to understand whether cells compensation for overall reduction in hsp90 levels is the primary "goal" for hsf1 activation.

      The HSE-luc reporter is an artificial construct (we now clarify this in the Materials and Methods). Although Hsp90 is important, Hsf1's goal in life goes well beyond it. It notably also regulates lots of genes in the absence of stress, notably in cancer cells. Fig. 4B is an example of a blot that shows that chronic stress does not dramatically affect the levels of Hsp90α/β.

      1. The proteomics data are very interesting, however additional details are missing and it is hard to extract them from source data 1. Specifically - focusing on the 2 hsp90s, what do they look like? The compensation questions above could be answered using the proteomics data as well.

      As mentioned above in response to this reviewer's point #5 (and #4 of reviewer #1), we have previously addressed that in a paper that was focused on precisely this issue, and we have adapted the current manuscript accordingly.

      1. How many proteins go up/down in the proteomics data? How does this compare between WT and knockout cells? The authors should detail the specific differences, which pathways? Which proteins? otherwise the volcano plots alone, on their own, are really not informative.

      We have now added a GO analysis (Figure 5C), and heat maps for chaperones/co-chaperones and Hsp90 interactors (new figure supplements 4 and 5). We have still left some volcano plots because they are a good visualization of the overall changes. The text has been revised accordingly, notably also to clarify what we are trying to show with volcano plots (GO analysis and heat maps).

      1. Fig. 3f: cells with hsf1 knockdown even decreased in size after HS. Is this significant? Why could that be?

      The be honest, we do not know. A wild speculation would be that Hsf1 is not only required to drive the cell size increase, but that a certain minimal level of Hsf1 is required to maintain normal cell size (specifically in A549 cells?).

      1. The siHSF1 cells showing no change in cell size is central to the paper's claims. This should be done in HEK293 cells at least, for which much of the data in the paper is shown, preferably also in RPE1 cells.

      We have now added new data with the results obtained with HEK293T cells (Fig. 3F).

      1. Technical note: it is very strange that MAFs can be transfected for luciferase assay. Such primary cells, to my knowledge, are largely non-transfectable. How was transfection performed in these cells? The authors should show that these cells can be transfected using imaging, or give a reference.

      We did both. We gave references and the experimental details in Materials and Methods, but we now say it even more explicitly in there. Note that the transfection efficiency is not so critical in luciferase assays as one only reads out the activities of the transfected cell population.

      1. The claim that proteostasis remains intact and the complexity of the proteome is unchanged should be examined more quantitatively. Specifically, analysis directly comparing between WT and KO cells should be performed: are the induced and repressed proteins the same? Is there a correlation between the levels of significantly changed proteins between WT and KO cells? This analysis should be done for chaperones, hsp90 interactors, as well as for the total proteome. Additionally, proteins whose levels differ could suggest (additional) mechanisms underlying the effects.

      This comment also relates back to point #8. We hope that our newly added comment in the Results section associated with the new heat maps makes it clearer what purpose the proteomic data serve and that it is beyond the scope of this paper to quantitate differences further or to home in on this or that protein (with the exception of those proteins we have done immunoblots for). To go deeper into mechanisms is going to be a full project(s) in itself.

      1. "Surprisingly, we found that Hsp90α/β KO cells do even better than WT cells under basal conditions (37{degree sign} C) (Figure 4D)." This is not so surprising, in light of the fact that HSF1 activity in these cells is higher, thus their chaperoning capacity should be better (for example, more HSP70 present?), as the authors themselves point out later in the text.

      It is surprising considering that there is less of a major molecular chaperone. It's definitely not the first thing you suspect when you knock out Hsp90. But to avoid confusion, we have taken out "surprisingly" and reworded the statement.

      1. "Similarly, Hsp90α/β KO cells might do better than WT cells under chronic HS because of their ability to further increase the levels of other molecular chaperones, such as Hsp27, Hsp40, and Hsp70, during chronic HS." This relates to the point above - the authors can directly quantify the changes in the levels of all other chaperones, since they have the proteomics data, and substantiate these claims, which are now only suggestions.

      The subordinate clause ("... because...") is not a speculation, it is a statement based on the data (Fig. 4B and figure supplement 4A-B, and yes, of course, the proteomic data). However, that KOs indeed do better because of that remains to be proven (hence, the "might do better").

      1. In A549 cells, knockout of Hsp90 led to lower basal diffusion coefficient (proxy for cytosolic density) at normal temperatures. Then, at 40 degrees, it seems that the coefficient goes back to being more or less equal to that of WT cells (fig. S5D). How can the authors explain this?

      One cannot really compare them one on one. After all, the Hsp90 KOs are different cell lines, their EGFP expression levels may differ, and their heat sensitivity definitely differs. What can be compared is cells of a given cell line (i.e. WT or KO), transfected as a pool and then split to be cultured at different temperatures.

      1. P-eIF2alpha and other translation marker western blots should be repeated and quantified and in also performed in A549 KO cells. The latter is very important, as the changed in A549 WT cells during adaptation of all translation regulatory markers: p-eIF2alpha, p-mTOR, and most strikingly total mTOR, are sky-rocketing, while in HEK cells these remain constant. As mTOR is a well-known regulator of cell size, and a target of Hsp90, could it be the major mediator of this effect in A549 cells? And if so, what is the substitute in HEK cells?

      We now include bar graphs with quantitation of multiple experiments for both HEK and A549 cells, including for the KOs (Figure 6C-D - figure supplement 8). What they show is that p-mTOR levels increase during chronic stress. But since overall it also increases in Hsp90α/β KO cells, we had to conclude that this cannot explain the differences between cells of different genotypes. We have added a statement to that effect in the corresponding Results section.

      1. Figs. 5D (and S5F) are both for HEK cells, while Fig. 5H is for A549. The corresponding plots for both cell lines should be provided for clarity, as the magnitudes in 5D and S5F seem much larger in HEK cells than seen in 5H. If there are differences between the cell lines these should be pointed out, as currently, showing some figures for one and not the other is confusing.

      HEK and A549 cells in these experiments, which are different, serve different purposes. We now explicitly mention already in the text of the Results, which cell line is used. Hopefully that makes it less confusing.

      1. Fig. 6C lacks a pvalue.

      It's missing because it cannot be calculated. The graph shows the average of "only" 2 biologically independent samples (as stated in the legend).

      1. Fig. S6C - the legend doesn't match the figure. Additionally, #aggregates should be normalized to the respective #of cells in each micrograph, and p-values should be presented for those normalized values.

      For what is now figure supplement 9C, this has been fixed as suggested.

      1. Also, under non-HS conditions, Hsp90 knockout cells show less aggregates than the WT. Is this significant (numbers are small, so perhaps it isn't)? What does this mean for the basal proteostasis state of Hsp90 knockout cells? Is it perhaps better than that of the WT?

      The suggested way of quantitating the aggregates took care of that. There is no clear difference anymore between WT and KO, but clearly many more aggregates under chronic stress (figure supplement 9C).

      1. The data on the connection between size and survival under chronic stress is highly compelling, even though correlative. The authors speculate in the discussion about one possible explanation to the question of how the enlarged size protect from the chronic stress. In fact, their proteomics dataset has the potential to help address, at least in part, their hypothesis about thresholds of certain proteins, by saying which proteins cross the detectability threshold in the data, and which processes these relate to.

      What the proteomic data say is that most things don't change (standardized to total protein). While it is possible that a few proteins do change in interesting ways, characterizing those is beyond the scope of this study.

      1. Fig. 7G should have a respective quantification with a p-value.

      We have added additional data. What is now Fig. 9 shows the quantitation of multiple biological replicates (with p-values).

      Minor comments:

      1. "it is known that acute HS causes ribosomal dissociation from mRNA, which results in a translational pause (Shalgi et al., 2013)." - This paper showed that acute HS causes ribosomal pausing on mRNAs, not ribosomal dissociation.

      We corrected this.

      1. Fig. 7E - size bar is missing.

      It was actually there, but hard to see. We have improved that in what is now Fig. 8E (and it is now also mentioned in the legend).

      Reviewer #3:

      My main points are outlined in the Public Review. Only a few additional comments are included here:

      1. The manuscript is quite long and there are places where it could be shortened and tightened for clarity. I'd recommend going through carefully and trying to shorten to improve readability.

      We hope that our revisions to address all of the reviewers' comments (and to accommodate more data) make the text more readable. But to make it shorter would have come at the expense of clarity.

      1. It wasn't clear to me that the increased luciferase folding in HSP90 KO lines was surprising. It is demonstrated that knockdown of these isoforms can activate HSF1, which increases many chaperones known to promote luciferase refolding.

      We address this point in our response to point #13 of reviewer #2 (basically: we took out "surprisingly").

      1. Along the same lines. HSP90 knockdown activates HSF1, but doesn't induce basal cell size. However, exogenous overexpression of HSF1 or activation of HSF1 with capsaicin increase cell size. Why are similar things not observed for HSP90 knockdown? Is it the extent of HSF1 activation? This seems a bit unlikely because it looked like activation was similar in KO and capsaicin treated cells.

      This must be due to the specifics of these different assays. The levels of Hsf1 protein and activity, and the time course of Hsf1 activity may be different. Moreover, it is likely that the reporter gene readout does not accurately report on all Hsf1 activities at a genome-wide scale.

      1. As noted above, does HSP90 depletion impact ISR signaling induced by other types of stress (e.g., ER or mitochondrial stress). Specifically, do you see sustained translational attenuation (and eIF2a phosphorylation) when HSP90 is depleted under these conditions. In other words, does HSP90 have a specific role in globally resolving eIF2a phosphorylation as part of the ISR or is that specific to certain types of stress.

      Although we now include data to show that tunicamycin (and therefore presumably the UPR/ISR) also induces a cell size increase, comprehensively analyzing what we refer to as RSR across different types of stresses (including mitochondrial and ER stresses) in the background of different Hsp90 genotypes and cell lines goes well beyond the scope of the current study.

    1. Author Response

      Reviewer #3 (Public Review):

      The authors sought to directly compare the predictions of two models of somatosensory processing: The attenuation model, which states that the sensation of touch on one hand is reduced when it is the predictable result of an active movement by the other hand; and the enhancement model, which states that the sensation of touch is actually increased, as long as the active hand does not receive touch stimultaneously with the passive hand (no double stimulation). The authors achieved their aims, with results clearly demonstrating (1) attenuation in the case of self touch, (2) that previously-observed enhancement is a consequence of the comparison condition (false enhancement), and (3) that attenuation involves predictive mechanisms and does not result simply from double stimulation. These findings, and the methodology, should particularly impact future studies of perceptual attenuation, sensory prediction error, and motor control more generally. The opposite conclusions obtainable by selecting different comparison conditions is particularly striking.

      Experiment 1 affirms that a touch to the passive finger caused by the active finger tapping a force sensor is perceived as weaker (attenuated) compared to a baseline not involving the active finger, but that if double stimulation is prevented (active finger moves, but no contact), neither attenuation nor enhancement occurs. Experiment 2 includes the three original conditions, plus the no-go condition used as a comparison in these earlier studies. Results suggest that the comparisons used by previous studies would result in the false appearance of enhancement. Finally, Experiment 3 tests the hypothesis that the lack of attenuation in the no-contact condition is due to the absence of double stimulation rather than predictive mechanisms. When contact and no-contact trials were mixed in an 80:20 ratio, such that participants would form predictions about the consequence of their active finger movement even if some trials lacked contact. In this case, attenuation was observed for both contact and no-contact trials, supporting the idea that attenuation is related to predictive processes linked to moving the active finger, and is not a simple consequence of double stimulation.

      The methodology and analysis plans for all three experiments were pre-registered prior to data collection. We can therefore be very confident that the results were not influenced by hypotheses developed only after seeing the data. The three experiments were each performed in a new set of participants. Experiments 2 and 3 included conditions that replicated the Experiment 1 effects, allowing us to be very confident that the results are robust.

      While the study has significant strengths, some aspects of the interpretation need to be clarified. In particular, the authors' interpretation depends on the idea that attenuation is absent in the no-contact condition because this action-sensory consequence relationship is an "arbitrary mapping." It is not clear what makes it arbitrary. The self-touch contact condition could also be considered somewhat arbitrary and different from real self-touch; the 2N test force was triggered by the right finger tapping a force sensor. If participants' tapping forces were recorded, it would be useful to include this information, particularly about how variable participants' taps were. In other words, unlike real self-touch, in this paradigm the force of the active finger tap did not affect the force delivered to the passive finger.

      By ‘arbitrary’, we refer to nonecological mappings between a movement and a somatosensory stimulus. In other words, a mapping that does not resemble how one touches their body (natural self-touch). Examples of such arbitrary mappings are moving the right finger in the air and receiving simultaneous touch on the other hand, as in Thomas et al. (2022), or moving a joystick or potentiometer with one hand and receiving a touch on the other hand. These joystick or potentiometer conditions are typically used as a control condition when studying somatosensory attenuation because they include an arbitrary sensorimotor mapping (Shergill et al., 2005, 2003; Teufel et al., 2010; Wolpe et al., 2016).

      We understand the reviewer’s point about the relationship between the forces applied with the right hand and the forces received on the left hand. First, we would like to clarify that we recorded the forces that the participants applied to the sensor in every experiment. We have now added a figure (Figure 3 – figure supplement 3) showing the forces over time across all participants in every experiment, which is referred to in the Methods on Lines 727-730. As we wrote in the Methods (Lines 720-727), and in line with previous studies (Asimakidou et al., 2022; Kilteni et al., 2021; Kilteni and Ehrsson, 2022), we asked participants to tap, neither too weakly nor too strongly, with their right index finger, “as if tapping the screen of their smartphone”. We did so because participants do not have an intuitive sense of how strong a force of 2 N is, and this instruction allowed them to apply forces of similar magnitude from trial to trial while receiving the same touch on their left index finger. Indeed, as shown in Figure 3 – figure supplement 3 (D-F), participants showed low trial-to-trial variability in the applied forces, with an average variability (s.e.m.) of only ± 0.13 N in Experiment 1, ± 0.12 N in Experiment 2 and ± 0.11 N in Experiment 3. In other words, they generated similar forces with their right index finger across all trials while receiving the same force on their left index finger, establishing an approximately constant gain between movement and touch and a perceived causality between the two (Bays and Wolpert, 2008; Kilteni, 2023). Critically, Bays and Wolpert (Experiment 1 in that book chapter) previously showed that the magnitude of attenuation remains unaffected when halving or doubling the gain between the force applied by the active finger and the force delivered on the passive hand as long as the gain remains constant throughout the experiment (Bays and Wolpert, 2008). This should not be surprising given that when one finger transmits a force through an object to another finger, the resulting force also depends on the object's properties (e.g., shape, material and contact area) and the angle at which the finger contacts the object. This is outlined in Lines 733-736 of the manuscript.

      One additional potential weakness is that participants' vision was occluded in Experiment 3, but not in Experiments 1 and 2. The authors do not discuss whether this difference could confound any of the analyses that compare results across experiments.

      We thank the reviewer for the comment. We do not think that blindfolding is a weakness of our study, as we designed our experiment to take this factor into account. Specifically, we blindfolded participants to ensure that they would not know when the force sensor was retracted on (unexpected) no-contact trials. This was essential for establishing an expectation that they would contact the force sensor. Importantly, participants were blindfolded in all conditions of Experiment 3 (contact, no-contact and baseline), so any effect of blindfolding was present across all conditions of Experiment 3. Since in the analyses of Experiment 3 (Lines 342-354), we always compared between conditions, blindfolding per se could not explain any differences between conditions, as any putative effects of blindfolding are effectively removed when contrasting two conditions in which participants were blindfolded. Notably, this argument also applies to the comparisons that we made between Experiment 3 and Experiments 1 and 2, since all these analyses (Lines 362-376) compare the difference between contact and no-contact trials (e.g., PSE values) between the experiments. Once again, any putative effects from blindfolding were effectively removed. We should also emphasize that the participants’ left index finger as well as the motor that delivered the force to their left index finger were occluded from view in Experiments 1 and 2. This was done to prevent participants from using any visual cues to discriminate between the two forces. This is has been included in the Methods section (Lines 772-775).

      In conclusion, blindfolding cannot explain the results of Experiment 3, and it did not alter the interpretation of any of our results derived by comparing the experiments. We have clarified this point in the manuscript (Lines 823-827).

    1. Author Response

      Reviewer #1 (Public Review):

      In this manuscript the authors perform a detailed analysis of the impact of food type on reproduction in C. elegans. They find that, in comparison with the standard OP50 strain of E. coli that is ubiquitously used to maintain C. elegans in the laboratory setting, the CS180 strain results in a reduction in the number of progeny that may be a consequence of an early transition from spermatogenesis to oogenesis that reduces total sperm number. They also find that the rate of oocyte fertilization is increased in animals fed CS180 vs. OP50. Using mutants and laser ablations, the authors show that, whereas the insulin-like peptide INS-6 acts in the ASJ sensory neurons to mediate the food type effect on total progeny and early oogenesis, the increased fertilization rate phenotype does not require ASJ or insulin-like signaling and instead requires the AWA olfactory neurons.

      The major strengths of the manuscript are the establishment of INS-6 as a link between food type and reproduction and the detail and rigor with which the experiments were executed. The results presented generally support the authors' model. This role of insulin-like signaling in connecting food type and reproduction makes it a plausible target for evolutionary forces that may have shaped insulin-like signaling in invertebrates. As such, this work contributes broadly to our understanding of how insulin signaling may have evolved prior to the emergence of vertebrates.

      We thank the Reviewer for these nice comments.

      A weakness of the work is the epistasis analysis of insulin-like pathway components, which is incomplete and at times difficult to interpret.

      We conducted an epistasis analysis between ins-6 and daf-16 with regard to early oogenesis onset on the CS180 diet. Through recombination of lin-41::GFP with the daf-16 deletion mutation on chromosome I, we showed that daf-16 mutants exhibit early oogenesis at mid L4 on CS180 (Figure 5C and F), which is unlike the ins-6 deletion (null) mutants or the reduction-offunction mutations in daf-2. Both ins-6 and daf-2 mutants exhibit delayed oogenesis on CS180 (Figure 5B, D, and F). Interestingly, the delayed oogenesis phenotype of ins-6 null mutants was not rescued by loss of daf-16, suggesting that wild-type ins-6 promotes early oogenesis independent of daf-16 (Figure 5F). This is reminiscent of the Arur lab’s findings, where daf-2 promotes germline meiotic progression independent of daf-16 in response to food availability (Lopez et al., Dev Cell 2013, vol 27, pp 227-240).

      Reviewer #2 (Public Review):

      The manuscript by Mishra et al. examines the modulation of the nervous system by different bacterial food to influence reproductive phenotypes-specifically onset of oogenesis, fertilization rate, and progeny production. Defining how animal reproduction could be modulated by bacterial food cues through neuroendocrine signaling is a fascinating subject of study for which C. elegans is well-suited. However, the overall scope of the current study is limited, and some of the central data do not provide compelling evidence for the authors' underlying hypothesis and model.

      1) Two strains of E. coli are examined, the standard C. elegans bacterial food strain OP50 and an E. coli strain that Alcedo and colleagues have previously characterized to influence aging and longevity through nervous system modulation. While the authors determine that differences in LPS structure present between the strains does not account for the food-dependent effects, there is little further insight regarding the bacterial features that contribute to the observed differences in reproductive physiology. Moreover, at least two of the phenotypes examined-total progeny and fertilization rate-are known to be affected by bacterial food quality and may be affected by bacteria in many ways, so the description of these phenotypes is somewhat less compelling than the study of the onset of oogenesis.

      Our study focused on how specific sensory neurons mediate the effects of different bacterial diets on three different aspects of C. elegans reproductive physiology—total progeny, oogenesis onset and fertilization rates. We examined the effects of three different bacteria, E. coli OP50, CS180 and CS2429, on these three phenotypes and the effects of two Serratia marcescens strains, Db11 and Db1140, on oogenesis onset. Of these five bacteria, only CS180 and its derivative CS2429, promote early C. elegans oogenesis.

      In the revised manuscript, we included the effects of a fourth E. coli strain, the K-12 HT115 on total progeny (Figure 2—supplement 1), oogenesis onset (Figure 2E) and fertilization rates (Figure 2F). We found that HT115 does not elicit the same response as CS180 on oogenesis onset and fertilization rates. Thus, the oogenic-inducing and fertilization-enhancing cue(s) appear to be specific to CS180 and its derivative CS2429. We started characterizing the potential nature of these CS180-derived cue(s). So far, we found that these cues are unlikely to be free, small metabolites, since they were lost upon filtration of the CS180-conditioned LB media through a nylon membrane that has a pore size of 0.45 µm (Figure 2G and H). While we agree with the Reviewer that the identification of these cues are important, we believe that it is beyond the scope of this manuscript.

      More importantly, we showed that the sensory neuron ASJ does modulate the timing of oogenesis and that this involves the insulin-like peptide ins-6 (please see our responses to the Essential Revisions section and Figures 5 and 6). We also showed that ASJ (Figure 7G and K) or ins-6 (Figure 8D) does not affect the food type-dependent fertilization rates, which are modulated by a different sensory neuron, the olfactory neuron AWA (Figure 7J and K). AWA in turn has no effect on the timing of oogenesis (Figure 7L). Thus, this manuscript links specific sensory neurons and insulin-like peptides to distinct aspects of oocyte biology, which we believe is a significant advance in the field of reproductive biology.

      2) The onset of oogenesis phenotype, using the lin-41::GFP reporter, seems more specific and tractable, and the authors nicely decouple this phenotype from the total progeny and fertilization rate phenotypes through experiments that shift animals to different bacterial food at specific developmental stages.

      We thank the Reviewer for this comment.

      However, as it stands, the data regarding the role of ins-6 and ASJ in modulating this phenotype, and the model that exposure to CS180 bacterial food causes a change in the ASJ expression of ins-6, which is sufficient to promote the earlier onset of oogenesis at the mid-L4 stage, seems somewhat incomplete and have some inconsistencies to be addressed.

      a) The ins-6 mutant phenotype is rescued by genome ins-6 and partially rescued by ins-6 expressed under and ASJ-specific promoter. The lack of rescue from an ASI promoter is puzzling given the secreted nature of ins-6.

      We address this in Essential Revisions, point 3. Briefly, we disagree that this is puzzling, since several labs have already shown that there are functional differences between the INS-6 produced from ASI versus the INS-6 produced from ASJ, using different experimental approaches (Chen et al., 2013; Tang et al., 2023; and this work). Indeed, the cell-specific activities of a secreted signal is not limited to INS-6, but has also been described for other secreted peptides, such as INS-1 (Kodama et al., 2006; Tomioka et al., 2006; Takeishi et al., eLife 2020, vol 9, e61167. Thus, the interesting question is why functional differences exist between the INS-6 peptides from the two neurons. This is a fascinating question, but beyond the scope of this manuscript.

      b) The ins-6 mutant phenotype with regard to delaying the early expression of lin-41::GFP on CS180 appears weaker than the daf-2 mutant phenotype. This is difficult to reconcile with what is known about the relative strength of the daf-2 mutant alleles relative to ins-6 for a wide range of phenotypes.

      There are evidence in the literature that the ins-6 mutant phenotype will not look exactly like that of daf-2 (Chen et al., 2013; Cornils et al., Development 2011, vol 138, pp1183-93; Fernandes de Abreu et al., PLoS Genet 2014, vol 10, e1004225). The DAF-2 insulin-like receptor is predicted to bind multiple insulin-like peptides (Pierce et al., Genes Dev 2001, vol 15, pp 672-686), some of which can act antagonistic to DAF-2 function (Pierce et al., 2001; Cornils et al., 2011; Chen et al., 2013; Fernandes de Abreu et al., 2014). Thus, the oogenic effects of the reduction-offunction mutations in daf-2 are likely the sum of multiple insulin-like peptides, some of which might also delay oogenesis. This could explain why the manipulation of an individual insulin-like peptide, INS-6, which could bind DAF-2 to promote oogenesis, does not closely resemble the phenotype of daf-2 mutants.

      c) The daf-16 loss-of-function phenotype and suppression of daf-2 and ins-6 mutant phenotypes are not shown for the lin-41::GFP expression phenotype.

      We address this in the Public Review comments of Reviewer 1. Briefly, we focused on the epistasis analysis between ins-6 and daf-16 and showed that ins-6 promotes early oogenesis independent of daf-16.

      d) The modest difference in ins-6p::mCherry expression in the ASJ neurons (Figure 5D) make the idea that this difference causes onset of oogenesis somewhat implausible.

      We disagree that this change is modest and that the oogenic effect of such a change is implausible.

      First, the change in ins-6p::mCherry expression in ASJ on CS180 is comparable to other physiologically-important expression changes that have been reported for other genes (for example, Entchev et al., eLife 2015, vol 4, 4:e06259, for the tryptophan hydroxylase tph-1 and the TGF-β daf-7; and Tataridas-Pallas et al, PLoS Genet 2021, vol 17, e1009358, for the neuronally expressed NRF transcription factor skn-1b). Second, it is worth noting that we were using a single-copy reporter for ins-6 expression, where detected changes will be smaller but should be closer to physiological responses. It is possible that multiple-copy reporters will give larger changes, but that would be further from a physiological response. Third, the change in ins-6p::mCherry expression is comparable in scale to the ins-6 mutant phenotype. Our results showed that the 35% increase in ASJ expression of ins-6 is due to food type (Figure 6A; mean fluorescence on OP50 = 1526 + 94; mean fluorescence on CS180 = 2056 + 104). This change in magnitude is similar to the loss of lin-41::GFP expression in mid L4 of ins-6 mutants versus controls. About 30% to 43% of control worms express lin-41::GFP, whereas 0% of ins-6 mutants express the same reporter at mid L4 on CS180 (Figure 5 and its associated supplement).

      e) The strain carrying an genetic ablation of ASJ appears to have a markedly different baseline of kinetics of lin-41::GFP expression (even at lethargus, less than half of the animals appear to express lin-41::GFP). Given this phenotype, it seems difficult to draw conclusions about bacterial food-dependent effects on expression of lin-41::GFP. Additional characterization corroborating timing of oogenesis independent of the lin-41::GFP marker may be helpful, but something seems amiss.

      We address this in Essential Revisions, point 4. Briefly, we disagree that the kinetics of lin-41::GFP expression in ASJ-ablated animals is puzzling, compared to the kinetics observed in insulin signaling mutants. Besides ins-6, ASJ expresses multiple signals (Taylor et al., 2021), some of which might also regulate the multiple functions of oogenic lin-41::GFP. Thus, it should not be surprising that loss of ASJ will have a markedly different effect on oogenesis than the loss of ins-6.

      Reviewer #3 (Public Review):

      I very much enjoyed reading this paper by Shashwat Mishra and team from Joy Alcedo's and from Queelim Ch'ng's laboratories dissecting how sensory signals regulate reproduction in worms. The mechanisms by which sensory inputs affect the function of the germline, the balance between growth and differentiation within this tissue, are of broad interest not only to those interested in reproduction and differentiation, but also to those interested in the mechanisms of plasticity that enable organisms to adjust to changing environmental conditions. These mechanisms are only now beginning to be characterized. Here the focus is on the role of insulin signals expressed in sensory neurons. This work builds on previous findings by the Alcedo lab that sensory perception of bacterial-type dependent signals regulates C. elegans lifespan. Here their focus is on the effects on reproduction, and on the communication of that information by insulin-like signals.

      We thank the Reviewer for these nice comments.

      Worms have a huge family of 40 insulin-like genes, which the Alcedo and Ch'ng labs have been studying for many years. The paper starts with the interesting premise that the brood size of the worms is food type dependent. The authors show that this is due to effects on the timing of the onset of oogenesis during larval development (which constrains the size of the pool of sperm available for subsequent oocyte fertilization) as well as on effects on the rate of oocyte fertilization during adulthood. Using clever timing for food switching, they show that the effects on oogenesis onset and on fertilization rate are separable. In addition, these effects did not appear to be merely the outcome of indirect effects of food ingestion, but were, instead, at least in part, due to the perception of environmental information by specific sensory neurons. Using mutants affecting transduction of sensory information in specific neurons and genetic ablation of specific neurons, the authors show that the onset of oogenesis and the rate of reproduction were controlled by different sensory neurons, ASJ and AWA, respectively. One of these neurons, ASJ, transmitted environmental information via the ins-6 neuropeptide.

      Altogether, the paper advances our understanding of how environmental determinants influence reproduction.

      We thank the Reviewer for these nice comments.

    1. Author Response

      Reviewer #1 (Public Review):

      However, the authors are cautioned to tone down some of the sentences with the human diabetic samples as they rely heavily on extrapolation rather experimental tests.

      Thank you for this feedback. We have added an experimental test to support the CellChat results. We found that, in accordance with the CellChat analysis, more macrophage Gas6 expression is observed in diabetic wounds via IF. These data are now included in Figures 3C-D. We have additionally edited the text relating to Figure 3 to indicate that these results are not fully conclusive.

      For instance, the antibody inhibition of Axl had minimal effect on the clearance of apoptotic cells in the wound and this would be expected with the redundancy endowed by other TAM receptors.

      Thank you for this point. We have made a note of this in the text in lines 289-291.

      For instance, in Figure 6, the number of TUNEL+ cells seem to be higher in the IgG samples compared to the anti-Timd4 treatment, but this is not the case in the quantification

      Thank you for this comment. We have replaced these with more representative images, which appear in Figure 6A. We also repeated the staining with antibodies for cleaved caspase 3, which appear in Fig. 6 – Fig. supplement 1A, which showed similar results.

      Reviewer #2 (Public Review):

      I suggest to repeat the quantification of cells containing active caspase-3 with an anticleaved caspase-3 antibody. Here the authors use an antibody recognizing phospho S150 antibody, which is far from generally accepted to be a marker for active caspase-3. It would also be good to quantify the apoptotic cells observed in the sections (Fig 1 I and J) and compare to control treatment on sections. It is not clear from the data presented whether the number of apoptotic cells increases or not in the time frame analyzed since the controls are lacking.

      Thank you for this important suggestion. We have repeated the IF staining using an antibody for cleaved caspase 3 (Cell Signaling 9661S) and quantified the apoptotic cells present. We found that apoptotic cells were rare but present at both 24h and 48h after injury, and that significantly more cleaved caspase 3+ cells were present in 48h wounds than 24h wounds. These data are now included in Figure 1H-J and Fig. 1 – Fig. supplement 1F. We have also used this antibody in IF staining in Fig. 5 – Fig. supplement 1B and Fig. 6 – Fig. supplement 1A.

      In a FACS analysis (Fig S1 H), the authors show that there is no increase in dead cells in a time frame of 48 hrs. Could it be that the majority of the cells that may have died in vivo, were lost during the procedure of tissue digestions. Dead cells tend to aggregate.

      Based on these comments and the inconsistency in these data due to potential technical challenges, we have removed the FACS data quantifying Annexin V. We now include the quantification of cleaved caspase 3 and an efferocytosis assay to analyze the kinetics of efferocytosis.

      On line 104 the authors refer to the apoptosis-inducing activity of G0s2. Please, realize that there is little or no in vivo evidence for a role of G0s2 in apoptosis.

      Thank you for this helpful comment. We have removed this gene from our analysis and text.

      The authors state that Axl is uniquely expressed in DC and fibroblasts (Fig 2). Are the Axlcells positive in panel G (red, Fig 2) that do not stain for the Pdgfra marker (green) then all DCs? Please clarify or show with a triple staining that these cells are indeed DCs.

      Thank you for this comment. To clarify, our intention was to show that both DCs and fibroblasts express Axl, not to say conclusively that only DCs and fibroblasts express Axl. Indeed, in Figure 5, we show that a portion of macrophages also express Axl (at day 3), so some of the Axl+ cells in 2G may be macrophages rather than DCs. We have made this more clear in the text in lines 163-166.

      In addition, it is not clear to me to what reference level exactly the expression levels are compared in Fig 2A. Is this between the 24 and 48h time points after wounding (as mentioned in the legend)? If so, the analysis may indicate up or down regulation but not necessarily expression or no expression.

      Thank you for making this point. The heatmaps display scaled log-normalized mRNA counts for the entire dataset, not a comparison between the two timepoints. We have clarified this in the figure legends.

      2) Human diabetic wounds display increased and altered efferocytosis signaling via Axl. This conclusion is solely based on CellChat analysis and should be tuned down or validated.

      Thank you for this suggestion. We have experimentally validated this conclusion using IF staining for Gas6. We found that more Gas6 staining in CD68+ macrophages in diabetic foot ulcers when compared to nondiabetic foot wounds. These data are now included in Figure 3C-D.

      The authors conclude that anti-Axl treatment leads to healing defects based on lack of granulation tissue and larger scabs, a reduction of fibroblast repopulation and revascularization. The differences in the last two parameters mentioned above are obvious, however the other parameters, as granulation tissue and scabs are less clear to me. Is this quantified in any way? In Fig S4 D there is also a large scab visible in the control treatment image. Therefore, it would be good if these parameters could be better substantiated.

      Thank you for this comment. We have edited the text in lines 301-304 to de-emphasize these qualitative changes.

      In view of the lack of revascularization, are there differences in the mRNA expression levels of angiogenic factors such as VEGF and others at this time point? Does revascularization occur at later stages?.

      Thank you for this helpful suggestion. We have used qPCR to measure Vegfa mRNA expression, and these data are now included in Figure 5I. We found no significant difference in Vegfa expression 5 days after injury.

      Based on the FACS analysis the authors claim that there are no differences at the level of DCs. However, the plots shown in Fig 5C do not convincingly show the detection of DC (as boxed in the lower panel). Based on the density plots one would presume this is just the continuation of the CD11b+ population and not a separate CD11c+ population. To get a better view of that, it would be better to show dot plots instead of density plots.

      Thank you for this insightful comment. We have created new plots as suggested to demonstrate that this is not exactly the case. In the wound bed, contrary to what we see in blood isolates many times the full separation of populations is elusive and to ensure that we use single stain controls to set the gates. Nonetheless, we provide in Author response image 1 the same data as dot-plots as requested to show that that is not the case, alongside the single stain control to show that the gating strategy is adequate. We do understand and acknowledge that in dissociated tissues sometimes the outlines are not as perfect as what is obtained in immunological samples.

      Author response image 1.

      Finally, the authors state (line 265-266) that anti-Axl treatment leads to non-significantly increased expression of IL1alpha and IL6 after one day of injury (Fig S4C). If the difference between the control-treated and the anti-Axl-treated group is statistically not significant I would not conclude there is an increase. Please adapt phrasing or include more mice in the experiment (now only 4) to substantiate the observation and clarify whether it is increased or not.

      Thank you for this comment. We have altered the text in lines 286-289 to better reflect this.

      The authors conclude that overall healing was not affected but that the wound beds appeared more fragile. What is meant with 'appeared more fragile' is not clear. In addition, this seems to me a quite subjective interpretation. What are the objective parameters to come this conclusion?

      Thank you for this point. We have altered the text to remove this subjective language.

      Similar to inhibition of Axl, inhibition of Timd4 led to a defect in revascularization as witnessed by the absence of CD31 staining. Also in this experiment one can raise similar questions as in the anti-Axl experiment: 1) does revascularization occur at a later timepoint; 2) what about the expression of angiogenic factors?

      Thank you for this helpful suggestion. To further investigate the impact of Axl inhibition of angiogenesis, we have assayed for Vegfa by qPCR. We found no significant difference in Vegfa expression 5 days after injury. These data are now included in Figure 5I.

      In the anti-Timd4 treated wounds the authors observe more TUNEL-positive cells and conclude that this is due to a defect in efferocytosis. However, the formal experimental proof for this in the current model is lacking. How do the authors exclude the possibility that anti-Timd4 treatment attracts more infiltrating cells that then undergo treatment, or that the treatment with anti-Timd4 leads to more apoptosis of certain cells in the wound bed. What is the nature of these apoptotic cells (neutrophils, T cells, others)? It has been shown that Timd4 can have stimulatory effects on other cells, such as T cells. Could deprivation of Timd4 signaling in certain conditions lead to more dying cells in this model?

      Thank you for this insightful comment. To investigate this, we have repeated this experiment with IF staining for cleaved caspase 3 and found similar results, indicating the increase in apoptosis upon Timd4 inhibition (Fig. 6 – Fig. supplement 1A). We have also included text to acknowledge the possibility of an increase in apoptosis in lines 326-327.

      Reviewer #3 (public Review)):

      They never do show that there is an increase in apoptotic cells in the wounds, which then go down (which would be a sign that the cells are being cleared via efferocytosis. In addition, they are looking for apoptotic cells at very early time points (24-48 hours), times at which large numbers of apoptotic cells would not be expected. As an example, neutrophil infiltration peaks at 24-48 hours and efferocytosis of apoptotic neutrophils would be expected after that. Other types of apoptotic cells would likely be cleared even later. Finally, several of the panels showing apoptotic cells were done with a very small number of samples (1-3 per group) in some cases so it is unclear how rigorous the data are. I would recommend that the authors at the very least soften the wording related to these conclusions and discuss the limitations of their experimental design; ideally data from more samples would be included to provide clear support those statements.

      Thank you for raising this important point. In order to support these claims, we have undertaken two additional experiments. Firstly, we have repeated the immunofluorescence staining with a new antibody for activated caspase 3 and quantified the number of apoptotic cells present in 24h and 48h wound beds. We found that apoptotic cells significantly increased in 48h wound beds compared to 24h wounds (Figures 1H and Fig. 1 – Fig. supplement 1F).

      We have also undertaken a new experiment to show the temporal regulation of efferocytosis. We injected stained apoptotic neutrophils into 1D, 3D, and 5D wound beds and quantified the stained cells remaining after 1 hour in order to quantify the clearance of cells from the wound bed at different timepoints. We found that significantly more stained cells undergoing efferocytosis remained in 5D wounds, and that the rate of efferocytosis was approximately constant over this timeline. These data are now included in Figures 2H-M.

      While we would be interested to determine the identities of cells engaging in efferocytosis of the labeled apoptotic neutrophils, we found that co-staining for additional cell markers was impossible while maintaining the fluorescent labeling on the injected neutrophils.

      2) The human RNA-seq data is also quite limited, as non-diabetic wound tissue was all from one patient. Again, this limitation should be acknowledged.

      Thank you for this feedback. We have analyzed new data sets that include 5 individuals with diabetic foot ulcers and 4 individuals with non-diabetic wounds. These data are now included in Figure 3.

      Also, there are some important published papers by Sashwati Roy's group indicating that there are defects in efferocytosis in diabetic wounds, which may go against what the authors are showing here to some degree. Discussion of the authors' work in relation to these other studies should be discussed.

      Thank you for this suggestion. We have included discussion of this work to the text in lines 192193.

      3) For anti-Axl and anti-Timd4 experiments, the authors conclude that inhibition of Axl does not affect TUNEL+ cells and that Timd4 does not affect reepithelialization. However, in some cases the sample size was only 3 mice per group when measuring these parameters. That is a very small number of samples to draw conclusions about apoptotic cells or reepithelialization since these parameters are key for the overall conclusions of the experiments. Given that these are key data, it would be important to include more than n=3. Additionally, as stated above, a time point later than 24 h may be necessary to actually see changes in apoptotic cells.

      Thank you for this suggestion. We have repeated the staining for apoptotic cells using a new antibody for cleaved caspase 3 and stained wound beds from additional mice. In the anti-Axl experiments, we now show data for cleaved caspase 3 staining of 3- and 5-day wound beds with N=4 (Fig. 5 – Fig. supplement 1B). In the anti-Timd4 experiments, we now have N=6-11 for the TUNEL staining at 5 days after injection and injury (Figure 6B).

      4) In Fig 6, there look to be many more TUNEL+ cells in the wound bed of IgG control samples compared to anti-Timd4-treated samples, which contradicts the graph. Perhaps the authors could clarify where they were taking their measurements for panels with image analysis results.

      Thank you for this helpful point. We have updated this figure to be more representative of the quantification (Figure 6A-B), as well as repeated the staining with antibodies for cleaved caspase 3 (Fig. 6 – Fig. supplement 1A).

      Another question related to this experiment is how it is possible that efferocytosis is so drastically different yet there are no changes in wound healing (this is one reason why a larger sample size for reepithelialization may be critical) - this would seem to suggest that efferocytosis is not important in wound healing, which is confusing. Further discussion on this might be useful.

      Thank you for this point. Indeed, we see that there is a defect to revascularization when Timd4 is inhibited (Figure 6E-F), which indicates that efferocytosis is important to normal healing. This is discussed in lines 333-335.