4 Matching Annotations
  1. Oct 2020
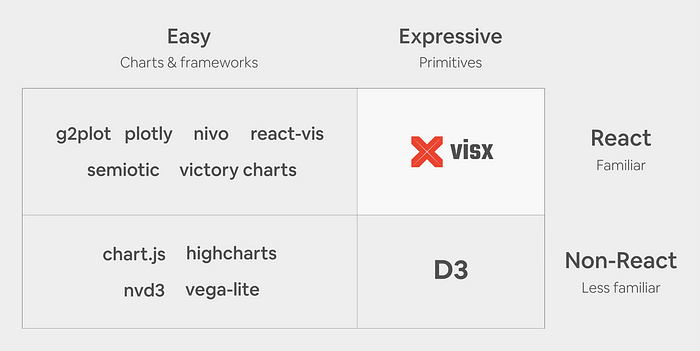
    1. suite of over 30 separate packages of React visualization primitives that fall into several categories (Figure 2). It is un-opinionated on state management, animation, and styling so it can integrate with any React codebase, and its emphasis on modularity (similar to D3) lets you keep your bundle sizes down by only using the packages you need to create your reusable chart library or a custom one-off chart.

      Short definition of visx

    2. In our research (Figure 1), we found that existing React visualization libraries are often high-level abstractions and optimized for ease of use (i.e., fewer lines of code) at the expense of expressivity. None offer the expressivity of D3 primitives and many don’t allow for the optimization we want in production because computation, animations, state management, styles, and rendering are all encapsulated.

      Comparison of data visualisation libraries:

    3. Leveraging React and its ecosystem would provide learnability and performance, and a low-level, modular API would deliver expressivity.

      Thanks to React, visx achieved all: learnability, performance and expressivity

    4. After 3 years of development, 2.5 years of production use at Airbnb, and a rewrite in TypeScript we are excited to announce the official 1.0 release of visx (formerly vx). You can find the project on GitHub and browse documentation and examples on airbnb.io.

      visx - collection of reusable low-level visualization components. visx combines the power of d3 to generate your visualization with the benefits of react for updating the DOM

      gallery