- Dec 2018
-
www.scienceintheclassroom.org www.scienceintheclassroom.org
-
Fig. 2 Terrestrial C loss rates from stream reaches increased with N and P concentrations.
Graph illustrating the loss of terrestrial carbon.
-
- Nov 2018
-
iphysresearch.github.io iphysresearch.github.io
-
Improving Generalization for Abstract Reasoning Tasks Using Disentangled Feature Representations
非常不错的 CNN 的网络结构图:
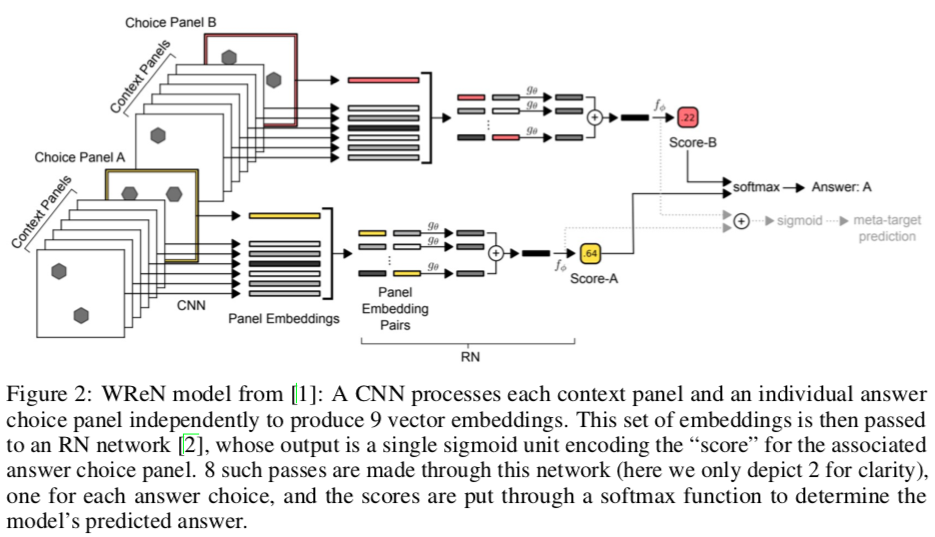
可以看到清晰的数据处理方式,还有图形明暗色彩的变化。
Tags
Annotators
URL
-
- Oct 2018
-
jnnp.bmj.com jnnp.bmj.com
-
Table 1
summary of psychological study findings (frontal lobe function in aggressive and antisocial subjects)
-
Table 2
summary of neuroimaging studies in violent and aggressive subjects
Tags
Annotators
URL
-
- Aug 2018
-
wendynorris.com wendynorris.com
-
Personal and organizational histories occupy prominent figure positions in the figure-ground dichotomy, and that such histories are used to cope with the future is indicated by several pieces of evidence.
Does this help to explain the need for SBTF volunteers to situate themselves in time -- as a way to construct a history in Weick's "figure-ground construction" method of sensemaking for themselves and to that convey sense to others?
-
And if Weick has drawn the correct conclusion about how the past is used to enact the present, being able to note the differences may be even more important than being able to see the similarities. This is especially so in equivocal enactments, which Weick (1979, p. 201) described as involving a figure-ground construction, one in which the ground consists of the strange and unfamiliar
Weick describes the need to discern differences over similarities to effectively use past-present metaphors as a sense-making device.
-
- Apr 2018
-
ds.swarthmore.edu ds.swarthmore.edu
-
Melchor
n. Saint Melchior, or Melichior, was purportedly one of the Biblical Magi along with Caspar and Balthazar who visited the infant Jesus after he was born. Melchior was often referred to as the oldest member of the Magi. He was traditionally called the King of Persia and brought the gift of gold to Jesus.
-
San Dionisio
n. Denis of Paris;Saint Denis was a legendary 3rd-century Christian martyr and saint. According to his hagiographies, he was bishop of Paris in the third century and, together with his companions Rusticus and Eleutherius, was martyred for his faith by decapitation.
-
Descartes
n. a French philosopher, mathematician, and scientist. Dubbed the father of modern western philosophy, much of subsequent Western philosophy. In his natural philosophy, he differed from the schools on two major points: first, he rejected the splitting of corporeal substance into matter and form; second, he rejected any appeal to final ends, divine or natural, in explaining natural phenomena. In his theology, he insists on the absolute freedom of God's act of creation.
-
Bacon
n. an English philosopher, statesman, scientist, jurist, orator, and author. Bacon has been called the father of empiricism. His works argued for the possibility of scientific knowledge based only upon inductive reasoning and careful observation of events in nature. Most importantly, he argued this could be achieved by use of a sceptical and methodical approach whereby scientists aim to avoid misleading themselves.
-
Santo Tomás
n. an Italian Dominican friar, Catholic priest, and Doctor of the Church. He was an immensely influential philosopher, theologian, and jurist in the tradition of scholasticism, within which he is also known as the Doctor Angelicus and the Doctor Communis.
-
Aristóteles
n. an ancient Greek philosopher and scientist born in the city of Stagira, Chalkidiki, in the north of Classical Greece. Along with Plato, Aristotle is considered the "Father of Western Philosophy"
-
Padre Anastasio
n. served as Pope from 27 November 399 to his death in 401.
-
- Dec 2017
-
crumplab.github.io crumplab.github.io
-
Some Lifetime Prevalence Results From the National Comorbidity Survey
Where is the figure?
-
-
www.scienceintheclassroom.org www.scienceintheclassroom.org
-
Flowering delays may result in a reduced overlap between plant flowering and pollinator activity (C). This plant–pollinator mismatch affects plant reproductive success (Hoye et al., 2013; Kudo and Ida, 2013; Memmott et al., 2007; Petanidou et al., 2014), and fruit production, with consequences on resource availability for frugivores, which may result in famine or death (Wright et al., 1999). Low fruit set affects the rates of seed dispersal and plant recruitment, which also occurs later in the wet season (C)
Fig. 1. (C)
Climate change has created longer, more intense dry seasons; which ultimately contributes to later plant reproduction, lower fruit yield, and lower germination rates. Delays in flowering might limit the the amount of time pollinators have to disperse pollen, which will reduce plants' abilities to produce viable offspring.
BD, HW
-
In this context, species producing leaves immediately after the first rains would delay leafing activity, thus overlapping with peak insect abundance (B) and, therefore, increasing herbivory damage, potentially affecting plant fitness (Aide, 1988, 1993)
Fig. 1. (B)
The effects of climate change on leaf production and insect activity. Climate change has resulted in later leaf production, which creates an increased overlap between leafing and insect activity. This increases the likelihood of herbivory damage to plants and ultimately decreases plans' abilities to survive and reproduce viable offspring.
BD, HW
-
- Nov 2017
-
www.scienceintheclassroom.org www.scienceintheclassroom.org
-
Fig. 1 Terrestrial C residence time was approximately halved with experimental nutrient enrichment.
Photo of the landscape prior to experiment.
-
Fig. 2 Terrestrial C loss rates from stream reaches increased with N and P concentrations.
Graph illustrating the loss of terrestrial carbon.
-
Fig. 1 Terrestrial C residence time was approximately halved with experimental nutrient enrichment. Increased nutrient inputs (+) reduced terrestrial particulate C residence time (–) and increased export of fine detrital particles (+) and respiration rates [which increased on C substrates (11) but decreased at reach scales; +/−]. Inset graph: Reach-scale leaf litter loss rates were faster in enriched (dashed lines) than in reference (solid lines) streams; the inverse of these rates is residence time. Colors correspond to the same years in (A) (reference versus enriched streams; N+P experiment; n = 12 annual rates) and to the same streams in (B) (pretreatment versus enriched years; N×P experiment; n = 15 annual rates). Data shown for litter loss are untransformed but were natural log–transformed for analyses and the calculation of loss rates (k, per day). The larger image depicts terrestrial organic C inputs, which enter as leaf litter, wood, and dissolved organic carbon (DOC), and outputs as hydrologic export (fine and coarse particles, DOC) and respired CO2 in deciduous forest streams, using an image of one of the N×P experimental stream sites.
Image illustrating the various sources of carbon observed in the experiment.
-
-
www.scienceintheclassroom.org www.scienceintheclassroom.org
-
herbarium specimens
A collection of preserved plant specimen used for specific scientific study.

RA
-
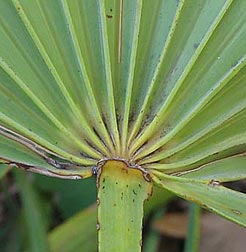
hastula
The junction between the leaf and the stem blade.
RA
-
- Oct 2017
-
www.turbosquid.com www.turbosquid.comman max1
-
man low poly figure human character generic
Tags
Annotators
URL
-
- Sep 2017
-
www.scienceintheclassroom.org www.scienceintheclassroom.org
-
Fig. 1 The lapping process. (A to F) Snapshots showing the movement of the tongue of F. catus and the dynamics of the liquid column during a lapping cycle. Lapping occurs by fluid adhesion to the dorsal part of the tongue's tip and by lifting a liquid column through the tongue's upward motion, before jaw closure. Time elapsed from the first frame is given in the top left corner of each frame. (G) Photograph of the dorsal side of the tongue of F. catus, acquired under anesthesia (16). Only the smooth tip is used in lapping.
Figure 1 Tabs
Major Question: Though we can picture a cat or dog lapping water, how can the use of high speed imaging show how cats are really getting water into their mouth?
High-speed Photography: The use of high speed photography allowed the researchers take a very quick process and see it stationary, step-by-step.
Results: Photograph A: the tongue is leaving the mouth to approach the liquid. Photograph B: the back of the tip of the tongue hit the top of the liquid, but do not penetrate the surface. Photograph C: as the cat's tongue is pulled back into it's mouth, the water below it is pulled up also forming a thin column which the cat will later trap into it's mouth. Photographs D-E: the column of water being held up by the water attaching to the tongue and it's shape is even maintained after the tongue retreats back into the mouth. Photograph F: the column of liquid falling back down into the water after a portion is taken up by the cat's mouth. Photograph G: the smooth area of the tongue is the only portion used in lapping. The roughness of the rest of the tongue would not allow it to use this technique to drink.
Next question: Though these images give us a mechanical understanding of the process of a cat's water intake, how can we quantify these results?
-
- Feb 2017
-
www.lifescied.org www.lifescied.org
-
FIGURE 1.

Title: Number of papers read by undergraduates and Masters Students
Specific Question: How many scientific papers have students carefully analyzed?
Analysis:
2/3 students have carefully read fewer than 20 papers.
Prediction: Most undergraduates read about 1 primary literature article each semester. This is probably not enough to learn how to read the primary literature.
-
- Nov 2016
-
scrolldiving.pro scrolldiving.pro
-
the material and the formal
Artistic practice here looks like something that differentiates itself from a "given" cognitive state of affairs. I'm curious about the importance of such framework...
So, apparently 'form' needs 'background.' But, can we have a 'figure-figure' relationship?
-
-
scienceintheclassroom.org scienceintheclassroom.org
-
Figure 1
Figure 1:
Tab 1 : Axis : The bottom axis is the peer review percentile score that defines how much the committee liked the application (the lower the percentile, the better).
In the first plot, the y axis is the number of citations an author got after receiving a grant.
In the second plot, the y axis is the number of publications an author produced after receiving a grant.
Tab 2 : Description In the first plot, we can see that there are more points in the top left corner than the bottom right corner. This indicates that applications that received better ratings also received more citations.
In the second plot, we see the same trend as in the first. This indicates that applications that received better ratings produced more publications.
-
- Oct 2016
-
www.gutenberg.org www.gutenberg.org
-
falling faintly through the universe and faintly falling
Chiasmus, cf. Portrait bird girl, "soft and slight, slight and soft."
Tags
Annotators
URL
-
-
www.gutenberg.org www.gutenberg.org
-
soft and slight, slight and soft
Chiasmus, cf. "The Dead" "falling faintly through the Universe and faintly falling."
Tags
Annotators
URL
-
- Sep 2016
-
scienceintheclassroom.org scienceintheclassroom.org
-
Fig. 4
Objective: To analyse the mutations of NHE9 gene in patients with comorbid autism and epilepsy.
Methods: Sequencing of all exons and exons-intron boundaries in NHE9 gene
Results. It was found out that there is a heterozygous CGA to TGA transition in exon 1. This leads to transformation of arginine 423 to a stop codon and this change is quite similar to the one nonsense mutation in the Nhe1 gene.
Conclusion: both in NHE9 and Nhe1 genes nonsense mutations are observed in the last extracellular loop of NHE protein; NHE9 in the case of comorbid autism & epilepsy and Nhe1 in the case of slow-wave epilepsy.
-
Fig. 3.
Objective: To study the regulation of some autism-associated genes by neuronal activity.
Methods: They used genetic screens looking for genes regulated by neuronal activity or for targets of transcription factors induced by activity. Cultured rat hippocampal neutrons and complementary DNA (cDNAs) of tested genes were used in this method, as wells a parallel neuronal membrane depolarisation by elevated KCL. After gene expression was studied and compared during a period of 6 hours.
Results: c3orf58 gene expression was increased within 6 hours, as seen in Panel A, while by sequencing it found out to contain several evolutionarily conserved binding sites for MEF2, CREB and SRF (Panel B), things that implies that c3orf58 is a direct or indirect target of MEF2. PCDH10 gene showed more than doubled expression within 6 hours (Panel C). RNAi knock-down of NPAS4 was used; rat hippocampal cultures were transducer with either control virus (blue) or NPAS4 RNAi (red) and as seen in Panel D NHE9 expression was slightly altered.
Conclusion: Activity-regulated genes are related to homozygous deletions in autism patients, since either their coding sequence is mutated, as happens in case of c3orf58 gene or their conserved DNA sequences are affected, as happens in case of NHE9 and PCDH10.
-
pedigree AU-3100 reveals an
Figure 1 - Tab 1 : 'overview' The authors compared the genetic makeup of four members of a consanguineous simplex family. The analyses focuses here on a region on chromosome 3 presenting identity by descent (IBD), which means that two or more individuals inherited that region from a common ancestor without recombination. In this case, the IBD is only present in the affected individual. In this region, a 886kb deletion was identified and will be studied more closely.
-
Homozygous deletion in AU-5101 removes 5′ region of RNF8and 3′ noncoding region of TBC1D228
A new deletion was identified in patient AU-5101 removes the 5'region of the genes RNF8, which was present in patient AU-3101. This protein is a transcriptional activator. The deletion also encompasses the 3' region of another gene, and could have an impact on its expression.
-
Homozygous deletions within regions of IBD that segregate with disease
Figure 2 Tab 1 : Overview The four figures show homozygous deletions identified using the SNP array. The upper part of each panel shows how many copies of each SNP the individual possesses, either none (deletion), one or two. The lower part of each panel shows the genes close to the deletions as well as the alignment between individuals.
-
y number data using the 500K SNP microarray and dCHIP (45) hidden Markov model inferred methodology aligned with the genotyping SNPs from (A)
Figure 1 - Tab 3 : 'Localisation of the deletion' Panel C zooms on the region of panel B that shows a copy number score of zero, which means that there is a homozygous deletion. The deletion is showed to be of 886kb in panel C. Both parents and the unaffected sibling have this deletion but on only one chromosome; this is shown by the copy number score of 1. On the contrary, the affected individual has a homologous deletion which is shown by the copy number score of 0.
The deletion affects the entire gene c3orf58, which codes for a protein present in the Golgi apparatus as well as the regulatory region of NHE9, which codes for an ion exchanger. This deletion can possibly affect the expression level of this protein.
-
SNP genotypes for each subje
Figure 1 Tab 2 : 'Identifying homozygous regions' In panel A, the authors present the genotyping data of each individual to study wether each SNP is homozygous or heterozygous. You can see that the affected individual presents a large region of homozygous SNPs which is also the 74cM IBD.
-
Homozygous deletion in AU-7001 within a protocadherin cluster proximal to PCDH10
Figure 2 Tab 2 : 'panel A' the Authors found a large deletion of 321kb in a cluster of genes coding for protocadherin proteins. These proteins are involved in cell adhesion. It is also worth noting that this deletion is close to PCDH10, where a deletion was identified in AU-3101.
-
Homozygous deletion in AU-5801 encompasses 5′ noncoding region of CNTN3
Figure 2 Tab 3 : 'Panel B and C' In two different individuals, deletions in the 5' noncoding region of genes were identified.A small deletion of 150kb was found in patient AU-5801 which deletes the upstream noncoding region of a gene coding for Contactin-3. This protein mediates cell surface interactions during the development of the nervous system.
A 47kb deletion was identified in patient AU-8101 in the 5' noncoding regions of SCN7A, which codes for a sodium channel protein.
Deletions in the 5' noncoding regions could impact the expression levels of these proteins.
-
-
scienceintheclassroom.org scienceintheclassroom.org
-
Fig. 3
Figure 3 :
Tab 1 : Panes : Each of these plots are made with a different set of data. In the first of the plots is made with the data concerning only the applications that published the most (i.e. the 0,1% best). The two last plots are also made only with the applications that published the least (i.e. 50 and 20% worse).
Tab 2 : Axis : The bottom axis of these plots is the percentile score of each application, that defines how the committee like the application (the lower the better). The y axis of these plots represents the relative percentile of citations that an application get per percentile score compared to publications near the 10% best. This means that the higher on the y axis it is, the more (or less) cited it has been compared to the number of citations that the publications around the 10% best got.
Tab 3 : Description : We can see in the 4 first plots that concern the applications that published the most that the more the application got a good rate from the committee, the more likely it will be cited. Although, this phenomenon is more obvious in the top 5 and 10%. In the two last plots, the curve is likely a straight horizontal line. It is especially obvious in the last plot. This means that the least an application publishes after a grant, the less it will be cited regardless of the rate of the committee.
-
Fig. 2
Figure 2 :
Tab 1 : Axis : The bottom axis is for both the plots the percentile score, that defines how the committee like the application (the lower the percentile, the better). For the first plot, the y axis is the residual number of citation an application gets after getting a grant. The residual number of citations is a statistical output that allows to generalise the number of citations by percentile score. For the second plot, the y axis is the residual number of publications a n application gets after getting a grant. The residual number of publications is a statistical output that allows to generalise the number of publications by percentile score.
Tab 2 : Description : On the first plot, we can see that the slope on the left is really steep. That shows that the committees can tell really effectively if an application has some potential. We can also see that the slope is changing around 60% of the percentile score. The authors tell that this is probably due to the ability of the program officers to detect high potential in applications that had a bad percentile score.
-
-
www.asmscience.org www.asmscience.org
-
MIC and MAC determination during the P. tetraurelia sexual cycle
def. maternal: recipient of gametic nucleus
-
-
onlinelibrary.wiley.com onlinelibrary.wiley.com
-
hypothetical pathways for scnRNA-mediated recruitment of the endonuclease in Paramecium
nucleotide modifications: possibly 6mA
-
The “genome-scanning” model, as envisioned in Paramecium
subtraction of MAC RNA from MIC small RNA = targets (IES) for excision
-
Nuclear dimorphism and DNA rearrangements in the ciliates Paramecium tetraurelia
tetraurelia: imprecise repeat v precise (splicing-like) IES excision
-
- Jul 2015
-
www.sciencemag.org www.sciencemag.org
-
Fig. 1 IAV requires the Ub-binding function of HDAC6 for capsid uncoating.
In this figure the authors showed the results obtained when they investigated HDAC6 role in IAV entry.
Panel A: The top part shows a cartoon of IAV entry that consists of multiple steps. The authors studied what step HDAC6 was critical during the virus host cell entry. Bottom part shows quantitative analysis graphs, each corresponding to the above step of IAV entry under investigation.
Panel A (endocytosis): The authors measured the amount of HA-stained spots per cell in wild type MEFs (WT MEF) compared to HADC5 Knock-out MEFs (HDAC6 KO). The third bar represents WT MEFs that were treated with dynasore (Dyn) in order to stop the endocytosis process. Depletion of HDAC6 did not influence the endocytosis step.
Panel A (HA-Acidification): In this step HDAC6 KO MEFS did not show any difference with respect to the wild type cells. It was concluded that HDAC6 does not influence this step of the virus infection.
Panel A (Fusion): fusion of capsid to endosome membrane is not affected by the lack of HDAC6 in knock-out MEF cells as shown in graph.
Panel A (Uncoating): Measuring the amount of cells with dispersed M1, the authors noticed that cells lacking HDAC6 dispersed less M1. This observation led to the conclusion that HDAC6 was fundamental for the uncoating process.
Panel A (vRNP import): Indeed, As vRNP import represents the step following uncoating, HDAC6 KO MEFs showed less NP-positive nuclei because the previous uncoating step was reduced.
In analyzing HA Acidification, Fusion, Uncoating and vRNP import, the authors used BafA1, which is a drug that is able to block uncoating, as a control for their experiment.
Panel B is a graphical representation of the 2 deacetylase catalytic domains of HDAC6 and the zinc-finger ubiquitin binding domain that is close to the C-terminus of the enzyme.
Panel C HDAC6 (WTr) (light gray bar) was a line of HDAC6 KO MEFs able to express again HDAC6. HDAC6 (HDm) (blue bar) was a line of HDAC6 KO MEFs expressing HDAC6 mutated in its deacetylase domain. HDAC6 (ZnFm) (purple bar) was a line of HDAC6 KO MEFs expressing HDAC6 with a mutation in its zinc-finger domain. The authors evaluated the effect of these mutations on the uncoating capacity of IAV. Depletion of deacetylase activity of HDAC6 did not influence the uncoating. Instead, loss of zinc-finger ubiquitin binding domain was detrimental for the uncoating.
The two asterisks on top of the purple bar indicate that this result is statistically significant, that is a result that is caused by something other than mere random chance.
Panel D: life in technicolor!!! These experiments were performed using the confocal microscopy technique. Fluorescent dye molecules bind to specific parts of the cell, so that only those parts are visualized. Fluorescent dyes are chemical compounds that re-emit light upon light excitation (light absorption).<br> The following video, created by Northwest Missouri State University, explains the basics of confocal microscopy. https://www.youtube.com/watch?v=jUAvneBhDcQ
The authors observed that after 2.5 hours from infection, M1 is dispersed inside WT MEFs, indicating that uncoating has occurred. Instead, M1 is confined inside vacuoles when cells lack HDAC6 and the mutant cells in which HDAC6 lacks the Zinc-finger ubiquitin binding region, meaning that the uncoating hasn't occurred.
-