9 Matching Annotations
  1. Oct 2020
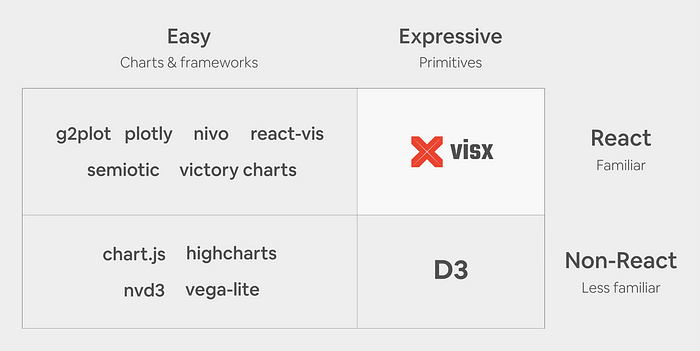
    1. In our research (Figure 1), we found that existing React visualization libraries are often high-level abstractions and optimized for ease of use (i.e., fewer lines of code) at the expense of expressivity. None offer the expressivity of D3 primitives and many don’t allow for the optimization we want in production because computation, animations, state management, styles, and rendering are all encapsulated.

      Comparison of data visualisation libraries:

  2. May 2020
    1. Hot Reloading refers to the ability to automatically update a running web application when changes are made to the application’s code.

      Hot Reloading is what provides a great experience with updating your Dash code inside the Jupyter Notebooks

    2. JupyterDash supports three approaches to displaying a Dash application during interactive development.

      3 display modes of Dash using Jupyter Notebooks:

      1. app.run_server(mode='external')
      2. app.run_server(mode='inline')
      3. app.run_server(mode='jupyterlab')
    3. # Run app and display result inline in the notebookapp.run_server(mode='inline')

      Moreover, you can display your Dash result inside a Jupyter Notebook using IPython.display.IFrame with this line:

      app.run_server(mode='inline')
      

    4. If running the server blocks the main thread, then it’s not possible to execute additional code cells without manually interrupting the execution of the kernel.JupyterDash resolves this problem by executing the Flask development server in a background thread. This leaves the main execution thread available for additional calculations. When a request is made to serve a new version of the application on the same port, the currently running application is automatically shut down first. This makes is possible to quickly update a running application by simply re-executing the notebook cells that define it.

      How Dash can run inside Jupyter Notebooks

    5. You can also try it out, right in your browser, with binder.

      Dash can be tried out inside a Jupyter Notebook right in your browser using binder.

    6. Then, copy any Dash example into a Jupyter notebook cell and replace the dash.Dash class with the jupyter_dash.JupyterDash class.

      To use Dash in Jupyter Notebooks, you have to import:

      from jupyter_dash import JupyterDash
      

      instead of:

      import dash
      

      Therefore, all the imports could look like that for a typical Dash app inside a Jupyter Notebook:

      import plotly.express as px
      from jupyter_dash import JupyterDash
      import dash_core_components as dcc
      import dash_html_components as html
      from dash.dependencies import Input, Output
      
  3. Apr 2020
    1. Most people are surprised to learn that of Plotly’s 50 engineers, the vast majority are React developers. This is because Dash is primarily a frontend library — there are far more lines of JavaScript (Typescript) than Python, R, or Julia code. Plotly only has 3 full-time Python developers, 2 full-time R developers, and 0 full-time Julia developers.

      Who works behind Plotly/Dash: 50 engineers:

      • 45 JavaScript (?)
      • 3 Python
      • 2 R
      • 0 Julia
  4. Mar 2020
    1. Currently Shiny is far more mature than Dash. Dash doesn’t have a proper layout tool yet, and also not build in theme, so if you are not familiar with Html and CSS, your application will not look good (You must have some level of web development knowledge). Also, developing new components will need ReactJS knowledge, which has a steep learning curve.

      Shiny > Dash:

      • Dash isn't yet as stabilised
      • Shiny has much more layout options, whereas in Dash you need to utilise HTML and CSS
      • developing new components in Dash needs ReactJS knowledge (not so easy)