14 Matching Annotations
- Sep 2021
-
medium.com medium.com
-
medium.com medium.com
-
animation in data visualization, while impressive and eye-catching, is a much lower priority than understanding how different chart types present data, how to properly design charts, understanding form in data visualization, and other aspects of data visualization practice.
-
-
- Mar 2021
-
www.fabiofranchino.com www.fabiofranchino.com
-
github.com github.comd3/d33
-
D3 4.0 is modular. Instead of one library, D3 is now many small libraries that are designed to work together. You can pick and choose which parts to use as you see fit.
-
To the consternation of some users, 3.x employed Unicode variable names such as λ, φ, τ and π for a concise representation of mathematical operations. A downside of this approach was that a SyntaxError would occur if you loaded the non-minified D3 using ISO-8859-1 instead of UTF-8. 3.x also used Unicode string literals, such as the SI-prefix µ for 1e-6. 4.0 uses only ASCII variable names and ASCII string literals (see rollup-plugin-ascii), avoiding encoding problems.
-
Microlibraries are easier to understand, develop and test. They make it easier for new people to get involved and contribute. They reduce the distinction between a “core module” and a “plugin”, and increase the pace of development in D3 features.
Tags
- d3.js
- contributing: low barrier to entry
- programming: use of special/mathematical symbols
- breaking change
- simpler code is easier to understand and verify that it is correct
- modularity
- sad/unfortunate conclusion
- microlibraries
- funny
- limitations leading to workarounds
- constant evolution/improvement of software/practices/solutions
- changes (software)
- change of behavior (software)
Annotators
URL
-
- Oct 2020
-
medium.com medium.com
-
suite of over 30 separate packages of React visualization primitives that fall into several categories (Figure 2). It is un-opinionated on state management, animation, and styling so it can integrate with any React codebase, and its emphasis on modularity (similar to D3) lets you keep your bundle sizes down by only using the packages you need to create your reusable chart library or a custom one-off chart.
Short definition of visx
-
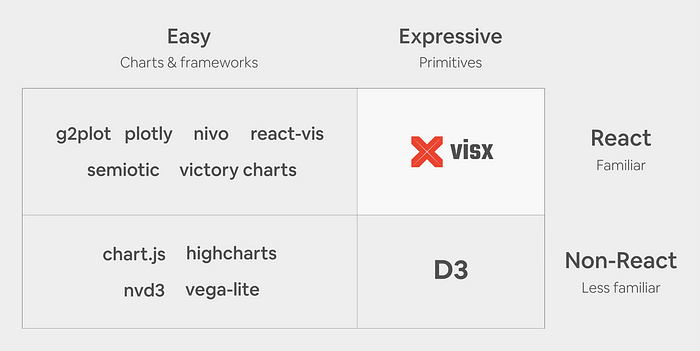
In our research (Figure 1), we found that existing React visualization libraries are often high-level abstractions and optimized for ease of use (i.e., fewer lines of code) at the expense of expressivity. None offer the expressivity of D3 primitives and many don’t allow for the optimization we want in production because computation, animations, state management, styles, and rendering are all encapsulated.
Comparison of data visualisation libraries:
-
because D3 and React both want to own DOM manipulation, we’ve found that it’s best to only use D3 for the math and React for the DOM because two mental models for updating the DOM opens the door for bugs to sneak in. However, using D3 solely for math means a significant amount of its (DOM-based) functionality is not available for use: selection.join, zoom, drag, brush, and transitions. Additionally, as mentioned above, D3 has its own learning curve and we would like developers to feel like they are writing native React code with standard APIs and familiar patterns.
You can use D3 inside a React app, but...
-
-
github.com github.com
Tags
Annotators
URL
-
- Jul 2020
-
github.com github.com
-
d3-flame-graph
Tags
Annotators
URL
-
- Apr 2020
-
hswolff.com hswolff.com