Some packages contain C and C++ code which needs to be compiled during package installation if packages are installed from source. CompilationConcurrency
This may be what prevent R from installing xgboost.
Some packages contain C and C++ code which needs to be compiled during package installation if packages are installed from source. CompilationConcurrency
This may be what prevent R from installing xgboost.
Sass
Define variables, such as colors (e.g. $primary: #337ab7) in Sass (styles.scss) then compile to css for web.
R library "bootstraplib" built on foundation of "sass".
Use "run_with_themer()" to get a live preview GUI for customizing bootstrap theme.
Also, use "shinyOptions(plot.autocolors=TRUE)" at top of app to get plot outputs that respect Dark Mode.
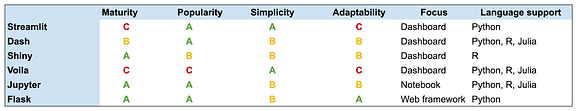
Here’s a table showing the tradeoffs:
Comparison of dashboard tech stack as of 10/2020:
Dablander, F. (2020, June 11). Interactive exploration of COVID-19 exit strategies. R-Bloggers. https://www.r-bloggers.com/interactive-exploration-of-covid-19-exit-strategies/
We save all of this code, the ui object, the server function, and the call to the shinyApp function, in an R script called app.R
The same basic structure for all Shiny apps:
ui object.server function.shinyApp function.---> examples <---
ui
UI example of a Shiny app (check the code below)
server
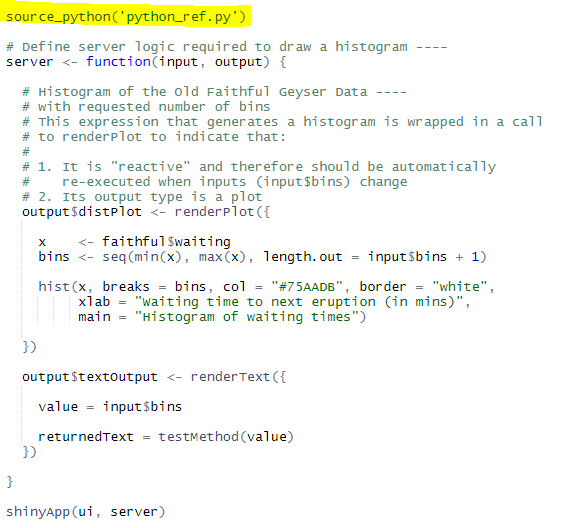
Server example of a Shiny app (check the code below):
renderPlotI want to get the selected number of bins from the slider and pass that number into a python method and do some calculation/manipulation (return: “You have selected 30bins and I came from a Python Function”) inside of it then return some value back to my R Shiny dashboard and view that result in a text field.
Using Python scripts inside R Shiny (in 6 steps):
textOutput("textOutput") (after plotoutput()).output$textOutput <- renderText({
}].
library(reticulate).source_python() function will make Python available in R:
reticulate package to R Environment and sourced the script inside your R code.Hit run.
Currently Shiny is far more mature than Dash. Dash doesn’t have a proper layout tool yet, and also not build in theme, so if you are not familiar with Html and CSS, your application will not look good (You must have some level of web development knowledge). Also, developing new components will need ReactJS knowledge, which has a steep learning curve.
Shiny > Dash:
You can host standalone apps on a webpage or embed them in R Markdown documents or build dashboards. You can also extend your Shiny apps with CSS themes, Html widgets, and JavaScript actions.
Typical tools used for working with Shiny
You can either create a one R file named app.R and create two seperate components called (ui and server inside that file) or create two R files named ui.R and server.R

Shiny Server: Running with a Proxy
The host parameter was introduced in Shiny 0.9.0.