10,000 Matching Annotations
  1. Sep 2025
    1. eLife Assessment

      In this valuable contribution, the authors present a novel and versatile probabilistic tool for classifying tracking behaviors and understanding parameters for different types of single-particle motion. The software package will be broadly applicable to single-particle tracking studies. The methodology has been convincingly tested by computational comparisons and experimental data, although the mathematical foundation for the hypothesis testing method can be further strengthened.

    2. Reviewer #1 (Public review):

      Summary:

      Weiss and co-authors presented a versatile probabilistic tool. aTrack helps in classifying tracking behaviors and understanding important parameters for different types of single particle motion types: Brwonian, Confined, or Directed motion. The tool can be used further to analyze populations of tracks and the number of motion states. This is a stand-alone software package, making it user-friendly for a broad group of researchers.

      Strengths:

      This manuscript presents a novel method for trajectory analysis.

      Comments on revisions:

      The authors have strengthened and improved the manuscript

    3. Reviewer #2 (Public review):

      Summary:

      The authors present a software package "aTrack" for identification of motion types and parameter estimation in single-particle tracking data. The software is based on maximum likelihood estimation of the time-series data given an assumed motion model and likelihood ratio tests for model selection. They characterized the performance of the software mostly on simulated data and showed that it is applicable to experimental data.

      Strengths:

      Although many tools exist in the single-particle tracking (SPT) field, this particular software package is developed using an innovative mathematical model and a probabilistic approach. It also provide inference of motion types, which are critical to answer biological questions in SPT experiments.

      (1) The authors adopt a novel mathematical framework, which is unique in the SPT field.

      (2) The authors have validated their method extensively using simulated tracks and compared to existing methods when appropriate.

      (3) The code is freely available

      Weaknesses:

      The authors did a good job during the revision to address most of the weaknesses in my (as well as other reviewer's) first round of review. Nevertheless, the following issue is still not fully addressed.<br /> The hypothesis testing method presented here lacks rigorous statistical foundation. The authors improved on this point after the revision, but in their newly added SI section "Statistical Test", only justified their choices using "hand-waving" arguments (i.e. there is not a single reference to proper statistical textbooks or earlier works in this important section). I understand that sometimes mathematical rigor comes later after some intuition-guided choices of critical parameters seems to work, but nevertheless need to point it out as a remaining weakness.

    4. Author response:

      The following is the authors’ response to the original reviews.

      Reviewer #1 (Public Review): 

      Summary: 

      Weiss and co-authors presented a versatile probabilistic tool. aTrack helps in classifying tracking behaviors and understanding important parameters for different types of single particle motion types: Brownian, Confined, or Directed motion. The tool can be used further to analyze populations of tracks and the number of motion states. This is a stand-alone software package, making it user-friendly for a broad group of researchers. 

      Strengths: 

      This manuscript presents a novel method for trajectory analysis. 

      Weaknesses: 

      (1) In the results section, is there any reason to choose the specific range of track length for determining the type of motion? The starting value is fine, and would be short enough, but do the authors have anything to report about how much is too long for the model? 

      We chose to test the range of track lengths (five-to-hundreds of steps) to cover the broad range of scenarios arising from single proteins or fluorophores to brighter objects with more labels.  While there is no upper-limit per se, the computation time of our method scales linearly with track length, 100 time-points takes ~2 minutes to run on a standard consumer-level desktop CPU. We have added the following sentence to note the time-cost with trajectory length:  

      “The recurrent formula enables our model computation time to scale linearly with the number of time points.”

      (2) Robustness to model mismatches is a very important section that the authors have uplifted diligently. Understanding where and how the model is limited is important. For example, the authors mentioned the limitation of trajectory length, do the authors have any information on the trajectory length range at which this method works accurately? This would be of interest to readers who would like to apply this method to their own data. 

      We agree that limitations are important to estimate, and trajectory length is an important consideration when choosing how to analyze a dataset. We report the categorization certainty, i.e. the likelihood differences, for a range of track lengths (Fig. 2 a,c, Fig. 3c-d, and Fig. 4 c,g.).

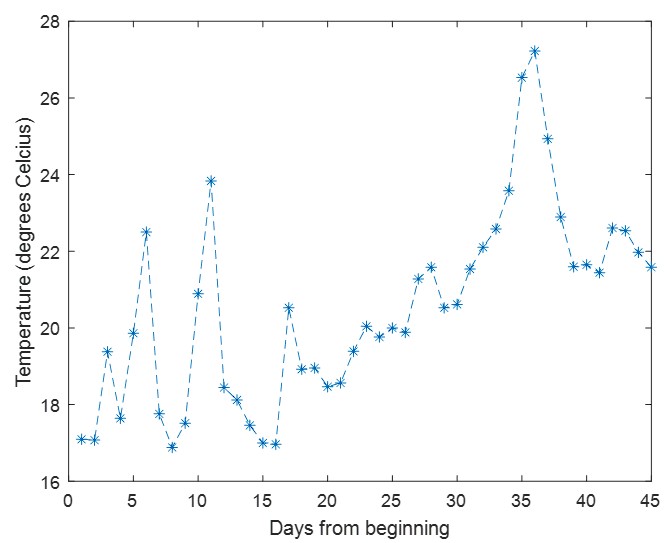
      For example, here are the key plots from Fig. 2 quantifying the relative likelihoods, where being within the light region is necessary. The light areas represent a useful likelihood ratio.

      We only performed analysis up to track lengths of 600 time steps but parameter estimations and significance can only improve when increasing the track length as long as the model assumptions are verified. The broader limitations and future opportunities for new methods are now expanded upon in the discussion, for example switching between states and model and state and model ambiguities (bound vs very slow diffusion vs very slow motion).

      (3) aTrack extracts certain parameters from the trajectories to determine the motion types. However, it is not very clear how certain parameters are calculated. For example, is the diffusion coefficient D calculated from fitting, and how is the confinement factor defined and estimated, with equations? This information will help the readers to understand the principles of this algorithm.

      We apologize for the confusion. All the model parameters are fit using the maximum likelihood approach. To make this point clearer in the manuscript, we have made three changes:

      (1) We modified the following sentence to replace “determined” with "fit”:

      “Finally, Maximum Likelihood Estimation (MLE) is used to fit the underlying parameter value”

      (2) We added the following sentence in the main text :

      “In our model, the velocity is the characteristic parameter of directed motion and the confinement factor represents the force within a potential well. More precisely, the confinement factor $l$ is defined such that at each time step the particle position is updated by $l$ times the distance particle/potential well center (see the Methods section for more details).”.

      (3) We have added a new section in the methods, called Fitting Method, where we have added the explanation below:

      “For the pure Brownian model, the parameters are the diffusion coefficient and the localization error. For the confinement model, the parameters are the diffusion coefficient, the localization error, confinement factor, and the diffusion coefficientof the potential well. For the directed model, the parameters are the diffusion coefficient, the localization error, the initial velocity and the acceleration variance.

      These parameters are estimated using the maximum likelihood approach which consists in finding the parameters that maximize the likelihood. We realize this fitting step using gradient descent via a TensorFlow model. All the estimates presented in this article are obtained from a single set of initial parameters to demonstrate that the convergence capacity of aTrack is robust to the initial parameter values.”

      (4) The authors mentioned the scenario where a particle may experience several types of motion simultaneously. How do these motions simulated and what do they mean in terms of motion types? Are they mixed motion (a particle switches motion types in the same trajectory) or do they simply present features of several motion types? It is not intuitive to the readers that a particle can be diffusive (Brownian) and direct at the same time. 

      In the text, we present an example where one can observe this type of motion to help the reader understand when this type of motion can be met: “Sometimes, particles undergo diffusion and directed motion simultaneously, for example, particles diffusing in a flowing medium (Qian 1991).”

      This is simulated by the addition of two terms affecting the hidden position variable before adding a localization term to create the observed variable. In the analysis, this manifests as non-zero values for the diffusion coefficient and the linear velocity. For example, Figure 4g and the associated text, where a single particle moves with a directed component and a Brownian diffusion component at each step.

      We did not simulate transitions between types of motion. Switching is not treated by this current model; however, this limitation is described in the discussion and our team and others are currently working on addressing this challenge.

      Reviewer #2 (Public Review): 

      Summary: 

      The authors present a software package "aTrack" for identification of motion types and parameter estimation in single-particle tracking data. The software is based on maximum likelihood estimation of the time-series data given an assumed motion model and likelihood ratio tests for model selection. They characterized the performance of the software mostly on simulated data and showed that it is applicable to experimental data. 

      Strengths: 

      A potential advantage of the presented method is its wide applicability to different motion types. 

      Weaknesses: 

      (1) There has been a lot of similar work in this field. Even though the authors included many relevant citations in the introduction, it is still not clear what this work uniquely offers. Is it the first time that direct MLE of the time-series data was developed? Suggestions to improve would include (a) better wording in the introduction section, (b) comparing to other popular methods (based on MSD, step-size statistics (Spot-On, eLife 2018;7:e33125), for example) using the simulated dataset generated by the authors, (c) comparing to other methods using data set in challenges/competitions (Nat. Comm (2021) 12:6253).  

      We thank the reviewer for this suggestion and agree that the explanation of the innovative aspects of our method in the introduction was not clear enough. We have now modified the introduction to better explain what is improved here compared to previous approaches.

      “The main innovations of this model are: 1) it uses analytical recurrence formulas to perform the integration step for complex motion, improving speed and accuracy; 2) it handles both confined and directed motion; 3) anomalous parameters, such as the center of the potential well and the velocity vector are allowed to change through time to better represent tracks with changing directed motion or confinement area; and lastly 4) for a given track or set of tracks, aTrack can determine whether tracks can be statistically categorized as confined or directed, and the parameters that best describe their behavior, for example, diffusion coefficient, radius of confinement, and speed of directed motion.”

      Regarding alternatives, we compare our method in the text to the best-performing algorithm of the

      2021 Anomalous Diffusion (AnDi) Challenge challenge mentioned by the reviewer in Figure 6 (RANDI, Argun et al, arXiv, 2021, Muñoz-Gil et al, Nat Com. 2021). Notably, both methods performed similarly on fBm, but ours was more robust in cases where there were small differences between the process underlying the data and the model assumptions, a likely scenario in real datasets. Regarding Spot-On, this was not mentioned as it only deals with multiple populations of Brownian diffusers, preventing a quantitative comparison.

      (2) The Hypothesis testing method presented here has a number of issues: first, there is no definition of testing statistics. Usually, the testing statistics are defined given a specific (Type I and/or Type II) error rate. There is also no discussion of the specificity and sensitivity of the testing results (i.e. what's the probability of misidentification of a Brownian trajectory as directed? etc).

      We now explain our statistical approach and how to perform hypothesis testing with our metric in a new supplementary section, Statistical test. 

      We use the likelihood ratio as a more conservative alternative to the p-value. In Fig S2, we show that our metric is an upper bound of the p-value and can be used to perform hypothesis testing with a chosen type I error rate. 

      Related, it is not clear what Figure 2e (and other similar plots) means, as the likelihood ratio is small throughout the parameter space. Also, for likelihood ratio tests, the authors need to discuss how model complexity affects the testing outcome (as more complex models tend to be more "likely" for the data) and also how the likelihood function is normalized (normalization is not an issue for MLE but critical for ratio tests). 

      We present the likelihood ratio as an upper bound of the p-value. Therefore, we can reject the null hypothesis if it is smaller than a given threshold, e.g. 0.05, but this number should be decreased if multiple tests are performed. The colorscale we show in the figure is meant to highlight the working range (light), and ambiguous range (dark) of the method.

      As the reviewer mentions, we expect the alternative hypothesis to result in higher likelihoods than the simpler null hypothesis for null hypothesis tracks, but, as seen in the Fig S2, the likelihood ratio of a dataset corresponding to the null hypothesis is strongly skewed toward its upper limit 1. This means that for most of the tracks, the likelihood is not (or little) affected by the model complexity. The likelihoods of all the models are normalized so their integrals over the data equals 1/A with A the area of the field of view which is independent of the model complexity.

      (3) Relating to the mathematical foundation (Figure 1b). The measured positions are drawn as direct arrows from the real position states: this infers instantaneous localization. In reality, there is motion blur which introduces a correlation of the measured locations. Motion blur is known to introduce bias in SPT analysis, how does it affect the method here? 

      The reviewer raises an important point as our model does not explicitly consider motion blur. We have now added a paragraph that presents how our model performs in case of motion blur in the section called Robustness to model mismatches. This section and the corresponding new Supplemental Fig. S7 demonstrate that the estimated diffusion length is accurate so long as the static localization error is higher than the dynamic localization error. If the dynamic localization error is higher, our model systematically underestimates the diffusion length by a factor 0.81 = (2/3)<sup>0.5</sup> which can be corrected for with an added post-processing step.  

      (4) The authors did not go through the interpretation of the figure. This may be a matter of style, but I find the figures ambiguous to interpret at times.  

      We thank the reviewer for their feedback on improving the readability. To avoid overly repetitive and lengthy sections of text, we have opted for a concise approach. This allows us to present closely related panels at the same point in the text, while not ignoring important variations and tests. Considering this feedback and the reviewers, we have added more information and interpretation throughout our manuscript to improve interpretability.

      (5) It is not clear to me how the classification of the 5 motion types was accomplished. 

      We have modified the specific text related to this figure to describe an illustrative example to show how one could use aTrack on a dataset where not that much is known: First, we present the method to determine the number of states; second, we verify the parameter estimates correspond to the different states.  

      Classifying individual tracks is possible. While not done in the section corresponding to Fig. 5, this is done in Fig. 7 and a new supplementary plot, Fig. S9b (shown below). In brief, this is accomplished with our method by computing the likelihood of each track given each state. The probability that a given track is in state k equals the likelihood of the track given the state divided by the sum of the likelihoods given the different states. 

      (6) Figure 3. Caption: what is ((d_{est}-0.1)/0.1)? Also panel labeled as "d" should be "e". 

      Thank you for bringing these errors to our attention, the panel and caption have been corrected.

      Reviewer #3 (Public Review): 

      Summary: 

      In this work, Simon et al present a new computational tool to assess non-Brownian single-particle dynamics (aTrack). The authors provide a solid groundwork to determine the motion type of single trajectories via an analytical integration of multiple hidden variables, specifically accounting for localization uncertainty, directed/confined motion parameters, and, very novel, allowing for the evolution of the directed/confined motion parameters over time. This last step is, to the best of my knowledge, conceptually new and could prove very useful for the field in the future. The authors then use this groundwork to determine the motion type and its corresponding parameter values via a series of likelihood tests. This accounts for obtaining the motion type which is statistically most likely to be occurring (with Brownian motion as null hypothesis). Throughout the manuscript, aTrack is rigorously tested, and the limits of the methods are fully explored and clearly visualised. The authors conclude with allowing the characterization of multiple states in a single experiment with good accuracy and explore this in various experimental settings. Overall, the method is fundamentally strong, wellcharacterised, and tested, and will be of general interest to the single-particle-tracking field. 

      Strengths: 

      (1) The use of likelihood ratios gives a strong statistical relevance to the methodology. There is a sharp decrease in likelihood ratio between e.g. confinement of 0.00 and 0.05 and velocity of 0.0 and 0.002 (figure 2c), which clearly shows the strength of the method - being able to determine 2nm/timepoint directed movement with 20 nm loc. error and 100 nm/timepoint diffusion is very impressive. 

      We apologize for the confusion, the directed tracks in Fig 2 have no Brownian-motion component, i.e. D=0. We have made this clearer in the main text. Specifically, this section of the text refers to a track in linear motion with 2 nm displacements per step. With 70 time points (69 steps), a single particle which moved from 138 nm with a localization error of 20 nm (95% uncertainty range of 80 nm) can be statistically distinguished from slow diffusive motion.

      In Fig. 4g, we explore the capabilities of our method to detect if a diffusive particle also has a directed motion component. 

      (2) Allowing the hidden variables of confinement and directed motion to change during a trajectory (i.e. the q factor) is very interesting and allows for new interpretations of data. The quantifications of these variables are, to me, surprisingly accurate, but well-determined. 

      (3) The software is well-documented, easy to install, and easy to use. 

      Weaknesses: 

      (1) The aTrack principle is limited to the motions incorporated by the authors, with, as far as I can see, no way to add new analytical non-Brownian motion. For instance, being able to add a dynamical stateswitching model (i.e. quick on/off switching between mobile and non-mobile, for instance, repeatable DNA binding of a protein), could be of interest. I don't believe this necessarily has to be incorporated by the authors, but it might be of interest to provide instructions on how to expand aTrack.  

      We agree that handling dynamic state switching is very useful and highlight this potential future direction in the discussion. The revised text reads:

      “An important limitation of our approach is that it presumes that a given track follows a unique underlying model with fixed parameters. In biological systems, particles often transition from one motion type to another; for example, a diffusive particle can bind to a static substrate or molecular motor (46). In such cases, or in cases of significant mislinkings, our model is not suitable. However, this limitation can be alleviated by implicitly allowing state transitions with a hidden Markov Model (15) or alternatives such as change-point approaches (30, 47, 48), and spatial approaches (49).”

      (2) The experimental data does not very convincingly show the usefulness of aTrack. The authors mention that SPBs are directed in mitosis and not in interphase. This can be quantified and studied by microscopy analysis of individual cells and confirming the aTrack direction model based on this, but this is not performed. Similarly, the size of a confinement spot in optical tweezers can be changed by changing the power of the optical tweezer, and this would far more strongly show the quantitative power of aTrack. 

      We agree with the reviewer and have revised the biological experiment section significantly to better illustrate the potential of aTrack in various use cases.

      Now, we show an experiment to quantify the effect of LatA, an actin inhibitor, on the fraction of directed tracks obtained with aTrack. We find that LatA significantly decreases directed motion while a LatA-resistant mutant is not affected (Fig7a-c).

      As suggested by the reviewer, we have expanded the optical tweezer experiment by varying the laser power. As expected, increasing the laser power decreases the confinement radius.

      (3) The software has a very strict limit on the number of data points per trajectory, which is a user input. Shorter trajectories are discarded, while longer trajectories are cut off to the set length. It is not explained why this is necessary, and I feel it deletes a lot of useful data without clear benefit (in experimental conditions).

      We thank the reviewer for this recommendation; we have now modified the architecture of our model to enable users to consider tracks of multiple lengths. Note that the computation time is proportional to the longest track length times the number of tracks.  

      Reviewer #2 (Recommendations For The Authors): 

      Develop a better mathematical foundation for the likelihood ratio tests. 

      We added more explanation of the likelihood ratio tests and their interpretation a new section entitled Statistical test in the supplementary information to address this recommendation.

      Place this work in clearer contexts. 

      We have now revised the introduction to better contextualize this work.

      Improve manuscript clarity. 

      Based on reviewer feedback and input from others, we have addressed this point throughout the article to improve readability.

      Make the code available. 

      The code is available on https://github.com/FrancoisSimon/aTrack, now including code for track generation.

      Reviewer #3 (Recommendations For The Authors): 

      (1) I believe the underlying model presented in Figure 1 is of substantial impact, especially when considering it as a simulation tool. I would suggest the authors make their method also available as a simulator (as far as I can tell, this is not explicitly done in their code repository, although logically the code required for the simulator should already be in the codebase somewhere). 

      Thank you for this suggestion, the simulation scripts are now on the Github repository together with the rest of the analysis method. https://github.com/FrancoisSimon/aTrack

      (2) The authors should explore and/or discuss the effects of wrong trajectory linking to their method. Throughout the text, fully correct trajectory linking is assumed and assessed, while in real experiments, it is often the case that trajectory linking is wrong, e.g. due to blinking emitters, imaging artefacts, high-density localizations, etc etc. This would have a major impact on the accuracy of trajectories, and it is extremely relevant to explore how this is translated to the output of aTrack. 

      As the reviewer notes, our current model does not account for track mislinking. This limits the method to data with lower fluorophore-densities, which is the typical use-case for SPT. We have added a brief description of the issue into the discussion of limitations.  

      (3) aTrack only supports 2D-tracking, but I don't believe there is a conceptual reason not to have this expanded to three dimensions. 

      The stand-alone software is currently limited to 2D tracks, however, the aTrack Python package works for any number of dimensions (i.e. 1-3). Note that since the current implementation assumes a single localization error for all axes, more modifications may be required for some types of 3D tracking. See https://github.com/FrancoisSimon/aTrack for more details about aTrack implementations.

      (4) Crucial information is missing in the experimental demonstrations. Especially in the NP-bacteria dataset, I miss scalebars, and information on the number of tracks. It is not explained why 5 different states are obtained - especially because I would naively expect three states: immobile NPs (e.g. stuck to glass), diffusing NPs, and NPs attached to bacteria, and thus directed. Figure 7e shows three diffusive states (why more than one?), no immobile states (why?), and two directed states (why?). 

      We thank the reviewer for pointing out these issues. We have now added scalebars and more experimental details to the figure and text as well as modifying the plot to more clearly emphasize the directed nanoparticles that are attached to cells from the diffusive nanoparticles.  

      Likely, our focal plane was too high to see the particles stuck on glass. The multiple diffusive states may be caused by different sizes of nanoparticle complexes, the multiple directed states can be caused by the fact that directed motion of the cell-attached-nanoparticles occasionally shows drastic changes of orientations. We have also clarified in the text how multiple states can help handle a heterogeneous population as was shown by Prindle et al. 2022, Microbiol Spectr. The characterization and phenotyping of microbial populations by nanoparticle tracking was published in Zapata et al. 2022, Nanoscale. 

      (5) I don't think I agree that 'robustness to model mismatches' is a good thing. Very crudely, the fact that aTrack finds fractional Brownian motion to be normal Brownian motion is technically a downside - and this should be especially carefully positioned if (in the future) a fractional Brownian motion model would be added to aTrack. I think that the author's point can be better tested by e.g. widely varying simulated vs fitted loc precision/diffusion coefficient (which are somewhat interchangeable).

      In this context, our intention in describing the robustness to “model mismatches” refers to classifying subdiffusion as subdiffusive irrespective of the exact subdiffusion motion physics (as well as superdiffusion), that is, to use aTrack how MSD analysis is often deployed. This is important in the context of real-world applications where simple mathematical models cannot perfectly represent real tracks with greater complexity. 

      Inevitably, some fraction of tracks with a pure Brownian motion may appear to match with a fractional Brownian motion, and thus statistical tests are needed to determine if this is significant. In general, aTrack finds fBm to be normal Brownian motion only when the anomalous coefficient is near 1, i.e. when the two models are indeed the same. When analysing fBm tracks with anomalous coefficients of 0.5 or 1.5, aTrack find that these tracks are better explained by our confined diffusion model or directed motion model, respectively (Please see Fig. 6a, copied below). 

      To better clarify our objective, the section now has a brief introduction that reads:

      “One of the most important features of a method is its robustness to deviations from its assumptions. Indeed, experimental tracking data will inevitably not match the model assumptions to some degree, and models need to be resilient to these small deviations.”  

      Smaller points: 

      (1) It is not clear what a biological example is of rotational diffusion. 

      We modified the text to better explain the use of rotational diffusion.

      (2) The text in the section on experimental data should be expanded and clarified, there currently are multiple 'floating sentences' that stop halfway, and it does not clearly describe the biological relevance and observed findings.  

      We thank the reviewer for pointing out this issue. We have reworked the experimental section to better and more clearly explain the biological relevance of the findings.

      (3) Caption of figure 3: 'd' should be 'e'. 

      (4) Caption of Figure 7: log-likelihood should be Lconfined - Lbrownian, I believe. 

      (5) Equation number missing in SI first sentence. 

      (6) Supplementary Figure 1 top part access should be Lc-Lb instead of Ld-Lb. 

      We have made these corrections, thank you for bringing them to our attention.

    1. eLife Assessment

      The paper reports valuable findings about the mechanism of regulation of the heat shock response in plants that acts as a brake to prevent hyperactivation of the stress response, which have theoretical or practical implications for a subfield. The study presented by the authors provides solid methods, data, and analysis that broadly support the claims. This report presents helpful information regarding new spliced HSFs forms in Arabidopsis that highlights key information in the understanding of heat stress and plant growth.

    2. Reviewer #2 (Public review):

      Summary:

      The authors report that Arabidopsis short HSFs S-HsfA2, S-HsfA4c, and S-HsfB1 confer extreme heat. They have truncated DNA binding domains that bind to a new heat-regulated element. Considering Short HSFA2, the authors have highlighted the molecular mechanism by which S-HSFs prevent HSR hyperactivation via negative regulation of HSP17.6B. The S-HsfA2 protein binds to the DNA binding domain of HsfA2, thus preventing its binding to HSEs, eventually attenuating HsfA2-activated HSP17.6B promoter activity. This report adds insights to our understanding of heat tolerance and plant growth.

      Strengths:

      (1) The manuscript represents ample experiments to support the claim.

      (2) The manuscript covers a robust number of experiments and provides specific figures and graphs to in support of their claim.

      (3) The authors have chosen a topic to focus on stress tolerance in changing environment.

      (4) The authors have summarized the probable mechanism using a figure.

      Weaknesses:

      Quite minimum

      (1) Fig. 3. the EMSA to reveal binding

      (2) Alignment of supplementary figures 6-7.

    3. Author response:

      The following is the authors’ response to the original reviews.

      Reviewer #1 (Public review):

      In the present work, Chen et al. investigate the role of short heat shock factors (S-HSF), generated through alternative splicing, in the regulation of the heat shock response (HSR). The authors focus on S-HsfA2, an HSFA2 splice variant containing a truncated DNA-binding domain (tDBD) and a known transcriptional-repressor leucin-rich domain (LRD). The authors found a two-fold effect of S-HsfA2 on gene expression. On the one hand, the specific binding of S-HsfA2 to the heat-regulated element (HRE), a novel type of heat shock element (HSE), represses gene expression. This mechanism was also shown for other S-HSFs, including HsfA4c and HsfB1. On the other hand, S-HsfA2 is shown to interact with the canonical HsfA2, as well as with a handful of other HSFs, and this interaction prevents HsfA2 from activating gene expression. The authors also identified potential S-HsfA2 targets and selected one, HSP17.6B, to investigate the role of the truncated HSF in the HSR. They conclude that S-HsfA2-mediated transcriptional repression of HSP17.6B helps avoid hyperactivation of the HSR by counteracting the action of the canonical HsfA2.

      The manuscript is well written and the reported findings are, overall, solid. The described results are likely to open new avenues in the plant stress research field, as several new molecular players are identified. Chen et al. use a combination of appropriate approaches to address the scientific questions posed. However, in some cases, the data are inadequately presented or insufficient to fully support the claims made. As such, the manuscript would highly benefit from tackling the following issues:

      (1) While the authors report the survival phenotypes of several independent lines, thereby strengthening the conclusions drawn, they do not specify whether the presented percentages are averages of multiple replicates or if they correspond to a single repetition. The number of times the experiment was repeated should be reported. In addition, Figure 7c lacks the quantification of the hsp17.6b-1 mutant phenotype, which is the background of the knock-in lines. This is an essential control for this experiment

      For the seedling survival rates and gene expression levels, we added statistical analysis based on at least two independent experiments. Figure 6E of the revised manuscript shows the phenotypes of the WT, hsp17.6b-1, HSP17.6B-KI, and HSP17.6B-OE plants and the statistical analysis of their seedling survival rates after heat exposure.

      (2) In Figure 1c, the transcript levels of HsfA2 splice variants are not evident, as the authors only show the quantification of the truncated variant. Moreover, similar to the phenotypes discussed above, it is unclear whether the reported values are averages and, if so, what is the error associated with the measurements. This information could explain the differences observed in the rosette phenotypes of the S-HsfA2-KD lines. Similarly, the gene expression quantification presented in Figures 4 and 5, as well as the GUS protein quantification of Figure 3F, also lacks this crucial information.
      RT‒qPCR analysis of the expression of these genes from at least two independent experiments was performed. We also added these missing information to the figure legends.

      (3) The quality of the main figures is low, which in some cases prevents proper visualization of the data presented. This is particularly critical for the quantification of the phenotypes shown in Figure 1b and for the fluorescence images in Figures 4f and 5b. Also, Figure 9b lacks essential information describing the components of the performed experiments.

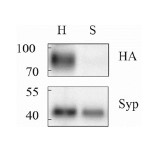
      We apologize; owing to the limitations of equipment and technology, we will attempt to obtain high-quality images in the future. A detailed description of Figure 9b is provided in the methods section.

      (4) Mutants with low levels of S-HsfA2 yield smaller plants than the corresponding wild type. This appears contradictory, given that the proposed role of this truncated HSF is to counteract the growth repression induced by the canonical HSF. What would be a plausible explanation for this observation? Was this phenomenon observed with any of the other tested S-HSFs?

      We found that the constitutive expression of S-HsfA2 inhibits Arabidopsis growth. Considering this, Arabidopsis plants do not produce S-HsfA2 under normal conditions to avoid growth inhibition. However, under heat stress, Arabidopsis plants generate S-HsfA2, which contributes to heat tolerance and growth balance. In the revised manuscript, we provided supporting data indicating that S-HsfA4c-GFP or S-HsfB1-RFP constitutive expression confers Arabidopsis extreme heat stress sensitivity but inhibits root growth (Supplemental Figure S8). Therefore, this phenomenon is also observed in S-HsfA4c-GFP or S-HsfB1-RFP.

      (5) In some cases, the authors make statements that are not supported by the results:<br /> (i) the claim that only the truncated variant expression is changed in the knock-down lines is not supported by Figure 1c;

      In three S-HsfA2-KD lines, RT‒PCR splicing analysis revealed that HsfA2-II but not HsfA2-III is easily detected. In the revised manuscript, we added RT‒qPCR analysis, and the results revealed that the abundance of HsfA2-III and HsfA2-II but not that of the full-length HsfA2 mRNA significantly decreased under extreme heat (Figure 1C). Considering that HsfA2-III but not HsfA2-II is a predominant splice variant under extreme heat (Liu et al., 2013), S-HsfA2-KD may lead to the knockdown of alternative HsfA2 splicing transcripts, especially HsfA2-III.

      (ii) the increase in GUS signal in Figure 3a could also result from local protein production;

      We included this possibility in the results analysis.

      (iii) in Figure 6b, the deletion of the HRE abolishes heat responsiveness, rather than merely altering the level of response; and

      In the revised manuscript, we added new data concerning the roles of HREs and HSEs in the response of the HSP17.6B promoter to heat stress (Figure 6A). These results suggest that the HRE and HSE elements are responsible for the response of the HSP17.6B promoter to heat stress and that the HRE negatively regulates the HSP17.6B promoter at 37°C, whereas the HSE is positive at 42°C.

      (iv) the phenotypes in Figure 8b are not clear enough to conclude that HSP17.6B overexpressors exhibit a dwarf but heat-tolerant phenotype.

      When grown in soil, the HSP17.6B-OE seedlings presented a dwarf phenotype compared with the WT control. Heat stress resulted in browning of the WT leaves, but the leaves of the HSP17.6B-OE plants remained green, suggesting that the HSP17.6B-OE seedlings also presented a heat-tolerant phenotype in the soil. These results are qualitative but not quantitative experimental data; therefore, the conclusions are adjusted in the abstract and results sections.

      Reviewer #2 (Public review):

      Summary:

      The authors report that Arabidopsis short HSFs S-HsfA2, S-HsfA4c, and S-HsfB1 confer extreme heat. They have truncated DNA binding domains that bind to a new heat-regulated element. Considering Short HSFA2, the authors have highlighted the molecular mechanism by which S-HSFs prevent HSR hyperactivation via negative regulation of HSP17.6B. The S-HsfA2 protein binds to the DNA binding domain of HsfA2, thus preventing its binding to HSEs, eventually attenuating HsfA2-activated HSP17.6B promoter activity. This report adds insights to our understanding of heat tolerance and plant growth.

      Strengths:

      (1) The manuscript represents ample experiments to support the claim.

      (2) The manuscript covers a robust number of experiments and provides specific figures and graphs in support of their claim.

      (3) The authors have chosen a topic to focus on stress tolerance in a changing environment.

      Weaknesses:

      (1) One s-HsfA2 represents all the other s-Hsfs; S-HsfA4c, and S-HsfB1. s-Hsfs can be functionally different. Regulation may be positive or negative. Maybe the other s-hsfs may positively regulate for height and be suppressed by the activity of other s-hsfs.

      In this study, we used S-HsfA2, S-HsfA4c, and S-HsfB1 data to support the view that “splice variants of HSFs generate new plant HSFs”. We also noted that S-HsfA2 cannot represent a traditional S-HSF. S-HsfA4c and S-HsfB1 may have functions other than S-HsfA2 because of their different C-terminal motifs or domains. Different S-HSFs might participate in the same biological process, such as heat tolerance, through the coregulation of downstream genes. We added this information to the discussion section.

      (2) Previous reports on gene regulations by hsfs can highlight the mechanism.

      In the introduction section, we included these references concerning HSFs and S-HSFs.

      (3) The Materials and Methods section could be rearranged so that it is based on the correct flow of the procedure performed by the authors.

      The materials and methods and results sections are arranged in the logical order.

      (4) Graphical representation could explain the days after sowing data, to provide information regarding plant growth.

      The days after sowing (DAS) for the age of the Arabidopsis seedlings are stated in the Materials and Methods section and figure legends.

      (5) Clear images concerning GFP and RFP data could be used.

      We provided high-quality images of S-HsfA2-GFP and the GFP control (Figure 3 in the revised manuscript).

      Reviewing Editor comments:

      The EMSA shown in Figures 2, 3, 4, and 5, which are critical to support the manuscript's claims, are of poor quality, without any repeats to support. In addition, there is not much information about how these EMSA were done. I suggest including better EMSA in a new version of this manuscript.

      Thank you for your suggestion. We added the missing information, including the detailed EMSA method and experiment repeat times in the methods section and figure legends. We provide high-quality images of HRE probes binding to nuclear proteins (Figure 4E).

      Reviewer  #1 (Recommendations for the authors):

      (1) The paper is overall well-written, but it could greatly benefit from reorganizing the results subsections. Currently, there are entire subsections dedicated to supplementary figures (e.g., lines 177-191) and main figures split into different subsections (e.g., lines 237-246). It is recommended to organize all the information related to a main figure into a single subsection and to incorporate the description of the corresponding supplementary figures. This would imply a general reorganization of the figures, moving some information to the supplementary data (for instance, the data in Figure 4 could be supplementary to Figure 5) and vice versa (Supplementary Figure 4 should be incorporated into main Figure 2, as it presents very important results). Also, Figures 7 and 8 would be better presented if merged into a single figure/subsection.

      Thank you for your suggestion. We have merged some figures into a single figure according to the main information. In the current version, there are 8 main figures, which includes a new figure.

      (2) Survival phenotypes vary widely, making reliable statistical analysis challenging. The chlorophyll and fresh weight quantifications presented in figures such as Figure 5 appear to effectively describe the phenomenon and allow for statistical comparisons. Figures 1 and 7 would benefit from including these measurements if the variability in survival percentages is too high to calculate statistical differences reliably. Also, in Figure 8, all chlorophyll measurements should be normalized to fresh weight rather than seedling number due to the dwarfism observed in the overexpressor lines.

      Thank you for pointing out your concerns. We added statistical analysis based on at least two independent experiments, including Figures 1 and 7, to the original manuscript. In Figure 8 in the original manuscript, chlorophyll measurements were normalized to fresh weight.

      (3) Typos: in Figure 3a it should be "min" not "mim"; in Supplementary Figure 3, the GFP and merge images are swapped.

      We apologize for these errors, and we have corrected them. Supplementary Figure 3 was replaced with new images and was included in Figure 3 in the revised manuscript.

      Reviewer  #2 (Recommendations for the authors):

      (1) The abstract states "How this process is prevented to ensure proper plant growth has not been determined." The authors can be the first to do this, by adding graphical data on the height difference in hSfA2-arabidopis and wild-type Arabidopsis.

      Thank you and agree with you. We have added this information to the new working model (Figure 8)

      (2) The authors claim that Arabidopsis S-HsfA2, S-HsfA4c, and S-HsfB1; but have used S-HsfA2 to understand the action. The mechanisms being unknown for S-HsfA4c, and S-HsfB1 cannot be represented by S-HsfA2 to represent the mechanism.

      Thank you for your valuable comments. In this study, we used S-HsfA2, S-HsfA4c, and S-HsfB1 data to support the view that “splice variants of HSFs generate new plant HSFs”. We also noted that S-HsfA2 cannot represent a traditional S-HSF because S-HsfA4c and S-HsfB1 may have functions other than S-HsfA2. Therefore, we deleted “representative S-HSF” from the revised manuscript. In the future, we will conduct in-depth research on the relevant mechanisms of S-HsfA4c and S-HsfB1 under your guidance.

      (3) The authors can include which of the HSFs interacted with other genes of Arabidopsis reported by other researchers are positively or negatively regulated in heat response/ growth or the balance.

      In the introduction section, we included these genes. AtHsfA2, AtHsfA3, and BhHsf1 confer heat tolerance in Arabidopsis but also result in a dwarf phenotype in plants (Ogawa et al., 2007; Yoshida et al., 2008; Zhu et al., 2009).

      (4) The authors have started from the subsection plant materials and growth conditions. It is unclear from where the authors have found these HSF mutant Arabidopsis? Is it a continuation of some other work? As a reader, I am utterly confused because of the arrangement of the materials and methods section.

      We apologize for the lack of detailed information in the Materials and methods section. These mutants were purchased from AraShare (Fuzhou, China) and verified via PCR and RT‒qPCR. We added the missing information.

      (5) Is the DAS - Days After Sowing - represented as a graph or table? This will add data to the plant growth section to clearly state the difference between the mutants and the wild-type.

      In this study, the age of the Arabidopsis seedlings was calculated as days after sowing (DAS), as stated in the Materials and Methods section and figure legends.

      (6) Heat stress treatment after gus staining looks absurd. Should it not follow after plant materials and growth conditions, which should ideally be after the plant transformation and cloning section? The initial step is definitely about plasmid construction. Kindly rearrange.

      Thank you for your valuable suggestions. We have rearranged the logical order of the materials and methods.

      (7) The expression of GFP and RFP was not clearly seen in the images. This could be because of the poor resolution of the images added.

      We obtained high-quality images of S-HsfA2-GFP (Figure 3 in the revised manuscript).

      (8) We live in an age where it is widely known that genes are not functioning independently but are coregulated and coregulate other proteins. The authors can address the role of these spliced variants on gene regulation and compare them with the HSFs.

      We agree with your suggestion. In this study, HSP17.6B was identified as a direct gene of S-HsfA2 and HsfA2, which can partly explain the role of S-HsfA2 in heat resistance and growth balance. However, the mechanical mechanism by which S-HsfA2 regulates heat tolerance and growth balance may not be limited to HSP17.6B. On the basis of the current data, we propose that the putative S-HsfA2-DERB2A-HsfA3 module might be associated with the roles of S-HsfA2 in heat tolerance and growth balance. Please refer to the discussion section for a detailed explanation.

      (9) Regulatory elements can be validated in relation to their interaction with proven HSFs.

      Supplemental Figure S3 shows that His6-HsfA2 failed to bind to the HRE in vitro.

      (10) The authors seem to be biased toward heat stress and have not worked enough on plant growth. Biochemical data and images on plant growth could be added to bring out the novelty of this manuscript.

      Thank you for your suggestion. We added new data indicating that, compared with the wild-type control, S-HsfA2-GFP, S-HsfA4c-GFP, or S-HsfB1-GFP overexpression inhibited root length (Supplemental Figure 8).

      (11) Line 251 on page 11 of the submitted manuscript says that the s-Hsfs were previously identified by Liu et al. (2013) yet in the abstract the authors claim that these s-HsFs are NEW kinds of HSF with a unique truncated DNA-binding domain (tDBD) that binds a NEW heat-regulated element (HRE).

      In our previous report, several S-HSFs, including S-HsfA2, S-HsfA4, S-HsfB1, and S-HsfB2a, were identified primarily in Arabidopsis (Liu et al., 2013). In this study, we further characterized S-HsfA2, S-HsfA4, and S-HsfB1 and revealed several features of S-HSFs. Therefore, we claim that these S-HSFs are new kinds of HSFs.

      (12) What are these NEW kinds of HRE? Which genes have these HRE? Was an in silico study conducted to study it or can any reports can be cited?

      HREs, i.e., heat-regulated elements, are newly identified heat-responsive elements in this study. The sequences of HREs are partially related to traditional heat shock elements (HSEs). Because we did not identify the essential nucleic acids required for t-DBD binding to the HRE, we did not perform an in silico study.

      (13) S-HSFs may interact with existing HSFs. Have the authors thought in this direction? It can have a role in positively regulating other sHSFs or regulating multiple expressing genes related to plant growth and other functions. This needs to be explored.

      Thank you for this point. Given that the overexpression of Arabidopsis HsfA2 or HsfA3 inhibits growth under nonstress conditions, we discussed this direction from the perspective of the interaction of S-HsfA2 with HsfA2 or HsfA3 in the revised manuscript.

      (14) The authors need to concentrate on the presentation and arrangement of both their materials and methods and result section and write them in a systematic manner (or following a workflow).

      The materials, methods and results sections are arranged in logical order.

      (15) The authors have used references in the results section which can be added to the discussion section to make it more accurate.

      Thank you for your suggestions. We have moved some references to the discussion section, but the necessary references remain in the results section.

    1. eLife Assessment

      This manuscript reports the development and characterization of iGABASnFR2, a genetically encoded GABA sensor that demonstrates substantially improved performance compared to its predecessor, iGABASnFR1. The work is comprehensive and methodologically rigorous, combining high-throughput mutagenesis, functional screening, structural analysis, biophysical characterization, and in vivo validation. The significance of the findings is fundamental, and the supporting evidence is compelling. iGABASnFR2 represents a notable advance in GABA sensor engineering, enabling enhanced imaging of GABA transmission both in brain slices and in vivo, and constitutes a timely, technically robust addition to the molecular toolkit for neuroscience research.

    2. Reviewer #1 (Public review):

      Summary:

      This manuscript by Kolb and Hasseman et al. introduces a significantly improved GABA sensor, building on the pioneering work of the Janelia team. Given GABA's role as the main inhibitory neurotransmitter and the historical lack of effective optical tools for real-time in vivo GABA dynamics, this development is particularly impactful. The new sensor boasts an enhanced signal-to-noise ratio (SNR) and appropriate kinetics for detecting GABA dynamics in both in vitro and in vivo settings. The study is well-presented, with convincing and high-quality data, making this tool a valuable asset for future research into GABAergic signaling.

      Strengths:

      The core strength of this work lies in its significant advancement of GABA sensing technology. The authors have successfully developed a sensor with higher SNR and suitable kinetics, enabling the detection of GABA dynamics both in vitro and in vivo. This addresses a critical gap in neuroscience research, offering a much-needed optical tool for understanding the most important inhibitory neurotransmitter. The clear representation of the work and the convincing, high-quality data further bolster the manuscript's strengths, indicating the sensor's reliability and potential utility. We anticipate this tool will be invaluable for further investigation of GABAergic signaling.

      Weaknesses:

      Despite the notable progress, a key limitation is that the current generation of GABA sensors, including the one presented here, still exhibits inferior performance compared to state-of-the-art glutamate sensors. While this work is a substantial leap forward, it highlights that further improvements in GABA sensors would still be highly beneficial for the field to match the capabilities seen with glutamate sensors.

    3. Reviewer #2 (Public review):

      Summary:

      This manuscript presents the development and characterization of iGABASnFR2, a genetically encoded GABA sensor with markedly improved performance over its predecessor, iGABASnFR1. The study is comprehensive and methodologically rigorous, integrating high-throughput mutagenesis, functional screening, structural analysis, biophysical characterization, and in vivo validation. iGABASnFR2 represents a significant advancement in GABA sensor engineering and application in imaging GABA transmission in slice and in vivo. This is a timely and technically strong contribution to the molecular toolkit for neuroscience.

      Strengths:

      The authors apply a well-established sensor optimization pipeline and iterative engineering strategy from single-site to combinatorial mutants to engineer iGABASnFR2. The development of both positive and negative going variants (iGABASnFR2 and iGABASnFR2n) offers experimental flexibility. The structure and interpretation of the key mutations provide insights into the working mechanism of the sensor, which also suggest optimization strategies. Although individual improvements in intrinsic properties are incremental, their combined effect yields clear functional gains, enabling detection of direction-selective GABA release in the retina and volume-transmitted GABA signaling in somatosensory cortex, which were challenging or missed using iGABASnFR1.

      Weaknesses:

      With minor revisions and clarifications, especially regarding membrane trafficking, this manuscript will be a valuable resource for probing inhibitory transmission.

    1. eLife Assessment

      This paper performs a valuable critical reassessment of anatomical and functional data, proposing a reclassification of the mouse visual cortex in which almost all the higher visual areas are consolidated into a single area V2. However, the evidence supporting this unification is incomplete, as the key experimental observations that the model attempts to reproduce do not accurately reflect the literature. This study will likely be of interest to neuroscientists focused on the mouse visual cortex and the evolution of cortical organization.

    2. Reviewer #1 (Public review):

      Summary:

      In this manuscript, the authors argue that defining higher visual areas (HVAs) based on reversals of retinotopic tuning has led to an over-parcellation of secondary visual cortices. Using retinotopic models, they propose that the HVAs are more parsimoniously mapped as a single area V2, which encircles V1 and exhibits complex retinotopy. They reanalyze functional data to argue that functional differences between HVAs can be explained by retinotopic coverage. Finally, they compare the classification of mouse visual cortex to that of other species to argue that our current classification is inconsistent with those used in other model species.

      Strengths:

      This manuscript is bold and thought-provoking, and is a must-read for mouse visual neuroscientists. The authors take a strong stance on combining all HVAs, with the possible exception of area POR, into a single V2 region. Although I suspect many in the field will find that their proposal goes too far, many will agree that we need to closely examine the assumptions of previous classifications to derive a more accurate areal map. The authors' supporting analyses are clear and bolster their argument. Finally, they make a compelling argument for why the classification is not just semantic, but has ramifications for the design of experiments and analysis of data.

      Weaknesses:

      Although I enjoyed the polemic nature of the manuscript, there are a few issues that weaken their argument.

      (1) Although the authors make a compelling argument that retinotopic reversals are insufficient to define distinct regions, they are less clear about what would constitute convincing evidence for distinct visual regions. They mention that a distinct area V3 has been (correctly) defined in ferrets based on "cytoarchitecture, anatomy, and functional properties", but elsewhere argue that none of these factors are sufficient to parcellate any of the HVAs in mouse cortex, despite some striking differences between HVAs in each of these factors. It would be helpful to clearly define a set of criteria that could be used for classifying distinct regions.

      (2) On a related note, although the authors carry out impressive analyses to show that differences in functional properties between HVAs could be explained by retinotopy, they glossed over some contrary evidence that there are functional differences independent of retinotopy. For example, axon projections to different HVAs originating from a single V1 injection - presumably including neurons with similar retinotopy - exhibit distinct functional properties (Glickfeld LL et al, Nat Neuro, 2013). As another example, interdigitated M2+/M2- patches in V1 show very different HVA connectivity and response properties, again independent of V1 location/retinotopy (Meier AM et al., bioRxiv). One consideration is that the secondary regions might be considered a single V2 with distinct functional modules based on retinotopy and connectivity (e.g., V2LM, V2PM, etc).

      (3) Some of the HVAs-such as AL, AM, and LI-appear to have redundant retinotopic coverage with other HVAS, such as LM and PM. Moreover, these regions have typically been found to have higher "hierarchy scores" based on connectivity (Harris JA et al., Nature, 2019; D'Souza RD et al., Nat Comm, 2022), though unfortunately, the hierarchy levels are not completely consistent between studies. Based on existing evidence, there is a reasonable argument to be made for a hybrid classification, in which some regions (e.g., LM, P, PM, and RL) are combined into a single V2 (though see point #2 above) while other HVAs are maintained as independent visual regions, distinct from V2. I don't expect the authors to revise their viewpoint in any way, but a more nuanced discussion of alternative classifications is warranted.

    3. Reviewer #2 (Public review):

      Summary:

      The study by Rowley and Sedigh-Sarvestani presents modeling data suggesting that map reversals in mouse lateral extrastriate visual cortex do not coincide with areal borders, but instead represent borders between subregions within a single area V2. The authors propose that such an organization explains the partial coverage in higher-order areas reported by Zhuang et al., (2017). The scheme revisits an organization proposed by Kaas et al., (1989), who interpreted the multiple projection patches traced from V1 in the squirrel lateral extrastriate cortex as subregions within a single area V2. Kaas et al's interpretation was challenged by Wang and Burkhalter (2007), who used a combination of topographic mapping of V1 connections and receptive field recordings in mice. Their findings supported a different partitioning scheme in which each projection patch mapped a specific topographic location within single areas, each containing a complete representation of the visual field. The area map of mouse visual cortex by Wang and Burkhalter (2007) has been reproduced by hundreds of studies and has been widely accepted as ground truth (CCF) (Wang et al., 2020) of the layout of rodent cortex. In the meantime, topographic mappings in marmoset and tree shew visual cortex made a strong case for map reversals in lateral extrastriate cortex, which represent borders between functionally diverse subregions within a single area V2. These findings from non-rodent species raised doubts about whether during evolution, different mammalian branches have developed diverse partitioning schemes of the cerebral cortex. Rowley and Sedigh-Sarvestani favor a single master plan in which, across evolution, all mammalian species have used a similar blueprint for subdividing the cortex.

      Strengths:

      The story illustrates the enduring strength of science in search of definitive answers.

      Weaknesses:

      To me, it remains an open question whether Rowley and Sedigh-Sarvestani have written the final chapter of the saga. A key reason for my reservation is that the areas the maps used in their model are cherry-picked. The article disregards published complementary maps, which show that the entire visual field is represented in multiple areas (i.e. LM, AL) of lateral extrastriate cortex and that the map reversal between LM and AL coincides precisely with the transition in m2AChR expression and cytoarchitecture (Wang and Burkhalter, 2007; Wang et al., 2011). Evidence from experiments in rats supports the gist of the findings in the mouse visual cortex (Coogan and Burkhalter, 1993).

      (1) The selective use of published evidence, such as the complete visual field representation in higher visual areas of lateral extrastriate cortex (Wang and Burkhalter, 2007; Wang et al., 2011) makes the report more of an opinion piece than an original research article that systematically analyzes the area map of mouse visual cortex we have proposed. No direct evidence is presented for a single area V2 with functionally distinct subregions.

      (2) The article misrepresents evidence by commenting that m2AChR expression is mainly associated with the lower field. This is counter to published findings showing that m2AChR spans across the entire visual field (Gamanut et al., 2018; Meier et al., 2021). The utility of markers for delineating areal boundaries is discounted, without any evidence, in disregard of evidence for distinct areal patterns in early development (Wang et al., 2011). Pointing out that markers can be distributed non-uniformly within an area is well-familiar. m2AChR is non-uniformly expressed in mouse V1, LM and LI (Ji et al., 2015; D'Souza et al., 2019; Meier et al., 2021). Recently, it has been found that the patchy organization within V1 plays a role in the organization of thalamocortical and intracortical networks (Meier et al., 2025). m2AChR-positive patches and m2AChR-negative interpatches organize the functionally distinct ventral and dorsal networks, notably without obvious bias for upper and lower parts of the visual field.

      (3) The study has adopted an area partitioning scheme, which is said to be based on anatomically defined boundaries of V2 (Zhuang et al., 2017). The only anatomical borders used by Zhuang et al. (2017) are those of V1 and barrel cortex, identified by cytochrome oxidase staining. In reality, the partitioning of the visual cortex was based on field sign maps, which are reproduced from Zhuang et al., (2017) in Figure 1A. It is unclear why the maps shown in Figures 2E and 2F differ from those in Figure 1A. It is possible that this is an oversight. But maintaining consistent areal boundaries across experimental conditions that are referenced to the underlying brain structure is critical for assigning modeled projections to areas or sub-regions. This problem is evident in Figure 2F, which is presented as evidence that the modeling approach recapitulates the tracings shown in Figure 3 of Wang and Burkhalter (2007). The dissimilarities between the modeling and tracing results are striking, unlike what is stated in the legend of Figure 2F.

      (4) The Rowley and Sedigh-Sarvestani find that the partial coverage of the visual field in higher order areas shown by Zhuang et al (2017) is recreated by the model. It is important to caution that Zhuang et al's (2017) maps were derived from incomplete mappings of the visual field, which was confined to -25-35 deg of elevation. This underestimates the coverage we have found in LM and AL. Receptive field mappings show that LM covers 0-90 deg of azimuth and -30-80 elevation (Wang and Burkhalter, 2007). AL covers at least 0-90 deg of azimuth and -30-50 deg of elevation (Wang and Burkhalter, 2007; Wang et al., 2011). These are important differences. Partial coverage in LM and AL underestimates the size of these areas and may map two projection patches as inputs to subregions of a single area rather than inputs to two separate areas. Complete, or nearly complete, visual representations in LM and AL support that each is a single area. Importantly, both areas are included in a callosal-free zone (Wang and Burkhalter, 2007). The surrounding callosal connections align with the vertical meridian representation. The single map reversal is marked by a transition in m2AChR expression and cytoarchitecture (Wang et al., 2011).

      (5) The statement that the "lack of visual field overlap across areas is suggestive of a lack of hierarchical processing" is predicated on the full acceptance of the mappings by Zhuang et al (2017). Based on the evidence reviewed above, the reclassification of visual areas proposed in Figure 1C seems premature.

      (6) The existence of lateral connections is not unique to rodent cortex and has been described in primates (Felleman and Van Essen, 1991).

      (7) Why the mouse and rat extrastriate visual cortex differ from those of many other mammals is unclear. One reason may be that mammals with V2 subregions are strongly binocular.

    4. Reviewer #3 (Public review):

      Summary:

      The authors review published literature and propose that a visual cortical region in the mouse that is widely considered to contain multiple visual areas should be considered a single visual area.

      Strengths:

      The authors point out that relatively new data showing reversals of visual-field sign within known, single visual areas of some species require that a visual field sign change by itself should not be considered evidence for a border between visual areas.

      Weaknesses:

      The existing data are not consistent with the authors' proposal to consolidate multiple mouse areas into a single "V2". This is because the existing definition of a single area is that it cannot have redundant representations of the visual field. The authors ignore this requirement, as well as the data and definitions found in published manuscripts, and make an inaccurate claim that "higher order visual areas in the mouse do not have overlapping representations of the visual field". For quantification of the extent of overlap of representations between 11 mouse visual areas, see Figure 6G of Garrett et al. 2014. [Garrett, M.E., Nauhaus, I., Marshel, J.H., and Callaway, E.M. (2014). Topography and areal organization of mouse visual cortex. The Journal of neuroscience 34, 12587-12600. 10.1523/JNEUROSCI.1124-14.2014.

    5. Author response:

      eLife Assessment:

      This paper performs a valuable critical reassessment of anatomical and functional data, proposing a reclassification of the mouse visual cortex in which almost all the higher visual areas are consolidated into a single area V2. However, the evidence supporting this unification is incomplete, as the key experimental observations that the model attempts to reproduce do not accurately reflect the literature . This study will likely be of interest to neuroscientists focused on the mouse visual cortex and the evolution of cortical organization.

      We do not agree or understand which 'key experimental observations' that the model attempts to reproduce do not accurately reflect the literature. The model reproduces a complete map of the visual field, with overlap in certain regions. When reversals are used to delineate areas, as is the current custom, multiple higher order areas are generated, and each area has a biased and overlapping visual field coverage. These are the simple outputs of the model, and they are consistent with the published literature, including recent publications such as Garrett et al. 2014 and Zhuang et al. 2017, a paper published in this journal. The area boundaries produced by the model are not identical to area boundaries in the literature, because the model is a simplification.

      Reviewer #1 (Public review):

      Summary:

      In this manuscript, the authors argue that defining higher visual areas (HVAs) based on reversals of retinotopic tuning has led to an over-parcellation of secondary visual cortices. Using retinotopic models, they propose that the HVAs are more parsimoniously mapped as a single area V2, which encircles V1 and exhibits complex retinotopy. They reanalyze functional data to argue that functional differences between HVAs can be explained by retinotopic coverage. Finally, they compare the classification of mouse visual cortex to that of other species to argue that our current classification is inconsistent with those used in other model species.

      Strengths:

      This manuscript is bold and thought-provoking, and is a must-read for mouse visual neuroscientists. The authors take a strong stance on combining all HVAs, with the possible exception of area POR, into a single V2 region. Although I suspect many in the field will find that their proposal goes too far, many will agree that we need to closely examine the assumptions of previous classifications to derive a more accurate areal map. The authors' supporting analyses are clear and bolster their argument. Finally, they make a compelling argument for why the classification is not just semantic, but has ramifications for the design of experiments and analysis of data.

      Weaknesses:

      Although I enjoyed the polemic nature of the manuscript, there are a few issues that weaken their argument.

      (1) Although the authors make a compelling argument that retinotopic reversals are insufficient to define distinct regions, they are less clear about what would constitute convincing evidence for distinct visual regions. They mention that a distinct area V3 has been (correctly) defined in ferrets based on "cytoarchitecture, anatomy, and functional properties", but elsewhere argue that none of these factors are sufficient to parcellate any of the HVAs in mouse cortex, despite some striking differences between HVAs in each of these factors. It would be helpful to clearly define a set of criteria that could be used for classifying distinct regions.

      We agree the revised manuscript would benefit from a clear discussion of updated rules of area delineation in the mouse. In brief, we argue that retinotopy alone should not be used to delineate area boundaries in mice, or any other species. Although there is some evidence for functional property, architecture, and connectivity changes across mouse HVAs, area boundaries continue to be defined primarily, and sometimes solely (Garrett et al., 2014; Juavinett et al., 2018; Zhuang et al., 2017), based on retinotopy. We acknowledge that earlier work (Wang and Burkhalter, 2007; Wang et al., 2011) did consider cytoarchitecture and connectivity alongside retinotopy, but more recent work has shifted to a focus on retinotopy as indicated by the currently accepted criterion for area delineation.  

      As reviewer #2 points out, the present criteria for mouse visual area delineation can be found in the Methods section of: [Garrett, M.E., Nauhaus, I., Marshel, J.H., and Callaway, E.M. (2014)].

      Criterion 1: Each area must contain the same visual field sign at all locations within the area.

      Criterion 2: Each visual area cannot have a redundant representation of visual space.

      Criterion 3: Adjacent areas of the same visual field sign must have a redundant representation.

      Criterion 4: An area's location must be consistently identifiable across experiments.

      As discussed in the manuscript, recent evidence in higher order visual cortex of tree shrews and rats led us to question the universality of these criteria across species. Specifically, tree shrew V2, macaque V2, and marmoset DM, exhibit reversals in visual field-sign in what are defined as single visual areas. This suggests that criterion 1 should be updated. It also suggests that Criterion 2 and 3 should be updated since visual field sign reversals often co-occur with retinotopic redundancies, since reversing course in the direction of progression along the visual field can easily lead to coverage of visual field regions already traveled.  

      More broadly, we argue that topography is just one of several criteria that should be considered in area delineation. We understand that few visual areas in any species meet all criteria, but we emphasize that topography cannot consistently be the sole satisfied criterion – as it currently appears to be for many mouse HVAs. Inspired by a recent perspective on cortical area delineation (Petersen et al., 2024), we suggest the following rules, that will be worked into the revised version of the manuscript. Topography is a criterion, but it comes after considerations of function, architectonics and connectivity.

      (1) Function—Cortical areas differ from neighboring areas in their functional properties  

      (2) Architectonics—Cortical areas often exhibit distinctions from neighboring areas in multiple cyto- and myeloarchitectonic markers

      (3) Connectivity—Cortical areas are characterized by a specific set of connectional inputs and outputs from and to other areas

      (4) Topography—Cortical areas often exhibit a distinct topography that balances maximal coverage of the sensory field with minimal redundancy of coverage within an area.

      As we discuss in the manuscript, although there are functional, architectonic, and connectivity differences across mouse HVAs, they typically vary smoothly across multiple areas – such that neighboring areas share the same properties and there are no sharp borders. For instance, sharp borders in cytoarchitecture are generally lacking in the mouse HVAs. A notable exceptions to this is the clear and sharp change in m2AChR expression that occurs between LM and AL (Wang et al., 2011). 

      (2) On a related note, although the authors carry out impressive analyses to show that differences in functional properties between HVAs could be explained by retinotopy, they glossed over some contrary evidence that there are functional differences independent of retinotopy. For example, axon projections to different HVAs originating from a single V1 injection - presumably including neurons with similar retinotopy - exhibit distinct functional properties (Glickfeld LL et al, Nat Neuro, 2013). As another example, interdigitated M2+/M2- patches in V1 show very different HVA connectivity and response properties, again independent of V1 location/retinotopy (Meier AM et al., bioRxiv). One consideration is that the secondary regions might be considered a single V2 with distinct functional modules based on retinotopy and connectivity (e.g., V2LM, V2PM, etc).

      Thank you for the correction. We will revise the text to discuss (Glickfeld et al., 2013), as it remains some of the strongest evidence in favor of retinotopy-independent functional specialization of mouse HVAs. However, one caveat of this study is the size of the V1 injection that is the source of axons studied in the HVAs. As apparent in Figure 1B, the large injection covers nearly a quarter of V1. It is worth nothing that (Han et al., 2018) found, using single-cell reconstructions and MAPseq, that the majority of V1 neurons project to multiple nearby HVA targets. In this experiment the tracing does not suffer from the problem of spreading over V1’s retinotopic map, and suggests that, presumably retinotopically matched, locations in each area receive shared inputs from the V1 population rather than a distinct but spatially interspersed subset. In fact, the authors conclude “Interestingly, the location of the cell body within V1 was predictive of projection target for some recipient areas (Extended Data Fig. 8). Given the retinotopic organization of V1, this suggests that visual information from different parts of visual field may be preferentially distributed to  specific target areas, which is consistent with recent findings (Zhuang et al., 2017)”. Given an injection covering a large portion of the retinotopic map, and the fact that feed-forward projections from V1 to HVAs carry coarse retinotopy - it is difficult to prove that functional specializations noted in the HVA axons are retinotopyindependent. This would require measurement of receptive field location in the axonal boutons, which the authors did not perform (possibly because the SNR of calcium indicators prevented such measurements at the time).  

      Another option would be to show that adjacent neurons in V1, that project to far-apart HVAs, exhibit distinct functional properties on par with differences exhibited by neurons in very different parts of V1 due to retinotopy. In other words, the functional specificity of V1 inputs to HVAs at retinotopically identical locations is of the same order as those that might be gained by retinotopic biases. To our knowledge, such a study has not been conducted, so we have decided to measure the data in collaboration with the Allen Institute. As part of the Allen Institute’s pioneering OpenScope project, we will make careful two-photon and electrophysiology measurements of functional properties, including receptive field location, SF, and TF in different parts of the V1 retinotopic map. Pairing this data with existing Allen Institute datasets on functional properties of neurons in the HVAs will allow us to rule in, or rule-out, our hypotheses regarding retinotopy as the source of functional specialization in mouse HVAs. We will update the discussion in the revised manuscript to better reflect the need for additional evidence to support or refute our proposal.

      Meier AM et al., bioRxiv 2025 (Meier et al., 2025) was published after our submission, but we are thankful to the reviewers for guiding our attention to this timely paper. Given the recent findings on the influence of locomotion on rodent and primate visual cortex, it is very exciting to see clearly specialized circuits for processing self-generated visual motion in V1. However, it is difficult to rule out the role of retinotopy as the HVA areas (LM, AL, RL) participating in the M2+ network less responsive to self-generated visual motion exhibit a bias for the medial portion of the visual field and the HVA area (PM) involved in the M2- network responsive to self-generated visual motion exhibit a bias for the lateral (or peripheral) parts of the visual field. For instance, a peripheral bias in area PM has been shown using retrograde tracing as in Figure 6 of (Morimoto et al., 2021), single-cell anterograde tracing  as in Extended Data Figure 8 of (Han et al., 2018), and functional imaging studies (Zhuang et al., 2017). Recent findings in the marmoset also point to visual circuits in the peripheral, but not central, visual field being significantly modulated by selfgenerated movements (Rowley et al., 2024). 

      However, a visual field bias in area PM that selectively receive M2- inputs is at odds with the clear presence of modular M2+/M2- patches across the entire map of V1 (Ji et al., 2015).  One possibility supported by existing data is that neurons in M2- patches, as well as those in M2+ patches, in the central representation of V1 make fewer or significantly weaker connections with area PM compared to areas LM, AL and RL. Evidence to the contrary would support retinotopy-independent and functionally specialized inputs from V1 to HVAs.

      (3) Some of the HVAs-such as AL, AM, and LI-appear to have redundant retinotopic coverage with other HVAS, such as LM and PM. Moreover, these regions have typically been found to have higher "hierarchy scores" based on connectivity (Harris JA et al., Nature, 2019; D'Souza RD et al., Nat Comm, 2022), though unfortunately, the hierarchy levels are not completely consistent between studies. Based on existing evidence, there is a reasonable argument to be made for a hybrid classification, in which some regions (e.g., LM, P, PM, and RL) are combined into a single V2 (though see point #2 above) while other HVAs are maintained as independent visual regions, distinct from V2. I don't expect the authors to revise their viewpoint in any way, but a more nuanced discussion of alternative classifications is warranted.

      We understand that such a proposal would combine a subset of areas with matched field sign (LM, P, PM, and RL) would be less extreme and received better by the community. This would create a V2 with a smooth map without reversals or significant redundant retinotopic coverage. However, the intuition we have built from our modeling studies suggest that both these areas, and the other smaller areas with negative field sign (AL, AM, LI), are a byproduct of a complex single map of the visual field that exhibits reversals as it contorts around the triangular and tear-shaped boundaries of V1. In other words, we believe the redundant coverage and field-sign changes/reversals are a byproduct of a single secondary visual field in V2 constrained by the cortical dimensions of V1. That being said, we understand that area delineations are in part based on a consensus by the community. Therefore we will continue to discuss our proposal with community members, and we will incorporate new evidence supporting or refuting our hypothesis, before we submit our revised manuscript.

      Reviewer #2 (Public review):

      Summary:

      The study by Rowley and Sedigh-Sarvestani presents modeling data suggesting that map reversals in mouse lateral extrastriate visual cortex do not coincide with areal borders, but instead represent borders between subregions within a single area V2. The authors propose that such an organization explains the partial coverage in higher-order areas reported by Zhuang et al., (2017). The scheme revisits an organization proposed by Kaas et al., (1989), who interpreted the multiple projection patches traced from V1 in the squirrel lateral extrastriate cortex as subregions within a single area V2. Kaas et al's interpretation was challenged by Wang and Burkhalter (2007), who used a combination of topographic mapping of V1 connections and receptive field recordings in mice. Their findings supported a different partitioning scheme in which each projection patch mapped a specific topographic location within single areas, each containing a complete representation of the visual field. The area map of mouse visual cortex by Wang and Burkhalter (2007) has been reproduced by hundreds of studies and has been widely accepted as ground truth (CCF) (Wang et al., 2020) of the layout of rodent cortex. In the meantime, topographic mappings in marmoset and tree shew visual cortex made a strong case for map reversals in lateral extrastriate cortex, which represent borders between functionally diverse subregions within a single area V2. These findings from non-rodent species raised doubts about whether during evolution, different mammalian branches have developed diverse partitioning schemes of the cerebral cortex. Rowley and Sedigh-Sarvestani favor a single master plan in which, across evolution, all mammalian species have used a similar blueprint for subdividing the cortex.

      Strengths:

      The story illustrates the enduring strength of science in search of definitive answers.

      Weaknesses:

      To me, it remains an open question whether Rowley and Sedigh-Sarvestani have written the final chapter of the saga. A key reason for my reservation is that the areas the maps used in their model are cherry-picked. The article disregards published complementary maps, which show that the entire visual field is represented in multiple areas (i.e. LM, AL) of lateral extrastriate cortex and that the map reversal between LM and AL coincides precisely with the transition in m2AChR expression and cytoarchitecture (Wang and Burkhalter, 2007; Wang et al., 2011). Evidence from experiments in rats supports the gist of the findings in the mouse visual cortex (Coogan and Burkhalter, 1993).

      We would not claim to have written the final chapter of the saga. Our goal was to add an important piece of new evidence to the discussion of area delineations across species. We believe this new evidence supports our unification hypothesis.  We also believe that there are several missing pieces of data that could support or refute our hypothesis. We have begun a collaboration to collect some of this data.  

      (1) The selective use of published evidence, such as the complete visual field representation in higher visual areas of lateral extrastriate cortex (Wang and Burkhalter, 2007; Wang et al., 2011) makes the report more of an opinion piece than an original research article that systematically analyzes the area map of mouse visual cortex we have proposed. No direct evidence is presented for a single area V2 with functionally distinct subregions.

      This brings up a nuanced issue regarding visual field coverage. Wang & Burkhalter, 2007 Figure 6 shows the receptive field of sample neurons in area LM that cover the full range between 0 and 90 degrees of azimuth, and -40 to 80 degree of elevation – which essentially matches the visual field coverage in V1. However, we do not know whether these neurons are representative of most neurons in area LM. In other words, while these single-cell recordings along selected contours in cortex show the span of the visual field coverage, they may not be able to capture crucial information about its shape, missing regions of the visual field or potential bias. To mitigate this, visual field maps measured with electrophysiology are commonly produced by even sampling across the two dimensions of the visual area, either by moving a single electrode along a grid-pattern (e.g. (Manger et al., 2002)), or using a grid-liked multi-electrode probe (e.g. (Yu et al., 2020)). This was not carried out either in Wang & Burkhalter 2007 or Wang et al. 2011.  Even sampling of cortical space is time consuming and difficult with electrophysiology, but efficient with functional imaging. Therefore, despite the likely under-estimation of visual field coverage, imaging techniques are valuable in that they can efficiently exhibit not only the span of the visual field of a cortical region, but also its shape and bias.  

      Multiple functional imaging studies that simultaneously measure visual field coverage in V1 and HVAs report a bias in the coverage of HVAs, relative to that in V1 (Garrett et al., 2014; Juavinett et al., 2018; Zhuang et al., 2017). While functional imaging will likely underestimate receptive fields compared to electrophysiology, the consistent observation of an orderly bias for distinct parts of the visual field across the HVAs suggests that at least some of the HVAs do not have full and uniform coverage of the visual field comparable to that in V1. For instance, (Garrett et al., 2014) show that the total coverage in HVAs, when compared to V1, is typically less than half (Figure 6D) and often irregularly shaped.

      Careful measurements of single-cell receptive fields, using mesoscopic two-photon imaging across the HVAs would settle this question. As reviewer #1 points out, this is technically feasible, though no dataset of this kind exists to our knowledge.

      (2) The article misrepresents evidence by commenting that m2AChR expression is mainly associated with the lower field. This is counter to published findings showing that m2AChR spans across the entire visual field (Gamanut et al., 2018; Meier et al., 2021). The utility of markers for delineating areal boundaries is discounted, without any evidence, in disregard of evidence for distinct areal patterns in early development (Wang et al., 2011). Pointing out that markers can be distributed non-uniformly within an area is well-familiar. m2AChR is non-uniformly expressed in mouse V1, LM and LI (Ji et al., 2015; D'Souza et al., 2019; Meier et al., 2021). Recently, it has been found that the patchy organization within V1 plays a role in the organization of thalamocortical and intracortical networks (Meier et al., 2025). m2AChR-positive patches and m2AChR-negative interpatches organize the functionally distinct ventral and dorsal networks, notably without obvious bias for upper and lower parts of the visual field.

      We wrote that “Future work showed boundaries in labeling of histological markers such as SMI-32 and m2ChR labeling, but such changes mostly delineated area LM/AL (Wang et al., 2011) and seemed to be correlated with the representation of the lower visual field.” The latter statement regarding the representation of the lower visual field is directly referencing the data in Figure 1 of (Wang et al., 2011), which is titled “Figure 1: LM/AL border identified by the transition of m2AChR expression coincides with receptive field recordings from lower visual field.” Similar to the Wang et al., we were simply referring to the fact that the border of area LM/AL co-exhibits a change in m2AChR expression as well as lower-visual field representation.  

      (3) The study has adopted an area partitioning scheme, which is said to be based on anatomically defined boundaries of V2 (Zhuang et al., 2017). The only anatomical borders used by Zhuang et al. (2017) are those of V1 and barrel cortex, identified by cytochrome oxidase staining. In reality, the partitioning of the visual cortex was based on field sign maps, which are reproduced from Zhuang et al., (2017) in Figure 1A. It is unclear why the maps shown in Figures 2E and 2F differ from those in Figure 1A. It is possible that this is an oversight. But maintaining consistent areal boundaries across experimental conditions that are referenced to the underlying brain structure is critical for assigning modeled projections to areas or sub-regions. This problem is evident in Figure 2F, which is presented as evidence that the modeling approach recapitulates the tracings shown in Figure 3 of Wang and Burkhalter (2007). The dissimilarities between the modeling and tracing results are striking, unlike what is stated in the legend of Figure 2F.

      Thanks for this correction. By “anatomical boundaries of higher visual cortex”, we meant the cortical boundary between V1 and higher order visual areas on one end, and the outer edge of the envelope that defines the functional boundaries of the HVAs in cortical space (Zhuang et al., 2017). The reviewer is correct that we should have referred to these as functional boundaries. The word ‘anatomical’ was meant to refer to cortical space, rather than visual field space.

      More generally though, there is no disagreement between the partitioning of visual cortex in Figure 1 and 2. Rather, the portioning in Figure 1 is directly taken from Zhuang et al., (2017) whereas those in Figure 2 are produced by mathematical model simulation. As such, one would not expect identical areal boundaries between Figure 2 and Figure 1. What we aimed to communicate with our modeling results, is that a single area can exhibit multiple visual field reversals and retinotopic redundancies if it is constrained to fit around V1 and cover a visual field approximately matched to the visual field coverage in V1. We defined this area explicitly as a single area with a single visual field (boundaries shown in Figure 2A). So  the point of our simulation is to show that even an explicitly defined single area can appear as multiple areas if it is constrained by the shape of mouse V1, and if visual field reversals are used to indicate areal boundaries. As in most models, different initial conditions and parameters produce a complex visual field which will appear as multiple HVAs when delineated by areal boundaries. What is consistent however, is the existence of complex single visual field that appears as multiple HVAs with partially overlapping coverage.

      Similarly, we would not expect a simple model to exactly reproduce the multi-color tracer injections in Wang and Burkhalter (2007). However, we find it quite compelling that the model can produce multiple groups of multi-colored axonal projections beyond V1 that can appear as multiple areas each with their own map of the visual field using current criteria, when the model is explicitly designed to map a single visual field. We will explain the results of the model, and their implications, better in the revised manuscript.

      (4) The Rowley and Sedigh-Sarvestani find that the partial coverage of the visual field in higher order areas shown by Zhuang et al (2017) is recreated by the model. It is important to caution that Zhuang et al's (2017) maps were derived from incomplete mappings of the visual field, which was confined to -25-35 deg of elevation. This underestimates the coverage we have found in LM and AL. Receptive field mappings show that LM covers 0-90 deg of azimuth and -30-80 elevation (Wang and Burkhalter, 2007). AL covers at least 0-90 deg of azimuth and -30-50 deg of elevation (Wang and Burkhalter, 2007; Wang et al., 2011). These are important differences. Partial coverage in LM and AL underestimates the size of these areas and may map two projection patches as inputs to subregions of a single area rather than inputs to two separate areas. Complete, or nearly complete, visual representations in LM and AL support that each is a single area. Importantly, both areas are included in a callosal-free zone (Wang and Burkhalter, 2007). The surrounding callosal connections align with the vertical meridian representation. The single map reversal is marked by a transition in m2AChR expression and cytoarchitecture (Wang et al., 2011).

      This is a good point. We do not expect that expanding the coverage of V1 will change the results of the model significantly. However, for the revised manuscript, we will update V1 coverage to be accurate, repeat our simulations, and report the results.  

      (5) The statement that the "lack of visual field overlap across areas is suggestive of a lack of hierarchical processing" is predicated on the full acceptance of the mappings by Zhuang et al (2017). Based on the evidence reviewed above, the reclassification of visual areas proposed in Figure 1C seems premature.

      The reviewer is correct. In the revised manuscript, we will be careful to distinguish bias in visual field coverage across areas from presence or lack of visual field overlap.  

      (6) The existence of lateral connections is not unique to rodent cortex and has been described in primates (Felleman and Van Essen, 1991).

      (7) Why the mouse and rat extrastriate visual cortex differ from those of many other mammals is unclear. One reason may be that mammals with V2 subregions are strongly binocular.

      This is an interesting suggestion, and careful visual topography data from rabbits and other lateral eyed animals would help to evaluate it. For what it’s worth, tree shrews are lateral eyed animals with only 50 degrees of binocular visual field and also show V2 subregions.

      Reviewer #3 (Public review):

      Summary:

      The authors review published literature and propose that a visual cortical region in the mouse that is widely considered to contain multiple visual areas should be considered a single visual area.

      Strengths:

      The authors point out that relatively new data showing reversals of visual-field sign within known, single visual areas of some species require that a visual field sign change by itself should not be considered evidence for a border between visual areas.

      Weaknesses:

      The existing data are not consistent with the authors' proposal to consolidate multiple mouse areas into a single "V2". This is because the existing definition of a single area is that it cannot have redundant representations of the visual field. The authors ignore this requirement, as well as the data and definitions found in published manuscripts, and make an inaccurate claim that "higher order visual areas in the mouse do not have overlapping representations of the visual field". For quantification of the extent of overlap of representations between 11 mouse visual areas, see Figure 6G of Garrett et al. 2014. [Garrett, M.E., Nauhaus, I., Marshel, J.H., and Callaway, E.M. (2014). Topography and areal organization of mouse visual cortex. The Journal of neuroscience 34, 12587-12600. 10.1523/JNEUROSCI.1124-14.2014.

      Thank you for this correction, we admit we should have chosen our words more carefully. In the revised manuscript, we will emphasize that higher order visual areas in the mouse do have some overlap in their representations but also exhibit bias in their coverage. This is consistent with our proposal and in fact our model simulations in Figure 2E also show overlapping representations along with differential bias in coverage. However, we also note Figure 6 of Garret et al. 2014 provides several pieces of evidence in support of our proposal that higher order areas are sub-regions of a single area V2. Specifically, the visual field coverage of each area is significantly less than that in V1 (Garret et al. 2014, Figure 6D). While the imaging methods used in Garret et al. likely under-estimate receptive fields, one would assume they would similarly impact measurements of coverage in V1 and HVAs. Secondly, each area exhibits a bias towards a different part of the visual field (Figure 6C and E), that this bias is distinct for different areas but proceeds in a retinotopic manner around V1 - with adjacent areas exhibiting biases for nearby regions of the visual field (Figure 6E). Thus, the biases in the visual field coverage across HVAs appear to be related and not independent of each other. As we show in our modeling and in Figure 2, such orderly and inter-related biases can be created from a single visual field constrained to share a border with mouse V1.   

      With regards to the existing definition of a single area: we did not ignore the requirement that single areas cannot have redundant representations of the visual field. Rather, we believe that this requirement should be relaxed considering new evidence collected from other species, where multiple visual field reversals exist within the same visual area. We understand this issue is nuanced and was not made clear in the original submission.  

      In the revised manuscript, we will clarify that visual field reversals often exhibit redundant retinotopic representation on either side of the reversal. In the revised manuscript we will clarify that our argument that multiple reversals can exist within a single visual area in the mouse, is an argument that some retinotopic redundancy can exist with single visual areas. Such a re-classification would align how we define visual areas in mice with existing classification in tree shrews, ferrets, cats, and primates – all of whom have secondary visual areas with complex retinotopic maps exhibiting multiple reversals and redundant retinotopic coverage.

    1. Author response:

      We sincerely thank the reviewers for the time and care they have invested in evaluating our manuscript. We greatly appreciate their thoughtful feedback, which highlights both the strengths and the areas where the work can be improved. We recognize the importance of the concerns raised, particularly regarding the TMS analyses and interpretation, as well as aspects of the manuscript structure and clarity. The authors are committed to transparency and a rigorous scientific process, and we will therefore carefully consider all reviewer comments. In the coming months, we will revise the manuscript to incorporate additional analyses, provide clearer methodological detail, and refine the interpretation of the stimulation results.

    2. Reviewer #4 (Public review):

      Summary:

      Several behavioral experiments and one TMS experiment were performed to examine adaptation to room reverberation for speech intelligibility in noise. This is an important topic that has been extensively studied by several groups over the years. And the study is unique in that it examines one candidate brain area, dlPFC, potentially involved in this learning, and finds that disrupting this area by TMS results in a reduction in the learning. The behavioral conditions are in many ways similar to previous studies. However, they find results that do not match previous results (e.g., performance in anechoic condition is worse than in reverberation), making it difficult to assess the validity of the methods used. One unique aspect of the behavioral experiments is that Ambisonics was used to simulate the spaces, while headphone simulation was mostly used previously. The main behavioral experiment was performed by interleaving 3 different rooms and measuring speech intelligibility as a function of the number of words preceding the target in a given room on a given trial. The findings are that performance improves on the time scale of seconds (as the number of words preceding the target increases), but also on a much larger time scale of tens to hundreds of seconds (corresponding to multiple trials), while for some listeners it is degraded for the first couple of trials. The study also finds that the performance is best in the room that matches the T60 most commonly observed in everyday environments. These are potentially interesting results. However, there are issues with the design of the study and analysis methods that make it difficult to verify the conclusions based on the data.

      Strengths:

      (1) Analysis of the adaptation to reverberation on multiple time scales, for multiple reverberant and anechoic environments, and also considering contextual effects of one environment interleaved with the other two environments.

      (2) TMS experiment showing reduction of some of the learning effects by temporarily disabling the dlPFC.

      Weaknesses:

      While the study examines the adaptation for different carrier lengths, it keeps multiple characteristics (mainly talker voice and location) fixed in addition to reverberation. Therefore, it is possible that the subjects adapt to other aspects of the stimuli, not just to reverberation. A condition in which only reverberation would switch for the target would allow the authors to separate these confounding alternatives. Now, the authors try to address the concerns by indirect evidence/analyses. However, the evidence provided does not appear sufficient.

      The authors use terms that are either not defined or that seem to be defined incorrectly. The main issue then is the results, which are based on analysis of what the authors call d', Hit Rate, and Final Hit rate. First of all, they randomly switch between these measures. Second, it's not clear how they define them, given that their responses are either 4-alternative or 8-alternative forced choice. d', Hit Rate, and False Alarm Rate are defined in Signal detection theory for the detection of the presence of a target. It can be easily extended to a 2-alternative forced choice. But how does one define a Hit, and, in particular, a False Alarm, in a 4/8-alternative? The authors do not state how they did it, and without that, the computation of d' based on HR and FAR is dubious. Also, what the authors call Hit Rate, is presumably the percent correct performance (PCC), but even that is not clear. Then they use FHR and act as if this was the asymptotic value of their HR, even though in many conditions their learning has not ended, and randomly define a variable of +-10 from FHR, which must produce different results depending on whether the asymptote was reached or not. Other examples of usage of strange usage of terms: they talk about "global likelihood learning" (L426) without a definition or a reference, or about "cumulative hit rate" (L1738), where it is not clear to me what "cumulative" means there.

      There are not enough acoustic details about the stimuli. The authors find that reverberant performance is overall better than anechoic in 2 rooms. This goes contrary to previous results. And the authors do not provide enough acoustic details to establish that this is not an artefact of how the stimuli were normalized (e.g., what were the total signal and noise levels at the two ears in the anechoic and reverberant conditions?).

      There are some concerns about the use of statistics. For example, the authors perform two-way ANOVA (L724-728) in which one factor is room, but that factor does not have the same 3 levels across the two levels of the other factor. Also, in some comparisons, they randomly select 11 out of 22 subjects even though appropriate test correct for such imbalances without adding additional randomness of whether the 11 selected subjects happened to be the good or the bad ones.

      Details of the experiments are not sufficiently described in the methods (L194-205) to be able to follow what was done. It should be stated that 1 main experiment was performed using 3 rooms, and that 3 follow-ups were done on a new set of subjects, each with the room swapped.

    3. Reviewer #3 (Public review):

      Summary:

      This manuscript presents a well-designed and insightful behavioural study examining human adaptation to room acoustics, building on prior work by Brandewie & Zahorik. The psychophysical results are convincing and add incremental but meaningful knowledge to our understanding of reverberation learning. However, I find the transcranial magnetic stimulation (TMS) component to be over-interpreted. The TMS protocol, while interesting, lacks sufficient anatomical specificity and mechanistic explanation to support the strong claims made regarding a unique role of the dorsolateral prefrontal cortex (dlPFC) in this learning process. More cautious interpretation is warranted, especially given the modest statistical effects, the fact that the main TMS result of interest is a null result, the imprecise targeting of dlPFC (which is not validated), and the lack of knowledge about the timescale of TMS effects in relation to the behavioural task. I recommend revising the manuscript to shift emphasis toward the stronger behavioural findings and to present a more measured and transparent discussion of the TMS results and their limitations.

      Strengths:

      (1) Well-designed acoustical stimuli and psychophysical task.

      (2) Comparisons across room combinations are well conducted.

      (3) The virtual acoustic environment is impressive and applied well here.

      (4) A timely study with interesting behavioural results.

      Weaknesses:

      (1) Lack of hypotheses, particularly for TMS.

      (2) Lack of evidence for targeting TMS in [brain] space and time.

      (3) The most interesting effect of TMS is a null result compared to a weak statistical effect for "meta adaptation"

    4. Reviewer #2 (Public review):

      Summary:

      This study investigated how listeners adapt to and utilize statistical properties of different acoustic spaces to improve speech perception. The researchers used repetitive TMS to perturb neural activity in DLPFC, inhibiting statistical learning compared to sham conditions. The authors also identified the most effective room types for the effective use of reverberations in speech in noise perception, with regular human-built environments bringing greater benefits than modified rooms with lower or higher reverberation times.

      Strengths:

      The introduction and discussion sections of the paper are very interesting and highlight the importance of the current study, particularly with regard to the use of ecologically valid stimuli in investigating statistical learning. However, they could be condensed into parts. TMS parameters and task conditions were well-considered and clearly explained.

      Weaknesses

      (1) The Results section is difficult to follow and includes a lot of detail, which could be removed. As such, it presents as confusing and speculative at times.

      (2) The hypotheses for the study are not clearly stated.

      (3) Multiple statistical models are implemented without correcting the alpha value. This leaves the analyses vulnerable to Type I errors.

      (4) It is confusing to understand how many discrete experiments are included in the study as a whole, and how many participants are involved in each experiment.

      (5) The TMS study is significantly underpowered and not robust. Sample size calculations need further explanation (effect sizes appear to be based on behavioural studies?). I would caution an exploratory presentation of these data, and calculate a posteriori the full sample size based on effect sizes observed in the TMS data.

    5. Reviewer #1 (Public review):

      Summary:

      This manuscript describes the results of an experiment that demonstrates a disruption in statistical learning of room acoustics when transcranial magnetic stimulation (TMS) is applied to the dorsolateral prefrontal cortex in human listeners. The work uses a testing paradigm designed by the Zahorik group that has shown improvement in speech understanding as a function of listening exposure time in a room, presumably through a mechanism of statistical learning. The manuscript is comprehensive and clear, with detailed figures that show key results. Overall, this work provides an explanation for the mechanisms that support such statistical learning of room acoustics and, therefore, represents a major advancement for the field.

      Strengths:

      The primary strength of the work is its simple and clear result, that the dorsolateral prefrontal cortex is involved in human room acoustic learning.

      Weaknesses:

      A potential weakness of this work is that the manuscript is quite lengthy and complex.

    6. eLife Assessment:

      This study addresses valuable questions about the neural mechanisms underlying statistical learning of room acoustics, combining robust behavioral measures with non-invasive brain stimulation. The behavioral findings are strong and extend previous work in psychoacoustics, but the TMS results are modest, with methodological limitations and over-interpretation that weaken the mechanistic conclusions. The strength of evidence is therefore incomplete, and a more cautious interpretation of the stimulation findings, alongside strengthened analyses, would improve the manuscript.

    1. eLife Assessment

      This important study evaluates a model for multisensory correlation detection, focusing on the detection of correlated transients in visual and auditory stimuli. Overall, the experimental design is sound and the evidence is compelling. The synergy between the experimental and theoretical aspects of the article is strong, and the work will be of interest to both neuroscientists and psychologists working in the domain of sensory processing and perception

    2. Reviewer #1 (Public review):

      Summary:

      Parise presents another instantiation of the Multisensory Correlation Detector model that can now accept stimulus-level inputs. This is a valuable development as it removes researcher involvement in the characterization/labeling of features and allows analysis of complex stimuli with a high degree of nuance that was previously unconsidered (i.e. spatial/spectral distributions across time). The author demonstrates the power of the model by fitting data from dozens of previous experiments including multiple species, tasks, behavioral modality, and pharmacological interventions.

      Strengths:

      One of the model's biggest strengths, in my opinion, is its ability to extract complex spatiotemporal co-relationships from multisensory stimuli. These relationships have typically been manually computed or assigned based on stimulus condition and often distilled to a single dimension or even single number (e.g., "-50 ms asynchrony"). Thus, many models of multisensory integration depend heavily on human preprocessing of stimuli and these models miss out on complex dynamics of stimuli; the lead modality distribution apparent in figure 3b and c are provocative. I can imagine the model revealing interesting characteristics of the facial distribution of correlation during continuous audiovisual speech that have up to this point been largely described as "present" and almost solely focused on the lip area.

      Another aspect that makes the MCD stand out among other models is the biological inspiration and generalizability across domains. The model was developed to describe a separate process - motion perception - and in a much simpler organism - drosophila. It could then describe a very basic neural computation that has been conserved across phylogeny (which is further demonstrated in the ability to predict rat, primate, and human data) and brain area. This aspect makes the model likely able to account for much more than what has already been demonstrated with only a few tweaks akin to the modifications described in this and previous articles from Parise.

      What allows this potential is that, as Parise and colleagues have demonstrated in those papers since our (re)introduction of the model in 2016, the MCD model is modular - both in its ability to interface with different inputs/outputs and its ability to chain MCD units in a way that can analyze spatial, spectral, or any other arbitrary dimension of a stimulus. This fact leaves wide-open the possibilities for types of data, stimuli, and tasks a simplistic neutrally inspired model can account for.

      And so it's unsurprising (but impressive!) that Parise has demonstrated the model's ability here to account for such a wide range of empirical data from numerous tasks (synchrony/temporal order judgement, localization, detection, etc.) and behavior types (manual/saccade responses, gaze, etc.) using only the stimulus and a few free parameters. This ability is another of the model's main strengths that I think deserves some emphasis: it represents a kind of validation of those experiments - especially in the context of cross-experiment predictions.

      Finally, what is perhaps most impressive to me is that the MCD (and the accompanying decision model) does all this with very few (sometimes zero) free parameters. This highlights the utility of the model and the plausibility of its underlying architecture, but also helps to prevent extreme overfitting if fit correctly.

      Weaknesses:

      The model boasts an incredible versatility across tasks and stimulus configurations and its overall scope of the model is to understand how and what relevant sensory information is extracted from a stimulus. We still need to exercise care when interpreting its parameters, especially considering the broader context of top-down control of perception and that some multisensory mappings may not be derivable purely from stimulus statistics (e.g., the complementary nature of some phonemes/visemes).

    3. Reviewer #2 (Public review):

      Summary:

      Building on previous models of multisensory integration (including their earlier correlation-detection framework used for non-spatial signals), the author introduces a population-level Multisensory Correlation Detector (MCD) that processes raw auditory and visual data. Crucially, it does not rely on abstracted parameters, as is common in normative Bayesian models," but rather works directly on the stimulus itself (i.e., individual pixels and audio samples). By systematically testing the model against a range of experiments spanning human, monkey, and rat data - the authors show that their MCD population approach robustly predicts perception and behavior across species with a relatively small (0-4) number of free parameters.

      Strengths:

      (1) Unlike prior Bayesian models that used simplified or parameterized inputs, the model here is explicitly computable from full natural stimuli. This resolves a key gap in understanding how the brain might extract "time offsets" or "disparities" from continuously changing audio-visual streams.

      (2) The same population MCD architecture captures a remarkable range of multisensory phenomena, from classical illusions (McGurk, ventriloquism) and synchrony judgments, to attentional/gaze behavior driven by audio-visual salience. This generality strongly supports the idea that a single low-level computation (correlation detection) can underlie many distinct multisensory effects.

      (3) By tuning model parameters to different temporal rhythms (e.g., faster in rodents, slower in humans), the MCD explains cross-species perceptual data without reconfiguring the underlying architecture.

      (4) The authors frame their model as a plausible algorithmic account of the Bayesian multisensory-integration models in Marr's levels of hierarchy.

      Weaknesses:

      What remains unclear is how the parameters themselves relate to stimulus quantities (like stimulus uncertainty), as is often straightforward in Bayesian models. A theoretical missing link is the explicit relationship between the parameters of the MCD models and those of a cue combination model, thereby bridging Marr's levels of hierarchy.

      Likely Impact and Usefulness

      The work offers a compelling unification of multiple multisensory tasks-temporal order judgments, illusions, Bayesian causal inference, and overt visual attention-under a single, fully stimulus-driven framework. Its success with natural stimuli should interest computational neuroscientists, systems neuroscientists, and machine learning scientists. This paper thus makes an important contribution to the field by moving beyond minimalistic lab stimuli, illustrating how raw audio and video can be integrated using elementary correlation analyses.

    4. Author response:

      The following is the authors’ response to the original reviews.

      Reviewer #1 (Public review):

      Summary:

      Parise presents another instantiation of the Multisensory Correlation Detector model that can now accept stimulus-level inputs. This is a valuable development as it removes researcher involvement in the characterization/labeling of features and allows analysis of complex stimuli with a high degree of nuance that was previously unconsidered (i.e., spatial/spectral distributions across time). The author demonstrates the power of the model by fitting data from dozens of previous experiments, including multiple species, tasks, behavioral modalities, and pharmacological interventions.

      Thanks for the kind words!

      Strengths:

      One of the model's biggest strengths, in my opinion, is its ability to extract complex spatiotemporal co-relationships from multisensory stimuli. These relationships have typically been manually computed or assigned based on stimulus condition and often distilled to a single dimension or even a single number (e.g., "-50 ms asynchrony"). Thus, many models of multisensory integration depend heavily on human preprocessing of stimuli, and these models miss out on complex dynamics of stimuli; the lead modality distribution apparent in Figures 3b and c is provocative. I can imagine the model revealing interesting characteristics of the facial distribution of correlation during continuous audiovisual speech that have up to this point been largely described as "present" and almost solely focused on the lip area.

      Another aspect that makes the MCD stand out among other models is the biological inspiration and generalizability across domains. The model was developed to describe a separate process - motion perception - and in a much simpler organism - Drosophila. It could then describe a very basic neural computation that has been conserved across phylogeny (which is further demonstrated in the ability to predict rat, primate, and human data) and brain area. This aspect makes the model likely able to account for much more than what has already been demonstrated with only a few tweaks akin to the modifications described in this and previous articles from Parise.

      What allows this potential is that, as Parise and colleagues have demonstrated in those papers since our (re)introduction of the model in 2016, the MCD model is modular - both in its ability to interface with different inputs/outputs and its ability to chain MCD units in a way that can analyze spatial, spectral, or any other arbitrary dimension of a stimulus. This fact leaves wide open the possibilities for types of data, stimuli, and tasks a simplistic, neutrally inspired model can account for.

      And so it's unsurprising (but impressive!) that Parise has demonstrated the model's ability here to account for such a wide range of empirical data from numerous tasks (synchrony/temporal order judgement, localization, detection, etc.) and behavior types (manual/saccade responses, gaze, etc.) using only the stimulus and a few free parameters. This ability is another of the model's main strengths that I think deserves some emphasis: it represents a kind of validation of those experiments, especially in the context of cross-experiment predictions (but see some criticism of that below).

      Finally, what is perhaps most impressive to me is that the MCD (and the accompanying decision model) does all this with very few (sometimes zero) free parameters. This highlights the utility of the model and the plausibility of its underlying architecture, but also helps to prevent extreme overfitting if fit correctly (but see a related concern below).

      We sincerely thank the reviewer for their thoughtful and generous comments. We are especially pleased that the core strengths of the model—its stimulus-computable architecture, biological grounding, modularity, and cross-domain applicability—were clearly recognized. As the reviewer rightly notes, removing researcher-defined abstractions and working directly from naturalistic stimuli opens the door to uncovering previously overlooked dynamics in complex multisensory signals, such as the spatial and temporal richness of audiovisual speech.

      We also appreciate the recognition of the model’s origins in a simple organism and its generalization across species and behaviors. This phylogenetic continuity reinforces our view that the MCD captures a fundamental computation with wide-ranging implications. Finally, we are grateful for the reviewer’s emphasis on the model’s predictive power across tasks and datasets with few or no free parameters—a property we see as key to both its parsimony and explanatory utility.

      We have highlighted these points more explicitly in the revised manuscript, and we thank the reviewer for their generous and insightful endorsement of the work.

      Weaknesses:

      There is an insufficient level of detail in the methods about model fitting. As a result, it's unclear what data the models were fitted and validated on. Were models fit individually or on average group data? Each condition separately? Is the model predictive of unseen data? Was the model cross-validated? Relatedly, the manuscript mentions a randomization test, but the shuffled data produces model responses that are still highly correlated to behavior despite shuffling. Could it be that any stimulus that varies in AV onset asynchrony can produce a psychometric curve that matches any other task with asynchrony judgements baked into the task? Does this mean all SJ or TOJ tasks produce correlated psychometric curves? Or more generally, is Pearson's correlation insensitive to subtle changes here, considering psychometric curves are typically sigmoidal? Curves can be non-overlapping and still highly correlated if one is, for example, scaled differently. Would an error term such as mean-squared or root mean-squared error be more sensitive to subtle changes in psychometric curves? Alternatively, perhaps if the models aren't cross-validated, the high correlation values are due to overfitting?

      The reviewer is right: the current version of the manuscript only provides limited information about parameter fitting. In the revised version of the manuscript, we included a parameter estimation and generalizability section that includes all information requested by the reviewer.

      To test whether using the MSE instead of Pearson correlation led to a similar estimated set of parameter values, we repeated the fitting using the MSE. The parameter estimated with this method (TauV, TauA, TauBim) closely followed those estimated using Pearson correlation (TauV, TauA, TauBim). Given the similarity of these results, we have chosen not to include further figures, however this analysis is now included in the new section (pages 23-24).

      Regarding the permutation test, it is expected that different stimuli produce analogous psychometric functions: after all, all studies relied on stimuli containing identical manipulation of lags. As a result, MCD population responses tend to be similar across experiments. Therefore, it is not a surprise that the permuted distribution of MCD-data correlation in Supplementary Figure 1K has a mean as high as 0.97. However, what is important is to demonstrate that the non-permuted dataset has an even higher goodness of fit. Supplementary Figure 1K demonstrates that none of the permuted stimuli could outperform the non-permuted dataset; the mean of the non-permuted distribution is 4.7 (standard deviations) above the mean of the already high  permuted distribution.

      We believe the new section, along with the present response, fully addresses the legitimate concerns of the reviewer.

      While the model boasts incredible versatility across tasks and stimulus configurations, fitting behavioral data well doesn't mean we've captured the underlying neural processes, and thus, we need to be careful when interpreting results. For example, the model produces temporal parameters fitting rat behavior that are 4x faster than when fitting human data. This difference in slope and a difference at the tails were interpreted as differences in perceptual sensitivity related to general processing speeds of the rat, presumably related to brain/body size differences. While rats no doubt have these differences in neural processing speed/integration windows, it seems reasonable that a lot of the differences in human and rat psychometric functions could be explained by the (over)training and motivation of rats to perform on every trial for a reward - increasing attention/sensitivity (slope) - and a tendency to make mistakes (compression evident at the tails). Was there an attempt to fit these data with a lapse parameter built into the decisional model as was done in Equation 21? Likewise, the fitted parameters for the pharmacological manipulations during the SJ task indicated differences in the decisional (but not the perceptual) process and the article makes the claim that "all pharmacologically-induced changes in audiovisual time perception" can be attributed to decisional processes "with no need to postulate changes in low-level temporal processing." However, those papers discuss actual sensory effects of pharmacological manipulation, with one specifically reporting changes to response timing. Moreover, and again contrary to the conclusions drawn from model fits to those data, both papers also report a change in psychometric slope/JND in the TOJ task after pharmacological manipulation, which would presumably be reflected in changes to the perceptual (but not the decisional) parameters.

      Fitting or predicting behaviour does not in itself demonstrate that a model captures the underlying neural computations—though it may offer valuable constraints and insights. In line with this, we were careful not to extrapolate the implications of our simulations to specific neural mechanisms.

      Temporal sensitivity is, by definition, a behavioural metric, and—as the reviewer correctly notes—its estimation may reflect a range of contributing factors beyond low-level sensory processing, including attention, motivation, and lapse rates (i.e., stimulus-independent errors). In Equation 21, we introduced a lapse parameter specifically to account for such effects in the context of monkey eye-tracking data. For the rat datasets, however, the inclusion of a lapse term was not required to achieve a close fit to the psychometric data (ρ = 0.981). While it is likely that adding a lapse component would yield a marginally better fit, the absence of single-trial data prevents us from applying model comparison criteria such as AIC or BIC to justify the additional parameter. In light of this, and to avoid unnecessary model complexity, we opted not to include a lapse term in the rat simulations.

      With respect to the pharmacological manipulation data, we acknowledge the reviewer’s point that observed changes in slope and bias could plausibly arise from alterations at either the sensory or decisional level—or both. In our model, low-level sensory processing is instantiated by the MCD architecture, which outputs the MCDcorr and MCDlag signals that are then scaled and integrated during decision-making. Importantly, this scaling operation influences the slope of the resulting psychometric functions, such that changes in slope can arise even in the absence of any change to the MCD’s temporal filters. In our simulations, the temporal constants of the MCD units were fixed to the values estimated from the non-pharmacological condition (see parameter estimation section above), and only the decision-related parameters were allowed to vary. From this modelling perspective, the behavioural effects observed in the pharmacological datasets can be explained entirely by changes at the decisional level. However, we do not claim that such an explanation excludes the possibility of genuine sensory-level changes. Rather, we assert that our model can account for the observed data without requiring modifications to early temporal tuning.

      To rigorously distinguish sensory from decisional effects, future experiments will need to employ stimuli with richer temporal structure—e.g., temporally modulated sequences of clicks and flashes that vary in frequency, phase, rhythm, or regularity (see Fujisaki & Nishida, 2007; Denison et al., 2012; Parise & Ernst, 2016, 2025; Locke & Landy, 2017; Nidiffer et al., 2018). Such stimuli engage the MCD in a more stimulus-dependent manner, enabling a clearer separation between early sensory encoding and later decision-making processes. Unfortunately, the current rat datasets—based exclusively on single click-flash pairings—lack the complexity needed for such disambiguation. As a result, while our simulations suggest that the observed pharmacologically induced effects can be attributed to changes in decision-level parameters, they do not rule out concurrent sensory-level changes.

      In summary, our results indicate that changes in the temporal tuning of MCD units are not necessary to reproduce the observed pharmacological effects on audiovisual timing behaviour. However, we do not assert that such changes are absent or unnecessary in principle. Disentangling sensory and decisional contributions will ultimately require richer datasets and experimental paradigms designed specifically for this purpose. We have now modified the results section (page 6) and the discussion (page 11) to clarify these points.

      The case for the utility of a stimulus-computable model is convincing (as I mentioned above), but its framing as mission-critical for understanding multisensory perception is overstated, I think. The line for what is "stimulus computable" is arbitrary and doesn't seem to be followed in the paper. A strict definition might realistically require inputs to be, e.g., the patterns of light and sound waves available to our eyes and ears, while an even more strict definition might (unrealistically) require those stimuli to be physically present and transduced by the model. A reasonable looser definition might allow an "abstract and low-dimensional representation of the stimulus, such as the stimulus envelope (which was used in the paper), to be an input. Ultimately, some preprocessing of a stimulus does not necessarily confound interpretations about (multi)sensory perception. And on the flip side, the stimulus-computable aspect doesn't necessarily give the model supreme insight into perception. For example, the MCD model was "confused" by the stimuli used in our 2018 paper (Nidiffer et al., 2018; Parise & Ernst, 2025). In each of our stimuli (including catch trials), the onset and offset drove strong AV temporal correlations across all stimulus conditions (including catch trials), but were irrelevant to participants performing an amplitude modulation detection task. The to-be-detected amplitude modulations, set at individual thresholds, were not a salient aspect of the physical stimulus, and thus only marginally affected stimulus correlations. The model was of course, able to fit our data by "ignoring" the on/offsets (i.e., requiring human intervention), again highlighting that the model is tapping into a very basic and ubiquitous computational principle of (multi)sensory perception. But it does reveal a limitation of such a stimulus-computable model: that it is (so far) strictly bottom-up.

      We appreciate the reviewer’s thoughtful engagement with the concept of stimulus computability. We agree that the term requires careful definition and should not be taken as a guarantee of perceptual insight or neural plausibility. In our work, we define a model as “stimulus-computable” if all its inputs are derived directly from the stimulus, rather than from experimenter-defined summary descriptors such as temporal lag, spatial disparity, or cue reliability. In the context of multisensory integration, this implies that a model must account not only for how cues are combined, but also for how those cues are extracted from raw inputs—such as audio waveforms and visual contrast sequences.

      This distinction is central to our modelling philosophy. While ideal observer models often specify how information should be combined once identified, they typically do not address the upstream question of how this information is extracted from sensory input. In that sense, models that are not stimulus-computable leave out a key part of the perceptual pipeline. We do not present stimulus computability as a marker of theoretical superiority, but rather as a modelling constraint that is necessary if one’s aim is to explain how structured sensory input gives rise to perception. This is a view that is also explicitly acknowledged and supported by Reviewer 2.

      Framed in Marr’s (1982) terms, non–stimulus-computable models tend to operate at the computational level, defining what the system is doing (e.g., computing a maximum likelihood estimate), whereas stimulus-computable models aim to function at the algorithmic level, specifying how the relevant representations and operations might be implemented. When appropriately constrained by biological plausibility, such models may also inform hypotheses at the implementational level, pointing to potential neural substrates that could instantiate the computation.

      Regarding the reviewer’s example illustrating a limitation of the MCD model, we respectfully note that the account appears to be based on a misreading of our prior work. In Parise & Ernst (2025), where we simulated the stimuli from Nidiffer et al. (2018), the MCD model reproduced participants’ behavioural data without any human intervention or adjustment. The model was applied in a fully bottom-up, stimulus-driven manner, and its output aligned with observer responses as-is. We suspect the confusion may stem from analyses shown in Figure 6 - Supplement Figure 5 of Parise & Ernst (2025), where we investigated the lack of a frequency-doubling effect in the Nidiffer et al. data. However, those analyses were based solely on the Pearson correlation between auditory and visual stimulus envelopes and did not involve the MCD model. No manual exclusion of onset/offset events was applied, nor was the MCD used in those particular figures. We also note that Parise & Ernst (2025) is a separate, already published study and is not the manuscript currently under review. 

      In summary, while we fully agree that stimulus computability does not resolve all the complexities of multisensory perception (see comments below about speech), we maintain that it provides a valuable modelling constraint—one that enables robust, generalisable predictions when appropriately scoped. 

      The manuscript rightly chooses to focus a lot of the work on speech, fitting the MCD model to predict behavioral responses to speech. The range of findings from AV speech experiments that the MCD can account for is very convincing. Given the provided context that speech is "often claimed to be processed via dedicated mechanisms in the brain," a statement claiming a "first end-to-end account of multisensory perception," and findings that the MCD model can account for speech behaviors, it seems the reader is meant to infer that energetic correlation detection is a complete account of speech perception. I think this conclusion misses some facets of AV speech perception, such as integration of higher-order, non-redundant/correlated speech features (Campbell, 2008) and also the existence of top-down and predictive processing that aren't (yet!) explained by MCD. For example, one important benefit of AV speech is interactions on linguistic processes - how complementary sensitivity to articulatory features in the auditory and visual systems (Summerfield, 1987) allow constraint of linguistic processes (Peelle & Sommers, 2015; Tye-Murray et al., 2007).

      We thank the reviewer for their thoughtful comments, and especially for the kind words describing the range of findings from our AV speech simulations as “very convincing.”

      We would like to clarify that it is not our view that speech perception can be reduced to energetic correlation detection. While the MCD model captures low- to mid-level temporal dependencies between auditory and visual signals, we fully agree that a complete account of audiovisual speech perception must also include higher-order processes—including linguistic mechanisms and top-down predictions. These are critical components of AV speech comprehension, and lie beyond the scope of the current model.

      Our use of the term “end-to-end” is intended in a narrow operational sense: the model transforms raw audiovisual input (i.e., audio waveforms and video frames) directly into behavioural output (i.e., button press responses), without reliance on abstracted stimulus parameters such as lag, disparity or reliability. It is in this specific technical sense that the MCD offers an end-to-end model. We have revised the manuscript to clarify this usage to avoid any misunderstanding.

      In light of the reviewer’s valuable point, we have now edited the Discussion to acknowledge the importance of linguistic processes (page 13) and to clarify what we mean by end-to-end account (page 11). We agree that future work will need to explore how stimulus-computable models such as the MCD can be integrated with broader frameworks of linguistic and predictive processing (e.g., Summerfield, 1987; Campbell, 2008; Peelle & Sommers, 2015; Tye-Murray et al., 2007).

      References

      Campbell, R. (2008). The processing of audio-visual speech: empirical and neural bases. Philosophical Transactions of the Royal Society B: Biological Sciences, 363(1493), 1001-1010. https://doi.org/10.1098/rstb.2007.2155

      Nidiffer, A. R., Diederich, A., Ramachandran, R., & Wallace, M. T. (2018). Multisensory perception reflects individual differences in processing temporal correlations. Scientific Reports 2018 8:1, 8(1), 1-15. https://doi.org/10.1038/s41598-018-32673-y

      Parise, C. V, & Ernst, M. O. (2025). Multisensory integration operates on correlated input from unimodal transient channels. ELife, 12. https://doi.org/10.7554/ELIFE.90841

      Peelle, J. E., & Sommers, M. S. (2015). Prediction and constraint in audiovisual speech perception. Cortex, 68, 169-181. https://doi.org/10.1016/j.cortex.2015.03.006

      Summerfield, Q. (1987). Some preliminaries to a comprehensive account of audio-visual speech perception. In B. Dodd & R. Campbell (Eds.), Hearing by Eye: The Psychology of Lip-Reading (pp. 3-51). Lawrence Erlbaum Associates.

      Tye-Murray, N., Sommers, M., & Spehar, B. (2007). Auditory and Visual Lexical Neighborhoods in Audiovisual Speech Perception: Trends in Amplification, 11(4), 233-241. https://doi.org/10.1177/1084713807307409

      Reviewer #2 (Public review):

      Summary:

      Building on previous models of multisensory integration (including their earlier correlation-detection framework used for non-spatial signals), the author introduces a population-level Multisensory Correlation Detector (MCD) that processes raw auditory and visual data. Crucially, it does not rely on abstracted parameters, as is common in normative Bayesian models," but rather works directly on the stimulus itself (i.e., individual pixels and audio samples). By systematically testing the model against a range of experiments spanning human, monkey, and rat data, the authors show that their MCD population approach robustly predicts perception and behavior across species with a relatively small (0-4) number of free parameters.

      Strengths:

      (1) Unlike prior Bayesian models that used simplified or parameterized inputs, the model here is explicitly computable from full natural stimuli. This resolves a key gap in understanding how the brain might extract "time offsets" or "disparities" from continuously changing audio-visual streams.

      (2) The same population MCD architecture captures a remarkable range of multisensory phenomena, from classical illusions (McGurk, ventriloquism) and synchrony judgments, to attentional/gaze behavior driven by audio-visual salience. This generality strongly supports the idea that a single low-level computation (correlation detection) can underlie many distinct multisensory effects.

      (3) By tuning model parameters to different temporal rhythms (e.g., faster in rodents, slower in humans), the MCD explains cross-species perceptual data without reconfiguring the underlying architecture.

      We thank the reviewer for their positive evaluation of the manuscript, and particularly for highlighting the significance of the model's stimulus-computable architecture and its broad applicability across species and paradigms. Please find our responses to the individual points below.

      Weaknesses:

      (1) The authors show how a correlation-based model can account for the various multisensory integration effects observed in previous studies. However, a comparison of how the two accounts differ would shed light on the correlation model being an implementation of the Bayesian computations (different levels in Marr's hierarchy) or making testable predictions that can distinguish between the two frameworks. For example, how uncertainty in the cue combined estimate is also the harmonic mean of the unimodal uncertainties is a prediction from the Bayesian model. So, how the MCD framework predicts this reduced uncertainty could be one potential difference (or similarity) to the Bayesian model.

      We fully agree with the reviewer that a comparison between the correlation-based MCD model and Bayesian accounts is valuable—particularly for clarifying how the two frameworks differ conceptually and where they may converge.

      As noted in the revised manuscript, the key distinction lies in the level of analysis described by Marr (1982). Bayesian models operate at the computational level, describing what the system is aiming to compute (e.g., optimal cue integration). In contrast, the MCD functions at the algorithmic level, offering a biologically plausible mechanism for how such integration might emerge from stimulus-driven representations.

      In this context, the MCD provides a concrete, stimulus-grounded account of how perceptual estimates might be constructed—potentially implementing computations with Bayesian-like characteristics (e.g., reduced uncertainty, cue weighting). Thus, the two models are not mutually exclusive but can be seen as complementary: the MCD may offer an algorithmic instantiation of computations that, at the abstract level, resemble Bayesian inference.

      We have now updated the manuscript to explicitly highlight this relationship (pages 2 and 11). In the revised manuscript, we also included a new figure (Figure 5) and movie (Supplementary Movie 3), to show how the present approach extends previous Bayesian models for the case of cue integration (i.e., the ventriloquist effect).

      (2) The authors show a good match for cue combination involving 2 cues. While Bayesian accounts provide a direction for extension to more cues (also seen empirically, for eg, in Hecht et al. 2008), discussion on how the MCD model extends to more cues would benefit the readers.

      We thank the reviewer for this insightful comment: extending the MCD model to include more than two sensory modalities is a natural and valuable next step. Indeed, one of the strengths of the MCD framework lies in its modularity. Let us consider the MCDcorr​ output (Equation 6), which is computed as the pointwise product of transient inputs across modalities. Extending this to include a third modality, such as touch, is straightforward: MCD units would simply multiply the transient channels from all three modalities, effectively acting as trimodal coincidence detectors that respond when all inputs are aligned in time and space.

      By contrast, extending MCDlag is less intuitive, due to its reliance on opponency between two subunits (via subtraction). A plausible solution is to compute MCDlag in a pairwise fashion (e.g., AV, VT, AT), capturing relative timing across modality pairs.

      Importantly, the bulk of the spatial integration in our framework is carried by MCDcorr, which generalises naturally to more than two modalities. We have now formalised this extension and included a graphical representation in a supplementary section of the revised manuscript.

      Likely Impact and Usefulness:

      The work offers a compelling unification of multiple multisensory tasks- temporal order judgments, illusions, Bayesian causal inference, and overt visual attention - under a single, fully stimulus-driven framework. Its success with natural stimuli should interest computational neuroscientists, systems neuroscientists, and machine learning scientists. This paper thus makes an important contribution to the field by moving beyond minimalistic lab stimuli, illustrating how raw audio and video can be integrated using elementary correlation analyses.

      Reviewer #1 (Recommendations for the authors):

      Recommendations:

      My biggest concern is a lack of specificity about model fitting, which is assuaged by the inclusion of sufficient detail to replicate the analysis completely or the inclusion of the analysis code. The code availability indicates a script for the population model will be included, but it is unclear if this code will provide the fitting details for the whole of the analysis.

      We thank the reviewer for raising this important point. A new methodological section has been added to the manuscript, detailing the model fitting procedures used throughout the study. In addition, the accompanying code repository now includes MATLAB scripts that allow full replication of the spatiotemporal MCD simulations.

      Perhaps it could be enlightening to re-evaluate the model with a measure of error rather than correlation? And I think many researchers would be interested in the model's performance on unseen data.

      The model has now been re-evaluated using mean squared error (MSE), and the results remain consistent with those obtained using Pearson correlation. Additionally, we have clarified which parts of the study involve testing the model on unseen data (i.e., data not used to fit the temporal constants of the units). These analyses are now included and discussed in the revised fitting section of the manuscript (pages 23-24).

      Otherwise, my concerns involve the interpretation of findings, and thus could be satisfied with minor rewording or tempering conclusions.

      The manuscript has been revised to address these interpretative concerns, with several conclusions reworded or tempered accordingly. All changes are marked in blue in the revised version.

      Miscellanea:

      Should b0 in equation 10 be bcrit to match the below text?

      Thank you for catching this inconsistency. We have corrected Equation 10 (and also Equation 21) to use the more transparent notation bcrit instead of b0, in line with the accompanying text.

      Equation 23, should time be averaged separately? For example, if multiple people are speaking, the average correlation for those frames will be higher than the average correlation across all times.

      We thank the reviewer for raising this thoughtful and important point. In response, we have clarified the notation of Equation 23 in the revised manuscript (page 20). Specifically, we now denote the averaging operations explicitly as spatial means and standard deviations across all pixel locations within each frame.

      This equation computes the z-score of the MCD correlation value at the current gaze location, normalized relative to the spatial distribution of correlation values in the same frame. That is, all operations are performed at the frame level, not across time. This ensures that temporally distinct events are treated independently and that the final measure reflects relative salience within each moment, not a global average over the stimulus. In other words, the spatial distribution of MCD activity is re-centered and rescaled at each frame, exactly to avoid the type of inflation or confounding the reviewer rightly cautioned against.

      Reviewer #2 (Recommendations for the authors):

      The authors have done a great job of providing a stimulus computable model of cue combination. I had just a few suggestions to strengthen the theoretical part of the paper:

      (1) While the authors have shown a good match between MCD and cue combination, some theoretical justification or equivalence analysis would benefit readers on how the two relate to each other. Something like Zhang et al. 2019 (which is for motion cue combination) would add to the paper.

      We agree that it is important to clarify the theoretical relationship between the Multisensory Correlation Detector (MCD) and normative models of cue integration, such as Bayesian combination. In the revised manuscript, we have now modified the introduction and added a paragraph in the Discussion addressing this link more explicitly. In brief, we see the MCD as an algorithmic-level implementation (in Marr’s terms) that may approximate or instantiate aspects of Bayesian inference.

      (2) Simulating cue combination for tasks that require integration of more than two cues (visual, auditory, haptic cues) would more strongly relate the correlation model to Bayesian cue combination. If that is a lot of work, at least discussing this would benefit the paper

      This point has now been addressed, and a new paragraph discussing the extension of the MCD model to tasks involving more than two sensory modalities has been added to the Discussion section.

    1. eLife Assessment

      This study is a fundamental advance in the field of developmental biology and transcriptional regulation that demonstrates the use of hPSC-derived organoids to generate reproducible organoids to study the mechanisms that drive neural tube closure. The work is exceptional in its development of tools to use CRISPR interference to screen for genes that regulate morphogenesis in human PSC organoids. The additional characterization of the role of specific transcription factors in neural tube formation is solid. The work provides both technical advances and new knowledge on human development through embryo models.

    2. Reviewer #1 (Public review):

      Summary:

      This is a wonderful and landmark study in the field of human embryo modeling. It uses patterned human gastruloids and conducts a functional screen on neural tube closure, and identifies positive and negative regulators, and defines the epistasis among them.

      Strengths:

      The above was achieved following optimization of the micro-pattern-based gastruloid protocol to achieve high efficiency, and then optimized to conduct and deliver CRISPRi without disrupting the protocol. This is a technical tour de force as well as one of the first studies to reveal new knowledge on human development through embryo models, which has not been done before.

      The manuscript is very solid and well-written. The figures are clear, elegant, and meaningful. The conclusions are fully supported by the data shown. The methods are well-detailed, which is very important for such a study.

      Weaknesses:

      This reviewer did not identify any meaningful, major, or minor caveats that need addressing or correcting.

      A minor weakness is that one can never find out if the findings in human embryo models can be in vitro revalidated in humans in vivo. This is for obvious and justified ethical reasons. However, the authors acknowledge this point in the section of the manuscript detailing the limitations of their study.

    3. Reviewer #2 (Public review):

      Summary:

      This manuscript is a technical report on a new model of early neurogenesis, coupled to a novel platform for genetic screens. The model is more faithful than others published to date, and the screening platform is an advance over existing ones in terms of speed and throughput.

      Strengths:

      It is novel and useful.

      Weaknesses:

      The novelty of the results is limited in terms of biology, mainly a proof of concept of the platform and a very good demonstration of the hierarchical interactions of the top regulators of GRNs.

      The value of the manuscript could be enhanced in two ways:

      (1) by showing its versatility and transforming the level of neural tube to midbrain and hindbrain, and looking at the transcriptional hierarchies there.

      (2) by relating the patterning of the organoids to the situation in vivo, in particular with the information in reference 49. The authors make a statement "To compare our findings with in vivo gene expression patterns, we applied the same approach to published scRNA-seq data from 4-week-old human embryos at the neurula stage" but it would be good to have a more nuanced reference: what stage, what genes are missing, what do they add to the information in that reference?

    1. eLife Assessment

      This useful manuscript reports mechanisms behind the increase in fecundity in response to sub-lethal doses of pesticides in the crop pest, the brown plant hopper. The authors hypothesize that the pesticide works by inducing the JH titer, which through the JH signaling pathway induces egg development, for which the evidence was judged to be solid.

    2. Reviewer #1 (Public review):

      Summary:

      Gao et al. has demonstrated that the the pesticide emamectin benzoate (EB) treatment of brown plathopper (BPH) leads to increased egg laying in the insect, which is a common agricultural pest. The authors hypothesize that EB upregulates JH titer resulting in increased fecundity.

      Strengths:

      The finding that a class of pesticide increases fecundity of brown planthopper is interesting.

      Comments on revisions:

      All my concerns have been addressed to reasonable level of satisfaction.

    1. eLife assessment

      This is a useful study that applies deep transfer learning to assign patient-level disease attributes to single cells of T2D and non-diabetic patients, including obese patients. This analysis identified a single cluster of T2D-associated β-cells; and two subpopulations of obese- β-cells derived from either non-diabetic or T2D donors. The findings were validated at the protein level using immunohistochemistry on islets derived from non-diabetic and T2D organ donors, contributing solid experimental evidence for the computational analyses.

    2. Reviewer #1 (Public review):

      In this manuscript, Roy et al. used the previously published deep transfer learning tool, DEGAS, to map disease associations onto single-cell RNA-seq data from bulk expression data. The authors performed independent runs of DEGAS using T2D or obesity status and identified distinct β-cell subpopulations. β-cells with high obese-DEGAS scores contained two subpopulations derived largely from either non-diabetic or T2D donors. Finally, immunostaining using human pancreas sections from healthy and T2D donors validated the heterogeneous expression and depletion of DLK1 in T2D islets.

      Strengths:

      (1) This meta-analysis of previously published scRNA-seq data uses a deep transfer learning tool.

      (2) Identification of novel beta cell subclusters.

      (3) Identified a relatively innovative role of DLK1 in T2D disease progression.

      Comments on revisions:

      All previous concerns have been addressed.

    3. Reviewer #2 (Public review):

      Summary:

      The manuscript by Gitanjali Roy et al. applies deep transfer learning (DEGAS) to assign patient-level disease attributes (metadata) to single cells of T2D and non-diabetic patients, including obese patients. This led to the identification of a singular cluster of T2D-associated β-cells; and two subpopulations of obese- β-cells derived from either non-diabetic or T2D donors. The objective was to identify novel and established genes implicated in T2D and obesity. Their final goal is to validate their findings at the protein level using immunohistochemistry of pancreas tissue from non-diabetic and T2D organ donors.

      Strengths:

      This paper is well-written, and the findings are relevant for β-cell heterogeneity in T2D and obesity.

      Weaknesses:

      The validation they provide is not sufficiently strong: no DLK1 immunohistochemistry is shown of obese patient-derived sections. Additional presumptive relevant candidates from this transcriptomic analysis should be screened for, at the protein level.

      Comments on revisions:

      The authors have largely addressed my comments. No further experiments are requested.

    1. eLife Assessment

      This is an important study that takes a key step towards understanding developmental disorders linked to mutations in the O-GlcNAc transferase enzyme by generating a mouse model harboring the C921Y mutation. The study thoroughly examines behavioral and anatomical differences in these mice and finds behavioral hyperactivity and learning/memory deficits, as well as phenotypic differences in skull and brain formation. However, the experimental evidence is incomplete owing to discrepancy in OGT protein/RNA levels in the C921Y mutant mice in this paper and the previous paper ("Neurodevelopmental defects in a mouse model of O-GlcNAc transferase intellectual disability "). This line of research will benefit from investigation of the differences in associated glycoproteins and mechanistic insights. This study will be of interest to those studying neurodevelopment, learning and behavior, or associated brain mechanisms.

    2. Reviewer #1 (Public review):

      This study established a C921Y OGT-ID mouse model, systematically demonstrating in mammals the pathological link between O-GlcNAc metabolic imbalance and neurodevelopmental disorders (cortical malformation, microcephaly) as well as behavioral abnormalities (hyperactivity, impulsivity, learning/memory deficits). However, critical flaws in the current findings require resolution to ensure scientific rigor.

      The most concerning finding appears in Figure S12. While Supplementary Figure S12 demonstrates decreased OGA expression without significant OGT level changes in C921Y mutants via Western blot/qPCR, previous reports (Florence Authier, et al., Dis Model Mech. 2023) described OGT downregulation in Western blot and an increase in qPCR in the same models. The opposite OGT expression outcomes in supposedly identical mouse models directly challenge the model's reliability. This discrepancy raises serious concerns about either the experimental execution or the interpretation of results. The authors must revalidate the data with rigorous controls or provide a molecular biology-based explanation.

      A few additional comments to the author may be helpful to improve the study.

      Major

      (1) While this study systematically validated multi-dimensional phenotypes (including neuroanatomical abnormalities and behavioral deficits) in OGT C921Y mutant mice, there is a lack of relevant mechanisms and intervention experiments. For example, the absence of targeted intervention studies on key signaling pathways prevents verification of whether proteomics-identified molecular changes directly drive phenotypic manifestations.

      (2) Although MRI detected nodular dysplasia and heterotopia in the cingulate cortex, the cellular basis remains undefined. Spatiotemporal immunofluorescence analysis using neuronal (NeuN), astrocytic (GFAP), and synaptic (Synaptophysin) markers is recommended to identify affected cell populations (e.g., radial glial migration defects or intermediate progenitor differentiation abnormalities).

      (3) While proteomics revealed dysregulation in pathways including Wnt/β-catenin and mTOR signaling, two critical issues remain unresolved: a) O-GlcNAc glycoproteomic alterations remain unexamined; b) The causal relationship between pathway changes and O-GlcNAc imbalance lacks validation. It is recommended to use co-immunoprecipitation or glycosylation sequencing to confirm whether the relevant proteins undergo O-GlcNAc modification changes, identify specific modification sites, and verify their interactions with OGT.

      (4) Given that OGT-ID neuropathology likely originates embryonically, we recommend serial analyses from E14.5 to P7 to examine cellular dynamics during critical corticogenesis phases.

      (5) The interpretation of Figure 8A constitutes overinterpretation. Current data fail to conclusively demonstrate impairment of OGT's protein interaction network and lack direct evidence supporting the proposed mechanisms of HCF1 misprocessing or OGA loss.

    3. Reviewer #2 (Public review):

      Summary:

      The authors are trying to understand why certain mutants of O-GlcNAc transferase (OGT) appear to cause developmental disorders in humans. As an important step towards that goal, the authors generated a mouse model with one of these mutations that disrupts OGT activity. They then go on to test these mice for behavioral differences, finding that the mutant mice exhibit some signs of hyperactivity and differences in learning and memory. They then examine alterations to the structure of the brain and skull, and again find changes in the mutant mice that have been associated with developmental disorders. Finally, they identify proteins that are up- or down-regulated between the two mice as potential mechanisms to explain the observations.

      Strengths:

      The major strength of this manuscript is the creation of this mouse model, as a key step in beginning to understand how OGT mutants cause developmental disorders. This line will prove important for not only the authors but other investigators as well, enabling the testing of various hypotheses and potentially treatments. The experiments are also rigorously performed, and the conclusions are well supported by the data.

      Weaknesses:

      The only weakness identified is a lack of mechanistic insight. However, this certainly may come in the future through more targeted experimentation using this mouse model.

    4. Author response:

      Reviewer #1 (Public review):

      This study established a C921Y OGT-ID mouse model, systematically demonstrating in mammals the pathological link between O-GlcNAc metabolic imbalance and neurodevelopmental disorders (cortical malformation, microcephaly) as well as behavioral abnormalities (hyperactivity, impulsivity, learning/memory deficits). However, critical flaws in the current findings require resolution to ensure scientific rigor.

      The most concerning finding appears in Figure S12. While Supplementary Figure S12 demonstrates decreased OGA expression without significant OGT level changes in C921Y mutants via Western blot/qPCR, previous reports (Florence Authier, et al., Dis Model Mech. 2023) described OGT downregulation in Western blot and an increase in qPCR in the same models. The opposite OGT expression outcomes in supposedly identical mouse models directly challenge the model's reliability. This discrepancy raises serious concerns about either the experimental execution or the interpretation of results. The authors must revalidate the data with rigorous controls or provide a molecular biology-based explanation.

      The referee’s assessment is based on a misunderstanding – these are certainly not the same experiment repeated twice with different answers. In the previous report of the OGT-C921Y mutant mice (Florence Authier, et al., Dis Model Mech. 2023), OGT and OGA mRNA/protein expression have been assessed in total brain protein extract from 3 months old male mice. In that study we observed a significant reduction in OGT protein levels while OGT mRNA levels were significantly increased in the mutant compared to WT controls. However, in our the current study (Figure S12), OGA and OGT mRNA/protein expression have been a) restricted to the pre-frontal cortex and b) are from 4 months old male mice, which does not allow a direct comparison of the two studies. In the pre-frontal cortex, OGT protein levels are not changed while OGT mRNA levels are increased (similarly to the total brain data), albeit not significantly. The different outcomes of OGT protein levels in both total brain and prefrontal cortex could suggest regional differences in OGT protein levels/stability as OGT mRNA levels are increased in both cases. Three other brain regions (hippocampus, striatum and cerebellum) have now also been assessed for OGT mRNA/protein expression, supporting such regional differences in OGT protein levels and these data will be included in the new version of the manuscript.

      A few additional comments to the author may be helpful to improve the study.

      Major

      (1) While this study systematically validated multi-dimensional phenotypes (including neuroanatomical abnormalities and behavioral deficits) in OGT C921Y mutant mice, there is a lack of relevant mechanisms and intervention experiments. For example, the absence of targeted intervention studies on key signaling pathways prevents verification of whether proteomics-identified molecular changes directly drive phenotypic manifestations.

      We agree with the referee that these experiments would further strenghten the work. They would, however, result in a 1-5 year delay in sharing this work with the scientific and patient communities. We will continue to work along these lines and report separately in the future.

      (2) Although MRI detected nodular dysplasia and heterotopia in the cingulate cortex, the cellular basis remains undefined. Spatiotemporal immunofluorescence analysis using neuronal (NeuN), astrocytic (GFAP), and synaptic (Synaptophysin) markers is recommended to identify affected cell populations (e.g., radial glial migration defects or intermediate progenitor differentiation abnormalities).

      We are currently performing these experiments so that they can be included in the version of record of this manuscript.

      (3) While proteomics revealed dysregulation in pathways including Wnt/β-catenin and mTOR signaling, two critical issues remain unresolved: a) O-GlcNAc glycoproteomic alterations remain unexamined; b) The causal relationship between pathway changes and O-GlcNAc imbalance lacks validation. It is recommended to use co-immunoprecipitation or glycosylation sequencing to confirm whether the relevant proteins undergo O-GlcNAc modification changes, identify specific modification sites, and verify their interactions with OGT.

      We agree with the referee that these experiments would further strenghten the work and will perform further experiments to explore whether these pathways are functionally affected. However, it is important to note that the inference that these proteins must themselves be O-GlcNAc modified is incorrect – indeed, O-GlcNAcylation of unknown protein kinase X, E3 ligase/DUB, Y or transcription factor Z could indirectly affect these pathways/proteins.

      (4) Given that OGT-ID neuropathology likely originates embryonically, we recommend serial analyses from E14.5 to P7 to examine cellular dynamics during critical corticogenesis phases.

      We agree with the referee that these experiments would further strenghten the work. They would, however, result in a significant delay in sharing this work with the scientific and patient communities. We will continue to work along these lines and report separately in the future.

      (5) The interpretation of Figure 8A constitutes overinterpretation. Current data fail to conclusively demonstrate impairment of OGT's protein interaction network and lack direct evidence supporting the proposed mechanisms of HCF1 misprocessing or OGA loss.

      For clarity, we will remove panel A from Figure 8 in the version of record – this panel was only ever meant to represent a priori hypotheses for OGT-CDG mechanisms, none of which have been either excluded or confirmed.

      Reviewer #2 (Public review):

      Summary:

      The authors are trying to understand why certain mutants of O-GlcNAc transferase (OGT) appear to cause developmental disorders in humans. As an important step towards that goal, the authors generated a mouse model with one of these mutations that disrupts OGT activity. They then go on to test these mice for behavioral differences, finding that the mutant mice exhibit some signs of hyperactivity and differences in learning and memory. They then examine alterations to the structure of the brain and skull, and again find changes in the mutant mice that have been associated with developmental disorders. Finally, they identify proteins that are up- or down-regulated between the two mice as potential mechanisms to explain the observations.

      Strengths:

      The major strength of this manuscript is the creation of this mouse model, as a key step in beginning to understand how OGT mutants cause developmental disorders. This line will prove important for not only the authors but other investigators as well, enabling the testing of various hypotheses and potentially treatments. The experiments are also rigorously performed, and the conclusions are well supported by the data.

      Weaknesses:

      The only weakness identified is a lack of mechanistic insight. However, this certainly may come in the future through more targeted experimentation using this mouse model.

      We agree with the referee that these experiments would further strenghten the work. They would, however, result in a 1-5 year delay in sharing this work with the scientific and patient communities. We will continue to work along these lines and report separately in the future.

    1. eLife Assessment

      This useful study uses fiber photometry, implantable lenses, and optogenetics to show that a subset of subthalamic nucleus neurons is active during movement, and that active but not passive avoidance depends in part on STN projections to substantia nigra. The strength of the evidence for these claims is solid, whereas evidence supporting the claims that STN is involved in cautious responding or the speed of avoidance is incomplete. This paper will be of interest to basic and applied behavioural neuroscientists working on avoidance if suitably streamlined to support the strongest claims.

    2. Reviewer #1 (Public review):

      Summary:

      The manuscript presents a robust set of experiments that provide new fundamental insights into the role of STN neurons during active and passive avoidance tasks. These forms of avoidance have received comparatively less attention in the literature than the more extensively studied escape or freezing responses, despite being extremely relevant to human behaviour and more strongly influenced by cognitive control.

      Strengths:

      Understanding the neural infrastructure supporting avoidance behaviour would be a fundamental milestone in neuroscience. The authors employ sophisticated methods, including calcium imaging and optogenetics, to delineate the functions of STN neurons during avoidance behaviours. The work is extremely thorough, and the evidence presented is compelling. Experiments are carefully constructed, well-controlled, and the statistical analyses are appropriate.

      Points for Authors' Consideration:

      (1) Motoric role of STN:<br /> The authors interpret their findings within the context of active avoidance, a cognitively demanding process. An alternative interpretation is that STN activation enhances global motoric tone, facilitating general movement rather than specifically encoding cautious avoidance. Experimentally, this could be evaluated by examining STN-induced motoric tone in non-avoidance contexts, such as open field tests with bilateral stimulations. Alternatively, or additionally, the authors could explicitly discuss evidence for and against the possibility that increased motoric tone may account for aspects of the observed behaviours.

      (2) Temporal Dynamics in Calcium Imaging (AA2 vs. AA1):<br /> Based on previous work by this group, a delay (~1-2 sec) in neuronal response onset was anticipated in AA2 compared to AA1. Although a delay in peak response is observed, there is no clear evidence of a significant delay in response onset or changes in slope of neural activity. The authors could quantify calcium onset latencies and slopes and statistically compare these parameters across conditions.

      (3) Speed Differences (AA2 vs. AA1):<br /> Given the increased latency in AA2, and based on previous work from the group, one would expect faster movements following initiation. However, such differences are not evident in the presented data. The authors might want to discuss the absence of an expected speed increase and clarify whether this absence is consistent with previous findings.

      (4) Behavioural Differences Across Neuronal Classes (Figure 7):<br /> The manuscript currently does not compare responses of neuronal classes I, II, and III between AA1 and AA2 conditions separately or provide information regarding their activity during AA3.

      (5) Streamlining Narrative and Figures:<br /> Given the extensive amount of material presented, the manuscript and figures would benefit from streamlining. Many data points and graphs could be moved to supplementary materials without affecting the core interpretation and simplifying the reading of the work by a non-expert audience. Similarly, the main text could be refined to more clearly emphasise the key findings, which would improve both readability and impact. At the same time, certain aspects would benefit from additional clarification. For example, it would be helpful to explain the key features of the AA1-AA3 tasks at the point of introduction, rather than referring readers to previous literature. Overall, enhancing clarity and accessibility would serve the authors well and broaden the impact of the work.

    3. Reviewer #2 (Public review):

      Summary:

      Zhou, Sajid et al. present a study investigating the STN involvement in signaled movement. They use fiber photometry, implantable lenses, and optogenetics during active avoidance experiments to evaluate this. The data are useful for the scientific community, and the overall evidence for their claims is solid, but many aspects of the findings are confusing and seemingly contradictory. For example, STN activity increases with contraversive turning in the fiber photometry experiments, but optogenetic stimulation of the STN evokes ipsiversive turning. While the authors present a huge collection of data, it is somewhat difficult to extract the key information and the meaningful implications resulting from this data.

      Strengths:

      The study is comprehensive in using many techniques, stimulation powers, frequencies, and configurations.

      Weaknesses:

      Here are the specific weaknesses of the paper.

      (1) Vglut2 isn't a very selective promoter for the STN. Did the authors verify every injection across brain slices to ensure the para-subthalamic nucleus, thalamus, lateral hypothalamus, and other Vglut2-positive structures were never infected?

      (2) The authors say in the methods that the high vs low power laser activation for optogenetic experiments was defined by the behavioral output. This is misleading, and the high vs low power should be objectively stated and the behavioral results divided according to the power used, not according to the behavioral outcome.

      (3) In the fiber photometry experiments exposing mice to the range of tones, it is impossible to separate the STN response to the tone from the STN response to the movement evoked by the tone. The authors should expose the mouse to the tones in a condition that prevents movement, such as anesthetized or restrained, to separate out the two components.

      (4) The claim 'STN activation is ideally suited to drive active avoids' needs more explanation. This claim comes after the fiber photometry experiments during active avoidance tasks, so there has been no causality established yet.

      (5) The statistical comparisons in Figure 7E need some justification and/or clarification. The 9 neuron types are originally categorized based on their response during avoids, then statistics are run showing that they respond differently during avoids. It is no surprise that they would have significantly different responses, since that is how they were classified in the first place. The authors must explain this further and show that this is not a case of circular reasoning.

      (6) The authors show that neurons that have strong responses to orientation show reduced activity during avoidance. What are the implications of this? The author should explain why this is interesting and important.

      (7) It is not clear which conditions each mouse experienced in which order. This is critical to the interpretation of Figure 9 and the reduction of passive avoids during STN stimulation. Did these mice have the CS1+STN stimulation pairing or the STN+US pairing prior to this experiment? If they did, the stimulation of the STN could be strongly associated with either punishment or with the CS1 that predicts punishment. If that is the case, stimulating the STN during CS2 could be like presenting CS1+CS2 at the same time and could be confusing.

      (8) The experiments in Figure 10 are used to say that STN stimulation is not aversive, but they only show that STN stimulation cannot be used as punishment in place of a shock. This doesn't mean that it is not aversive; it just means it is not as aversive as a shock. The authors should do a simpler aversion test, such as conditioned or real-time place preference, to claim that STN stimulation is not aversive. This is particularly surprising as previous work (Serra et al., 2023) does show that STN stimulation is aversive.

      (9) In the discussion, the idea that the STN encodes 'moving away' from contralateral space is pretty vague and unsupported. It is puzzling that the STN activates more strongly to contraversive turns, but when stimulated, it evokes ipsiversive turns; however, it seems a stretch to speculate that this is related to avoidance. In the last experiments of the paper, the axons from the STN to the GPe and to the midbrain are selectively stimulated. Do these evoke ipsiversive turns similarly?

      (10) In the discussion, the authors claim that the STN is essential for modulating action timing in response to demands, but their data really only show this in one direction. The STN stimulation reliably increases the speed of response in all conditions (except maximum speed conditions such as escapes). It seems to be over-interpreting the data to say this is an inability to modulate the speed of the task, especially as clear learning and speed modulation do occur under STN lesion conditions, as shown in Figure 12B. The mice learn to avoid and increase their latency in AA2 vs AA1, though the overall avoids and latency are different from controls. The more parsimonious conclusion would be that STN stimulation biases movement speed (increasing it) and that this is true in many different conditions.

      (11) In the discussion, the authors claim that the STN projections to the midbrain tegmentum directly affect the active avoidance behavior, while the STN projections to the SNr do not affect it. This seems counter to their results, which show STN projections to either area can alter active avoidance behavior. What is the laser power used in these terminal experiments? If it is high (3mW), the authors may be causing antidromic action potentials in the STN somas, resulting in glutamate release in many brain areas, even when terminals are only stimulated in one area. The authors could use low (0.25mW) laser power in the terminals to reduce the chance of antidromic activation and spatially restrict the optical stimulation.

      (12) Was normality tested for data prior to statistical testing?

      (13) Why are there no error bars on Figure 5B, black circles and orange triangles?

    4. Reviewer #3 (Public review):

      Summary:

      The authors use calcium recordings from STN to measure STN activity during spontaneous movement and in a multi-stage avoidance paradigm. They also use optogenetic excitation, optogenetic inhibition, and lesion approaches to increase or decrease the activity of STN during the avoidance paradigm. The paper reports a large amount of data and makes many claims, some seem well supported to this Reviewer, others not so much.

      Strengths:

      Well-supported claims include data showing that during spontaneous movements, especially contraversive ones, STN calcium activity is increased using bulk photometry measurements. Single-cell measures back this claim but also show that it is only a modest minority of STN cells that respond strongly, with most showing no response during movement, and a similar number showing smaller inhibitions during movement.

      Similar data during cued active avoidance procedures show that STN calcium activity sharply increases in response to auditory cues, and during cued movements to avoid a footshock. Optogenetic and lesion experiments are consistent with an important role for STN in generating cue-evoked avoidance. And a strength of these results is that multiple bi-directional approaches were used.

      Weaknesses:

      I found the experimental design and presentation convoluted and the results over-interpreted.

      (1) I really don't understand or accept this idea that delayed movement is necessarily indicative of cautious movements. Is the distribution of responses multi-modal in a way that might support this idea, or do the authors simply take a normal distribution and assert that the slower responses represent 'caution'? Even if responses are multi-modal and clearly distinguished by 'type', why should readers think this that delayed responses imply cautious responding instead of say: habituation or sensitization to cue/shock, variability in attention, motivation, or stress; or merely uncertainty which seems plausible given what I understand of the task design where the same mice are repeatedly tested in changing conditions. This relates to a major claim (i.e., in the work's title).

      (2) Related to the last, I'm struggling to understand the rationale for dividing cells into 'types' based the their physiological responses in some experiments (e.g., Figure 7).

      (3) The description and discussion of orienting head movements were not well supported, but were much discussed in the avoidance datasets. The initial speed peaks to cue seem to be the supporting data upon which these claims rest, but nothing here suggests head movement or orientation responses.

      (4) Similar to the last, the authors note in several places, including abstract, the importance of STN in response timing, i.e., particularly when there must be careful or precise timing, but I don't think their data or task design provides a strong basis for this claim.

      (5) I think that other reports show that STN calcium activity is recruited by inescapable foot shock as well. What do these authors see? Is shock, independent of movement, contributing to sharp signals during escapes?

      (6) In particular, and related to the last point, the following work is very relevant and should be cited: https://elifesciences.org/reviewed-preprints/104643#tab-content. Note that the focus of this other paper is on a subset of VGLUT2+ Tac1 neurons in paraSTN, but using VGLUT2-Cre to target STN will target both STN and paraSTN.

      (7) In multiple other instances, claims that were more tangential to the main claims were made without clearly supporting data or statistics. E.g., claim that STN activation is related to translational more than rotational movement; claim that GCaMP and movement responses to auditory cues were small; claims that 'some animals' responded differently without showing individual data.

      (8) In several figures, the number of subjects used was not described. This is necessary. Also necessary is some assessment of the variability across subjects. The only measure of error shown in many figures relates to trial-to-trial or event variability, which is minimal because, in many cases, it appears that hundreds of trials may have been averaged per animal, but this doesn't provide a strong view of biological variability. When bar/line plots are used to display data, I recommend showing individual animals where feasible.

      (9) Can the authors consider the extent to which calcium imaging may be better suited to identify increases compared to decreases and how this may affect the results, particularly related to the GRIN data when similar numbers of cells show responses in both directions (e.g., Figure 3)?

      (10) Raw example traces are not provided.

      (11) The timeline of the spontaneous movement and avoidance sessions was not clear, nor was the number of events or sessions per animal nor how this was set. It is not clear if there was pre-training or habituation, if many or variable sessions were combined per animal, or what the time gaps between sessions were, or if or how any of these parameters might influence interpretation of the results.

      (12) It is not clear if or how the spread of expression outside of the target STN was evaluated, and if or how many mice were excluded due to spread or fiber placements.

    1. eLife Assessment

      This study demonstrates the potential role of 17α-estradiol in modulating neuronal gene expression in the aged hypothalamus of male rats, identifying key pathways and neuron subtypes affected by the drug. While the findings are useful and provide a foundation for future research, the strength of supporting evidence is incomplete due to the lack of female comparison, a young male control group, unclear link to 17α-estradiol lifespan extension in rats, and insufficient analysis of glial cells and cellular stress in CRH neurons.

    2. Reviewer #1 (Public review):

      Summary:

      Previous studies have shown that treatment with 17α-estradiol (a stereoisomer of the 17β-estradiol) extends lifespan in male mice but not in females. The current study by Li et al, aimed to identify cell-specific clusters and populations in the hypothalamus of aged male rats treated with 17α-estradiol (treated for 6 months). This study identifies genes and pathways affected by 17α-estradiol in the aged hypothalamus.

      Strengths:

      Using single-nucleus transcriptomic sequencing (snRNA-seq) on hypothalamus from aged male rats treated with 17α-estradiol they show that 17α-estradiol significantly attenuated age-related increases in cellular metabolism, stress, and decreased synaptic activity in neurons.

      Moreover, sc-analysis identified GnRH as one of the key mediators of 17α-estradiol's effects on energy homeostasis. Furthermore, they show that CRH neurons exhibited a senescent phenotype, suggesting a potential side effect of the 17α-estradiol. These conclusions are supported by supervised clustering by neuropeptides, hormones, and their receptors.

      Weaknesses:

      However, the study has several limitations that reduce the strength of the key claims in the manuscript. In particular:

      (1) The study focused only on males and did not include comparisons with females. However, previous studies have shown that 17α-estradiol extends lifespan in a sex-specific manner in mice, affecting males but not females. Without the comparison with the female data, it's difficult to assess its relevance to the lifespan.

      (2) Its not known whether 17α-estradiol leads to lifespan extension in male rats similar to male mice. Therefore, it is not possible to conclude that the observed effects in the hypothalamus, are linked to the lifespan extension. The manuscript cited in the introduction does not include lifespan data on rats.

      (3) The effect of 17α-estradiol on non-neuronal cells such as microglia and astrocytes is not well described (Fig.1). Previous studies demonstrated that 17α-estradiol reduces microgliosis and astrogliosis in the hypothalamus of aged male mice. Current data suggest that the proportion of oligo, and microglia were increased by the drug treatment, while the proportions of astrocytes were decreased. These data might suggest possible species differences, differences in the treatment regimen, or differences in drug efficiency. This has to be discussed.

      A more detailed analysis of glial cell types within the hypothalamus in response to drug should be provided.

      (4) The conclusion that CRH neurons are going into senescence is not clearly supported by the data. A more detailed analysis of the hypothalamus such as histological examination to assess cellular senescence markers in CRH neurons, is needed to support this claim.

      Revised submission:

      Some of the concerns were addressed in this revised version, and the authors responded and addressed study design limitations in both sexes/ages.

      However, there are still some concerns that were not sufficiently addressed:<br /> While the term "senescent" was changed to "stressed," some histological/ cellular validation of this phenotype is still needed.

      Some discussion on the sex-specific effects of 17α-estradiol in the hypothalamus is still required. Previous studies in mice demonstrated that 17α-estradiol reduced hypothalamic microgliosis and astrogliosis in male but not female UM-HET3 mice.

      Additionally, the provided analysis on astrocytes and microglia is superficial.

    3. Reviewer #2 (Public review):

      Summary:

      Li et al. investigated the potential anti-ageing role of 17α-Estradiol on the hypothalamus of aged rats. To achieve this, they employed a very sophisticated method for single-cell genomic analysis that allowed them to analyze effects on various groups of neurons and non-neuronal cells. They were able to sub-categorize neurons according to their capacity to produce specific neurotransmitters, receptors, or hormones. They found that 17α-Estradiol treatment led to an improvement in several factors related to metabolism and synaptic transmission by bringing the expression levels of many of the genes of these pathways closer or to the same levels to those of young rats, reversing the ageing effect. Interestingly, among all neuronal groups, the proportion of Oxytocin-expressing neurons seems to be the one most significantly changing after treatment with 17α-Estradiol, suggesting an important role of these neurons on mediating its anti-ageing effects. This was also supported by an increase in circulating levels of oxytocin. It was also found that gene expression of corticotropin-releasing hormone neurons was significantly impacted by 17α-Estradiol even though it was not different between aged and young rats, suggesting that these neurons could be responsible for side effects related to this treatment. This article revealed some potential targets that should be further investigated in future studies regarding the role of 17α-Estradiol treatment in aged males.

      Strengths:

      • The single nucleus mRNA sequencing is a very powerful method for gene expression analysis and clustering. The supervised clustering of neurons was very helpful in revealing otherwise invisible differences between neuronal groups and helped identify specific neuronal populations as targets.

      • There is a variety of functions used that allowed the differential analysis of a very complex type of data. This led to a better comparison between the different groups in many levels.

      • There were some physiological parameters measured such as circulating hormone levels that helped the interpretation of the effects of the changes in hypothalamic gene expression.

      Weaknesses:

      • One main control group is missing from the study, the young males treated with 17α-Estradiol.

      • Even though the technical approach is a sophisticated one, analyzing the whole rat hypothalamus instead of specific nuclei or subregions makes the study weaker.

      • Although the authors claim to have several findings, the data fail to support these claims.

      • The study is about improving ageing but no physiological data from the study demonstrated such claim with the exception of the testes histology which was not properly analyzed and was not even significantly different between the groups.

      • Overall, the study remains descriptive with no physiological data to demonstrate that any of the effects on hypothalamic gene expression is related to metabolic, synaptic or other function.

      Comments on revisions:

      The authors revised part of the manuscript to address some of the reviewers' comments. This improved the language and the text flow to a certain extent. They also added an additional analysis including glial cells. However, they failed to address the main weaknesses brought up by the reviewers and did not add any experimental demonstration of their claims on lifespan expansion induced by 17α-estradiol in rats (the cited study does not include lifespan in rats). In addition, they insisted i keeping parts in the discussion that are not directly linked to any of the papers' findings.

    4. Author response:

      The following is the authors’ response to the previous reviews

      Reviewer #1 (Public Review):

      Summary:

      Previous studies have shown that treatment with 17α-estradiol (a stereoisomer of the 17β-estradiol) extends lifespan in male mice but not in females. The current study by Li et al, aimed to identify cell-specific clusters and populations in the hypothalamus of aged male rats treated with 17α-estradiol (treated for 6 months). This study identifies genes and pathways affected by 17α-estradiol in the aged hypothalamus.

      Strengths:

      Using single-nucleus transcriptomic sequencing (snRNA-seq) on the hypothalamus from aged male rats treated with 17α-estradiol they show that 17α-estradiol significantly attenuated age-related increases in cellular metabolism, stress, and decreased synaptic activity in neurons.

      Thanks.

      Moreover, sc-analysis identified GnRH as one of the key mediators of 17α-estradiol's effects on energy homeostasis. Furthermore, they show that CRH neurons exhibited a senescent phenotype, suggesting a potential side effect of the 17α-estradiol. These conclusions are supported by supervised clustering by neuropeptides, hormones, and their receptors.

      Thanks.

      Weaknesses:

      However, the study has several limitations that reduce the strength of the key claims in the manuscript. In particular:

      (1) The study focused only on males and did not include comparisons with females. However, previous studies have shown that 17α-estradiol extends lifespan in a sex-specific manner in mice, affecting males but not females. Without the comparison with the female data, it's difficult to assess its relevance to the lifespan.

      This study was originally designed based on previous findings indicating that lifespan extension is only effective in males, leading to the exclusion of females from the analysis. The primary focus of our research was on the transcriptional changes and serum endocrine alterations induced by 17α-estradiol in aged males compared to untreated aged males. We believe that even in the absence of female subjects, the significant effects of 17α-estradiol on metabolism in the hypothalamus, synapses, and endocrine system remain evident, particularly regarding the expression levels of GnRH and testosterone. Notably, lower overall metabolism, increased synaptic activity, and elevated levels of GnRH and testosterone are strong indicators of health and well-being in males, supporting the validity of our primary conclusions. However, including female controls would enhance the depth of our findings. If female controls were incorporated, we propose redesigning the sample groups to include aged male control, aged female control, aged female treated, aged male treated, as well as young male control, young male treated, young female control, and young female treated. We regret that we cannot provide this data in the short term. Nevertheless, we believe this reviewer’s creative idea presents a valuable avenue for future research on this topic. In this study, we emphasize the role of 17α-estradiol in overall metabolism, synaptic function, GnRH, and testosterone in aged males and underscore the importance of supervised clustering of neuropeptide-secreting neurons in the hypothalamus.

      (2) It is not known whether 17α-estradiol leads to lifespan extension in male rats similar to male mice. Therefore, it is not possible to conclude that the observed effects in the hypothalamus, are linked to the lifespan extension.

      Thanks for the reminding. 17α-estradiol was reported to extend lifespan in male rats similar to male mice (PMID: 33289482). We have added the valuable reference to introduction in the new version.  

      (3) The effect of 17α-estradiol on non-neuronal cells such as microglia and astrocytes is not well-described (Figure 1). Previous studies demonstrated that 17α-estradiol reduces microgliosis and astrogliosis in the hypothalamus of aged male mice. Current data suggest that the proportion of oligo, and microglia were increased by the drug treatment, while the proportions of astrocytes were decreased. These data might suggest possible species differences, differences in the treatment regimen, or differences in drug efficiency. This has to be discussed.

      We have reviewed reports describing changes in cell numbers following 17α-estradiol treatment in the brain, using the keywords "17α-estradiol," "17alpha-estradiol," and "microglia" or "astrocyte." Only a limited amount of data was obtained. We found one article indicating that 17α-estradiol treatment in Tg (AβPP(swe)/PS1(ΔE9)) model mice resulted in a decreased microglial cell number compared to the placebo (AβPP(swe)/PS1(ΔE9) mice), but this change was not significant when compared to the non-transgenic control (PMID: 21157032). The transgenic AβPP(swe)/PS1(ΔE9) mouse model may differ from our wild-type aging rat model in this context.

      Moreover, the calculation of cell numbers was based on visual observation under a microscope across several brain tissue slices. This traditional method often yields controversial results. For example, oligodendrocytes in the corpus callosum, fornix, and spinal cord have been reported to be 20-40% more numerous in males than in females based on microscopic observations (PMID: 16452667). In contrast, another study found no significant difference in the number of oligodendrocytes between sexes when using immunohistochemistry staining (PMID: 18709647). Such discrepancies arising from traditional observational methods are inevitable.

      We believe the data presented in this article are reliable because the cell number and cell ratio data were derived from high-throughput cell counting of the entire hypothalamus using single-cell suspension and droplet wrapping (10x Genomics).

      (4) A more detailed analysis of glial cell types within the hypothalamus in response to drugs should be provided.

      We provided more enrichment analysis data of differentially expressed genes between Y, O, and O.T in microglia and astrocytes in Figure 2—figure supplement 3. In this supplemental data, we found unlike that in neurons, Micro displayed lower levels of synapse-related cellular processes in O.T. compared to O.

      (5) The conclusion that CRH neurons are going into senescence is not clearly supported by the data. A more detailed analysis of the hypothalamus such as histological examination to assess cellular senescence markers in CRH neurons, is needed to support this claim.

      We also noted the inappropriate claim and have changed "senescent phenotype" to "stressed phenotype" and "abnormal phenotype" in both the abstract and results sections. The stressed phenotype could be induced by heightened functional activity in the cells, potentially indicating higher cellular activity. The GnRH and CRH neurons discussed in this paper may represent such a case, as illustrated by the observed high serum GnRH, testosterone, and cortisol levels. This revision suggestion is highly valuable and constructive for our understanding of the unique physiological characteristics revealed by these data.

      Reviewer #2 (Public Review):

      Summary:

      Li et al. investigated the potential anti-ageing role of 17α-Estradiol on the hypothalamus of aged rats. To achieve this, they employed a very sophisticated method for single-cell genomic analysis that allowed them to analyze effects on various groups of neurons and non-neuronal cells. They were able to sub-categorize neurons according to their capacity to produce specific neurotransmitters, receptors, or hormones. They found that 17α-Estradiol treatment led to an improvement in several factors related to metabolism and synaptic transmission by bringing the expression levels of many of the genes of these pathways closer or to the same levels as those of young rats, reversing the ageing effect. Interestingly, among all neuronal groups, the proportion of Oxytocin-expressing neurons seems to be the one most significantly changing after treatment with 17α-Estradiol, suggesting an important role of these neurons in mediating its anti-ageing effects. This was also supported by an increase in circulating levels of oxytocin. It was also found that gene expression of corticotropin-releasing hormone neurons was significantly impacted by 17α-Estradiol even though it was not different between aged and young rats, suggesting that these neurons could be responsible for side effects related to this treatment. This article revealed some potential targets that should be further investigated in future studies regarding the role of 17α-Estradiol treatment in aged males.

      Strengths:

      (1) Single-nucleus mRNA sequencing is a very powerful method for gene expression analysis and clustering. The supervised clustering of neurons was very helpful in revealing otherwise invisible differences between neuronal groups and helped identify specific neuronal populations as targets.

      Thanks.

      (2) There is a variety of functions used that allow the differential analysis of a very complex type of data. This led to a better comparison between the different groups on many levels.

      Thanks.

      (3) There were some physiological parameters measured such as circulating hormone levels that helped the interpretation of the effects of the changes in hypothalamic gene expression

      Thanks.

      Weaknesses

      (1) One main control group is missing from the study, the young males treated with 17α-Estradiol.

      Given that the treatment period lasts six months, which extends beyond the young male rats' age range, we aimed to investigate the perturbation of 17α-Estradiol on the normal aging process. Including data from young males could potentially obscure the treatment's effects in aged males due to age effects, though similar effects between young and aged animals may exist. Long-term treatment of hormone may exert more developmental effects on the young than the old. Consequently, we decided to exclude this group from our initial sample design. We apologize for this omission.

      (2) Even though the technical approach is a sophisticated one, analyzing the whole rat hypothalamus instead of specific nuclei or subregions makes the study weaker.

      The precise targets of 17α-Estradiol within the hypothalamus remain unresolved. Selecting a specific nucleus for study is challenging. The supervised clustering method described in this manuscript allows us to identify the more sensitive neuron subtypes influenced by 17α-Estradiol and aging across the entire hypothalamus, without the need to isolate specific nuclei in a disturbed hypothalamic environment.

      (3) Although the authors claim to have several findings, the data fail to support these claims. You may mean the claim as the senescent phenotype in Crh neuron induced by 17a-estradiol.

      Thanks. We have changed the "senescent phenotype" to "stressed phenotype" in the abstract and results to avoid such claim. The stressed phenotype may be induced by heightened functional activity in the cells, potentially indicating higher cellular activity.

      (4) The study is about improving ageing but no physiological data from the study demonstrated such a claim with the exception of the testes histology which was not properly analyzed and was not even significantly different between the groups.

      The primary objective of this study is to elucidate the effects of 17α-Estradiol on the endocrine system in the aging hypothalamus; exploring anti-aging effects is not the main focus. From the characteristics of the aging hypothalamus, we know that down-regulated GnRH and testosterone levels, along with elevated mTOR signaling, are indicators of aging in these organs from previous publications (PMID: 37886966, PMID: 37048056, PMID: 22884327). The contrasting signaling networks related to metabolism and synaptic processes significantly differentiate young and aging hypothalami, and 17α-Estradiol helps rebalance these networks, suggesting its potential anti-aging effects.

      (5) Overall, the study remains descriptive with no physiological data to demonstrate that any of the effects on hypothalamic gene expression are related to metabolic, synaptic, or other functions.

      The study focuses on investigating cellular responses and endocrine changes in the aging hypothalamus induced by 17α-estradiol, utilizing single-nucleus RNA sequencing (snRNA-seq) and a novel data mining methodology to analyze various neuron subtypes. It is important to note that this study does not mainly aim to explore the anti-aging effects. Consequently, we have revised the claim in the abstract from “the effects of 17α-estradiol in anti-aging in neurons” to “the effects of 17α-estradiol on aging neurons.” We observed that the lower overall metabolism and increased expression levels of cellular processes in the synapses align with findings previously reported regarding 17α-estradiol. To address the lack of physiological data and the challenges in measuring multiple endocrine factors due to their volatile nature, we employed several bidirectional Mendelian analyses of various genome-wide association study (GWAS) data related to these serum endocrine factors to identify their mutual causal effects.

      Reviewing Editor Comment:

      Based on the Public Reviews and Recommendations for Authors, the Reviewers strongly recommend that revisions include an experimental demonstration of the physiological effects of the treatment on ageing in rats as well as the CRH-senescence link. Additional analysis of the glia would greatly strengthen the study, as would inclusion of females and young male controls. The important point was also raised that the work linking 17a-estradiol was performed in mice, and the link with lifespan in rats is not known. Discussion of this point is recommended.

      We thank the reviewers for their constructive feedback. Regarding the recommendations in the Public Reviews and Recommendations for Authors:

      a)  Physiological effects & CRH-senescence link:

      We acknowledge that 17α-estradiol has been reported to extend lifespan in male rats, consistent with findings in male mice (PMID: 33289482). This point has now been noted in the Introduction. We regret that further experimental validation of the treatment's physiological effects on aging in rats was beyond the scope of this study.

      b) Phenotype terminology:

      In response to concerns about the "senescent" characterization of CRH neurons, we have revised this terminology to "stressed phenotype" throughout the abstract and results. While we were unable to conduct additional experiments to confirm senescence markers, this revised description better reflects the heightened cellular activity observed (as evidenced by elevated serum GnRH and testosterone levels), without implying confirmed senescence.

      c) Glial cell analysis:

      To address questions about glial cell function during treatment, we have added new enrichment analysis data of differentially expressed genes in microglia and astrocytes from young (Y), old (O), and old treated (O.T) groups in Figure 2—figure supplement 3. This analysis reveals that microglia exhibit contrasting synaptic-related cellular processes compared to total neurons.

      d) Female and young controls:

      We sincerely apologize for the absence of female subjects and young male controls in the current study. The reviewers' suggestion to examine the male-specific effects of 17α-estradiol using female controls represents an excellent direction for future research, which we plan to pursue in upcoming studies.

      Reviewer #2 (Recommendations For The Authors):

      General comments:

      (1) The manuscript is very hard to read. Proofreading and editing by software or a professional seems necessary. The words "enhanced", "extensive" etc. are not always used in the right way.

      Thanks for the suggestion. We have revised the proofreading and editing. The words "enhanced" and "extensive" were also revised in most sentences.

      (2) The numbers of animals and samples are not well explained. Is it 9 rats overall or per group? If there are 8 testes samples per group, should we assume that there were 4 rats per group? The pooling of the hypothalamic how was it done? Were all the hypothalamic from each group pooled together? A small table with the animals per group and the samples would help.

      We appreciate your reminder regarding the initial mistake in our manuscript preparation. In the preliminary submission, we reported 9 rats based solely on sequencing data and data mining. The revised version (v1) now includes additional experimental data, with an effective total of 12 animals (4 per group). Unfortunately, we overlooked updating this information in the v1 submission. We have since added detailed information in the Materials and Methods sections: Animals, Treatment and Tissues, and snRNA-seq Data Processing, Batch Effect Correction, and Cell Subset Annotation.

      (3) The Clustering is wrong. There are genes in there that do not fall into any of the 3 categories: Neurotransmitters, Receptors, Hormones.

      We acknowledge the error in gene clustering and have implemented the following corrections:

      (a) The description has been updated to state: 'Vast majority of these subtypes were clustered by neuropeptides, hormones, and their receptors among all neurons.'

      (b) Genes not belonging to these three categories have been substantially removed.

      (c) The neuropeptide category (now including several growth hormones) has been expanded to 104 genes, while their corresponding receptors (including several sex hormone receptors) now comprise 105 genes.

      (4) The coloring of groups in the graphs is inconsistent. It must be more homogeneous to make it easier to identify.

      We have changed the colors of groups in Fig. 1D to make the color of cell clusters consistent in Fig. 1A-D.

      (5) The groups c1-c4 are not well explained. How did the authors come up with these?

      We have added more descriptions of c1-c4 in materials and methods in the new version.

      (6) In most cases it's not clear if the authors are talking about cell numbers that express a certain mRNA, the level of expression of a certain mRNA, or both. They need to do a better job using more precise descriptions instead of using general terms such as "signatures", "expression profiles", "affected neurons" etc. It is very hard to understand if the number of neurons is compared between the groups or the gene expression.

      We have changed the "signatures" to "gene signatures" to make it more accurate in meaning. The "affected neurons" were also changed to "sensitive neurons". But sorry that we were not able to find better alternatives to the "expression profiles".

      (7) Sometimes there are claims made without justification or a reference. For example, the claim about the senescence of CRH neurons due to the upregulation of mitochondrial genes and downregulation of adherence junction genes (lines 326-328) should be supported by a reference or own findings.

      The "senescence" here is not appropriate. We have changed it to "stressed phenotype" or "aberrant changes" in abstract and results.

      (8) Young males treated with Estradiol as a control group is necessary and it is missing.

      Your suggestion is appreciated; however, the treatment duration for aged mice (O.T) was set at 6 months, while the young mice were only 4 months old. This disparity makes it challenging to align treatment timelines for the young animals. The primary aim of this study is to investigate the perturbation of 17α-estradiol on the aging process, and any distinct effects due to age effect observed in young males might complicate our understanding of its role in aged males, though similar endocrine effects may exist in the young animals. Long-term treatment of hormone may exert more developmental effects on the young than the old. Therefore, we made the decision to exclude the young samples in our initial study design. We apologize for any confusion this may have caused.

      Specific Comments:

      Line 28: "elevated stresses and decreased synaptic activity": Please make this clearer. Can't claim changes in synaptic activity by gene expression.

      We have changed it to "the expression level of pathways involved in synapse"

      Line 32: "increased Oxytocin": serum Oxytocin.

      We have added the “serum”.

      Line 52 - 54: Any studies from rats?

      Thanks. In rats there is also reported that 17α-estradiol has similar metabolic roles as that in mice (PMID: 33289482) and we have added it to the refences. It’s very useful for this manuscript.

      Line 62 - 65: It wasn't investigated thoroughly in this paper so why was it suggested in the introduction?

      We have deleted this sentence as being suggested.

      Line 70: "synaptic activity" Same as line 28.

      We have changed it to "pathways involved in synaptic activity".

      Line 79: Why were aged rats caged alone and young by two? Could that introduce hypothalamic gene expression effects?

      The young males were bred together in peace. But the aged males will fight and should be kept alone.

      Lines 78, 99, 109-110: It is not clear how many animals per group were used and how many samples per group were used separately and/or grouped. Please be more specific.

      We have added these information to Materials and methods/Animals, treatment and tissues and Materials and methods/snRNA-seq data processing, batch effect correction, and cell subset annotation.

      Line 205: "in O" please add "versus young.".

      We have changed accordingly.

      Line 207: replace "were" with "was"

      We have alternatively changed the "proportion" to "proportions".

      Line 208: replace "that" with "compared to" and after "in O.T." add "compared to?"

      We have changed accordingly.

      Line 223: "O.T." compared to what? Figure?

      We have changed it accordingly.

      Line 227: Figure?

      We have added (Figure 1E) accordingly.

      Line 229: "synaptic activity" Same as line 28.

      We have revised it.

      Line 235: "synaptic activity" and "neuropeptide secretion" Same as line 28.

      We have revised it.

      Line 256:" interfered" please revise.

      We changed to "exerted".

      Line 263: "on the contrary" please revise.

      We have changed "on the contrary" to "opposite".

      Line 270: "conversed" did you mean "conserved"?

      We have changed "conversed" to "inversed".

      Line 296-298: Please explain. Why would these be side effects?

      It’s hard to explain, therefore, we deleted the words "side effects".

      Line 308: "synaptic activity" Same as line 28.

      We have changed it to "expression levels of synapse-related cellular processes".

      Line 314: "and sex hormone secretion and signaling"Isn't this expected?

      Yes, it is expected. We have added it to the sentence "and, as expected, sex hormone secretion and signaling".

      Line 325-328: Why is this senescence? Reference?

      We have added “potent” to it.

      Line 360-361: This doesn't show elevated synaptic activity.

      "elevated synaptic activity" was changed to "The elevated expression of synapse-related pathways"

      Line 363-364: "Unfortunately" is not a scientific expression and show bias.

      We have changed it to "Notably".

      Line 376: Similar as above.

      Yes, we have change it to "in contrast".

      Lines 382-385: This is speculation. Please move to discussion.

      Sorry for that. We think the causal effects derived from MR result is evidence. As such, we have not changed it.

      Line 389: Please revise "hormone expressing".

      We have changed it accordingly.

      Line 401: Isn't this effect expected due to feedback inhibition of the biochemical pathway? Please comment.

      The binding capability of 17alpha-estradiol to estrogen receptors and its role in transcriptional activation remain core questions surrounded by controversy. Earlier studies suggest that 17alpha-estradiol exhibits at least 200 times less activity than 17beta-estradiol (PMID: 2249627, PMID: 16024755). However, recent data indicate that 17alpha-estradiol shows comparable genomic binding and transcriptional activation through estrogen receptor α (Esr1) to that of 17beta-estradiol (PMID: 33289482). Additionally, there is evidence that 17alpha-estradiol has anti-estrogenic effects in rats (PMID: 16042770). These findings imply possible feedback inhibition via estrogen receptors. Furthermore, 17alpha-estradiol likely differs from 17beta-estradiol due to its unique metabolic consequences and its potential to slow aging in males, an effect not attributed to 17beta-estradiol. For instance, neurons are also targets of 17alpha-estradiol, with Esr1 not being the sole target (PMID: 38776045). Intriguingly, neurons expressing Ar and Esr1 ranked among the top 20 most perturbed receptor subtypes during aging (O vs Y), but were no longer ranked in this group following treatment (O.T vs Y and O.T vs O comparisons). This indicates that 17α-estradiol administration attenuated age-associated perturbation in these neuronal subtypes, which may be a consequence of potential feedback (Figure 3D). Nevertheless, the precise effective targets of 17alpha-estradiol are still unresolved.

      Line 409: This conclusion cannot be made because the effect is not statistically significant. Can say "trend" etc.

      Thanks for the recommendation. We have added "potential" in front of the conclusion.

      Line 426: "suggesting" please revise.

      sorry, it’s a verb.

      Lines 426-428: This is speculation. Please move to discussion.

      The elevated GnRH levels in O.T., observed through EIA analysis, suggest a deduction regarding the direct causal effects of 17alpha-estradiol on various endocrine factors related to feeding, energy homeostasis, reproduction, osmotic regulation, stress response, and neuronal plasticity through MR analysis. Thus, we have not amended our position. We apologize for any confusion.

      Lines 431-432: improved compared to what?

      The statement have been revised as " The most striking role of 17α-estradiol treatment revealed in this study showed that HPG axis was substantially improved in the levels of serum Gnrh and testosterone".

      Line 435: " Estrogen Receptor Antagonists". Please revise.

      Thanks for the recommendation. We have changed it to "estrogen receptor antagonists".

      Line 438" "Secrete". Please revise

      Sorry, it is "secret".

      Lines 439-449: None of this has been demonstrated. Please remove these conclusions.

      We appreciate the reviewer's scrutiny regarding lines 439-449. While these statements should not be interpreted as definitive conclusions from our current data, we propose they serve as clinically relevant discussion points worthy of exploration. Our findings demonstrate 17α-estradiol's role in modulating testosterone levels in aged males. This mechanistic insight warrants consideration of its therapeutic potential for age-related hypogonadism - a hypothesis we believe merits discussion given the compound's specific endocrine effects.

      Lines 450-457: No females were included in this study. Why? Also, why is this discussed? It is relevant but doesn't belong in this manuscript since it was not studied here.

      Testosterone levels are crucial for male health, while estradiol levels are essential for the health and fertility of females. Previous studies have demonstrated that 17α-estradiol does not contribute to lifespan extension in females. Given the effects of 17α-estradiol on males—specifically, its role in promoting testosterone and reducing estradiol levels—we believe it is important to discuss the potential sex-biased effects of 17α-estradiol, as this could inform future investigations. We have refined this section to clarify that these points represent mechanistic hypotheses derived from our male data and existing literature, not conclusions about unstudied female physiology. This framing maintains the discussion's scientific value while respecting the study's scope.

      Lines 458-459: This was not demonstrated in this article. Please remove.

      We have restricted the claim to "expression level of energy metabolism in hypothalamic neurons".

      Line 464: "Promoted lifespan extension" Not demonstrated. Please remove.

      At the end of the sentence it was revised as "which may be a contributing factor in promoting lifespan extension".

      Line 466: "Showed" No.

      The whole sentence was deleted in the new version.

      Line 483: "the sex-based effects". Not studied here.

      Since the changes in testosterone levels are significant in this dataset and this hormone has a sex-biased nature, we find it worthwhile to suggest this as a topic for future investigation. We have added "which needs further verification in the future" at the end of this sentence.

    1. eLife Assessment

      This is a well-done study that provides compelling data from a diverse set of approaches from single cell transcriptome data and network analysis from genetically diverse mouse cells to identify novel driver genes underlying human GWAS associations. The authors present solid evidence that network analysis of scRNA-seq data from genetically diverse mouse bone-marrow derived stromal cells can be informative for identifying human BMD GWAS driver genes. Their approach should be broadly useful and applicable to other GWAS studies.

    2. Reviewer #1 (Public review):

      In this manuscript, Dillard and colleagues integrate cross-species genomic data with a systems approach to identify potential driver genes underlying human GWAS loci and establish the cell type(s) within which these genes act and potentially drive disease.

      Specifically, they utilize a large single cell RNA-seq (scRNA-seq) dataset from an osteogenic cell culture model - bone marrow-derived stromal cells cultured under osteogenic conditions (BMSC-OBs) - from a genetically diverse outbred mouse population called the Diversity Outbred (DO) stock to discover network driver genes that likely underlie human bone mineral density (BMD) GWAS loci. The DO mice segregate over 40M single nucleotide variants, many of which affect gene expression levels, therefore making this an ideal population for systems genetic and co-expression analyses.

      The current study builds on previous published work from the same group that used co-expression analysis to identify co-expressed "modules" of genes that were enriched for BMD GWAS associations. In this study, the authors utilized a much larger scRNA-seq dataset from 80 DO BMSC-OBs, inferred co-expression based on Bayesian networks for each identified mesenchymal cell type, focused on networks with dynamic expression trajectories that are most likely driving differentiation of BMSC-OBs, and then prioritized genes ("differentiation driver genes" or DDGs) in these osteogenic differentation networks that had known expression or splicing QTLs (eQTL/sQTLs) in any GTEx tissue that co-localized with human BMD GWAS loci. The systems analysis is impressive, the experimental methods are described in detail, and the experiments appear to be carefully done. The computational analysis of the single cell data is comprehensive and thorough, and the evidence presented in support of the identified DDGs, including Tpx2 and Fgfrl1, is for the most part convincing. Some limitations in the data resources and methods hamper enthusiasm somewhat and are discussed below.

      Overall, while this study will no doubt be valuable to the BMD community, the cross-species data integration and analytical framework may be more valuable and generally applicable to the study of other diseases, especially for diseases with robust human GWAS data but for which robust human genomic data in relevant cell types is lacking.

      Specific strengths of the study include the large scRNA-seq dataset on BMSC-OBs from 80 DO mice, the clustering analysis to identify specific cell types and sub-types, the comparison of cell type frequencies across the DO mice, and the CELLECT analysis to prioritize cell clusters that are enriched for BMD heritability (Figure 1). The network analysis pipeline outlined in Figure 2 is also a strength, as is the pseudotime trajectory analysis (results in Figure 3).

      Potential drawbacks of the authors' approach include their focus on genes that were previously identified as having an eQTL or sQTL in any GTEx tissue. The authors rightly point out that the GTEx database does not contain data for bone tissue, but reason that eQTLs can be shared across many tissues - this assumption is valid for many cis-eQTLs, but it could also exclude many genes as potential DDGs with effects that are specific to bone/osteoblasts. Indeed, the authors show that important BMD driver genes have cell-type specific eQTLs. Another issue concerns potential model overfitting in the iterativeWGCNA analysis of mesenchymal cell type-specific co-expression, which identified an average of 76 co-expression modules per cell cluster (range 26-153). Based on the limited number of genes that are detected as expressed in a given cell due to sparse per cell read depth (400-6200 reads/cell) and drop outs, it's surprising that as many as 153 co-expression modules could be distinguished within any cell cluster. I would suspect some degree of model overfitting is responsible for these results.

      Overall, though, these concerns are minor relative to the many strengths of the study design and results. Indeed, I expect the analytical framework employed by the authors here will be valuable to -- and replicated by -- researchers in other disease areas.

      Comments on revisions:

      Thank you for addressing my concerns. This is an impressive study and manuscript that you should be proud of.

    3. Reviewer #2 (Public review):

      Summary:

      In this manuscript, Farber and colleagues have performed single cell RNAseq analysis on bone marrow derived stem cells from DO Mice. By performing network analysis, they look for driver genes that are associated with bone mineral density GWAS associations. They identify two genes as potential candidates to showcase the utility of this approach.

      Strengths:

      The study is very thorough and the approach is innovative and exciting. The manuscript contains some interesting data relating to how cell differentiation is occurring and the effects of genetics on this process. The section looking for genes with eQTLs that differ across the differentiation trajectory (Figure 4) was particularly exciting.

      Weaknesses:

      The manuscript is, in parts, hard to read due to the use of acronyms and there are some questions about data analysis that still need to be addressed.

      Comments on revisions:

      Dillard et al have made several improvements to their manuscript.

      (1) We previously asked the authors to determine whether any cell types were enriched for BMD-related traits since the premise of the paper is that 'many genes impacting BMD do so by influencing osteogenic differentiation or ... adipogenic differentiation'. Given the potential for the cell culture method to skew the cell type distribution non-physiologically, it is important to establish which cell types in their assay are most closely associated with BMD traits. The new CELLECT analysis and Figure 1E address this point nicely. However, it would still be nice to see the correlations between these cell types and BMD traits in the mice as this would provide independent evidence to support their physiological importance more broadly.

      (2) Shortening the introduction.

      (3) Addressing limitations that arise from not accounting for founder genome SNPs when aligning scRNA-seq data.

      (4) The main take-away of this paper is, to us, the development of a single cell approach to studying BMD-related traits. It is encouraging that the cells post-culture appear to be representative of those pre-culture (supplemental figure 3).

      However, the authors seem to have neglected several comments made by both reviewers. While we share the authors' enthusiasm for the single cell analytical approach, we do not understand their reluctance to perform further statistical tests. We feel that the following comments have still not been addressed:

      (1) The manuscript still contains the following:

      "To provide further support that tradeSeq-identified genes are involved in differentiation, we performed a cell type-specific expression quantitative trait locus (eQTL) analysis for each mesenchymal cell type from the 80 DO mice. We identified 563 genes (eGenes) regulated by a significant cis-eQTL in specific cell types of the BMSC-OB scRNA-seq data (Supplementary Table S14). In total, 73 eGenes were also tradeSeq-identified genes in one or more cell type boundaries along their respective trajectories (Supplementary Table S9)."

      The purpose of this paragraph is to convince readers that the eGenes approach aligns with the tradeSeq approach (and that their approach can therefore be trusted). It is essential that such claims are supported by statistical reasoning. Given that it would be very simple to perform permutation/enrichment analyses to address this point, and both reviewers requested similar analyses, we do not understand the author's reluctance here. Otherwise, this section should be rewritten so that it does not imply that the identification of these genes provides support for their approach.

      (2) Given that a central purpose of this manuscript is to establish a systematic workflow for identifying candidate genes, the manuscript could still benefit from more explanation as to why the authors chose to highlight Tpx2 and Fgfrl1. Tpx2 does already have a role in bone physiology through the IMPC. The authors should comment on why they did not explore Kremen1, for instance, as this gene seems important for the transition to both OB1 and 2.

      A final minor comment is that it would be very helpful if the authors could indicate if the DDGs in Table 1 are also eGenes for the relevant cell type. This is much more meaningful than looking through GTEx.

    4. Author response:

      The following is the authors’ response to the original reviews.

      Reviewer #1 (Public review): 

      In this manuscript, Dillard and colleagues integrate cross-species genomic data with a systems approach to identify potential driver genes underlying human GWAS loci and establish the cell type(s) within which these genes act and potentially drive disease. Specifically, they utilize a large single-cell RNA-seq (scRNA-seq) dataset from an osteogenic cell culture model - bone marrow-derived stromal cells cultured under osteogenic conditions (BMSC-OBs) - from a genetically diverse outbred mouse population called the Diversity Outbred (DO) stock to discover network driver genes that likely underlie human bone mineral density (BMD) GWAS loci. The DO mice segregate over 40M single nucleotide variants, many of which affect gene expression levels, therefore making this an ideal population for systems genetic and co-expression analyses. The current study builds on previously published work from the same group that used co-expression analysis to identify co-expressed "modules" of genes that were enriched for BMD GWAS associations. In this study, the authors utilize a much larger scRNA-seq dataset from 80 DO BMSC-OBs, infer co-expression-based and Bayesian networks for each identified mesenchymal cell type, focused on networks with dynamic expression trajectories that are most likely driving differentiation of BMSC-OBs, and then prioritized genes ("differentiation driver genes" or DDGs) in these osteogenic differentiation networks that had known expression or splicing QTLs (eQTL/sQTLs) in any GTEx tissue that colocalized with human BMD GWAS loci. The systems analysis is impressive, the experimental methods are described in detail, and the experiments appear to be carefully done. The computational analysis of the single-cell data is comprehensive and thorough, and the evidence presented in support of the identified DDGs, including Tpx2 and Fgfrl1, is for the most part convincing. Some limitations in the data resources and methods hamper enthusiasm somewhat and are discussed below. Overall, while this study will no doubt be valuable to the BMD community, the cross-species data integration and analytical framework may be more valuable and generally applicable to the study of other diseases, especially for diseases with robust human GWAS data but for which robust human genomic data in relevant cell types is lacking. 

      Specific strengths of the study include the large scRNA-seq dataset on BMSC-OBs from 80 DO mice, the clustering analysis to identify specific cell types and sub-types, the comparison of cell type frequencies across the DO mice, and the CELLECT analysis to prioritize cell clusters that are enriched for BMD heritability (Figure 1). The network analysis pipeline outlined in Figure 2 is also a strength, as is the pseudotime trajectory analysis (results in Figure 3). One weakness involves the focus on genes that were previously identified as having an eQTL or sQTL in any GTEx tissue. The authors rightly point out that the GTEx database does not contain data for bone tissue, but the reason that eQTLs can be shared across many tissues - this assumption is valid for many cis-eQTLs, but it could also exclude many genes as potential DDGs with effects that are specific to bone/osteoblasts. Indeed, the authors show that important BMD driver genes have cell-type-specific eQTLs. Furthermore, the mesenchymal cell type-specific co-expression analysis by iterative WGCNA identified an average of 76 co-expression modules per cell cluster (range 26-153). Based on the limited number of genes that are detected as expressed in a given cell due to sparse per-cell read depth (400-6200 reads/cell) and dropouts, it's hard to believe that as many as 153 co-expression modules could be distinguished within any cell cluster. I would suspect some degree of model overfitting here and would expect that many/most of these identified modules have very few gene members, but the methods list a minimum module size of 20 genes. How do the numbers of modules identified in this study compare to other published scRNA-seq studies that use iterative WGCNA? 

      In the section "Identification of differentiation driver genes (DDGs)", the authors identified 408 significant DDGs and found that 49 (12%) were reported by the International Mouse Knockout [sic] Consortium (IMPC) as having a significant effect on whole-body BMD when knocked out in mice. Is this enrichment significant? E.g., what is the background percentage of IMPC gene knockouts that show an effect on whole-body BMD? Similarly, they found that 21 of the 408 DDGs were genes that have BMD GWAS associations that colocalize with GTEx eQTLs/sQTLs. Given that there are > 1,000 BMD GWAS associations, is this enrichment (21/408) significant? Recommend performing a hypergeometric test to provide statistical context to the reported overlaps here. 

      We thank the reviewer for their constructive feedback and thoughtful questions. In regards to the iterativeWGCNA, a larger number of modules is sometimes an outcome of the analysis, as reported in the iterativeWGCNA preprint (Greenfest-Allen et al., 2017). While we did not make a comparison to other works leveraging this tool for scRNA-seq, it has been used broadly across other published studies, such as PMID: 39640571, 40075303, 33677398, 33653874. While model overfitting, as you mention, may be a cause for more modules, our Bayesian network analysis we perform after iterativeWGCNA highlights smaller aspects of coexpression modules, as opposed to focusing on the entirety of any given module.

      We did not perform enrichment or statistical tests as our goal was to simply highlight attributes or unique features of these genes for additional context.

      Reviewer #2 (Public review): 

      Summary: 

      In this manuscript, Farber and colleagues have performed single-cell RNAseq analysis on bone marrow-derived stem cells from DO Mice. By performing network analysis, they look for driver genes that are associated with bone mineral density GWAS associations. They identify two genes as potential candidates to showcase the utility of this approach. 

      Strengths: 

      The study is very thorough and the approach is innovative and exciting. The manuscript contains some interesting data relating to how cell differentiation is occurring and the effects of genetics on this process. The section looking for genes with eQTLs that differ across the differentiation trajectory (Figure 4) was particularly exciting. 

      Weaknesses: 

      The manuscript is in parts hard to read due to the use of acronyms and there are some questions about data analysis that need to be addressed. 

      We thank the reviewer for their feedback and shared enthusiasm for our work. We tried to minimize the use of technical acronyms as much as we could without compromising readability. Additionally, we addressed questions regarding aspects of data analysis. 

      Reviewer #1 (Recommendations for the authors):

      (1) For increased transparency and to allow reproducibility, it would be necessary for the scripts used in the analysis to be shared along with the publication of the preprint. Also, where feasible, sharing the processed data in addition to the raw data would allow the community greater access to the results and be highly beneficial. 

      Thank you for this suggestion. The raw data will be available via GEO accession codes listed in the data availability statement. We will make available scripts for some analyses on our Github (https://github.com/Farber-Lab/DO80_project) and processed scRNA-seq data in a Seurat object (.rds) on Zenodo (https://zenodo.org/records/15299631)

      (2) Lines 55-76: I think the summary of previous work here is too long. I understand that they would like to cover what has been done previously, but this seems like overkill. 

      Good suggestion. We have streamlined some of the summary of our previous work.

      (3) Did the authors try to map QTL for cell-type proportion differences in their BMSC-OBs? While 80 samples certainly limit mapping power, the data shown in Figs 4C/D suggest that you might identify a large-effect modifier of LMP/OB1 proportions. 

      We did try to map QTL for cell type proportion differences, but no significant associations were identified. 

      (4) Methods question: Does the read alignment method used in your analysis account for SNPs/indels that segregate among the DO/CC founder strains? If not, the authors may wish to include this in their discussion of study limitations and speculate on how unmapped reads could affect expression results. 

      The read alignment method we used does not account for SNPs/indels from the DO founder strains that fall in RNA transcripts captured in the scRNA-seq data. We have included this as a limitation in our discussion (line 422-424). 

      (5) Much of the discussion reads as an overview of the methods, while a discussion of the results and their context to the existing BMD literature is relatively lacking in comparison.

      We have added additional explanation of the results and context to the discussion (line 381-382, 396-407). 

      (6) Figure 1E and lines 146-149: Adjusted p values should be reported in the figure and accompanying text instead of switching between unadjusted and adjusted p values. 

      We updated Figure 1e to portray adjusted p-values, listed the adjusted p-values in legend of Figure 1e, and listed them in the main text (line 153-154).

      (7) Why do the authors bring the IMPC KO gene list into the analysis so late? This seems like a highly relevant data resource (moreso than the GTEx eQTLs/sQTLs) that could have been used much earlier to help identify DDGs. 

      Given that our scRNA-seq data is also from mice, we did choose to integrate information from the IMPC to highlight supplemental features of genes in networks (i.e., genes that have an experimentally-tested and significant effect on BMD in mice). However, our primary goal was to inform human GWAS and leverage our previous work in which we identified colocalizations between human BMD GWAS and eQTL/sQTL in a human GTEx tissue, which is why this information was used to guide our network analysis.

      (8) Does Fgfrl1 and/or Tpx2 have a cis-eQTL in your BMSC-OB scRNA-seq dataset? 

      We did not identify cis-eQTL effects for Fgfrl1 and Tpx2.

      (9) Figure 4B-C: These eQTLs may be real, but based on the diplotype patterns in Figure 4C, I suspect they are artifacts of low mapping power that are driven by rare genotype classes with one or two samples having outlier expression results. For example, if you look at the results in Fig 4C for S100a1 expression, the genotype classes with the highest/lowest expression have lower sample numbers. In the case of Pkm eQTL showing a PWK-low effect, the PWK genome has many SNPs that differ from the reference genome in the 3' UTR of this gene, and I wonder if reads overlapping these SNPs are not aligning correctly (see point 4 above) and resulting (falsely) in lower expression values for samples with a PWK haplotype. 

      As mentioned above, our alignment method did not consider DO founder genetic variation that is specifically located in the 3’ end of RNA transcripts in the scRNA-seq data. We have included this as a limitation in our discussion (line 422-424).

      In future studies, we intend to include larger populations of mice to potentially overcome, as you mention, any artifacts that may be attributable to low statistical power, rare genotype classes, or outlier expression.

      Reviewer #2 (Recommendations for the authors):

      Major Points 

      (1) The authors hypothesize "that many genes impacting BMD do so by influencing osteogenic differentiation or possibly bone marrow adipogenic differentiation". However, cell type itself does not correlate with any bone trait. Does this indicate that the hypothesis is not entirely correct, as genes that drive these phenotypes would not be enriched in one particular cell type? The authors have previously identified "high-priority target genes". So, are there any cell types that are enriched for these target genes? If not, this would indicate that all these genes are more ubiquitously expressed and this is probably why they would have a greater effect on the overall bone traits. Furthermore, are the 73 eGenes (so genes with eQTLs in a particular cell type that change around cell type boundaries) or the DDGs (Table 1) enriched for these high-priority target genes? 

      The bone traits measured in the DO mice are complex and impacted by many factors, including the differentiation propensity and abundance of certain cell types, both within and outside of bone. Though we did not identify correlations between cell type abundance and the bone traits we measured, we tailored our investigations to focus on cellular differentiation using the scRNA-seq data. However, future studies would need to be performed to investigate any connections between cellular differentiation, cell type abundance, and bone traits.

      We did not perform enrichment analyses of either the target genes identified from our other work or eGenes identified here, but instead used the target gene list to center our network analysis and the eGenes to showcase the utility of the DO mouse population.

      (2) The readability of the paper could be improved by minimising the use of acronyms and there are several instances of confusing wording throughout the paper. In many cases, this can be solved by re-organising sentences and adding a bit more detail. For example, it was unclear how you arrived at Fgfrl1 or Tpx2.

      One of the goals of our study was to identify genes that have (to our knowledge) little to no known connection to BMD. We chose to highlight Fgfrl1 and Tpx2 because there is minimal literature characterizing these genes in the context of bone, which we speak to in the results (line 296-297). Additionally, we prioritized these genes in our previous work and they were identified in this study by using our network analyses using the scRNA-seq data, which we mention in the results (line 276-279).

      (3) Technical aspects of the assay. In Figure 1d you show that the cell populations vary considerably between different DO mice. It would be useful to give some sense of the technical variance of this assay given that the assay involves culturing the cells in an exogenous environment. This could take the form of tests between mice within the same inbred strain, or even between different legs of the same DO mice to show that results are technically very consistent. It might also be prudent to identify that this is a potential limitation of the approach as in vitro culturing has the potential to substantially change the cell populations that are present. 

      We agree that in vitro culturing, in addition to the preparation of single cells for scRNA-seq, are unavoidable sources of technical variation in this study. However, the total number of cells contributed by each of the 80 DO mice after data processing does not appear to be skewed and the distribution appears normal (see added figures, now included as Supplemental Figure 3). Therefore, technical variation is at least consistent across all samples. Nevertheless, we have mentioned the potential for technical variation artifacts in our study in the discussion (line 414-416).

      (4) Need for permutation testing. "We identified 563 genes regulated by a significant eQTL in specific cell types. In total, 73 genes with eQTLs were also tradeSeq-identified genes in one or more cell type boundaries". These types of statements are fine but they need to be backed up with permutation testing to show that this level of enrichment is greater than one would expect by chance. 

      We did not perform enrichment tests as our only goal was to 1. determine if eQTL could be resolved in the DO mouse population using our scRNA-seq data and 2. predict in what cell type the associated eQTL and associated eGene may have an effect.

      (5) The main novelty of the paper seems to be that you have used single-cell RNA seq (given that you appear to have already detailed the candidates at the end). I don't think this makes the paper less interesting, but I think you need to reframe the paper more about the approach, and not the specific results. How you landed on these candidates is also not clear. So the paper might be improved by more robustly establishing the workflow and providing guidelines for how studies like this should be conducted in the future. 

      We sought to not only devise a rigorous approach to analyze our single cell data, but also showcase the utility of the approach in practice by highlighting targets for future research (i.e., Fgfrl1 and Tpx2).

      Our goal was to identify novel genes and we landed on these candidate genes (Fgfrl1 and Tpx2) because they had substantial data supporting their causality and they have yet to be fully characterized in the context of bone and BMD (line 295-297).

      In regards to establishing the workflow, we have included rationale for specific aspects of our approach throughout the paper. For example, Figure 2 itemizes each step of our network analysis and we explain why each step is utilized throughout various parts results (e.g., lines 168-170, 179-181, 191-193, 202-203, 257-260, 276-277).

      We have added a statement advocating for large-scale scRNA-seq from genetically diverse samples and network analyses for future studies (line 436-438).

      Minor Points 

      (1) In the summary you use the word "trajectory". Trajectories for what? I assume the transition between cell types, but this is not clear. 

      We added text to clarify the use of trajectory in the summary (line 34).

      (2) This sentence: "By 60 identifying networks enriched for genes implicated in GWAS we predicted putatively causal genes 61 for hundreds of BMD associations based on their membership in enriched modules." is also not clear. Do you mean: we predicted putatively causal genes by identifying clusters of co-expressed genes that were enriched for GWAS genes?" It is not clear how you identify the causal gene in the network. Is this just based on the hub gene? 

      The aforementioned sentence has since been removed to streamline the introduction, as suggested by Reviewer 1.

      In regards to causal gene identification, it is not based on whether it is hub gene. We prioritized a DDG (and their associated networks) if it was a causal gene that we identified in our previous work as having eQTL/sQTL in a GTEx tissue that colocalizes with human BMD GWAS.

      (3) Figure 3C. This is good but the labels are quite small. Would be good to make all the font sizes larger. 

      We have enlarged Figure 3C.

      (4) Line 341 in the Discussion should be "pseudotemporal". 

      We have edited “temporal” to “pseduotemporal”.

    1. eLife Assessment

      This manuscript introduces a potentially valuable large-scale fMRI dataset pairing vision and language, and employs rigorous decoding analyses to investigate how the brain represents visual, linguistic, and imagined content. The current manuscript blurs the line between a resource paper and a theoretical contribution, and the evidence for truly modality-agnostic representations remains incomplete at this stage. Clarifying the conceptual aims and strengthening both the dataset technicality and the quantitative analyses would improve the manuscript's significance for the fields of cognitive neuroscience and multimodal AI.

    2. Reviewer #1 (Public review):

      Summary:

      The authors introduce a densely-sampled dataset where 6 participants viewed images and sentence descriptions derived from the MS Coco database over the course of 10 scanning sessions. The authors further showcase how image and sentence decoders can be used to predict which images or descriptions were seen, using pairwise decoding across a set of 120 test images. The authors find decodable information widely distributed across the brain, with a left-lateralized focus. The results further showed that modality-agnostic models generally outperformed modality-specific models, and that data based on captions was not explained better by caption-based models but by modality-agnostic models. Finally, the authors decoded imagined scenes.

      Strengths:

      (1) The dataset presents a potentially very valuable resource for investigating visual and semantic representations and their interplay.

      (2) The introduction and discussion are very well written in the context of trying to understand the nature of multimodal representations and present a comprehensive and very useful review of the current literature on the topic.

      Weaknesses:

      (1) The paper is framed as presenting a dataset, yet most of it revolves around the presentation of findings in relation to what the authors call modality-agnostic representations, and in part around mental imagery. This makes it very difficult to assess the manuscript, whether the authors have achieved their aims, and whether the results support the conclusions.

      (2) While the authors have presented a potential use case for such a dataset, there is currently far too little detail regarding data quality metrics expected from the introduction of similar datasets, including the absence of head-motion estimates, quality of intersession alignment, or noise ceilings of all individuals.

      (3) The exact methods and statistical analyses used are still opaque, making it hard for a reader to understand how the authors achieved their results. More detail in the manuscript would be helpful, specifically regarding the exact statistical procedures, what tests were performed across, or how data were pooled across participants.

      (4) Many findings (e.g., Figure 6) are still qualitative but could be supported by quantitative measures.

      (5) Results are significant in regions that typically lack responses to visual stimuli, indicating potential bias in the classifier. This is relevant for the interpretation of the findings. A classification approach less sensitive to outliers (e.g., 70-way classification) could avoid this issue. Given the extreme collinearity of the experimental design, regressors in close temporal proximity will be highly similar, which could lead to leakage effects.

      (6) The manuscript currently lacks a limitations section, specifically regarding the design of the experiment. This involves the use of the overly homogenous dataset Coco, which invites overfitting, the mixing of sentence descriptions and visual images, which invites imagery of previously seen content, and the use of a 1-back task, which can lead to carry-over effects to the subsequent trial.

      (7) I would urge the authors to clarify whether the primary aim is the introduction of a dataset and showing the use of it, or whether it is the set of results presented. This includes the title of this manuscript. While the decoding approach is very interesting and potentially very valuable, I believe that the results in the current form are rather descriptive, and I'm wondering what specifically they add beyond what is known from other related work. This includes imagery-related results. This is completely fine! It just highlights that a stronger framing as a dataset is probably advantageous for improving the significance of this work.

    3. Reviewer #2 (Public review):

      Summary:

      This study introduces SemReps-8K, a large multimodal fMRI dataset collected while subjects viewed natural images and matched captions, and performed mental imagery based on textual cues. The authors aim to train modality-agnostic decoders--models that can predict neural representations independently of the input modality - and use these models to identify brain regions containing modality-agnostic information. They find that such decoders perform comparably or better than modality-specific decoders and generalize to imagery trials.

      Strengths:

      (1) The dataset is a substantial and well-controlled contribution, with >8,000 image-caption trials per subject and careful matching of stimuli across modalities - an essential resource for testing theories of abstract and amodal representation.

      (2) The authors systematically compare unimodal, multimodal, and cross-modal decoders using a wide range of deep learning models, demonstrating thoughtful experimental design and thorough benchmarking.

      (3) Their decoding pipeline is rigorous, with informative performance metrics and whole-brain searchlight analyses, offering valuable insights into the cortical distribution of shared representations.

      (4) Extension to mental imagery decoding is a strong addition, aligning with theoretical predictions about the overlap between perception and imagery.

      Weaknesses:

      While the decoding results are robust, several critical limitations prevent the current findings from conclusively demonstrating truly modality-agnostic representations:

      (1) Shared decoding ≠ abstraction: Successful decoding across modalities does not necessarily imply abstraction or modality-agnostic coding. Participants may engage in modality-specific processes (e.g., visual imagery when reading, inner speech when viewing images) that produce overlapping neural patterns. The analyses do not clearly disambiguate shared representational structure from genuinely modality-independent representations. Furthermore, in Figure 5, the modality-agnostic encoder did not perform better than the modality-specific decoder trained on images (in decoding images), but outperformed the modality-specific decoder trained on captions (in decoding captions). This asymmetry contradicts the premise of a truly "modality-agnostic" encoder. Additionally, given the similar performance between modality-agnostic decoders based on multimodal versus unimodal features, it remains unclear why neural representations did not preferentially align with multimodal features if they were truly modality-independent.

      (2) The current analysis cannot definitively conclude that the decoder itself is modality-agnostic, making "Qualitative Decoding Results" difficult to interpret in this context. This section currently provides illustrative examples, but lacks systematic quantitative analyses.

      (3) The use of mental imagery as evidence for modality-agnostic decoding is problematic. Imagery involves subjective, variable experiences and likely draws on semantic and perceptual networks in flexible ways. Strong decoding in imagery trials could reflect semantic overlap or task strategies rather than evidence of abstraction.

      The manuscript presents a methodologically sophisticated and timely investigation into shared neural representations across modalities. However, the current evidence does not clearly distinguish between shared semantics, overlapping unimodal processes, and true modality-independent representations. A more cautious interpretation is warranted. Nonetheless, the dataset and methodological framework represent a valuable resource for the field.

    4. Reviewer #3 (Public review):

      Summary:

      The authors recorded brain responses while participants viewed images and captions. The images and captions were taken from the COCO dataset, so each image has a corresponding caption, and each caption has a corresponding image. This enabled the authors to extract features from either the presented stimulus or the corresponding stimulus in the other modality. The authors trained linear decoders to take brain responses and predict stimulus features. "Modality-specific" decoders were trained on brain responses to either images or captions, while "modality-agnostic" decoders were trained on brain responses to both stimulus modalities. The decoders were evaluated on brain responses while the participants viewed and imagined new stimuli, and prediction performance was quantified using pairwise accuracy. The authors reported the following results:

      (1) Decoders trained on brain responses to both images and captions can predict new brain responses to either modality.

      (2) Decoders trained on brain responses to both images and captions outperform decoders trained on brain responses to a single modality.

      (3) Many cortical regions represent the same concepts in vision and language.

      (4) Decoders trained on brain responses to both images and captions can decode brain responses to imagined scenes.

      Strengths:

      This is an interesting study that addresses important questions about modality-agnostic representations. Previous work has shown that decoders trained on brain responses to one modality can be used to decode brain responses to another modality. The authors build on these findings by collecting a new multimodal dataset and training decoders on brain responses to both modalities.

      To my knowledge, SemReps-8K is the first dataset of brain responses to vision and language where each stimulus item has a corresponding stimulus item in the other modality. This means that brain responses to a stimulus item can be modeled using visual features of the image, linguistic features of the caption, or multimodal features derived from both the image and the caption. The authors also employed a multimodal one-back matching task, which forces the participants to activate modality-agnostic representations. Overall, SemReps-8K is a valuable resource that will help researchers answer more questions about modality-agnostic representations.

      The analyses are also very comprehensive. The authors trained decoders on brain responses to images, captions, and both modalities, and they tested the decoders on brain responses to images, captions, and imagined scenes. They extracted stimulus features using a range of visual, linguistic, and multimodal models. The modeling framework appears rigorous, and the results offer new insights into the relationship between vision, language, and imagery. In particular, the authors found that decoders trained on brain responses to both images and captions were more effective at decoding brain responses to imagined scenes than decoders trained on brain responses to either modality in isolation. The authors also found that imagined scenes can be decoded from a broad network of cortical regions.

      Weaknesses:

      The characterization of "modality-agnostic" and "modality-specific" decoders seems a bit contradictory. There are three major choices when fitting a decoder: the modality of the training stimuli, the modality of the testing stimuli, and the model used to extract stimulus features. However, the authors characterize their decoders based on only the first choice-"modality-specific" decoders were trained on brain responses to either images or captions, while "modality-agnostic" decoders were trained on brain responses to both stimulus modalities. I think that this leads to some instances where the conclusions are inconsistent with the methods and results.

      First, the authors suggest that "modality-specific decoders are not explicitly encouraged to pick up on modality-agnostic features during training" (line 137) while "modality-agnostic decoders may be more likely to leverage representations that are modality-agnostic" (line 140). However, whether a decoder is required to learn modality-agnostic representations depends on both the training responses and the stimulus features. Consider the case where the stimuli are represented using linguistic features of the captions. When you train a "modality-specific" decoder on image responses, the decoder is forced to rely on modality-agnostic information that is shared between the image responses and the caption features. On the other hand, when you train a "modality-agnostic" decoder on both image responses and caption responses, the decoder has access to the modality-specific information that is shared by the caption responses and the caption features, so it is not explicitly required to learn modality-agnostic features. As a result, while the authors show that "modality-agnostic" decoders outperform "modality-specific" decoders in most conditions, I am not convinced that this is because they are forced to learn more modality-agnostic features.

      Second, the authors claim that "modality-specific decoders can be applied only in the modality that they were trained on, while "modality-agnostic decoders can be applied to decode stimuli from multiple modalities, even without knowing a priori the modality the stimulus was presented in" (line 47). While "modality-agnostic" decoders do outperform "modality-specific" decoders in the cross-modality conditions, it is important to note that "modality-specific" decoders still perform better than expected by chance (figure 5). It is also important to note that knowing about the input modality still improves decoding performance even for "modality-agnostic" decoders, since it determines the optimal feature space-it is better to decode brain responses to images using decoders trained on image features, and it is better to decode brain responses to captions using decoders trained on caption features.

    1. eLife Assessment

      This study provides new important insights concerning pathogen variant-specific reproduction parameters from molecular sequencing and case finding. The methods for inferring which variants will likely emerge in subsequent epidemic cycles are solid. This article is of broad interest to infectious disease epidemiology researchers and mathematical modellers of the COVID-19 pandemic.

    2. Reviewer #1 (Public review):

      In this manuscript, the authors describe a new method to more accurately estimate the fitness advantage of new SARS-CoV-2 variants when they emerge. This was a key public health question during the pandemic and drove a number of important policy choices during the latter half of the acute phase of the pandemic. They attempt to link fitness to expected wave size. The analyses are tested on data from 33 different US states for which the data were considered sufficient. The main novelty of the method is that it links the frequency of variants to the number of cases and thus estimates fitness in terms of the reproduction number.

      The results with the new method appear to be more consistent estimates of fitness advantage over time, suggesting that the methods suggested are more accurate than the comparator methods.

      Given that the paper presents a methodological advancement, the absence of a simulation study is a weakness. I am satisfied that the trends estimated via the different approaches suggest a useful advancement for a difficult problem. However, the work would have been considerably stronger if synthetic data had been used to illustrate without doubt how the revised method better captures underlying, pre-specified differences in fitness.

    3. Reviewer #2 (Public review):

      Summary:

      This study develops a joint epidemiological and population genetic model to infer variant-specific effective reproduction numbers Rt and growth advantages of SARS-CoV-2 variants using US case counts and sequence data (Jan 2021-Mar 2022). For this, they use the commonly used renewal equation framework, observation models (negative binomial with zero inflation and Dirichlet-multinomial likelihoods, both to account for overdispersion). For the parameterization of Rt, again, they used a classic cubic spline basis expansion. Additionally, they use Bayesian Inference, specifically SVI. I was reassured to see the sensitivity analysis on the generation time to check effects on Rt.

      This is an incredibly robust study design. Integrating case and sequence data enables estimation of both absolute and relative variant fitness, overcoming limitations of frequency-only or case-only models. This reminds me of https://www.medrxiv.org/content/10.1101/2023.01.02.23284123v4.full

      I also really appreciated the flexible and interpretable parameterization of the renewal equations with splines. But I may be biased since I really like splines!

      The approach is justified, however, it has some big limitations. Specifically, there are some notable weaknesses, that I detail below.

      (1) The model does not account for demographic stochasticity or transmission overdispersion (superspreading), which are known to affect SARS-CoV-2 dynamics and can bias Rt, especially in low incidence or early introduction phases.

      (2) While the authors explore the sensitivity of generation time, the reliance on fixed generation time parameters (with some adjustments for Delta/Omicron) may still bias results

      (3) There is no explicit adjustment for population immunity, which limits the ability to disentangle intrinsic variant fitness (even though the model allows for inclusion of covariates - this to me is one of two major flaws in the study.

      (4) The second major flaw in my opinion is that there is no hierarchical pooling across states - each state is modeled independently. A hierarchical Bayesian model could borrow strength across states, improving estimates for states with sparse data and enabling more robust inference of shared variant effects.

      I would strongly recommend the following things in order of priority, where the first two points I consider critical.

      (1) Implement a hierarchical model for variant growth advantages and Rt across states.

      (2) Include time-varying covariates for vaccination rates, prior infection, and non-pharmaceutical interventions directly. This would help disentangle intrinsic variant transmissibility from changes in population susceptibility and behavior.

      (3) Extend the renewal model to a stochastic or branching process framework that explicitly models overdispersed transmission.

      (4) It would be good to allow for multiple seeding events per variant and per state. This can be informed by phylogeography in a minimum effort way and would improve the accuracy of Rt.

      (5) By now, I don't think it will be a surprise that addressing sampling bias is standard, reweighting sequence data or comparing results with independent surveillance data to assess the impact of non-representative sequencing.

    1. eLife Assessment

      This study provides an important extension of credibility-based learning research with a well-controlled paradigm by showing how feedback reliability can distort reward-learning biases in a disinformation-like bandit task. The strength of evidence is convincing for the core effects reported (greater learning from credible feedback; robust computational accounts, parameter recovery) but incomplete for the specific claims about heightened positivity bias at low credibility, which depend on a single dataset, metric choices (absolute vs relative), and potential perseveration or cueing confounds. Limitations concerning external validity and task-induced cognitive load, and the use of relatively simple Bayesian comparators, suggest that incorporating richer active-inference/HGF benchmarks and designs that dissociate positivity bias from choice history would further strengthen this paper.

    2. Reviewer #1 (Public review):

      This is a well-designed and very interesting study examining the impact of imprecise feedback on outcomes on decision-making. I think this is an important addition to the literature and the results here, which provide a computational account of several decision-making biases, are insightful and interesting.

      I do not believe I have substantive concerns related to the actual results presented; my concerns are more related to the framing of some of the work. My main concern is regarding the assertion that the results prove that non-normative and non-Bayesian learning is taking place. I agree with the authors that their results demonstrate that people will make decisions in ways that demonstrate deviations from what would be optimal for maximizing reward in their task under a strict application of Bayes rule. I also agree that they have built reinforcement learning models which do a good job of accounting for the observed behavior. However, the Bayesian models included are rather simple- per the author descriptions, applications of Bayes' rule with either fixed or learned credibility for the feedback agents. In contrast, several versions of the RL models are used, each modified to account for different possible biases. However more complex Bayes-based models exist, notably active inference but even the hierarchical gaussian filter. These formalisms are able to accommodate more complex behavior, such as affect and habits, which might make them more competitive with RL models. I think it is entirely fair to say that these results demonstrate deviations from an idealized and strict Bayesian context; however, the equivalence here of Bayesian and normative is I think misleading or at least requires better justification/explanation. This is because a great deal of work has been done to show that Bayes optimal models can generate behavior or other outcomes that are clearly not optimal to an observer within a given context (consider hallucinations for example) but which make sense in the context of how the model is constructed as well as the priors and desired states the model is given.

      As such, I would recommend that the language be adjusted to carefully define what is meant by normative and Bayesian and to recognize that work that is clearly Bayesian could potentially still be competitive with RL models if implemented to model this task. An even better approach would be to directly use one of these more complex modelling approaches, such as active inference, as the comparator to the RL models, though I would understand if the authors would want this to be a subject for future work.

      Abstract:

      The abstract is lacking in some detail about the experiments done, but this may be a limitation of the required word count? If word count is not an issue, I would recommend adding details of the experiments done and the results. One comment is that there is an appeal to normative learning patterns, but this suggests that learning patterns have a fixed optimal nature, which may not be true in cases where the purpose of the learning (e.g. to confirm the feeling of safety of being in an in-group) may not be about learning accurately to maximize reward. This can be accommodated in a Bayesian framework by modelling priors and desired outcomes. As such the central premise that biased learning is inherently non-normative or non-Bayesian I think would require more justification. This is true in the introduction as well.

      Introduction:

      As noted above the conceptualization of Bayesian learning being equivalent to normative learning I think requires either further justification. Bayesian belief updating can be biased an non-optimal from an observer perspective, while being optimal within the agent doing the updating if the priors/desired outcomes are set up to advantage these "non-optimal" modes of decision making.

      Results:

      I wonder why the agent was presented before the choice - since the agent is only relevant to the feedback after the choice is made. I wonder if that might have induced any false association between the agent identity and the choice itself. This is by no means a critical point but would be interesting to get the authors' thoughts.

      The finding that positive feedback increases learning is one that has been shown before and depends on valence, as the authors note. They expanded their reinforcement learning model to include valence; but they did not modify the Bayesian model in a similar manner. This lack of a valence or recency effect might also explain the failure of the Bayesian models in the preceding section where the contrast effect is discussed. It is not unreasonable to imagine that if humans do employ Bayesian reasoning that this reasoning system has had parameters tuned based on the real world, where recency of information does matter; affect has also been shown to be incorporable into Bayesian information processing (see the work by Hesp on affective charge and the large body of work by Ryan Smith). It may be that the Bayesian models chosen here require further complexity to capture the situation, just like some of the biases required updates to the RL models. This complexity, rather than being arbitrary, may be well justified by decision making in the real world.

      The methods mention several symptom scales- it would be interesting to have the results of these and any interesting correlations noted. It is possible that some of individual variability here could be related to these symptoms, which could introduce precision parameter changes in a Bayesian context and things like reward sensitivity changes in an RL context.

      Discussion:

      (For discussion, not a specific comment on this paper): One wonders also about participant beliefs about the experiment or the intent of the experimenters. I have often had participants tell me they were trying to "figure out" a task or find patterns even when this was not part of the experiment. This is not specific to this paper, but it may be relevant in the future to try and model participant beliefs about the experiment especially in the context of disinformation, when they might be primed to try and "figure things out".

      As a general comment, in the active inference literature, there has been discussion of state-dependent actions, or "habits", which are learned in order to help agents more rapidly make decisions, based on previous learning. It is also possible that what is being observed is that these habits are at play, and that they represent the cognitive biases. This is likely especially true given, as the authors note, the high cognitive load of the task. It is true that this would mean that full-force Bayesian inference is not being used in each trial, or in each experience an agent might have in the world, but this is likely adaptive on the longer timescale of things, considering resource requirements. I think in this case you could argue that we have a departure from "normative" learning, but that is not necessarily a departure from any possible Bayesian framework, since these biases could potentially be modified by the agent or eschewed in favor of more expensive full-on Bayesian learning when warranted. Indeed in their discussion on the strategy of amplifying credible news sources to drown out low-credibility sources, the authors hint to the possibility of longer term strategies that may produce optimal outcomes in some contexts, but which were not necessarily appropriate to this task. As such, the performance on this task- and the consideration of true departure from Bayesian processing- should be considered in this wider context. Another thing to consider is that Bayesian inference is occurring, but that priors present going in produce the biases, or these biases arise from another source, for example factoring in epistemic value over rewards when the actual reward is not large. This again would be covered under an active inference approach, depending on how the priors are tuned. Indeed, given the benefit of social cohesion in an evolutionary perspective, some of these "biases" may be the result of adaptation. For example, it might be better to amplify people's good qualities and minimize their bad qualities in order to make it easier to interact with them; this entails a cost (in this case, not adequately learning from feedback and potentially losing out sometimes), but may fulfill a greater imperative (improved cooperation on things that matter). Given the right priors/desired states, this could still be a Bayes-optimal inference at a social level and as such may be ingrained as a habit which requires effort to break at the individual level during a task such as this.

      The authors note that this task does not relate to "emotional engagement" or "deep, identity-related, issues". While I agree that this is likely mostly true, it is also possible that just being told one is being lied to might elicit an emotional response that could bias responses, even if this is a weak response.

      Comments on revisions:

      In their updated version the authors have made some edits to address my concerns regarding the framing of the 'normative' bayesian model, clarifying that they utilized a simple bayesian model which is intended to adhere in an idealized manner to the intended task structure, though further simulations would have been ideal.

      The authors, however, did not take my recommendation to explore the symptoms in the symptom scales they collected as being a potential source of variability. They note that these were for hypothesis generation and were exploratory, fair enough, but this study is not small and there should have been sufficient sample size for a very reasonable analysis looking at symptom scores.

      However, overall the toned down claims and clarifications of intent are adequate responses to my previous review.

    3. Reviewer #2 (Public review):

      This important paper studies the problem of learning from feedback given by sources of varying credibility. The convincing combination of experiment and computational modeling helps to pin down properties of learning, while opening unresolved questions for future research.

      Summary:

      This paper studies the problem of learning from feedback given by sources of varying credibility. Two bandit-style experiments are conducted in which feedback is provided with uncertainty, but from known sources. Bayesian benchmarks are provided to assess normative facets of learning, and alternative credit assignment models are fit for comparison. Some aspects of normativity appear, in addition to possible deviations such as asymmetric updating from positive and negative outcomes.

      Strengths:

      The paper tackles an important topic, with a relatively clean cognitive perspective. The construction of the experiment enables the use of computational modeling. This helps to pinpoint quantitatively the properties of learning and formally evaluate their impact and importance. The analyses are generally sensible, and advanced parameter recovery analyses (including cross-fitting procedure) provide confidence in the model estimation and comparison. The authors have very thoroughly revised the paper in response to previous comments.

      Weaknesses:

      The authors acknowledge the potential for cognitive load and the interleaved task structure to play a meaningful role in the results, though leave this for future work. This is entirely reasonable, but remains a limitation in our ability to generalize the results. Broadly, some of the results obtain in cases where the extent of generalization is not always addressed and remains uncertain.

    4. Reviewer #3 (Public review):

      Summary

      This paper investigates how disinformation affects reward learning processes in the context of a two-armed bandit task, where feedback is provided by agents with varying reliability (with lying probability explicitly instructed). They find that people learn more from credible sources, but also deviate systematically from optimal Bayesian learning: They learned from uninformative random feedback, learned more from positive feedback, and updated too quickly from fully credible feedback (especially following low-credibility feedback). Overall, this study highlights how misinformation could distort basic reward learning processes, without appeal to higher order social constructs like identity.

      Strengths

      • The experimental design is simple and well-controlled; in particular, it isolates basic learning processes by abstracting away from social context
      • Modeling and statistics meet or exceed standards of rigor
      • Limitations are acknowledged where appropriate, especially those regarding external validity
      • The comparison model, Bayes with biased credibility estimates, is strong; deviations are much more compelling than e.g. a purely optimal model
      • The conclusions are of substantial interest from both a theoretical and applied perspective

      Weaknesses

      The authors have addressed most of my concerns with the initial submission. However, in my view, evidence for the conclusion that less credible feedback yields a stronger positivity bias remains weak. This is due to two issues.

      Absolute or relative positivity bias?

      The conclusion of greater positivity bias for lower credible feedback (Fig 5) hinges on the specific way in which positivity bias is defined. Specifically, we only see the effect when normalizing the difference in sensitivity to positive vs. negative feedback by the sum. I appreciate that the authors present both and add the caveat whenever they mention the conclusion. However, without an argument that the relative definition is more appropriate, the fact of the matter is that the evidence is equivocal.

      There is also a good reason to think that the absolute definition is more appropriate. As expected, participants learn more from credible feedback. Thus, normalizing by average learning (as in the relative definition) amounts to dividing the absolute difference by increasingly large numbers for more credible feedback. If there is a fixed absolute positivity bias (or something that looks like it), the relative bias will necessarily be lower for more credible feedback. In fact, the authors own results demonstrate this phenomenon (see below). A reduction in relative bias thus provides weak evidence for the claim.

      It is interesting that the discovery study shows evidence of a drop in absolute bias. However, for me, this just raises questions. Why is there a difference? Was one a just a fluke? If so, which one?

      Positivity bias or perseveration?

      Positivity bias and perseveration will both predict a stronger relationship between positive (vs. negative) feedback and future choice. They can thus be confused for each other when inferred from choice data. This potentially calls into question all the results on positivity bias.

      The authors clearly identify this concern in the text and go to considerable lengths to rule it out. However, the new results (in revision 1) show that a perseveration-only model can in fact account for the qualitative pattern in the human data (the CA parameters). This contradicts the current conclusion:

      Critically, however, these analyses also confirmed that perseveration cannot account for our main finding of increased positivity bias, relative to the overall extent of CA, for low-credibility feedback.

      Figure 24c shows that the credibility-CA model does in fact show stronger positivity bias for less credible feedback. The model distribution for credibility 1 is visibly lower than for credibilities 0.5 and 0.75.

      The authors need to be clear that it is the magnitude of the effect that the perseveration-only model cannot account for. Furthermore, they should additionally clarify that this is true only for models fit to data; it is possible that the credibility-CA model could capture the full size of the effect with different parameters (which could fit best if the model was implemented slightly differently).

      The authors could make the new analyses somewhat stronger by using parameters optimized to capture just the pattern in CA parameters (for example by MSE). This would show that the models are in principle incapable of capturing the effect. However, this would be a marginal improvement because the conclusion would still rest on a quantitative difference that depends on specific modeling assumptions.

      New simulations clearly demonstrate the confound in relative bias

      Figure 24 also speaks to the relative vs. absolute question. The model without positivity bias shows a slightly stronger absolute "positivity bias" for the most credible feedback, but a weaker relative bias. This is exactly in line with the logic laid out above. In standard bandit tasks, perseveration can be quite well-captured by a fixed absolute positivity bias, which is roughly what we see in the simulations (I'm not sure what to make of the slight increase; perhaps a useful lead for the authors). However, when we divide by average credit assignment, we now see a reduction. This clearly demonstrates that a reduction in relative bias can emerge without any true differences in positivity bias.

      Given everything above, I think it is unlikely that the present data can provide even "solid" evidence for the claim that positivity bias is greater with less credible feedback. This confound could be quickly ruled out, however, by a study in which feedback is sometimes provided in the absence of a choice. This would empirically isolate positivity bias from choice-related effects, including perseveration.

    5. Author response:

      The following is the authors’ response to the original reviews

      Reviewer #1 (Public review):

      This is a well-designed and very interesting study examining the impact of imprecise feedback on outcomes in decision-making. I think this is an important addition to the literature, and the results here, which provide a computational account of several decision-making biases, are insightful and interesting.

      We thank the reviewer for highlighting the strengths of this work.

      I do not believe I have substantive concerns related to the actual results presented; my concerns are more related to the framing of some of the work. My main concern is regarding the assertion that the results prove that non-normative and non-Bayesian learning is taking place. I agree with the authors that their results demonstrate that people will make decisions in ways that demonstrate deviations from what would be optimal for maximizing reward in their task under a strict application of Bayes' rule. I also agree that they have built reinforcement learning models that do a good job of accounting for the observed behavior. However, the Bayesian models included are rather simple, per the author's descriptions, applications of Bayes' rule with either fixed or learned credibility for the feedback agents. In contrast, several versions of the RL models are used, each modified to account for different possible biases. However, more complex Bayes-based models exist, notably active inference, but even the hierarchical Gaussian filter. These formalisms are able to accommodate more complex behavior, such as affect and habits, which might make them more competitive with RL models. I think it is entirely fair to say that these results demonstrate deviations from an idealized and strict Bayesian context; however, the equivalence here of Bayesian and normative is, I think, misleading or at least requires better justification/explanation. This is because a great deal of work has been done to show that Bayes optimal models can generate behavior or other outcomes that are clearly not optimal to an observer within a given context (consider hallucinations for example), but which make sense in the context of how the model is constructed as well as the priors and desired states the model is given.

      As such, I would recommend that the language be adjusted to carefully define what is meant by normative and Bayesian and to recognize that work that is clearly Bayesian could potentially still be competitive with RL models if implemented to model this task. An even better approach would be to directly use one of these more complex modelling approaches, such as active inference, as the comparator to the RL models, though I would understand if the authors would want this to be a subject for future work.

      We thank the reviewer for raising this crucial and insightful point regarding the framing of our results and the definitions of 'normative' and 'Bayesian' learning. Our primary aim in this work was to characterize specific behavioral signatures that demonstrate deviations from predictions generated by a strict, idealized Bayesian framework when learning from disinformation (which we term “biases”). We deliberately employed relatively simple Bayesian models as benchmarks to highlight these specific biases. We fully agree that more sophisticated Bayes-based models (as mentioned by the reviewer, or others) could potentially offer alternative mechanistic explanations for participant behavior. However, we currently do not have a strong notion about which Bayesian models can encompass our findings, and hence, we leave this important question for future work.

      To enhance clarity within the current manuscript we now avoided the use of the term “normative” to refer to our Bayesian models, using the term “ideal” instead. We also define more clearly what exactly we mean by that notion when the idea model is described:

      “This model is based on an idealized assumptions that during the feedback stage of each trial, the value of the chosen bandit is updated (based on feedback valence and credibility) according to Bayes rule reflecting perfect adherence to the instructed task structure (i.e., how true outcomes and feedback are generated).”

      Moreover, we have added a few sentences in the discussion commenting on how more complex Bayesian models might account for our empirical findings:

      “However, as hypothesized, when facing potential disinformation, we also find that individuals exhibit several important biases i.e., deviations from strictly idealized Bayesian strategies. Future studies should explore if and under what assumptions, about the task’s generative structure and/or learner’s priors and objectives, more complex Bayesian models (e.g., active inference (58)) might account for our empirical findings.”

      Abstract:

      The abstract is lacking in some detail about the experiments done, but this may be a limitation of the required word count. If word count is not an issue, I would recommend adding details of the experiments done and the results.

      We thank the reviewer for their valuable suggestion. We have now included more details about the experiment in the abstract:

      “In two experiments, participants completed a two-armed bandit task, where they repeatedly chose between two lotteries and received outcome-feedback from sources of varying credibility, who occasionally disseminated disinformation by lying about true choice outcome (e.g., reporting non reward when a reward was truly earned or vice versa).”

      One comment is that there is an appeal to normative learning patterns, but this suggests that learning patterns have a fixed optimal nature, which may not be true in cases where the purpose of the learning (e.g. to confirm the feeling of safety of being in an in-group) may not be about learning accurately to maximize reward. This can be accommodated in a Bayesian framework by modelling priors and desired outcomes. As such, the central premise that biased learning is inherently non-normative or non-Bayesian, I think, would require more justification. This is true in the introduction as well.

      Introduction:

      As noted above, the conceptualization of Bayesian learning being equivalent to normative learning, I think requires further justification. Bayesian belief updating can be biased and non-optimal from an observer perspective, while being optimal within the agent doing the updating if the priors/desired outcomes are set up to advantage these "non-optimal" modes of decision making.

      We appreciate the reviewer's thoughtful comment regarding the conceptualization of "normative" and "Bayesian" learning. We fully agree that the definition of "normative" is nuanced and can indeed depend on whether one considers reward-maximization or the underlying principles of belief updating. As explained above we now restrict our presentation to deviations from “ideal Bayes” learning patterns and we acknowledge the reviewer’s concern in a caveat in our discussion.

      Results:

      I wonder why the agent was presented before the choice, since the agent is only relevant to the feedback after the choice is made. I wonder if that might have induced any false association between the agent identity and the choice itself. This is by no means a critical point, but it would be interesting to get the authors' thoughts.

      We thank the reviewer for raising this interesting point regarding the presentation of the agent before the choice. Our decision to present the agent at this stage was intentional, as our original experimental design aimed to explore the possible effects of "expected source credibility" on participants' choices (e.g., whether knowledge of feedback credibility will affect choice speed and accuracy). However, we found nothing that would be interesting to report.

      The finding that positive feedback increases learning is one that has been shown before and depends on valence, as the authors note. They expanded their reinforcement learning model to include valence, but they did not modify the Bayesian model in a similar manner. This lack of a valence or recency effect might also explain the failure of the Bayesian models in the preceding section, where the contrast effect is discussed. It is not unreasonable to imagine that if humans do employ Bayesian reasoning that this reasoning system has had parameters tuned based on the real world, where recency of information does matter; affect has also been shown to be incorporable into Bayesian information processing (see the work by Hesp on affective charge and the large body of work by Ryan Smith). It may be that the Bayesian models chosen here require further complexity to capture the situation, just like some of the biases required updates to the RL models. This complexity, rather than being arbitrary, may be well justified by decision-making in the real world.

      Thanks for these additional important ideas which speak more to the notion that more complex Bayesian frameworks may account for biases we report.

      The methods mention several symptom scales- it would be interesting to have the results of these and any interesting correlations noted. It is possible that some of the individual variability here could be related to these symptoms, which could introduce precision parameter changes in a Bayesian context and things like reward sensitivity changes in an RL context.

      We included these questionnaires for exploratory purposes, with the aim of generating informed hypotheses for future research into individual differences in learning. Given the preliminary nature of these analyses, we believe further research is required about this important topic.

      Discussion:

      (For discussion, not a specific comment on this paper): One wonders also about participants' beliefs about the experiment or the intent of the experimenters. I have often had participants tell me they were trying to "figure out" a task or find patterns even when this was not part of the experiment. This is not specific to this paper, but it may be relevant in the future to try and model participant beliefs about the experiment especially in the context of disinformation, when they might be primed to try and "figure things out".

      We thank the reviewer for this important recommendation. We agree and this point is included in our caveat (cited above) that future research should address what assumptions about the generative task structure can allow Bayesian models to account for our empirical patterns.

      As a general comment, in the active inference literature, there has been discussion of state-dependent actions, or "habits", which are learned in order to help agents more rapidly make decisions, based on previous learning. It is also possible that what is being observed is that these habits are at play, and that they represent the cognitive biases. This is likely especially true given, as the authors note, the high cognitive load of the task. It is true that this would mean that full-force Bayesian inference is not being used in each trial, or in each experience an agent might have in the world, but this is likely adaptive on the longer timescale of things, considering resource requirements. I think in this case you could argue that we have a departure from "normative" learning, but that is not necessarily a departure from any possible Bayesian framework, since these biases could potentially be modified by the agent or eschewed in favor of more expensive full-on Bayesian learning when warranted.<br /> Indeed, in their discussion on the strategy of amplifying credible news sources to drown out low-credibility sources, the authors hint at the possibility of longer-term strategies that may produce optimal outcomes in some contexts, but which were not necessarily appropriate to this task. As such, the performance on this task- and the consideration of true departure from Bayesian processing- should be considered in this wider context.

      Another thing to consider is that Bayesian inference is occurring, but that priors present going in produce the biases, or these biases arise from another source, for example, factoring in epistemic value over rewards when the actual reward is not large. This again would be covered under an active inference approach, depending on how the priors are tuned. Indeed, given the benefit of social cohesion in an evolutionary perspective, some of these "biases" may be the result of adaptation. For example, it might be better to amplify people's good qualities and minimize their bad qualities in order to make it easier to interact with them; this entails a cost (in this case, not adequately learning from feedback and potentially losing out sometimes), but may fulfill a greater imperative (improved cooperation on things that matter). Given the right priors/desired states, this could still be a Bayes-optimal inference at a social level and, as such, may be ingrained as a habit that requires effort to break at the individual level during a task such as this.

      We thank the reviewer for these insightful suggestions speaking further to the point about more complex Bayesian models.

      The authors note that this task does not relate to "emotional engagement" or "deep, identity-related issues". While I agree that this is likely mostly true, it is also possible that just being told one is being lied to might elicit an emotional response that could bias responses, even if this is a weak response.

      We agree with the reviewer that a task involving performance-based bonuses, and particularly one where participants are explicitly told they are being lied to, might elicit weak emotional response. However, our primary point is that the degree of these responses is expected to be substantially weaker than those typically observed in the broader disinformation literature, which frequently deals with highly salient political, social, or identity-related topics that inherently carry strong emotional and personal ties for participants, leading to much more pronounced affective engagement and potential biases. Our task deliberately avoids such issues thus minimizing the potential for significant emotion-driven biases. We have toned down the discussion accordingly:

      “This occurs even when the decision at hand entails minimal emotional engagement or pertinence to deep, identity-related, issues.”

      Reviewer #2 (Public review):

      This valuable paper studies the problem of learning from feedback given by sources of varying credibility. The solid combination of experiment and computational modeling helps to pin down properties of learning, although some ambiguity remains in the interpretation of results.

      Summary:

      This paper studies the problem of learning from feedback given by sources of varying credibility. Two banditstyle experiments are conducted in which feedback is provided with uncertainty, but from known sources. Bayesian benchmarks are provided to assess normative facets of learning, and alternative credit assignment models are fit for comparison. Some aspects of normativity appear, in addition to deviations such as asymmetric updating from positive and negative outcomes.

      Strengths:

      The paper tackles an important topic, with a relatively clean cognitive perspective. The construction of the experiment enables the use of computational modeling. This helps to pinpoint quantitatively the properties of learning and formally evaluate their impact and importance. The analyses are generally sensible, and parameter recovery analyses help to provide some confidence in the model estimation and comparison.

      We thank the reviewer for highlighting the strengths of this work.

      Weaknesses:

      (1) The approach in the paper overlaps somewhat with various papers, such as Diaconescu et al. (2014) and Schulz et al. (forthcoming), which also consider the Bayesian problem of learning and applying source credibility, in terms of theory and experiment. The authors should discuss how these papers are complementary, to better provide an integrative picture for readers.

      Diaconescu, A. O., Mathys, C., Weber, L. A., Daunizeau, J., Kasper, L., Lomakina, E. I., ... & Stephan, K. E. (2014). Inferring the intentions of others by hierarchical Bayesian learning. PLoS computational biology, 10(9), e1003810.

      Schulz, L., Schulz, E., Bhui, R., & Dayan, P. Mechanisms of Mistrust: A Bayesian Account of Misinformation Learning. https://doi.org/10.31234/osf.io/8egxh

      We thank the reviewers for pointing us to this relevant work. We have updated the introduction, mentioning these precedents in the literature and highlighting our specific contributions:

      “To address these questions, we adopt a novel approach within the disinformation literature by exploiting a Reinforcement Learning (RL) experimental framework (36). While RL has guided disinformation research in recent years (37–41), our approach is novel in using one of its most popular tasks: the “bandit task”.”

      We also explain in the discussion how these papers relate to the current study:

      “Unlike previous studies wherein participants had to infer source credibility from experience (30,37,72), we took an explicit-instruction approach, allowing us to precisely assess source-credibility impact on learning, without confounding it with errors in learning about the sources themselves. More broadly, our work connects with prior research on observational learning, which examined how individuals learn from the actions or advice of social partners (72–75). This body of work has demonstrated that individuals integrate learning from their private experiences with learning based on others’ actions or advice—whether by inferring the value others attribute to different options or by mimicking their behavior (57,76). However, our task differs significantly from traditional observational learning. Firstly, our feedback agents interpret outcomes rather than demonstrating or recommending actions (30,37,72).”

      (2) It isn't completely clear what the "cross-fitting" procedure accomplishes. Can this be discussed further?

      We thank the reviewer for requesting further clarification on the cross-fitting procedure. Our study utilizes two distinct model families: Bayesian models and CA models. The credit assignment parameters from the CA models can be treated as “data/behavioural features” corresponding to how choice feedback affects choice-propensities. The cross fitting-approach allows us in effect to examine whether these propensity features are predicted from our Bayesian models. To the extent they are not, we can conclude empirical behavior is “biased”.

      Thus, in our cross-fitting procedure we compare the CA model parameters extracted from participant data (empirical features) with those that would be expected if our Bayesian agents performed the task. Specifically, we first fit participant behavior with our Bayesian models, then simulate this model using the best-fitted parameters and fit those simulations with our CA models. This generates a set of CA parameters that would be predicted if participants behavior is reduced to a Bayesian account. By comparing these predicted Bayesian CA parameters with the actual CA parameters obtained from human participants, the cross-fitting procedure allows us to quantitatively demonstrate that the observed participant parameters are indeed statistically significant deviations from normative Bayesian processing. This provides a robust validation that the biases we identify are not artifacts of the CA model's structure but true departures from normative learning.

      We also note that Reviewer 3 suggested an intuitive way to think about the CA parameters—as analogous to logistic regression coefficients in a “sophisticated regression” of choice on (recencyweighted) choice-feedback. We find this suggestion potentially helpful for readers. Under this interpretation, the purpose of the cross-fitting method can be seen simply as estimating the regression coefficients that would be predicted by our Bayesian agents, and comparing those to the empirical coefficients.

      In our manuscript we now explain this issues more clearly by explaining how our model is analogous to a logistic regression:

      “The probability to choose a bandit (say A over B) in this family of models is a logistic function of the contrast choice-propensities between these two bandits. One interpretation of this model is as a “sophisticated” logistic regression, where the CA parameters take the role of “regression coefficients” corresponding to the change in log odds of repeating the just-taken action in future trials based on the feedback (+/- CA for positive or negative feedback, respectively; the model also includes gradual perseveration which allows for constant log-odd changes that are not affected by choice feedback) . The forgetting rate captures the extent to which the effect of each trial on future choices diminishes with time. The Q-values are thus exponentially decaying sums of logistic choice propensities based on the types of feedback a bandit received.”

      We also explain our cross-fitting procedure in more detail:

      “To further characterise deviations between behaviour and our Bayesian learning models, we used a “crossfitting” method. Treating CA parameters as data-features of interest (i.e., feedback dependent changes in choice propensity), our goal was to examine if and how empirical features differ from features extracted from simulations of our Bayesian learning models. Towards that goal, we simulated synthetic data based on Bayesian agents (using participants’ best fitting parameters), but fitted these data using the CA-models, obtaining what we term “Bayesian-CA parameters” (Fig. 2d; Methods). A comparison of these BayesianCA parameters, with empirical-CA parameters obtained by fitting CA models to empirical data, allowed us to uncover patterns consistent with, or deviating from, ideal-Bayesian value-based inference. Under the sophisticated logistic-regression interpretation of the CA-model family the cross-fitting method comprises a comparison between empirical regression coefficients (i.e., empirical CA parameters) and regression coefficient based on simulations of Bayesian models (Bayesian CA parameters).”

      (3) The Credibility-CA model seems to fit the same as the free-credibility Bayesian model in the first experiment and barely better in the second experiment. Why not use a more standard model comparison metric like the Bayesian Information Criterion (BIC)? Even if there are advantages to the bootstrap method (which should be described if so), the BIC would help for comparability between papers.

      We thank the reviewer for this important comment regarding our model comparison approach. We acknowledge that classical information criteria like AIC and BIC are widely used in RL studies. However, we argue our method for model-comparison is superior.

      We conducted a model recovery analysis demonstrating a significant limitation of using AIC or BIC for model-comparison in our data. Both these methods are strongly biased in favor of the Bayesian models. Our PBCM method, on the other hand, is both unbiased and more accurate. We believe this is because “off the shelf” methods like AIC and BIC rely on strong assumptions (such as asymptotic sample size and trial-independence) that are not necessarily met in our tasks (Data is finite; Trials in RL tasks depend on previous trials). PBCM avoids such assumptions to obtain comparison criteria specifically tailored to the structure and size of our empirical data. We have now mentioned this fact in the results section of the main text:

      “We considered using AIC and BIC, which apply “off-the shelf” penalties for model-complexity. However, these methods do not adapt to features like finite sample size (relying instead on asymptotic assumption) or temporal dependence (as is common in reinforcement learning experiments). In contrast, the parametric bootstrap cross-fitting method replaces these fixed penalties with empirical, data-driven criteria for modelselection. Indeed, model-recovery simulations confirmed that whereas AIC and BIC were heavily biased in favour of the Bayesian models, the bootstrap method provided excellent model-recovery (See Fig. S20).”

      We have also included such model recovery in the SI document:

      (4) As suggested in the discussion, the updating based on random feedback could be due to the interleaving of trials. If one is used to learning from the source on most trials, the occasional random trial may be hard to resist updating from. The exact interleaving structure should also be clarified (I assume different sources were shown for each bandit pair). This would also relate to work on RL and working memory: Collins, A. G., & Frank, M. J. (2012). How much of reinforcement learning is working memory, not reinforcement learning? A behavioral, computational, and neurogenetic analysis. European Journal of Neuroscience, 35(7), 10241035.

      We thank the reviewer for this point. The specific interleaved structure of the agents is described in the main text:

      “Each agent provided feedback for 5 trials for each bandit pair (with the agent order interleaved within the bandit pair).”

      As well as in the methods section:

      “Feedback agents were randomly interleaved across trials subject to the constraint that each agent appeared on 5-trials for each bandit pair.”

      We also thank the reviewer for mentioning the relevant work on working memory. We have now added it to our discussion point:

      “In our main study, we show that participants revised their beliefs based on entirely non-credible feedback, whereas an ideal Bayesian strategy dictates such feedback should be ignored. This finding resonates with the “continued-influence effect” whereby misleading information continues to influence an individual's beliefs even after it has been retracted (59,60). One possible explanation is that some participants failed to infer that feedback from the 1-star agent was statistically void of information content, essentially random (e.g., the group-level credibility of this agent was estimated by our free-credibility Bayesian model as higher than 50%). Participants were instructed that this feedback would be “a lie” 50% of the time but were not explicitly told that this meant it was random and should therefore be disregarded. Notably, however, there was no corresponding evidence random feedback affected behaviour in our discovery study. It is possible that an individual’s ability to filter out random information might have been limited due to a high cognitive load induced by our main study task, which required participants to track the values of three bandit pairs and juggle between three interleaved feedback agents (whereas in our discovery study each experimental block featured a single bandit pair). Future studies should explore more systematically how the ability to filter random feedback depends on cognitive load (61).”

      (5) Why does the choice-repetition regression include "only trials for which the last same-pair trial featured the 3-star agent and in which the context trial featured a different bandit pair"? This could be stated more plainly.

      We thank the reviewer for this question. When we previously submitted our manuscript, we thought that finding enhanced credit-assignment for fully credible feedback following potential disinformation from a different context would constitute a striking demonstration of our “contrast effect”. However, upon reexamining this finding we found out we had a coding error (affecting how trials were filtered). We have now rerun and corrected this analysis. We have assessed the contrast effect for both "same-context" trials (where the contextual trial featured the same bandit pair as the learning trial) and "different-context" trials (where the contextual trial featured a different bandit pair). Our re-analysis reveals a selective significant contrast effect in the samecontext condition, but no significant effect in the different-context condition. We have updated the main text to reflect these corrected findings and provide a clearer explanation of the analysis:

      “A comparison of empirical and Bayesian credit-assignment parameters revealed a further deviation from ideal Bayesian learning: participants showed an exaggerated credit-assignment for the 3-star agent compared with Bayesian models [Wilcoxon signed-rank test, instructed-credibility Bayesian model (median difference=0.74, z=11.14); free-credibility Bayesian model (median difference=0.62, z=10.71), all p’s<0.001] (Fig. 3a). One explanation for enhanced learning for the 3-star agents is a contrast effect, whereby credible information looms larger against a backdrop of non-credible information. To test this hypothesis, we examined whether the impact of feedback from the 3-star agent is modulated by the credibility of the agent in the trial immediately preceding it. More specifically, we reasoned that the impact of a 3-star agent would be amplified by a “low credibility context” (i.e., when it is preceded by a low credibility trial). In a binomial mixed effects model, we regressed choice-repetition on feedback valence from the last trial featuring the same bandit pair (i.e., the learning trial) and the feedback agent on the trial immediately preceding that last trial (i.e., the contextual credibility; see Methods for model-specification). This analysis included only learning trials featuring the 3-star agent, and context trials featuring the same bandit pair as the learning trial (Fig. 4a). We found that feedback valence interacted with contextual credibility (F(2,2086)=11.47, p<0.001) such that the feedback-effect (from the 3-star agent) decreased as a function of the preceding context-credibility (3-star context vs. 2-star context: b= -0.29, F(1,2086)=4.06, p=0.044; 2star context vs. 1-star context: b=-0.41, t(2086)=-2.94, p=0.003; and 3-star context vs. 1-star context: b=0.69, t(2086)=-4.74, p<0.001) (Fig. 4b). This contrast effect was not predicted by simulations of our main models of interest (Fig. 4c). No effect was found when focussing on contextual trials featuring a bandit pair different than the one in the learning trial (see SI 3.5). Thus, these results support an interpretation that credible feedback exerts a greater impact on participants’ learning when it follows non-credible feedback, in the same learning context.”

      We have modified the discussion accordingly as well:

      “A striking finding in our study was that for a fully credible feedback agent, credit assignment was exaggerated (i.e., higher than predicted by our Bayesian models). Furthermore, the effect of fully credible feedback on choice was further boosted when it was preceded by a low-credibility context related to current learning. We interpret this in terms of a “contrast effect”, whereby veridical information looms larger against a backdrop of disinformation (21). One upshot is that exaggerated learning might entail a risk of jumping to premature conclusions based on limited credible evidence (e.g., a strong conclusion that a vaccine is produces significant side-effect risks based on weak credible information, following non-credible information about the same vaccine). An intriguing possibility, that could be tested in future studies, is that participants strategically amplify the extent of learning from credible feedback to dilute the impact of learning from noncredible feedback. For example, a person scrolling through a social media feed, encountering copious amounts of disinformation, might amplify the weight they assign to credible feedback in order to dilute effects of ‘fake news’. Ironically, these results also suggest that public campaigns might be more effective when embedding their messages in low-credibility contexts , which may boost their impact.”

      And we have included some additional analyses in the SI document:

      “3.5 Contrast effects for contexts featuring a different bandit

      Given that we observed a contrast effect when both the learning and the immediately preceding "context trial” involved the same pair of bandits, we next investigated whether this effect persisted when the context trial featured a different bandit pair – a situation where the context would be irrelevant to the current learning. Again, we used in a binomial mixed effects model, regressing choice-repetition on feedback valence in the learning trial and the feedback agent in the context trial. This analysis included only learning trials featuring the 3-star agent, and context trials featuring a different bandit pair than the learning trial (Fig. S22a). We found no significant evidence of an interaction between feedback valence and contextual credibility (F(2,2364)=0.21, p=0.81) (Fig. S22b). This null result was consistent with the range of outcomes predicted by our main computational models (Fig. S22c).

      We aimed to formally compare the influence of two types of contextual trials: those featuring the same bandit pair as the learning trial versus those featuring a different pair. To achieve this, we extended our mixedeffects model by incorporating a new predictor variable, "CONTEXT_TYPE" which coded whether the contextual trial involved the same bandit pair (coded as -0.5) or a different bandit pair (+0.5) compared to the learning trial. The Wilkinson notation for this expanded mixed-effects model is:

      𝑅𝐸𝑃𝐸𝐴𝑇 ~ 𝐶𝑂𝑁𝑇𝐸𝑋𝑇_𝑇𝑌𝑃𝐸 ∗ 𝐹𝐸𝐸𝐷𝐵𝐴𝐶𝐾 ∗ (𝐶𝑂𝑁𝑇𝐸𝑋𝑇<sub>2-star</sub> + 𝐶𝑂𝑁𝑇𝐸𝑋𝑇<sub>3-star</sub>) + 𝐵𝐸𝑇𝑇𝐸𝑅 + (1|𝑝𝑎𝑟𝑡𝑖𝑐𝑖𝑝𝑎𝑛𝑡)

      This expanded model revealed a significant three-way interaction between feedback valence, contextual credibility, and context type (F(2,4451) = 7.71, p<0.001). Interpreting this interaction, we found a 2-way interaction between context-source and feedback valence when the context was the same (F(2,4451) = 12.03, p<0.001), but not when context was different (F(2,4451) = 0.23, p = 0.79). Further interpreting the double feedback-valence * context-source interaction (for the same context) we obtained the same conclusions as reported in the main text.”

      (6) Why apply the "Truth-CA" model and not the Bayesian variant that it was motivated by?

      Thanks for this very useful suggestion. We are unsure if we fully understand the question. The Truth-CA model was not motivated by a new Bayesian model. Our Bayesian models were simply used to make the point that participants may partially discriminate between truthful and untruthful feedback (for a given source). This led to the idea that perhaps more credit is assigned for truth (than lie) trials, which is what we found using our Truth-CA model. Note we show that our Bayesian models cannot account for this modulation.

      We have now improved our "Truth-CA" model. Previously, our Truth-CA model considered whether feedback on each trial was true or not based on realized latent true outcomes. However, it is possible that the very same feedback would have had an opposite truth-status if the latent true outcome was different (recall true outcomes are stochastic). This injects noise into the trial classification in our previous model. To avoid this, in our new model feedback is modulated by the probability the reported feedback is true (marginalized over stochasticity of true outcome).

      We have described this new model in the methods section:

      “Additionally, we formulated a “Truth-CA” model, which worked as our Credibility-CA model, but incorporated a free truth-bonus parameter (TB). This parameter modulates the extent of credit assignment for each agent based on the posterior probability of feedback being true (given the credibility of the feedback agent, and the true reward probability of the chosen bandit). The chosen bandit was updated as follows:

      𝑄 ← (1 – 𝑓<sub>Q</sub>) ∗ 𝑄 + [𝐶𝐴(𝑎𝑔𝑒𝑛𝑡) + 𝑇𝐵 ∗ (𝑃(𝑡𝑟𝑢𝑡ℎ) − 0.5)] ∗ 𝐹

      where P(truth) is the posterior probability of the feedback being true in the current trial (for exact calculation of P(truth) see “Methods: Bayesian estimation of posterior belief that feedback is true”).”

      All relevant results have been updated accordingly in the main text:

      “To formally address whether feedback truthfulness modulates credit assignment, we fitted a new variant of the CA model (the “Truth-CA” model) to the data. This variant works as our Credibility-CA model but incorporated a truth-bonus parameter (TB) which increases the degree of credit assignment for feedback as a function of the experimenter-determined likelihood the feedback is true (which is read from the curves in Fig 6a when x is taken to be the true probability the bandit is rewarding). Specifically, after receiving feedback, the Q-value of the chosen option is updated according to the following rule: 𝑄 ← (1 – 𝑓<sub>Q</sub>) ∗ 𝑄 + [𝐶𝐴(𝑎𝑔𝑒𝑛𝑡) + 𝑇𝐵 ∗ (𝑃(𝑡𝑟𝑢𝑡ℎ) − 0.5)] ∗ 𝐹 where 𝑇𝐵 is the free parameter representing the truth bonus, and 𝑃(𝑡𝑟𝑢𝑡ℎ) is the probability the received feedback being true (from the experimenter’s perspective). We acknowledge that this model falls short of providing a mechanistically plausible description of the credit assignment process, because participants have no access to the experimenter’s truthfulness likelihoods (as the true bandit reward probabilities are unknown to them). Nonetheless, we use this ‘oracle model’ as a measurement tool to glean rough estimates for the extent to which credit assignment Is boosted as a function of its truthfulness likelihood. Fitting this Truth-CA model to participants' behaviour revealed a significant positive truth-bonus (mean=0.21, t(203)=3.12, p=0.002), suggesting that participants indeed assign greater weight to feedback that is likely to be true (Fig. 6c; see SI 3.3.1 for detailed ML parameter results). Notably, simulations using our other models (Methods) consistently predicted smaller truth biases (compared to the empirical bias) (Fig. 6d). Moreover, truth bias was still detected even in a more flexible model that allowed for both a positivity bias and truth-bias (see SI 3.7). The upshot is that participants are biased to assign higher credit based on feedback that is more likely to be true in a manner that is inconsistent with out Bayesian models and above and beyond the previously identified positivity biases.“

      Finally, the Supplementary Information for the discovery study has also been revised to feature this analysis:

      “We next assessed whether participants infer whether the feedback they received on each trial was true or false and adjust their credit assignment based on this inference. We again used the “Truth-CA” model to obtain estimates for the truth bonus (TB), the increase in credit assignment as a function of the posterior probability of feedback being true. As in our main study, the fitted truth bias parameter was significantly positive, indicating that participants assign greater weight to feedback they believe is likely to be true (Fig, S4a; see SI 3.3.1 for detailed ML parameter results). Strikingly, model-simulations (Methods) predicted a lower truth bonus than the one observed in participants (Fig. S4b).”

      (7) "Overall, the results from this study support the exact same conclusions (See SI section 1.2) but with one difference. In the discovery study, we found no evidence for learning based on 50%-credibility feedback when examining either the feedback effect on choice repetition or CA in the credibility-CA model (SI 1.2.3)" - this seems like a very salient difference, when the paper reports the feedback effect as a primary finding of interest, though I understand there remains a valence-based difference.

      We agree with the reviewer and thank them for this suggestion. We now state explicitly throughout the manuscript that this finding was obtained only in one of our two studies. In the section “Discovery study” of the results we state explicitly this finding was not found in the discovery study:

      “However, we found no evidence for learning based on 50%-credibility feedback when examining either the feedback effect on choice repetition or CA in the credibility-CA model (SI 1.2.3).”

      We also note that related to another concern from R3 (that perseveration may masquerade as positivity bias) we conducted additional analyses (detailed in SI 3.6.2). These analyses revealed that the observed positivity bias for the 1-star agent in the discovery study falls within the range predicted by simple choice-perseveration. Consequently, we have removed the suggestion that participants still learn from the random agent in the discovery study. Furthermore, we have modified the discussion section to include a possible explanation for this discrepancy between the two studies:

      “Notably, however, there was no corresponding evidence random feedback affected behaviour in our discovery study. It is possible that an individual’s ability to filter out random information might have been limited due to a high cognitive load induced by our main study task, which required participants to track the values of three bandit pairs and juggle between three interleaved feedback agents (whereas in our discovery study each experimental block featured a single bandit pair). Future studies should explore more systematically how the ability to filter random feedback depends on cognitive load (61).”

      (8) "Participants were instructed that this feedback would be "a lie 50% of the time but were not explicitly told that this meant it was random and should therefore be disregarded." - I agree that this is a possible explanation for updating from the random source. It is a meaningful caveat.

      Thank you for this thought. While this can be seen as a caveat—since we don’t know what would have happened with explicit instructions—we also believe it is interesting from another perspective. In many real-life situations, individuals may have all the necessary information to infer that the feedback they receive is uninformative, yet still fail to do so, especially when they are not explicitly told to ignore it.

      In future work, we plan to examine how behaviour changes when participants are given more explicit instructions—for example, that the 50%-credibility agent provides purely random feedback.

      (9) "Future studies should investigate conditions that enhance an ability to discard disinformation, such as providing explicit instructions to ignore misleading feedback, manipulations that increase the time available for evaluating information, or interventions that strengthen source memory." - there is work on some of this in the misinformation literature that should be cited, such as the "continued influence effect". For example: Johnson, H. M., & Seifert, C. M. (1994). Sources of the continued influence effect: When misinformation in memory affects later inferences. Journal of experimental psychology: Learning, memory, and cognition, 20(6), 1420.

      We thank the reviewer for pointing us towards the relevant literature. We have now included citations about the “continued influence effect” of misinformation in the discussion:

      “In our main study, we show that participants revised their beliefs based on entirely non-credible feedback, whereas an ideal Bayesian strategy dictates such feedback should be ignored. This finding resonates with the “continued-influence effect” whereby misleading information continues to influence an individual's beliefs even after it has been retracted (59,60).”

      (10) Are the authors arguing that choice-confirmation bias may be at play? Work on choice-confirmation bias generally includes counterfactual feedback, which is not present here.

      We agree with the reviewer that a definitive test for choice-confirmation bias typically requires counterfactual feedback, which is not present in our current task. In our discussion, we indeed suggest that the positivity bias we observe may stem from a form of choice-confirmation, drawing on the extensive literature on this bias in reinforcement learning (Lefebvre et al., 2017; Palminteri et al., 2017; Palminteri & Lebreton, 2022). However, we fully acknowledge that this link is a hypothesis and that explicitly testing for choice-confirmation bias would necessitate a future study specifically incorporating counterfactual feedback. We have included a clarification of this point in the discussion:

      “Previous reinforcement learning studies, report greater credit-assignment based on positive compared to negative feedback, albeit only in the context of veridical feedback (43,44,62). Here, supporting our a-priori hypothesis we show that this positivity bias is amplified for information of low and intermediate credibility (in absolute terms in the discovery study, and relative to the overall extent of CA in both studies) . Of note, previous literature has interpreted enhanced learning for positive outcomes in reinforcement learning as indicative of a confirmation bias (42,44). For example, positive feedback may confirm, to a greater extent than negative feedback one’s choice as superior (e.g., “I chose the better of the two options”). Leveraging the framework of motivated cognition (35), we posited that feedback of uncertain veracity (e.g., low credibility) amplifies this bias by incentivising individuals to self-servingly accept positive feedback as true (because it confers positive, desirable outcomes), and explain away undesirable, choice-disconfirming, negative feedback as false. This could imply an amplified confirmation bias on social media, where content from sources of uncertain credibility, such as unknown or unverified users, is more easily interpreted in a self-serving manner, disproportionately reinforcing existing beliefs (63). In turn, this could contribute to an exacerbation of the negative social outcomes previously linked to confirmation bias such as polarization (64,65), the formation of ‘echo chambers’ (19), and the persistence of misbelief regarding contemporary issues of importance such as vaccination (66,67) and climate change (68–71). We note however, that further studies are required to determine whether positivity bias in our task is indeed a form of confirmation bias.”

      Reviewer #3 (Public review):

      Summary

      This paper investigates how disinformation affects reward learning processes in the context of a two-armed bandit task, where feedback is provided by agents with varying reliability (with lying probability explicitly instructed). They find that people learn more from credible sources, but also deviate systematically from optimal Bayesian learning: They learned from uninformative random feedback, learned more from positive feedback, and updated too quickly from fully credible feedback (especially following low-credibility feedback). Overall, this study highlights how misinformation could distort basic reward learning processes, without appeal to higher-order social constructs like identity.

      Strengths

      (1) The experimental design is simple and well-controlled; in particular, it isolates basic learning processes by abstracting away from social context.

      (2) Modeling and statistics meet or exceed the standards of rigor.

      (3) Limitations are acknowledged where appropriate, especially those regarding external validity.

      (4) The comparison model, Bayes with biased credibility estimates, is strong; deviations are much more compelling than e.g., a purely optimal model.

      (5) The conclusions are interesting, in particular the finding that positivity bias is stronger when learning from less reliable feedback (although I am somewhat uncertain about the validity of this conclusion)

      We deeply thank the reviewer for highlighting the strengths of this work.

      Weaknesses

      (1) Absolute or relative positivity bias?

      In my view, the biggest weakness in the paper is that the conclusion of greater positivity bias for lower credible feedback (Figure 5) hinges on the specific way in which positivity bias is defined. Specifically, we only see the effect when normalizing the difference in sensitivity to positive vs. negative feedback by the sum. I appreciate that the authors present both and add the caveat whenever they mention the conclusion (with the crucial exception of the abstract). However, what we really need here is an argument that the relative definition is the right way to define asymmetry....

      Unfortunately, my intuition is that the absolute difference is a better measure. I understand that the relative version is common in the RL literature; however previous studies have used standard TD models, whereas the current model updates based on the raw reward. The role of the CA parameter is thus importantly different from a traditional learning rate - in particular, it's more like a logistic regression coefficient (as described below) because it scales the feedback but not the decay. Under this interpretation, a difference in positivity bias across credibility conditions corresponds to a three-way interaction between the exponentially weighted sum of previous feedback of a given type (e.g., positive from the 75% credible agent), feedback positivity, and condition (dummy coded). This interaction corresponds to the nonnormalized, absolute difference.

      Importantly, I'm not terribly confident in this argument, but it does suggest that we need a compelling argument for the relative definition.

      We thank the reviewer for raising this important point about the definition of positivity bias, and for their thoughtful discussion on the absolute versus relative measures. We believe that the relative valence bias offers a distinct and valuable perspective on positivity bias. Conceptually, this measure describes positivity bias in a manner akin to a “percentage difference” relative to the overall level of learning which allows us to control for the overall decreases in the overall amount of credit assignment as feedback becomes less credible. We are unsure if one measure is better or more correct than the other and we believe that reporting both measures enriches the understanding of positivity bias and allows for a more comprehensive characterization of this phenomenon (as long as these measures are interpreted carefully). We have stated the significance of the relative measure in the results section:

      “Following previous research, we quantified positivity bias in 2 ways: 1) as the absolute difference between credit-assignment based on positive or negative feedback, and 2) as the same difference but relative to the overall extent of learning. We note that the second, relative, definition, is more akin to “percentage change” measurements providing a control for the overall lower levels of credit-assignment for less credible agent.”

      We also wish to point out that in our discovery study we had some evidence for amplification of positivity bias in absolute sense.

      (2) Positivity bias or perseveration?

      A key challenge in interpreting many of the results is dissociating perseveration from other learning biases. In particular, a positivity bias (Figure 5) and perseveration will both predict a stronger correlation between positive feedback and future choice. Crucially, the authors do include a perseveration term, so one would hope that perseveration effects have been controlled for and that the CA parameters reflect true positivity biases. However, with finite data, we cannot be sure that the variance will be correctly allocated to each parameter (c.f. collinearity in regressions). The fact that CA- is fit to be negative for many participants (a pattern shown more strongly in the discovery study) is suggestive that this might be happening. A priori, the idea that you would ever increase your value estimate after negative feedback is highly implausible, which suggests that the parameter might be capturing variance besides that it is intended to capture.

      The best way to resolve this uncertainty would involve running a new study in which feedback was sometimes provided in the absence of a choice - this would isolate positivity bias. Short of that, perhaps one could fit a version of the Bayesian model that also includes perseveration. If the authors can show that this model cannot capture the pattern in Figure 5, that would be fairly convincing.

      We thank the reviewer for this very insightful and crucial point regarding the potential confound between positivity bias and perseveration. We entirely agree that distinguishing these effects can be challenging. To rigorously address this concern and ascertain that our observed positivity bias, particularly its inflation for low-credibility feedback, is not merely an artifact of perseveration, we conducted additional analyses as suggested.

      First, following the reviewer’s suggestion we simulated our Bayesian models, including a perseveration term, for both our main and discovery studies. Crucially, none of these simulations predicted the specific pattern of inflated positivity bias for low-credibility feedback that we identified in participants.

      Additionally, taking a “devil’s advocate” approach, we tested whether our credibility-CA model (which includes perseveration but not a feedback valence bias) can predict our positivity bias findings. Thus, we simulated 100 datasets using our Credibility-CA model (based on empirical best-fitting parameters). We then fitted each of these simulated datasets using our CredibilityValence CA model. By examining the distribution of results across these synthetic datasets fits and comparing them to the actual results from participants, we found that while perseveration could indeed lead (as the reviewer suspected) to an artifactual positivity bias, it could not predict the magnitude of the observed inflation of positivity bias for low-credibility feedback (whether measured in absolute or relative terms).

      Based on these comprehensive analyses, we are confident that our main results concerning the modulation of a valence bias as a function of source-credibility cannot be accounted by simple choice-perseveration. We have briefly explained these analyses in the main results section:

      “Previous research has suggested that positivity bias may spuriously arise from pure choice-perseveration (i.e., a tendency to repeat previous choices regardless of outcome) (49,50). While our models included a perseveration-component, this control may not be preferent. Therefore, in additional control analyses, we generated synthetic datasets using models including choice-perseveration but devoid of feedback-valence bias, and fitted them with our credibility-valence model (see SI 3.6.1). These analyses confirmed that perseveration can masquerade as an apparent positivity bias. Critically, however, these analyses also confirmed that perseveration cannot account for our main finding of increased positivity bias, relative to the overall extent of CA, for low-credibility feedback.”

      Additionally, we have added a detailed description of these additional analyses and their findings to the Supplementary Information document:

      “3.6 Positivity bias results cannot be explained by a pure perseveration

      3.6.1 Main study

      Previous research has suggested it may be challenging to dissociate between a feedback-valence positivity bias and perseveration (i.e., a tendency to repeat previous choices regardless of outcome). While our Credit Assignment (CA) models already include a perseveration mechanism to account for this, this control may not be perfect. We thus conducted several tests to examine if our positivity-bias related results could be accounted for by perseveration.

      First we examined whether our Bayesian-models, augmented by a perseveration mechanism (as in our CA model) can generate predictions similar to our empirical results. We repeated our cross-fitting procedure to these extended Bayesian models. To briefly recap, this involved fitting participant behavior with them, generating synthetic datasets based on the resulting maximum likelihood (ML) parameters, and then fitting these simulated datasets with our Credibility-Valence CA model (which is designed to detect positivity bias). This test revealed that adding perseveration to our Bayesian models did not predict a positivity bias in learning. In absolute terms there was a small negativity bias (instructed-credibility Bayesian: b=−0.19, F(1,1218)=17.78, p<0.001, Fig. S23a-b; free-credibility Bayesian: b=−0.17, F(1,1218)=13.74, p<0.001, Fig. S23d-e). In relative terms we detected no valence related bias (instructed-credibility Bayesian: b=−0.034, F(1,609)=0.45, p=0.50, Fig. S22c; free-credibility Bayesian: b=−0.04, F(1,609)=0.51, p=0.47, Fig. S23f). More critically, these simulations also did not predict a change in the level of positivity bias as a function of feedback credibility, neither at an absolute level (instructed-credibility Bayesian: F(2,1218)=0.024, p=0.98, Fig. S23b; free-credibility Bayesian: F(2,1218)=0.008, p=0.99, Fig. S23e), nor at a relative level (instructedcredibility Bayesian: F(2,609)=1.57, p=0.21, Fig. S23c; free-credibility Bayesian: F(2,609)=0.13, p=0.88, Fig. S23f). The upshot is that our positivity-bias findings cannot be accounted for by our Bayesian models even when these are augmented with perseveration.

      However, it is still possible that empirical CA parameters from our credibility-valence model (reported in main text Fig. 5) were distorted, absorbing variance from a perseveration. To address this, we took a “devil's advocate” approach testing the assumption that CA parameters are not truly affected by feedback valance and that there is only perseveration in our data. Towards that goal, we simulated data using our CredibilityCA model (which includes perseveration but does not contain a valence bias in its learning mechanism) and then fitted these synthetic datasets using our Credibility-Valence CA model to see if the observed positivity bias could be explained by perseveration alone. Specifically, we generated 101 “group-level” synthetic datasets (each including one simulation for each participant, based on their empirical ML parameters), and fitted each dataset with our Credibility-Valence CA model. We then analysed the resulting ML parameters in each dataset using the same mixed-effects models as described in the main text, examining the distribution of effects of interest across these simulated datasets. Comparing these simulation results to the data from participants revealed a nuanced picture. While the positivity bias observed in participants is within the range predicted by a pure perseveration account when measured in absolute terms (Fig. S24a), it is much higher than predicted by pure perseveration when measured relative to the overall level of learning (Fig. S24c). More importantly, the inflation in positivity bias for lower credibility feedback is substantially higher in participants than what would be predicted by a pure perseveration account, a finding that holds true for both absolute (Fig. S24b) and relative (Fig. S24d) measures.”

      “3.6.2 Discovery study

      We then replicated these analyses in our discovery study to confirm our findings. We again checked whether extended versions of the Bayesian models (including perseveration) predicted the positivity bias results observed. Our cross-fitting procedure showed that the instructed-credibility Bayesian model with perseveration did predict a positivity bias for all credibility levels in this discovery study, both when measured in absolute terms [50% credibility (b=1.74,t(824)=6.15), 70% credibility (b=2.00,F(1,824)=49.98), 85% credibility (b=1.81,F(1,824)=40.78), 100% credibility (b=2.42,F(1,824)=72.50), all p's<0.001], and in relative terms [50% credibility (b=0.25,t(412)=3.44), 70% credibility (b=0.31,F(1,412)=17.72), 85% credibility (b=0.34,F(1,412)=21.06), 100% credibility (b=0.42,F(1,412)=31.24), all p's<0.001]. However, importantly, these simulations did not predict a change in the level of positivity bias as a function of feedback credibility, neither at an absolute level (F(3,412)=1.43,p=0.24), nor at a relative level (F(3,412)=2.06,p=0.13) (Fig. S25a-c). In contrast, simulations of the free-credibility Bayesian model (with perseveration) predicted a slight negativity bias when measured in absolute terms (b=−0.35,F(1,824)=5.14,p=0.024), and no valence bias when measured relative to the overall degree of learning (b=0.05,F(1,412)=0.55,p=0.46). Crucially, this model also did not predict a change in the level of positivity bias as a function of feedback credibility, neither at an absolute level (F(3,824)=0.27,p=0.77), nor at a relative level (F(3,412)=0.76,p=0.47) (Fig. S25d-f).

      As in our main study, we next assessed whether our Credibility-CA model (which includes perseveration but no valence bias) predicted the positivity bias results observed in participants in the discovery study. This analysis revealed that the average positivity bias in participants is higher than predicted by a pure perseveration account, both when measured in absolute terms (Fig. S26a) and in relative terms (Fig. S26c). Specifically, only the aVBI for the 70% credibility agent was above what a perseveration account would predict, while the rVBI for all agents except the completely credible one exceeded that threshold. Furthermore, the inflation in positivity bias for lower credibility feedback (compared to the 100% credibility agent) is significantly higher in participants than would be predicted by a pure perseveration account, in both absolute (Fig. S26b) and relative (Fig. S26d) terms.

      Together, these results show that the general positivity bias observed in participants could be predicted by an instructed-credibility Bayesian model with perseveration, or by a CA model with perseveration. Moreover, we find that these two models can predict a positivity bias for the 50% credibility agent, raising a concern that our positivity bias findings for this source may be an artefact of not-fully controlled for perseveration. However, the credibility modulation of this positivity bias, where the bias is amplified for lower credibility feedback, is consistently not predicted by perseveration alone, regardless of whether perseveration is incorporated into a Bayesian or a CA model. This finding suggests that participants are genuinely modulating their learning based on feedback credibility, and that this modulation is not merely an artifact of choice perseveration.”

      (3) Veracity detection or positivity bias?

      The "True feedback elicits greater learning" effect (Figure 6) may be simply a re-description of the positivity bias shown in Figure 5. This figure shows that people have higher CA for trials where the feedback was in fact accurate. But assuming that people tend to choose more rewarding options, true-feedback cases will tend to also be positive-feedback cases. Accordingly, a positivity bias would yield this effect, even if people are not at all sensitive to trial-level feedback veracity. Of course, the reverse logic also applies, such that the "positivity bias" could actually reflect discounting of feedback that is less likely to be true. This idea has been proposed before as an explanation for confirmation bias (see Pilgrim et al, 2024 https://doi.org/10.1016/j.cognition.2023.105693and much previous work cited therein). The authors should discuss the ambiguity between the "positivity bias" and "true feedback" effects within the context of this literature....

      Before addressing these excellent comments, we first note that we have now improved our "TruthCA" model. Previously, our Truth-CA model considered whether feedback on each trial was true or not based on realized latent true outcomes. However, it is possible that the very same feedback would have had an opposite truth-status if the latent true outcome was different (recall true outcomes are stochastic). This injects noise into the trial classification in our former model. To avoid this, in our new model feedback is modulated by the probability the reported feedback is true (marginalized over stochasticity of true outcome). Please note in our responses below that we conducted extensive analysis to confirm that positivity bias doesn’t in fact predict the truthbias we detect using our truth biased model

      We have described this new model in the methods section:

      “Additionally, we formulated a “Truth-CA” model, which worked as our Credibility-CA model, but incorporated a free truth-bonus parameter (TB). This parameter modulates the extent of credit assignment for each agent based on the posterior probability of feedback being true (given the credibility of the feedback agent, and the true reward probability of the chosen bandit). The chosen bandit was updated as follows:

      𝑄 ← (1 – 𝑓<sub>Q</sub>) ∗ 𝑄 + [𝐶𝐴(𝑎𝑔𝑒𝑛𝑡) + 𝑇𝐵 ∗ (𝑃(𝑡𝑟𝑢𝑡ℎ) − 0.5)] ∗ 𝐹

      where P(truth) is the posterior probability of the feedback being true in the current trial (for exact calculation of P(truth) see “Methods: Bayesian estimation of posterior belief that feedback is true”).”

      All relevant results have been updated accordingly in the main text:

      To formally address whether feedback truthfulness modulates credit assignment, we fitted a new variant of the CA model (the “Truth-CA” model) to the data. This variant works as our Credibility-CA model, but incorporated a truth-bonus parameter (TB) which increases the degree of credit assignment for feedback as a function of the experimenter-determined likelihood the feedback is true (which is read from the curves in Fig 6a when x is taken to be the true probability the bandit is rewarding). Specifically, after receiving feedback, the Q-value of the chosen option is updated according to the following rule:

      𝑄 ← (1 – 𝑓<sub>Q</sub>) ∗ 𝑄 + [𝐶𝐴(𝑎𝑔𝑒𝑛𝑡) + 𝑇𝐵 ∗ (𝑃(𝑡𝑟𝑢𝑡ℎ) − 0.5)] ∗ 𝐹

      where 𝑇𝐵 is the free parameter representing the truth bonus, and 𝑃(𝑡𝑟𝑢𝑡ℎ) is the probability the received feedback being true (from the experimenter’s perspective). We acknowledge that this model falls short of providing a mechanistically plausible description of the credit assignment process, because participants have no access to the experimenter’s truthfulness likelihoods (as the true bandit reward probabilities are unknown to them). Nonetheless, we use this ‘oracle model’ as a measurement tool to glean rough estimates for the extent to which credit assignment Is boosted as a function of its truthfulness likelihood.

      Fitting this Truth-CA model to participants' behaviour revealed a significant positive truth-bonus (mean=0.21, t(203)=3.12, p=0.002), suggesting that participants indeed assign greater weight to feedback that is likely to be true (Fig. 6c; see SI 3.3.1 for detailed ML parameter results). Notably, simulations using our other models (Methods) consistently predicted smaller truth biases (compared to the empirical bias) (Fig. 6d). Moreover, truth bias was still detected even in a more flexible model that allowed for both a positivity bias and truth-bias (see SI 3.7). The upshot is that participants are biased to assign higher credit based on feedback that is more likely to be true in a manner that is inconsistent with out Bayesian models and above and beyond the previously identified positivity biases.”

      Finally, the Supplementary Information for the discovery study has also been revised to feature this analysis:

      “We next assessed whether participants infer whether the feedback they received on each trial was true or false and adjust their credit assignment based on this inference. We again used the “Truth-CA” model to obtain estimates for the truth bonus (TB), the increase in credit assignment as a function of the posterior probability of feedback being true. As in our main study, the fitted truth bias parameter was significantly positive, indicating that participants assign greater weight to feedback they believe is likely to be true (Fig, S4a; see SI 3.3.1 for detailed ML parameter results). Strikingly, model-simulations (Methods) predicted a lower truth bonus than the one observed in participants (Fig. S4b).”

      Additionally, we thank the reviewer for pointing us to the relevant work by Pilgrim et al. (2024). We agree that the relationship between "true feedback" and "positivity bias" effects is nuanced, and their potential overlap warrants careful consideration. Note our analyses suggest that this is not solely the case. Firstly, simulations of our Credibility-Valence CA model predict only a small "truth bonus" effect, which is notably smaller than what we observed in participants. Secondly, we formulated an extension of our "Truth-CA" model that includes a valence bias in credit assignment. If our truth bonus results were merely an artifact of positivity bias, this extended model should absorb that variance, producing a null truth bonus parameter. However, fitting this model to participant data still revealed a significant positive truth bonus, which again exceeds the range predicted by simulations of our Credibility CA model:

      “3.7 Truth inference is still detected when controlling for valence bias

      Given that participants frequently select bandits that are, on average, mostly rewarding, it is reasonable to assume that positive feedback is more likely to be objectively true than negative feedback. This raises a question if the "truth inference" effect we observed in participants might simply be an alternative description of a positivity bias in learning. To directly test this idea, we extended our Truth-CA model to explicitly account for a valence bias in credit assignment. This extended model features separate CA parameters for positive and negative feedback for each agent. When we fitted this new model to participant behavior, it still revealed a significant truth bonus in both the main study (Wilkoxon’s signrank test: median = 0.09, z(202)=2.12, p=0.034; Fig. S27a) and the discovery study (median = 3.52, z(102)=7.86, p<0.001; Fig. S27c). Moreover, in the main study, this truth bonus remained significantly higher than what was predicted by all the alternative models, with the exception of the instructed-credibility bayesian model (Fig. S27b). In the discovery study, the truth bonus was significantly higher than what was predicted by all the alternative models (Fig. S27d).”

      Together, these findings suggest that our truth inference results are not simply a re-description of a positivity bias.

      Conversely, we acknowledge the reviewer's point that our positivity bias results could potentially stem from a more general truth inference mechanism. We believe that this possibility should be addressed in a future study where participants rate their belief that received feedback is true (rather than a lie).We have extended our discussion to clarify this possibility and to include the suggested citation:

      “Our findings show that individuals increase their credit assignment for feedback in proportion to the perceived probability that the feedback is true, even after controlling for source credibility and feedback valence. Strikingly, this learning bias was not predicted by any of our Bayesian or credit-assignment (CA) models. Notably, our evidence for this bias is based on a “oracle model” that incorporates the probability of feedback truthfulness from the experimenter's perspective, rather than the participant’s. This raises an important open question: how do individuals form beliefs about feedback truthfulness, and how do these beliefs influence credit assignment? Future research should address this by eliciting trial-by-trial beliefs about feedback truthfulness. Doing so would also allow for testing the intriguing possibility that an exaggerated positivity bias for non-credible sources reflects, to some extent, a truth-based discounting of negative feedback—i.e., participants may judge such feedback as less likely to be true. However, it is important to note that the positivity bias observed for fully credible sources (here and in other literature) cannot be attributed to a truth bias—unless participants were, against instructions, distrustful of that source.”

      The authors get close to this in the discussion, but they characterize their results as differing from the predictions of rational models, the opposite of my intuition. They write:

      “Alternative "informational" (motivation-independent) accounts of positivity and confirmation bias predict a contrasting trend (i.e., reduced bias in low- and medium credibility conditions) because in these contexts it is more ambiguous whether feedback confirms one's choice or outcome expectations, as compared to a full-credibility condition.”

      I don't follow the reasoning here at all. It seems to me that the possibility for bias will increase with ambiguity (or perhaps will be maximal at intermediate levels). In the extreme case, when feedback is fully reliable, it is impossible to rationally discount it (illustrated in Figure 6A). The authors should clarify their argument or revise their conclusion here.

      We apologize for the lack of clarity in our previous explanation. We removed the sentence you cited (it was intended to make a different point which we now consider non-essential). Our current narration is consistent with the point you are making.

      (4) Disinformation or less information?

      Zooming out, from a computational/functional perspective, the reliability of feedback is very similar to reward stochasticity (the difference is that reward stochasticity decreases the importance/value of learning in addition to its difficulty). I imagine that many of the effects reported here would be reproduced in that setting. To my surprise, I couldn't quickly find a study asking that precise question, but if the authors know of such work, it would be very useful to draw comparisons. To put a finer point on it, this study does not isolate which (if any) of these effects are specific to disinformation, rather than simply less information. I don't think the authors need to rigorously address this in the current study, but it would be a helpful discussion point.

      We thank the reviewer for highlighting the parallel (and difference) between feedback reliability and reward stochasticity. However, we have not found any comparable results in the literature. We also note that our discussion includes a paragraph addressing the locus of our effects making the point that more studies are necessary to determine whether our findings are due to disinformation per se or sources being less informative. While this paragraph was included in the previous version it led us to infer our Discussion was too long and we therefore shortened it considerably:

      “An important question arises as to the psychological locus of the biases we uncovered. Because we were interested in how individuals process disinformation—deliberately false or misleading information intended to deceive or manipulate—we framed the feedback agents in our study as deceptive, who would occasionally “lie” about the true choice outcome. However, statistically (though not necessarily psychologically), these agents are equivalent to agents who mix truth-telling with random “guessing” or “noise” where inaccuracies may arise from factors such as occasionally lacking access to true outcomes, simple laziness, or mistakes, rather than an intent to deceive. This raises the question of whether the biases we observed are driven by the perception of potential disinformation as deceitful per se or simply as deviating from the truth. Future studies could address this question by directly comparing learning from statistically equivalent sources framed as either lying or noisy. Unlike previous studies wherein participants had to infer source credibility from experience (30,37,72), we took an explicit-instruction approach, allowing us to precisely assess source-credibility impact on learning, without confounding it with errors in learning about the sources themselves. More broadly, our work connects with prior research on observational learning, which examined how individuals learn from the actions or advice of social partners (72–75). This body of work has demonstrated that individuals integrate learning from their private experiences with learning based on others’ actions or advice—whether by inferring the value others attribute to different options or by mimicking their behavior (57,76). However, our task differs significantly from traditional observational learning. Firstly, our feedback agents interpret outcomes rather than demonstrating or recommending actions (30,37,72). Secondly, participants in our study lack private experiences unmediated by feedback sources. Finally, unlike most observational learning paradigms, we systematically address scenarios with deliberately misleading social partners. Future studies could bridge this by incorporating deceptive social partners into observational learning, offering a chance to develop unified models of how individuals integrate social information when credibility is paramount for decision-making.”

      (5) Over-reliance on analyzing model parameters

      Most of the results rely on interpreting model parameters, specifically, the "credit assignment" (CA) parameter. Exacerbating this, many key conclusions rest on a comparison of the CA parameters fit to human data vs. those fit to simulations from a Bayesian model. I've never seen anything like this, and the authors don't justify or even motivate this analysis choice. As a general rule, analyses of model parameters are less convincing than behavioral results because they inevitably depend on arbitrary modeling assumptions that cannot be fully supported. I imagine that most or even all of the results presented here would have behavioral analogues. The paper would benefit greatly from the inclusion of such results. It would also be helpful to provide a description of the model in the main text that makes it very clear what exactly the CA parameter is capturing (see next point).

      We thank the reviewer for this important suggestion which we address together with the following point.

      (6) RL or regression?

      I was initially very confused by the "RL" model because it doesn't update based on the TD error. Consequently, the "Q values" can go beyond the range of possible reward (SI Figure 5). These values are therefore not Q values, which are defined as expectations of future reward ("action values"). Instead, they reflect choice propensities, which are sometimes notated $h$ in the RL literature. This misuse of notation is unfortunately quite common in psychology, so I won't ask the authors to change the variable. However, they should clarify when introducing the model that the Q values are not action values in the technical sense. If there is precedent for this update rule, it should be cited.

      Although the change is subtle, it suggests a very different interpretation of the model.

      Specifically, I think the "RL model" is better understood as a sophisticated logistic regression, rather than a model of value learning. Ignoring the decay term, the CA term is simply the change in log odds of repeating the just-taken action in future trials (the change is negated for negative feedback). The PERS term is the same, but ignoring feedback. The decay captures that the effect of each trial on future choices diminishes with time. Importantly, however, we can re-parameterize the model such that the choice at each trial is a logistic regression where the independent variables are an exponentially decaying sum of feedback of each type (e.g., positive-cred50, positive-cred75, ... negative-cred100). The CA parameters are simply coefficients in this logistic regression.

      Critically, this is not meant to "deflate" the model. Instead, it clarifies that the CA parameter is actually not such an assumption-laden model estimate. It is really quite similar to a regression coefficient, something that is usually considered "model agnostic". It also recasts the non-standard "cross-fitting" approach as a very standard comparison of regression coefficients for model simulations vs. human data. Finally, using different CA parameters for true vs false feedback is no longer a strange and implausible model assumption; it's just another (perfectly valid) regression. This may be a personal thing, but after adopting this view, I found all the results much easier to understand.

      We thank the reviewer for their insightful and illuminating comments, particularly concerning the interpretation of our model parameters and the nature of our Credit assignment model. We believe your interpretation of the model is accurate and we now narrate it to readers in the hope that our modelling will become clearer and more intuitively. We also present to readers how these recasts our “cross-fitting” approach in the way you suggested (we return to this point below).

      Broadly, while we agree that modelling results depend on underlying assumptions, we believe that “model-agnostic” approaches also have important limitations—especially in reinforcement learning (RL), where choices are shaped by histories of past events, which such approaches often fail to fully account for. As students of RL, we are frequently struck by how careful modelling demonstrates that seemingly meaningful “model-agnostic” patterns can emerge as artefacts of unaccounted-for variables. We also note that the term “model-agnostic” is difficult to define—after all, even regression models rely on assumptions, and some computational models make richer or more transparent assumptions than others. Ideally, we aim to support our findings using converging methods wherever possible.

      We want to clarify that many of our reported findings indeed stem from straightforward behavioral analyses (e.g., simple regressions of choice-repetition), which do not rely on complex modeling assumptions. The two key results that primarily depend on the analysis of model parameters are our findings related to positivity bias and truth inference.

      Regarding the positivity bias, identifying truly model-agnostic behavioral signatures, distinct from effects like choice-perseveration, has historically been a significant challenge in the literature. Classical research on this bias rests on the interpretation of model parameters (Lefebvre et al., 2017; Palminteri et al., 2017), or at least on the use of models to assess what an “unbiased learner” baseline should look like (Palminteri & Lebreton, 2022). Some researchers have suggested possible regressions incorporating history effects to detect positivity bias from choicerepetition behavior, but these regressions (as our model) rely on subtle assumptions about forgetting and history effects (Toyama et al., 2019). Specifically, in our case, this issue is also demonstrated by analysis we conducted related to the previous point the reviewer made (about perseveration masquerading as positivity bias). We believe that dissociating clearly positivity bias from perseveration is an important challenge for the field going forward.

      For our truth inference results, obtaining purely behavioral signatures is similarly challenging due to the intricate interdependencies (the reviewer has identified in previous points) between agent credibility, feedback valence, feedback truthfulness, and choice accuracy within our task design.

      Finally, we agree with the reviewer that regression coefficients are often interpreted as a “modelagnostic” pattern. From this perspective even our findings regarding positivity and truth bias are not a case of over-reliance on complex model assumptions but are rather a way to expose deviations between empirical “sophisticated” regression coefficients and coefficients predicted from Bayesian models.

      We have now described the main learning rule of our model in the main text to ensure that the meaning of the CA parameters is clearer for readers:

      “Next, we formulated a family of non-Bayesian computational RL models. Importantly, these models can flexibly express non-Bayesian learning patterns and, as we show in following sections, can serve to identify learning biases deviating from an idealized Bayesian strategy. Here, an assumption is that during feedback, the choice propensity for the chosen bandit (which here is represented by a point estimate, “Q value“, rather than a distribution) either increases or decreases (for positive or negative feedback, respectively) according to a magnitude quantified by the free “Credit-Assignment (CA)” model parameters (47):

      𝑄(𝑐ℎ𝑜𝑠𝑒𝑛) ← (1 – 𝑓<sub>Q</sub>) ∗ 𝑄(𝑐ℎ𝑜𝑠𝑒𝑛) + 𝐶𝐴(𝑎𝑔𝑒𝑛𝑡, 𝑣𝑎𝑙𝑒𝑛𝑐𝑒) ∗ 𝐹

      where F is the feedback received from the agents (coded as 1 for reward feedback and -1 for non-reward feedback), while fQ (∈[0,1]) is the free parameter representing the forgetting rate of the Q-value (Fig. 2a, bottom panel; Fig. S5b; Methods). The probability to choose a bandit (say A over B) in this family of models is a logistic function of the contrast choice-propensities between these two bandits. One interpretation of this model is as a “sophisticated” logistic regression, where the CA parameters take the role of “regression coefficients” corresponding to the change in log odds of repeating the just-taken action in future trials based on the feedback (+/- CA for positive or negative feedback, respectively; the model also includes gradual perseveration which allows for constant log-odd changes that are not affected by choice feedback; see “Methods: RL models”) . The forgetting rate captures the extent to which the effect of each trial on future choices diminishes with time. The Q-values are thus exponentially decaying sums of logistic choice propensities based on the types of feedback a bandit received.”

      We also explain the implications of this perspective for our cross-fitting procedure:

      “To further characterise deviations between behaviour and our Bayesian learning models, we used a “crossfitting” method. Treating CA parameters as data-features of interest (i.e., feedback dependent changes in choice propensity), our goal was to examine if and how empirical features differ from features extracted from simulations of our Bayesian learning models. Towards that goal, we simulated synthetic data based on Bayesian agents (using participants’ best fitting parameters), but fitted these data using the CA-models, obtaining what we term “Bayesian-CA parameters” (Fig. 2d; Methods). A comparison of these BayesianCA parameters, with empirical-CA parameters obtained by fitting CA models to empirical data, allowed us to uncover patterns consistent with, or deviating from, ideal-Bayesian value-based inference. Under the sophisticated logistic-regression interpretation of the CA-model family the cross-fitting method comprises a comparison between empirical regression coefficients (i.e., empirical CA parameters) and regression coefficient based on simulations of Bayesian models (Bayesian CA parameters). Using this approach, we found that both the instructed-credibility and free-credibility Bayesian models predicted increased BayesianCA parameters as a function of agent credibility (Fig. 3c; see SI 3.1.1.2 Tables S8 and S9). However, an in-depth comparison between Bayesian and empirical CA parameters revealed discrepancies from ideal Bayesian learning, which we describe in the following sections.”

      Recommendations for the authors:

      Reviewer #3 (Recommendations for the authors):

      (1) Keep terms consistent, e.g., follow-up vs. main; hallmark vs. traditional.

      We have now changed the text to keep terms consistent.

      (2) CA model is like a learning rate; but it's based on the raw reward, not the TD error - this seems strange.

      We thank the reviewer for this comment. We understand that the use of a CA model instead of a TD error model may seem unusual at first glance. However, the CA model offers an important advantage: it more easily accommodates what we term "negative learning rates". This means that some participants may treat certain agents (especially the random one) as consistently deceitful, leading them to effectively increase/reduce choice tendencies following negative/positive feedback. A CA model handles this naturally by allowing negative CA parameters as a simple extension of positive ones. In contrast, adapting a TD error model to account for this is more complex. For instance, attempting to introduce a "negative learning rate" makes the RW model behave in a non-stable manner (e.g., Q values become <0 or >1). At the initial stages of our project, we explored different approaches to dealing with this issue and we found the CA model provides the best approach. For these reasons, we decided to proceed with our CA model.

      Additionally, we used the CA model in previous studies (e.g., Moran, Dayan & Dolan (2021)) where we included (in SI) a detailed discussion of the similarities and difference between creditassignment and Rescorla-Wagner models

      (3) Why was the follow-up study not pre-registered?

      We appreciate the reviewer's comment regarding preregistration, which we should have done. Unfortunately, this is now “water under the bridge” but going forward we hope to pre-register increasing parts of our work.

      (4) Other work looking at reward stochasticity?

      As noted in point 4 of the main weaknesses, previous work on reward stochasticity primarily focused on explaining the increase/decrease in learning and its mechanistic bases under varying stochasticity levels. In our study, we uniquely characterize several specific learning biases that are modulated by source credibility, a topic not extensively explored within the existing reward stochasticity framework, as far as we know.

      (5) Equation 1 is different from the one in the figure?

      The reviewer is completely correct. The figure provides a simplified visual representation, primarily focusing on the feedback-based update of the Q-value, and for simplicity, it omits the forgetting term present in the full Equation 1. To ensure complete clarity and prevent any misunderstanding, we have now incorporated a more detailed explanation of the model, including the complete Equation 1 and its components, directly within the main text. This comprehensive description will ensure that readers are fully aware of how the model operates.

      “Next, we formulated a family of non-Bayesian computational RL models. Importantly, these models can flexibly express non-Bayesian learning patterns and, as we show in following sections, can serve to identify learning biases deviating from an idealized Bayesian strategy. Here, an assumption is that during feedback, the choice propensity for the chosen bandit (which here is represented by a point estimate, “Q value“, rather than a distribution) either increases or decreases (for positive or negative feedback, respectively) according to a magnitude quantified by the free “Credit-Assignment (CA)” model parameters (47):

      𝑄(𝑐ℎ𝑜𝑠𝑒𝑛) ← (1 – 𝑓<sub>Q</sub>) ∗ 𝑄(𝑐ℎ𝑜𝑠𝑒𝑛) + 𝐶𝐴(𝑎𝑔𝑒𝑛𝑡, 𝑣𝑎𝑙𝑒𝑛𝑐𝑒) ∗ 𝐹

      where F is the feedback received from the agents (coded as 1 for reward feedback and -1 for non-reward feedback), while fQ (∈[0,1]) is the free parameter representing the forgetting rate of the Q-value (Fig. 2a, bottom panel; Fig. S5b; Methods).”

      (6) Please describe/plot the distribution of all fitted parameters in the supplement. I would include the mean and SD in the main text (methods) as well.

      Following the reviewer’s suggestions, we have included in the Supplementary Document tables displaying the mean and SD of fitted parameters from participants for our main models of interest. We have also plotted the distributions of such parameters. Both for the main study:

      (7) "A novel approach within the disinformation literature by exploiting a Reinforcement Learning (RL) experimental framework".

      The idea of applying RL to disinformation is not new. Please tone down novelty claims. It would be nice to cite/discuss some of this work as well.

      https://arxiv.org/abs/2106.05402?utm_source=chatgpt.com https://www.scirp.org/pdf/jbbs_2022110415273931.pdf https://papers.ssrn.com/sol3/papers.cfm?abstract_id=4173312

      We thank the reviewer for pointing us towards relevant literature. We have now toned down the sentence in the introduction and cited the references provided:

      “To address these questions, we adopt a novel approach within the disinformation literature by exploiting a Reinforcement Learning (RL) experimental framework (36). While RL has guided disinformation research in recent years (37–40), our approach is novel in using one of its most popular tasks: the “bandit task”.”

      (8) Figure 3a - The figures should be in the order that they're referenced (3 is referenced before 2).

      We generally try to stick to this important rule but, in this case, we believe that our ordering serves better the narrative and hope the reviewer will excuse this small violation.

      (9) "Additionally, we found a positive feedback-effect for the 3-star agent"

      What is the analysis here? To avoid confusion with the "positive feedback" effect, consider using "positive effect of feedback". The dash wasn't sufficient to avoid confusion in my case.

      We have now updated the terms in the text to avoid confusion.

      (10) The discovery study revealed even stronger results supporting a conclusion that the credibility-CA model was superior to both Bayesian models for most subjects

      This is very subjective, but I'll just mention that my "cherry-picking" flag was raised by this sentence. Are you only mentioning cases where the discovery study was consistent with the main study? Upon a closer read, I think the answer is most likely "no", but you might consider adopting a more systematic (perhaps even explicit) policy on when and how you reference the discovery study to avoid creating this impression in a more casual reader.

      We thank the reviewer for this valuable suggestion. To prevent any impression of "cherry-picking", we have removed specific references to the discovery study from the main body of the text. Instead, all discussions regarding the convergence and divergence of results between the two studies are now in the dedicated section focusing on the discovery study:

      “The discovery study (n=104) used a disinformation task structurally similar to that used in our main study, but with three notable differences: 1) it included 4 feedback agents, with credibilities of 50%, 70%, 85% and 100%, represented by 1, 2, 3, and 4 stars, respectively; 2) each experimental block consisted of a single bandit pair, presented over 16 trials (with 4 trials for each feedback agent); and 3) in certain blocks, unbeknownst to participants, the two bandits within a pair were equally rewarding (see SI section 1.1). Overall, this study's results supported similar conclusions as our main study (see SI section 1.2) with a few differences. We found convergent support for increased learning from more credible sources (SI 1.2.1), superior fit for the CA model over Bayesian models (SI 1.2.2) and increased learning from feedback inferred to be true (SI 1.2.6). Additionally, we found an inflation of positivity bias for low-credibility both when measured relative to the overall level of credit assignment (as in our main study), or in absolute terms (unlike in our main study) (Fig. S3; SI 1.2.5). Moreover, choice-perseveration could not predict an amplification of positivity bias for low-credibility sources (see SI 3.6.2). However, we found no evidence for learning based on 50%-credibility feedback when examining either the feedback effect on choice repetition or CA in the credibility-CA model (SI 1.2.3).”

      (11) An in-depth comparison between Bayesian and empirical CA parameters revealed discrepancies from normative Bayesian learning.

      Consider saying where this in-depth comparison can be found (based on my reading, I think you're referring to the next section?

      We have now modified the sentence for better clarity:

      “However, an in-depth comparison between Bayesian and empirical CA parameters revealed discrepancies from ideal Bayesian learning, which we describe in the following sections.”

      (12) "which essentially provides feedback" Perhaps you meant "random feedback"?

      We have modified the text as suggested by the reviewer.

      <(13) Essentially random

      Why "essentially"? Isn't it just literally random?

      We have modified the text as suggested by the reviewer.

      (14) Both Bayesian models predicted an attenuated credit-assignment for the 3-star agent

      Attenuated relative to what? I wouldn't use this word if you mean weaker than what we see in the human data. Instead, I would say people show an exaggerated credit-assignment, since Bayes is the normative baseline.

      We changed the text according to the reviewer’s suggestion:

      “A comparison of empirical and Bayesian credit-assignment parameters revealed a further deviation from ideal Bayesian learning: participants showed an exaggerated credit-assignment for the 3-star agent compared with Bayesian models.”

      (15) "there was no difference between 2-star and 3-star agent contexts (b=0.051, F(1,2419)=0.39, p=0.53)"

      You cannot confirm the null hypothesis! Instead, you can write "The difference between 2-star and 3-star agent contexts was not significant". Although even with this language, you should be careful that your conclusions don't rest on the lack of a difference (the next sentence is somewhat ambiguous on this point).

      Additionally, the reported b coefs do not match the figure, which if anything, suggests a larger drop from 0.75 (2-star) to 1 (3-star). Is this a mixed vs fixed effects thing? It would be helpful to provide an explanation here.

      We thank the reviewer for this question. When we previously submitted our manuscript, we thought that finding enhanced credit-assignment for fully credible feedback following potential disinformation from a DIFFERENT context would constitute a striking demonstration of our “contrast effect”. However, upon reexamining this finding we found out we had a coding error (affecting how trials were filtered). We have now rerun and corrected this analysis. We have assessed the contrast effect for both "same-context" trials (where the contextual trial featured the same bandit pair as the learning trial) and "different-context" trials (where the contextual trial featured a different bandit pair). Our re-analysis reveals a selective significant contrast effect in the same-context condition, but no significant effect in the different-context condition. We have updated the main text to reflect these corrected findings and provide a clearer explanation of the analysis:

      “A comparison of empirical and Bayesian credit-assignment parameters revealed a further deviation from ideal Bayesian learning: participants showed an exaggerated credit-assignment for the 3-star agent compared with Bayesian models [Wilcoxon signed-rank test, instructed-credibility Bayesian model (median difference=0.74, z=11.14); free-credibility Bayesian model (median difference=0.62, z=10.71), all p’s<0.001] (Fig. 3a). One explanation for enhanced learning for the 3-star agents is a contrast effect, whereby credible information looms larger against a backdrop of non-credible information. To test this hypothesis, we examined whether the impact of feedback from the 3-star agent is modulated by the credibility of the agent in the trial immediately preceding it. More specifically, we reasoned that the impact of a 3-star agent would be amplified by a “low credibility context” (i.e., when it is preceded by a low credibility trial). In a binomial mixed effects model, we regressed choice-repetition on feedback valence from the last trial featuring the same bandit pair (i.e., the learning trial) and the feedback agent on the trial immediately preceding that last trial (i.e., the contextual credibility; see Methods for model-specification). This analysis included only learning trials featuring the 3-star agent, and context trials featuring the same bandit pair as the learning trial (Fig. 4a). We found that feedback valence interacted with contextual credibility (F(2,2086)=11.47, p<0.001) such that the feedback-effect (from the 3-star agent) decreased as a function of the preceding context-credibility (3-star context vs. 2-star context: b= -0.29, F(1,2086)=4.06, p=0.044; 2star context vs. 1-star context: b=-0.41, t(2086)=-2.94, p=0.003; and 3-star context vs. 1-star context: b=0.69, t(2086)=-4.74, p<0.001) (Fig. 4b). This contrast effect was not predicted by simulations of our main models of interest (Fig. 4c). No effect was found when focussing on contextual trials featuring a bandit pair different than the one in the learning trial (see SI 3.5). Thus, these results support an interpretation that credible feedback exerts a greater impact on participants’ learning when it follows non-credible feedback, in the same learning context.”

      We have modified the discussion accordingly as well:

      “A striking finding in our study was that for a fully credible feedback agent, credit assignment was exaggerated (i.e., higher than predicted by our Bayesian models). Furthermore, the effect of fully credible feedback on choice was further boosted when it was preceded by a low-credibility context related to current learning. We interpret this in terms of a “contrast effect”, whereby veridical information looms larger against a backdrop of disinformation (21). One upshot is that exaggerated learning might entail a risk of jumping to premature conclusions based on limited credible evidence (e.g., a strong conclusion that a vaccine produces significant side-effect risks based on weak credible information, following non-credible information about the same vaccine). An intriguing possibility, that could be tested in future studies, is that participants strategically amplify the extent of learning from credible feedback to dilute the impact of learning from noncredible feedback. For example, a person scrolling through a social media feed, encountering copious amounts of disinformation, might amplify the weight they assign to credible feedback in order to dilute effects of ‘fake news’. Ironically, these results also suggest that public campaigns might be more effective when embedding their messages in low-credibility contexts, which may boost their impact.”

      And we have included some additional analyses in the SI document:

      “3.5 Contrast effects for contexts featuring a different bandit Given that we observed a contrast effect when both the learning and the immediately preceding "context trial” involved the same pair of bandits, we next investigated whether this effect persisted when the context trial featured a different bandit pair – a situation where the context would be irrelevant to the current learning. Again, we used in a binomial mixed effects model, regressing choice-repetition on feedback valence in the learning trial and the feedback agent in the context trial. This analysis included only learning trials featuring the 3-star agent, and context trials featuring a different bandit pair than the learning trial (Fig. S22a). We found no significant evidence of an interaction between feedback valence and contextual credibility (F(2,2364)=0.21, p=0.81) (Fig. S22b). This null result was consistent with the range of outcomes predicted by our main computational models (Fig. S22c).”

      We aimed to formally compare the influence of two types of contextual trials: those featuring the same bandit pair as the learning trial versus those featuring a different pair. To achieve this, we extended our mixedeffects model by incorporating a new predictor variable, "CONTEXT_TYPE" which coded whether the contextual trial involved the same bandit pair (coded as -0.5) or a different bandit pair (+0.5) compared to the learning trial. The Wilkinson notation for this expanded mixed-effects model is:

      𝑅𝐸𝑃𝐸𝐴𝑇 ~ 𝐶𝑂𝑁𝑇𝐸𝑋𝑇_𝑇𝑌𝑃𝐸 ∗ 𝐹𝐸𝐸𝐷𝐵𝐴𝐶𝐾 ∗ (𝐶 𝐶𝑂𝑁𝑇𝐸𝑋𝑇<sub>2-star</sub> + 𝐶𝑂𝑁𝑇𝐸𝑋𝑇<sub>3-star</sub>) + 𝐵𝐸𝑇𝑇𝐸𝑅 + (1|𝑝𝑎𝑟𝑡𝑖𝑐𝑖𝑝𝑎𝑛𝑡)

      This expanded model revealed a significant three-way interaction between feedback valence, contextual credibility, and context type (F(2,4451) = 7.71, p<0.001). Interpreting this interaction, we found a 2-way interaction between context-source and feedback valence when the context was the same (F(2,4451) = 12.03, p<0.001), but not when context was different (F(2,4451) = 0.23, p = 0.79). Further interpreting the double feedback-valence * context-source interaction (for the same context) we obtained the same conclusions as reported in the main text.”

      (16) "Strikingly, model-simulations (Methods) showed this pattern is not predicted by any of our other models"

      Why doesn't the Bayesian model predict this?

      Thanks for the comment. Overall, Bayesian models do predict a slight truth inference effect (see Figure 6d). However, these effects are not as strong as the ones observed in participants, suggesting that our results go beyond what would be predicted by a Bayesian model.

      Conceptually, it's important to note that the Bayesian model can infer (after controlling for source credibility and feedback valence) whether feedback is truthful based solely on prior beliefs about the chosen bandit. Using this inferred truth to amplify the weight of truthful feedback would effectively amount to “bootstrapping on one’s own beliefs.” This is most clearly illustrated with the 50% agent: if one believes that a chosen bandit yields rewards 70% of the time, then positive feedback is more likely to be truthful than negative feedback. However, a Bayesian observer would also recognize that, given the agent’s overall unreliability, such feedback should be ignored regardless.

      (17) "A striking finding in our study was that for a fully credible feedback agent, credit assignment was exaggerated (i.e., higher than predicted by a Bayesian strategy)".

      "Since we did not find any significant interactions between BETTER and the other regressors, we decided to omit it from the model formulation".

      Was this decision made after seeing the data? If so, please report the original analysis as well.

      We have included the BETTER regressor again, and we have re-run the analyses. We now report the results of such regression. We have also changed the methods section accordingly:

      “We used a different mixed-effects binomial regression model to test whether value learning from the 3-star agent was modulated by contextual credibility. We focused this analysis on instances where the previous trial with the same bandit pair featured the 3-star agent. We regressed the variable REPEAT, which indicated whether the current trial repeated the choice from the previous trial featuring the same bandit-pair (repeated choice=1, non-repeated choice=0). We included the following regressors: FEEDBACK coding the valence of feedback in the previous trial with the same bandit pair (positive=0.5, negative=-0.5), CONTEXT2-star indicating whether the trial immediately preceding the previous trial with the same bandit pair (context trial) featured the 2-star agent (feedback from 2-star agent=1, otherwise=0), and CONTEXT3star indicating whether the trial immediately preceding the previous trial with the same bandit pair featured the 3-star agent. We also included a regressor (BETTER) coding whether the bandit chosen in the learning trial was the better -mostly rewarding- or the worse -mostly unrewarding- bandit within the pair. We included in this analysis only current trials where the context trial featured a different bandit pair. The model in Wilkinson’s notation was:

      𝑅𝐸𝑃𝐸𝐴𝑇~ 𝐹𝐸𝐸𝐷𝐵𝐴𝐶𝐾 ∗ (𝐶𝑂𝑁𝑇𝐸𝑋𝑇<sub>2-star</sub> + 𝐶𝑂𝑁𝑇𝐸𝑋𝑇<sub>3-star</sub>) + 𝐵𝐸𝑇𝑇𝐸𝑅 + (1|𝑝𝑎𝑟𝑡𝑖𝑐𝑖𝑝𝑎𝑛𝑡) ( 13 )

      In figure 4c, we independently calculate the repeat probability difference for the better (mostly rewarding) and worse (mostly non-rewarding) bandits and averaged across them. This calculation was done at the participants level, and finally averaged across participants.”

    1. eLife Assessment

      This valuable study combined careful computational modeling, a large patient sample, and replication in an independent general population sample to provide a computational account of a difference in risk-taking between people who have attempted suicide and those who have not. It is proposed that this difference reflects a general change in the approach to risky (high-reward) options and a lower emotional response to certain rewards. Evidence for the specificity of the effect to suicide, however, is incomplete, which would require additional analyses.

    2. Reviewer #1 (Public review):

      Summary:

      The authors use a gambling task with momentary mood ratings from Rutledge et al. and compare computational models of choice and mood to identify markers of decisional and affective impairments underlying risk-prone behavior in adolescents with suicidal thoughts and behaviors (STB). The results show that adolescents with STB show enhanced gambling behavior (choosing the gamble rather than the sure amount), and this is driven by a bias towards the largest possible win rather than insensitivity to possible losses. Moreover, this group shows a diminished effect of receiving a certain reward (in the non-gambling trials) on mood. The results were replicated in an undifferentiated online sample where participants were divided into groups with or without STB based on their self-report of suicidal ideation on one question in the Beck Depression Inventory self-report instrument. The authors suggest, therefore, that adolescents with decreased sensitivity to certain rewards may need to be monitored more closely for STB due to their increased propensity to take risky decisions aimed at (expected) gains (such as relief from an unbearable situation through suicide), regardless of the potential losses.

      Strengths:

      (1) The study uses a previously validated task design and replicates previously found results through well-explained model-free and model-based analyses.

      (2) Sampling choice is optimal, with adolescents at high risk; an ideal cohort to target early preventative diagnoses and treatments for suicide.

      (3) Replication of the results in an online cohort increases confidence in the findings.

      (4) The models considered for comparison are thorough and well-motivated. The chosen models allow for teasing apart which decision and mood sensitivity parameters relate to risky decision-making across groups based on their hypotheses.

      (5) Novel finding of mood (in)sensitivity to non-risky rewards and its relationship with risk behavior in STB.

      Weaknesses:

      (1) The sample size of 25 for the S- group was justified based on previous studies (lines 181-183); however, all three papers cited mention that their sample was low powered as a study limitation.

      (2) Modeling in the mediation analysis focused on predicting risk behavior in this task from the model-derived bias for gains and suicidal symptom scores. However, the prediction of clinical interest is of suicidal behaviors from task parameters/behavior - as a psychiatrist or psychologist, I would want to use this task to potentially determine who is at higher risk of attempting suicide and therefore needs to be more closely watched rather than the other way around (predicting behavior in the task from their symptom profile). Unfortunately, the analyses presented do not show that this prediction can be made using the current task. I was left wondering: is there a correlation between beta_gain and STB? It is also important to test for the same relationships between task parameters and behavior in the healthy control group, or to clarify that the recommendations for potential clinical relevance of these findings apply exclusively to people with a diagnosis of depression or anxiety disorder. Indeed, in line 672, the authors claim their results provide "computational markers for general suicidal tendency among adolescents", but this was not shown here, as there were no models predicting STB within patient groups or across patients and healthy controls.

      (3) The FDR correction for multiple comparisons mentioned briefly in lines 536-538 was not clear. Which analyses were included in the FDR correction? In particular, did the correlations between gambling rate and BSI-C/BSI-W survive such correction? Were there other correlations tested here (e.g., with the TAI score or ERQ-R and ERQ-S) that should be corrected for? Did the mediation model survive FDR correction? Was there a correction for other mediation models (e.g., with BSI-W as a predictor), or was this specific model hypothesized and pre-registered, and therefore no other models were considered? Did the differences in beta_gain across groups survive FDR when including comparisons of all other parameters across groups? Because the results were replicated in the online dataset, it is ok if they did not survive FDR in the patient dataset, but it is important to be clear about this in presenting the findings in the patient dataset.

      (4) There is a lack of explicit mention when replication analyses differ from the analyses in the patient sample. For instance, the mediation model is different in the two samples: in the patient sample, it is only tested in S+ and S- groups, but not in healthy controls, and the model relates a dimensional measure of suicidal symptoms to gambling in the task, whereas in the online sample, the model includes all participants (including those who are presumably equivalent to healthy controls) and the predictor is a binary measure of S+ versus S- rather than the response to item 9 in the BDI. Indeed, some results did not replicate at all and this needs to be emphasized more as the lack of replication can be interpreted not only as "the link between mood sensitivity to CR and gambling behavior may be specifically observable in suicidal patients" (lines 582-585) - it may also be that this link is not truly there, and without a replication it needs to be interpreted with caution.

      (5) In interpreting their results, the authors use terms such as "motivation" (line 594) or "risk attitude" (line 606) that are not clear. In particular, how was risk attitude operationalized in this task? Is a bias for risky rewards not indicative of risk attitude? I ask because the claim is that "we did not observe a difference in risk attitude per se between STB and controls". However, it seems that participants with STB chose the risky option more often, so why is there no difference in risk attitude between the groups?

    3. Reviewer #2 (Public review):

      Summary:

      This article addresses a very pertinent question: what are the computational mechanisms underlying risky behaviour in patients who have attempted suicide? In particular, it is impressive how the authors find a broad behavioural effect whose mechanisms they can then explain and refine through computational modeling. This work is important because, currently, beyond previous suicide attempts, there has been a lack of predictive measures. This study is the first step towards that: understanding the cognition on a group level. This is before being able to include it in future predictive studies (based on the cross-sectional data, this study by itself cannot assess the predictive validity of the measure).

      Strengths:

      (1) Large sample size.

      (2) Replication of their own findings.

      (3) Well-controlled task with measures of behaviour and mood + precise and well-validated computational modeling.

      Weaknesses:

      I can't really see any major weakness, but I have a few questions:

      (1) I can see from the parameter recovery that the parameters are very well identified. Is it surprising that this is the case, given how many parameters there are for 90 trials? Could the authors show cross-correlations? I.e., make a correlation matrix with all real parameters and all fitted parameters to show that not only the diagonal (i.e., same data is the scatter plots in S3) are high, but that the off-diagonals are low.

      (2) Could the authors clarify the result in Figure 2B of a correlation between gambling rate and suicidal ideation score, is that a different result than they had before with the group main effect? I.e., is your analysis like this: gambling rate ~ suicide ideation + group assignment? (or a partial correlation)? I'm asking because BSI-C is also different between the groups. [same comment for later analyses, e.g. on approach parameter].

      (3) The authors correlate the impact of certain rewards on mood with the % gambling variable. Could there not be a more direct analysis by including mood directly in the choice model?

      (4) In the large online sample, you split all participants into S+ and S-. I would have imagined that instead, you would do analyses that control for other clinical traits. Or, for example, you have in the S- group only participants who also have high depression scores, but low suicide items.

    4. Reviewer #3 (Public review):

      This manuscript investigates computational mechanisms underlying increased risk-taking behavior in adolescent patients with suicidal thoughts and behaviors. Using a well-established gambling task that incorporates momentary mood ratings and previously established computational modeling approaches, the authors identify particular aspects of choice behavior (which they term approach bias) and mood responsivity (to certain rewards) that differ as a function of suicidality. The authors replicate their findings on both clinical and large-scale non-clinical samples.

      The main problem, however, is that the results do not seem to support a specific conclusion with regard to suicidality. The S+ and S- groups differ substantially in the severity of symptoms, as can be seen by all symptom questionnaires and the baseline and mean mood, where S- is closer to HC than it is to S+. The main analyses control for illness duration and medication but not for symptom severity. The supplementary analysis in Figure S11 is insufficient as it mistakes the absence of evidence (i.e., p > 0.05) for evidence of absence. Therefore, the results do not adequately deconfound suicidality from general symptom severity.

      The second main issue is that the relationship between an increased approach bias and decreased mood response to CR is conceptually unclear. In this respect, it would be natural to test whether mood responses influence subsequent gambling choices. This could be done either within the model by having mood moderate the approach bias or outside the model using model-agnostic analyses.

      Additionally, there is a conceptual inconsistency between the choice and mood findings that partly results from the analytic strategy. The approach bias is implemented in choice as a categorical value-independent effect, whereas the mood responses always scale linearly with the magnitude of outcomes. One way to make the models more conceptually related would be to include a categorical value-independent mood response to choosing to gamble/not to gamble.

      The manuscript requires editing to improve clarity and precision. The use of terms such as "mood" and "approach motivation" is often inaccurate or not sufficiently specific. There are also many grammatical errors throughout the text.

      Claims of clinical relevance should be toned down, given that the findings are based on noisy parameter estimates whose clinical utility for the treatment of an individual patient is doubtful at best.

    1. eLife Assessment

      This study presents a valuable finding on the molecular mechanisms that govern GABAergic inhibitory synapse function. The authors propose that Endophilin A1 serves as a novel regulator of GABAergic synapses by acting as a component of the inhibitory postsynaptic density. The findings are convincing and likely to interest a broad audience of scientists focusing on inhibitory synaptic transmission, the excitation-inhibition balance, and its disruption in disorders such as epilepsy.

    2. Reviewer #1 (Public review):

      Summary:

      In the present study, Chen et al. investigate the role of Endophilin A1 in regulating GABAergic synapse formation and function. To this end, the authors use constitutive or conditional knockout of Endophilin A1 (EEN1) to assess the consequences on GABAergic synapse composition and function, as well as the outcome for PTZ-induced seizure susceptibility. The authors show that EEN1 KO mice show a higher susceptibility to PTZ-induced seizures, accompanied by a reduction in the GABAergic synaptic scaffolding protein gephyrin as well as specific GABAAR subunits and eIPSCs. The authors then investigate the underlying mechanisms, demonstrating that Endophilin A1 binds directly to gephyrin and GABAAR subunits, and identifying the subdomains of Endophilin A1 that contribute to this effect. Overall, the authors state that their study places Endophilin A1 as a new regulator of GABAergic synapse function.

      Strengths:

      Overall, the topic of this manuscript is very timely, since there has been substantial recent interest in describing the mechanisms governing inhibitory synaptic transmission at GABAergic synapses. The study will therefore be of interest to a wide audience of neuroscientists studying synaptic transmission and its role in disease. The manuscript is well written and contains a substantial quantity of data. In the revised version of the manuscript, the authors have increased the number of samples analyzed and have significantly improved the statistical analysis, thereby substantially strengthening the conclusions of their study.

    3. Reviewer #2 (Public review):

      Summary:

      The function of neural circuits relies heavily on the balance of excitatory and inhibitory inputs. Particularly, inhibitory inputs are understudied when compared to their excitatory counterparts due to the diversity of inhibitory neurons, their synaptic molecular heterogeneity, and their elusive signature. Thus, insights into these aspects of inhibitory inputs can inform us largely on the functions of neural circuits and the brain.

      Endophilin A1, an endocytic protein heavily expressed in neurons, has been implicated in numerous pre- and postsynaptic functions, however largely at excitatory synapses. Thus, whether this crucial protein plays any role in inhibitory synapse, and whether this regulates functions at the synaptic, circuit, or brain level remains to be determined.

      The three remaining concerns are:

      (1) The use of one-way ANOVA is not well justified.

      (2) The use of superplots to show culture to culture variability would make it more transparent.

      (3) Change EEN1 in Figure 8B to EndoA1.

      Comments on revised version:

      The authors addressed the concerns adequately.

    4. Reviewer #3 (Public review):

      Chen et al. identify endophilin A1 as a novel component of the inhibitory postsynaptic scaffold. Their data show impaired evoked inhibitory synaptic transmission in CA1 neurons of mice lacking endophilin A1, and an increased susceptibility to seizures. Endophilin can interact with the postsynaptic scaffold protein gephyrin and promotes assembly of the inhibitory postsynaptic element. Endophilin A1 is known to play a role in presynaptic terminals and in dendritic spines, but a role for endophilin A1 at inhibitory postsynaptic densities has not yet been described, providing a valuable addition to the field.

      To investigate the role of endophilin A1 at inhibitory postsynapses, the authors used a broad array of experimental approaches, including tests of seizure susceptibility, electrophysiology, biochemistry, neuronal culture and image analysis. The authors have addressed the remaining concerns in their revision. Taken together, their results expand the synaptic role of endophilin-A1 to include the inhibitory post synaptic element.

    5. Author response:

      The following is the authors’ response to the previous reviews

      Reviewer #2 (Recommendations for the authors):

      Comments on revised version:

      The authors addressed the concerns adequately. The three remaining concerns are:

      (1) The use of one-way ANOVA is not well justified.

      The statement about statistical test in “Statistical analysis” section is as follows in the revised manuscript, “Data sets were tested for normality and direct comparisons between two groups were made using two-tailed Student’s t test (t test, for normally distributed data) as indicated. To evaluate statistical significance of three or more groups of samples, one-way ANOVA analysis with a Tukey test was used or repeated measures ANOVA analysis with a Tukey test was used in behavior assays. Statistical parameters are reported in the figures and the corresponding legends”.

      We used a one-way ANOVA for the data about one categorical independent variable and one quantitative dependent variable. The independent variable should have at least three different groups or categories. And we conducted repeated measures ANOVA analysis for the data about behavioral tests according to the suggestion by Reviewer #1 (Point 18) in revised manuscript.

      (2) The use of superplots to show culture to culture variability would make it more transparent.

      Thanks for the nice suggestion. While superplots could more transparently show culture to culture variability, it is difficult to add more colors or even shades to the scatterplots in the current form, which have already been color coded for multiple groups of samples. The scatterplots we used effectively illustrate the variability across all collected data and do not affect the conclusions of our study. Therefore, we prefer not to change the way of data presentation in the revised manuscript.

      (3) Change EEN1 in Figure 8B to EndoA1.

      Thanks a lot for the sharp eye. Corrected.

      Reviewer #3 (Recommendations for the authors):

      Specific comments:

      The authors have made a substantial effort to improve their manuscript. A number of issues, related to numbers of observations mentioned by the reviewers, are clarified in the revised manuscript. The authors have also clarified some of the other questions from the reviewers. The long list of issues brought up by the reviewers and the many corrections needed still raise questions about data quality in this manuscript.

      In response to my comments (Point 2), the added experiment with PSD95.FingR and GPN.FingR in cultured neurons (Fig. S5A-D) is a good addition; the in vivo data using FingRs in Figure S3 look less convincing however. In response to my Point 5, the authors have added a cell-free binding assay (Figure 5I). This is a useful addition, but to convincingly make the point of interaction between Gephyrin and EndoA1, more rigorous biophysical quantitation of binding is needed. The legend in Figure 5I states that 4 independent experiments were performed, but the graph only shows 3 dots. This needs to be corrected.

      We sincerely appreciate your comments and apologize for any concerns raised. As suggested (Point 2), we made many efforts to visualize endogenous postsynaptic proteins using recombinant probes. However, due to much lower expression of GPN.FingR compared with PSD95.FingR in P21 brain slices following viral infection (Figure S3), we were unable to obtain better imaging results. To strengthen our data and conclusions, we additionally performed experiments with PSD95.FingR and GPN.FingR in cultured neurons (Fig. S5A-D) in the revised manuscript.

      Regarding the biophysical quantification of gephyrin–endophilin A1 binding, we do not have the equipment for this type of experiment (surface plasmon resonance or isothermal titration calorimetry). Instead, we performed a pull-down assay as an alternative to confirm their interaction (Figure 5I). We also apologize for the error in the number of independent experiments stated in the figure legend and have corrected it in the revised manuscript.

    1. eLife Assessment

      This paper presents an important theoretical exploration of how a flexible protein domain with multiple DNA binding sites may simultaneously provide stability to the DNA-bound state and enables exploration of the DNA strand. The authors propose a mechanism ("octopusing") for protein doing a random walk while bound to DNA which simultaneously enables exploration of the DNA strand and enhances the stability of the bound state. This study presents compelling evidence that their findings has implications for the way intrinsically disordered regions (IDR) of transcription factors proteins (TF) can enhance their ability to efficiently find their binding site on the DNA from which they exert control over the transcription of their target gene. The paper concludes with a comparison of model predictions with experimental data which gives further support to the proposed model.

    1. eLife Assessment

      This is an important study that examines the impact of Streptococcus pneumoniae genetics on its in vitro growth kinetics, aiming to identify potential targets for vaccines and therapeutics. The study identified significant variations in growth characteristics among capsular serotypes and lineages, linked to phylogeny and high heritability, but genome-wide association studies did not reveal specific genomic loci associated with growth features independent of the genetic background. The evidence supporting these findings is convincing.

    2. Reviewer #1 (Public review):

      Summary:

      This manuscript uses a diverse isolate collection of Streptococcus pneumoniae from hospital patients in the Netherlands to understand the population-level genetic basis of growth rate variation in this pathogen, which is a key determinant of S. pneumoniae within-host fitness. Previous efforts have studied this phenomenon in strain-specific comparisons, which can lack the statistical power and scope of population-level studies. The authors collected a rigorous set of in vitro growth data for each S. pneumoniae isolate and subsequently paired growth curve analysis with whole-genome analyses to identify how phylogenetics, serotype and specific genetic loci influence in vitro growth. While there were noticeable correlations between capsular serotype and phylogeny with growth metrics, they did not identify specific loci associated with altered in vitro growth, suggesting that these phenotypes are controlled by the collective effect of the entire genetic background of a strain. This is an important finding that lays the foundation for additional, more highly-powered studies that capture more S. pneumoniae genetic diversity to identify these genetic contributions.

      Strengths:

      The authors were able to completely control the experimental and genetic analyses to ensure all isolates underwent the same analysis pipeline to enhance the rigor of their findings.

      The isolate collection captures an appreciable amount of S. pneumoniae diversity and, importantly, enables disentangling the contributions of the capsule and phylogenetic background to growth rates.

      This study provides a population-level, rather than strain-specific, view of how genetic background influences growth rate in S. pneumoniae. This is an advance over previous studies that have only looked at smaller sets of strains.

      The methods used are well-detailed and robust to allow replication and extension of these analyses. Moreover, the manuscript is very well written and includes a thoughtful and thorough discussion of the strengths and limitations of the current study.

      Weaknesses:

      As acknowledged by the authors, the genetic diversity and sample size of this newly collected isolate set is still limited relative to the known global diversity of S. pneumoniae, which evidently limits the power to detect loci with smaller/combinatorial contributions to growth rate (and ultimately infection).

      The in vitro growth data is limited to a single type of rich growth medium, which may not fully reflect the nutritional and/or selective pressures present in the host.

      The current study does not use genetic manipulation or in vitro/in vivo infection models to experimentally test whether alteration of growth rates as observed in this study is linked to virulence or successful infection. The availability of a naturally diverse collection with phylogenetic and serotype combinations already identified as interesting by the authors provides a strong rationale for wet-lab studies of these phenotypes.

      Update on first revision:

      The authors have responded to all of my initial comments as well as those of the other reviewers, and I have no further concerns to be addressed.

    3. Reviewer #2 (Public review):

      The study by Chaguza et al. presents a novel perspective on pneumococcal growth kinetics, suggesting that the overall genetic background of Streptococcus pneumoniae, rather than specific loci, plays a more dominant role in determining growth dynamics. Through a genome-wide association study (GWAS) approach, the authors propose a shift in how we understand growth regulation, differing from earlier findings that pinpointed individual genes, such as wchA or cpsE, as key regulators of growth kinetics. This study highlights the importance of considering the cumulative impact of the entire genetic background rather than focusing solely on individual genetic loci.

      The study emphasizes the cumulative effects of genetic variants, each contributing small individual impacts, as the key drivers of pneumococcal growth. This polygenic model moves away from the traditional focus on single-gene influences. Through rigorous statistical analyses, the authors persuasively advocate for a more holistic approach to understanding bacterial growth regulation, highlighting the complex interplay of genetic factors across the entire genome. Their findings open new avenues for investigating the intricate mechanisms underlying bacterial growth and adaptation, providing fresh insights into bacterial pathogenesis.

      Strengths:

      This study exemplifies a holistic approach to unraveling key factors in bacterial pathogenesis. By analyzing a large dataset of whole-genome sequences and employing robust statistical methodologies, the authors provide strong evidence to support their main findings. Which is a leap forward from previous studies focused on a relatively smaller number of strains. Their integration of genome-wide association studies (GWAS) highlights the cumulative, polygenic influences on pneumococcal growth kinetics, challenging the traditional focus on individual loci. This comprehensive strategy not only advances our understanding of bacterial growth regulation but also establishes a foundation for future research into the genetic underpinnings of bacterial pathogenesis and adaptation. The amount of data generated and corresponding approaches to analyze the data are impressive as well as convincing. The figures are convincing and comprehensible too. The revised version of the manuscript, after the addition and including explanations, is more convincing and acceptable.

      Weaknesses:

      This study suggests evidence that the genetic background significantly influences bacterial growth kinetics. However, the absence of experimental validation remains a critical limitation. Although the authors acknowledge in their response to reviewers that bench-experiments were beyond the scope of this work and are planned, this gap of experimental validation weakens the current conclusions. Demonstrable validation will be essential to corroborate the associations identified through the GWAS approach. Future experimental efforts will be critical to substantiate these findings and to deepen our understanding of the genetic determinants governing bacterial growth dynamics.

    4. Reviewer #3 (Public review):

      This study provides insights into the growth kinetics of a diverse collection of Streptococcus pneumoniae, identifying capsule and lineage differences. It was not able to identify any specific loci from the GWAS that were associated with the growth features. It does provide a useful study linking phenotypic data with large scale genomic population data.

      In the revised version, the authors have addressed the points raised by the reviewers. The authors have provided additional detail in the Introduction and Methods that both improves the general accessibility for the broad readership of eLife, and the ability of other researchers to reproduce the approaches used in this study. They have expanded the Results and Discussion text in some sections to provide greater clarity and accuracy in reporting their data.

      The inclusion of a Data Availability statement was a useful addition and will help ensure the manuscript adheres to eLife's publishing policies.

    5. Author response:

      The following is the authors’ response to the original reviews

      Reviewer #1 (Public review): 

      Summary: 

      This manuscript uses a diverse isolate collection of Streptococcus pneumoniae from hospital patients in the Netherlands to understand the population-level genetic basis of growth rate variation in this pathogen, which is a key determinant of S. pneumoniae within-host fitness. Previous efforts have studied this phenomenon in strain-specific comparisons, which can lack the statistical power and scope of population-level studies. The authors collected a rigorous set of in vitro growth data for each S. pneumoniae isolate and subsequently paired growth curve analysis with whole-genome analyses to identify how phylogenetics, serotype, and specific genetic loci influence in vitro growth. While there were noticeable correlations between capsular serotype and phylogeny with growth metrics, they did not identify specific loci associated with altered in vitro growth, suggesting that these phenotypes are controlled by the collective effect of the entire genetic background of a strain. This is an important finding that lays the foundation for additional, more highly-powered studies that capture more S. pneumoniae genetic diversity to identify these genetic contributions.

      Thank you for an excellent summary of our manuscript.

      Strengths: 

      (1) The authors were able to completely control the experimental and genetic analyses to ensure all isolates underwent the same analysis pipeline to enhance the rigor of their findings.

      (2) The isolate collection captures an appreciable amount of S. pneumoniae diversity and, importantly, enables disentangling the contributions of the capsule and phylogenetic background to growth rates.

      (3) This study provides a population-level, rather than strain-specific, view of how genetic background influences the growth rate in S. pneumoniae. This is an advance over previous studies that have only looked at smaller sets of strains.

      (4) The methods used are well-detailed and robust to allow replication and extension of these analyses. Moreover, the manuscript is very well written and includes a thoughtful and thorough discussion of the strengths and limitations of the current study.

      Thank you for excellently summarising the strengths of our manuscript.

      Weaknesses: 

      (1) As acknowledged by the authors, the genetic diversity and sample size of this newly collected isolate set are still limited relative to the known global diversity of S. pneumoniae, which evidently limits the power to detect loci with smaller/combinatorial contributions to growth rate (and ultimately infection). 

      Indeed, while larger pneumococcal datasets exist globally, most of these datasets do not have reliable metadata on in vitro growth rates and other phenotypes, as the intention, for the most part, is to conduct population-level surveillance to track the changes in the serotype distribution to assess the impact of introducing pneumococcal conjugate vaccines. In this study, we adopted a different approach to phenotypically characterising the samples collected from these surveillance studies to understand the genetic features that influence the intrinsic growth characteristics of the isolates. While our dataset size is modest, it exemplifies how we can combine whole-genome sequencing and phenotypic characterisation of bacterial isolates to understand the genetic determinants that may drive intrinsic phenotypic differences between strains.

      (2) The in vitro growth data is limited to a single type of rich growth medium, which may not fully reflect the nutritional and/or selective pressures present in the host.

      We agree that our study focused on a single type of rich growth medium, which may not fully reflect the nutritional or selective pressures present in the host. The rationale and the representativeness of the selected culture conditions were more extensively discussed in Arends et al. (10.1128/spectrum.00050-22). Considering that this was a proof-of-concept study to assess the feasibility of our approach, future studies by us and others will evaluate the impact of using different media. Besides the media, complementary techniques such as transcriptome sequencing will help uncover additional insights into potential factors that influence differences in pneumococcal growth kinetics. 

      (3) The current study does not use genetic manipulation or in vitro/in vivo infection models to experimentally test whether alteration of growth rates as observed in this study is linked to virulence or successful infection. The availability of a naturally diverse collection with phylogenetic and serotype combinations already identified as interesting by the authors provides a strong rationale for wet-lab studies of these phenotypes.

      We concur that additional genetic manipulation studies to assess the impact of altering growth rates on virulence and infection would have provided further insights. While this was beyond the scope of this study, we plan to conduct follow-up work to assess this using carefully selected strains from our pneumococcal collection. Because our current study demonstrates that genetic determinants of pneumococcal growth features are not simply confined to single loci, such experimental validation would require novel wet-lab approaches that consider epistatic interactions. In addition, in vivo infection models that allow the study of dissemination from the bloodstream are not yet well established.

      Reviewer #2 (Public review): 

      Summary: 

      The study by Chaguza et al. presents a novel perspective on pneumococcal growth kinetics, suggesting that the overall genetic background of Streptococcus pneumoniae, rather than specific loci, plays a more dominant role in determining growth dynamics. Through a genome-wide association study (GWAS) approach, the authors propose a shift in how we understand growth regulation, differing from earlier findings that pinpointed individual genes, such as wchA or cpsE, as key regulators of growth kinetics. This study highlights the importance of considering the cumulative impact of the entire genetic background rather than focusing solely on individual genetic loci.

      The study emphasizes the cumulative effects of genetic variants, each contributing small individual impacts, as the key drivers of pneumococcal growth. This polygenic model moves away from the traditional focus on single-gene influences. Through rigorous statistical analyses, the authors persuasively advocate for a more holistic approach to understanding bacterial growth regulation, highlighting the complex interplay of genetic factors across the entire genome. Their findings open new avenues for investigating the intricate mechanisms underlying bacterial growth and adaptation, providing fresh insights into bacterial pathogenesis.

      Thank you for an excellent summary of our manuscript.

      Strengths: 

      This study exemplifies a holistic approach to unraveling key factors in bacterial pathogenesis. By analyzing a large dataset of whole-genome sequences and employing robust statistical methodologies, the authors provide strong evidence to support their main findings. Which is a leap forward from previous studies focused on a relatively smaller number of strains. Their integration of genome-wide association studies (GWAS) highlights the cumulative, polygenic influences on pneumococcal growth kinetics, challenging the traditional focus on individual loci. This comprehensive strategy not only advances our understanding of bacterial growth regulation but also establishes a foundation for future research into the genetic underpinnings of bacterial pathogenesis and adaptation. The amount of data generated and corresponding approaches to analyze the data are impressive as well as convincing. The figures are convincing and comprehensible too.

      Thank you for pointing out the strengths of our manuscript excellently.

      Weaknesses: 

      Despite the strong outcomes of the GWAS approach, this study leaves room for differing interpretations. A key point of contention lies in the title, which initially gives the impression that the research addresses growth kinetics under both in vitro and in vivo conditions. However, the study is limited to in vitro growth kinetics, with the assumption that these findings are equally applicable to in vivo scenarios-a premise that is not universally valid. To more accurately reflect the study's scope and avoid potential misrepresentation, the title should explicitly specify "in vitro" growth kinetics. This clarification would better align the title with the study's actual focus and findings.

      Thank you for these suggestions. We have updated the title to include "in vitro" to avoid confusion. The new title now reads, “The capsule and genetic background, rather than specific loci, strongly influence in vitro pneumococcal growth kinetics.” While our study used in vitro data, our goal is to highlight that such in vitro differences in pneumococcal growth may influence in vivo dynamics, as highlighted in several papers referenced in the introduction and discussion. 

      This study suggests that the entire genetic background significantly influences bacterial growth kinetics. However, to transform these predictions into established facts, extensive experimental validation is necessary. This would involve "bench experiments" focusing on generating and studying mutant variants of serotypes or strains with diverse genomic variations, such as targeted deletions. The growth phenotypes of these mutants should be analyzed, complemented by complementation assays to confirm the specific roles of the deleted regions. These efforts would provide critical empirical evidence to support the findings from the GWAS approach and enhance understanding of the genetic basis of bacterial growth kinetics.

      We fully agree with this assessment. As reviewer #1 similarly highlighted, additional genetic manipulation studies would provide further helpful information to assess the impact of altering growth rates on virulence and infection. However, the experimental studies were beyond the scope of this study due to several factors beyond our control. However, we intend to conduct follow-up experimental work to provide additional insights into how the combination of serotypes and genetic background influences pneumococcal growth in vitro and virulence in vivo. Because our current study demonstrates that genetic determinants of pneumococcal growth features are not simply confined to single loci, such experimental validation would require novel wet-lab approaches that consider epistatic interactions. 

      In the discussion section, the authors state that "the influence of serotype appeared to be higher than the genetic background for the average growth rate" (lines 296-298). Alongside references 13-15, this emphasizes the important role of capsular variability, which is a key determinant of serotypes, in influencing growth kinetics. However, this raises the question: why isn't a specific locus like cps, which is central to capsule biogenesis, considered a strong influencer of growth kinetics in this study?

      Thank you for highlighting the point above. Indeed, the capsule biosynthesis (cps) locus is associated with pneumococcal growth kinetics, as seen in the analysis of individual serotypes. However, the cps locus does not come up as a hit in the GWAS because we controlled for the population structure of the pneumococcal strains. The absence of the hits in the cps locus is because serotypes, hence cps loci, tend to be tightly associated with lineages despite occasional capsule switches, which introduce serotypes to different lineages. Therefore, controlling for population structure, which is critical for GWAS analyses, virtually eliminates the detection of potential hits within the cps locus. However, detecting such hits with larger datasets may still be possible. For this reason, we performed a separate analysis of the individual serotypes and lineages shown in Figure 3.

      One plausible explanation could be the absence of "elevated signals" for cps in the GWAS analysis. GWAS relies on identifying loci with statistically significant associations to phenotypes. The lack of such signals for cps may indicate that its contribution, while biologically important, does not stand out genome-wide. This might be due to the polygenic nature of growth kinetics, where the overall genetic background exerts a cumulative effect, potentially diluting the apparent influence of individual loci like cps in statistical analyses. 

      We fully agree with this point. We mentioned in the abstract and discussion that the absence of the signals for specific individual loci within the pneumococcal genome may imply that the growth kinetics are polygenic. We have edited the discussion to emphasise the suggested point.

      Reviewer #3 (Public review): 

      This study provides insights into the growth kinetics of a diverse collection of Streptococcus pneumoniae, identifying capsule and lineage differences. It was not able to identify any specific loci from the genome-wide association studies (GWAS) that were associated with the growth features. It does provide a useful study linking phenotypic data with large-scale genomic population data. The methods for the large part were appropriately written in sufficient detail, and data analysis was performed with rigour. The interpretation of the results was supported by the data, although some additional explanation of the significance of e.g. ancestral state reconstruction would be useful. Efforts were made to make the underlying data fully accessible to the readers although some of the supplementary material could be formatted and explained a bit better. 

      Thank you for the excellent summary of the manuscript. We have added some text to clarify the significance of some approaches, including ancestral state reconstruction and supplementary material.

      Reviewer #1 (Recommendations for the authors): 

      (1) Since the PCBN was collected pre and post-vaccine introduction, did the authors stratify their analyses other than Figure 7 (disease correlations) to assess how vaccine status may influence growth rates? Is the assertion in Lines 238-239 supported by the in vitro data? 

      We have done this analysis. Overall, there was no association between vaccine introduction and pneumococcal growth rates. In lines 238-239, we assumed that in vaccinated populations, the host may be more capable of suppressing bacterial replication due to vaccination. However, there was no in vitro data to back this statement. Therefore, we have edited the statement to remove the text regarding vaccination policy. 

      We considered vaccination status when analysing the data presented in Figure 7. As mentioned in the legend, we only analysed the dataset collected before vaccine introduction to avoid confounding due to vaccination status. To fully assess the impact of vaccination, we would need additional information besides the date of isolation, including vaccine doses and time since vaccination, which was not available for our study.

      (2) Similarly, do any of the growth rate metrics correlate with other aspects of the clinical dataset, like the year of isolation or the sex/age of the patient?

      We did not include these assessments in the manuscript, as these aspects of the clinical dataset are mostly related to the patient and not necessarily the intrinsic characteristics of the pneumococcus. However, upon revising the manuscript, we compared the growth characteristics against the vaccination period, and we did not find any statistically significant association. The relationship between pneumococcal growth features of the isolates used in the current study and their corresponding clinical manifestations of invasive  disease was described in Arends  et al. (10.1128/spectrum.00050-22).

      (3) When evaluating the impact of serotype on growth rates, did the directionality of some of the described impacts match with those previously reported in other studies?

      We were unable to assess the directionality of the serotype’s impact on growth rates. In part, we did not conduct this analysis because our study used different strains from those used in other studies. Such differences in the genetic backgrounds, growth media, and analytical approaches made assessing the consistencies between the studies difficult.

      (4) Did the authors expect that a specific growth metric would be more likely to correlate with specific genetic variants? The reader would benefit from a brief discussion of how the metrics (e.g., maximum growth or lag phase duration) are biologically meaningful beyond the overall growth rate. 

      We indeed expected that specific growth metrics might correlate with certain genetic variants based on their distinct biological roles. The lag phase duration can potentially reflect the ability of the pneumococcus to adapt to environmental conditions, such as nutrient availability or stress, and may be more influenced by regulatory genes involved in sensing and responding to environmental cues (PMID: 30642990, PMID: 22139505). In contrast, maximum growth rate is more likely to be impacted by core metabolic or biosynthetic genes that control the rate of cell division under optimal conditions (PMID: 31053828). Maximum optical density, which reflects the final cell density, might be shaped by factors related to nutrient utilization efficiency, waste tolerance, or quorum sensing. The duration of the stationary phase is related to the switch from lipoteichoic acids to wall teichoic acids, permitting the initiation of the lytic growth phase (PMID: 239401). It is unclear whether this switch is mediated by external triggers or also by intrinsic features of the pneumococcus. Including this type of analysis allows for a more nuanced understanding of how genetic variants contribute to different physiological aspects of microbial growth. The relevance of the lag phase and the stationary phase in relation to the clinical phenotypes of invasive disease (such as pleural empyema and meningitis) of our pneumococcal isolates has been studied and discussed in Arends et al. (PMID: 35678554). The observed associations are summarized in Table 2 of that article. We have added some text in the discussion on the biological relevance of each bacterial growth metric.

      (5) For the GWAS analyses, have similar analyses been performed for other S. pneumoniae collections? Are there known "control" loci that the authors could replicate in the current collection to verify the robustness of the approach?

      Others have undertaken GWAS analyses of other S. pneumoniae collections elsewhere. Unlike our study, none of the GWAS analyses elsewhere focused on bacterial growth kinetics. Therefore, considering this is the first GWAS study in pneumococcus and bacteria, in general, to focus on growth kinetics, we do not have “control” loci that we could replicate to verify the robustness of the approach. However, we hope that future studies will be able to utilise our findings to compare their approach as more and more similar analyses of in vitro growth data become available.

      (6) Is there a statistical method that could predict the sample size necessary to detect the proposed combinatorial or small contributions from various genetic loci to growth rate? This reviewer is not an expert in statistical genetics but would appreciate an indication of the scale required by future studies to identify these regions.

      We are unaware of a statistical approach that could predict sample sizes to detect small or combinatorial effect sizes. However, we intend to conduct simulations in future studies to gain insights into the required sample sizes.

      (7) WGS and genome assembly metrics should be provided for each sequenced genome especially since only short-read assemblies were performed. If not already deposited, the assemblies should be deposited for data sharing as well.

      We have deposited the sequence reads to the European Nucleotide Archive (ENA) and provided the accession numbers, WGS, and assembly metrics in Supplementary Data 1. We have described the tools used to generate the assemblies from the reads.

      (8) Please include the specific ethics approval numbers for the sample collection protocol.

      Study procedures were approved by the Medical Ethical committees of the participating hospitals, including a waiver for individual informed consent (file number 2020–6644 Radboudumc).  

      Reviewer #3 (Recommendations for the authors): 

      Certain aspects of the manuscript could be clarified and extended to improve the manuscript.

      (1) Introduction 

      a) The authors assume knowledge by the reader on Streptococcus pneumoniae, specifically the genetic diversity of lineages and capsules. This diversity is highlighted in the discussion L368 that there are >100 serotypes. The authors should consider backgrounding the number of serotypes and the importance of serotype switching in these bacteria, as well as explaining the diversity of the lineages (GPSC) that are increasingly used as standard nomenclature for Streptococcus pneumonia.

      Thank you for bringing this to our attention. We have included a brief description of the GPSC lineages and capsule switching in the introduction.

      b) The last paragraph of the introduction is lengthy and gets into the methods and results of the manuscript. These could be edited down.

      We have revised the paragraph to remove the methods and results.

      (2) Methods 

      a) The authors should provide details on the QC undertaken and any exclusion criteria of genomes based on the QC. The supplement material has tabs e.g. read and assembly metrics but unclear how determined and impacted the study.

      We utilised all the genomes available for this study, which had in vitro phenotypic data available. We excluded no genomes due to poor sequence quality.

      Additional information about the genomes is available from previous studies, which are referenced in the methods section.

      b) Why did the authors map draft assemblies to the reference genome for the SNP alignment (from which the ML tree was inferred)? Draft genome assemblies usually contain errors so there is potential for false positive SNPs. Further, there is a lack of perbase quality information using the draft genome assemblies. Given the short read data are available - why were the reads not used as input for snippy (which is the standard input for snippy)? This may have impacted the results reliant on the SNP calls.

      We mapped a combination of reads and draft assemblies to the reference genome to generate the SNP alignment using Snippy (https://github.com/tseemann/snippy). For the pneumococcal isolates, we mapped the reads, while for the included outgroup, we mapped the assembly as we did not have sequence reads available. We have edited the methods section to clarify this.

      c) SNP alignment. the authors explain the decision to not undertake recombination detection later in the discussion. Did the authors mask any phage or repeat regions? And how was the outgroup S. oralis included in the analyses e.g what genome was used?

      We included the outgroup genome in the alignment generated by SNIPPY, which involved generating aligned consensus sequences for each isolate after mapping the reads to the pneumococcal ATCC 700669 reference genome (GenBank accession: NC_011900), as described in the methods. We have now included the accession number for the S. oralis genome, which was used as an outgroup in our phylogenetic analysis. Phages are not typically common in pneumococcal genomes compared to other species. Similarly, although repeats are present in the pneumococcal genome, the consensus in the field is that these do not particularly bias the pneumococcal phylogeny. Therefore, the consensus in the field has been not to explicitly mask these regions as done for highly clonal bacterial pathogens, such as Mycobacterium tuberculosis. Overall, our approach to building the phylogenetic tree is robust compared to alternative methods (PMID:

      29774245).

      d) Should the presence/absence of unitigs that were used as the input for the GWAS be included as a supp dataset?

      We have now provided the presence/absence matrix for the unitigs used in the  analysis as a supplementary dataset available at GitHub(https://github.com/ChrispinChaguza/SpnGrowthKinetics). We have revised the methods section to include a section on data availability.

      e) For the annotation of unitigs, the authors used their bespoke script with features from complete public genomes. Please provide accession/ identifying information of the complete genomes (not only the ATCC 700669) reference in the methods. Also, why did the authors choose not to annotate with annotate_hits_pyseer from pyseer? 

      We annotated the hits using our bespoke script because we understood our approach better and could control the information generated from the script. Annotating with “annotate_hits_pyseer” from pyseer would produce similar results to both approaches, as they compared the unitigs to annotated reference genomes.

      (3) Results 

      a) The authors could consider providing an overview of the diversity (e.g. lineages and capsules) in the study and contextualising it in the broader context of Streptococcus pneumoniae population genomics. This would help readers who are less familiar with this pathogen to understand the diversity included in this study. 

      We included this information in the first paragraph of the results section. Considering that population-level analyses based on this dataset have already been published, we have referenced the corresponding papers to provide additional information to readers.

      b) Did the timespan of the study pre and post-PCV7 introduction need to be briefly touched on in the results? For example, did the serotypes and lineages vary over the two collection periods and does this need to be considered in the interpretation of the results at all? 

      The prevalence of serotypes and lineages varied over time, partly due to the introduction of vaccines and random temporal fluctuations in the distribution of strains. We did not explicitly adjust for time, as this is not likely to influence the intrinsic biology of the strains. However, we adjusted for the population structure of the strains, whose changes would most likely affect the distribution of strains in the population. For other analyses, including that in Figure 7, we considered the vaccination status by restricting the analysis to the isolates collected before vaccine introduction.

      c) Figures. Some of the figures had very small text (especially Figure 1) that was difficult to read and Figure 2 and Figure 4 were mentioned once, while several paragraphs of results were used to discuss Figure 3. Is Figure 1 required as a main figure? Could Figure 3 be split? e.g. one with the chord diagram, one with panels b-e, and one with panels jq? Figure 4 - the ancestral state reconstruction analyses could be expanded upon in the results.

      We have increased the text in some figures where possible. However, for figures that show more information, smaller text is more suitable. 

      Figure 1 is essential to the manuscript as it provides a visual overview of the approach used in this study. Without this figure, it may be difficult for some readers, especially those unfamiliar with bacterial genomic analyses, to understand our study approach and how we estimated the pneumococcal growth parameters used for the GWAS. 

      For Figure 4, we prefer to keep it as it is, to have the information in one place, as splitting it will mean including some of the panels in the supplementary material, considering that we already have seven figures in the manuscript. 

      We have added additional text to the results regarding the ancestral reconstruction analyses. We included them mainly to demonstrate the correlation between the pneumococcal growth rates and the phylogeny.

      (4) Discussion 

      a) Why was 15 hours for culture undertaken and not 24? The authors discuss the impact that this may have had on their results.

      The 15-hour incubation period was deliberately chosen, as the growth curves indicate that most isolates had reached the stationary phase by that time. Extending the culture duration would likely not have yielded additional meaningful data. As is well established, Streptococcus pneumoniae undergoes autolysis upon reaching a certain cell density, which could distort growth measurements and complicate interpretation if incubation were prolonged. For clarification, we have changed the sentences related to this topic in the Discussion.

      b) Some paragraphs in the discussion were very long e.g. L347-381. The authors could consider breaking long paragraphs down into shorter ones to improve the readability of the manuscript.

      We agree with this assessment. We initially wanted to include all the information on the study’s limitations in the same paragraph. However, as suggested, we have now split the highlighted paragraph into two shorter paragraphs. 

      (5) Supplementary Data 

      a) Providing information in each tab of each supp data file would be useful. For example - including a table header that explained what was in each sheet rather than relying on the tab names. Formatting for some of the underlying supplementary data could be improved e.g. in supplementary data 2 no explanation is given to interpret the data included in these files.

      Thank you for the suggestions. For clarity, we have included a header in each tab of the spreadsheet that describes what is included in each dataset. We have also removed the previous Supplementary Data 2. We realised that the information presented in this spreadsheet was redundant, as it was already available in Supplementary Data 1.

    1. eLife Assessment

      This important study describes newly identified light-gated ion channel homologs (channelrhodopsins, ChRs) in several protist species, with a primary focus on the biophysical characterization of ChRs of ancyromonads. The authors employed a powerful combination of bioinformatics, manual and automated patch-clamp electrophysiology, absorption spectroscopy, and flash photolysis. Additionally, they evaluated the applicability of the newly discovered anion-conducting ChRs in cortical neurons of mouse brain slices and in living C. elegans worms. The evidence supporting most of the claims is compelling, and this work will be of interest to the microbial rhodopsin community and neuro- and cardioscientists utilizing optogenetics in their research.

    2. Reviewer #1 (Public review):

      Summary:

      This work by Govorunova et al. identified three naturally blue-shifted channelrhodopsins (ChRs) from ancyromonads, namely AnsACR, FtACR, and NlCCR. The phylogenetic analysis places the ancyromonad ChRs in a distinct branch, highlighting their unique evolutionary origin and potential for novel applications in optogenetics. Further characterization revealed the spectral sensitivity, ionic selectivity, and kinetics of the newly discovered AnsACR, FtACR, and NlCCR. This study also offers valuable insights into the molecular mechanism underlying the function of these ChRs, including the roles of specific residues in the retinal-binding pocket. Finally, this study validated the functionality of these ChRs in both mouse brain slices (for AnsACR and FtACR) and in vivo in Caenorhabditis elegans (for AnsACR), demonstrating the versatility of these tools across different experimental systems.<br /> In summary, this work provides a potentially valuable addition to the optogenetic toolkit by identifying and characterizing novel blue-shifted ChRs with unique properties.

      Strengths:

      This study provides a thorough characterization of the biophysical properties of the ChRs' properties and demonstrated the versatility of these tools in different ex vivo and in vivo experimental systems. The authors also explored the potential of AnsACR for multiplexed optogenetics. Finally, the mutagenesis experiments revealed the roles of key residues in the photoactive site that can affect the spectral and kinetic properties of the channelrhodopsins.

      Weaknesses:

      The revised manuscript has addressed most of the previous major weaknesses.

    3. Reviewer #2 (Public review):

      Summary:

      Govorunova et al present three new anion opsins that have potential applications silencing neurons. They identify new opsins by scanning numerous databases for sequence homology to known opsins, focusing on anion opsins. The three opsin identified, are uncommonly fast, potent, and are able to silence neuronal activity. The authors characterize numerous parameters of the opsins and compare these opsins to the existing and widely used GtACR opsins.

      Strengths:

      This paper follows the tradition of the Spudich lab, presenting and rigorously characterizing potentially valuable opsins. Furthermore, they explore several mutations of the identified opsin that may make these opsins even more useful for the broader community. The opsins AnsACR and FtACR are particularly notable having extraordinarily fast onset kinetics that could have utility in many domains. Furthermore, the authors show AnsACR is useable in multiphoton experiments having a peak photocurrent in a commonly used wavelength. Overall, the author's detailed measurements and characterization make for an important resource - both presenting new opsins that may be important for future experiment, and providing characterizations to expand our understanding of opsin biophysics in general.

    4. Reviewer #3 (Public review):

      Summary:

      The authors aimed to develop Channelrhodopsins (ChRs), light-gated ion channels, with high potency and blue action spectra for use in multicolor (multiplex) optogenetics applications. To achieve this, they performed a bioinformatics analysis to identify ChR homologues in several protist species, focusing on ChRs from ancyromonads, which exhibited the highest photocurrents and the most blue-shifted action spectra among the tested candidates. Within the ancyromonad clade, the authors identified two new anion-conducting ChRs and one cation-conducting ChR. These were characterized in detail using a combination of manual and automated patch-clamp electrophysiology, absorption spectroscopy, and flash photolysis. The authors also explored sequence features that may explain the blue-shifted action spectra and differences in ion selectivity among closely related ChRs.

      Strengths:

      A key strength of this study is the high-quality experimental data, which were obtained using well-established techniques such as manual patch-clamp and absorption spectroscopy, complemented by modern automated patch-clamp approaches. These data convincingly support most of the claims. The newly characterized ChRs expand the optogenetics toolkit and will be of significant interest to researchers working with microbial rhodopsins, those developing new optogenetic tools, as well as neuro- and cardioscientists employing optogenetic methods.

      Weaknesses:

      This study does not exhibit major methodological weaknesses.

    5. Author response:

      Reviewer #1 (Public review):

      Summary:

      This work by Govorunova et al. identified three naturally blue-shifted channelrhodopsins (ChRs) from ancyromonads, namely AnsACR, FtACR, and NlCCR. The phylogenetic analysis places the ancyromonad ChRs in a distinct branch, highlighting their unique evolutionary origin and potential for novel applications in optogenetics. Further characterization revealed the spectral sensitivity, ionic selectivity, and kinetics of the newly discovered AnsACR, FtACR, and NlCCR. This study also offers valuable insights into the molecular mechanism underlying the function of these ChRs, including the roles of specific residues in the retinal-binding pocket. Finally, this study validated the functionality of these ChRs in both mouse brain slices (for AnsACR and FtACR) and in vivo in Caenorhabditis elegans (for AnsACR), demonstrating the versatility of these tools across different experimental systems.

      In summary, this work provides a potentially valuable addition to the optogenetic toolkit by identifying and characterizing novel blue-shifted ChRs with unique properties.

      Strengths:

      This study provides a thorough characterization of the biophysical properties of the ChRs and demonstrates the versatility of these tools in different ex vivo and in vivo experimental systems. The mutagenesis experiments also revealed the roles of key residues in the photoactive site that can affect the spectral and kinetic properties of the channel.

      We thank the Reviewer for his/her positive evaluation of our work.

      Weaknesses:

      While the novel ChRs identified in this work are spectrally blue-shifted, there still seems to be some spectral overlap with other optogenetic tools. The authors should provide more evidence to support the claim that they can be used for multiplex optogenetics and help potential end-users assess if they can be used together with other commonly applied ChRs. Additionally, further engineering or combination with other tools may be required to achieve truly orthogonal control in multiplexed experiments.

      To demonstrate the usefulness of ancyromonad ChRs for multiplex optogenetics as a proof of principle, we co-expressed AnsACR with the red-shifted cation-conducting ChR Chrimson and measured net photocurrent generated by this combination as a function of the wavelength. We found that it is hyperpolarizing in the blue region of the spectrum, and depolarizing at the red region. In the revision, we added a new panel (Figure 1D) showing these results and the following paragraph to the main text:

      “To test the possibility of using AnsACR in multiplex optogenetics, we co-expressed it with the red-shifted CCR Chrimson (Klapoetke et al., 2014) fused to an EYFP tag in HEK293 cells. We measured the action spectrum of the net photocurrents with 4 mM Cl<sup>-</sup> in the pipette, matching the conditions in the neuronal cytoplasm (Doyon, Vinay et al. 2016). Figure 1D, black shows that the direction of photocurrents was hyperpolarizing upon illumination with λ<500 nm and depolarizing at longer wavelengths. A shoulder near 520 nm revealed a FRET contribution from EYFP (Govorunova, Sineshchekov et al. 2020), which was also observed upon expression of the Chrimson construct alone (Figure 1D, red)”.

      In the C. elegans experiments, partial recovery of pharyngeal pumping was observed after prolonged illumination, indicating potential adaptation. This suggests that the effectiveness of these ChRs may be limited by cellular adaptation mechanisms, which could be a drawback in long-term experiments. A thorough discussion of this challenge in the application of optogenetics tools would prove very valuable to the readership.

      We added the following paragraph to the revised Discussion:

      “One possible explanation of the partial recovery of pharyngeal pumping that we observed after 15-s illumination, even at the highest tested irradiance, is continued attenuation of photocurrent during prolonged illumination (desensitization). However, the rate of AnsACR desensitization (Figure 1 – figure supplement 4A and Figure 1 – figure supplement 5A) is much faster than the rate of the pumping recovery, reducing the likelihood that desensitization is driving this phenomenon. Another possible reason for the observed adaptation is an increase in the cytoplasmic Cl<sup>-</sup> concentration owing to AnsACR activity and hence a breakdown of the Cl<sup>-</sup> gradient on the neuronal membrane. The C. elegans pharynx is innervated by 20 neurons, 10 of which are cholinergic (Pereira, Kratsios et al. 2015). A pair of MC neurons is the most important for regulation of pharyngeal pumping, but other pharyngeal cholinergic neurons, including I1, M2, and M4, also play a role (Trojanowski, Padovan-Merhar et al. 2014). Moreover, the pharyngeal muscles generate autonomous contractions in the presence of acetylcholine tonically released from the pharyngeal neurons (Trojanowski, Raizen et al. 2016). Given this complexity, further elucidation of pharyngeal pumping adaptation mechanisms is beyond the scope of this study.”

      Reviewer #2 (Public review):

      Summary:

      Govorunova et al present three new anion opsins that have potential applications in silencing neurons. They identify new opsins by scanning numerous databases for sequence homology to known opsins, focusing on anion opsins. The three opsins identified are uncommonly fast, potent, and are able to silence neuronal activity. The authors characterize numerous parameters of the opsins.

      Strengths:

      This paper follows the tradition of the Spudich lab, presenting and rigorously characterizing potentially valuable opsins. Furthermore, they explore several mutations of the identified opsin that may make these opsins even more useful for the broader community. The opsins AnsACR and FtACR are particularly notable, having extraordinarily fast onset kinetics that could have utility in many domains. Furthermore, the authors show that AnsACR is usable in multiphoton experiments having a peak photocurrent in a commonly used wavelength. Overall, the author's detailed measurements and characterization make for an important resource, both presenting new opsins that may be important for future experiments, and providing characterizations to expand our understanding of opsin biophysics in general.

      We thank the Reviewer for his/her positive evaluation of our work.

      Weaknesses:

      First, while the authors frequently reference GtACR1, a well-used anion opsin, there is no side-by-side data comparing these new opsins to the existing state-of-the-art. Such comparisons are very useful to adopt new opsins.

      GtACR1 exhibits the peak sensitivity at 515 nm and therefore is poorly suited for combination with red-shifted CCRs or fluorescent sensors, unlike blue-light-absorbing ancyromonad ACRs. Nevertheless, we conducted side-by-side comparison of ancyromonad ChRs, GtACR1 and GtACR2, the latter of which has the spectral maximum at 470 nm. The results are shown in the new Figures 1E and F, and the new multipanel Figure 1 – figure supplement 4 added in the revision. We also added the following text, describing these results, to the revised Results section:

      “Figures 1E and F show the dependence of the peak photocurrent amplitude and reciprocal peak time, respectively, on the photon flux density for ancyromonad ChRs and GtACRs. The current amplitude saturated earlier than the time-to-peak for all tested ChRs. Figure 1 – figure supplement 4A-E shows normalized photocurrent traces recorded at different photon densities. Quantitation of desensitization at the end of 1-s illumination revealed a complex light dependence (Figure 1, Figure Supplement 4F). Figure 1 – figure supplement 5 shows normalized photocurrent traces recorded in response to a 5-s light pulse of the maximal available intensity and the magnitude of desensitization at its end.”

      Next, multiphoton optogenetics is a promising emerging field in neuroscience, and I appreciate that the authors began to evaluate this approach with these opsins. However, a few additional comparisons are needed to establish the user viability of this approach, principally the photocurrent evoked using the 2p process, for given power densities. Comparison across the presented opsins and GtACR1 would allow readers to asses if these opsins are meaningfully activated by 2P.

      We carried out additional 2P experiments in ancyromonad ChRs, GtACR1 and GtACR2 and added their results to a new main-text Figure 6 and Figure 6 – figure supplement 1. We added the new section describing these results, “Two-photon excitation”, to the main text in the revision:

      “To determine the 2P activation range of AnsACR, FtACR, and NlCCR, we conducted raster scanning using a conventional 2P laser, varying the excitation wavelength between 800 and 1,080 nm (Figure 6 – figure supplement 1). All three ChRs generated detectable photocurrents with action spectra showing maximal responses at ~925 nm for AnsACR, 945 nm for FtACR, and 890 nm for NlCCR (Figure 6A). These wavelengths fall within the excitation range of common Ti:Sapphire lasers, which are widely used in neuroscience laboratories and can be tuned between ~700 nm and 1,020-1,300 nm. To assess desensitization, cells expressing AnsACR, FtACR, or NlCCR were illuminated at the respective peak wavelength of each ChR at 15 mW for 5 seconds. GtACR1 and GtACR2, previously used in 2P experiments (Forli, Vecchia et al. 2018, Mardinly, Oldenburg et al. 2018), were included for comparison. The normalized photocurrent traces recorded under these conditions are shown in Figure 6B-F. The absolute amplitudes of 2P photocurrents at the peak time and at the end of illumination are shown in Figure 6G and H, respectively. All five tested variants exhibited comparable levels of desensitization at the end of illumination (Figure 6I).”

      Reviewer #3 (Public review):

      Summary:

      The authors aimed to develop Channelrhodopsins (ChRs), light-gated ion channels, with high potency and blue action spectra for use in multicolor (multiplex) optogenetics applications. To achieve this, they performed a bioinformatics analysis to identify ChR homologues in several protist species, focusing on ChRs from ancyromonads, which exhibited the highest photocurrents and the most blue-shifted action spectra among the tested candidates. Within the ancyromonad clade, the authors identified two new anion-conducting ChRs and one cation-conducting ChR. These were characterized in detail using a combination of manual and automated patch-clamp electrophysiology, absorption spectroscopy, and flash photolysis. The authors also explored sequence features that may explain the blue-shifted action spectra and differences in ion selectivity among closely related ChRs.

      Strengths:

      A key strength of this study is the high-quality experimental data, which were obtained using well-established techniques such as manual patch-clamp and absorption spectroscopy, complemented by modern automated patch-clamp approaches. These data convincingly support most of the claims. The newly characterized ChRs expand the optogenetics toolkit and will be of significant interest to researchers working with microbial rhodopsins, those developing new optogenetic tools, as well as neuro- and cardioscientists employing optogenetic methods.

      We thank the Reviewer for his/her positive evaluation of our work.

      Weaknesses:

      This study does not exhibit major methodological weaknesses. The primary limitation of the study is that it includes only a limited number of comparisons to known ChRs, which makes it difficult to assess whether these newly discovered tools offer significant advantages over currently available options.

      We conducted side-by-side comparison of ancyromonad ChRs and GtACRs, wildly used for optical inhibition of neuronal activity. The results are shown in the new Figures 1E and F, and the new multipanel Figure 1 – figure supplement 4 and Figure 1 – figure supplement 5 added in the revision. We also added the following text, describing these results, to the revised Results section:

      “Figures 1E and F show the dependence of the peak photocurrent amplitude and reciprocal peak time, respectively, on the photon flux density for ancyromonad ChRs and GtACRs. The current amplitude saturated earlier than the time-to-peak for all tested ChRs. Figure 1 – figure supplement 4A-E shows normalized photocurrent traces recorded at different photon densities. Quantitation of desensitization at the end of 1-s illumination revealed a complex light dependence (Figure 1, Figure Supplement 4F). Figure 1 – figure supplement 5 shows normalized photocurrent traces recorded in response to a 5-s light pulse of the maximal available intensity and the magnitude of desensitization at its end.”

      Additionally, although the study aims to present ChRs suitable for multiplex optogenetics, the new ChRs were not tested in combination with other tools. A key requirement for multiplexed applications is not just spectral separation of the blue-shifted ChR from the red-shifted tool of interest but also sufficient sensitivity and potency under low blue-light conditions to avoid cross-activation of the respective red-shifted tool. Future work directly comparing these new ChRs with existing tools in optogenetic applications and further evaluating their multiplexing potential would help clarify their impact.

      As a proof of principle, we co-expressed AnsACR with the red-shifted cation-conducting CCR Chrimson and demonstrated that the net photocurrent generated by this combination is hyperpolarizing in the blue region of the spectrum, and depolarizing at the red region. In the revision, we added a new panel (Figure 1D) showing these results and the following paragraph to the main text:

      “To test the possibility of using AnsACR in multiplex optogenetics, we co-expressed it with the red-shifted CCR Chrimson (Klapoetke et al., 2014) fused to an EYFP tag in HEK293 cells. We measured the action spectrum of the net photocurrents with 4 mM Cl<sup>-</sup> in the pipette, matching the conditions in the neuronal cytoplasm (Doyon, Vinay et al. 2016). Figure 1D, black shows that the direction of photocurrents was hyperpolarizing upon illumination with λ<500 nm and depolarizing at longer wavelengths. A shoulder near 520 nm revealed a FRET contribution from EYFP (Govorunova, Sineshchekov et al. 2020), which was also observed upon expression of the Chrimson construct alone (Figure 1D, red)”.

      Reviewing Editor Comments:

      The reviewers suggest that direct comparison to GtACR1 is the most important step to make this work more useful to the community.

      We followed the Reviewers’ recommendations and carried out side-by-side comparison of ancyromonad ChRs and GtACR1 as well as GtACR2 (Figure 1E and F, Figure 1 – figure supplement 4, Figure 1 – figure supplement 5, and Figure 6). Note, however, that GtACR1’s spectral maximum is at 515 nm, which makes it poorly suitable for blue light excitation. Also, ChRs are known to perform very differently in different cell types and upon expression of their genes in different vector backbones, so our results cannot be generalized for all experimental systems. Each ChR user needs to select the most appropriate tool for his/her purpose by testing several candidates in his/her own experimental setting.

      Reviewer #1 (Recommendations for the authors):

      (1) The figure legend for Figure 2D-I appears to be incomplete. Please provide a detailed explanation of the panels.

      In the revision, we have expanded the legend of Figure 2 to explain all individual panels.

      (2) The meaning of the Vr shift (Y-axis in Figure 2H-I) should be clarified in the main text to aid reader understanding.

      In the revision, we added the phrase “which indicated higher relative permeability to NO<sub>3</sub> than to Cl<sup>-“</sup> to explain the meaning of the Vr shift upon replacement of Cl<sup>-</sup> with NO<sub>3</sub>-.

      (3) Adding statistical analysis for the peak and end photocurrent values in Figure 2D-F would strengthen the claim that there is minimal change in relative permeability during illumination.

      In the revision, we added the V<sub>r</sub> values for the peak photocurrent to Figure 2H-I, which already contained the V<sub>r</sub> values for the end photocurrent, and carried out a statistical analysis of their comparison. The following sentence was added to the text in the revision:

      “The V<sub>r</sub> values of the peak current and that at the end of illumination were not significantly different by the two-tailed Wilcoxon signed-rank test (Fig. 2G), indicating no change in the relative permeability during illumination.”

      (4) Figure 4H and I seem out of place in Figure 4, as the title suggests a focus on wild-proteins and AnsACR mutants. The authors could consider moving these panels to Figure 3 for better alignment with the content.

      As noted below, we changed the panel order in Figure 4 upon the Reviewer’s request. In particular, former Figure 4I is Figure 4C in the revision, and former Figure 4H is now panel C in Figure 3 – figure supplement 1 in the revision. We rearranged the corresponding section of the text (highlighted yellow in the manuscript).

      (5) The characterization section could be strengthened by including data on the pH sensitivity of FtACR, which is currently missing from the main figures.

      Upon the Reviewer’s request, we carried out pH titration of FtACR absorbance and added the results as Figure 4B in the revision.

      (6) The logic in Figure 4A-G appears somewhat disjointed. For example, Figure 4A shows pH sensitivity for WT AnsACR and the G86E mutant, while Figure 4 B-D shifts to WT AnsACR and the D226N mutant, and Figure 4E returns to the G86E mutant. Reorganizing or clarifying the flow would improve readability.

      We followed the Reviewer’s advice and changed the panel order in Figure 4. In the revised version, the upper row (panels A-C) shows the pH titration data of the three WTs, the middle row (panels D-F) shows analysis of the AnsACR_D226N mutant, and the lower row (panels G-I) shows analysis of the AnsACR_G88E mutant. We also rearranged accordingly the description of these panels in the text.

      (7) In Figure 5A, "NIACR" should likely be corrected to "NlCCR".

      We corrected the typo in the revision.

      (8) The statistical significance in Figure 6C and D is somewhat confusing. Clarifying which groups are being compared and using consistent symbols would improve interoperability.

      In the revision, we improved the figure panels and legend to clarify that the comparisons are between the dark and light stimulation groups within the same current injection.

      (9) The authors pointed out that at rest or when a small negative current was injected, the neurons expressing Cl- permeable ChRs could generate a single action potential at the beginning of photostimulation, as has been reported before. The authors could help by further discussing if and how this phenomenon would affect the applicability of such tools.

      We mentioned in the revised Discussion section that activation of ACRs in the axons could depolarize the axons and trigger synaptic transmission at the onset of light stimulation, and this undesired excitatory effect need to be taken into consideration when using ACRs.

      Reviewer #2 (Recommendations for the authors):

      Govorunova et al present three new anion opsins that have potential applications in silencing neurons. This paper follows the tradition of the Spudich lab, presenting and rigorously characterizing potentially valuable opsins. Furthermore, they explore several mutations of the identified opsin that may make these opsins even more useful for the broader community. In general, I feel positively about this manuscript. It presents new potentially useful opsins and provides characterization that would enable its use. I have a few recommendations below, mostly centered around side-by-side comparisons to existing opsins.

      (1) My primary concern is that while there is a reference to GtACR1, a highly used opsin first described by this team, they do not present any of this data side by side.

      When evaluating opsins to use, it is important to compare them to the existing state of the art. As a potential user, I need to know where these opsins differ. Citing other papers does not solve this as, even within the same lab, subtle methodological differences or data plotting decisions can obscure important differences.

      As we explained in the response to the public comments, we carried out side-by-side comparison of ancyromonad ChRs and GtACRs as requested by the Reviewer. The results are shown in the new Figures 1E and F, and the new multipanel Figure 1 – figure supplement 4 and Figure 1 – figure supplement 5, added in the revision. However, we would like to emphasize a limited usefulness of such comparative analysis, as ChRs are known to perform very differently in different cell types and upon expression of their genes in different vector backbones, so our results cannot be generalized for all experimental systems. Each ChR user needs to select the most appropriate tool for his/her purpose by testing several candidates in his/her own experimental setting.

      (2) Multiphoton optogenetics is an emerging field of optogenetics, and it is admirable that the authors address it here. The authors should present more 2p characterization, so that it can be established if these new opsins are viable for use with 2P methods, the way GtACR1 is. The following would be very useful for 2P characterization:

      Photocurrents for a given power density, compared to GtACR1 and GtACR2.

      The new Figure 6 (B-F) added in the revision shows photocurrent traces recorded from the three ancyromonad ChRs and  two GtACRs upon 2P excitation of a given power density.

      Comparing NICCR and FtACR's wavelength specificity and photocurrent. If these opsins are too weak to create reasonable 2P spectra, this difference should be discussed.

      The new Figure 6A shows the 2P action spectra of all three ancyromonad ChRs.

      A Trace and calculated photocurrent kinetics to compare 1P and 2P. This need not be the flash-based absorption characterization of Figure 3, but a side-by-side photocurrent as in Figure 2.

      As mentioned above, photocurrent traces recorded from ancyromonad ChRs and GtACRs upon 2P excitation are shown in the new Figure 6 (B-F). However, direct comparison of the 2P data with the 1P data is not possible, as we used laser scanning illumination for the former and wild-field illumination for the latter.

      Characterization of desensitization. As the authors mention, many opsins undergo desensitization, presenting the ratio of peak photocurrent vs that at multiple time points (probably up to a few seconds) would provide evidence for how effectively these constructs could be used in different scenarios.

      We conducted a detailed analysis of desensitization under both 1P and 2P excitation. The new Figure 1 – figure supplement 4 and Figure 1 – figure supplement 5 show the data obtained under 1P excitation, and the new Figure 6 shows the data for 2P conditions.

      I have to admit, that by the end of the paper, I was getting confused as to which of the three original constructs had which property, and how that was changing with each mutation. I would suggest that a table summarizing each opsin and mutation with its onset and offset kinetics, peak wavelength, photocurrent, and ion selectivity would greatly increase the ability to select and use opsins in the future.

      In the revision, we added a table of the spectroscopic properties of all tested mutants as Supplementary File 2. This study did not aim to analyze other parameters listed by the Reviewer. We added the following sentence referring to this table to the main text:

      “Supplementary File 2 contains the λ values of the half-maximal amplitude of the long-wavelength slope of the spectrum, which can be estimated more accurately from the action spectra than the λ of the maximum.”

      It may be out of the scope of this manuscript, but if a soma localization sequence can be shown to remove the 'axonal spiking' (as described in line 441), this would be a significant addition to the paper.

      Our previous study (Messier et al., 2018, doi: 10.7554/eLife.38506) showed that a soma localization sequence can reduce, but not eliminate, the axonal spiking. We plan to test these new ACRs with the trafficking motifs in the future.

      NICCR appears to have the best photocurrents of all tested opsins in this paper. It seems odd that it was omitted from the mouse cortical neurons experiments.

      We have not included analysis of NlCCR behavior in neurons because we are preparing a separate manuscript on this ChR.

      Figure 6 would benefit from more gradation in the light powers used to silence and would benefit from comparison to GtACR. I suggest using a fixed current with a series of illumination intensities to see which of the three opsins (or GtACR) is most effective at silencing. At present, it looks binary, and a user cannot evaluate if any of these opsins would be better than what is already available.

      In the revision, we added the data comparing the light sensitivity of AnsACR and FtACR with previously identified GtACR1 and GtACR2 (new Figure 1E and F) to help users compare these ACRs. Although they are less sensitive to light comparing to GtACR1 and GtACR2, they could still be activated by commercially available light sources if the expression levels are similar. Less sensitive ACRs may have less unwanted activation when using with other optogenetic tools.

      Reviewer #3 (Recommendations for the authors):

      Suggested Improvements to Experiments, Data, or Analyses:

      (1) Line 25: "significantly exceeding those by previously known tools" and Line 408: "NlCCR is the most blue-shifted among ancyromonad ChRs and generates larger photocurrents than the earlier known CCRs with a similar absorption maximum." As noted in the public review, this statement applies only to a very specific subgroup of ChRs with spectral maxima below 450 nm. If the goal was to claim that NlCCR is a superior tool among a broader range of blue-light-activated ChRs, direct comparisons with state-of-the-art ChRs such as ChR2 T159C (Berndt et al., 2011), CatCh (Kleinlogel et al., 2014), CoChR (Klapoetke et al., 2014), CoChR-3M (Ganjawala et al., 2019), or XXM 2.0 (Ding et al., 2022) would be beneficial. If the goal was to demonstrate superiority among tools with spectra below 450 nm, I suggest explicitly stating this in the paper.

      The Reviewer correctly inferred that we emphasized the superiority of NlCCR among tools with similar spectral maxima, not all blue-light-activated ChRs available for neuronal photoexcitation, most of which exhibit absorption maxima at longer wavelengths. To clarify this, we added “with similar spectral maxima” to the sentence in the original Line 25. The sentence in Line 408 already contains this clarification: “with a similar absorption maximum”.

      (2) Lines 111-113: "The absorption spectra of the purified proteins were slightly blue-shifted from the respective photocurrent action spectra (Figure 1D), likely due to the presence of non-electrogenic cis-retinal-bound forms." I would be skeptical of this statement. The spectral shifts in NlCCR and AnsACR are small and may fall within the range of experimental error. The shift in FtACR is more apparent; however, if two forms coexist in purified protein, this should be reflected as two Gaussian peaks in the absorption spectrum (or at least as a broader total peak reflecting two states with close maxima and similar populations). On the contrary, the action spectrum appears to have two peaks, one potentially below 465 nm. Generally, neither spectrum appears significantly broader than a typical microbial rhodopsin spectrum. This question could be clarified by quantifying the widths of the absorption and action spectra or by overlaying them on the same axis. In my opinion, the two spectra seem very similar, and just appearance of the "bump" in the action spectum shifts the apparent maximum of the action spectrum to the red. If there were two states, then they should both be electrogenic, and the slight difference in spectra might be explained by something else (e.g. by a slight difference in the quantum yields of the two states).

      As the Reviewer suggested, in the revision we added a new figure (Figure 1 – figure supplement 2), showing the overlay of the absorption and action spectra of each ancyromonad ChR. This figure shows that the absorption spectra are wider than the action spectra (especially in AnsACR and FtACR), which confirms our interpretation (contribution of the non-electrogenic blue-shifted cis-retinal-bound forms to the absorption spectrum). Note that the presence of such forms explaining a blue shift of the absorption spectrum has been experimentally verified in HcKCR1 (doi: 10.1016/j.cell.2023.08.009; 10.1038/s41467-025-56491-9). Therefore, we revised the text as follows:

      “The absorption spectra of the purified proteins (Figure 1C) were slightly blue-shifted from the respective photocurrent action spectra (Figure 1 – figure supplement 3), likely due to the presence of non-electrogenic cis-retinal-bound forms. The presence of such forms, explaining the discrepancy between the absorption and the action spectra, was verified by HPLC in KCRs (Tajima et al. 2023, Morizumi et al., 2025).”

      (3) Lines 135-136: "The SyncroPatch enables unbiased estimation of the photocurrent amplitude because the cells are drawn into the wells without considering their tag fluorescence." While SyncroPatch does allow unbiased selection of patched cells, it does not account for the fraction of transfected cells. Without a method to exclude non-transfected cells, which are always present in transient transfections, the comparison of photocurrents may be affected by the proportion of untransfected cells, which could vary between constructs. To clarify whether the statistically significant difference in the Kolmogorov-Smirnov test could indicate that the fraction of transfected cells after 48-72h differs between constructs, I suggest analyzing only transfected cells or reporting fractions of transfected cells by each construct.

      The Reviewer correctly states that non-transfected cells are always present in transiently transfected cell populations. However, his/her suggestion to “exclude non-transfected cells” is not feasible in the absence of a criterion for such exclusion. As it is evident from our data, transient transfection results in a continuum of the amplitude values, and it is not possible to distinguish a small photocurrent from no photocurrent, considering the noise level. We would like, however, to emphasize that not excluding any cells provides an estimate of the overall potency of each ChR variant, which depends on both the fraction of transfected cells and their photocurrents. This approach mimics the conditions of in vivo experiments, when non-expressing cells also cannot be excluded.

      (4) Line 176: "AnsACR and FtACR photocurrents exhibited biphasic rise." The fastest characteristic time is very close to the typical resolution of a patch-clamp experiment (RC = 50 μs for a 10 pF cell with a 5 MΩ series resistance). Thus, I am skeptical that the faster time constant of the biphasic opening represents a protein-specific characteristic time. It may not be fully resolved by patch-clamp and could simply result from low-pass filtering of a specific cell. I suggest clarifying this for the reader.

      The Reviewer is right that the patch clamp setup acts as a lowpass filter. Earlier, we directly measured its time resolution (~15 μs) by recording the ultrafast (occurring on the ps time scale) charge movements related to the trans-cis isomerization (doi: 10.1111/php.12558). However, the lowpass filter of the setup can only slow the entire signal, but cannot lead to the appearance of a separate kinetic component (i.e. a monophasic process cannot become biphasic). Therefore, we believe that the biphasic photocurrent rise reflects biphasic channel opening rather than a measurement artifact. Two phases in the channel opening have also been detected in GtACR1 (doi: 10.1073/pnas.1513602112) and CrChR2 (10.1073/pnas.1818707116).

      (5) Line 516: "The forward LED current was 900 mA." It would be more informative to report the light intensity rather than the forward current, as many readers may not be familiar with the specific light output of the used LED modules at this forward current.

      We have added the light intensity value in the revision:

      “The forward LED current was 900 mA (which corresponded to the irradiance of ~2 mW mm<sup>-2</sup>)…”

      (6) Lines 402-403: "The NlCCR ... contains a neutral residue in the counterion position (Asp85 in BR), which is typical of all ACRs. Yet, NlCCR does not conduct anions, instead showing permeability to Na+." This is not atypical for CCRs and has been demonstrated in previous works of the authors (CtCCR in Govorunova et al. 2021, ChvCCR1 in Govorunova et al. 2022). What is unique is the absence of negatively charged residues in TM2, as noted later in the current study. However, the absence of negatively charged residues in TM2 appears to be rare for ACRs as well. Not as a strong point of criticism, but to enhance clarity, I suggest analyzing the frequency of carboxylate residues in TM2 of ACRs to determine whether the unique finding is relevant to ion selectivity or to another property.

      The Reviewer is correct that some CCRs lack a carboxylate residue in the D85 position, so this feature alone cannot be considered as a differentiating criterion. However, the complete absence of glutamates in TM2 is not rare in ACRs and is found, for example, in HfACR1 and CarACR2. We have discussed this issue in our earlier review (doi: 10.3389/fncel.2021.800313) and do not think that repeating this discussion in this manuscript is appropriate.

      Recommendations for Writing and Presentation:

      (1) Some figures contain incomplete or missing labels:

      Figure 2: Panels D to I lack labels.

      In the revision, we have expanded the legend of Figure 2 to explain all individual panels.

      Figure 3 - Figure Supplement 1: Missing explanations for each panel.

      In the revision, we changed the order of panes and explained all individual panels in the legend.

      Figure 5 - Figure Supplement 1: Missing explanations for each panel.

      No further explanation for individual panels in this Figure is needed because all panels show the action spectra of various mutants, the names of which are provided in the panels themselves. Repeating this information in the figure legend would be redundant.

      (2) In Figure 2, "sem" is written in lowercase, whereas "SEM" is capitalized in other figures. Standardizing the format would improve consistency.

      In the revision, we changed the font of the SEM abbreviation to the uppercase in all instances.

      (3) Line 20: "spectrally separated molecules must be found in nature." There is no proof that they cannot be developed synthetically; rather, it is just difficult. I suggest softening this statement, as the findings of this study, together with others, will probably allow designing molecules with specified spectral properties in the future.

      In the revision, we changed the cited sentence to the following:

      “Multiplex optogenetic applications require spectrally separated molecules, which are difficult to engineer without disrupting channel function”.

      (4) Line 216-219: "Acidification increased the amplitude of the fast current ~10-fold (Figure 4F) and shifted its Vr ~100 mV (Figure 3 - figure supplement 1D), as expected of passive proton transport. The number of charges transferred during the fast peak current was >2,000 times smaller than during the channel opening, from which we concluded that the fast current reflects the movement of the RSB proton." The claim about passive transport of the RSB proton should be clarified, as typically, passive transport is not limited to exactly one proton per photocycle, and the authors observe the increase in the fast photocurrents upon acidification.

      We thank the Reviewer for pointing out the confusing character of our description. To clarify the matter, we added a new photocurrent trace to Figure 4I in the revision recorded from AnsACR_G86E at 0 mV and pH 7.4. We have rewritten the corresponding section of Results as follows:

      “Its rise and decay τ corresponded to the rise and decay τ of the fast positive current recorded from AnsACR_G86E at 0 mV and neutral pH, superimposed on the fast negative current reflecting the chromophore isomerization (Figure 4I, upper black trace). We interpret this positive current as an intramolecular proton transfer to the mutagenetically introduced primary acceptor (Glu86), which was suppressed by negative voltage (Figure 4I, lower black trace). Acidification increased the amplitude of the fast negative current ~10-fold (Figure 4I, black arrow) and shifted its V<sub>r</sub> ~100 mV to more depolarized values (Figure 4 – figure supplement 2A). This can be explained by passive inward movement of the RSB proton along the large electrochemical gradient.”

      Minor Corrections:

      (1) Line 204: Missing bracket in "phases in the WT (Figure 4D."

      The quoted sentence was deleted during the revision.

      (2) Line 288: Typo-"This Ala is conserved" should probably be "This Met is conserved."

      We mean here the Ala four residues downstream from the first Ala. To avoid confusion, we changed the cited sentence to the following:

      “The Ala corresponding to BR’s Gly122 is also found in AnsACR and NlCCR (Figure 5A)…”

      (3) Lines 702-704: Missing Addgene plasmid IDs in "(plasmids #XXX and #YYY, respectively)."

      In the revision, we added the missing plasmid IDs.

    1. eLife Assessment:

      In this revised version, the authors provide a thorough investigation of the interaction of megakaryocytes (MK) with their associated extracellular matrix (ECM) during maturation; they provide compelling evidence that the existence of a dense cage-like pericellular structure containing laminin γ1 and α4 and collagen IV is key to fixing the perisinusoidal localization of MK and preventing their premature intravasation. Adhesion of MK to this ECM cage is dependent on integrin beta1 and beta3 expressed by MK. This strong conclusion is based on the use of state-of-the art techniques such f primary murine bone marrow MK cultures, mice lacking ECM receptors, namely integrin beta1 and beta3 null mice, as well as high-resolution 2D and 3D imaging. The study provides valuable insight into the role of cell-matrix interactions in MK maturation and provides an interesting model with practical implications for the fields of hemostasis and thrombosis.

    2. Reviewer #1 (Public review):

      The authors report on a thorough investigation of the interaction of megakaryocytes (MK) with their associated ECM during maturation. They report convincing evidence to support the existence of a dense cage-like pericellular structure containing laminin γ1 and α4 and collagen IV, which interacts with integrins β1 and β3 on MK and serve to fix the perisinusoidal localization of MK and prevent their premature intravasation. As with everything in nature, the authors support a Goldilocks range of MK-ECM interactions - inability to digest the ECM via inhibition of MMPs leads to insufficient MK maturation and development of smaller MK. This important work sheds light into the role of cell-matrix interactions in MK maturation, and suggests that higher-dimensional analyses are necessary to capture the full scope of cellular biology in the context of their microenvironment. The authors have responded appropriately to the majority of my previous comments.

    3. Reviewer #2 (Public review):

      Summary:

      This study makes a significant contribution to understanding the microenvironment of megakaryocytes (MKs) in the bone marrow, identifying an extracellular matrix (ECM) cage structure that influences MK localization and maturation. The authors provide compelling evidence for the presence of this ECM cage and its role in MK homeostasis, employing an array of sophisticated imaging techniques and molecular analyses.

      The authors have addressed most of the concerns raised in the previous review, providing clarifications and additional data that strengthen their conclusions

      More broadly, this work adds to a growing recognition of the ECM as an active participant in haematopoietic cell regulation in the bone marrow microenvironment. This work could pave the way to future studies investigating how the megakaryocytes' ECM cage affects their function as part of the haematopoietic stem cell niche, and by extension, influences global haematopoiesis.

    4. Author response:

      The following is the authors’ response to the previous reviews.

      Minor Issues:

      (1) As the authors mention, MKs have been suggested to mature rapidly at the sinusoids, and both integrin KO and laminin KO MKs appear mislocalized away from the sinusoids. Additionally, average MK distances from the sinusoid may also help separate whether the maturation defects could be in part due to impaired migration towards CXCL12 at the sinusoid. Presumably, MKs could appear mislocalized away from the sinusoid given the data presented suggesting they are leaving the BM and entering circulation. Additional commentary on intrinsic (ex-vivo) MK maturation phenotypes may help strengthen the author's conclusions

      Thank you for your insightful suggestion regarding intrinsic MK maturation defects in integrin KO and laminin KO mice. This indeed could be the case. We have now addressed this possibility in the revised discussion section (page 14; lines 14-15), acknowledging intrinsic maturation defects as a potential contributor to observed maturation issues.

      (2) It would be helpful if the authors could comment as to whether MKs are detectable in blood.

      We appreciate the opportunity to clarify this point. Intact Itgb1<sup>-/-</sup>/Itgb3<sup>-/-</sup> MKs were not detected in the peripheral blood by either flow cytometry or blood smear analysis. This indicates that megakaryocytes do not normally circulate in the systemic bloodstream. Instead, we observed large MK nuclei trapped specifically within the lung capillaries, consistent with their known physical retention in the pulmonary circulation during platelet release. This explanation is now better explained on page 10, lines 14-19.

      (3) Supplementary Figure 6 - shows no effect on in vitro MK maturation and proplt, or MK area - But Figures 6B/6C demonstrate an increase in total MK number in MMP-inhibitor treated mice compared to control. This discrepancy should be better discussed.

      We have now expanded the discussion in the revised manuscript to address the different results obtained in vitro and in vivo, emphazing that the in vitro model may not fully recapitulate the complex and dynamic bone marrow ECM niche. Additionally, differences in the source and regulation of MMPs likely contribute to the differing outcomes, underlining the importance of studying these processes within their physiological context. For instance, non-megakaryocytic sources of MMPs and paracrine regulatory mechanisms may play a critical role within the physiological microenvironment, ultimately affecting MK proliferation and maturation in a manner not observed in simplified culture systems. This clarifications can be found on page 12, lines 6-17.

      (4) A function of the ECM discussed relates to MK maturation but in the B1/3 integrin KO mice, the presence of the ECM cage is reduced but there appears to be no significant impact upon maturation (Supplementary Figure 4). By contrast, MMP inhibition in vivo (but not in vitro) reduces MK maturation. These data could be better clarified in the text.

      Thank you for raising this important point. While Suppl. Figure 4 shows normal size and ploidy in DKO MK, a critical defect is revealed at the ultrastructural level. Mature DKO MKs exhibit severe dysplasia of the demarcation membrane system (DMS), characterized by extensive membrane accumulation and abnormal archirecture, with no typical platelet territories visible. This DMS defect directly impairs MK maturation and explains the thrombocytopenia observed in these mice. Increased emperipolesis further indicated disrupted maturation processes. These observations confirm the essential role of the ECM cage in supporting proper DMS organization and overall MK maturation in vivo, consistent with findings from MMP inhibition experiments. We have clarified and emphasized the significance of these DMS abnormalities in the revised manuscripts, including updated results (Page 9, lines 17-21) and a new EM image in Suppl. Figure 4.

      Reviewer #1 (Public review):

      The authors report on a thorough investigation of the interaction of megakaryocytes (MK) with their associated ECM during maturation. They report convincing evidence to support the existence of a dense cage-like pericellular structure containing laminin γ1 and α4 and collagen IV, which interacts with integrins β1 and β3 on MK and serve to fix the perisinusoidal localization of MK and prevent their premature intravasation. As with everything in nature, the authors support a Goldilocks range of MK-ECM interactions - inability to digest the ECM via inhibition of MMPs leads to insufficient MK maturation and development of smaller MK. This important work sheds light into the role of cell-matrix interactions in MK maturation, and suggests that higher-dimensional analyses are necessary to capture the full scope of cellular biology in the context of their microenvironment. The authors have responded appropriately to the majority of my previous comments.

      We sincerely thank the reviewer for their insightful comments.

      Some remaining points:

      In a previous critique, I had suggested that "it is unclear how activation of integrins allows the MK to become "architects for their ECM microenvironment" as the authors posit. A transcriptomic analysis of control and DKO MKs may help elucidate these effects". The authors pointed out the technical difficulty of obtained sufficient numbers of MK for such analysis, which I accept, and instead analyzed mature platelets, finding no difference between control and DKO platelets. This is not necessarily surprising, since mature circulating platelets have no need to engage an ECM microenvironment, and for the same reason I would suggest that mature platelet analyses are not representative of MK behavior as regards ECM interactions.

      We fully agree with the reviewer that platelet analyses do not accurately reflect the behavior of MKs in the context of interactions with the ECM. This understanding is also one of the reasons why we chose not to include RT-PCR data on platelets in our manuscript. Instead, we emphasize the role of integrins as essential regulators of ECM remodeling, as they transmit traction forces that can significantly influence this process. We also report reduced RhoA activation in DKO MK, which is likely to affect ECM organization. We believe that these explanations contribute to a clearer understanding of how integrin activation enables megakaryocytes to act as "architects" of their ECM microenvironment.

      Reviewer #2 (Public review):

      This study makes a significant contribution to understanding the microenvironment of megakaryocytes (MKs) in the bone marrow, identifying an extracellular matrix (ECM) cage structure that influences MK localization and maturation. The authors provide compelling evidence for the presence of this ECM cage and its role in MK homeostasis, employing an array of sophisticated imaging techniques and molecular analyses.The authors have addressed most of the concerns raised in the previous review, providing clarifications and additional data that strengthen their conclusion.

      More broadly, this work adds to a growing recognition of the ECM as an active participant in haematopoietic cell regulation in the bone marrow microenvironment. This work could pave the way to future studies investigating how the megakaryocytes' ECM cage affects their function as part of the haematopoietic stem cell niche, and by extension, influences global haematopoiesis.

      We thank this reviewer for providing such constructive feedback.

    1. eLife Assessment

      This paper is important in demonstrating a requirement for sulfation in organizing apical extracellular matrix (aECM) during tubulogenesis in Drosophila melanogaster. The authors identify and characterize the organization of some of the first known components of the non-chitinous aECM in the Drosophila salivary gland tube, and these findings are supported by convincing data. This study would be of interest to developmental and cell biologists.

      [Editors' note: this paper was reviewed by Review Commons.]

    2. Reviewer #1 (Public review):

      Summary:

      There is growing appreciation for the important of luminal (apical) ECM in tube development, but such matrices are much less well understood than basal ECMs. Here the authors provide insights into the aECM that shapes the Drosophila salivary gland (SG) tube and the importance of PAPSS-dependent sulfation in its organization and function.

      The first part of the paper focuses on careful phenotypic characterization of papss mutants, using multiple markers and TEM. This revealed reduced markers of sulfation and defects in both apical and basal ECM organization, Golgi (but not ER) morphology, number and localization of other endosomal compartments, plus increased cell death. The authors focus on the fact that papss mutants have an irregular SG lumen diameter, with both narrowed regions and bulged regions. They address the pleiotropy, showing that preventing the cell death and resultant gaps in the tube did not rescue the SG luminal shape defects and discussing similarities and differences between the papss mutant phenotype and those caused by more general trafficking defects. The analysis uses a papss nonsense mutant from an EMS screen - I appreciate the rigorous approach the authors took to analyze transheterozygotes (as well as homozygotes) plus rescued animals in order to rule out effects of linked mutations. Importantly, the rescue experiments also demonstrated that sulfation enzymatic activity is important.

      The 2nd part of the paper focuses on the SG aECM, showing that Dpy and Pio ZP protein fusions localize abnormally in papss mutants and that these ZP mutants (and Np protease mutants) have similar SG lumen shaping defects to the papss mutants. A key conclusion is that SG lumen defects correlate with loss of a Pio+Dpy-dependent filamentous structure in the lumen. These data suggest that ZP protein misregulation could explain this part of the papss phenotype.

      Overall, the text is very well written and clear. Figures are clearly labeled. The methods involve rigorous genetic approaches, microscopy, and quantifications/statistics and are documented appropriately. The findings are convincing.

      Significance:

      This study will be of interest to researchers studying developmental morphogenesis in general and specifically tube biology or the aECM. It should be particularly of interest to those studying sulfation or ZP proteins (which are broadly present in aECMs across organisms, including humans).

      This study adds to the literature demonstrating the importance of luminal matrix in shaping tubular organs and greatly advances understanding of the luminal matrix in the Drosophila salivary gland, an important model of tubular organ development and one that has key matrix differences (such as no chitin) compared to other highly studied Drosophila tubes like the trachea.

      The detailed description of the defects resulting from papss loss suggests that there are multiple different sulfated targets, with a subset specifically relevant to aECM biology. A limitation is that specific sulfated substrates are not identified here (e.g. are these the ZP proteins themselves or other matrix glycoproteins or lipids?); therefore, it's not clear how direct or indirect the effects of papss are on ZP proteins. However, this is clearly a direction for future work and does not detract from the excellent beginning made here.

    3. Reviewer #2 (Public review):

      Summary

      This study provides new insights into organ morphogenesis using the Drosophila salivary gland (SG) as a model. The authors identify a requirement for sulfation in regulating lumen expansion, which correlates with several effects at the cellular level, including regulation of intracellular trafficking and the organization of Golgi, the aECM and the apical membrane. In addition, the authors show that the ZP proteins Dumpy (Dpy) and Pio form an aECM regulating lumen expansion. Previous reports already pointed to a role for Papss in sulfation in SG and the presence of Dpy and Pio in the SG. Now this work extends these previous analyses and provides more detailed descriptions that may be relevant to the fields of morphogenesis and cell biology (with particular focus on ECM research and tubulogenesis). This study nicely presents valuable information regarding the requirements of sulfation and the aECM in SG development.

      Strengths:

      - The results supporting a role for sulfation in SG development are strong. In addition, the results supporting the involvement of Dpy and Pio in the aECM of the SG, their role in lumen expansion, and their interactions, are also strong.

      - The authors have made an excellent job in revising and clarifying the many different issues raised by the reviewers, particularly with the addition of new experiments and quantifications. I consider that the manuscript has improved considerably.

      - The authors generated a catalytically inactive Papss enzyme, which is not able to rescue the defects in Papss mutants, in contrast to wild type Papss. This result clearly indicates that the sulfation activity of Papss is required for SG development.

    4. Author response:

      The following is the authors’ response to the original reviews

      Reviewer #1 (Public review):

      Summary:

      There is growing appreciation for the important of luminal (apical) ECM in tube development, but such matrices are much less well understood than basal ECMs. Here the authors provide insights into the aECM that shapes the Drosophila salivary gland (SG) tube and the importance of PAPSS-dependent sulfation in its organization and function.

      The first part of the paper focuses on careful phenotypic characterization of papss mutants, using multiple markers and TEM. This revealed reduced markers of sulfation and defects in both apical and basal ECM organization, Golgi (but not ER) morphology, number and localization of other endosomal compartments, plus increased cell death. The authors focus on the fact that papss mutants have an irregular SG lumen diameter, with both narrowed regions and bulged regions. They address the pleiotropy, showing that preventing the cell death and resultant gaps in the tube did not rescue the SG luminal shape defects and discussing similarities and differences between the papss mutant phenotype and those caused by more general trafficking defects. The analysis uses a papss nonsense mutant from an EMS screen - I appreciate the rigorous approach the authors took to analyze transheterozygotes (as well as homozygotes) plus rescued animals in order to rule out effects of linked mutations. Importantly, the rescue experiments also demonstrated that sulfation enzymatic activity is important.

      The 2nd part of the paper focuses on the SG aECM, showing that Dpy and Pio ZP protein fusions localize abnormally in papss mutants and that these ZP mutants (and Np protease mutants) have similar SG lumen shaping defects to the papss mutants. A key conclusion is that SG lumen defects correlate with loss of a Pio+Dpy-dependent filamentous structure in the lumen. These data suggest that ZP protein misregulation could explain this part of the papss phenotype.

      Overall, the text is very well written and clear. Figures are clearly labeled. The methods involve rigorous genetic approaches, microscopy, and quantifications/statistics and are documented appropriately. The findings are convincing.

      Significance:

      This study will be of interest to researchers studying developmental morphogenesis in general and specifically tube biology or the aECM. It should be particularly of interest to those studying sulfation or ZP proteins (which are broadly present in aECMs across organisms, including humans).

      This study adds to the literature demonstrating the importance of luminal matrix in shaping tubular organs and greatly advances understanding of the luminal matrix in the Drosophila salivary gland, an important model of tubular organ development and one that has key matrix differences (such as no chitin) compared to other highly studied Drosophila tubes like the trachea.

      The detailed description of the defects resulting from papss loss suggests that there are multiple different sulfated targets, with a subset specifically relevant to aECM biology. A limitation is that specific sulfated substrates are not identified here (e.g. are these the ZP proteins themselves or other matrix glycoproteins or lipids?); therefore, it's not clear how direct or indirect the effects of papss are on ZP proteins. However, this is clearly a direction for future work and does not detract from the excellent beginning made here.

      Comments on revised version:

      Overall, I am pleased with the authors' revisions in response to my original comments and those of the other reviewers

      Reviewer #2 (Public review):

      Summary

      This study provides new insights into organ morphogenesis using the Drosophila salivary gland (SG) as a model. The authors identify a requirement for sulfation in regulating lumen expansion, which correlates with several effects at the cellular level, including regulation of intracellular trafficking and the organization of Golgi, the aECM and the apical membrane. In addition, the authors show that the ZP proteins Dumpy (Dpy) and Pio form an aECM regulating lumen expansion. Previous reports already pointed to a role for Papss in sulfation in SG and the presence of Dpy and Pio in the SG. Now this work extends these previous analyses and provides more detailed descriptions that may be relevant to the fields of morphogenesis and cell biology (with particular focus on ECM research and tubulogenesis). This study nicely presents valuable information regarding the requirements of sulfation and the aECM in SG development.

      Strengths

      -The results supporting a role for sulfation in SG development are strong. In addition, the results supporting the involvement of Dpy and Pio in the aECM of the SG, their role in lumen expansion, and their interactions, are also strong.

      -The authors have made an excellent job in revising and clarifying the many different issues raised by the reviewers, particularly with the addition of new experiments and quantifications. I consider that the manuscript has improved considerably.

      -The authors generated a catalytically inactive Papss enzyme, which is not able to rescue the defects in Papss mutants, in contrast to wild type Papss. This result clearly indicates that the sulfation activity of Papss is required for SG development.

      Weaknesses

      -The main concern is the lack of clear connection between sulfation and the phenotypes observed at the cellular level, and, importantly, the lack of connection between sulfation and the Pio-Dpy matrix. Indeed, the mechanism/s by which sulfation affects lumen expansion are not elucidated and no targets of this modification are identified or investigated. A direct (or instructive) role for sulfation in aECM organization is not clearly supported by the results, and the connection between sulfation and Pio/Dpy roles seems correlative rather than causative. As it is presented, the mechanisms by which sulfation regulates SG lumen expansion remains elusive in this study.

      -In my opinion the authors overestimate their findings with several conclusions, as exemplified in the abstract:

      "In the absence of Papss, Pio is gradually lost in the aECM, while the Dpy-positive aECM structure is condensed and dissociates from the apical membrane, leading to a thin lumen. Mutations in dpy or pio, or in Notopleural, which encodes a matriptase that cleaves Pio to form the luminal Pio pool, result in a SG lumen with alternating bulges and constrictions, with the loss of pio leading to the loss of Dpy in the lumen. Our findings underscore the essential role of sulfation in organizing the aECM during tubular organ formation and highlight the mechanical support provided by ZP domain proteins in maintaining luminal diameter."

      The findings leading to conclude that sulfation organizes the aECM and that the absence of Papss leads to a thin lumen due to defects in Dpy/Pio are not strong. The authors certainly show that Papss is required for proper Pio and Dpy accumulation. They also show that Pio is required for Dpy accumulation, and that Pio and Dpy form an aECM required for lumen expansion. However, the absence of Pio and Dpy do not fully recapitulate Papss mutant defects (thin lumen). I wonder whether other hypothesis and models could account for the observed results. For instance, a role for Papss affecting secretion, in which case sulfation would have an indirect role in aECM organization. This study does not address the mechanical properties of Dpy in normal and mutant salivary glands.

      -Minor issues relate to the genotype/phenotype analysis. It is surprising that the authors detect only mild effects on sulfation in Papss mutants using an anti-sulfoTyr antibody, as Papss is the only Papss synthathase. Generating germ line clones (which is a feasible experiment) would have helped to prove that this minor effect is due to the contribution of maternal product. The loss of function allele used in this study seems problematic, as it produces effects in heterozygous conditions difficult to interpret. Cleaning the chromosome or using an alternative loss of function condition (another allele, RNAi, etc...) would have helped to present a more reliable explanation.

      Recommendations for the authors:

      Reviewer #1 (Recommendations for the authors):

      Overall, I am pleased with the authors' revisions in response to my original comments and those of the other reviewers. The addition of the sulfation(-) mutant to Fig. 1 is particularly nice. I have just a few additional suggestions for text changes to improve clarity/precision.

      (1) The current title of this manuscript is quite broad, making it sound like a review article. I recommend adding sulfation and salivary gland to the title to convey the main points more clearly. e.g. Sulfation affects apical extracellular matrix organization during development of the Drosophila salivary gland tube.

      Thank you for the suggestion. We agree and have changed the title of the paper as suggested.

      (2) Figure 1B shows very striking enrichment of papss expression in the salivary gland compared to other tubes like the trachea that also contain Pio and Dpy. To me, this implies that the key substrate(s) of Papss are likely to be unique, or at least more highly enriched, in the salivary gland aECM compared to the tracheal aECM (e.g. probably not Pio or Dpy themselves). I suggest that the authors address the implications of this apparent SG specificity in the discussion (paragraph beginning on p. 21, line 559).

      Yes, we agree that there may be other key substrates of Papss in the SG, such as mucins, which play an important role in organizing the aECM and expanding the lumen. We have included a discussion.

      (3) p. 15, lines 374-376 "The Pio protein is known to be cleaved, at one cleavage site after the ZP domain by the furin protease and at another cleavage site within the ZP domain by the matriptase Notopleural (Np) (Drees et al., 2019; Drees et al., 2023; Figure 5B)." As far as I can see, the Drees papers show that Pio is cleaved somewhere in the vicinity of a consensus furin cleavage site, but do not actually establish that the cleavage happens at this exact site or is done by a furin protease (this is just an assumption). Please word more carefully, e.g. "at one cleavage site after the ZP domain, possibly by a furin protease".

      Thank you for pointing this out. We have edited the text.

      Reviewer #2 (Recommendations for the authors):

      Throughout the paper, I find a bit confusing the description of the lumen phenotype and their interpretations.

      Papss mutants produce SG that are either "thin" or show "irregular lumen with bulges". Do the authors think that these are two different manifestations of the same effect? or do they think that there are different causes behind?

      The thin lumen phenotype appears to occur when the Pio-Dpy matrix is significantly condensed. When this matrix is less condensed in one region of the lumen than in other regions, the lumen appears irregular with bulges.

      Are the defects in Grasp65 mutants categorized as "irregular lumen with bulges" similar to those in Papss mutants? Why do these mutants don't show a "thin lumen" defect?

      Grasp65 mutant phenotypes are milder than those of Papss mutants. Multiple mutations in several Golgi components that more significantly disrupt Golgi structures and function may cause more severe defects in lumen expansion and shape.

      How the defects described for Pio ("multiple constrictions with a slight expansion between constrictions") and Dpy mutants ("lumen with multiple bulges and constrictions") relate to the "irregular lumen with bulges" in Papss mutants?

      pio and dpy mutants show more stereotypical phenotypes, while Papss mutants exhibit more irregular and random phenotypes. The irregular lumen phenotypes in Papss mutants are associated with a condensed Pio-Dpy matrix.

    1. eLife Assessment

      This valuable study concerns a highly interesting and biologically relevant topic, the regulation of the PIN auxin transporter, which is of broad interest to the plant biology community. The authors propose NPY1 to act downstream of PID in auxin-mediated development by modulating PIN phosphorylation, which, if experimentally solidified, would expand our understanding of PIN regulation. While the genetic evidence is solid, the mechanistic role of NPY1 and the functional relevance of phosphorylated PIN residues are still uncertain. There are also concerns regarding experimental rigor and methodological transparency.

    2. Reviewer #1 (Public review):

      Summary:

      The authors of this study propose a model in which NPY family regulators antagonize the activity of the pid mutation in the context of floral development and other auxin-related phenotypes. This is hypothesized to occur through regulation of or by PID and its action on the PIN1 auxin transporter.

      Strengths:

      The findings are intriguing.

      Weaknesses and Major Comments:

      (1) While the findings are indeed intriguing, the mechanism of action and interaction among these components remains poorly understood. The study would benefit from significantly more thorough and focused experimental analyses to truly advance our understanding of pid phenotypes and the interplay among PID, NPYs, and PIN1.

      (2) The manuscript appears hastily assembled, with key methodological and conceptual details either missing or inconsistent. Although issues with figure formatting and clarity (e.g., lack of scale bars and inconsistent panel layout) may alone warrant revision, the content remains the central concern and must take precedence over presentation.

      (3) Given that fertile progeny are obtained from pid-TD pin1/PIN1 and pid NPY OE lines, it would be important to analyze whether mutations and associated phenotypes are heritable. This is especially relevant since CRISPR lines can be mosaic. Comprehensive genotyping and inheritance studies are required.

      (4) The Materials and Methods section lacks essential information on how the lines were generated, genotyped, propagated, and scored. There is also generally no mention of how reproducible the observations were. These genetic experiments need to be described in detail, including the number of lines analyzed and consistency across replicates.

      (5) The nature of the pid alleles used in the study is not described. This is essential for interpretation.

      (6) The authors measure PIN1 phosphorylation in response to NPY overexpression and conclude that the newly identified phosphorylation sites are inhibitory because they do not overlap with known activating sites. This conclusion is speculative without functional validation. Functional assays are available and must be included to substantiate this claim.

      (7) Figure 5 implies that NPY1 acts downstream of PID, but there is no biochemical evidence supporting this hierarchy. Additional experiments are needed to demonstrate the epistatic or regulatory relationship.

      (8) The authors should align their genetic observations with cell biological data on PIN1, PIN2, and PID localization and distribution.

    3. Reviewer #2 (Public review):

      Summary:

      The study is well-conducted, revealing that NPY1, with previously less-characterized molecular functions, can suppress pid mutant phenotypes with a phosphorylation-based mechanism. Overexpression of NPY1 (NPY1-OE) results in PIN phosphorylation at unique sites and bypasses the requirement for PID for this event. Conversely, a C-terminal deleted form of NPY1 (NPY1-dC) fails to rescue pid despite promoting a certain phospho-profile in PIN proteins.

      Strengths:

      (1) The careful genetic analyses of pid suppression by NPY1-OE and the inability of NPY1dC to do the same.

      (2) Phospho-proteomics approaches reveal that NPY1-OE induces phosphorylation of PINs at non-canonical sites, independent of PID.

      Weaknesses:

      (1) The native role of NPY1 is not tested by phospho-proteomics in loss-of-function npy1 mutants. Such analysis would be crucial to demonstrate that NPY1 is required for the observed phosphorylation events.

      (2) The functional consequences of the newly identified phosphorylation sites in PINs remain speculative. Site-directed mutagenesis (phospho-defective and phospho-mimetic) would help clarify their physiological roles.

      (3) The kinase responsible for NPY1-mediated phosphorylation remains unidentified. Since NPY1 is a non-kinase protein, a model involving recruitment of partner kinases (e.g., PIN-phosphorylating kinases other than PID) should be considered or discussed.

    4. Reviewer #3 (Public review):

      Summary:

      This manuscript from Mudgett et al. explores the relative roles of PID and NPY1 in auxin-dependent floral initiation in Arabidopsis. Micro vectorial auxin flows directed by PIN1 are essential to flower initiation, and loss of PIN1 or two of its regulators, PID and NPY1 (in a yucca-deficient background) phenocopies the pinformed phenotype. This group has previously shown that PID-PIN1 interactions and function are dosage-dependent. The authors pick up this thread by demonstrating that a heterozygote containing a CRISPR deletion of one copy of PIN1 can restore quasi-wild type floral initiation to pid.

      The authors then show that overexpression of NPY1 is sufficient to more or less restore wild-type floral initiation to the pid mutant. The authors claim that this result demonstrates that NPY1 functions downstream of PID, as this ectopic abundance of NPY1 resulted in phosphorylation of PIN1 at sites that differ from sites of action of PID. The authors pursue evidence that PID action via NPY1 is analogous to the mode of action by which phot1/2 act on NPH3 in seedling phototropism. Such a model is supported by the evidence presented herein that the C terminus of NPY1, which has abundant Ser/Thr content, is phosphorylated, and that the deletion of this domain prevents overexpression compensation of the pinformed phenotype.<br /> While the results presented support evidence in the literature that PID acts on NPY1 to regulate PIN1 function, it is also possible that NPY1 overexpression results in limited expansion of phosphorylation targets observed with other AGC kinases. And if the phot model is any indication, there may be other PID targets that modulate PIN1-dependent floral initiation.

      However, overexpression of the NPY1 C-terminal deletion construct resulted in phosphorylation of both PIN1 and PIN2 and agravitropic root growth similar to what is observed in pin2 mutants. This suggests that direct PID phosphorylation of PINs and action via NPY1 can be distinguished by phosphorylation sites and by growth phenotypes.

      Strengths:

      A very important effort that places NPY1 downstream of PID in floral initiation.

      Weaknesses:

      As PID has been shown to act on sites that regulate PIN protein polarity as well as PIN protein function, it would be useful if the authors consider how their results would fit/not fit with a model where combinatorial function of NPY1 and PID regulate PIN1 in a manner similar to the way that PID appears to function combinatorially with D6PK on PIN3.

    5. Author response:

      Reviewer #1 (Public review):

      Summary:

      The authors of this study propose a model in which NPY family regulators antagonize the activity of the pid mutation in the context of floral development and other auxin-related phenotypes. This is hypothesized to occur through regulation of or by PID and its action on the PIN1 auxin transporter.

      Strengths:

      The findings are intriguing.

      We are pleased that the reviewer found the work interesting!

      Weaknesses and Major Comments:

      (1) While the findings are indeed intriguing, the mechanism of action and interaction among these components remains poorly understood. The study would benefit from significantly more thorough and focused experimental analyses to truly advance our understanding of pid phenotypes and the interplay among PID, NPYs, and PIN1.

      Elucidating the mechanism of action and interaction among these components will require years of additional research. As key steps toward these goals, our work clearly established that 1) NPY1 functions downstream of PID, as overexpression of NPY1 completely suppressed pid phenotypes. This is surprising because the predominant model is that PID functions by directly phosphorylating and activating PINs without the need of NPY1 involvement.  2) In the absence of PID, NPY1 protein accumulated less in the NPY1 OE lines, suggesting that PID plays a role in affecting NPY1 stability/degradation/accumulation. We are not sure what are the exact experiments this reviewer is proposing.

      Regarding pid phenotypes, pid is completely sterile in our conditions, while the suppression by NPY1 OE is very clear and the lines are fertile.

      (2) The manuscript appears hastily assembled, with key methodological and conceptual details either missing or inconsistent. Although issues with figure formatting and clarity (e.g., lack of scale bars and inconsistent panel layout) may alone warrant revision, the content remains the central concern and must take precedence over presentation.

      We did not include scale bars in our figures because the phenotype of interest is presence/absence of flowers. Readers should compare the mutants with the rescued plants and the WT plants.

      (3) Given that fertile progeny are obtained from pid-TD pin1/PIN1 and pid NPY OE lines, it would be important to analyze whether mutations and associated phenotypes are heritable. This is especially relevant since CRISPR lines can be mosaic. Comprehensive genotyping and inheritance studies are required.

      We only use stable, heritable, Cas9-free mutants in our studies.  We genotype our mutants in every generation.  More details have been added to the Materials and Methods section. We provide the genetic materials we use to the scientific community when requested to enable verification and extension of our results. 

      (4) The Materials and Methods section lacks essential information on how the lines were generated, genotyped, propagated, and scored. There is also generally no mention of how reproducible the observations were. These genetic experiments need to be described in detail, including the number of lines analyzed and consistency across replicates.

      More details have been added to the Materials and Methods section

      The criticism is not fully accurate. For example, we stated in the main text: “We genotyped T2 progenies from two pid-c1 heterozygous T1 plants (#68 and # 83) for the presence of pid-c1 and for pid-c1 zygosity. We used mCherry signal, which was included in the NPY1 OE construct, as a proxy to determine the presence and absence of the NPY1 transgene. For each line, we identified T2 plants without the NPY1 transgene and without the pid-c1 mutation (called WT-68 and WT-83, respectively). We also isolated T2 plants that contained the NPY1 overexpression construct, but did not have the pid-c1 mutation (called NPY1 OE #68 in WT, and NPY1 OE #83 in WT). Finally, we identified T2 plants that were pid-c1 homozygous and that had the NPY1 transgene (called NPY1 OE #68 in pid-c1 and NPY1 OE #83 in pid-c1). These genetic materials enabled us to compare the same NPY1 OE transgenic event in different genetic backgrounds.”

      The genetic materials used are freely available to the scientific community.  We would like to point out that we used several pin1 and pid alleles to make sure that the phenotypes are caused by the genes of interest.

      (5) The nature of the pid alleles used in the study is not described. This is essential for interpretation.

      The mutants were described in a previous paper (M. Mudgett, Z. Shen, X. Dai, S.P. Briggs, & Y. Zhao, Suppression of pinoid mutant phenotypes by mutations in PIN-FORMED 1 and PIN1-GFP fusion, Proc. Natl. Acad. Sci. U.S.A. 120 (48) e2312918120, https://doi.org/10.1073/pnas.2312918120 (2023).  We have added the relevant information to Materials and Methods.

      (6) The authors measure PIN1 phosphorylation in response to NPY overexpression and conclude that the newly identified phosphorylation sites are inhibitory because they do not overlap with known activating sites. This conclusion is speculative without functional validation. Functional assays are available and must be included to substantiate this claim.

      We concluded that the phosphorylation of PINs in NPY1 OE is inhibitory on the basis of the following: 1) pid is suppressed in pin1 heterozygous backgrounds and by PIN1-GFP<sub>HDR,</sub> demonstrating that partial loss of function of PIN1 or a decrease in PIN1 gene dosage, which decreases PIN1 protein expression, caused the suppression of pid. 2) pid is completely suppressed by NPY1 OE, which caused an increase of PIN phosphorylation, suggesting that phosphorylation of PINs in NPY1 OE lines is inhibitory.  It is true that we do not have biochemical data to support the conclusion. We would like to point out that the phosphorylation sites in PINs identified in this work do overlap with previously identified sites.

      PIN activity assays are conducted in heterologous systems that do not include NPY proteins. Since NPY is important for PIN activities, we believe that these assays may provide misleading results. Moreover, PIN1 is likely part of a large protein complex.  Without knowing the composition of the complex, functional assays in heterologous systems will not be interpretable.

      (7) Figure 5 implies that NPY1 acts downstream of PID, but there is no biochemical evidence supporting this hierarchy. Additional experiments are needed to demonstrate the epistatic or regulatory relationship.

      We show that overexpression of NPY1 completely suppressed the pid phenotype, and this epistatic relationship indicates that NPY1 functions downstream of PID. Moreover, we report that PID is required for NPY1 accumulation, indicating that PID is upstream of NPY1.

      (8) The authors should align their genetic observations with cell biological data on PIN1, PIN2, and PID localization and distribution.

      We are hesitating in using traditional PIN1-GFP, PIN2-GFP lines, as they are not stable in our hands. Localization of PID is still not clear. We have generated PID-GFP<sub>HDR</sub> lines, but we could not detect any fluorescent signals (unpublished results).  In addition, maize PINOID (BIF2) localizes to the nucleus, cytoplasm and cell periphery (Skirpan, A., Wu, X. and McSteen, P. (2008), Genetic and physical interaction suggest that BARREN STALK1 is a target of BARREN INFLORESCENCE2 in maize inflorescence development. The Plant Journal, 55: 787-797. https://doi.org/10.1111/j.1365-313X.2008.03546.x)

      We would rather wait for the proper genetic materials before devoting our effort to this.

      Reviewer #2 (Public review):

      Summary:

      The study is well-conducted, revealing that NPY1, with previously less-characterized molecular functions, can suppress pid mutant phenotypes with a phosphorylation-based mechanism. Overexpression of NPY1 (NPY1-OE) results in PIN phosphorylation at unique sites and bypasses the requirement for PID for this event. Conversely, a C-terminal deleted form of NPY1 (NPY1-dC) fails to rescue pid despite promoting a certain phospho-profile in PIN proteins.

      Strengths:

      (1) The careful genetic analyses of pid suppression by NPY1-OE and the inability of NPY1dC to do the same.

      (2) Phospho-proteomics approaches reveal that NPY1-OE induces phosphorylation of PINs at non-canonical sites, independent of PID.

      Thank you for having accurately summarized the main findings

      Weaknesses:

      (1) The native role of NPY1 is not tested by phospho-proteomics in loss-of-function npy1 mutants. Such analysis would be crucial to demonstrate that NPY1 is required for the observed phosphorylation events.

      This is an excellent point and we agree with the reviewer that analyzing loss-of-function npy mutants is important. The challenge is that we need to knockout NPY1, NPY3, and NPY5 to phenocopy pid. We will also need to find a way to suppress the npy triple mutants, which are sterile, so that we can have meaningful comparisons.

      (2) The functional consequences of the newly identified phosphorylation sites in PINs remain speculative. Site-directed mutagenesis (phospho-defective and phospho-mimetic) would help clarify their physiological roles.

      We agree with the reviewer on this point as well. However, this is not trivial, as we have uncovered so many phosphorylation sites.

      (3) The kinase responsible for NPY1-mediated phosphorylation remains unidentified. Since NPY1 is a non-kinase protein, a model involving recruitment of partner kinases (e.g., PIN-phosphorylating kinases other than PID) should be considered or discussed.

      we will add a sentence to mention D6PK and other kinases in the Discussion in the revised version.  We are hoping that the kinases will come out of future forward genetic screens.

      Reviewer #3 (Public review):

      Summary:

      This manuscript from Mudgett et al. explores the relative roles of PID and NPY1 in auxin-dependent floral initiation in Arabidopsis. Micro vectorial auxin flows directed by PIN1 are essential to flower initiation, and loss of PIN1 or two of its regulators, PID and NPY1 (in a yucca-deficient background) phenocopies the pinformed phenotype. This group has previously shown that PID-PIN1 interactions and function are dosage-dependent. The authors pick up this thread by demonstrating that a heterozygote containing a CRISPR deletion of one copy of PIN1 can restore quasi-wild type floral initiation to pid.

      The authors then show that overexpression of NPY1 is sufficient to more or less restore wild-type floral initiation to the pid mutant. The authors claim that this result demonstrates that NPY1 functions downstream of PID, as this ectopic abundance of NPY1 resulted in phosphorylation of PIN1 at sites that differ from sites of action of PID. The authors pursue evidence that PID action via NPY1 is analogous to the mode of action by which phot1/2 act on NPH3 in seedling phototropism. Such a model is supported by the evidence presented herein that the C terminus of NPY1, which has abundant Ser/Thr content, is phosphorylated, and that the deletion of this domain prevents overexpression compensation of the pinformed phenotype.

      While the results presented support evidence in the literature that PID acts on NPY1 to regulate PIN1 function, it is also possible that NPY1 overexpression results in limited expansion of phosphorylation targets observed with other AGC kinases. And if the phot model is any indication, there may be other PID targets that modulate PIN1-dependent floral initiation.

      However, overexpression of the NPY1 C-terminal deletion construct resulted in phosphorylation of both PIN1 and PIN2 and agravitropic root growth similar to what is observed in pin2 mutants. This suggests that direct PID phosphorylation of PINs and action via NPY1 can be distinguished by phosphorylation sites and by growth phenotypes.

      Strengths:

      A very important effort that places NPY1 downstream of PID in floral initiation.

      We thank the reviewer for the comments.

      Weaknesses:

      As PID has been shown to act on sites that regulate PIN protein polarity as well as PIN protein function, it would be useful if the authors consider how their results would fit/not fit with a model where combinatorial function of NPY1 and PID regulate PIN1 in a manner similar to the way that PID appears to function combinatorially with D6PK on PIN3

      We agree with the reviewer that we do not have a complete picture of how NPY, PID, PIN work together to control flower initiation. Some aspects of our results are difficult to reconcile with the model of PIN1 and PID acting in tandem, i.e., by PID directly phosphorylating and activating PIN1. Indeed, our results suggest that PIN1 and PID have opposite effects on organogenesis. For example, heterozygous pin1 (or PIN1-GFP<sub>HDR,</sub> which is presumably less active than wild type PIN1) suppresses the pid phenotype.  Moreover, pid and pin1 have opposite effects on cotyledon number and true leaf number. Mutations in PID lead to more cotyledons and more true leaves than WT whereas pin1 mutants make fewer cotyledons and fewer true leaves than WT (Bennett SRM, Alvarez J, Bossinger G, Smyth DR (1995) Morphogenesis in pinoid mutants of Arabidopsis thaliana. The Plant Journal 8: 505-520).  We have elaborated on this point in the last paragraph of the Discussion.

      The genetic materials we have generated may allow us to uncover additional components in the pathway from forward genetic screens, which may eventually lead to a clear picture.

    1. eLife Assessment

      This useful paper examined the mechanism of planar cell polarity (PCP) using Drosophila pupal wing, investigating how 'cellular level', 'molecular level' and 'tissue level' mechanisms intersect to establish PCP. This represents a progress for the field, and the conclusions are mostly backed up by solid data. Whereas the manuscript is sound overall, the reviewers found remaining concerns, which can mostly be addressed by textual clarification of the concepts used in the manuscript.

      [Editors' note: this paper was reviewed by Review Commons.]

    2. Reviewer #1 (Public review):

      The authors use inducible Fz::mKate2-sfGFP to explore "cell-scale signaling" in PCP. They reach several conclusions. First, they conclude that cell-scale signaling does not depend on limiting pools of core components (other than Fz). Second, they conclude that cell-scale signaling does not depend on microtubule orientation, and third, they conclude that cell-scale signaling is strong relative to cell to cell coupling of polarity.

      There are some interesting inferences that can be drawn from the manuscript, but there are also some significant challenges in interpreting the results and conclusions from the work as presented. I suggest that the authors 1) define "cell-scale signaling," as the precise meaning must be inferred, 2) reconsider some premises upon which some conclusions depend, 3) perform an essential assay validation, and 4) explain some other puzzling inconsistencies.

      Major concerns:

      The exact meaning of cell-scale signaling is not defined, but I infer that the authors use this term to describe how what happens on one side of a cell affects another side. The remainder of my critique depends on this understanding of the intended meaning.

      The authors state that any tissue wide directional information comes from pre-existing polarity and its modification by cell flow, such that the de novo signaling paradigm "bypasses" these events and should therefore not be responsive to any further global cues. It is my understanding that this is not a universally accepted model, and indeed, the authors' data seem to suggest otherwise. For example, the image in Fig 5B shows that de novo induction restores polarity orientation to a predominantly proximal to distal orientation. If no global cue is active, how is this orientation explained? The 6 hr condition, that has only partial polarity magnitude, is quite disordered. Do the patterns at 8 and 10 hrs become more proximally-distally oriented? It is stated that they all show swirls, but please provide adult wing images, and the corresponding orientation outputs from QuantifyPolarity to help validate the notion that the global cues are indeed bypassed by this paradigm.

      It is implicit that, in the de novo paradigm, polarization is initiated immediately or shortly after heat shock induction. However, the results should be differently interpreted if the level of available Fz protein does not rise rapidly and then stabilize before the 6 hr time point, and instead continues to rise throughout the experiment. Western blots of the Fz::mKate2-sfGFP at time points after induction should be performed to demonstrate steady state prior to measurements. Otherwise, polarity magnitude could simply reflect the total available pool of Fz at different times after induction. Interpreting stability is complex, and could depend on the same issue, as well as the amount of recycling that may occur. Prior work from this lab using FRAP suggested that turnover occurs, and could result from recycling as well as replenishment from newly synthesized protein.

      From the Fig 3 results, the authors claim that limiting pools of core proteins do not explain cell-scale signaling, a result expected based on the lack of phenotypes in heterozygotes, but of course they do not test the possibility that Fz is limiting. They do note that some other contributing protein could be.

      In Fig 3, it is unclear why the authors chose to test dsh1/+ rather than dsh[null]/+. In any case, the statistically significant effect of Dsh dose reduction is puzzling, and might indicate that the other interpretation is correct. Ideally, a range including larger and smaller reductions would be tested. As is, I don't think limiting Dsh is ruled out.

      The data in Fig 5 are somewhat internally inconsistent, and inconsistent with the authors' interpretation. In both repolarization conditions, the authors claim that repolarization extends only to row 1, and row 1 is statistically different from non-repolarized row 1, but so too is row 3. Row 2 is not. This makes no sense, and suggests either that the statistical tests are inappropriate and/or the data is too sparse to be meaningful. For the related boundary intensity data in Fig 6, the authors need to describe exactly how boundaries were chosen or excluded from the analysis. Ideally, all boundaries would be classified as either meido-lateral (meaning anterior-posterior) or proximal-distal depending on angle.

      If the authors believe their Fig 5 and 6 analyses, how do they explain that hairs are reoriented well beyond where the core proteins are not? This would be a dramatic finding, because as far as I know, when core proteins are polarized, prehair orientation always follows the core protein distribution. Surprisingly, the authors do not so much as comment about this. The authors should age their wings just a bit more to see whether the prehair pattern looks more like the adult hair pattern or like that predicted by their protein orientation results.

    3. Reviewer #2 (Public Review):

      This paper aims to dissect the relative importance of the various cues that establish PCP in the wing disc of Drosophila, which remains a prominent and relevant model for PCP. The authors suggest that one must consider cues at three scales (molecular, cell and tissue) and specifically design tests for the importance of cell-level cues, which they call non-local cell scale signalling. They develop clever experimental approaches that allow them to track complex stability and also to induce polarity at experimentally defined times. In a first set of experiments, they restore PCP after the global cues have disappeared (de novo polarisation) and conclude from the results that another (cell scale) cue must exist. In another set of experiments, they show that de novo repolarization is robust to the dosage of various components of core PCP, leading them to conclude that there must be an underlying cell scale polarity, which, apparently, has nothing to do with microtubule or cell shape polarity. They then describe nice evidence that de novo polarisation is relatively short range both in a polarised and unpolarised field. They conclude that there is a strong cell-intrinsic polarity that remains to be characterised.

      Major concerns:

      (1) The first set of repolarisation experiments is performed after the global cell rearrangements that have been shown to act as global signals. However, this approach does not exclude the possible contribution of an unknown diffusible global signal.

      (2) The putative non-local cell scale signal must be more precisely defined (maybe also given a better name). It is not clear to me that one can separate cell-scale from molecular-scale signal. Local signals can redistribute within a cell (or membrane) so local signals are also cell-scale. Without a clear definition, it is difficult to interpret the results of the gene dosage experiments. The link between gene dosage and cell-scale signal is not rigorously stated. Related to this, the concluding statement of the introduction is too cryptic.

      Critique:

      The experiments described in this paper are of high quality with a sophisticated level of design and analysis. However, there needs to be some recalibration of the extent of the conclusions that can be drawn. Moreover, a limitation of this paper is that, despite the quality of their data, they cannot give a molecular hint about the nature of their proposed cell-scale signal.

    4. Reviewer #3 (Public Review):

      The manuscript by Carayon and Strutt addresses the role of cell-scale signaling during the establishment of planar cell polarity (PCP) in the Drosophila pupal wing. The authors induce locally the expression of a tagged core PCP protein, Frizzled, and observe and analyze the de novo establishment of planar cell polarity. Using this system, the authors show that PCP can be established within several hours, that PCP is robust towards variation in core PCP protein levels, that PCP proteins do not orient microtubules, and that PCP is robust towards 'extrinsic' re-polarization. The authors conclude that the polarization at the cell-scale is strongly intrinsic and only weakly affected by the polarity of neighboring cells.

      Major comments:

      The data are clearly presented and the manuscript is well written. The conclusions are well supported by the data. 

      (1) The authors use a system to de novo establish PCP, which has the advantage of excluding global cues orienting PCP and thus to focus on the cell-intrinsic mechanisms. At the same time, the system has the limitation that it is unclear to what extent de novo PCP establishment reflects 'normal' cell scale PCP establishment, in particular because the Gal4/UAS expression system that is used to induce Fz expression will likely result in much higher Fz levels compared with the endogenous levels. The authors should briefly discuss this limitation.

      (2) Fig. 3. The authors use heterozygous mutant backgrounds to test the robustness of de novo PCP establishment towards (partial) depletion in core PCP proteins. The authors conclude that de novo polarization is 'extremely robust to variation in protein level'. Since the authors (presumably) lowered protein levels by 50%, this conclusion appears to be somewhat overstated. The authors should tune down their conclusion.

      Significance: 

      The manuscript contributes to our understanding of how planar cell polarity is established. It extends previous work by the authors (Strutt and Strutt, 2002,2007) that already showed that induction of core PCP pathway activity by itself is sufficient to induce de novo PCP. This manuscript further explores the underlying mechanisms. The authors test whether de novo PCP establishment depends on an 'inhibitory signal', as previously postulated (Meinhardt, 2007), but do not find evidence. They also test whether core PCP proteins help to orient microtubules (which could enhance cell intrinsic polarization of core PCP proteins), but, again, do not find evidence, corroborating previous work (Harumoto et al, 2010). The most significant finding of this manuscript, perhaps, is the observation that local de novo PCP establishment does not propagate far through the tissue. A limitation of the study is that the mechanisms establishing intrinsic cell scale polarity remain unknown. The work will likely be of interest to specialists in the field of PCP.

    5. Author response:

      (1) General Statements

      Our manuscript studies mechanisms of planar polarity establishment in vivo in the Drosophila pupal wing. Specifically we seek to understand mechanisms of ‘cell-scale signalling’ that is responsible for segregating core pathway planar polarity proteins to opposite cell edges. This is an understudied question, in part because it is difficult to address experimentally.

      We use conditional and restrictive expression tools to spatiotemporally manipulate core protein activity, combined with quantitative measurement of core protein distribution, polarity and stability. Our results provide evidence for a robust cell-scale signal, while arguing against mechanisms that depend on depletion of a limited pool of a core protein or polarised transport of core proteins on microtubules. Furthermore, we show that polarity propagation across a tissue is hard, highlighting the strong intrinsic capacity of individual cells to establish and maintain planar polarity.

      The original manuscript received three fair and thorough peer-reviews, which raised many important points. In response, we decided to embark on a full revision that attempts to answer all of the points. We have included new data to support our conclusions in Supplemental Figures 1, 2 and 5.

      Additionally in response to the reviewers we have revised the manuscript title, which is now ‘Characterisation of cell-scale signalling by the core planar polarity pathway during Drosophila wing development’.

      (2) Point-by-point description of the revisions

      We thank all of the reviewers for their thorough and thoughtful review of our manuscript. They raise many helpful points which have been extremely useful in assisting us to revise the manuscript.

      In response we have carried out a major revision of the manuscript, making numerous changes and additions to the text and also adding new experimental data. Specific changes are listed after our detailed response to each comment.

      Reviewer #1:

      Summary

      The authors use inducible Fz::mKate2-sfGFP to explore "cell-scale signaling" in PCP. They reach several conclusions. First, they conclude that cell-scale signaling does not depend on limiting pools of core components (other than Fz). Second, they conclude that cell-scale signaling does not depend on microtubule orientation, and third, they conclude that cell-scale signaling is strong relative to cell to cell coupling of polarity. 

      There are some interesting inferences that can be drawn from the manuscript, but there are also some significant challenges in interpreting the results and conclusions from the work as presented. I suggest that the authors 1) define "cell-scale signaling," as the precise meaning must be inferred, 2) reconsider some premises upon which some conclusions depend, 3) perform an essential assay validation, and 4) explain some other puzzling inconsistencies.

      Major points

      The exact meaning of cell-scale signaling is not defined, but I infer that the authors use this term to describe how what happens on one side of a cell affects another side. The remainder of my critique depends on this understanding of the intended meaning.

      As the reviewer points out, it is important that the meaning of the term ‘cell-scale signalling’ is clear to the reader and in response to their comment we have had another go at defining it explicitly in the Introduction to the manuscript.

      Specifically, we use the term ‘cell-scale signalling’ to describe possible intracellular mechanisms acting on core protein segregation to opposite cell membranes during core pathway dependent planar polarisation. For example, this could be a signal from distal complexes at one side of the cell leading to segregation of proximal complexes to the opposite cell edge, or vice versa. See also our response to Reviewer #2 regarding the distinction between ‘molecular-scale’ and ‘cell-scale’ signalling. 

      Changes to manuscript: Revised definition of ‘cell-scale signalling’ in Introduction.

      The authors state that any tissue wide directional information comes from pre-existing polarity and its modification by cell flow, such that the de novo signaling paradigm "bypasses" these events and should therefore not be responsive to any further global cues. It is my understanding that this is not a universally accepted model, and indeed, the authors' data seem to suggest otherwise. For example, the image in Fig 5B shows that de novo induction restores polarity orientation to a predominantly proximal to distal orientation. If no global cue is active, how is this orientation explained?

      We assume that the reviewer’s point is that it is not universally accepted that de novo induction after hinge contraction leads to uncoupling from global cues (rather than that it is not accepted that hinge contraction remodels radial polarity to a proximodistal pattern). We are (we believe) the only lab that has used de novo induction as a tool, and we’re not aware of any debate in the literature about whether this bypasses global cues. Nevertheless, we accept that it is hard to prove there is no influence of global cues, when the nature of those cues and the time at which they act remain unclear. Below we summarise the reasons why we believe there are not significance effects of global cues in our experiments that would influence the interpretation of our results.

      First, our reading of the literature supports a broad consensus that an early radial core planar polarity pattern is realigned by cell flow produced by hinge contraction beginning at around 16h APF (e.g. Aigouy et al., 2010; Strutt and Strutt, 2015; Aw and Devenport, 2017; Butler and Wallingford, 2017; Tan and Strutt, 2025). Taken at face value, this suggests that there are ‘radial’ cues present prior to hinge contraction, maybe coming from the wing margin – arguably these radial cues could be Ft-Ds or Wnts or both, given they are expressed in patterns consistent with such a role (notwithstanding the published evidence arguing against roles for either of these cues). It then appears that hinge contraction supercedes these cues to convert a radial pattern to a proximodistal pattern – whether the radial cues that affect the core pathway earlier remain active after hinge contraction is unclear, although both Ft-Ds and Wnts appear to maintain their ‘radial’ patterns beyond the beginning of hinge contraction (e.g. Merkel et al., 2014; Ewen-Campen et al., 2020; Yu et al., 2020).

      We think that the reviewer is proposing the presence of a proximodistal cue that is active in the proximal region of the wing that we use for our experiments shown e.g. in Fig.5, and that this cue orients core polarity here (but not elsewhere in the wing) in a time window after 18h APF. Ft-Ds and Wnts do not seem to be plausible candidates as they are still in ‘radial’ patterns. This leaves either an unknown proximodistal cue (a gradient of some unknown signalling molecule?), or possibly some ability of hinge contraction to align proximodistal polarity specifically in this wing region but not elsewhere. We cannot definitively rule out either of these possibilities, but neither do we think there is sufficient evidence to justify invoking their existence to explain our observations.

      In particular, the reason that we don’t think there is a proximodistal cue in the proximal part of the wing after 18h APF, is that work from our lab shows that induction of Fz or Stbm expression at times around or after the start of hinge contraction (i.e. >16 h APF) results in increasing levels of trichome swirling with polarity not being coordinated with the tissue axis either proximally or distally (Strutt and Strutt, 2002; Strutt and Strutt 2007). Our simplest interpretation for this is that induction at these stages fails to establish the early radial pattern of core pathway polarity and hence hinge contraction cannot reorient radial to proximodistal. If hinge contraction alone could specify proximodistal polarity in the absence of the earlier radial polarity, then we would not expect to see swirling over much of the proximal wing (where the forces from hinge contraction are strongest (Etournay et al., 2015)).

      In this manuscript, our earliest de novo experiments begin with Fz induction at 18h APF (de novo 10h), then at 20h APF (de novo 8h) and at 22h APF (de novo 6h). The image in Fig. 5B, referred to by the reviewer, is of a wing where Fz is induced de novo at 22 h APF. In these wings, as expected, the core proteins localise asymmetrically in stereotypical swirling patterns throughout the wing surface (see Fig. 2M and also Strutt and Strutt, 2002; Strutt and Strutt 2007), but – usefully for our experiments – they broadly localise along the proximal-distal axis in the region analysed in Fig. 5B. Given the strong swirling in surrounding regions when inducing at >20h APF, we feel reasonably confident in assuming that the pattern is not due to a proximodistal cue present in the proximal wing.

      We appreciate that the original manuscript did not show images including the trichome pattern in adjacent regions, so this point would not have been clear, but we now include these in Supplementary Fig. 5. We have also added a note in the legend to Fig. 5B to clarify that the proximodistal pattern seen is local to this wing region. We apologise for this oversight and the confusion caused and appreciate the feedback.

      The 6 hr condition, that has only partial polarity magnitude, is quite disordered. Do the patterns at 8 and 10 hrs become more proximally-distally oriented? It is stated that they all show swirls, but please provide adult wing images, and the corresponding orientation outputs from QuantifyPolarity to help validate the notion that the global cues are indeed bypassed by this paradigm.

      In all three ‘normal’ de novo conditions (6h, 8h and 10h), regardless of the time of induction, the polarity orientation patterns of Fz-mKate2 in pupal and adult wings are very similar in the experimentally analysed region (Fig. S5B-E). The strong local hair swirling agrees with the previous published data (Strutt and Strutt, 2002; Strutt and Strutt 2007). Overall, we don’t see any evidence that the 10h de novo induction results in more proximodistally coordinated polarity than the 8h or 6h conditions. This is consistent with our contention that there is no global cue present at these stages, which presumably would have a stronger effect when core pathway activity was induced at earlier stages.

      Changes to manuscript: Added additional explanation of the ‘de novo induction’ paradigm and why we believe the resulting polarity patterns are unlikely to be influenced by any global signals in Introduction and Results section ‘Induced core protein relocalisation…’. Added quantification of polarity in the experiment region proximal to the anterior cross-vein in pupal wings (Fig.S5E-E’’’) and zoomed-out images of the surrounding region in adult wings showing that the polarity pattern does not become more proximodistal when induction time is longer, and also that there is not overall proximodistal polarity in proximal regions of the wing (Fig.S5B-D), arguing against an unknown proximodistal polarity cue at these stages of development.

      In the de novo paradigm, polarization is initiated immediately or shortly after heat shock induction. However, the results should be differently interpreted if the level of available Fz protein does not rise rapidly and then stabilize before the 6 hr time point, and instead continues to rise throughout the experiment. Western blots of the Fz::mKate2-sfGFP at time points after induction should be performed to demonstrate steady state prior to measurements. Otherwise, polarity magnitude could simply reflect the total available pool of Fz at different times after induction. Interpreting stability is complex, and could depend on the same issue, as well as the amount of recycling that may occur. Prior work from this lab using FRAP suggested that turnover occurs, and could result from recycling as well as replenishment from newly synthesized protein. 

      The reviewer raises an important point, which we agree could confound our experimental interpretations. As suggested we have now carried out western blotting and quantitation for Fz::mKate2-sfGFP levels and added these data to Fig.S1 (Fig. S1C,D). Quantified Fz is not significantly different between the three de novo polarity induction timings and not significantly different compared to constitutive Fz::mKate2-sfGFP expression (although there is a trend towards increasing Fz::mKate2-sfGFP protein levels with increasing induction times). These data are consistent with Fz::mKate2-sfGFP being at steady state in our experiments and that levels are sufficient to achieve normal polarity (as constitutive Fz::mKate2-sfGFP does so). Therefore it is unlikely that differing protein levels explain the differing polarity magnitudes at the different induction times. Interestingly, Fz::mKate2-sfGFP levels are lower than endogenous Fz levels, possibly due to lower expression or increased turnover/reduced recycling.

      Changes to manuscript: Added western blot analysis of Fz::mKate2-sfGFP expression under 10h, 8h and 6h induction conditions vs endogenous Fz expression and constitutive Fz::mKate2sfGFP expression (Fig.S1C-D) and discussed in Results section ‘Planar polarity establishment is…’.

      From the Fig 3 results, the authors claim that limiting pools of core proteins do not explain cellscale signaling, a result expected based on the lack of phenotypes in heterozygotes, but of course they do not test the possibility that Fz is limiting. They do note that some other contributing protein could be. 

      Previously published results from our lab (Strutt et al., 2016 Cell Reports; Supplemental Fig. S6E) show that in a heterozygous fz mutant background, Fz protein levels are not affected by halving the gene dosage when compared to wt, suggesting that Fz is most likely produced in excess and is not normally limiting, but that protein that cannot form complexes may be rapidly degraded. We have now added this information to the text.

      Changes to manuscript: Added explanation in text that Fz levels had previously been shown to not be dosage sensitive in Results section ‘Planar polarity establishment is…’ and also added a caveat to the Discussion about not directly testing Fz.

      In Fig 3, it is unclear why the authors chose to test dsh1/+ rather than dsh[null]/+. In any case, the statistically significant effect of Dsh dose reduction is puzzling, and might indicate that the other interpretation is correct. Ideally, a range including larger and smaller reductions would be tested. As is, I don't think limiting Dsh is ruled out. 

      Concerning the choice of dsh allele, we appreciate the query of the reviewer regarding use of dsh[1] instead of a null, as there might be a concern that dsh[1] would give a less strong phenotype. The answer is that over more than two decades we and others have never found any evidence that dsh[1] does not act as a ‘null’ for planar polarity in the pupal wing, and furthermore use of dsh[1] preserves function in Wg signalling – and we would prefer to rule out any phenotypic effects due to any potential cross-talk between the two pathways that might be seen using a complete null. To expand on this point, dsh[1] mutant protein is never seen at cell junctions (Axelrod 2001; Shimada et al., 2001; our own work), and by every criteria we have used, planar polarity is completely disrupted in hemizygous or homozygous mutants e.g. see quantifications of polarity in (Warrington et al., 2017 Curr Biol).

      In terms of the broader point, whether we can rule out Dsh being limiting, we were very careful to be clear that we did not see evidence for Dsh (or other core proteins) being limiting in terms of ‘rates of core pathway de novo polarisation’. When the reviewer says ‘the statistically significant effect of Dsh dose reduction is puzzling’ we believe they are referring to the data in Fig. 3J, showing a small but significantly different reduction in stable Fz in de novo 6h conditions (also seen in 8h de novo conditions, Fig. S3I). As Dsh is known to stabilise Fz in complexes (Strutt et al., 2011 Dev Cell; Warrington et al., 2017 Curr Biol), in itself this result is not wholly surprising. Nevertheless, while this shows that halving Dsh levels does modestly reduce Fz stability, it does not alter our conclusion that halving Dsh levels does not affect Fz polarisation rate under either 6h or 8h de novo conditions.

      Unfortunately, we do not have available to us a practical way of achieving consistent intermediate reductions in Dsh levels (e.g. a series of verified transgenes expressing at different levels). Levels of all the core proteins could be dialled down using transgenes, to see when the system breaks, and indeed we have previously published that lower levels of polarity are seen if Fmi levels are <<50% or if animals are transheterozygous for pk, stbm, dgo or dsh, pk, stbm, dgo simultaneously (Strutt et al., 2016 Cell Reports). However, it seems to be a trivial result that eventually the ability to polarise is lost if insufficient core proteins are present at the junctions. For this reason we have focused on a simple set of experiments reducing gene dosage singly by 50% under two de novo induction conditions, and have been careful to state our results cautiously. The assays we carried out were a great deal of work even for just the 5 heterozygous conditions tested.

      We believe that the experiments shown effectively make the point that there is no strong dosage sensitivity – and it remains our contention that if protein levels were the key to setting up cell-scale polarity, then a 50% reduction would be expected to show an effect on the rate of polarisation. We further note that as Fz::mKate2-sfGFP levels are lower than endogenous Fz levels (see above), the system might be expected to be sensitised to further dosage reductions, and despite this we failed to see an effect on rate of polarisation.

      We note that Reviewer #3 made a similar point about whether we can rule out dosage sensitivity on the basis of 50% reductions in protein level. To address the comments of both reviewers we had now added some further narrative and caveats in the text.

      In a similar vein, Reviewer #2 requested data on whether dosage reduction altered protein levels by the expected amount. We have now added further explanation/references and western blot data to address this.

      Changes to manuscript: Added more explanation of our choice of dsh[1] as an appropriate mutant allele to use in Results section ‘Planar polarity establishment is…’. Added some narrative and caveats regarding whether lowering levels more than 50% would add to our findings in the Discussion. Revised conclusions to be more cautious including altering section title to read ‘Planar polarity establishment is not highly sensitive to variation in protein levels of core complex components’.

      Also added westerns and text/references showing that for the tested proteins there is a reduction in protein levels upon removal of one gene dosage in Results section ‘Planar polarity establishment is…’ and Fig.S2.

      The data in Fig 5 are somewhat internally inconsistent, and inconsistent with the authors' interpretation. In both repolarization conditions, the authors claim that repolarization extends only to row 1, and row 1 is statistically different from non-repolarized row 1, but so too is row 3. Row 2 is not. This makes no sense, and suggests either that the statistical tests are inappropriate and/or the data is too sparse to be meaningful. 

      As we’re sure the reviewer appreciates, this was an extremely complex experiment to perform and analyse. We spent a lot of time trying to find the best way to illustrate the results (finally settling on a 2D vector representation of polarity) and how to show the paired statistical comparisons between different groups. Moreover, in the end we were only able to detect generally quite modest (statistically significant) changes in cell polarity under the experimental conditions.

      However, we note that failure to see large and consistent changes in polarity is exactly the expected result if it is hard to repolarise from a boundary – and this is of course the conclusion that we draw. Conversely, if repolarisation were easy, which was our expectation at least under de novo conditions without existing polarity, then we would have expected large and highly statistically significant changes in polarity across multiple cell rows. Hence we stand by our conclusion that ‘it is hard to repolarise from a boundary of Fz overexpression in both control and de novo polarity conditions’.

      Overall, we were trying to establish three points:

      (1) to demonstrate that repolarisation occurs from a boundary of overexpression i.e. from boundary 0 to row 0

      (2) to establish whether a wave of repolarisation occurs across rows 1, 2 and 3

      (3) to determine if in repolarisation in de novo condition it is easier to repolarise than in repolarisation in the control (already polarised) condition Taking each in turn:

      (1) To detect repolarisation from a boundary relative to the control condition, we have to compare row 0 in repolarisation condition (Fig.5G,K) vs control condition (Fig.5F,J). This comparison shows a significative repolarisation (p=0.0014). From now, row 0 in repolarisation condition is our reference for repolarisation occurring.

      (2) To determine if there is a wave of repolarisation in the repolarisation condition we have to compare row 0 vs row 1 to 3 in the repolarisation condition (Fig.5K). Row 1 is not significantly different to row 0, but rows 2 and 3 are different and the vectors show obviously lower polarity than row 0. Hence no wave of repolarisation is detected over rows 1 to 3.

      (3) To determine if it is easier to repolarise in the de novo condition, our reference for establishment of a repolarisation pattern is the polarisation condition in rows 0 to 3. So, we compare repolarisation condition vs repolarisation in de novo condition, row 0 vs row 0, row 1 vs row 1, row 2 vs row 2 and row 3 vs row 3 – in each case no significative difference in polarity is detected, supporting our conclusion that it is not easier to repolarise in the de novo condition.

      We agree that the variations in row 3 are puzzling, but there is no evidence that this is due to propagation of polarity from row 0, and so in terms of our three questions, it does not alter our conclusions.

      Changes to manuscript: We have extensively revised the text describing the results in Fig.5 to hopefully make the reasons for our conclusions clearer and also be more cautious in our conclusions in Results section ‘Induced core protein relocalisation…’. 

      For the related boundary intensity data in Fig 6, the authors need to describe exactly how boundaries were chosen or excluded from the analysis. Ideally, all boundaries would be classified as either meido-lateral (meaning anterior-posterior) or proximal-distal depending on angle. 

      We thank the reviewer for pointing out that this was not clear.

      All boundaries were classified following their orientation compared to the Fz over-expression boundary using hh-GAL4 expressed in the wing posterior compartment. Horizontal junctions were defined as parallel to the Fz over-expression boundary (between 0 and 45 degrees) and mediolateral junctions as junctions linking two horizontal boundaries (between 45 and 90 degrees).

      Changes to manuscript: The boundary classification detailed above has been added in the Materials and Methods.

      If the authors believe their Fig 5 and 6 analyses, how do they explain that hairs are reoriented well beyond where the core proteins are not? This would be a dramatic finding, because as far as I know, when core proteins are polarized, prehair orientation always follows the core protein distribution. Surprisingly, the authors do not so much as comment about this. The authors should age their wings just a bit more to see whether the prehair pattern looks more like the adult hair pattern or like that predicted by their protein orientation results.

      Again the reviewer makes an interesting point, and we agree that this is something that we should have more directly addressed in the manuscript.

      There are three reasons why we might expect adult trichomes to show a different effect from the measured core protein polarity pattern seen in our experiments:

      (i) we are assaying core protein polarity at 28h APF, but trichomes emerge at >32h APF, so there is still time for polarity to propagate a bit further from the boundary. We now have added data showing that by the point of trichome initiation, the wave of polarisation extends 3-4 cell rows (Fig.S5A).

      (ii) it has long been known that a strong localisation of core proteins at a cell edge is not required for polarisation of trichome polarity from a boundary. For instance, in Strutt & Strutt 2007 we show clones of cells overexpressing Fz causing propagation through pk[pk-sple] mutant tissue where there is no detectable core protein polarity. We were following up prior observations of Adler et al., 2000 in the wing and Lawrence et al., 2004 in the abdomen.

      (iii) there is evidence to suggest that the polarity of adult trichomes is locally coupled, possibly mechanically. This point is hard to prove without live imaging taking in both initial core protein localisation, the site of actin-rich trichome initiation and then the final orientation of the much larger microtubule filled trichome, and we’re not aware that such data exist. However, Wong & Adler 1993 (JCB) showed that over a number of hours trichomes become much larger and move towards the centre of the cell, presumably becoming decoupled from any core protein cue. The images in Guild … & Tilney, 2005 (MBoC)  are also interesting to look at in this regard. Finally, septate junction proteins have been implicated in local alignment of trichomes, independently of the core pathway (Venema … & Auld, 2004 Dev Biol).

      Changes to manuscript: Added new data in Fig.S5A showing where trichomes initiate under 6h de novo induction conditions, for comparison to core protein localisation and adult trichome data in Fig.5. Added some text explaining why adult trichome repolarisation might be stronger than the observed effects on core protein localisation in Discussion. 

      Minor points

      As the authors know, there is a model in the literature that suggests microtubule trafficking provides a global cue to orient PCP. The authors' repolarization data in Fig 4 make a reasonably convincing case against a role for no role for microtubules in cell-scale signaling, but do not rule out a role as a global cue. The authors should be careful of language such as "...MTs and core proteins being oriented independently of each other" that would appear to possibly also refer to a role as a global cue. 

      Thank you for pointing out that this was not clear. We have now modified the text to hopefully address this.

      Changes to manuscript: Text updated in Results section ‘Microtubules do not provide…’.

      Significance:

      There are two negative conclusions and one positive conclusion made by the authors. Provided the above points are addressed, the negative conclusions, that core proteins are not limiting and that microtubules are not involved in cell-scale signaling are solid. The positive conclusion is more nebulous - the authors say that cell-scale signaling is strong relative to cell-cell signaling - but how strong is strong? Strong relative to their prior expectations? I'm not sure how to interpret such a conclusion. Overall, we learn something from these results, though it fails to reveal anything about mechanism. These results will be of some interest to those studying PCP.

      The reviewer raises an interesting point, which is how do you compare the strength of two different processes, even if both processes affect the same outcome (in this case cell polarity). Repolarisation from a boundary has not been carefully studied at the level of core protein localisation in any previous study to our knowledge – this is one of the important novel aspects of this study. Hence there is not a baseline for defining strong repolarisation. Similarly, there has been no investigation of the nature of ‘cell-scale signalling’. This was a considerable challenge for us in writing the manuscript, and we have done our best to find appropriate language that hopefully conveys our message adequately. Minimally our work may provide a baseline for helping to define the ‘strengths’ of these processes in future studies.

      One of our main points is that we can generate an artificial boundary of Fz expression, where Fz levels are at least several fold higher than in the neighbouring cell (e.g. compare Fig.4N’ and O’) and only two rows of cells show a significant change in polarity relative to controls. Even when the tissue next to the overexpression domain is still in the process of generating polarity (de novo condition) then the boundary has little effect on polarity in neighbouring cell rows. This was a result that surprised us, and we tried to convey that by using language to suggest cell-scale signalling was stronger than cell-cell signalling i.e. stronger in terms of the ability to define the final direction of polarity.

      Changes to manuscript: In the revised manuscript we have reviewed our use of language and now avoid saying ‘strong’ but instead use terms such as ‘effective’ and ‘robust’ in e.g. Results section ‘Induced core protein relocalisation…’, the Discussion and we have also changed the title of the manuscript to avoid claiming a ‘strong’ signal.

      Reviewer #2:

      Overview

      This paper aims to dissect the relative importance of the various cues that establish PCP in the wing disc of Drosophila, which remains a prominent and relevant model for PCP. The authors suggest that one must consider cues at three scales (molecular, cell and tissue) and specifically design tests for the importance of cell-level cues, which they call non-local cell scale signalling. They develop clever experimental approaches that allow them to track complex stability and also to induce polarity at experimentally defined times. In a first set of experiments, they restore PCP after the global cues have disappeared (de novo polarisation) and conclude from the results that another (cell scale) cue must exist. In another set of experiments, they show that de novo repolarization is robust to the dosage of various components of core PCP, leading them to conclude that there must be an underlying cell scale polarity, which, apparently, has nothing to do with microtubule or cell shape polarity. They then describe nice evidence that de novo polarisation is relatively short range both in a polarised and unpolarised field. They conclude by there is a strong cell-intrinsic polarity that remains to be characterised.

      Critique

      The experiments described in this paper are of high quality with a sophisticated level of design and analysis. However, there needs to be some recalibration of the extent of the conclusions that can be drawn (see below). Moreover, a limitation of this paper is that, despite the quality of their data, they cannot give a molecular hint about the nature of their proposed cell-scale signal. Below are a two key points that the authors may want to clarify.

      (1) The first set of repolarisation experiment is performed after the global cell rearrangements that have been shown to act as global signal. However, this approach does not exclude the possible contribution of an unknown diffusible global signal.

      A similar point was raised by Reviewer 1. For the convenience of this reviewer, we’ll summarise the arguments against such an unknown cue again below. More broadly, both reviewers asking a similar question indicates that we have failed to lay out the evidence in sufficient detail. In our defence, we have used the same ‘de novo’ paradigm in three previous publications (Strutt and Strutt 2002, 2007; Brittle et al 2022) without attracting (overt) controversy. We have now added text to the Introduction and Results that goes into more detail, as well as more experimental evidence (Fig.S5).

      Firstly, it is worth noting that the global cues acting in the wing are poorly understood, with mostly negative evidence against particular cues accruing in recent years. This makes it a hard subject to succinctly discuss. Secondly, we accept that it is hard to prove there is no influence of global cues, when the nature of those cues and the time at which they act remain unclear. Below we summarise the reasons why we believe there are not significance effects of global cues in our experiments that would influence the interpretation of our results.

      First, our reading of the literature supports a broad consensus that an early radial core planar polarity pattern is realigned by cell flow produced by hinge contraction beginning at around 16h APF (e.g. Aigouy et al., 2010; Strutt and Strutt, 2015; Aw and Devenport, 2017; Butler and Wallingford, 2017; Tan and Strutt, 2025). Taken at face value, this suggests that there are ‘radial’ cues present prior to hinge contraction, maybe coming from the wing margin – arguably these radial cues could be Ft-Ds or Wnts or both, given they are expressed in patterns consistent with such a role (notwithstanding the published evidence arguing against roles for either of these cues). It then appears that hinge contraction supercedes these cues to convert a radial pattern to a proximodistal pattern – whether the radial cues that affect the core pathway earlier remain active after hinge contraction is unclear, although both Ft-Ds and Wnts appear to maintain their ‘radial’ patterns beyond the beginning of hinge contraction (e.g. Merkel et al., 2014; Ewen-Campen et al.,2020; Yu et al., 2020).

      We think that the reviewers are proposing the presence of a proximodistal cue that is active in the proximal region of the wing that we use for our experiments shown e.g. in Fig.5, and that this cue orients core polarity here (but not elsewhere in the wing) in a time window after 18h APF. Ft-Ds and Wnts do not seem to be plausible candidates as they are still in ‘radial’ patterns. This leaves either an unknown proximodistal cue (a gradient of some unknown signalling molecule?), or possibly some ability of hinge contraction to align proximodistal polarity specifically in this wing region but not elsewhere. We cannot definitively rule out either of these possibilities, but neither do we think there is sufficient evidence to justify invoking their existence to explain our observations.

      In particular, the reason that we don’t think there is a proximodistal cue in the proximal part of the wing after 18h APF, is that work from our lab shows that induction of Fz or Stbm expression at times around or after the start of hinge contraction (i.e. >16 h APF) results in increasing levels of trichome swirling with polarity not being coordinated with the tissue axis either proximally or distally (Strutt and Strutt, 2002; Strutt and Strutt 2007). Our simplest interpretation of this is that induction at these stages fails to result in the early radial pattern of core pathway polarity being established and hence a failure of hinge contraction to reorient radial to proximodistal. If hinge contraction alone could specify proximodistal polarity in the absence of the earlier radial polarity, then we would not expect to see swirling over much of the proximal wing (where the forces from hinge contraction are strongest, Etournay et al., 2015).

      In this manuscript, our earliest de novo experiments begin at 18h APF (de novo 10h), then at 20h APF (de novo 8h) and at 22h APF (de novo 6h). The image in Fig. 5B referred to by Reviewer 1, is of a wing where Fz is induced de novo at 22 h APF. In these wings, as expected, the core proteins localise asymmetrically in stereotypical swirling patterns throughout the wing surface (see Fig. 2M and also Strutt and Strutt, 2002; Strutt and Strutt 2007), but – usefully for our experiments – they broadly localise along the proximal-distal axis in the region analysed in Fig. 5B. Given the strong swirling in surrounding regions when inducing at >20h APF, we feel reasonably confident in assuming that the pattern is not due to a proximodistal cue present in the proximal wing. We appreciate that the original manuscript did not show images including the trichome pattern in adjacent regions, so this point would not have been clear, but we now include these in Supplementary Fig.S5. We have also added a note in the legend to Fig. 5B to clarify that the proximodistal pattern seen is local to this wing region.

      Changes to manuscript: Text extended in Introduction and Results to better explain why we believe the de novo conditions that we use most likely result in a polarity pattern that is not significantly influenced by ‘global cues’. Now show zoomed-out images of the surrounding region around the experiment region proximal to the anterior cross-vein region in adult wings, showing that the polarity pattern does not become more proximodistal when induction time is longer, and also that there is not overall proximodistal polarity in proximal regions of the wing, arguing against an unknown proximodistal polarity cue at these stages of development (Fig.S5B-E’’’).

      (2) The putative non-local cell scale signal must be more precisely defined (maybe also given a better name). It is not clear to me that one can separate cell-scale from molecular-scale signal.

      Local signals can redistribute within a cell (or membrane) so local signals are also cell-scale. Without a clear definition, it is difficult to interpret the results of the gene dosage experiments. The link between gene dosage and cell-scale signal is not rigorously stated. Related to this, the concluding statement of the introduction is too cryptic.

      We thank the reviewer for raising this, as again a similar comment was made by Reviewer 1, so we are clearly falling short in defining the term. We have now had another attempt in the Introduction.

      To more specifically answer the point made by the reviewer regarding molecular vs cellular, we are essentially being guided here by the prior computational modelling work, as at the biological level the details are still being worked out. A specific class of previous models only allowed ‘signals’ between core proteins to act ‘locally’, meaning within a cell junction, and within the models there was no explicit mechanism by which proteins on other junctions could ‘detect’ the polarity of a neighbouring junction (e.g. Amonlirdviman et al., 2005; Le Garrec et al., 2006; Fischer et al., 2013). Other models implicitly or explicitly encode a mechanism by which cell junctions can be influenced by the polarity of other junctions (e.g. Meinhardt, 2007; Burak and Shraiman, 2009; Abley et al., 2013; Shadkhoo and Mani, 2019), for instance by diffusion of a factor produced by localisation of particular planar polarity proteins.

      We agree with the reviewer that a cell-scale signal will depend on ‘molecules’ and thus could be called ‘molecular-scale’, but here by ‘molecular-scale’ we mean signals that at the range of the sizes of molecules i.e. nanometers, rather than cell-scale signals that act at the size of cells i.e. micrometers. A caveat to our definition is that we implicitly include interactions that occur locally on cell junctions (<1 µm range) within ‘molecular-scale’, but this is a shorter range than ‘cellular-scale’ which requires signals acting over the diameter of a cell (3-5 µm). Nevertheless, we think the concept of ‘molecular-scale’ vs ‘cell-scale’ is a helpful one in this context, and have attempted to address the issue through a more careful definition of the terms.

      Changes to manuscript: Text revised in Introduction and legend to Fig.1 to more carefully define ‘cell-scale signalling’ and to distinguish it from ‘molecular-scale signalling’. Final sentence of Introduction also altered so we no longer cryptically speculate on the nature of the cell-scale signal but leave this to the Discussion.

      Minor comments. 

      Some of the (clever) genetic manipulation may need more details in the text. For example:

      - Need to specify if the hs-flp approach induces expression throughout the tissue.

      We apologise for the lack of clarity. In all the experiments, the hs-FLP transgene is present in all cells, and heat-shock results in ubiquitous expression. 

      Changes to manuscript: We have clarified this in the Results and Materials and Methods.

      - Need to specify in the text that in the unpolarised condition the tissue is both dsh and fz mutant.

      The reviewer is of course correct and we have updated this point in the text. The full genotype for the unpolarised condition is: w dsh<sup>1</sup> hsFLP22/y;; Act>>fz-mKate2sfGFP, fz<sup>P21</sup>/fz<sup>P21</sup> (see Table S1). So this line is mutant for dsh and fz with induced expression of Fz-mKate2sfGFP. 

      Changes to manuscript: We have clarified this in the relevant part of the Results.

      - Need to specify in the text that the experiment illustrated in Fig 5 is with hh-gal4. 

      As noted by the reviewer, we continued to use the same hh-GAL4 repolarisation paradigm as in Fig.4 and this info was in the legend to Fig.5 legend. However, we agree it is helpful to be explicit about this in the main text.

      Changes to manuscript: We have added this to this section of the Results.

      - Need to address a possible shortcoming of the hh experiment, that the AP boundary is a region of high tension.

      It is true that the AP boundary is under high tension in the wing disc (e.g. Landsberg et al., 2009). But we are not aware of any evidence that this higher tension persists into the pupal wing. In separate studies we have labelled for Myosin II in pupal wings (Trinidad et al 2025 Curr Biol; Tan & Strutt 2025 Nature Comms), and as far as we have noticed have not seen preferentially higher levels on the AP boundary. We think if tension were higher, the cell boundaries would appear straighter than in surrounding cells (as seen in the wing disc) and this is not evident in our images.

      - Need to dispel the possibility that there is no residual polarisation (e.g. of other components) in fz1 mutant (I assume this is the case).

      We use the null allele fz[P21] through this work, and we and others have consistently reported a complete loss of polarisation of other core proteins or downstream components in this background. The caveat to this is that core proteins that persist at cell junctions always appear at least slightly punctate in mutant backgrounds for other core proteins, and so any automated detection algorithm will always find evidence of individual cell polarity above a baseline level of uniform distribution. Hence we tend to use lack of local coordination of polarity (variance of cell polarity angle) as an additional measure of loss of polarisation, in addition to direct measures of average cell polarity. (We discuss this in the QuantifyPolarity manuscript Tan et al 2021 e.g. Fig.S6).

      Changes to manuscript: We now include in the Materials and Methods section ‘Fly genetics…’ a much more extensive explanation of the evidence for specific mutant alleles being ‘null’ for planar polarity function (including dsh1 as raised by Reviewer 1), specifically that they result in no detectable planar polarisation of either other core proteins or downstream effectors, and added appropriate references.

      - Need to provide evidence that 50% gene dosage commensurately affect protein level. 

      This is a good suggestion. In the case of Stbm, we have already published a western blot showing that a reduction in gene dosage results in reduced protein levels (Strutt et al 2016, Fig.S6). We have now performed western blots to quantify protein levels upon reduction of fmi, pk and dgo levels (we actually used EGFP-dgo for the latter, as we don’t have antibodies that can detect endogenous Dgo on western blots).

      Changes to manuscript: When presenting the dosage reduction experiments, we now refer back to Strutt et al., 2016 explicitly for Stbm, and have added western blot data for Fmi, Pk and EGFPDgo in new Fig.S2.

      - I am surprised that the relationship with microtubule polarity was never investigated. Is this true? 

      We agree this is a point that needed further clarification, as Reviewer 1 made a related point regarding the two possible roles for microtubules, one being as a mediator of a global cue upstream of the core pathway, and the second (which we investigate in this manuscript) as a mediator of a cell-scale signal downstream of the core pathway.

      Both the Uemura and Axelrod groups have published on potential upstream function as a global cue mediator in the Drosophila wing (e.g. Shimada et al., 2006; Harumoto et al., 2010; Matis et al., 2014).

      Both groups have also looked out whether core pathway components could affect orientation of microtubules (Harumoto et al., 2010; Olofsson at al., 2014; Sharp and Axelrod 2016). Notably Harumoto et al., 2010 observed that in 24h APF wings, loss of Fz or Stbm did not alter microtubule polarity from a proximodistal orientation consistent with the microtubules aligning along the long cell axis in the absence of other cues. However, this did not rule out an instructive effect of Fz or Stbm on microtubule polarity during core pathway cell-scale signalling. The Axelrod lab manuscripts saw interesting effects of Pk protein isoforms on microtubule polarity, albeit not throughout the entire wing, which hinted at a potential role in cell-scale signalling. Taken together this prior work was the motivation for our directed experiments to specifically test whether the core pathway might generate cell-scale polarity by instructing microtubule polarity.

      Changes to manuscript: We have revised the Results section ‘Microtubules do not…’ to make a clearer distinction regarding possible ‘upstream’ and ‘downstream’ roles of microtubules in Drosophila core pathway planar polarity and the motivation for our experiments investigating the latter.

      - The authors suggest that polarity does not propagate as a wave. And yet the range measured in adult is longer than in the pupal wing. Explain. 

      Again an excellent point, also made by Reviewer 1, which we have now addressed explicitly in the manuscript. For the convenience of this reviewer, we lay out the reasons why we think the propagation of polarity seen in the adult is further than seen for core protein localisation.

      There are three reasons why we might expect adult trichomes to show a different effect from the measured core protein polarity pattern seen in our experiments:

      (i) we are assaying core protein polarity at 28h APF, but trichomes emerge at >32h APF, so there is still time for polarity to propagate a bit further from the boundary. We now have added data showing that by the point of trichome initiation, the wave of polarisation extends 3-4 cell rows (Fig.S5A).  

      (ii) it has long been known that a strong localisation of core proteins at a cell edge is not required for polarisation of trichome polarity from a boundary. For instance, in Strutt & Strutt 2007 we show clones of cells overexpressing Fz causing propagation through pk[pk-sple] mutant tissue where there is no detectable core protein polarity. We were following up prior observations of Adler et al 2000 in the wing and Lawrence et al 2004 in the abdomen.

      (iii) there is evidence to suggest that the polarity of adult trichomes is locally coupled, possibly mechanically. This point is hard to prove without live imaging taking in both initial core protein localisation, the site of actin-rich trichome initiation and then the final orientation of the much larger microtubule filled trichome, and we’re not aware that such data exist. However, Wong & Adler 1993 (JCB) showed that over a number of hours trichomes become much larger and move towards the centre of the cell, presumably becoming decoupled from any core protein cue. The images in Guild … & Tilney, 2005 (MBoC)  are also interesting to look at in this regard. Finally, septate junction proteins have been implicated in local alignment of trichomes, independently of the core pathway (Venema … & Auld, 2004 Dev Biol).

      Changes to manuscript: Added new data in Fig.S5A showing where trichomes initiate under 6h de novo induction conditions, for comparison to core protein localisation and adult trichome data in Fig.5. Added some text explaining why adult trichome repolarisation might be stronger than the observed effects on core protein localisation in Discussion. 

      - The discussion states that the cell-intrinsic system remains to be fully characterised, implying that it has been partially characterised. What do we know about it? 

      As the reviewer probably realises, we were attempting to side-step a long speculative discussion about the various hints and ideas in the literature by grouping them under the umbrella of ‘remaining to be fully characterised’. We would argue that this current manuscript is the first to attempt to systematically investigate the nature of ‘cell-scale signalling’. The lack of prior work is probably due to two factors (i) pioneering theoretical work showed that a sufficiently strong global signal coupled with ‘local’ (i.e. confined to one cell junction) protein interactions was sufficient to polarise cells without the need to invoke the existence of a cell-scale signal; (ii) there is no easy way to identify cell-scale signals as their loss results in loss of polarity which will also occur if other (i.e. more locally acting) core pathway functions are compromised.

      The main investigation of the potential for cell-scale signalling has been another set of theory studies (Burak and Shraiman 2009; Abley et al., 2013; Shadkhoo and Mani 2019) which have considered the possibility of diffusible signals. In our present work we have further considered the possibility of a ‘depletion’ model, based on the pioneering theory work of Hans Meinhardt, and as discussed above the possibility that microtubules could mediate a cell-scale signal.

      Changes to manuscript: We have revised the Discussion to hopefully be clearer about the current state of knowledge.

      Reviewer #3:

      The manuscript by Carayon and Strutt addresses the role of cell-scale signaling during the establishment of planar cell polarity (PCP) in the Drosophila pupal wing. The authors induce locally the expression of a tagged core PCP protein, Frizzled, and observe and analyze the de novo establishment of planar cell polarity. Using this system, the authors show that PCP can be established within several hours, that PCP is robust towards variation in core PCP protein levels, that PCP proteins do not orient microtubules, and that PCP is robust towards 'extrinsic' repolarization. The authors conclude that the polarization at the cell-scale is strongly intrinsic and only weakly affected by the polarity of neighboring cells. 

      Major comments

      The data are clearly presented and the manuscript is well written. The conclusions are well supported by the data. 

      (1) The authors use a system to de novo establish PCP, which has the advantage of excluding global cues orienting PCP and thus to focus on the cell-intrinsic mechanisms. At the same time, the system has the limitation that it is unclear to what extent de novo PCP establishment reflects 'normal' cell scale PCP establishment, in particular because the Gal4/UAS expression system that is used to induce Fz expression will likely result in much higher Fz levels compared with the endogenous levels. The authors should briefly discuss this limitation. 

      We apologise if this wasn’t clear. We only used GAL4/UAS overexpression when we were generating an artificial boundary of Fz expression with hh-GAL4 to induce repolarisation. The de novo induction system involves Fz::mKate2-sfGFP being expressed directly under an Act5C promoter without use of GAL4/UAS. In response to a comment from Reviewer 1 we have now carried out western blot analysis which shows that Fz::mKate2-sfGFP levels under Act5C are actually lower than endogenous Fz levels. As we achieve normal levels of polarity, similar to what we measure in wild-type conditions when measured using QuantifyPolarity, we assume that therefore Fz levels are not limiting under these conditions. However, we note that lower than normal levels of Fz might sensitise the system to perturbation, which in fact would be advantageous in our study, as it might for instance have been expected to more readily reveal dosage sensitivity of other components.

      Changes to manuscript: We now describe the levels of expression achieved using the de novo induction system (Fig.S1C-D) and discuss possible consequences in the relevant Results sections and Discussion.

      (2) Fig. 3. The authors use heterozygous mutant backgrounds to test the robustness of de novo PCP establishment towards (partial) depletion in core PCP proteins. The authors conclude that de novo polarization is 'extremely robust to variation in protein level'. Since the authors (presumably) lowered protein levels by 50%, this conclusion appears to be somewhat overstated. The authors should tune down their conclusion. 

      Reviewer 1 makes a similar point about whether we can argue that the lack of sensitivity to a 50% reduction in protein levels actually rules out the depletion model. To address the comments of both reviewers we had now added some further narrative and caveats in the text.

      We nevertheless believe that the experiments shown effectively make the point that there is no strong dosage sensitivity – and it remains our contention that if protein levels were the key to setting up cell-scale polarity, then a 50% reduction would be expected to show an effect on the rate of polarisation. We further note that as Fz::mKate2-sfGFP levels are lower than endogenous Fz levels, the system might be expected to be sensitised to further dosage reductions, and despite this we fail to see an effect on rate of polarisation.

      In a similar vein, Reviewer 2 requested data on whether dosage reduction altered protein levels by the expected amount. We have now added further explanation/references and western blot data to address this.

      Changes to manuscript: Added some narrative and caveats regarding whether lowering levels more than 50% would add to our findings in the Discussion. Revised conclusions to be more cautious including altering section title to read ‘Planar polarity establishment is not highly sensitive to variation in protein levels of core complex components.

      Also added westerns and text/references showing that for the tested proteins there is a reduction in protein levels upon removal of one gene dosage in Results section ‘Planar polarity establishment is…’ and Fig.S2.

      Minor comments 

      (1) Page 3. The authors mention and reference that they used the PCA method to quantify cell polarity magnification and magnitude. It would help the unfamiliar reader, if the authors would briefly describe the principle of this method. 

      Changes to manuscript: More details have been added in Materials & Methods.

      Significance:

      The manuscript contributes to our understanding of how planar cell polarity is established. It extends previous work by the authors (Strutt and Strutt, 2002,2007) that already showed that induction of core PCP pathway activity by itself is sufficient to induce de novo PCP. This manuscript further explores the underlying mechanisms. The authors test whether de novo PCP establishment depends on an 'inhibitory signal', as previously postulated (Meinhardt, 2007), but do not find evidence. They also test whether core PCP proteins help to orient microtubules (which could enhance cell intrinsic polarization of core PCP proteins), but, again, do not find evidence, corroborating previous work (Harumoto et al, 2010). The most significant finding of this manuscript, perhaps, is the observation that local de novo PCP establishment does not propagate far through the tissue. A limitation of the study is that the mechanisms establishing intrinsic cell scale polarity remain unknown. The work will likely be of interest to specialists in the field of PCP.

  2. Aug 2025
    1. eLife Assessment

      This important study investigates how signals from the nervous system can influence the response to different food sources. To demonstrate the role of specific neuronal and intestinal regulators in sensing food quality and modulating digestion, the authors present evidence through a combination of genetic screening, RNA-seq analysis, and functional studies. These findings shed light on an adaptive strategy to integrate food perception with physiological responses, with a mix of solid and convincing evidence supporting the work.

    2. Reviewer #1 (Public review):

      Summary:

      In this manuscript, Liu et al have tried to dissect the neural and molecular mechanisms that C. elegans use to avoid the digestion of harmful bacterial food. Liu et al show that C. elegans use ON-OFF state of AWC olfactory neurons to regulate the digestion of harmful gram-positive bacteria S. saprophyticus (SS). Authors show that when C. elegans are fed on SS food, AWC neurons switch to OFF fate, which prevents the digestion of S. saprophyticus, and this helps C. elegans avoid these harmful bacteria. Using genetic and transcriptional analysis as well as making use of previously published findings, Liu et al implicate p38 MAPK pathway (in particular, NSY-1, the C. elegans homolog of MAPKKK ASK1) and insulin signaling in this process.

      Strengths:

      The revised manuscript has improved significantly. The authors have addressed almost all the comments that I had in my initial review.

      Weaknesses:

      None.

    3. Reviewer #2 (Public review):

      Summary:

      Using C. elegans as a model, the authors present an interesting story demonstrating a new regulatory connection between olfactory neurons and the digestive system. Mechanistically, they identified key factors (NSY-1, STR-130 et.al) in neurons, as well as critical 'signaling factors' (INS-23, DAF-2) that bridge different cells/tissues to execute the digestive shutdown induced by poor-quality food (Staphylococcus saprophyticus, SS).

      Strengths:

      The conclusions of this manuscript are mostly well supported by the experimental results shown.

      Weaknesses:

      The authors have done a nice job in addressing my comments.

    4. Reviewer #3 (Public review):

      Summary:

      The study explores a molecular mechanism by which C. elegans detects low-quality food through neuron-digestive crosstalk, offering new insights into food quality control systems. Liu and colleagues demonstrated that NSY-1, expressed in AWC neurons, is a key regulator for sensing Staphylococcus saprophyticus (SS), inducing avoidance behavior and shutting down the digestive system via intestinal BCF-1. They further revealed that INS-23, an insulin peptide, interacts with the DAF-2 receptor in the gut to modulate SS digestion. The study uncovers a food quality control system connecting neural and intestinal responses, enabling C. elegans to adapt to environmental challenges.

      Strengths:

      The study employs a genetic screening approach to identify nsy-1 as a critical regulator in detecting food quality and initiating adaptive responses in C. elegans. The use of RNA-seq analysis is particularly noteworthy, as it reveals distinct regulatory pathways involved in food sensing (Figure 4) and digestion of Staphylococcus saprophyticus (Figure 5). The strategic application of both positive and negative data mining enhances the depth of analysis. Importantly, the discovery that C. elegans halts digestion in response to harmful food and employs avoidance behavior highlights a physiological adaptation mechanism.

      Weaknesses:

      Major weaknesses have been addressed.

    5. Author response:

      The following is the authors’ response to the original reviews.

      Reviewer #1 (Public review):

      Summary:

      In this manuscript, Liu et al have tried to dissect the neural and molecular mechanisms that C. elegans use to avoid digestion of harmful bacterial food. Liu et al show that C. elegans use the ON-OFF state of AWC olfactory neurons to regulate the digestion of harmful gram-positive bacteria S. saprophyticus (SS). The authors show that when C. elegans are fed on SS food, AWC neurons switch to OFF fate which prevents digestion of S. saprophyticus and this helps C. elegans avoid these harmful bacteria. Using genetic and transcriptional analysis as well as making use of previously published findings, Liu et al implicate the p38 MAPK pathway (in particular, NSY-1, the C. elegans homolog of MAPKKK ASK1) and insulin signaling in this process.

      Strengths:

      The authors have used multiple approaches to test the hypothesis that they present in this manuscript.

      Weaknesses:

      Overall, I am not convinced that the authors have provided sufficient evidence to support the various components of their hypothesis. While they present data that loosely align with their hypothesis, they fail to consider alternative explanations and do not use rigorous approaches to strengthen their overall hypothesis. The selective picking of genes from the RNA sequencing data and forcing the data to fit the proposed hypothesis based on previously published findings, without exploring other approaches, indicates a lack of thoroughness and rigor. These critical shortcomings significantly diminish enthusiasm for the manuscript in its totality. In my opinion, this is the biggest weakness in this manuscript.

      We appreciate the reviewer’s all the suggestions which help us to improve this paper. We now addressed reviewer’s comments at the section of “Reviewer #1 (Recommendations for the authors)”

      Reviewer #2 (Public review):

      Summary:

      Using C. elegans as a model, the authors present an interesting story demonstrating a new regulatory connection between olfactory neurons and the digestive system.

      Mechanistically, they identified key factors (NSY-1, STR-130 et.al) in neurons, as well as critical 'signaling factors' (INS-23, DAF-2) that bridge different cells/tissues to execute the digestive shutdown induced by poor-quality food (Staphylococcus saprophyticus, SS).

      Strengths:

      The conclusions of this manuscript are mostly well supported by the experimental results shown.

      Weaknesses:

      Several issues could be addressed and clarified to strengthen their conclusions.

      (1) The word "olfactory" should be carefully used and checked in this manuscript. Although AWCs are classic olfactory neurons in C. elegans, no data in this manuscript supports the idea that olfactory signals from SS drive the responses in the digestive system. To validate that it is truly olfaction, the authors may want to check the responses of worms (e.g. AWC, digestive shutdown, INS-23 expression) to odors from SS.

      We appreciate the reviewer’s careful attention to terminology. We agree that the term "olfactory" requires direct experimental validation. However, in this paper, we only used "olfactory" to specific define the AWC neurons. As reviewer’s suggestion, we now deleted the word “olfactory”.

      (2) In line 113, what does "once the digestive system is activated" mean? The authors need to provide a clearer statement about 'digestive activation' and 'digestive shutdown'.

      Previously, we observed that activating larval digestion with heat-killed E. coli or E. coli cell wall peptidoglycan (PGN) enabled the digestion of SS as food (Hao et al., 2024). Additionally, when animals reached the L2 stage by feeding normal OP50 diet, they could utilize SS as a food source to support growth (Figure 1figure supplement 1D). These findings suggest that once digestion is activated (via E. coli components or L2-stage maturation), worms gain the capacity to process SS as a viable food source, abolishing SS-induced growth impairment (Hao et al., 2024) ( Figure 1figure supplement 1D).

      (3) No control data on OP50. This would affect the conclusions generated from Figures 2A, 2B, 2D, 3B, 3C, 3G, 4D-G, 5D-E, 6B-D.

      We appreciate  this point. The central goal of the experiments listed (Figures 2A,B,D; 3B,C,G; 4D-G; 5D-E; 6B-D) was not to compare growth or behavior between SS and OP50 under standard conditions, but rather to understand the genetic basis of the C. elegans response specifically to SS, as identified through our nsy-1 mutant screen.

      Our data in Figure 1 clearly establishes the fundamental difference in growth and feeding behavior when larvae encounter SS compared to OP50 (Figures 1A,B). Having established SS as an unfavorable food source that triggers a specific protective response (digestive shutdown), the subsequent experiments focus on deciphering how this response is mediated.

      Therefore, within these specific experimental contexts under SS feeding: The primary comparison is between wild-type (N2) and nsy-1 mutant animals. All assays (growth, behavior, survival) are performed under the same SS feeding conditionsfor both genotypes.

      This design allows us to directly assess the functional role of NSY-1 in mediating the SS-specific response pathway we are investigating. Including an OP50 control for every figure would not address this core genetic question and could introduce confounding variables given the established difference in how C. elegans treats these two food sources. The critical internal control for these specific experiments is the performance of the wild-type under SS versus the mutant under SS.

      (4) Do the authors know which factors are released from AWC neurons to drive the digestive shutdown?

      Enrichment analysis revealed that genes related to extracellular functions, such as insulin-related genes, are induced in nsy-1 mutant animals (Figure 5—figure supplement 1A, Supplementary file 4). Further analysis of insulin-related genes from the RNA-seq data showed that ins-23 is predominantly induced in nsy-1 mutant animals (Figure 5—figure supplement 1B), suggesting its potential role in promoting SS digestion. We found that knockdown of ins-23 in nsy-1 mutants inhibited SS digestion (Figure 5D). Given that INS-23 is expressed in AWC neurons (Figure 5figure supplement 3A, CeNGEN), this suggests increased production and likely enhanced release of INS-23 from AWC neurons in the nsy-1 mutant background, which promotes SS digestion.

      The insulin/insulin-like growth factor signaling (IIS) pathway, particularly through the DAF-2 receptor, integrates nutritional signals to regulate various behavioral and physiological responses related to food (Kodama et al., 2006; Ryu et al., 2018). It has been shown that INS-23 acts as an antagonist for the DAF-2 receptor to promote larval diapause (Matsunaga et al., 2018). To test whether ins-23 induction in nsy-1 mutants promotes SS digestion through its receptor, DAF-2, we constructed a nsy-1; daf-2 double mutant. We found that the SS digestion ability of the nsy-1 mutant was inhibited by the daf-2 mutation. This suggests that the nsy-1 mutation induces the insulin peptide ins-23, which promotes SS digestion through its potential receptor, DAF-2.

      The data supports a model where AWC neurons regulate digestion via the release of INS-23. Loss of nsy-1 function increases INS-23 release from AWC, activating DAF-2 signaling and promoting digestion. Conversely, in wild-type animals, reduced INS-23 release from AWC contributes to digestive shutdown in response to SS food.

      Reviewer #3 (Public review):

      Summary:

      The study explores a molecular mechanism by which C. elegans detects low-quality food through neuron-digestive crosstalk, offering new insights into food quality control systems. Liu and colleagues demonstrated that NSY-1, expressed in AWC neurons, is a key regulator for sensing Staphylococcus saprophyticus (SS), inducing avoidance behavior and shutting down the digestive system via intestinal BCF-1. They further revealed that INS-23, an insulin peptide, interacts with the DAF-2 receptor in the gut to modulate SS digestion. The study uncovers a food quality control system connecting neural and intestinal responses, enabling C. elegans to adapt to environmental challenges.

      Strengths:

      The study employs a genetic screening approach to identify nsy-1 as a critical regulator in detecting food quality and initiating adaptive responses in C. elegans. The use of RNA-seq analysis is particularly noteworthy, as it reveals distinct regulatory pathways involved in food sensing (Figure 4) and digestion of Staphylococcus saprophyticus (Figure 5). The strategic application of both positive and negative data mining enhances the depth of analysis. Importantly, the discovery that C. elegans halts digestion in response to harmful food and employs avoidance behavior highlights a physiological adaptation mechanism.

      Weaknesses:

      Major points:

      (1) While NSY-1 positively regulates str-130 expression in AWC neurons and is critical for SS avoidance and survival, the authors should examine whether similar phenotypes are observed in str-130 mutants.

      In this study, we mainly focused on how worms sense adverse food sources (SS food) and shutdown digestion (not growth as digestion shutdown readout). We found that nsy-1 in AWC play key roles in response SS food, once nsy-1 mutation, mutant animals cannot detect SS food and digest it, therefore growth under SS food. From RNA-seq, we found that nsy-1 positively regulates several sensory perception related genes (sra-32, str-87, str-112, str-130, str-160, str-230) (Figure 4figure supplement 1A, Supplementary file 2). After screen, we found that we found that knockdown of str-130 in wild-type animals promoted SS digestion, thereby supporting animal growth (Figure 4D), and the proportion of animals with two AWC<sup>OFF</sup> neurons decreased (Figure 4E). Secondly, we found that overexpression of str-130 in nsy-1 mutant animals inhibited SS digestion, thereby slowing animal growth (Figure 4F), and the proportion of animals with two AWC<sup>OFF</sup> neurons increased (Figure 4G). These results demonstrate that NSY-1 promotes the AWC<sup>OFF</sup> state by inducing str-130 expression, which in turn inhibits SS digestion in C. elegans.

      (2) NSY-1 promotes the AWC-OFF state through str-130, inhibiting SS digestion. The authors should investigate whether STR-130 in AWC neurons regulates bcf-1 expression levels in the intestine.

      We agree with the reviewer's suggestion regarding the potential role of STR-130 in AWC neurons regulating intestinal bcf-1 expression. To address this, we generated transgenic worms with AWC-specific knockdown of str-130, achieved by rescuing sid-1 cDNA expression under the ceh-36 promoter (AWC-specific) in sid-1(qt9);BCF-1::GFP background worms.

      We observed that AWC neuron-specific RNAi of str-130 elevated intestinal BCF-1::GFP expression (Figure 6—figure supplement 1B). This demonstrates that STR-130 functions cell-non-autonomously in AWC neurons to repress BCF-1 expression in the intestine.

      (3) The current results rely on str-2 expression levels to indicate the AWC state. Ablating AWC neurons and testing the effects on digestion would provide stronger evidence for their role in digestive regulation.

      To confirm the important of AWC state in SS digestion, we performed AWC-specific neuron ablation experiments using previously validated transgenic strain that expresses cleaved caspase under the AWC-specific promoter, ceh-36 (ceh-36p::caspase). Critically, worms with ablated AWC neurons completely failed to digest SS food (Figure 3—figure supplement 4), phenocopying the non-digesting state of wild-type worms on SS when AWC-OFF signaling is impaired. This result directly confirms that functional AWC neurons are essential for initiating SS digestion, aligning with our model where the AWC-OFF state (induced by SS) inhibits digestion while the AWC-ON state promotes it.

      Furthermore, we previously study discovered that AWC ablation activates the intestinal mitochondrial unfolded protein response and inhibits food digestion, mechanistically linking neuronal integrity to gut stress responses and digestive inhibition.

      Together, these functional ablation studies provide compelling physiological evidence that AWC neurons act as central regulators of food-state sensing and gut function.

      (4) The claim that NSY-1 inhibits INS-23 and that INS-23 interacts with DAF-2 to regulate bcf-1 expression (Line 339-340) requires further validation. Neuron-specific disruption of INS-23 and gut-specific rescue of DAF-2 should be tested.

      We agree with the reviewer that the proposed NSY-1 ⊣ INS-23 → DAF-2 → BCF-1 signaling axis requires tissue-specific validation. To address this, we conducted compartment-specific functional dissection of INS-23 and DAF-2:

      AWC neuronal role of INS-23:

      To test whether INS-23 acts in AWC neurons to regulate intestinal BCF-1, we generated AWC-specific knockdown strains which was achieved by rescuing sid-1 cDNA expression under the ceh-36 promoter in a sid-1(qt9);BCF-1::GFP background. We found that AWC-restricted ins-23 knockdown significantly reduced intestinal BCF-1::GFP expression (Figure 6—figure supplement 1A). This confirms that INS-23 functions cell-non-autonomously within AWC sensory neurons to activate intestinal BCF-1, consistent with NSY-1’s upstream inhibition of INS-23 in this neuronal  subtype

      Intestinal role of DAF-2 as INS-23 receptor:

      To investigate weather DAF-2 acts as the gut-localized receptor for neuronal INS-23 signaling, we performed tissue-specific rescue experiments in the nsy-1(ag3);daf-2(e1370) double mutant. When DAF-2 was re-introduced specifically in the intestine (using the ges-1 promoter), we observed a significant suppression of SS digestion (Figure 5—figure supplement 3B), but not rescue digestive defect. This indicates that INS-23 induction in nsy-1 mutants promotes digestion independently of intestinal DAF-2 function.

      (5) Figure Reference Errors: Lines 296-297 mention Figure 6E, which does not exist in the main text. This appears to refer to Figure 5E, which has not been described.

      We corrected this.

      Reviewer #1 (Recommendations for the authors):

      I would like the authors to address the following comments in a resubmission.

      (1) The hallmark of the activated p38 MAPK pathway is the phosphorylation of most downstream kinase p38 (PMK-1/PMK2 in C. elegans) of this kinase cascade. Previous work from Bergmann lab showed that the most downstream kinase of this pathway, PMK-1/PMK-2, is not required for AWC asymmetry. I wonder whether that is the case also for the model that Liu et al have presented in this manuscript. Since p38/PMK-1 undergoes activation (phosphorylation) in response to pathogenic bacteria like P. aeruginosa, it is worth testing whether PMK-1 plays a role downstream of NSY-1 in the model that Liu et al present in this manuscript. It would be worth testing whether there is increased phosphorylation of p38 when C. elegans are fed SS and whether that phosphorylation regulates downstream components that Liu et al have identified in this manuscript.

      We thank the reviewer for raising this important point regarding PMK-1/p38 MAPK signaling. As established in our prior work (Reference 1), SS exposure triggers phosphorylation of PMK-1 (P-PMK-1) in C. elegans, and pmk-1 mutants exhibit enhanced growth on SS (Figure-1, Figure-2). This confirms that PMK-1-mediated innate immune signaling actively regulates SS responsiveness and digestion.

      To address whether PMK-1 functions downstream of NSY-1 within our proposed model, we performed critical epistasis analyses. While we observed that nsy-1 mutation elevates ins-23 (indicating NSY-1 suppression of ins-23), knockdown of pmk-1 did not alter ins-23 expression levels (Figure 5-figure supplement 3C). This demonstrates that PMK-1 does not operate through the ins-23 pathway to regulate SS digestion. Thus, although both pathways respond to SS, the PMK-1-mediated innate immune response and the NSY-1/INS-23 axis constitute distinct regulatory mechanisms governing digestive adaptation.

      Reference 1: Geng, S., Li, Q., Zhou, X., Zheng, J., Liu, H., Zeng, J., Yang, R., Fu, H., Hao, F., Feng, Q., & Qi, B. (2022). Gut commensal E. coli outer membrane proteins activate the host food digestive system through neural-immune communication. Cell host & microbe, 30(10), 1401–1416.e8. https://doi.org/10.1016/j.chom.2022.08.004

      (2) Since p38 MAPK pathway has a well-established role in host defense in the C. elegans intestine, it is important to show that NSY-1 does not function in the intestine in the model that Liu et al present. I would like the authors to reintroduce nsy-1 in C. elegans intestine in nsy-1 mutant animals and then test whether it has any effect on worm length on SS food (similar to what is done in Figure 3 for AWC-specific nsy-1).

      Beyond its  established  role  in  AWC  neurons,  we  detected  NSY-1 expression in the intestine (Figure 3-figure supplement 2A). To assess intestinal NSY-1 function, we performed tissue-specific rescue experiments in nsy-1 mutants using the intestinal-specific vha-1 promoter. Intestinal expression of NSY-1 significantly suppressed the enhanced SS digestion phenotype in nsy-1 mutants (Figure 3-figure supplement 2B), demonstrating functional involvement of gut-localized NSY-1 in regulating digestive responses. We propose intestinal NSY-1 mediates this effect through innate immune signaling, consistent with its known pathway components. As previously established (Reference 1), the canonical PMK-1/p38 MAPK pathway functions downstream of NSY-1, with both sek-1 and pmk-1 knockdown enhancing SS digestion through immune modulation. This indicates intestinal NSY-1 suppresses digestion may act through PMK-1-mediated immune responses. Since neuronal NSY-1's role in digestive control was previously undefined, we prioritized mechanistic analysis of its neuronal function in digestion regulation.

      Notably, this immune-mediated mechanism operates independently of NSY-1's neuronal regulation pathway. In AWC neurons, NSY-1 controls digestion exclusively through the neuropeptide signaling axis (INS-23/DAF-2/BCF-1) without engaging innate immune components.

      Reference 1: Geng, S., Li, Q., Zhou, X., Zheng, J., Liu, H., Zeng, J., Yang, R., Fu, H., Hao, F., Feng, Q., & Qi, B. (2022). Gut commensal E. coli outer membrane proteins activate the host food digestive system through neural-immune communication. Cell host & microbe, 30(10), 1401–1416.e8. https://doi.org/10.1016/j.chom.2022.08.004

      (3) At multiple places, wild-type (WT) controls have been labeled as N2. It is better to label all controls as WT (and not as N2).

      Corrected.

      (4) In Figure 2B, the aversion response should be scored at multiple time points, like Figure 1C, rather than at just one timepoint.

      We thank the reviewer for suggesting multi-timepoint analysis of aversion behavior. In accordance with this recommendation, we have now quantified SS avoidance at multi-timepoint. As shown in the revised Figure 2B, nsy-1 mutants exhibited significantly impaired avoidance responses at both 4h and 6h but not at 8h, confirming that NSY-1 is essential for sustained aversion to SS food in the early response. This data demonstrates that the critical role of NSY-1 in food discrimination at initial sensory responses.

      (5) Does the re-introduction of nsy-1 in AWC neurons in nsy-1 mutant background help animals avoid SS in dwelling and food-choice assays? Along the same lines, does the CRISPR-generated AWC-specific mutant of NSY-1 fail to avoid SS in dwelling and food-choice assays similar to the whole-animal mutant? These behavioral data are missing in Figure 3.

      We thank the reviewer for prompting behavioral validation of AWC-specific nsy-1 functions. To determine whether NSY-1 in AWC neurons mediates SS sensory perception, we performed dwelling (avoidance) and food-choice assays using AWC-specific nsy-1 knockout and AWC-rescued strains (nsy-1(ag3); Podr-1::nsy-1). In dwelling assays, AWC-specific nsy-1 KO mutants exhibited significantly impaired SS avoidance at 6h (Figure 3-figure supplement 3A), while AWC-rescued strains restored avoidance capacity at 2-6h (Figure 3-figure supplement 3B). Food-choice assays further revealed that AWC nsy-1 KO mutants preferentially migrated toward SS (Figure 3-figure supplement 3C), whereas AWC-rescued showed no preference between SS and HK-E. coli (Figure 3-figure supplement 3D). These data conclusively demonstrate that NSY-1 acts in AWC neurons to mediate SS recognition and aversion behaviors.

      (6) In Figure 3E and F, the number of animals that were used for scoring AWC str-2p::GFP expression should be specified.

      we added the number of animals in the figure.

      (7)  RNA seq analysis identified multiple GPCRs (including STR-130) that are upregulated in an NSY-1-dependent manner when animals are fed with SS bacteria. However, the authors decided to only characterize STR-130 because of previously published findings. It is important to rule out the role of other GPCRs since all are upregulated on SS food as shown in Figure S4 B. I would like the authors to knock down other GPCRs in the same manner as they did for STR-130 and demonstrate that only str-130 knockdown behaves similarly to the nsy-1 mutant (if that is the case) using the assay presented in Figure 4 D.

      We appreciate the reviewer’s suggestion to comprehensively evaluate NSY-1-regulated GPCRs. In response, we extended our functional analysis to all six GPCRs (str-130, str-230, str-87, str-112, str-160, and sra-32) identified as NSY-1-dependent and SS-induced in RNA-seq (Figure 4—figure supplement 1).

      Using RNAi knockdown and the SS growth assay, we observed that RNAi of str-130, str-230, str-87, or str-112 significantly enhanced SS growth (Figure 4—figure supplement 2A), with str-130 RNAi exhibiting the most robust phenotype—phenocopying nsy-1 mutants. Crucially, none of these GPCR knockdowns further enhanced growth in nsy-1(ag3) mutants (Figure 4—figure supplement 2B), confirming their position downstream of NSY-1. These data establish str-130 as the dominant effector of NSY-1-mediated SS response regulation, while suggesting minor contributions from other GPCRs (str-230, str-87, str-112).

      (8) In Figure 4E and G, the number of animals that were used for scoring GFP expression should be specified.

      we added the number of animals in the figure.

      (9) When comparing Figure 3E and Figure 4E, it appears that the loss of str-130 RNAi does not phenocopy nsy-1 mutant. This raises the question of whether the inefficiency of RNAi targeting str-130 is the cause, or if STR-130 is not the only GPCR regulated by NSY-1 on SS food. I would like the authors to address this discrepancy. If RNAi inefficiency is indeed the cause, using an RNAi-sensitive background, such as an eri- 1 mutant, could help strengthen the data presented in Figure 4E. Conversely, if RNAi inefficiency is not responsible for the discrepancy, I suggest that the authors investigate the roles of other GPCRs that were identified by RNA sequencing.

      We appreciate the reviewer’s observation regarding the phenotypic difference between nsy-1 mutants and str-130 (RNAi) animals on SS food (Fig. 3E vs Fig. 4E).

      While both genetic perturbations significantly enhance SS growth and increase the proportion of animals exhibiting AWC<sup>ON</sup> states compared to wild type (indicating enhanced digestion), the specific AWC<sup>ON </sup> neuron configurations differ: nsy-1 mutants predominantly show 2 AWC<sup>ON</sup> animals, whereas str-130(RNAi) animals primarily exhibit the 1 AWC<sup>ON</sup> /1 AWC<sup>OFF</sup> configuration (Fig. 3E vs Fig. 4E).

      This difference likely arises because STR-130 is the key GPCR mediating NSY-1's inhibitory effect on SS digestion, but it is not the sole GPCR involved, as evidenced by our RNAi screen identifying several additional NSY-1-regulated GPCRs (str-230, str-87, str-112) whose depletion also enhanced SS growth (Fig. 4A-D).

      The robust SS growth enhancement and AWC<sup>ON </sup> state increase caused by str-130 (RNAi) (phenocopying the nsy-1 mutant’s functional outcome of enhanced digestion) (Figure 4D, 4E) indicate effective RNAi knockdown for this specific assay. Therefore, the distinct neural configurations reflect the partial redundancy among GPCRs downstream of NSY-1, rather than an inherent inefficiency of the str-130 RNAi.

      The nsy-1 mutant phenotype represents the complete loss of all inhibitory GPCR signaling coordinated by NSY-1, while str-130(RNAi) represents the loss of its major component. Investigating the roles of other identified GPCRs (str-230, str-87, str-112) in modulating AWC<sup>ON </sup> neuron states is an important direction for future research.

      (10) In Figure 4 F and 4 G, the authors show that the overexpression of STR-130 rescues the nsy-1 mutant phenotype suggesting that NSY-1 might function through STR-130 to control digestion on SS food. These data place STR-130 downstream of NSY-1. To further strengthen these epistasis data, authors should knock down str-130 in nsy-1 mutant animals and show that the combined loss of both genes produces the same effect as the loss of either gene alone.

      We thank the reviewer for the insightful suggestion to further define the genetic relationship between nsy-1 and str-130. To strengthen our epistasis analysis, we performed RNAi knockdown of str-130 in the nsy-1(ag3) mutant background and assessed development on SS food. Consistent with STR-130 acting downstream of NSY-1, the loss of str-130 via RNAi did not further enhance the developmental capacity (i.e., growth phenotype) of nsy-1(ag3) mutant animals on SS. This lack of enhancement indicates that str-130 and nsy-1 function within the same genetic pathway, with str-130 acting epistatically downstream of nsy-1 (Figure 4—figure supplement 3). This finding reinforces the model proposed from our overexpression data (Fig. 4F-G) – that NSY-1 primarily exerts its inhibitory effect on SS digestion by inducing the expression GPCR STR-130.

      (11) In Figure 5C, please mention "ins-23 transcript levels" on the top of the graph so that it is clear what these data represent.

      We appreciate the reviewer’s suggestion.

      (12) Since all ins genes were upregulated in nsy-1 mutants (though ins-23 was indeed the most highly upregulated gene) on SS food from RNA seq analysis (Figure S5 B), it is important to first phenotypically characterize all of them using "worm length assay". If this analysis shows that ins-23 has the most robust phenotype, it would make more sense to just focus on ins-23.

      We agree with the reviewer that initial phenotypic characterization of candidate genes identified through transcriptomic analysis is valuable.Our RNA-seq data revealed that several insulin-like peptide genes, including ins-22, ins-23, ins-24, and ins-27, were significantly upregulated in the nsy-1 mutant on SS food (Figure 5—figure supplement 1B). We prioritized these insulin-like peptide genes for functional validation because they are known to act as neuropeptides capable of mediating non-cell autonomous signaling in previous studies (Shao et al 2016).

      To determine if any were functionally responsible for the enhanced SS growth observed in nsy-1 mutants, we performed functional phenotypic screening using the SS growth assay (worm length assay). We individually knocked down each of these candidates (ins-22, ins-23, ins-24, ins-27) in the nsy-1(ag3) mutant background. Among these, only RNAi targeting ins-23 significantly attenuated (i.e., suppressed) the enhanced development of the nsy-1(ag3) mutant on SS (Figure 5—figure supplement 2). This targeted functional screening revealed that ins-23 has the most robust and specific role in mediating the enhanced digestion phenotype downstream of NSY-1 loss, providing the critical justification for our subsequent focus on this particular insulin-like peptide.

      Ref:

      Shao, L. W., Niu, R., & Liu, Y. (2016). Neuropeptide signals cell non-autonomous mitochondrial unfolded protein response. Cell research, 26(11), 1182–1196. https://doi.org/10.1038/cr.2016.118

      Reviewer #2 (Recommendations for the authors):

      There are several minor errors and typos in the manuscript

      (1) A number of typos in the figures, like "length".

      Corrected.

      (2) The 'axis labels' are inconsistent from panel to panel, like "relative body length" and "relative worm length".

      Corrected.

      (3) The fonts are inconsistent from panel to panel.

      Corrected.

      (4) There is no Ex unique number for transgenic lines.

      Corrected.

      Reviewer #3 (Recommendations for the authors):

      Minor points:

      (1)  Figure 3B, 3C, 3G, 4D, 4F, 5D, 5E, and 6C: Replace "lenth" with "length" (consistent with Figure 2A).

      Corrected.

      (2) Figure 4D: Correct "ctontrol" to "control."

      Corrected.

      (3) Figure 4G: Update the co-injection marker to Podr-1::GFP instead of Pstr-2::GFP.

      Corrected.

      (4) Figure 5C: This figure is missing from the Results section.

      Corrected.

      (5) Figure 6A: Label the graph with Pbcf-1::bcf-1::GFP, as in Figure 6D.

      Corrected.

      (6) Italicization: Lines 588 and 603-italicize nsy-1.

      Corrected.

      (7) Supplementary Figure S2A: Correct "Screeng" to "Screening."

      Corrected.

      (8) Spelling/Proofreading: Ensure consistent spelling and grammar, such as correcting "mutan" to "mutant" in Figure 4A.

      Corrected.

    1. eLife Assessment

      In this valuable manuscript, Rao and colleagues investigate the UFD-1/NPL-4 complex, which is involved in extracting misfolded proteins in the plasma membrane and the accumulation of pathogenic bacteria in the intestine. Using convincing methods, the authors find that knockdown of the ufd-1 and npl-4 genes leads to shortened lifespan of the nematode C. elegans and reduced accumulation of the bacterial pathogen P. aeruginosa in the intestine.

    2. Reviewer #1 (Public review):

      The authors adequately addressed the concerns I raised in my initial review, which are noted below.

      (1) I suggest that the authors choose a different term in their title, abstract and manuscript to describe the phenotypes associated with ufd-1 and npl-4 knockdown other than an "inflammation-like response." Inflammation is a pathological term with four cardinal signs: redness (rubor), swelling (tumor), warmth (calor) and pain (dolor). These are not symptoms known to occur in C. elegans. The authors could consider using "inappropriate," "aberrant" or "toxic" immune activation in the title and abstract.

      (2) I think it is important to point out in the context of the authors novelty claim in the abstract and manuscript that the toxic effects of inappropriate immune activation in C. elegans has been widely catalogued. For example: doi.org/10.1371/journal.ppat.1011120 (2023); doi:10.1186/s12915-016-0320-z (2016).; doi:10.1126/science.1203411 (2011); doi:10.1534/g3.115.025650 (2016). In addition, doi:10.7554/eLife.74206 (2022) previously described a mutation that caused innate immune activation that reduced accumulation of P. aeruginosa in the intestine, but also caused animals to have a shortened lifespan.

      Thus, I do not think this study reveals the existence of inflammatory-like responses in C. elegans, as stated by the authors. Indeed, I think it is important for the authors to remove this novelty claim from their paper and discuss their work in the context of these studies in a paragraph in the introduction.

      (3) The authors rely on the use of RNAi of ufd-1 and npl-4 to study their effect on P. aeruginosa colonization and pathogen resistance throughout the manuscript. To address the possibility of off-target effects of the RNAi, the authors should consider both (i) showing with qRT-PCR that these genes are indeed targeted during RNAi, and (ii) confirming their phenotypes with an orthologous technique, preferably by studying ufd-1 and npl-4 loss-of-function mutants [both in the wild-type and sek-1(km4) backgrounds]. If mutation of these genes is lethal, the authors could use Auxin Inducible Degron (AID) technology to induce the degradation of these proteins in post-developmental animals.

      (4) I am confused about the author's explanation regarding their observation that inhibition of the UFD-1/ NPL-4 complex extends the lifespan of sek-1(km25) animals, but not pmk-1(km25) animals, as SEK-1 is the MAPKK that functions immediately upstream of the p38 MAPK PMK-1 to promote pathogen resistance.

      I am also confused why their RNA-seq experiment revealed a signature of intracellular pathogen response genes and not PMK-1 targets, which the authors propose is accounting for toxic immune activation. Activation of which immune response leads to toxicity?

      (5) The authors did not test alternative explanations for why UFD-1/ NPL-4 complex inhibition compromises survival during pathogen infection, other than exuberant immune activation. For example, it is possible that inhibition of this proteosome complex shortens lifespan by compromising the general health/ normal physiology of nematodes. Immune responses could be activated as a secondary consequence of this stress, and not be a direct cause of early mortality. Does sek-1(km4) mutant suppress the lifespan shortened lifespan of ufd-1 and npl-4 knockdown? This experiment should also be done with loss-of-function mutants, as noted in point 3.

      (6) The conclusion of Figure 6 hinges on an experiment that uses double RNAi to knockdown two genes at the same time (Fig. 6D and 6G), an approach that is inherently fraught in C. elegans biology owing to the likelihood that the efficiency of RNAi-mediated gene knockdown is compromised and may account for the observed phenotypes. The proper control for double RNAi is not empty vector + ufd-1(RNAi), but rather gfp(RNAi) + ufd-1(RNAi), as the introduction of a second hairpin RNA is what may compromise knockdown efficiency. In this context, it is important to confirm that knockdown of both genes occurs as expected (with qRT-PCR) and to confirm this phenotype using available elt-2 loss-of-function mutants.

      (7) A supplementary table with the source data for at least three replications (mean lifespan, n, statistical comparison) for each pathogenesis assay should be included in this manuscript.

      Comments on revisions:

      The authors adequately addressed the concerns I raised.

    3. Reviewer #2 (Public review):

      Summary:

      The authors aimed to uncover what role, if any, the UFD1/NPL4 complex might play in innate immune responses of the nematode C. elegans. The authors find that loss of the complex renders animals more sensitive to both pathogenic and non-pathogenic bacteria. However, there appears to be a complex interplay with known innate immune pathways since loss of UFD1/NPL4 actually results in increased survival of animals lacking the canonical innate immune pathways.

      Strengths:

      The authors perform robust genetic analysis to exclude and include possible mechanisms by which the UFD1/NPL4 pathway acts in the innate immune response.

      Weaknesses:

      The argument that the loss of the UFD1/NPL4 complex triggers a response that mimics that of an intracellular pathogen is not thoroughly investigated. Additionally, the finding of a role of the GATA transcription factor, ELT-2, in this response is suggestive, but experiments showing sufficiency in the context of loss of the UFD1/NPL4 complex need to be explored.

      Comments on revisions:

      The authors have performed several control experiments for their RNAi based experiments and also tested the requirement for xbp-1s in their paradigm. The findings and their interpretations are acceptable.

    4. Author response:

      The following is the authors’ response to the original reviews.

      Reviewer #1 (Public Review):

      (1) I suggest that the author's choose a different term in their title, abstract and manuscript to describe the phenotypes associated with ufd-1 and npl-4 knockdown other than an "inflammation-like response." Inflammation is a pathological term with four cardinal signs: redness (rubor), swelling (tumor), warmth (calor) and pain (dolor). These are not symptoms know to occur in C. elegans. The authors could consider using "tolerance" instead, as this term may better describe their findings.

      We have changed “inflammation-like response” to “aberrant immune response” throughout the manuscript.

      (2) It would help the reader to better understand the novelty of the findings in this study if the authors include a paragraph in their introduction to put their results in context of the published literature that has examined the relationship between immune activation and nematode health and survival. In particular, I suggest that the authors discuss doi:10.7554/eLife.74206 (2022), a study that charcterized a similar observation to what the authors are reporting. This study found that low cholesterol reduces pathogen tolerance and host survival during pathogen infection. Cholesterol scarcity increases p38 PMK-1 phosphorylation, priming immune effector induction in a manner that reduces pathogen accumulation in the intestine during a subsequent infection. I also suggest that the authors highlight in this introductory paragraph that the toxic effects of inappropriate immune activation in C. elegans has been widely catalogued. For example: doi.org/10.1371/journal.ppat.1011120 (2023); doi:10.1186/s12915-016-0320-z (2016).; doi:10.1126/science.1203411 (2011); doi:10.1534/g3.115.025650 (2016).

      In this context, the authors could consider re-wording their novelty claim in the abstract and introduction to take into account this previous body of work.

      We have added a paragraph to the Discussion section to place our findings in the context of previous research. The revised manuscript now includes the following text (page 11, lines 336–344): “Previous studies have shown that hyperactivation of immune pathways can negatively affect organismal development. For example, sustained activation of the p38 MAPK pathway impairs development in C. elegans (Cheesman et al., 2016; Kim et al., 2016), and excessive activation of the IPR also leads to developmental defects (Lažetić et al., 2023). Similar to our current study, recent work has demonstrated that heightened immune responses can reduce gut pathogen load while paradoxically decreasing host survival during infection (Ghosh and Singh, 2024; Peterson et al., 2022). However, our study uniquely shows that while such heightened immune responses are detrimental to immunocompetent animals, they can be beneficial in the context of immunodeficiency.”

      (3) The authors rely on the use of RNAi of ufd-1 and npl-4 to study their effect on P. aeruginosa colonization and pathogen resistance throughout the manuscript. To address the possibility of off-target effects of the RNAi, the authors should consider both (i) showing with qRT-PCR that these genes are indeed targeted during RNAi, and (ii) confirming their phenotypes with an orthologous technique, preferably by studying ufd-1 and npl-4 loss-offunction mutants [both in the wild-type and sek-1(km4) backgrounds]. If mutation of these genes is lethal, the authors could use Auxin Inducible Degron (AID) technology to induce the degradation of these proteins in post-developmental animals.

      We attempted several protocols of CRISPR in our laboratory to generate ufd-1 loss-of-function mutants; however, these efforts were unsuccessful. While this does not rule out the possibility of generating ufd-1 mutants, the failure is likely due to technical limitations on our part rather than an inherent inability to disrupt the gene. Nevertheless, to confirm the specificity of our RNAi-based approach, we quantified ufd-1 and npl-4 mRNA levels following RNAi treatment and found that each gene was specifically and effectively downregulated by its respective RNAi. 

      Importantly, ufd-1 and npl-4 RNA sequences do not share significant homology, yet knockdown of either gene results in nearly identical phenotypes, including reduced survival on P. aeruginosa, diminished intestinal colonization, and shortened lifespan. These consistent outcomes strongly support the conclusion that the phenotypes are attributable to the disruption of the functional UFD-1-NPL-4 complex. We have added these results in the revised manuscript (pages 4-5, lines 114-125): “To confirm the specificity of the RNAi knockdowns and rule out potential off-target effects, we examined transcript levels of ufd-1 and npl-4 following RNAi treatment. RNAi against ufd-1 significantly reduced ufd-1 mRNA levels without reducing npl-4 expression, while npl-4 RNAi specifically downregulated npl-4 transcripts with no impact on ufd-1 mRNA levels (Figure 1—figure supplement 1A and B). Additionally, alignment of ufd-1 and npl-4 mRNA sequences against the C. elegans transcriptome revealed no significant similarity to other genes, supporting the specificity of the RNAi constructs. Moreover, the ufd-1 and npl-4 RNA sequences do not share significant sequence similarity. Therefore, the highly similar phenotypes observed in ufd-1 and npl-4 knockdown animals, including shortened lifespan, reduced survival on P. aeruginosa, and decreased intestinal colonization with P. aeruginosa, strongly suggest that these outcomes result from the disruption of the functional UFD-1-NPL-4 complex.”

      (4) I am confused about the authors explanation regarding their observation that inhibition of the UFD-1/ NPL-4 complex extends the lifespan of sek-1(km25) animals, but not pmk-1(km25) animals, as SEK-1 is the MAPKK that functions immediately upstream of the p38 MAPK PMK-1 to promote pathogen resistance.

      I am also confused why their RNA-seq experiment revealed a signature of intracellular pathogen response genes and not PMK-1 targets, which the authors propose is accounting for toxic immune activation. Activation of which immune response leads to toxicity?

      We consistently observe that sek-1(km4) mutants are more sensitive to P. aeruginosa infection than pmk-1(km25) mutants, a finding also reported in previous studies (for example, PMID: 33658510). Given that SEK-1 functions upstream of PMK-1 in the MAPK signaling cascade, it is plausible that SEK-1 also regulates additional MAP kinases, such as PMK-2 (PMID: 25671546), which could contribute to the enhanced susceptibility observed in sek-1 mutants.

      Our results show that inhibition of the UFD-1-NPL-4 complex improves survival specifically in severely immunocompromised animals, such as sek-1(km4) mutants, but not in pmk1(km25) mutants. To further validate this, we generated the double mutant dbl-1(nk3);pmk1(km25), which exhibits reduced survival on P. aeruginosa compared to either single mutant.

      Notably, inhibition of the UFD-1-NPL-4 complex also enhances survival in the dbl1(nk3);pmk-1(km25) background, reinforcing the observation that this response is specific to severely compromised immune states.

      We would also like to clarify that the observed phenotypes are independent of the SEK1/PMK-1 pathway, as shown in Figure 3A-3C, Figure 3—figure supplement 1, and Figure 4A-4C. The IPR seems to play a role in the observed phenotypes, as inhibition of some of the protease and pals genes (IPR genes) leads to increased P. aeruginosa colonization in ufd-1 knockdown animals (Figure 6—figure supplement 1). The other immune response pathway that leads to the observed phenotypes is ELT-2, as explained in Figure 6. Finally, we have included in the revised manuscript a note that, in addition, as-yet unidentified pathways are also likely contributing to the phenotypes triggered by disruption of the UFD-1-NPL-4 complex.

      (5) The authors did not test alternative explanations for why UFD-1/ NPL-4 complex inhibition compromises survival during pathogen infection, other than exuberant immune activation. For example, it is possible that inhibition of this proteosome complex shortens lifespan by compromising the general health/ normal physiology of nematodes. Immune responses could be activated as a secondary consequence of this stress, and not be a direct cause of early morality. Does sek-1(km4) mutant suppress the lifespan shortened lifespan of ufd-1 and npl-4 knockdown? This experiment should also be done with loss-offunction mutants, as noted in point 3.

      We have already included this data in Figure 4D, where we observed that ufd-1 and npl-4 knockdown reduce the lifespan of sek-1(km4) animals. It is possible that immune activation is a secondary consequence of cellular stress induced by inhibition of the UFD-1NPL-4 complex. However, our data strongly suggest that the observed phenotypes, including reduced gut pathogen load and decreased survival on the pathogen, are due to the aberrant immune response activated by the inhibition of the UFD-1-NPL-4 complex. Evidence from sek-1(km4) mutants particularly underscores the role of this dysregulated immune activation. While this aberrant immune response is detrimental to wild-type animals under pathogenic conditions, it appears to be beneficial in severely immunocompromised backgrounds. Specifically, in sek-1(km4) mutants, inhibition of the UFD-1-NPL-4 complex enhances survival during P. aeruginosa infection (Figure 4A). However, under non-infectious conditions, where sek-1(km4) mutants exhibit a normal lifespan, the same immune activation becomes harmful (Figure 4D). Together, these findings demonstrate that the aberrant immune response induced by UFD-1–NPL-4 inhibition is context-dependent: it is advantageous only for immunocompromised animals under infection, but deleterious to healthy animals under infection and to both healthy and immunocompromised animals under non-infectious conditions.

      (6) The conclusion of Figure 6 hinges on an experiments that uses double RNAi to knockdown two genes at the same time (Fig. 6D and 6G), an approach that is inherently fraught in C. elegans biology owing the likelihood that the efficiency of RNAi-mediated gene knockdown is compromised and may account for the observed phenotypes. The proper control for double RNAi is not empty vector + ufd-1(RNAi), but rather gfp(RNAi) + ufd1(RNAi), as the introduction of a second hairpin RNA is what may compromise knockdown efficiency. In this context, it is important to confirm that knockdown of both genes occurs as expected (with qRT-PCR) and to confirm this phenotype using available elt-2 loss-of-function mutants.

      We thank the reviewer for this helpful suggestion. We have repeated all double

      RNAi experiments using gfp RNAi as a control instead of the empty vector (Figure 6 and Figure 6—figure supplement 1). Additionally, we assessed the efficiency of gene knockdown in the double RNAi conditions (Figure 6—figure supplement 2) and found that RNAi efficacy was not compromised by the double RNAi treatment.

      (7) A supplementary table with the source data for at least three replications (mean lifespan, n, statistical comparison) for each pathogenesis assay should be included in this manuscript.

      The source data is provided for all the data presented in the manuscript.

      Reviewer #2 (Public Review):

      Summary:

      The authors aimed to uncover what role, if any, the UFD1/NPL4 complex might play in the innate immune responses of the nematode C. elegans. The authors find that loss of the complex renders animals more sensitive to both pathogenic and non-pathogenic bacteria. However, there appears to be a complex interplay with known innate immune pathways since the loss of UFD1/NPL4 actually results in increased survival of animals lacking the canonical innate immune pathways.

      We thank the reviewer for providing an excellent summary of our work.

      Strengths:

      The authors perform robust genetic analysis to exclude and include possible mechanisms by which the UFD1/NPL4 pathway acts in the innate immune response.

      We thank the reviewer for highlighting the strengths of our work.

      Weaknesses:

      The argument that the loss of the UFD1/NPL4 complex triggers a response that mimics that of an intracellular pathogen has not been thoroughly investigated. Additionally, the finding of a role of the GATA transcription factor, ELT-2, in this response is suggestive, but experiments showing sufficiency in the context of loss of the UFD1/NPL4 complex need to be explored.

      We have investigated the role of IPR genes in the phenotypes observed upon ufd1 knockdown (Figure 6—figure supplement 1), and our results suggest that the IPR may contribute, at least in part, to the phenotypic outcomes of ufd-1 RNAi. In the Discussion section (pages 11–12, lines 345–356), we have included a detailed discussion on the possible mechanisms underlying IPR activation upon inhibition of the UFD-1–NPL-4 complex. We agree that the interaction between the UFD-1–NPL-4 complex and the IPR is intriguing and warrants further investigation. However, we believe that an in-depth exploration of this interaction lies beyond the scope of the current study.

      We have incorporated new data on ELT-2 overexpression in the revised manuscript. Overexpression of ELT-2 partially phenocopies the effects of ufd-1 knockdown, supporting the idea that other pathways likely contribute to the full spectrum of phenotypes observed upon UFD-1-NPL-4 complex inhibition. The revised manuscript reads (page 10, lines 311319): “To determine whether ELT-2 activation alone is sufficient to recapitulate the phenotypes observed upon UFD-1-NPL-4 complex inhibition, we analyzed animals overexpressing ELT-2. Similar to ufd-1 knockdown, ELT-2 overexpression led to a significant reduction in the colonization of the gut by P. aeruginosa (Figure 6—figure supplement 3A and 3B). However, overexpression of ELT-2 did not alter the survival of worms on P. aeruginosa (Figure 6—figure supplement 3C). Taken together, these findings suggest that the phenotypes triggered by disruption of the UFD-1-NPL-4 complex are partially mediated by ELT-2. However, additional pathways, yet to be identified, likely cooperate with ELT-2 to regulate both pathogen resistance and host survival.”

      Reviewer #1 (Recommendations For The Authors):

      The authors could consider avoiding the use of descriptors (e.g., "drastic") when presenting their data.

      We have removed the descriptors.

      Reviewer #2 (Recommendations For The Authors):

      What happens with overexpression of ELT2?

      Overexpression of ELT-2 partially recapitulates the phenotypes of ufd-1 knockdowns, indicating that additional pathways are likely involved in controlling the phenotypes observed upon inhibition of the UFD-1-NPL-4 complex. The revised manuscript reads (page 10, lines 311-319): “To determine whether ELT-2 activation alone is sufficient to recapitulate the phenotypes observed upon UFD-1-NPL-4 complex inhibition, we analyzed animals overexpressing ELT-2. Similar to ufd-1 knockdown, ELT-2 overexpression led to a significant reduction in the colonization of the gut by P. aeruginosa (Figure 6—figure supplement 3A and 3B). However, overexpression of ELT-2 did not alter the survival of worms on P. aeruginosa (Figure 6—figure supplement 3C). Taken together, these findings suggest that the phenotypes triggered by disruption of the UFD-1-NPL-4 complex are partially mediated by ELT-2. However, additional pathways, yet to be identified, likely cooperate with ELT-2 to regulate both pathogen resistance and host survival.”

      The data with xbp-1 loss of function is very different than that of pek1 and atf-6. Does loss of ufd1/npl4 suppress the increased pathogen survival of xbp-1s overexpressing animals?

      We have examined worms overexpressing XBP-1s and found that overexpression of XBP-1s does not rescue the phenotypes caused by ufd-1 knockdown. The revised manuscript reads (page 6, lines 167-174): “To further examine the role of XBP-1 in this context, we assessed the effect of ufd-1 knockdown in animals neuronally overexpressing the constitutively active spliced form of XBP-1 (XBP-1s), which has been previously associated with enhanced longevity (Taylor and Dillin, 2013). Knockdown of ufd-1 resulted in the reduced survival of XBP-1s-overexpressing animals on P. aeruginosa, despite a concurrent decrease in bacterial colonization of the gut (Figure 2—figure supplement 1A-C). This indicated that the XBP-1 pathway was not required for the reduced P. aeruginosa colonization of ufd-1 knockdown animals.” 

      Lastly, while the pathogen burden is reduced in ufd1/npl4 loss and pumping rates are marginally affected, have you checked defecation rates? Could they be increased?

      We thank the reviewer for this valuable suggestion. We measured defecation rates following ufd-1 and npl-4 knockdown and, unexpectedly, found that inhibition of ufd-1/npl-4 leads to a reduction in defecation frequency. These findings clearly indicate that altered defecation cannot explain the observed decrease in gut colonization. The revised manuscript reads (page 5, lines 138-148): “The clearance of intestinal contents through the defecation motor program (DMP) is known to influence gut colonization by P. aeruginosa in C. elegans (Das et al., 2023). It is therefore conceivable that knockdown of the UFD-1-NPL-4 complex might increase defecation frequency, thereby promoting the physical expulsion of bacteria and resulting in reduced gut colonization. To test this possibility, we measured DMP rates in animals subjected to ufd-1 and npl-4 RNAi. Contrary to this hypothesis, both ufd-1 and npl-4 knockdown animals exhibited a significant reduction in defecation frequency compared to control RNAi-treated animals (Figure 1—figure supplement 2C). This reduction in DMP rate persisted even after 12 hours of exposure to P. aeruginosa (Figure 1—figure supplement 2D). Thus, the change in the DMP rate in ufd-1 and npl-4 knockdown animals is unlikely to be the reason for the reduced gut colonization by P. aeruginosa.”

      In summary, we would like to thank the reviewers again for providing constructive and thoughtful feedback. We believe we have fully addressed all the concerns of the reviewers by carrying out several new experiments and modifying the text. The manuscript has undergone substantial revision and has thereby improved significantly. We do hope that the evidence in support of the conclusions is found to be complete in the revised manuscript.

    1. eLife Assessment

      The identification of RBMX2 as a novel regulator linking mycobacterial infection to Epithelial-Mesenchymal Transition and cancer progression are fundamental findings that advance our understanding of a major research question about the link between infectious and non-infectious diseases, microbiology and oncology. It does so by introducing RBMX2 as a novel host factor, a potential therapeutic target and biomarker for both TB and lung cancer. The evidence provided is convincing because it is appropriate and the validated multi-omics methodologies used are in line with the current state of the art. This study will be of interest to scientists working in the fields of drug discovery, microbiology and oncology.

    2. Reviewer #3 (Public review):

      Summary:

      This study investigates the role of the host protein RBMX2 in regulating the response to Mycobacterium bovis infection and its connection to epithelial-mesenchymal transition (EMT), a key pathway in cancer progression. Using bovine and human cell models, the authors have wisely shown that RBMX2 expression is upregulated following M. bovis infection and promotes bacterial adhesion, invasion, and survival by disrupting epithelial tight junctions via the p65/MMP-9 signaling pathway. They also demonstrate that RBMX2 facilitates EMT and is overexpressed in human lung cancers, suggesting a potential link between chronic infection and tumor progression. The study highlights RBMX2 as a novel host factor that could serve as a therapeutic target for both TB pathogenesis and infection-related cancer risk.

      Strengths:

      The major strengths lie in its multi-omics integration (transcriptomics, proteomics, metabolomics) to map RBMX2's impact on host pathways, combined with rigorous functional assays (knockout/knockdown, adhesion/invasion, barrier tests) that establish causality through the p65/MMP-9 axis. Validation across bovine and human cell models and in clinical tissue samples enhances translational relevance. Finally, identifying RBMX2 as a novel regulator linking mycobacterial infection to EMT and cancer progression opens exciting therapeutic avenues.

      Weaknesses:

      There are a few minor weaknesses like grammatical errors, spelling mistakes. Also, the manuscript is too dense; improving the narratives in the Results and Discussion section could help readers follow the logic of the experimental design and conclusions.

    3. Author response:

      The following is the authors’ response to the original reviews.

      Reviewer #1 (Public review):

      Summary:

      This manuscript presents a compelling study identifying RBMX2 as a novel host factor upregulated during Mycobacterium bovis infection.

      The study demonstrates that RBMX2 plays a role in:

      (1) Facilitating M. bovis adhesion, invasion, and survival in epithelial cells.

      (2) Disrupting tight junctions and promoting EMT.

      (3) Contributing to inflammatory responses and possibly predisposing infected tissue to lung cancer development.

      By using a combination of CRISPR-Cas9 library screening, multi-omics, coculture models, and bioinformatics, the authors establish a detailed mechanistic link between M. bovis infection and cancer-related EMT through the p65/MMP-9 signaling axis. Identification of RBMX2 as a bridge between TB infection and EMT is novel.

      Strengths:

      This topic and data are both novel and significant, expanding the understanding of transcriptomic diversity beyond RBM2 in M. bovis responsive functions.

      Weaknesses:

      (1) The abstract and introduction sometimes suggest RBMX2 has protective anti-TB functions, yet results show it facilitates pathogen adhesion and survival. The authors need to rephrase claims to avoid contradiction.

      We sincerely appreciate the reviewer's valuable feedback regarding the need to clarify RBMX2's role throughout the manuscript. We have carefully revised the text to ensure consistent messaging about RBMX2's function in promoting M. bovis infection. Below we detail the specific modifications made:\

      (1) Introduction Revisions:

      Changed "The objective of this study was to elucidate the correlation between host genes and the susceptibility of M.bovis infection" to "The objective of this study was to identify host factors that promote susceptibility to M.bovis infection"

      Revised "RBMX2 polyclonal and monoclonal cell lines exhibited favorable phenotypes" to "RBMX2 knockout cell lines showed reduced bacterial survival"

      Replaced "The immune regulatory mechanism of RBMX2" with "The role of RBMX2 in facilitating M.bovis immune evasion"

      (2) Results Revisions:

      Modified "RBMX2 fails to affect cell morphology and the ability to proliferate and promotes M.bovis infection" to "RBMX2 does not alter cell viability but significantly enhances M.bovis infection"

      Strengthened conclusion in Figure 4: "RBMX2 actively disrupts tight junctions to facilitate bacterial invasion"

      (3) Discussion Revisions:

      Revised screening description: "We screened host factors affecting M.bovis susceptibility and identified RBMX2 as a key promoter of infection"

      Strengthened concluding statement: "In summary, RBMX2 drives TB pathogenesis by compromising epithelial barriers and inducing EMT"

      These targeted revisions ensure that:

      All sections consistently present RBMX2 as promoting infection; the language aligns with our experimental finding; potential protective interpretations have been eliminated. We believe these modifications have successfully addressed the reviewer's concern while maintaining the manuscript's original structure and scientific content. We appreciate the opportunity to improve our manuscript and thank the reviewer for this constructive suggestion.

      (2) While p65/MMP-9 is convincingly implicated, the role of MAPK/p38 and JNK is less clearly resolved.

      We sincerely appreciate the reviewer's insightful comment regarding the roles of MAPK/p38 and JNK in our study. Our experimental data clearly demonstrated that RBMX2 knockout significantly reduced phosphorylation levels of p65, p38, and JNK (Fig. 5A), indicating potential involvement of all three pathways in RBMX2-mediated regulation.

      Through systematic functional validation, we obtained several important findings:

      In pathway inhibition experiments, p65 activation (PMA treatment) showed the most dramatic effects on both tight junction disruption (ZO-1, OCLN reduction) and EMT marker regulation (E-cadherin downregulation, N-cadherin upregulation);p38 activation (ML141 treatment) exhibited moderate effects on these processes; JNK activation (Anisomycin treatment) displayed minimal impact.

      Most conclusively, siRNA-mediated silencing of p65 alone was sufficient to:

      Restore epithelial barrier function

      Reverse EMT marker expression

      Reduce bacterial adhesion and invasion

      These results establish a clear hierarchy in pathway importance: p65 serves as the primary mediator of RBMX2's effects, while p38 plays a secondary role and JNK appears non-essential under our experimental conditions. We have now clarified this relationship in the revised Discussion section to strengthen this conclusion.

      This refined understanding of pathway hierarchy provides important mechanistic insights while maintaining consistency with all our experimental data. We thank the reviewer for this valuable suggestion that helped improve our manuscript.

      (3) Metabolomics results are interesting but not integrated deeply into the main EMT narrative.

      Thank you for this constructive suggestion. In this article, we detected the metabolome of RBMX2 knockout and wild-type cells after Mycobacterium bovis infection, which mainly served as supporting evidence for our EMT model. However, we did not conduct an in-depth discussion of these findings. We have now added a detailed discussion of this section to further support our EMT model.

      ADD:Meanwhile, metabolic pathways enriched after RBMX2 deletion, such as nucleotide metabolism, nucleotide sugar synthesis, and pentose interconversion, primarily support cell proliferation and migration during EMT by providing energy precursors, regulating glycosylation modifications, and maintaining redox balance; cofactor synthesis and amino sugar metabolism participate in EMT regulation through influencing metabolic remodeling and extracellular matrix interactions; chemokine and cGMP-PKG signaling pathways may further mediate inflammatory responses and cytoskeletal rearrangements, collectively promoting the EMT process.

      (4) A key finding and starting point of this study is the upregulation of RBMX2 upon M. bovis infection. However, the authors have only assessed RBMX2 expression at the mRNA level following infection with M. bovis and BCG. To strengthen this conclusion, it is essential to validate RBMX2 expression at the protein level through techniques such as Western blotting or immunofluorescence. This would significantly enhance the credibility and impact of the study's foundational observation.

      Thank you for your comment. We have supplemented the experiments in this part and found that Mycobacterium bovis infection can significantly enhance the expression level of RBMX2 protein.

      (5) The manuscript would benefit from a more in-depth discussion of the relationship between tuberculosis (TB) and lung cancer. While the study provides experimental evidence suggesting a link via EMT induction, integrating current literature on the epidemiological and mechanistic connections between chronic TB infection and lung tumorigenesis would provide important context and reinforce the translational relevance of the findings.

      We sincerely appreciate the valuable comments from the reviewer. We fully agree with your suggestion to further explore the relationship between tuberculosis (TB) and lung cancer. In the revised manuscript, we will add a new paragraph in the Discussion section to systematically integrate the current literature on the epidemiological and mechanistic links between chronic tuberculosis infection and lung cancer development, including the potential bridging roles of chronic inflammation, tissue damage repair, immune microenvironment remodeling, and the epithelial-mesenchymal transition (EMT) pathway. This addition will help more comprehensively interpret the clinical implications of the observed EMT activation in the context of our study, thereby enhancing the biological plausibility and clinical translational value of our findings.

      ADD:There is growing epidemiological evidence suggesting that chronic TB infection represents a potential risk factor for the development of lung cancer. Studies have shown that individuals with a history of TB exhibit a significantly increased risk of lung cancer, particularly in areas of the lung with pre-existing fibrotic scars, indicating that chronic inflammation, tissue repair, and immune microenvironment remodeling may collectively contribute to malignant transformation 74. Moreover, EMT not only endows epithelial cells with mesenchymal features that enhance migratory and invasive capacity but is also associated with the acquisition of cancer stem cell-like properties and therapeutic resistance 75. Therefore, EMT may serve as a crucial molecular link connecting chronic TB infection with the malignant transformation of lung epithelial cells, warranting further investigation in the intersection of infection and tumorigenesis.

      Reviewer #2 (Public review):

      Summary:

      I am not familiar with cancer biology, so my review mainly focuses on the infection part of the manuscript. Wang et al identified an RNA-binding protein RBMX2 that links the Mycobacterium bovis infection to the epithelial-Mesenchymal transition and lung cancer progression. Upon mycobacterium infection, the expression of RBMX2 was moderately increased in multiple bovine and human cell lines, as well as bovine lung and liver tissues. Using global approaches, including RNA-seq and proteomics, the authors identified differential gene expression caused by the RBMX2 knockout during M. bovis infection. Knockout of RBMX2 led to significant upregulations of tight-junction related genes such as CLDN-5, OCLN, ZO-1, whereas M. bovis infection affects the integrity of epithelial cell tight junctions and inflammatory responses. This study establishes that RBMX2 is an important host factor that modulates the infection process of M. bovis.

      Strengths:

      (1) This study tested multiple types of bovine and human cells, including macrophages, epithelial cells, and clinical tissues at multiple timepoints, and firmly confirmed the induced expression of RBMX2 upon M. bovis infection.

      (2) The authors have generated the monoclonal RBMX2 knockout cell lines and comprehensively characterized the RBMX2-dependent gene expression changes using a combination of global omics approaches. The study has validated the impact of RBMX2 knockout on the tight-junction pathway and on the M. bovis infection, establishing RBMX2 as a crucial host factor.

      Weaknesses:

      (1) The RBMX2 was only moderately induced (less than 2-fold) upon M. bovis infection, arguing its contribution may be small. Its value as a therapeutic target is not justified. How RBMX2 was activated by M. bovis infection was unclear.

      Thank you for your valuable and constructive comments. In this study, we primarily utilized the CRISPR whole-genome screening approach to identify key factors involved in bovine tuberculosis infection. Through four rounds of screening using a whole-genome knockout cell line of bovine lung epithelial cells infected with Mycobacterium bovis, we identified RBMX2 as a critical factor.

      Although the transcriptional level change of RBMX2 was less than two-fold, following the suggestion of Reviewer 1, we examined its expression at the protein level, where the change was more pronounced, and we have added these results to the manuscript.

      Regarding the mechanism by which RBMX2 is activated upon M. bovis infection, we previously screened for interacting proteins using a Mycobacterium tuberculosis secreted and membrane protein library, but unfortunately, we did not identify any direct interacting proteins from M. tuberculosis (https://doi.org/10.1093/nar/gkx1173).

      (2) Although multiple time points have been included in the study, most analyses lack temporal resolution. It is difficult to appreciate the impact/consequence of M. bovis infection on the analyzed pathways and processes.

      We appreciate the valuable comments from the reviewers. Although our study included multiple time points post-infection, in our experimental design we focused on different biological processes and phenotypes at distinct time points:

      During the early phase (e.g., 2 hours post-infection), we focused on barrier phenotypes during the intermediate phase (e.g., 24 hours post-infection), we concentrated more on pathway activation and EMT phenotypes;

      And during the later phase (e.g., 48–72 hours post-infection), we focused more on cell death phenotypes, which were validated in another FII article (https://doi.org/10.3389/fimmu.2024.1431207).

      We also examined the impact of varying infection durations on RBMX2 knockout EBL cellular lines via GO analysis. At 0 hpi, genes were primarily related to the pathways of cell junctions, extracellular regions, and cell junction organization. At 24 hpi, genes were mainly associated with pathways of the basement membrane, cell adhesion, integrin binding and cell migration By 48 hpi, genes were annotated into epithelial cell differentiation and were negatively regulated during epithelial cell proliferation. This indicated that RBMX2 can regulate cellular connectivity throughout the stages of M. bovis infection.

      For KEGG analysis, genes linked to the MAPK signaling pathway, chemical carcinogen-DNA adducts, and chemical carcinogen-receptor activation were observed at 0 hpi. At 24 hpi, significant enrichment was found in the ECM-receptor interaction, PI3K-Akt signaling pathway, and focal adhesion. Upon enrichment analysis at 48 hpi, significant enrichment was noted in the TGF-beta signaling pathway, transcriptional misregulation in cancer, microRNAs in cancer, small cell lung cancer, and p53 signaling pathway.

      Reviewer #3 (Public review):

      Summary:

      This study investigates the role of the host protein RBMX2 in regulating the response to Mycobacterium bovis infection and its connection to epithelial-mesenchymal transition (EMT), a key pathway in cancer progression. Using bovine and human cell models, the authors have wisely shown that RBMX2 expression is upregulated following M. bovis infection and promotes bacterial adhesion, invasion, and survival by disrupting epithelial tight junctions via the p65/MMP-9 signaling pathway. They also demonstrate that RBMX2 facilitates EMT and is overexpressed in human lung cancers, suggesting a potential link between chronic infection and tumor progression. The study highlights RBMX2 as a novel host factor that could serve as a therapeutic target for both TB pathogenesis and infection-related cancer risk.

      Strengths:

      The major strengths lie in its multi-omics integration (transcriptomics, proteomics, metabolomics) to map RBMX2's impact on host pathways, combined with rigorous functional assays (knockout/knockdown, adhesion/invasion, barrier tests) that establish causality through the p65/MMP-9 axis. Validation across bovine and human cell models and in clinical tissue samples enhances translational relevance. Finally, identifying RBMX2 as a novel regulator linking mycobacterial infection to EMT and cancer progression opens exciting therapeutic avenues.

      Weaknesses:

      Although it's a solid study, there are a few weaknesses noted below.

      (1) In the transcriptomics analysis, the authors performed (GO/KEGG) to explore biological functions. Did they perform the search locally or globally? If the search was performed with a global reference, then I would recommend doing a local search. That would give more relevant results. What is the logic behind highlighting some of the enriched pathways (in red), and how are they relevant to the current study?

      We appreciate the reviewer's thoughtful questions regarding our transcriptomic analysis. In this study, we employed a localized enrichment approach focusing specifically on gene expression profiles from our bovine lung epithelial cell system. This cell-type-specific analysis provides more biologically relevant results than global database searches alone.

      Regarding the highlighted pathways, these represent:

      Temporally significant pathways showing strongest enrichment at each stage:

      (1) 0h: Cell junction organization (immediate barrier response)

      (2) 24h: ECM-receptor interaction (early EMT initiation)

      (3) 48h: TGF-β signaling (chronic remodeling)

      Mechanistically linked to our core findings about RBMX2's role in:

      (1) Epithelial barrier disruption

      (2) Mesenchymal transition

      (3) Chronic infection outcomes

      We selected these particular pathways because they:

      (1) Showed the most statistically significant changes (FDR <0.001)

      (2) Formed a coherent biological narrative across infection stages

      (3) Were independently validated in our functional assays

      This targeted approach allows us to focus on the most infection-relevant pathways while maintaining statistical rigor.

      (2) While the authors show that RBMX2 expression correlates with EMT-related gene expression and barrier dysfunction, the evidence for direct association remains limited in this study. How does RBMX2 activate p65? Does it bind directly to p65 or modulate any upstream kinases? Could ChIP-seq or CLIP-seq provide further evidence for direct RNA or DNA targets of RBMX2 that drive EMT or NF-κB signaling?

      We sincerely appreciate the reviewer's in-depth questions regarding the mechanisms by which RBMX2 activates p65 and its association with EMT. Although the molecular mechanism remains to be fully elucidated, our study has provided experimental evidence supporting a direct regulatory relationship between RBMX2 and the p65 subunit of the NF-κB pathway. Specifically, we investigated whether the transcription factor p65 could directly bind to the promoter region of RBMX2 using CHIP experiments. The results demonstrated that the transcription factor p65 can physically bind to the RBMX2 region.

      Furthermore, dual-luciferase reporter assays were conducted, showing that p65 significantly enhances the transcriptional activity of the RBMX2 promoter, indicating a direct regulatory effect of RBMX2 on p65 expression.

      These findings support our hypothesis that RBMX2 activates the NF-κB signaling pathway through direct interaction with the p65 protein, thereby participating in the regulation of EMT progression and barrier function.

      In our subsequent work papers, we will also employ experiments such as CLIP to further investigate the specific mechanisms through which RBMX2 exerts its regulatory functions.

      ADD and Revise in Results:

      To thoroughly verify the regulatory mechanism between RBMX2 and p65, we initiated our investigation by conducting an in-depth analysis of the RBMX2 promoter region to identify potential interactions with the transcription factor p65. Initially, we performed molecular docking simulations to predict the binding affinity and interaction patterns between RBMX2 and p65 proteins. These simulations revealed multiple amino acid residues within the RBMX2 protein that formed strong, stable interactions with p65. The docking analysis yielded a high docking score of 1978.643 (Fig. 7K), indicating a significant likelihood of a direct physical interaction between these two proteins.

      To complement the protein-protein interaction analysis, we next investigated whether p65 could directly bind to the promoter region of the RBMX2 gene at the transcriptional level. Using the JASPAR database, a comprehensive resource for transcription factor binding profiles, we queried the RBMX2 promoter sequence for potential p65 binding sites. This analysis identified several putative binding motifs, suggesting that p65 may act as a transcriptional regulator of RBMX2 expression.

      To experimentally validate this transcriptional regulatory relationship, we employed a dual-luciferase reporter assay. We cloned the RBMX2 promoter region containing the predicted p65 binding sites into a luciferase reporter plasmid. This construct was then co-transfected into cultured cells along with a plasmid expressing p65. The luciferase activity was significantly increased in cells expressing p65 compared to control groups, providing functional evidence that p65 enhances the transcriptional activity of the RBMX2 promoter (Fig. 7I).

      Furthermore, to confirm the direct binding of p65 to the RBMX2 promoter in a chromatin context, we performed chromatin immunoprecipitation followed by quantitative PCR (ChIP-qPCR). In this assay, we used specific antibodies against p65 to immunoprecipitate chromatin fragments containing p65-bound DNA. The enriched DNA fragments were then analyzed using primers targeting the RBMX2 promoter region. Our results demonstrated a significant enrichment of the RBMX2 promoter in the p65 immunoprecipitated samples compared to the IgG control, thereby confirming that p65 physically associates with the RBMX2 promoter in vivo (Fig. 7J). Collectively, these findings-ranging from computational docking predictions to transcriptional reporter assays and ChIP validation-provide strong evidence supporting a direct regulatory interaction between p65 and RBMX2. This regulatory mechanism may play a critical role in the biological pathways involving these two molecules, particularly in contexts such as inflammation, immune response, or cellular stress, where p65 (a subunit of NF-κB) is known to be prominently involved.

      (3) The manuscript suggests that RBMX2 enhances adhesion/invasion of several bacterial species (e.g., E. coli, Salmonella), not just M. bovis. This raises questions about the specificity of RBMX2's role in Mycobacterium-specific pathogenesis. Is RBMX2 a general epithelial barrier regulator or does it exhibit preferential effects in mycobacterial infection contexts? How does this generality affect its potential as a TB-specific therapeutic target?

      Thank you for your valuable comments. When we initially designed this experiment, we were interested in whether the RBMX2 knockout cell line could confer effective resistance not only against Mycobacterium bovis but also against Gram-negative and Gram-positive bacteria. Surprisingly, we indeed observed resistance to the invasion of these pathogens, albeit weaker compared to that against Mycobacterium bovis.

      Nevertheless, we believe these findings merit publication in eLife. Moreover, RBMX2 knockout does not affect the phenotype of epithelial barrier disruption under normal conditions; its significant regulatory effect on barrier function is only evident upon infection with Mycobacterium bovis.

      Importantly, during our genome-wide knockout library screening, RBMX2 was not identified in the screening models for Salmonella or Escherichia coli, but was consistently detected across multiple rounds of screening in the Mycobacterium bovis model.

      (4) The quality of the figures is very poor. High-resolution images should be provided.

      Thank you for your feedback; we provided higher-resolution images.

      (5) The methods are not very descriptive, particularly the omics section.

      Thank you for your comments; we have revised the description of the sequencing section.

      (6) The manuscript is too dense, with extensive multi-omics data (transcriptomics, proteomics, metabolomics) but relatively little mechanistic integration. The authors should have focused on the key mechanistic pathways in the figures. Improving the narratives in the Results and Discussion section could help readers follow the logic of the experimental design and conclusions.

      Thank you for your valuable comments. We have streamlined the figures and revised the description of the results section accordingly.

      Reviewer #2 (Recommendations for the authors):

      (1) The first part of the results and the major conclusions largely overlap with the previous paper by the same authors (Frontiers in Immunology, https://doi.org/10.3389/fimmu.2024.1431207). The previous paper has already established that RBMX2 is induced upon infection as a host factor, and its knockout led to cell proliferation. Thus, the current paper should focus more on the mechanisms rather than repeating the previous story.

      We appreciate the reviewer's careful reading and constructive feedback. We fully acknowledge the foundational work published in our Frontiers in Immunology paper (doi:10.3389/fimmu.2024.1431207), which established RBMX2 as an infection-induced host factor affecting cell proliferation. The current study represents a significant mechanistic extension of these initial findings, with the following key advances:

      (1) Novel Mechanistic Insights (Current Study Focus):

      Discovery of the p65/MMP-9 pathway as the central mechanism mediating RBMX2's effects on EMT (Figs. 4-6)

      First demonstration of RBMX2's role in epithelial barrier disruption (Figs. 2-3)

      Identification of temporal regulation patterns during infection progression (Fig. 7)

      (2) Expanded Biological Scope:

      Demonstration of RBMX2's function in both bovine and human cell systems (vs. previous bovine-only data)

      Clinical correlation with TB lesions

      Therapeutic potential assessment through pathway inhibition

      (3) Technical Advancements:

      CRISPR-based mechanistic validation (vs. previous siRNA approach)

      Multi-omics integration (transcriptomics + metabolomics)

      Advanced live-cell imaging

      We have now:

      Removed redundant proliferation data from Results

      Sharpened the Introduction to highlight mechanistic questions

      Added explicit discussion comparing both studies

      The current work provides the first comprehensive mechanistic framework for RBMX2's role in TB pathogenesis, moving substantially beyond the initial observational findings. We believe these new insights into the molecular pathways and therapeutic implications represent an important advance for the field..

      (2) Line 107-110: The CRISPR screening results are not provided. Has it been published, or is it an unpublished dataset? RBMX2 knockout cells exhibited 'significant' resistance to the infection. How significant? Data?

      Thank you for your valuable comments. The library mentioned, along with data on another host factor, TOP1, is being submitted by another researcher from our laboratory to a journal, and we will cite each other in the future. RBMX2 ranked second in terms of enrichment among all the identified genes, and its knockout cell line exhibited the second highest anti-infective capacity among all the host factors.

      (3) Line 152: The RNA-seq analysis has already been performed/reported in the previous Frontiers paper. Therein, 173 genes were found to be differentially expressed. In the current paper, 42 genes were differentially expressed in all three time points. If the addition of new time points were the highlight of this paper, why would the authors focus on differentially expressed genes from all three time points?

      Thank you for your valuable comments.

      In the newly added data, we aimed to investigate the temporal changes during Mycobacterium bovis infection of host cells.

      Previous study (Frontiers): Single 24h timepoint → 173 DEGs

      Current study: Three timepoints (0h, 24h, 48h) with 42 consistently regulated genes → Reveals temporally stable core regulators of infection response

      On one hand, we briefly described in the manuscript those important genes that exhibited changes across all time points.

      On the other hand, in the supplementary materials, we also focused on the enriched genes at each individual time point, to better understand the temporal dynamics regulated by RBMX2.

      (4) Line 153: The '0 h' time point is in fact 2 h post-infection. Why did the authors skip the real 0h time point? All the analysis and data should be relative to the 0h pi, rather than relative to the WT at each time point.

      We appreciate the reviewer's important question regarding our timepoint nomenclature. The experimental timeline was designed as follows:

      (1) Infection Protocol:

      2h to 0h: Bacterial co-culture (MOI 20:1)

      0h: Gentamicin (100 μg/ml) added to kill extracellular bacteria

      0h+: Monitored intracellular survival

      (2) Rationale for "0h" Designation:

      This marks the onset of intracellular infection phase when Extracellular bacteria are eliminated (validated by plating)Host cell responses to intracellular pathogens begin All subsequent measurements reflect genuine infection (not attachment)

      (3)Technical Validation:

      Confirmed complete extracellular killing by:

      Culture supernatant plating (0 CFU after gentamycin)

      Microscopy ( no surface-associated bacteria)

      (4) Comparative Analysis:

      All data are presented as:

      Fold-change relative to uninfected controls at each timepoint

      We have now:

      Clarified the timeline in Methods

      Specified "0h = post-gentamicin" in all figure legends

      This standardized approach aligns with established intracellular pathogen studies (e.g., Cell Microbiol. 2018;20:e12840). We're happy to adjust terminology if "0hpi (post-invasion)" would be clearer.

      (5) Figure 2F: The data should be compared to the 0h pi, and show the temporal changes of gene expression.

      Thank you for your suggestion. We have added additional information to this section. At the same time, we also aim to focus on the changes in gene expression between RBMX2 knockout and wild-type (WT) samples.

      We have now:

      Added temporal expression profiles relative to 0hpi baseline (SFig.4C).

      Clarified the dual normalization approach in Methods

      Maintained original between-group comparisons for phenotypic correlation

      (6) Line 207. Not all the proteins were down-regulated post-infection.

      Thank you for your comment. The overall level of the Tight junction related protein is downregulated, although it may not show a significant change at a specific time point.

      We have revised our description, changing the keyword from "All" to "Most."

      (7) Line 278, the introduction of the H1299 cell line should appear earlier when it was mentioned for the first time in the manuscript.

      Thank you for your comment. We have provided a description in the abstract and Result1.

      ADD:

      Abstrat: Meanwhile, we also validated the EMT process in human lung epithelial cancer cells H1299.

      Result 1: Furthermore, RBMX2-silenced H1299 cells exhibited a higher survival rate compared to H1299 ShNc cells after M. bovis infection (Fig. 1H).

      (8) Figure 4 is huge and almost illegible, which may be divided into two figures.

      Thank you for your valuable comments. We have streamlined the figures and revised the description of the results section accordingly.

      Reviewer #3 (Recommendations for the authors):

      I encountered frequent grammatical and syntactic issues. Thoroughly revising the manuscript for English language and clarity, preferably with professional editing assistance, could increase the quality of the paper.

      Thank you for your valuable comments; we will invite a professional editor to polish the language.

    1. eLife Assessment

      The article presents important findings describing the role of IL27 in maintaining HSCs at steady state, and in emergency haematopoiesis in response to T. goodii by limiting the inflammatory monocyte outcomes. The evidence provided are solid and support that IL27 acts at the level of HSCs and not downstream. This study will be of interest to immunologists and hematologists, as well as infectious disease researchers.

    2. Reviewer #1 (Public review):

      In the manuscript, Aldridge and colleagues investigate the role of IL-27 in regulating hematopoiesis during T. gondii infection. Using loss-of-function approaches, reporter mice, and the generation of serial chimeric mice, they elegantly demonstrate that IL-27 induction plays a critical role in modulating bone marrow myelopoiesis and monocyte generation to the infection site. The study is well-designed, with clear experimental approaches that effectively address the mechanisms by which IL-27 regulates bone marrow myelopoiesis and prevents HSC exhaustion. I have two minor comments that could enhance the conceptual framework of this study:

      (1) The authors indirectly show that IL-27R expression on HSPCs is necessary for regulating HSC proliferation and preventing exhaustion. However, given that they have access to IL-27RFlox mice, they could cross these with Fgd5Cre mice to specifically delete IL-27R on long-term HSCs. This would provide direct evidence for the role of IL-27 signaling in LTHSCs during infection.

      (2) Since memory T and B cells often home to the bone marrow, it would be interesting to consider the potential cross-talk between these cells, HSPCs, and IL-27 signaling during secondary T. gondii infection. A brief discussion of this possibility would strengthen the study's broader implications.

    3. Reviewer #2 (Public review):

      Aldridge et al. demonstrate the important role of IL-27 in limiting emergency myelopoiesis in response to Toxoplasma gondii infection. Interestingly, IL-27 acts specifically at the level of early haematopoietic progenitors, inducing STAT signalling, which, in this case, dampens proliferation and preserves HSC fitness.

      They used different mouse genetic models such as HSC lineage tracing, IL27 and IL27R-deficient mice to show that :

      HSCs actively participate in emergency myelopoiesis during Toxoplasma gondii infection.

      The absence of IL27 and IL27R increases monocyte progenitors and monocytes, mainly inflammatory monocytes CCR2hi.

      At steady state, loss of IL27 impairs HSC fitness as competitive transplantation shows long-term engraftment deficiency of IL27 BM cells. This impairment is exacerbated after infection.

      IL27 is produced by various BM and other tissue cells at steady state and its expression increases with infection, mainly by increasing the number of monocytes producing it.

      This article highlights a new mechanism that acts directly at the level of early hematopoietic cells to limit over-inflammation during infection.

    4. Author response:

      The following is the authors’ response to the original reviews.

      Reviewer #1 (Public review):

      In the manuscript, Aldridge and colleagues investigate the role of IL-27 in regulating hematopoiesis during T. gondii infection. Using loss-of-function approaches, reporter mice, and the generation of serial chimeric mice, they elegantly demonstrate that IL-27 induction plays a critical role in modulating bone marrow myelopoiesis and monocyte generation to the infection site. The study is well-designed, with clear experimental approaches that effectively adddress the mechanisms by which IL-27 regulates bone marrow myelopoiesis and prevents HSC exhaustion.

      Reviewer #2 (Public review):

      Summary:

      Aldridge et al. aim to demonstrate the role of IL27 in limiting emergency myelopoiesis in response to Toxoplasma gondii infection by acting directly at the level of early haematopoietic progenitors.

      They used different mouse genetic models, such as HSC lineage tracing, IL27 and IL27R-deficient mice, to show that:

      (1) HSCs actively participate in emergency myelopoiesis during Toxoplasma gondii infection.

      (2) The absence of IL27 and IL27R increases monocyte progenitors and monocytes, mainly inflammatory monocytes CCR2hi.

      (3) At steady state, loss of IL27 impairs HSC fitness as competitive transplantation shows long-term engraftment deficiency of IL27 BM cells. This impairment is exacerbated after infection.

      (4) IL27 is produced by various BM and other tissue cells at steady state, and its expression increases with infection, mainly by increasing the number of monocytes producing it.

      Although it is indisputable that IL27 has a role in emergency myelopoiesis by limiting the number of proinflammatory monocytes in response to infection, the authors' claim that it acts only on HSCs and not on more committed progenitors (CMP, GMP, MP) is not supported by the quality of the data presented here, as described below in the weakness section. In addition, this study highlights a role for IL27 during infection, but does not focus on trained immunity, which is the focus of the targeted elife issue.

      We thank the reviewer for these comments. We did try (and perhaps failed) to highlight that all cells within the HSPC category, which includes HSCs and MPPs, have the potential to contribute. The lack of IRGM1-RFP reporter expression in CMPs (Supp Fig5C) suggests that only HSCs and MPPs are progenitors that respond to IL-27 within the bone marrow, and thus that IL-27 signaling on these contributes to the effects observed on monopoiesis and peripheral monocyte populations. We have emphasized this in the revised manuscript, particularly in the introduction (line 82) and discussion (lines 469-472). While this manuscript does not focus solely on trained immunity, the impacts of infection regulating HSC differentiation and having a long-term impact on this compartment are a central theme of trained immunity. For example, Figure 6 and the supporting supplemental figures almost exclusively focus on the differentiation potential that is programed into LTHSCs by infection and the role of IL-27 in regulating this programing. Additionally, Figure 7 shows the long-term consequences of such training. The introduction      and discussion have been modified  to emphasize these connections to trained immunity.         

      Weakness

      (1) In Figure 4, MFI quantification is required. This figure also shows the expression level (FACS and RNA) in progenitors (GMP and CMP, GP, MP), which is quite similar to that of HSC at this level, so it is really surprising that CMP does not respond at all to IL27 (S5C).

      As requested, we have included the MFIs, calculated as a fold change over control FMOs, in the revised manuscript. While HSPCs and CMPs show relatively similar RNA expression of Il27ra (Supp. Fig. 5 A), the levels of surface IL-27R expression by CMPs is lower than HSPCs (Fig. 4C, revised). Additional downstream progenitors (including GMPs) show highly reduced RNA expression and a corresponding low expression of the receptor protein. This is now more apparent with the quantified MFIs (Fig 4-5).

      (2) Total BM was used to test the direct effect of IL27 on HSC. There could be an indirect effect from other more mature BM cells, even if they show lower receptor expression than HSC. This should be done on a different sorted population to prove the direct effect of IL27 on HSC. The authors need to look more closely at some stat-dependent genes or stat itself in different sorted cell populations, not just irgm1. It is also known that Stat is associated with increased HSC proliferation in response to IFN, which is the opposite of what is observed here.

      We thank the reviewer for this question. We have found that the methanol fixation required to detect pSTAT disrupted the ability to stain for HSPCs by flow cytometry. Thus, we used the IRGM1 reporter, which we have found to be a sensitive and high-fidelity reporter of STAT1 activity while preserving epitope markers of HSPCs.

      We agree that the use of bulk bone marrow in the in vitro stimulations could allow for the activation of non-HSPC cell types that are IL-27R+. This is now emphasized in the text. However, there are advantages to this bulk approach as it allows simultaneous analysis of all HSPC populations and downstream progenitors in the same cultures, allowing the ability to assess how the small numbers of IL-27R expressing lymphocytes present in these cultures respond (data that are now included, Supp. Fig. 5C). These cultures also allow a direct comparison of our IL-27R expression analysis with responsiveness to IL-27. Only a selection of the populations analyzed are shown in these data; however, all populations in Figure 4A were also analyzed in Supp. Fig. 5C. These data sets directly correlate receptor expression with sensitivity to IL-27. If this effect was indirect (i.e the ability of IL-27 to induce IFN-γ) then we would expect more robust expression of the IRGM1 reporter across other cell populations. However, while IFN-γ stimulates broad expression of IRGM1, the effects of IL-27 are restricted to HSPC and mature lymphocytes (Supp. Fig. 5C). In other words, the cells that express the highest levels of the IL-27R are most responsive to IL-27.

      While we do not directly measure HSPC proliferation in these cultures, we agree with the reviewer that the decreased proportions of proliferating HSPCs seen in the absence of IL-27 during infection (Fig. 7A) is a complex data set. The reviewer is also correct that interferons can promote HSC proliferations; however, they can also promote cell stress, DNA damage, and even cell death of HSCs during chronic exposure (reviewed extensively in Demerdash, Y., et al. Exp Hematol. 2021. PMID: 33571568). Thus IFNs, much like IL-27, appear to regulate HSPCs with contextual importance, inducing their proliferation but also death. The activation of STAT1 and STAT3 by IL-27 may be at the core of some of these effects observed in our data, and we point out that IL-10, another activator of STAT1+3, has been shown to limit HSC responses to inflammation (lined 58-62), but we have also presented other possibilities in the discussion.

      (3) The decrease in HSC fitness in IL27R KO at steady state could be an indirect effect of the increase in proinflammatory monocytes contributing to high levels of inflammatory cytokines in the BM and thus chronic HSC activation that is enhanced in response to infection. What is the pro-Inflammatory cytokine profile of the BM of IL27 OR IL27R deficient mice and of mixed chimera mice.

      We thank the reviewer for this insightful comment. This was part of our stated rationale in generating the mixed WT:IL-27R-/- BM chimeras presented in Figure 2. In this mixed setting, there remained differences between the ability of the IL-27R sufficient and deficient stem cells to generate inflammatory macrophages. These results suggest that differences in the inflammatory environment do not account for the differences observed. This conclusion is further supported by the observation that the infection-induced levels of IFN-γ in the bone marrow are equivalent in the presence or absence of IL-27 (now included in the revised manuscript, Supp. Fig. 1F).

      (4) Furthermore, the FACS profile of KI67/brdu of Figure 7 is doubtful, as it is shown in different literature that KSL are not predominantly quiescent as shown here, but about 50% are KI67-. This is also inconsistent with the increase of HSC observed in Figure 1. Quantification of total BruDU+ HSC and other progenitors is also important to quantify all cells that have proliferated during infection. As the repopulation of IL27-deficient BM is also lower in the absence of infection the proliation  of HSC in IL27R KO mice in the absence of infection is also important.

      The comment indicates that the reviewer is concerned that our staining for Ki67 is on the low end of reported literature (~10-50% of LSKs, depending on age of the mice and simulation (Thapa R, et al. Stem Cell Res Ther. 2023. PMID: 37280691; Nies KPH, et al. Cytometry A. 2018. PMID: 30176186)). Our stains were performed on cells from infected mice, which does alter the classic markers used to identify HSPCs. For this reason, we are stringent with our gating strategy and may be excluding more HSPCs than are included in other reports. We have included our FMO control in the revised manuscript to indicate our gating approach (Supp. Fig. 9A). While the population of Ki67+ HSPCs is low, these results were consistent between our experiments and provide data sets that are interpretable.

      (5) The immunofluorescence in Figure 3 shows a high level of background and it is difficult to see the GFP and tomato positive cells. In this sense, the number of HSCs quantified as Procr+ (more than 8000 on a single BM section) is inconsistent with the total number of HSCs that a BM can contain (i.e., around 6000 per BM as quantified in Figure 1).

      We agree with the reviewer and have found that there is a high level of background in these stains. We have thresholded these images, as described in our methods, to minimize this. Additionally, the increased numbers of Procr+ cells in the imaging vs our flow data is expected, and has been reported by others (Steinert, EM, et al. Cell. 2015. PMID: 25957682).

      (6) The addition of arrows to the figure will help to visualise positive cells. It is also not clear why the author normalised the GFP+ cells to the tomato+ cells in Figure 3D.

      We thank the reviewer for this comment and have added the suggested arrows. We have also included a more detailed explanation for our normalization strategy.

      (7) Furthermore, even if monocytes represent a high proportion of IL27-producing cells, they are only 50% of the cells at 5dpi, as shown in Figure 3 and S4. Without other monocyte markers, line 307 is incorrect.

      We thank the reviewer for this clarification and have adjusted the text accordingly.

      (8) How do the authors explain that in Figure 1, 5-10% of labelled precursors and monocytes can give 100% of monocytes? This would mean that only labelled HSC can differentiate into PEC monocytes. 5

      We thank the reviewer for their interest in this result. Monocytes and macrophages are some

      Reviewer #1 (Recommendations for the authors):

      I have two minor comments that could enhance the conceptual framework of this study:

      (1) The authors indirectly show that IL-27R expression on HSPCs is necessary for regulating HSC proliferation and preventing exhaustion. However, given that they have access to IL-27RFlox mice, they could cross these with Fgd5Cre mice to specifically delete IL-27R on long-term HSCs. This would provide direct evidence for the role of IL-27 signaling in LTHSCs during infection.

      We appreciate this comment and did attempt this experiment with several HSPC specific Cres, including the Procr-cre (used elsewhere in the manuscript) and the MDS1-cre-ERT2 (Jackson Laboratory Strain #:032863). Unfortunately, validation revealed that deletion efficiency of the IL-27R with these HSCspecific Cre lines was inefficient, and so experiments are ongoing to enhance efficiency of the deletion and test alternative Cre lines (such as the Fgd5-cre).

      (2) Since memory T and B cells often home to the bone marrow, it would be interesting to consider the potential cross-talk between these cells, HSPCs, and IL-27 signaling during secondary T. gondii infection. A brief discussion of this possibility would strengthen the study's broader implications.

      We thank the reviewer for this opportunity. We have previously investigated the interplay between immune cells in the bone marrow (Glatman Zaretsky A, et al. Cell Rep. 2017. PMID: 28228257) and now include these possibilities in the discussion (line 465-470).

      Reviewer #2 (Recommendations for the authors):

      Minor points:

      (1) Figures 6F and 7B: should be shown as % of donor and not total number to clarify the lineage potency of LTHSC. The fact that the results of transplantation are separated into different figures makes it not easy to follow. To see if the increase in monocyte production by IL27 KO BM is specific, the percent of donorderived cells for other populations, such as lymphoid, but also in MP, and inflammatory monocytes, is necessary to confirm Figure 2.

      Perhaps there has been a misunderstanding? In these plots, we are not analyzing mixed chimeras but single transfer chimeras into lethally irradiated hosts. Thus, the % of donor reaches ~80- 90%. However, to measure the actual output of the HSPCs, the cell number was necessary to compare amongst groups. Additional description is provided in the figure legends and in the text of the manuscript (lines 391-392, 434-436, 651-653, and 680-682).

      (2) The heavy UMAP description is unnecessary. Responses As requested, we have reduced this description of how the UMAPs were derived.

      As requested, we have reduced this description of how the UMAPs were derived

    1. eLife Assessment

      This important study describes the effect of beta-glucan innate training of macrophages and its effect on uptake of tumour cells and on the production of inflammatory cytokines. The data are convincing and show decreased phagocytic activity of apoptotic tumour cells accompanied by lower levels of secreted IL-1β, and in vivo findings are also provided in the revision. This finding has potential impact on designing potential macrophage-targeted cancer immuno-therapeutic approaches.

    2. Reviewer #1 (Public review):

      Summary:

      The authors were attempting to describe if trained innate immunity would modulate antibody dependent-cellular phagocytosis (ADCP) and/or efferocytosis.

      Strengths:

      The use of primary murine macrophages, and not a cell line, is considered a strength.

      The trained immunity mediated changes to phagocytosis affected both myeloma and breast cancer cells. The broad effect is consistent with trained immunity.

      In this revised manuscript, the authors now include in vivo data to show in vivo relevance.

      Weaknesses:

      There are many types of cancers so it would be helpful to focus the title more for the types of cancers included in the present study, the most relevant of course would be the type of cancer used for the in vivo model.

    3. Reviewer #3 (Public review):

      Summary:

      Chatzis et al showed that β-glucan trained macrophages have decreased phagocytic activity of apoptotic tumor cells and that is accompanied by lower levels of secreted IL-1β using mouse model.

      Strengths:

      This finding has potential impact on designing new cancer immunotherapeutic approaches by targeting macrophage efferocytosis.

      The concerns have been addressed.

    4. Author response:

      The following is the authors’ response to the original reviews.

      Reviewer #1 (Public review):

      Summary:

      The authors were attempting to describe whether trained innate immunity would modulate antibody-dependent cellular phagocytosis (ADCP) and/or efferocytosis.

      Strengths:

      The use of primary murine macrophages, and not a cell line, is considered a strength. The trained immunity-mediated changes to phagocytosis affected both melanoma and breast cancer cells. The broad effect is consistent with trained immunity.

      Weaknesses:

      The most significant weakness, also noted by the authors in the discussion, is the lack of in vivo data. Without these data, it is not possible to put the in vitro data in context. It is unknown if the described effects on efferocytosis will be relevant to the in vivo progression of cancer.

      We thank the reviewer for these comments. To examine the role of trained immunity on the modulation of macrophage efferocytosis in vivo, we performed immunostaining analysis in sections from B16F10 tumour samples.

      Importantly, we found that macrophage efferocytosis of apoptotic tumour cells was significantly decreased in the tumour tissue that was excised from mice treated with β-glucan 7 days prior to tumour inoculation (supplementary Figure 3). These data are consistent with our findings using co-culture assays further strengthening the impact of our key findings in this report.

      Reviewer #2 (Public review):

      Summary:

      The authors follow up their preclinical work on beta-glucan-induced trained immunity in murine tumor models that they published in Cell in 2020. In particular, they focus on the role of trained immunity and efferocytosis of cancer cells

      Strengths:

      While properly conducted, the work is underwhelming and fully depends on in vitro observations performed with co-cultures of bone marrow derived macrophages from beta-glucantreated mice and tumor cell lines. From these in vitro studies, the authors conclude that trained immunity induction has no effect on antibody-dependent cellular phagocytosis, while it decreases efferocytosis.

      Weaknesses:

      It would be important to study these phenomena in tumor mouse models in vivo. The authors clearly have the expertise as they have shown in previous studies. Especially because the in vitro observation appears to conflict with the in vivo anti-tumor found in mice prophylactically treated with beta-glucan. Clearly, trained immunity is associated with diverse cellular responses and mechanisms, some of which may promote tumor growth, as the current manuscript suggests, but in the absence of in vivo studies, it is merely a mechanistic exercise of which the relevance is difficult to determine.

      We thank the reviewer for raising this important comment. We have followed reviewer’s suggestion and examined the role of trained immunity on the modulation of macrophage efferocytosis in vivo. As mentioned in our response to Reviewer 1, we demonstrate that efferocytosis of apoptotic melanoma cells in situ was attenuated in tumour samples from ‘trained’ mice as compared to those from controltreated mice.

      Efferocytosis displays a pro-tumour and immunosuppressive role, therefore both our in vitro co-culture (Figure 1) and in vivo (supplementary Figure 3) findings are consistent with our previously published in vivo data supporting the tumour-suppressive role of prophylactic treatment with β-glucan (Kalafati, Kourtzelis et al, PMID: 33125892). 

      Reviewer #3 (Public review):

      Summary:

      Chatzis et al showed that β-glucan trained macrophages have decreased phagocytic activity of apoptotic tumor cells and that is accompanied by lower levels of secreted IL-1β using a mouse model. Strengths: This finding has a potential impact on designing new cancer immunotherapeutic approaches by targeting macrophage efferocytosis.

      Weaknesses:

      Whether this finding could be applied to other scenarios is underdetermined.

      (1)  Does the decrease of efferocytosis also occur in human monocytes/macrophages after training?

      (2)  Both β-glucan and BCG are well-trained innate immunity agents, the authors showed that β-glucan decreased efferocytosis via IL-1 β, so it is interesting to know whether BCG has a similar effect.

      We thank the reviewer for these comments. Our data suggest that induction of trained immunity with β-glucan contributes to decreased macrophage efferocytosis of tumour cells based on co-culture and in vivo approaches in a mouse setting.  

      We agree with the reviewer that utilisation of a human setting would be important to provide additional validation of our findings.

      Induction of trained immunity entails epigenetic and metabolic reprogramming of hematopoietic stem and progenitor cells (HSPCs). As such, the elucidation of mechanisms that modulate trained immunity in human cells would require the establishment of a macrophage differentiation model based on the use of HSPCs rather than the stimulation of monocytes or macrophages with β-glucan.

      Additionally, the investigation of the impact of BCG in trained immunity-dependent phagocytosis would require the assessment of all different types of phagocytic cargos (apoptotic melanoma and breast cancer cells, apoptotic neutrophils, microbial bioparticles) as we did in the case of the β-glucan.  The capacity of different molecules to induce trained immunity in the efferocytosis setting requires further investigation that would be beyond the scope of this study. Therefore, we plan to address these very interesting points in a future study.

      Additional text was added in the Discussion section to clarify the reviewer's points. In addition, we provide a more specific title that reflects better the specificity of our findings.

    1. eLife Assessment

      The manuscript provides important findings on how striatal projection neurons regulate spontaneous locomotion speed in the context of implicit motivation and distinct contextual valence. The manuscript presented convincing supporting evidence for the findings. This work will be of broad interest to neuroscientists in the fields of basal ganglia, movement control, and cognition.

    2. Reviewer #1 (Public review):

      Summary:

      This fundamental work employed multidisciplinary approaches and conducted rigorous experiments to study how a specific subset of neurons in the dorsal striatum (i.e., "patchy" striatal neurons) modulates locomotion speed depending on the valence of naturalistic contexts.

      Strengths:

      The scientific findings are novel and original and significantly advance our understanding of how the striatal circuit regulates spontaneous movement in various contexts.

      Weaknesses:

      This is extensive research involving various circuit manipulation approaches. Some of these circuit manipulations are not physiological. This is discussed.

    3. Reviewer #2 (Public review):

      Hawes et al. investigated the role of striatal neurons in the patch compartment of the dorsal striatum. Using Sepw1-Cre line, the authors combined a modified version of the light/dark transition box test that allows them to examine locomotor activity in different environmental valence with a variety of approaches, including cell-type-specific ablation, miniscope calcium imaging, fiber photometry, and opto-/chemogenetics. First, they found ablation of patchy striatal neurons resulted in an increase in movement vigor when mice stayed in a safe area or when they moved back from more anxiogenic to safe environments. The following miniscope imaging experiment revealed that a larger fraction of striatal patchy neurons was negatively correlated with movement speed, particularly in an anxiogenic area. Next, the authors investigated differential activity patterns of patchy neurons' axon terminals, focusing on those in GPe, GPi, and SNr, showing that the patchy axons in SNr reflect movement speed/vigor. Chemogenetic and optogenetic activation of these patchy striatal neurons suppressed the locomotor vigor, thus demonstrating their causal role in the modulation of locomotor vigor when exposed to valence differentials. Unlike the activation of striatal patches, such a suppressive effect on locomotion was absent when optogenetically activating matrix neurons by using the Calb1-Cre line, indicating distinctive roles in the control of locomotor vigor by striatal patch and matrix neurons. Together, they have concluded that nigrostriatal neurons within striatal patches negatively regulate movement vigor, dependent on behavioral contexts where motivational valence differs.

      The strengths of this work include the use of multiple experimental approaches, including genetic/viral ablation of patch neurons, miniscope single-cell imaging, as well as projection-specific recording of axonal activity by fiber photometry, and causal manipulation of the neurons by chemogenetic and optogenetics. Although similar findings were reported previously, the authors' results will be of value owing to multiple levels of investigation. In my view, this study will add to the important literature by demonstrating how patch (striosomal) neurons in the striatum controls movement vigor.

    4. Reviewer #3 (Public review):

      Hawes et al. combined behavioral, optical imaging, and activity manipulation techniques to investigate the role of striatal patch SPNs in locomotion regulation. Using Sepw1-Cre transgenic mice, they found that patch SPNs encode locomotion deceleration in a light-dark box procedure through optical imaging techniques. Moreover, genetic ablation of patch SPNs increased locomotion speed, while chemogenetic activation of these neurons decreased it. The authors concluded that a subtype of patch striatonigral neurons modulates locomotion speed based on external environmental cues.

      In the revision, the authors have largely addressed my concerns with additional explanation and discussion, although some of the key experiments to strengthen the authors' claim by identifying the function of specific cell populations remain to be conducted due to technical challenges. Nevertheless, the current results remain valuable and interesting to a wide audience in the field.

    5. Author response:

      The following is the authors’ response to the previous reviews

      Reviewer #1 (Public review): 

      Summary:

      This fundamental work employed multidisciplinary approaches and conducted rigorous experiments to study how a specific subset of neurons in the dorsal striatum (i.e., "patchy" striatal neurons) modulates locomotion speed depending on the valence of the naturalistic context. 

      Strengths: 

      The scientific findings are novel and original and significantly advance our understanding of how the striatal circuit regulates spontaneous movement in various contexts.  Response: We appreciate the reviewer’s positive evaluation.

      Weaknesses: 

      This is extensive research involving various circuit manipulation approaches. Some of these circuit manipulations are not physiological. A balanced discussion of the technical strengths and limitations of the present work would be helpful and beneficial to the field. Minor issues in data presentation were also noted. 

      We have incorporated the recommended discussion of technical limitations and addressed the physiological plausibility of our manipulations on Page 33 of the revised Discussion section. Specifically, we wrote: 

      “Judicious interpretation of the present data must consider the technical limitations of the various methods and circuit-level manipulations applied. Patchy neurons are distributed unevenly across the extensive structure of the striatum, and their targeted manipulation is constrained by viral spread in the dorsal striatum. Somatic calcium imaging using single-photon microscopy captures activity from only a subset of patchy neurons within a narrow focal plane beneath each implanted GRIN lens. Similarly, limitations in light diffusion from optical fibers may reduce the effective population of targeted fibers in both photometry and optogenetic experiments. For example, the more modest locomotor slowing observed with optogenetic activation of striatonigral fibers in the SNr compared to the stronger effects seen with Gq-DREADD activation across the dorsal striatum could reflect limited fiber optic coverage in the SNr.Alternatively, it may suggest that non-striatonigral mechanisms also contribute to generalized slowing. Our photometry data do not support a role for striatopallidal projections from patchy neurons in movement suppression. The potential contribution of intrastriatal mechanisms, discussed earlier, remains to be empirically tested. Although the behavioral assays used were naturalistic, many of the circuit-level interventions were not. Broad ablation or widespread activation of patchy neurons and their efferent projections represent non-physiological manipulations. Nonetheless, these perturbation results are interpreted alongside more naturalistic observations, such as in vivo imaging of patchy neuron somata and axon terminals, to form a coherent understanding of their functional role”.

      Reviewer #2 (Public review):

      Hawes et al. investigated the role of striatal neurons in the patch compartment of the dorsal striatum. Using Sepw1-Cre line, the authors combined a modified version of the light/dark transition box test that allows them to examine locomotor activity in different environmental valence with a variety of approaches, including cell-type-specific ablation, miniscope calcium imaging, fiber photometry, and opto-/chemogenetics. First, they found ablation of patchy striatal neurons resulted in an increase in movement vigor when mice stayed in a safe area or when they moved back from more anxiogenic to safe environments. The following miniscope imaging experiment revealed that a larger fraction of striatal patchy neurons was negatively correlated with movement speed, particularly in an anxiogenic area. Next, the authors investigated differential activity patterns of patchy neurons' axon terminals, focusing on those in GPe, GPi, and SNr, showing that the patchy axons in SNr reflect movement speed/vigor. Chemogenetic and optogenetic activation of these patchy striatal neurons suppressed the locomotor vigor, thus demonstrating their causal role in the modulation of locomotor vigor when exposed to valence differentials. Unlike the activation of striatal patches, such a suppressive effect on locomotion was absent when optogenetically activating matrix neurons by using the Calb1-Cre line, indicating distinctive roles in the control of locomotor vigor by striatal patch and matrix neurons. Together, they have concluded that nigrostriatal neurons within striatal patches negatively regulate movement vigor, dependent on behavioral contexts where motivational valence differs.

      We are grateful for the reviewer’s thorough summary of our main findings.

      In my view, this study will add to the important literature by demonstrating how patch (striosomal) neurons in the striatum control movement vigor. This study has applied multiple approaches to investigate their functionality in locomotor behavior, and the obtained data largely support their conclusions. Nevertheless, I have some suggestions for improvements in the manuscript and figures regarding their data interpretation, accuracy, and efficacy of data presentation

      We appreciate the reviewer’s overall positive assessment and have made substantial improvements to the revised manuscript in response to reviewers’ constructive suggestions.

      (1) The authors found that the activation of the striatonigral pathway in the patch compartment suppresses locomotor speed, which contradicts with canonical roles of the direct pathway. It would be great if the authors could provide mechanistic explanations in the Discussion section. One possibility is that striatal D1R patch neurons directly inhibit dopaminergic cells that regulate movement vigor (Nadal et al., Sci. Rep., 2021; Okunomiya et al., J Neurosci., 2025). Providing plausible explanations will help readers infer possible physiological processes and give them ideas for future follow-up studies.

      We have added the recommended data interpretation and future perspectives on Page 30 of the revised Discussion section. Specifically, we wrote:

      “Potential mechanisms by which striatal patchy neurons reduce locomotion involve the supression of dopamine availability within the striatum. Dopamine, primarily supplied by neurons in the SNc and VTA,broadly facilitates locomotion (Gerfen and Surmeier 2011, Dudman and Krakauer 2016). Recent studies have shown that direct activation of patchy neurons leads to a reduction in striatal dopamine levels, accompanied by decreased walking speed (Nadel, Pawelko et al. 2021, Dong, Wang et al. 2025, Okunomiya, Watanabe et al. 2025). Patchy neuron projections terminate in structures known as “dendron bouquets”, which enwrap SNc dendrites within the SNr and can pause tonic dopamine neuron firing (Crittenden, Tillberg et al. 2016, Evans, Twedell et al. 2020). The present work highlights a role for patchy striatonigral inputs within the SN in decelerating movement, potentially through GABAergic dendron bouquets that limit dopamine release back to the striatum (Dong, Wang et al. 2025). Additionally, intrastriatal collaterals of patch spiny projection neurons (SPNs) have been shown to suppress dopamine release and associated synaptic plasticity via dynorphin-mediated activation of kappa opioid receptors on dopamine terminals (Hawes, Salinas et al. 2017). This intrastriatal mechanism may further contribute to the reduction in striatal dopamine levels and the observed decrease in locomotor speed, representing a compelling avenue for future investigation.”

      (2) On page 14, Line 301, the authors stated that "Cre-dependent mCheery signals were colocalized with the patch marker (MOR1) in the dorsal striatum (Fig. 1B)". But I could not find any mCherry on that panel, so please modify it.

      We have included representative images of mCherry and MOR1 staining in Supplementary Fig. S1 of the revised manuscript.

      (3) From data shown in Figure 1, I've got the impression that mice ablated with striatal patch neurons were generally hyperactive, but this is probably not the case, as two separate experiments using LLbox and DDbox showed no difference in locomotor vigor between control and ablated mice. For the sake of better interpretation, it may be good to add a statement in Lines 365-366 that these experiments suggest the absence of hyperactive locomotion in general by ablating these specific neurons.

      As suggested by the reviewer, we have added the following statement on Page 17 of the revised manuscript: “These data also indicate that PA elevates valence-specific speed without inducing general hyperactivity”.

      (4) In Line 536, where Figure 5A was cited, the author mentioned that they used inhibitory DREADDs (AAV-DIO-hM4Di-mCherrry), but I could not find associated data on Figure 5. Please cite Figure S3, accordingly.

      We have added the citation for the now Fig. S4 on Page 25 of the revised manuscript.

      (5) Personally, the Figure panel labels of "Hi" and "ii" were confusing at first glance. It would be better to have alternatives.

      As suggested by the reviewer, we have now labeled each figure panel with a distinct single alphabetical letter.

      (6) There is a typo on Figure 4A: tdTomata → tdTomato

      We have made the correction on the figure.

      Reviewer #3 (Public review):

      Hawes et al. combined behavioral, optical imaging, and activity manipulation techniques to investigate the role of striatal patch SPNs in locomotion regulation. Using Sepw1-Cre transgenic mice, they found that patch SPNs encode locomotion deceleration in a light-dark box procedure through optical imaging techniques. Moreover, genetic ablation of patch SPNs increased locomotion speed, while chemogenetic activation of these neurons decreased it. The authors concluded that a subtype of patch striatonigral neurons modulates locomotion speed based on external environmental cues. Below are some major concerns:

      The study concludes that patch striatonigral neurons regulate locomotion speed. However, unless I missed something, very little evidence is presented to support the idea that it is specifically striatonigral neurons, rather than striatopallidal neurons, that mediate these effects. In fact, the optogenetic experiments shown in Fig. 6 suggest otherwise. What about the behavioral effects of optogenetic stimulation of striatonigral versus striatopallidal neuron somas in Sepw1-Cre mice?

      Our photometry data implicate striatonigral neurons in locomotor slowing, as evidenced by a negative cross-correlation with acceleration and a negative lag, indicating that their activity reliably precedes—and may therefore contribute to—deceleration. In contrast, photometry results from striatopallidal neurons showed no clear correlation with speed or acceleration.

      Figure 6 demonstrates that optogenetic manipulation within the SNr of Sepw1-Cre<sup>+</sup> striatonigral axons recapitulated context-dependent locomotor changes seen with Gq-DREADD activation of both striatonigral and striatopallidal Sepw1-Cre<sup>+</sup> cells in the dorsal striatum but failed to produce the broader locomotor speed change observed when targeting all Sepw1-Cre<sup>+</sup> cells in the dorsal striatum using either ablation or Gq-DREADD activation. The more subtle speed-restrictive phenotype resulting from ChR activation in the SNr could, as the reviewer suggests, implicate striatopallidal neurons in broad locomotor speed regulation. However, our photometry data indicate that this scenario is unlikely, as activity of striatopallidal Sepw1-Cre<sup>+</sup> fibers is not correlated with locomotor speed. Another plausible explanation is that the optogenetic approach may have affected fewer striatonigral fibers, potentially due to the limited spatial spread of light from the optical fiber within the SNr. Broad locomotor speed change in LDbox might require the recruitment of a larger number of striatonigral fibers than we were able to manipulate with optogenetics. We have added discussion of these technical limitations to the revised manuscript. Additionally, we now discuss the possibility that intrastriatal collaterals may contribute to reduced local dopamine levels by releasing dynorphin, which acts on kappa opioid receptors located on dopamine fibers (Hawes, Salinas et al. 2017), thereby suppressing dopamine release.

      The reviewer also suggests an interesting experiment involving optogenetic stimulation of striatonigral versus striatopallidal somata in Sepw1-Cre mice. While we agree that this approach would yield valuable insights, we have thus far been unable to achieve reliable results using retroviral vectors. Moreover, selectively targeting striatopallidal terminals optogenetically remains technically challenging, as striatonigral fibers also traverse the pallidum, and the broad anatomical distribution of the pallidum complicates precise targeting. This proposed work will need to be pursued in a future study, either with improved retrograde viral tools or the development of additional mouse lines that offer more selective access to these neuronal populations as we documented recently (Dong, Wang et al. 2025).

      In the abstract, the authors state that patch SPNs control speed without affecting valence. This claim seems to lack sufficient data to support it. Additionally, speed, velocity, and acceleration are very distinct qualities. It is necessary to clarify precisely what patch neurons encode and control in the current study.

      We believe the reviewer’s interpretation pertains to a statement in the Introduction rather than the Abstract: “Our findings reveal that patchy SPNs control the speed at which mice navigate the valence differential between high- and low-anxiety zones, without affecting valence perception itself.” Throughout our study, mice consistently preferred the dark zone in the Light/Dark box, indicating intact perception of the valence differential between illuminated areas. While our manipulations altered locomotor speed, they did not affect time spent in the dark zone, supporting the conclusion that valence perception remained unaltered. We appreciate the reviewer’s insight and agree it is an intriguing possibility that locomotor responses could, over time, influence internal states such as anxiety. We addressed this in the Discussion, noting that while dark preference was robust to our manipulations, future studies are warranted to explore the relationship between anxious locomotor vigor and anxiety itself. We report changes in scalar measures of animal speed across Light/Dark box conditions and under various experimental manipulations. Separately, we show that activity in both patchy neuron somata and striatonigral fibers is negatively correlated with acceleration—indicating a positive correlation with deceleration. Notably, the direction of the cross-correlational lag between striatonigral fiber activity and acceleration suggests that this activity precedes and may causally contribute to mouse deceleration, thereby influencing reductions in speed. To clarify this, we revised a sentence in the Results section:

      “Moreover, patchy neuron efferent activity at the SNr may causally contribute to deceleration, asindicated by the negative cross-correlational lag, thereby reducing animal speed.”. We also updated the Discussion to read: “Together, these data specifically implicate patchy striatonigral neurons in slowing locomotion by acting within the SNr to drive deceleration.”

      One of the major results relies on chemogenetic manipulation (Figure 5). It would be helpful to demonstrate through slice electrophysiology that hM3Dq and hM4Di indeed cause changes in the activity of dorsal striatal SPNs, as intended by the DREADD system. This would support both the positive (Gq) and negative (Gi) findings, where no effects on behavior were observed.

      We were unable to perform this experiment; however, hM3Dq has previously been shown to be effective in striatal neurons (Alcacer, Andreoli et al. 2017). The lack of effect observed in GiDREADD mice serves as an unintended but valuable control, helping to rule out off-target effects of the DREADD agonist JHU37160 and thereby reinforcing the specificity of hM3Dq-mediated activation in our study. We have now included an important caveat regarding the Gi-DREADD results, acknowledging the possibility that they may not have worked effectively in our target cells:

      “Potential explanations for the negative results in Gi-DREADD mice include inherently low basal activity among patchy neurons or insufficient expression of GIRK channels in striatal neurons, which may limit the effectiveness of Gicoupling in suppressing neuronal activity (Shan, Fang et al. 2022).”

      Finally, could the behavioral effects observed in the current study, resulting from various manipulations of patch SPNs, be due to alterations in nigrostriatal dopamine release within the dorsal striatum?

      We agree that this is an important potential implication of our work, especially given that we and others have shown that patchy striatonigral neurons provide strong inhibitory input to dopaminergic neurons involved in locomotor control (Nadel, Pawelko et al. 2021, Lazaridis, Crittenden et al. 2024, Dong, Wang et al. 2025, Okunomiya, Watanabe et al. 2025). Accordingly, we have expanded the discussion section to include potential mechanistic explanations that support and contextualize our main findings.

      Reviewer #1 (Recommendations for the authors):

      Here are some minor issues for the authors' reference:

      (1) This work supports the motor-suppressing effect of patchy SPNs, and >80% of them are direct pathway SPNs. This conclusion is not expected from the traditional basal ganglia direct/indirect pathway model. Most experiments were performed using nonphysiological approaches to suppress (i.e., ablation) or activate (i.e., continuous chemo-optogenetic stimulation). It remains uncertain if the reported observations are relevant to the normal biological function of patchy SPNs under physiological conditions. Particularly, under what circumstances an imbalanced patch/matrix activity may be induced, as proposed in the sections related to the data presented in Figure 6. A thorough discussion and clarification remain needed. Or it should be discussed as a limitation of the present work.

      We have added discussion and clarification of physiological limitations in response to reviewer feedback. Additionally, we revised the opening sentence of an original paragraph in the discussion section to emphasize that it interprets our findings in the context of more physiological studies reporting natural shifts in patchy SPN activity due to cognitive conflict, stress, or training. The revised opening sentence now reads: “Together with previous studies of naturally occurring shifts in patchy neuron activation, these data illustrate ethologically relevant roles for a subgroup of genetically defined patchy neurons in behavior.”

      (2) Lines 499-500: How striato-nigral cells encode speed and deceleration deserves a thorough discussion and clarification. These striatonigral cells can target both SNr GABAergic neurons and dendrites of the dopaminergic neurons. A discussion of microcircuits formed by the patchy SPNs axons in the SNr GABAergic and SNC DAergic neurons should be presented.

      We have added this point at lines 499–500, including a reference to a relevant review of microcircuitry. Additionally, we expanded the discussion section to address microcircuit mechanisms that may underlie our main findings.

      (3) Line 70: "BNST" should be spelled out at the first time it is mentioned.

      This has been done.

      (4) Line 133: only GCaMP6 was listed in the method, but GCaMP8 was also used (Figure 4). Clarification or details are needed.

      Thank you for your careful attention to detail. We have corrected the typographical errors in the Methods section. Specifically, in the Stereotaxic Injections section, we corrected “GCaMP83” to “GCaMP8s.” In the Fiber Implant section, we removed the incorrect reference to “GCaMP6s” and clarified that GCaMP8s was used for photometry, and hChR2 was used for optogenetics.

      (5) Line 183: Can the authors describe more precisely what "a moment" means in terms of seconds or minutes?

      This has been done.

      (6) Line 288: typo: missing / in ΔF

      Thank you this has been fixed

      (7) Line 301-302: the statement of "mCherry and MOR1 colocalization" does not match the images in Figure 1B.

      This has been corrected by proving a new Supplementary Figure S1.

      (8) Related to the statement between Lines 303-304: Figure 1c data may reflect changes in MOR1 protein or cell loss. Quantification of NeuN+ neurons within the MOR1 area would strengthen the conclusion of 60% of patchy cell loss in Figure 1C

      Since the efficacy of AAV-FLEX-taCasp3 in cell ablation has been well established in our previous publications and those of others (Yang, Chiang et al. 2013, Wu, Kung et al. 2019), we do not believe the observed loss of MOR1 staining in Fig. 1C merely reflects reduced MOR1 expression. Moreover, a general neuronal marker such as NeuN may not reliably detect the specific loss of patchy neurons in our ablation model, given the technical limitations of conventional cell-counting methods like MBF’s StereoInvestigator, which typically exhibit a variability margin of 15–20%.

      (9) Lines 313-314: "Similarly, PA mice demonstrated greater stay-time in the dark zone (Figure 1E)." Revision is needed to better reflect what is shown in Figure 1E and avoid misunderstandings.

      Thank you this has been addressed.

      (10) The color code in Figure 2Gi seems inconsistent with the others? Clarifications are needed

      Color coding in Figure 2Gi differs from that in 2Eii out of necessity. For example, the "Light" cells depicted in light blue in 2Eii are represented by both light gray and light red dots in 2Gi. Importantly, Figure 2G does not encode specific speed relationships; instead, any association with speed is indicated by a red hue.

      (11) Lines 538-539: the statement of "Over half of the patch was covered" was not supported by Figure 5C. Clarification is needed.

      Thank you. For clarity, we updated the x-axis labels in Figures 1C and 5C from “% area covered” to “% DS area covered,” and defined “DS” as “dorsal striatal” in the corresponding figure legends. Additionally, we revised the sentence in question to read: “As with ablation, histological examination indicated that a substantial fraction of dorsal patch territories, identified through MOR1 staining, were impacted (Fig. 5C).”

      (12) Figure 3: statistical significance in Figure 3 should be labeled in various panels.

      We believe the reviewer's concern pertains to the scatter plot in panel F—specifically, whether the data points are significantly different from zero. In panel 3F, the 95% confidence interval clearly overlaps with zero, indicating that the results are not statistically significant.

      (13) Figures 6D-E: no difference in the speed of control mice and ChR2 mice under continuous optical stimulation was not expected. It was different from Gq-DRADDS study in Figure 5E-F. Clarifications are needed.

      For mice undergoing constant ChR2 activation of Sepw1-Cre+ SNr efferents, overall locomotor speed does not differ from controls. However, the BIL (bright-to-illuminated) effect on zone transitions isdisrupted: activating Sepw1-Cre<sup>+ </sup> fibers in the SNr blunts the typical increase in speed observed when mice flee from the light zone toward the dark zone. This impaired BIL-related speed increase upon exiting the light was similarly observed in the Gq-DREADD cohort. The reviewer is correct that this optogenetic manipulation within the SNr did not produce the more generalized speed reductions seen with broader Gq-DREADD activation of all Sepw1-Cre<sup>+ </sup> cells in the dorsal striatum. A likely explanation is the difference in targeting—ChR2 specifically activates SNr-bound terminals, whereas Gq-DREADD broadly activates entire Sepw1-Cre<sup>+ </sup> cells. Notably, many of the generalized speed profile changes observed with chemogenetic activation are opposite to those resulting from broad ablation of Sepw1-Cre<sup>+ </sup> cells. The more subtle speed-restrictive phenotype observed with ChR2 activation targeted to the SNr may suggest that fewer striatonigral fibers were affected by this technique, possibly due to the limited spread of light from the fiber optic. Broad locomotor speed change in LDbox might require the recruitment of a larger number of striatonigral fibers than we were able to manipulate with an optogenetic approach. Alternatively, it could indicate that non-striatonigral Sepw1-Cre<sup>+ </sup> projections—such as striatopallidal or intrastriatal pathways—play a role in more generalized slowing. If striatopallidal fibers contributed to locomotor slowing, we would expect to see non-zero cross-correlations between neural activity and speed or acceleration, along with negative lag indicating that neural activity precedes the behavioral change. However, our fiber photometry data do not support such a role for Sepw1-Cre<sup>+ </sup> striatopallidal fibers. We have also referenced the possibility that intrastriatal collaterals could suppress striatal dopamine levels, potentially explaining the stronger slowing phenotype observed when the entire striatal population is affected, as opposed to selectively targeting striatonigral terminals. These technical considerations and interpretive nuances have been incorporated and clarified in the revised discussion section.

      (14) Lines 632: "compliment": a typo?

      Yes, it should be “complement”.

      (15) Figure 4 legend: descriptions of panels A and B were swapped

      Thank you. This has been corrected.

      (16) Friedman (2020) was listed twice in the bibliography (Lines 920-929).

      Thank you. This has been corrected.

      Reviewer #3 (Recommendations for the authors):

      It will be helpful to label and add figure legends below each figure.

      Thank you for the suggestion.

      Editor's note:

      Should you choose to revise your manuscript, if you have not already done so, please include full statistical reporting including exact p-values wherever possible alongside the summary statistics (test statistic and df) and, where appropriate, 95% confidence intervals. These should be reported for all key questions and not only when the p-value is less than 0.05 in the main manuscript. We noted some instances where only p values are reported.

      Readers would also benefit from coding individual data points by sex and noting N/sex

      We have included detailed statistical information in the revised manuscript. Both male and female mice were used in all experiments in approximately equal numbers. Since no sex-related differences were observed, we did not report the number of animals by sex.

      References

      Alcacer, C., L. Andreoli, I. Sebastianutto, J. Jakobsson, T. Fieblinger and M. A. Cenci (2017). "Chemogenetic stimulation of striatal projection neurons modulates responses to Parkinson's disease therapy." J Clin Invest 127(2): 720-734.

      Crittenden, J. R., P. W. Tillberg, M. H. Riad, Y. Shima, C. R. Gerfen, J. Curry, D. E. Housman, S. B. Nelson, E. S. Boyden and A. M. Graybiel (2016). "Striosome-dendron bouquets highlight a unique striatonigral circuit targeting dopamine-containing neurons." Proc Natl Acad Sci U S A 113(40): 1131811323.

      Dong, J., L. Wang, B. T. Sullivan, L. Sun, V. M. Martinez Smith, L. Chang, J. Ding, W. Le, C. R. Gerfen and H. Cai (2025). "Molecularly distinct striatonigral neuron subtypes differentially regulate locomotion." Nat Commun 16(1): 2710.

      Dudman, J. T. and J. W. Krakauer (2016). "The basal ganglia: from motor commands to the control of vigor." Curr Opin Neurobiol 37: 158-166.

      Evans, R. C., E. L. Twedell, M. Zhu, J. Ascencio, R. Zhang and Z. M. Khaliq (2020). "Functional Dissection of Basal Ganglia Inhibitory Inputs onto Substantia Nigra Dopaminergic Neurons." Cell Rep 32(11): 108156.

      Gerfen, C. R. and D. J. Surmeier (2011). "Modulation of striatal projection systems by dopamine." Annual review of neuroscience 34: 441-466.

      Hawes, S. L., A. G. Salinas, D. M. Lovinger and K. T. Blackwell (2017). "Long-term plasticity of corticostriatal synapses is modulated by pathway-specific co-release of opioids through kappa-opioid receptors." J Physiol 595(16): 5637-5652.

      Lazaridis, I., J. R. Crittenden, G. Ahn, K. Hirokane, T. Yoshida, A. Mahar, V. Skara, K. Meletis, K.Parvataneni, J. T. Ting, E. Hueske, A. Matsushima and A. M. Graybiel (2024). "Striosomes Target Nigral Dopamine-Containing Neurons via Direct-D1 and Indirect-D2 Pathways Paralleling Classic DirectIndirect Basal Ganglia Systems." bioRxiv.

      Nadel, J. A., S. S. Pawelko, J. R. Scott, R. McLaughlin, M. Fox, M. Ghanem, R. van der Merwe, N. G. Hollon, E. S. Ramsson and C. D. Howard (2021). "Optogenetic stimulation of striatal patches modifies habit formation and inhibits dopamine release." Sci Rep 11(1): 19847.

      Okunomiya, T., D. Watanabe, H. Banno, T. Kondo, K. Imamura, R. Takahashi and H. Inoue (2025).

      "Striosome Circuitry Stimulation Inhibits Striatal Dopamine Release and Locomotion." J Neurosci 45(4).

      Shan, Q., Q. Fang and Y. Tian (2022). "Evidence that GIRK Channels Mediate the DREADD-hM4Di Receptor Activation-Induced Reduction in Membrane Excitability of Striatal Medium Spiny Neurons." ACS Chem Neurosci 13(14): 2084-2091.

      Wu, J., J. Kung, J. Dong, L. Chang, C. Xie, A. Habib, S. Hawes, N. Yang, V. Chen, Z. Liu, R. Evans, B. Liang, L. Sun, J. Ding, J. Yu, S. Saez-Atienzar, B. Tang, Z. Khaliq, D. T. Lin, W. Le and H. Cai (2019). "Distinct Connectivity and Functionality of Aldehyde Dehydrogenase 1a1-Positive Nigrostriatal Dopaminergic Neurons in Motor Learning." Cell Rep 28(5): 1167-1181 e1167.

      Wu, J., J. Kung, J. Dong, L. Chang, C. Xie, A. Habib, S. Hawes, N. Yang, V. Chen, Z. Liu, R. Evans, B. Liang, L. Sun, J. Ding, J. Yu, S. Saez-Atienzar, B. Tang, Z. Khaliq, D. T. Lin, W. Le and H. Cai (2019). "Distinct Connectivity and Functionality of Aldehyde Dehydrogenase 1a1-Positive Nigrostriatal Dopaminergic Neurons in Motor Learning." Cell Rep 28(5): 1167-1181 e1167.

    1. eLife Assessment

      In this manuscript, Park et al. developed a multiplexed CRISPR construct to genetically ablate the GABA transporter GAT3 in the mouse visual cortex, with effects on population-level neuronal activity. This work is important, as it sheds light on how GAT3 controls the processing of visual information. The findings are compelling, leveraging state-of-the-art gene CRISPR/Cas9, in vivo two-photon laser scanning microscopy, and advanced statistical modeling.

    2. Reviewer #1 (Public review):

      Summary:

      The authors have investigated the role of GAT3 in the visual system. First, they have developed a CRISPR/Cas9-based approach to locally knock out this transporter in the visual cortex. They then demonstrated electrophysiologically that this manipulation increases inhibitory synaptic input into layer 2/3 pyramidal cells. They further examined the functional consequences by imaging neuronal activity in the visual cortex in vivo. They found that absence of GAT3 leads to reduced spontaneous neuronal activity and attenuated neuronal responses and reliability to visual stimuli, but without an effect on orientation selectivity. Further analysis of this data suggests that Gat3 removal leads to less coordinated activity between individual neurons and in population activity patterns, thereby impaired information encoding. Overall, this is an elegant and technically advanced study that demonstrates a new and important role of GAT3 in controlling processing of visual information.

      Strengths:

      Development of a new approach for a local knockout (GAT3)

      Important and novel insights into visual system function and its dependence on GAT3

      Plausible cellular mechanism

      Weaknesses:

      No major weaknesses.

    3. Reviewer #2 (Public review):

      Summary:

      Park et al. has made a tool for spatiotemporally restricted knockout of the astrocytic GABA transporter GAT3 leveraging CRISPR/Cas9 and viral transduction in adult mice, and evaluated the effects of GAT3 on neural encoding of visual stimulation.

      Strengths:

      This concise manuscript leverages state-of-the-art gene CRISPR/Cas9 technology for knocking out astrocytic genes. This has to a little degree been preformed previously in astrocytes and represents an important development in the field. Moreover they utilize in vivo two-photon imaging of neural responses to visual stimuli as a readout of neural activity, in addition to validating their data with ex vivo electrophysiology. Lastly, they use advanced statistical modeling to analyze the impact on GAT3 knockout. Overall, the study comes across as rigorous and convincing.

      Weaknesses:

      Adding the following experiments would potentially have strengthened the conclusions and helped interpret the findings, although may be considered outside the scope of this manuscript, and be pursued in future work:

      (1) Neural activity is quite profoundly influenced by GAT3 knockout. Corroborating these relatively large changes to neural activity with in vivo electrophysiology of some sort as an additional readout would have strengthened the conclusions.

      (2) Given the quite large effects on neural coding in visual cortex assessed with jRGECO imaging it would have been interesting the mouse groups could have been subjected to behavioral testing assessing the visual system.

    4. Author response:

      The following is the authors’ response to the original reviews.

      Reviewer #1 (Public review):

      Summary:

      The authors have investigated the role of GAT3 in the visual system. First, they have developed a CRISPR/Cas9-based approach to locally knock out this transporter in the visual cortex. They then demonstrated electrophysiologically that this manipulation increases inhibitory synaptic input into layer 2/3 pyramidal cells. They further examined the functional consequences by imaging neuronal activity in the visual cortex in vivo. They found that the absence of GAT3 leads to reduced spontaneous neuronal activity and attenuated neuronal responses and reliability to visual stimuli, but without an effect on orientation selectivity. Further analysis of this data suggests that Gat3 removal leads to less coordinated activity between individual neurons and in population activity patterns, thereby impairing information encoding. Overall, this is an elegant and technically advanced study that demonstrates a new and important role of GAT3 in controlling the processing of visual information.

      We are grateful to the reviewer for their positive appraisal of our work, including our technical advances and our demonstration of how cortical astrocytes play a role in visual information processing by neurons via GAT3-mediated regulation of activity.

      Strengths:

      (1)  Development of a new approach for a local knockout (GAT3).

      (2)  Important and novel insights into visual system function and its dependence on GAT3.

      (3)  Plausible cellular mechanism.

      Weaknesses:

      No major weaknesses were identified by this reviewer.

      We thank the reviewer for highlighting the strengths of our study, including the development of a novel local knockout strategy for GAT3, the discovery of important functional consequences for visual system processing, and the identification of a plausible underlying cellular mechanism.

      Reviewer #2 (Public review):

      Summary:

      Park et al. have made a tool for spatiotemporally restricted knockout of the astrocytic GABA transporter GAT3, leveraging CRISPR/Cas9 and viral transduction in adult mice, and evaluated the effects of GAT3 on neural encoding of visual stimulation.

      Strengths:

      This concise manuscript leverages state-of-the-art gene CRISPR/Cas9 technology for knocking out astrocytic genes. This has only to a small degree been performed previously in astrocytes, and it represents an important development in the field. Moreover, the authors utilize in vivo two-photon imaging of neural responses to visual stimuli as a readout of neural activity, in addition to validating their data with ex vivo electrophysiology. Lastly, they use advanced statistical modeling to analyze the impact of GAT3 knockout. Overall, the study comes across as rigorous and convincing.

      We appreciate the reviewer’s endorsement of our experimental rigor and methodological innovation. We agree that combining in vivo and ex vivo measurements with rigorous analytical methods strengthens the overall conclusions of the study and demonstrates the important role of astrocytic GAT3 in cortical visual processing.

      Weaknesses:

      Adding the following experiments would potentially have strengthened the conclusions and helped with interpreting the findings:

      (1) Neural activity is quite profoundly influenced by GAT3 knockout. Corroborating these relatively large changes to neural activity with in vivo electrophysiology of some sort as an additional readout would have strengthened the conclusions.

      We agree that further investigation of neuronal activity at higher temporal resolution would provide valuable complementary data, particularly given the profound effects we observed using a pan-neuronal calcium indicator. Detailed in vivo electrophysiology—such as large-scale Neuropixel recordings—would allow assessment of single-neuron spiking dynamics and potentially cell-type specific responses following GAT3 deletion. While such an investigation is beyond the scope of the current study, we concur that it would be an important follow-up direction to further dissect the effects of GAT3 knockout on neuron activity profiles at both single-cell and population levels.

      (2) Given the quite large effects on neural coding in visual cortex assessed på jRGECO imaging, it would have been interesting if the mouse groups could have been subjected to behavioral testing, assessing the visual system.

      We appreciate the reviewer’s suggestion to explore potential behavioral consequences of GAT3 deletion. Based on our observed alterations in visual cortical activity, we agree that GAT3 knockout could impact visual discrimination-based behaviors. Astrocytes in the visual cortex are highly tuned to sensory and motor events and are generally known to shape behavioral outputs (Slezak et al., 2019; Kofuji & Araque, 2021). Our study suggests that regulation of inhibitory signaling via GAT3 transporters is a possible mechanism by which astrocytes influence visually guided behaviors. Although behavioral assessments fall beyond the scope of the current work, we agree with the reviewer’s suggestion and will pursue future experiments employing paradigms such as go/no-go visual detection or two-alternative forced choice to determine whether astrocytic GAT3 modulates visually guided behaviors and perceptual decisionmaking.  

      Reviewer #1 (Recommendations for the authors):

      It could be more clearly stated from the very beginning that a method was developed and used which, by itself, apparently has no cell type selectivity. It is highly plausible that the effects are mostly due to the absence of astrocytic GAT3, as discussed by the authors, but the distinction of what has been done and what is interpretation based on the literature is occasionally a bit blurry. This is also important because there are CRISPR/Cas9-based approaches that are astrocyte-specific (e.g., GEARBOCS).

      We thank the reviewer for this helpful suggestion. As noted, our current approach does not confer celltype specificity on its own. Although our interpretation—supported by expression patterns and prior literature—attributes the observed effects primarily to astrocytic GAT3 loss, we agree that this distinction should be explicitly stated. We have revised the Introduction section (lines 83-87) to clarify that while MRCUTS allows for local gene knockout, it is not inherently cell-type specific unless combined with celltype restricted Cre drivers, as is possible in future applications.

      A change of ambient GABA following GAT3 deletion is central to the proposed cellular mechanism. Demonstrating this directly would strengthen the manuscript (e.g., changed tonic GABAergic current in the absence of GAT3, and insensitivity to SNAP-5114).

      While we recognize that directly quantifying ambient GABA levels would further strengthen our study, substantial evidence supports the role of GABA transporters in coordinately regulating both phasic and tonic inhibition and cellular excitability (Kinney, 2005; Keros & Hablitz, 2005; Semyanov et al. 2003).

      Moreover, tonic GABA currents have been shown to strongly correlate with phasic inhibitory bursts (Glykys & Mody, 2007; Farrant & Nusser, 2005; Ataka & Gu, 2006), suggesting shared underlying regulatory mechanisms. Furthermore, as the reviewer correctly points out, alternative mechanisms such as non-vesicular GABA release or disinhibition via interneuron suppression cannot be excluded (also discussed in Kinney 2005). Given these considerations, we prioritized sIPSC measurements as a more integrative and reliable proxy for altered GABAergic signaling in L2/3 pyramidal neurons. We have revised the Discussion section (lines 329-333) to explain our choice of approach for further clarification.

      We also agree it would be of interest to test whether GAT3 KO neurons exhibit insensitivity to SNAP-5114, both ex vivo and in vivo. However, based on our SNAP-5114 application experiments in vivo, which revealed only subtle effects on single-neuron properties (Figure S2A-F), we anticipate that interpreting a lack of effect in the KO condition would be challenging and potentially inconclusive.  

      References

      Ataka, T. & Gu, J. G. Relationship between tonic inhibitory currents and phasic inhibitory activity in the spinal cord lamina II region of adult mice. Mol. Pain. (2006).  

      Bright, D. & Smart, T. Methods for recording and measuring tonic GABAA receptor-mediated inhibition. Front. Neural Circuits. 7, (2013).

      Farrant, M. & Nusser, Z. Variations on an inhibitory theme: phasic and tonic activation of GABAA receptors. Nat. Rev. Neurosci. 6, 215–229 (2005).  

      Glykys, J. & Mody, I. Activation of GABAA Receptors: Views from Outside the Synaptic Cleft. Neuron. 56, 763-770 (2007).

      Keros, S. & Hablitz, J. J. Subtype-Specific GABA Transporter Antagonists Synergistically Modulate Phasic and Tonic GABAA Conductances in Rat Neocortex. J. Neurophysiol. 94, 2073–2085 (2005).

      Kinney, G. A. GAT-3 Transporters Regulate Inhibition in the Neocortex. J. Neurophysiol. 94, 4533–4537 (2005).

      Kofuji, P. & Araque, A. Astrocytes and Behavior. Annu. Rev. Neurosci. 44, 49–67 (2021).

      Semyanov, A., Walker, M. & Kullmann, D. GABA uptake regulates cortical excitability via cell type–specific tonic inhibition. Nat. Neurosci. 6, 484–490 (2003).

      Slezak, M., Kandler, S., Van Veldhoven, P. P., Van den Haute, C., Bonin, V. & Holt, M.G. Distinct

      Mechanisms for Visual and Motor-Related Astrocyte Responses in Mouse Visual Cortex. Curr. Biol. 18, 3120-3127 (2019).

    1. eLife Assessment

      This important study presents a cross-species and cross-disciplinary analysis of cortical folding. The authors use a combination of physical gel models, computational simulations, and morphometric analysis, extending prior work in human brain development to macaques and ferrets. The findings support the hypothesis that mechanical forces driven by differential growth can account for major aspects of gyrification. The evidence presented, though limited in certain species-specific and parametric details, is overall strong and convincingly supports the central claims; the findings will be of broad interest in developmental neuroscience.

    2. Reviewer #1 (Public review):

      The manuscript by Yin and colleagues addresses a long-standing question in the field of cortical morphogenesis, regarding factors that determine differential cortical folding across species and individuals with cortical malformations. The authors present work based on a computational model of cortical folding evaluated alongside a physical model that makes use of gel swelling to investigate the role of a two-layer model for cortical morphogenesis. The study assesses these models against empirically derived cortical surfaces based on MRI data from ferret, macaque monkey, and human brains.

      The manuscript is clearly written and presented, and the experimental work (physical gel modeling as well as numerical simulations) and analyses (subsequent morphometric evaluations) are conducted at the highest methodological standards. It constitutes an exemplary use of interdisciplinary approaches for addressing the question of cortical morphogenesis by bringing together well-tuned computational modeling with physical gel models. In addition, the comparative approaches used in this paper establish a foundation for broad-ranging future lines of work that investigate the impact of perturbations or abnormalities during cortical development.

      The cross-species approach taken in this study is a major strength of the work. However, correspondence across the two methodologies did not appear to be equally consistent in predicting brain folding across all three species. The results presented in Figures 4 (and Figures S3 & S4) show broad correspondence in shape index and major sulci landmarks across all three species. Nevertheless, the results presented for the human brain lack the same degree of clear correspondence for the gel model results as observed in the macaque and ferret. While this study clearly establishes a strong foundation for comparative cortical anatomy across species and the impact of perturbations on individual morphogenesis, further work that fine-tunes physical modeling of complex morphologies, such as that of the human cortex, may help to further understand the factors that determine cortical functionalization and pathologies.

    3. Reviewer #2 (Public review):

      This manuscript explores the mechanisms underlying cerebral cortical folding using a combination of physical modelling, computational simulations, and geometric morphometrics. The authors extend their prior work on human brain development (Tallinen et al., 2014; 2016) to a comparative framework involving three mammalian species: ferrets (Carnivora), macaques (Old World monkeys), and humans (Hominoidea). By integrating swelling gel experiments with mathematical differential growth models, they simulate sulcification instability and recapitulate key features of brain folding across species. The authors make commendable use of publicly available datasets to construct 3D models of fetal and neonatal brain surfaces: fetal macaque (ref. [26]), newborn ferret (ref. [11]), and fetal human (ref. [22]).

      Using a combination of physical models and numerical simulations, the authors compare the resulting folding morphologies to real brain surfaces using morphometric analysis. Their results show qualitative and quantitative concordance with observed cortical folding patterns, supporting the view that differential tangential growth of the cortex relative to the subcortical substrate is sufficient to account for much of the diversity in cortical folding. This is a very important point in our field, and can be used in the teaching of medical students.

      Brain folding remains a topic of ongoing debate. While some regard it as a critical specialization linked to higher cognitive function, others consider it an epiphenomenon of expansion and constrained geometry. This divergence was evident in discussions during the Strüngmann Forum on cortical development (Silver et al., 2019). Though folding abnormalities are reliable indicators of disrupted neurodevelopmental processes (e.g., neurogenesis, migration), their relationship to functional architecture remains unclear. Recent evidence suggests that the absolute number of neurons varies significantly with position-sulcus versus gyrus-with potential implications for local processing capacity (e.g., https://doi.org/10.1002/cne.25626). The field is thus in need of comparative, mechanistic studies like the present one.

      This paper offers an elegant and timely contribution by combining gel-based morphogenesis, numerical modelling, and morphometric analysis to examine cortical folding across species. The experimental design - constructing two-layer PDMS models from 3D MRI data and immersing them in organic solvents to induce differential swelling - is well-established in prior literature. The authors further complement this with a continuum mechanics model simulating folding as a result of differential growth, as well as a comparative analysis of surface morphologies derived from in vivo, in vitro, and in silico brains.

      I offer a few suggestions here for clarification and further exploration:

      Major Comments

      (1) Choice of Developmental Stages and Initial Conditions

      The authors should provide a clearer justification for the specific developmental stages chosen (e.g., G85 for macaque, GW23 for human). How sensitive are the resulting folding patterns to the initial surface geometry of the gel models? Given that folding is a nonlinear process, early geometric perturbations may propagate into divergent morphologies. Exploring this sensitivity-either through simulations or reference to prior work-would enhance the robustness of the findings.

      (2) Parameter Space and Breakdown Points

      The numerical model assumes homogeneous growth profiles and simplifies several aspects of cortical mechanics. Parameters such as cortical thickness, modulus ratios, and growth ratios are described in Table II. It would be informative to discuss the range of parameter values for which the model remains valid, and under what conditions the physical and computational models diverge. This would help delineate the boundaries of the current modelling framework and indicate directions for refinement.

      (3) Neglected Regional Features: The Occipital Pole of the Macaque

      One conspicuous omission is the lack of attention to the occipital pole of the macaque, which is known to remain smooth even at later gestational stages and has an unusually high neuronal density (2.5× higher than adjacent cortex). This feature is not reproduced in the gel or numerical models, nor is it discussed. Acknowledging this discrepancy-and speculating on possible developmental or mechanical explanations-would add depth to the comparative analysis. The authors may wish to include this as a limitation or a target for future work.

      (4) Spatio-Temporal Growth Rates and Available Human Data

      The authors note that accurate, species-specific spatio-temporal growth data are lacking, limiting the ability to model inhomogeneous cortical expansion. While this may be true for ferret and macaque, there are high-quality datasets available for human fetal development, now extended through ultrasound imaging (e.g., https://doi.org/10.1038/s41586-023-06630-3). Incorporating or at least referencing such data could improve the fidelity of the human model and expand the applicability of the approach to clinical or pathological scenarios.

      (5) Future Applications: The Inverse Problem and Fossil Brains

      The authors suggest that their morphometric framework could be extended to solve the inverse growth problem-reconstructing fetal geometries from adult brains. This speculative but intriguing direction has implications for evolutionary neuroscience, particularly the interpretation of fossil endocasts. Although beyond the scope of this paper, I encourage the authors to elaborate briefly on how such a framework might be practically implemented and validated.

      Conclusion

      This is a well-executed and creative study that integrates diverse methodologies to address a longstanding question in developmental neurobiology. While a few aspects-such as regional folding peculiarities, sensitivity to initial conditions, and available human data-could be further elaborated, they do not detract from the overall quality and novelty of the work. I enthusiastically support this paper and believe that it will be of broad interest to the neuroscience, biomechanics, and developmental biology communities.

      Note: The paper mentions a companion paper [reference 11] that explores the cellular and anatomical changes in the ferret cortex. I did not have access to this manuscript, but judging from the title, this paper might further strengthen the conclusions.

    4. Author response:

      Reviewer 1 (Public review):

      The manuscript by Yin and colleagues addresses a long-standing question in the field of cortical morphogenesis, regarding factors that determine differential cortical folding across species and individuals with cortical malformations. The authors present work based on a computational model of cortical folding evaluated alongside a physical model that makes use of gel swelling to investigate the role of a two-layer model for cortical morphogenesis. The study assesses these models against empirically derived cortical surfaces based on MRI data from ferret, macaque monkey, and human brains.

      The manuscript is clearly written and presented, and the experimental work (physical gel modeling as well as numerical simulations) and analyses (subsequent morphometric evaluations) are conducted at the highest methodological standards. It constitutes an exemplary use of interdisciplinary approaches for addressing the question of cortical morphogenesis by bringing together well-tuned computational modeling with physical gel models. In addition, the comparative approaches used in this paper establish a foundation for broad-ranging future lines of work that investigate the impact of perturbations or abnormalities during cortical development.

      The cross-species approach taken in this study is a major strength of the work. However, correspondence across the two methodologies did not appear to be equally consistent in predicting brain folding across all three species. The results presented in Figures 4 (and Figures S3 and S4) show broad correspondence in shape index and major sulci landmarks across all three species. Nevertheless, the results presented for the human brain lack the same degree of clear correspondence for the gel model results as observed in the macaque and ferret. While this study clearly establishes a strong foundation for comparative cortical anatomy across species and the impact of perturbations on individual morphogenesis, further work that fine-tunes physical modeling of complex morphologies, such as that of the human cortex, may help to further understand the factors that determine cortical functionalization and pathologies.

      We thank the reviewer for positive opinions and helpful comments. Yes, the physical gel model of the human brain has a lower similarity index with the real brain. There are several reasons.

      First, the highly convoluted human cortex has a few major folds (primary sulci) and a very large number of minor folds associated with secondary or tertiary sulci (on scales of order comparable to the cortical thickness), relative to the ferret and macaque cerebral cortex. In our gel model, the exact shapes, positions, and orientations of these minor folds are stochastic, which makes it hard to have a very high similarity index of the gel models when compared with the brain of a single individual.

      Second, in real human brains, these minor folds evolve dynamically with age and show differences among individuals. In experiments with the gel brain, multiscale folds form and eventually disappear as the swelling progresses through the thickness. Our physical model results are snapshots during this dynamical process, which makes it hard to have a concrete one-to-one correspondence between the instantaneous shapes of the swelling gel and the growing human brain.

      Third, the growth of the brain cortex is inhomogeneous in space and varying with time, whereas, in the gel model, swelling is relatively homogeneous.

      We agree that further systematic work, based on our proposed methods, with more fine-tuned gel geometries and properties, might provide a deeper understanding of the relations between brain geometry, and growth-induced folds and their functionalization and pathologies. Further analysis of cortical pathologies using computational and physical gel models can be found in our companion paper (Choi et al., 2025), also submitted to eLife:

      G. P. T. Choi, C. Liu, S. Yin, G. Sejourn´ e, R. S. Smith, C. A. Walsh, L. Mahadevan, Biophysical basis for´ brain folding and misfolding patterns in ferrets and humans. Preprint, bioRxiv 2025.03.05.641682.

      Reviewer 2 (Public review):

      This manuscript explores the mechanisms underlying cerebral cortical folding using a combination of physical modelling, computational simulations, and geometric morphometrics. The authors extend their prior work on human brain development (Tallinen et al., 2014; 2016) to a comparative framework involving three mammalian species: ferrets (Carnivora), macaques (Old World monkeys), and humans (Hominoidea). By integrating swelling gel experiments with mathematical differential growth models, they simulate sulcification instability and recapitulate key features of brain folding across species. The authors make commendable use of publicly available datasets to construct 3D models of fetal and neonatal brain surfaces: fetal macaque (ref. [26]), newborn ferret (ref. [11]), and fetal human (ref. [22]).

      Using a combination of physical models and numerical simulations, the authors compare the resulting folding morphologies to real brain surfaces using morphometric analysis. Their results show qualitative and quantitative concordance with observed cortical folding patterns, supporting the view that differential tangential growth of the cortex relative to the subcortical substrate is sufficient to account for much of the diversity in cortical folding. This is a very important point in our field, and can be used in the teaching of medical students.

      Brain folding remains a topic of ongoing debate. While some regard it as a critical specialization linked to higher cognitive function, others consider it an epiphenomenon of expansion and constrained geometry. This divergence was evident in discussions during the Strungmann Forum on cortical development (Silver¨ et al., 2019). Though folding abnormalities are reliable indicators of disrupted neurodevelopmental processes (e.g., neurogenesis, migration), their relationship to functional architecture remains unclear. Recent evidence suggests that the absolute number of neurons varies significantly with position-sulcus versus gyrus-with potential implications for local processing capacity (e.g., https://doi.org/10.1002/cne.25626). The field is thus in need of comparative, mechanistic studies like the present one.

      This paper offers an elegant and timely contribution by combining gel-based morphogenesis, numerical modelling, and morphometric analysis to examine cortical folding across species. The experimental design - constructing two-layer PDMS models from 3D MRI data and immersing them in organic solvents to induce differential swelling - is well-established in prior literature. The authors further complement this with a continuum mechanics model simulating folding as a result of differential growth, as well as a comparative analysis of surface morphologies derived from in vivo, in vitro, and in silico brains.

      We thank the reviewer for the very positive comments.

      I offer a few suggestions here for clarification and further exploration:

      Major Comments

      (1)   Choice of Developmental Stages and Initial Conditions

      The authors should provide a clearer justification for the specific developmental stages chosen (e.g., G85 for macaque, GW23 for human). How sensitive are the resulting folding patterns to the initial surface geometry of the gel models? Given that folding is a nonlinear process, early geometric perturbations may propagate into divergent morphologies. Exploring this sensitivity-either through simulations or reference to prior work-would enhance the robustness of the findings.

      The initial geometry is one of the important factors that decides the final folding pattern. The smooth brain in the early developmental stage shows a broad consistency across individuals, and we expect the main folds to form similarly across species and individuals.

      Generally, we choose the initial geometry when the brain cortex is still relatively smooth. For the human, this corresponds approximately to GW23, as the major folds such as the Rolandic fissure (central sulcus), arise during this developmental stage. For the macaque brain, we chose developmental stage G85, primarily because of the availability of the dataset corresponding to this time, which also corresponds to the least folded.

      We expect that large-scale folding patterns are strongly sensitive to the initial geometry but fine-scale features are not. Since our goal is to explain the large-scale features, we expect sensitivity to the initial shape.

      Enclosed are some results from other researchers that are consistent with this idea. Below are some images of simulations from Wang et al. obtained by perturbing the geometry of a sphere to an ellipsoid. We see that the growth-induced folds mostly maintain their width (wavelength), but change their orientations.

      Reference:

      Wang, X., Lefevre, J., Bohi, A., Harrach, M.A., Dinomais, M. and Rousseau, F., 2021. The influence of` biophysical parameters in a biomechanical model of cortical folding patterns. Scientific Reports, 11(1), p.7686.

      Related results from the same group show that slight perturbations of brain geometry, cause these folds also tend to change their orientations but not width/wavelength (Bohi et al., 2019).

      Reference:

      Bohi, A., Wang, X., Harrach, M., Dinomais, M., Rousseau, F. and Lefevre, J., 2019, July. Global per-` turbation of initial geometry in a biomechanical model of cortical morphogenesis. In 2019 41st Annual International Conference of the IEEE Engineering in Medicine and Biology Society (EMBC) (pp. 442-445). IEEE.

      Finally, a systematic discussion of the role of perturbations on the initial geometries and physical properties can be seen in our work on understanding a different system, gut morphogenesis (Gill et al., 2024).

      We have added the discussion about geometric sensitivity in the section Methods-Numerical Simulations:

      “Small perturbations on initial geometry would affect minor folds, but the main features of major folds, such as orientations, width, and depth, are expected to be conserved across individuals [49, 50]. For simplicity, we do not perturb the fetal brain geometry obtained from datasets.”

      (2) Parameter Space and Breakdown Points

      The numerical model assumes homogeneous growth profiles and simplifies several aspects of cortical mechanics. Parameters such as cortical thickness, modulus ratios, and growth ratios are described in Table II. It would be informative to discuss the range of parameter values for which the model remains valid, and under what conditions the physical and computational models diverge. This would help delineate the boundaries of the current modelling framework and indicate directions for refinement.

      Exploring the valid parameter space is a key problem. We have tested a series of growth parameters and will state them explicitly in our revision. In the current version, we chose the ones that yield a relatively high similarity index to the animal brains. More generally, folding patterns are largely regulated by geometry as well as physical parameters, such as cortical thickness, modulus ratios, growth ratios, and inhomogeneity. In our previous work on a different system, gut morphogenesis, where similar folding patterns are seen, we have explored these features (Gill et al., 2024).

      Reference:

      Gill, H.K., Yin, S., Nerurkar, N.L., Lawlor, J.C., Lee, C., Huycke, T.R., Mahadevan, L. and Tabin, C.J., 2024. Hox gene activity directs physical forces to differentially shape chick small and large intestinal epithelia. Developmental Cell, 59(21), pp.2834-2849.

      (3) Neglected Regional Features: The Occipital Pole of the Macaque

      One conspicuous omission is the lack of attention to the occipital pole of the macaque, which is known to remain smooth even at later gestational stages and has an unusually high neuronal density (2.5× higher than adjacent cortex). This feature is not reproduced in the gel or numerical models, nor is it discussed. Acknowledging this discrepancy-and speculating on possible developmental or mechanical explanationswould add depth to the comparative analysis. The authors may wish to include this as a limitation or a target for future work.

      Yes, we have added that the omission of the Occipital Pole of the macaque is one of our paper’s limitations. Our main aim in this paper is to explore the formation of large-scale folds, so the smooth region is neglected. But future work could include this to make the model more complete.

      The main text has been modified in Methods, 3D model reconstruction, pre-processing:

      “To focus on fold formation, we neglected some smooth regions such as the Occipital Pole of the macaque.”

      (4) Spatio-Temporal Growth Rates and Available Human Data

      The authors note that accurate, species-specific spatio-temporal growth data are lacking, limiting the ability to model inhomogeneous cortical expansion. While this may be true for ferret and macaque, there are high-quality datasets available for human fetal development, now extended through ultrasound imaging (e.g., https://doi.org/10.1038/s41586-023-06630-3). Incorporating or at least referencing such data could improve the fidelity of the human model and expand the applicability of the approach to clinical or pathological scenarios.

      We thank the reviewer for pointing out the very useful datasets that exist for the exploration of inhomogeneous growth driven folding patterns. We have referred to this paper to provide suggestions for further work in exploring the role of growth inhomogeneities.

      We have referred to this high-quality dataset in our main text, Discussion:

      “...the effect of inhomogeneous growth needs to be further investigated by incorporating regional growth of the gray and white matter not only in human brains [29, 31] based on public datasets [45], but also in other species.”

      A few works have tried to incorporate inhomogeneous growth in simulating human brain folding by separating the central sulcus area into several lobes (e.g., lobe parcellation method, Wang, PhD Thesis, 2021). Since our goal in this paper is to explain the large-scale features of folding in a minimal setting, we have kept our model simple and show that it is still capable of capturing the main features of folding in a range of mammalian brains.

      Reference:

      Xiaoyu Wang. Modelisation et caract´ erisation du plissement cortical. Signal and Image Processing. Ecole´ nationale superieure Mines-T´ el´ ecom Atlantique, 2021. English.´ 〈NNT : 2021IMTA0248〉.

      (5) Future Applications: The Inverse Problem and Fossil Brains

      The authors suggest that their morphometric framework could be extended to solve the inverse growth problem-reconstructing fetal geometries from adult brains. This speculative but intriguing direction has implications for evolutionary neuroscience, particularly the interpretation of fossil endocasts. Although beyond the scope of this paper, I encourage the authors to elaborate briefly on how such a framework might be practically implemented and validated.

      For the inverse problem, we could use the following strategies:

      a. Perform systematic simulations using different geometries and physical parameters to obtain the variation in morphologies as a function of parameters.

      b. Using either supervised training or unsupervised training (physics-informed neural networks, PINNs) to learn these characteristic morphologies and classify their dependence on the parameters using neural networks. These can then be trained to determine the possible range of geometrical and physical parameters that yield buckled patterns seen in the systematic simulations.

      c. Reconstruct the 3D surface from fossil endocasts. Using the well-trained neural network, it should be possible to predict the initial shape of the smooth brain cortex, growth profile, and stiffness ratio of the gray and white matter.

      As an example in this direction, supervised neural networks have been used recently to solve the forward problem to predict the buckling pattern of a growing two-layer system (Chavoshnejad et al., 2023). The inverse problem can then be solved using machine-learning methods when the training datasets are the folded shape, which are then used to predict the initial geometry and physical properties.

      Reference:

      Chavoshnejad, P., Chen, L., Yu, X., Hou, J., Filla, N., Zhu, D., Liu, T., Li, G., Razavi, M.J. and Wang, X., 2023. An integrated finite element method and machine learning algorithm for brain morphology prediction. Cerebral Cortex, 33(15), pp.9354-9366.

      Conclusion

      This is a well-executed and creative study that integrates diverse methodologies to address a longstanding question in developmental neurobiology. While a few aspects-such as regional folding peculiarities, sensitivity to initial conditions, and available human data-could be further elaborated, they do not detract from the overall quality and novelty of the work. I enthusiastically support this paper and believe that it will be of broad interest to the neuroscience, biomechanics, and developmental biology communities.

      Note: The paper mentions a companion paper [reference 11] that explores the cellular and anatomical changes in the ferret cortex. I did not have access to this manuscript, but judging from the title, this paper might further strengthen the conclusions.

      The companion paper (Choi et al., 2025) has also been submitted to Elife and can be found on bioXiv here:

      G. P. T. Choi, C. Liu, S. Yin, G. Sejourn´ e, R. S. Smith, C. A. Walsh, L. Mahadevan, Biophysical basis for´ brain folding and misfolding patterns in ferrets and humans. bioRxiv 2025.03.05.641682.

    1. eLife Assessment

      This valuable study introduces a novel experimental and modeling framework to quantify passive joint torques in Drosophila, revealing that passive forces are insufficient to support body weight, contrary to prior assumptions based on larger insects. The approach is technically impressive, combining genetic silencing, kinematic tracking, and biomechanical modeling. However, the strength of evidence is incomplete, limited by concerns about the specificity of the genetic tools, simplifications in the mechanical model, and limited functional interpretation.

    2. Reviewer #1 (Public review):

      Summary:

      In this work, Wang et al. use a combination of genetic tools, novel experimental approaches and biomechanical models to quantify the contribution of passive leg forces in Drosophila. They also deduce that passive forces are not sufficient to support the body weight of the animal. Overall, the contribution of passive forces reported in this work is much less than what one would expect based on the size of the organism and previous literature from larger insects and mammals. This is an interesting finding, but some major caveats in their approach remain unanswered.

      Strengths:

      (1) The authors combine experimental measurements and modeling to quantify the contributions of passive forces at limb joints in Drosophila.

      (2) The authors replicate a previous experimental strategy (Hooper et al 2009, J. Neuro) to suspend animals in air for measuring passive forces and, as in previous studies, find that passive forces are much stronger than gravitational forces acting on the limbs. While in these previous studies using large insects, a lot of invasive approaches for accurately quantifying passive forces are possible (e.g., physically cutting of nerves, directly measuring muscle forces in isolated preparations, etc), the small size of Drosophila makes this difficult. The authors overcome this using a novel approach where they attach additional weight to the leg (changes gravitational force) and inactivate motor neurons (remove active forces). With a few approximations and assumptions, the authors then deduce the contribution of passive forces at each joint for each leg.

      (3) The authors find interesting differences in passive forces across different legs. This could have behavioral implications.

      (4) Finally, the authors compare experimental results of how a free-standing Drosophila is lowered ("falls down") on silencing motor neurons, to a biomechanical "OpenSim" model for deducing the role of passive forces in supporting the body weight of the fly. Using this approach, they conclude that passive forces are not sufficient to support the body weight of the fly.

      Weaknesses:

      (1) Line 65 "(Figure 1A). Inactivation causes a change in the leg's rest position; however, in preliminary experiments, the body rotation did not have a large effect on the rest positions of the leg following inactivation. This result is consistent with the one already reported for stick insects and shows that passive forces within the leg are much larger than the gravitational force on a leg and dominate limb position [1]." This is the direct replication of the previous work by Hooper et al 2009 and therefore authors should ideally show the data for this condition (no weight attached).

      (2) The authors use vglut-gal4, a very broad driver for inactivating motor neurons. The driver labels all glutamatergic neurons, including brain descending neurons and nerve cord interneurons, in addition to motor neurons. Additionally, the strength of inactivation might differ in different neurons (including motor neurons) depending on the expression levels of the opsins. As a result, in this condition, the authors might not be removing all active forces. This is a major caveat that authors do not address. They explore that they are not potentially silencing all inputs to muscles by using an additional octopaminergic driver, but this doesn't address the points mentioned above. At the very least, the authors should try using other motor neuron drivers, as well as other neuronal silencers. This driver is so broad that authors couldn't even use it for physiology experiments. Additionally, the authors could silence VGlut-labeled motor neurons and record muscle activity (potentially using GCaMP as has been done in several recent papers cited by the authors, Azevedo et al, 2020) as a much more direct readout.

      (3) Figure 4 uses an extremely simplified OpenSim model that makes several assumptions that are known to be false. For example, the Thorax-Coxa joint is assumed to be a ball and socket joint, which it is not. Tibia-tarsus joint is completely ignored and likely makes a major contribution in supporting overall posture, given the importance of the leg "claw" for adhering to substrates. Moreover, there are a couple of recent open-source neuromechanical models that include all these details (NeuromechFly by Lobato-Rios et al, 2022, Nat. Methods, and the fly body model by Vaxenburg et al, 2025, Nature). Leveraging these models to rule in or rule out contributions at other joints that are ignored in the authors' OpenSim model would be very helpful to make their case.

      (4) Figure 5 shows the experimental validation of Figure 4 simulations; however, it suffers from several caveats.

      a) The authors track a single point on the head of the fly to estimate the height of the fly. This has several issues. Firstly, it is not clear how accurate the tracking would be. Secondly, it is not clear how the fly actually "falls" on VGlut silencing; do all flies fall in a similar manner in every trial? Almost certainly, there will be some "pitch" and "role" in the way the fly falls. These will affect the location of this single-tracked point that doesn't reflect the authors' expectations. Unless the authors track multiple points on the fly and show examples of tracked videos, it is hard to believe this dataset and, hence, any of the resulting interpretations.

      b) As described in the previous point, the "reason" the fly falls on silencing all glutamatergic neurons could be due to silencing all sorts of premotor/interneurons in addition to the silencing of motor neurons.

      c) (line 175) "The first finding is that there was a large variation in the initial height of the fly (Figure 5C), consistent with a recent study of flies walking on a treadmill[20]." The cited paper refers to how height varies during "walking". However, in the current study, the authors are only looking at "standing" (i.e. non-walking) flies. So it is not the correct reference. In my opinion, this could simply reflect poor estimation of the fly's height based on poor tracking or other factors like pitch and role.

      d) "The rate at which the fly fell to the ground was much smaller in the experimental flies than it was in the simulated flies (Figure 5E). The median rate of falling was 1.3 mm/s compared to 37 mm/s for the simulated flies (Figure 5F). (Line 190) The most likely reason for the longer than expected time for the fly to fall is delays associated with motor neuron inactivation and muscle inactivation." I don't believe this reasoning. There are so many caveats (which I described in the above points) in the model and the experiment, that any of those could be responsible for this massive difference between experiment and modeling. Simply not getting rid of all active forces (inadequate silencing) could be one obvious reason. Other reasons could be that the model is using underestimates of passive forces, as alluded to in point 3.

      (5) Final figure (Figure 6) focuses on understanding the time course of neuronal silencing. First of all, I'm not entirely sure how relevant this is for the story. It could be an interesting supplemental data. But it seems a bit tangential. Additionally, it also suffers from major caveats.

      a) The authors now use a new genetic driver for which they don't have any behavioral data in any previous figures. So we do not know if any of this data holds true for the previous experiments. The authors perform whole-cell recordings from random unidentified motor neurons labeled by E49-Gal4>GtACR1 to deduce a time constant for behavioral results obtained in the VGlut-Gal4>GtACR1 experiments.

      b) The DMD setup is useful for focal inactivation, however, the appropriate controls and data are not presented. Line 200 "A spot of light on the cell body produces as much of the hyperpolarization as stimulating the entire fly (mean of 11.3 mV vs 13.1 mV across 9 neurons). Conversely, excluding the cell body produces only a small effect on the MN (mean of 2.6 mV)." First of all, the control experiment for showing that DMD is indeed causing focal inactivation would be to gradually move the spot of light away from the labeled soma, i.e. to the neighboring "labelled" soma and show that there is indeed focal inactivation. Instead authors move it quite a long distance into unlabeled neuropil. Secondly, I still don't get why the authors are doing this experiment. Even if we believe the DMD is functioning perfectly, all this really tells us is that a random subset motor neurons (maybe 5 or 6 cells, legend is missing this info) labeled by E49-Gal4 is strongly hyperpolarized by its own GtACR1 channel opening, rather than being impacted because of hyperpolarizations in other E49-Gal4 labeled neurons. This has no relevance to the interpretation of any of the VGlut-Gal4 behavioral data. VGLut-Gal4 is much broader and also labels all glutamatergic neurons, most of which are inhibitory interneurons whose silencing could lead to disinhibition of downstream networks.

    3. Reviewer #2 (Public review):

      Summary:

      The authors aim to quantify passive muscle forces in the legs of Drosophila, and test the hypothesis that these forces would be sufficient to support body weight in small insects. They take advantage of the genetic tools available in Drosophila, and use a combination of genetic silencing (optogenetic inactivation of motor neurons), kinematic measurements, and simulations using OpenSim. This integrative toolkit is used to examine the role of passive torques across multiple leg joints. They find that passive forces are weaker than expected - in particular, passive forces were found to be too weak to support the body weight of the fly. This challenges previous scaling assumptions derived from studies in larger insects and has potential implications for our understanding of motor control in small animals.

      Strengths:

      The primary strength of this work lies in its integration of multiple analyses. By pulling together simulations, kinematic measurements from high-resolution videos, and genetic manipulation, they are able to overcome limitations of past studies. In particular, optogenetic manipulation allowed for measurements to be made in whole animals, and the modeling component is valuable because it both validates experimental findings and elucidates the mechanism behind some of the observed dynamic consequences (e.g., the rapid fall after motor inactivation). The conclusions made in the study are well-supported by the data and could have an impact on a number of fields, including invertebrate neurobiology and bioinspired design.

      Weaknesses:

      While (as mentioned above) the study's conclusions are well-supported by the results and modeling, limitations arise because of the assumptions made. For instance, using a linear approximation may not hold at larger joint angles, and future studies would benefit from accounting for nonlinearities. Future studies could also delve into the source of passive forces, which is important for more deeply understanding the anatomical and physical basis of the results in this study. For instance, assessments of muscle or joint properties to correlate stiffness values with physical structure might be an area of future consideration

    4. Reviewer #3 (Public review):

      Summary:

      The authors present a novel method to measure passive joint torques - torques due to internal forces other than active muscle contraction - in the fruit fly: genetically inactivating all motor neurons in intact limb acted upon by a gravitational load results in a change in limb configuration; evaluating the moment equilibrium condition about the limb joints then yields a direct estimate of the passive joint torques. Deactivating all motor neurons in an intact standing fly provided two further conclusions: First, because deactivation causes the fly to drop to the floor, the passive joint torques are deemed insufficient to maintain rotational equilibrium against the body weight; using a multi-body-dynamics simulation, the authors estimate that the passive torques would need to be about 40-80 times higher to maintain a typical posture without active muscle action. Second, a delay between the motor neuron inactivation and the onset of the "free fall" motivates the authors to invoke a simple exponential decay model, which is then used to derive a time constant for muscle deactivation, in robust agreement with direct electro-physiological recordings.

      Strengths:

      The experimental design that permits determination of passive joint torques is elegant, effective, novel, and altogether excellent; it permits measurements previously impossible. A careful error analysis is presented, and a spectrum of technically challenging methods, including multi-body dynamics and e-phys, is deployed to further interpret and contextualise the results.

      Weaknesses:

      (1) Passive torques are measured, but only some short speculative statements, largely based on previous work, are offered on their functional significance; some of these claims are not well supported by experimental evidence or theoretical arguments. Passive forces are judged as "large" compared to the weight force of the limb, but the arguably more relevant force is the force limb muscles can generate, which, even in equilibrium conditions, is already about two orders of magnitude larger. The conclusion that passive forces are dynamically irrelevant seems natural, but contrasts with the assertion that "passive forces [...] will have a strong influence on limb kinematics". As a result, the functional significance of passive joint torques in the fruit fly, if any, remains unclear, and this ambiguity represents a missed opportunity. We now know the magnitude of passive joint torques - do they matter and for what? Are they helpful, for example, to maintain robust neuronal control, or a mechanical constraint that negatively impacts performance, e.g., because they present a sink for muscle work?

      (2) The work is framed with a scaling argument, but the assumptions that underpin the associated claims are not explicit and can thus not be evaluated. This is problematic because at least some arguments appear to contradict textbook scaling theory or everyday experience. For example, active forces are assumed to scale with limb volume, when every textbook would have them scale with area instead; and the asserted scaling of passive forces involves some hidden assumptions that demand more explicit discussion to alert the reader to associated limitations. Passive forces are said to be important only in small animals, but a quick self-experiment confirms that they are sufficient to stabilize human fingers or ankles against gravity, systems orders of magnitude larger than an insect limb, in seeming contradiction with the alleged dominance of scale. Throughout the manuscript, there are such and similar inaccuracies or ambiguities in the mechanical framing and interpretation, making it hard to fairly evaluate some claims, and rendering others likely incorrect.

    5. Author response:

      Reviewer 1:

      (1) Line 65 "(Figure 1A). Inactivation causes a change in the leg's rest position; however, in preliminary experiments, the body rotation did not have a large effect on the rest positions of the leg following inactivation. This result is consistent with the one already reported for stick insects and shows that passive forces within the leg are much larger than the gravitational force on a leg and dominate limb position [1]." This is the direct replication of the previous work by Hooper et al 2009 and therefore authors should ideally show the data for this condition (no weight attached).

      We did not present this data – the effect of inactivation on the leg’s rest position in unweighted leg - because it was already reported in the case of stick insects. However, we understand the reviewer’s point that it is important to present the data showing this replication. We will do the same in the revised version.

      (2) The authors use vglut-gal4, a very broad driver for inactivating motor neurons. The driver labels all glutamatergic neurons, including brain descending neurons and nerve cord interneurons, in addition to motor neurons. Additionally, the strength of inactivation might differ in different neurons (including motor neurons) depending on the expression levels of the opsins. As a result, in this condition, the authors might not be removing all active forces. This is a major caveat that authors do not address. They explore that they are not potentially silencing all inputs to muscles by using an additional octopaminergic driver, but this doesn't address the points mentioned above. At the very least, the authors should try using other motor neuron drivers, as well as other neuronal silencers. This driver is so broad that authors couldn't even use it for physiology experiments. Additionally, the authors could silence VGlut-labeled motor neurons and record muscle activity (potentially using GCaMP as has been done in several recent papers cited by the authors, Azevedo et al, 2020) as a much more direct readout.

      This reviewer critique is related to the use of vglut-gal4 –a broad driver– to inactivate motor neurons (MNs). The reviewer argues that the use of a broad driver might result in some effects that are not due to MN inactivation. Conversely, it is possible that not all MNs are inactivated. These critiques raise important points that we will address in the revision by 1) performing experiments with other MN drivers as suggested by the reviewer, 2) performing experiments in flies that are inactivated by freezing. These measurements will provide other estimates of passive forces allowing us to better triangulate the range of values for the passive forces. Moreover, it appears that one of the reviewer’s main concern is that the passive forces are overestimated because of the residual active forces. We will discuss this possibility in detail. It is important to note that in the end what we hope to accomplish is to provide a useful estimate of the passive forces. It is unlikely that the passive force will be a precise number like a physical constant as the passive forces likely depend on recent history.

      (3) Figure 4 uses an extremely simplified OpenSim model that makes several assumptions that are known to be false. For example, the Thorax-Coxa joint is assumed to be a ball and socket joint, which it is not. Tibia-tarsus joint is completely ignored and likely makes a major contribution in supporting overall posture, given the importance of the leg "claw" for adhering to substrates. Moreover, there are a couple of recent open-source neuromechanical models that include all these details (NeuromechFly by Lobato-Rios et al, 2022, Nat. Methods, and the fly body model by Vaxenburg et al, 2025, Nature). Leveraging these models to rule in or rule out contributions at other joints that are ignored in the authors' OpenSim model would be very helpful to make their case.

      Our OpenSim model predates the newer mechanical model. In the revised manuscript, we will revisit the model in light of recent developments.

      (4) Figure 5 shows the experimental validation of Figure 4 simulations; however, it suffers from several caveats.

      a) The authors track a single point on the head of the fly to estimate the height of the fly. This has several issues. Firstly, it is not clear how accurate the tracking would be. Secondly, it is not clear how the fly actually "falls" on VGlut silencing; do all flies fall in a similar manner in every trial? Almost certainly, there will be some "pitch" and "role" in the way the fly falls. These will affect the location of this single-tracked point that doesn't reflect the authors' expectations. Unless the authors track multiple points on the fly and show examples of tracked videos, it is hard to believe this dataset and, hence, any of the resulting interpretations.

      b) As described in the previous point, the "reason" the fly falls on silencing all glutamatergic neurons could be due to silencing all sorts of premotor/interneurons in addition to the silencing of motor neurons.

      c) (line 175) "The first finding is that there was a large variation in the initial height of the fly (Figure 5C), consistent with a recent study of flies walking on a treadmill[20]." The cited paper refers to how height varies during "walking". However, in the current study, the authors are only looking at "standing" (i.e. non-walking) flies. So it is not the correct reference. In my opinion, this could simply reflect poor estimation of the fly's height based on poor tracking or other factors like pitch and role.

      d) "The rate at which the fly fell to the ground was much smaller in the experimental flies than it was in the simulated flies (Figure 5E). The median rate of falling was 1.3 mm/s compared to 37 mm/s for the simulated flies (Figure 5F). (Line 190) The most likely reason for the longer than expected time for the fly to fall is delays associated with motor neuron inactivation and muscle inactivation." I don't believe this reasoning. There are so many caveats (which I described in the above points) in the model and the experiment, that any of those could be responsible for this massive difference between experiment and modeling. Simply not getting rid of all active forces (inadequate silencing) could be one obvious reason. Other reasons could be that the model is using underestimates of passive forces, as alluded to in point 3.

      (4a) Although we agree that measuring different points on the body would allow us to estimate the moments, we disagree that the height of the fly cannot be evaluated from the measurement of a single point. The measurements have been performed using the same techniques that we used to assess the fly’s height in a different study where we estimated the resolution of our imaging system to be ~20 mm(Chun et. al. 2021). We will include these details in the revised manuscript. The video showing the falling experiments are not available or referenced in the manuscript. These will be made available.

      b) We will repeat the “falling” experiment with a more restrictive driver.

      c) We disagree with the reviewer on this point. The system has a resolution of ~20 mm and is sufficient to make conclusion about the difference in the height of the fly. We will clarify this point in the revised manuscript.

      d) We do not follow the reviewer’s rationale here. The passive forces in the model (along with any residual forces) are the same in the model as well as in the experiment. Moreover, there will be a delay between light onset, neuronal inactivation and muscle inactivation. These processes are not instantaneous. In Figure 6, we estimate these delays and have concluded that they will cause substantial delay. In the revised manuscript, we will discuss other reasons for the delay suggested by the reviewer.

      (5) Final figure (Figure 6) focuses on understanding the time course of neuronal silencing. First of all, I'm not entirely sure how relevant this is for the story. It could be an interesting supplemental data. But it seems a bit tangential. Additionally, it also suffers from major caveats.

      a) The authors now use a new genetic driver for which they don't have any behavioral data in any previous figures. So we do not know if any of this data holds true for the previous experiments. The authors perform whole-cell recordings from random unidentified motor neurons labeled by E49-Gal4>GtACR1 to deduce a time constant for behavioral results obtained in the VGlut-Gal4>GtACR1 experiments.

      b) The DMD setup is useful for focal inactivation, however, the appropriate controls and data are not presented. Line 200 "A spot of light on the cell body produces as much of the hyperpolarization as stimulating the entire fly (mean of 11.3 mV vs 13.1 mV across 9 neurons). Conversely, excluding the cell body produces only a small effect on the MN (mean of 2.6 mV)." First of all, the control experiment for showing that DMD is indeed causing focal inactivation would be to gradually move the spot of light away from the labeled soma, i.e. to the neighboring "labelled" soma and show that there is indeed focal inactivation. Instead authors move it quite a long distance into unlabeled neuropil. Secondly, I still don't get why the authors are doing this experiment. Even if we believe the DMD is functioning perfectly, all this really tells us is that a random subset motor neurons (maybe 5 or 6 cells, legend is missing this info) labeled by E49-Gal4 is strongly hyperpolarized by its own GtACR1 channel opening, rather than being impacted because of hyperpolarizations in other E49-Gal4 labeled neurons. This has no relevance to the interpretation of any of the VGlut-Gal4 behavioral data. VGLut-Gal4 is much broader and also labels all glutamatergic neurons, most of which are inhibitory interneurons whose silencing could lead to disinhibition of downstream networks.

      (5 a) However, we can address the reviewer critique by recording from the Vglut line while using a MN line to target the recordings to MNs.

      b) Once we use the Vglut driver to perform these recordings, it will help assess how much of the MN inactivation is due to the GtACR expressed in the MN versus other neurons.

      Reviewer 2:

      While (as mentioned above) the study's conclusions are well-supported by the results and modeling, limitations arise because of the assumptions made. For instance, using a linear approximation may not hold at larger joint angles, and future studies would benefit from accounting for nonlinearities. Future studies could also delve into the source of passive forces, which is important for more deeply understanding the anatomical and physical basis of the results in this study. For instance, assessments of muscle or joint properties to correlate stiffness values with physical structure might be an area of future consideration.

      We agree with these comments but believe that these studies represent avenues for future work.

      Reviewer 3:

      (1) Passive torques are measured, but only some short speculative statements, largely based on previous work, are offered on their functional significance; some of these claims are not well supported by experimental evidence or theoretical arguments. Passive forces are judged as "large" compared to the weight force of the limb, but the arguably more relevant force is the force limb muscles can generate, which, even in equilibrium conditions, is already about two orders of magnitude larger. The conclusion that passive forces are dynamically irrelevant seems natural, but contrasts with the assertion that "passive forces [...] will have a strong influence on limb kinematics". As a result, the functional significance of passive joint torques in the fruit fly, if any, remains unclear, and this ambiguity represents a missed opportunity. We now know the magnitude of passive joint torques - do they matter and for what? Are they helpful, for example, to maintain robust neuronal control, or a mechanical constraint that negatively impacts performance, e.g., because they present a sink for muscle work?

      To us, measuring passive forces was the first step to understanding neural/biomechanical control of limb. In general, we agree with these comments and would like to understand the role of passive forces in overall control of limb. A complete discussion of the role of the significance of passive forces in the control of limb is beyond the scope of this study. We would like to note that it is unlikely that the active forces are two orders of magnitude larger during unloaded movement of the limb. However, these issues will have to be settled in future work.

      (2) The work is framed with a scaling argument, but the assumptions that underpin the associated claims are not explicit and can thus not be evaluated. This is problematic because at least some arguments appear to contradict textbook scaling theory or everyday experience. For example, active forces are assumed to scale with limb volume, when every textbook would have them scale with area instead; and the asserted scaling of passive forces involves some hidden assumptions that demand more explicit discussion to alert the reader to associated limitations. Passive forces are said to be important only in small animals, but a quick self-experiment confirms that they are sufficient to stabilize human fingers or ankles against gravity, systems orders of magnitude larger than an insect limb, in seeming contradiction with the alleged dominance of scale. Throughout the manuscript, there are such and similar inaccuracies or ambiguities in the mechanical framing and interpretation, making it hard to fairly evaluate some claims, and rendering others likely incorrect.

      We interpret this comment as making two separate points. The first one is that the reviewer says that our statement that active forces depend on the third power of the limb or L<sup>3</sup> is incorrect. We agree and apologize for this oversight. Specifically, on L6-7 we say, “both inertial forces and active forces scale with the mass if the limb which in turn scales with the volume of the limb and therefore depends on the third power of limb length (L<sup>3</sup>)”. Instead, this statement should read “inertial forces scale with the mass if the limb which in turn scales with the volume of the limb and therefore depends on the third power of limb length (L<sup>3</sup>)”. However, this oversight does not affect the scaling argument as the scaling arguments in the rest of the manuscript only involves inertial forces and not active forces.

      The second point is about the scaling law that governs passive forces. In the current manuscript, we have assumed that the passive forces scale as L<sup>2</sup> based on previous work. The reviewer has pointed out that this assumption might be incorrect or at the very least needs a rationale. We agree with this assessment: passive forces that arise in the muscle are likely to scale as L<sup>2</sup> but passive forces that arise in the joint might not. In the revised manuscript, we will discuss this concern.

      Response to the public comment:

      There was a comment from a reader: “None of our work cited in various places in this preprint (i.e., Zakotnik et al. 2006, Guschlbauer et al. 2007, Page et al. 2008, Hooper et al. 2009, Hooper 2012, Ache and Matheson 2012, Blümel et al. 2012, Ache and Matheson 2013, von Twickel et al. 2019, and Guschlbauer et al. 2022) claims or implies that passive forces could be sufficient to support the weight of an insect or any animal. To claim or suggest otherwise (as done in lines 33-35) is incorrect and sets up a misleading straw man that misrepresents our work. All statements in the preprint regarding our work related to this specific matter need to be removed or edited accordingly. For instance, the investigations, calculations, and interpretations in Hooper et al. 2009 are solely about limbs that are not being used in stance or other loaded tasks (indeed, the article's title specifically refers to "unloaded" leg posture and movements). Trying to use this work to predict whether passive muscle forces alone can support a stick insect against gravity requires considering much more than the oversimplified calculation given in lines 290-292. Other “back of the envelope calculations” (lines 299-300) are likely also insufficient and erroneous. The discussion in lines 289-304 needs to be edited accordingly”

      We thank the reader for their comment. However, we interpret these studies differently. The studies above rightly focused on unloaded legs because it would be difficult to study passive forces in an intact insect without genetic tools. The commenter correctly points out that these studies do not comment on whether passive forces are strong enough to support the weight of the fly. However, we disagree that our arguments based on their results are unreasonable or strawman. We think that our interpretation of their measurements is correct. Moreover, we were motivated by Yox et. el. 1982 who states in so many words: “Stiffness of the muscles in the joints of all the legs might be sufficient to support a resting arthropod. A more rigorous analysis of all supporting limbs and joint angles would be required to prove this hypothesis”. We were inspired by this comment. In the revised manuscript, we will make it clear that the statement made in Line 33 is based on Yox. et. al. and our interpretation of measurements made by others.

    1. eLife Assessment

      This important study characterises the morphogenesis of cortical folding in the ferret and human cerebral cortex using complementary physical and computational modelling. Notably, these approaches are applied to charting, in the ferret model, known abnormalities of cortical folding in humans. The study finds that variation in cortical thickness and expansion account for deviations in morphology, and supports these findings using cutting-edge approaches from both physical gel models and numerical simulations. The strength of evidence is convincing, and although it could benefit from more quantitative assessment, the study will be of broad interest to the field of developmental neuroscience.

    2. Reviewer #1 (Public review):

      The manuscript by Choi and colleagues investigates the impact of variation in cortical geometry and growth on cortical surface morphology. Specifically, the study uses physical gel models and computational models to evaluate the impact of varying specific features/parameters of the cortical surface. The study makes use of this approach to address the topic of malformations of cortical development and finds that cortical thickness and cortical expansion rate are the drivers of differences in morphogenesis.

      The study is composed of two main sections. First, the authors validate numerical simulation and gel model approaches against real cortical postnatal development in the ferret. Next, the study turns to modelling malformations in cortical development using modified tangential growth rate and cortical thickness parameters in numerical simulations. The findings investigate three genetically linked cortical malformations observed in the human brain to demonstrate the impact of the two physical parameters on folding in the ferret brain.

      This is a tightly presented study that demonstrates a key insight into cortical morphogenesis and the impact of deviations from normal development. The dual physical and computational modeling approach offers the potential for unique insights into mechanisms driving malformations. This study establishes a strong foundation for further work directly probing the development of cortical folding in the ferret brain. One weakness of the current study is that the interpretation of the results in the context of human cortical development is at present indirect, as the modelling results are solely derived from the ferret. However, these modelling approaches demonstrate proof of concept for investigating related alterations more directly in future work through similar approaches to models of the human cerebral cortex.

    3. Reviewer #2 (Public review):

      Summary:

      Based on MRI data of the ferret (a gyrencephalic non-primate animal, in whom folding happens postnatally), the authors create in vitro physical gel models and in silico numerical simulations of typical cortical gyrification. They then use genetic manipulations of animal models to demonstrate that cortical thickness and expansion rate are primary drivers of atypical morphogenesis. These observations are then used to explain cortical malformations in humans.

      Strengths:

      The paper is very interesting and original, and combines physical gel experiments, numerical simulations, as well as observations in MCD. The figures are informative, and the results appear to have good overall face validity.

      Weaknesses:

      On the other hand, I perceived some lack of quantitative analyses in the different experiments, and currently, there seems to be rather a visual/qualitative interpretation of the different processes and their similarities/differences.

      Ideally, the authors also quantify local/pointwise surface expansion in the physical and simulation experiments, to more directly compare these processes. Time courses of eg, cortical curvature changes, could also be plotted and compared for those experiments.

      I had a similar impression about the comparisons between simulation results and human MRI data. Again, face validity appears high, but the comparison appeared mainly qualitative.

      I felt that MCDs could have been better contextualized in the introduction.

    4. Author response:

      Reviewer 1 (Public review):

      The manuscript by Choi and colleagues investigates the impact of variation in cortical geometry and growth on cortical surface morphology. Specifically, the study uses physical gel models and computational models to evaluate the impact of varying specific features/parameters of the cortical surface. The study makes use of this approach to address the topic of malformations of cortical development and finds that cortical thickness and cortical expansion rate are the drivers of differences in morphogenesis.

      The study is composed of two main sections. First, the authors validate numerical simulation and gel model approaches against real cortical postnatal development in the ferret. Next, the study turns to modelling malformations in cortical development using modified tangential growth rate and cortical thickness parameters in numerical simulations. The findings investigate three genetically linked cortical malformations observed in the human brain to demonstrate the impact of the two physical parameters on folding in the ferret brain.

      This is a tightly presented study that demonstrates a key insight into cortical morphogenesis and the impact of deviations from normal development. The dual physical and computational modeling approach offers the potential for unique insights into mechanisms driving malformations. This study establishes a strong foundation for further work directly probing the development of cortical folding in the ferret brain. One weakness of the current study is that the interpretation of the results in the context of human cortical development is at present indirect, as the modelling results are solely derived from the ferret. However, these modelling approaches demonstrate proof of concept for investigating related alterations more directly in future work through similar approaches to models of the human cerebral cortex.

      We thank the reviewer for the very positive comments. While the current gel and organismal experiments focus on the ferret only, we want to emphasize that our analysis does consider previous observations of human brains and morphologies therein (Tallinen et al., Proc. Natl. Acad. Sci. 2014; Tallinen et al., Nat. Phys. 2016), which we compare and explain. This allows us to analyze the implications of our study broadly to understand the explanations of cortical malformations in humans using the ferret to motivate our study. Further analysis of normal human brain growth using computational and physical gel models can be found in our companion paper (Yin et al., 2025), also submitted to eLife:

      S. Yin, C. Liu, G. P. T. Choi, Y. Jung, K. Heuer, R. Toro, L. Mahadevan, Morphogenesis and morphometry of brain folding patterns across species. bioRxiv 2025.03.05.641692.

      In future work, we plan to obtain malformed human cortical surface data, which would allow us to further investigate related alterations more directly.

      Reviewer 2 (Public review):

      Summary:

      Based on MRI data of the ferret (a gyrencephalic non-primate animal, in whom folding happens postnatally), the authors create in vitro physical gel models and in silico numerical simulations of typical cortical gyrification. They then use genetic manipulations of animal models to demonstrate that cortical thickness and expansion rate are primary drivers of atypical morphogenesis. These observations are then used to explain cortical malformations in humans.

      Strengths:

      The paper is very interesting and original, and combines physical gel experiments, numerical simulations, as well as observations in MCD. The figures are informative, and the results appear to have good overall face validity.

      We thank the reviewer for the very positive comments.

      Weaknesses:

      On the other hand, I perceived some lack of quantitative analyses in the different experiments, and currently, there seems to be rather a visual/qualitative interpretation of the different processes and their similarities/differences. Ideally, the authors also quantify local/pointwise surface expansion in the physical and simulation experiments, to more directly compare these processes. Time courses of eg, cortical curvature changes, could also be plotted and compared for those experiments. I had a similar impression about the comparisons between simulation results and human MRI data. Again, face validity appears high, but the comparison appeared mainly qualitative.

      We thank the reviewer for the comments. Besides the visual and qualitative comparisons between the models, we would like to point out that we have included the quantification of the shape difference between the real and simulated ferret brain models via spherical parameterization and the curvature-based shape index as detailed in main text Fig. 4 and SI Section 3. We have also utilized spherical harmonics representations for the comparison between the real and simulated ferret brains at different maximum order N. In our revision, we plan to further include the curvature-based shape index calculations for the comparison between the real and simulated ferret brains at more time points.

      As for the comparison between the malformation simulation results and human MRI data in the current work, since the human MRI data are two-dimensional while our computational models are threedimensional, we focus on the qualitative comparison between them. In future work, we plan to obtain malformed human cortical surface data, from which we can then perform the parameterization-based and curvature-based shape analysis for a more quantitative assessment.

      I felt that MCDs could have been better contextualized in the introduction.

      We thank the reviewer for the comment and will include a more detailed introduction to MCDs in our revision.

    1. eLife Assessment

      This is an important study reporting a new phenotype for a gene cluster that has previously been associated with the responses of the Gram-negative opportunistic pathogen Pseudomonas aeruginosa to flow fluid. Expression of the froABCD gene cluster is induced by HOCl in vitro and by activated immune cells, which produce these types of reactive chlorine species. Overall, the evidence presented by the authors is solid; however, the mechanism of fro-induction by HOCl remains unclear, and the evidence in support of the authors' claims is descriptive, which needs to be improved. This study is of interest to infection biologists interested in mechanisms of bacterial pathogenicity.

    2. Reviewer #1 (Public review):

      Summary:

      Foik et al. report that hypochlorous acid, a reactive chlorine species generated during host defense, activates the transcription of the froABCD in P. aeruginosa. This gene cluster had previously been associated with a potential role during the flow of fluids and appears to be regulated by the sigma factor FroR and its anti-sigma factor FroI. In the present study, the authors show that froABCD is expressed both in neutrophils and macrophages, which they claim is likely a result of HOCl but not H2O2 production. Fro expression is also induced in a murine model of corneal infection, which is characterized by immune cell invasion. Expression of the fro system can be quenched by several antioxidants, such as methionine, cysteine, and others. FroR-deficient cells that lack froABCD expression during HOCl stress appear more sensitive to the oxidant.

      Strengths:

      The authors provide a number of data supporting their claim that transcription of the froABCD system is induced by reactive chlorine species. This was shown by RNAseq, qRT-PCR, and through microscopy using a transcriptional reporter fusion. Likewise, elevated expression of froABCD was shown in vitro and in vivo, excluding potential in vitro artifacts. The manuscript, while mostly descriptive, is easy to follow, and the data were presented clearly.

      Weaknesses:

      (1) Lines 60-62: Some of the authors' conclusions are not supported by the data and thus appear unfounded. One example: "we determine that fro upregulation.....These data suggest a novel mechanism..." Their data do not show that MSR upregulation is a direct effect of FroABCD. Instead, it could be possible that the FroR sigma factor also controls the expression of msr genes, which would be independent of froABCD.

      (2) The authors show increased fro transcription both in neutrophils and macrophages; however, the two types of immune cells differ quite dramatically with respect to myeloperoxidase activation and HOCl production. Neither has this been discussed nor considered here.

      (3) With respect to the activation of fro expression upon challenge with conditioned media from stimulated neutrophils, does the conditioned media contain detectable amounts of HOCl? Do chloramines, which are byproducts of HOCl oxidation with amines, also stimulate expression?

      (4) A better control to prove that this fro expression is indeed induced by HOCl in activated neutrophils would be to conduct the experiments in the presence of a myeloperoxidase inhibitor.

      (5) The work was conducted with two different P. aeruginosa strains (i.e. AL143 and PAO1F). None of the figure legends provides details on which strain was used. For instance, in line 111, the authors refer to Figure S1B for data that I thought were done with PAO1F, while in 154, data were presented in the context of the infection model, which was conducted with the other strain.

      (6) It would be good if immune cell recruitment at 2hrs and 20hrs PI could be quantified.

      (7) The conclusions of Figure 4 are, in my opinion, weak (line 187-188; "It is possible that ....."). These antioxidants likely quench the low amounts of NaOCl directly. This would significantly reduce the NaOCl concentrations to a level that no longer activates expression of fro. There is no direct evidence provided that oxidized methionine induces fro expression. Do the authors postulate that this is free methionine, or could methionine and/or cysteine oxidation in FroR increase the binding affinity of the sigma factor to the promoter? Another possibility is that NaOCl deactivates the anti-sigma factor. None of these scenarios has been considered here.

      (8) Line 184: The reaction constants of HOCl with Cys and Met are similar.

      (9) Treatment with 16 uM NaOCl caused a growth arrest of ~15 hrs in the WT (Figure 5A), whereas no growth at all was recorded with 7.5 uM in Figure 3A.

      (10) The concentration range of NaOCl causing fro expression is extremely narrow, while oxidative burst rapidly generates HOCl at much higher concentrations. This should be discussed in more detail.

    3. Reviewer #2 (Public review):

      Summary:

      Foik et al. studied the regulation of the fro operon in response to HOCl, an oxidant derived from immune cells, especially neutrophils. They use a transcriptional fusion of YFP to the froA promoter in an mCherry-expressing P. aeruginosa strain to determine fro-induction under the microscope. They use this system to study fro expression in medium, in the presence of neutrophils and macrophages, neutrophil-conditioned medium, and several chemical stimuli, including NaCl, HOCl, hydrogen peroxide, nitric acid, hydrochloric acid, and sodium hydroxide. They also use a corneal infection model to demonstrate that froA is upregulated in P. aeruginosa 20 h post-infection and perform transcriptional analyses in WT and a froR mutant in response to HOCl.

      Strengths:

      Their data clearly shows that HOCl is a strong inducer of the fro Operon. The addition of HOCl-quenching chemicals together with HOCl abrogates the response. They also show that a froR mutant is more susceptible to HOCl than WT. Their transcriptomic data reveal genes under control of the FroR/FroI sigma factor/anti sigma factor system.

      Weaknesses:

      Although the presented evidence is mostly solid, some of their findings need to be evaluated more carefully; explaining the rationale behind some of the experiments might enhance the article, and some of the models proposed by the authors seem far-fetched, as outlined below:

      (1) In line 76 the authors claim "Relative to P. aeruginosa that were incubated in host cell-free media, P. aeruginosa in close proximity to human neutrophils or that were engulfed in mouse macrophages appeared to increase fro expression (Fig. 1C)". Counting bacterial cells in Figure 1C shows that 1 in 17 bacteria (5.8%) induce the froA-promotor in media in the absence of immune cells, while 4 in 72 bacteria (only 5.5%) do the same in the presence of neutrophils. Contrary to the authors' claims, it appears that P. aeruginosa actually decreases fro-expression in close proximity to neutrophils. There is a slight increase in fro-expression in bacteria co-incubated with macrophages (3 in 21, or 14.3%). A more rigorous statistical analysis might substantiate the authors' claim, but, as is, the claim "neutrophils increase fro expression" is untenable.

      (2) The authors should explain the rationale behind some of the chemicals used. Why did they use nitric acid? Especially at these high concentrations, a strong acid such as nitric acid might have a significant influence on the medium pH. I understand that the medium is phosphate-buffered, but 25 mM nitric acid in an unbuffered medium would shift the pH well below 2. Similar considerations apply to hydrochloric acid and sodium hydroxide.

      (3) In line 187, the authors state that "It is possible that oxidized methionine increases fro expression" and they suggest a model to that effect in Figure 5D. It is unclear why the authors singled out methionine sulfoxide, since a number of other things get oxidized by HOCl. In line 184, the authors state, in the same vein, that "HOCl oxidizes methionine residues 100-fold more rapidly than other cellular components". The authors should state which other cellular compounds they are referring to. Certainly not cysteine and other thiols, which react equally fast and are highly abundant in the cell: P. aeruginosa contains 340 µM GSH, 140 µM CoA-SH (https://doi.org/10.1074/jbc.RA119.009934) plus free cysteine and cysteines in proteins (based on codon usage, 1.34% of amino acids in proteins are cysteine, while methionine is only slightly more present at 2.10%, although a number of starting methionines are removed from mature proteins).

      (4) Overall (and this is probably not addressable with the authors' data), some very interesting questions remain unanswered: what is the molecular mechanism of fro-induction? How is the FroR/FroI system modulated by HOCl? Does the system sense free or protein-bound methionine-sulfoxide? Are certain methionine residues in these proteins directly oxidized by HOCl? Many "HOCl-sensing" proteins are also modified at cysteine residues or amino groups; could those play a role? And lastly: what is the connection between shear/fluid flow and HOCl, or are these totally separate mechanisms of fro-induction?

    4. Author response:

      We greatly appreciate the efforts of the reviewers, which have provided insightful and helpful comments to improve the manuscript. The feedback touches upon a number of topics, focusing on clarification or justification of experimental techniques and on understanding the mechanism by which P. aeruginosa detects HOCl. All reviewers raised the issue of how HOCl activates fro expression, including whether free or protein-bound methionine, cysteine, or other HOCl byproducts induce this expression. For the upcoming revision, we plan to perform experiments that address this issue and will discuss potential mechanistic models in light of the new data. In addition, we plan to perform additional experiments to address a reviewer’s concerns regarding the dependence of the fro response on HOCl production by neutrophils. The revision will correct imprecise statements pointed out by reviewers, and address all remaining issues requiring clarification or further discussion, including the range of HOCl sensitivity, relationship between HOCl and flow sensitivity, and justification for testing the fro response to nitric acid.

    1. eLife Assessment

      This study provides valuable insights into the host's variable susceptibility to Mycobacterium tuberculosis, using a novel collection of wild-derived inbred mouse lines from diverse geographic locations, along with immunological and single-cell transcriptomic analyses. While the data are convincing, a deeper mechanistic investigation into neutrophil subset functions would have further enhanced the study. This work will interest microbiologists and immunologists in the tuberculosis field.

    2. Reviewer #1 (Public review):

      Summary:

      This study investigated the heterogeneous responses to Mycobacterium tuberculosis (Mtb) in 19 wild-derived inbred mouse strains collected from various geographic locations. The goal of this study is to identify novel mechanisms that regulate host susceptibility to Mtb infection. Using the genetically resistant C57BL/6 mouse strain as the control, they successfully identified a few mouse strains that revealed higher bacterial burdens in the lung, implicating increased susceptibility in those mouse strains. Furthermore, using flow cytometry analysis, they discovered strong correlations between CFU and various immune cell types, including T cells and B cells. The higher neutrophil numbers correlated with significantly higher CFU in some of the newly identified susceptible mouse strains. Interestingly, MANB and MANC mice exhibited comparable numbers of neutrophils but showed drastically different bacterial burdens. The authors then focused on the neutrophil heterogeneity and utilized a single-cell RNA-seq approach, which led to identifying distinct neutrophil subsets in various mouse strains, including C57BL/6, MANA, MANB, and MANC. Pathway analysis on neutrophils in susceptible MANC strain revealed a highly activated and glycolytic phenotype, implicating a possible mechanism that may contribute to the susceptible phenotype. Lastly, the authors found that a small group of neutrophil-specific genes are expressed across many other cell types in the MANC strain.

      Strengths:

      This manuscript has many strengths.

      (1) Utilizing and characterizing novel mouse strains that complement the current widely used mouse models in the field of TB. Many of those mouse strains will be novel tools for studying host responses to Mtb infection.

      (2) The study revealed very unique biology of neutrophils during Mtb infection. It has been well-established that high numbers of neutrophils correlate with high bacterial burden in mice. However, this work uncovered that some mouse strains could be resistant to infection even with high numbers of neutrophils in the lung, indicating the diverse functions of neutrophils. This information is important.

      Weaknesses:

      The weaknesses of the manuscript are that the work is relatively descriptive. It is unclear whether the neutrophil subsets are indeed functionally different. While single-cell RNA seq did provide some clues at transcription levels, functional and mechanistic investigations are lacking. Similarly, it is unclear how highly activated and glycolytic neutrophils in MANC strain contribute to its susceptibility.

    3. Reviewer #2 (Public review):

      Summary:

      These studies investigate the phenotypic variability and roles of neutrophils in tuberculosis (TB) susceptibility by using a diverse collection of wild-derived inbred mouse lines. The authors aimed to identify new phenotypes during Mycobacterium tuberculosis infection by developing, infecting, and phenotyping 19 genetically diverse wild-derived inbred mouse lines originating from different geographic regions in North America and South America. The investigators achieved their main goals, which were to show that increasing genetic diversity increases the phenotypic spectrum observed in response to aerosolized M. tuberculosis, and further to provide insights into immune and/or inflammatory correlates of pulmonary TB. Briefly, investigators infected wild-derived mice with aerosolized M. tuberculosis and assessed early infection control at 21 days post-infection. The time point was specifically selected to correspond to the period after infection when acquired immunity and antigen-specific responses manifest strongly, and also early susceptibility (morbidity and mortality) due to M. tuberculosis infection has been observed in other highly susceptible wild-derived mouse strains, some Collaborative Cross inbred strains, and approximately 30% of individuals in the Diversity Outbred mouse population. Here, the investigators normalized bacterial burden across mice based on inoculum dose and determined the percent of immune cells using flow cytometry, primarily focused on macrophages, neutrophils, CD4 T cells, CD8 T cells, and B cells in the lungs. They also used single-cell RNA sequencing to identify neutrophil subpopulations and immune phenotypes, elegantly supplemented with in vitro macrophage infections and antibody depletion assays to confirm immune cell contributions to susceptibility. The main results from this study confirm that mouse strains show considerable variability to M. tuberculosis susceptibility. Authors observed that enhanced infection control correlated with higher percentages of CD4 and CD8 T cells, and B cells, but not necessarily with the percentage of interferon-gamma (IFN-γ) producing cells. High levels of neutrophils and immature neutrophils (band cells) were associated with increased susceptibility, and the mouse strain with the most neutrophils, the MANC line, exhibited a transcriptional signature indicative of a highly activated state, and containing potentially tissue-destructive, mediators that could contribute to the strain's increased susceptibility and be leveraged to understand how neutrophils drive lung tissue damage, cavitation, and granuloma necrosis in pulmonary TB.

      Strengths:

      The strengths are addressing a critically important consideration in the tuberculosis field - mouse model(s) of the human disease, and taking advantage of the novel phenotypes observed to determine potential mechanisms. Notable strengths include,

      (1) Innovative generation and use of mouse models: Developing wild-derived inbred mice from diverse geographic locations is innovative, and this approach expands the range of phenotypic responses observed during M. tuberculosis infection. Additionally, the authors have deposited strains at The Jackson Laboratory making these valuable resources available to the scientific community.

      (2) Potential for translational research: The findings have implications for human pulmonary TB, particularly the discovery of neutrophil-associated susceptibility in primary infection and/or neutrophil-mediated disease progression that could both inform the development of therapeutic targets and also be used to test the effectiveness of such therapies.

      (3) Comprehensive experimental design: The investigators use many complementary approaches including in vivo M. tuberculosis infection, in vitro macrophage studies, neutrophil depletion experiments, flow cytometry, and a number of data mining, machine learning, and imaging to produce robust and comprehensive analyses of the wild-derives d strains and neutrophil subpopulations in 3 weeks after M. tuberculosis infection.

      Weaknesses:

      The manuscript and studies have considerable strengths and very few weaknesses. One minor consideration is that phenotyping is limited to a single limited-time point; however, this time point was carefully selected and has a strong biological rationale provided by investigators. This potential weakness does not diminish the overall findings, exciting results, or conclusions.

    4. Author response:

      Reviewer #1 (Public review):

      […] Strengths:

      This manuscript has many strengths.

      (1) Utilizing and characterizing novel mouse strains that complement the current widely used mouse models in the field of TB. Many of those mouse strains will be novel tools for studying host responses to Mtb infection.

      (2) The study revealed very unique biology of neutrophils during Mtb infection. It has been well-established that high numbers of neutrophils correlate with high bacterial burden in mice. However, this work uncovered that some mouse strains could be resistant to infection even with high numbers of neutrophils in the lung, indicating the diverse functions of neutrophils. This information is important.

      We are grateful for the reviewer’s thoughtful consideration of our work and appreciate their comment that our mouse strains can benefit the models available in the TB field. We further appreciate the recognition of the importance of neutrophil diversity during Mtb infection.

      Weaknesses:

      The weaknesses of the manuscript are that the work is relatively descriptive. It is unclear whether the neutrophil subsets are indeed functionally different. While single-cell RNA seq did provide some clues at transcription levels, functional and mechanistic investigations are lacking.

      We appreciate this comment and agree that further research needs to be done on the functionality of the neutrophils to discover mechanistic differences between the mouse genotypes. Out attempts at extracting sufficient RNA from sorted neutrophils from the mouse lungs were unsuccessful. However, future attempts at comparing RNA expression between mouse genotypes as well as proteomic data are necessary to determine the mechanistic differences in neutrophil biology in these mice.

      Similarly, it is unclear how highly activated and glycolytic neutrophils in MANC strain contribute to its susceptibility.

      This is a fair comment and we agree that it is still unclear how these neutrophils contribute to MANC susceptibility. Growing the neutrophils ex vivo and infecting them with Mtb is technically challenging, due to the slow growth of Mtb and the short lifespan of the neutrophils. As mentioned in the comment above, future in vivo characterization and RNA expression studies will be necessary to address these questions.

      Reviewer #2 (Public review):

      […] Strengths:

      The strengths are addressing a critically important consideration in the tuberculosis field - mouse model(s) of the human disease, and taking advantage of the novel phenotypes observed to determine potential mechanisms. Notable strengths include,

      (1) Innovative generation and use of mouse models: Developing wild-derived inbred mice from diverse geographic locations is innovative, and this approach expands the range of phenotypic responses observed during M. tuberculosis infection. Additionally, the authors have deposited strains at The Jackson Laboratory making these valuable resources available to the scientific community.

      (2) Potential for translational research: The findings have implications for human pulmonary TB, particularly the discovery of neutrophil-associated susceptibility in primary infection and/or neutrophil-mediated disease progression that could both inform the development of therapeutic targets and also be used to test the effectiveness of such therapies.

      (3) Comprehensive experimental design: The investigators use many complementary approaches including in vivo M. tuberculosis infection, in vitro macrophage studies, neutrophil depletion experiments, flow cytometry, and a number of data mining, machine learning, and imaging to produce robust and comprehensive analyses of the wild-derives d strains and neutrophil subpopulations in 3 weeks after M. tuberculosis infection.

      We thank the reviewer for their thorough and thoughtful assessment of our study. We appreciate the recognition that this mouse model can become a resource and can benefit the study of different immune responses to Mtb infection as well as be informative for studying human TB. We further appreciate their comment that the complementary approaches we have used to characterized the mouse phenotypes strengthens this study.

      Weaknesses:

      The manuscript and studies have considerable strengths and very few weaknesses. One minor consideration is that phenotyping is limited to a single limited-time point; however, this time point was carefully selected and has a strong biological rationale provided by investigators. This potential weakness does not diminish the overall findings, exciting results, or conclusions.

      We thank the reviewer for pointing out that a single time point has been studied, and that this time point is biologically relevant. We agree that additional time points, including later time points that address systemic dissemination, should be included in future studies.

    1. eLife Assessment

      In this important study, the authors develop a microfluidic "Vessel-on-Chip" model to study Neisseria meningitidis interactions in an in vitro vascular system. Compelling evidence demonstrates that endothelial cell-lined channels can be colonized by N. meningitidis, triggering neutrophil recruitment with advantages over complex surgical xenograft models. This system offers potential for follow-on studies of N. meningitidis pathogenesis, though it lacks the cellular complexity of true vasculature including smooth muscle cells and pericytes.

      [Editors' note: this paper was reviewed by Review Commons.]

    2. Reviewer #1 (Public review):

      Summary:

      The work by Pinon et al describes the generation of a microvascular model to study Neisseria meningitidis interactions with blood vessels. The model uses a novel and relatively high throughput fabrication method that allows full control over the geometry of the vessels. The model is well characterized from the vascular standpoint and shows improvements when exposed to flow. The authors show that Neisseria binds to the 3D model in a similar geometry that in the animal xenograft model, induces an increase in permeability short after bacterial perfusion, and endothelial cytoskeleton rearrangements including a honeycomb actin structure. Finally, the authors show neutrophil recruitment to bacterial microcolonies and phagocytosis of Neisseria.

      Strengths:

      The article is overall well written, and it is a great advancement in the bioengineering and sepsis infection field. The authors achieved their aim at establishing a good model for Neisseria vascular pathogenesis and the results support the conclusions. I support the publication of the manuscript. I include below some clarifications that I consider would be good for readers.

      One of the most novel things of the manuscript is the use of a relatively quick photoablation system. Could this technique be applied in other laboratories? While the revised manuscript includes more technical details as requested, the description remains difficult to follow for readers from a biology background. I recommend revising this section to improve clarity and accessibility for a broader scientific audience.

      The authors suggest that in the animal model, early 3h infection with Neisseria do not show increase in vascular permeability, contrary to their findings in the 3D in vitro model. However, they show a non-significant increase in permeability of 70 KDa Dextran in the animal xenograft early infection. As a bioengineer this seems to point that if the experiment would have been done with a lower molecular weight tracer, significant increases in permeability could have been detected. I would suggest to do this experiment that could capture early events in vascular disruption.

      One of the great advantages of the system is the possibility of visualizing infection-related events at high resolution. The authors show the formation of actin of a honeycomb structure beneath the bacterial microcolonies. This only occurred in 65% of the microcolonies. Is this result similar to in vitro 2D endothelial cultures in static and under flow? Also, the group has shown in the past positive staining of other cytoskeletal proteins, such as ezrin in the ERM complex. Does this also occur in the 3D system?

      Significance:

      The manuscript is comprehensive, complete and represents the first bioengineered model of sepsis. One of the major strengths is the carful characterization and benchmarking against the animal xenograft model. Beyond the technical achievement, the manuscript is also highly quantitative and includes advanced image analysis that could benefit many scientists. The authors show a quick photoablation method that would be useful for the bioengineering community and improved the state-of-the-art providing a new experimental model for sepsis.

      My expertise is on infection bioengineered models.

    3. Reviewer #2 (Public review):

      Pinon and colleagues have developed a Vessel-on-Chip model showcasing geometrical and physical properties similar to the murine vessels used in the study of systemic infections. The vessel was created via highly controllable laser photoablation in a collagen matrix, subsequent seeding of human endothelial cells, and flow perfusion to induce mechanical cues. This model could be infected with Neisseria meningitidis as a model of systemic infection. In this model, microcolony formation and dynamics, and effects on the host were very similar to those described for the human skin xenograft mouse model (the current gold standard for systemic studies) and were consistent with observations made in patients. The model could also recapitulate the neutrophil response upon N. meningitidis systemic infection.

      The claims and the conclusions are supported by the data, the methods are properly presented, and the data is analyzed adequately. The most important strength of this manuscript is the technology developed to build this model, which is impressive and very innovative. The Vessel-on-Chip can be tuned to acquire complex shapes and, according to the authors, the process has been optimized to produce models very quickly. This is a great advancement compared with the technologies used to produce other equivalent models. This model proves to be equivalent to the most advanced model used to date (skin xenograft mouse model). The human skin xenograft mouse model requires complex surgical techniques and has the practical and ethical limitations associated with the use of animals. However, the Vessel-on-chip model is free of ethical concerns, can be produced quickly, and allows to precisely tune the vessel's geometry and to perform higher resolution microscopy. Both models were comparable in terms of the hallmarks defining the disease, suggesting that the presented model can be an effective replacement of the animal use in this area. In addition, the Vessel-on-Chip allows to perform microscopy with higher resolution and ease, which can in turn allow more complex and precise image-based analysis.

      A limitation of this model is that it lacks the multicellularity that characterizes other similar models, which could be useful to research disease more extensively. However, the authors discuss the possibilities of adding other cells to the model, for example, fibroblasts. It is also not clear whether the technology presented in the current paper can be adopted by other labs. The methodology is complex and requires specialized equipment and personnel, which might hinder its widespread utilization of this model by researchers in the field.

      This manuscript will be of interest for a specialized audience focusing on the development of microphysiological models. The technology presented here can be of great interest to researchers whose main area of interest is the endothelium and the blood vessels, for example, researchers on the study of systemic infections, atherosclerosis, angiogenesis, etc. This manuscript can have great applications for a broad audience and it can present an opportunity to begin collaborations, aimed at answering diverse research questions with the same model.

    4. Reviewer #3 (Public review):

      Summary:

      In this manuscript Pinon et al. describe the development of a 3D model of human vasculature within a microchip to study Neisseria meningitidis (Nm)- host interactions and validate it through its comparison to the current gold-standard model consisting of human skin engrafted onto a mouse. There is a pressing need for robust biomimetic models with which to study Nm-host interactions because Nm is a human-specific pathogen for which research has been primarily limited to simple 2D human cell culture assays. Their investigation relies primarily on data derived from microscopy and its quantitative analysis, which support the authors' goal of validating their Vessel-on-Chip (VOC) as a useful tool for studying vascular infections by Nm, and by extension, other pathogens associated with blood vessels.

      Strengths:<br /> • Introduces a novel human in vitro system that promotes control of experimental variables and permits greater quantitative analysis than previous models<br /> • The VOC model is validated by direct comparison to the state-of-the-art human skin graft on mouse model<br /> • The authors make significant efforts to quantify, model, and statistically analyze their data<br /> • The laser ablation approach permits defining custom vascular architecture<br /> • The VOC model permits the addition and/or alteration of cell types and microbes added to the model<br /> • The VOC model permits the establishment of an endothelium developed by shear stress and active infusion of reagents into the system

      Weaknesses:<br /> • The work presented here is mostly descriptive, with little new information that is learned about the biology of Nm or endothelial cells. However, the goal of this study was to establish the VOC model, and the validation presented here is necessary for follow-on studies on Nm pathogenesis and host response.<br /> • The VOC model contains one cell type, human umbilical cord vascular endothelial cells (HUVECs), while true vasculature contains a number of other cell types that associate with and affect the endothelium, such as smooth muscle cells, pericytes, and components of the immune system. These and other shortcomings of the VOC model as it currently stands warrant additional discussion.

      Impact:<br /> The VOC model presented by Pinon et al. is an exciting advancement in the set of tools available to study human pathogens interacting with the vasculature. This manuscript focuses on validating the model, and as such sets the foundation for impactful research in the future. Of particular value is the photoablation technique that permits the custom design of vascular architecture without the use of artificial scaffolding structures described in previously published works.

    1. eLife Assessment

      Yabaji et al. reports a fundamental study highlighting the mechanistic connection for susceptibility to TB infection via the sst1 locus, this was shown to involve increased IFN and Myc production causing the down-regulation of anti-oxidant defence genes and chronic lipidation. Ultimately, lipid peroxidation may underlie infectivity and macrophage dysfunction. Overall, the data presented are compelling, supported by a well designed multi-omics approach and the findings will be of broad interest to researchers investigating the molecular mechanisms of TB infection.

      [Editors' note: this paper was reviewed by Review Commons.]

    2. Reviewer #1 (Public review):

      Summary:

      In this report, Yabaji et al describe studies designed to address the mechanism behind the TB susceptibility gene sst1. This locus is known to affect expression of IFN and synergizes with Myc to potentiate infectivity. Using a variety of molecular expression and imaging techniques, the authors demonstrate that mice harboring an sst1 transgene (compared to B6 controls) are highly susceptible to TB infection via a mechanism involving loss of antioxidant defense systems, the down regulation of key antioxidant genes and ferritin controlling intracellular iron levels. The combination of increased iron plus decreased antioxidant defense systems in turn increases lipid peroxidation and downstream sequelae. Inhibition of peroxidation diminishes infectivity increases ferritin levels. Furthermore, the authors demonstrate that Myc activation potentiates this process and that down regulation of NRF2 antioxidant defenses accompany potentiated infectivity. Increased peroxidation products (4-HNE) may activate the ASK1/JNK system leading to IFNb superinduction and diminished macrophage viability thereby diminishing ability to withstand TB infection. Extending these findings, additional mouse models plus some work in humans supports the peroxidation hypothesis. Overall, the work is significant for it introduces a molecular basis for TB infectivity and presents a potential novel therapeutic opportunity.

      Strengths:

      (1) Strengths of this study include a multi-omic analysis of infectivity combining gene expression analysis with biochemical and cell biological evaluation.

      (2) Novel identification of an iron-catalyzed lipid peroxidation based mechanism for why the sst1 locus is linked to TB infection.

      (3) Parallels to human biology are included via analysis of Myc upregulation in peripheral blood from patients.

      (4) Appropriate statistical analysis

      Weaknesses:

      (1) Lipid peroxidation is a broad phenotype process and the authors honed in on 4-HNE dependent processes as a likely mechanism because they can measure 4-HNE conjugated proteins. However, lipid peroxidation is a complex phenomenon and the work presented herein is largely descriptive.

      (2) The authors continually refer to increased 4HNE while they do not measure this 9 carbon lipid, they actually measure 4-HNE conjugated proteins immunochemically.

      (3) The authors do not distinguish between increased protein-HNE adducts and increased membrane peroxidation (or both) as mechanistically linked to infectivity.

    3. Author response:

      General Statements

      We are grateful for constructive reviewers’ comments and criticisms and have thoroughly addressed all major and minor comments in the revised manuscript.

      Summary of new data.

      We have performed the following additional experiments to support our concept:

      (1) The kinetcs of ROS production in B6 and B6.Sst1S macrophages after TNF stimulation (Fig. 3I and J, Suppl. Fig. 3G);

      (2) Time course of stress kinase activation (Fig.3K) that clearly demonstrated the persistent stress kinase (phospho-ASK1 and phospho-cJUN) activation exclusively in. the B6.Sst1S macrophages;

      (3) New Fig.4 C-E panels include comparisons of the B6 and B6.Sst1S macrophage responses to TNF and effects of IFNAR1 blockade in both backgrounds.

      (4) We performed new experiments demonstrating that the synthesis of lipid peroxidation products (LPO) occurs in TNF-stimulated macrophages earlier than the IFNβ super-induction (Suppl.Fig.4A and B).

      (5) We demonstrated that the IFNAR1 blockade 12, 24 and 32 h after TNF stimulation still reduced the accumulation of LPO product (4-HNE) in TNF-stimulated B6.Sst1S BMDMs (Suppl.Fig.4 E-G).

      (6) We added comparison of cMyc expression between the wild type B6 and B6.Sst1S BMDMs during TNF stimulation for 6-24 h (Fig.5I-J).

      (7) New data comparing 4-HNE levels in Mtb-infected B6 wild type and B6.Sst1S macrophages and quantification of replicating Mtb was added (Fig.6B, Suppl.Fig.7C and D).

      (8) In vivo data described in Fig.7 was thoroughly revised and new data was included. We demonstrated increased 4-HNE loads in multibacillary lesions (Fig.7A, Suppl. Fig.9A) and the 4-HNE accumulation in CD11b+ myeloid cells (Fig.7B and Suppl.Fig.9B). We demonstrated that the Ifnb – expressing cells are activated iNOS+ macrophages (Fig.7D and Suppl.Fig.13A). Using new fluorescent multiplex IHC, we have shown that stress markers phopho-cJun and Chac1 in TB lesions are expressed by Ifnb- and iNOS-expressing macrophages (Fig.7E and Suppl.Fig.13D-F).

      (9) We performed additional experiment to demonstrate that naïve (non-BCG vaccinated) lymphocytes did not improve Mtb control by Mtb-infected macrophages in agreement with previously published data (Suppl.Fig.7H).

      Summary of updates

      Following reviewers requests we updated figures to include isotype control antibodies, effects of inhibitors on non-stimulated cells, positive and negative controls for labile iron pool, additional images of 4-HNE and live/dead cell staining.

      Isotype control for IFNAR1 blockade were included in Fig.3M, Fig.4C -E, Fig.6L-M Suppl.Fig.4F-G, 7I.

      Positive and negative controls for labile iron pool measurements were added to Fig.3E, Fig.5D, Suppl.Fig.3B

      Cell death staining images were added Suppl.Fig.3H

      Co-staining of 4-HNE with tubulin was added to Suppl.Fig.3A.

      High magnification images for Figure 7 were added in Suppl.Fig.8 to demonstrate paucibacillary and multibacillary image classification.

      Single-channel color images for individual markers were provided in Fig.7E and Suppl.Fig.13B-F.

      Inhibitor effects on non-stimulated cells were included in Fig.5 D-H, Suppl.Fig.6A and B. Titration of CSF1R inhibitors for non-toxic concentration determination are included in Suppl.Fig.6D.

      In addition, we updated the figure legends in the revised manuscript to include more details about the experiments. We also clarified our conclusions in the Discussion. Responses to every major and minor comment of the reviewers are provided below.

      Point-by-point description of the revisions

      Reviewer #1 (Evidence, reproducibility and clarity:

      Summary

      The study by Yabaji et al. examines macrophage phenotypes B6.Sst1S mice, a mouse strain with increased susceptibility to M. tuberculosis infection that develops necrotic lung lesions. Extending previous work, the authors specifically focus on delineating the molecular mechanisms driving aberrant oxidative stress in TNF-activated B6.Sst1S macrophages that has been associated with impaired control of M. tuberculosis. The authors use scRNAseq of bone marrow-derived macrophages to further characterize distinctions between B6.Sst1S and control macrophages and ascribe distinct trajectories upon TNF stimulation. Combined with results using inhibitory antibodies and small molecule inhibitors in in vitro experimentation, the authors propose that TNF-induced protracted c-Myc expression in B6.Sst1S macrophages disables the cellular defense against oxidative stress, which promotes intracellular accumulation of lipid peroxidation products, fueled at least in part by overexpression of type I IFNs by these cells. Using lung tissue sections from M. tuberculosis-infected B6.Sst1S mice, the authors suggest that the presence of a greater number of cells with lipid peroxidation products in lung lesions with high counts of stained M. tuberculosis are indicative of progressive loss of host control due to the TNF-induced dysregulation of macrophage responses to oxidative stress. In patients with active tuberculosis disease, the authors suggest that peripheral blood gene expression indicative of increased Myc activity was associated with treatment failure.

      Major comments

      The authors describe differences in protein expression, phosphorylation or binding when referring to Fig 2A-C, 2G, 3D, 5B, 5C. However, such differences are not easily apparent or very subtle and, in some cases, confounded by differences in resting cells (e.g. pASK1 Fig 3L; c-Myc Fig 5B) as well as analyses across separate gels/blots (e.g. Fig 3K, Fig 5B). Quantitative analyses across different independent experiments with adequate statistical analyses are required to strengthen the associated conclusions.

      We updated our Western blots as follows:

      (1) Densitometery of normalized bands is included above each lane (Fig.2A-C; Fig.3C-D and 3K; Fig.4A-B; Fig.5B,C,I,J). New data in Fig.3K is added to highlight differences between B6 and B6.Sst1S at individual timepoints after TNF stimulation. In Fig.5I we added new data comparing Myc levels in B6 and B6.Sst1S with and without JNK inhibitor and updated the results accordingly. New Fig.3K clearly demonstrates the persistent activation of p-cJun and pAsk1 at 24 and 36h of TNF stimulation. In Fig.5B we clearly demonstrate that Myc levels were higher in B6.Sst1S after 12 h of TNF stimulation. At 6h, however, the basal differences in Myc levels are consistently higher in B6.Sst1S and the induction by TNF is 1.6-fold similar in both backgrounds. We noted this in the text.

      (2) A representative experiment is shown in individual panels and the corresponding figure legend contains information on number of biological repeats. Each Western blot was repeated 2 – 4 times.

      The representative images of fluorescence microscopy in Fig 3H, 4H, 5H, S3C, S3I, S5A, S6A seem to suggest that under some conditions the fluorescence signal is located just around the nucleus rather than absent or diminished from the cytoplasm. It is unclear whether this reflects selective translocation of targets across the cell, morphological changes of macrophages in culture in response to the various treatments, or variations in focal point at which images were acquired. Control images (e.g. cellular actin, DIC) should be included for clarification. If cell morphology changes depending on treatments, how was this accounted for in the quantitative analyses? In addition, negative controls validating specificity of fluorescence signals would be warranted.

      Our conclusion of higher LPO production is based on several parameters: 4-HNE staining, measurements of MDA in cell lysates and oxidized lipids using BODIPY C11. Taken together they demonstrate significant and reproducible increase in LPO accumulation in TNFstimulated B6.Sst1S macrophages. This excludes imaging artefact related to unequal 4-HNE distribution noted by the reviewer. In fact, we also noted that the 4-HNE was spread within cell body of B6.Sst1S macrophages and confirmed it using co-staining with tubulin, as suggested by the reviewer (new Suppl.Fig.3A). Since low molecular weight LPO products, such as MDA and 4-HNE, traverse cell membranes, it is unlikely that they will be strictly localized to a specific membrane bound compartment. However, we agree that at lower concentrations, there might be some restricted localization, explaining a visible perinuclear ring of 4-HNE staining in B6 macrophages. This phenomenon may be explained just by thicker cytoplasm surrounding nucleus in activated macrophages spread on adherent plastic surface or by proximity to specific organelles involved in generation or clearance of LPO products and definitively warrants further investigation.

      We also included images of non-stimulated cells in Fig.3H, Suppl.Fig.3A and 3E. We used multiple fields for imaging and quantified fluorescence signals (Suppl. Fig.3D and 3F, Suppl.Fig.4G, Suppl.Fig.6A and B).

      We used negative controls without primary antibodies for the initial staining optimization, but did not include it in every experiment.

      To interpret the evaluation on the hierarchy of molecular mechanisms in B6.Sst1S macrophages, comparative analyses with B6 control cells should be included (e.g. Fig 4C-I, Fig 5, Fig 6B, E-M, S6C, S6E-F). This will provide weight to the conclusions that the dysregulated processes are specifically associated with the susceptibility of B6.Sst1S macrophages.

      Understanding the sst1-mediated effects on macrophage activation is the focus of our previously published studies Bhattacharya et al., JCI, 2021) and this manuscript. The data comparing B6 and B6.Sst1S macrophage are presented in Fig.1, Fig.2, Fig.3, Fig.4, Fig.5A-C, I and J, Fig.6A-C, 6J and corresponding supplemental figures 1, 2, 3, 4A and B, Suppl.Fig.5, Suppl.Fig.6C, Suppl.Fig.7A-D,7F.

      Once we identified the aberrantly activated pathways in the B6.Sst1S, we used specific inhibitors to correct the aberrant response in B6.Sst1S.

      All experiments using inhibitory antibodies require comparison to the effect of a matched isotype control in the same experiment (e.g. Fig 3J, 4F, G, I; 6L, 6M, S3G, S6F).

      Isotype control for IFNAR1 blockade were included in Fig.3M, Fig.4C-E, Fig.6L-M Suppl.Fig.4F-G, 7I.

      Experiments using inhibitors require inclusion of an inhibitor-only control to assess inhibitor effects on unstimulated cells (e.g. Fig 4I, 5D-I)

      Inhibitor effects on non-stimulated cells were included in Fig.5 D-H, Suppl.Fig.6A and B.

      Fig 3K and Fig 5J appear to contain the same images for p-c-Jun and b-tubulin blots.

      Fig.3K and 5J partially overlapped but had different focus – 3K has been updated to reflect the time course of stress kinase activation. Fig.5J is updated (currently Fig.5I and J) to display B6 and B6.Sst1S macrophage data including cMyc and p-cJun levels.

      Data of TNF-treated cells in Fig 3I appear to be replotted in Fig 3J.

      Currently these data is presented in Fig.3L and 3M and has been updated to include comparison of B6 and B6.Sst1S cells (Fig.3L) and effects of inhibitors in Fig.3M.

      It is stated that lungs from 2 mice with paucibacillary and 2 mice with multi-bacillary lesions were analyses. There is contradicting information on whether these tissues were collected at the same time post infection (week 14?) or whether the pauci-bacillary lesions were in lungs collected at earlier time points post infection (see Fig S8A). If the former, how do the authors conclude that multi-bacillary lesions are a progression from paucibacillary lesions and indicative of loss of M. tuberculosis control, especially if only one lesion type is observed in an individual host? If the latter, comparison between lesions will likely be dominated by temporal differences in the immune response to infection.

      In either case, it is relevant to consider density, location, and cellular composition of lesions (see also comments on GeoMx spatial profiling). Is the macrophage number/density per tissue area comparable between pauci-bacillary and multi-bacillary lesions?

      We did not collect lungs at the same time point. As described in greater detail in our preprints (Yabaji et al., https://doi.org/10.1101/2025.02.28.640830 and https://doi.org/10.1101/2023.10.17.562695) pulmonary TB lesions in our model of slow TB progression are heterogeneous between the animals at the same timepoint, as observed in human TB patients and other chronic TB animal models. Therefore, we perform analyses of individual TB lesions that are classified by a certified veterinary pathologist in a blinded manner based on their morphology (H&E) and acid fast staining of the bacteria, as depicted in Suppl.Fig.8. Currently it is impossible to monitor progression of individual lesions in mice. However, in mice TB is progressive disease and no healing and recovery from the disease have been observed in our studies or reported in literature. Therefore, we assumed that paucibacillary lesions preceded the multibacillary ones, and not vice versa, thus reflecting the disease progression. In our opinion, this conclusion most likely reflects the natural course of the disease. However, we edited the text : instead of disease progression we refer to paucibacillary and multibacillary lesions.

      Does 4HNE staining align with macrophages and if so, is it elevated compared to control mice and driven by TNF in the susceptible vs more resistant mice?

      We performed additional staining and analyses to demonstrate the 4-HNE accumulation in CD11b+ myeloid cells of macrophage morphology. Non-necrotic lesions contain negligible proportion of neutrophils (Fig.7B, Suppl.Fig.9B). B6 mice do not develop advanced multibacillary TB lesions containing 4-HNE+ cells. Also, 4-HNE staining was localized to TB lesions and was not found in uninvolved lung areas of the infected mice, as shown in Suppl.Fig.9A (left panel).

      It is well established that TNF plays a central role in the formation and maintenance of TB granulomas in humans and in all animal models. Therefore, TNF neutralization would lead to rapid TB progression, rapid Mtb growth and lesions destruction in both B6 and B6.Sst1S genetic backgrounds.

      Pathway analysis of spatial transcriptomic data (Suppl.Fig.11) identified TNF signaling via NFkB among dominant pathways upregulated in multibacillary lesions, suggesting that the 4-HNE accumulation paralleled increased TNF signaling. In addition, in vivo other cytokines, including IFN-I, could activate macrophages and stimulate production of reactive oxygen and nitrogen species and lead to the accumulation of LPO products as shown in this manuscript.

      It would be relevant to state how many independent lesions per host were sampled in both the multiplex IHC as well as the GeoMx data. Can the authors show the selected regions of interest in the tissue overview and in the analyses to appreciate within-host and across-host heterogeneity of lesions. The nature of the spatial transcriptomics platform used is such that the data are derived from tissue areas that contain more than just Iba1+ macrophages. At later stages of infection, the cellular composition of such macrophage-rich areas will be different when compared to lesions earlier in the infection process. Hence, gene expression profiles and differences between tissue regions cannot be attributed to macrophages in this tissue region but are more likely a reflection of a mix of cellular composition and per-cell gene expression.

      We used Iba1 staining to identify macrophages in TB lesions and programmed GeoMx instrument to collect spatial transcriptomics probes from Iba1+ cells within ROIs. Also, we selected regions of interest (ROI) avoiding necrotic areas (depicted in Suppl.Fig.10). We agree that Iba1+ macrophage population is heterogenous – some Iba1+ cells are activated iNOS+ macrophages, other are iNOS-negative (Fig.7C and D, and Suppl.Fig.13A). Multibacillary lesions contain larger areas occupied by activated (iNOS+) macrophages (Fig.7D,

      Suppl.Fig.13B and 13F). Although the GeoMx spatial transcriptomic platform does not provide single cell resolution, it allowed us to compare populations of Iba1+ cells in paucibacillary and multibacillary TB lesions and to identify a shift in their overall activation pattern.

      It is stated that loss of control of M. tuberculosis in multibacillary lesions was associated with "downregulation of IFNg-inducible genes". If the authors base this on the tissue expression of individual genes, this requires further investigation to support such conclusion (also see comment on GeoMx above). Furthermore, how might this conclusion be compatible with significantly elevated iNOS+ cells (Fig 7D) in multibacillary lesions?

      We demonstrated that Ciita gene expression is specifically induced by IFN-gamma and is suppressed by IFN-I (Fig.6M). The expression of Ciita in paucibacillary lesions suggest the presence of the IFN-gamma activated cells and its disappearance in the multibacillary lesion is consistent with massive activation of IFN-I pathway (Fig.7C).

      It is appreciated that the human blood signature analyses contain Myc-signatures but the association with treatment failure is not very strong based on the data in Fig 13B and C (Suppl.Fig.15B and C now). The authors indicate that they have no information on disease severity, but it should perhaps not be assumed that treatment failure is indicative of poor host control of the infection. Perhaps independent analyses in separate cohort/data set can add strength and provide -additional insights (e.g. PMID: 35841871; PMID: 32451443, PMID: 17205474, PMID: 22872737). In addition, the human data analyses could be strengthened by extension to additional signatures such as IFN, TNF, oxidative stress. Details of the human study design are not very clear and are lacking patient demographics, site of disease, time of blood collection relative to treatment onset, approving ethics committees.

      X axis of Suppl.Fig.15A represent pre-defined molecular signature gene sets (MSigDB) in Gene Set Enrichment Analysis (GSEA) database (https://www.gseamsigdb.org/gsea/msigdb). On Y axis is area under curve (AUC) score for each gene set. The Myc upregulated gene set myc_up was identified among top gene sets associated with treatment failure using unbiased ssGSEA algorithm. The upregulation of Myc pathway in the blood transcriptome associated with TB treatment failure most likely reflects greater proportion of immature cells in peripheral blood, possibly due to increased myelopoiesis.

      Pathway analysis of the differentially expressed genes revealed that treatment failures were associated with the following pathways relevant to this study: NF-kB Signaling, Flt3 Signaling in Hematopoietic Progenitor Cells (indicative of common myeloid progenitor cell proliferation), SAPK/JNK Signaling and Senescence (indicative of oxidative stress). The upregulation of these pathways in human patients with poor TB treatment outcomes correlates with our findings in TB susceptible mice. The detailed analysis of differentially regulated pathways in human TB patients is beyond the scope of this study and is presented in another manuscript entitled “ Tuberculosis risk signatures and differential gene expression predict individuals who fail treatment” by Arthur VanValkenburg et al., submitted for publication.

      Blood collection for PBMC gene expression profiling of TB patients was prior to TB treatment or within a first week of treatment commencement. Boxplot of bootstrapped ssGSEA enrichment AUC scores from several oncogene signatures ranked from lowest to highest AUC score, with myc_up and myc_dn genes highlighted in red.

      We agree with the reviewer that not every gene in the myc_up gene set correlates with the treatment outcome. But the association of the gene set is statistically significant, as presented in Suppl.Fig.15B – C.

      We updated the details of the study, including study sites and the ethics committee approval statement and references describing these cohorts.

      Other comments

      It is excellent that the authors provide individual data points. Choosing a colour other than black would increase clarity when black bars are used.

      We followed this useful suggestion and selected consistent color codes for B6 and B6.Sst1S groups to enhance clarity throughout the revised manuscript.

      Error bars are inconsistently depicted as either bi-directional or just unidirectional.

      We used bi-directional error bars in the revised manuscript.

      Fig 1E, G, H - please include a scale to clarify what the heat map is representing.

      We have included the expression key in Fig.1E,G and H and Suppl.Fig.1C and D in the revised version.

      Fig 2K, Fig S10A gene information cannot be deciphered.

      We increased the font in previous Fig.2K and moved to supplement to keep larger fonts (current Suppl.Fig.2G).

      Fig S4A,B please add error bars.

      These data are presented as Suppl.Fig.5 in the revised version. We performed one experiment to test the hypothesis. Because the data indicated no clear increase in transposon small RNAs in the sst1S macrophages, we did not pursue this hypothesis further, and therefore, the error bars were not included. However, we decided to include these negative data because it rejects a very attractive and plausible hypothesis.

      Please use gene names as per convention (e.g. Ifnb1) to distinguish gene expression from protein expression in figures and text.

      We addressed the comment in the revised manuscript.

      Fig S8B. Contrary to the description of results, there seems to be minimal overlap between the signal for YFP and the Ifnb1 probe. Is the Ifnb1 reporter mouse a legacy reporter? If so, it is worth stating this and including such considerations in the data interpretation.

      The YFP reporter expresses YFP protein under the control of the Ifnb1 promoter. The YFP protein accumulates within the cells and while Ifnb protein is rapidly secreted and does not accumulate in the producing cells in appreciable amounts. So YFP is not a lineage tracing reporter, but its accumulation marks the Ifnb1 promoter activity in cells, although the YFP protein half-life is longer than that of the Ifnb1 mRNA that is rapidly degraded (Witt et al., BioRxiv, 2024; doi:10.1101/2024.08.28.61018). Therefore, there is no precise spatiotemporal coincidence of these readouts.

      Please clarify what is meant by "normal interstitium" ? If the tissue is from uninfected mice, please state clearly.

      In this context we refer to the uninvolved lung areas of the infected lungs. In every sample we compare uninvolved lung areas and TB lesions of the same animal. Also, we performed staining of lung of non-infected mice as additional controls.

      If macrophage cultures underwent media changes every 48h, how was loss of liberated Mtb taken into account especially if differences in cell density/survival were noted? The assessment of M. tuberculosis load by qPCR is not well described. In particular, the method of normalization applied within the experiments (not within the qPCR) here remains unclear, even with reference to the authors' prior publication.

      Our lab has many years of experience working with macrophage monolayers infected with virulent Mtb and uses optimized protocols to avoid cell losses and related artifacts. Recently we published a detailed protocol for this methodology in STAR Protocols (Yabaji et al., 2022; PMID 35310069). In brief, it includes preparation of single cell suspensions of Mtb by filtration to remove clumps, use of low multiplicity of infection, preparation of healthy confluent monolayers and use of nutrient rich culture medium and medium change every 2 days. We also rigorously control for cell loss using whole well imaging and quantification of cell numbers and live/dead staining.

      Please add citation for the limma package.

      The references has been added (Ritchie et al, NAR 2015; PMID 25605792).

      The description of methodology relating to the "oncogene signatures" is unclear.

      This signature was described in Bild etal, Nature, 2006 and McQuerry JA, et al, 2019 “Pathway activity profiling of growth factor receptor network and stemness pathways differentiates metaplastic breast cancer histological subtypes”. BMC Cancer 19: 881 and is cited in Methods section Oncogene signatures

      Please clearly state time points post infection for mouse analyses.

      We collected lung samples from Mtb infected mice 12 – 20 weeks post infection. The lesions were heterogeneous and were individually classified using criteria described above.

      Reference is made to "a list of genes unique to type I [interferon] genes [....]" (p29). Can the authors indicate the source of the information used for compiling this list?

      The lists were compiled from Reactome, EMBL's European Bioinformatics Institute and GSEA databases. The links for all datasets are provided in Suppl.Table 8 “Expression of IFN pathway genes in Iba1+ cells from pauci- and multi-bacillary lesions of Mtb infected B6.Sst1S mouse lungs” in the “Pool IFN I & II gene sets” worksheet.

      The discussion at present is very long, contains repetition of results and meanders on occasion.

      Thank you for this suggestion, We critically revised the text for brevity and clarity.

      Reviewer #1 (Significance):  

      Strengths and limitations  

      Strengths: multi-pronged analysis approaches for delineating molecular mechanisms of macrophage responses that might underpin susceptibility to M. tuberculosis infection; integration of mouse tissues and human blood samples  

      Weaknesses: not all conclusions supported by data presented; some concerns related to experimental design and controls; links between findings in human cohort and the mechanistic insights gained in mouse macrophage model uncertain

      The revised manuscript addresses every major and minor comment of the reviewers, including isotype controls and naïve T cells, to provide additional support for our conclusions. Our study revealed causal links between Myc hyperactivity with the deficiency of anti-oxidant defense and type I interferon pathway hyperactivity. We have shown that Myc hyperactivity in TNF-stimulated macrophages compromises antioxidant defense leading to autocatalytic lipid peroxidation and interferon-beta superinduction that in turn amplifies lipid peroxidation, thus, forming a vicious cycle of destructive chronic inflammation. This mechanism offers a plausible mechanistic explanation of for the association of Myc hyperactivity with poorer treatment outcomes in TB patients and provide a novel target for host-directed TB therapy.

      Advance

      The study has the potential to advance molecular understanding of the TNF-driven state of oxidative stress previously observed in B6.Sst1S macrophages and possible implications for host control of M. tuberculosis in vivo.

      Audience

      Experts seeking understanding of host factors mediating M. tuberculosis control, or failure thereof, with appreciation for the utility of the featured mouse model in assessing TB diseases progression and severe manifestation. Interest is likely extended to audience more broadly interested in TNF-driven macrophage (dys)function in infectious, inflammatory, and autoimmune pathologies.

      Reviewer expertise

      In preparing this review, I am drawing on my expertise in assessing macrophage responses and host defense mechanisms in bacterial infections (incl. virulent M. tuberculosis) through in vitro and in vivo studies. This includes but is not limited to macrophage infection and stimulation assays, microscopy, intra-macrophage replication of M. tuberculosis, analyses of lung tissues using multi-plex IHC and spatial transcriptomics (e.g. GeoMx). I am familiar with the interpretation of RNAseq analyses in human and mouse cells/tissues, but can provide only limited assessment of appropriateness of algorithms and analysis frameworks.

      Reviewer #2 (Evidence, reproducibility and clarity):

      Yabaji et al. investigated the effects of BMDMs stimulated with TNF from both WT and B6.Sst1S mice, which have previously been identified to contain the sst1 locus conferring susceptibility to Mycobacterium tuberculosis. They identified that B6.Sst1S macrophages show a superinduction of IFNß, which might be caused by increased c-Myc expression, expanding on the mechanistic insights made by the same group (Bhattacharya et al. 2021). Furthermore, prolonged TNF stimulation led to oxidative stress, which WT BMDMs could compensate for by the activation of the antioxidant defense via NRF2. On the other hand, B6.Sst1S BMDMs lack the expression of SP110 and SP140, co-activators of NRF2, and were therefore subjected to maintained oxidative stress. Yabaji et al. could link those findings to in vivo studies by correlating the presence of stressed and aberrantly activated macrophages within granulomas to the failure of Mtb control, as well as the progression towards necrosis. As the knowledge regarding Mtb progression and necrosis of granulomas is not yet well understood, findings that might help provide novel therapy options for TB are crucial. Overall, the manuscript has interesting findings with regard to macrophage responses in Mycobacteria tuberculosis infection.

      However, in its current form there are several shortcomings, both with respect to the precision of the experiments and conclusions drawn.

      In particular a) important controls are often missing, e.g. T-cells form non-immune mice in Fig. 6J, in F, effectivity of BCG in B6 mice in 6N; b) single experiments are shown throughout the manuscript, in particular western blots and histology without proper quantification and statistics, this is absolutely not acceptable; c) very few repetitions are shown in in vitro experiments, where there is no evidence for limitation in resources (usually not more than 3), it is not clear what "independent experiment means" - i.e. the robustness of the findings is questionable; d) data are often normalized multiple times, e.g. in the case of qPCR, and the methods of normalization are not clear (what house-keeping gene exactly?);

      Moreover, experiments regarding IFN I signaling (e.g. short term TNF treatment of BMDMs to analyze LPO, making sure that the reporter mouse for IFNß works in vivo) and c-Myc (e.g. the increase after M-CSF addition might impact on other analysis as well and the experiments should be adjusted to control for this effect; MYC expression in the human samples) should be carefully repeated and evaluated to draw correct conclusions.

      In addition, we would like to strongly encourage the authors to more precisely outline the experimental set-ups and figure legends, so that the reader can easily understand and follow them. In other words: The legends are - in part very - incomplete. In addition, the authors should be mindful of gene names vs. protein names and italicize where appropriate.

      We appreciate a very thorough evaluation of our manuscript by this reviewer. Their insightful comments helped us improve the manuscript. As outlined below in point-by-point responses (1) we added important controls including isotype control antibodies in IFNAR blocking experiments and non-vaccinated T cells in T cell – macrophage interactions experiments; updated figure legends to indicate number of repeated experiment where a representative experiment is shown, numbers of mouse lungs and individual lesions, methods of data normalization, where it was missing. We also explained our in vitro experimental design and how we analyzed and excluded effects of media change and fresh CSF1 addition, by using a rest period before TNF stimulation and Mtb infection. The data shown in Suppl. Fig. 6C (previously Suppl. Fig. 5B) demonstrate that Myc levels induced by CSF1 return to the basal level at 12 h after media change. Our detailed in vitro protocol that contains these details has been published (Yabaji et al., STAR Protocols, 2022). We added new data demonstrating the ROS and LPO production at 6h of TNF stimulation, while the Ifnb1 mRNA super-induction occurred at 16 – 18 h, and edited the text to highlight these dynamics. The upregulation of Myc pathway in human samples does not necessarily mean the upregulation of Myc itself, it could be due to the dysregulation of downstream pathways. The upregulation of Myc pathway in the blood transcriptome associated with TB treatment failure most likely reflects greater proportion of immature cells in peripheral blood, possibly due to increased myelopoiesis. The detailed analysis of this cell populations in human patients is suggested by our findings but it is beyond the scope of this study.

      The reviewer’s comments also suggested that a summary of our findings was necessary. The main focus of our study was to untangle connections between oxidative stress and Ifnb1 superinduction. It revealed that Myc hyperactivity caused partial deficiency of antioxidant defense leading to type I interferon pathway hyperactivity that in turn amplifies lipid peroxidation, thus establishing a vicious cycle driving inflammatory tissue damage.

      Our laboratory worked on mechanisms of TB granuloma necrosis over more than two decades using genetic, molecular and immunological analyses in vitro and in vivo. It provided mechanistic basis for independent studies in other laboratories using our mouse model and further expanding our findings, thus supporting the reproducibility and robustness of our results and our lab’s expertise.

      Specific comments to the experiments and data:

      - Fig. 1E: Evaluation of differences in up- and downregulation between B6 and B6.Sst1S cells should highlight where these cells are within the heatmap, as it is only labelled with the clusters, or it should be depicted differently (in particular for cluster 1 and 2). Furthermore, a more simple labelling of the pathways would increase the readability of the data.

      For our scRNAseq data presentation, we used formats accepted by computational community. To clarify Fig.1E, we added labels above B6 and B6.Sst1S-specific clusters.

      - Fig. 2D, E: The staining legend is missing. For the quantification it is not clear what % total means. Is this based on the intensity or area? What do the dots represent in the bar chart? Is one data point pooled from several pictures? If not, the experiments need to be repeated, as three pictures might not be representative for evaluation.

      - Fig. 2E: Statistics comparing B6/ B6,SsT1S with TNF (different) is required: Absence of induction is not a proof for a difference!

      We included staining with NRF2-specific antibodies and performed area quantification per field using ImageJ to calculate the NRF2 total signal intensity per field. Each dot in the graph represents the average intensity of 3 fields in a representative experiment. The experiment was repeated 3 times. We included pairwise comparison of TNF-stimulated B6 and B6.Sst1S macrophages and updated the figure legend.

      - Fig. 3E: Positive and negative control need to be depicted in the figure (see legend).

      We have added the positive and negative controls for the determination of labile iron pool to the data in Fig. 3E and related Suppl. Fig. 3B and to Fig. 5D that also demonstrates labile iron determination.

      - Fig. 3I: A quantification by flow cytometry or total cell counts are important, as 6% cell death in cell culture is a very modest observation. Otherwise, confocal images of the quantification would be a good addition to judge the specificity of the viability staining.

      To validate the specificity of the viability staining method, we have provided fluorescent images as Suppl.Fig.3H. The main point of this experiment was to demonstrate a modest, but reproducible, increase in cell death in the sst1-mutant macrophages that suggested an IFNdependent oxidative damage. In our study, we did not focus on mechanisms of cell death, but on a state of chronic oxidative stress in the sst1 mutant live cells during TNF stimulation.

      - Fig. 3I, J: What does one dot represent?

      We performed this assay in 96 well format and each dot represent the % cell death in an individual well.

      - Fig. 3K,L: For the B6 BMDMs it seems that p-cJun is highly increased at 12h in (L), while it is not in (K). On the other hand, for the B6.Sst1S BMDMs it peaks at 24h in (K), while in (L) it seems to at 12h. According to the data in (L) it seems that p-cJun is rather earlier and stronger activated in B6 BMDMs and has a weakened but prolonged activation in the B6.Sst1S BMDMs, which would not fit with your statement in the text that B6.Sst1S BMDMs show an upregulation.

      These experiments need repetitions and quantification and statistiscs.

      Fig. 3L: ASK1 seems to be higher at 12h for the B6 BMDMs and similar for both lines at 24h, which is not fitting to the statement in the text. ("Also, the ASK1 - JNK - cJun stress kinase axis was upregulated in B6.Sst1S macrophages, as compared to B6, after 12 - 36 h of TNF stimulation")

      These experiments were repeated, and new data were added to highlight differences in ASK1 and c-Jun phosphorylation between B6 and B6.Sst1S at individual timepoints after TNF stimulation (presented in new Fig.3K). It demonstrated that after TNF stimulation the activation of stress kinases ASK1 and c-Jun initially increased in both genetic backgrounds. However, their upregulation was maintained exclusively in the sst1-susceptible macrophages from 24 to 36 h of TNF stimulation, while in the resistant macrophages their upregulation was transient. Thus, during prolonged TNF stimulation, B6.Sst1S macrophages experience stress that cannot be resolved, as evidenced by this kinetic analysis. The quantification of the band intensity was added to Western blot images above individual lanes.

      Reviewer 2 pointed to missing isotype control antibodies in Fig.3 and Fig.4:

      - Figure 3J: the isotype control for the IFNAR antibody is missing

      - Figure 4E: It seems the isotype control itself has already an effect in the reduction of IFNb.

      - Fig. 4H: It seems that the Isotype control antibody had an effect to increase 4-HNE (compared to TNF stimulated only).

      We always include isotype control antibodies in our experiments because antibodies are known to modulate macrophage activation via binding to Fc receptor. To address the reviewer’s comments, we updated all panels that present the effects of IFNAR1 blockade with isotypematched non-specific control antibodies in the revised manuscript. Specifically, we included isotype control in Fig. 3M (previously Fig.3J), Fig.4I, Suppl.4E-G, Fig.6L-M), Suppl.Fig.7I (previously Suppl.Fig.6F).

      - Fig.4A - C: "IFNAR1 blockade, however, did not increase either the NRF2 and FTL protein levels, or the Fth, Ftl and Gpx1 mRNA levels above those treated with isotype control antibodies"

      Maybe not above the isotype but it is higher than the TNF alone stimulation at least for NRF2 at 8h and for Ftl at both time points. Why does the isotype already cause stimulation/induction of the cells? !These experiments need repetitions and quantification and statistics!

      To determine specific effects of IFNAR blockade we compared effects of non-specific isotype control and IFNAR1-specific antibodies. In our experiments, the isotype control antibody modestly increased of Nrf2 and Ftl protein levels and the Fth and Ftl mRNA levels, but their effects were similar to the effect of IFNAR-specific antibody. The non-IFN -specific effects of antibodies, although are of potential biological significance, are modest in our model and their analysis is beyond the scope of this study.

      - Fig.4H Was the AB added also at 12h post stimulation? Figure legend should be adjusted.

      The IFNAR1 blocking antibodies and isotype control antibodies were added at 2 h after TNF stimulation in Fig.4H and 4I, as described in the corresponding figure legend. The data demonstrating effects of IFNAR blockade after 12, 24,and 33h of TNF stimulation are presented in Suppl.Fig.4 E-G.

      - Figure 4I: How was the data measured here, i.e. what is depicted? The isotype control is missing. It seems a two-way ANOVA was used, yet it is stated differently. The figure legend should be revised, as Dunnett's multiple comparison would only check for significances compared to the control.

      The microscopy images and bar graphs were updated to include isotype control and presented in Suppl. Fig.4E - G of the revised version. We also revised the statistical analysis to include correction for multiple comparisons.

      - Figure 4C and subsequent: How exactly was the experiment done (house-keeping gene)?

      We included the details in the figure legends of revised version. We quantified the gene expression by DDCt method using b-actin (for Fig. 4C-E) and 18S (For Fig. 4F and G) as internal controls.

      - Figure 4D,E: Information on cells used is missing. Why the change in stimulation time? Did it not work after 12h? Then the experiments in A-C should be repeated for 16h.

      The updated Fig. 4D and E present comparison of B6 and B6.Sst1S BMDMs clearly demonstrating significant difference between these macrophages in Ifnb1 mRNA expression 16 h after TNF stimulation, in agreement with our previous publication(Bhattacharya, et al., 2021). There we studied the time course of responses of B6 and B6.Sst1S macrophages to TNF at 2h intervals and demonstrated the divergence between their activation trajectories starting at 12 h of TNF stimulation Therefore, to reveal the underlying mechanisms we focus our analyses on this critical timepoint, i.e. as close to the divergence as possible. However, the difference between the strains in Ifnb1 mRNA expression achieved significance only by 16h of TNF stimulation. That is why we have used this timepoint for the Ifnb1 and Rsad2 analyses. It clearly shows that the superinduction was not driven by the positive feedback via IFNAR, as has been shown by the Ivashkiv lab for B6 wild type macrophages previously PMID 21220349.

      - Figure 4E: It would be helpful to see if these transcripts are actually translated into protein levels, e.g. perform an ELISA. Authors state that IFNAR blockages does not alter the expression but you statistic says otherwise.

      - The data for Ifnb expression (or better protein level) should be provided for B6 BMDMs as well.

      We have previously reported the differences in Ifnb protein secretion (He et al., Plos Pathogens, 2013 and Bhattacharya et al., JCI 2021). We use mRNA quantification by qRT-PCR as a more sensitive and direct measurement of the sst1-mediated phenotype. The revised Fig.4D and E include responses of B6 in addition to the B6.Sst1S to demonstrate that the IFNAR blockade does not reduce the Ifnb1 mRNA levels in TNF-stimulated B6.Sst1S mutant to the B6 wild type levels. A slight reduction can be explained by a known positive feedback loop in the IFN-I pathway (see above). In this experiment we emphasized that the effect of the sst1 locus is substantially greater, as compared to the effect of the IFNAR blockade (Fig.4D), and updated the text accordingly.

      - Fig. 4F: To what does the fold induction refer to? If it is again to unstimulated cells, then why is the induction now so much higher than in (E) where it was only 50x (now to 100x).

      - Figure 4G: Again to what is the fold induction referring to? It seems your Fer-1 treatment only contains 2 data points. This needs to be fixed.

      Yes, the fold induction was calculated by normalizing mRNA levels to untreated control incubated for the same time. Regarding the variation in Ifnb1 mRNA levels - a two-fold variation is not unusual in these experiments that may result in the Ifnb1 mRNA superinduction ranging from 50 -200-fold at this timepoint (16h). The graph in Fig.4G was modified to make all datapoints more visible.

      - "These data suggest that type I IFN signaling does not initiate LPO in our model but maintains and amplifies it during prolonged TNF stimulation that, eventually, may lead to cell death". Data for a short term TNF stimulation are not shown, however, so it might impact also on the initiation of LPO.

      - The overall conclusion drawn from Fig. 3 and 4 is not really clear with regard that IFN does not initiate LPO. Where is that shown? Data on earlier stimulation time points should be added to make this clear.

      We demonstrated ROS production (new Suppl.Fig.3G) and the rate of LPO biosynthesis (new Suppl.Fig.4E-F) at 6 h post TNF stimulation, while the Ifnb1 superinduction occurs between 12-18 h post TNF stimulation. This temporal separation supports our conclusion that IFN-β superinduction does not initiate LPO. We clarified it in the text:

      “Thus, Ifnb1 super-induction and IFN-I pathway hyperactivity in B6.Sst1S macrophages follow the initial LPO production, and maintain and amplify it during prolonged TNF stimulation”. (Previously: These data suggest that type I IFN signaling does not initiate LPO in our model). We also edited the conclusion in this section to explain the hierarchy of the sst1-regulated AOD and IFN-I pathways better:

      “Taken together, the above experiments allowed us to reject the hypothesis that IFN-I hyperactivity caused the sst1-dependent AOD dysregulation. In contrast, they established that the hyperactivity of the IFN-I pathway in TNF-stimulated B6.Sst1S macrophages was itself driven by the initial dysregulation of AOD and iron-mediated lipid peroxidation. During prolonged TNF stimulation, however, the IFN-I pathway was upregulated, possibly via ROS/LPOdependent JNK activation, and acted as a potent amplifier of lipid peroxidation”.

      We believe that these additional data and explanation strengthen our conclusions drawn from Figures 3 and 4.

      - "A select set of mouse LTR-containing endogenous retroviruses (ERV's) (Jayewickreme et al, 2021), and non-retroviral LINE L1 elements were expressed at a basal level before and after TNF stimulation, but their levels in the B6.Sst1S BMDMs were similar to or lower than those seen in B6". This sentence should be revised as the differences between B6 and B6.Sst1S BMDMs seem small and are not there after 48h anymore. Are these mild changes really caused by the mutation or could they result from different housing conditions and/or slowly diverging genetically lines. How many mice were used for the analysis? Is there already heterogeneity between mice from the same line?

      We agree with the reviewer that the data presented in Suppl.Fig.4 (Suppl.Fig.5 in the revised version) indicated no increase in single- and double-stranded transposon RNAs in the B6.Sst1S macrophages. The purpose of these experiment was to test the hypothesis that increased transposon expression might be responsible for triggering the superinduction of type I interferon response in TNF-stimulated B6.Sst1S macrophages. In collaboration with a transposon expert Dr. Nelson Lau (co-author of this manuscript) we demonstrated that transposon expression was not increased above the B6 level and, thus, rejected this attractive hypothesis. We explained the purpose of this experiment in the text and adequately described our findings as “the levels in the B6.Sst1S BMDMs were similar to or lower than those seen in B6”…and concluded that ” the above analyses allowed us to exclude the overexpression of persistent viral or transposon RNAs as a primary mechanism of the IFN-I pathway hyperactivity” in the sst1-mutant macrophages.

      - Fig. 5A: Indeed, it even seems that Myc is upregulated for the mutant BMDMs. Yet, there are only 2 data points for B6 12h.

      These experiments need repetitions and quantification and statistics.

      We observed these differences in c-Myc mRNA levels by independent methods: RNAseq and qRT-PCR. The qRT-PCR experiments were repeated 3 times. A representative experiment in Fig.5A shows 3 data points for each condition. We reformatted the panel to make all data points clearly visible.

      - Fig. 5B: Why would the protein level decrease in the controls over 6h of additional cultivation? Is this caused by fresh M-CSF? In this case maybe cells should be left to settle for one day before stimulating them to properly compare c-Myc induction. Comment on two c-Myc bands is needed. At 12h only the upper one seems increased for TNF stimulated mutant BMDMs compared to B6 BMDMs.

      We agree with the reviewer’s point that cells need to be rested after media change that contains fresh CSF-1. Indeed, in Suppl.Fig.6C, we show that after media change containing 10% L929 supernatant (a source of CSF1) there is an increase in c-Myc protein levels that takes approximately 12 hours to return to baseline.

      Our protocol includes resting period of 18-24 h after medium change before TNF stimulation.

      We updated Methods to highlight this detail. Thus, the increase in c-Myc levels we observe at 12 h of TNF stimulation (Fig.5B) is induced by TNF, not the addition of growth factors, as further discussed in the text.

      The two c-Myc bands observed in Fig.5B,I and J, are similar to patterns reported in previous studies that used the same commercial antibodies (PMIDs: 24395249, 24137534, 25351955). Whether they correspond to different c-Myc isoforms or post-translational modifications is unknown.

      - Fig. 5A,B: It seems that not all the RNA is translated into protein, as c-Myc at 12h in the mutant BMDMs seems to be lower than at 6h, while the gene expression implicates it vice versa.

      In addition to Fig.5B, the time course of Myc protein expression up to 24 h is presented in new panels Fig. 5I-5J. It demonstrates the gradual decrease of Myc protein levels. The observed dissociation between the mRNA and protein levels in the sst1-mutant BMDMs at 12 and 24 h is most likely due to translation inhibition as a result of the development of the integrated stress response, ISR (as shown in our previous publication by Bhattacharya et al., JCI, 2021). Translation of Myc is known to be particularly sensitive to the ISR (PMID18551192, PMID25079319, PMID28490664). Perhaps, the IFN-driven ISR may serve as a backup mechanism for Myc downregulation. We are planning to investigate these regulatory mechanisms in greater detail in the future.

      - Fig. 5J: Indeed, the inhibitor seems to cause the downregulation of the proteins. Explanation?

      This experiment was repeated twice and the average normalized densitometry values are presented in the updated Fig.5J. The main question addressed in this experiment was whether hyperactivity of JNK in TNF-stimulated sst1 mutant macrophages contributed to Myc upregulation, as had been previously shown in cancer. Comparing effects of JNK inhibition on phospho-cJun and c-Myc protein levels in TNF stimulated B6.Sst1S macrophages (updated Fig.5J), we rejected the hypotghesis that JNK activity might have a major role in c-Myc upregulation in sst1 mutant macrophages.

      - "TNF stimulation tended to reduce the LPO accumulation in the B6 macrophages and to increase it in the B6.Sst1S ones" However, this is not apparent in Sup. Fig. 6B. Here it seems that there might be a significant increase.

      Suppl.Fig.6B (currently Suppl.Fig.7B) shows the 4-HNE accumulation at day 3 post infection. The data obtained after 5 days of Mtb infection are shown in Fig.6A. We clarified this in the text: “By day 5 post infection, TNF stimulation induced significant LPO accumulation only in the B6.Sst1S macrophages (Fig.6A)”.

      - Fig. 6B: Mtb and 4-HNE should be shown in two different channels in order to really assign each staining correctly.

      What time point is this? Are the mycobacteria cleared at MOI1, since it looks that there are fewer than that? How does this look like for the B6 BMDMs? Are there even less mycobacteria?

      We included B6 infection data to the updated Fig.6B and added Suppl.Fig.7C and 7D that address this reviewer’s comment. The data represent day 5 of Mtb infection as indicated in the updated Fig.6B and Suppl.Fig.7C and 7D legends. New Suppl.Fig.7D shows quantification of replicating Mtb using Mtb replication reporter stain expressing single strand DNA binding protein GFP fusion, as described in Methods. We observed fewer Mtb and a lower percentage of replicating Mtb in B6 macrophages, but we did not observe a complete Mtb elimination in either background.

      We used red fluorescence for both Mtb::mCherry and 4-HNE staining to clearly visualize the SSB-GFP puncta in replicating Mtb DNA. In the revised manuscript, we have included the relevant channels in Suppl. Fig.7C and D to demonstrate clearly distinct patterns of Mtb::mCherry and 4-HNE signals. We did not aim to quantify the 4-HNE signal intensity in this experiment. For the 4-HNE quantification we use Mtb that expressed no reporter proteins (Fig.6A-B and Suppl.Fig.7A-B).

      - Fig 6E: In the context of survival a viability staining needs to be included, as well as the data from day 0. Then it needs to be analyzed whether cell numbers remain the same from D0 or if there is a change.

      We updated Fig.6 legend to indicate that the cell number percentages were calculated based on the number of cells at Day 0 (immediately after Mtb infection). We routinely use fixable cell death staining to enumerate cell death to exclude artifacts due to cell loss. Brief protocol containing this information is included in Methods section. The detailed protocol including normalization using BCG spike has been published – Yabaji et al, STAR Protocols, 2022. Here we did not present dead cell percentage as it remained low and we did not observe damage to macrophage monolayers. The fold change of Mtb was calculated after normalization using Mtb load at Day 0 after infection and washes.

      "The 3D imaging demonstrated that YFP-positive cells were restricted to the lesions, but did not strictly co-localize with intracellular Mtb, i.e. the Ifnb promoter activity was triggered by inflammatory stimuli, but not by the direct recognition of intracellular bacteria. We validated the IFNb reporter findings using in situ hybridization with the Ifnb probe, as well as anti-GFP antibody staining (Suppl.Fig.8B - E)." The colocalization is not present within the tissue sections. It seems that the reporter line does not show the same staining pattern in vivo as the IFNß probe or the anti GFP antibody staining. The reporter line has to be tested for the specificity of the staining. Furthermore, to state that it was restricted to the lesions, an uninvolved tissue area needs to be depicted.

      The Ifnb secreting cells are notoriously difficult to detect in vivo using direct staining of the protein. Therefore, lineage tracing of reporter expression are used as surrogates. The Ifnb reporter used in our study has been developed by the Locksley laboratory (Scheu et al., PNAS, 2008, PMID: 19088190) and has been validated in many independent studies. The reporter mice express the YFP protein under the control of the Ifnb1 promoter. The YFP protein accumulates within the cells, while Ifnb protein is rapidly secreted and does not accumulate in the producing cells in appreciable amounts. Also, the kinetics of YFP protein degradation is much slower as compared to the endogenous Ifnb1 mRNA that was detected using in situ hybridization. Thus, there is no precise spatiotemporal coincidence of these readouts in Ifnb expressing cells in vivo. However, this methodology more closely reflect the Ifnb expressing cells in vivo, as compared to a Cre-lox mediated lineage tracing approach. In the revised manuscript we demonstrate that both YFP and mRNA signals partially overlap (Suppl.Fig.12B). In Suppl.Fig.12B. we also included a new panel showing no YFP expression in the uninvolved area of the reporter mice infected with Mtb. The YFP expression by activated macrophages is demonstrated by co-staining with Iba1- and iNOS-specific antibodies (new Fig.7D and Suppl.Fig.13A). Our specificity control also included TB lesions in mice that do not carry the YFP reporter and did not express the YFP signal, as reported elsewhere (Yabaji et al., BioRxiv, https://doi.org/10.1101/2023.10.17.562695).

      - Are paucibacillary and multibacillary lesions different within the same animal or does one animal have one lesion phenotype? If that is the case, what is causing the differences between mice? Bacterial counts for the mice are required.

      The heterogeneity of pulmonary TB lesions has been widely acknowledged in clinic and highlighted in recent experimental studies. In our model of chronic pulmonary TB (described in detail in Yabaji et al., https://doi.org/10.1101/2025.02.28.640830 and https://doi.org/10.1101/2023.10.17.562695) the development of pulmonary TB lesions is not synchronized, i.e. the lesions are heterogeneous between the animals and within individual animals at the same timepoint. Therefore, we performed a lesion stratification where individual lesions were classified by a certified veterinary pathologist in a blinded manner based on their morphology (H&E) and acid fast staining of the bacteria, as depicted in Suppl.Fig.8.

      - "Among the IFN-inducible genes upregulated in paucibacillary lesions were Ifi44l, a recently described negative regulator of IFN-I that enhances control of Mtb in human macrophages (DeDiego et al, 2019; Jiang et al, 2021) and Ciita, a regulator of MHC class II inducible by IFNy, but not IFN-I (Suppl.Table 8 and Suppl.Fig.10 D-E)." Why is Sup. Fig. 10 D, E referred to? The figure legend is also not clear, e.g. what means "upregulated in a subset of IFN-inducible genes"? Input for the hallmarks needs to be defined.

      These data is now presented in Suppl.Fig.11 and following the reviewer’s comment, we moved reference to panels 11D – E up to previous paragraph in the main text, where it naturally belongs . We also edited the figure legend to refer to the list of IFN-inducible genes compiled from the literature that is discussed in the text. We appreciate the reviewer’s suggestion that helped us improve the text clarity. The inputs for the Hallmark pathway analysis are presented in Suppl.Tables 7 and 8, as described in the text.

      - Fig. 7C: Single channel pictures are required as it is hard to see the differences in staining with so many markers. Why is there no iNOS expression in the bottom row? What does the rectangle indicate on the bottom right? As black is chosen for DAPI, it is not visible at all. In case the signal is needed a visible a color should be chosen.

      We thoroughly revised this figure to address the reviewer’s concern about the lack of clarity. We provide individual channels for each marker in Fig.7D – E and Suppl.Fig.13F. We have to use DAPI in these presentation in gray scale to better visualize other markers.

      - "In the advanced lesions these markers were primarily expressed by activated macrophages (Iba1+) expressing iNOS and/or Ifny (YFP+)(Fig.7D)" Iba1 is needed in the quantification. Based on the images, iNOS seems to be highly produced in Iba1 negative cells. Which cells do produce it then? Flow cytometry data for this quantification are required. This would allow you to specifically check which cells express the markers and allow for a more precise analysis of double positive cells.

      Currently these data demonstrating the co-localization of stress markers phospho-c-Jun and Chac1 with YFP are presented in Fig.7E (images) and Suppl.Fig.13D (quantification). The co-localization of stress markers phospho-cJun and Chac1 with iNOS is presented in Suppl.Fig.13F (images) and Suppl.Fig.13E (quantification). We agree that some iNOS+ cells are Iba1-negative (Fig.7D). We manually quantified percentages of Iba1+iNOS+ double positive cells and demonstrated that they represent the majority of the iNOS+ population(Suppl.Fig.13A). Regarding the required FACS analysis, we focus on spatial approaches because of the heterogeneity of the lesions that would be lost if lungs are dissociated for FACS. We are working on spatial transcriptomics at a single cell resolution that preserves spatial organization of TB lesions to address the reviewer’s comment and will present our results in the future.

      - Results part 6: In general, can you please state for each experiment at what time point mice were analyzed? You should include an additional macrophage staining (e.g. MerTK, F4/80), as alveolar macrophages are not staining well for Iba1 and you might therefore miss them in your IF microscopy. It would be very nice if you could perform flow cytometry to really check on the macrophages during infection and distinguish subsets (e.g. alveolar macrophages, interstitial macrophages, monocytes).

      We have included the details of time post infection in figure legends for Fig.7, Suppl.Figures 8, 9, 12B, 13, 14A of the revised manuscript. We have performed staining with CD11b, CD206 and CD163 to differentiate the recruited and lung resident macrophages and determined that in chronic pulmonary TB lesions in our model the vast majority of macrophages are recruited CD11b+, but not resident (CD206+ and CD163+) macrophages. These data is presented in another manuscript (Yabaji et al., BioRxiv https://doi.org/10.1101/2023.10.17.562695).

      - Spatial sequencing: The manuscript would highly profit from more data on that. It would be very interesting to check for the DEGs and show differential spatial distribution. Expression of marker genes should be inferred to further define macrophage subsets (e.g. alveolar macrophages, interstitial macrophages, recruited macrophages) and see if these subsets behave differently within the same lesion but also between the lesions. Additional bioinformatic approaches might allow you to investigate cell-cell interactions. There is a lot of potential with such a dataset, especially from TB lesions, that would elevate your findings and prove interesting to the TB field.

      - "Thus, progression from the Mtb-controlling paucibacillary to non-controlling multibacillary TB lesions in the lungs of TB susceptible mice was mechanistically linked with a pathological state of macrophage activation characterized by escalating stress (as evidenced by the upregulation phospho-cJUN, PKR and Chac1), the upregulation of IFNβ and the IFN-I pathway hyperactivity, with a concurrent reduction of IFNγ responses." To really show the upregulation within macrophages and their activation, a more detailed IF microscopy with the inclusion of additional macrophage markers needs to be provided. Flow cytometry would enable analysis for the differences between alveolar and interstitial macrophages, as well as for monocytes. As however, it seems that the majority of iNOS, as well as the stress associated markers are not produced by Iba1+ cells. Analyzing granulocytes and T lymphocytes should be considered.

      We appreciate the reviewer’s suggestion. Indeed, our model provides an excellent opportunity to investigate macrophage heterogeneity and cell interactions within chronic TB lesions. We are working on spatial transcriptomics at a single cell resolution that would address the reviewer’s comment and will present our results in the future.

      In agreement with classical literature the overwhelming majority of myeloid cells in chronic pulmonary TB lesions is represented by macrophages. Neutrophils are detected at the necrotic stage, but our study is focused on pre-necrotic stages to reveal the earlier mechanisms predisposing to the necrotization. We never observed neutrophils or T cells expressing iNOS in our studies.

      - It's mentioned in the method section that controls in the IF staining were only fixed for 10min, while the infected cells were fixed for 30min. Consistency is important as the PFA fixation might impact on the fluorescence signal. Therefore, controls should be repeated with the same fixation time.

      We have carefully considered the impact of fixation time on fluorescence and have separately analyzed the non-infected and infected samples to address this concern. For the non-infected samples, we examined the effect of TNF in both B6 and B6.Sst1S backgrounds, ensuring that a consistent fixation protocol (10 min) was applied across all experiments without Mtb infection.

      For the Mtb infection experiments, we employed an optimized fixation protocol (30 min) to ensure that Mtb was killed before handling the plates, which is critical for preserving the integrity of the samples. In this context, we compared B6 and B6.Sst1S samples to evaluate the effects of fixation and Mtb infection on lipid peroxidation (LPO) induction.

      We believe this approach balances the need for experimental consistency with the specific requirements for handling infected cells, and we have revised the manuscript to reflect this clarification.

      - Reactive oxygen species levels should be determined in B6 and B6.Sst1S BMDMs (stimulated and unstimulated), as they are very important for oxidative stress.

      We have conducted experiments to measure ROS production in both B6 and B6.Sst1S BMDMs and demonstrated higher levels of ROS in the susceptible BMDMs after prolonged TNF stimulation (new Fig.3I-J and Suppl. Fig. 3G). Additionally, we have previously published a comparison of ROS production between B6 and B6.Sst1S by FACS (PMID: 33301427), which also supports the findings presented here.

      - Sup. Fig 2C: The inclusion of an unstimulated control would be advisable in order to evaluate if there are already difference in the beginning.

      We have included the untreated control to the Suppl. Fig. 2C (currently Suppl. Fig. 2D) in the revised manuscript.

      - Sup. Fig. 3F: Why is the fold change now lower than in Fig. 4D (fold change of around 28 compared to 120 in 4D)?

      The data in Fig.4D (Fig.4E in the revised manuscript) and Suppl.Fig.3F (currently Suppl.Fig.4C) represent separate experiments and this variation between experiments is commonly observed in qRT-PCR that is affected by slight variations in the expression in unsimulated controls used for the normalization and the kinetics of the response. This 2-4 fold difference between same treatments in separate experiments, as compared to 30 – 100 fold and higher induction by TNF does not affect the data interpretation.

      - Sup. Fig. 5C, D: The data seems very interesting as you even observe an increase in gene expression. Data for the B6 mice should be evaluated for increase to a similar level as the TNF treated mutants. Data on the viability of the cells are necessary, as they no longer receive MCSF and might be dying at this point already.

      To ensure that the observed effects were not confounded by cytotoxicity, we determined non-toxic concentrations of the CSF1R inhibitors during 48h of incubation and used them in our experiments that lasted for 24h. To address this valid comment, we have included cell viability data in the revised manuscript to confirm that the treatments did not result in cell death (Suppl. Fig. 6D). This experiment rejected our hypothesis that CSF1 driven Myc expression could be involved in the Ifnb superinduction. Other effects of CSF1R inhibitors on type I IFN pathway are intriguing but are beyond the scope of this study.

      - Sup. Fig 12: the phospho-c-Jun picture for (P) is not the same as in the merged one with Iba1. Double positive cells are mentioned to be analyzed, but from the staining it appears that P-c-Jun is expressed by other cells. You do not indicate how many replicates were counted and if the P and M lesions were evaluated within the same animal. What does the error bar indicate? It seems unlikely from the plots that the double positive cells are significant. Please provide the p values and statistical analysis.

      We thank the reviewer for bringing this inadvertent field replacement in the single phospho-cJun channel to our attention. However, the quantification of Iba1+phospho-cJun+ double positive cells in Suppl.Fig.12 and our conclusions were not affected. In the revised manuscript, images and quantification of phospho-cJun and Iba1 co-expression are shown in new Suppl.Fig.13B and C, respectively. We have also updated the figure legends to denote the number of lesions analyzed and statistical tests. Specifically, lesions from 6–8 mice per group (paucibacillary and multibacillary) were evaluated. Each dot in panels Suppl.Fig.13 represent individual lesions.

      - Sup. Fig. 13D (suppl.Fig.15D now): What about the expression of MYC itself? Other parts of the signaling pathway should be analyzed(e.g. IFNb, JNK)?

      The difference in MYC mRNA expression tended to be higher in TB patients with poor outcomes, but it was not statistically significant after correction for multiple testing. The upregulation of Myc pathway in the blood transcriptome associated with TB treatment failure most likely reflects greater proportion of immature cells in peripheral blood, possibly due to increased myelopoiesis. Pathway analysis of the differentially expressed genes revealed that treatment failures were associated with the following pathways relevant to this study: NF-kB Signaling, Flt3 Signaling in Hematopoietic Progenitor Cells (indicative of common myeloid progenitor cell proliferation), SAPK/JNK Signaling and Senescence (possibly indicative of oxidative stress). The upregulation of these pathways in human patients with poor TB treatment outcomes correlates with our findings in TB susceptible mice.

      - In the mfIHC you he usage of anti-mouse antibodies is mentioned. Pictures of sections incubated with the secondary antibody alone are required to exclude the possibility that the staining is not specific. Especially, as this data is essential to the manuscript and mouse-antimouse antibodies are notorious for background noise.

      We are well aware of the technical difficulties associated with using mouse on mouse staining. In those cases, we use rabbit anti-mouse isotype specific antibodies specifically developed to avoid non-specific background (Abcam cat#ab133469). Each antibody panel for fluorescent multiplexed IHC is carefully optimized prior to studies. We did not use any primary mouse antibodies in the final version of the manuscript and, hence, removed this mention from the Methods.

      - In order to tie the story together, it would be interesting to treat infected mice with an INFAR antibody, as well as perform this experiment with a Myc antibody. According to your data, you might expect the survival of the mice to be increased or bacterial loads to be affected.

      In collaboration with the Vance laboratory, we tested effects of type I IFN pathway inhibition in B6.Sst1S mice on TB susceptibility: either type I receptor knockout or blocking antibodies increased their resistance to virulent Mtb (published in Ji et al., 2019; PMID 31611644). Unfortunately, blocking Myc using neutralizing antibodies in vivo is not currently achievable. Specifically blocking Myc using small molecule inhibitors in vivo is notoriously difficult, as recognized in oncology literature. We consider using small molecule inhibitors of either Myc translation or specific pathways downstream of Myc in the future.

      - It is surprising that you not even once cite or mention your previous study on bioRxiv considering the similarity of the results and topic (https://doi.org/10.1101/2020.12.14.422743). Is not even your Figure 1I and Figure 2 J, K the same as in that study depicted in Figure 4?

      The reviewer refers to the first version of this manuscript uploaded to BioRxiv, but it has never been published. We continued this work and greatly expanded our original observations, as presented in the current manuscript. Therefore, we do not consider the previous version as an independent manuscript and, therefore, do not cite it.

      - Please revise spelling of the manuscript and pay attention to write gene names in italics

      Thank you, we corrected the gene and protein names according to current nomenclature.

      Minor points:

      - Fig. 1: Please provide some DEGs that explain why you used this resolution for the clustering of the scRNAseq data and that these clusters are truly distinct from each other.

      Differential gene expression in clusters is presented in Suppl.Fig.1C (interferon response) and Suppl.Fig.1D (stress markers and interferon response previously established in our studies).

      - Fig. 1F: What do the two lines represent (magenta, green)?

      The lines indicate pseudotime trajectories of B6 (magenta) and B6.Sst1S (green) BMDMs.

      - Fig. 1F, G: Why was cluster 6 excluded?

      This cluster was not different between B6 and B6.Sst1S, so it was not useful for drawing the strain-specific trajectories.

      - Fig. 1E, G, H: The intensity scales are missing. They are vital to understand the data.

      We have included the scale in revised manuscript (Fig.1E,G,H and Suppl.Fig.1C-D).

      - Fig. 2G-I: please revise order, as you first refer to Fig. 2H and I

      We revised the panels’ order accordingly

      - Fig. 5: You say the data represents three samples but at least in D and E you have more. Please revise. Why do you only include at (G) the inhibitor only control?

      We added the inhibitor only controls to Fig. 5D - H. We also indicated the number of replicates in the updated Fig.5 legend.

      - Figure 7A, Sup. Fig. 8: Are these maximum intensity projection? Or is one z-level from the 3D stack depicted?

      The Fig. 7A shows 3D images with all the stacks combined.

      - Fig. 7B: What do the white boxes indicate?

      We have removed this panel in the revised version and replaced it with better images.

      - Sup. Fig. 1A: The legend for the staining is missing

      The Suppl. Fig.1A shows the relative proportions of either naïve (R and S) or TNFstimulated (RT and ST) B6 or B6.Sst1S macrophages within individual single cell clusters depicted in Fig.1B. The color code is shown next to the graph on the right.

      - Sup. Fig. 1B: The feature plots are not clear: The legend for the expression levels is missing. What does the heading means?

      We updated the headings, as in Fig.1C. The dots represent individual cells expressing Sp110 mRNA (upper panels) and Sp140 mRNA (lower panels).

      - Sup. Fig. 3C: The scale bar is barely visible.

      We resized the scale bar to make it visible and presented in Suppl. Fig.3E (previously Suppl. Fig.3C).

      - Sup. Fig. 3D: There is not figure legend or the legend to C-E is wrong.

      - Sup. Fig. 3F, G: You do not state to what the data is relative to.

      We identified an error in the Suppl.Fig.3 legend referring to specific panels. The Suppl.Fig.3 legend has been updated accordingly. New panels were added and Suppl.Fig.3-G panels are now Suppl.Fig.4C-D.

      - Sup. Fig. 3H: It seems you used a two-way ANOVA, yet state it differently. Please revise the figure legend, as Dunnett's multiple comparison would only check for significances compared to the control.

      Following the reviewer’s comment, we repeated statistical analysis to include correction for multiple comparisons and revised the figure and legend accordingly.

      - Sup. Fig. 4A, B: It is not clear what the lines depict as the legend is not explained. Names that are not required should be changed to make it clear what is depicted (e.g. "TE@" what does this refer to?)

      This previous Sup. Fig 4 is now Sup. Fig. 5. The “TE@” is a leftover label from the bioinformatics pipeline, referring to “Transposable Element”. We apologize for this confusion and have removed these extraneous labels. We have also added transposon names of the LTR (MMLV30 and RTLV4) and L1Md to Suppl.Fig.5A and 5B legend, respectively.

      - Sup. 4B: What does the y-scale on the right refer to?

      We apologize for the missing label for the y-scale on the right which represents the mRNA expression level for the SetDB1 gene, which has a much lower steady state level than the LINE L1Md, so we plotted two Y-scales to allow both the gene and transposon to be visualized on this graph.

      - Sup. 4C: Interpretation of the data is highly hindered by the fact that the scales differ between the B6 and B6.Sst1. The scales are barely visible.

      We apologize for the missing labels for the y-scales of these coverage plots, which were originally meant to just show a qualitative picture of the small RNA sequencing that was already quantitated by the total amounts in Sup. 4B. We have added thee auto-scaled Y-scales to Sup. 4C and improved the presentation of this figure.

      - Sup. Fig. 5A, B: Is the legend correct? Did you add the antibody for 2 days or is the quantification from day 3?

      We recognize that the reviewer refers to Suppl.Fig.6A-B (Suppl.Fig.7A-B in the revised manuscript). We did not add antibodies to live cells. The figure legend describes staining with 4HNE-specific antibodies 3 days post Mtb infection.

      - Sup. Fig. 8A: Are the "early" and "intermediate" lesions from the same time points? What are the definitions for these stages?

      We discussed our lesion classification according to histopathology and bacterial loads above. Of note, in the revised manuscript we simplified our classification to denote paucibacillary and multibacillary lesions only. We agree with reviewers that designation lesions as early, intermediate and advanced lesions were based on our assumptions regarding the time course of their progression from low to high bacterial loads.

      - Sup. Fig. 8E: You should state that the bottom picture is an enlargement of an area in the top one. Scale bars are missing.

      We replaced this panel with clearer images in Suppl.Fig.12B.

      - Sup. Fig. 11A: The IF staining is only visible for Iba and iNOS. Please provide single channels in order to make the other staining visible.

      Suppl.Fig.11A (now Suppl.Fig.13B) shows the low-magnification images of TB lesions. In the Fig. 7 and Suppl. Fig. 13F of the revised manuscript we provided images for individual markers.

      - Sup. Fig. 13A (Suppl.Fig.15A now): Your axis label is not clear. What do the numbers behind the genes indicate? Why did you choose oncogene signatures and not inflammatory markers to check for a correlation with disease outcome?

      X axis of Suppl.Fig.15A represent pre-defined molecular signature gene sets MSigDB) in Gene Set Enrichment Analysis (GSEA) database (https://www.gseamsigdb.org/gsea/msigdb). On Y axis is area under curve (AUC) score for each gene set.

      - Sup. 13D(Suppl.Fig.15D now): Maybe you could reorder the patients, so that the impression is clearer, as right now only the top genes seem to show a diverging gene signature, while the rest gives the impression of an equal distribution.

      The Myc upregulated gene set myc_up was identified among top gene sets associated with treatment failure using unbiased ssGSEA algorithm. We agree with the reviewer that not every gene in the myc_up gene set correlates with the treatment outcome. But the association of the gene set is statistically significant, as presented in Suppl.Fig.15B – C.

      - The scale bars for many microscopy pictures are missing.

      We have included clearly visible scale bars to all the microscopy images in the revised version.

      - The black bar plots should be changed (e.g. in color), since the single data points cannot be seen otherwise.

      - It would be advisable that a consistent color scheme would be used throughout the manuscript to make it easier to identify similar conditions, as otherwise many different colours are not required and lead right now rather to confusion (e.g. sometimes a black bar refers to BMDMs with and sometimes without TNF stimulation, or B6 BMDMs). Furthermore, plot sizes and fonts should be consistent within the manuscript (including the supplemental data)

      We followed this useful suggestion and selected consistent color codes for B6 and B6.Sst1S groups to enhance clarity throughout the revised manuscript.

      Within the methods section:

      - At which concentration did you use the IFNAR antibody and the isotype?

      We updated method section by including respective concentrations in the revised manuscript.

      - Were mice maintained under SPF conditions? At what age where they used?

      Yes, the mice are specific pathogen free. We used 10 - 14 week old mice for Mtb infection.

      - The BMDM cultivation is not clear. According to your cited paper you use LCCM but can you provide how much M-CSF it contains? How do you make sure that amounts are the same between experiments and do not vary? You do not mention how you actually obtain this conditioned medium. Is there the possibility of contamination or transferred fibroblasts that would impact on the data analysis? Is LCCM also added during stimulation and inhibitor treatment?

      We obtain LCCM by collecting the supernatant from L929 cell line that form confluent monolayer according to well-established protocols for LCCM collection. The supernatants are filtered through 0.22 micron filters to exclude contamination with L929 cells and bacteria. The medium is prepared in 500 ml batches that are sufficient for multiples experiments. Each batch of L929-conditioned medium is tested for biological activity using serial dilutions.

      - How was the BCG infection performed? How much bacteria did you use? Which BCG strain was used?

      We infected mice with M. bovis BCG Pasteur subcutaneously in the hock using 10<sup>6</sup> CFU per mouse.

      - At what density did you seed the BMDMs for stimulation and inhibitor experiments?

      In 96 well plates, we seed 12,000 cells per well and allow the cells to grow for 4 days to reach confluency (approximately 50,000 cells per well). For a 6-well plate, we seed 2.5 × 10<sup>5</sup> cells per well and culture them for 4 days to reach confluency. For a 24-well plate, we seed 50,000 cells per well and keep the cells in media for 4 days before starting any treatments. This ensures that the cells are in a proliferative or near-confluent state before beginning the stimulation or inhibitor treatments. Our detailed protocol is published in STAR Protocols (Yabaji et al., 2022; PMID 35310069).

      - What machine did you use to perform the bulk RNA sequencing? How many replicates did you include for the sequencing?

      For bulk sequencing we used 3 RNA samples for each condition. The samples were sequenced at Boston University Microarray & Sequencing Resource service using Illumina NextSeq<sup>TM</sup> 2000 instrument.

      - How many replicates were used for the scRNA sequencing? Why is your threshold for the exclusion of mitochondrial DNA so high? A typical threshold of less than 5% has been reported to work well with mouse tissue.

      We used one sample per condition. For the mitochondrial cutoff, we usually base it off of the total distribution. There is no "universal" threshold that can be applied to all datasets. Thresholds must be determined empirically.

      - You do not mention how many PCAs were considered for the scRNA sequencing analysis.

      We considered 50 PCAs, this information was added to Methods

      - You should name all the package versions you used for the scRNA sequencing (e.g. for the slingshot, VAM package)

      The following package versions were used: Seurat v4.0.4, VAM v1.0.0, Slingshot v2.3.0, SingleCellTK v2.4.1, Celda v1.10.0, we added this information to Methods.

      - You mention two batches for the human samples. Can you specify what the two batches are?

      Human blood samples were collected at five sites, as described in the updated Methods section and two RNAseq batches were processed separately that required batch correction.

      - At which temperature was the IF staining performed?

      We performed the IF at 4oC. We included the details in revised version.

      Reviewer #2 (Significance):

      Overall, the manuscript has interesting findings with regard to macrophage responses in Mycobacteria tuberculosis infection.

      However, in its current form there are several shortcomings, both with respect to the precision of the experiments and conclusions drawn.

      Reviewer #3 (Evidence, reproducibility and clarity):

      Summary

      The authors use a mouse model designed to be more susceptible to M.tb (addition of sst1 locus) which has granulomatous lesions more similar to human granulomas, making this mouse highly relevant for M.tb pathogenesis studies. Using WT B6 macrophages or sst1B6 macrophages, the authors seek to understand the how the sst1 locus affects macrophage response to prolonged TNFa exposure, which can occur during a pro-inflammatory response in the lungs. Using single cell RNA-seq, revealed clusters of mutant macrophages with upregulated genes associated with oxidative stress responses and IFN-I signaling pathways when treated with TNF compared to WT macs. The authors go on to show that mutant macrophages have decreased NRF2, decreased antioxidant defense genes and less Sp110 and Sp140. Mutant macrophages are also more susceptible to lipid peroxidation and ironmediated oxidative stress. The IFN-I pathway hyperactivity is caused by the dysregulation of iron storage and antioxidant defense. These mutant macrophages are more susceptible to M.tb infection, showing they are less able to control bacterial growth even in the presence of T cells from BCG vaccinated mice. The transcription factor Myc is more highly expressed in mutant macs during TNF treatment and inhibition Myc led to better control of M.tb growth. Myc is also more abundant in PBMCs from M.tb infected humans with poor outcomes, suggesting that Myc should be further investigated as a target for host-directed therapies for tuberculosis.

      Major Comments

      Isotypes for IF imaging and confocal IF imaging are not listed, or not performed. It is a concern that the microscopy images throughout the manuscript do not have isotype controls for the primary antibodies.

      Fig 4 (and later) the anti-IFNAR Ab is used along with the Isotype antibody, Fig 4I does not show the isotype. Use of the isotype antibody is also missing in later figures as well as Fig 3J. Why was this left off as the proper control for the Ab?

      We addressed the comment in revised manuscript as described above in summary and responses to reviewers 1 and 2. Isotype controls for IFNAR1 blockade were included in Fig.3M (previously 3J), Fig. 4I, Suppl.Fig.4G (previously Fig.4I), and updated Fig.4C-E, Fig.6L-M, Suppl.Fig.4F-G, 7I.

      Conclusions drawn by the authors from some of the WB data are worded strongly, yet by eye the blots don't look as dramatically different as suggested. It would be very helpful to quantify the density of bands when making conclusions. (for example, Fig 4A).

      We added the densitometry of Western blot values after normalization above each lane in Fig.2A-C, Fig.3C-D and 3K; Fig.4A-B, Fig.5B,C,I,J.

      Fig 5A is not described clearly. If the gene expression is normalized to untreated B6 macs, then the level of untreated B6 macs should be 1. In the graph the blue bars are slightly below 1, which would not suggest that levels "initially increased and subsequently downregulated" as stated in the text. It seems like the text describes the protein expression but not the RNA expression. Please check this section and more clearly describe the results.

      We appreciate the reviewer’s comment and modified the text to specify the mRNA and protein expression data, as follows:

      “We observed that Myc was regulated in an sst1-dependent manner: in TNF-stimulated B6 wild type BMDMs, c-Myc mRNA was downregulated, while in the susceptible macrophages c-Myc mRNA was upregulated (Fig.5A). The c-Myc protein levels were also higher in the B6.Sst1S cells in unstimulated BMDMs and 6 – 12 h of TNF stimulation (Fig.5B)”.

      Also, why look at RNA through 24h but protein only through 12h? If c-myc transcripts continue to increase through 24h, it would be interesting to see if protein levels also increase at this later time point.

      The time-course of Myc expression up to 24 h is presented in new panels Fig. 5I-5J It demonstrates the decrease of Myc protein levels at 24 h. In the wild type B6 BMDMs the levels of Myc protein significantly decreased in parallel with the mRNA suppression presented in Fig.5A. In contrast , we observed the dissociation of the mRNA and protein levels in the _sst1_mutant BMDMs at 12 and 24 h, most likely, because the mutant macrophages develop integrated stress response (as shown in our previous publication by Bhattacharya et al., JCI, 2021) that is known to inhibit Myc mRNA translation.

      Fig 5J the bands look smaller after D-JNK1 treatment at 6 and 12h though in the text is says no change. Quantifying the bands here would be helpful to see if there really is no difference.

      This experiment was repeated twice, and the average normalized densitometry values are presented in the updated Fig.5J. The main question addressed in this experiment was whether the hyperactivity of JNK in TNF-stimulated sst1 mutant macrophages contributed to Myc upregulation, as was previously shown in cancer. Comparing effects of JNK inhibition on phospho-cJun and c-Myc protein levels in TNF stimulated B6.Sst1S macrophages (updated Fig.5J), we concluded that JNK did not have a major role in c-Myc upregulation in this context.

      Section 4, third paragraph, the conclusion that JNK activation in mutant macs drives pathways downstream of Myc are not supported here. Are there data or other literature from the lab that supports this claim?

      This statement was based on evidence from available literature where JNK was shown to activate oncogens, including Myc. In addition, inhibition of Myc in our model upregulated ferritin (Fig.Fig.5C), reduced the labile iron pool, prevented the LPO accumulation (Fig.5D - G) and inhibited stress markers (Fig.5H). However, we do not have direct experimental evidence in our model that Myc inhibition reduces ASK1 and JNK activities. Hence, we removed this statement from the text and plan to investigate this in the future.

      Fig 6N Please provide further rationale for the BCG in vivo experiment. It is unclear what the hypothesis was for this experiment.

      In the current version BCG vaccination data is presented in Suppl.Fig.14B. We demonstrate that stressed BMDMs do not respond to activation by BCG-specific T cells (Fig.6J) and their unresponsiveness is mediated by type I interferon (Fig.6L and 6M). The observed accumulation of the stressed macrophages in pulmonary TB lesions of the sst1-susceptible mice (Fig.7E, Suppl.Fig.13 and 14A) and the upregulation of type I interferon pathway (Fig.1E,1G, 7C), Suppl.Fig.1C and 11) suggested that the effect of further boosting T lymphocytes using BCG in Mtb-infected mice will be neutralized due to the macrophage unresponsiveness. This experiment provides a novel insight explaining why BCG vaccine may not be efficient against pulmonary TB in susceptible hosts.

      The in vitro work is all concerning treatment with TNFa and how this exposure modifies the responses in B6 vs sst1B6 macrophages; however, this is not explored in the in vivo studies. Are there differences in TNFa levels in the pauci- vs multi-bacillary lesions that lead to (or correlate with) the accumulation of peroxidation products in the intralesional macrophages. How to the experiments with TNFa in vitro relate back to how the macrophages are responding in vivo during infection?

      Our investigation of mechanisms of necrosis of TB granulomas stems from and supported by in vivo studies as summarized below.

      This work started with the characterization necrotic TB granulomas in C3HeB/FeJ mice in vivo followed by a classical forward genetic analysis of susceptibility to virulent Mtb in vivo.

      That led to the discovery of the sst1 locus and demonstration that it plays a dominant role in the formation of necrotic TB granulomas in mouse lungs in vivo. Using genetic and immunological approaches we demonstrated that the sst1 susceptibility allele controls macrophage function in vivo (Yan, et al., J.Immunol. 2007) and an aberrant macrophage activation by TNF and increased production of Ifn-b in vitro (He et al. Plos Pathogens, 2013). In collaboration with the Vance lab we demonstrated that the type I IFN receptor inactivation reduced the susceptibility to intracellular bacteria of the sst1-susceptible mice in vivo (Ji et al., Nature Microbiology, 2019). Next, we demonstrated that the Ifnb1 mRNA superinduction results from combined effects of TNF and JNK leading to integrated stress response in vitro (Bhattacharya, JCI, 2021). Thus, our previous work started with extensive characterization of the in vivo phenotype that led to the identification of the underlying macrophage deficiency that allowed for the detailed characterization of the macrophage phenotype in vitro presented in this manuscript. In a separate study, the Sher lab confirmed our conclusions and their in vivo relevance using Bach1 knockout in the sst1-susceptible B6.Sst1S background, where boosting antioxidant defense by Bach1 inactivation resulted in decreased type I interferon pathway activity and reduced granuloma necrosis. We have chosen TNF stimulation for our in vitro studies because this cytokine is most relevant for the formation and maintenance of the integrity of TB granulomas in vivo as shown in mice, non-human primates and humans. Here we demonstrate that although TNF is necessary for host resistance to virulent Mtb, its activity is insufficient for full protection of the susceptible hosts, because of altered macrophages responsiveness to TNF. Thus, our exploration of the necrosis of TB granulomas encompass both in vitro and extensive in vivo studies.

      Minor comments

      Introduction, while well written, is longer than necessary. Consider shortening this section. Throughout figures, many graphs show a fold induction/accumulation/etc, but it is rarely specified what the internal control is for each graph. This needs to be added.

      Paragraph one, authors use the phrase "the entire IFN pathway was dramatically upregulated..." seems to be an exaggeration. How do you know the "entire" IFN pathway was upregulated in a dramatic fashion?

      (1) We shortened the introduction and discussion; (2) verified that figure legends internal controls that were used to calculate fold induction; (3) removed the word “entire” to avoid overinterpretation.

      Figures 1E, G and H and supp fig 1C, the heat maps are missing an expression key Section 2 second paragraph refers to figs 2D, E as cytoplasmic in the text, but figure legend and y-axis of 2E show total protein.

      The expression keys were added to Fig.1E,G,H, Fig.7C, Suppl.Fig.1C and 1D and Suppl.Fig.11A of the revised manuscript.

      Section 3 end of paragraph 1 refers to Fig 3h. Does this also refer to Supp Fig 3E?

      Yes, Fig.3H shows microscopy of 4-HNE and Suppl.Fig.3H shows quantification of the image analysis. In the revised manuscript these data are presented in Fig.3H and Suppl.Fig.3F. The text was modified to reflect this change.

      Supplemental Fig 3 legend for C-E seems to incorrectly also reference F and G.

      We corrected this error in the figure legend. New panels were added to Suppl.Fig.3 and previous Suppl.Fig.3F and G were moved to Suppl.Fig.4 panels C and D of the revise version.

      Fig 3K, the p-cJun was inhibited with the JNK inhibitor, however it’s unclear why this was done or the conclusion drawn from this experiment. Use of the JNK inhibitor is not discussed in the text.

      The JNK inhibitor was used to confirm that c-Jun phosphorylation in our studies is mediated by JNK and to compare effects of JNK inhibition on phospho-cJun and Myc expression. This experiment demonstrated that the JNK inhibitor effectively inhibited c-Jun phosphorylation but not Myc upregulation, as shown in Fig.5I-J of the revised manuscript.

      Fig 4 I and Supp Fig 3 H seem to have been swapped? The graph in Fig 4I matches the images in Supp Fig 3I. Please check.

      We reorganized the panels to provide microscopy images and corresponding quantification together in the revised the panels Fig. 4H and Fig. 4I, as well as in Suppl. Fig. 4F and Suppl. Fig. 4G.

      Fig 6, it is unclear what % cell number means. Also for bacterial growth, the data are fold change compared to what internal control?

      We updated Fig.6 legend to indicate that the cell number percentages were calculated based on the number of cells at Day 0 (immediately after Mtb infection). We routinely use fixable cell death staining to enumerate cell death. Brief protocol containing this information is included in Methods section. The detailed protocol including normalization using BCG spike has been published – Yabaji et al, STAR Protocols, 2022. Here we did not present dead cell percentage as it remained low and we did not observe damage to macrophage monolayers. This allows us to exclude artifacts due to cell loss. The fold change of Mtb was calculated after normalization using Mtb load at Day 0 after infection and washes.

      Fig 7B needs an expression key

      The expression keys was added to Fig.7C (previously Fig. 7B).

      Supp Fig 7 and Supp Fig 8A, what do the arrows indicate?

      In Suppl.Fig.8 (previously Suppl.Fig.7) the arrows indicate acid fast bacilli (Mtb). In figures Fig.7A and Suppl.Fig.9A arrows indicate Mtb expressing fluorescent reporter mCherry. Corresponding figure legends were updated in the revised version.

      Supp Fig 9A, two ROI appear to be outlined in white, not just 1 as the legend says Methods:

      We updated the figure legend.

      Certain items are listed in the Reagents section that are not used in the manuscript, such as necrostatin-1 or Z-VAD-FMK. Please carefully check the methods to ensure extra items or missing items does not occur.

      These experiments were performed, but not included in the final manuscript. Hence, we removed the “necrostatin-1 or Z-VAD-FMK” from the reagents section in methods of revised version.

      Western blot, method of visualizing/imaging bands is not provided, method of quantifying density is not provided, though this was done for fig 5C and should be performed for the other WBs.

      We used GE ImageQuant LAS4000 Multi-Mode Imager to acquire the Western blot images and the densitometric analyses were performed by area quantification using ImageJ. We included this information in the method section. We added the densitometry of Western blot values after normalization above each lane in Fig.2A-C, Fig.3C-D and 3K; Fig.4A-B, Fig.5B,C,I,J.

      Reviewer #3 (Significance):

      The work of Yabaji et al is of high significance to the field of macrophage biology and M.tb pathogenesis in macrophages. This work builds from previously published work (Bhattacharya 2021) in which the authors first identified the aberrant response induced by TNF in sst1 mutant macrophages. Better understanding how macrophages with the sst1 locus respond not only to bacterial infection but stimulation with relevant ligands such as TNF will aid the field in identifying biomarkers for TB, biomarkers that can suggest a poor outcome vs. "cure" in response to antibiotic treatment or design of host-directed therapies.

      This work will be of interest to those who study macrophage biology and who study M.tb pathogenesis and tuberculosis in particular. This study expands the knowledge already gained on the sst1 locus to further determine how early macrophage responses are shaped that can ultimately determine disease progression.

      Strengths of the study include the methodologies, employing both bulk and single cell-RNA seq to answer specific questions. Data are analyze using automated methods (such as HALO) to eliminated bias. The experiments are well planned and designed to determine the mechanisms behind the increased iron-related oxidative stress found in the mutant macrophages following TNF treatment. Also, in vivo studies were performed to validate some of the in vitro work. Examining pauci-bacillary lesions vs multi-bacillary lesions and spatial transcriptomics is a significant strength of this work. The inclusion of human data is another strength of the study, showing increased Myc in humans with poor response to antibiotics for TB.

      Limitations include the fact that the work is all done with BMDMs. Use of alveolar macrophages from the mice would be a more relevant cell type for M.tb studies. AMs are less inflammatory, therefore treatment with TNF of AMs could result in different results compared to BMDMs. Reviewer's field of expertise: macrophage activation, M.tb pathogenesis in human and mouse models, cell signaling.

      Limitations: not qualified to evaluate single cell or bulk RNA-seq technical analysis/methodology or spatial transcriptomics analysis.

    1. eLife Assessment

      This useful study shows that stimuli of a certain size elicit theta oscillations in V1 neurons both in spikes and local field potentials, and monkeys performing a dot detection task on these stimuli show theta rhythmicity in their response times. This replicates previous findings showing rhythmic theta activity in V4 and behaviour when stimuli are presented in the receptive field along with a surrounding flanker stimulus. However, there is incomplete evidence that rhythmicity in neural activity is related to the rhythmicity in behavior, and the mechanisms underlying these oscillations remain unclear.

    2. Reviewer #1 (Public review):

      Summary:

      The authors add to the body of evidence showing theta rhythmic modulations of neuronal activity and behavior.

      Strengths:

      Precise characterization of the effects of visual stimulation on theta-induced neuronal oscillations of spiking neurons in V1 and its relevance for behavior.

      The manuscript is well-written and clearly presented,

      Weaknesses:

      The advances are limited over the established body of evidence. Both theta-induced visual oscillations and their relevance for behavior have been firmly established by prior work, including prior work from the authors. There is no major new technique, data, finding, or insight that extends our knowledge in a majorly significant way beyond existing knowledge, in my opinion. I would suggest that the authors re-evaluate the body of existing work to more strongly place their work in the context of existing work. A study that targets fundamental holes or open questions in the field would have been viewed as more impactful.

    3. Reviewer #2 (Public review):

      Summary:

      Schmid & colleagues test an interesting hypothesis that V1 neurons might act as theta-tuned filters to incoming sensory information, and thereby influence downstream processing and detection performance.

      Strengths:

      The authors report that circular stimuli elicit theta oscillations in V1 single units and population activity. They also report that the phase of the theta oscillations influences performance in a change detection task.

      Weaknesses:

      The results are reported in terms of specific stimulus sizes. To truly reflect general-purpose spatial computations in the primary visual cortex, it will be important to establish a relationship between stimulus size and receptive field size.

      I have several major concerns that I would like the authors to address:

      (1) First paragraph of Results: The results are presented at very specific stimulus sizes: 0.3-degree, 1-degree, 4-degree, and so on. A key missing piece of information is the size of the receptive fields (RFs) that were recorded from. A related missing information is at what eccentricity these RFs were recorded from. Since there is nothing magical about a 1-degree stimulus, any general-purpose computation in the primary visual cortex has to establish a relationship between RF size and stimulus size.

      (2) Second paragraph of Results: The authors state that "specific stimulus sizes consistently induced strong theta rhythmic activity: 1{degree sign} in MUA and 2{degree sign} in LFP". What is the interpretation of these specific sizes? Given that the LFP and MUAe reflect different aspects of neural activity, how does one interpret the discrepancy?

      (3) Third paragraph of Results: Again related to (1), what is the relationship between the stimulus size that elicited the largest theta peaks and RF size at the population level? (1)-(3) taken together, there seems to be an opportunity to reveal something more fundamental about V1 processing that the authors might have missed here.

      (4) Change detection task: It was not clear to me whether the timing of the luminance change, which varied from 500ms to 1500ms, was drawn from an exponential distribution or a uniform distribution. Only an exponential distribution has the property of a flat hazard function, which will be important to establish that the animal could not anticipate the timing of the upcoming change.

      (5) Figure 3D: Have the authors tried to fit the data separately for each animal? There seems to be an inconsistency in the results between the 2 animals. The circular data points ('AL') seem positively correlated, similar to the overall trend, but the diamond data points ('DP') seem to have a negative slope.

    4. Reviewer #3 (Public review):

      Summary:

      This paper investigates changes in brain oscillations in V1 in response to experimentally manipulating visual stimulus features (size, contrast at optimal size) and examines whether these effects are of perceptual relevance. The results reveal prominent stimulus-related theta oscillations in V1 that match in frequency the rhythms of behavioural performance (response speed in detecting targets in the visual display). Phase analyses relate these fluctuations of detection performance more formally to opposite theta phase angles in V1.

      Strengths:

      The non-human primate model provides unique findings on how brain oscillations relate to rhythms in perception (in two rhesus monkeys) that align well with findings from human studies (as occurring in the theta band). However, theta rhythms in humans are typically associated with fronto-parietal activity in the domain of spatial orienting, attentional sampling, while here the focus is on V1. Importantly, microsaccade-controls seem to speak against a spatial orienting/ attentional sampling mechanism to explain the observed effects (at least regarding overt attention).

      Weaknesses:

      This study provides interesting clues on perceptually relevant brain oscillations. Despite the microsaccade-control, I believe it remains an open question whether the V1 rhythmicity is of pure V1 origin, or driven by top-down input, as it is conceivable that specific stimuli capture attention differently (and hence induce specific covert attentional (re)orienting patterns). For perceptually relevant (yet beta) rhythmicity over occipital areas that are top-down generated, see e.g., Veniero et al., 2019.

    1. eLife Assessment

      In this useful study, ectopic expression and knockdown strategies were used to assess the effects of increasing and decreasing Cyclic di-AMP on the developmental cycle in Chlamydia. The authors convincingly demonstrate that overexpression of the dacA-ybbR operon results in increased production of c-di-AMP and early expression of the transitionary gene hctA and late gene omcB. Whilst the authors have attempted to revise the submission, the model proposed in the revised manuscript is still not fully supported by the data presented.

    2. Reviewer #2 (Public review):

      This manuscript describes the role of the production of c-di-AMP on the chlamydial developmental cycle. The main findings remain the same. The authors show that overexpression of the dacA-ybbR operon results in increased production of c-di-AMP and early expression of transitionary and late genes. The authors also knocked down the expression of the dacA-ybbR operon and reported a modest reduction in the expression of both hctA and omcB. The authors conclude with a model suggesting the amount of c-di-AMP determines the fate of the RB, continued replication, or EB conversion.

      Overall, this is a very intriguing study with important implications however the data is very preliminary and the model is very rudimentary. The data support the observation that dramatically increased c-di-AMP has an impact on transitionary gene expression and late gene expression suggesting dysregulation of the developmental cycle. This effect goes away with modest changes in c-di-AMP (detaTM-DacA vs detaTM-DacA (D164N)). However, the model predicts that low levels of c-di-AMP delays EB production is not not well supported by the data. If this prediction were true then the growth rate would increase with c-di-AMP reduction and the data does not show this. The levels of of c-di-AMP at the lower levels need to be better validated as it seems like only very high levels make a difference for dysregulated late gene expression. However, on the low end it's not clear what levels are needed to have an effect as only DacAopMut and DacAopKD show any effects on the cycle and the c-di-AMP levels are only different at 24 hours.

      The data still do not support the overall model.

      In Figure 1 the authors show at 24 hpi.

      DacA overexpression increases cdiAMP to ~4000 pg/ml

      DacAmut overexpression reduces cdiAMP dramatically to ~256 pg/ml)

      DacATM overexpression increases cdiAMP to ~4000 pg/ml.

      DacAmutTM overexpression does not seem to change cdiAMP ~1500 pg/ml .

      dacAKD decreases cdiAMP to ~300 pg/ml .

      dacAKDcom increased cdiAMP to ~8000 pg/ml.

      DacA-ybbRop overexpression increased cdiAMP to ~500,000 pg/ml.

      DacA-ybbRopmut ~300 pg/ml.

      However in Figure 2 the data show that overexpression of DacA (cdiAMP ~4000 pg/ml) did not have a different phenotype than over expression of the mutant (cdiAMP ~256 pg/ml). HctA expression down, omcB expression down, euo not much change, replication down, and IFUs down. Additionally, Figure 3 shows no differences in anything measured although cdiAMP levels were again dramatically different. DacATM overexpression (~4000 pg/ml) and DacAmutTM (~1500). This makes it unclear what cdiAMP is doing to the developmental cycle.

      In Figure 4 the authors knockdown dacA (dacA-KD) and complement the knockdown (dacA-KDcom) dacAKD decreases cdiAMP (~300) while DacA-KDcom increases cdiAMP much above wt (~8000).<br /> KD decreased hctA and omcB at 24hpi. Complementation resulted in a moderate increase in hctA at a single time point but not at 24 hpi and had no effect on euo or omcB expression. Importantly, complementation decreased the growth rate. Based on the proposed model, growth rate should increase as the chlamydia should all be RBs and replicating and not exiting the cell cycle to become EBs (not replicating). Interestingly reducing cdiAMP levels by over expressing DacAmut (~256 pg/ml) did not have an effect on the cycle but the reduction in cdiAMP by knockdown of dacA (~300 pg/ml) did have a moderate effect on the cycle.

      For Figure 5 DacA-ybbRop was overexpressed and this increased cdiAMP dramatically ~500,000 pg/ml as compared to wt ~1500. This increased hctA only at an early timepoint and not at 24hpi and again had no effect on omcB or euo. Overexpression of the operon with the mutation DacA-ybbRopmut reduced cdiAMP to ~300 pg/ml and this showed a reduction in growth rate similar to dacAmut but a more dramatic decrease in IFUs.

      Overall:

      DacA overexpression increases cdiAMP to ~4000 pg/ml (decreased everything except euo)

      DacAmut overexpression reduces cdiAMP dramatically (~256 pg/ml). (decreased everything except euo)

      DacATM overexpression increases cdiAMP to ~4000 pg/ml (no changes noted)

      DacAmutTM overexpression does not seem to change cdiAMP ~1500 pg/ml (no changes noted)

      dacAKD decrease cdiAMP to ~300 pg/ml (decreased everything except euo)

      dacAKDcom increased cdiAMP to ~8000 pg/ml (decreases growth rate, increase hctA a little but not omcB)

      DacA-ybbRop overexpression increased cdiAMP to ~500,000 pg/ml (decreases growth rate, increase hctA a little but not omcB)

      DacA-ybbRopmut ~300 pg/ml (decreased everything except euo)

      Overall, the data show that increasing cdiAMP only has a phenotype if it is dramatically increased, no effect at 4000 pg/ml. Decreasing cdiAMP has a consistent effect, decreased growth rate, IFU, hctA expression and omcB expression. However, if their proposed model was correct and low levels of cdiAMP blocked EB conversion then more chlamydial cells would be RBs (dividing cells) and the growth rate should increase. Conversely, if cdiAMP levels were dramatically raised then all RBs would all convert and the growth rate would be very low. When cdiAMP was raised to ~4000 pg/ml there was no effect on the growth rate. However, an increase to ~8000 pg/ml resulted in a significant decrease but growth continued. Increasing cdAMP to ~500,000 pg/ml had less of an impact on the growth rate. Overall, the data does not cleanly support the proposed model.

    3. Author response:

      The following is the authors’ response to the current reviews

      Reviewer #2 (Public review): 

      This manuscript describes the role of the production of c-di-AMP on the chlamydial developmental cycle. The main findings remain the same. The authors show that overexpression of the dacA-ybbR operon results in increased production of c-di-AMP and early expression of transitionary and late genes. The authors also knocked down the expression of the dacA-ybbR operon and reported a modest reduction in the expression of both hctA and omcB. The authors conclude with a model suggesting the amount of c-di-AMP determines the fate of the RB, continued replication, or EB conversion. 

      Overall, this is a very intriguing study with important implications however the data is very preliminary and the model is very rudimentary. The data support the observation that dramatically increased c-di-AMP has an impact on transitionary gene expression and late gene expression suggesting dysregulation of the developmental cycle. This effect goes away with modest changes in c-di-AMP (detaTM-DacA vs detaTM-DacA (D164N)). However, the model predicts that low levels of c-di-AMP delays EB production is not not well supported by the data. If this prediction were true then the growth rate would increase with c-di-AMP reduction and the data does not show this. The levels of of c-di-AMP at the lower levels need to be better validated as it seems like only very high levels make a difference for dysregulated late gene expression. However, on the low end it's not clear what levels are needed to have an effect as only DacAopMut and DacAopKD show any effects on the cycle and the c-di-AMP levels are only different at 24 hours. 

      These appear to be the same comments the reviewer presented last time, so we will reiterate our prior points here and elsewhere. We do not think and nor do we predict that low c-di-AMP levels should increase growth rate (as measured by gDNA levels), and this conclusion cannot be drawn from our data. Rather, we predict that the inability to accumulate c-di-AMP should delay production of EBs, and this is what the data show. The reviewer has applied their own subjective (and erroneous) interpretation to the model. The asynchronicity of the normal developmental cycle means RBs continue to replicate as EBs are forming, so gDNA levels cannot be used as the sole metric for determining RB levels. We show that reduced c-di-AMP levels reduce EB levels as well as transcripts associated with late stages of development. The parsimonious interpretation of these data support that low c-di-AMP levels delay progression through the developmental cycle consistent with our model.

      The data still do not support the overall model.

      We disagree.  We have presented quantified data that include appropriate controls and statistical tests, and the reviewer has not disputed that or pointed to additional experiments that need to be performed.  The reviewer has imposed a subjective interpretation of our model based on their own biases.  A reader is free, of course, to disagree with our model, but a reviewer should not block a manuscript based on such a disagreement if no experimental flaws have been identified. 

      In Figure 1 the authors show at 24 hpi. 

      We also showed data from 16hpi, which is a more relevant timepoint for assessing premature transition to EBs.  In contrast, the 24hpi is more important for assessing developmental effects of reduced c-di-AMP levels.

      DacA overexpression increases cdiAMP to ~4000 pg/ml 

      DacAmut overexpression reduces cdiAMP dramatically to ~256 pg/ml) 

      DacATM overexpression increases cdiAMP to ~4000 pg/ml. 

      DacAmutTM overexpression does not seem to change cdiAMP ~1500 pg/ml . 

      dacAKD decreases cdiAMP to ~300 pg/ml . 

      dacAKDcom increased cdiAMP to ~8000 pg/ml. 

      DacA-ybbRop overexpression increased cdiAMP to ~500,000 pg/ml. 

      DacA-ybbRopmut ~300 pg/ml. 

      However in Figure 2 the data show that overexpression of DacA (cdiAMP ~4000 pg/ml) did not have a different phenotype than over expression of the mutant (cdiAMP ~256 pg/ml). HctA expression down, omcB expression down, euo not much change, replication down, and IFUs down. Additionally, Figure 3 shows no differences in anything measured although cdiAMP levels were again dramatically different. DacATM overexpression (~4000 pg/ml) and DacAmutTM (~1500). This makes it unclear what cdiAMP is doing to the developmental cycle. 

      As we have explained in the text and in response to reviewer comments on previous rounds of review, overexpressing the full-length WT or mutant DacA is detrimental to developmental cycle progression for reasons that have nothing to do with c-di-AMP levels (likely disrupting membrane function), since, as the reviewer notes, the WT DacA deltaTM strain had similar c-di-AMP levels but no negative effects on growth/development. If we had not presented the effects of overexpressing the individual isoforms, then a reviewer would surely have requested such, which is why we present these data even though they don’t seem to support our model.  This is an honest representation of our findings.  The reviewer seems intent on nitpicking a minor datapoint that seems to contradict the rest of the manuscript while ignoring or not carefully reading the rest of the manuscript.

      In Figure 4 the authors knockdown dacA (dacA-KD) and complement the knockdown (dacA-KDcom) 

      dacAKD decreases cdiAMP (~300) while DacA-KDcom increases cdiAMP much above wt (~8000). 

      KD decreased hctA and omcB at 24hpi. Complementation resulted in a moderate increase in hctA at a single time point but not at 24 hpi and had no effect on euo or omcB expression.

      By 24hpi, late gene transcripts are being maximally produced during a normal developmental cycle. It is unclear why the reviewer thinks that these transcripts should be elevated above this level in any of our strains that prematurely transition to EBs. There is no basis in the literature to support such an assumption. As we noted in the text, the dacA-KDcom strain phenocopied the dacAop OE strain, and we showed RNAseq data and EB production curves for the latter that support our conclusions of the effect of increased c-di-AMP levels on developmental progression.

      Importantly, complementation decreased the growth rate.

      Yes, since the c-di-AMP levels breached the “EB threshold” at 16hpi, it causes premature transition to EBs, which do not replicate their gDNA, at an earlier stage of the cycle when fewer organisms are present. Therefore, the gDNA levels are decreased at 24hpi, which is consistent with our model.

      Based on the proposed model, growth rate should increase as the chlamydia should all be RBs and replicating and not exiting the cell cycle to become EBs (not replicating).

      This is a spurious conclusion from the reviewer. As we clearly showed, the dacA-KDcom did not restore a wild-type phenotype and instead mimicked the dacAop OE strain. This was commented on in the text.

      Interestingly reducing cdiAMP levels by over expressing DacAmut (~256 pg/ml) did not have an effect on the cycle but the reduction in cdiAMP by knockdown of dacA (~300 pg/ml) did have a moderate effect on the cycle. 

      This is again a spurious conclusion from the reviewer. The dacAMut and dacA-KD strains are distinct. As noted in the text and above for DacA WT OE, overexpressing the DacAMut similarly disrupts organism morphology, which is different from dacA-KD. These strains should not be directly compared because of this. This point has been previously highlighted in the text (in Results and Discussion).

      For Figure 5 DacA-ybbRop was overexpressed and this increased cdiAMP dramatically ~500,000 pg/ml as compared to wt ~1500. This increased hctA only at an early timepoint and not at 24hpi and again had no effect on omcB or euo.

      As we explained in prior reviews, our RNAseq data more comprehensively assessed transcripts for the dacAop OE strain. These data show convincingly that late gene transcripts (not just hctA and omcB) are elevated earlier in the developmental cycle. Again, it is not clear why the reviewer should expect that late gene transcripts should be higher in these strains than they are during a normal developmental cycle. This is not part of our model and appears to be a bias that the reviewer has imposed that is not supported by the literature.

      Overexpression of the operon with the mutation DacA-ybbRopmut reduced cdiAMP to ~300 pg/ml and this showed a reduction in growth rate similar to dacAmut but a more dramatic decrease in IFUs. 

      As we described in the text, in earlier revisions, and above, the dacAMut OE strain has distinct effects unrelated to c-di-AMP levels and, therefore, should not be compared to other strains in terms of linking its c-di-AMP levels to its phenotype.

      Overall: 

      DacA overexpression increases cdiAMP to ~4000 pg/ml (decreased everything except euo) 

      DacAmut overexpression reduces cdiAMP dramatically (~256 pg/ml). (decreased everything except euo) 

      DacATM overexpression increases cdiAMP to ~4000 pg/ml (no changes noted) 

      DacAmutTM overexpression does not seem to change cdiAMP ~1500 pg/ml (no changes noted) 

      dacAKD decrease cdiAMP to ~300 pg/ml (decreased everything except euo) 

      dacAKDcom increased cdiAMP to ~8000 pg/ml (decreases growth rate, increase hctA a little but not omcB) 

      DacA-ybbRop overexpression increased cdiAMP to ~500,000 pg/ml (decreases growth rate, increase hctA a little but not omcB) <br /> DacA-ybbRopmut ~300 pg/ml (decreased everything except euo) 

      Overall, the data show that increasing cdiAMP only has a phenotype if it is dramatically increased, no effect at 4000 pg/ml.

      Yes, this clearly shows there is a threshold - as we hypothesize!  However, these thresholds are more important at the 16hpi timepoint not 24hpi (which the reviewer is referencing) when assessing premature transition to EBs.  We specifically highlighted in our prior revision in Figure 1E this EB threshold to make this point clearer for the reader.  Once the threshold is breached, then the overall c-di-AMP levels become irrelevant as the RBs have begun their transition to EBs.

      Decreasing cdiAMP has a consistent effect, decreased growth rate, IFU, hctA expression and omcB expression. However, if their proposed model was correct and low levels of cdiAMP blocked EB conversion then more chlamydial cells would be RBs (dividing cells) and the growth rate should increase.

      The only effect should be normal gDNA levels, which is what we see in the dacA-KD.  Given the asynchronicity of a normal developmental cycle in which RBs continue to replicate as EBs are still forming, there is no basis to assume gDNA levels should increase under these conditions for the dacA-KD strain at 24hpi.

      Conversely, if cdiAMP levels were dramatically raised then all RBs would all convert and the growth rate would be very low.

      We agree. This is what is reflected by the dacAop OE and dacA-KDcom strains, with reduced gDNA levels at 24hpi since organisms have transitioned to EBs at an earlier time post-infection.

      When cdiAMP was raised to ~4000 pg/ml there was no effect on the growth rate.

      Yes, because it had not breached the EB threshold at 16hpi – consistent with our model!  The reviewer is confusing effects of elevated c-di-AMP at 24hpi when they should be assessed at the 16hpi timepoint for strains overproducing this molecule.

      However, an increase to ~8000 pg/ml resulted in a significant decrease but growth continued.

      If the reviewer is referring to the dacA-KDcom strain, then this is not accurate. gDNA levels were decreased in this strain at 24hpi when the c-di-AMP levels were increased compared to the WT (mCherry OE) control at 16hpi, indicating this strain had breached the “EB threshold” and initiated conversion to EBs at an earlier timepoint post-infection when fewer organisms were present.

      Increasing cdAMP to ~500,000 pg/ml had less of an impact on the growth rate.

      It is not clear what this conclusion is based on and what the reviewer is comparing to.  This is a subjective assessment not based on our data.

      Overall, the data does not cleanly support the proposed model.

      It is an unfortunate aspect of biology, particularly for obligate intracellular bacteria – a challenging experimental system on which to work, that the data are not always “clean”.  The overall effects of increased c-di-AMP levels on chlamydial developmental cycle progression we have documented support our model, and we think the reader, as always, should make their own assessment.


      The following is the authors’ response to the original reviews.

      Reviewer #2 (Public review): 

      This manuscript describes the role of the production of c-di-AMP on the chlamydial developmental cycle. The main findings remain the same. The authors show that overexpression of the dacA-ybbR operon results in increased production of c-di-AMP and early expression of transitionary and late genes. The authors also knocked down the expression of the dacA-ybbR operon and reported a modest reduction in the expression of both hctA and omcB. The authors conclude with a model suggesting the amount of c-di-AMP determines the fate of the RB, continued replication, or EB conversion. 

      Overall, this is a very intriguing study with important implications however, the data is very preliminary, and the model is very rudimentary. The data support the observation that dramatically increased c-di-AMP has an impact on transitionary gene expression and late gene expression suggesting dysregulation of the developmental cycle. This effect goes away with modest changes in c-di-AMP (detaTM-DacA vs detaTM-DacA (D164N)). However, the model predicts that low levels of c-di-AMP delays EB production is not not well supported by the data. If this prediction were true then the growth rate would increase with c-di-AMP reduction and the data does not show this.

      Thank you for the comments. We have apparently not adequately communicated our predictions and the model. We do not think and nor do we predict that low c-di-AMP levels should increase growth rate, and there is no basis in any of our data to support that. Rather, we predict that the inability to accumulate c-di-AMP should delay production of EBs, and this is what the data show. We have clarified this in the text (line 89 paragraph).

      The levels of c-di-AMP at the lower levels need to be better validated as it seems like only very high levels make a difference for dysregulated late gene expression. However, on the low end it's not clear what levels are needed to have an effect as only DacAopMut and DacAopKD show any effects on the cycle and the c-di-AMP levels are only different at 24 hours.

      Our hypothesis is that increasing concentrations of c-di-AMP within a given RB is a signal for it to undergo secondary differentiation to the EB, and the data support this as noted by the reviewers. Again, we stress that low levels of c-di-AMP are irrelevant to the model. We have revised Figure 1E to indicate the level of c-di-AMP in the control strain at the 24hpi timepoint that coincides with increased EB levels. We hope this will further clarify the goals of our study. That a given strain might be below the EB control is not relevant to the model beyond indicating that it has not reached the necessary threshold for triggering secondary differentiation.

      The authors responded to reviewers' critiques by adding the overexpression of DacA without the transmembrane region. This addition does not really help their case. They show that detaTM-DacA and detaTM-DacA (D164N) had the same effects on c-di-AMP levels but the figure shows no effects on the developmental cycle.

      As it relates directly to the reviewer’s point, the delta-TM strains did not show the same level of c-di-AMP. It may be that the reviewer misread the graph. The purpose of testing these strains was to show that the negative effects of overexpressing full-length WT DacA were due to its membrane localization. Both the FL and deltaTM-DacA (WT) overexpression had equivalent c-di-AMP levels even though the delta-TM overexpression looked like the mCherry-expressing strain based on the measured parameters. This shows that the c-di-AMP levels were irrelevant to the phenotypes observed when overexpressing these WT isoforms. For the mutant isoforms, the delta-TM looked like the mCherry-expressing control while the FL isoform was negatively impacted for reasons we described in the Discussion (e.g., dominant negative effect). In addition, at 16hpi, neither delta-TM strain had c-di-AMP levels that approached the 24h control as denoted in Figure 1E (dashed line) and in the text, which explains why these strains did not show increased late gene transcripts at an earlier timepoint like the dacAop and dacA-KDcom strains.

      Describing the significance of the findings: 

      The findings are important and point to very exciting new avenues to explore the important questions in chlamydial cell form development. The authors present a model that is not quantified and does not match the data well. 

      We respectfully disagree with this assessment as noted above in response to the reviewer’s critique. All of our data are quantified and support the hypothesis as stated.

      Describing the strength of evidence: 

      The evidence presented is incomplete. The authors do a nice job of showing that overexpression of the dacA-ybbR operon increases c-di-AMP and that knockdown or overexpression of the catalytically dead DacA protein decreases the c-di-AMP levels. However, the effects on the developmental cycle and how they fit the proposed model are less well supported. 

      Overall this is a very intriguing finding that will require more gene expression data, phenotypic characterization of cell forms, and better quantitative models to fully interpret these findings. 

      It is not clear what quantitative models the reviewer would prefer, but, ultimately, it is up to the reader to decide whether they agree or not with the model we present. The data are the data, and we have tried to present them as clearly as possible. We would emphasize that, with the number of strains we have analyzed, we have presented a huge amount of data for a study with an obligate intracellular bacterium. As a comparison, most publications on Chlamydia might use a handful of transformant strains, if any. Given the cost and time associated with performing such studies, it is prohibitive to attempt all the time points that one might like to do, and it is not clear to us that further studies will add to or alter the conclusions of the current manuscript.

      Reviewer #2 (Recommendations for the authors): 

      Minor critiques 

      The graphs have red and blue lines but the figure legends are red and black. It would be better if these matched. 

      Changed.

      For Figure 1C. The labels are not very helpful. It's not clear what is HeLa vs mCherry. I believe it is uninfected vs Chlamydia infected.

      Changed.

    1. eLife Assessment

      This valuable study revisits the effects of substitution model selection on phylogenetics by comparing reversible and non-reversible DNA substitution models. The authors provide solid evidence that 1) it can be beneficial to include non-time-reversible models in addition to general time-reversible models when inferring phylogenetic trees out of simulated viral genome sequence data sets, and that 2) non time-reversible models may fit the real data better than the reversible substitution models commonly used in phylogenetics, a finding consistent with previous work.

    1. Reviewer #1 (Public review):

      Summary:

      This is a contribution to the field of developmental bioelectricity. How do changes of resting potential at the cell membrane affect downstream processes? Zhou et al. reported in 2015 that phosphatidylserine and K-Ras cluster upon plasma membrane depolarization and that voltage-dependent ERK activation occurs when constitutively active K-RasG12V mutants are overexpressed. In this paper, the authors advance the knowledge of this phenomenon by showing that membrane depolarization up-regulates mitosis and that this process is dependent on voltage-dependent activation of ERK. ERK activity's voltage-dependence is derived from changes in the dynamics of phosphatidylserine in the plasma membrane and not by extracellular calcium dynamics. This paper reports an interesting and important finding. It is somewhat derivative of Zhou et al., 2015. (https://www.science.org/doi/full/10.1126/science.aaa5619). The main novelty seems to be that they find quantitatively different conclusions upon conducting similar experiments, albeit with a different cell line (U2OS) than those used by Zhou et al. Sasaki et al. do show that increased K+ levels increase proliferation, which Zhou et al. did not look at. The data presented in this paper are a useful contribution to a field often lacking such data.

      Strengths:

      Bioelectricity is an important field for areas of cell, developmental, and evolutionary biology, as well as for biomedicine. Confirmation of ERK as a transduction mechanism and a characterization of the molecular details involved in the control of cell proliferation are interesting and impactful.

      Weaknesses:

      The authors lean heavily on the assumption that the Nernst equation is an accurate predictor of membrane potential based on K+ level. This is a large oversimplification that undermines the author's conclusions, most glaringly in Figure 2C. The author's conclusions should be weakened to reflect that the activity of voltage gated ion channels and homeostatic compensation are unaccounted for.

      There are grammatical tense errors are made throughout the paper (ex line 99 "This kinetics should be these kinetics")

      Line 71: Zhou et al. use BHK, N2A, PSA-3 cells, this paper uses U2OS (osteosarcoma) cells. Could that explain the differences in bioelectric properties that they describe? In general, there should be more discussion of the choice of cell line. Why were U2OS cells chosen? What are the implications of the fact that these are cancer cells, and bone cancer cells in particular? Does this paper provide specific insights for bone cancers? And crucially, how applicable are findings from these cells to other contexts?

      Line 115: The authors use EGF to calibrate 'maximal' ERK stimulation. Is this level near saturation? Either way is fine, but it would be useful to clarify.

      Line 121: Starting line 121 the authors say "Of note, U2OS cells expressed wild-type K-Ras but not an active mutant of K-Ras, which means voltage dependent ERK activation occurs not only in tumor cells but also in normal cells". Given that U2OS cells are bone sarcoma cells, is it appropriate to refer to these as 'normal' cells in contrast to 'tumor' cells?

      Line 101: These normalizations seem reasonable, the conclusions sufficiently supported and the requisite assumptions clearly presented. Because the dish-to-dish and cell-to-cell variation may reflect biologically relevant phenomena it would be ideal if non-normalized data could be added in supplemental data where feasible.

      Figure 2C is listed as Figure 2D in the text

      There is no Figure 2F (Referenced in line 148)

    2. Reviewer #2 (Public review):

      Sasaki et al. use a combination of live-cell biosensors and patch-clamp electrophysiology to investigate the effect of membrane potential on the ERK MAPK signaling pathway, and probe associated effects on proliferation. This is an effect that has long been proposed, but a convincing demonstration has remained elusive, because it is difficult to perturb membrane potential without disturbing other aspects of cell physiology in complex ways. The time-resolved measurements here are a nice contribution to this question, and the perforated patch clamp experiments with an ERK biosensor are fantastic - they come closer to addressing the above difficulty of perturbing voltage than any prior work. It would have been difficult to obtain these observations with any other combination of tools.

      However, there are still some concerns as detailed in specific comments below:

      Specific comments:

      (1) All the observations of ERK activation, by both high extracellular K+ and voltage clamp, could be explained by cell volume increase (more discussion in subsequent comments). There is a substantial literature on ERK activation by hypotonic cell swelling (e.g. https://doi.org/10.1042/bj3090013, https://doi.org/10.1002/j.1460-2075.1996.tb00938.x, among others). Here are some possible observations that could demonstrate that ERK activation by volume change is distinct from the effects reported here:

      i) Does hypotonic shock activate ERK in U2OS cells?

      ii) Can hypotonic shock activate ERK even after PS depletion, whereas extracellular K+ cannot?

      iii) Does high extracellular K+ change cell volume in U2OS cells, measured via an accurate method such as fluorescence exclusion microscopy?

      iv) It would be helpful to check the osmolality of all the extracellular solutions, even though they were nominally targeted to be iso-osmotic.

      (2) Some more details about the experimental design and the results are needed from Figure 1:

      i) For how long are the cells serum-starved? From the Methods section, it seems like the G1 release in different K+ concentration is done without serum, is this correct? Is the prior thymidine treatment also performed in the absence of serum?

      ii) There is a question of whether depolarization constitutes a physiologically relevant mechanism to regulate proliferation, and how depolarization interacts with other extracellular signals that might be present in an in vivo context. Does depolarization only promote proliferation after extended serum starvation (in what is presumably a stressed cell state)? What fraction of total cells are observed to be mitotic (without normalization), and how does this compare to the proliferation of these cells growing in serum-supplemented media? Can K+ concentration tune proliferation rate even in serum-supplemented media?

      (3) In Figure 2, there are some possible concerns with the perfusion experiment:

      i) Is the buffer static in the period before perfusion with high K+, or is it perfused? This is not clear from the Methods. If it is static, how does the ERK activity change when perfused with 5 mM K+? In other words, how much of the response is due to flow/media exchange versus change in K+ concentration?

      ii) Why do there appear to be population-average decreases in ERK activity in the period before perfusion with high K+ (especially in contrast to Fig. 3)? The imaging period does not seem frequent enough for photobleaching to be significant.

      (4) Figure 3 contains important results on couplings between membrane potential and MAPK signaling. However, there are a few concerns:

      i) Does cell volume change upon voltage clamping? Previous authors have shown that depolarizing voltage clamp can cause cells to swell, at least in the whole-cell configuration:

      https://www.cell.com/biophysj/fulltext/S0006-3495(18)30441-7 . Could it be possible that the clamping protocol induces changes in ERK signaling due to changes in cell volume, and not by an independent mechanism?

      ii) Does the -80 mV clamp begin at time 0 minutes? If so, one might expect a transient decrease in sensor FRET ratio, depending on the original resting potential of the cells. Typical estimates for resting potential in HEK293 cells range from -40 mV to -15 mV, which would reach the range that induces an ERK response by depolarizing clamp in Fig. 3B. What are the resting potentials of the cells before they are clamped to -80 mV, and why do we not see this downward transient?

      (5) The activation of ERK by perforated voltage clamp and by high extracellular K+ are each convincing, but it is unclear whether they need to act purely through the same mechanism - while additional extracellular K+ does depolarize the cell, it could also be affecting function of voltage-independent transporters and cell volume regulatory mechanisms on the timescales studied. To more strongly show this, the following should be done with the HEK cells where there is already voltage clamp data:

      i) Measure resting potential using the perforated patch in zero-current configuration in the high K+ medium. Ideally this should be done in the time window after high K+ addition where ERK activation is observed (10-20 minutes) to minimize the possibility of drift due to changes in transporter and channel activity due to post-translational regulation.

      ii) Measure YFP/CFP ratio of the HEK cells in the high K+ medium (in contrast to the U2OS cells from Fig. 2 where there is no patch data).

      iii) The assertion that high K+ is equivalent to changes in Vmem for ERK signaling would be supported if the YFP/CFP change from K+ addition is comparable to that induced by voltage clamp to the same potential. This would be particularly convincing if the experiment could be done with each of the 15 mM, 30 mM, and 145 mM conditions.

      (6) Line 170: "ERK activity was reduced with a fast time course (within 1 minute) after repolarization to -80 mV." I don't see this in the data: in Fig. 3C, it looks like ERK remains elevated for > 10 min after the electrical stimulus has returned to -80 mV

      Comments on revisions:

      The authors have done a good job addressing the comments on the previous submission.

    3. Reviewer #3 (Public review):

      Summary:

      This paper demonstrates that membrane depolarization induces a small increase in cell entry into mitosis. Based on previous work from another lab, the authors propose that ERK activation might be involved. They show convincingly using a combination of assays that ERK is activated by membrane depolarization. They show this is Ca2+ independent and is a result of activation of the whole K-Ras/ERK cascade which results from changed dynamics of phosphatidylserine in the plasma membrane that activates K-Ras. Although the activation of the Ras/ERK pathway by membrane depolarization is not new, linking it to an increase in cell proliferation is novel.

      Strengths

      A major strength of the study is the use of different techniques - live imaging with ERK reporters, as well as Western blotting to demonstrate ERK activation as well as different methods for inducing membrane depolarization. They also use a number of different cell lines. Via Western blotting the authors are also able to show that the whole MAPK cascade is activated.

      Weaknesses

      A weakness of the study is the data in Figure 1 showing that membrane depolarization results in an increase of cells entering mitosis. There are very few cells entering mitosis in their sample in any condition. This should be done with many more cells to increase the confidence in the results. The study also lacks a mechanistic link between ERK activation by membrane depolarization and increased cell proliferation.

      The authors did achieve their aims with the caveat that the cell proliferation results could be strengthened. The results, for the most par,t support the conclusions.

      This work suggests that alterations in membrane potential may have more physiological functions than action potential in the neural system as it has an effect on intracellular signalling and potentially cell proliferation.

      In the revised manuscript, the authors have now addressed the issues with Figure 1, and the data presented are much clearer. They did also attempt to pinpoint when in the cell cycle ERK is having its activity, but unfortunately, this was not conclusive.

    4. Author response:

      The following is the authors’ response to the original reviews.

      Reviewer #1 (Public review):

      Summary:

      This is a contribution to the field of developmental bioelectricity. How do changes of resting potential at the cell membrane affect downstream processes? Zhou et al. reported in 2015 that phosphatidylserine and K-Ras cluster upon plasma membrane depolarization and that voltage-dependent ERK activation occurs when constitutive active K-RasG12V mutants are overexpressed. In this paper, the authors advance the knowledge of this phenomenon by showing that membrane depolarization up-regulates mitosis and that this process is dependent on voltage-dependent activation of ERK. ERK activity's voltage-dependence is derived from changes in the dynamics of phosphatidylserine in the plasma membrane and not by extracellular calcium dynamics.

      Strengths:

      Bioelectricity is an important field for areas of cell, developmental, and evolutionary biology, as well as for biomedicine. Confirmation of ERK as a transduction mechanism, and a characterization of the molecular details involved in control of cell proliferation, is interesting and impactful.

      Weaknesses:

      The functional cell division data need to be stronger. They show that increasing K+ increases proliferation and argue that since a MEK inhibitor (U0126) reduces proliferation in K+ treated cells, K+ induces cell division via ERK. But I don't see statistics to show that the rescue is significant, and I don't see a key U0126-only control. If the U0126 alone reduces proliferation, the combined effect wouldn't prove much.

      We thank the reviewer for constructive feedback. We repeated the experiment including the U0126-only control (5K+U). We updated Fig.1, presenting the newly obtained data with statistical analysis.

      Also, unless I'm missing something, it looks like every sample in their control has exactly the same number of mitotic cells. I understand that they are normalizing to this column, but shouldn't they be normalizing to the mean, with the independent values scattering around 1? It doesn't seem like it can be paired replicates since there are 6 replicates in the control and 4 replicates in one of the conditions? 

      We apologize for the unclear description. As the reviewer pointed out, the experiments were not paired replicates due to the limited number of conditions that can be conducted as a single experiment. To overcome this problem, we always included a control condition (i.e. 5K) based on which normalization was performed. This is the reason the data in 5K is always 1 and the sample size of 5K is the largest. Data include 100-900 mitotic cells within the imaging frame of 6 hrs. We re-wrote the figure legend (Fig1) and the main text, which hopefully clarified our experimental framework.

      Reviewer #2 (Public review):

      Sasaki et al. use a combination of live-cell biosensors and patch-clamp electrophysiology to investigate the effect of membrane potential on the ERK MAPK signaling pathway, and probe associated effects on proliferation. This is an effect that has long been proposed, but convincing demonstration has remained elusive, because it is difficult to perturb membrane potential without disturbing other aspects of cell physiology in complex ways. The time-resolved measurements here are a nice contribution to this question, and the perforated patch clamp experiments with an ERK biosensor are fantastic - they come closer to addressing the above difficulty of perturbing voltage than any prior work. It would have been difficult to obtain these observations with any other combination of tools.

      However, there are still some concerns as detailed in specific comments below:

      Specific comments:

      (1) All the observations of ERK activation, by both high extracellular K+ and voltage clamp, could be explained by cell volume increase (more discussion in subsequent comments). There is a substantial literature on ERK activation by hypotonic cell swelling (e.g. https://doi.org/10.1042/bj3090013https://doi.org/10.1002/j.1460-2075.1996.tb00938.x, among others). Here are some possible observations that could demonstrate that ERK activation by volume change is distinct from the effects reported here:

      (i) Does hypotonic shock activate ERK in U2OS cells?

      (ii) Can hypotonic shock activate ERK even after PS depletion, whereas extracellular K+ cannot?

      (iii) Does high extracellular K+ change cell volume in U2OS cells, measured via an accurate method such as fluorescence exclusion microscopy?

      (iv) It would be helpful to check the osmolality of all the extracellular solutions, even though they were nominally targeted to be iso-osmotic.

      This is an important point. We conducted several experiments and provided explanations to rule out the possibility that ERK activation can be explained solely by cell volume change. We measured the osmolarity of all solutions used in this paper, which were 296-305 mOsm/L. This information was added to the Material and Methods section (line 387). Under our experimental conditions, ERK activation was not observed with hypotonic 70 % nor 50% osmolarity solution (Fig.S2).

      It is therefore unlikely that the main cause of ERK activation upon high K<sup>+</sup> perfusion is due to cell volume change. We would like to pursue this issue further when we obtain capacity to measure accurate cell volume change in the future.

      (2) Some more details about the experimental design and the results are needed from Figure 1:

      (i) For how long are the cells serum-starved? From the Methods section, it seems like the G1 release in different K+ concentration is done without serum, is this correct? Is the prior thymidine treatment also performed in the absence of serum?

      Only the high K<sup>+</sup> incubation phase was serum free. We added the following sentence in the main text (line 63) and an experimental diagram was added as Fig1A. “Cells were incubated in the presence of serum except for the phase with altered K<sup>+</sup> concentration. “

      (ii) There is a question of whether depolarization constitutes a physiologically relevant mechanism to regulate proliferation, and how depolarization interacts with other extracellular signals that might be present in an in vivo context.

      This is a very important point. However, the significance of membrane depolarization for cell proliferation in vivo is beyond the scope of this study. This important question will be addressed in the future.

      Does depolarization only promote proliferation after extended serum starvation (in what is presumably a stressed cell state)?

      Cells were cultured in the presence of serum prior to the high K<sup>+</sup> incubation phase as described above. We added a new figure (Fig1A).

      What fraction of total cells are observed to be mitotic (without normalization), and how does this compare to the proliferation of these cells growing in serum-supplemented media? Can K+ concentration tune proliferation rate even in serum-supplemented media?

      We included data recorded in serum-supplemented conditions (Fig.1), which showed a high mitotic rate. This is presumably due to the growth factors included in serum. There is no significant difference between 5K+FBS and 15K+FBS.

      (3) In Figure 2, there are some possible concerns with the perfusion experiment:

      (i) Is the buffer static in the period before perfusion with high K+, or is it perfused? This is not clear from the Methods. If it is static, how does the ERK activity change when perfused with 5 mM K+? In other words, how much of the response is due to flow/media exchange versus change in K+ concentration?

      The buffer was static prior to high K perfusion. We confirmed that perfusion alone does not activate ERK (Fig.S2). We added the following sentence to the main text. “We also confirmed that the effect of perfusion was negligible, as ERK activation was not observed upon start of the 5K<sup>+</sup> perfusion” (line 150).

      (ii) Why do there appear to be population-average decreases in ERK activity in the period before perfusion with high K+ (especially in contrast to Fig. 3)? The imaging period does not seem frequent enough for photo bleaching to be significant.

      Although we don’ t have a clear answer to this question, we speculate that several aspects of the experimental setup may have contributed to the difference. The cell lines and imaging systems used in Fig.2 and Fig.3 were different. The expression level may be different between U2OS cells and HEK 293 cells: transient expression in U2OS cells in contrast to stable expression in HEK 293 cells. This difference may lead to the different signal-to-noise ratio. The imaging system used in Fig.2 is an epi-illumination microscope excited with a 439/24 bandpass filter and detected with 483/32 (CFP) and 542/27 (YFP), while the imaging system used in Fig.3 is a confocal microscope excited with 458 nm laser and detected with 475-525 (DFP) and LP530 (YFP). These optical setups may also contribute to the different population-average properties before stimulation.

      (4) Figure 3 contains important results on couplings between membrane potential and MAPK signaling. However, there are a few concerns:

      (i) Does cell volume change upon voltage clamping? Previous authors have shown that depolarizing voltage clamp can cause cells to swell, at least in the whole-cell configuration: https://www.cell.com/biophysj/fulltext/S0006-3495(18)30441-7 . Could it be possible that the clamping protocol induces changes in ERK signaling due to changes in cell volume, and not by an independent mechanism?

      We do not know whether cell volume is altered in the perforated-patch configuration. As discussed above, however, the effect of cell volume changes on ERK activity seemed to be negligible, because ERK activation was not observed with hypotonic 70 % nor 50% osmolarity solution (Fig.S2)

      (ii) Does the -80 mV clamp begin at time 0 minutes? If so, one might expect a transient decrease in sensor FRET ratio, depending on the original resting potential of the cells. Typical estimates for resting potential in HEK293 cells range from -40 mV to -15 mV, which would reach the range that induces an ERK response by depolarizing clamp in Fig. 3B. What are the resting potentials of the cells before they are clamped to -80 mV, and why do we not see this downward transient?

      We set the potential to -80mV immediately after the giga-seal formation and waited for at least 5 minutes to allow pore formation by gramicidin. We started imaging only after membrane potential was expected to have reached a steady state at -80 mV. We now included this sentence in the ‘Material and Methods’ section (line 398).

      (5) The activation of ERK by perforated voltage clamp and by high extracellular K+ are each convincing, but it is unclear whether they need to act purely through the same mechanism - while additional extracellular K+ does depolarize the cell, it could also be affecting function of voltage-independent transporters and cell volume regulatory mechanisms on the timescales studied. To more strongly show this, the following should be done with the HEK cells where there is already voltage clamp data:

      (i) Measure resting potential using the perforated patch in zero-current configuration in the high K+ medium. Ideally this should be done in the time window after high K+ addition where ERK activation is observed (10-20 minutes) to minimize the possibility of drift due to changes in transporter and channel activity due to post-translational regulation.

      We measured membrane potential in the perforated patch configuration and confirmed that there is negligible potential drift within 20 minutes of perfusion with 145 K+ (only 1~5 mV change during perfusion).

      (ii) Measure YFP/CFP ratio of the HEK cells in the high K+ medium (in contrast to the U2OS cells from Fig. 2 where there is no patch data).

      YFP/CFP ratio data in HEK cells are shown in Fig.S1. As the signal-to-noise level is affected by the expression level of the probe, it is difficult to compare between cells with different expression levels. A higher YFP/CFP value with HEK cells compared to HeLa cells and A431 cells (Sup1) does not necessarily mean that HEK cells have higher ERK activity.

      (iii) The assertion that high K+ is equivalent to changes in Vmem for ERK signaling would be supported if the YFP/CFP change from K+ addition is comparable to that induced by voltage clamp to the same potential. This would be particularly convincing if the experiment could be done with each of the 15 mM, 30 mM, and 145 mM conditions.

      The experimental system using fluorescent biosensor cannot measure absolute ERK activity and can only measure the amount of change after a specific stimulus compared to the period before the stimulus. In electrophysiology experiments, the pre-stimulation membrane potential was clamped to -80 mV, whereas in the perfusion experiment, the membrane potential was variable in individual cells (-35 to -15 mV). It is therefore difficult to compare the results of electrophysiology experiments with those of the perfusion system. Unlike ion channels, it is currently not possible to plot absolute ERK activity with respect to the overall membrane potential. In the present study, we therefore discussed the change rather than the absolute value of ERK activity.

      (6) Line 170: "ERK activity was reduced with a fast time course (within 1 minute) after repolarization to -80 mV." I don't see this in the data: in Fig. 3C, it looks like ERK remains elevated for > 10 min after the electrical stimulus has returned to -80 mV

      Thank you for pointing out that our description was confusing. We changed the sentence to clarify the point we wanted to make. It now reads as follows. “ERK activity showed signs of reduction within 1 minute after repolarization to -80 mV.” (line 174)

      Reviewer #3 (Public review):

      Summary:

      This paper demonstrates that membrane depolarization induces a small increase in cell entry into mitosis. Based on previous work from another lab, the authors propose that ERK activation might be involved. They show convincingly using a combination of assays that ERK is activated by membrane depolarization. They show this is Ca2+ independent and is a result of activation of the whole K-Ras/ERK cascade which results from changed dynamics of phosphatidylserine in the plasma membrane that activates K-Ras. Although the activation of the Ras/ERK pathway by membrane depolarization is not new, linking it to an increase in cell proliferation is novel.

      Strengths

      A major strength of the study is the use of different techniques - live imaging with ERK reporters, as well as Western blotting to demonstrate ERK activation as well as different methods for inducing membrane depolarization. They also use a number of different cell lines. Via Western blotting the authors are also able to show that the whole MAPK cascade is activated.

      Weaknesses

      A weakness of the study is the data in Figure 1 showing that membrane depolarization results in an increase of cells entering mitosis. There are very few cells entering mitosis in their sample in any condition. This should be done with many more cells to increase confidence in the results.

      We apologize that that description was not clear. Due to the limited number of conditions that can be conducted as a single experiment, we always included control condition (i.e. 5K) and performed normalization by comparing with the control condition of the initial 1.5 hrs. Data were from 100-900 mitotic cell counts within 6hr of the imaging time window. We re-wrote the figure legend (Fig1) and the main text.

      The study also lacks a mechanistic link between ERK activation by membrane depolarization and increased cell proliferation.

      The present study focused on the link between membrane potential and the ERK activity; the mechanistic link between ERK activity and cell proliferation is beyond the scope of the present study. This important topic will be pursued further in subsequent studies.

      The authors did achieve their aims with the caveat that the cell proliferation results could be strengthened. The results for the most part support the conclusions.

      This work suggests that alterations in membrane potential may have more physiological functions than action potential in the neural system as it has an effect on intracellular signalling and potentially cell proliferation.

      Reviewer #1 (Recommendations for the authors):

      minor typo:

      ERK activity has voltage-dependency with the physiological rang of membrane potential should be "range"

      Corrected

      Reviewer #2 (Recommendations for the authors):

      Small points:

      Line 82: rang -> range

      Corrected

      Line 102: ". they were stimulated" -> ". The cells were stimulated"

      Corrected

      Figs. 2C, 2D show exactly the same data points and the same information. Please cut one of these figures.

      We deleted 2C and added the information in 2D and made new Fig.2C.

      For all figs: Please indicate # of cells and # of independent dishes used in each experiment, and make clear whether individual data-points correspond to cells, dishes, or some other unit of measure.

      We added the information in figure legends.

      Reviewer #3 (Recommendations for the authors):

      The authors should repeat the cell proliferation experiments with more cells to strengthen the data. They could also use alternative assays like phosphorylated histone H3 staining for cells in M phase, that might to easier to quantitate.

      We repeated the experiment and Fig.1 was replaced with the new Fig.1

      The authors should investigate how the upregulation of ERK is driving cells into mitosis. At what point in the cell cycle is activated ERK induced by membrane depolarization having the effect. Is it entry into mitosis or earlier in the cell cycle?

      The cells were incubated with a high K+ solution 8-9 hr after G1 release, which is supposed to correspond to G2. These data suggest that mitotic activity is stimulated when ERK is activated at G2. However, we lack conclusive data at present to show the consequence of ERK activation during G2. We therefore cannot pinpoint the stage of cell cycle where depolarization-activated ERK exerts its effect.

      The authors refer a lot to the work of Zhou et al 2015 throughout the paper. This is not necessary and is a bit distracting.

      We deleted several sentence from the manuscript.

    5. eLife Assessment

      This useful paper presents evidence from several experimental approaches that suggest that changes in membrane potential directly affect ERK signaling to regulate cell division. This result is relevant because it supports an ion channel-independent pathway by which changes in membrane voltage can affect cell growth. The reviewers point out that while some experimental results and interpretations are compelling, the strength of evidence is still incomplete and changes to the manuscript are needed to rule out other possible interpretations of the data.

    1. eLife Assessment

      This is a fundamental study providing molecular insight into how cross-talk between histone modifications regulates the histone H3K36 methyltransferase SETD2. The manuscript contains excellent quality data, and the conclusions are convincing and justified. This work will be of interest to many biochemists working in the field of chromatin biology and epigenetics.

    2. Reviewer #1 (Public review):

      Summary:

      In this manuscript, Mack and colleagues investigate the role of posttranslational modifications, including lysine acetylation and ubiquitination, in methyltransferase activity of SETD2 and show that this enzyme functions as a tumor suppressor in a KRASG12C-driven lung adenocarcinoma. In contrast to H3K36me2-specific oncogenic methyltransferases, the deletion of SETD2, which is capable of H3K36 trimethylation, increases lethality in a KRASG12C-driven lung adenocarcinoma mouse tumor model. In vitro, the authors demonstrate that polyacetylation of histone H3, particularly of H3K27, H3K14 and H3K23, promotes the catalytic activity of SETD2, whereas ubiquitination of H2A and H2B has no effect.

      Strengths:

      Overall, this is a well-designed study that addresses an important biological question regarding the functioning of the essential chromatin component. The manuscript contains excellent quality data, and the conclusions are convincing and justified. This work will be of interest to many biochemists working in the field of chromatin biology and epigenetics.

      Comments on revisions:

      All previous comments are well addressed, and I enthusiastically support publication.

    3. Reviewer #2 (Public review):

      Summary:

      Human histone H3K36 methyltransferase Setd2 has been previously shown to be a tumor suppressor in lung and pancreatic cancer. In this manuscript by Mack et al., the authors first use a mouse KRASG12D-driven lung cancer model to confirm in vivo that Setd2 depletion exacerbates tumorigenesis. They then investigate the enzymatic regulation of the Setd2 SET domain in vitro, demonstrating that H2A, H3, or H4 acetylation stimulates Setd2-SET activity, with specific enhancement by mono-acetylation at H3K14ac or H3K27ac. In contrast, histone ubiquitination has no effect. The authors propose that H3K27ac may regulate Setd2-SET activity by facilitating its binding to nucleosomes. This work provides insight into how cross-talk between histone modifications regulates Setd2 function.

      Comments on revisions:

      (1) Regarding New Figure 2F lane 1, please reference PMID: 33972509 Fig 4D bottom. Setd2-SET is a well-known robust K36 trimethylase. Why, under the authors' conditions, do WT nucleosomes show a significant amount of K36me1 and K36me2 accumulation, whereas K36me3 is not as pronounced? As a comparison, the authors should also report the evidence for the efficiency of each chemical modification that generates K36 methylation mimic.

      (2) The bottom panel of Figure 2B does not match the top one; the number of repeats should be indicated in the figure legends.

      (3) In Figure 4E, the differences between Setd2-bound WT and acetylated nucleosomes are minimal, as judged by both the decreasing trend of unbound nucleosomes and the increasing trend of bound fractions. This experiment needs to be quantified based on multiple repeats.

    4. Author response:

      The following is the authors’ response to the original reviews.

      Reviewer #1 (Public review):

      (1) Labels should be added in the Figures and should be uniform across all Figures (some are distorted).

      We thank the Reviewer for pointing out this issue. As requested, labels have been edited to ensure they are legible and are consistent in font, size, and style.  

      Reviewer #2 (Public review):

      (1) As for Figure 2F, Setd2-SET activity on WT rNuc (H3) appears to be significantly lower compared to what is extensively reported in the literature. This is particularly puzzling given that Figure 2B suggests that using 3H-SAM, H3-nuc are much better substrates than K36me1, whereas in Figure 3F, rH3 is weaker than K36me1. It is recommended for the authors to perform additional experimental repeats and include a quantitative analysis to ensure the consistency and reliability of these findings.  

      We appreciate the Reviewer’s points. We respectfully suggest that these comments may reflect potential confusion around interpreting how different assays detect in vitro methylation, what data can and cannot be compared, and the nature of the different substrates used. 

      With respect to point 1 (Western signal significantly lower compared to extensive literature): To the best of our knowledge, it would be extremely challenging to make a quantitative argument comparing the strength of the Western signal in Figure 2F with results reported in the literature. Specifically, comparing our results with previous studies would require (1) all the studies to have used the exact same antibodies as antibody signal intensities vary depending on the specific activity and selectively of a particular antibody and even its lot number, (2) similar in vitro methylation reaction condition, (3) the same type of recombinant nucleosomes used, and so on. Further, given that these are Western blots, we do not understand how one could interpret an absolute activity level. In the figure, all we can conclude is that in in vitro methylation reactions, our recombinant SETD2 protein methylates rNucs to generate mono-, di-, and tri-methylation at K36 (using vetted antibodies (see Fig. 2e)). If there is a specific paper within the extensive literature that the Reviewer highlights, we could look more into the details of why the signals are different (our guess is that any difference would largely be due to the use of different antibodies). We add that it might be challenging to find a similar experiment performed in the literature; we are not aware of a similar experiment. 

      With respect to comparing Figure 2B and 2F: We do not understand how one can meaningfully compare incorporation of radiolabeled SAM to antibody-based detection on film using an antibody against specific methyl states. In particular, regarding the question regarding comparing rH3 vs H3K36me1 nucleosomes, we point out that in using recombinant nucleosomes installed with native modifications (e.g. H3K36me1), in which the entire population of the starting material is mono-methylated, then naturally the Western signal with an anti-H3K36me1 antibody will be strong. In Fig. 2b, the assay is incorporation of radiolabeled methyl, which is added to the preexiting mono-methylated substrate. In other words, the results are entirely consistent if one understands how the methylation reactions were performed, how methylation was detected, and the nature of the reagents.

      (2) The additional bands observed in Figure 4B, which appear to be H4, should be accompanied by quantification of the intensity of the H3 bands to better assess K36me3 activity. Additionally, the quantification presented in Figure 4C for SAH does not seem accurate as it potentially includes non-specific methylation activity, likely from H4. This needs to be addressed for clarity and accuracy. 

      We thank the reviewer for this comment. The additional bands observed in Figure 4B represent degradation products of histone H3, not H4 methylation. This is commonly seen in in vitro reactions using recombinant nucleosomes, where partial proteolysis of H3 can occur under the assay conditions.  

      (3) In Figure 4E, the differences between bound and unbound substrates are not sufficiently pronounced. Given the modest differences observed, authors might want to consider repeating the assay with sufficient replicates to ensure the results are statistically robust.

      In Figure 4E, we observe a clear difference between the bound and unbound substrate. To aid interpretation, we have clarified in the figure where the bound complex migrates on the gel, while the unbound nucleosomes migrate at the bottom of the gel. The differences are indeed subtle, which we highlight in the text.  

      (4) Regarding labeling, there are multiple issues that need correction: In the depiction of Epicypher's dNuc, it is crucial to clearly mark H2B as the upper band, rather than ambiguously labeling H2A/H2B together when two distinct bands are evident. In Figure 3B and D, the histones appear to be mislabeled, and the band corresponding to H4 has been cut off. It would be beneficial to refer to Figure 3E for correct labeling to maintain consistency and accuracy across figures. 

      Thank you for pointing this out. To avoid any confusion, we have delineated the H2B and H2A markers and indicate the band corresponding to H4.

      (5) There are issues with the image quality in some blots; for instance, Figure 2EF and Figure 2D exhibit excessive contrast and pixelation, respectively. These issues could potentially obscure or misrepresent the data, and thus, adjustments in image processing are recommended to provide clearer, more accurate representations. 

      Contrast adjustments were applied uniformly across each entire image and were not used to modify any specific region of the blot. We have corrected the issue of increased pixelation in Figure 2D. 

      (6) The authors are recommended to provide detailed descriptions of the materials used, including catalog numbers and specific products, to allow for reproducibility and verification of experimental conditions. 

      We have added the missing product specifications and catalog numbers to ensure clarity and reproducibility of the experiments.

      (7) The identification of Setd2 as a tumor suppressor in KrasG12C-driven LUAD is a significant finding. However, the discussion on how this discovery could inspire future therapeutic approaches needs to be more balanced. The current discussion (Page 10) around the potential use of inhibitors is somewhat confusing and could benefit from a clearer explanation of how Setd2's role could be targeted therapeutically. It would be beneficial for the authors to explore both current and potential future strategies in a more structured manner, perhaps by delineating between direct inhibitors, pathway modulators, and other therapeutic modalities. 

      SETD2 is a tumor suppressor in lung cancer (as we show here and many others have clearly established in the literature) and thus we would recommend avoiding a SETD2 inhibitor to treat solid tumors, as it could have a very much unwanted affect.  Our discussion addresses a different point regarding the relative importance of the enzymatic activity versus other, nonenzymatic functions of SETD2. We believe that a detailed exploration of the therapeutic potential of inhibiting SETD2 would be better suited in a review or a more therapy-focused manuscript.

    1. eLife Assessment

      This study identifies novel approaches to improving transgene expression in the injured mammalian myocardium through a combination of a tissue regeneration enhancer element and engineered AAVs - specifically, a liver-detargeting capsid, AAV.cc84, and an in vivo library screen-selected AAV-IR41. The evidence is convincing, and the AAV vectors are of fundamental value to the field of cardiac gene therapy. Future research exploring how to combine the features of AAV.cc84 and AAV-IR41 could yield an even more promising vector for therapeutic use.

    2. Reviewer #1 (Public review):

      In this manuscript, Wolfson and co-authors demonstrate a combination of an injury-specific enhancer and engineered AAV that enhances transgene expression in injured myocardium. The authors characterize spatiotemporal dynamics of TREE-directed AAV expression in the injured heart using a non-invasive longitudinal monitoring system. They show that transgene expression is drastically increased 3 days post-injury, driven by 2ankrd1a. They reported a liver-detargeted capsid, AAV cc.84, with decreased viral entry into the liver while maintaining TREE transgene specificity. They further identified the IR41 serotype with enhanced transgene expression in injured myocardium from AAV library screening. This is an interesting study that optimizes the potential application of TREE delivery for cardiac repair.

      Comments on revisions:

      The authors are responsive and have addressed my concerns.

    3. Reviewer #2 (Public review):

      Summary:

      In this manuscript by Wolfson et al., various adeno-associated viruses (AAVs) were delivered to mice to assess the cardiac-specificity, injury border-zone cardiomyocyte transduction rate, and temporal dynamics in the goal to find better AAVs for gene therapies targeting the heart. The authors delivered tissue regeneration enhancer elements (TREEs) controlling luciferase expression and used IVIS imaging to examine transduction in the heart and other organs. They found that luciferase expression increased in the first week after injury when using AAV9-TREE-Hsp68 promoter, waning to baseline levels by 7 weeks. However, AAV9 vectors transduced the liver, which was significantly reduced by using an AAV.cc84 liver de-targeting capsid. The authors then performed in vivo screening of AAV9 capsids and found AAV-IR41 to preferentially transduce injured myocardium when compared to AAV9. Finally, the authors combined TREEs with AAV-IR41 to show improved luciferase expression compared to AAV9-TREE at 7, 14 and 21 days after injury.

      Overall, this manuscript provides insights into TREE expression dynamics when paired with various heart-targeting capsids, which can be useful for researchers studying ischemic injury of murine hearts. While the authors have shown the success of using AAV9-TREEs in porcine hearts, it is unknown whether the expression dynamics would be similar in pigs or humans, as mentioned in the limitations.

      Strengths:

      Important contribution to the AAV gene therapy literature.

      Comments on revised version:

      My concerns have been adequately addressed.

    4. Reviewer #3 (Public review):

      Summary:

      The tissue regeneration enhancer elements (TREEs) identified in zebrafish have been shown to drive injury-activated temporal-spatial gene expression in mice and large animals. These findings increase the translational potential of findings in zebrafish to mammals. In this manuscript, the authors tested TREEs in combination with different adeno-associated viral (AAV) vectors using in vivo luciferase bioluminescent imaging that allows for longitudinal tracking. The TREE-driven luciferase delivered by a liver de-targeted AAV.cc84 decreased off-target transduction in liver. They further screened an AAV library to identify capsid variants that display enhanced transduction for infarcted myocardium post ischemia reperfusion and myocardial infarction. A new capsid variant, AAV.IR41, was found to show increased transduction post I/R and MI.

      Strengths:

      The authors injected AAV-cargo several days after ischemia/reperfusion (I/R) injury as a clinically relevant approach. Overall, this study is significant in that it identifies new AAV vectors that can be used to deliver promising genes as potential new gene therapies in the future. The manuscript is well-written and the data are also of high quality.

      Weaknesses:

      The authors have addressed my previous concerns.

    5. Author response:

      The following is the authors’ response to the original reviews.

      Reviewer #1 (Public review):

      In this manuscript, Wolfson and co-authors demonstrate a combination of an injury-specific enhancer and engineered AAV that enhances transgene expression in injured myocardium. The authors characterize spatiotemporal dynamics of TREE-directed AAV expression in the injured heart using a non-invasive longitudinal monitoring system. They show that transgene expression is drastically increased 3 days post-injury, driven by 2ankrd1a. They reported a liver-detargeted capsid, AAV cc.84, with decreased viral entry into the liver while maintaining TREE transgene specificity. They further identified the IR41 serotype with enhanced transgene expression in injured myocardium from AAV library screening. This is an interesting study that optimizes the potential application of TREE delivery for cardiac repair. However, several concerns were raised prior to publication:

      Major Concerns:

      (1) In Figure 1, the authors demonstrated that 2andkrd1aEN is not responsive to sham injury after AAV delivery, but Figure 3 shows a strong response to sham when AAV is delivered after injury. The authors do not provide an explanation for this observation.

      This discrepancy is due to the timing of AAV delivery. In Figure 1, AAV was delivered 60 days prior to IVIS imaging and cardiac injury, allowing time for the baseline level of AAV transgene expression to reach a plateau. From this baseline level, we were able to measure fold change in luminescence signal before and after cardiac injury. In Figure 3, AAV was delivered 4 days after cardiac injury. Luminescence in the heart was measured 3 days later (day 7), when the baseline of AAV transgene expression is still building. The data from Figure 1C-D inform us that the 2ankrd1aEN response to cardiac injury peaks within the first week and returns to baseline levels after 5-7 weeks. In Figure 3E, we show that 2ankrd2aEN provides a baseline level of expression that is present in sham hearts and reaches its plateau after 6 weeks. In contrast, I/R injured hearts show enhanced expression in the first 3-4 weeks, corresponding with the dynamics of 2ankrd1aEN’s response to injury observed in Figure 1C. We have now included a phrase in the revised manuscript on p. 7, paragraph 1 to clarify.

      (2) In Figure 4, a higher GFP signal is observed in all areas of the heart of the IR41-treated mouse compared to AAV9. The authors should compare GFP expression between AAV9 and IR41 in uninjured hearts and provide insights into enhanced cardiac tropism to confirm that IR41 is MI injury enriched, not Sham as well.

      We sought to address this question with the experiments presented in Figure 5. We treated sham mice with AAV9 and IR41 containing 2ankrd1aEN. Figure 5D showed IR41 delivered more vector genomes to the sham heart on average, though not with a p-value less than 0.05 compared with AAV9. In Supplemental Figure 5B, IR41 also provided higher luminescence at day 7 post-sham but was comparable at day 14 and day 21. These data suggest IR41 might increase heart tropism in healthy hearts, but IR41’s effect is most dramatic when delivered to injured hearts, where cardiac vector genomes are highest (Figure 5D). We have now included a sentence in the revised manuscript on p. 8, paragraph 2 to clarify.

      (3) The authors should clarify which model is being used between myocardial infarction (MI) and Ischemia-reperfusion (IR) throughout the figures, as the experimental schemes and figure legends did not match with each other (MI or IR in Figure 1A, 1D, 3A, and 3E). Both models cause different types of injuries. The authors should explain the difference in TREE expression in both models.

      We have revised the figures to specify the model, where I/R or MI is used.

      (4) In Figure 2, the authors use REN instead of 2ankrd1aEN to demonstrate liver-detargeting using AAV cc.84. Is there a specific reason?

      Our data in Figure 1 informed us that off-target liver expression is more specifically an issue for REN compared to 2ankrd1aEN. Baseline levels of luminescence in the heart could not be as clearly marked due to off-target expression in the liver, which was showcased in Figure 2B with AAV9 delivery to sham mice. As discussed above, 2ankrd1aEN provided stronger baseline levels of expression of the heart which could be more clearly marked in IVIS images for tracking fold changes over time. For these reasons, we sought to explore how incorporation of the AAV.cc84 capsid could be utilized to minimize off-target liver expression. We have now included a sentence in the revised manuscript on p. 5, paragraph 3 to clarify.

      Reviewer #2 (Public review):

      In this manuscript by Wolfson et al., various adeno-associated viruses (AAVs) were delivered to mice to assess the cardiac-specificity, injury border-zone cardiomyocyte transduction rate, and temporal dynamics, with the goal of finding better AAVs for gene therapies targeting the heart. The authors delivered tissue regeneration enhancer elements (TREEs) controlling luciferase expression and used IVIS imaging to examine transduction in the heart and other organs. They found that luciferase expression increased in the first week after injury when using AAV9-TREE-Hsp68 promoter, waning to baseline levels by 7 weeks. However, AAV9 vectors transduced the liver, which was significantly reduced by using an AAV.cc84 liver de-targeting capsid. The authors then performed in vivo screening of AAV9 capsids and found AAV-IR41 to preferentially transduce injured myocardium when compared to AAV9. Finally, the authors combined TREEs with AAV-IR41 to show improved luciferase expression compared to AAV9-TREE at 7, 14, and 21 days after injury.

      Overall, this manuscript provides insights into TREE expression dynamics when paired with various heart-targeting capsids, which can be useful for researchers studying ischemic injury of murine hearts. While the authors have shown the success of using AAV9-TREEs in porcine hearts, it is unknown whether the expression dynamics would be similar in pigs or humans, as mentioned in the limitations.

      The following questions and concerns can be addressed to improve the manuscript:

      (1) From the IVIS data, it seems that the Hsp68 promoter might not be "normally silent in mouse tissues," specifically in the liver (Figure S1B). Are there any other promoters that can be combined with TREEs to induce cardiac-injury specific expression while minimizing liver expression? This could simplify capsid design to focus on delivery to injured areas.

      Indeed we found the Hsp68 promoter does provide low levels of baseline expression, especially in the liver of mice. The Hsp68 promoter was initially chosen due to its permissive nature allowing for assessment of expression directed by TREEs. Many or most groups use the Hsp68 promoter for enhancer tests in mice, but we agree that other permissive promoters might have lower baseline levels of expression and might have the benefit of smaller size. We have not rigorously tested other permissive promoters in our experiments.

      (2) Why is it that AAV9-TREE-Hsp68-Luc wane in expression (Figure 1C and 1D), whereas AAV.cc84-TREE-Hsp68-Luc expresses stably for over 2 months (3E)? This has important implications for the goal of transience in gene delivery.

      Please see our response to reviewer 1’s comment #1 above.

      (3) AAV-IR41 was found to transduce cardiomyocytes in the injured zone. However, this capsid also shows a very strong off-target liver expression. From a capsid design perspective, is it possible to combine AAV-cc84 and AAV-IR41?

      This approach is in theory possible as these epitopes are structurally distinct. However, since the mechanism (receptor usage) is currently unknown, it would not be possible to predict whether the properties are mutually exclusive. Further, we would need to ensure that combining modifications does not impact vector yield. We can explore such features with next generation candidates as we continue to improve the platform. We have now included a sentence in the revised manuscript on p. 9, paragraph 3, mentioning the possibility of combining the two capsid mutations.

      (4) It would be helpful to see immunostaining for the various time points in Figure 5. Is it possible to use an anti-luciferase antibody (or AAV-TREE-Hsp68-eGFP) to compare the two TREE capsids?

      We were not able to do immunostaining of luciferase expression, because the biopsied hearts were used to quantify vector genomes via qPCR. We have previously reported results of immunostaining of EGFP expression directed by 2ankrd1aEN in I/R-injured mouse hearts (Yan et al., 2023), which we expect to match the expression seen in these experiments.

      Reviewer #3 (Public review):

      Summary:

      The tissue regeneration enhancer elements (TREEs) identified in zebrafish have been shown to drive injury-activated temporal-spatial gene expression in mice and large animals. These findings increase the translational potential of findings in zebrafish to mammals. In this manuscript, the authors tested TREEs in combination with different adeno-associated viral (AAV) vectors using in vivo luciferase bioluminescent imaging that allows for longitudinal tracking. The TREE-driven luciferase delivered by a liver de-targeted AAV.cc84 decreased off-target transduction in the liver. They further screened an AAV library to identify capsid variants that display enhanced transduction for myocardium post-myocardial infarction. A new capsid variant, AAV.IR41, was found to show increased transduction at the infarct border zones.

      Strengths:

      The authors injected AAV-cargo several days after ischemia/reperfusion (I/R) injury as a clinically relevant approach. Overall, this study is significant in that it identifies new AAV vectors for potential new gene therapies in the future. The manuscript is well-written, and their data are also of high quality.

      Weaknesses:

      The authors might be using MI (myocardial infarction) and I/R injury interchangeably in their text and labels. For instance, "We systemically transduced mice at 4 days after permanent left coronary artery ligation with either AAV9 or IR41 harboring a 2ankrd1aEN-Hsp68::fLuc transgene. IVIS imaging revealed higher expression levels in animals transduced with IR41 compared to AAV9, in both sham and I/R groups (Fig. 5A)". They should keep it consistent. There is also no description for the MI model.

      We have adjusted figure labels and main text to ensure the injury model is described correctly.

      We have also addressed all additional Recommendations for the authors, which requested minor modifications to figures like error bars and image annotation.

    1. eLife Assessment

      This important study provides a conceptual advance in our understanding of how membrane geometry modulates the balance between specific and non-specific molecular interactions, reversing multiphase morphologies in postsynaptic protein assemblies. Using a mesoscale simulation framework grounded in experimental binding affinities, the authors successfully recapitulate key experimental observations in both solution and membrane-associated systems, providing novel mechanistic insight into how spatial constraints regulate postsynaptic condensate organization. The conclusions are supported by solid strength of evidence and the findings are of broad significance for both computational and experimental biologists

    2. Reviewer #2 (Public review):

      This is a timely and insightful study aiming to explore the general physical principles for the sub-compartmentalization--or lack thereof--in the phase separation processes underlying the assembly of postsynaptic densities (PSDs), especially the markedly different organizations in three-dimensional (3D) droplets on one hand and the two-dimensional (2D) condensates associated with a cellular membrane on the other. Simulation of a highly simplified model (one bead per protein domain) is apparently carefully executed. Based on a thorough consideration of various control cases, the main conclusion regarding the trade-off between repulsive excluded volume interactions and attractive interactions among protein domains in determining the structures of 3D vs 2D model PSD condensates is quite convincing. The novel results in this manuscript should be published.

      Comment on the revised manuscript:

      The authors have adequately addressed all my previous concerns. The manuscript is now much improved, ready for publication as a version of record.

    3. Reviewer #3 (Public review):

      Summary:

      In this work, Yamada, Brandani and Takada have developed a mesoscopic model of the interacting proteins in the postsynaptic density. They have performed simulations, based on this model and using the software ReaDDy, to study the phase separation in this system in 2D (on the membrane) and 3D (in the bulk). They have carefully investigated the reasons behind different morphologies observed in each case, and have looked at differences in valency, specific/non-specific interactions and interfacial tension.

      Strengths:

      The simulation model is developed very carefully, with strong reliance on binding valency and geometry, experimentally measured affinities, and physical considerations like the hydrodynamic radii. The presented analyses are also thorough, and great effort has been put into investigating different scenarios that might explain the observed effects.

      Weaknesses:

      The biggest weakness of the study, in my opinion, has been a lack of more in-depth and quantitative physical insights about phase separation theories. In the revised version, the authors have added text to point the interested reader to the respective theories, and have included a qualitative assessment of their findings in the light of said theories. This better positions their discussion. I still believe the role of entropic effects need more attention, which can be the subject of future studies.

      The authors have revised their Introduction and added text to the Discussion, to enrich their view on the attractive and repulsive forces as well as mixing entropy. This version better covers the physics of phase separation.

      I appreciate the added discussion about the different diffusive behavior in the membrane in contrast to the bulk (i.e. the Saffman-Delbrück model). This paves the way for future studies, including realistic kinetics of the studied system.

    4. Author response:

      The following is the authors’ response to the original reviews.

      Reviewer #1 (Public review):

      Summary:

      This study uses mesoscale simulations to investigate how membrane geometry regulates the multiphase organization of postsynaptic condensates. It reveals that dimensionality shifts the balance between specific and non-specific interactions, thereby reversing domain morphology observed in vitro versus in vivo.

      Strengths:

      The model is grounded in experimental binding affinities, reproduces key experimental observations in 3D and 2D contexts, and offers mechanistic insight into how geometry and molecular features drive phase behavior.

      Weaknesses:

      The model omits other synaptic components that may influence domain organization and does not extensively explore parameter sensitivity or broader physiological variability.

      We thank the reviewer for his/her time and effort to our manuscript. We agree with the point that the contribution of other synaptic components should be addressed. We have included a discussion of the effects of environmental factors such as protein and ion concentrations, as well as other omitted postsynaptic components (SAPAP, Shank, and Homer) on phase morphology. In the middle of the 2<sup>nd</sup> paragraph of Discussion, we added: 

      “While these in vivo results contain additional scaffold and cytoskeletal elements omitted in our model, such as SAPAP, Shank and Homer, nearly all proteins in the middle and lower layers of the PSD associate directly or indirectly with PSD-95 in the upper PSD layer. Consequently, it is probable that other scaffold proteins contribute to the mobility of AMPAR-containing and NMDAR-containing nanodomains indistinguishably. They may increase the stability of the AMPAR and NMDAR clusters but are unlikely to have a distinct effect to reverse the phase-separation phenomenon.”

      Also, as the reviewer pointed out, we agree with that physiological factors such as ion concentration may influence the phase. However, conditions such as ion concentration are implicitly implemented as the specific and nonspecific interactions in this model, which makes it difficult to estimate the effect of each physiological condition individually. We added the variability potential of physiological conditions to the discussion section as a limitation of this model. To investigate parameter sensitivity in more detail, we performed additional MD simulations with weakened membrane constraints to account for the behavior between 3D and 2D. We added:

      “First, our results did not provide direct insights to physiological conditions, such as ion concentrations. Since such factors are implicitly implemented in our model, it is difficult to estimate these effects individually. This suggests the need for future implementation of environmental factors and validation under a broader range of in vivo-like settings.”

      Reviewer #2 (Public review):

      This is a timely and insightful study aiming to explore the general physical principles for the sub-compartmentalization--or lack thereof--in the phase separation processes underlying the assembly of postsynaptic densities (PSDs), especially the markedly different organizations in three-dimensional (3D) droplets on one hand and the twodimensional (2D) condensates associated with a cellular membrane on the other. Simulation of a highly simplified model (one bead per protein domain) is carefully executed. Based on a thorough consideration of various control cases, the main conclusion regarding the trade-off between repulsive excluded volume interactions and attractive interactions among protein domains in determining the structures of 3D vs 2D model PSD condensates is quite convincing. The results in this manuscript are novel; however, as it stands, there is substantial room for improvement in the presentation of the background and the findings of this work. In particular,

      (i) conceptual connections with prior works should be better discussed 

      (ii) essential details of the model should be clarified, and

      (iii) the generality and limitations of the authors' approach should be better delineated.

      We appreciate the reviewer for his/her time and effort on our manuscript and for encouraging comments and helpful suggestions. We answered every technical comment the reviewer mentioned below.

      Specifically, the following items should be addressed (with the additional references mentioned below cited and discussed):

      (1) Excluded volume effects are referred to throughout the text by various terms and descriptions such as "repulsive force according to the volume" (e.g., in the Introduction), "nonspecific volume interaction", and "volume effects" in this manuscript. This is somewhat curious and not conducive to clarity, because these terms have alternate or connotations of alternate meanings (e.g., in biomolecular modeling, repulsive interactions usually refer to those with longer spatial ranges, such as that between like charges). It will be much clearer if the authors simply refer to excluded volume interactions as excluded volume interactions (or effects).  

      Thank you for this comment. We have substituted the words “excluded volume interactions” for words of similar meaning. However, we have left the expression of “non-specific interactions” as they are referring to explicit interactions that are given as force fields in the model, rather than in the general meaning of excluded volume effect.

      (2) In as much as the impact of excluded volume effects on subcompartmentalization of condensates ("multiple phases" in the authors' terminology), it has been demonstrated by both coarse-grained molecular dynamics and field-theoretic simulations that excluded volume is conducive to demixing of molecular species in condensates [Pal et al., Phys Rev E 103:042406 (2021); see especially Figures 4-5 of this reference]. This prior work bears directly on the authors' observation. Its relationship with the present work should be discussed.  

      We appreciate the reviewer’s insightful comment. We have now included a more detailed discussion on excluded volume effect in the revised manuscript, which provides important context for our findings. Furthermore, we have cited the references to support and enrich the discussion, as recommended.

      (3)  In the present model setup, activation of the CaMKII kinase affects only its binding to GluN2Bc. This approach is reasonable and leads to model predictions that are essentially consistent with the experiment. More broadly, however, do the authors expect activation of the CaMKII kinase to lead to phosphorylation of some of the molecular species involved with PSDs? This may be of interest since biomolecular condensates are known to be modulated by phosphorylation [Kim et al., Science 365:825-829 (2019); Lin et al, eLife 13:RP100284 (2025)].  

      We agree that phosphorylation effect on phase separation is an important and interesting aspect to consider. Some experimental results have shown that activation of CaMKII can lead to phosphorylation of various proteins and make PSD condensate more stable by altering their interactions. We included the sentence below in limitations:

      “In this context, we also do not explicitly account for downstream phosphorylation events. Although such proteins are not included in the current components, they will regulate PSD-95, affecting its binding valency, or diffusion coefficient. This is a subject worthy of future research.”

      (4) The forcefield for confinement of AMPAR/TARP and NMDAR/GluN2Bc to 2D should be specified in the main text. Have the authors explored the sensitivity of their 2D findings on the strength of this confinement?

      We thank the reviewer for the helpful recommendation. We have revised the manuscript to include membrane-mimicking potential on main text. Furthermore, we also think that exploring the shape of the 3D/2D condensate phase due to the sensitivity of confinement is a very interesting point. We have additionally performed MD simulations with smaller/larger membrane constraints and included the results in supporting information as Figure S5. The following parts are added:

      “We further attempted to mimic intermediate conditions between 3D and 2D systems in two different manners. First, we applied a weaker membrane constraint in 2D system. Even when the strength of membrane constraints is reduced by a factor of 1000, NMDARs are located on the inner side when the CaMKII was active, as well as the result in 2D system (Fig.S5ABC). Second, to weaken further the effect of membrane constraints, we artificially altered the membrane thickness from 5 nm to 50 nm, in addition to reducing the membrane constraints by 1000. As a result, NMDAR clusters move to the bottom and surround AMPAR (Fig.S5DEF). In this artificial intermediate condition, both states in which the NMDARs are outside (corresponding to 3D) and in which the NMDARs are inside (corresponding to 2D) are observed, depending on the strength of the membrane constraint.”

      (5)  Some of the labels in Figure 1 are confusing. In Figure 1A, the structure labeled as AMPAR has the same shape as the structure labeled as TARP in Figure 1B, but TARP is labeled as one of the smaller structures (like small legs) in the lower part of AMPAR in Figure 1A. Does the TARP in Figure 1B correspond to the small structures in the lower part of AMPAR? If so, this should be specified (and better indicated graphically), and in that case, it would be better not to use the same structural drawing for the overall structure and a substructure. The same issue is seen for NMDAR in Figure 1A and GluN2Bc in Figure 1B. 

      (6) In addition to clarifying Figure 1, the authors should clarify the usage of AMPAR vs TARP and NMDAR vs GluN2Bc in other parts of the text as well.

      (7) The physics of the authors' model will be much clearer if they provide an easily accessible graphical description of the relative interaction strengths between different domain-representing spheres (beads) in their model. For this purpose, a representation similar to that given by Feric et al., Cell 165:1686-1697 (2016) (especially Figure 6B in this reference) of the pairwise interactions among the beads in the authors' model should be provided as an additional main-text figure. Different interaction schemes corresponding to inactive and activated CAMKII should be given. In this way, the general principles (beyond the PSD system) governing 3D vs 2D multiple-component condensate organization can be made much more apparent.  \

      We sincerely appreciate the reviewer’s comments. According to the recommendation, we have changed the diagram in Figure 1B into interaction matrix with each mesoscale molecular representation and the expression in main text to be clearer about AMPAR and TARP, and about the relationship between NMDAR and GluN2Bc. Former diagram of the pairs of specific interaction is moved to supplementary figure. 

      (8) Can the authors' rationalization of the observed difference between 3D and 2D model PSD condensates be captured by an intuitive appreciation of the restriction on favorable interactions by steric hindrance and the reduction in interaction cooperativity in 2D vs 3D?  

      We thank the reviewer for the comment. As pointed out, the multiphase morphology change observed in this study can be attributed to a decrease in coordination number in 2D compared to 3D. We have included the physicochemical rationalization in the discussion.  

      (9) In the authors' model, the propensity to form 2D condensates is quite weak. Is this prediction consistent with the experiment? Real PSDs do form 2D condensates around synapses.  

      We are grateful to the reviewer for highlighting this important point. We agree with that the real PSD forms 3D condensates beneath the 2D membrane. Some lower PSD components under the membrane (i.e. SAPAP, Shank, and Homer) are omitted in our system, which may cause a weak condensation. To emphasize this, we have added the following sentence:

      “While these in vivo results contain additional scaffold and cytoskeletal elements omitted in our model, such as SAPAP, Shank and Homer, nearly all proteins in the middle and lower layers of the PSD associate directly or indirectly with PSD-95 in the upper PSD layer. Consequently, it is probable that other scaffold proteins contribute to the mobility of AMPAR-containing and NMDAR-containing nanodomains indistinguishably. They may increase the stability of the AMPAR and NMDAR clusters but are unlikely to have a distinct effect to reverse the phase-separation phenomenon.”

      However, we believe that the clusters formed on the 2D membrane are not a robust “phase” because they do not follow scaling law. In fact, in our previous study of PSD system with AMPAR(TARP)<sub>4</sub> and PSD-95, we have already reported that phase separation is less likely to occur in 2D than in 3D. The previous result suggests that phase separation on membrane may be difficult to achieve, which is consistent with the results of this study.

      (10) More theoretical context should be provided in the Introduction and/or Discussion by drawing connections to pertinent prior works on physical determinants of co-mixing and de-mixing in multiple-component condensates (e.g., amino acid sequence), such as Lin et al., New J Phys 19:115003 (2017) and Lin et al., Biochemistry 57:2499-2508 (2018). 

      (11) In the discussion of the physiological/neurological significance of PSD in the Introduction and/or Discussion, for general interest it is useful to point to a recently studied possible connection between the hydrostatic pressure-induced dissolution of model PSD and high-pressure neurological syndrome [Lin et al., Chem Eur J 26:11024-11031 (2020)].

      We thank the reviewer for the helpful recommendation. We have added the recommended references in each relevant part in introduction, respectively.

      (12) It is more accurate to use "perpendicular to the membrane" rather than "vertical" in the caption for Figure 3E and other such descriptions of the orientation of the CaMKII hexagonal plane in the text.

      We thank you for your comment. We replaced the word “vertical” with “perpendicular" in the main text and caption.

      Reviewer #3 (Public review):

      Summary:

      In this work, Yamada, Brandani, and Takada have developed a mesoscopic model of the interacting proteins in the postsynaptic density. They have performed simulations, based on this model and using the software ReaDDy, to study the phase separation in this system in 2D (on the membrane) and 3D (in the bulk). They have carefully investigated the reasons behind different morphologies observed in each case, and have looked at differences in valency, specific/non-specific interactions, and interfacial tension.

      Strengths:

      The simulation model is developed very carefully, with strong reliance on binding valency and geometry, experimentally measured affinities, and physical considerations like the hydrodynamic radii. The presented analyses are also thorough, and great effort has been put into investigating different scenarios that might explain the observed effects.

      Weaknesses:

      The biggest weakness of the study, in my opinion, has to do with a lack of more in-depth physical insight about phase separation. For example, the authors express surprise about similar interactions between components resulting in different phase separation in 2D and 3D. This is not surprising at all, as in 3D, higher coordination numbers and more available volume translate to lower free energy, which easily explains phase separation. The role of entropy is also significantly missing from the analyses. When interaction strengths are small, entropic effects play major roles. In the introduction, the authors present an oversimplified view of associative and segregative phase transitions based on the attractive and repulsive interactions, and I'm afraid that this view, in which all the observed morphologies should have clear pairwise enthalpic explanations, diffuses throughout the analysis. Meanwhile, I believe the authors correctly identify some relevant effects, where they consider specific/nonspecific interactions, or when they investigate the reduced valency of CaMKII in the 2D system.

      We thank the reviewer for the insightful and constructive comments. Regarding the difference in phase behavior between 2D and 3D systems, we appreciate the reviewer’s clarification that differences in coordination number and entropy in higher dimensions can account for the observed morphology of the phases. While it may be clear that entropy decreases due to the decrease of coordination number, our objective was to uncover how such an isotropic entropy reduction regulates the behavior of each phase driven by different interactions, which remains largely unknown. To emphasize this, we modified the introduction and have now included a discussion of the entropic contributions to phase behavior in both 2D and 3D systems, and we have made this clearer in the revised manuscript by referencing relevant theoretical frameworks. In the Discussion, we added the sentence below:

      “Generally, phase separation can be explained by the Flory-Huggins theory and its extensions: phase separation can be favored by the difference in the effective pairwise interactions in the same phase compared to those across different phases, and is disfavored by mixing entropy. The effective interactions contain various molecular interactions, including direct van der Waals and electrostatic interactions, hydrophobic interactions, and purely entropic macromolecular excluded volume interactions. For the latter, Asakura-Oosawa depletion force can drive the phase separation. Furthermore, the demixing effect was explicitly demonstrated in previous simulations and field theory (61). Importantly, we note that the effective pairwise interactions scale with the coordination number z. The coordination number is a clear and major difference between 3D and 2D systems. In 3D systems, large z allows both relatively strong few specific interactions and many weak non-specific interactions. While a single specific interaction is, by definition, stronger than a single non-specific interaction, contribution of the latter can have strong impact due to its large number. On the other hand, a smaller z in the membrane-bound 2D system limits the number of interactions. In case of limited competitive binding, specific interactions tend to be prioritized compared to non-specific ones. In fact, Fig. 3A clearly shows that number of specific interactions in 2D is similar to that in 3D, while that of non-specific interactions is dramatically reduced in 2D. In the current PSD system, CaMKII is characterized by large valency and large volume. In the 3D solution system, non-specific excluded volume interactions drive CaMKII to the outer phase, while this effect is largely reduced in 2D, resulting in the reversed multiphase.   

      Also, I sense some haste in comparing the findings with experimental observations. For example, the authors mention that "For the current four component PSD system, the product of concentrations of each molecule in the dilute phase is in good agreement with that of the experimental concentrations (Table S2)." But the data used here is the dilute phase, which is the remnant of a system prepared at very high concentrations and allowed to phase separate. The errors reported in Table S2 already cast doubt on this comparison. 

      We thank the reviewer for the insightful comment. In the validation process, we adjusted the parameters so that the number of molecules in dilute phase is consistent with the experimental lower limit of phase separation, based on the assumption that phase-separated dilute phase is the same concentration as the critical concentration. That is why we focus on comparing dilute phase concentration in Table S2. However, in our simulations, the number of protein molecules is relatively small since it is based on the average number per synapse spine. For example, there are only about 60 CaMKII molecules at most, and its presence in the dilute phase is highly sensitive to concentration, as the reviewer pointed out. This is one of the limitations, so we have added a description to the Limitations section. We added:

      “Second, parameter calibration contains some uncertainty. Previous in vitro study results used for parameter validation are at relatively high concentrations for phase separation, which may shift critical thresholds compared to that in in vivo environments. Also, since the number of molecules included in the model is small, the difference of a single molecule could result in a large error during this validation process.”

      Or while the 2D system is prepared via confining the particles to the vicinity of the membrane, the different diffusive behavior in the membrane, in contrast to the bulk (i.e., the Saffman-Delbrück model), is not considered. This would thus make it difficult to interpret the results of a coupled 2D/3D system and compare them to the actual system.

      We appreciate the reviewer’s helpful comment. We agree with that there is a concern that the Einstein-Stokes equation does not adequately reproduce the diffusion of membrane-embedded particles. We recalculated the diffusion coefficients for every membrane particle used in this model using the Saffman-Delbrück model and found that diffusion coefficients for receptor cores (AMPAR and NMDAR) were approximately three times larger. These values are still about ~10 times smaller than that of molecules diffusing under the cytoplasm. Additionally, since this study focuses on the morphology of the phase/cluster at the thermodynamic equilibrium, we think that the magnitude of the diffusion coefficient has little influence on the final structure of the cluster. However, we will incorporate the membrane-embedded diffusion as a future improvement item for better modelling and implementation. We added:

      “Third, we estimated all the diffusion coefficients from the Einstein-Stokes equation, which may oversimplify membrane-associated dynamics. Applying the Saffmann-Delbrück model to membrane-embedded particles would be desired although the resulting diffusion coefficients remain of the same order of magnitude. These limitations highlight the need for further research, yet they do not undermine the core significance of the present findings in advancing our understanding of multiphase morphologies.”

    1. eLife Assessment

      Kin selection and inclusive fitness have generated significant controversy. This paper reconsiders the general form of Hamilton's rule in which benefits and costs are defined as regression coefficients, with higher-order coefficients being added to accommodate non-linear interactions. The paper is a landmark contribution to the field with compelling, systematic analysis, giving clarity to long-standing debates.

    2. Joint Public Review:

      This manuscript reconsiders the "general form" of Hamilton's rule, in which "benefit" and "cost" are defined as regression coefficients. It points out that there is no reason to insist on Hamilton's rule of the form -c+br>0, and that, in fact, arbitrarily many terms (i.e. higher-order regression coefficients) can be added to Hamilton's rule to reflect nonlinear interactions. Furthermore, it argues that insisting on a rule of the form -c+br>0 can result in conditions that are true but meaningless and that statistical considerations should be employed to determine which form of Hamilton's rule is meaningful for a given dataset or model.

      Comments on latest version:

      The authors have provided a robust, valuable and detailed response to the previous reviews.

      Comments from Reviewer #1: I have nothing further to add.

      Comments from Reviewer #2: I appreciate the clarifications the author has made to the manuscript regarding (i) "sample covariance" terminology, (ii) the generality of the "generalized Price equation", and (iii) the distinction between the covariance and regression forms of the Price equation. I also appreciate that the ms now engages more deeply with some of the previous literature on regression-based Hamilton's rules (e.g. Smith et al., 2010; Rousset 2015). I feel these revisions make this contribution more valuable, and also more technically sound, since the term "sample covariance" is no longer used incorrectly.

      I also add that I agree with the substance of the authors' response to Reviewer #3. That is, the original submission was very clear that the regression-based Hamilton's rule is already completely general in the range of situations to which it applies, and that the added "generality" in the present ms refers to the variety of regression models that can be applied to these situations. In this way, the original ms already anticipates and addresses the criticism that Reviewer #3 raises.

      Reviewer #3 did not provide comments on the revised version.

    1. eLife Assessment

      The ratio of nuclei to cell volume is a well-controlled parameter in eukaryotic cells. This study now reports important findings that expand our understanding of the regulatory relationship between cell size and number of nuclei. The evidence supporting the conclusions is convincing obtained by applying appropriate and validated methodology in line with current state-of-the-art. The paper will be of broad interest for cell biologists and fungal biotechnologists seeking to understand mechanisms determining cell size and number of nuclei and why this knowledge might also be of importance for the production of enzymes and thus production strains not only of Aspergillus oryzae but also other industrially used fungi.

    2. Reviewer #1 (Public review):

      Filamentous fungi are established work horses in biotechnology with Aspergillus oryzae as a prominent example with a thousand-year of history. Still the cell biology and biochemical properties of the production strains is not well understood. The paper of the Takeshita group describes the change in nuclear numbers and correlate it to different production capacities. They used microfluidic devices to really correlate the production with nuclear numbers. In addition, they used microdissection to understand expression profile changes and found an increase of ribosomes. The analysis of two genes involved in cell volume control in S. pombe did not reveal conclusive answers to explain the phenomenon. It appears that it is a multi-trait phenotype. Finally, they identified SNPs in many industrial strains and tried to correlate them to the capability of increasing their nuclear numbers.

      The methods used in the paper range from high quality cell biology, Raman spectroscopy to atomic force and electron microscopy and from laser microdissection to the use of microfluidic devices to study individual hyphae.

      This is a very interesting, biotechnologically relevant paper with the application of excellent cell biology.

      Comments on revised version:

      The authors addressed all suggestions satisfactorily.

    3. Reviewer #2 (Public review):

      Summary:

      In the study presented by Itani and colleagues it is shown that some strains of Aspergillus oryzae - especially those used industrially for the production of sake and soy sauce - develop hyphae with a significantly increased number of nuclei and cell volume over time. These thick hyphae are formed by branching from normal hyphae and grow faster and therefore dominate the colonies. The number of nuclei positively correlates with the thicker hyphae and also the amount of secreted enzymes. The addition of nutrients such as yeast extract or certain amino acids enhanced this effect. Genome and transcriptome analyses identified genes, including rseA, that are associated with the increased number of nuclei and enzyme production. The authors conclude from their data involvement of glycosyltransferases, calcium channels and the tor regulatory cascade in regulation of cell volume and number of nuclei. Thicker hyphae and an increased number of nuclei was also observed in high-production strains of other industrially used fungi such as Trichoderma reesei and Penicillium chrysogenum, leading to the hypothesis that the mentioned phenotypes are characteristic of production strains which is of significant interest for fungal biotechnology.

      Strengths:

      The study is very comprehensive and involves application of divers state-of-the-art cell biological, biochemical and genetical methods. Overall, the data are properly controlled and analyzed, figures and movies are of excellent quality.<br /> The results are particularly interesting with regard to the elucidation of molecular mechanisms that regulate the size of fungal hyphae and their number of nuclei. For this, the authors have discovered a very good model: (regular) strains with a low number of nuclei and strains with high number of nuclei. Also, the results can be expected to be of interest for the further optimization of industrially relevant filamentous fungi.

      In the revision the authors addressed all my comments and as a result produced an even stronger study.

    4. Reviewer #3 (Public review):

      Summary:

      The authors seek to determine the underlying traits that support the exceptional capacity of Aspergillus oryzae to secrete enzymes and heterologous proteins. To do so, they leverage the availability of multiple domesticated isolates of A. oryzae along with other Aspergillus species to perform comparative imaging and genomic analysis.

      Strengths:

      The strength of this study lies in the use of multifaceted approaches to identify significant differences in hyphal morphology that correlate with enzyme secretion, which is then followed by the use of genomics to identify candidate functions that underlie these differences.

      Weaknesses:

      Although the image analysis and data interpretation is convincing, the genetic data supporting the author's model is somewhat more speculative and will likely require additional investigation.

      Overall, the authors have achieved their aims in that they are able to clearly document the presence of two distinct hyphal forms in A. oryzae and other Aspergillus species, and to correlate the presence of the thicker rapidly growing form with enhanced enzyme secretion. The image analysis is convincing. The discovery that addition of yeast extract and specific amino acids can stimulate formation of the novel hyphal form is also notable. Although the conclusions are generally supported by the results, this is perhaps less so for the genetic analysis as it remains unclear how direct the role of RseA and the calcium transporters might be in supporting the formation of the thicker hyphae.

      The results presented here will impact the field. The complexity of hyphal morphology and how it affects secretion are not well understood despite the importance of these processes for the fungal lifestyle. In addition, the description of approaches that can be used to facilitate the study of these different hyphal forms (i.e., stimulation using yeast extract or specific animo acids) will benefit future efforts to understand the molecular basis of their formation.

    5. Author response:

      The following is the authors’ response to the original reviews.

      Reviewer #1 (Public review): 

      Filamentous fungi are established workhorses in biotechnology, with Aspergillus oryzae as a prominent example with a thousand-year history. Still, the cell biology and biochemical properties of the production strains is not well understood. The paper of the Takeshita group describes the change in nuclear numbers and correlates it to different production capacities. They used microfluidic devices to really correlate the production with nuclear numbers. In addition, they used microdissection to understand expression profile changes and found an increase in ribosomes. The analysis of two genes involved in cell volume control in S. pombe did not reveal conclusive answers to explain the phenomenon. It appears that it is a multi-trait phenotype. Finally, they identified SNPs in many industrial strains and tried to correlate them to the capability of increasing their nuclear numbers. 

      The methods used in the paper range from high-quality cell biology, Raman spectroscopy, to atomic force and electron microscopy, and from laser microdissection to the use of microfluidic devices to

      study individual hyphae. 

      This is a very interesting, biotechnologically relevant paper with the application of excellent cell biology. I have only minor suggestions for improvement. 

      We sincerely appreciate your fair and positive evaluation of our work. Thank you for your suggestions for improvement. We respond to each of them appropriately.

      Reviewer #2 (Public review): 

      Summary: 

      In the study presented by Itani and colleagues, it is shown that some strains of Aspergillus oryzae - especially those used industrially for the production of sake and soy sauce - develop hyphae with a significantly increased number of nuclei and cell volume over time. These thick hyphae are formed by branching from normal hyphae and grow faster and therefore dominate the colonies. The number of nuclei positively correlates with the thicker hyphae and also the amount of secreted enzymes. The addition of nutrients such as yeast extract or certain amino acids enhanced this effect. Genome and transcriptome analyses identified genes, including rseA, that are associated with the increased number of nuclei and enzyme production. The authors conclude from their data involvement of glycosyltransferases, calcium channels, and the tor regulatory cascade in the regulation of cell volume and number of nuclei. Thicker hyphae and an increased number of nuclei were also observed in high-production strains of other industrially used fungi such as Trichoderma reesei and Penicillium chrysogenum, leading to the hypothesis that the mentioned phenotypes are characteristic of production strains, which is of significant interest for fungal biotechnology. 

      Strengths: 

      The study is very comprehensive and involves the application of diverse state-of-the-art cell biological, biochemical, and genetic methods. Overall, the data are properly controlled and analyzed, figures and

      movies are of excellent quality. 

      The results are particularly interesting with regard to the elucidation of molecular mechanisms that regulate the size of fungal hyphae and their number of nuclei. For this, the authors have discovered a very good model: (regular) strains with a low number of nuclei and strains with a high number of nuclei. Also, the results can be expected to be of interest for the further optimization of industrially relevant filamentous

      fungi. 

      Weaknesses: 

      There are only a few open questions concerning the activity of the many nuclei in production strains (active versus inactive), their number of chromosomes (haploid/diploid), and whether hyper-branching always leads to propagation of nuclei. 

      We are very grateful for your recognition of our findings, the proposed model, and their significance for future applications. We are grateful for the questions, which contribute to a more accurate understanding. 

      Our responses to each are provided below.  

      Reviewer #3 (Public review): 

      Summary: 

      The authors seek to determine the underlying traits that support the exceptional capacity of Aspergillus oryzae to secrete enzymes and heterologous proteins. To do so, they leverage the availability of multiple domesticated isolates of A. oryzae along with other Aspergillus species to perform comparative imaging and genomic analysis. 

      Strengths: 

      The strength of this study lies in the use of multifaceted approaches to identify significant differences in hyphal morphology that correlate with enzyme secretion, which is then followed by the use of genomics to identify candidate functions that underlie these differences. 

      Weaknesses: 

      There are aspects of the methods that would benefit from the inclusion of more detail on how experiments were performed and data interpreted. 

      Overall, the authors have achieved their aims in that they are able to clearly document the presence of two distinct hyphal forms in A. oryzae and other Aspergillus species, and to correlate the presence of the thicker, rapidly growing form with enhanced enzyme secretion. The image analysis is convincing. The discovery that the addition of yeast extract and specific amino acids can stimulate the formation of the novel hyphal form is also notable. Although the conclusions are generally supported by the results, this is perhaps less so for the genetic analysis as it remains unclear how direct the role of RseA and the calcium transporters might be in supporting the formation of the thicker hyphae. 

      The results presented here will impact the field. The complexity of hyphal morphology and how it affects secretion is not well understood despite the importance of these processes for the fungal lifestyle. In addition, the description of approaches that can be used to facilitate the study of these different hyphal forms (i.e., stimulation using yeast extract or specific amino acids) will benefit future efforts to understand the molecular basis of their formation. 

      We are very grateful for your fair and thoughtful evaluation of our work. We agree that the genetic analysis in the latter part is relatively weaker compared to the imaging analysis in the first half. Rather than a single mutation causing a dramatic phenotypic change, we believe that the accumulation of various mutations through breeding leads to the observed phenotype, making it difficult to clearly demonstrate causality. Since transcriptome and SNP analyses have revealed key pathways and phenotypes, it would be gratifying if these insights could contribute to future applications utilizing filamentous fungi.

      Reviewer #1 (Recommendations for the authors): 

      I was wondering what happens if thick hyphae were taken as inoculum for a new colony or thin hyphae. Is it possible to enrich for one or the other type of hyphae? Perhaps in the presence of yeast extract or certain amino acids. 

      Added an explanation in the discussion.

      L304-306. When thick hyphae were cultured on fresh medium, thin hyphae initially emerged, suggesting that sustained metabolic activity is required for the formation of thick hyphae with a high number of nuclei.    

      L120-121. In some cases, thick hyphae emerged by branching from thick hyphae (Fig. 2D, left), while in other cases, thin hyphae emerged from thick hyphae (Fig. 2D, right). Thin hyphae emerge in the early stage of cultivation even in the presence of yeast extract or certain amino acids.

      In the Discussion, they hypothesize that the primary effect could be on cell wall rigidity. I am wondering if that hypothesis could be tested by adding, for instance, sublethal concentrations of cytochalasin to hyphae of A. nidulans to weaken the cell wall. 

      The question is reasonable. To ensure accurate understanding, we moved Fig. S6 to Fig. 6 and revised the discussion as follows. 

      L294-295. In our model, cell wall loosening at a branching site and regulation of cell volume by turgor pressure constitute necessary conditions for increasing cell volume and maintaining thick hyphae. L306-309. Weakening the cell wall by treatment with a low concentration of calcofluor white did not lead to hyphal thickening or an increase in nuclear number. On the contrary, thick hyphae have thicker cell walls (Fig. 2H-K), which are necessary to maintain the increased cell volume.

      I recommend including some older literature. It was described already 20 years ago that A. nigerdifferentiates hyphae with different capacities to secrete proteins (PMID: 16238620). In addition, there are old reports in A. nidulans reporting high numbers of nuclei (https://doi.org/10.1099/00221287-60-1-133). Perhaps it is worth trying to reproduce those cultural conditions. At least this should be discussed. In the same line, the number of nuclei increases a lot in the stalk of conidiophores in A. nidulans. These observations could be used as examples that the phenomenon observed in A. oryzae may be of general importance. 

      Thank you for the suggestion. It is a very interesting proposal. We checked the nuclei distribution of A. nidulans on the media and added the following discussion.

      L328-334. A previous study reported an increase in the number of nuclei in A. nidulans (62, 63). Here, we examined the nuclear distribution of A. nidulans grown on the culture media, however, did not find class III hyphae as observed in A. oryzae. Even in A. nidulans, conidiophore stalks contain a high number of nuclei. It has been shown that A. oryzae has a taller conidiophore stalk (64). In the thick hyphae of A. oryzae, the expression level of flbA, an early regulator of conidiophore development (65), was elevated. This suggests that differentiation to aerial hyphae may be involved in the increase of hyphal volume and nuclear number. 

      (62) Clutterbuck A.J. Synchronous Nuclear Division and Septation in Aspergillus nidulans. J Gen Microbiol 60, 133-135 (1970).

      (63) Vinck, A., Terlou, M., Pestman, W.R., Martens, E.P., Ram, A.F., van den Hondel, C.A., Wösten, H.A. Hyphal differentiation in the exploring mycelium of Aspergillus niger. Mol Microbiol 58, 693-9 (2005).

      (64) Wada R, Maruyama J, Yamaguchi H, Yamamoto N, Wagu Y, Paoletti M, Archer DB, Dyer PS, Kitamoto K. Presence and functionality of mating type genes in the supposedly asexual filamentous fungus Aspergillus oryzae. Appl Environ Microbiol 78, 2819-29 (2012).

      (65) Lee, B.N., Adams, T.H. Overexpression of flbA, an early regulator of Aspergillus asexual sporulation, leads to activation of brlA and premature initiation of development. Mol Microbiol 14, 323-34 (1994).

      Reviewer #2 (Recommendations for the authors): 

      I suggest addressing the following questions to strengthen the manuscript: 

      (1) Do the authors have an explanation for their result that with an increase in the number of nuclei the individual nucleus is smaller? Have the authors checked whether all the nuclei are haploid or diploid?

      Thank you for the very important question. We added new results to Fig. S5D and S5E and the following discussion.

      L335-340. We investigated whether the reduction in nuclear size observed in thick hyphae was due to a change from diploid to haploid status. However, no difference in GFP-histone fluorescence intensity was detected between thick and thin hyphae (Fig. S5D). In both RIB40 and RIB915 strains, no significant difference in conidial spore size was observed despite the large difference in the number of nuclei within the hyphae (Fig. S5E). These results suggest that both thick and thin hyphae remain haploid, and that the smaller nuclear size observed in thick hyphae is likely due to a higher nuclear density.

      (2) In this context, the biological relevance of the increase in the number of nuclei should also be discussed in more detail. It remains to be clarified whether in hyphae with a high number of nuclei all nuclei are functionally active or whether many nuclei are possibly "inactive". Studies on the transcriptional activity of individual nuclei or on DNA replication (e.g., by EdU labeling) could clarify this. 

      Added the explanation below.

      L102-105. The transcriptional activity of each nucleus is unknown. However, a previous study (Yasui et al., FBB 2020) demonstrated that nuclear division is synchronized even when there are more than 200 nuclei. This suggests that DNA replication occurs similarly in most nuclei. Furthermore, since the germination rate of conidia and the colonies formed from individual conidia show no significant abnormalities, it is suggested that nearly all nuclei possess normal genomes and chromosomes.

      (3) It becomes not entirely clear what the underlying signal is that causes a thin hypha to branch into a thick multinucleated cell. This needs to be discussed in more detail. 

      Thanks for the suggestion. We clarified the signal to increase nuclear number and cell volume.

      L294-309. Although it is speculative, we propose a model to aid interpretation in the discussion. We have clarified that both genetic potential and environmental signals such as nutrients are important.

      (4) Is increased branching always correlated with an increased number of nuclei? 

      It is not an increase in branching, but rather the thickening of hyphae and an increase in cell volume that is consistently associated with an increase in nuclear number. Approximately 40 hours after inoculation, within 400 μm from the tip, the number of branches was 3.4 (SD=2.4) in thin hyphae and 2.6 (SD=0.5) in thick hyphae, suggesting that branching does not increase (n=4). Since thick hyphae elongate faster, it seems that fewer branches are present near the tip, even if the branching frequency itself remains unchanged.

      (5) The abstract does not summarize the many findings of the manuscript in an adequate way. 

      abstract change

      Minor: 

      (1) Lines 49-50: Why italics? 

      corrected.

      (2) Line 179: process. 

      corrected.

      (3) Lines 313-314: Do not forget (and discuss) in this context mycorrhiza fungi with up to thousands of nuclei that were apparently selected during evolution for this high number of nuclei. 

      Thank you for the very interesting suggestion. We have added the following discussion.

      L339-351. The regulation of nuclear number and its ecological strategy are intriguing in other fungi such as N. crassa, which rapidly spreads after wildfires (68), and arbuscular mycorrhiza fungi that form symbiotic relationships with plants and contain thousands of nuclei within hyphae lacking septa (69).

      (68) Jacobson, D. J. et al. Neurospora in temperate forests of western North America. Mycologia 96, 66–74 (2004).

      (69) Kokkoris V, Stefani F, Dalpé Y, Dettman J, Corradi N. Nuclear Dynamics in the Arbuscular Mycorrhizal Fungi. Trends Plant Sci. 25, 765-778 (2020).

      (4) Lines 356-358: many typos.

      corrected.

      Reviewer #3 (Recommendations for the authors): 

      Specific suggestions or clarifications for the authors include: 

      (1) Lines 49-50: Is this sentence italicized for a reason? 

      It was a mistake, so we have corrected it.

      (2) Line 83: More detail on the specific characteristics of the different classes of hyphae would be helpful. Perhaps include a schematic drawing that emphasizes the differences between class I,II, and III hyphae. 

      L398-400. The classification is described in the Methods section: Class I – nuclei are distributed at regular intervals without overlapping; Class II – nuclei are aligned but occasionally overlap; Class III – nuclei are scattered throughout the hyphae without alignment. Representative images are shown in a previous study (Yasui et al., FBB 2020). 

      L82-84. We have added this information to clarify the classification.

      (3) Lines 102-103: It was not very clear how this experiment was done. Are you counting nuclei within 100 um of the tip? Are these all in one hyphal compartment? These details could be provided in a drawing that would make it easier for the reader to understand how this was done. 

      L109. Due to variation in the distance from the hyphal tip to the septum, we counted the number of nuclei within 100 μm from the hyphal tip. When septa were present, nuclei were counted in the same manner, so multiple compartments may be included. Changed the explanation.

      (4) Lines 134-140: Is there a way to calibrate levels of secreted protein or amylase activity per nucleus? That is, if the ratio of cytoplasmic volume per nucleus is constant, does the same apply to the secreted product? Knowing this would help to clarify whether the key feature in enhanced secretion is nuclear (e.g., gene expression) versus a cytoplasmic trait (e.g., vesicle trafficking). 

      Enzyme activity was measured across the entire mycelium, which includes a mixture of hyphae with high and low numbers of nuclei. Therefore, it is difficult to assess the correlation between enzyme activity and nuclear number. Enzyme activity was normalized by fungal biomass. The size of each colony is shown in Fig. 1B. Additionally, the correlation between the proportion of hyphae with increased nuclear number and enzyme activity is shown in Fig. 3H. In the experiment where enzyme activity was measured in a single hypha, we attempted to measure the number of nuclei; however, we could not use the nuclear GFP strain because the substrate exhibits green fluorescence. DAPI staining also failed due to limited dye access to the microfluidic channel. Changed the section title, ‘Increase in nuclear number and enzyme secretion’ from ‘Correlation between nuclear number and enzyme secretion’.

      (5) Line 151 and Figure 3F: YE also triggered a ~5-fold enhancement of secretion in A. nidulans without a concomitant increase in hyphal width. This merits some comment in the text.  

      Added an explanation, L156-157.

      In A. nidulans, the addition of yeast extract did not cause a dramatic increase in nuclear number, but hyphal width increased by 1.4-times and protein secretion increased by 5.1-times.

      (6) Line 252: Were nimE levels detected or altered in thick hyphae? The levels of this cycling might play a more important role in a shortened cell cycle than the authors have considered, especially as NimE functions during both G1 and G2. 

      Added an explanation below, L260-262.

      The expression level of nimE (AO090003000993) was low in both thick and thin hyphae, with no significant difference observed. As known in other organisms, its function is likely regulated through phosphorylation and the protein degradation.

      (7) Line 254: Please provide a citation for the statement that branches emerge as a result of cell wall loosening. 

      rephrased and added citation, L263.

      Branching is thought to occur through the degradation and reconstruction of the cell wall at the branching site (54).

      Harris SD. Branching of fungal hyphae: regulation, mechanisms and comparison with other branching systems. Mycologia 100, 823-32 (2008).   

      (8) Lines 275-277: It would be interesting to know whether the addition of rapamycin also suppressed the ability of amino acids to trigger greater numbers of class III hyphae. 

      We added new results at Fig. S2G.

      L168. Rapamycin decreased the ratio of hyphae with increased nuclei even in the medium with yeast extract (Fig. S2G).

      (9) Lines 282-289: My sense is that this model is too speculative at this time. The role of RseA seems very broad based on the strong deletion phenotype. How would the removal of RseA be regulated to limit its effect to the branch site? Also, the msyA deletion phenotype isn't entirely consistent with what you would expect if it were necessary to maintain thick hyphae. Lastly, the authors do not show that translational capacity is enhanced in thick hyphae. I would suggest that these statements be tempered to some degree. 

      Thank you for your comment. We agree that it was too speculative, whereas we believe that some explanatory interpretation is necessary. Therefore, we have revised the text as follows, L294-300. In our model, cell wall loosening during branching and regulation of cell volume by turgor pressure constitute necessary conditions for increasing cell volume and maintaining thick hyphae. RseA and MsyA may be involved in these processes. At the same time, enhanced translational capacity by increased expression of ribosomal genes, possibly due to associated with TOR activation by specific amino acids, and mechanisms that accelerate the cell cycle represent another essential condition that enables an increase in nuclear number.

      (10) General: how do the authors reconcile the observation that YE and amino acids stimulate the formation of thicker hyphae, yet the time lapse imaging (Figure 2E) suggests that these hyphae arise at a later time during colony development when these resources might be limiting? The authors should consider providing some insight into this in the Discussion. 

      L300-305. Added a discussion below.

      Both genetic potential and nutritional environmental signals are likely required for the formation of thick hyphae with a high number of nuclei. When thick hyphae were cultured on fresh medium, thin hyphae initially emerged, suggesting the necessity of sustained high metabolic activity.

    1. eLife Assessment

      This important study reports that an oncogenic population in an epithelium can either be repressed or spread, depending on the tissues. This is explained based on the differential interfacial tension hypothesis, and supported by pharmacological perturbations and numerical simulations using the vertex model. The study conveys a key message, but, as it stands, the strength of evidence is incomplete, and a more detailed analysis of the mechanistic origin of the different tensions and better comparison between experiments and simulations would strongly strengthen the message.

    2. Reviewer #1 (Public review):

      Summary:

      The behaviour of cells expressing constitutively active HRas is examined in mosaic monolayers, both in MCF10a breast epithelial and Beas2b bronchial epithelial cell lines, mimicking the potential initial phase of development of carcinoma. Single HRas-positive cells are excluded from MCF10a but not Beas2b monolayers. Most interestingly, however, when in groups, these cells are not excluded, but rather sharply segregated within a MCF10a monolayer. In contrast, they freely mix with wt Beas2b cells. Biophysical analysis identifies high tension at heterotypic interfaces between HRas and wild-type cells as the likely reason for segregation of MCF10a cells. The hypothesis is supported experimentally, as myosin inhibition abolishes segregation. The probable reason for the lack of segregation in the bronchial epithelium is to be found in the different intrinsic properties of these cells, which form a looser tissue with lower basal actomyosin activity. The behaviour of single cells and groups is recapitulated in a vortex model based on the principle of differential interfacial tension, under the condition of high heterotypic interfacial tension.

      Strengths:

      Despite being long recognized as a crucial event during cancer development, segregation of oncogenic cells has been a largely understudied question. This nice work addresses the mechanics of this phenomenon through a straightforward experimental design, applying the biophysical analytical approaches established in the field of morphogenesis. Comparison between two cell types provides some preliminary clues on the diversity of effects in various cancers.

      Weaknesses:

      Although not calling into question the main message of this study, there are a few issues that one may want to address:

      (1) One may be careful in interpreting the comparison between MCF10a and Beas2b cells as used in this study. The conditions may not necessarily be representative of the actual properties of breast and bronchial epithelia. How much of the epithelial organization is reconstituted under these experimental conditions remains to be established. This is particularly obvious for bronchial cells, which would need quite specific culture conditions to build a proper bronchial layer. In this study, they seemed to be on the verge of a mesenchymal phenotype (large gaps, huge protrusions, cells growing on top of each other, as mentioned in the manuscript).

      As an alternative to Beas2b, comparison of MCF10a with another cell line capable of more robust in vitro epithelial organization, but ideally with different adhesive and/or tensile properties, would be highly interesting, as it may narrow down the parameters involved in segregation of oncogenic cells.

      (2) While the seminal description of tissue properties based on interfacial tensions (Brodland 2002) is clearly key to interpreting these data, the actual "Differential Interfacial Tension Hypothesis" poses that segregation results from global differences, i.e., juxtaposition of two tissues displaying different intrinsic tensions. On the contrary, the results of the present work support a different scenario, where what counts is the actual difference in tension ALONG the tissue boundary, in other words, that segregation is driven by high HETEROTYPIC interfacial tension. This is an important distinction that should be clarified.

      (3) Related: The fact that actomyosin accumulates at the heterotypic interface is key here. It would be quite informative to better document the pattern of this accumulation, which is not clear enough from the images of the current manuscript: Are we talking about the actual interface between mutant and wt cells (membrane/cortex of heterotypic contacts)? Or is it more globally overactivated in the whole cell layer along the border? Some better images and some quantification would help.

      (4) In the case of Beas2b cells, mutant cells show higher actin than wt cells, while actin is, on the contrary, lower in mutant MCF10a cells (Figure 2b). Has this been taken into account in the model? It may be in line with the idea that HRas may have a different action on the two cell types, a possibility that would certainly be worth considering and discussing.

      In conclusion, the study conveys an important message, but, as it stands, the strength of evidence is incomplete. It would greatly benefit from a more detailed and complete analysis of the experimental data, a better fit between this analysis and the corresponding vertex model, and a more in-depth discussion of biological and biophysical aspects. These revisions should be rather easily done, and would then make the evidence much more solid.

    3. Reviewer #2 (Public review):

      Summary:

      The authors investigate the behavior of oncogenic cells in mammary and bronchial epithelia. They observe that individual oncogenic cells are preferentially excluded from the mammary epithelium, but they remain integrated in the bronchial epithelium. They also observe that clusters of oncogenic cells form a compact cluster in the mammary epithelium, but they disperse in the bronchial epithelium. The authors demonstrate experimentally and in the vertex model simulations that the difference in observed behavior is due to the differential tension between the mutant and wild-type cells due to a differential expression of actin and myosin.

      Strengths:

      (1) Very detailed analysis of experiments to systematically characterize and quantify differences between mammary and bronchial epithelia.

      (2) Detailed comparison between the experiments and vertex model simulations to identify the differential cell line tension between the oncogenic and wild-type cells as one of the key parameters that are responsible for the different behavior of oncogenic cells in mammary and bronchial epithelia

      Weaknesses:

      (1) It is unclear what the mechanistic origin of the shape-tension coupling is, which is used in the vertex model, and how important that coupling is for the presented results. The authors claim that the shape-tension coupling is due to the anisotropic distribution of stress fibers when cells are under external stress. It is unclear why the stress fibers should affect an effective line tension on the cell boundaries and why the stress fibers should be sensitive to the magnitude of the internal isotropic cell pressure. In experiments, it makes sense that stress fibers form when cells are stretched. Similar stress fibers form when the cytoskeleton or polymer networks are stretched. It is unclear why the stress fibers should be sensitive to the magnitude of internal isotropic cell pressure. If all the surrounding cells have the same internal pressure, then the cell would not be significantly deformed due to that pressure, and stress fibers would not form. The authors should better justify the use of the shape-tension coupling in the model and also present simulation results without that coupling. I expect that most of the observed behavior is already captured by the differential tension, even if there is no shape-tension coupling.

      (2) The observed difference of shape indices between the interfacial and bulk cells in simulations in the absence of differential line tension is concerning. This suggests that either there are not enough statistics from the simulations or that something is wrong with the simulations. For all presented simulation results, the authors should repeat multiple simulations and then present both averages and standard deviations. This way, it would be easier to determine whether the observed differences in simulations are statistically significant.

      (3) The authors should also analyze the cell line tension data in simulations and make a comparison with experiments.

    1. eLife Assessment

      In this important study, the authors use computational modeling to explore how fast learning can be reconciled with the accumulation of stable memories in the olfactory bulb, where adult neurogenesis is prominent. Their model demonstrates that changes in excitability, plasticity, and susceptibility to apoptosis during the maturation of adult-born granule cells can help resolve the flexibility-stability dilemma. These compelling results provide a coherent picture of a neurogenesis-dependent learning process that is consistent with diverse experimental observations and may serve as a foundation for further experimental and computational studies.

    2. Reviewer #1 (Public review):

      Summary:

      Sakelaris and Riecke used computational modeling to explore how neurogenesis and sequential integration of new neurons into a network support memory formation and maintenance. They focus on the integration of granule cells in the olfactory bulb, a brain area where adult neurogenesis is prominent. Experimental results published during recent years provide an excellent basis to address the question at hand by biologically constrained models. The study extends previous computational models and provides a coherent picture of how multiple processes may act in concert to enable rapid learning, high stability of memories, and high memory capacity. This computational model generates experimentally testable predictions and is likely to be valuable to understand roles of neurogenesis and related phenomena in memory. One of the key findings is that important features of the memory system depend on transient properties of adult-born granule cells such as enhanced excitability and apoptosis during specific phases the development of individual neurons. The model can explain many experimental observations, and suggests specific functions for different processes (e.g., importance of apoptosis for continual learning). While this model is obviously a massive simplification of the biological system, it conceptualizes diverse experimental observations into a coherent picture, it generates testable predictions for experiments, and it and will likely inspire further modeling and experimental studies.

      Strengths:

      - The model can explain diverse experimental observations

      - The model directly represents the biological network

      Weaknesses:

      - As many other models of biological networks, this model contains major simplifications.

    3. Reviewer #2 (Public review):

      Summary:

      The authors propose a mechanism to provide flexibility to learn new information while preserving stability in neural networks by combining structural plasticity and synaptic plasticity.

      Strengths:

      An intriguing idea, well embedded in experimental data.

      Authors have done a great job addressing reviewers' concerns

      Weaknesses:

      None

    4. Reviewer #3 (Public review):

      The manuscript is focused on local bulbar mechanisms to solve the flexibility-stability dilemma in contrast to long range interactions documented in other systems (hippocampus-cortex). The network performance is assessed in a perceptual learning task: the network is presented with alternating, similar artificial stimuli (defined as enrichment) and the authors assess its ability to discriminate between these stimuli by comparing the mitral cell representations quantified by Fisher discriminant analysis. The authors use enhancement in discriminability between stimuli as function of the degree of specificity of connectivity in the network to quantify the formation of an odor-specific network structure which as such has memory - they quantify memory as the specificity of that connectivity.

      The focus on neurogenesis, excitability and synaptic connectivity of abGCs is topical, and the authors systematically built their model, clearly stating their assumptions and setting up the questions and answers. In my opinion, the combination of latent dendritic representations, excitability and apoptosis in an age-dependent manner is interesting and as the authors point out leads to experimentally testable hypotheses.

      In the revised manuscript, the authors have systematically addressed my previous concerns. In particular, they now refer to previous work on granule cells-mitral cell interactions more generally, they explain the pros and cons for usage of specificity in connectivity as a proxy for memory capacity, and the biological plausibility of the model.

    1. eLife Assessment

      This important work sets out to identify the neural substrates of associative fear responses in adult zebrafish. Through a compelling and innovative paradigm and analysis, the authors suggest brain regions associated with individual differences in fear memory. While several findings are well supported, aspects of the interpretation and presentation are partially incomplete, and the manuscript would benefit from adjusting key claims or including additional experiments. Nonetheless, this study showcases the strength of zebrafish for systems-level neuroscience and will be of broad interest to the neuroscience community.

    2. Reviewer #1 (Public review):

      Summary:

      This work provides a comprehensive analysis of how adult zebrafish show fear responses to conspecific alarm substances (CAS) and retain their associative memory. It shows that freezing is a more reliable measure of fear response and memory compared to evasive swimming, and that the reactivity and the type of responses depend on the zebrafish strain. It further suggests neuronal substrates of different fear responses based on c-Fos mapping.

      Strengths:

      The behavioral part is the most comprehensive and detailed yet in the zebrafish field, providing strong support for the authors' claim. The flow from Figure 1 to Figure 4 is very smooth. They provide extremely detailed, yet complementary and necessary, analyses of how different categories of behavior emerge over time during the CAS exposure and memory retrieval. I'm convinced that neuro researchers who study fear/stress responses will always refer to this paper to plan and interpret their future experiments.

      Weaknesses:

      The neural analysis part is very comprehensive. Figure 5 and Figure 6 are independent but complement each other very well. They together support that the cerebellar system is the key brain component for a freezing response. Their extreme focus on high-level analyses, however, came at the expense of biological intuitions. I suggest adding some figure panels and result/discussion paragraphs to help with that aspect.

    3. Reviewer #2 (Public review):

      In this study, Fontana et al. develop a paradigm for associative conditioning by pairing exposure to an alarm substance with a novel tank. Exposure to conspecific alarm substance (CAS) in the novel tank triggers freezing and what they characterize as evasive swimming behaviour, which is subsequently seen in a re-exposure to the novel tank without the CAS present. Importantly, these states are identified via automated processes, including postural tracking and a random forest classification process, which could be very useful tools for subsequent studies.

      In their experiments, they focus on the differences in behaviour among strains of zebrafish (both males and females), and among individual zebrafish. For males and females of different strains, they find some differences, though the clearest message seems to be that the most robust measure of the behaviour in response to both the CAS and in the memory trials is the freezing behaviour, while evasive behaviour is more variable. and not always seen. This may relate to their observation of significant "evasiveness" in vehicle control experiments (discussed further below).

      Moving on to individual variation from within this multi-strain male/female dataset, they first examine transition matrices between states and find tthat his is not dramatically altered by stimulus exposure. They then use clustering to identify 4 different "classes" of zebrafish that differ in their expression (or not) of two types of behaviour: freezing and/or evasive behaviour. They show that over the three exposure epochs of the experiment, this classification is somewhat stable in an individual fish, though many fish change their behaviour - e.g., evading + freezing -> only freezing.

      In the final set of experiments, the authors move beyond behavioural analyses and perform whole-brain cFos mapping of these individual zebrafish. They perform analyses aimed at identifying correlations between individual behavioural expression and the number of cFos-positive cells in different brain regions. Using partial least squares analysis, they find areas associated with two types of behavioural contrasts, which differ in their weighting of different behavioural expression during the Memory trials. Covariation and network structure analysis within different classes of larvae also find some differences in covariation among brain areas, providing hypotheses as to underlying network effects that may govern the expression of freezing and/or evasive behavior in the memory trial phases.

      Overall, I find this to be an interesting study that employs state of the are methods of behavioural analyses and whole-brain cFos analyses, but I am left a little bit confused as to what the take home message is and what can be concluded from this complex study that mixes in analyses of strain, sex, and individuality within a quite complex assay with multiple behavioural parameters.

      My suggestions are as follows:

      (1) My first concern relates to the claim in the abstract that "We found that fear memory behavior fell into four distinct groups: non-reactive, evaders, evading freezers, and freezers".

      In my opinion, the "freezing" aspect is well supported as being both triggered by the CAS and for memory effect upon re-exposure to the tank, but I am less convinced about the "evasive" behaviour. In Figure 2, it appears that "evasiveness" is generally not increased in both the Exposure or Memory phases for many groups, and in Figure 5, it appears that "evasiveness" is expressed by nearly 50% of the fish in the pre-exposure condition before CAS addition and in all phases in the vehicle condition. Therefore, it appears that most of the expression of this behaviour is independent of any memory-based effect.

      (2) My second concern relates to the claim in the abstract that "background strain and sex influenced how fish respond to CAS, with males more likely to increase evasive behaviors than females and the TU strain more likely to be non-reactive."

      My understanding, based on the introduction and on the methods, is that it is likely important that the CAS be prepared from conspecifics of the same strain and sex, and for this reason, they prepared different CAS specific for each strain and each sex. Therefore, the "CAS" that is applied is necessarily different for each condition, and I am concerned about if the differences observed could relate more to variation in the quality, purity, concentration, etc. of the specific CAS samples for different groups, rather than their reactivity to the substance or their ability to form memories based on such experiences.

      (3) My third concern relates to the interpretation of the cFos data.

      As I mentioned above, I feel as though the behavioural analysis is perhaps more complex than is warranted via the inclusion of evasiveness, and I wonder if the conclusions from the experiments would be simpler if analyzed only from the perspective of freezing.

      But considering the presented analyses: while I dont think there is anything wrong with the partial least squares approach and the network analyses, I am concerned that the simple messaging in the text does not reflect the complexity of this analysis combining different weightings of different behavioural characteristics in a behavioural contrast, or covariations among many regions and what such analyses mean at the level of brain function. For these reasons, I feel like statements along the lines of "Behavioral variation is driven by differences in the activity of brain regions outside the telencephalon, such as the cerebellum, preglomerular nuclei, preoptic area and hypothalamus" are not well supported.