- Jan 2025
-
www.biorxiv.org www.biorxiv.org
-
Reviewer #1 (Public review):
In this work, Urbanska and colleagues use a machine-learning based crossing of mechanical characterisations of various cells in different states and their transcriptional profiles. Using this approach, they identify a core set of five genes that systematically vary together with the mechanical state of the cells, although not always in the same direction depending on the conditions. They show that the combined transcriptional changes in this gene set is strongly predictive of a change in the cell mechanical properties, in systems that were not used to identify the genes (a validation set). Finally, they experimentally after the expression level of one of these genes, CAV1, that codes for the caveolin 1 protein, and show that, in a variety of cellular systems and contexts, perturbations in the expression level of CAV1 also induce changes in cell mechanics, cells with lower CAV1 expression being generally softer.
Overall the approach seems accessible, sound and is well described. My personal expertize is not suited to judge its validity, novelty or relevance, so I do not make comments on that. The results it provides seem to have been thoroughly tested by the authors (using different types of mechanical characterisations of the cells) and to be robust in their predictive value. The authors also show convincingly that one of the genes they identified, CAV1, is not only correlated with the mechanical properties of cells, but also that changing its expression level affects cell mechanics. At this stage, the study appears mostly focused on the description and validation of the methodological approach, and it is hard to really understand what the results obtain really mean, the importance of the biological finding - what is this set of 5 genes doing in the context of cell mechanics? Is it really central, or is it just one of the set of knobs on which the cell plays - and it is identified by this method because it is systematically modulated but maybe, for any given context, it is not the dominant player - all these fundamental questions remain unanswered at this stage. On one hand, it means that the study might have identified an important novel module of genes in cell mechanics, but on the other hand, it also reveals that it is not yet easy to interpret the results provided by this type of novel approach.
Comments on revisions:
In their point-by-point answer, the authors did a great effort to provide pedagogical answers that clarified most of the points I had raised. They also did more analysis, some of which are included as supplementary data, and added a few sentences to the main text and discussion. As far as I am concerned, I see no particular issue with the revised article. I think it will be interesting both as a new type of approach in mechanobiology, and also as a motivation for more experimentally oriented labs to test the hypothesis proposed in the article and the 'module' they found.
-
Author response:
The following is the authors’ response to the original reviews.
In summary, the changes made in the revision process include:
An addition of a paragraph in the result section that discusses the absolute values of measured Young’s moduli in the light of probing frequencies, accompanied by a new supplementary figure and a supplementary table that support that discussion
- Fig. S10. Absolute Young’s modulus values across the frequencies characteristic for the three measurement methods.
- Table S9. Operation parameters of the three methods used for characterizing the mechanical properties of cells.
Three new supplementary figures that display the expression matrices for the genes from the identified modules in carcinoma datasets used for validation:
- Fig. S4. Expression of identified target genes in the CCLE microarray dataset used for validation.
- Fig. S5. Expression of identified target genes in the CCLE RNA-Seq dataset used for validation.
- Fig. S6. Expression of identified target genes in the Genentech dataset used for validation.
An addition of a paragraph in the discussion section that discusses the intracellular origins of resistance to deformation and the dominance of actin cortex at low deformations.
- Refinement of the manuscript text and figures based on the specific feedback from the Reviewers.
Please see below for detailed responses to the Reviewers’ comments.
Reviewer #1 (Public Review)
In this work, Urbanska and colleagues use a machine-learning based crossing of mechanical characterisations of various cells in different states and their transcriptional profiles. Using this approach, they identify a core set of five genes that systematically vary together with the mechanical state of the cells, although not always in the same direction depending on the conditions. They show that the combined transcriptional changes in this gene set is strongly predictive of a change in the cell mechanical properties, in systems that were not used to identify the genes (a validation set). Finally, they experimentally after the expression level of one of these genes, CAV1, that codes for the caveolin 1 protein, and show that, in a variety of cellular systems and contexts, perturbations in the expression level of CAV1 also induce changes in cell mechanics, cells with lower CAV1 expression being generally softer.
Overall the approach seems accessible, sound and is well described. My personal expertise is not suited to judge its validity, novelty or relevance, so I do not make comments on that. The results it provides seem to have been thoroughly tested by the authors (using different types of mechanical characterisations of the cells) and to be robust in their predictive value. The authors also show convincingly that one of the genes they identified, CAV1, is not only correlated with the mechanical properties of cells, but also that changing its expression level affects cell mechanics. At this stage, the study appears mostly focused on the description and validation of the methodological approach, and it is hard to really understand what the results obtain really mean, the importance of the biological finding - what is this set of 5 genes doing in the context of cell mechanics? Is it really central, or is it just one of the set of knobs on which the cell plays - and it is identified by this method because it is systematically modulated but maybe, for any given context, it is not the dominant player - all these fundamental questions remain unanswered at this stage. On one hand, it means that the study might have identified an important novel module of genes in cell mechanics, but on the other hand, it also reveals that it is not yet easy to interpret the results provided by this type of novel approach.
We thank the Reviewer #1 for the thoughtful evaluation of our manuscript. The primary goal of the manuscript was to present a demonstration of an unbiased approach for the identification of genes involved in the regulations of cell mechanics. The manuscript further provides a comprehensive computational validation of all genes from the identified network, and experimental validation of a selected gene, CAV1.
We agree that at the current stage, far-reaching conclusions about the biological meaning of the identified network cannot be made. We are, however, convinced that the identification of an apparently central player such as CAV1 across various cellular systems is per se meaningful, in particular since CAV1 modulation shows clear effects on the cell mechanical state in several cell types.
We anticipate that our findings will encourage more mechanistic studies in the future, investigating how these identified genes regulate mechanical properties and interact with each other. Notwithstanding, the identified genes (after testing in specific system of interest) can be readily used as genetic targets for modulating mechanical properties of cells. Access to such modifications is of huge relevance not only for performing further research on the functional consequence of cell mechanics changes (in particular in in-vivo systems where using chemical perturbations is not always possible), but also for the potential future implementation in modulating mechanical properties of the cells to prevent disease (for example to inhibit cancer metastasis or increase efficacy of cancer cell killing by cytotoxic T cells).
We have now added a following sentence in the first paragraph of discussion to acknowledge the open ends of our study:
“(...). Here we leveraged this opportunity by performing discriminative network analysis on transcriptomes associated with mechanical phenotype changes to elucidate a conserved module of five genes potentially involved in cell mechanical phenotype regulation. We provided evidence that the inferred conserved functional network module contains an ensemble of five genes that, in particular when combined in a unique combinatorial marker, are universal, specific and trustworthy markers of mechanical phenotype across the studied mouse and human systems. We further demonstrated on the example of a selected marker gene, CAV1, that its experimental up- and downregulation impacts the stiffness of the measured cells. This demonstrates that the level of CAV1 not only correlates with, but also is causative of mechanical phenotype change. The mechanistic insights into how precisely the identified genes are involved in regulating mechanical properties, how they interact with each other, and whether they are universal and dominant in various contexts all remain to be established in
future studies.”
Reviewer #2 (Public Review)
A key strength is the quantitative approaches all add rigor to what is being attempted. The approach with very different cell culture lines will in principle help identify constitutive genes that vary in a particular and predictable way. To my knowledge, one other study that should be cited posed a similar pan-tissue question using mass spectrometry proteomics instead of gene expression, and also identified a caveolae component (cavin-1, PTRF) that exhibited a trend with stiffness across all sampled tissues. The study focused instead on a nuclear lamina protein that was also perturbed in vitro and shown to follow the expected mechanical trend (Swift et al 2013).
We thank the Reviewer #2 for the positive evaluation of the breadth of the results and for pointing us to the relevant reference for the proteomic analysis related to tissue stiffness (Swift et al., 2013). This study, which focused primarily on the tissue-level mechanical properties, identifying PTRF, a caveolar component, which links to our observation of another caveolar component, CAV1, at the single-cell level.
We have now included the citation in the following paragraph of the discussion:
“To our knowledge, there are no prior studies that aim at identifying gene signatures associated with single-cell mechanical phenotype changes, in particular across different cell types. There are, however, several studies that investigated changes in expression upon exposure of specific cell types to mechanical stimuli such as compression (87, 88) or mechanical stretch (22, 80, 89), and one study that investigated difference in expression profiles between stiffer and softer cells sorted from the same population (90). Even though the studies concerned with response to mechanical stimuli answer a fundamentally different question (how gene expression changes upon exposure to external forces vs which genes are expressed in cells of different mechanical phenotype), we did observe some similarities in the identified genes. For example, in the differentially expressed genes identified in the lung epithelia exposed to compression (87), three genes from our module overlapped with the immediate response (CAV1, FHL2, TGLN) and four with the long-term one (CAV1, FHL2, TGLN, THBS1). We speculate that this substantial overlap is caused by the cells undergoing change in their stiffness during the response to compression (and concomitant unjamming transition). Another previous study explored the association between the stiffness of various tissues and their proteomes. Despite the focus on the tissue-scale rather than single-cell elasticity, the authors identified polymerase I and transcript release factor (PTRF, also known as cavin 1 and encoding for a structural component of the caveolae) as one of the proteins that scaled with tissue stiffness across samples (91).”
Reviewer #3 (Public Review)
In this work, Urbanska et al. link the mechanical phenotypes of human glioblastoma cell lines and murine iPSCs to their transcriptome, and using machine learning-based network analysis identify genes with putative roles in cell mechanics regulation. The authors identify 5 target genes whose transcription creates a combinatorial marker which can predict cell stiffness in human carcinoma and breast epithelium cell lines as well as in developing mouse neurons. For one of the target genes, caveolin1 (CAV1), the authors perform knockout, knockdown, overexpression and rescue experiments in human carcinoma and breast epithelium cell lines. They determine the cell stiffness via RT-DC, AFM indentation and AFM rheology and confirm that high CAV1 expression levels correlate with increased stiffness in those model systems. This work brings forward an interesting approach to identify novel genes in an unbiased manner, but surprisingly the authors validate caveolin 1, a target gene with known roles in cell mechanics regulation.
I have two main concerns with the current version of this work:
(1) The authors identify a network of 5 genes that can predict mechanics. What is the relationship between the 5 genes? If the authors aim to highlight the power of their approach by knockdown, knockout or over-expression of a single gene why choose CAV1 (which has an individual p-value of 0.16 in Fig S4)? To justify their choice, the authors claim that there is limited data supporting the direct impact of CAV1 on mechanical properties of cells but several studies have previously shown its role in for example zebrafish heart stiffness, where a knockout leads to higher stiffness (Grivas et al., Scientific Reports 2020), in cancer cells, where a knockdown leads to cell softening (Lin et al., Oncotarget 2015), or in endothelial cell, where a knockout leads to cell softening (Le Master et al., Scientific Reports 2022).
We thank the reviewer for their comments. First, we do acknowledge that studying the relationship between the five identified genes is an intriguing question and would be a natural extension of the currently presented work. It is, however, beyond the scope of presented manuscript, in which our primarily goal was to introduce a general pipeline for de novo identification of genes related to cell mechanics. We did add a following statement in the discussion (yellow highlight) to acknowledge the open ends of our study:
“The mechanical phenotype of cells is recognized as a hallmark of many physiological and pathological processes. Understanding how to control it is a necessary next step that will facilitate exploring the impact of cell mechanics perturbations on cell and tissue function (76).
The increasing availability of transcriptional profiles accompanying cell state changes has recently been complemented by the ease of screening for mechanical phenotypes of cells thanks to the advent of high-throughput microfluidic methods (77). This provides an opportunity for data-driven identification of genes associated with the mechanical cell phenotype change in a hypothesis-free manner. Here we leveraged this opportunity by performing discriminative network analysis on transcriptomes associated with mechanical phenotype changes to elucidate a conserved module of five genes potentially involved in cell mechanical phenotype regulation. We provided evidence that the inferred conserved functional network module contains an ensemble of five genes that, in particular when combined in a unique combinatorial marker, are universal, specific and trustworthy markers of mechanical phenotype across the studied mouse and human systems. We further demonstrated on the example of a selected marker gene, CAV1, that its experimental up- and downregulation impacts the stiffness of the measured cells. This demonstrates that the level of CAV1 not only correlates with, but also is causative of mechanical phenotype change. The mechanistic insights into how precisely the identified genes are involved in regulating mechanical properties, how they interact with each other, and whether they are universal and dominant in various contexts all remain to be established in future studies.”
Regarding the selection of CAV1 as the gene that we used for validation experiment; as mentioned in the introductory paragraph of the result section “Perturbing expression levels of CAV1 changes cells stiffness” (copied below), we were encouraged by the previous data already linking CAV1 with cell mechanics when selecting it as our first target. The relationship between CAV1 and cell mechanics regulation, however, is not very well established (of note, two of the latest manuscripts came out after the initial findings of our study).
Regarding the citations suggested by the reviewer: two are already included in the original manuscript (Lin et al., Oncotarget 2015 – Ref (63), Le Master –2022 Ref (67)), along with an additional one (Hsu et al 2018 (66)), and the third one (Grivas et al, 2020 (68)) is now also added to the manuscript. Though, we would like to highlight that even though Grivas et al state that the CAV1 KO cells are stiffer, the AFM indentation measurements were performed on the cardiac tissue, with a spherical tip of 30 μm radius and likely reflect primarily supracelluar, tissue-scale properties, as opposed to cell-scale measurements performed in our study (we used cultured cells which mostly lack the extracellular tissue structures, deformability cytometry was performed on dissociated cells and picks up on cell properties exclusively, and in case of AFM measurements a spherical tip with 5 μm radius was used).
“We decided to focus our attention on CAV1 as a potential target for modulating mechanical properties of cells, as it has previously been linked to processes intertwined with cell mechanics. In the context of mechanosensing, CAV1 is known to facilitate buffering of the membrane tension (45), play a role in β1-inegrin-dependent mechanotransduction (58) and modulate the mechanotransduction in response to substrate stiffness (59). CAV1 is also intimately linked with actin cytoskeleton — it was shown to be involved in cross-talk with Rho-signaling and actin cytoskeleton regulation (46, 60–62), filamin A-mediated interactions with actin filaments (63), and co-localization with peripheral actin (64). The evidence directly relating CAV1 levels with the mechanical properties of cells (47, 62, 65, 66) and tissues (66, 67) , is only beginning to emerge.”
Regarding the cited p-value of 0.16, we would like to clarify that it is the p-value associated with the coefficient of the crude linear regression model fitted to the data for illustrative purposes in Fig S4. This value only says that from the linear fit we cannot conclude much about the correlation of the level of Cav1 with the Young’s modulus change. Much more relevant parameters to look at are the AUC-ROC values and associated p-values reported in the Table 4 in the main text (see below), which show good performance of CAV1 in separating soft and stiff cell states.
The positive hypothesis I assumes that markers are discriminative of samples with stiff/soft mechanical phenotype regardless of the studied biological system, and CAV1 has a clear trend with the minimum AUC-ROC on 3 datasets of 0.78, even though the p-value is below the significance level. The positive hypothesis II assumes that markers are discriminative of samples with stiff/soft mechanical phenotype in carcinoma regardless of data source, and CAV1 has a clear significance because the minimum AUC-ROC on 3 datasets is 0.89 and the p-value is 0.02.
(2) The authors do not show how much does PC-Corr outperforms classical co-expression network analysis or an alternative gold standard. It is worth noting that PC-Corr was previously published by the same authors to infer phenotype-associated functional network modules from omics datasets (Ciucci et al., Scientific Reports 2017).
As pointed out by the Reviewer, PC-corr has been introduced and characterized in detail in a previous publication (Ciucci et al, 2017, Sci. Rep.), where it was compared against standard co-expression analysis (below reported as: p-value network) on molecules selected using univariate statistical analysis.
See the following fragment of Discussion in Ciucci et al, 2017:
“The PC-corr networks were always compared to P-value networks. The first strategical difference lies in the way features are selected: while the PC-corr adopts a multivariate approach, i.e. it uses a combination of features that are responsible for the sample discrimination, in the P-value network the discriminating features are singly selected (one by one) with each Mann-Whitney test (followed by Benjamini-Hochberg procedure). The second strategical difference lies in the generation of the correlation weights in the network. PC-corr combines in parallel and at the same time in a unique formula the discrimination power of the PC-loadings and the association power of the Pearson correlation, directly providing in output discriminative omic associations. These are generated using a robust (because we use as merging factor the minimum operator, which is a very penalizing operator) mathematical trade-off between two important factors: multivariate discriminative significance and correlation association. In addition, as mentioned above, the minimum operator works as an AND logical gate in a digital circuit, therefore in order to have a high link weight in the PCcorr network, both the discrimination (the PC-loadings) and the association (the Pearson correlations) of the nodes adjacent to the link should be simultaneously high. Instead, the Pvalue procedure begins with the pre-selection of the significant omic features and, only in a second separated step, computes the associations between these features. Therefore, in P-value networks, the interaction weights are the result neither of multivariate discriminative significance, nor of a discrimination/association interplay.”
Here we implement PC-corr for a particular application and do not see it as central to the message of the present manuscript to compare it with other available methods. We considered it much more relevant to focus on an in-silico validation on dataset not used during the PCcorr analysis (see Table 3 and 4 for details).
Altogether, the authors provide an interesting approach to identify novel genes associated with cell mechanics changes, but the current version does not fulfill such potential by focusing on a single gene with known roles in cell mechanics.
Our manuscript presents a demonstration of an overall approach for the identification of genes involved in the regulation of cell mechanics, and the perturbations performed on CAV1 have a demonstrative role (please also refer to the explanations of why we decided to perform the verification focused on CAV1 above). The fact that we identify CAV1, which has been implicated in regulating cell mechanics in a handful of studies, de novo and in an unbiased way speaks to the power of our approach. We do agree that investigation into the effect of manipulating the expression of the remaining genes from the identified network module, as well as into the mutual relationships between those genes and their covariance in perturbation experiments, constitutes a desirable follow-up on the presented results. It is, however, beyond the scope of the current manuscript. Regardless, the other genes identified can be readily tested in systems of interest and used as potential knobs for tuning mechanical properties on demand.
Reviewer #1 (Recommendations For Authors)
I am not a specialist of the bio-informatics methods used in this study, so I will not make any specific technical comments on them.
In terms of mechanical characterisation of cells, the authors use well established methods and the fact that they systematically validate their findings with at least two independent methods (RT-DC and AFM for example) makes them very robust. So I have no concerns with this part. The experiments of perturbations of CAV 1 are also performed to the best standards and the results are clear, no concern on that.
My main concerns are rather questions I was asking myself and could not answer when reading the article. Maybe the authors could find ways to clarify them - the discussion of their article is already very long and maybe it should not be lengthened to much. In my opinion, some of the points discussed are not really essential and rather redundant with other parts of the paper. This could be improved to give some space to clarify some of the points below:
We thank the Reviewer #1 for an overall positive evaluation of the manuscript as well as the points of criticism which we addressed in a point-by-point manner below.
(1) This might be a misunderstanding of the method on my side, but I was wondering whether it is possible to proceed through the same steps but choose other pairs of training datasets amongst the 5 systems available (there are 10 such pairs if I am not mistaken) and ask whether they always give the same set of 5 genes. And if not, are the other sets also then predictive, robust, etc. Or is it that there are 'better' pairs than others in this respect. Or the set of 5 genes is the only one that could be found amongst these 5 datasets - and then could it imply that it is the only group 'universal' group of predictive genes for cell mechanics (when applied to any other dataset comprising similar mechanical measures and expression profiles, for other cells, other conditions)?
I apologize in case this question is just the result of a basic misunderstanding of the method on my side. But I could not answer the question myself based on what is in the article and it seems to be important to understand the significance of the finding and the robustness of the method.
We thank the Reviewer for this question. To clarify: while in general it is possible to proceed through the same analysis steps choosing a different pair of datasets (see below for examples), we have purposefully chosen those two and not any other datasets because they encompassed the highest number of samples per condition in the RNAseq data (see Fig 4 and Table R1 below), originated from two different species and concerned least related tissues (the other option for mouse would be neural progenitors which in combination with the glioblastoma would likely result in focusing on genes expressed in neural tissues). This is briefly explained in the following fragment of the manuscript on Page 10:
“For the network construction, we chose two datasets that originate from different species, concern unrelated biological processes, and have a high number of samples included in the transcriptional analysis: human glioblastoma and murine iPSCs (Table 1).”
To further address the comment of the reviewer: there is indeed a total of 10 possible two-set combinations of datasets, 6 of those pairs are human-mouse combinations (highlighted in orange in Author response Table 1), 3 are human-human combinations (highlighted in blue), and 1 is mousemouse (marked in green).
Author response table 1.
Possible two-set combinations of datasets. For each combination, the number of common genes is indicated. The number on the diagonal represents total number of transcripts in the individual datasets, n corresponds to the number of samples in the respective datasets. * include non-coding genes.
To reiterate, we have chosen the combination of set A (glioblastoma) and set D (iPSCs) to choose datasets from different species and with highest sample number.
As for the other combinations of human-mouse datasets:
• set A & E lead to derivation of a conserved module, however as expected this module includes genes specific for neuronal tissues (such as brain & testis specific immunoglobulin IGSF11, or genes involved in neuronal development such as RFX4, SOX8)
Author response image 1.
• the remaining combinations (set B&D, B&E, C&D and C&E) do not lead to a derivation of a highly interconnected module
Author response image 2.
Author response image 3.
Author response image 4.
Author response image 5.
Finally, it would have also been possible to perform the combined PC-corr procedure on all 5 datasets. However, this would prevent us from doing validation using unknown datasets.
Hence, we decided to proceed with the 2 discovery and 4 validation datasets.
For the sake of completeness, we present below some of the networks obtained from the analysis performed on all 5 datasets (which intersect at 8059 genes).
Author response image 6.
The above network was created by calculating mean/minimum PC-corr among all five datasets and applying the threshold. The thresholding can be additionally restricted in that we:
a. constrain the directionality of the correlation between the genes (𝑠𝑔𝑛(𝑐) ) to be the same among all or at least n datasets
b. constrain the directionality of the correlation between the cell stiffness and gene expression level (𝑠𝑔𝑛(𝑉)) for individual genes.
Some of the resulting networks for such restrictions are presented below.
Author response image 7.
Author response image 8.
Of note, some of the nodes from the original network presented in the paper (CAV1, FHL2, and IGFBP7) are preserved in the 5-set network (and highlighted with blue rims),
(2) The authors already use several types of mechanical characterisation of the cells, but there are even more of them, in particular, some that might not directly correspond to global cell stiffness but to other aspects, like traction forces, or cell cortex rheology, or cell volume or passage time trough constrictions (active or passive) - they might all be in a way or another related, but they are a priori independent measures. Would the authors anticipate finding very different 'universal modules' for these other mechanical properties, or again the same one? Is there a way to get at least a hint based on some published characterisations for the cells used in the study? Basically, the question is whether the gene set identified is specific for a precise type of mechanical property of the cell, or is more generally related to cell mechanics modulation - maybe, as suggested by the authors because it is a set of molecular knobs acting upstream of general mechanics effectors like YAP/TAZ or acto-myosin?
We thank the Reviewer for this comment. We would like to first note that in our study, we focused on single-cell mechanical phenotype understood as a response of the cells to deformation at a global (RT-DC) or semi-local (AFM indentation with 5-μm bead) level and comparatively low deformations (1-3 μm, see Table S9). There is of course a variety of other methods for measuring cell mechanics and mechanics-related features, such as traction force microscopy mentioned by the reviewer. Though, traction force microscopy probes how the cells apply forces and interact with their environment rather than the inherent mechanical properties of the cells themselves which were the main interest of our study.
Nevertheless, as mentioned in the discussion, we found some overlap with the genes identified in other mechanical contexts, for example in the context of mechanical stretching of cells:
“Furthermore, CAV1 is known to modulate the activation of transcriptional cofactor yesassociated protein, YAP, in response to changes in stiffness of cell substrate (60) and in the mechanical stretch-induced mesothelial to mesenchymal transition (74).”
Which suggests that the genes identified here may be more broadly related to mechanical aspects of cells.
Of note, we do have some insights connected to the changes of cell volume — one of the biophysical properties mentioned by the reviewer — from our experiments. For all measurements performed with RT-DC, we can also calculate cell volumes from 2D cell contours (see Author response images 9, 10, and 11). For most of the cases (all apart from MEF CAV1KO), the stiffer phenotype of the cells, associated with higher levels of CAV1, shows a higher volume.
Author response image 9.
Cell volumes for the divergent cell states in the five characterized biological systems. (A) Glioblastoma. (B) Carcinoma, (C) MCF10A, (D) iPSCs, (E) Developing neurons. Data corresponds to Figure 2. Cell volumes were estimated using Shape-Out 1.0.10 by rotation of the cell contours.
Author response image 10.
Cell volumes for CAV1 perturbation experiments. (A) CAV1 knock down performed in TGBC cells. (B) CAV1 overexpression in ECC4 and TGBC cells. Data corresponds to Figure 5. Cell volumes were estimated using Shape-Out 1.0.10 by rotation of the cell contours.
Author response image 11.
Cell volumes for WT and CAV1KO MEFs. Data corresponds to Figure S9. Cell volumes were estimated using Shape-Out 1.0.10 by rotation of the cell contours.
(3) The authors have already tested a large number of conditions in which perturbations of the level of expression of CAV1 correlates with changes in cell mechanics, but I was wondering whether it also has some direct explanatory value for the initial datasets used - for example for the glioblastoma cells from Figure 2, in the different media, would a knock-down of CAV1 prevent the increase in stiffness observed upon addition of serum, or for the carcinoma cells from different tissues treated with different compounds - if I understand well, the authors have tested a subset of these (ECC4 versus TGBC in figure 5) - how did they choose these and how general is it that the mechanical phenotype changes reported in Figure 2 are all mostly dependant on CAV1 expression level? I must say that the way the text is written and the results shown, it is hard to tell whether CAV1 is really having a dominant effect on cell mechanics in most of these contexts or only a partial effect. I hope I am being clear in my question - I am not questioning the conclusions of Figures 5 and 6, but asking whether the level of expression of CAV1, in the datasets reported in Figure 2, is the dominant explanatory feature for the differences in cell mechanics.
We thank reviewer for this comment and appreciate the value of the question about the generality and dominance of CAV1 in influencing cell mechanics.
On the computational side, we have addressed these issues by looking at the performance of CAV1 (among other identified genes) in classifying soft and stiff phenotypes across biological systems (positive hypothesis I), as well as across data of different type (sequencing vs microarray data) and origin (different research institutions) (positive hypothesis II). CAV1 showed strong classification performance (Table 4), suggesting it is a general marker of stiffness changes.
On the experimental side, we conducted the perturbation experiments in two systems of choice: two intestinal carcinoma cell lines (ECC4 and TGBC) and the MCF10A breast epithelial cell line. These choices were driven by ease of handling, accessibility, as well as (for MCF10A) connection with a former study (Taveres et al, 2017). While we observed correlations between CAV1 expression and cell mechanics in wide range of datasets, the precise role of CAV1 in each system may vary, and further perturbation experiments in specific systems could be performed to solidify the direct/dominant role of CAV1 in cell mechanics. We hypothesize that the suggested knockdown of CAV1 upon serum addition in glioblastoma cells could reduce or prevent the increase in stiffness observed, though this experiment has not been performed.
In conclusion, while the computational analysis gives us confidence that CAV1 is a good indicator of cell stiffness, we predict that it acts in concert with other genes and in specific context could be replaced by other changes. We suggest that the suitability of CAV1 for manipulation of the mechanical properties should be tested in each system of interested before use.
To highlight the fact that the relevance of CAV1 for modulating cell mechanics in specific systems of interest should be tested and the mechanistic insights into how CAV1 regulates cell mechanics are still missing, we have added the following sentence in the discussion:
“The mechanical phenotype of cells is recognized as a hallmark of many physiological and pathological processes. Understanding how to control it is a necessary next step that will facilitate exploring the impact of cell mechanics perturbations on cell and tissue function (76). The increasing availability of transcriptional profiles accompanying cell state changes has recently been complemented by the ease of screening for mechanical phenotypes of cells thanks to the advent of high-throughput microfluidic methods (77). This provides an opportunity for data-driven identification of genes associated with the mechanical cell phenotype change in a hypothesis-free manner. Here we leveraged this opportunity by performing discriminative network analysis on transcriptomes associated with mechanical phenotype changes to elucidate a conserved module of five genes potentially involved in cell mechanical phenotype regulation. We provided evidence that the inferred conserved functional network module contains an ensemble of five genes that, in particular when combined in a unique combinatorial marker, are universal, specific and trustworthy markers of mechanical phenotype across the studied mouse and human systems. We further demonstrated on the example of a selected marker gene, CAV1, that its experimental up- and downregulation impacts the stiffness of the measured cells. This demonstrates that the level of CAV1 not only correlates with, but also is causative of mechanical phenotype change. The mechanistic insights into how precisely the identified genes are involved in regulating mechanical properties, how they interact with each other, and whether they are universal and dominant in various contexts all remain to be established in future studies.”
(4) It would be nice that the authors try to more directly address, in their discussion, what is the biological meaning of the set of 5 genes that they found - is it really mostly a product of the methodology used, useful but with little specific relevance to any biology, or does it have a deeper meaning? Either at a system level, or at an evolutionary level.
We would like to highlight that our manuscript is focused on the method that we introduce to identify sets of genes involved in the regulation of cell mechanics. The first implementation included here is only the beginning of this line of work which, in the future, will include looking in detail at the biological meaning and the interconnectivity of the genes identified. Most likely, there is a deeper meaning of the identified module which could be revealed with a lot of dedicated future work. As it is a mere speculation at this point, we would like to refrain from going into more detail about it in the current manuscript. We provide below a few words of extended explanation and additional analysis that can shed light on the current limited knowledge of the connections between the genes and evolutionary preservation of the genes.
While it is difficult to prove at present, we do believe that the identified node of genes may have an actual biological meaning and is not a mere product of the used methodology. The PC-corr score used for applying the threshold and obtaining the gene network is high only if the Pearson’s correlation between the two genes is high, meaning that the high connected module of genes identified show corelated expression and is likely co-regulated. Additionally, we performed the GO Term analysis using DAVID to assess the connections between the genes (Figure S3). We have now performed an additional analysis using two orthogonal tools the functional protein association tool STRING and KEGG Mapper.
With STRING, we found a moderate connectivity using the five network nodes identified in our study, and many of the obtained connections were based on text mining and co-expression, rather than direct experimental evidence (Author response image 12A). A more connected network can be obtained by allowing STRING to introduce further nodes (Author response image 12B). Interestingly, some of the nodes included by STRING in the extended network are nodes identified with milder PCcorr thresholds in our study (such as CNN2 or IGFBP3, see Table S3).
With KEGG Mapper, we did not find an obvious pathway-based clustering of the genes from the module either. A maximum of two genes were assigned to one pathway and those included:
• focal adhesions (pathway hsa04510): CAV1 and THBS1
• cytoskeleton in muscle cells (pathway hsa04820): FHL2 and THBS1
• proteoglycans in cancer (pathway hsa05205): CAV1 and THBS1.
As for the BRITE hierarchy, following classification was found:
• membrane trafficking(hsa04131): CAV1, IGFBP7, TAGLN, THBS, with following subcategories:
- endocytosis / lipid raft mediated endocytosis/caveolin-mediated endocytosis:
CAV1
- endocytosis / phagocytosis / opsonins: THBS1
- endocytosis / others/ insulin-like growth factor-binding proteins: IGFBP7 o others / actin-binding proteins/others: TAGLN.
Taken together, all that analyses (DAVID, STRING, KEGG) show that at present no direct relationship/single pathway can be found that integrates all the genes from the identified modules. Future experiments, including investigations of how other module nodes are affected when one of the genes is manipulated, will help to establish actual physical or regulatory interactions between the genes from our module.
To touch upon the evolutionary perspective, we provide an overview of occurrence of the genes from the identified module across the evolutionary tree. This overview shows that the five identified genes are preserved in phylum Chordata with quite high sequence similarity, and even more so within mammals (Author response image 13).
Author response image 12.
Visualisation of interactions between the nodes in the identified module using functional protein association networks tool STRING. (A) Connections obtained using multiple proteins search and entering the five network nodes. (B) Extended network that includes further genes to increase indirect connectivity. The genes are added automatically by STRING. Online version of STRING v12.0 was used with Homo sapiens as species of interest.
Author response image 13.
Co-occurrence of genes from the network module across the evolutionary tree. Mammals are indicated with the green frame, glires (include mouse), as well as primates (include human) are indicated with yellow frames. The view was generated using online version of STRING 12.0.
Reviewer #2 (Recommendations For Authors)
(1) The authors need to discuss the level of sensitivity of their mechanical measurements with RT-DC for changes to the membrane compared to changes in microtubules, nucleus, etc. The limited AFM measurements also seem membrane/cortex focused. For these and further reasons below, "universal" doesn't seem appropriate in the title or abstract, and should be deleted.
We thank the reviewer for this comment. Indeed, RT-DC is a technique that deforms the entire cell to a relatively low degree (inducing ca 17% mean strain, i.e. a deformation of approximately 2.5 µm on a cell with a 15 µm diameter, see Table S9 and Urbanska et al., Nat Methods 2020). Similarly, the AFM indentation experiments performed in this study (using a 5-µm diameter colloidal probe and 1 µm indentation) induce low strains, at which, according to current knowledge, the actin cortex dominates the measured deformations. However, other cellular components, including the membrane, microtubules, intermediate filaments, nucleus, other organelles, and cytoplasmic packing, can also contribute. We have reviewed these contributions in detail in a recent publication (Urbanska and Guck, 2024, Ann Rev Biophys., PMID 38382116). For a particular system, it is hard to speculate without further investigation which parts of the cell have a dominant effect on the measured deformability. We have added now a following paragraph in the discussion to include this information:
“The mechanical phenotype of single cells is a global readout of cell’s resistance to deformation that integrates contributions from all cellular components. The two techniques implemented for measuring cell mechanical in this study — RT-DC and AFM indentation using a spherical indenter with 5 µm radius — exert comparatively low strain on cells (< 3 µm, see Table S9), at which the actin cortex is believed to dominate the measured response. However, other cellular components, including the membrane, microtubules, intermediate filaments, nucleus, other organelles, and cytoplasmic packing, also contribute to the measured deformations (reviewed in detail in (79)) and, for a particular system, it is hard to speculate without further investigation which parts of the cell have a dominant effect on the measured deformability.”
The key strength of measuring the global mechanics is that such measurements are agnostic of the specific origin of the resistance to shape change. As such, the term “universal” could be seen as rather appropriate, as we are not testing specific contributions to cell mechanics, and we see the two methods used (RT-DC and AFM indentation) as representative when it comes to measuring global cell mechanics. And we highlighted many times throughout the text that we are measuring global single-cell mechanical phenotype.
Most importantly, however, we have used the term “universal” to capture that the genes are preserved across different systems and species, not in relation to the type of mechanical measurements performed and as such we would like to retain the term in the title.
(2) Fig.2 cartoons of tissues is a good idea to quickly illustrate the range of cell culture lines studied. However, it obligates the authors to examine the relevant primary cell types in singlecell RNAseq of human and/or mouse tissues (e.g. Tabula Muris). They need to show CAV1 is expressed in glioblastoma, iPSCs, etc and not a cell culture artifact. CAV1 and the other genes also need to be plotted with literature values of tissue stiffness.
We thank the reviewer for this the comment; however, we do believe that the cartoons in Figure 2 should assist the reader to readily understand whether cultured cells derived from the respective tissues were used (see cartoons representing dishes), or the cells directly isolated from the tissue were measured (this is the case for the developing neurons dataset).
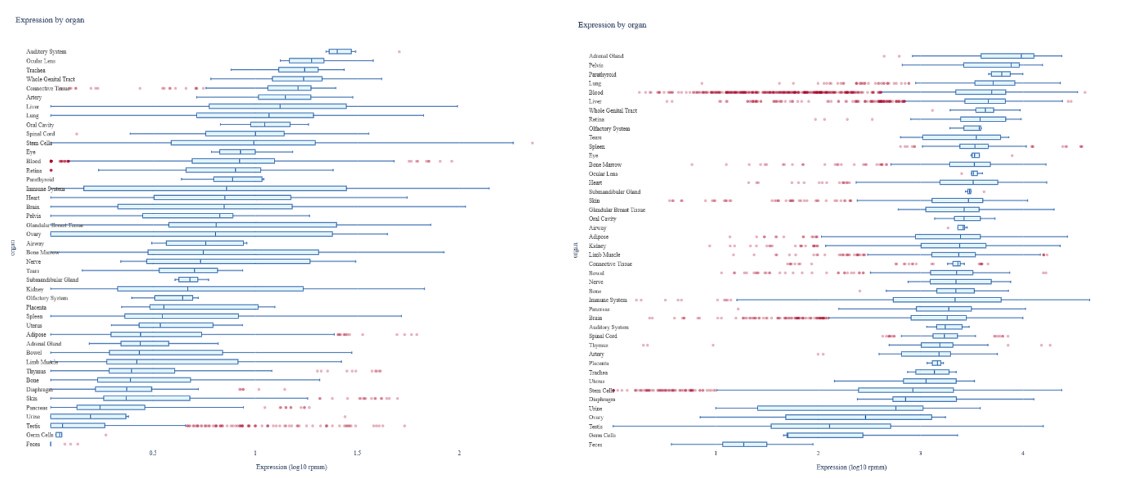
We did, however, follow the suggestion of the reviewer to use available resources and checked the expression of genes from the identified network module across various tissues in mouse and human. We first used the Mouse Genome Informatics (MGI; https://www.informatics.jax.org/) to visualize the expression of the genes across organs and organ systems (Author response image 14) as well as across more specific tissue structures (Author response image 15). These two figures show that the five identified genes are expressed quite broadly in mouse. We next looked at the expression of the five genes in the scRNASeq dataset from Tabula Muris (Author response image 16). Here, the expression of respective genes seemed more restricted to specific cell clusters. Finally, we also collected the cross-tissue expression of the genes from our module in human tissues from Human Protein Atlas v23 at both mRNA (Author response image 17) and protein (Author response image 18) levels. CAV1, IGFBP7, and THBS1 showed low tissue specificity at mRNA level, FHL2 was enriched in heart muscle and ovary (the heart enrichment is also visible in Author response image 15 for mouse) and TAGLN in endometrium and intestine. Interestingly, the expression at the protein level (Author response image 18) did not seem to follow faithfully the mRNA levels (Author response image 17). Overall, we conclude that the identified genes are expressed quite broadly across mouse and human tissues.
Author response image 14.
Expression of genes from the identified module across various organ and organ systems in mouse. The expression matrices for organs (A) and organ systems (B) were generated using Tissue x Gene Matrix tool of Gene eXpression Database (https://www.informatics.jax.org/gxd/, accessed on 22nd September 2024). No pre-selection of stage (age) and assay type (includes RNA and protein-based assays) was applied. The colors in the grid (blues for expression detected and reds for expression not detected) get progressively darker when there are more supporting annotations. The darker colors do not denote higher or lower levels of expression, just more evidence.
Author response image 15.
Expression of genes from the identified module across various mouse tissue structures. The expression matrices for age-selected mouse marked as adult (A) or young individuals (collected ages labelled P42-84 / P w6-w12 / P m1.5-3.0) (B) are presented and were generated using RNASeq Heatmap tool of Gene eXpression Database (https://www.informatics.jax.org/gxd/, accessed on 2nd October 2024).
Author response image 16.
Expression of genes from the identified module across various cell types and organs in t-SNE embedding of Tabula Muris dataset. (A) t-SNE clustering color-coded by organ. (B-F) t-SNE clustering colorcoded for expression of CAV1 (B), IGFBP7 (C), FHL2 (D), TAGLN (E), and THBS1 (F). The plots were generated using FACS-collected cells data through the visualisation tool available at https://tabulamuris.sf.czbiohub.org/ (accessed on 22nd September 2024).
Author response image 17.
Expression of genes from the identified module at the mRNA level across various human tissues. (A-E) Expression levels of CAV1 (A), IGFBP7 (B), FHL2 (C), TAGLN (D), and THBS1 (E). The plots were generated using consensus dataset from Human Protein Atlas v23 https://www.proteinatlas.org/ (accessed on 22nd September 2024).
Author response image 18.
Protein levels of genes from the identified module across various human tissues. (A-E) Protein levels of CAV1 (A), IGFBP7 (B), FHL2 (C), TAGLN (D), and THBS1 (E). The plots were generated using Human Protein Atlas v23 https://www.proteinatlas.org/ (accessed on 22nd September 2024).
Regarding literature values and tissue stiffness, we would like to argue that cell stiffness is not equivalent to tissue stiffness, and we are interested in the former. Tissue stiffness is governed by a combination of cell mechanical properties, cell adhesions, packing and the extracellular matrix. There can be, in fact, mechanically distinct cell types (for example characterized by different metabolic state, malignancy level etc) within one tissue of given stiffness. Hence, we consider that testing for the correlation between tissue stiffness and expression of identified genes is not immediately relevant.
(3) Fig.5D,H show important time-dependent mechanics that need to be used to provide explanations of the differences in RT-DC (5B,F) and in standard AFM indentation expts (5C,G). In particular, it looks to me that RT-DC is a high-f/short-time measurement compared to the AFM indentation, and an additional Main or Supp Fig needs to somehow combine all of this data to clarify this issue.
We thank the reviewer for this comment. It is indeed the case, that cells typically display higher stiffness when probed at higher rates. We have now expanded on this aspect of the results and added a supplementary figure (Fig. S10) that illustrates the frequencies used in different methods and summarizes the apparent Young’s moduli values into one plot in a frequencyordered manner. Of note, we typically acquire RT-DC measurements at up to three flowrates, and the increase in measurement flow rates accompanying increase in flow rate also results in higher extracted apparent Young’s moduli (see Fig. S10 B,D). We have further added Table S9 that summarizes operating parameters of all three methods used for probing cell mechanics in this manuscript:
“The three techniques for characterizing mechanical properties of cells — RT-DC, AFM indentation and AFM microrheology — differ in several aspects (summarized in Table S9), most notably in the frequency at which the force is applied to cells during the measurements, with RT-DC operating at the highest frequency (~600 Hz), AFM microrheology at a range of frequencies in-between (3–200 Hz), and AFM indentation operating at lowest frequency (5 Hz) (see Table S9 and Figure S10A). Even though the apparent Young’s moduli obtained for TGBCS cells were consistently higher than those for ECC4 cells across all three methods, the absolute values measured for a given cell line varied depending on the methods: RT-DC measurements yielded higher apparent Young’s moduli compared to AFM indentation, while the apparent Young’s moduli derived from AFM microrheology measurements were frequency-dependent and fell between the other two methods (Fig. 5B–D, Fig. S10B). The observed increase in apparent Young’s modulus with probing frequency aligns with previous findings on cell stiffening with increased probing rates observed for both AFM indentation (68, 69) and microrheology assays (70–72).”
(4) The plots in Fig.S4 are important as main Figs, particularly given the cartoons of different tissues in Fig.1,2. However, positive correlations for a few genes (CAV1, IGFBP7, TAGLN) are most clear for the multiple lineages that are the same (stomach) or similar (gli, neural & pluri). The authors need to add green lines and pink lines in all plots to indicate the 'lineagespecific' correlations, and provide measures where possible. Some genes clearly don't show the same trends and should be discussed.
We thank reviewer for this comment. It is indeed an interesting observation (and worth highlighting by adding the fits to lineage-restricted data) that the relationship between relative change in Young’s modulus and the selected gene expression becomes steeper for samples from similar tissue contexts.
For the sake of keeping the main manuscript compact, we decided to keep Fig. S7 (formerly Fig. S4) in the supplement, however, we did add the linear fit to the glioblastoma dataset (pink line) and a fit to the related neural/embryonic datasets (gli, neural & pluri – purple line) as advised — see below.
We did not pool the stomach data since it is represented by a single point in the figure, aligning with how the data is presented in the main text—stomach adenocarcinoma cell lines (MKN1 and MKN45) are pooled in Fig. 1B (see below).
We have also amended the respective results section to emphasize that, in certain instances, the correlation between changes in mechanical phenotype and alterations in the expression of analysed genes may be less pronounced:
“The relation between normalized apparent Young’s modulus change and fold-change in the expression of the target genes is presented in Fig. S7. The direction of changes in the expression levels between the soft and stiff cell states in the validation datasets was not always following the same direction (Fig. 4, C to F, Fig. S7). This suggests that the genes associated with cell mechanics may not have a monotonic relationship with cell stiffness, but rather are characterized by different expression regimes in which the expression change in opposite directions can have the same effect on cell stiffness. Additionally, in specific cases a relatively high change in Young’s modulus did not correspond to marked expression changes of a given gene — see for example low CAV1 changes observed in MCF10A PIK3CA mutant (Fig. S7A), or low IGFBP7 changes in intestine and lung carcinoma samples (Fig. S7C). This indicates that the importance of specific targets for the mechanical phenotype change may vary depending on the origin of the sample.”
(5) Table-1 neuro: Perhaps I missed the use of the AFM measurements, but these need to be included more clearly in the Results somewhere.
To clarify: there were no AFM measurements performed for the developing neurons (neuro) dataset, and it is not marked as such in Table 1. There are previously published AFM measurements for the iPSCs dataset (maybe that caused the confusion?), and we referred to them as such in the table by citing the source (Urbanska et al (30)) as opposed to the statement “this paper” (see the last column of Table 1). We did not consider it necessary to include these previously published data. We have added additional horizontal lines to the table that will hopefully help in the table readability.
Reviewer #3 (For Authors)
Major
- I strongly encourage the authors to validate their approach with a gene for which mechanical data does not exist yet, or explore how the combination of the 5 identified genes is the novel regulator of cell mechanics.
We appreciate the reviewer’s insightful comment and agree that it would be highly interesting to validate further targets and perform combinatorial perturbations. However, it is not feasible at this point to expand the experimental data beyond the one already provided. We hope that in the future, the collective effort of the cell mechanics community will establish more genes that can be used for tuning of mechanical properties of cells.
- If this paper aims at highlighting the power of PC-Corr as a novel inference approach, the authors should compare its predictive power to that of classical co-expression network analysis or an alternative gold standard.
We thank the reviewer for the suggestion to compare the predictive power of PC-Corr with classical co-expression network analysis or an alternative gold standard. PC-corr has been introduced and characterized in detail in a previous publication (Ciucci et al, 2017, Sci. Rep.), where it was compared against standard co-expression analysis methods. Here we implement PC-corr for a particular application. Thus, we do not see it as central to the message of the present manuscript to compare it with other available methods again.
- The authors call their 5 identified genes "universal, trustworthy and specific". While they provide a great amount of data all is derived from human and mouse cell lines. I suggest toning this down.
We thank the reviewers for this comment. To clarify, the terms universal, trustworthy and specific are based on the specific hypotheses tested in the validation part of the manuscript, but we understand that it may cause confusion. We have now toned that the statement by adding “universal, trustworthy and specific across the studied mouse and human systems” in the following text fragments:
(1) Abstract
“(…) We validate in silico that the identified gene markers are universal, trustworthy and specific to the mechanical phenotype across the studied mouse and human systems, and demonstrate experimentally that a selected target, CAV1, changes the mechanical phenotype of cells accordingly when silenced or overexpressed. (...)”
(2) Last paragraph of the introduction
“(…) We then test the ability of each gene to classify cell states according to cell stiffness in silico on six further transcriptomic datasets and show that the individual genes, as well as their compression into a combinatorial marker, are universally, specifically and trustworthily associated with the mechanical phenotype across the studied mouse and human systems. (…)”
(3) First paragraph of the discussion
“We provided strong evidence that the inferred conserved functional network module contains an ensemble of five genes that, in particular when combined in a unique combinatorial marker, are universal, specific and trustworthy markers of mechanical phenotype across the studied mouse and human systems.”
Minor suggestions
- The authors point out how genes that regulate mechanics often display non-monotonic relations with their mechanical outcome. Indeed, in Fig.4 developing neurons have lower CAV1 in the stiff group. Perturbing CAV1 expression in that model could show the nonmonotonic relation and strengthen their claim.
We thank reviewer for highlighting this important point. It would indeed be interesting to explore the changes in cell stiffness upon perturbation of CAV1 in a system that has a potential to show an opposing behavior. Unfortunately, we are unable to expand the experimental part of the manuscript at this time. We do hope that this point can be addressed in future research, either by our team or other researchers in the field.
- In their gene ontology enrichment assay, the authors claim that their results point towards reduced transcriptional activity and reduced growth/proliferation in stiff compared to soft cells. Proving this with a simple proliferation assay would be a nice addition to the paper.
This is a valuable suggestion that should be followed up on in detail in the future. To give a preliminary insight into this line of investigation, we have had a look at the cell count data for the CAV1 knock down experiments in TGBC cells. Since CAV1 is associated with the GO Term “negative regulation of proliferation/transcription” (high CAV1 – low proliferation), we would expect that lowering the levels of CAV1 results in increased proliferation and higher cell counts at the end of experiment (3 days post transfection). As illustrated in Author response image 19 below, the cell counts were higher for the samples treated with CAV1 siRNAs, though, not in a statistically significant way. Interestingly, the magnitude of the effect partially mirrored the trends observed for the cell stiffness (Figure 5F).
Author response image 19.
The impact of CAV1 knock down on cell counts in TGBC cells. (A) Absolute cell counts per condition in a 6-well format. Cell counts were performed when harvesting for RT-DC measurements using an automated cell counter (Countess II, Thermo Fisher Scientific). (B) The event rates observed during the RT-DC measurements. The harvested cells are resuspended in a specific volume of measuring buffer standardized per experiment (50-100 μl); thus, the event rates reflect the absolute cell numbers in the respective samples. Horizontal lines delineate medians with mean absolute deviation (MAD) as error, datapoints represent individual measurement replicates, with symbols corresponding to matching measurement days. Statistical analysis was performed using two sample two-sided Wilcoxon rank sum test.
Methods
- The AFM indentation experiments are performed with a very soft cantilever at very high speeds. Why? Also, please mention whether the complete AFM curve was fitted with the Hertz/Sneddon model or only a certain area around the contact point.
We thank the reviewer for this comment. However, we believe that the spring constants and indentation speeds used in our study are typical for measurements of cells and not a cause of concern.
For the indentation experiments, we used Arrow-TL1 cantilevers (nominal spring constant k = 0.035-0.045 N m<sup>−1</sup>, Nanoworld, Switzerland) which are used routinely for cell indentation (with over 200 search results on Google Scholar using the term: "Arrow-TL1"+"cell", and several former publications from our group, including Munder et al 2016, Tavares et al 2017, Urbanska et al 2017, Taubenberger et al 2019, Abuhattum et al 2022, among others). Additionally, cantilevers with the spring constants as low as 0.01 N m−1 can be used for cell measurements (Radmacher 2002, Thomas et al, 2013).
The indentation speed of 5 µm s<sup>−1</sup> is not unusually high and does not result in significant hydrodynamic drag.
For the microrheology experiments, we used slightly stiffer and shorter (100/200 µm compared to 500 µm for Arrow-TL1) cantilevers: PNP-TR-TL (nominal spring constant k = 0.08 N m<sup>−1</sup>, Nanoworld, Switzerland). The measurement frequencies of 3-200 Hz correspond to movements slightly faster than 5 µm s<sup>−1</sup>, but cells were indented only to 100 nm, and the data were corrected for the hydrodynamic drag (see equation (8) in Methods section).
Author response image 20.
Exemplary indentation curve obtained using arrow-TL1 decorated with a 5-µm sphere on a ECC4 cell. The shown plot is exported directly from JPK Data Processing software. The area shaded in grey is the area used for fitting the Sneddon model.
In the indentation experiments, the curves were fitted to a maximal indentation of 1.5 μm (rarely exceeded, see Author response image 20). We have now added this information to the methods section:
- Could the authors include the dataset wt #1 in Fig 4D? Does it display the same trend?
We thank the reviewer for this comment. To clarify: in the MCF10A dataset (GEO: GSE69822) there are exactly three replicates of each wt (wild type) and ki (knock-in, referring to the H1047R mutation in the PIK3CA) samples. The numbering wt#2, wt#3, wt#4 originated from the short names that were used in the working files containing non-averaged RPKM (possibly to three different measurement replicates that may have not been exactly paired with the ki samples). We have now renamed the samples as wt#1, wt#2 and wt#3 to avoid the confusion. This naming also reflects better the sample description as deposited in the GSE69822 dataset (see Author response table 2).
Author response table 2.
- Reference (3) is an opinion article with the last author as the sole author. It is used twice as a self-standing reference, which is confusing, as it suggests there is previous experimental evidence.
We thank the reviewer for pointing this out and agree that it may not be appropriate to cite the article (Guck 2019 Biophysical Reviews, formerly Reference (3), currently Reference (76)) in all instances. The references to this opinion article have now been removed from the introduction:
“The extent to which cells can be deformed by external loads is determined by their mechanical properties, such as cell stiffness. Since the mechanical phenotype of cells has been shown to reflect functional cell changes, it is now well established as a sensitive label-free biophysical marker of cell state in health and disease (1-2).”
“Alternatively, the problem can be reverse-engineered, in that omics datasets for systems with known mechanical phenotype changes are used for prediction of genes involved in the regulation of mechanical phenotype in a mechanomics approach.”
But has been kept in the discussion:
“The mechanical phenotype of cells is recognized as a hallmark of many physiological and pathological processes. Understanding how to control it is a necessary next step that will facilitate exploring the impact of cell mechanics perturbations on cell and tissue function
(76).”.
This reference seems appropriate to us as it expands on the point that our ability to control cell mechanics will enable the exploration of its impact on cell and tissue function, which is central to the discussion of the current manuscript.
-The authors should mention what PC-corr means. Principle component correlation? Pearson's coefficient correlation?
PC-corr is a combination of loadings from the principal component (PC) analysis and Pearson’s correlation for each gene pair. We have aimed at conveying this in the “Discriminative network analysis on prediction datasets” result section. We have now added and extra sentence at the first appearance of PC-corr to clarify that for the readers from the start:
“After characterizing the mechanical phenotype of the cell states, we set out to use the accompanying transcriptomic data to elucidate genes associated with the mechanical phenotype changes across the different model systems. To this end, we utilized a method for inferring phenotype-associated functional network modules from omics datasets termed PCCorr (28), that relies on combining loadings obtained from the principal component (PC) analysis and Pearson’s correlation (Corr) for every pair of genes. PC-Corr was performed individually on two prediction datasets, and the obtained results were overlayed to derive a conserved network module. Owing to the combination of the Pearson’s correlation coefficient and the discriminative information included in the PC loadings, the PC-corr analysis does not only consider gene co-expression — as is the case for classical co-expression network analysis — but also incorporates the relative relevance of each feature for discriminating between two or more conditions; in our case, the conditions representing soft and stiff phenotypes. The overlaying of the results from two different datasets allows for a multi-view analysis (utilizing multiple sets of features) and effectively merges the information from two different biological systems.”
- The formatting of Table 1 is confusing. Horizontal lines should be added to make it clear to the reader which datasets are human and which mouse as well as which accession numbers belong to the carcinomas.
Horizontal lines have now been added to improve the readability of Table 1. We hope that makes the table easier to follow and satisfies the request. We assume that further modifications to the table appearance may occur during publishing process in accordance with the publisher’s guidelines.
- In many figures, data points are shown in different shapes without an explanation of what the shapes represent.
We thank the reviewer for this comment and apologize for not adding this information earlier. We have added explanations of the symbols to captions of Figures 2, 3, 5, and 6 in the main text:
“Fig. 2. Mechanical properties of divergent cell states in five biological systems. Schematic overviews of the systems used in our study, alongside with the cell stiffness of individual cell states parametrized by Young’s moduli E. (…) Statistical analysis was performed using generalized linear mixed effects model. The symbol shapes represent measurements of cell lines derived from three different patients (A), matched experimental replicates (C), two different reprogramming series (D), and four different cell isolations (E). Data presented in (A) and (D) were previously published in ref (29) and (30), respectively.”
“Fig. 3. Identification of putative targets involved in cell mechanics regulation. (A) Glioblastoma and iPSC transcriptomes used for the target prediction intersect at 9,452 genes. (B, C) PCA separation along two first principal components of the mechanically distinct cell states in the glioblastoma (B) and iPSC (C) datasets. The analysis was performed using the gene expression data from the intersection presented in (A). The symbol shapes in (B) represent cell lines derived from three different patients. (…)”
“Fig. 5. Perturbing levels of CAV1 affects the mechanical phenotype of intestine carcinoma cells. (…) In (E), (F), (I), and (J), the symbol shapes represent experiment replicates.”
“Fig. 6. Perturbations of CAV1 levels in MCF10A-ER-Src cells result in cell stiffness changes. (…) Statistical analysis was performed using a two-sided Wilcoxon rank sum test. In (B), (D), and (E), the symbol shapes represent experiment replicates.”
As well as to Figures S2, S9, and S11 in the supplementary material (in Figure S2, the symbol explanation was added to the legends in the figure panels as well):
“Fig. S2. Plots of area vs deformation for different cell states in the characterized systems. Panels correspond to the following systems: (A) glioblastoma, (B) carcinoma, (C) non-tumorigenic breast epithelia MCF10A, (D) induced pluripotent stem cells (iPSCs), and (E) developing neurons. 95%- and 50% density contours of data pooled from all measurements of given cell state are indicated by shaded areas and continuous lines, respectively. Datapoints indicate medians of individual measurements. The symbol shapes represent cell lines derived from three different patients (A), two different reprogramming series (D), and four different cell isolations (E), as indicated in the respective panels. (…).”
“Fig. S9. CAV1 knock-out mouse embryonic fibroblasts (CAV1KO) have lower stiffness compared to the wild type cells (WT). (…) (C) Apparent Young’s modulus values estimated for WT and CAV1KO cells using areadeformation data in (B). The symbol shapes represent experimental replicates. (…)”
“Fig. S11. Plots of area vs deformation from RT-DC measurements of cells with perturbed CAV1 levels. Panels correspond to the following experiments: (A and B) CAV1 knock-down in TGBC cells using esiRNA (A) and ONTarget siRNA (B), (C and D) transient CAV1 overexpression in ECC4 cells (C) and TGBC cells (D). Datapoints indicate medians of individual measurement replicates. The isoelasticity lines in the background (gray) indicate regions of of same apparent Young’s moduli. The symbol shapes represent experimental replicates.”
- In Figure 2, the difference in stiffness appears bigger than it actually is because the y-axes are not starting at 0.
While we acknowledge that starting the y-axes at a value other than 0 is generally not ideal, we chose this approach to better display data variability and minimize empty space in the plots.
A similar effect can be achieved with logarithmic scaling, which is a common practice (see Author response image 21 for visualization). We believe our choice of axes cut-off enhances the interpretability of the data without misleading the viewer.
Author response image 21.
Visualization of different axis scaling strategies applied to the five datasets presented in Figure 2 of the manuscript.
Of note, apparent Young’s moduli obtained from RT-DC measurements typically span 0.5-3.0 kPa (see Figure 2.3 from Urbanska et al 2021, PhD thesis). Differences between treatments rarely exceed a few hundred pascals. For example, in an siRNA screen of mitotic cell mechanics regulators in Drosophila cells (Kc167), the strongest hits (e.g., Rho1, Rok, dia) showed changes in stiffness of 100-150 Pa (see Supplementary Figure 11 from Rosendahl, Plak et al 2018, Nature Methods 15(5): 355-358).
- In Figure 3, I don't personally see the benefit of showing different cut-offs for PC-corr. In the end, the paper focuses on the 5 genes in the pentagram. I think only showing one of the cutoffs and better explaining why those target genes were picked would be sufficient and make it clearer for the reader.
We believe it is beneficial to show the extended networks for a few reasons. First, it demonstrates how the selected targets connect to the broader panel of the genes, and that the selected module is indeed much more interconnected than other nodes. Secondly, the chosen PC-corr cut-off is somewhat arbitrary and it may be interesting to look through the genes from the extended network as well, as they are likely also important for regulating cell mechanics. This broader view may help readers identify familiar genes and recognizing the connections to relevant signaling networks and processes of interest.
- In Figure 4C, I suggest explaining why the FANTOM5 and not another dataset was used for the visualization here and mentioning whether the other datasets were similar.
In Figure 4C, we have chosen to present data corresponding to FANTOM5, because that was the only carcinoma dataset in which all the cell lines tested mechanically are presented. We have now added this information to the caption of Figure 4. Additionally, the clustergrams corresponding to the remaining carcinoma datasets (CCLE RNASeq, Genetech ) are presented in supplementary figures S4-S6.
“The target genes show clear differences in expression levels between the soft and stiff cell states and provide for clustering of the samples corresponding to different cell stiffnesses in both prediction and validation datasets (Fig. 4, Figs. S4-S6).”
Typos
We would like to thank the Reviewer#3 for their detailed comments on the typos and details listed below. This is much appreciated as it improved the quality of our manuscript.
- In the first paragraph of the results section the 'and' should be removed from this sentence: Each dataset encompasses two or more cell states characterized by a distinct mechanical phenotype, and for which transcriptomic data is available.
The sentence has been corrected and now reads:
“Each dataset encompasses two or more cell states characterized by a distinct mechanical phenotype, and for which transcriptomic data is available.”
- In the methods in the MCF10A PIK3CA cell lines part, it says cell liens instead of cell lines.
The sentence has been corrected and now reads:
“The wt cells were additionally supplemented with 10 ng ml<sup>−1</sup> EGF (E9644, Sigma-Aldrich), while mutant cell lienes were maintained without EGF.”
- In the legend of Figure 6 "accession number: GSE17941, data previously published in ())" the reference is missing.
The reference has been added.
- In the legend of Figure 5 "(E) Verification of CAV1 knock-down in TGBC cells using two knock-down system" 'a' between using and two is missing.
The legend has been corrected (no ‘a’ is missing, but it should say systems (plural)):
- In Figure 5B one horizontal line is missing.
The Figure 5B has been corrected accordingly.
- Terms such as de novo or in silico should be written in cursive.
We thank the Reviewer for this comment; however, we believe that in the style used by eLife, common Latin expressions such as de novo or in vitro are used in regular font.
- In the heading of Table 4 "The results presented in this table can be reproducible using the code and data available under the GitHub link reported in the methods section." It should say reproduced instead of reproducible.
Yes, indeed. It has been corrected.
- The citation of reference 20 contains several author names multiple times.
Indeed, it has been fixed now:
- In Figure S2 there is a vertical line in the zeros of the y axis labels.
I am not sure if there was some rendering issue, but we did not see a vertical line in the zeros of the y axis label in Figure S2.
- The Text in Figure S4 is too small.
We thank the reviewer for pointing this out. We have now revised Figure S7 (formerly Figure S4) to increase the text size, ensuring better readability. (It has also been updated to include additional fits as requested by Reviewer #2).
- In Table 3 "positive hypothesis II markers are discriminative of samples with stiff/soft independent of data source" the words 'mechanical phenotype' are missing.
The column headings in Table 3 have now been updated accordingly.
- In Table S3 explain in the table headline what vi1, vi2 and v are. I assume the loading for PC1, the loading for PC2 and the average of the previous two values. But it should be mentioned somewhere.
The caption of table S3 has been updated to explain the meaning of vi1, vi2 and v.
-
-
www.biorxiv.org www.biorxiv.org
-
eLife Assessment
This study addresses a novel and interesting question about how the rise of the Qinghai-Tibet Plateau influenced patterns of bird migration, employing a multi-faceted approach that combines species distribution data with environmental modeling. The findings are valuable for understanding avian migration within a subfield, but the strength of evidence is incomplete due to critical methodological assumptions about historical species-environment correlations, limited tracking data, and insufficient clarity in species selection criteria. Addressing these weaknesses would significantly enhance the reliability and interpretability of the results.
-
Reviewer #1 (Public review):
Strengths:
This is an interesting topic and a novel theme. The visualisations and presentation are to a very high standard. The Introduction is very well-written and introduces the main concepts well, with a clear logical structure and good use of the literature. The methods are detailed and well described and written in such a fashion that they are transparent and repeatable.
Weaknesses:
I only have one major issue, which is possibly a product of the structure requirements of the paper/journal. This relates to the Results and Discussion, line 91 onwards. I understand the structure of the paper necessitates delving immediately into the results, but it is quite hard to follow due to a lack of background information. In comparison to the Methods, which are incredibly detailed, the Results in the main section reads as quite superficial. They provide broad overviews of broad findings but I found it very hard to actually get a picture of the main results in its current form. For example, how the different species factor in, etc.
-
Reviewer #2 (Public review):
Summary:
The study tries to assess how the rise of the Qinghai-Tibet Plateau affected patterns of bird migration between their breeding and wintering sites. They do so by correlating the present distribution of the species with a set of environmental variables. The data on species distributions come from eBird. The main issue lies in the problematic assumption that species correlations between their current distribution and environment were about the same before the rise of the Plateau. There is no ground truthing and the study relies on Movebank data of only 7 species which are not even listed in the study. Similarly, the study does not outline the boundaries of breeding sites NE of the Plateau. Thus it is absolutely unclear potentially which breeding populations it covers.
Strengths:
I like the approach for how you combined various environmental datasets for the modelling part.
Weaknesses:
The major weakness of the study lies in the assumption that species correlations between their current distribution and environments found today are back-projected to the far past before the rise of the Q-T Plateau. This would mean that species responses to the environmental cues do not evolve which is clearly not true. Thus, your study is a very nice intellectual exercise of too many ifs.
The second major drawback lies in the way you estimate the migratory routes of particular birds. No matter how good the data eBird provides is, you do not know population-specific connections between wintering and breeding sites. Some might overwinter in India, some populations in Africa and you will never know the teleconnections between breeding and wintering sites of particular species. The few available tracking studies (seven!) are too coarse and with limited aspects of migratory connectivity to give answer on the target questions of your study.
Your set of species is unclear, selection criteria for the 50 species are unknown and variability in their migratory strategies is likely to affect the direction of the effects. In addition, the position of the breeding sites relative to the Q-T plate will affect the azimuths and resulting migratory flyways. So in fact, we have no idea what your estimates mean in Figure 2.
There is no way one can assess the performance of your statistical exercises, e.g. performances of the models.
-
Author response:
eLife Assessment
This study addresses a novel and interesting question about how the rise of the Qinghai-Tibet Plateau influenced patterns of bird migration, employing a multi-faceted approach that combines species distribution data with environmental modeling. The findings are valuable for understanding avian migration within a subfield, but the strength of evidence is incomplete due to critical methodological assumptions about historical species-environment correlations, limited tracking data, and insufficient clarity in species selection criteria. Addressing these weaknesses would significantly enhance the reliability and interpretability of the results.
We would like to thank you and two anonymous reviewers for your careful, thoughtful, and constructive feedback on our manuscript. These reviews made us revisit a lot of our assumptions and we believe the paper will be much improved as a result. In addition to minor points, we will make three main changes to our manuscript in response to the reviews. First, we will address the concerns on the assumptions of historical species-environment correlations from perspectives of both theoretical and empirical evidence. Second, we will discuss the benefits and limitations of using tracking data in our study and demonstrate how the findings of our study are consolidated with results of previous studies. Third, we will clarify our criteria for selecting species in terms of both eBird and tracking data.
Below, we respond to each comment in turn. Once again, we thank you all for your feedback.
Reviewer #1 (Public review):
Strengths:
This is an interesting topic and a novel theme. The visualisations and presentation are to a very high standard. The Introduction is very well-written and introduces the main concepts well, with a clear logical structure and good use of the literature. The methods are detailed and well described and written in such a fashion that they are transparent and repeatable.
We appreciate the reviewer’s careful reading of our manuscript, encouraging comments and constructive suggestions.
Weaknesses:
I only have one major issue, which is possibly a product of the structure requirements of the paper/journal. This relates to the Results and Discussion, line 91 onwards. I understand the structure of the paper necessitates delving immediately into the results, but it is quite hard to follow due to a lack of background information. In comparison to the Methods, which are incredibly detailed, the Results in the main section reads as quite superficial. They provide broad overviews of broad findings but I found it very hard to actually get a picture of the main results in its current form. For example, how the different species factor in, etc.
Yes, it is the journal request to format in this way (Methods follows the Results and Discussion) for the article type of short reports. As suggested, in the revision we will elaborate on details of our findings, especially the species-specific responses, in terms of (i) shifts of distribution of avian breeding and wintering areas under the influence of the uplift of the Qinghai-Tibetan Plateau, and (ii) major factors that shape current migration patterns of birds in the Plateau. We will also better reference the approaches we used in the study.
Reviewer #2 (Public review):
Summary:
The study tries to assess how the rise of the Qinghai-Tibet Plateau affected patterns of bird migration between their breeding and wintering sites. They do so by correlating the present distribution of the species with a set of environmental variables. The data on species distributions come from eBird. The main issue lies in the problematic assumption that species correlations between their current distribution and environment were about the same before the rise of the Plateau. There is no ground truthing and the study relies on Movebank data of only 7 species which are not even listed in the study. Similarly, the study does not outline the boundaries of breeding sites NE of the Plateau. Thus it is absolutely unclear potentially which breeding populations it covers.
We are very grateful for the careful review and helpful suggestions. We will revise the manuscript carefully in response to the reviewer’s comments and believe that it will be much improved as a result. Below are our point-by-point replies to the comments.
Strengths:
I like the approach for how you combined various environmental datasets for the modelling part.
We appreciate the reviewer’s encouragement.
Weaknesses:
The major weakness of the study lies in the assumption that species correlations between their current distribution and environments found today are back-projected to the far past before the rise of the Q-T Plateau. This would mean that species responses to the environmental cues do not evolve which is clearly not true. Thus, your study is a very nice intellectual exercise of too many ifs.
This is a valid concern. We will address this from both the perspectives of the theoretical design of our study and empirical evidence.
First, we agree with the reviewer that species responses to environmental cues might vary over time. Nonetheless, the simulated environments before the uplift of the plateau serve as a counterfactual state in our study. Counterfactual is an important concept to support causation claims by comparing what happened to what would have happened in a hypothetical situation: “If event X had not occurred, event Y would not have occurred” (Lewis 1973). Recent years have seen an increasing application of the counterfactual approach to detect biodiversity change, i.e., comparing diversity between the counterfactual state and real estimates to attribute the factors causing such changes (e.g., Gonzalez et al. 2023). Whilst we do not aim to provide causal inferences for avian distributional change, using the counterfactual approach, we are able to estimate the influence of the plateau uplift by detecting the changes of avian distributions, i.e., by comparing where the birds would have distributed without the plateau to where they currently distributed. We regard the counterfactual environments as a powerful tool for eliminating, to the extent possible, vagueness, as opposed to simply description of current distributions of birds. Therefore, we assume species’ responses to environments are conservative and their evolution should not discount our findings. We will clarify this in both the Introduction and Methods.
Second, we used species distribution modelling to contrast the distributions of birds before and after the uplift of the plateau under the assumption that species tend to keep their ancestral ecological traits over time (i.e., niche conservatism). This indicates a high probability for species to distribute in similar environments wherever suitable. Particularly, considering birds are more likely to be influenced by food resources (Martins et al. 2024), and the distribution of available food before the uplift (Jia et al. 2020), we believe the findings can provide valuable insights into the influence of the plateau on avian migratory patterns. Having said that, we acknowledge other factors, e.g., carbon dioxide concentrations (Zhang et al. 2022), can influence the simulations of environments and our prediction of avian distribution. We will clarify the assumptions and evidence we have for the modelling in Methods. We will further point out the direction for future studies in the Discussion.
The second major drawback lies in the way you estimate the migratory routes of particular birds. No matter how good the data eBird provides is, you do not know population-specific connections between wintering and breeding sites. Some might overwinter in India, some populations in Africa and you will never know the teleconnections between breeding and wintering sites of particular species. The few available tracking studies (seven!) are too coarse and with limited aspects of migratory connectivity to give answer on the target questions of your study.
We agree with the reviewer that establishing interconnections for birds is important for estimating the migration patterns of birds. We employed a dynamic model to assess their weekly distributions. Thus, we can track the movement of species every week, and capture the breeding and wintering areas for specific populations. That being said, we acknowledge that our approach can be subjected to the patchy sampling of eBird data. We will better demonstrate this in the main text.
Tracking data can provide valuable insights into the movement patterns of species but are limited to small numbers of species due to the considerable costs and time needed. We aimed to adopt the tracking data to examine the influence of focal factors on avian migration patterns, but only seven species, to the best of our ability, were acquired. Moreover, similar results were found in studies that used tracking data to estimate the distribution of breeding and wintering areas of birds in the plateau (e.g., Prosser et al. 2011, Zhang et al. 2011, Zhang et al. 2014, Liu et al. 2018, Kumar et al. 2020, Wang et al. 2020, Pu and Guo 2023, Yu et al. 2024, Zhao et al. 2024). We believe the conclusions based on seven species are rigour, but their implications could be restricted by the number of tracking species we obtained. We will demonstrate how our findings on breeding and wintering areas of birds are reinforced by other studies reporting the locations of those areas. We will also add a separate caveat section to discuss the limitations stated above.
Your set of species is unclear, selection criteria for the 50 species are unknown and variability in their migratory strategies is likely to affect the direction of the effects.
We will clarify the selection criteria for the 50 species). We first obtained a full list of birds in the plateau from Prins and Namgail (2017). We then extracted species identified as full migrants in Birdlife International (https://datazone.birdlife.org/species/spcdistPOS) from the full list.
In addition, the position of the breeding sites relative to the Q-T plate will affect the azimuths and resulting migratory flyways. So in fact, we have no idea what your estimates mean in Figure 2.
We calculated the azimuths not only by the angles between breeding sites and wintering sites but also based on the angles between the stopovers of birds. Therefore, the azimuths are influenced by the relative positions of breeding, wintering and stopover sites. We will better explain this both in the Methods and legend of Figure 2.
There is no way one can assess the performance of your statistical exercises, e.g. performances of the models.
As suggested, we will add the AUC values to assess the performances of the models.
References
Gonzalez, A., J. M. Chase, and M. I. O'Connor. 2023. A framework for the detection and attribution of biodiversity change. Philosophical Transactions of the Royal Society B: Biological Sciences 378: 20220182.
Jia, Y., H. Wu, S. Zhu, Q. Li, C. Zhang, Y. Yu, and A. Sun. 2020. Cenozoic aridification in Northwest China evidenced by paleovegetation evolution. Palaeogeography, Palaeoclimatology, Palaeoecology 557:109907.
Kumar, N., U. Gupta, Y. V. Jhala, Q. Qureshi, A. G. Gosler, and F. Sergio. 2020. GPS-telemetry unveils the regular high-elevation crossing of the Himalayas by a migratory raptor: implications for definition of a “Central Asian Flyway”. Scientific Reports 10:15988.
Lewis, D. 1973. Counterfactuals. Oxford: Blackwell.
Liu, D., G. Zhang, H. Jiang, and J. Lu. 2018. Detours in long-distance migration across the Qinghai-Tibetan Plateau: individual consistency and habitat associations. PeerJ 6:e4304.
Martins, L. P., D. B. Stouffer, P. G. Blendinger, K. Böhning-Gaese, J. M. Costa, D. M. Dehling, C. I. Donatti, C. Emer, M. Galetti, R. Heleno, Í. Menezes, J. C. Morante-Filho, M. C. Muñoz, E. L. Neuschulz, M. A. Pizo, M. Quitián, R. A. Ruggera, F. Saavedra, V. Santillán, M. Schleuning, L. P. da Silva, F. Ribeiro da Silva, J. A. Tobias, A. Traveset, M. G. R. Vollstädt, and J. M. Tylianakis. 2024. Birds optimize fruit size consumed near their geographic range limits. Science 385:331-336.
Prins, H. H. T., and T. Namgail. 2017. Bird migration across the Himalayas : wetland functioning amidst mountains and glaciers. Cambridge University Press, Cambridge.
Prosser, D. J., P. Cui, J. Y. Takekawa, M. Tang, Y. Hou, B. M. Collins, B. Yan, N. J. Hill, T. Li, Y. Li, F. Lei, S. Guo, Z. Xing, Y. He, Y. Zhou, D. C. Douglas, W. M. Perry, and S. H. Newman. 2011. Wild bird migration across the Qinghai-Tibetan Plateau: a transmission route for highly pathogenic H5N1. PloS One 6:e17622.
Pu, Z., and Y. Guo. 2023. Autumn migration of black-necked crane (Grus nigricollis) on the Qinghai-Tibetan and Yunnan-Guizhou plateaus. Ecology and Evolution 13:e10492.
Wang, Y., C. Mi, and Y. Guo. 2020. Satellite tracking reveals a new migration route of black-necked cranes (Grus nigricollis) in Qinghai-Tibet Plateau. PeerJ 8:e9715.
Yu, X., G. Song, H. Wang, Q. Wei, C. Jia, and F. Lei. 2024. Migratory flyways and connectivity of brown headed gulls (Chroicocephalus brunnicephalus) revealed by GPS tracking. Global Ecology and Conservation 56:e03340.
Zhang, G.G., D.P. Liu, Y.Q. Hou, H.X. Jiang, M. Dai, F.W. Qian, J. Lu, T. Ma, L.X. Chen, and Z. Xing. 2014. Migration routes and stopover sites of Pallas’s gulls Larus ichthyaetus breeding at Qinghai Lake, China, determined by satellite tracking. Forktail 30:104-108.
Zhang, G.G., D.P. Liu, Y.Q. Hou, H.X. Jiang, M. Dai, F.W. Qian, J. Lu, Z. Xing, and F.S. Li. 2011. Migration routes and stop-over sites determined with satellite tracking of bar-headed geese (Anser indicus) breeding at Qinghai Lake, China. Waterbirds 34:112-116, 115.
Zhang, R., D. Jiang, C. Zhang, and Z. Zhang. 2022. Distinct effects of Tibetan Plateau growth and global cooling on the eastern and central Asian climates during the Cenozoic. Global and Planetary Change 218:103969.
Zhao, T., W. Heim, R. Nussbaumer, M. van Toor, G. Zhang, A. Andersson, J. Bäckman, Z. Liu, G. Song, M. Hellström, J. Roved, Y. Liu, S. Bensch, B. Wertheim, F. Lei, and B. Helm. 2024. Seasonal migration patterns of Siberian Rubythroat (Calliope calliope) facing the Qinghai–Tibet Plateau. Movement Ecology 12:54.
-
-
www.biorxiv.org www.biorxiv.org
-
eLife Assessment
This study presents important findings demonstrating that FZD5 and FZD8, two of the ten Frizzled proteins, undergo Wnt-mediated endocytosis. The E3 ubiquitin ligases RNF43/ZNRF3 regulate their degradation in a Wnt-dependent manner, a mechanism that was not previously recognized. The evidence supporting the claims of the authors is solid. This research will be of interest to biologists specializing in Wnt signaling, cancer, and regenerative medicine.
-
Reviewer #1 (Public review):
Summary:
The mechanism by which WNT signals are received and transduced into the cell has been the topic of extensive research. Cell surface levels of the WNT receptors of the FZD family are subject to tight control and it's well established that the transmembrane ubiquitin ligases ZNRF3 and RNF43 target FZDs for degradation and that proteins of the R-spondin family block this effect. This manuscript explores the role that WNT proteins play in receptor internalization, recycling and degradation, and the authors provide evidence that WNTs promote interactions of FZD with the ubiquitin ligases. Using cells mutant in all 3 DVL genes, the authors demonstrate that this effect of WNT on FZD is DVL-independent.
Strengths:
Overall, the data are of good quality and support the authors' hypothesis. Strengths of this study are the use of CRISPR-mutated cell lines to establish genetic requirements for the various components. The finding that FZD internalization and degradation is WNT dependent and does not involve DVL is novel.
Weaknesses:
Weaknesses of the work include a heavy reliance on overexpression and monitoring the effects in a single cell line, HEK293. In addition, the claim of specificity - only FZD5 and FZD8 participate in this process - is not strongly supported.
-
Reviewer #2 (Public review):
In this manuscript Luo et al uncover that the ZNRF3/RNF43 E3 ubiquitin ligases participate in the selective endocytosis and degradation of FZD5/8 receptors in response to Wnt stimulation. Interestingly, DVL proteins have previously been shown to be important for RNF43/ZNRF3-dependent ubiquitination of Frizzled receptors but in this study the authors show that DVL proteins are only important for ligand and RNF43/ZNRF3-independent FZD endocytosis. Although it is well established that ZNRF3 and RNF43 promote the endocytosis and degradation of FZD receptors as part of a negative regulatory loop to dampened B-catenin signaling, the dependency of Wnt stimulation for this process and the specificity of this degradation for different FZD receptors remained poorly characterized.
In my opinion there are two significant findings of this study: 1) Wnt proteins are required for ZNRF3/RNF43 mediated endocytosis and degradation of FZD receptors and this constitutes an important negative regulatory loop. 2) The ZNRF3/RNF43 substrate selectivity for FZD5/8 over the other 8 Frizzleds. Of course, many questions remain, and new ones emerge as is often the case, but these findings challenge our dogmatic view on how the ZNRF3/RNF43 regulate Wnt signaling and emphasize their role in Wnt-dependent Frizzled endocytosis/degradation and beta-catenin signaling. Below I have suggestions to strengthen the manuscript.
(1) Given their results the authors conclude that upregulation of Frizzled on the plasma membrane is not sufficient to explain the stabilization of beta-catenin seen in the ZNRF3/RNF43 mutant cells. This interpretation is sound, and they suggest in the discussion that ZNRF3/RNF43-mediated ubiquitination could serve as a sorting signal to sort endocytosed FZD to lysosomes for degradation and that absence or inhibition of this process would promote FZD recycling. This should be relatively easy to test using surface biotinylation experiments and would considerably strengthen the manuscript.<br /> (2) The authors show that the FZD5 CRD domain is required for endocytosis since a mutant FZD5 protein in which the CRD is removed does not undergo endocytosis. This is perhaps not surprising since this is the site of Wnt binding, but the authors show that a chimeric FZD5CRD-FZD4 receptor can confer Wnt-dependent endocytosis to an otherwise endocytosis incompetent FZD4 protein. Since the linker region between the CRD and the first TM differs between FZD5 and FZD4 it would be interesting to understand whether the CRD specifically or the overall arrangement (such as the spacing) is the most important determinant.<br /> (3) I find it surprising that only FZD5 and FZD8 appear to undergo endocytosis or be stabilized at the cell surface upon ZNRF3/RNF43 knockout. Is this consistent with previous literature? Is that a cell-specific feature? These findings should be tested in a different cell line, with possibly different relative levels of ZNRF3 and RNF43 expression.<br /> (4) If FZD7 is not a substrate of ZNRF3/RNF43 and therefore is not ubiquitinated and degraded, how do the authors reconcile that its overexpression does not lead to elevated cytosolic beta-catenin levels in Figure 5B?<br /> (5) For Figure 5B, it would be interesting if the authors could evaluate whether overexpression of FZD5 in the ZNRF3/RNF43 double knockout lines would synergize and lead to further increase in cytosolic beta-catenin levels. As control if the substrate selectivity is clear FZD7 overexpression in that line should not do anything.<br /> (6) In Figure 6G, the authors need to show cytosolic levels of beta-catenin in the absence of Wnt in all cases.<br /> (7) Since the authors show that DVL is not involved in the Wnt and ZRNF3-dependent endocytosis they should repeat the proximity biotinylation experiment in figure 7 in the DVL triple KO cells. This is an important experiment since previous studies showed that DVL was required for the ZRNF3/RNF43-mediated ubiqtuonation of FZD.
-
Author response:
Reviewer #2 (Public review):
(1) Given their results the authors conclude that upregulation of Frizzled on the plasma membrane is not sufficient to explain the stabilization of beta-catenin seen in the ZNRF3/RNF43 mutant cells. This interpretation is sound, and they suggest in the discussion that ZNRF3/RNF43-mediated ubiquitination could serve as a sorting signal to sort endocytosed FZD to lysosomes for degradation and that absence or inhibition of this process would promote FZD recycling. This should be relatively easy to test using surface biotinylation experiments and would considerably strengthen the manuscript.
Thank you for your valuable suggestions and comments. We will perform cell surface biotinylation experiments.
(2) The authors show that the FZD5 CRD domain is required for endocytosis since a mutant FZD5 protein in which the CRD is removed does not undergo endocytosis. This is perhaps not surprising since this is the site of Wnt binding, but the authors show that a chimeric FZD5CRD-FZD4 receptor can confer Wnt-dependent endocytosis to an otherwise endocytosis incompetent FZD4 protein. Since the linker region between the CRD and the first TM differs between FZD5 and FZD4 it would be interesting to understand whether the CRD specifically or the overall arrangement (such as the spacing) is the most important determinant.
Our results in Fig. 1F-G clearly show that the CRD of FZD5 specifically is both necessary and sufficient for Wnt3a/5a-induced FZD5 endocytosis, as replacing the CRD alone in FZD5 with the CRD from either FZD4 or FZD7 completely abolished Wnt-induced endocytosis, whereas replacing the CRD alone in FZD4 or FZD7 with the FZD5 CRD alone could confer Wnt-induced endocytosis.
(3) I find it surprising that only FZD5 and FZD8 appear to undergo endocytosis or be stabilized at the cell surface upon ZNRF3/RNF43 knockout. Is this consistent with previous literature? Is that a cell-specific feature? These findings should be tested in a different cell line, with possibly different relative levels of ZNRF3 and RNF43 expression.
Thank you for your comments and suggestions. Our finding that ZNRF3/RNF43 specifically regulates FZD5/8 degradation is consistent with recent published studies in which FZD5 is required for the survival of RNF43-mutant PDAC or colorectal cancer cells (Nature Medicine, 2017, PMID: 27869803) and FZD5 is required for the maintenance of intestinal stem cells (Developmental Cell, 2024, PMID: 39579768 and 39579769), and in both cases, FZDs other than FZD5/8 are also expressed but not sufficient to compensate for the function of FZD5. The mechanism by which Wnt3a/5a specifically induces FZD5/8 endocytosis and degradation is currently unknown and needs to be explored in the future. We speculate that Wnt binding to FZD5/8 may recruit another protein on the cell surface to specifically facilitate FZD5/8 endocytosis. On the other hand, we cannot exclude the possibility that Wnts other than Wnt3a/5a may induce the endocytosis and degradation of FZDs other than FZD5/8 since there are 19 Wnts and 10 FZDs in humans. We will perform flow cytometry experiments using FZD5/8-specific antibodies to examine whether Wnt3a/5a induces FZD5/8 endocytosis in more cell lines.
(4) If FZD7 is not a substrate of ZNRF3/RNF43 and therefore is not ubiquitinated and degraded, how do the authors reconcile that its overexpression does not lead to elevated cytosolic beta-catenin levels in Figure 5B?
We are currently not sure of the mechanism underlying this result. Considering that most FZDs are expressed in 293A cells, we do not know how much of the mature form of overexpressed FZD7 was presented to the plasma membrane.
(5) For Figure 5B, it would be interesting if the authors could evaluate whether overexpression of FZD5 in the ZNRF3/RNF43 double knockout lines would synergize and lead to further increase in cytosolic beta-catenin levels. As control if the substrate selectivity is clear FZD7 overexpression in that line should not do anything.
We will perform these experiments as you suggested.
(6) In Figure 6G, the authors need to show cytosolic levels of beta-catenin in the absence of Wnt in all cases.
We did not add Wnt CM in this experiment. RSPO1 activity, which relies on endogenous Wnt, has been well documented in previous studies.
(7) Since the authors show that DVL is not involved in the Wnt and ZRNF3-dependent endocytosis they should repeat the proximity biotinylation experiment in figure 7 in the DVL triple KO cells. This is an important experiment since previous studies showed that DVL was required for the ZRNF3/RNF43-mediated ubiqtuonation of FZD.
Thank you for your valuable suggestions. We will perform the proximity biotinylation experiment in DVL TKO cells.
-
-
www.biorxiv.org www.biorxiv.org
-
eLife Assessment
This important work provides another layer of regulatory mechanism for TGF-beta signaling activity. The evidence supports the involvement of microtubules as a reservoir of Smad2/3 and additional evidence convincingly demonstrates functional involvement of Rudhira in this process. The work will be of board interest to developmental biologists in general and molecular biologists in the field of growth factor signaling.
-
Reviewer #1 (Public review):
Summary:
This manuscript aimed to study the role of Rudhira (also known as Breast Carcinoma Amplified Sequence 3), an endothelium-restricted microtubules-associated protein, in regulating of TGFβ signaling. The authors demonstrate that Rudhira is a critical signaling modulator for TGFβ signaling by releasing Smad2/3 from cytoskeletal microtubules and how that Rudhira is a Smad2/3 target gene. Taken together, the authors provide a model of how Rudhira contributes to TGFβ signaling activity to stabilize the microtubules, which is essential for vascular development.
Strengths:
The study used different methods and techniques to achieve aims and support conclusions, such as Gene Ontology analysis, functional analysis in culture, immunostaining analysis, and proximity ligation assay. This study provides unappreciated additional layer of TGFβ signaling activity regulation after ligand-receptor interaction.
Weaknesses:
(1) It is unclear how current findings provide a better understanding of Rudhira KO mice, which the authors published some years ago.
(2) Why do they use HEK cells instead of SVEC cells in Fig 2 and 4 experiments?
(3) A model shown in Fig 5E needs improvement to grasp their findings easily.
Comments on revised version:
The authors have adequately responded to the reviewers' concerns.
-
Reviewer #2 (Public review):
Summary:
It was first reported in 2000 that Smad2/3/4 are sequestered to microtubules in resting cells and TGF-β stimulation releases Smad2/3/4 from microtubules, allowing activation of the Smad signaling pathway. Although the finding was subsequently confirmed in a few papers, the underlying mechanism has not been explored. In the present study, the authors found that Rudhira/breast carcinoma amplified sequence 3 is involved in release Smad2/3 from microtubules in response to TGF-β stimulation. Rudhira is also induced by TGF-β and probably involved in stabilization of microtubules in the delayed phase after TGF-β stimulation. Therefore, Rudhira has two important functions downstream of TGF-β in the early as well as delayed phase.
Strengths:
This work aimed to address an unsolved question on one of the earliest events after TGF-β stimulation. Based on loss-of-function experiments, the authors identified Rudhira, as a key player that triggers Smad2/3 release from microtubules after TGF-β stimulation. This is an important first step for understanding the initial phase of Smad signaling activation.
Weaknesses:
Currently, the processes how Rudhira causes the release of Smad proteins from microtubules and how Rudhira is mobilized to microtubules in response to TGF-β remain unclear. The authors are expected to address these points experimentally in the future.
This reviewer is also afraid that some of the biochemical data lack appropriate controls and are not convincing enough.
-
Author response:
The following is the authors’ response to the original reviews.
Public Reviews:
Reviewer #1 (Public Review):
Summary
This manuscript aimed to study the role of Rudhira (also known as Breast Carcinoma Amplified Sequence 3), an endothelium-restricted microtubules-associated protein, in regulating of TGFβ signaling. The authors demonstrate that Rudhira is a critical signaling modulator for TGFβ signaling by releasing Smad2/3 from cytoskeletal microtubules and how Rudhira is a Smad2/3 target gene. Taken together, the authors provide a model of how Rudhira contributes to TGFβ signaling activity to stabilize the microtubules, which is essential for vascular development.
Strengths
The study used different methods and techniques to achieve aims and support conclusions, such as Gene Ontology analysis, functional analysis in culture, immunostaining analysis, and proximity ligation assay. This study provides an unappreciated additional layer of TGFβ signaling activity regulation after ligand receptor interaction.
We thank the reviewer for acknowledging the importance of our study and providing a clear summary of our findings.
Weaknesses
(1) It is unclear how current findings provide a beVer understanding of Rudhira KO mice, which the authors published some years ago.
Our previous study demonstrated that Rudhira KO mice have a predominantly developmental cardiovascular phenotype that phenocopies TGFβ loss of function (Shetty, Joshi et al., 2018). Additionally, we found that at the molecular level, Rudhira regulates cytoskeletal organization (Jain et al., 2012; Joshi and Inamdar, 2019). Our current study builds upon these previous findings, showing an essential role of Rudhira in maintaining TGFβ signaling and controlling the microtubule cytoskeleton during vascular development. On one hand Rudhira regulates TGFβ signaling by promoting the release of Smads from microtubules, while on the other, Rudhira is a TGFβ target essential for stabilizing microtubules. Thus, our current study provides a molecular basis for Rudhira function in cardiovascular development.
(2) Why do they use HEK cells instead of SVEC cells in Figure 2 and 4 experiments?
Our earlier studies have characterized the role of Rudhira in detail using both loss and gain of function methods in multiple cell types (Jain et al., 2012; SheVy, Joshi et al., 2018; Joshi and Inamdar, 2019). As endothelial cells are particularly difficult to transfect, and because the function of Rudhira in promoting cell migration is conserved in HEK cells, it was practical and relevant to perform these experiments in HEK cells (Figures 2 and 4E).
(3) A model shown in Figure 5E needs improvement to grasp their findings easily.
We have modified Figure 5E for clarity.
Reviewer #2 (Public Review):
Summary
It was first reported in 2000 that Smad2/3/4 are sequestered to microtubules in resting cells and TGF-β stimulation releases Smad2/3/4 from microtubules, allowing activation of the Smad signaling pathway. Although the finding was subsequently confirmed in a few papers, the underlying mechanism has not been explored. In the present study, the authors found that Rudhira/breast carcinoma amplified sequence 3 is involved in the release of Smad2/3 from microtubules in response to TGF-β stimulation. Rudhira is also induced by TGF-β and is probably involved in the stabilization of microtubules in the delayed phase after TGF-β stimulation. Therefore, Rudhira has two important functions downstream of TGF-β in the early as well as delayed phase.
Strengths:
This work aimed to address an unsolved question on one of the earliest events after TGF-β stimulation. Based on loss-of-function experiments, the authors identified a novel and potentially important player, Rudhira, in the signal transmission of TGF-β.
We thank the reviewer for the critical evaluation and appreciation of our findings.
Weaknesses:
The authors have identified a key player that triggers Smad2/3 released from microtubules after TGF-β stimulation probably via its association with microtubules. This is an important first step for understanding the regulation of Smad signaling, but underlying mechanisms as well as upstream and downstream events largely remain to be elucidated.
We acknowledge that the mechanisms regulating cytoskeletal control of Smad signaling are far from clear, but these are out of scope of this manuscript. This manuscript rather focuses on Rudhira/Bcas3 as a pivot to understand vascular TGFβ signaling and microtubule connections.
(1) The process of how Rudhira causes the release of Smad proteins from microtubules remains unclear. The statement that "Rudhira-MT association is essential for the activation and release of Smad2/3 from MTs" (lines 33-34) is not directly supported by experimental data.
We agree with the reviewer’s comment. Although we provide evidence that the loss of Rudhira (and thereby deduced loss of Rudhira-MT association) prevents release of Smad2/3 from MTs (Fig 3C), it does not confirm the requirement of Rudhira-MT association for this. In light of this, we have modified the statement to ‘Rudhira associates with MTs and is essential for the activation and release of Smad2/3 from MTs”.
(2) The process of how Rudhira is mobilized to microtubules in response to TGF-β remains unclear.
Our previous study showed that Rudhira associates with microtubules, and preferentially binds to stable microtubules (Jain et al., 2012; Joshi and Inamdar, 2019). Since TGFβ stimulation is known to stabilize microtubules, we hypothesize that TGFβ stimulation increases Rudhira binding to stable microtubules. We have mentioned this in our revised manuscript.
(3) After Rudhira releases Smad proteins from microtubules, Rudhira stabilizes microtubules. The process of how cells return to a resting state and recover their responsiveness to TGF-β remains unclear.
We show that dissociation of Smads from microtubules is an early response and stabilization of microtubules is a late TGFβ response. However, we agree that the sequence of these molecular events has not been characterized in-depth in this or any other study, making it difficult to assign causal roles (eg. whether release of Smads from MTs is a pre-requisite for MT stabilization by Rudhira) or reversibility. However, the TGFβ pathway is auto regulatory, leading to increased turnover of receptors and Smads and increased expression of inhibitory Smads, which may recover responsiveness to TGFβ. Additionally, the still short turnover time of stable microtubules (several minutes to hours) may also promote quick return to resting state. We have discussed this in our revised manuscript.
Recommendations for the authors:
Reviewer #2 (Recommendations for The Authors):
(1) Overall: Duration of TGF-β stimulation in cell-based assays should be described in the legends for readers' convenience. Avoid simple bar graphs because sample numbers are only 3. A scaVer plot should be super-imposed.
Details added, as suggested. Duration of treatment is mentioned in Materials and methods section for figures 1C-D; 2A-B; 3; 4A-C; 5A-C; S2D; S3A-C; S4C, D. Bar graphs have been replaced with a bar + scatter plot. Note that, as the Excel file for data related to fig 4A was corrupted, we repeated the experiments to generate fresh data. Hence the graph had to be replaced. However, the result holds true as before.
(2) Figure 1A: This panel is too small. Gene names are almost invisible.
Modified for clarity.
(3) Figure 1B: Show TGFβRI expression by immunoblomng (re-probing) to verify that it is expressed in the rightmost lane.
TGFβRI overexpression was confirmed by qPCR in a replicate in the same experiment (Fig S2C).
(4) Figure 1C: Show expression of Rudhira. In addition, confirm the positions of molecular weight markers. Smad2 migrated slower than pSmad2.
Rudhira expression is shown in Fig S1B. Molecular weight markers have been corrected.
(5) Figure 3A: This panel shows a negative result that Smad2/3 fails to interact with Rudhira. A positive control, for example, Smad4, would make the data convincing.
Although it would be nice to have a positive control for interaction, we do not agree that a positive control of Smad4 is essential for our conclusion from this experiment, which is that ‘we were unable to detect an interaction between Rudhira and Smad2/3’.
(6) Fig. 3B: Show Rudhira blot. If possible, show that the Rudhira-MT association precedes Smad phosphorylation by a time course experiment. This is an important point but not experimentally demonstrated.
The interaction between Rudhira and microtubules with or without TGFβ is demonstrated by PLA (Fig 3E). Although important, the suggested time course experiments to assess the sequence of events are beyond the scope of this manuscript.
(7) Figure 3E: Does the process require the type I receptor kinase activity or non-Smad signaling pathways?
Since TGFβ pathway is complex and is regulated at multiple steps, this possibility has not been tested and is beyond the scope of current study.
(8) Figure 4A: The authors did not examine if these elements are functional. Therefore, this panel can be presented as a supplementary figure.
As suggested, the panel has been moved to supplementary information.
(9) Figure 4E: The figure legend does not say that cells were TGF-β-stimulated. It remains unclear if Smad2 and Smad3 are involved in Rudhira expression as phosphorylated or non-phosphorylated forms. Therefore, the authors should show a pSmad2 blot. In the absence of TGF-β stimulation, Smad2 and Smad3 are expected to be sequestrated to microtubules and therefore not phosphorylated. In the case that cells were stimulated with TGF-β, show if Rudhira is induced by TGF-β in HEK293T cells. This is not shown in this manuscript.
This experiment was not performed under regulated conditions with or without TGFβ, hence the sensitivity to TGFβ could not be assessed. Cells were not stimulated with exogenous TGFβ, but cultured in regular medium with serum, which can have up to ~40 ng/ml of TGFβ (latent and active). Additionally, owing to severe depletion of Smad2 or Smad3 by shRNAs we expect sufficient loss of phospho-Smads2/3.
(10) Figure S1A: Rudhira migrated at the position corresponding to 91 kD only in this panel.
Corrected the position of molecular weight marker.
(11) Line 205-206, "Since in vivo studies indicate that rudhira depletion severely affects the TGFβ pathway [11]": Refer to Reference 11. The paper does not say anything about TGFβ.
Reference corrected to Ref #14.
(12) Smad4 was previously reported to be sequestered to microtubules [Ref. 7]. Does Rudhira release Smad4 also?
This is an interesting point which could be followed up on our future studies.
(13) It would be nice if the authors examined how Rudhira causes the release of Smad2/3 from microtubules. Currently, it remains unclear whether the association of Rudhira to microtubules is required for the release of Smad2/3. Does a Rudhira mutant lacking microtubule binding fail to induce the release of Smad2/3 after TGF-β stimulation? If so, do Rudhira and Smad2/3 share the same binding site on microtubules? In that case, the mechanism can be regarded as "competitive".
This is a thoughtful experiment much beyond the scope of current manuscript. In our previous study we were able to localize the Tubulin binding sites of Rudhira primarily to its Bcas3 domain (Joshi and Inamdar, 2019), however the equivalent sites in Tubulin were not assessed. While MH2 domains of Smad2/3 bind β-tubulin, amino acids 114-243 of β-tubulin bind to Smad2/3 (Dai et al., 2007). A systematic study of these tripartite interactions including Rudhira would be an interesting follow up for our future study.
-
-
www.biorxiv.org www.biorxiv.org
-
eLife Assessment
The authors show that a middle carotid artery occlusion (MCAO) hypoxia lesion leads to hyaluronan-mediated chemoattraction to the lesion penumbra of Thbs-4-expressing astrocytes of the sub-ventricular zone (SVZ). These findings are valuable because they shed light on the function of astrocytes from the adult SVZ in pathological states like brain ischemic injury. The results are convincing, as they rely on a comprehensive analysis of experimental data.
-
Reviewer #1 (Public review):
Summary:
The authiors show that SVZ derived astrocytes respond to a middle carotid artery occlusion (MCAO) hypoxia lesion by secreting and modulating hyaluronan at the edge of the lesion (penumbra) and that hyaluronin is a chemoattractant to SVZ astrocytes. They use lineage tracing of SVZ cells to determine their origin. They also find that SVZ derived astrocytes express Thbs-4 but astrocytes at the MCAO-induced scar do not. Also, they demonstrate that decreased HA in the SVZ is correlated with gliogenesis. While much of the paper is descriptive/correlative they do overexpress Hyaluronan synthase 2 via viral vectors and show this is sufficient to recruit astrocytes to the injury. Interestingly, astrocytes preferred to migrate to the MCAO than to the region of overexpressed HAS2.
Strengths:
The field has largely ignored the gliogenic response of the SVZ, especially with regards to astrocytic function. These cells and especially newborn cells may provide support for regeneration. Emigrated cells from the SVZ have been shown to be neuroprotective via creating pro-survival environments, but their expression and deposition of beneficial extracellular matrix molecules is poorly understood. Therefore, this study is timely and important. The paper is very well written and flow of result logical.
Comments on revised version:
Thanks for addressing my final points.
-
Reviewer #2 (Public review):
Summary:
In their manuscript, Ardaya et al address the impact of ischemia-induced astrogliogenesis from the adult SVZ and their effect on remodeling of the extracellular matrix (ECM) in the glial scar. The authors show that the levels of Thbs4, a marker previously identified to be expressed in astrocytes and neural stem cells (NSCs) of the SVZ, strongly increase upon ischemia. While proliferation is significantly increase shortly after ischemia, Nestin and DCX (markers for NSCs and neuroblasts, respectively) decrease and Thbs4 levels suggesting that the neurogenic program is halted and astrogenesis is enhanced. By fate-mapping, the authors show that astrocytes derive from SVZ NSCs and migrate towards the lesion. These SVZ-derived astrocytes strongly express Thbs4 and populate the border of the lesion, while local astrocytes do not express Thbs4 and localize to both scar and border. Interestingly, the Thbs4-positive astrocytes appear to represent a second wave of astrocytes accumulating at the scar, following an immediate reaction of first wave reactive gliosis by local astrocytes. Mechanistically, the study presents evidence that the degradation of hyaluronan (HA), a key component of the extracellular matrix (ECM) is downregulated in the SVZ after ischemia, potentially inducing astrogliogenesis, while HA accumulation at the lesion side represents at least one signal to recruit the newly generated astrocytes. In the aim to facilitate tissue regeneration after ischemic injury, the authors propose that the Thbs4-positive astrocytes could be a promising therapeutical target to modulate the glial scar after brain ischemia.
Strengths:
This topic is timely and important since the focus of previous studies was almost exclusively on the role of neurogenesis. The generation of adult-born astrocytes has been proven in both neurogenic niches under physiological conditions, but the implicated function in pathology has not been sufficiently addressed yet.
Weaknesses:
The study presented by Ardaya et al presents good evidence that a population of astrocytes that express Thbs4 contribute to scar formation after ischemic injury. The authors demonstrate that ischemic injury increases proliferation in the SVZ, decreases neurogenesis and increases astrogenesis. However, whether astrogenesis is a result of terminal differentiation of type B cells or their proliferation remains unclear. Here, a combination of fate mapping and thymidine analogue-tracing would have been conclusively.
-
Author response:
The following is the authors’ response to the previous reviews.
Reviewer #1 (Public review):
Summary:
The authors show that SVZ derived astrocytes respond to a middle carotid artery occlusion
(MCAO) hypoxia lesion by secreting and modulating hyaluronan at the edge of the lesion (penumbra) and that hyaluronan is a chemoattractant to SVZ astrocytes. They use lineage tracing of SVZ cells to determine their origin. They also find that SVZ derived astrocytes express Thbs-4 but astrocytes at the MCAO-induced scar do not. Also, they demonstrate that decreased HA in the SVZ is correlated with gliogenesis. While much of the paper is descriptive/correlative they do overexpress Hyaluronan synthase 2 via viral vectors and show this is sufficient to recruit astrocytes to the injury. Interestingly, astrocytes preferred to migrate to the MCAO than to the region of overexpressed HAS2.
Strengths:
The field has largely ignored the gliogenic response of the SVZ, especially with regards to astrocytic function. These cells and especially newborn cells may provide support for regeneration. Emigrated cells from the SVZ have been shown to be neuroprotective via creating pro-survival environments, but their expression and deposition of beneficial extracellular matrix molecules is poorly understood. Therefore, this study is timely and important. The paper is very well written and the flow of results logical.
Comments on revised version:
The authors have addressed my points and the paper is much improved. Here are the salient remaining issues that I suggest be addressed.
We appreciate the feedback by the reviewer, and we are glad that the paper is considered to be much improved. We have done our best to address the remaining issues in this 2nd revision.
The authors have still not shown, using loss of function studies, that Hyaluronan is necessary for SVZ astrogenesis and or migration to MCAO lesions.
This is true. Unfortunately, complete removal of hyaluronan (via Hyase) triggers epilepsy, already described in 1963 by James Young (Exp Neurol paper). Degradation by Hyase also provokes neuroinflammation (Soria et al., 2020 Nat Commun). Two alternatives could be 1) partial depletion with Has inhibitor 4MU (but it is also associated with increased inflammation) or 2) a Has-KO mouse, such as Has3-/- (Arranz et al., 2014), although, to our knowledge, this mouse line is not openly available. We have added a sentence in line 332 addressing this shortcoming: “Loss-of-function studies, using HA-depletion models or HA synthase (Has)deficient mice are still needed to corroborate this finding, although the inflammation associated with HA deficiency might confound interpretation.”
(1) The co-expression of EGFr with Thbs4 and the literature examination is useful.
We thank the reviewer for the kind comment.
(2) Too bad they cannot explain the lack of effect of the MCAO on type C cells. The comparison with kainate-induced epilepsy in the hippocampus may or may not be relevant.
As stated in the previous response, we also found this interesting, and it does warrant further exploration by looking into possible direct NSC-astrocyte differentiation. But we believe that both this possible direct differentiation and the reactive status for these astrocytes are out of the scope of the study. We will not speculate about this in the discussion, either.
(3) Thanks for including the orthogonal confocal views in Fig S6D.
(4) The statement that "BrdU+/Thbs4+ cells mostly in the dorsal area" and therefore they mostly focused on that region is strange. Figure 8 clearly shows Thbs4 staining all along the striatal SVZ. Do they mean the dorsal segment of the striatal SVZ or the subcallosal SVZ? Fig. 4b and Fig 4f clearly show the "subcallosal" area as the one analysed but other figures show the dorsal striatal region (Fig. 2a). This is important because of the well-known embryological and neurogenic differences between the regions.
While it is true that Thbs4 is also expressed in the other subregions of the SVZ (lateral, ventral and medial), as observed in Fig 8. we chose the dorsal area because it is the subregion where we observed the larger increase in slow proliferative NSCs (Thbs4/GFAP/BrdU-positive cells) after MCAO (Fig S3). As observed in the quantifications in Fig S3, we found Thbs4/GFAP/BrdUpositive cells increase in lateral, medial and ventral SVZ, but it is not significant. Therefore, from Fig 4 onwards, we focused on the dorsal SVZ, which the reviewer mentions as “subcallosal” area. We chose the term “dorsal” as stated in single-cell studies (Cebrian-Silla et al, 2021, eLife; Marcy et al., 2023, Sci Adv) and reviews (Sequerra 2014 Front Cell Neurosci) that investigate or mention this subregion, respectively. In the abstract, we are perfectly clear stating that newborn astrocytes migrate frm both dorsal and medial areas.
In Fig 2a, the immunofluorescence image shows medial and lateral SVZ, but at this point in the paper, we have not yet made specific subregional quantifications, and the Nestin, DCX and Thbs4 quantifications refer to the SVZ as a whole, both in the IF and in the WB (Fig 2e-g). We apologize for the confusion. We have clarified this in the text (line 119).
(5) It is good to know that the harsh MCAO's had already been excluded.
(6) Sorry for the lack of clarity - in addition to Thbs4, I was referring to mouse versus rat Hyaluronan degradation genes (Hyal1, Hyal2 and Hyal3) and hyaluronan synthase genes (HAS1 and HAS2) in order to address the overall species differences in hyaluronan biology thus justifying the "shift" from mouse to rat. You examine these in the (weirdly positioned) Fig. 8h,i. Please add a few sentences on mouse vs rat Thbs4 and Hyaluronan relevant genes.
We thank the reviewer for these remarks. We have now added a sentence pointing to the similar internalization and degradation in rat and mouse (reviewed by Sherman et al., 2015). This correction is in line 233. Hyaluronan is, in evolutionary terms, a very “old” molecule, part of the “ancient” glycan-based matrix, before the evolution of proteoglycans and fibrous proteins such as collagen, laminin etc. Hence, its machinery is highly conserved across species.
We have also reorganized the panels in Fig 8, where 8h and 8i were indeed weirdly positioned. We hope that the new version of this figure is more easily readable.
(7) Thank you for the better justification of using the naked mole rat HA synthase.
Reviewer #3 (Public review):
Summary:
The authors aimed to study the activation of gliogenesis and the role of newborn astrocytes in a post-ischemic scenario. Combining immunofluorescence, BrdU-tracing and genetic cellular labelling, they tracked the migration of newborn astrocytes (expressing Thbs4) and found that Thbs4-positive astrocytes modulate the extracellular matrix at the lesion border by synthesis but also degradation of hyaluronan. Their results point to a relevant function of SVZ newborn astrocytes in the modulation of the glial scar after brain ischemia. This work's major strength is the fact that it is tackling the function of SVZ newborn astrocytes, whose role is undisclosed so far.
Strengths:
The article is innovative, of good quality, and clearly written, with properly described Materials and Methods, data analysis and presentation. In general, the methods are designed properly to answer the main question of the authors, being a major strength. Interpretation of the data is also in general well done, with results supporting the main conclusions of this article.
In this revised version, the points raised/weaknesses were clarified and discussed in the article.
Recommendations for the authors:
Reviewer #1 (Recommendations for the authors):
Minor points:
(1) Thanks for the clarification.
(2) Thanks for the clarification.
(3) The magnification is not apparent in Fig. 5.
We had removed two brain slices (from 4 to 2) in order to increase the size of the image 2-fold. We have now further increased the TTC panel, 25% from the revised version, 125% from the original.
(4) Thanks for the clarification.
(5) Thanks for the clarification.
(6) Thanks for the clarification.
(7) Thanks for the clarification.
(8) Thanks for the clarification.
-
-
www.biorxiv.org www.biorxiv.org
-
eLife Assessment
Bowler et al. present a software/hardware system for behavioral control of navigation-based virtual reality experiments, particularly suited for pairing with 2-photon imaging but applicable to a variety of techniques. This system represents a valuable contribution to the field of behavioral and systems neuroscience, as it provides a standardized, easy to implement, and flexible system that could be adopted across multiple laboratories. The authors provide compelling evidence of the functionality of their system by reporting benchmark tests and demonstrating hippocampal activity patterns consistent with standards in the field. This work will be of interest to systems neuroscientists looking to integrate flexible head-fixed behavioral control with neural data acquisition.
-
Reviewer #1 (Public review):
Summary:
Bowler et al. present a thoroughly tested system for modularized behavioral control of navigation-based experiments, particularly suited for pairing with 2-photon imaging but applicable to a variety of techniques. This system, which they name behaviorMate, represents an important methodological contribution to the field of behavioral and systems neuroscience. As the authors note, behavioral control paradigms vary widely across laboratories in terms of hardware and software utilized and often require specialized technical knowledge to make changes to these systems. Having a standardized, easy to implement, and flexible system that can be used by many groups is therefore highly desirable.
Strengths:
The present manuscript provides compelling evidence of the functionality and applicability of behaviorMate. The authors report benchmark tests for high-fidelity, real-time update speed between the animal's movement and the behavioral control, on both the treadmill-based and virtual reality (VR) setups. The VR system relies on Unity, a common game development engine, but implements all scene generation and customizability in the authors' behaviorMate and VRMate software, which circumvents the need for users to program task logic in C# in Unity. Further, the authors nicely demonstrate and quantify reliable hippocampal place cell coding in both setups, using synchronized 2-photon imaging. This place cell characterization also provides a concrete comparison between the place cell properties observed in treadmill-based navigation vs. visual VR in a single study, which itself is a valuable contribution to the field.
Weaknesses: None noted.
Documentation for installing and operating behaviorMate is available via the authors' lab website and Github, linked in the manuscript.
The authors have addressed all of my requests for clarification from the previous round of review. This work will be of great interest to systems neuroscientists looking to integrate flexible head-fixed behavioral control with neural data acquisition.
-
Reviewer #2 (Public review):
The authors present behaviorMate, an open-source behavior control system including a central GUI and compatible treadmill and display components. Notably, the system utilize the "Intranet of things" scheme and the components communicate through local network, making the system modular, which in turn allows user to configure the setup to suit their experimental needs. Overall, behaviorMate is a useful resource for researchers performing head-fixed VR imaging studies involving 1D navigation tasks, as the commercial alternatives are often expensive and inflexible to modify.
One major utility of behaviorMate is an open-source alternative to commercial behavior apparatus for head-fixed imaging studies involving 1D navigation tasks. The documentation, BOM, CAD files, circuit design, source and compiled software, along with the manuscript, create an invaluable resource for neuroscience researcher looking to set up a budget-friendly VR and head-fixed imaging rig. Some features of behaviorMate, including the computer vision-based calibration of treadmill, and the decentralized, Android-based display devices, are very innovative approaches and can be quite useful in practical settings.
behaviorMate can also be used as a set of generic schema and communication protocols that allows the users to incorporate recording and stimulation devices during a head-fixed imaging experiment. Due to the "Intranet of things" approach taken in the design, any hardware that supports UDP communication can in theory be incorporated into the system. In terms of current capability, behaviorMate supports experimental contingencies based on animal position and time and synchronization with external recording devices using a TTL start signal. Further customization involving more complicated experimental contingencies, more accurate recording synchronization (for example with ephys recording devices), incorporation of novel behavior and high-speed neural recording hardware beyond GPIO signaling would require modification of the Java source and custom hardware implementation. Modification to the Java source of behaviorMate can be performed with basic familiarity with object-oriented programming using the Java programming language, and a JavaFX-based plugin system is under development to make such customizations more approachable for users.
In summary, the manuscript presents a well-developed and useful open-source behavior control system for head-fixed VR imaging experiments with innovative features.
-
Reviewer #3 (Public review):
In this work, the authors present an open-source system called behaviourMate for acquiring data related to animal behavior. The temporal alignment of recorded parameters across various devices is highlighted as crucial to avoid delays caused by electronics dependencies. This system not only addresses this issue but also offers an adaptable solution for VR setups. Given the significance of well-designed open-source platforms, this paper holds importance.
Advantages of behaviorMate:
The cost-effectiveness of the system provided.<br /> The reliability of PCBs compared to custom-made systems.<br /> Open-source nature for easy setup.<br /> Plug & Play feature requiring no coding experience for optimizing experiment performance (only text based Json files, 'context List' required for editing).
-
Author response:
The following is the authors’ response to the previous reviews.
Public Reviews:
Reviewer #1 (Public Review):
(1) As VRMate (a component of behaviorMate) is written using Unity, what is the main advantage of using behaviorMate/VRMate compared to using Unity alone paired with Arduinos (e.g. Campbell et al. 2018), or compared to using an existing toolbox to interface with Unity (e.g. Alsbury-Nealy et al. 2022, DOI: 10.3758/s13428-021-01664-9)? For instance, one disadvantage of using Unity alone is that it requires programming in C# to code the task logic. It was not entirely clear whether VRMate circumvents this disadvantage somehow -- does it allow customization of task logic and scenery in the GUI? Does VRMate add other features and/or usability compared to Unity alone? It would be helpful if the authors could expand on this topic briefly.
We have updated the manuscript (lines 412-422) to clarify the benefits of separating the VR system as an isolated program and a UI that can be run independently. We argue that “…the recommended behaviorMate architecture has several important advantages. Firstly, by rendering each viewing angle of a scene on a dedicated device, performance is improved by splitting the computational costs across several inexpensive devices rather than requiring specialized or expensive graphics cards in order to run…, the overall system becomes more modular and easier to debug [and] implementing task logic in Unity would require understanding Object-Oriented Programming and C# … which is not always accessible to researchers that are typically more familiar with scripting in Python and Matlab.”
VRMate receives detailed configuration info from behaviorMate at runtime as to which VR objects to display and receives position updates during experiments. Any other necessary information about triggering rewards or presenting non-VR cues is still handled by the UI so no editing of Unity is necessary. Scene configuration information is in the same JSON format as the settings files for behaviorMate, additionally there are Unity Editor scripts which are provided in the VRmate repository which permit customizing scenes through a “drag and drop” interface and then writing the scene configuration files programmatically. Users interested in these features should see our github page to find example scene.vr files and download the VRMate repository (including the editor scripts). We provided 4 vr contexts, as well as a settings file that uses one of them which can be found on the behaviorMate github page (https://github.com/losonczylab/behaviorMate) in the “vr_contexts” and “example_settigs_files” directories. These examples are provided to assist VRMate users in getting set up and could provide a more detailed example of how VRMate and behaviorMate interact.
(2) The section on "context lists", lines 163-186, seemed to describe an important component of the system, but this section was challenging to follow and readers may find the terminology confusing. Perhaps this section could benefit from an accompanying figure or flow chart, if these terms are important to understand.
We maintain the use of the term context and context list in order to maintain a degree of parity with the java code. However, we have updated lines 173-175 to define the term context for the behaviorMate system: “... a context is grouping of one or more stimuli that get activated concurrently. For many experiments it is desirable to have multiple contexts that are triggered at various locations and times in order to construct distinct or novel environments.”
a. Relatedly, "context" is used to refer to both when the animal enters a particular state in the task like a reward zone ("reward context", line 447) and also to describe a set of characteristics of an environment (Figure 3G), akin to how "context" is often used in the navigation literature. To avoid confusion, one possibility would be to use "environment" instead of "context" in Figure 3G, and/or consider using a word like "state" instead of "context" when referring to the activation of different stimuli.
Thank you for the suggestion. We have updated Figure 3G to say “Environment” in order to avoid confusion.
(3) Given the authors' goal of providing a system that is easily synchronizable with neural data acquisition, especially with 2-photon imaging, I wonder if they could expand on the following features:
a. The authors mention that behaviorMate can send a TTL to trigger scanning on the 2P scope (line 202), which is a very useful feature. Can it also easily generate a TTL for each frame of the VR display and/or each sample of the animal's movement? Such TTLs can be critical for synchronizing the imaging with behavior and accounting for variability in the VR frame rate or sampling rate.
Different experimental demands require varying levels of precision in this kind of synchronization signals. For this reason, we have opted against a “one-size fits all” for synchronization with physiology data in behaviorMate. Importantly this keeps the individual rig costs low which can be useful when constructing setups specifically for use when training animals. behaviorMate will log TTL pulses sent to GPIO pins setup as sensors, and can be configured to generate TTL pulses at regular intervals. Additionally all UDP packets received by the UI are time stamped and logged. We also include the output of the arduino millis() function in all UDP packets which can be used for further investigation of clock drift between system components. Importantly, since the system is event driven there cannot be accumulating drift across running experiments between the behaviorMate UI and networked components such as the VR system.
For these reasons, we have not needed to implement a VR frame synchronization TTL for any of our experiments, however, one could extend VRMate to send "sync" packets back to behaviorMate to log when each frame was displayed precisely or TTL pulses (if using the same ODROID hardware we recommend in the standard setup for rendering scenes). This would be useful if it is important to account for slight changes in the frame rate at which the scenes are displayed. However, splitting rendering of large scenes between several devices results in fast update times and our testing and benchmarks indicate that display updates are smooth and continuous enough to appear coupled to movement updates from the behavioral apparatus and sufficient for engaging navigational circuits in the brain.
b. Is there a limit to the number of I/O ports on the system? This might be worth explicitly mentioning.
We have updated lines 219-220 in the manuscript to provide this information: Sensors and actuators can be connected to the controller using one of the 13 digital or 5 analog input/output connectors.
c. In the VR version, if each display is run by a separate Android computer, is there any risk of clock drift between displays? Or is this circumvented by centralized control of the rendering onset via the "real-time computer"?
This risk is mitigated by the real-time computer/UI sending position updates to the VR displays. The maximum amount scenes can be out of sync is limited because they will all recalibrate on every position update – which occurs multiple times per second as the animal is moving. Moreover, because position updates are constantly being sent by behaviorMate to VRMate and VRMate is immediately updating the scene according to this position, the most the scene can become out of sync with the mouse's position is proportional to the maximum latency multiplied by the running speed of the mouse. For experiments focusing on eliciting an experience of navigation, such a degree of asynchrony is almost always negligible. For other experimental demands it could be possible to incorporate more precise frame timing information but this was not necessary for our use case and likely for most other use cases. Additionally, refer to the response to comment 3a.
Reviewer #2 (Public review):
(1) The central controlling logic is coupled with GUI and an event loop, without a documented plugin system. It's not clear whether arbitrary code can be executed together with the GUI, hence it's not clear how much the functionality of the GUI can be easily extended without substantial change to the source code of the GUI. For example, if the user wants to perform custom real-time analysis on the behavior data (potentially for closed-loop stimulation), it's not clear how to easily incorporate the analysis into the main GUI/control program.
Without any edits to the existing source code behaviorMate is highly customizable through the settings files, which allow users to combine the existing contexts and decorators in arbitrary combinations. Therefore, users have been able to perform a wide variety of 1D navigation tasks, well beyond our anticipated use cases by generating novel settings files. The typical method for providing closed-loop stimulation would be to set up a context which is triggered by animal behavior using decorators (e.g. based on position, lap number and time) and then trigger the stimulation with a TTL pulse. Rarely, if users require a behavioral condition not currently implemented or composable out of existing decorators, it would require generating custom code in Java to extend the UI. Performing such edits requires only knowledge of basic object-oriented programming in Java and generating a single subclass of either the BasicContextList or ContextListDecorator classes. In addition, the JavaFX (under development) version of behaviorMate incorporates a plugin which doesn't require recompiling the code in order to make these changes. However, since the JavaFX software is currently under development, documentation does not yet exist. All software is open-sourced and available on github.com for users interested in generating plugins or altering the source code.
We have added the additional caveat to the manuscript in order to clarify this point (Line 197-202): “However, if the available set of decorators is not enough to implement the required task logic, some modifications to the source code may be necessary. These modifications, in most cases, would be very simple and only a basic understanding of object-oriented programming is required. A case where this might be needed would be performing novel customized real-time analysis on behavior data and activating a stimulus based on the result”
(2) The JSON messaging protocol lacks API documentation. It's not clear what the exact syntax is, supported key/value pairs, and expected response/behavior of the JSON messages. Hence, it's not clear how to develop new hardware that can communicate with the behaviorMate system.
The most common approach for adding novel hardware is to use TTL pulses (or accept an emitted TTL pulse to read sensor states). This type of hardware addition is possible through the existing GPIO without the need to interact with the software or JSON API. Users looking to take advantage of the ability to set up and configure novel behavioral paradigms without the need to write any software would be limited to adding hardware which could be triggered with and report to the UI with a TTL pulse (however fairly complex actions could be triggered this way).
For users looking to develop more customized hardware solutions that interact closely with the UI or GPIO board, additional documentation on the JSON messaging protocol has been added to the behaviormate-utils repository (https://github.com/losonczylab/behaviormate_utils). Additionally, we have added a link to this repository in the Supplemental Materials section (line 971) and referenced this in the manuscript (line 217) to make it easier for readers to find this information.
Furthermore, developers looking to add completely novel components to the UI can implement the interface described by Context.java in order to exchange custom messages with hardware. (described in the JavaDoc: https://www.losonczylab.org/behaviorMate-1.0.0/) These messages would be defined within the custom context and interact with the custom hardware (meaning the interested developer would make a novel addition to the messaging API). Additionally, it should be noted that without editing any software, any UDP packets sent to behaviorMate from an IP address specified in the settings will get time stamped and logged in the stored behavioral data file meaning that are a large variety of hardware implementation solutions using both standard UDP messaging and through TTL pulses that can work with behaviorMate with minimal effort. Finally, see response to R2.1 for a discussion of the JavaFX version of the behaviorMatee UI including plugin support.
(3) It seems the existing control hardware and the JSON messaging only support GPIO/TTL types of input/output, which limits the applicability of the system to more complicated sensor/controller hardware. The authors mentioned that hardware like Arduino natively supports serial protocols like I2C or SPI, but it's not clear how they are handled and translated to JSON messages.
We provide an implementation for an I2C-based capacitance lick detector which interested developers may wish to copy if support for novel I2C or SPI. Users with less development experience wishing to expand the hardware capabilities of behaviorMatecould also develop adapters which can be triggered on a TTL input/output. Additionally, more information about the JSON API and how messages are transmitted to the PC by the arduino is described in point (2) and the expanded online documentation.
a. Additionally, because it's unclear how easy to incorporate arbitrary hardware with behaviorMate, the "Intranet of things" approach seems to lose attraction. Since currently, the manuscript focuses mainly on a specific set of hardware designed for a specific type of experiment, it's not clear what are the advantages of implementing communication over a local network as opposed to the typical connections using USB.
As opposed to serial communication protocols as typical with USB, networking protocols seamlessly function based on asynchronous message passing. Messages may be routed internally (e.g. to a PCs localhost address, i.e. 0.0.0..0) or to a variety of external hardware (e.g. using IP addresses such as those in the range 192.168.1.2 - 192.168.1.254). Furthermore, network-based communication allows modules, such as VR, to be added easily. behavoirMate systems can be easily expanded using low-cost Ethernet switches and consume only a single network adapter on the PC (e.g. not limited by the number of physical USB ports). Furthermore, UDP message passing is implemented in almost all modern programming languages in a platform independent manner (meaning that the same software can run on OSX, Windows, and Linux). Lastly, as we have pointed out (Line 117) a variety of tools exist for inspecting network packets and debugging; meaning that it is possible to run behaviorMate with simulated hardware for testing and debugging.
The IOT nature of behaviorMate means there is no requirement for novel hardware to be implemented using an arduino, since any system capable of UDP communication can be configured. For example, VRMate is usually run on Odroid C4s, however one could easily create a system using Raspberry Pis or even additional PCs. behaviorMate is agnostic to the format of the UDP messages, but packaging any data in the JSON format for consistency would be encouraged. If a new hardware is a sensor that has input requiring it to be time stamped and logged then all that is needed is to add the IP address and port information to the ‘controllers’ list in a behaviorMate settings file. If more complex interactions are needed with novel hardware than a custom implementation of ContextList.java may be required (see response to R2.2). However, the provided UdpComms.java class could be used to easily send/receive messages from custom Context.java subclasses.
Solutions for highly customized hardware do require basic familiarity with object-oriented programming using the Java programming language. However, in our experience most behavioral experiments do not require these kinds of modifications. The majority of 1D navigation tasks, which behaviorMate is currently best suited to control, require touch/motion sensors, LEDs, speakers, or solenoid valves, which are easily controlled by the existing GPIO implementation. It is unlikely that custom subclasses would even be needed.
Reviewer #3 (Public review):
(1) While using UDP for data transmission can enhance speed, it is thought that it lacks reliability. Are there error-checking mechanisms in place to ensure reliable communication, given its criticality alongside speed?
The provided GPIO/behavior controller implementation sends acknowledgement packets in response to all incoming messages as well as start and stop messages for contexts and “valves”. In this way the UI can update to reflect both requested state changes as well as when they actually happen (although there is rarely a perceptible gap between these two states unless something is unplugged or not functioning). See Line 85 in the revised manuscript “acknowledgement packets are used to ensure reliable message delivery to and from connected hardware”.
(2) Considering this year's price policy changes in Unity, could this impact the system's operations?
VRMate is not affected by the recent changes in pricing structure of the Unity project.
The existing compiled VRMate software does not need to be regenerated to update VR scenes, or implement new task logic (since this is handled by the behaviorMate GUI). Therefore, the VRMate program is robust to any future pricing changes or other restructuring of the Unity program and does not rely on continued support of Unity. Additionally, while the solution presented in VRMate has many benefits, a developer could easily adapt any open-source VR Maze project to receive the UDP-based position updates from behaviorMate or develop their own novel VR solutions.
(3) Also, does the Arduino offer sufficient precision for ephys recording, particularly with a 10ms check?
Electrophysiology recording hardware typically has additional I/O channels which can provide assistance with tracking behavior/synchronization at a high resolution. While behaviorMate could still be used to trigger reward valves, either the ephys hardware or some additional high-speed DAQ would be recommended to maintain accurately with high-speed physiology data. behaviorMate could still be set up as normal to provide closed and open-loop task control at behaviorally relevant timescales alongside a DAQ circuit recording events at a consistent temporal resolution. While this would increase the relative cost of the individual recording setup, identical rigs for training animals could still be configured without the DAQ circuit avoiding unnecessary cost and complexity.
(4) Could you clarify the purpose of the Sync Pulse? In line 291, it suggests additional cues (potentially represented by the Sync Pulse) are needed to align the treadmill screens, which appear to be directed towards the Real-Time computer. Given that event alignment occurs in the GPIO, the connection of the Sync Pulse to the Real-Time Controller in Figure 1 seems confusing.
A number of methods exist for synchronizing recording devices like microscopes or electrophysiology recordings with behaviorMate’s time-stamped logs of actuators and sensors. For example, the GPIO circuit can be configured to send sync triggers, or receive timing signals as input. Alternatively a dedicated circuit could record frame start signals and relay them to the PC to be logged independently of the GPIO (enabling a high-resolution post-hoc alignment of the time stamps). The optimal method to use varies based on the needs of the experiment. Our setups have a dedicated BNC output and specification in the settings file that sends a TTL pulse at the start of an experiment in order to trigger 2p imaging setups (see line 224, specifically that this is a detail of “our” 2p imaging setup). We provide this information as it might be useful suggesting how to have both behavior and physiology data start recording at the same time. We do not intend this to be the only solution for alignment. Figure 1 indicates an “optional” circuit for capturing a high speed sync pulse and providing time stamps back to the real time PC. This is another option that might be useful for certain setups (or especially for establishing benchmarks between behavior and physiology recordings). In our setup event alignment does not exclusively occur on the GPIO.
a. Additionally, why is there a separate circuit for the treadmill that connects to the UI computer instead of the GPIO? It might be beneficial to elaborate on the rationale behind this decision in line 260.
Event alignment does not occur on the GPIO, separating concerns between position tracking and more general input/output features which improves performance and simplifies debugging. In this sense we maintain a single event loop on the Arduino, avoiding the need to either run multithreaded operations or rely extensively on interrupts which can cause unpredictable code execution (e.g. when multiple interrupts occur at the same time). Our position tracking circuit is therefore coupled to a separate,low-cost arduino mini which has the singular responsibility of position-tracking.
b. Moreover, should scenarios involving pupil and body camera recordings connect to the Analog input in the PCB or the real-time computer for optimal data handling and processing?
Pupil and body camera recordings would be independent data streams which can be recorded separately from behaviorMate. Aligning these forms of full motion video could require frame triggers which could be configured on the GPIO board using single TTL like outputs or by configuring a valve to be “pulsed” which is a provided type customization.
We also note that a more advanced developer could easily leverage camera signals to provide closed loop control by writing an independent module that sends UDP packets to behavoirMate. For example a separate computer vision based position tracking module could be written in any preferred language and use UDP messaging to send body tracking updates to the UI without editing any of the behaviorMate source code (and even used for updating 1D location).
(5) Given that all references, as far as I can see, come from the same lab, are there other labs capable of implementing this system at a similar optimal level?
To date two additional labs have published using behaviorMate, the Soltez and Henn labs (see revised lines 341-342). Since behaviorMate has only recently been published and made available open source, only external collaborators of the Losonczy lab have had access to the software and design files needed to do this. These collaborators did, however, set up their own behavioral setups in separate locations with minimal direct support from the authors–similar to what would be available to anyone seeking to set a behaviorMate system would find online on our github page or by posting to the message board.
Recommendations for the authors:
Reviewer #1 (Recommendations For The Authors):
(4) To provide additional context for the significance of this work, additional citations would be helpful to demonstrate a ubiquitous need for a system like behaviorMate. This was most needed in the paragraph from lines 46-65, specifically for each sentence after line 55, where the authors discuss existing variants on head-fixed behavioral paradigms. For instance, for the clause "but olfactory and auditory stimuli have also been utilized at regular virtual distance intervals to enrich the experience with more salient cues", suggested citations include Radvansky & Dombeck 2018 (DOI: 10.1038/s41467-018-03262-4), Fischler-Ruiz et al. 2021 (DOI: 10.1016/j.neuron.2021.09.055).
We thank the reviewer for the suggested missing citations and have updated the manuscript accordingly (see line 58).
(5) In addition, it would also be helpful to clarify behaviorMate's implementation in other laboratories. On line 304 the authors mention "other labs" but the following list of citations is almost exclusively from the Losonczy lab. Perhaps the citations just need to be split across the sentence for clarity? E.g. "has been validated by our experimental paradigms" (citation set 1) "and successfully implemented in other labs as well" (citation set 2).
We have split the citation set as suggested (see lines 338-342).
Minor Comments:
(6) In the paragraph starting line 153 and in Fig. 2, please clarify what is meant by "trial" vs. "experiment". In many navigational tasks, "trial" refers to an individual lap in the environment, but here "trial" seems to refer to the whole behavioral session (i.e. synonymous with "experiment"?).
In our software implementation we had originally used “trial” to refer to an imaging session rather than experiment (and have made updates to start moving to the more conventional lexicon). To avoid confusion we have remove this use of “trial” throughout the manuscript and replaced with “experiment” whenever possible
(7) This is very minor, but in Figure 3 and 4, I don't believe the gavage needle is actually shown in the image. This is likely to avoid clutter but might be confusing to some readers, so it may be helpful to have a small inset diagram showing how the needle would be mounted.
We assessed the image both with and without the gavage needle and found the version in the original (without) to be easier to read and less cluttered and therefore maintained that version in the manuscript.
(8) In Figure 5 legend, please list n for mice and cells.
We have updated the Figure 5 legend to indicate that for panels C-G, n=6 mice (all mice were recorded in both VR and TM systems), 3253 cells in VR classified as significantly tuned place cells VR, and 6101 tuned cells in TM,
(9) Line 414: It is not necessary to tilt the entire animal and running wheel as long as the head-bar clamp and objective can rotate to align the imaging window with the objective's plane of focus. Perhaps the authors can just clarify the availability of this option if users have a microscope with a rotatable objective/scan head.
We have added the suggested caveat to the manuscript in order to clarify when the goniometers might be useful (see lines 281-288).
(10) Figure S1 and S2 could be referenced explicitly in the main text with their related main figures.
We have added explicit references to figures S1 and S2 in the relevant sections (see lines 443, 460 and 570)
(11) On line 532-533, is there a citation for "proximal visual cues and tactile cues (which are speculated to be more salient than visual cues)"?
We have added citations to both Knierim & Rao 2003 and Renaudineau et al. 2007 which discuss the differential impact of proximal vs distal cues during navigation as well as Sofroniew et al. 2014 which describe how mice navigate more naturally in a tactile VR setup as opposed to purely visual ones.
(12) There is a typo at the end of the Figure 2 legend, where it should say "Arduino Mini."
This typo has been fixed.
Reviewer #2 (Recommendations For The Authors):
(4) As mentioned in the public review: what is the major advantage of taking the IoT approaches as opposed to USB connections to the host computer, especially when behaviorMate relies on a central master computer regardless? The authors mentioned the readability of the JSON messages, making the system easier to debug. However, the flip side of that is the efficiency of data transmission. Although the bandwidth/latency is usually more than enough for transmitting data and commands for behavior devices, the efficiency may become a problem when neural recording devices (imaging or electrophysiology) need to be included in the system.
behaviorMate is not intended to do everything, and is limited to mainly controlling behavior and providing some synchronizing TTL style triggers. In this way the system can easily and inexpensively be replicated across multiple recording setups; particularly this is useful for constructing additional animal training setups. The system is very much sufficient for capturing behavioral inputs at relevant timescales (see the benchmarks in Figures 3 and 4 as well as the position correlated neural activity in Figures 5 and 6 for demonstration of this). Additional hardware might be needed to align the behaviorMate output with neural data for example a high-speed DAQ or input channels on electrophysiology recording setups could be utilized (if provided). As all recording setups are different the ideal solution would depend on details which are hard to anticipate. We do not mean to convey that the full neural data would be transmitted to the behaviorMate system (especially using the JSON/UDP communications that behaviorMate relies on).
(5) The author mentioned labView. A popular open-source alternative is bonsai (https://github.com/bonsai-rx/bonsai). Both include a graphical-based programming interface that allows the users to easily reconfigure the hardware system, which behaviorMate seems to lack. Additionally, autopilot (https://github.com/auto-pi-lot/autopilot) is a very relevant project that utilizes a local network for multiple behavior devices but focuses more on P2P communication and rigorously defines the API/schema/communication protocols for devices to be compatible. I think it's important to include a discussion on how behaviorMate compares to previous works like these, especially what new features behaviorMate introduces.
We believe that behaviorMate provides a more opinionated and complete solution than the projects mentioned. A wide variety of 1D navigational paradigms can be constructed in behaviorMate without the need to write any novel software. For example, bonsai is a “visual programming language” and would require experimenters to construct a custom implementation of each of their experiments. We have opted to use Java for the UI with distributed computations across modules in various languages. Given the IOT methodology it would be possible to use any number of programming languages or APIs; a large number of design decisions were made when building the project and we have opted to not include this level of detail in the manuscript in order to maintain readability. We strongly believe in using non-proprietary and open source projects, when possible, which is why the comparison with LabView based solutions was included in the introduction. Also, we have added a reference to the autopilot reference to the section of the introduction where this is discussed.
(6) One of the reasons labView/bonsai are popular is they are inherently parallel and can simultaneously respond to events from different hardware sources. While the JSON events in behaviorMate are asynchronous in nature, the handling of those events seems to happen only in a main event loop coupled with GUI, which is sequential by nature. Is there any multi-threading/multi-processing capability of behaviorMate? If so it's an important feature to highlight. If not I think it's important to discuss the potential limitation of the current implementation.
IOT solutions are inherently concurrent since the computation is distributed. Additional parallelism could be added by further distributing concerns between additional independent modules running on independent hardware. The UI has an eventloop which aggregates inputs and then updates contexts based on the current state of those inputs sequentially. This sort of a “snapshot” of the current state is necessary to reason about when the start certain contexts based on their settings and applied decorators. While the behaviorMate UI uses multithreading libraries in Java to be more performant in certain cases, the degree to which this represents true vs “virtual” concurrency would depend on the individual PC architecture it is run on and how the operating system allocates resources. For this reason, we have argued in the manuscript that behaviorMate is sufficient for controlling experiments at behaviorally relevant timescales, and have presented both benchmarks and discussed different synchronization approaches and permit users to determine if this is sufficient for their needs.
(7) The context list is an interesting and innovative approach to abstract behavior contingencies into a data structure, but it's not currently discussed in depth. I think it's worth highlighting how the context list can be used to cover a wide range of common behavior experimental contingencies with detailed examples (line 185 might be a good example to give). It's also important to discuss the limitation, as currently the context lists seem to only support contingencies based purely on space and time, without support for more complicated behavior metrics (e.g. deliver reward only after X% correct).
To access more complex behavior metrics during runtime, custom context list decorators would need to be implemented. While this is less common in the sort of 1D navigational behaviors the project was originally designed to control, adding novel decorators is a simple process that only requires basic object oriented programming knowledge. As discussed we are also implementing a plugin-architecture in the JavaFX update to streamline these types of additions.
Minor Comments:
(8) In line 202, the author suggests that a single TTL pulse is sent to mark the start of a recording session, and this is used to synchronize behavior data with imaging data later. In other words, there are no synchronization signals for every single sample/frame. This approach either assumes the behavior recording and imaging are running on the same clock or assumes evenly distributed recording samples over the whole recording period. Is this the case? If so, please include a discussion on limitations and alternative approaches supported by behaviorMate. If not, please clarify how exactly synchronization is done with one TTL pulse.
While the TTL pulse triggers the start of neural data in our setups, various options exist for controlling for the described clock drift across experiments and the appropriate one depends on the type of recordings made, frame rate duration of recording etc. Therefore behaviorMate leaves open many options for synchronization at different time scales (e.g. the adding a frame-sync circuit as shown in Figure 1 or sending TTL pulses to the same DAQ recording electrophysiology data). Expanded consideration of different synchronization methods has been included in the manuscript (see lines 224-238).
(9) Is the computer vision-based calibration included as part of the GUI functionality? Please clarify. If it is part of the GUI, it's worth highlighting as a very useful feature.
The computer vision-based benchmarking is not included in the GUI. It is in the form of a script made specifically for this paper. However for treadmill-based experiments behaviorMate has other calibration tools built into it (see line 301-303).
(10) I went through the source code of the Arduino firmware, and it seems most "open X for Y duration" functions are implemented using the delay function. If this is indeed the case, it's generally a bad idea since delay completely pauses the execution and any events happening during the delay period may be missed. As an alternative, please consider approaches comparing timestamps or using interrupts.
We have avoided the use of interrupts on the GPIO due to the potential for unpredictable code execution. There is a delay which is only just executed if the duration is 10 ms or less as we cannot guarantee precision of the arduino eventloop cycling faster than this. Durations longer than 10 ms would be time stamped and non-blocking. We have adjusted this MAX_WAIT to be specified as a macro so it can be more easily adjusted (or set to 0).
(11) Figure 3 B, C, D, and Figure 4 D, E suffer from noticeable low resolution.
We have converted Figure 3B, C, D and 4C, D, E to vector graphics in order to improve the resolution.
(12) Figure 4C is missing, which is an important figure.
This figure appeared when we rendered and submitted the manuscript. We apologize if the figure was generated such that it did not load properly in all pdf viewers. The panel appears correctly in the online eLife version of the manuscript. Additionally, we have checked the revision in Preview on Mac OS as well as Adobe Acrobat and the built-in viewer in Chrome and all figure panels appear in each so we hope this issue has been resolved.
(13) There are thin white grid lines on all heatmaps. I don't think they are necessary.
The grid lines have been removed from the heatmaps as suggested.
(14) Line 562 "sometimes devices directly communicate with each other for performance reasons", I didn't find any elaboration on the P2P communication in the main text. This is potentially worth highlighting as it's one of the advantages of taking the IoT approaches.
In our implementation it was not necessary to rely on P2P communication beyond what is indicated in Figure 1. The direct communication referred to in line 562 is meant only to refer to the examples expanded on in the rest of the paragraph i.e. the behavior controller may signal the microscope directly using a TTL signal without looping back to the UI. As necessary users could implement UDP message passing between devices, but this is outside the scope of what we present in the manuscript.
(15) Line 147 "Notably, due to the systems modular architecture, different UIs could be implemented in any programming language and swapped in without impacting the rest of the system.", this claim feels unsupported without a detailed discussion of how new code can be incorporated in the GUI (plugin system).
This comment refers to the idea of implementing “different UIs”. This would entail users desiring to take advantage of the JSON messaging API and the proposed electronics while fully implementing their own interface. In order to facilitate this option we have improved documentation of the messaging API posted in the README file accompanying the arduino source code. We have added reference to the supplemental materials where readers can find a link to the JSON API implementation to clarify this point.
Additionally, while a plugin system is available in the JavaFX version of behaviorMate, this project is currently under development and will update the online documentation as this project matures, but is unrelated to the intended claim about completely swapping out the UI.
Reviewer #3 (Recommendations For The Authors):
(6) Figure 1 - the terminology for each item is slightly different in the text and the figure. I think making the exact match can make it easier for the reader.
- Real-time computer (figure) vs real-time controller (ln88).
The manuscript was adjusted to match figure terminology.
- The position controller (ln565) - position tracking (Figure).
We have updated Figure 1 to highlight that the position controller does the position tracking.
- Maybe add a Behavior Controller next to the GPIO box in Figure 1.
We updated Figure 1 to highlight that the Behavior Controller performs the GPIO responsibility such that "Behavior Controller" and "GPIO circuit" may be used interchangeably.
- Position tracking (fig) and position controller (subtitle - ln209).
We updated Figure 1 to highlight that the position controller does the position tracking.
- Sync Pulse is not explained in the text.
The caption for Figure 1 has been updated to better explain the Sync pulse and additional systems boxes
(7) For Figure 3B/C: What is the number of data points? It would be nice to see the real population, possibly using a swarm plot instead of box plots. How likely are these outliers to occur?
In order to better characterize the distributions presented in our benchmarking data we have added mean and standard deviation information the plots 3 and 4. For Figure 3B: 0.0025 +/- 0.1128, Figure 3C: 12.9749 +/- 7.6581, Figure 4C: 66.0500 +/- 15.6994, Figure 4E: 4.1258 +/- 3.2558.
-
-
www.biorxiv.org www.biorxiv.org
-
eLife Assessment
Periods in which experience regulates early plasticity in sensory circuits are well established, but the mechanisms that control these critical periods are poorly understood. In this important study, the authors examine early-life critical periods that regulate the Drosophila antennal lobe and show that constant odor exposure markedly reduces the volume, synapse number, and function of a specific glomerulus. The authors offer compelling evidence that these changes are mediated by the invasion of ensheathing glia into the glomerulus where they phagocytose connections via a mechanism involving the engulfment receptor Draper.
-
Reviewer #1 (Public review):
Time periods in which experience regulates early plasticity in sensory circuits are well established, but the mechanisms that control these critical periods are poorly understood. In this manuscript, Leier and Foden and colleagues examine early-life critical periods that regulate the Drosophila antennal lobe, a model sensory circuit for understanding synaptic organization. Using early-life (0-2 days old) exposure to distinct odorants, they show that constant odor exposure markedly reduces the volume, synapse number, and function of the VM7 glomerulus. The authors offer evidence that these changes are mediated by invasion of ensheathing glia into the glomerulus where they phagocytose connections via a mechanism involving the engulfment receptor Draper.
This manuscript is a striking example of a study where the questions are interesting, the authors spent a considerable amount of time to clearly think out the best experiments to ask their questions in the most straightforward way, and expressed the results in a careful, cogent, and well-written fashion. It was a genuine delight to read this paper. Overall, this is an incredibly important finding, a careful analysis, and an excellent mechanistic advance in understanding sensory critical period biology.
Comments on latest version:
In the revision, the authors have clearly thought deeply and added provocative new data. They have addressed my concerns and I laud them on an excellent study.
-
Reviewer #2 (Public review):
Sensory experiences during developmental critical periods have long-lasting impacts on neural circuit function and behavior. However, the underlying molecular and cellular mechanisms that drive these enduring changes are not fully understood. In Drosophila, the antennal lobe is composed of synapses between olfactory sensory neurons (OSNs) and projection neurons (PNs), arranged into distinct glomeruli. Many of these glomeruli show structural plasticity in response to early-life odor exposure, reflecting the sensitivity of the olfactory circuitry to early sensory experiences.<br /> In their study, the authors explored the role of glia in the development of the antennal lobe in young adult flies, proposing that glial cells might also play a role in experience-dependent plasticity. They identified a critical period during which both structural and functional plasticity of OSN-PN synapses occur within the ethyl butyrate (EB)-responsive VM7 glomerulus. When flies were exposed to EB within the first two days post-eclosion, significant reductions in glomerular volume, presynaptic terminal numbers, and postsynaptic activity were observed. The study further highlights the importance of the highly conserved engulfment receptor Draper in facilitating this critical period plasticity. The authors demonstrated that, in response to EB exposure during this developmental window, ensheathing glia increase Draper expression, infiltrate the VM7 glomerulus, and actively phagocytose OSN presynaptic terminals. This synapse pruning has lasting effects on circuit function, leading to persistent decreases in both OSN-PN synapse numbers and spontaneous PN activity as analyzed by perforated patch-clamp electrophysiology to record spontaneous activity from PNs postsynaptic to Or42a OSNs .
In my view, this is an intriguing and potentially valuable set of data.
Comments on latest version:
After carefully reviewing the revised manuscript, I am satisfied with the authors' responses to my initial suggestions, particularly regarding the synaptic readouts used in their analyses. The authors have clarified their approach with appropriate changes in wording, which enhance the manuscript's clarity and address my previous concerns. Although I believe it could have been beneficial to incorporate postsynaptic markers to further substantiate the findings, I understand this may not have been feasible within the scope of the current study.
Overall, I find that the major claims of the manuscript are now sufficiently supported by the presented data. The revisions have improved the manuscript, and I am confident it meets the standards for publication. I therefore recommend the manuscript for publication in its current form.
-
Author response:
The following is the authors’ response to the original reviews.
Reviewer #1 (Public Review):
Time periods in which experience regulates early plasticity in sensory circuits are well established, but the mechanisms that control these critical periods are poorly understood. In this manuscript, Leier and Foden and colleagues examine early-life critical periods that regulate the Drosophila antennal lobe, a model sensory circuit for understanding synaptic organization. Using early-life (0-2 days old) exposure to distinct odorants, they show that constant odor exposure markedly reduces the volume, synapse number, and function of the VM7 glomerulus. The authors offer evidence that these changes are mediated by invasion of ensheathing glia into the glomerulus where they phagocytose connections via a mechanism involving the engulfment receptor Draper.
This manuscript is a striking example of a study where the questions are interesting, the authors spent a considerable amount of time to clearly think out the best experiments to ask their questions in the most straightforward way, and expressed the results in a careful, cogent, and well-written fashion. It was a genuine delight to read this paper. I have two experimental suggestions that would really round out existing work to better support the existing conclusions and some instances where additional data or tempered language in describing results would better support their conclusions. Overall, though, this is an incredibly important finding, a careful analysis, and an excellent mechanistic advance in understanding sensory critical period biology.
We thank the reviewer for their thoughtful and constructive comments on our manuscript. In response to their critiques, we conducted several new experiments as well as additional analysis and making changes to the text. As requested, we carried out an electrophysiological analysis of VM7 PN firing in draper knockdown animals with and without odor exposure. To our surprise, loss of glial Draper fully suppresses the dramatic reduction in spontaneous PN activity observed following critical period ethyl butyrate exposure, arguing that the functional response is restored alongside OSN morphology. It also suggests that the OR42a OSN terminals are intact and functional until they are phagocytosed by ensheathing glia. In other words, glia are not merely clearing axon terminals that have already degenerated. This evidence provides additional support to the claim that the VM7 glomerulus will be an outstanding model for defining mechanism of experience-dependent glial pruning. Detailed responses to the reviewers’ comments follow below.
Regarding the apparent disconnect between the near complete silencing of PNs versus the 50% reduction in OR42a OSN infiltration volume, we agree with the reviewer that this tracks with previous data in the field. While our Imaris pipeline is relatively sensitive, it may not pick up modest changes to terminal arbor architecture. Indeed, as described in Jindal et al. (2023) and in the Methods in this manuscript, we chose conservative software settings that, if anything, would undercount the percent change in infiltration volume. We also note that increased inhibitory LN inputs onto PNs could contribute to dramatic PN silencing we observe. While fascinating, we view LN plasticity beyond the scope of the current manuscript. We removed any mention of ‘silent synapses’ and now speculate about increased inhibition.
Reviewer #1 (Recommendations For The Authors):
Major Elements:
(1) The authors demonstrate that loss of draper in glia can suppress many of the pruning related phenotypes associated with EB exposure. However, they do not assess electrophysiological output in these experiments, only morphology. It would be great to see recordings from those animals to see if the functional response is also restored.
We performed the experiment the reviewer requested (see Figure 4F-J). We are pleased to report that our recordings from VM7 PNs match our morphology measurements: in repo-GAL4>UAS-draper RNAi flies, there was no difference in the innervation of VM7 PNs between animals exposed to mineral oil or 15% EB from 0-2 DPE. This result is in sharp contrast to the near-total loss of OSN-PN innervation in flies with intact glial Draper signaling, and strongly validates the role we propose for Draper in the Or42a OSN critical period.
(2) There is a disconnect between physiology and morphology with a near complete loss of activity from VM7 PNs but a less severe loss of ORN synapses. While not completely incongruent (previous work in the AL showed a complete loss of attractive behavior though synapse number was only reduced 40% - Mosca et al. 2017, eLife), it is curious. Can the authors comment further? Ideally, some of these synapses could be visualized by EM to determine if the remaining synapses are indeed of correct morphology. If not, this could support their assertion of silent inputs from page 7. Further, what happens to the remaining synapses? VM7 PNs should be receiving some activity from other local interneurons as well as neighboring PNs.
We agree that on the surface, our electrophysiology results are more striking than one might expect solely from our measurements of VM7 morphology and presynaptic content. As the reviewer points out, previous studies of fly olfaction have consistently found that relatively modest shifts in glomerular volume in response to prolonged earlylife odorant exposure can be accompanied by drastic changes in physiology and behavior (in addition, we would add Devaud et al., 2003; Devaud et al., 2001; Acebes et al., 2012; and Chodankar et al., 2020, as foundational examples of this phenomenon).
A major driver of these changes appears to be remodeling of antennal lobe inhibitory LNs (see Das et al., 2011; Wilson and Laurent, 2005; Chodankar et al., 2020), especially GABAergic inhibitory interneurons. Perhaps increased LN inhibition of chronically activated PNs, on top of the reduced excitatory inputs resulting from ensheathing glial pruning of the Or42a OSN terminal arbor, would explain the near-total loss of VM7 PN activity we observe after critical period EB exposure. However, given that the scope of our study is limited to critical-period glial biology and does not address the complex topics of LN rewiring or synapse morphology, we have removed the sentence in which we raise the possibility of “silent synapses” in order to avoid confusion. The reviewer is also correct that VM7 PNs have inputs from non-ORN presynaptic partners, including LNs and PNs. So again, perhaps increased inhibitory inputs contributes to the near-complete silencing of the PNs. Given the heterogeneity of LN populations, we view this area as fertile ground for future research.
Language / Data Considerations:
(1) Or42a OSNs have other inputs, namely, from LNs. What are they doing here? Are they also affected?
As discussed above, the question of how LN innervation of Or42a OSNs is altered by critical-period EB exposure is an intriguing one that fully deserves its own follow-up study, and we have tried to avoid speculation about the role of LNs when discussing our pruning phenotype. We note at multiple points throughout the text the importance of LNs and refer to previous studies of LN plasticity in response to chronic odorant exposure.
(2) In all of the measurements, what happens to synaptic density? Is it maintained? Does it scale precisely? This would be helpful to know.
We have performed the analysis as requested, which is now included in a supplement to Figure 5. We found that synaptic density shows no trend in variation across conditions and glial driver genotypes.
(3) In Figure 5, the controls for the alrm-GAL4 experiments show a much more drastic phenotype than controls in previous figures? Does this background influence how we can interpret the results? Could the response have instead hit a floor effect and it's just not possible to recover?
The reviewer is correct that following EB exposure, astrocyte vs. ensheathing glial driver backgrounds displayed modest differences in the extent of pruning by volume (0.27 for astros, 0.36 for EG). We note that the two drpr RNAi lines that we used had non-significant (but opposite) effects on the estimated size of OSN42a OSN volume in combination with the astrocyte driver, arguing against a floor effect. In addition, a recent publication by Nelson et al. (2024) replicated our findings with a different astrocyte GAL4 driver and draper RNAi line. Thus, we are confident that this result is biologically meaningful and not an artifact of genetic background.
(4) The estimation of infiltration measurement in Figure 6 is tricky to interpret. It implies that the projections occupy the same space, which cannot be possible. I'd advocate a tempering of some of this language and consider an intensity measurement in addition to their current volume measurements (or perhaps an "occupied space" measurement) to more accurately assess the level of resolution that can be obtained via these methods.
We completely agree that our language in describing EG infiltration could have been more precise, and we modified our language as suggested. The combination of the Or42a-mCD8::GFP label we and others use, our use of confocal microscopy, and our Surface pipeline in Imaris combine to create a glomerular mask that traces the outline of the OSN terminal arbor, but is nonetheless not 100% “filled” by neuronal membrane and/or glial processes.
(5) Do the authors have the kind of resolution needed to tell whether there is indeed Or42a-positive axon fragmentation (as asserted on p16 and from their data in figures 4, 5, 7). If the authors want to say this, I would advocate for a measurement of fragmentation / total volume to prove it - if not, I would advocate tempering of the current language.
The reviewer brings up a fair criticism: while our assertion about axon fragmentation was based on our visual observations of hundreds of EB-exposed brains, the resolution limits of confocal microscopy do not allow us to rigorously rule out fragmentation within a bundle of OSN axons. Instead, our most compelling evidence for the lack of EB-induced Or42a OSN fragmentation in the absence of glial Draper comes from our new electrophysiology data (Figure 4F-J) in repo-GAL4>UAS-draper RNAi animals. We found no difference in spontaneous release from Or42a terminals in flies exposed to mineral oil or 15% EB from 0-2 DPE, which would not be the case if there was Draper-independent fragmentation along the axons or terminal arbors upon EB exposure. We have updated our discussion of fragmentation so that our statements are based on this new evidence, and not confocal microscopy.
(6) There is an interesting Discussion opportunity missed here. Some experiments would, ostensibly, require pupae to detect odorants within the casing via structures consistently in place for olfaction during pupation. It would be useful for the authors to discuss a little more deeply when this critical period may arise and why the experiment where pupae are exposed to EB two days before eclosion and there is no response, occurs as it does. I agree that it's clearly a time when they are not sensitive to the odorant, but that could just be because there's no ability to detect odorants at that time. Is it a question of non-sensitivity to EB or just non-sensitivity to everything?
We share the reviewer’s interest in the plasticity of the olfactory circuit during pupariation, although, as they correctly point out, it is difficult to conceive of an odorant-exposure experiment that could disentangle the barrier effects of puparium from the sensitivity of the circuit itself, and our pre-eclosion data in Figure 3A, D, G does not distinguish between the two. While an investigation into mechanism by which the critical period for ethyl butyrate exposure opens and closes is outside the scope of the present study, we would consider the physical barrier of the puparium to be a satisfactory explanation for why eclosion marks the functional opening of experiencedependent plasticity. As the reviewer suggests, we have added this important nuance to our discussion of the opening of the critical period in the corresponding paragraph of the Results, as well as to the Discussion section “Glomeruli exhibit dichotomous responses to critical period odor exposure.”
Minor Elements:
(1) Page 6 bottom: "Or4a-mCD8::GFP" should be "Or42a-mCD8::GFP"
(2) Page 15, end of last full paragraph. Remove the "e"
Thank you for pointing out these typos. They have been corrected.
Reviewer #2 (Public Review):
Sensory experiences during developmental critical periods have long-lasting impacts on neural circuit function and behavior. However, the underlying molecular and cellular mechanisms that drive these enduring changes are not fully understood. In Drosophila, the antennal lobe is composed of synapses between olfactory sensory neurons (OSNs) and projection neurons (PNs), arranged into distinct glomeruli. Many of these glomeruli show structural plasticity in response to early-life odor exposure, reflecting the sensitivity of the olfactory circuitry to early sensory experiences.
In their study, the authors explored the role of glia in the development of the antennal lobe in young adult flies, proposing that glial cells might also play a role in experiencedependent plasticity. They identified a critical period during which both structural and functional plasticity of OSN-PN synapses occur within the ethyl butyrate (EB)responsive VM7 glomerulus. When flies were exposed to EB within the first two days post-eclosion, significant reductions in glomerular volume, presynaptic terminal numbers, and postsynaptic activity were observed. The study further highlights the importance of the highly conserved engulfment receptor Draper in facilitating this critical period plasticity. The authors demonstrated that, in response to EB exposure during this developmental window, ensheathing glia increase Draper expression, infiltrate the VM7 glomerulus, and actively phagocytose OSN presynaptic terminals. This synapse pruning has lasting effects on circuit function, leading to persistent decreases in both OSN-PN synapse numbers and spontaneous PN activity as analyzed by perforated patch-clamp electrophysiology to record spontaneous activity from PNs postsynaptic to Or42a OSNs.
In my view, this is an intriguing and potentially valuable set of data. However, since I am not an expert in critical periods or habituation, I do not feel entirely qualified to assess the full significance or the novelty of their findings, particularly in relation to existing research.
We thank the reviewer for their insightful critique of our work. In response to their comments, we added additional physiological analysis and tempered our language around possible explanations for the apparent disconnect between the physiological and morphological critical period odor exposure. These changes are explained in more detail in the response to the public review by Reviewer 1 and also in our responses outlined below.
Reviewer #2 (Recommendations For The Authors):
I though do have specific comments and questions concerning the presynaptic phenotype they deduce from confocal BRP stainings and electrophysiology.
Concerning the number of active zones: this can hardly be deduced from standardresolution confocal images and, maybe more importantly, lacking postsynaptic markers. This particularly also in the light of them speculating about "silent synapses". There are now tools existing concerning labeled, cell type specific expression of acetylcholine-receptor expression and cholinergic postsynaptic density markers (importantly Drep2). Such markers should be entailed in their analysis. They should refer to previous concerning "brp-short" concerning its original invention and prior usage.
We thank the reviewer for their thoughtful approach to our methodology and claims. While the use of confocal microscopy of Bruchpilot puncta to estimate numbers of presynapses is standard practice (see Furusawa et al., 2023; Aimino et al., 2022; Urwyler et al., 2019; Ackerman et al., 2021), the reviewer is correct that a punctum does not an active zone make. Bruchpilot staining and quantification is a well-validated tool for approximating the number of presynaptic active zones, not a substitute for super-resolution microscopy. We made changes to our language about active zones to make this distinction clearer. We have also removed the sentence where we discuss the possibility of “silent synapses,” which both reviewers felt was too speculative for our existing data. Finally, we are highly interested in characterizing the response of PNs and higher-order processing centers to critical-period odorant exposure as a future direction for our research. However, given the complexity of the subject, we chose to limit the scope of this study to the interactions between OSNs and glia.
Regarding their electrophysiological analysis and the plausibility of their findings: I am uncertain whether the moderate reduction in BRP puncta at the relevant OSN::PN synapse can fully account for the significantly reduced spontaneous PN activity they report. This seems particularly doubtful in the absence of any direct evidence for postsynaptically silent synapses. Perhaps this is my own naivety, but I wonder why they did not use antennal nerve stimulation in their experiments?
We refer to previous studies of the AL indicating that moderate changes in glomerular volume and presynaptic content can translate to far more striking alterations in electrophysiology and behavior (Devaud et al., 2003; Devaud et al., 2001; Acebes et al., 2012; and Chodankar et al., 2020, Mosca et al., 2017). This literature has demonstrated that chronic odorant exposure can result in remodeling of inhibitory local interneurons to suppress over-active inputs from OSNs. While we do not address the complex subject of interneuron remodeling in the present study, we find it highly likely that there would be significant changes in interneuron innervation of PNs, independent of glial phagocytosis of OSN excitatory inputs, resulting in additional inhibition. Moving forward, we are very interested in expanding these studies to include odor-evoked changes in PN activity.
Additional minor point: The phrase "Soon after its molecular biology was described (et al., 1999), the Drosophila melanogaster" seems somewhat misleading. Isn't the field still actively describing the molecular biology of the fly olfactory system?
We completely agree and have removed this sentence entirely.
Reviewing Editor's Note: to enhance the evidence from mostly compelling in most facets to solid would be to add physiology to the Draper analysis.
These experiments have been completed and are presented in Figure 4F-J.
References
Acebes A, Devaud J-M, Arnés M, Ferrús A. 2012. Central Adaptation to Odorants Depends on PI3K Levels in Local Interneurons of the Antennal Lobe. J Neurosci 32:417–422. doi:10.1523/jneurosci.2921-11.2012
Ackerman SD, Perez-Catalan NA, Freeman MR, Doe CQ. 2021. Astrocytes close a motor circuit critical period. Nature592:414–420. doi:10.1038/s41586-021-03441-2
Aimino MA, DePew AT, Restrepo L, Mosca TJ. 2022. Synaptic Development in Diverse Olfactory Neuron Classes Uses Distinct Temporal and Activity-Related Programs. J Neurosci 43:28–55. doi:10.1523/jneurosci.0884-22.2022
Chodankar A, Sadanandappa MK, VijayRaghavan K, Ramaswami M. 2020. Glomerulus-Selective Regulation of a Critical Period for Interneuron Plasticity in the Drosophila Antennal Lobe. J Neurosci 40:5549–5560. doi:10.1523/jneurosci.2192-19.2020
Das S, Sadanandappa MK, Dervan A, Larkin A, Lee JA, Sudhakaran IP, Priya R, Heidari R, Holohan EE, Pimentel A, Gandhi A, Ito K, Sanyal S, Wang JW, Rodrigues V, Ramaswami M. 2011. Plasticity of local GABAergic interneurons drives olfactory habituation. Proc Natl Acad Sci 108:E646–E654. doi:10.1073/pnas.1106411108 Devaud J, Acebes A, Ramaswami M, Ferrús A. 2003. Structural and functional changes in the olfactory pathway of adult Drosophila take place at a critical age. J Neurobiol 56:13–23. doi:10.1002/neu.10215
Devaud J-M, Acebes A, Ferrus A. 2001. Odor Exposure Causes Central Adaptation and ́Morphological Changes in Selected Olfactory Glomeruli in Drosophila. J Neurosci 21:6274–6282. doi:10.1523/jneurosci.21-16-06274.2001
Furusawa K, Ishii K, Tsuji M, Tokumitsu N, Hasegawa E, Emoto K. 2023. Presynaptic Ube3a E3 ligase promotes synapse elimination through down-regulation of BMP signaling. Science 381:1197–1205. doi:10.1126/science.ade8978
Mosca TJ, Luginbuhl DJ, Wang IE, Luo L. 2017. Presynaptic LRP4 promotes synapse number and function of excitatory CNS neurons. eLife 6:e27347. doi:10.7554/elife.27347
Nelson N, Vita DJ, Broadie K. 2024. Experience-dependent glial pruning of synaptic glomeruli during the critical period. Sci Rep 14:9110. doi:10.1038/s41598-024-59942-3
Urwyler O, Izadifar A, Vandenbogaerde S, Sachse S, Misbaer A, Schmucker D. 2019. Branch-restricted localization of phosphatase Prl-1 specifies axonal synaptogenesis domains. Science 364. doi:10.1126/science.aau9952
Wilson RI, Laurent G. 2005. Role of GABAergic Inhibition in Shaping Odor-Evoked Spatiotemporal Patterns in the Drosophila Antennal Lobe. J Neurosci 25:9069–9079.
doi:10.1523/jneurosci.2070-05.2005
-
-
-
eLife Assessment
With the goal of investigating the assembly and fragmentation of cellular aggregates, this work investigates cyanobacterial aggregates in a laboratory setting. Investigating the conditions and mechanisms behind aggregation is an important contribution as it yields basic understanding of natural processes and offers potential strategies for control. The combination of computational and experimental investigations in this manuscript provides solid support for the proposed processes for aggregation and fragmentation, with some concerns about the strength of evidence for a subset of claims.
-
Reviewer #1 (Public review):
This work has significant relevance to the field, both practically and naturally. Combatting or preventing toxic cyanobacterial blooms is an active area of environmental research that offers a practical backbone for this manuscript's ideas. Additionally, the formation and behavior of cellular aggregates, in general, is of widespread interest in many fields, including marine and freshwater ecology, healthcare and antibiotic resistance research, biophysics, and microbial evolution. In this field, there are still outstanding questions regarding how microbial aggregates form into communities, including if and how they come together from separate places. Therefore, I believe that researchers from many distinct fields would find interest in the topic of this paper, particularly Figure 5, in which a phase space that is meant to represent the different modes of aggregate formation and destruction is suggested, dependent on properties of the fluid flow and particle concentration.
Altogether, the authors were mostly successful in their investigation, and I find most of their claims to be justified. In particular, the authors achieve strong results from their experiments regarding aggregate fragmentation. However, readers could benefit from some clarification in a couple of key areas. Additionally, I found that some of the authors' claims were based on weak or nonexistent data. Below, I outline the key claims of the paper and indicate the level to which they were supported by their data.
- Their first major claim is that fluid flows alone must be quite strong in order to fragment the cyanobacterial aggregates they have studied. With their rheological chamber, they explicitly show that energy dissipation rates must exceed "natural" conditions by multiple orders of magnitude in order to fragment lab strain colonies, and even higher to disrupt natural strains sampled from a nearby freshwater lake. This claim is well-supported by their experiments and data.<br /> - The authors then claim that the fragmentation of aggregates due to fluid flows occurs through erosion of small pieces. Because their experimental setup does not allow them to explicitly observe this process (for example, by watching one aggregate break into pieces), they implement an idealized model to show that the nature of the changes to the size histogram agrees with an erosion process. However, in Figure 2C there is a noticeable gap between their experiment and the prediction of their model. Additionally, in a similar experiment shown in Figure S6, the experiment cannot distinguish between an idealized erosion model and an alternative, an idealized binary fission model where aggregates split into equal halves. For these reasons, this claim is weakened.<br /> - Their third major claim is that fluid flows only weakly cause cells to collide and adhere in a "coming together" process of aggregate formation. They test this claim in Figure 3, where they suspend single cells in their test chamber and stir them at moderate intensity, monitoring their size histogram. They show that the size histogram changes only slightly, indicating that aggregation is, by and large, not occurring at a high rate. Therefore, they lend support to the idea that cell aggregation likely does not initiate group formation in toxic cyanobacterial blooms. Additionally, they show that the median size of large colonies also does not change at moderate turbulent intensities. These results agree with previous studies (their own citation 25) indicating that aggregates in toxic blooms are clonal in nature. This is an important result and well-supported by their data, but only for this specific particle concentration and stirring intensity. Later, in Figure 5 they show a much broader range of particle concentrations and energy dissipation rates that they leave untested.<br /> - The fourth major result of the manuscript is displayed in Equation 8 and Figure 5, where the authors derive an expression for the ratio between the rate of increase of a colony due to aggregation vs. the rate due to cell division. They then plot this line on a phase map, altering two physical parameters (concentration and fluid turbulence) to show under what conditions aggregation vs. cell division are more important for group formation. Because these results are derived from relatively simple biophysical considerations, they have the potential to be quite powerful and useful and represent a significant conceptual advance. However, there is a region of this phase map that the authors have left untested experimentally. The lowest energy dissipation rate that the authors tested in their experiment seemed to be \dot{epsilon}~1e-2 [m^2/s^3], and the highest particle concentration they tested was 5e-4, which means that the authors never tested Zone II of their phase map. Since this seems to be an important zone for toxic blooms (i.e. the "scum formation" zone), it seems the authors have missed an important opportunity to investigate this regime of high particle concentrations and relatively weak turbulent mixing.
Other items that could use more clarity:<br /> - The authors rely heavily on size distributions to make the claims of their paper. Yet, how they generated those size distributions is not clearly shown in the text. Of primary concern, the authors used a correction function (Equation S1) to estimate the counts of different size classes in their image analysis pipeline. Yet, it is unclear how well this correction function actually performs, what kinds of errors it might produce, and how well it mapped to the calibration dataset the authors used to find the fit parameters.<br /> - Second, in their models they use a fractal dimension to estimate the number of cells in the group from the group radius, but the agreement between this fractal dimension fit and the data is not shown, so it is not clear how good an approximation this fractal dimension provides. This is especially important for their later derivation of the "aggregation-to-cell division" ratio (Equation 8).
-
Reviewer #2 (Public review):
Summary:
In this work, the authors investigate the role of fluid flow in shaping the colony size of a freshwater cyanobacterium Microcystis. To do so, they have created a novel assay by combining a rheometer with a bright field microscope. This allows them to exert precise shear forces on cyanobacterial cultures and field samples, and then quantify the effect of these shear forces on the colony size distribution. Shear force can affect the colony size in two ways: reducing size by fragmentation and increasing size by aggregation. They find limited aggregation at low shear rates, but high shear forces can create erosion-type fragmentation: colonies do not break in large pieces, but many small colonies are sheared off the large colonies. Overall, bacterial colonies from field samples seem to be more inert to shear than laboratory cultures, which the authors explain in terms of enhanced intercellular adhesion mediated by secreted polysaccharides.
Strengths:
-This study is timely, as cyanobacterial blooms are an increasing problem in freshwater lakes. They are expected to increase in frequency and severeness because of rising temperatures, and it is worthwhile learning how these blooms are formed. More generally, how physical aspects such as flow and shear influence colony formation is often overlooked, at least in part because of experimental challenges. Therefore, the method developed by the authors is useful and innovative, and I expect applications beyond the presented system here.<br /> -A strong feature of this paper is the highly quantitative approach, combining theory with experiments, and the combination of laboratory experiments and field samples.
Weaknesses:
-Especially the introduction seems to imply that shear force is a very important parameter controlling colony formation. However, if one looks at the results this effect is overall rather modest, especially considering the shear forces that these bacterial colonies may experience in lakes. The main conclusion seems that not shear but bacterial adhesion is the most important factor in determining colony size. As the importance of adhesion had been described elsewhere, it is not clear what this study reveals about cyanobacterial colonies that was not known before.<br /> -The agreement between model and experiments is impressive, but the role of the fit parameters in achieving this agreement needs to be further clarified.<br /> -The article may not be very accessible for readers with a biology background. Overall, the presentation of the material can be improved by better describing their new method.
-
Author response:
We thank the reviewers and the editor for the detailed and constructive feedback provided. We look forward to submitting a revised version of the manuscript that addresses their comments. We acknowledge that further clarification is needed about the novelty brought by our experimental setup and model in comparison to previous studies using different methodologies. We also acknowledge that more details can be included about the calibration steps and sensitivity of the model parameters. Below we detail the planned changes for the revised version regarding the points raised by the reviewers.
Reviewer #1 (Public review):
- The authors then claim that the fragmentation of aggregates due to fluid flows occurs through erosion of small pieces. Because their experimental setup does not allow them to explicitly observe this process (for example, by watching one aggregate break into pieces), they implement an idealized model to show that the nature of the changes to the size histogram agrees with an erosion process. However, in Figure 2C there is a noticeable gap between their experiment and the prediction of their model. Additionally, in a similar experiment shown in Figure S6, the experiment cannot distinguish between an idealized erosion model and an alternative, an idealized binary fission model where aggregates split into equal halves. For these reasons, this claim is weakened.
The two idealized models of fragment distribution, namely erosion and binary fission, lead to distinguishable final size distributions. We believe that our experiments support the hypothesis of the erosion mechanism. Please note that Figure 2 is concerned with the fragmentation of large colonies, whereas Figure 3 and associated Figure S6 are concerned with very small colonies of a few cells formed by aggregation of single-cell suspension. Indeed, for very small colonies of a few cells, our experimental results cannot distinguish between a binary fission model and an erosion model (Figure S6).
The situation is very different for large colonies. To address the reviewer’s concern, we will add a new figure in the Supplementary Information (SI), similar to our Figure 2C, where we will compare the erosion model with a binary fission model for large colonies fragmented under ε = 5.8 m<sup>2</sup>/s<sup>3</sup>. We already did this exercise. The results in this new supplementary figure will show that the idealized binary fission model (i.e., where every fracture event produces exactly two fragments) does not capture the experimental fragmentation behaviour of large colonies. In contrast, the idealized erosion model provides a much better prediction of the experimental results, within the experimental uncertainty and variability in colony strength, and has the notable advantage of a straightforward computational implementation.
- The fourth major result of the manuscript is displayed in Equation 8 and Figure 5, where the authors derive an expression for the ratio between the rate of increase of a colony due to aggregation vs. the rate due to cell division. They then plot this line on a phase map, altering two physical parameters (concentration and fluid turbulence) to show under what conditions aggregation vs. cell division are more important for group formation. Because these results are derived from relatively simple biophysical considerations, they have the potential to be quite powerful and useful and represent a significant conceptual advance. However, there is a region of this phase map that the authors have left untested experimentally. The lowest energy dissipation rate that the authors tested in their experiment seemed to be \dot{epsilon}~1e-2 [m^2/s^3], and the highest particle concentration they tested was 5e-4, which means that the authors never tested Zone II of their phase map. Since this seems to be an important zone for toxic blooms (i.e. the "scum formation" zone), it seems the authors have missed an important opportunity to investigate this regime of high particle concentrations and relatively weak turbulent mixing.
We agree with the reviewer that Zone (II) of Figure 5 is of great importance to dense bloom formation under wind mixing and that this parameter range was not covered by our experiments using a cone-and-plate shear flow. The measuring range of our device was motivated by engineering applications such artificial mixing of eutrophic lakes using bubble plumes, as well as preliminary experiments which demonstrated that high levels of dissipation rate were required to achieve fragmentation. The dissipation rates of our cone-and-plate experiments capture Zones (III) and (IV) and the higher end of Zone (I). However, the cone-and-plate experiments are less suitable for the lower dissipation rates of Zone (II), as indicated by the red bars in Figure 5, due to the accumulation of colonies in stagnation points.
Instead, in our revision we will more extensively discuss recent results published in the literature for evidence of aggregation-dominance at Zone (II). The experimental studies of Wu et al. (2019) and Wu et al. (2024) (full citation below) investigated the formation of Microcystis surface scum layers at high colony concentrations (high biovolume fraction) in wind-mixed mesocosms. These studies identified aggregation of colonies at rates faster than cell division, while the stable colony size decreased with mixing rate. The parameter range of these studies fall within Zone II, and their experimental results agree with our model predictions. We will include in the reviewed version these references and a detailed discussion elucidating the parameter range covered in our experiments and the findings of other studies.
Wu, X., Noss, C., Liu, L., & Lorke, A. (2019). Effects of small-scale turbulence at the air-water interface on Microcystis surface scum formation. Water Research, 167, 115091.
Wu, H., Wu, X., Rovelli, L., & Lorke, A. (2024). Dynamics of Microcystis surface scum formation under different wind conditions: the role of hydrodynamic processes at the air-water interface. Frontiers in Plant Science, 15, 1370874.
Other items that could use more clarity:
- The authors rely heavily on size distributions to make the claims of their paper. Yet, how they generated those size distributions is not clearly shown in the text. Of primary concern, the authors used a correction function (Equation S1) to estimate the counts of different size classes in their image analysis pipeline. Yet, it is unclear how well this correction function actually performs, what kinds of errors it might produce, and how well it mapped to the calibration dataset the authors used to find the fit parameters.
We agree with the reviewer that more details of the calibration processes should be included. We will include in the revised version of the SI more details of the calibration steps and direct comparison of raw and corrected histograms of the size distribution and its associated uncertainty.
- Second, in their models they use a fractal dimension to estimate the number of cells in the group from the group radius, but the agreement between this fractal dimension fit and the data is not shown, so it is not clear how good an approximation this fractal dimension provides. This is especially important for their later derivation of the "aggregation-to-cell division" ratio (Equation 8)
We agree with the reviewer that more details on the estimation of fractal dimension are needed. The revised version of the SI will include the estimation procedure, the number of colonies analysed, and the associated uncertainty.
Reviewer #2 (Public review)
- Especially the introduction seems to imply that shear force is a very important parameter controlling colony formation. However, if one looks at the results this effect is overall rather modest, especially considering the shear forces that these bacterial colonies may experience in lakes. The main conclusion seems that not shear but bacterial adhesion is the most important factor in determining colony size. As the importance of adhesion had been described elsewhere, it is not clear what this study reveals about cyanobacterial colonies that was not known before.
As we explain in the Introduction, it is a major open question whether cyanobacterial colonies are formed mainly by cell division (after which the dividing cells remain attached to each other by the EPS layer) or mainly by the aggregation of independent cells & colonies. See for example the highly cited review of Xiao & Reynolds 2018 (our ref 17), and references therein. This question has not been resolved and is investigated in our study. We would like to emphasize several key findings that our study reveals about the mechanical behaviour of cyanobacterial colonies under flow:
(i) Quantification of mechanical strength in cyanobacterial colonies: Our results demonstrate the high mechanical strength of cyanobacterial colonies (much higher than previously thought in references 32 and 39 of the manuscript), as evidenced by the requirement of very high shear rates to achieve fragmentation. To this end, our study highlights their resilience against naturally occurring flows and bridges the gap between theoretical assumptions about colony strength and experimentally measured mechanical properties.
(ii) Validation of a hypothesis regarding colony formation: Using a fluid-mechanical approach, we confirm the findings of recent genetic studies (references 25 and 64 of the manuscript) which indicated that colony formation of cyanobacteria under natural conditions occurs predominantly via cell division rather than via the aggregation of individual cells. Only in very dense blooms and surface scums, colony formation by the aggregation of smaller colonies likely plays a role.
(iii) Practical guidelines for cyanobacterial bloom control: Our findings provide valuable insights into the design of artificial mixing systems that are used to suppress surface blooms of buoyant cyanobacteria in lakes. In these lake applications, in which we have been involved, the aim of the mixing is to disperse the colonies over the water column so that they cannot form a surface layer (i.e., the mixing intensity should overcome the flotation velocity of the colonies), which takes away the competitive advantage of buoyant cyanobacteria over nonbuoyant phytoplankton species. However, it has always been an open question whether the high shear of artificial mixing would cause colony fragmentation. An understanding of changes in colony size is relevant for the design of artificial mixing, because smaller colonies have a lower flotation velocity. Our results show that the dissipation rates that are generated by artificial mixing are sufficient to prevent aggregation of large colonies, but not high enough to induce fragmentation of division-formed colonies.
In the revised version of the manuscript, we will improve the writing to better clarify these three novel insights obtained from our study.
- The agreement between model and experiments is impressive, but the role of the fit parameters in achieving this agreement needs to be further clarified.
The influence of the fit parameters (namely the stickiness α1 and the pairs of colony strength parameters S1,q1,S2,q2) is discussed in the sections “DYNAMICAL CHANGES IN COLONY SIZE MODELED BY A TWO-CATEGORY DISTRIBUTION” and “MATERIALS AND METHODS.” We kept the discussion concise to maintain readability. However, we agree with the reviewer that additional details about the importance of the fit parameters and the sensitivity of the results to these parameters could be beneficial. In the revised version of the SI, we will include a more detailed discussion of the fit parameters.
- The article may not be very accessible for readers with a biology background. Overall, the presentation of the material can be improved by better describing their new method.
We apologize for the limited readability of the description of the experimental setup and model used. In the revised version of the manuscript, we aim to expand the description of the new methods presented here for a broader audience of biology.
-
-
www.biorxiv.org www.biorxiv.org
-
eLife Assessment
This report details convincing evidence that experience with multilingualism in general, and with larger phonological inventories specifically, is related to differences in the structure of the transverse temporal gyri. The project is notable for using a relatively large sample, and confirming the primary finding in a second sample. The important findings strongly point to experience-dependent plasticity related to language experience as a driver of neuroanatomy of the auditory cortex.
-
Reviewer #1 (Public review):
Summary:
The goal of this project is to test the hypothesis that individual differences in experience with multiple languages relate to differences in brain structure, specifically in the transverse temporal gyrus. The approach used here is to focus specifically on the phonological inventories of these languages, looking at the overall size of the phonological inventory as well as the acoustic and articulatory diversity of the cumulative phonological inventory in people who speak one or more languages. The authors find that the thickness of the transverse temporal gyrus (either the primary TTG, in those with one TTG, or in the second TTG, in people with multiple gyri) was related to language experience, and that accounting for the phonological diversity of those languages improved the model fit. Taken together, the evidence suggests that learning more phonemes (which is more likely if one speaks more than one language) leads to experience-related plasticity brain regions implicated in early auditory processing.
Strengths:
This project is rigorous in its approach--not only using a large sample but replicating the primary finding in a smaller, independent sample. Language diversity is difficult to quantify, and likely to be qualitatively and quantitatively distinct across different populations, and the authors use a custom measure of multilingualism (accounting for both number of languages as well as age of acquisition) and three measures of phonological diversity. The team has been careful in discussion of these findings, and while it is possible that pre-existing differences in brain structure could lead to an aptitude difference which could drive one to learn more than one language, the fine-grained relationships with phonological diversity seem less likely to emerge from aptitude rather than experience.
The authors have satisfied my curiosity regarding other potential confounds in the data, including measurements of lexical distance as well as phonological typology.
-
Reviewer #2 (Public review):
This work investigates the possible association between language experience and morphology of the superior temporal cortex, a part of the brain responsible for the processing of auditory stimuli. Previous studies have found associations between language and music proficiency as well as language learning aptitude and cortical morphometric measures in regions in the primary and associated auditory cortex. These studies have most often, however, focused on finding neuroanatomical effects of difference between features in a few (often two) languages or from learning single phonetic/phonological features and have often been limited in terms of N. On this background, the authors use more sophisticated measures of language experience that take into account the age of onset and the differences in phonology between languages the subjects have been exposed as well as a larger number of subjects (N = 146 + 69) to relate language experience to the shape and structure of the superior temporal cortex, measured from T1-weighted MRI data. It shows solid evidence for there being a negative relationship between language experience and the right 2nd transverse temporal gyrus as well as some evidence for the relationship representing phoneme-level cross-linguistic information.
Strengths
The use of entropy measures to quantify language experience and include typological distance measures allows for a more general interpretation of the results and is an important step toward respecting and making use of linguistic diversity in neurolinguistic experiments.
A relatively large group of subjects with a range of linguistic backgrounds.
The full analysis of the structure of the superior temporal cortex including cortical volume, area, as well as the shape of the transverse gyrus/gyri. There is a growing literature on the meaning of the shape and number of the transverse gyri in relation to language proficiency and the authors explore all measures given the available data.
The authors chose to use a replication data set to verify their data, which is applaudable. However, see the relevant point under "Weaknesses".
Weaknesses
Even if the language experience and typological distance measures are a step in the right direction for correctly associating language exposure with cortical plasticity, it still is a measure that is insensitive to the intensity of the exposure.
Only the result from the multiple transverse temporal gyri (2nd TTG) is analyzed in the replicated dataset. Only the association in the right hemisphere 2nd TTG is replicated but this is not reflected in the discussion or the conclusions. The positive correlation in the right TTG is thus not attempted to be replicated.
The replication dataset differed in more ways than the more frequent combination of English and German experience, as mentioned in the discussion. Specifically, the fraction of monolinguals was higher in the replication dataset and the samples came from different scanners. It would be better if the primary and replication datasets were more equally matched.
-
Reviewer #3 (Public review):
Summary:
The study uses structural MRI to identify how the number, degree of experience, and phonemic diversity of language(s) that a speaker knows can influence the thickness of different sub-segments of auditory cortex. In both a primary and replication sample of adult speakers, the authors find key differences in cortical thickness within specific subregions of cortex due to either the age at which languages are acquired (degree of experience) or the diversity of the phoneme inventories carried by that/those language(s) (breadth of experience).
Strengths:
The results are first and foremost quite fascinating and I do think they make a compelling case for the different ways in which linguistic experience shapes auditory cortex.
The study uses a number of different measures to quantify linguistic experience, related to how many languages a person knows (taking into account the age at which each was learned) as well as the diversity of the phoneme inventories contained within those languages. The primary sample is moderately large for a study that focuses on brain-behaviour relationships; a somewhat smaller replication sample is also deployed in order to test the generality of the effects.
Analytic approaches benefit from the careful use of brain segmentation techniques that nicely capture key landmarks and account for vagaries in the structure of STG that can vary across individuals (e.g., the number of transverse temporal gyri varies from 1-4 across individuals).
Weaknesses:
The specificity of these effects is interesting; some effects really do appear to be localized to left hemisphere and specific subregions of auditory cortex e.g., TTG. There is an ancillary analysis that examines regions outside auditory cortex to examine whether these are the only brain regions for which such effects occur. Expanding the search space to a whole-brain analysis, and a more lenient statistical threshold, does reveal only small patches of the brain outside auditory cortex show similar effects. Notably, these could be due to inflated type-1 error, but overall we would need a much larger sample to be certain.
Discussion of potential genetic differences underlying the findings is interesting. It does represent one alternative account that does not have to do with plasticity/experience, as the authors acknowledge.
The replication sample is useful and a great idea. It does however feature roughly half the number of participants. As the authors are careful to point out, that statistical power is weaker and given small effects in some cases we should not be surprised that the results only partially replicated in that sample.
-
Author response:
The following is the authors’ response to the original reviews.
Reviewer #1 (Public Review):
Summary:
The goal of this project is to test the hypothesis that individual differences in experience with multiple languages relate to differences in brain structure, specifically in the transverse temporal gyrus. The approach used here is to focus specifically on the phonological inventories of these languages, looking at the overall size of the phonological inventory as well as the acoustic and articulatory diversity of the cumulative phonological inventory in people who speak one or more languages. The authors find that the thickness of the transverse temporal gyrus (either the primary TTG, in those with one TTG, or in the second TTG, in people with multiple gyri) was related to language experience, and that accounting for the phonological diversity of those languages improved the model fit. Taken together, the evidence suggests that learning more phonemes (which is more likely if one speaks more than one language) leads to experience-related plasticity in brain regions implicated in early auditory processing.
Strengths:
This project is rigorous in its approach--not only using a large sample, but replicating the primary finding in a smaller, independent sample. Language diversity is difficult to quantify, and likely to be qualitatively and quantitatively distinct across different populations, and the authors use a custom measure of multilingualism (accounting for both number of languages as well as age of acquisition) and three measures of phonological diversity. The team has been careful in discussion of these findings, and while it is possible that pre-existing differences in brain structure could lead to an aptitude difference which could drive one to learn more than one language, the fine-grained relationships with phonological diversity seem less likely to emerge from aptitude rather than experience.
Weaknesses:
It is a bit unclear how the measures of phonological diversity relate to one another--they are partially separable, but rest on the same underlying data (the phonemes in each language). It would be helpful for the reader to understand how these measures are distributed (perhaps in a new figure), and the degree to which they are correlated with one another.
Thank you for the comment. Indeed our description missed this important detail that we now included in the manuscript. Unsurprisingly, the distances all correlated with one another, which we present in Table 2 in Section 2.3 of the revised manuscript. We have also added a figure with distributions of the three distance measures (see Figure S3).
Further, as the authors acknowledge, it is always possible that an unseen factor instead drives these findings--if typological lexical distance measures are available, it would be helpful to enter these into the model to confirm that phonological factors are the specific driver of TTG differences and not language diversity in a more general sense. That said, the relationship between phonological diversity and TTG structure is intuitive.
Thank you for the suggestion. To further establish that our results reflected the relationship between TTG structure and phonological diversity specifically (as opposed to language diversity in a more general sense), we derived a fourth measure of language experience, where the AoA index of different languages was weighted by lexical distances between the languages. Here, we followed the methodology described in Kepinska, Caballero, et al. (2023): We used Levenshtein Distance Normalized Divided (LDND) (Wichmann et al., 2010) which was computed using the ASJP.R program by Wichmann (https://github.com/Sokiwi/InteractiveASJP01). Information on lexical distances was combined with language experience information per participant using Rao's quadratic entropy equation in the same way as for the phonological measures.
We then entered this language experience measure accounting for lexical distances between the languages into linear models predicting the thickness of the second left and right TTG (controlling for participants’ age, sex and mean hemispheric thickness) in the main sample, and compared these models with the corresponding models including the original three phonological distance measures (models 24 in Author response table 1), and the measure with no typological information (1).
Below, we list adjusted R2 values of all models, from which it is clear that the index of multilingual language experience accounting for lexical distances between languages (5) explained less variance than the index incorporating phoneme-level distances between languages (2), both in the left and the right hemisphere. This further strengthens our conclusion that our results reflected the relationship between TTG structure and phonological diversity specifically, as opposed to language diversity in a more general sense.
Author response table 1.
We have added a description of this analysis to the manuscript, Section 3.3, lines 357-370.
One curious aspect of this paper relates to the much higher prevalence of split or duplicate TTG in the sample. The authors do a good job speculating on how features of the TASH package might lead to this, but it is unclear where the ground truth lies--some discussion of validation of TASH against a gold standard would be useful.
The validation of the TASH toolbox in comparison to gold standard manual measurement involved assessing how well the measurements of left and right Heschl's gyrus (HG) volumes obtained using the TASH method correlated with those obtained through manual labeling (see Dalboni da Rocha et al., 2020 for details). This validation process was conducted across three independent datasets. Additionally, for comparison, the manually labeled HG volumes were also compared with those obtained using FreeSurfer's Destrieux parcellation of the transverse temporal gyrus in the same datasets. The validation process, therefore, involved rigorous comparisons of HG volumes obtained through manual labeling, FreeSurfer, and TASH across different datasets, along with an assessment of inter-rater reliability for the manual labeling procedure. This comprehensive approach ensures that the results are robust and reliable. TASH_complete, the version used in the present work, is an extension of the extensively validated TASH, which apart from the first gyrus, also identifies additional transverse temporal gyri (i.e. Heschl’s gyrus duplications and multiplications) situated in the PT, when present. Since work on the correspondence between manually identified TTG multiplications is still ongoing, as outlined in the Methods section, we complemented the automatic segmentation by extensive visual assessment of the identified posterior gyri. This process involved removing from the analysis those gyri that lay along the portion of the superior temporal plane that curved vertically (i.e., within the parietal extension, Honeycutt et al., 2000), when present. Given that TASH_complete and TASH operate on the same principles and are both based on FreeSurfer’s surface reconstruction and cortical parcellation (which have been extensively validated against manual tracing and other imaging modalities, showing good accuracy), and since we have visually inspected all segmentations, we are confident as to the accuracy of the reported TTG variability. It has to be further noted that the prevalence of TTG multiplications beyond 2nd full posterior duplications was not systematically assessed in previous descriptive reports (Marie, 2015). However, we acknowledge that more work is needed to further ascertain anatomical accuracy of the segmentations, and we elaborate on this point in the Discussion of the revised manuscript (lines 621-623).
Reviewer #2 (Public Review):
This work investigates the possible association between language experience and morphology of the superior temporal cortex, a part of the brain responsible for the processing of auditory stimuli. Previous studies have found associations between language and music proficiency as well as language learning aptitude and cortical morphometric measures in regions in the primary and associated auditory cortex. These studies have most often, however, focused on finding neuroanatomical effects of difference between features in a few (often two) languages or from learning single phonetic/phonological features and have often been limited in terms of N. On this background, the authors use more sophisticated measures of language experience that take into account the age of onset and the differences in phonology between languages the subjects have been exposed to as well as a larger number of subjects (N = 146 + 69) to relate language experience to the shape and structure of the superior temporal cortex, measured from T1weighted MRI data. It shows solid evidence for there being a negative relationship between language experience and the right 2nd transverse temporal gyrus as well as some evidence for the relationship representing phoneme-level cross-linguistic information.
Strengths
The use of entropy measures to quantify language experience and include typological distance measures allows for a more general interpretation of the results and is an important step toward respecting and making use of linguistic diversity in neurolinguistic experiments.
A relatively large group of subjects with a range of linguistic backgrounds.
The full analysis of the structure of the superior temporal cortex including cortical volume, area, as well as the shape of the transverse gyrus/gyri. There is a growing literature on the meaning of the shape and number of the transverse gyri in relation to language proficiency and the authors explore all measures given the available data.
The authors chose to use a replication data set to verify their data, which is applaudable. However, see the relevant point under "Weaknesses".
Weaknesses
The authors fail to explain how a thinner cortex could reflect the specialization of the auditory cortex in the processing of diverse speech input. The Dynamic Restructuring Model (Pliatsikas, 2020) which is referred to does not offer clear guidance to interpretation. A more detailed discussion of how a phonologically diverse environment could lead to a thinner cortex would be very helpful.
Thank you for bringing our attention to this point. We have now extended the explanation we had previously included in the Discussion by including the following passage on p. 20 (lines 557-566) of the revised manuscript:
“Experience-induced pruning is essential for maintaining an efficient and adaptive neural network. It reinforces relevant neural circuits for faster more efficient information processing, while diminishing those that are less active, or less beneficial. The cortical specialization may need to arise because phonologically more diverse language experience requires that the mapping of acoustic signal to sound categories is denser, more detailed and more intricate. As a result, the brain may need to engage in more intensive processing to discriminate between and accurately perceive the sound categories of each language. This increased cognitive demand may, in turn, require the auditory and language processing regions of the brain to adapt and become more efficient. Over time, this heightened effort for successful speech perception and sound discrimination may lead to neural plasticity, resulting in cortical specialization. This means that cortical areas become more finely tuned and specialized for processing the unique phonological features of language(s) spoken by individuals.”
We have also added a passage to the Introduction regarding the possible microscopic or physiological underpinnings of the brain structural differences that we observe macroscopically using structural MRI (lines 68-73):
“Such environmental effect on cortical thickness might in turn be tied to microstructural changes to the underlying brain tissue, such as modifications in dendritic length and branching, synaptogenesis or synaptic pruning, growth of capillaries and glia, all previously tied to some kind of environmental enrichment and/or skill learning (see Lövdén et al., 2013; Zatorre et al., 2012 for overviews). Increased cortical thickness may reflect synaptogenesis and dendritic growth, while cortical thinning observed with MRI may be a result of increased myelination (Natu et al., 2019) or synaptic pruning.”
It is difficult to understand what measure of language experience is used when. Clearer and more explicit nomenclature would assist in the interpretation of the results.
We have added more explicit list of indices used in the Introduction (lines 104-107 of the revised manuscript) and in Section 2.4 and used them consistently throughout the text:
(1) language experience index not accounting for typological features: ‘Language experience - no typology’
(2) measures combining language experience with typological distances at different levels:
a. ‘Language experience – features’,
b. ‘Language experience – phonemes’,
c. ‘Language experience – phonological classes’.
There is a lack of description of the language backgrounds of the included subjects. How many came from each of the possible linguistic backgrounds? How did they differ in language exposure? This would be informative to evaluate the generalizability of the conclusions.
Thank you for raising this point. Given the complexity of participants’ language experience, ranging between monolingual to speaking 7 different languages, we opted for a fully parametric approach in quantifying it. We used the Shannon’s entropy and Rao’s quadratic entropy equations to create continuous measures of language experience, without the constraints of a minimum sample size per language and the need to exclude participants with underrepresented languages. To add further details in our description of the language background, we summarize the language background of both samples in the newly added Table 1 presenting a breakdown of participants by number of languages they spoke, and Supplementary Table S1 listing all languages spoken by each participant.
Only the result from the multiple transverse temporal gyri (2nd TTG) is analyzed in the replicated dataset. Only the association in the right hemisphere 2nd TTG is replicated but this is not reflected in the discussion or the conclusions. The positive correlation in the right TTG is thus not attempted to be replicated.
Thank you for bringing this point to our attention. Since only few participants presented single gyri in the left (n = 7) and the right hemisphere (n = 14), the replication analysis focused on the second TTG results only. We have now commented on this fact in Section 3.5 (lines 413-415), as well as in the Discussion (lines 594-596).
The replication dataset differed in more ways than the more frequent combination of English and German experience, as mentioned in the discussion. Specifically, the fraction of monolinguals was higher in the replication dataset and the samples came from different scanners. It would be better if the primary and replication datasets were more equally matched.
Indeed, the replication sample did not fully mimic the characteristics of the main sample and a better match between the two samples would have been preferable. As elaborated in the Introduction, however, the data was split into two groups according to the date of data acquisition, which also coincided with the field strength of the scanners used for data acquisition: the first, main sample’s data were acquired on a 1.5T, the replication sample’s on 3T. We opted for keeping this split and not introducing additional noise in the analysis by using data from different field strengths at the cost of not fully matching the two datasets. Observing the established effects (even partially) in this somewhat different replication sample, however, seems in our view to further strengthen our results.
Even if the language experience and typological distance measures are a step in the right direction for correctly associating language exposure with cortical plasticity, it still is a measure that is insensitive to the intensity of the exposure. The consequences of this are not discussed.
Indeed, we agree with the reviewer that there is still a lot of grounds to cover to fully understand the relationship between language experience and cortical plasticity. We have added a paragraph to the Discussion (lines 587-592 of the revised manuscript) to bring attention to this issue:
“Future research should also further increase the degree of detail in describing the multilingual language experience, as both AoA and proficiency (used here) are not sensitive to other aspects of multilingualism, such as intensity of the exposure to the different languages, or quantity and quality of language input. Since these aspects have been convincingly shown to be associated with neural changes (e.g., Romeo, 2019), incorporating further, more detailed measures describing individuals’ language experience could further enhance our understanding of cortical plasticity in general, and how the brain accommodates variable language experience in particular.”
Reviewer #3 (Public Review):
Summary:
The study uses structural MRI to identify how the number, degree of experience, and phonemic diversity of language(s) that a speaker knows can influence the thickness of different sub-segments of the auditory cortex. In both a primary and replication sample of adult speakers, the authors find key differences in cortical thickness within specific subregions of the cortex due to either the age at which languages are acquired (degree of experience), or the diversity of the phoneme inventories carried by that/those language(s) (breadth of experience).
Strengths:
The results are first and foremost quite fascinating and I do think they make a compelling case for the different ways in which linguistic experience shapes the auditory cortex.
The study uses a number of different measures to quantify linguistic experience, related to how many languages a person knows (taking into account the age at which each was learned) as well as the diversity of the phoneme inventories contained within those languages. The primary sample is moderately large for a study that focuses on brainbehaviour relationships; a somewhat smaller replication sample is also deployed in order to test the generality of the effects.
Analytic approaches benefit from the careful use of brain segmentation techniques that nicely capture key landmarks and account for vagaries in the structure of STG that can vary across individuals (e.g., the number of transverse temporal gyri varies from 1-4 across individuals).
Weaknesses:
The specificity of these effects is interesting; some effects really do appear to be localized to the left hemisphere and specific subregions of the auditory cortex e.g., TTG. However because analyses only focus on auditory regions along the STG and MTG, one could be led to the conclusion that these are the only brain regions for which such effects will occur. The hypothesis is that these are specifically auditory effects, but that does make a clear prediction that nonauditory regions should not show the same sort of variability. I recognize that expanding the search space will inflate type-1 errors to a point where maybe it's impossible to know what effects are genuine. And the fine-grained nature of the effects suggests a coarse analysis of other cortical regions is likely to fail. So I don't know the right answer here. Only that I tend to wonder if some control region(s) might have been useful for understanding whether such effects truly are limited to the auditory cortex. Otherwise one might argue these are epiphenomenal or some hidden factor unrelated to auditory experience predicting that we'd also see them in the non-auditory cortex as well, either within or outside the brain's speech network(s).
Thank you for raising this important issue. Our primary analyses indeed focused on the auditory regions, given their involvement in speech and language processing at different levels of processing hierarchy (from low – HG, to high – STG and STS). Here, we included a fairly broad range of ROIs (8 per hemisphere, 16 in total) and it has to be noted that it was only the bilateral planum temporale which showed an association with multilingualism. In the original submission we had indeed attempted at confirming the specificity of this result by performing a whole-brain vertex-wise analysis in freesurfer (see Table 3, Section 3.2, Figure S5), which again showed that the only cluster of vertices related to participants’ language experience at p < .0001 (uncorrected) was located in the superior aspect of the left STG, corresponding to the location of planum temporale and the second TTG. Lowering the threshold of statistical significance to p < .001 (uncorrected) results in further clusters of vertices whose thickness was positively associated with the degree of multilingual language experience localized in:
• Left hemisphere: central sulcus (S_cenral), long insular gyrus and central sulcus of the insula (G_Ins_lg_and_S_cent_ins), lingual gyrus (G_oc-temp_med-Lingual), planum temporale of the superior temporal gyrus (G_temp_sup-Plan_tempo), short insular gyri (G_insular_short), middle temporal gyrus (G_temporal_middle), and planum polare of the superior temporal gyrus (G_temp_sup-Plan_polar)
• Right hemisphere: angular gyrus (G_pariet_inf-Angular), superior temporal sulcus (S_temporal_sup), middle-posterior part of the cingulate gyrus and sulcus (G_and_S_cingul-Mid-Post), marginal branch of the cingulate sulcus (S_cingul-Marginalis), parieto-occipital sulcus (S_parieto_occipital), parahippocampal gyrus (G_oc-temp_med-Parahip), Inferior temporal gyrus (G_temporal_inf)
We present the result of this analysis in Author response image 1, where clusters are labelled according to the Destrieux anatomical atlas implemented in FreeSurfer:
Author response image 1.
As the reviewer points out, establishing relationships between our dependent and independent variables at a lower threshold of statistical significance might not reflect a true effect, and it is statistically more probable that multilingualism-related cortical thickness effects seem to be specific to the auditory regions. We do not exclude that an analysis of other pre-defined ROIs, performed at a similar level of detail as our present investigation, would uncover further significant associations between multilingual language experience and brain anatomy, but such an investigation is beyond the scope of the present work.
The reason(s) why we might find a link between cortical thickness and experience is not fully discussed. The introduction doesn't really mention why we'd expect cortical thickness to be correlated (positively or negatively) with speech experience. There is some discussion of it in the Discussion section as it relates to the Pliatsikas' Dynamic Restructuring Model, though I think that model only directly predicts thinning as a function of experience (here, negative correlations). It might have less to say about observed positive correlations e.g., HG in the right hemisphere. In any case, I do think that it's interesting to find some relationship between brain morphology and experience but clearer explanations for why these occur could help, and especially some mention of it in the intro so readers are clearer on why cortical thickness is a useful measure.
We have expanded the section of the Introduction introducing cortical thickness pointing to different microstructural changes previously associated with environmental enrichment and skill learning (lines 68-73), and hope the link between cortical thickness and multilingual language experience is clearer now:
“Such environmental effect on cortical thickness might in turn be tied to microstructural changes to the underlying brain tissue, such as modifications in dendritic length and branching, synaptogenesis or synaptic pruning, growth of capillaries and glia, all previously tied to some kind of environmental enrichment and/or skill learning (see Lövdén et al., 2013; Zatorre et al., 2012 for overviews). Increased cortical thickness may reflect synaptogenesis and dendritic growth, while cortical thinning observed with MRI may be a result of increased myelination (Natu et al., 2019) or synaptic pruning.”
In addition, we have also expanded the Discussion section providing more reasoning for the links between cortical thickness and multilingual language experience (lines 557-566):
“Experience-induced pruning is essential for maintaining an efficient and adaptive neural network. It reinforces relevant neural circuits for faster more efficient information processing, while diminishing those that are less active, or less beneficial. The cortical specialization may need to arise because phonologically more diverse language experience requires that the mapping of acoustic signal to sound categories is denser, more detailed and more intricate. As a result, the brain may need to engage in more intensive processing to discriminate between and accurately perceive the sound categories of each language. This increased cognitive demand may, in turn, require the auditory and language processing regions of the brain to adapt and become more efficient. Over time, this heightened effort for successful speech perception and sound discrimination may lead to neural plasticity, resulting in cortical specialization. This means that cortical areas become more finely tuned and specialized for processing the unique phonological features of language(s) spoken by individuals.”
One pitfall of quantifying phoneme overlap across languages is that what we might call a single 'phoneme', shared across languages, will, in reality, be realized differently across them. For instance, English and French may be argued to both use the vowel /u/ although it's realized differently in English vs. French (it's often fronted and diphthongized in many English speaker groups). Maybe the phonetic dictionaries used in this study capture this using a close phonetic transcription, but it's hard to tell; I suspect they don't, and in that case, the diversity measures would be an underestimate of the actual number of unique phonemes that a listener needs to maintain.
The PHOIBLE database uses transcription that reflects phonological descriptive data as closely as possible, according to the available descriptive sources. Different realizations of sounds are (as much as possible) marked in the database. For example, the open front unrounded vowel /a/ is listed as e.g., [a] or [a̟ ], with the “+” sign denoting a fronted realization. This is done in PHOIBLE by the use of diacritics (see https://phoible.org/conventions) which further specify variations on the language-specific realizations of the phonemes listed in the database. Further details are available in Moran (2012) (https://digital.lib.washington.edu/researchworks/items/0d26e54d-950a-4d0b-b72c-3afb4b1aa9eb). In our calculation of phoneme-based distances a sign with and without a diacritic were treated as different phonemes, and therefore the different realizations were accounted for.
That said, we fully agree with the reviewer that in fact any diversity measure will be an underestimation of the actual variation, as between-speaker micro-variation can never be fully reflected in largescale typological databases as the one used in the present study. To the best of our knowledge, however, PHOIBLE offers the most comprehensive way of allowing for quantifying cross-linguistic variation to date, and we are looking forward for the field to offer further tools capturing the linguistic variability at an ever-finer level of detail.
Discussion of potential genetic differences underlying the findings is interesting. One additional data point here is a study finding a relationship between the number of repeats of the READ1 (a factor of the DCDC2 gene) in populations of speakers, and the phoneme inventory of language(s) predominant in that population (DeMille, M. M., Tang, K., Mehta, C. M., Geissler, C., Malins, J. G., Powers, N. R., ... & Gruen, J. R. (2018). Worldwide distribution of the DCDC2 READ1 regulatory element and its relationship with phoneme variation across languages. Proceedings of the National Academy of Sciences, 115(19), 4951-4956.) Admittedly, that paper makes no claim about the cortical expression of that regulatory factor under study, and so more work needs to be done on whether this has any bearing at all on the auditory cortex. But it does represent one alternative account that does not have to do with plasticity/experience.
We thank the reviewer for bringing this important line of research to our attention, which we now included in the Discussion (lines 494-498 of the revised manuscript).
The replication sample is useful and a great idea. It does however feature roughly half the number of participants meaning statistical power is weaker. Using information from the first sample, the authors might wish to do a post-hoc power analysis that shows the minimum sample size needed to replicate their effect; given small effects in some cases, we might not be surprised that the replication was only partial. I don't think this is a deal breaker as much as it's a way to better understand whether the failure to replicate is an issue of power versus fragile effects.
Thank you for the suggestion. Indeed, the effect sizes established in the analyses using the main sample were small (e.g., f2 = 0.07). According to a power analysis performed with G*Power 3.1 (Faul et al., 2009), detecting an effect of this magnitude of the predictor of interest at alpha = .05 (two-tailed), in a linear multiple regression model with 4 predictors (i.e., 3 covariates of no-interest: sex, age, hemispheric thickness, and 1 predictor of interest), a sample of N = 114 is required to achieve 80% of power. Our partial lack of replicating the effect might therefore indeed be related to a lower power of the replication sample, rather than the effect itself being fragile.
Recommendations for the authors:
Reviewer #1 (Recommendations for the Authors):
A few remaining details that I think you can handle:
(1) Was there any correction for multiple comparisons, especially when multiple anatomical measures were investigated in separate models? (e.g. ln 130).
Since three different anatomical measures were investigated in Analysis 1 and Analysis 2 (see Table 1), the alpha level of the two linear mixed models was lowered to α = .0166. Note that the p-values of the predictors of interest were p = .012 (mixed model with all auditory regions) and p = .005 (mixed model with all identified TTGs).
(2) In Table 2, since your sample skews heavily female, it would be more useful to present the counts of Male/Female totals for 1, 2, 3, 4, etc TTGs as proportions of the total for that sex rather than counts, so that the distribution across sex is more obvious.
Thank you for bringing this issue to our attention. We have now included an additional row in Table 4, with proportions of males and females presenting different total number of identified gyri in the left and the right hemisphere.
(3) (ln 161) It wasn't clear to me how you dealt statistically with the fact that some participants had only one TTG - did you simply enter "0" as a value for cortical thickness for 2, 3, etc. for those participants? If so, it's possible that this result could reflect the number of split/duplicated gyri rather than the thickness of those gyri.
Indeed, if non-existing gyri were coded with a value of “0” (it being the lowest possible thickness value), the results would reflect the configuration of TTGs (single vs multiple gyri) rather than a relationship between thickness and language experience.
The model was, however, fit to all available thickness values, and the gyri labels (1st, 2nd, 3rd) were modeled as a fixed factor with 3 levels. This procedure allowed us to localize the effect of language experience to a specific gyrus. The following formula was used with the lmer package in R:
thickness ~ age + sex + whole_brain_thickness + language_experience* gyrus*hemisphere + (1 | participant_id)
We observed a significant interaction between language experience and the 2nd gyrus (NB. no significant 3-way interaction between language experience, the 2nd gyrus and hemisphere pointed to the effect being bilateral). This result was then followed up with two linear models: one for the thickness values of the 2nd left and one for the 2nd right gyrus, each fit to the available data only (n = 130 for the left hemisphere; n = 96 for the right), see Table 5. This procedure ensured that only the available cortical thickness data were considered when establishing their relationship with our independent variable (language experience).
(4) I think more could be done in the results section to distinguish your three phonological measures--these details are evident in the Methods section, but if readers consume this paper front to back they may find it difficult to figure out what each measure really means.
Thank you. We have added more explicit list of indices used in the Introduction (lines 104-107) and in Section 2.4. As per Reviewer #2 comments, the Methods section was also moved before the Results section, hopefully further enhancing the readability of the paper.
Typos:
ln 270: "weighed"--could you have meant "weighted"?
Corrected, thank you!
ln 377: "Apart from phoneme-based typological distance measure explaining" --> "Apart from *the* phonemebased..."
Corrected, thank you!
Reviewer #2 (Recommendations for the Authors):
The interpretation of the results would be much helped by the methods section being moved to precede it. Now, much of the results section is methods summaries that would not have been needed if the reader had been presented with the methods beforehand. This is especially true for the measures of language experience and typological distances used.
Thank you. We have moved the Materials and Methods section before the Results section.
The equation in section "4.2 Language experience" should be H = - sum(p_i log2 (p_i)) and not H = - sum(p_i log2(i)).
Corrected, thank you!
It is unclear what "S" represents in the equation in the section "4.4 Combining typology and language experience (indexed by AoA)".
The explanation has been added, thank you!
-
-
www.biorxiv.org www.biorxiv.org
-
eLife Assessment
This is an important study providing compelling evidence that the Mediator kinase module mediates an elevated inflammatory response, manifested by heightened cytokine levels, associated with Downs syndrome (DS) via transcriptional changes impacting cell signaling and metabolism that involve mobilization of nuclear receptors by altered lipid metabolites, which has significance for the treatment of DS and other chronic inflammatory conditions. Particular strengths of the study include the combined experimental approaches of transcriptomics, untargeted metabolomics and cytokine screens and the use of sibling matched cell lines (trisomy 21 vs disomy 21) from various donors. Evidence is also provided implicating the Mediator kinase module in controlling mRNA splicing and mitochondrial function that should stimulate new research to elucidate the mechanistic bases for these novel functions.
-
Reviewer #1 (Public review):
Summary:
The main conclusion of this manuscript, that the mediator kinases supporting the IFN response in Downs syndrome cell lines, represents an important addition to understanding the pathology of this affliction.
Strengths:
Mediator kinase stimulates cytokine production. Both RNAseq and metabolomics clearly demonstrate a stimulatory role for CDK8/CDK19 in the IFN response. The nature of this role, direct vs. indirect, is inferred by previous studies demonstrating that inflammatory transcription factors are Cdk8/19 substrates. The cytokine and metabolic changes are clear cut and provide a potential avenue to mitigate these associated pathologies.
Weaknesses:
Seahorse analysis is normally calculated with specific units for oxygen consumption, ATP production, etc. It would be of interest to see the actual values of OCR (e.g., pmol/O2 consumption/number of cells) between the D21 and T21 cell lines rather than standardizing the results. Previous studies reported reduced mitochondrial function with DS cell lines and model systems (e.g., see [10.1016/j.bbadis.2022.166388] and aberrant mitochondrial morphology/oxidative stress [10.1016/j.cmet.2012.12.005] [10.1016/j.neuroscience.2022.12.003]. This report observes elevated mitochondrial function in the T21 cells vs. the D21 control. There are several potential reasons for these differences but it is not up to the authors to rectify their results with others. However, it would be of interest to the general reader that they be mentioned in the discussion.
-
Reviewer #2 (Public review):
Summary:
In this manuscript, Cozzolino et al. demonstrate that inhibition of the Mediator kinase CDK8 and its paralog CDK19 suppresses hyperactive interferon (IFN) signaling in Down syndrome (DS), which results from trisomy of chromosome 21 (T21). Numerous pathologies associated with DS are considered direct consequences of chronic IFN pathway activation, and thus hyperactive IFN signaling lies at the heart of pathophysiology. The collective interrogation of transcriptomics, metabolomics, and cytokine screens in sibling-matched cell lines (T21 vs D21) allows the authors to conclude that Mediator kinase inhibition could mitigate chronic, hyperactive IFN signaling in T21. To probe the functional outcomes of Mediator kinase inhibition, the authors performed cytokine screens, transcriptomic, and untargeted metabolomics. This collective approach revealed that Mediator kinases establish IFN-dependent cytokine responses at least in part through transcriptional regulation of cytokine genes and receptors. Mediator kinase inhibition suppresses cell responses during hyperactive IFN signaling through inhibition of pro-inflammatory transcription factor activity (anti-inflammatory effect) and alteration of core metabolic pathways, including upregulation of anti-inflammatory lipid mediators, which served as ligands for specific nuclear receptors and downstream phenotypic outcomes (e.g., oxygen consumption). These data provided a mechanistic link between Mediator kinase activity and nuclear receptor function. Finally, the authors also disclosed that Mediator kinase inhibition alters splicing outcomes.
Overall, this study reveals a mechanism by which Mediator kinases regulate gene expression and establish that its inhibition antagonizes chronic IFN signaling through collective transcriptional, metabolic, and cytokine responses. The data have implications for DS and other chronic inflammatory conditions, as Mediator kinase inhibition could potentially mitigate pathological immune system hyperactivation.
Comments on revisions:
In the record of version, the authors have improved readability and also incorporated experiments that provide compelling support to the main discovery of the story. Below I summarize the previous strengths and how they improved noted weaknesses.
(1) One major strength of this study is the mechanistic evidence linking Mediator kinases to hyperactive IFN signaling through transcriptional changes impacting cell signaling and metabolism.<br /> (2) Another major strength of this study is the use of sibling matched cell lines (T21 vs D21) from various donors (not just one sibling pair), and further cross-referencing with data from large cohorts, suggesting that part of the data and conclusions are generalizable.<br /> (3) Another major strength of this study is the combined experimental approach including transcriptomics, untargeted metabolomics and cytokine screens to define the mechanisms underlying suppression of hyperactive interferon signaling in DS upon Mediator kinase inhibition.<br /> (4) Another major strength of this study is the significance of the work to DS and its potential impact to other chronic inflammatory conditions.<br /> (5) The previously noted weakness regarding the roles of nuclear receptors to activation of an anti-inflammatory program upon Mediator kinase inhibition was not directly experimentally addressed because existing data from other studies (referenced in this version) have linked specific nuclear receptors to lipid biosynthesis and anti-inflammatory cascades. This is considered acceptable.<br /> (6) The presentation of the splicing data analysis is not better integrated in the overall story.<br /> (7) The authors improved the readability of the manuscript by providing specific details throughout.<br /> (8) Figures were improved and simplified when possible to facilitate readability.<br /> (9) The authors now clarified the PRO-Seq (TFEA analysis) explaining that their data is consistent with the general observation that stimulus-responsive genes is controlled by enhancer-bound TFs.
-
Author response:
The following is the authors’ response to the original reviews.
Reviewer #1 (Public Review):
Summary:
The main conclusion of this manuscript is that the mediator kinases supporting the IFN response in Downs syndrome cell lines represent an important addition to understanding the pathology of this affliction.
Strengths:
Mediator kinase stimulates cytokine production. Both RNAseq and metabolomics clearly demonstrate a stimulatory role for CDK8/CDK19 in the IFN response. The nature of this role, direct vs. indirect, is inferred by previous studies demonstrating that inflammatory transcription factors are Cdk8/19 substrates. The cytokine and metabolic changes are clear-cut and provide a potential avenue to mitigate these associated pathologies.
Weaknesses:
This study revealed a previously undescribed role for the CKM in splicing. The previous identification of splicing factors as substrates of CDK8/CDK19 is also intriguing. However, additional studies seem to be necessary in order to attach this new function to the CKM. As the authors point out, the changes in splicing patterns are relatively modest compared to other regulators. In addition, some indication that the proteins encoded by these genes exhibit reduced levels or activities would support their RNAseq findings.
We have added new splicing data for the version of record. Specifically, we have added splicing data analysis for the "non-sibling" T21 cell line (±cortistatin A, t=4.5h) and for the sibling T21 line (±cortistatin A) at t=24h. The results are summarized in new Figure 5 – figure supplement 2. The data are in agreement with our prior data from the sibling T21 line ±CA at t=4.5h. In particular, i) similar numbers of genes were impacted by splicing changes (alternative exon inclusion or alternative exon skipping) in CA-treated cells in the "non-sibling" T21 line compared with the sibling T21 line; ii) upon completion of a pathway analysis of these alternatively spliced genes, similar pathways were affected by CA in each case (non-sibling T21 vs. sibling T21), in particular those related to IFN signaling; iii) regarding the new t=24h timepoint for the sibling T21 line, similar numbers of genes were alternatively spliced (alternative exon inclusion or alternative exon skipping) in CA-treated cells compared with the 4.5h timepoint, and iv) the IPA results with the alternately spliced genes identified inflammatory signaling, mRNA processing, and lipid metabolism among other pathways, which broadly reflect the cytokine screen and metabolomics data in CA-treated cells (t=24h).
Additional evidence for CDK8/CDK19 regulation of splicing comes from our t=24h RNA-seq data in T21 cells ±CA. GSEA results revealed down-regulation of many pathways related to RNA processing and splicing, suggesting that the splicing changes caused by Mediator kinase inhibition result from reduced expression of splicing regulators, at least at this longer timeframe. These results are summarized in new Figure 2 – figure supplement 2E. Collectively, the data shown in this article reveal a previously unidentified role for Mediator kinases as splicing regulators. We emphasize in the article, however, that the splicing effects of Mediator kinase inhibition appear modest, at least within the cell lines and timeframes of our experiments, especially when compared with CDK7 inhibition [Rimel et al. Genes Dev 2020 1452].
Seahorse analysis is normally calculated with specific units for oxygen consumption, ATP production, etc. It would be of interest to see the actual values of OCR between the D21 and T21 cell lines rather than standardizing the results. This will address the specific question about relative mitochondrial function between these cells. Reduced mitochondrial function has been associated with DS patients. Therefore, it would be important to know whether mitochondrial function is reduced in the T21 cells vs. the D21 control. Importantly for the authors' goal of investigating the use of CDK8/19 inhibitors in DS patients, does CA treatment reduce mitochondrial function to pathological levels?
These are good points. We have addressed as follows.
(1) We have added a comparative analysis of Seahorse data for the sibling-matched T21 and D21 lines. As shown in new Figure 2 – figure supplement 4A-C, the T21 line shows higher basal levels of OCR and ECAR compared with D21. Although reviewer 1 states that "reduced mitochondrial function has been associated with DS patients" we are unaware of the study from which this conclusion was made. Our results are consistent with a Down syndrome mouse model study published last year [Sarver et al. eLife 2023 e86023]. We acknowledge that in this study, T21/D21 OCR levels varied in different tissues, but the majority of tissue types showed elevated OCR in T21, similar to our results in the human B-cells used here.
(2) Interestingly, CA treatment reduced OCR and ECAR in T21 cells (and D21), suggesting that Mediator kinase inhibition might normalize mitochondrial function (and ECAR) toward D21 levels. We show this comparison in new Figure 2 – figure supplement 4D-F. Indeed, CA treatment appears to normalize T21 mitochondrial function and ECAR toward D21 levels. Although this may suggest a therapeutic benefit, we emphasize that more experiments would be needed to make such claims with confidence.
(3) We include a breakdown of mitochondrial parameters from Seahorse data in the bar plots shown in Figure 2–figure supplement 3. This includes ATP production, which shows reduced ATP levels in CA-treated T21 cells specifically.
(4) We have added Seahorse data for ECAR (extracellular acidification rate) in the siblingmatched D21 and T21 cells, ±CA. These results are shown in new Figure 2 – figure supplement 3D, and indicate that CA treatment reduces ECAR in both D21 and T21 cells. This result is consistent with a prior report that analyzed ECAR in CDK8 analog-sensitive HCT116 cells [Galbraith et al. Cell Rep 2017 1495].
Reviewer #2 (Public Review):
Summary:
In this manuscript, Cozzolino et al. demonstrate that inhibition of the Mediator kinase CDK8 and its paralog CDK19 suppresses hyperactive interferon (IFN) signaling in Down syndrome (DS), which results from trisomy of chromosome 21 (T21). Numerous pathologies associated with DS are considered direct consequences of chronic IFN pathway activation, and thus hyperactive IFN signaling lies at the heart of pathophysiology. The collective interrogation of transcriptomics, metabolomics, and cytokine screens in sibling-matched cell lines (T21 vs D21) allows the authors to conclude that Mediator kinase inhibition could mitigate chronic, hyperactive IFN signaling in T21. To probe the functional outcomes of Mediator kinase inhibition, the authors performed cytokine screens, transcriptomic, and untargeted metabolomics. This collective approach revealed that Mediator kinases establish IFN-dependent cytokine responses at least in part through transcriptional regulation of cytokine genes and receptors. Mediator kinase inhibition suppresses cell responses during hyperactive IFN signaling through inhibition of pro- inflammatory transcription factor activity (anti-inflammatory effect) and alteration of core metabolic pathways, including upregulation of anti-inflammatory lipid mediators, which served as ligands for specific nuclear receptors and downstream phenotypic outcomes (e.g., oxygen consumption). These data provided a mechanistic link between Mediator kinase activity and nuclear receptor function. Finally, the authors also disclosed that Mediator kinase inhibition alters splicing outcomes.
Overall, this study reveals a mechanism by which Mediator kinases regulate gene expression and establish that its inhibition antagonizes chronic IFN signaling through collective transcriptional, metabolic, and cytokine responses. The data have implications for DS and other chronic inflammatory conditions, as Mediator kinase inhibition could potentially mitigate pathological immune system hyperactivation.
Strengths:
(1) One major strength of this study is the mechanistic evidence linking Mediator kinases to hyperactive IFN signaling through transcriptional changes impacting cell signaling and metabolism. (2) Another major strength of this study is the use of sibling-matched cell lines (T21 vs D21) from various donors (not just one sibling pair), and further cross-referencing with data from large cohorts, suggesting that part of the data and conclusions are generalizable.
(3) Another major strength of this study is the combined experimental approach including transcriptomics, untargeted metabolomics, and cytokine screens to define the mechanisms underlying suppression of hyperactive interferon signaling in DS upon Mediator kinase inhibition. (4) Another major strength of this study is the significance of the work to DS and its potential impact on other chronic inflammatory conditions.
Weakness:
(1) Genetic evidence linking the mentioned nuclear receptors to activation of an anti-inflammatory program upon Mediator kinase inhibition could improve the definition of the mechanism and overall impact of the work.
Existing data from other studies, some of which are cited in the article, have linked PPAR and LXR to lipid biosynthesis and anti-inflammatory signaling cascades. We assume that reviewer 2 is suggesting knockdown and/or degron depletion of specific nuclear receptors, to compare/contrast the effect of CA on IFN responses in T21 and D21 cells. Such experiments would help de-couple the NR-specific contributions from other CA-dependent effects. We consider these experiments important next steps for this project, but beyond the scope of this study. That said, we anticipate that data from such experiments might be challenging to interpret, given the complex and inter-connected cascade of transcriptional and metabolic changes that would result from PPAR or LXR depletion.
(2) Page 5 states that "Mediator kinases broadly regulate cholesterol and fatty acid biosynthesis and this was further confirmed by the metabolomics data", but a clear mechanistic explanation was lacking. Likewise, the data suggest but do not prove, that altered lipid metabolites influence the function of nuclear receptors to regulate an anti-inflammatory program in response to Mediator kinase inhibition (p. 6), despite the fact the gene expression changes elicited by Mediator kinase inhibition tracked with downstream metabolic changes.
We have clarified the text on page 5 to address this comment. Specifically, we note that CA treatment increases expression of FA metabolism and cholesterol metabolism genes in T21 cells under basal conditions, and the genes affected are shown in Figure 2–figure supplement 1E. Thus, the mechanistic explanation is that Mediator kinases cause elevated levels of FA and cholesterol metabolites via changes in expression of FA and cholesterol biosynthesis genes (at least in part). We further address the mechanism with the PRO-seq data and TFEA results in Figure 6; in particular, p53 activity is rapidly suppressed in CA-treated T21 cells (t=75min), and this alone is sufficient to activate SREBP [Moon et al. Cell 2019 564]. CA-dependent activation of SREBP target genes is a dominant feature in the T21 RNA-seq data (t=4.5h).
We agree with the second point raised by reviewer 2, that our data suggest but do not prove nuclear receptor function is altered by CA treatment. We do cite papers that have provided good evidence that the metabolites elevated in CA-treated cells are NR ligands and activate their target genes. Additional experiments to address this question might involve targeted depletion of select metabolites via inhibition of key biosynthetic enzymes. We consider these experiments beyond the scope of this already expansive article. That said, it will be challenging to conclusively demonstrate clear cause-effect relationships (e.g. to demonstrate whether select metabolites altered by CA treatment directly alter PPARA function), given i) the myriad transcriptional and metabolic changes caused by CA treatment, coupled with the fact that ii) the CA-dependent lipid metabolite changes are spread out across chemically distinct NR agonists (e.g. endocannabinoids, oleamide, or cholesterol metabolites such as desmosterol), and iii) NR activation can occur via multiple different metabolites.
(3) The figures are outstanding but dense.
Thank you. We have done our best to represent the results clearly and within the publication guidelines. There was an enormous amount of data to summarize for this article.
(4) Figure 6 (PRO-Seq). The authors refer to pro-inflammatory TFs (e.g. NF-kB/RelA). It is not clear whether the authors have specifically examined TF binding at enhancers or more broadly at every region occupied by the interrogated TFs?
This is a good point. Our analysis (TFEA) only identified the TFs whose activity was changing in CA-treated cells. It did not distinguish where these TFs were bound (enhancers vs. promoters). We completed a modified TFEA by separating enhancer TFs vs. promoter TFs. The results showed a preference for CA-dependent suppression of enhancer-bound TFs. This result is consistent with the general observation that stimulus-response transcription is controlled by enhancer-bound TFs (e.g. Kim et al. Nature 2010 182; Azofeifa et al. Genome Res 2018 334; Jones et al. bioRxiv 2024 585303). However, our TFEA enhancer/promoter analysis is preliminary and more work would be needed to address this comment in a rigorous way. Therefore, we did not include this analysis in the revision.
Reviewing Editor Comments:
Main suggestions for improvement:
(1) Provide additional information about the mechanistic basis for the changes in lipid levels observed on kinase inhibition.
We have changed the text to better emphasize that the mechanistic basis involves i) gene expression changes resulting from Mediator kinase inhibition (e.g. Fig 2 – figure supplement 1D, E, Fig 2 – figure supplement 2B, Fig 2 – figure supplement 4B-D); ii) activation of SREBP and PPAR and LXR, based upon IPA results with RNA-seq data (e.g. Fig 2B, Fig 2 – figure supplement 1F, Fig 2 – figure supplement 2D, Fig 2 – figure supplement 4E; Fig 3E), and iii) rapid CAdependent suppression of p53 function (Fig 6A), which will activate SREBP (Moon et al. Cell 2019 564).
(2) Provide direct genetic evidence that the nuclear receptors are activated by the lipid changes to mediate an anti-inflammatory program in response to Mediator kinase inhibition.
This is an excellent question but we consider it beyond the scope of this already expansive study. That said, we cite several papers in the article that demonstrate that the lipids we observe elevated in CA-treated cells i) directly bind PPAR or LXR and ii) activate their TF function. We also note that the anti-inflammatory impacts of Mediator kinase inhibition are broad, affecting distinct gene sets through transcriptional changes, metabolites, and cytokines. Any NR-specific contributions could be challenging to de-couple from CA-dependent effects using knockdown or depletion methods, given the compensatory responses that would result.
(3) Improve/expand the evidence that Mediator kinase inhibition confers reduced mitochondrial function.
We have added new Seahorse data for sibling-matched D21 and T21 cells (±CA) for the version of record. Our prior results showed reduced mitochondrial function and OCR in CA-treated T21 cells. We have added data that compares D21 and T21 mitochondrial function. As shown in new Figure 2 – figure supplement 4A-C, the T21 line shows higher basal levels of OCR and ECAR compared with D21. These results are consistent with a Down syndrome mouse model study published last year [Sarver et al. eLife 2023 e86023]. When we compare CA-treated T21 with D21 cells, mitochondrial respiration and OCR are similar, suggesting that Mediator kinase inhibition might normalize mitochondrial function (and ECAR) toward D21 levels. We show this comparison in new Figure 2 – figure supplement 4D-F. Although this may suggest a therapeutic benefit, we emphasize that more experiments would be needed to make such claims with confidence.
(4) Determine whether mitochondrial function is reduced in the T21 cells vs. the D21 controls and whether kinase inhibition with the inhibitor reduces mitochondrial function to pathological levels.
For the version of record, we have added a direct comparison of mitochondrial parameters and OCR in the sibling-matched D21/T21 lines. The data show that T21 cells have higher OCR compared with D21. These results are consistent with a Down syndrome mouse model study published last year [Sarver et al. eLife 2023 e86023]. Our results also indicate that CA treatment brings OCR and other "mitochondrial parameters" in T21 cells toward D21 levels, as noted above.
(5) Consider whether the CDK8/19 inhibitor has off-target effects that would lessen its therapeutic value.
We chose cortistatin A (CA) for this project because it is the most potent and selective inhibitor available for targeting CDK8/CDK19. Initial published reports suggested off-target effects (Cee et al. Angew Chem IEE 2009), but these experiments used binding assays against the kinase protein alone, and did not measure binding or inhibition with biologically relevant, active kinase complexes. Kinome-wide screens involving native, active kinase complexes showed no evidence of off-target effects for cortistatin A, even at concentrations 5000-times the measured KD (Pelish et al. Nature 2015). See Author response image 1.
Related to CA therapeutic value, that is an important issue but beyond the scope of this study. We consider CA a valuable chemical probe, to use as a means to define CDK8/CDK19-dependent functions in cell line models. As a chemical probe, we consider CA the "best-in-class" Mediator kinase inhibitor, based upon all available data (Clopper & Taatjes Curr Opin Chem Biol 2022 102186).
That said, we understand the concern about off-target effects, which can never be ruled out with a chemical inhibitor. We include quantitative western data (Fig 1 – figure supplement 1A) that compares CA with a structurally distinct CDK8/CDK19 inhibitor, CCT251545. The data show that, as expected, CA (100nM) and CCT251545 (250nM) similarly inhibit STAT1 S727 phosphorylation in IFN-stimulated cells. The samples were pre-treated with inhibitor for 30 minutes prior to IFNg and collected 45 minutes after IFNg treatment.
We did not complete any experiments with knockouts or kinasedead alleles primarily because knockouts or kinase-dead alleles are not reliable comparisons for chemical inhibition because of the different time frames involved. For example, there will be genetic compensation in edited cell lines (Rossi/Stanier Nature 2015 230) and we and others have shown that there are major differences between kinase protein loss through knockdown or knockout methods vs. rapid inhibition with small molecules (e.g. Poss et al. Cell Rep 2016 436; Sooraj et al. Mol Cell 2022 123).
Author response image 1.
Information about cortistatin A. A) KiNativ kinome screen from HEK293 lysates. CA blocked capture of only CDK8/CDK19 in this MSbased assay, among over 200 kinases detected. B) Equilibrium binding constants and kinetics for CA. C) CA structure; note the dimethylamine is protonated at physiological pH, and forms a pi-cation interaction with W105 (crystal structure, panel D). Only CDK8 and CDK19 have an aromatic residue (W) at this position, providing a structural basis for high selectivity.
(6) Improve the presentation of the splicing data and better discuss how the splicing alterations may be contributing to the disease phenotype.
We have added new splicing data for the version of record. Specifically, we have added splicing data analysis for the "non-sibling" T21 cell line (±cortistatin A, t=4.5h) and for the sibling T21 line (±cortistatin A) at t=24h. The results are summarized in new Figure 5 – figure supplement 2. The data are in agreement with our prior results from the sibling T21 line ±CA at t=4.5h. In particular, i) similar numbers of genes were impacted by splicing changes (alternative exon inclusion or alternative exon skipping) in CA-treated cells in the "non-sibling" T21 line compared with the sibling T21 line; ii) upon completion of a pathway analysis of these alternatively spliced genes, similar pathways, including IFN signaling pathways, were affected by CA in each case (non-sibling T21 vs. sibling T21); iii) regarding the new t=24h timepoint for the sibling T21 line, similar numbers of genes were alternatively spliced (alternative exon inclusion or alternative exon skipping) in CA-treated cells compared with the 4.5h timepoint, and iv) the IPA results with the alternately spliced genes identified inflammatory signaling, mRNA processing, nucleotide and lipid metabolism among other pathways, which broadly reflect the cytokine screen and metabolomics data in CA-treated cells (t=24h).
Additional evidence for CDK8/CDK19 regulation of splicing comes from our t=24h RNA-seq data in T21 cells ±CA. GSEA results from sibling T21 cells ±CA revealed down-regulation of many pathways related to RNA processing and splicing (RNA-seq data, t=24h), suggesting that the splicing changes caused by Mediator kinase inhibition result from reduced expression of splicing regulators, at least at longer timeframes. These results are summarized in new Figure 2 – figure supplement 2E.
Related to how splicing alterations may be contributing to the CA-dependent effects and their potential therapeutic implications, this is an interesting question but open-ended. It will not be straightforward to link specific splicing changes to possible therapeutic outcomes, especially given that there are hundreds of genes affected and because the effects are modest (i.e. not all-ornothing).
Reviewer #1 (Recommendations For The Authors):
The findings that CA treatment leads to upregulation of as many genes are downregulated is consistent with previous studies of a 50:50 role for the CKM. However, most previous studies utilized knockout alleles or knockdown approaches. As the authors demonstrated in a previous study, CA inhibits kinase activity without changing CDK8 levels. Does this indicate that the kinase activity of Cdk8/19 is required for transcriptional repression? Previous in vitro studies suggested that Cdk8/19-dependent repression was independent of their kinase activity. The authors should comment on this.
This is a challenging question to address, because the answer will depend on the timing of the experiment and the experimental context. The short answer is that the kinase activity of CDK8/19 will activate some genes and reduce expression of others, at least in part because CDK8/19 phosphorylate TFs, which drive global gene expression programs. TF phosphorylation by CDK8/19 appears to activate some genes and repress others (e.g. STAT1 S727A example from Steinparzer et al. Mol Cell 2019 485), at least based upon RNA-seq data, but this doesn't measure the immediate effects on the transcriptome. It is true that kinase activity isn't required to block pol II incorporation into the PIC (Knuesel et al. Genes Dev 2009 439). This is a kinase-independent function of the module; MKM-Mediator binding will block Mediator-pol II interaction and therefore block PIC assembly and pol II initiation (Knuesel 2009; Ebmeier & Taatjes PNAS 2010 11283). The kinase-independent functions of CDK8/19 were not a focus of the work described here. We only focus on Mediator kinase activity. We also do not focus on potential effects on RNAPII initiation or PIC assembly, although these are important peripheral topics.
Descriptors are less useful as the reader must go back to reconstruct the experiment: "Although metabolites were measured 24h after CA treatment, these data suggest that altered lipid metabolites influence LXR and PPAR function". Does "altered" mean the lipid concentrations were up or down? Similarly, lipids that "influenced" LXR function - were they stimulatory or inhibitory?
Good point. Where possible, we used more accurate language when describing CAdependent changes.
I found many sections in the text confusing. For example: Figure 3. Mediator kinase inhibition antagonizes IFNγ transcriptional responses in T21 and D21. It takes a while to unpack this figure title. Instead of the double negative, the authors could simply state that "Mediator kinase is required for IFN-dependent transcriptional activation". Describing the protein activity, versus the drug-induced phenotype, can often clarify complicated scenarios.
Good idea. We have edited the text to eliminate some but not all of these double negatives. In some cases we prefer to describe the consequence of kinase inhibition.
Reviewer #2 (Recommendations For The Authors):
(1) The splicing data analysis is compelling, but not well integrated into the overall story and it cuts the storytelling logic in the Abstract. The authors could consider better integrating the large amount of data generated and better explaining how it relates to the various aspects of the proposed model (transcriptional, metabolism) to help improve potential cause-and-effect outcomes. -
We agree. The large amount of data, combined with the different experimental approaches, makes it a challenge to summarize the data in a concise way. We have done our best to organize the results in a logical and clear manner. To address this comment, we have gone through the text and re-organized where possible, and we have edited the abstract. We have added new splicing data and the splicing results are now better integrated (in our opinion) in part because of the pathway results from the t=24h ±CA RNA-seq data, which show major reductions in gene sets related to splicing and RNA processing.
(2) The manuscript could improve its readability by providing specific details throughout. Examples include i) explaining why and what 29 cytokines were chosen for the screen (p. 3, p. 4) ii) providing major data analysis conclusions to the cytokine screen part (p. 3) iii) expanding the conclusions to the metabolic pathway analysis (p. 4) iv) being more precise when referring to T21-specific changes (up or down?) (p 4), and "significantly altered" by CA treatment in T21 cells (up or down?) (p. 5).
Good points. We have edited the text to address these comments. Please note that the 29 cytokines refers to a different study (Malle et al. Nature 2023) and we had no role in selecting the cytokines. Our screen involved 105 cytokines that were arrayed as part of a commercially available panel.
(3) The figures are outstanding but dense (e.g., Figure 1b, can any simplification and/or highlighting be done to underscore important features?). Some panels are illegible (e.g. Figure 1- supplement Figure 2a and b). The authors could improve data presentation. For example, the Venn diagrams (e.g., Figure 2f) are hard to quickly digest. Can the authors find a better way to highlight important data (e.g., hard to distinguish the meaning of font bolding from italics)?
Thank you for these suggestions. Regarding Figure 1B, we simplified the metabolic pathways to emphasize the biochemicals that specifically relate to this study. We decided against highlighting specific metabolites beyond this simplification, because in our opinion it causes as many problems as it solves. Where possible, we have enlarged the panels with hard-to-read text; thank you for the suggestion. For the Venn diagrams, they convey a large amount of information in a single panel: increased or decreased gene expression in T21 or D21, cytokine genes or cytokine receptors, and gene expression convergence or divergence compared with protein levels from cytokine screens. There is a different way to display the results, but it would involve generating more data panels to parse out the results. This could be considered better, but we opted for something that is more information-rich that requires only a single data panel. Given the large amount of data already shown, we hope the reviewer can understand this choice.
-
-
www.biorxiv.org www.biorxiv.org
-
eLife Assessment
This study presents a new quantitative method, CROWN-seq, to map the cap-adjacent RNA modification N6,2'-O-dimethyladenosine (m6Am) with single nucleotide resolution. Using thoughtful controls and well-validated reagents, the authors provide compelling evidence that the method is reliable and reproducible. Additionally, the study provides important evidence that m6Am may increase transcription in modified mRNAs. However, the data only demonstrates a correlation between m6Am and transcriptional regulation rather than causality. Overall, this study is poised to advance m6Am research, being of broad interest to the RNA biology and gene regulation fields.
-
Reviewer #1 (Public review):
Summary:
In this manuscript, Liu et al. present CROWN-seq, a technique that simultaneously identifies transcription-start nucleotides and quantifies N6,2'-O-dimethyladenosine (m6Am) stoichiometry. This method is derived from ReCappable-seq and GLORI, a chemical deamination approach that differentiates A and N6-methylated A. Using ReCappable-seq and CROWN-seq, the authors found that genes frequently utilize multiple transcription start sites, and isoforms beginning with an Am are almost always N6-methylated. These findings are consistently observed across nine cell lines. Unlike prior reports that associated m6Am with mRNA stability and expression, the authors suggest here that m6Am may increase transcription when combined with specific promoter sequences and initiation mechanisms. Additionally, they report intriguing insights on m6Am in snRNA and snoRNA and its regulation by FTO. Overall, the manuscript presents a strong body of work that will significantly advance m6Am research.
Strengths:
The technology development part of the work is exceptionally strong, with thoughtful controls and well-supported conclusions.
Weaknesses:
Given the high stoichiometry of m6Am, further association with upstream and downstream sequences (or promoter sequences) does not appear to yield strong signals. As such, transcription initiation regulation by m6Am, suggested by the current work, warrants further investigation.
-
Reviewer #2 (Public review):
Summary:
In the manuscript "Decoding m6Am by simultaneous transcription-start mapping and methylation quantification" Liu and co-workers describe the development and application of CROWN-Seq, a new specialized library preparation and sequencing technique designed to detect the presence of cap-adjacent N6,2'-O-dimethyladenosine (m6Am) with single nucleotide resolution. Such a technique was a key need in the field since prior attempts to get accurate positional or quantitative measurements of m6Am positioning yielded starkly different results and failed to generate a consistent set of targets. As noted in the strengths section below the authors have developed a robust assay that moves the field forward.
Furthermore, their results show that most mRNAs whose transcription start nucleotide (TSN) is an 'A' are in fact m6Am (85%+ for most cell lines). They also show that snRNAs and snoRNAs have a substantially lower prevalence of m6Am TSNs.
Strengths:
Critically, the authors spent substantial time and effort to validate and benchmark the new technique with spike-in standards during development, cross-comparison with prior techniques, and validation of the technique's performance using a genetic PCIF1 knockout. Finally, they assayed nine different cell lines to cross-validate their results. The outcome of their work (a reliable and accurate method to catalog cap-adjacent m6Am) is a particularly notable achievement and is a needed advance for the field.
Weaknesses:
No major concerns were identified by this reviewer.
Mid-level Concerns: All previous concerns were addressed in the revised version
-
Reviewer #3 (Public review):
Summary:
m6Am is an abundant mRNA modification present on the TSN. Unlike the structurally similar and abundant internal mRNA modification m6A, m6Am's function has been controversial. One way to resolve controversies surrounding mRNA modification functions has been to develop new ways to better profile said mRNA modification. Here, Liu et al. developed a new method (based on GLORI-seq for m6A-sequencing), for antibody-independent sequencing of m6Am (CROWN-seq). Using appropriate spike-in controls and knockout cell lines, Liu et al. clearly demonstrated CROWN-seq's precision and quantitative accuracy for profiling transcriptome-wide m6Am. Subsequently, the authors used CROWN-seq to greatly expand the number of known m6Am sites in various cell lines and also determine m6Am stoichiometry to generally be high for most genes. CROWN-seq identified gene promoter motifs that correlate best with high stoichiometry m6Am sites, thereby identifying new determinants of m6Am stoichiometry. CROWN-seq also helped reveal that m6Am does not regulate mRNA stability or translation (as opposed to past reported functions). Rather, m6Am stoichiometry correlates well with transcription levels. Finally, Liu et al. reaffirmed that FTO mainly demethylates m6Am, not of mRNA but of snRNAs and snoRNAs.
Strengths:
This is a well-written manuscript that describes and validates a new m6Am-sequencing method: CROWN-seq as the first m6Am-sequencing method that can both quantify m6Am stoichiometry and profile m6Am at single-base resolution. These advantages facilitated Liu et al. to uncover new potential findings related to m6Am regulation and function. I am confident that CROWN-seq will likely be the gold standard for m6Am-sequencing henceforth.
Weaknesses:
Though the authors have uncovered a potentially new function for m6Am, they need to be clear that without identifying a mechanism, their data might only be demonstrating a correlation between the presence of m6Am and transcriptional regulation rather than causality.
-
Author response:
The following is the authors’ response to the original reviews.
Public Reviews:
Reviewer #1 (Public review):
Summary:
In this manuscript, Liu et al. present CROWN-seq, a technique that simultaneously identifies transcription-start nucleotides and quantifies N6,2'-O-dimethyladenosine (m6Am) stoichiometry. This method is derived from ReCappable-seq and GLORI, a chemical deamination approach that differentiates A and N6-methylated A. Using ReCappable-seq and CROWN-seq, the authors found that genes frequently utilize multiple transcription start sites, and isoforms beginning with an Am are almost always N6-methylated. These findings are consistently observed across nine cell lines. Unlike prior reports that associated m6Am with mRNA stability and expression, the authors suggest here that m6Am may increase transcription when combined with specific promoter sequences and initiation mechanisms. Additionally, they report intriguing insights on m6Am in snRNA and snoRNA and its regulation by FTO. Overall, the manuscript presents a strong body of work that will significantly advance m6Am research.
Strengths:
The technology development part of the work is exceptionally strong, with thoughtful controls and well-supported conclusions.
We appreciate the reviewer for the very positive assessment of the study. We have addressed the concerns below.
Weaknesses:
Given the high stoichiometry of m6Am, further association with upstream and downstream sequences (or promoter sequences) does not appear to yield strong signals. As such, transcription initiation regulation by m6Am, suggested by the current work, warrants further investigation.
We thank the reviewer for the insightful comments. We have softened the language related to m<sup>6</sup>Am and transcription regulation. We totally agree with the reviewer that future investigation is required to determine the molecular mechanism behind m<sup>6</sup>Am and transcription regulation.
Reviewer #2 (Public review):
Summary:
In the manuscript "Decoding m6Am by simultaneous transcription-start mapping and methylation quantification" Liu and co-workers describe the development and application of CROWN-Seq, a new specialized library preparation and sequencing technique designed to detect the presence of cap-adjacent N6,2'-O-dimethyladenosine (m6Am) with single nucleotide resolution. Such a technique was a key need in the field since prior attempts to get accurate positional or quantitative measurements of m6Am positioning yielded starkly different results and failed to generate a consistent set of targets. As noted in the strengths section below the authors have developed a robust assay that moves the field forward.
Furthermore, their results show that most mRNAs whose transcription start nucleotide (TSN) is an 'A' are in fact m6Am (85%+ for most cell lines). They also show that snRNAs and snoRNAs have a substantially lower prevalence of m6Am TSNs.
Strengths:
Critically, the authors spent substantial time and effort to validate and benchmark the new technique with spike-in standards during development, cross-comparison with prior techniques, and validation of the technique's performance using a genetic PCIF1 knockout. Finally, they assayed nine different cell lines to cross-validate their results. The outcome of their work (a reliable and accurate method to catalog cap-adjacent m6Am) is a particularly notable achievement and is a needed advance for the field.
Weaknesses:
No major concerns were identified by this reviewer.
We thank the reviewer for the positive assessment of the method and dataset. We have addressed the concerns below.
Mid-level Concerns:
(1) In Lines 625 and 626, the authors state that “our data suggest that mRNAs initate (mis-spelled by authors) with either Gm, Cm, Um, or m6Am.” This reviewer took those words to mean that for A-initiated mRNAs, m6Am was the ‘default’ TSN. This contradicts their later premise that promoter sequences play a role in whether m6Am is deposited.
We thank the reviewer for the comment. We have changed this sentence into “Instead, our data suggest that mRNAs initiate with either Gm, Cm, Um, or Am, where Am are mostly m<sup>6</sup>Am modified.” The revised sentence separates the processes of transcription initiation and m<sup>6</sup>Am deposition, which will not confuse the reader.
(2) Further, the following paragraph (lines 633-641) uses fairly definitive language that is unsupported by their data. For example in lines 637 and 638 they state “We found that these differences are often due to the specific TSS motif.” Simply, using ‘due to’ implies a causative relationship between the promoter sequences and m6Am has been demonstrated. The authors do not show causation, rather they demonstrate a correlation between the promoter sequences and an m6Am TSN. Finally, despite claiming a causal relationship, the authors do not put forth any conceptual framework or possible mechanism to explain the link between the promoter sequences and transcripts initiating with an m6Am.
(3) The authors need to soften the language concerning these data and their interpretation to reflect the correlative nature of the data presented to link m6Am and transcription initiation.
For (2) and (3). We have softened the language in the revised manuscript. Specifically, for lines 633-641 in the original manuscript, we have changed “are often due to” into “are often related to” in the revised manuscript, which claims a correlation rather than a causation.
Reviewer #3 (Public review):
Summary:
m6Am is an abundant mRNA modification present on the TSN. Unlike the structurally similar and abundant internal mRNA modification m6A, m6Am’s function has been controversial. One way to resolve controversies surrounding mRNA modification functions has been to develop new ways to better profile said mRNA modification. Here, Liu et al. developed a new method (based on GLORI-seq for m6A-sequencing), for antibody-independent sequencing of m6Am (CROWN-seq). Using appropriate spike-in controls and knockout cell lines, Liu et al. clearly demonstrated CROWN-seq’s precision and quantitative accuracy for profiling transcriptome-wide m6Am. Subsequently, the authors used CROWN-seq to greatly expand the number of known m6Am sites in various cell lines and also determine m6Am stoichiometry to generally be high for most genes. CROWN-seq identified gene promoter motifs that correlate best with high stoichiometry m6Am sites, thereby identifying new determinants of m6Am stoichiometry. CROWN-seq also helped reveal that m6Am does not regulate mRNA stability or translation (as opposed to past reported functions). Rather, m6Am stoichiometry correlates well with transcription levels. Finally, Liu et al. reaffirmed that FTO mainly demethylates m6Am, not of mRNA but of snRNAs and snoRNAs.
Strengths:
This is a well-written manuscript that describes and validates a new m6Am-sequencing method: CROWN-seq as the first m6Am-sequencing method that can both quantify m6Am stoichiometry and profile m6Am at single-base resolution. These advantages facilitated Liu et al. to uncover new potential findings related to m6Am regulation and function. I am confident that CROWN-seq will likely be the gold standard for m6Am-sequencing henceforth.
Weaknesses:
Though the authors have uncovered a potentially new function for m6Am, they need to be clear that without identifying a mechanism, their data might only be demonstrating a correlation between the presence of m6Am and transcriptional regulation rather than causality.
We thank the reviewer for the very positive assessment of the CROWN-seq method. We have softened the language which is related to the correlation between m<sup>6</sup>Am and transcription regulation.
Reviewer recommendations:
We thank the reviewers for their constructive suggestions. In the revised manuscript, we have corrected the errors and updated the requested discussions and figures.
Reviewer #1 (Recommendations for the authors):
(1) The prior work from the research group, "Reversible methylation of m6Am in the 5′ cap controls mRNA stability" (PMID: 28002401), should be cited, even if the current findings differ from earlier conclusions-particularly in line 58 and the section titled "m6Am does not substantially influence mRNA stability or translation".
We thank the reviewer for this comment. We have added the citation.
(2) I wonder why the authors chose to convert A to I before capping and recapping, as RNA fragmentation caused by chemical treatment may introduce noise into these processes.
We thank the reviewer for this comment. This is a very good point. We have indeed considered this alternative protocol. There are two concerns in performing decapping-and-recapping before A-to-I conversion: (1) it is unclear whether the 3’-desthiobiotin, which is essential for the 5’ end enrichment, is stable or not during the harsh A-to-I conversion; (2) performing decapping-and-recapping first requires more enzyme and 3’-desthiobiotin-GTP, which are the major cost of the library preparation. This is because the input of CROWN-seq (~1 μg mRNA) is much higher than that in ReCappable-seq (~5 μg total RNA or ~250 ng mRNA). In the current protocol, many 5’ ends are highly fragmented and therefore are lost during the A-to-I conversion. As a result, less enzyme and 3’-desthiobiotin-GTP are needed.
(3) During CROWN-seq benchmarking, the authors found that 93% of reads mapped to transcription start sites, implying a 7% noise level with a spike-in probe. This noise could lead to false positives in TSN assignments in real samples. It appears that additional filters (e.g., a known TSS within 100 nt) were applied to mitigate false positives. If so, I recommend that the authors clarify these filters in the main text.
We thank the reviewer for this comment. We think that the spike-in probes might lead to an underestimation of the accuracy of TSN mapping. The spike-in probes are made by in vitro transcription with m<sup>7</sup>Gpppm<sup>6</sup>AmG or m<sup>7</sup>GpppAmG analogs. We found that the in vitro transcription exhibits a small amount of non-specific initiation, which leads to spike-in probes with 5’ ends that are not precisely aligned with the desired TSS. To better illustrate the mapping accuracy of CROWN-seq, we provided Figure 2H, which compares the non-conversion rates of newly found A-TSNs between wild-type and PCIF1 knock cells. If the newly found A-TSNs are real, they should show high non-conversion rates in wild-type cells (i.e., high m<sup>6</sup>Am) and almost zero non-conversion rates (i.e., Am) in PCIF1 knockout cells. As expected, most of the newly found A-TSNs are true A-TSNs since they are m6Am in wild-type and Am in PCIF1 knockout. Thus, we think that CROWN-seq is very precise in TSS mapping. We have clarified this in the Discussion.
(4) I wonder if PCIF1 knockout affects TSN choice and abundance. If not, this data should be presented. If so, how are these changes accounted for in Figure 2H and Figure S5?
We thank the reviewer for this comment. PCIF1 KO does not really affect TSN choice. Here we calculate the correlation of relative TSN expression within genes between wild-type and PCIF1 KO cells (shown using Pearson’s r). It shows that most of the genes have similar TSN choices (with higher Pearson’s r) in both wild-type and PCIF1 KO cells. Thus, PCIF1 KO does not alter global TSN expressions.
Author response image 1.
(5) The manuscript refers to Am as a rare modification in mRNA (e.g., introduction lines 101-102; discussion lines 574, 608; and possibly other locations) without specifying this only applies to transcription start sites. As this study does not cover entire mRNA sequences, these statements may not be misleading.
We thank the reviewer for this comment. We have clarified it.
Reviewer #2 (Recommendations for the authors):
(1) On line 122, the authors state that: "On average, a gene uses 9.5{plus minus}9 (mean and s.d., hereafter) TSNs (Figure 1A)." However, they do not discuss the dispersion apparent in the TSNs they observed. Figure panels 1A, B, and S1A, B show a range of 120 bases or less. What is the predominant range of distances between annotated TSNs and the newly identified ones?
1a) For example, what percentage of new TSNs fall within 20? 50? 75? bases of the annotated sites? Additional text describing the distribution of these TSNs would help readers better understand the diversity inherent in these novel 5' RNA ends. Notably, this additional text likely is best placed in the CROWN-Seq section related to Figure 2 or S2.
We thank the reviewer for this comment. We have updated Figure S2 to describe the newly found TSSs. Depending on the coverage in CROWN-seq, the TSSs with higher coverage tend to overlap with or locate proximally to known TSSs. In contrast, the TSSs with low coverage tend to be located further away from annotated TSSs.
1b) The alternate TSNs can have effects on splicing patterns and isoform identity. Providing a few sentences to explain how regularly this occurs would be helpful.
We thank the reviewer for this comment. It is a very interesting point. Different TSNs can indeed have different splicing patterns. Although the discovery of splicing patterns regulated by TSNs is out of the scope of this study, we have discussed this possibility in the revised Discussion section.
(2) On Lines 241 and 242, the authors mentioned that 1284 sites were excluded from the analysis based on low (under 20-explained in the figure legend) read count, distance from TSS, or false negatives (which are not explained). Although I agree that the authors are justified in setting these reads aside, the information could be useful to readers willing to perform follow-up work if their mRNAs of interest were included in these 1284 sites.
2a) An annotation of all of these sites (broken down by category, i.e. the 811, the 343, and the 130) as a supplementary table should be provided.
We thank the reviewer for this comment. We have added the categories to the revised Table S1.
(3) Although I have marked several typos/grammar mistakes in several parts of this review, others exist elsewhere in the text and should be corrected.
We thank the reviewer for this comment. We have corrected them.
(4) In lines 122 and 123 the authors say "Only ~9% of genes contain a single TSN (Figure 1A)." However, their figure shows 81% with a single TSN. Why is there a 10% discrepancy?
We thank the reviewer for this comment. We have corrected the plot in Figure 1A, to match the description.
(5) The first Tab of Table S2 is labeled 'Legend', but is blank. Is this intentional?
We thank the reviewer for this comment. We have updated the table legends.
(6) On lines 70 and 76 of the supplementary figure file pertaining to Figure S2, the legend labels for Figure S2E and S2F are not accurate, they need to be changed to G and H.
(7) In Figure 4A 'percentile' is misspelled.
(8) The color-coding legend for the 4 bases is missing from (and should be added to) Figure S4A.
(9) On Lines 984, 1163, and 1194 the '2s' should be properly sub-scripted where appropriate.
For (6) to (9). We thank the reviewer for finding these issues. We have now corrected them.
Reviewer #3 (Recommendations for the authors):
(1) The authors should discuss if their results can definitively distinguish between the SSCA+1GC motif promoting m6Am that, in turn, promotes transcription, versus the SCA+1GC motif promoting m6Am but also separately promoting transcription in a m6Am-independent manner. The authors should also discuss this in light of recent findings by An et al. (2024 Mol. Cell), which support the former conclusion.
We thank the reviewer for the suggestion. We now have updated the Discussion to address that our paper and An et al. can support each other.
(2) Given that the authors showed m6Am promotes gene expression (Figure 5) but does not affect mRNA stability (Fig. S5), logic dictates that m6Am must regulate mRNA transcription. However, the authors should explain why this regulation focuses on the initiation aspect of transcription rather than other aspects of transcriptional e.g. premature termination, pause release, and elongation.
We thank the reviewer for this comment. In this study, we did not profile the 3’ ends of nascent RNAs and thus we can only make conclusions about the overall transcription process but not a specific aspect. We have updated the revised Discussion section to mention that An et al. discovered that m<sup>6</sup>Am can sequester PCF11 and thus promote transcription, and therefore some of the effects we see could be related to differential premature termination.
(3) Authors should add alternative versions of Figure 1D but with 3 colours corresponding to Am vs. m6Am vs. Cm/Gm/Um for all the cells, they performed CROWN-seq on.
We thank the reviewer for this comment. We have updated Figure S5 as the corresponding figure showing the fraction of Am vs. m6Am vs. Cm/Gm/Um.
(4) Figure 2H (left): Please comment on the few outliers that still show high non-conversion even in PCIF1-KO cells.
We thank the reviewer for this comment. We have discussed the outliers in the main text. These outliers can be found in the revised Table S3.
(5) Line 254: "Second, if these sites were RNA fragments they would not contain m6Am." is missing a comma.
(6) S2G and S2H labelling in Figure S2 legends is wrong.
For (5) and (6). We thank the reviewer for these comments. We have corrected them.
(7) Figure 3D: Many gene names are printed multiple times (e.g. ACTB is printed 5 times). Is this correct; is each dot representing 1 cell line?
We thank the reviewer for this comment. These gene names represent different transcription-start nucleotides. We now clarify that each instance refers to a different start site.
(8) S5A-C: Even if there's no substantial difference, authors should still display the Student's T-test P-values as they did for S5D-G.
We thank the reviewer for this comment. We have updated the P-values.
(9) Figure 5C and S5E: Why are the authors not showing the respective analysis for C-TSN and U-TSN genes?
We thank the reviewer for this comment. Most mRNAs start with A or G. We therefore selected G-TSN as the control. Unlike G-TSNs which occur in diverse sequence and promoter contexts, C-TSNs and U-TSNs are unusual. Genes that mainly use C-TSNs and U-TSNs are the so-called “5’ TOP (Terminal OligoPyrimidine)” genes. The 5’ TOP genes are mostly genes related to translation and metabolism, and thus their expressions reflect the homeostasis of cell metabolism. Thus, we were concerned that any differential expression of the C-TSN and U-TSN genes between wild-type and PCIF1 knockout cells might reflect specific effects on TOP transcriptional regulation rather than the general effects of PCIF1 on transcription.
(10) Line 82, 470, 506, 676: The authors should also cite Koh et al (2019 Nat. Comm.) in these lines that describe how snRNAs can also be m6Am-methylated and how FTO targets these same snRNAs for demethylation.
We thank the reviewer for this comment. We have updated the citation.
-
-
www.biorxiv.org www.biorxiv.org
-
eLife Assessment
In this article, Cheng et al present an important finding that advances the understanding of mitochondrial stress response(s). The authors employed mass spectrometry-based methods in conjunction with standard molecular and cellular biology techniques to provide compelling evidence that phosphatidylethanolamine-binding protein 1 (PEBP1) acts as a pivotal regulator of the mitochondrial component of integrated stress response. Notwithstanding that this discovery is likely to be of significant interest to researchers across a broad spectrum of disciplines ranging from cell biology to neuroscience, it was thought that further mechanistic dissection of the role of PEBP1 in modulating integrated stress response may further strengthen this study.
-
Reviewer #1 (Public review):
Summary:
In this study, the authors use thermal proteome profiling to capture changes in protein stability following a brief (30 min) treatment of cells with various mitochondrial stressors. This approach identified PEBP1 as a potentiator of Integrated Stress Response (ISR) induction by various mitochondrial stressors, although the specific dynamics vary by stressor. PEBP1 deletion attenuates DELE1-HRI-mediated activation of the ISR, independent of its known role in the RAF/MEK/ERK pathway. These effects can be bypassed by HRI overexpression and do not affect DELE1 processing. Interestingly, in cells, PEBP1 physically interacts with eIF2alpha, but not its phosphorylated form (eIF2alpha-P), leading the authors to suggest that PEBP1 functions as a scaffold to promote eIF2alpha phosphorylation by HRI.
Strengths:
The authors present a clear and well-structured study, beginning with an original and unbiased approach that effectively addresses a novel question. The investigation of PEBP1 as a specific regulator of the DELE1-HRI signaling axis is particularly compelling, supported by extensive data from both genetic and pharmacological manipulations. Including careful titrations, time-course experiments, and orthogonal approaches strengthens the robustness of their findings and bolsters their central claims.
Moreover, the authors skillfully integrate publicly available datasets with their original experiments, reinforcing their conclusions' generality and broader relevance. This comprehensive combination of methodologies underscores the reliability and significance of the study's contributions to our understanding of stress signaling.
Weaknesses:
While the study presents exciting findings, there are a few areas that could benefit from further exploration. The HRI-DELE1 pathway was only recently discovered, leaving many unanswered questions. The observation that PEBP1 interacts with eIF2alpha, but not with its phosphorylated form, suggests a novel mechanism for regulating the Integrated Stress Response (ISR). However, as they note themselves, the authors do not delve into the biochemical or molecular mechanisms through which PEBP1 promotes HRI signaling. Given the availability of antibodies against phosphorylated HRI, it would have been interesting to explore whether PEBP1 influences HRI phosphorylation. Furthermore, since the authors already have recombinant PEBP1 protein (as shown in Figure 1D), additional in vitro experiments such as in vitro immunoprecipitation, FRET, or surface plasmon resonance (SPR) could have confirmed the interaction with eIF2alpha. Future studies might investigate whether PEBP1 directly interacts with HRI, stimulates its auto-phosphorylation or kinase activity, or serves as a template for oligomerization, potentially supported by structural characterization of the complex and mutational validation.
Another point of weakness is the unclear significance of the 1.5-2x enhanced interaction with eIF2alpha upon PEBP1 phosphorylation, as there is little evidence to show that this increase has any downstream effects. The ATF4-luciferase reporter experiments, comparing WT and S153D overexpression, may have reached saturation with WT, making it difficult to detect further stimulation by S153D. Additionally, expression levels for WT and mutant forms are not provided, making it challenging to interpret the results. It would also be interesting to explore whether combined mitochondrial stress and PMA treatment further enhance the ISR.
Lastly, while the authors claim that oligomycin does not significantly alter the melting temperature of recombinant PEBP1 in vitro, the data in Figure S1D suggest a small shift. Without variance measures across replicates or background subtraction, this claim is less convincing. The inclusion of statistical analyses would strengthen the interpretation of these results.
Impact on the field:
The study's relevance is underscored by the fact that overactive ISR is linked to a broad range of neurodegenerative diseases and cognitive disorders, a field actively being explored for therapeutic interventions, with several drugs currently in clinical trials. Similarly, mitochondrial dysfunction plays a well-established role in brain health and other diseases. Identifying new targets within these pathways, like PEBP1, could provide alternative therapeutic strategies for treating such conditions. Therefore, gaining a deeper understanding of the mechanisms through which PEBP1 influences ISR regulation is highly pertinent and could have far-reaching implications for the development of future therapies.
-
Reviewer #2 (Public review):
Summary:
In this work, Cheng et al use the TPP/MS-CETSA strategy to discover new components for the mitochondria arm of the Integrated Stress Response. By using short exposures of several drugs that potentially induce mitochondrial stress, they find significant CETSA shifts for the scaffold protein PEBP1 both for antimycinA and oligomycin, making PEBP1 a candidate for mitochondrial-induced ISR signaling. After extensive follow-up work, they provide good support that PEBP1 is likely involved in ISR, and possibly act through an interaction with the key ISR effector node EIF2a.
Strengths:
The work adds an important understanding of ISR signaling where PEBP1 might also constitute a druggable node to attenuate cellular stress. Although CETSA has great potential for dissecting cellular pathways, there are few studies where this has been explored, particularly with such an extensive follow-up, also giving the work methodological implications. Together I therefore think this study could have a significant impact.
Weaknesses:
The TPP/MS-CETSA experiment is quite briefly described and might have a too relaxed cut-off. The assays confirming interactions between PEBP1 and EIF2a might not be fully conclusive.
-
Reviewer #3 (Public review):
Summary:
In this paper, Chang and Meliala et al. demonstrate that PEBP1 is a modulator of the ISR, specifically through the induction of mitochondrial stress. The authors utilize thermal proteome profiling (TPP) by which they identify PEPB1 as a thermally stabilized protein upon oligomycin treatment, indicating its role in mitochondrial stress. Moreover, RNA-sequencing analysis indicated that PEBP1 may be specifically modulating the mitochondrial stress-induced ISR, as PEBP1 knock-out reduces phosphorylation of eIF2α. They also show that PEBP1 function is independent of ER stress specifically tunicamycin treatment and loss of PEBP1 does affect mitochondrial ISR but in an OMA1, DELE1 independent manner. Thus, the authors hypothesized that PEBP1 interacts directly with eIF2α, functioning as a scaffolding protein. However, direct co-immunoprecipitation failed to demonstrate PEBP1 and eIF2α potential interaction. The authors then used a NanoBiT luminescence complementation assay to show the PEBP1-eIF2a interaction and its disruption by S51 phosphorylation.
Strengths:
Taken together, this work is novel, and the data presented suggests PEBP1 has a role as a modulator of the mitochondrial ISR, enhancing the signal to elicit the necessary response.
Weaknesses:
The one major issue of this work is the lack of a mechanism showing precisely how PEBP1 amplifies the mitochondrial integrated stress response. The work, as it is described, presents data suggesting PEBP1's role in the ISR but fails to present a more conclusive mechanism.
-
Author response:
We thank all the reviewers for their insightful comments on this work.
Response to Reviewer #1:
We greatly appreciate your comments on the general reliability and significance of our work. We fully agree that it would have been ideal to have additional evidence related to the role of PEBP1 in HRI activation. Unfortunately, we have not been able to find phospho-HRI antibodies that work reliably. The literature seems to agree with this as a band shift using total-HRI antibodies is usually used to study HRI activation. However, with the cell lines showing the most robust effect with PEBP1 knockout or knockdown, we are yet to convince ourselves with the band shifts we see. This could be addressed by optimizing phos-tag gels although these gels can be a bit tricky with complex samples such as cell lysates which contain many phosphoproteins.
To address the interaction between PEBP1 and eIF2alpha more rigorously we were inspired by the insights you and reviewer #2 provided. While we are unable to do further experiments, we now think it would indeed be possible to do this with either using the purified proteins and/or CETSA WB. These experiments could also provide further evidence for the role of PEBP1 phosphorylation. Although phosphorylation of PEBP1 at S153 has been implicated as being important for other functions of PEBP1, we are not sure about its role here. It may indeed have little relevance for ISR signalling.
For the in vitro thermal shift assay, we have performed two independent experiments. While it appears that there is a slight destabilization of PEBP1 by oligomycin, the ultimate conclusion of this experiment remains incomplete as there could be alternative explanations despite the apparent simplicity of the assay due the fluorescence background by oligomycin only. We now provide a lysate based CETSA analysis which does not display the same PEBP1 stabilization as the intact cell experiment. As for the signal saturation in ATF4-luciferase reporter assay, this is a valid point.
Response to Reviewer #2:
We strongly agree that CETSA has a lot of potential to inform us about cellular state changes and this was indeed the starting point for this project. We apologize for being (too) brief with the explanations of the TPP/MS-CETSA approach and we have now added a bit more detail. With regard to the cut-offs used for the mass spectrometry analysis, you are absolutely right that we did not establish a stringent cut-off that would show the specificity of each drug treatment. Our take on the data was that using the p values (and ignoring the fold-changes) of individual protein changes as in Fig 1D, we can see that mitochondrial perturbations display a coordinated response. We now realize that the downside of this representation is that it obscures the largest and specific drug effects. As mentioned in the response to Reviewer #1, we now also think that it would be possible to obtain more evidence for the potential interaction between PEBP1 and eIF2alpha using CETSA-based assays.
Response to Reviewer #3:
Thank you for your assessment, we agree that this manuscript would have been made much stronger by having clearer mechanistic insights. As mentioned in the responses to other reviewers above, we aim to address this limitation in part by looking at the putative interaction between PEBP1 and eIF2alpha with orthogonal approaches. However, we do realize that analysis of protein-protein interactions can be notoriously challenging due to false negative and false positive findings. As with any scientific endeavor, we will keep in mind alternative explanations to the observations, which could eventually provide that cohesive model explaining how precisely PEBP1, directly or indirectly, influences ISR signalling.
Recommendations for the authors:
Reviewer #1 (Recommendations for the authors):
The data overall are very solid, and I would only recommend the following minor changes:
(1) Line 187 and line 268: there is perhaps a trend towards slightly increased ATF4-luc reporter with PEBP1-S153D, but it is not statistically significant, so I would tone down the wording here.
We now modified this part to "This data is consistent with the modest increase…" .
(2) The recently discovered SIFI complex (Haakonsen 2024, https://doi.org/10.1038/s41586023-06985-7) regulates both HRI and DELE1 through bifunctional localization/degron motifs. It seems like PEBP1 also contains such a motif, which suggests a potential mechanism for enrichment near mitochondria, perhaps even in response to stress. Maybe the authors could further speculate on this in the discussion.
While working on the manuscript, we considered the possibility that PEBP1 function could be related to SIFI complex and concluded that here is a critical difference: while SIFI specifically acts to turn off stress response signalling, loss of PEBP1 prevents eIF2alpha phosphorylation. We did not however consider that PEBP1 could have a localization/degron motif. Motif analysis by deepmito (busca.biocomp.unibo.it) and similar tools did not identify any conventional mitochondrial targeting signal although we acknowledge that PEBP1 has a terminal alpha-helix which was identified for SIFI complex recognition. We are not sure why you think PEBP1 contains such a motif and therefore are hesitant to speculate on this further in the manuscript.
(3) Line 358: references 50 and 45 are identical.
Thank you for spotting this. Corrected now.
(4) Figure S1D: it looks like Oligomycin has a significant background fluorescence, which makes interpretation of these graphs difficult - do you have measurements of the compound alone that can be used to subtract this background from the data? Based on the Tm I would say it does stabilize recombinant PEBP1, and there is no quantification of the variance across the 3 replicates to say there is no difference.
You are right, this assay is problematic due to the background fluorescence. The measurements with oligomycin only and subtracting this background results in slightly negative values and nonsensical thermal shift curves. We now additionally show quantification from two different experiments (unfortunately we ran out of reagents for further experiments), and this quantification shows that if anything, oligomycin causes mild destabilization of recombinant PEBP1. We also used lysate CETSA assay which does not show thermal stabilization of PEBP1 by oligomycin, ruling out a direct effect. We attempted to use ferrostatin1 as a positive control as it may bind PEBP1-ALOX protein complex, and it appeared to show marginal stabilization of PEBP1.
Reviewer #2 (Recommendations for the authors):
I have a few comments for the authors to address:
(1) The MS-CETSA experiment is quite briefly described and this could be expanded somewhat. Not clear if multiple biological replicates are used. Is there any cutoff in data analysis based on fold change size (which correlated to the significance of cellular effects), etc? As expected from only one early timepoint (see eg PMID: 38328090), there appear to be a limited number of significant shifts over the background (as judged from Figure S1A). In the Excel result file, however (if I read it right) there are large numbers of proteins that are assigned as stabilized or destabilized. This might be to mark the direction of potential shifts, but considering that most of these are likely not hits, this labeling could give a false impression. Could be good to revisit this and have a column for what could be considered significant hits, where a fold change cutoff could help in selecting the most biologically relevant hits. This would allow Figure 1D to be made crisper when it likely dramatically overestimates the overlap between significant CETSA shifts for these drugs.
Fair point, while we focused more on PEBP1, it is important to have sufficient description of the methods. We used duplicate samples for the MS, which is probably the most important point which was absent from the original submission as is now added to the methods. We also added slightly more description on the data analysis. While the AID method does not explicitly use log2 fold changes, it does consider the relative abundance of proteins under different temperature fractions. Since the Tm (melting temperature) for each protein can be at any temperature, we felt that if would be complicated to compare fractions where the protein stability is changed the most and even more so if we consider both significance and log2FC. Therefore, we used this multivariate approach which indicates the proteins with most likely changes across the range of temperatures. To acknowledge that most of the statistically significant changes are not the much over the background as you correctly pointed out, we now add to the main text that “However, most of these changes are relatively small. To focus our analysis on the most significant and biologically relevant changes…” We also agree that it may be confusing that the AID output reports de/stabilization direction for all proteins. In general, we are not big fans of cutoffs as these are always arbitrary, but with multivariate p value of 0.1 it becomes clear that there are only a relatively small number of hits with larger changes. We have now added to the guide in the data sheet that "Primarily, use the adjusted p value of the log10 Multivariate normal pvalue for selecting the overall statistically significant hits (p<0.05 equals -1.30 or smaller; p<0.01 equals -2 or smaller)". We have also added to the guide part of the table that “Note that this prediction does not consider whether the change is significant or not, it only shows the direction of change”
(2) On page 4 the authors state "We reasoned that thermal stability of proteins might be particularly interesting in the context of mitochondrial metabolism as temperature-sensitive fluorescent probes suggest that mitochondrial temperature in metabolically active cells is close to 50{degree sign}C". I don't see the relevance of this statement as an argument for using TPP/CETSA. When this is also not further addressed in the work, it could be deleted.
Deleted. We agree, while this is an interesting point, it is not that relevant in this paper.
(3) To exclude direct drug binding to PEBP1, a thermofluor experiment is performed (Fig S1D). However, the experiment gives a high background at the lower temperatures and it could be argued that this is due to the flouroprobe binding to a hydrophobic pocket of the protein, and that oligomycin at higher concentrations competes with this binding, attenuating fluorescence. These are complex experiments and there could be other explanations, but the authors should address this. An alternative means to provide support for non-binding would be a lysate CETSA experiment, with very short (1-3 minutes) drug exposure before heating. This would typically give a shift when the protein is indicated to be CETSA responsive as in this case.
Agree. However, we don't have good means to perform the thermofluor experiments to rule out alternative explanations. What we can say is (as discussed above for reviewer #1, point 4) that quantification from two different experiments shows that oligomycin is does not thermally stabilizing recombinant PEBP1. To complement this conclusion, we used lysate CETSA assay which does not show thermal stabilization of PEBP1 by oligomycin. In this assay we attempted to use ferrostatin1 as a positive control as it may bind PEBP1-ALOX protein complex, and it appeared to show marginal stabilization of PEBP1. But since we lack a robust positive control for these assays, some doubt will inevitably remain.
(4) The authors appear to have missed that there is already a MS-CETSA study in the literature on oligomycin, from Sun et al (PMID: 30925293). Although this data is from a different cell line and at a slightly longer drug treatment and is primarily used to access intracellular effects of decreased ATP levels induced by oligomycin, the authors should refer to this data and maybe address similarities if any.
Apologies for the oversight, the oligomycin data from this paper eluded us at it was mainly presented in the supplementary data. We compared the two datasets and find found some overlap despite the differences in the experimental details. Both datasets share translational components (e.g. EIF6 and ribosomal proteins), but most notably our other top hit BANF1 which we mentioned in the main text was also identified by Sun et al. We have updated the manuscript text as "Other proteins affected by oligomycin included BANF1, which binds DNA in an ATP dependent manner [16], and has also identified as an oligomycin stabilized protein in a previous MS-CETA experiment [23]", citing the Sun et al paper.
(5) The confirmation of protein-protein interaction is notoriously prone to false positives. The authors need to use overexpression and a sensitive reporter to get positive data but collect additional data using mutants which provide further support. Typically, this would be enough to confirm an interaction in the literature, although some doubt easily lingers. When the authors already have a stringent in-cell interaction assay for PEBP1 in the CETSA thermal shift, it would be very elegant to also apply the CETSA WB assay to the overexpressed constructs and demonstrate differences in the response of oligomycin, including the mutants. I am not sure this is feasible but it should be straightforward to test.
This is a very good suggestion. Unfortunately, due to the time constraints of the graduate students (who must write up their thesis very soon), we are not able to perform and repeat such experiments to the level of confidence that we would like.
(6) At places the story could be hard to follow, partly due to the frequent introduction of new compounds, with not always well-stated rationale. It could be useful to have a table also in the main manuscript with all the compounds used, with the rationale for their use stated. Although some of the cellular pathways addressed are shown in miniatures in figures, it could be useful to have an introduction figure for the known ISR pathways, at least in the supplement. There are also a number of typos to correct.
We agree that there are many compounds used. We have attempted to clarify their use by adding this information into the table of used compounds in the methods and adding an overall schematic to Fig S1G and a note on line 132 "(see Figure 1-figure supplement 1G for summary of drugs used to target PEBP1 and ISR in this manuscript). We have also attempted to remove typos as far as possible.
(7) EIF2a phosphorylation in S1E does not appear to be more significant for Sodium Arsenite argued to be a positive control, than CCCP, which is argued to be negative. Maybe enough with one positive control in this figure?
This experiment was used as a justification for our 30 min time point for the proteomics. By showing the 30 min and 4 h time points as Fig 1G and Figure 1-figure supplement 1F, our point was to demonstrate that the kinetics of phosphorylation and dephosphorylation are relevant. As you correctly pointed out, the stress response induced by sodium arsenite, but also tunicamycin is already attenuated at the 4h time point. We prefer to keep all samples to facilitate comparisons.
(8) Page 7 reference to Figure S2H, which doesn't exist. Should be S3H.
Apologies for the mistake, now corrected to Figure 2-figure supplement 1B.
(9) Finally, although the TPP labeling of the method is used widely in the literature this is CETSA with MS detection and MS-CETSA is a better term. This is about thermal shifts of individual proteins which is a very well-established biophysical concept. In contrast, the term Thermal Proteome Profiling does not relate to any biophysical concept, or real cell biology concept, as far as I can see, and is a partly misguided term.
We changed the term TPP into MS-CETSA, but also include the term TPP in the introduction to facilitate finding this paper by people using the TPP term.
Reviewer #3 (Recommendations for the authors):
Major Issues
(1) The one major issue of this work is the lack of a mechanism showing precisely how PEBP1 amplifies the mitochondrial integrated stress response. The work, as it is described, presents data suggesting PEBP1's role in the ISR but fails to present a more conclusive mechanism. The idea of mitochondrial stress causing PEBP1 to bind to eIF2a, amplifying ISR is somewhat vague. Thus, the lack of a more defined model considerably weakens the argument, as the data is largely corollary, showing KO and modulation of PEBP1 definitely has a unique effect on the ISR, however, it is not conclusive proof of what the authors claim. While KO of PEBP1 diminishes the phosphorylation of eIF2a, taken together with the binding to eIF2a, different pathways could be simultaneously activated, and it seems premature to surmise that PEBP1 is specific to mitochondrial stress. Could PEBP1 be reacting to decreased ATP? Release of a protein from the mitochondria in response to stress? Is PEBP1's primary role as a modulator of the ISR, or does it have a role in non-stress-related translation? A cohesive model would tie together these separate indirect findings and constitute a considerable discovery for the ISR field, and the mitochondrial stress field.
Thank you for your assessment, we agree that this manuscript would have been much stronger by having clearer mechanistic insights. As with any scientific endeavor, we will keep in mind alternative explanations to the observations, which could eventually provide that cohesive model explaining how precisely PEBP1, directly or indirectly, influences ISR signalling.
(2) The data relies on the initial identification of PEBP1 thermal stabilization concomitant with mitochondrial ISR induction post-treatment of several small molecules. However, the experiment was performed using a single timepoint of 30 minutes. There was no specific rationale for the choice of this time point for the thermal proteome profiling.
The reasoning for this was explicitly stated: "We reasoned that treating intact cells with the drugs for only 30 min would allow us to observe rapid and direct effects related to metabolic flux and/or signaling related to mitochondrial dysfunction in the absence of major changes in protein expression levels.”
Minor Issues
(1) In Lines 163-166 the authors state "The cells from Pebp1 KO animals displayed reduced expression of common ISR genes (Figure 2F), despite upregulation of unfolded protein response genes Ern1 (Ire1α) and Atf6 genes. This gene expression data therefore suggests that Pebp1 knockout in vivo suppresses induction of the ISR". This statement should be reassessed. While an arm of the UPR does stimulate ISR, this arm is controlled by PERK, and canonically IRE1 and ATF6 do not typically activate the ISR, thus their upregulation is likely unrelated to ISR activation and does not contribute the evidence necessary for this statement.
Apologies for the confusion, we aimed to highlight that as there is an increase in the two UPR arms, it is more likely that ISR instead of UPR is reduced. We have now changed the statement to the following:
"The cells from Pebp1 PEBP1 KO animals displayed reduced expression of common ISR genes (Figure 2F), while there was mild upregulation of the unfolded protein response genes Ern1 (Ire1α) and Atf6 genes. This gene expression data therefore suggests that the reduced expression of common ISR genes is less likely to be mediated by changes in PERK, the third UPR arm, and more likely due to suppression of ISR by Pebp1 knockout in vivo."
(2) In Lines 169 and 170 the authors state "Western blotting indicated reduced phosphorylation of eIF2α in RPE1 cells lacking PEBP1, suggesting that PEBP1 is involved in regulating ISR signaling between mitochondria and eIF2α". This conclusion is not supported by evidence. A number of pathways could be activated in these knockout cells, and simply observing an increase in p-eIF2α after knocking out PEBP1 does not constitute an interaction, as correlation doesn't mean causation. This KO could indirectly affect the ISR, with PEBP1 having no role in the ISR. While taken together there is enough circumstantial evidence in the manuscript to suggest a role for PEBP1 in the ISR, statements such as these have to be revised so as not to overreach the conclusions that can be achieved from the data, especially with no discernible mechanism.
We have now revised this statement by removing the conclusion and stating only the observation: "Western blotting indicated reduced phosphorylation of eIF2α in RPE1 cells lacking PEBP1 (Fig. 3A)."
-
-
www.biorxiv.org www.biorxiv.org
-
eLife Assessment
This manuscript provides fundamental studies to gain insight into the mutations in the presenilin-1 (PSEN1) gene on proteolytic processing of the amyloid precursor protein (APP). The authors provide compelling evidence using mutations in PSEN to understand what drives alternative substrate turnover with convincing data and rigorous analysis. This deep mechanistic study provides a framework towards the development of small molecule inhibitors to treat AD.
-
Reviewer #1 (Public review):
Summary:
Arafi et al. present results of studies designed to better understand the effects of mutations in the presenilin-1 (PSEN1) gene on proteolytic processing of the amyloid precursor protein (APP). This is important because APP processing can result in the production of the amyloid β-protein (Aβ), a key pathologic protein in Alzheimer's disease (AD). Aβ exists in various forms that differ in amino acid sequence and assembly state. The predominant forms of Aβ are Aβ40 and Aβ42, which are 40 and 42 amino acids in length, respectively. Shorter and longer forms derive from processive proteolysis of the Aβ region of APP by the heterotetramer β-secretase, within which presenilin 1 possesses the active site of the enzyme. Each form may become toxic if it assembles into non-natively folded, oligomeric, or fibrillar structures. A deep mechanistic understanding of enzyme-substrate interactions is a first step toward the design and successful use of small-molecule therapeutics for AD.
The key finding of Arafi et al. is that PSEN1 amino acid sequence is a major determinant of enzyme turnover number and the diversity of products. For the biochemist, this may not be surprising, but in the context of understanding and treating AD, it is immense because it shifts the paradigm from targeting the results of γ-secretase action, viz., Aβ oligomers and fibrils, to targeting initial Aβ production at the molecular level. It is the equivalent of taking cancer treatment from simple removal of tumorous tissue to the prevention of tumor formation and growth. Arafi et al. have provided us with a blueprint for the design of small-molecule inhibitors of γ-secretase. The significance of this achievement cannot be overstated.
Strengths and weaknesses:
The comprehensiveness and rigor of the study are notable. Rarely have I reviewed a manuscript reporting results of so many orthogonal experiments, all of which support the authors' hypotheses, and of so many excellent controls. In addition, as found in clinical trial reports, the limitations of the study were discussed explicitly. None of these significantly affected the conclusions of the study.
Some minor concerns were expressed during the review process. The authors have revised the manuscript, and in doing so, dealt appropriately with the concerns and strengthened the manuscript.
-
Reviewer #2 (Public review):
Summary:
The work by Arafi et al. show the effect of Familial Alzheimer's Disease presenilin-1 mutants on endoproteinase and carboxylase activity. They have elegantly demonstrated how some of mutants alter each step of processing. Together with FLIM experiments, this study provides additional evidence to support their 'stalled complex hypotheses'.
Strengths:
This is a beautiful biochemical work. The approach is comprehensive.
Weaknesses:
However, the novelty of this manuscript is questionable since this group has published similar work with different mutants (Ref 11) .
-
Author response:
The following is the authors’ response to the original reviews.
comprehensiveness and rigor of the study are notable. Rarely have I reviewed a manuscript reporting the results of so many orthogonal experiments, all of which support the authors' hypotheses, and of so many excellent controls.” Reviewer 2 commented: “They have elegantly demonstrated how some mutants alter each step of processing. Together with FLIM experiments, this study provides additional evidence to support their 'stalled complex hypotheses'….This is a beautiful biochemical work. The approach is comprehensive.”
Below we respond to the relatively minor concerns of Reviewer 2, which may be included with the first version of the Reviewed Preprint.
Reviewer 2:
(1) It appears that the purified γ-secretase complex generates the same amount of Aβ40 and Aβ42, which is quite different in cellular and biochemical studies. Is there any explanation for this?
Roughly equal production of Aβ40 and Aβ42 is a phenomenon seen with purified enzyme assays, and the reason for this has not been identified. However, we suggest that what is meaningful in our studies is the relative difference between the effects of FAD-mutant vs. WT PSEN1 on each proteolytic processing step. All FAD mutations are deficient in multiple cleavage steps in γsecretase processing of APP substrate, and these deficiencies correlate with stabilization of E-S complexes.
(2) It has been reported the Aβ production lines from Aβ49 and Aβ48 can be crossed with various combinations (PMID: 23291095 and PMID: 38843321). How does the production line crossing impact the interpretation of this work?
In the cited reports, such crossover was observed when using synthetic Aβ intermediates as substrate. In PMID 2391095 (Okochi M et al, Cell Rep, 2013), Aβ43 is primarily converted to Aβ40, but also to some extent to Aβ38. In PMID: 38843321 (Guo X et al, Science, 2024), Aβ48 is ultimately converted to Aβ42, but also to a minor degree to Aβ40. We have likewise reported such product line “crossover” with synthetic Aβ intermediates (PMID: 25239621; Fernandez MA et al, JBC, 2014). However, when using APP C99-based substrate, we did not detect any noncanonical tri- and tetrapeptide co-products of Aβ trimming events in the LC-MS/MS analyses (PMID: 33450230; Devkota S et al, JBC, 2021). In the original report on identification of the small peptide coproducts for C99 processing by γ-secretase using LC-MS/MS (PMID: 19828817; Takami M et al, J Neurosci, 2009), only very low levels of noncanonical peptides were observed. In the present study, we did not search for such noncanonical trimming coproducts, so we cannot rule out some degree of product line crossover.
(3) In Figure 5, did the authors look at the protein levels of PS1 mutations and C99-720, as well as secreted Aβ species? Do the different amounts of PS1 full-length and PS1-NTF/CTF influence FILM results?
FLIM results depend on the degree that C99 and long Aβ intermediates are bound to γ-secretase compared to unbound C99 and Aβ. The 6E10-Alexa 488 lifetime is significantly decreased by FAD mutations compared to WT PSEN1 (Fig. 5). However, the observed decrease in lifetime with the PSEN1 FAD mutants might also be due to lower levels of C99-720 expression or higher levels of PSEN1 CTF (i.e., mature γ-secretase complexes). We checked the C99-720 fluorescence intensities in the FLIM experiments and found that C99-720 intensities are not significantly different between cells transfected with WT and those with FAD PSEN1. Furthermore, Western blot analysis shows that levels of C99-720 are not significantly low and those of PSEN1 CTF are not high in FAD PSEN1 compared to WT PSEN1 expressing cells. Although PSEN1 CTF levels trend low for PSEN1 F386S, this mutant resulted in decreased FLIM only in Aβ-rich regions. Thus, the reduced FLIM apparently reflects effects of FAD mutation on E-S complex stability. Levels of full-length PSEN1 were also determined and found not to correlated with FLIM effects, although full-length PSEN1 represents protein not incorporated into full active γ-secretase complexes and therefore does not interact with C99-720.
(4) It is interesting that both Aβ40 and Aβ42 Elisa kits detect Aβ43. Have the authors tested other kits in the market? It might change the interpretation of some published work.
We have not tested other ELISA kits. Considering our findings, it would be a good idea for other investigators to test whatever ELISAs they use for specificity vis-à-vis Aβ43.
-
-
www.biorxiv.org www.biorxiv.org
-
eLife assessment
The identification of NCS1 as a distal appendage protein that captures preciliary vesicles has important implications for understanding the early steps of ciliary assembly. Furthermore, the work has important implications for the broader understanding of NCS1, which prior to this work was focused on roles in neurotransmission, but now must be considered in a broader context. The investigators used a variety of state-of-the-art methodologies, and the conclusions are convincingly supported by the experimental data. This work will be of interest to cell biologists studying ciliary assembly, human geneticists exploring the pathology of cilia as well as neurobiologists studying NCS1.
-
Reviewer #1 (Public Review):
In this work, Kanie and colleagues explored the role of NCS1 in capturing the ciliary vesicle. The microscopy was well executed and appropriately quantified. The authors convincingly show that while NCS1 is important for capturing the ciliary vesicle, another unknown distal appendage component is partially redundant in that ciliary vesicle capture and ciliary assembly are not fully dependent on NCS1. Overall, I am convinced by the data, and my only concern is that the discussion of the mouse phenotypes does not do a good job of putting this gene into the greater context of the complexity of mouse mutations.
Interestingly NCS1 has been previously studied in the context of neurotransmission and the new findings raise questions about whether prior findings are actually due to neuronal cilia defects.
-
Reviewer #2 (Public Review):
Kanie et al have recently characterized DAP protein CEP89 as important for the recruitment of the ciliary vesicle. Here, they describe a novel interacting partner for CEP89 that can bind membranes and therefore mediates its role in ciliary vesicle recruitment. An initial LAP tag pull-down and mass spectrometry experiment finds NCS-1 and C3ORF14 as CEP89 interactors. This interaction is mapped in the context of the ciliary vesicle formation. From the data presented, it is clear that, upon knockout, the function of these proteins might be compensated by others, as the phenotype can eventually recover over time.
In terms of the biological significance of this interaction, it would be good to examine (via co-immunoprecipitation) whether the CEP89/NCS-1/C3ORF14 interaction takes place upon serum starvation. Does the complex change?
Also, for the subdistal appendage localization of NCS-1 and C3ORF14, would this also change upon serum starvation?
For the ciliation results and the recruitment of IFT88 in CEP89 knockout cell lines, this contradicts previous work from Tanos et al (PMID: 23348840), as well as Hou et al (PMID: 36669498). A parallel comparison using siRNA, a transient knockout system, or a degron system would help understand this. A similar point goes for Figure 4, where the effect on ciliogenesis is minimal in knockout cells, but acute siRNA has been shown to have a stronger phenotype.
An elegant phenotype rescue is shown in Figure 5. An interesting question would be, how does this mutant and/or the myristoylation affect the recruitment of C3ORF14?
For the EF-hand mutants, it would be good to use control mutants, from known Ca2+ binding proteins as a control for the experiment shown.
-
Reviewer #3 (Public Review):
This work addresses an important question aimed at understanding how membrane docking to the distal appendages is regulated during ciliogenesis. In this study, Tomoharu and colleagues identified interactions between CEP89 (important for RAB34-positive membrane localization to the mother centriole) and NCS1 and C3ORF14. Both these CEP89 interacting proteins were characterized as distal appendage localized proteins between CEP89 and RAB34 based on super-resolution microscopy. Ciliogenesis investigations using knockout cells indicated that NCS1 and CEP89 have similar impaired ciliation due to disruption in vesicle recruitment/RAB34 to the mother centriole, while C3ORF14 had less effect on ciliogenesis. The authors refer to the ciliogenesis requirement for CEP89/NCS1 as ciliary vesicles, which has been previously referred to as preciliary vesicle or distal appendage vesicles. NCS1 distal appendage localization was dependent on CEP89 and TTBK2, but it is not clear how TTBK2 affects NCS1. The authors subsequently performed double knockouts with NCS1 and other distal appendage proteins and showed stronger effects on mother centriole RAB34 levels, suggesting efficient membrane docking during ciliogenesis requires several distal appendage proteins. This is consistent with NCS1 knockout mice which do not display typical ciliopathy phenotypes. These mice do display obesity, which is associated with cilia dysfunction, and show reduced ciliary protein levels. As noted by the authors, the in vivo results for NCS1 knockouts could be affected by the mouse background which was not evaluated. The authors demonstrate the NCS1 myristoylation motif is required for RAB34 localization to the mother centrioles, providing a mechanistic explanation for how distal appendage proteins could interact with membranes during ciliogenesis. Overall the authors' findings support an important role for NCS1 in regulating ciliogenesis via myristoylation-dependent interaction with RAB34-positive membranes docked at the mother centriole.
-
Author response:
Reviewer #2 (Public Review):
Comment 1: In terms of the biological significance of this interaction, it would be good to examine (via co-immunoprecipitation) whether the CEP89/NCS-1/C3ORF14 interaction takes place upon serum starvation. Does the complex change?
NCS1 centriolar localization requires CEP89 as no NCS1 localization was observed in CEP89 knockout cells (Figure 2L; Figure 2-figure supplement 2B). Both CEP89 and NCS1 centriolar localization were observed (Figure 2C; Figure 1D of the PMID: 36711481) in cells grown in serum containing media, although their localization was further enhanced in serum starved cells. From these results, we predict that CEP89 and NCS1 can interact and colocalize in both serum-fed and serum-depleted condition. We think it may not be easy to assess the change in interaction with the co-immunoprecipitation assay, as interactions occur in a test tube, which may not reflect the binding condition inside the cells.
Comment 2: Also, for the subdistal appendage localization of NCS-1 and C3ORF14, would this also change upon serum starvation?
We agree that it would be interesting to see whether the subdistal appendage localization changes upon serum starvation, as NCS1 may capture the ciliary vesicle at the subdistal appendages as we discussed. However, the loss of the subdistal appendage protein, CEP128, blocks subdistal appendage localization of CEP89 [PMID: 32242819] without affecting cilium formation [PMID: 27818179]. This suggests that the subdistal appendage localization of NCS1 or C3ORF14 is likely dispensable for cilium formation.
Comment 3: For the ciliation results and the recruitment of IFT88 in CEP89 knockout cell lines, this contradicts previous work from Tanos et al (PMID: 23348840), as well as Hou et al (PMID: 36669498). A parallel comparison using siRNA, a transient knockout system, or a degron system would help understand this. A similar point goes for Figure 4, where the effect on ciliogenesis is minimal in knockout cells, but acute siRNA has been shown to have a stronger phenotype.
Hou et al. [PMID: 36669498] investigated the role of distal appendage proteins, CEP164, CEP89, and FBF1 in the ciliated chordotonal organ of Drosophila melanogaster by generating knockout Drosophila strains. The results were markedly different from what was observed in mammalian cells. Notably, CEP164 is not required for cilium formation, and CEP89 is required for FBF1 localization in the animal. CEP89 was required for cilium formation in the cells in the ciliated chordotonal organ, of which cilium formation is dependent on IFT machinery. They did not show if IFT centriolar recruitment is affected in the CEP89 mutant cells. These differences likely reflect the divergence of the organization of distal appendage during evolution.
The ciliation phenotype of our CEP89 knockout cells are milder than what was shown in Tanos et al [PMID: 23348840], but largely consistent with the results from Bornens group, which used siRNA to deplete CEP89 [PMID: 23789104]. Besides, NCS1 knockout cells showed very similar phenotype to the CEP89 knockout cells, and relatively acute deletion of NCS1 (14 days after infection of the lenti-virus containing sgNCS1 without single-cell cloning) displayed an almost identical ciliation defect (Figure 4B-C). Thus, we believe CEP89 is only partially required for cilium formation in RPE-hTERT cells and that the differences are more technical than definitive.
Comment 4: An elegant phenotype rescue is shown in Figure 5. An interesting question would be, how does this mutant and/or the myristoylation affect the recruitment of C3ORF14?
NCS1 is not required for the localization of C3ORF14 (Figure 2M; Figure 2- figure supplement 2C), so we can assume that the myristoylation defective mutant does not affect C3ORF14 recruitment.
Comment 5: For the EF-hand mutants, it would be good to use control mutants, from known Ca2+ binding proteins as a control for the experiment shown.
In the Figure 5-figure supplement 1A-C, we generated a series of EF-hand mutant of NCS1 to see if the calcium binding affects the CEP89 interaction, NCS1 localization, and cilium formation. NCS1 is only protein among the calcium binding NCS family proteins that was found as a positive hit in the mass spec data of CEP89 tandem affinity purification. Therefore, we cannot use other NCS1 family proteins as a control for CEP89 binding, NCS1 localization, and cilium formation.
-
-
www.biorxiv.org www.biorxiv.org
-
eLife Assessment
This fundamental work substantially advances our understanding of how the glycocalyx of cells provide a non-specific barrier for the interaction of viruses with cell-surface receptors. Using both in vitro experiments and in vivo manipulations they provide solid evidence for the properties of the glycocalyx to serve as an energy barrier as a main attribute of its mode of action. The work will be of broad interest to virologists and the cell biology community that studies host-pathogen interactions.
-
Joint Public Review:
This manuscript tests the notion that bulky membrane glycoproteins suppress viral infection through non-specific interactions. Using a suite of biochemical, biophysical, and computational methods in multiple contexts (ex vivo, in vitro, and in silico), the authors collect evidence supporting the notion that (1) a wide range of surface glycoproteins erect an energy barrier for the virus to form stable adhesive interface needed for fusion and uptake and (2) the total amount of glycan, independent of their molecular identity, additively enhanced the suppression.
As a functional assay the authors focus on viral infection starting from the assumption that a physical boundary modulated by overexpressing a protein-of-interest could prevent viral entry and subsequent infection. Here they find that glycan content (measured using the PNA lectin) of the overexpressed protein and total molecular weight, that includes amino acid weight and the glycan weight, is negatively correlated with viral infection. They continue to demonstrate that it is in effect the total glycan content, using a variety of lectin labelling, that is responsible for reduced infection in cells. Because the authors do not find a loss in virus binding this allows them to hypothesize that the glycan content presents a barrier for the stable membrane-membrane contact between virus and cell. They subsequently set out to determine the effective radius of the proteins at the membrane and demonstrate that on a supported lipid bilayer the glycosylated proteins do not transition from the mushroom to the brush regime at the densities used. Finally, using Super Resolution microscopy they find that above an effective radius of 5 nm proteins are excluded from the virus-cell interface.
The experimental design does not present major concerns and the results provide insight on a biophysical mechanism according to which, repulsion forces between branched glycan chains of highly glycosylated proteins exert a kinetic energy barrier that limits the formation of a membrane/viral interface required for infection.
However several general and specific concerns remain that the author is recommended to address before their claims as above are compelling.
GENERAL QUESTIONS:
(1) For many enveloped viruses, the attachment factors - paradoxically - are also surface glycoproteins, often complexed with a distinct fusion protein. The authors note here that the glycoportiens do not inhibit the initial binding, but only limit the stability of the adhesive interface needed for subsequent membrane fusion and viral uptake. How these antagonistic tendencies might play out should be discussed.
(2) Unlike polymers tethered to solid surface undergoing mushroom-to-brush transition in density-dependent manner, the glycoproteins at the cell surface are of course mobile (presumably in a density-dependent manner). They can thus redistribute in spatial patterns, which serve to minimize the free energy. I suggest the authors explicitly address how these considerations influence the in vitro reconstitution assays seeking to assess the glycosylation-dependent protein packing.
(3) The discussion of the role of excluded volume in steric repulsion between glycoprotein needs clarification. As presented, it's unclear what the role of "excluded volume" effects is in driving steric repulsion? Do the authors imply depletion forces? Or the volume unavailable due to stochastic configurations of gaussian chains? How does the formalism apply to branched membrane glycoproteins is not immediately obvious.
(4) The authors showed that glycoprotein expression inversely correlated with viral infection and link viral entry inhibition to steric hindrance caused by the glycoprotein. Alternative explanations would be that the glycoprotein expression (a) reroutes endocytosed viral particles or (b) lowers cellular endocytic rates and via either mechanism reduce viral infection. The authors should provide evidence that these alternatives are not occurring in their system. They could for example experimentally test whether non-specific endocytosis is still operational at similar levels, measured with fluid-phase markers such as 10kDa dextrans.
(5) The authors approach their system with the goal of generalizing the cell membrane (the cumulative effect of all cell membrane molecules on viral entry), but what about the inverse? How does the nature of the molecule seeking entry affect the interface? For example, a lipid nanoparticle vs a virus with a short virus-cell distance vs a virus with a large virus-cell distance?
SPECIFIC QUESTIONS:
(1) The proposed mechanism indicates that glycosylation status does not produce an effect in the "trapping" of virus, but in later stages of the formation of the virus/membrane interface due to the high energetic costs of displacing highly glycosylated molecules at the vicinity of the virus/membrane interface. It is suggested to present a correlation between the levels of glycans in the Calu-3 cell monolayers and the number of viral particles bound to cell surface at different pulse times. Results may be quantified following the same method as shown in Figure 2 for the correlation between glycosylation levels and viral infection (in this case the resulting output could be number of viral particles bound as a function of glycan content).
(2) The use of the purified glycosylated and non-glycosylated ectodomains of MUC1 and CD-43 to establish a relationship between glycosylation and protein density into lipid bilayers on silica beads is an elegant approach. An assessment of the impact of glycosylation in the structural conformation of both proteins, for instance determining the Flory radius of the glycosylated and non-glycosylated ectodomains by the FRET-FLIM approach used in Figure 4 would serve to further support the hypothesis of the article.
(3) The MUC1 glycoprotein is reported to have a dramatic effect in reducing viral infection shown in Fig 1F. On the contrary, in a different experiment shown in Fig2D and Fig2H MUC1 has almost no effect in reducing viral infection. It is not clear how these two findings can be compatible.
(4) Why is there a shift in the use of the glycan marker? How does this affect the conclusions? For the infection correlation relating protein expression with glycan content the PNA-lectin was used together with flow cytometry. For imaging the infection and correlating with glycan content the SSA-lectin is used.
(5) The authors in several instances comment on the relevance and importance of the total glycan content. Nevertheless, these conclusions are often drawn when using only one glycan-binding lectin. In fact, the anti-correlation with viral infection is distinct for the various lectins (Fig 2D and Fig 2H). Would it make more sense to use a combination of lectins to get a full glycan spectrum?
(6) Fig 3A shows virus binding to HEK cells upon MUC1 expression. Please provide the surface expression of the MUC1 so that the data can be compared to Fig 1F. Nevertheless, it is not clear why the authors used MUC expression as a parameter to assess virus binding. Alternatively, more conclusive data supporting the hypothesis would be the absence of a correlation between total glycan content and virus binding capacity.
(7) While the use of the Flory model could provide a simplification for a (disordered) flexible structure such as MUC1, where the number of amino acids equals N in the Flory model, this generalisation will not hold for all the proteins. Because folding will dramatically change the effective polypeptide chain-length and reduce available positioning of the amino acids, something the authors clearly measured (Fig 4G), this generalisation is not correct. In fact, the generalisation does not seem to be required because the authors provide an estimation for the effective Flory radius using their FRET approach
-
-
www.biorxiv.org www.biorxiv.org
-
eLife Assessment
This manuscript reports valuable findings on the role of the Srs2 protein in turning off the DNA damage signaling response initiated by Mec1 (human ATR) kinase. The data provide solid evidence that Srs2 interaction with PCNA and ensuing SUMO modification is required for checkpoint downregulation. However, while the model that Srs2 acts at gaps after camptothecin-induced DNA damage is reasonable, direct experimental evidence for this is currently lacking. The work will be of interest to cell biologists studying genome integrity.
-
Reviewer #1 (Public review):
Overall, the data presented in this manuscript is of good quality. Understanding how cells control RPA loading on ssDNA is crucial to understanding DNA damage responses and genome maintenance mechanisms. The authors used genetic approaches to show that disrupting PCNA binding and SUMOylation of Srs2 can rescue the CPT sensitivity of rfa1 mutants with reduced affinity for ssDNA. In addition, the authors find that SUMOylation of Srs2 depends on binding to PCNA and the presence of Mec1.
Comments on revisions:
I am satisfied with the revisions made by the authors, which helped clarify some points that were confusing in the initial submission.
-
Reviewer #2 (Public review):
This revised manuscript mostly addresses previous concerns by doubling down on the model without providing additional direct evidence of interactions between Srs2 and PCNA, and that "precise sites of Srs2 actions in the genome remain to be determined." One additional Srs2 allele has been examined, showing some effect in combination with rfa1-zm2.
Many of the conclusions are based on reasonable assumptions about the consequences of various mutations, but direct evidence of changes in Srs2 association with PNCA or other interactors is still missing. There is an assumption that a deletion of a Rad51-interacting domain or a PCNA-interacting domain have no pleiotropic effects, which may not be the case. How SLX4 might interact with Srs2 is unclear to me, again assuming that the SLX4 defect is "surgical" - removing only one of its many interactions.
One point of concern is the use of t-tests without some sort of correction for multiple comparisons - in several figures. I'm quite sceptical about some of the p < 0.05 calls surviving a Bonferroni correction. Also in 4B, which comparison is **? Also, admittedly by eye, the changes in "active" Rad53 seem much greater than 5x. (also in Fig. 3, normalizing to a non-WT sample seems odd).
What is the WT doubling time for this strain? From the FACS it seems as if in 2 h the cells have completed more than 1 complete cell cycle. Also in 5D. Seems fast...
I have one over-arching confusion. Srs2 was shown initially to remove Rad51 from ssDNA and the suppression of some of srs2's defects by deleting rad51 made a nice, compact story, though exactly how srs2's "suppression of rad6" fit in isn't so clear (since Rad6 ties into Rad18 and into PCNA ubiquitylation and into PCNA SUMOylation). Now Srs2 is invoked to remove RPA. It seems to me that any model needs to explain how Srs2 can be doing both. I assume that if RPA and Rad51 are both removed from the same ssDNA, the ssDNA will be "trashed" as suggested by Symington's RPA depletion experiments. So building a model that accounts for selective Srs2 action at only some ssDNA regions might be enhanced by also explaining how Rad51 fits into this scheme.
As a previous reviewer has pointed out, CPT creates multiple forms of damage. Foiani showed that 4NQO would activate the Mec1/Rad53 checkpoint in G1- arrested cells, presumably because there would be single-strand gaps but no DSBs. Whether this would be a way to look specifically at one type of damage is worth considering; but UV might be a simpler way to look.
As also noted, the effects on the checkpoint and on viability are quite modest. Because it isn't clear (at least to me) why rfa1 mutants are so sensitive to CPT, it's hard for me to understand how srs2-zm2 has a modest suppressive effect: is it by changing the checkpoint response or facilitating repair or both? Or how srs2-3KR or srs2-dPIM differ from Rfa1-zm2 in this respect. The authors seem to lump all these small suppressions under the rubric of "proper levels of RPA-ssDNA" but there are no assays that directly get at this. This is the biggest limitation.
Srs2 has also been implicated as a helicase in dissolving "toxic joint molecules" (Elango et al. 2017). Whether this activity is changed by any of the mutants (or by mutations in Rfa1) is unclear. In their paper, Elango writes: "Rare survivors in the absence of Srs2 rely on structure-specific endonucleases, Mus81 and Yen1, that resolve toxic joint-molecules" Given the involvement of SLX4, perhaps the authors should examine the roles of structure-specific nucleases in CPT survival?
Experiments that might clarify some of these ambiguities are proposed to be done in the future. For now, we have a number of very interesting interactions that may be understood in terms of a model that supposes discriminating among gaps and ssDNA extensions by the presence of PCNA, perhaps modified by SUMO. As noted above, it would be useful to think about the relation to Rad6.
-
Reviewer #3 (Public review):
The superfamily I 3'-5' DNA helicase Srs2 is well known for its role as an anti-recombinase, stripping Rad51 from ssDNA, as well as an anti-crossover factor, dissociating extended D-loops and favoring non-crossover outcome during recombination. In addition, Srs2 plays a key role in in ribonucleotide excision repair. Besides DNA repair defects, srs2 mutants also show a reduced recovery after DNA damage that is related to its role in downregulating the DNA damage signaling or checkpoint response. Recent work from the Zhao laboratory (PMID: 33602817) identified a role of Srs2 in downregulating the DNA damage signaling response by removing RPA from ssDNA. This manuscript reports further mechanistic insights into the signaling downregulation function of Srs2.
Using the genetic interaction with mutations in RPA1, mainly rfa1-zm2, the authors test a panel of mutations in Srs2 that affect CDK sites (srs2-7AV), potential Mec1 sites (srs2-2SA), known sumoylation sites (srs2-3KR), Rad51 binding (delta 875-902), PCNA interaction (delta 1159-1163), and SUMO interaction (srs2-SIMmut). All mutants were generated by genomic replacement and the expression level of the mutant proteins was found to be unchanged. This alleviates some concern about the use of deletion mutants compared to point mutations. Double mutant analysis identified that PCNA interaction and SUMO sites were required for the Srs2 checkpoint dampening function, at least in the context of the rfa1-zm2 mutant. There was no effect of this mutants in a RFA1 wild type background. This latter result is likely explained by the activity of the parallel pathway of checkpoint dampening mediated by Slx4, and genetic data with an Slx4 point mutation affecting Rtt107 interaction and checkpoint downregulation support this notion. Further analysis of Srs2 sumoylation showed that Srs2 sumoylation depended on PCNA interaction, suggesting sequential events of Srs2 recruitment by PCNA and subsequent sumoylation. Kinetic analysis showed that sumoylation peaks after maximal Mec1 induction by DNA damage (using the Top1 poison camptothecin (CPT)) and depended on Mec1. This data are consistent with a model that Mec1 hyperactivation is ultimately leading to signaling downregulation by Srs2 through Srs2 sumoylation. Mec1-S1964 phosphorylation, a marker for Mec1 hyperactivation and a site found to be needed for checkpoint downregulation after DSB induction, did not appear to be involved in checkpoint downregulation after CPT damage. The data are in support of the model that Mec1 hyperactivation when targeted to RPA-covered ssDNA by its Ddc2 (human ATRIP) targeting factor, favors Srs2 sumoylation after Srs2 recruitment to PCNA to disrupt the RPA-Ddc2-Mec1 signaling complex. Presumably, this allows gap filling and disappearance of long-lived ssDNA as the initiator of checkpoint signaling, although the study does not extend to this step.
Strengths<br /> (1) The manuscript focuses on the novel function of Srs2 to downregulate the DNA damage signaling response and provide new mechanistic insights.<br /> (2) The conclusions that PCNA interaction and ensuing Srs2-sumoylation are involved in checkpoint downregulation are well supported by the data.
Weaknesses<br /> (1) Additional mutants of interest could have been tested, such as the recently reported Pin mutant, srs2-Y775A (PMID: 38065943), and the Rad51 interaction point mutant, srs2-F891A (PMID: 31142613).<br /> (2) The use of deletion mutants for PCNA and RAD51 interaction is inferior to using specific point mutants, as done for the SUMO interaction and the sites for post-translational modifications.<br /> (3) Figure 4D and Figure 5A report data with standard deviations, which is unusual for n=2. Maybe the individual data points could be plotted with a color for each independent experiment to allow the reader to evaluate the reproducibility of the results.
Comments on revisions:
In this revision, the authors adequately addressed my concerns. The only issue I see remaining is the site of Srs2 action. The authors argue in favor of gaps and against R-loops and ssDNA resulting from excessive supercoiling. The authors do not discuss ssDNA resulting from processing of one-sided DSBs, which are expected to result from replication run-off after CPT damage but are not expected to provide the 3'-junction for preferred PCNA loading. Can the authors exclude PCNA at the 5'-junction at a resected DSB?
-
Author response:
The following is the authors’ response to the original reviews.
eLife Assessment
This manuscript reports valuable findings on the role of the Srs2 protein in turning off the DNA damage signaling response initiated by Mec1 (human ATR) kinase. The data provide solid evidence that Srs2 interaction with PCNA and ensuing SUMO modification is required for checkpoint downregulation. However, experimental evidence with regard to the model that Srs2 acts at gaps after camptothecin-induced DNA damage is currently lacking. The work will be of interest to cell biologists studying genome integrity but would be strengthened by considering the possible role of Rad51 and its removal.
We thank editors and reviewers for their constructive comments and address their main criticisms below.
(1) Srs2 action sites. Our data provide support to the model that Srs2 removal of RPA is favored at ssDNA regions with proximal PCNA, but not at ssDNA regions lacking proximal PCNA. A prominent example of the former type of ssDNA regions is an ssDNA gap with a 3’ DNA end permissive for PCNA loading. Examples of the latter type of ssDNA sites include those within R-loops and negatively supercoiled regions, both lacking 3’ DNA end required for PCNA loading. The former type of ssDNA regions can recruit other DNA damage checkpoint proteins, such as 9-1-1, which requires a 5’ DNA end for loading; thus, these ssDNA regions are ideal for Srs2’s action in checkpoint dampening. In contrast, ssDNA within supercoiled and Rloop regions, both of which can be induced by CPT treatment (Pommier et al, 2022), lacks the DNA ends required for checkpoint activation. RPA loaded at these sites plays important roles, such as recruiting Rloop removal factors (Feng and Manley, 2021; Li et al, 2024; Nguyen et al, 2017), and they are not ideal sites for Srs2’s checkpoint dampening functions. Based on the above rationale and our data, we suggest that Srs2 removal of RPA is favored only at a subset of ssDNA regions prone to checkpoint activation and can be avoided at other ssDNA regions where RPA mainly helps DNA protection and repair. We have modified the text and model drawing to better articulate the implications of our work, that is, Srs2 can distinguish between two types of ssDNA regions by using PCNA proximity as a guide for RPA removal_._ We noted that the precise sites of Srs2 actions in the genome remain to be determined.
(2) Rad51 in the Srs2-RPA antagonism. In our previous report (Dhingra et al, 2021), we provided several lines of evidence to support the conclusion that Rad51 is not relevant to the Srs2-RPA antagonism, despite it being the best-studied protein that is regulated by Srs2. For example, while rad51∆ rescues the hyperrecombination phenotype of srs2∆ cells as shown by others, we found that rad51∆ did not affect the hypercheckpoint phenotype of srs2∆. In contrast, rfa1-zm1/zm2 have the opposite effects. The differential effects of rad51∆ and rfa1-zm1/zm2 were also seen for the srs2-ATPase dead allele (srs2-K41A). For example, rfa1-zm2 rescued the hyper-checkpoint defect and the CPT sensitivity of srs2-K41A, while rad51∆ had neither effect. These and other data described by Dhingra et al (2021) suggest that Srs2’s effects on checkpoint vs. recombination can be separated and that Rad51 removal by Srs2 is distinct from the Srs2RPA antagonism in checkpoint regulation. Given the functional separation summarized above, in our current work investigating which Srs2 features affect the Srs2-RPA antagonism, we did not focus on the role of Rad51. However, we did examine all known features of Srs2, including its Rad51 binding domain. Consistent with our conclusion summarized above, deleting the Rad51 binding domain in Srs2 (srs2∆Rad51BD) has no effect on rfa1-zm2 phenotype in CPT (Figure 2D). This data provides yet another evidence that Srs2 regulation of Rad51 is separable from the Srs2-RPA antagonism. Our work provides a foundation for future examination of how Srs2 regulates RPA and Rad51 in different manners and if there is a crosstalk between them in specific contexts. We have added this point to the revised text.
Public Reviews:
Reviewer #1.
Overall, the data presented in this manuscript is of good quality. Understanding how cells control RPA loading on ssDNA is crucial to understanding DNA damage responses and genome maintenance mechanisms. The authors used genetic approaches to show that disrupting PCNA binding and SUMOylation of Srs2 can rescue the CPT sensitivity of rfa1 mutants with reduced affinity for ssDNA. In addition, the authors find that SUMOylation of Srs2 depends on binding to PCNA and the presence of Mec1. Noted weaknesses include the lack of evidence supporting that Srs2 binding to PCNA and its SUMOylation occur at ssDNA gaps, as proposed by the authors. Also, the mutants of Srs2 with impaired binding to PCNA or impaired SUMOylation showed no clear defects in checkpoint dampening, and in some contexts, even resulted in decreased Rad53 activation. Therefore, key parts of the paper would benefit from further experimentation and/or clarification.
We thank the reviewer for the positive comments, and we address her/his remark regarding ssDNA gaps below. In addition, we provide evidence that redundant pathways can mask checkpoint dampening phenotype of the srs2-∆PIM and -3KR alleles.
Major Comments
(1) The central model proposed by the authors relies on the loading of PCNA at the 3' junction of an ssDNA gap, which then mediates Srs2 recruitment and RPA removal. While several aspects of the model are consistent with the data, the evidence that it is occurring at ssDNA gaps is not strong. The experiments mainly used CPT, which generates mostly DSBs. The few experiments using MMS, which mostly generates ssDNA gaps, show that Srs2 mutants lead to weaker rescue in this context (Figure S1). How do the authors explain this discrepancy? In the context of DSBs, are the authors proposing that Srs2 is engaging at later steps of HRdriven DSB repair where PCNA gets loaded to promote fill-in synthesis? If so, is RPA removal at that step important for checkpoint dampening? These issues need to be addressed and the final model adjusted.
Our data provide supports to the model that Srs2 removal of RPA is favored at ssDNA regions with proximal PCNA, but not at ssDNA regions lacking proximal PCNA (Figure 7). A prominent example of the former type is ssDNA gap with 3’ DNA end permissive for PCNA loading. Examples of the latter type of ssDNA sites are present within R-loops and negatively supercoiled regions, and these ssDNA sites lack 3’ DNA ends required for PCNA loading. In principle, the former can recruit other DNA damage checkpoint proteins, such as 9-1-1, which requires 5’ DNA end for loading, thus it is ideal for Srs2’s action in checkpoint dampening. In contrast, ssDNA within supercoiled and R-loop regions, which can be induced by CPT treatment (Pommier et al., 2022), lacks DNA ends required for checkpoint activation. RPA loaded at these sites plays important roles such as recruiting R-loop removal factors (Feng and Manley, 2021; Li et al., 2024; Nguyen et al., 2017), and these are not ideal sites for Srs2 removal of RPA to achieve checkpoint dampening. Our work suggests that Srs2 removal of RPA is favored only at a subset of ssDNA regions prone to checkpoint activation and can be avoided at other ssDNA regions where RPA mainly helps DNA protection and repair. We have modified the text and the model to clarify our conclusions and emphasized that Srs2 can distinguish between two types of ssDNA regions using PCNA proximity as a guide for RPA removal.
We note that in addition to DSBs, CPT also induces both types of ssDNA mentioned above. For example, CPT can lead to ssDNA gap formation upon excision repair or DNA-protein crosslink repair of trapped Top1 (Sun et al, 2020). The resultant ssDNA regions contain 3’ DNA end for PCNA loading, thus favoring Srs2 removal of RPA. CPT treatment also depletes the functional pool of Top1, thus causing topological stress and increased levels of DNA supercoiling and R-loops (Petermann et al, 2022; Pommier et al., 2022). As mentioned above, R-loops and supercoiled regions do not favor Srs2 removal of RPA due to a lack of PCNA loading. We have now adjusted the text to clarify that CPT can lead to the generation of two types of ssDNA regions as stated above. We have also adjusted the model drawing to indicate that while ssDNA gaps can be logical Srs2 action sites, other types of ssDNA regions with proximal PCNA (e.g., resected ssDNA tails) could also be targeted by Srs2. Our work paves the way to determine the precise ssDNA regions for Srs2’s action.
Multiple possibilities should be considered in explaining the less potent suppression of rfa1 mutants by srs2 alleles in MMS compared to CPT conditions. For example, MMS and CPT affect checkpoints differently. While CPT only activates the DNA damage checkpoint, MMS additionally induces DNA replication checkpoint (Menin et al, 2018; Redon et al, 2003; Tercero et al, 2003). It is possible that the Srs2-RPA antagonism is more relevant to the DNA damage checkpoint compared with the DNA replication checkpoint. Further investigation of this possibility among other scenarios will shed light on differential suppression seen here. We have included this discussion in the revised text.
(2) The data in Figure 3 showing that Srs2 mutants reduce Rad53 activation in the rfa1-zm2 mutant are confusing, especially given the claim of an anti-checkpoint function for Srs2 (in which case Srs2 mutants should result in increased Rad53 activation). The authors propose that Rad53 is hyperactivated in rfa1-zm2 mutant because of compromised ssDNA protection and consequential DNA lesions, however, the effects sharply contrast with the central model. Are the authors proposing that in the rfa1-zm2 mutant, the compromised protection of ssDNA supersedes the checkpoint-dampening effect? Perhaps a schematic should be included in Figure 3 to depict these complexities and help the reader. The schematic could also include the compensatory dampening mechanisms like Slx4 (on that note, why not move Figure S2 to a main figure?... and even expand experiments to better characterize the compensatory mechanisms, which seem important to help understand the lack of checkpoint dampening effect in the Srs2 mutants)
Partially defective alleles often do not manifest null phenotype. In this case, while srs2∆ increases Rad53 activation (Dhingra et al., 2021), srs2-∆PIM and -3KR did not (Figure 3A-3B). However, srs2-∆PIM did increase Rad53 activation when combined with another checkpoint dampening mutant slx4<sup>RIM</sup> (now Figure 4B-4C). This result suggests that defects of partially defective srs2 alleles can be masked by Slx4. Further, srs2-∆PIM and 3KR rescued rfa1-zm2’s checkpoint abnormality (now Figure 3B-3C), suggesting that Srs2 binding to PCNA and its sumoylation contribute to the Srs2-RPA antagonism in the DNA damage checkpoint response.
Partially defective alleles that impair specific features of a protein without producing null phenotype have been used widely to reveal biological mechanisms. For example, a partially defective allele of the checkpoint protein Rad9 perturbing binding to gamma-H2A (rad9-K1088M) does not cause DNA damage sensitivity on its own, due to the compensation from other checkpoint factors (Hammet et al, 2007). However_, rad9-K1088M_ rescues the DNA damage sensitivity and persistent G2/M checkpoint of slx4 mutants, providing strong evidence for the notion that Slx4 dampens checkpoint via regulating Rad9 (Ohouo et al, 2013).
We have now indicated that our model highlights the checkpoint recovery process and does not depict another consequence of the Srs2-RPA antagonism, that is, rfa1 DNA binding mutants can lead to increased levels of DNA lesions and consequently stronger checkpoint activation, which are rescued by lessening Srs2’s ability to strip RPA from DNA (Dhingra et al., 2021). We have stated these points more clearly in the text and added a schematic (Figure 3A) to outline the genetic relationship and interpretations. We also moved Figure S2 to the main figures (Figure 4), as suggested by the reviewer. Better characterizing the compensatory mechanisms among the multiple checkpoint dampening pathways requires substantial amounts of work that will be pursued in the future.
(3) The authors should demarcate the region used for quantifying the G1 population in Figure 3B and explain the following discrepancy: By inspection of the cell cycle graph, all mutants have lower G1 peak height compared to WT (CPT 2h). However, in the quantification bar graph at the bottom, ΔPIM has higher G1 population than the WT.
We now describe how the G1 region of the FACS histogram was selected to derive the percentage of G1 cells in Figure 3B (now Figure 3C). Briefly, the G1 region from the “G1 sample” was used to demarcate the G1 region of the “CPT 2h” sample. We noticed that a mutant panel was mistakenly put in the place of wild-type, and this error is now corrected. The conclusion remains that srs2-∆PIM and srs2-3KR improved rfa1-zm2 cells’ ability to exit G2/M, while they themselves do not show difference from the wild-type control for the percentage of G1 cells after 2hr CPT treatment. We have added statistics in Figure 3C that support this conclusion.
Reviewer #2:
This is an interesting paper that delves into the post-translational modifications of the yeast Srs2 helicase and proteins with which it interacts in coping with DNA damage. The authors use mutants in some interaction domains with RPA and Srs2 to argue for a model in which there is a balance between RPA binding to ssDNA and Srs2's removal of RPA. The idea that a checkpoint is being regulated is based on observing Rad53 and Rad9 phosphorylation (so there are the attributes of a checkpoint), but evidence of cell cycle arrest is lacking. The only apparent delay in the cell cycle is the re-entry into the second S phase (but it could be an exit from G2/M); but in any case, the wild-type cells enter the next cell cycle most rapidly. No direct measurement of RPA residence is presented.
We thank the reviewer for the helpful comments. Previous studies have shown that CPT does not induce the DNA replication checkpoint, and thus does not slow down or arrest S phase progression; however, CPT does induce the DNA damage checkpoint, which causes a delay (not arrest) in G2/M phase and re-entering into the second G1 (Menin et al., 2018; Redon et al., 2003). Our result is consistent with these findings, showing that CPT induces G2/M delay but not arrest. We have now made this point clearer in the text.
We have previously reported chromatin-bound RPA levels in rfa1-zm2, srs2, and their double mutants, as well as in vitro ssDNA binding by wild-type and mutant RPA complexes (Dhingra et al., 2021). These data showed that Srs2 loss or its ATPase dead mutant led to 4-6-fold increase of RPA levels on chromatin, which was rescued by rfa1-zm2 (Dhingra et al., 2021). On its own, rfa1-zm2 did not cause defective chromatin association, despite modestly reducing ssDNA binding in vitro (Dhingra et al., 2021). This discrepancy could be due to a lack of sensitivity of the chromatin fractionation assay in revealing moderate changes of RPA residence on DNA in vivo. Our functional assays (Figure 2-3) were more effective in identifying the Srs2 features pertaining to RPA regulation.
Strengths:
Data concern viability assays in the presence of camptothecin and in the post-translational modifications of Srs2 and other proteins.
Weaknesses:
There are a couple of overriding questions about the results, which appear technically excellent. Clearly, there is an Srs2-dependent repair process here, in the presence of camptothecin, but is it a consequence of replication fork stalling or chromosome breakage? Is repair Rad51-dependent, and if so, is Srs2 displacing RPA or removing Rad51 or both? If RPA is removed quickly what takes its place, and will the removal of RPA result in lower DDC1-MEC1 signaling?
Srs2 can affect both the checkpoint response and DNA repair processes in CPT conditions. However, rfa1zm2 mainly affects the former role of Srs2; this allows us to gain a deeper understanding of this role, which is critical for cell survival in CPT (Dhingra et al., 2021). Building on this understanding, our current study identified two Srs2 features that could afford spatial and temporal regulation of RPA removal from DNA, providing a rationale for how cells can properly utilize an activity that can be beneficial yet also dangerous if it were to lack regulation. Study of Srs2-mediated DNA repair in CPT conditions, either in Rad51-dependent or -independent manner, to deal with replication fork stalling or DNA breaks will require studies in the future.
Moreover, it is worth noting that in single-strand annealing, which is ostensibly Rad51 independent, a defect in completing repair and assuring viability is Srs2-dependent, but this defect is suppressed by deleting Rad51. Does deleting Rad51 have an effect here?
We have previously shown that rad51∆ did not rescue the hyper-checkpoint phenotype of srs2∆ cells in CPT conditions, while rfa1-zm1 and -zm2 did (Dhingra et al., 2021). This differential effect was also seen for the srs2 ATPase-dead allele (Dhingra et al., 2021). These and other data described by Dhingra et al (2021) suggest that Srs2’s effects on checkpoint vs. recombination are separable at least in CPT condition, and that the Srs2-RPA antagonism in checkpoint regulation is not affected by Rad51 removal (unlike in SSA).
Neither this paper nor the preceding one makes clear what really is the consequence of having a weakerbinding Rfa1 mutant. Is DSB repair altered? Neither CPT nor MMS are necessarily good substitutes for some true DSB assay.
We have previously showed that rfa1-zm1/zm2 did not affect the frequencies of rDNA recombination, gene conversation, or direct repeat repair (Dhingra et al., 2021). Further, rfa1-zm1/zm2 did not suppress the hyperrecombination phenotype of srs2∆, while rad51∆ did (Dhingra et al., 2021). In a DSB system, wherein the DNA repeats flanking the break were placed 30 kb away from each other, srs2∆ led to hyper-checkpoint and lethality, both of which were rescued by rfa1-zm mutants (Dhingra et al., 2021). In this assay, rfa1-zm1/zm2 did not show sensitivity, suggesting largely proficient DNA repair. Collectively, these data suggest that moderately weakening DNA binding of Rfa1 does not lead to detectable effect on the recombinational repair examined thus far, rather it affects Srs2-mediated checkpoint downregulation. In-depth studies of rfa1-zm mutations in the context of various DSB repair steps will be interesting to pursue in the future.
With camptothecin, in the absence of site-specific damage, it is difficult to test these questions directly. (Perhaps there is a way to assess the total amount of RPA bound, but ongoing replication may obscure such a measurement). It should be possible to assess how CPT treatment in various genetic backgrounds affects the duration of Mec1/Rad53-dependent checkpoint arrest, but more than a FACS profile would be required.
Quantitative measurement of RPA residence time on DNA in cellular context and the duration of the
Mec1/Rad53-mediated cell cycle delay/arrest will be informative but requires further technology development. Our current work provides a foundation for such quantitative assessment.
It is also notable that MMS treatment does not seem to yield similar results (Fig. S1).
Figure S1 showed that srs2-∆PIM and srs2-3KR had weaker suppression of rfa1-zm2 growth on MMS plates than on CPT plates. Multiple possibilities should be considered in explaining the less potent suppression of rfa1 mutants by srs2 in MMS compared with CPT conditions. For example, MMS and CPT affect checkpoints differently. While CPT only activates the DNA damage checkpoint, MMS additionally induces DNA replication checkpoint (Menin et al., 2018; Redon et al., 2003; Tercero et al., 2003). It is therefore possible that the Srs2RPA antagonism is more relevant for the DNA damage checkpoint control compared with the DNA replication checkpoint. Further investigation of this possibility will shed light on differential suppression seen here. We have included this discussion in the revised text.
Reviewer #3:
The superfamily I 3'-5' DNA helicase Srs2 is well known for its role as an anti-recombinase, stripping Rad51 from ssDNA, as well as an anti-crossover factor, dissociating extended D-loops and favoring non-crossover outcome during recombination. In addition, Srs2 plays a key role in ribonucleotide excision repair. Besides DNA repair defects, srs2 mutants also show a reduced recovery after DNA damage that is related to its role in downregulating the DNA damage signaling or checkpoint response. Recent work from the Zhao laboratory (PMID: 33602817) identified a role of Srs2 in downregulating the DNA damage signaling response by removing RPA from ssDNA. This manuscript reports further mechanistic insights into the signaling downregulation function of Srs2.
Using the genetic interaction with mutations in RPA1, mainly rfa1-zm2, the authors test a panel of mutations in Srs2 that affect CDK sites (srs2-7AV), potential Mec1 sites (srs2-2SA), known sumoylation sites (srs2-3KR), Rad51 binding (delta 875-902), PCNA interaction (delta 1159-1163), and SUMO interaction (srs2SIMmut). All mutants were generated by genomic replacement and the expression level of the mutant proteins was found to be unchanged. This alleviates some concern about the use of deletion mutants compared to point mutations. The double mutant analysis identified that PCNA interaction and SUMO sites were required for the Srs2 checkpoint dampening function, at least in the context of the rfa1-zm2 mutant. There was no effect of these mutants in a RFA1 wild-type background. This latter result is likely explained by the activity of the parallel pathway of checkpoint dampening mediated by Slx4, and genetic data with an Slx4 point mutation affecting Rtt107 interaction and checkpoint downregulation support this notion. Further analysis of Srs2 sumoylation showed that Srs2 sumoylation depended on PCNA interaction, suggesting sequential events of Srs2 recruitment by PCNA and subsequent sumoylation. Kinetic analysis showed that sumoylation peaks after maximal Mec1 induction by DNA damage (using the Top1 poison camptothecin (CPT)) and depended on Mec1. These data are consistent with a model that Mec1 hyperactivation is ultimately leading to signaling downregulation by Srs2 through Srs2 sumoylation. Mec1-S1964 phosphorylation, a marker for Mec1 hyperactivation and a site found to be needed for checkpoint downregulation after DSB induction did not appear to be involved in checkpoint downregulation after CPT damage. The data are in support of the model that Mec1 hyperactivation when targeted to RPA-covered ssDNA by its Ddc2 (human ATRIP) targeting factor, favors Srs2 sumoylation after Srs2 recruitment to PCNA to disrupt the RPA-Ddc2-Mec1 signaling complex. Presumably, this allows gap filling and disappearance of long-lived ssDNA as the initiator of checkpoint signaling, although the study does not extend to this step.
Strengths
(1) The manuscript focuses on the novel function of Srs2 to downregulate the DNA damage signaling response and provide new mechanistic insights.
(2) The conclusions that PCNA interaction and ensuing Srs2-sumoylation are involved in checkpoint downregulation are well supported by the data.
We thank the reviewer for carefully reading our work and for his/her positive comments.
Weaknesses
(1) Additional mutants of interest could have been tested, such as the recently reported Pin mutant, srs2Y775A (PMID: 38065943), and the Rad51 interaction point mutant, srs2-F891A (PMID: 31142613).
Residue Y775 of Srs2 was shown to serve as a separation pin in unwinding D-loops and dsDNA with 3’ overhang in vitro; however, srs2-Y775A lacks cellular phenotype in assays for gene conversion, crossover, and genetic interactions. As such, the biological role of this residue has not been clear. In addressing reviewer’s comment, we obtained srs2-Y775A, and the control strains as described in the recent publication (Meir et al, 2023). While srs2-Y775A on its own did not affect CPT sensitivity, it improved rfa1-zm_2 mutant growth on media containing CPT. This result suggests that Y775 can influence RPA regulation during in checkpoint dampening. Given that truncated Srs2 (∆Cter 276 a.a.) containing Y775A showed normal RPA stripping activity _in vitro, it is possible that cellular assay using rfa1-zm2 is more sensitive for revealing defect of this activity or full-length protein is required for manifest Y775A effect. Future experiments distinguishing these possibilities can provide more clarity. Nevertheless, our result reveals the first phenotype of Srs2 separation pin mutant. We have added this new result (Figure S4) and our interpretation.
We have already included data showing that a srs2 mutant lacking the Rad51 binding domain (srs2∆Rad51BD, ∆875-902) did not affect rfa1-zm2 growth in CPT nor caused defects in CPT on its own (Figure 2D). This data suggest that Rad51 binding is not relevant to the Srs2-RPA antagonism in CPT, a conclusion fully supported by data in our previous study (Dhingra et al., 2021). Collectively, these findings do not provide a strong rationale to test a point mutation within the Rad51BD region.
(2) The use of deletion mutants for PCNA and RAD51 interaction is inferior to using specific point mutants, as done for the SUMO interaction and the sites for post-translational modifications.
We generally agree with this view. However, it is less of a concern in the context of the Rad51 binding site mutant (srs2-∆Rad51BD) since it behaved as the wild-type allele in our assays. The srs2-∆PIM mutant (lacking 4 amino acids) has been examined for PCNA binding in vitro and in vivo (Kolesar et al, 2016; Kolesar et al, 2012); to our knowledge no detectable defect was reported. Thus, we believe that this allele is suitable for testing whether Srs2’s ability to bind PCNA is relevant to RPA regulation.
(3) Figure 4D and Figure 5A report data with standard deviations, which is unusual for n=2. Maybe the individual data points could be plotted with a color for each independent experiment to allow the reader to evaluate the reproducibility of the results.
We have included individual data points as suggested and corrected figure legend to indicate that three independent biological samples per genotype were examined in both panels.
References:
Dhingra N, Kuppa S, Wei L, Pokhrel N, Baburyan S, Meng X, Antony E, Zhao X (2021) The Srs2 helicase dampens DNA damage checkpoint by recycling RPA from chromatin. Proc Natl Acad Sci U S A 118: e2020185118.
Feng S, Manley JL (2021) Replication Protein A associates with nucleolar R loops and regulates rRNA transcription and nucleolar morphology. Genes Dev 35: 1579-1594.
Fiorani S, Mimun G, Caleca L, Piccini D, Pellicioli A (2008) Characterization of the activation domain of the Rad53 checkpoint kinase. Cell Cycle 7: 493-499.
Hammet A, Magill C, Heierhorst J, Jackson SP (2007) Rad9 BRCT domain interaction with phosphorylated H2AX regulates the G1 checkpoint in budding yeast. EMBO Rep 8: 851-857.
Kolesar P, Altmannova V, Silva S, Lisby M, Krejci L (2016) Pro-recombination role of Srs2 protein requires SUMO (Small Ubiquitin-like Modifier) but is independent of PCNA (Proliferating Cell Nuclear Antigen) interaction. J Biol Chem 291: 7594-7607.
Kolesar P, Sarangi P, Altmannova V, Zhao X, Krejci L (2012) Dual roles of the SUMO-interacting motif in the regulation of Srs2 sumoylation. Nucleic Acids Res 40: 7831-7843.
Li Y, Liu C, Jia X, Bi L, Ren Z, Zhao Y, Zhang X, Guo L, Bao Y, Liu C et al (2024) RPA transforms RNase H1 to a bidirectional exoribonuclease for processive RNA-DNA hybrid cleavage. Nat Commun 15: 7464.
Meir A, Raina VB, Rivera CE, Marie L, Symington LS, Greene EC (2023) The separation pin distinguishes the pro- and anti-recombinogenic functions of Saccharomyces cerevisiae Srs2. Nat Commun 14: 8144.
Memisoglu G, Lanz MC, Eapen VV, Jordan JM, Lee K, Smolka MB, Haber JE (2019) Mec1(ATR) autophosphorylation and Ddc2(ATRIP) phosphorylation regulates dna damage checkpoint signaling. Cell Rep 28: 1090-1102 e1093.
Menin L, Ursich S, Trovesi C, Zellweger R, Lopes M, Longhese MP, Clerici M (2018) Tel1/ATM prevents degradation of replication forks that reverse after Topoisomerase poisoning. EMBO Rep 19: e45535.
Nguyen HD, Yadav T, Giri S, Saez B, Graubert TA, Zou L (2017) Functions of Replication Protein A as a sensor of R loops and a regulator of RNaseH1. Mol Cell 65: 832-847 e834.
Ohouo PY, Bastos de Oliveira FM, Liu Y, Ma CJ, Smolka MB (2013) DNA-repair scaffolds dampen checkpoint signalling by counteracting the adaptor Rad9. Nature 493: 120-124.
Papouli E, Chen S, Davies AA, Huttner D, Krejci L, Sung P, Ulrich HD (2005) Crosstalk between SUMO and ubiquitin on PCNA is mediated by recruitment of the helicase Srs2p. Mol Cell 19: 123-133.
Petermann E, Lan L, Zou L (2022) Sources, resolution and physiological relevance of R-loops and RNA-DNA hybrids. Nat Rev Mol Cell Biol 23: 521-540.
Pommier Y, Nussenzweig A, Takeda S, Austin C (2022) Human topoisomerases and their roles in genome stability and organization. Nat Rev Mol Cell Biol 23: 407-427.
Redon C, Pilch DR, Rogakou EP, Orr AH, Lowndes NF, Bonner WM (2003) Yeast histone 2A serine 129 is essential for the efficient repair of checkpoint-blind DNA damage. EMBO Rep 4: 678-684.
Sun Y, Saha S, Wang W, Saha LK, Huang SN, Pommier Y (2020) Excision repair of topoisomerase DNAprotein crosslinks (TOP-DPC). DNA Repair (Amst) 89: 102837.
Tercero JA, Longhese MP, Diffley JFX (2003) A central role for DNA replication forks in checkpoint activation and response. Mol Cell 11: 1323-1336.
Reviewer #1 (Recommendations For The Authors):
(1) "the srs2-ΔPIM (Δ1159-1163 amino acids)". "11" should not be italic.
Corrected.
(2) "the srs2-SIMmut (1170 IIVID 1173 to 1170 AAAAD 1173)". "1173" should be 1174.
Corrected.
(3) Can Slx4-RIM mutant rescue rfa1-zm2 CPT sensitivity?
We found that unlike srs2∆, slx4∆ failed to rescue rfa1-zm2 CPT sensitivity (picture on the right). On the other hand, slx4∆ counteracts Rad9-dependent Rad53 activation as shown by Ohouo et al (2013).
Author response image 1.
(4) One genotype (rfa1-zm2 srs2-3KR) is missing in Figure 5B.
Corrected.
(5) In Fig. S2C, FACS plots do not match the bar graph (see major concern 3).
Corrected and is described in more detail in Major Concern #3.
Reviewer #2 (Recommendations For The Authors):
Figure 1. The colors in A are not well-conserved in B.
Colors for srs2-7AV and -2SA in panel B are now matched with those in panel A.
Figure 2. Is srs2-SIMmut the same as srs2-sim?
This mutant allele is now referred to as srs2-SIM<sup>mut</sup> throughout the text and figures.
The suppression of rfa1-zm2 and (less strongly) rfa-t33 by the Srs2 mutants is interesting. Based on previous data, the suppression is apparently mutual, though it isn't shown here, unless we misunderstand.
We have previously shown that rfa1-zm2 and srs2∆ showed mutual suppression (Dhingra et al 2021 PNAS) and have included an example in Figure S1A. Unlike srs2∆, srs2-∆PIM and -3KR showed little damage sensitivity and DDC defects, likely due to the compensation by the Slx4-mediated checkpoint dampening (detailed in the Public Review section). Suppression is not applicable toward mutants lacking a phenotype, though the mutants could confer suppression when there is a functional relationship with another mutant, as we see here toward rfa1-zm2.
Is Srs2 interaction with PCNA dependent on its ubiquitylation or SUMO? Does PCNA mutant K164R mimic this mutation? (this may well be known; our ignorance).
It was known that Srs2 can bind unmodified PCNA, though SUMO enhances this interaction; however, a very small percentage of PCNA is sumoylated in cells and PCNA sumoylation affects both Srs2-dependent and independent processes (e.g., (Papouli et al, 2005). As such, the genetic interaction of K164R with rfa1-zm2 can be difficult to interpret.
Why srs2-7AV or srs2-sim make rfa1-zm2 even more sensitive is also not obvious. The authors take refuge in the statement that Srs2 "has multiple roles in cellular survival of genotoxic stress" but don't attempt to be more precise.
Our understanding of srs2-7AV and -sim is limited; thus, more specific speculation cannot be made at this time.
Figure 3. It is striking (Figure 3A) that all the cells have reached G2 an hour after releasing from alpha-factor arrest, even though presumably CPT treatment must impair replication. It is even more striking that there is apparently no G2/M arrest in the presumably damaged cells as the WT (Figure 3B) has the most rapid progression through the cell cycle. How does this compare with cells in the absence of CPT? The idea that CPT is triggering Rad53-mediated response is hard to understand if there is in fact no delay in the cell cycle. Instead, the several mutants appear to delay re-entry into S... Or maybe it is actually an exit from G2/M?
This phenomenon needs a better explanation.
CPT does not induce the DNA replication checkpoint nor S phase delay, explaining apparent G2 content by the one hour time point; however, CPT does induce the DNA damage checkpoint, and a delay (not arrest) in G2/M (Menin et al., 2018; Redon et al., 2003; Tercero et al., 2003). We confirmed these findings. In our hand, wildtype G1 cells released into the cell cycle in the absence of CPT complete the first cell cycle within 80 minutes, such that most cells are in the second G1 phase by 90 min. In contrast, when wild-type cells were treated with CPT, G2/M exit was only partial at 120min (e.g., Figure 3B). These features differentiate CPT treatment from MMS treatment, which induces both types of checkpoints and lengthening the time that cells reach G2. We have highlighted this unique feature of CPT in checkpoint induction.
What is "active Rad53"? If the authors mean they are using a phospho-specific Ab versus Rad53, they should explain this. It's impossible to know if total Rad53 is altered from Figure 3A. A blot with an antibody that detects both phosphorylated and nonphosphorylated Rad53 would help.
The F9 antibody used here detects phosphorylated Rad53 forms induced by Mec1 activation and does not detect unphosphorylated Rad53 (Fiorani et al, 2008). We changed “active Rad53” to “phosphorylated Rad53”. We used Pgk1 as a loading control to ensure equal loading, which help to quantify the relative amount of “active Rad53” in cells. This method has been used widely in the field.
Also is there a doublet of Rad53 in the right two lanes and in WT? Rad53 often shows more than one slowmigrating species, so this isn't necessarily a surprise. Were both forms used in quantitation?
Both forms are used for quantification.
Figure 4A. Is there a di-SUMO form above the band marked Srs2-Su? Is this known? Is it counted?
Mono-sumoylated form of Srs2 is the most abundant form of sumoylated Srs2, though we detected a sumoylated Srs2 band that can represent its di-sumo form. We did quantify both forms in the plot.
B. The dip at 1.5 h in Rad9-P is curious. It would be useful to know what % of Rad9 is phosphorylated in a repair-defective (rad52?) background with CPT treatment. And would such rad52 cells show a long arrest?
This dip is reproducible and may reflect that a population of cells escape G2/M delay at this timepoint.
Figure 5. It seems clear that the autophosphorylation site of Mec1, which was implicated in turning off a longdelayed G2/M arrest has no effect here, but presumably, a kinase-dead Mec1 (or deletion) does? The idea that a checkpoint is being regulated seems to come more from an assumption than from any direct data; as noted above, the only apparent delay in the cell cycle is the re-entry into S. There clearly is Rad53 and Rad9 phosphorylation so there are the attributes of a checkpoint. If PI3KK phosphorylation is important, can this be accomplished by Tel1 as well as Mec1?
A mec1 helicase dead or null would not activate the checkpoint at the first place, therefore will not be useful to address whether Mec1 autophosphorylation is implicated in turning off checkpoint. A recent study from the Haber lab provided evidence that Mec1 autophosphorylation at S1964 helps to turn off the checkpoint in a DSB situation (Memisoglu et al, 2019). The role of Tel1 in checkpoint dampening will be interesting to examine in the future.
Figure 6. Two Rfa1 phospho-sites don't appear to be important, but do the known multiple phosphorylations of Rfa2 play a role?
Figure 6D examined three Rfa2 phosphorylation sites and found no genetic interaction with srs2∆.
Summary: There are a lot of interesting data here, but they don't strongly support the author's model in the absence of a more direct way to monitor RPA binding and removal. This could be done using some sitespecific damage, but hard to do with CPT or MMS (which themselves don't appear to have the same effect). The abstract suggests Srs2 is "temporally and spatially regulated to both allow timely checkpoint termination and to prevent superfluous RPA removal." But where is the checkpoint termination if there's no evident checkpoint? And "superfluous" is probably not the right word (= unnecessary); probably the authors intend "excessive"? As noted above, it also isn't clear if the displacement is of RPA or of Rad51, which normally replaces RPA and which is well-known to be itself displaced by Srs2. Again, if CPT is causing enough damage to kill orders of magnitudes of cells (are the plate and liquid concentrations comparable, we suddenly wonder) then why isn't there some stronger evidence for a cell cycle response to the DDC?
As described in the Public Review section, we have previously shown that a lack of Srs2-mediated checkpoint downregulation leads to a 4-6 fold increase of RPA on chromatin, which was rescued by rfa1-zm2 (Dhingra et al., 2021). On its own, rfa1-zm2 did not cause defective chromatin association in our assays, despite modestly reducing ssDNA binding in vitro (Dhingra et al., 2021). This discrepancy could be due to a lack of sensitivity of chromatin fractionation assay in revealing moderate changes of RPA residence on DNA. Considering this, we decided to employ functional assays (Figure 2-3) that are more effective in identifying the specific Srs2 features pertaining to RPA regulation.
We respectfully disagree with the reviewer’s point that there is “no evident checkpoint” in CPT. Previous studies have shown that CPT induces the DNA damage checkpoint as evidenced by Mec1 activation and phosphorylation of Rad53 and Rad9, and delaying exit from G2/M (Dhingra et al., 2021; Menin et al., 2018; Redon et al., 2003). Our data are fully consistent with these reports. It is important to note that DNA damage checkpoint can manifest at a range of strengths depending on the genotoxic conditions and treatment, but the fundamental principles are the same. For example, we found that the Srs2-RPA antagonism not only affects the checkpoint downregulation in CPT, but also does so in MMS treatment and in a DSB system. We focused on CPT condition in this work, since CPT only induces the DNA damage checkpoint but not DNA replication checkpoint while MMS induces both. Further investigating the Srs2-RPA antagonism in a DSB system can be interesting to pursue in the future.
We believe that “superfluous removal” is appropriately used when discussing RPA regulation at genomic sites wherein it supports ssDNA protection and DNA repair, rather than DDC. Examples of these sites include R-loops and negatively supercoiled regions. These sites lack 3’ and 5’ DNA ends at the ss-dsDNA junctions for loading PCNA and the 9-1-1 checkpoint factors, and thus are not designated for checkpoint regulation.
We addressed the reviewer’s point regarding Rad51 in the Public Review section. We disagree with reviewer’s view that “Rad51 normally replaces RPA”. RPA is involved in many more processes than Rad51 wherein it is not replaced by Rad51.
Regarding toxicity of CPT, our view is that it stems from a combination of checkpoint regulation and other processes that also involve the Srs2-RPA antagonism. While this work focused on the checkpoint aspect of this antagonism, future studies will be conducted to address the latter.
One reference is entered as Lee Zhou and Stephen J. Elledge as opposed to "Zhou and Elledge."
Corrected.
Reviewer #3 (Recommendations For The Authors):
(1) It would be nice to see the additional point mutants (srs2-Y775A, srs2-F891A) be tested, as they showed little to no phenotypes in the previously reported analyses, which did not specifically test the function surveyed here.
This point is addressed in the Public Reviews section.
(2) Maybe the caveat of using deletion versus point mutations could be discussed.
This point is addressed in the Public Reviews section.
(3) Please plot individual data points of the two independent experiments in Figures 4D and 5A so that the reader can evaluate reproducibility. N=2 does not really allow deriving SD.
This point is addressed in the Public Reviews section and three individual data points are now included in both panels.
(4) It will help the reader to have the exact strains used in each experiment listed in each figure legend. Minor point.
The strain table is now updated to address this point.
(5) Page 7 middle paragraph: The reference to Figure 4A in line 11 should probably be Figure S3A.
Corrected.
-
-
www.biorxiv.org www.biorxiv.org
-
eLife Assessment
This study provides useful in vitro evidence to support a mechanism whereby dyslipidemia could accelerate renal functional decline through the activation of the AT1R/LOX1 complex by oxLDL and AngII. As such, it improves the knowledge regarding the complex interplay between dyslipidemia and renal disease and provides a solid basis for the discovery of novel therapeutic strategies for patients with lipid disorders. The methods, data, and analyses partly support the presented findings, although the observed variability and need for further in vivo validation require additional research in this key area.
-
Reviewer #1 (Public review):
Summary:
In the present study, Dr. Ihara demonstrated a key role of oxLDL in enhancing Ang II-induced Gq signaling by promoting the AT1/LOX1 receptor complex formation.
Strengths:
This study is very exciting and the work is also very detailed, especially regarding the mechanism of LOX1-AT1 receptor interaction and its impact on oxidative stress, fibrosis and inflammation.
Weaknesses:
The direct evidence for the interaction between AT1 and LOX1 receptors in cell membrane localization is relatively weak.
-
Reviewer #2 (Public review):
While the findings might be valid, there is enough uncertainty that these results should not be considered anything other than preliminary, warranting a more thorough and rigorous investigation.
Comments on revisions:
As the author mentioned that due to the receptor internalisation of AT1 and/or LOX1 induced by AngII or Ox-LDL makes it difficult to detect receptor interaction at the membrane by Co-IP. If so, the GPCR internalisation related pathway should be activated, such as GRKs, arrestin2 could be activated and enhanced during this process, whether they could further provide the evidence for these changes in different groups by Western blot or IF images.
If the authors don't know why the results across experiments can vary so greatly nor control them, how do we know that their interpretation of the very modest intra-experimental variability they observe is correct? They explain away the difference in biosensor activity response to the likely respective insertion sites that were used. While this can be true, and even might be true, it is important to note that the publication they cite shows that the sensors in the third loop and the C-terminus respond very similarly. In fact, the authors concluded: "Our results also suggest that positioning conformational biosensors into ICL3 and the C-tail effectively reports canonical G protein-mediated signaling downstream of the AT1R." Moreover, it is unclear why the less sensitive biosensor (as least as measured by degree of DBRET) is the one that appears to show enhancement. I suppose one could argue that the activity is maximal using the C-tail and one must use a less responsive reporter to detect the effect, but this is a rationalization for an unexplained result rather than a validated mechanistic explanation. If the other results were more compelling, perhaps this would be less of an issue. Finally, they did not explain why a control, non-specific antibody wasn't used for the studies presented in panel 2d. This would have been an easy study to have done in the interim. It also would have been important to test the effect of the LOX1-ab on the effects of AngII treatment alone.
In their response to the gene expression studies, the authors attribute the lack of a robust response for some genes to the low dose of oxLDL that was used but give no justification for their choice for this low dose. More importantly, they present the data for a number of hand-picked genes rather than a global assessment of response. Their justification---cost constraints---isn't sufficient to justify this incomplete analysis. Their selective rt-PCR results are a pilot study.
There is no direct evidence in this study that shows that "partial" EMT is occurring in vivo. The rt-PCR studies presented in Fig 8 are not sufficient. Even if one accepts their incomplete analysis of transcriptomic studies using RT-PCR rather than a complete transcriptomic assessment, the study was done on bulk RNA from the entire kidney. The source material includes all cell types, not just epithelial cells, so there is no way to be sure that EMT is occurring. As noted elsewhere, they found no histologic evidence for injury and had no immunostaining results demonstrating "partial EMT" of damaged renal epithelial cells.
All of the evidence described is indirect, and the responses, while plausible, are generally excuses for lack of truly unequivocally positive results. The authors acknowledge the potential confounders of lower BP response in the Lox1-KO, unexpected weight loss in response to high fat diet, the lack of meaningful histologic evidence of injury, and they also acknowledge the absence of increased Gq signaling in the kidney, which is central to their model, but defend the entire model based on some minor changes in urinary 8-OHdG and albumin levels and a curated set of transcriptional changes. Their data could support their model---loss of Lox1 seems to reduce the levels somewhat, but the data are preliminary.
There remain serious reservations about the immunostaining results, with explanations and new data not reassuring. The authors report that they are unable to co-stain for Lox1 and AT1R because both were generated in rabbit, but this reviewer didn't ask for co-staining of the two markers. Rather, it was co-staining showing that Lox1 and ATR1 in fact stain in a specific manner to the same nephron segments. The authors have added a supplementary figure showing co-staining for LOX1/AT1R with megalin, a marker for proximal tubules. However, several aspects of this are problematic:
i. The pattern in the new Supp Fig 10 does not look like that in Fig 9. In the latter, staining is virtually everywhere, all nephron segments, and predominantly basolateral. In Supp Fig 10, they note that the pattern is primarily in the microvilli of the proximal tubule, where megalin is present. The new studies also seem to be a bit more specific, ie there are some tubules that appear to not stain with the markers.
ii. It is difficult to be certain that the megalin staining isn't simply "bleed-through" of the signal from the other antibody. The paper doesn't describe the secondary antibody used for megalin to be sure that the emission spectra completely non-overlapping and it isn't clear that the microscope that was used offers necessary precision.
iii. Their explanation for the pattern of AT1R staining is unconvincing. AT1R immunolocalization is known to be challenging, prompting Schrankl et al to do a definitive study using RNAscope to localize its expression in mice, rats and humans (Am J Physiol Renal Physiol 320: F644-F653, 2021). It argues against the pattern seen in Figure 9 (diffuse tubular expression), though it does suggest it is present in proximal tubules in mice. But perhaps more problematic for their model is that AT1R is not expressed in human tubules (or at least the RNA is undetectable).
Why isn't there more colocalization apparent for the AT1R and LOX1 if they form a co-receptor complex? They say that the complexes may be very dynamic, yet their movie in Suppl Fig 1 does not really support that. Not only are there few overlapping puncta in the static image, there is very little change over the duration of the movie. We don't see complexes form and then disappear and we see few new complexes form.
The explanation for why the number of replicates is variable is not reassuring. The authors note that it was because of the higher variability of the results, necessitating a higher "N" to achieve significance, but this has the appearance of P-chasing.
-
Author response:
The following is the authors’ response to the original reviews.
Reviewer #1 (Public Review):
Summary:
This study demonstrates a key role of oxLDL in enhancing Ang II-induced Gq signaling by promoting the AT1/LOX1 receptor complex formation. Importantly, Gq-mediated calcium influx was only observed in LOX1 and AT1 both expressing cells, and AT1-LOX1 interaction aggravated renal damage and dysfunction under the condition of a high-fat diet with Ang II infusion, so this study indicated a new therapeutic potential of AT1-LOX1 receptor complex in CKD patients with dyslipidemia and hypertension.
Strengths:
This study is very exciting and the work is also very detailed, especially regarding the mechanism of LOX1-AT1 receptor interaction and its impact on oxidative stress, fibrosis, and inflammation.
Weaknesses:
The direct evidence for the interaction between AT1 and LOX1 receptors in cell membrane localization is relatively weak. Here I raise some questions that may further improve the study.
Major points:
(1) The authors hypothesized that in the interaction of AT1/LOX1 receptor complex in response to ox-LDL and AngII, there should be strong evidence of fluorescence detection of colocalization for these two membrane receptors, both in vivo and in vitro. Although the video evidence for AT1 internalization upon complex activation is shown in Figure S1, the more important evidence should be membrane interaction and enhanced signal of intracellular calcium influx.
Thank you for your valuable feedback. We agree that demonstrating the colocalization and interaction of AT1 and LOX-1 receptors at the membrane is critical to supporting our hypothesis.
In response, we have previously provided visual evidence of membrane co-localization of the AT1/LOX-1 receptor complex using an in situ PLA assay with anti-FLAG and antiV5 antibodies in CHO cells expressing FLAG-tagged AT1 and V5-tagged LOX-1 (Yamamoto et al., FASEB J 2015). This was further supported by immunoprecipitation of membrane proteins in CHO cells co-expressing LOX-1 and AT1, which confirmed the presence of the receptor complex. In the current study, we offer additional evidence of enhanced intracellular calcium influx following simultaneous stimulation with oxLDL and Ang II, confirming the functional activation of the AT1/LOX-1 receptor complex (Fig. 1g-j and Fig. 3e-h). Together, these findings provide substantial support for the colocalization of AT1 and LOX-1 and their influence on downstream signaling in our in vitro experiments.
However, we acknowledge the limitation of direct evidence for membrane co-localization of LOX-1 and AT1 in vivo. This constraint is attributed to the fact that both available anti-AT1 and anti-LOX-1 antibodies are derived from rabbits, making coimmunofluorescence or PLA challenging in our study. To address this, we employed coimmunofluorescent staining with megalin, a well-established marker for proximal renal tubules, as shown in Fig. S10. We found that both AT1 and LOX-1 co-localized with megalin, particularly at the brush borders, indicating their presence in the same renal compartments relevant to AT1/LOX-1 signaling.
We have revised the manuscript to highlight the functional evidence from calcium influx assays, supported by prior PLA results, demonstrating the interaction between LOX-1 and AT1. Additionally, we included a figure showing the co-localization of AT1 and LOX-1 with megalin in proximal renal tubules to reinforce these findings. Lastly, we have emphasized in the discussion the limitation regarding the lack of direct in vivo evidence for membrane co-localization of LOX-1 and AT1.
(2) Co-IP experiment should be provided to prove the AT1/LOX1 receptor interaction in response to ox-LDL and AngII in AT1 and LOX1 both expressing cells but not in AT1 only expressing cells.
We thank the reviewer for the insightful suggestion to validate the AT1/LOX1 receptor interaction under various stimulation conditions. In our previous study (Yamamoto et al., FASEB J 2015), we demonstrated the interaction between AT1 and LOX1 receptors through Co-IP and in situ PLA assays in cells overexpressing both receptors, without stimulation. These experiments provided solid evidence of the receptor interaction under static conditions at the cell membrane.
However, as noted in the previous work, we did not perform Co-IP experiments under AngII or oxLDL stimulation. The primary reason for this is that both AngII and oxLDL trigger internalization of the AT1 and/or LOX1 receptors, which may complicate the detection of receptor interaction at the membrane via Co-IP. This is supported by our realtime imaging, which showed a reduction in AT1 and/or LOX1 puncta following stimulation, indicating internalization of the receptors (Fig. 2a).
While we acknowledge the reviewer’s interest in investigating the interaction under AngII stimulation, we believe that the current data—especially from the PLA and Co-IP assays under static conditions—strongly support the interaction of AT1 and LOX1 receptors at the membrane.
(3) The authors mentioned that the Gq signaling-mediated calcium influx may change gene expression and cellular characteristics, including EMT and cell proliferation. They also provided evidence that oxidative stress, fibrosis, and inflammation were all enhanced after activating both receptors and inhibiting Gq was effective in reversing these changes. However, single stimulation with ox-LDL or AngII also has strong effects on ROS production, inflammation, and cell EMT, which has been extensively proved by previous studies. So, how to distinguish the biased effect of LOX1 or AT1r alone or the enhanced effect of receptor conformational changes mediated by their receptor interaction? Is there any better evidence to elucidate this point?
Thank you for raising this important point regarding the distinction between the individual effects of LOX-1 or AT1R activation and the enhanced effects mediated by their interaction. In our study, the concentration of oxLDL used (2–10 μg/ml) was significantly lower than concentrations typically employed in other studies (which often exceed 20 μg/ml). As a result, oxLDL alone produced minimal effects, aside from a reduction in cell proliferation observed in the BrdU assay. This suggests that oxLDL, at the concentrations used in our experiments, does not elicit a strong cellular response on its own.
The key to distinguishing the effect of the LOX-1/AT1 interaction lies in the amplification of Gq signaling, a pathway specifically activated by AngII. The distinction between the individual effects of LOX-1 or AT1R and the enhanced effects due to their interaction is centered on the increased activation of Gq signaling. In our experiments, co-treatment with oxLDL and AngII led to a significant increase in IP1 levels and calcium influx— both critical indicators of Gq signaling activation. While AngII alone also raised IP1 levels, the combined treatment with oxLDL further amplified the Gq signaling response, as reflected in the enhanced calcium influx. Importantly, oxLDL alone did not alter IP1 levels, even at high concentrations (100 μg/ml) (Takahashi et al., iScience 2021).
This enhancement of Gq signaling provides strong evidence of the synergistic interaction between LOX-1 and AT1, which surpasses the individual effects of either receptor alone. The LOX-1/AT1 interaction is thus crucial for the observed amplification of AngIIspecific signaling pathways. The combination of increased IP1 levels and calcium influx serves as compelling evidence of this interaction, clearly differentiating the effects of individual receptor activation from the enhanced response driven by receptor conformational changes and interaction.
Thank you again for your insightful comment, which has helped us to better articulate the significance of receptor interaction in this study.
(4) How does the interaction between AT1 and LOX1 affect the RAS system and blood pressure? What about the serum levels of rennin, angiotensin, and aldosterone in ND-fed or HFD-fed mice?
Thank you for your insightful question regarding the effects of AT1 and LOX-1 interaction on the renin-angiotensin system (RAS) and blood pressure, as well as the plasma levels of renin, angiotensin, and aldosterone in normal diet (ND)-fed and high-fat diet (HFD)-fed mice.
OxLDL binds to LOX-1, amplifying AT1 receptor activation and Gq signaling, which enhances the effects of Ang II. This interaction between AT1 and LOX-1 can lead to increased vasoconstriction, oxidative stress, and inflammation, which contribute to elevated blood pressure. This pathway may play a crucial role in modulating the RAS, particularly under conditions of elevated oxLDL, such as those induced by a HFD. Regarding the components of the RAS, we focused on plasma aldosterone levels, as this is a direct consequence of Ang II signaling. As shown in Fig. S7, when mice were treated with a pressor dose of Ang II infusion and subjected to a HFD to elevate oxLDL levels, we did not observe a significant increase in plasma aldosterone levels (102.8 ± 11.6pg/mL vs. 141.8 ± 15.0 pg/mL, P = 0.081).
In terms of blood pressure, Fig. 7b shows that no significant changes were observed under these treatment conditions, despite the AT1/LOX-1 interaction. These findings suggest that while oxLDL, via the AT1/LOX-1 interaction, can enhance Ang II signaling, its effect on blood pressure was not apparent in our study. This may be due to several factors, including heterogeneous cellular responses to the combined treatment across different cell types, as shown by the lack of reaction in vascular endothelial cells, vascular smooth muscle cells, and macrophages (Fig. S2). This may also be attributed to the high concentration of angiotensin II used in this study, which could have saturated aldosterone production under our experimental conditions. We have revised the manuscript to reflect these points.
Thank you again for your thoughtful comment, which has allowed us to expand and refine the discussion on this important aspect of our study.
Reviewer #2 (Public Review):
(1) Individuals with chronic kidney disease often have dyslipidemia, with the latter both a risk factor for atherosclerotic heart disease and a contributor to progressive kidney disease. Prior studies suggest that oxidized LDL (oxLDL) may cause renal injury through the activation of the LOX1 receptor. The authors had previously reported that LOX1 and AT1 interact to form a complex at the cell surface. In this study, the authors hypothesize that oxLDL, in the setting of angiotensin II, is responsible for driving renal injury by inducing a more pronounced conformational change of the AT1 receptor which results in enhanced Gq signaling.
They go about testing the hypothesis in a set of three studies. In the first set, they engineered CHO cell lines to express AT1R alone, LOX1 in combination with AT1R, or LOX1 with an inactive form of AT1R and indirectly evaluated Gq activity using IP1 and calcium activity as read-outs. They assessed activity after treatment with AngII, oxLDL, or both in combination and found that treatment with both agents resulted in the greatest level of activity, which could be effectively blocked by a Gq inhibitor but not a Gi inhibitor nor a downstream Rho kinase inhibitor targeting G12/13 signaling. These results support their hypothesis, though variability in the level of activation was dramatically inconsistent from experiment to experiment, differing by as much as 20-fold. In contrast, within the experiment, differences between the AngII and AngII/oxLDL treatments, while nominally significant and consistent with their hypothesis, generally were only 10-20%. Another example of unexplained variability can be found in Figures 1g-1j. AngII, at a concentration of 10-12, has no effect on calcium flux in one set of studies (Figure 1g, h) yet has induced calcium activity to a level as great as AngII + oxLDL in another (Figure 1i). The inconsistency of results lessens confidence in the significance of these findings. In other studies with the LOX1-CHO line, they tested for conformational change by transducing AT1 biosensors previously shown to respond to AngII and found that one of them in fact showed enhanced BRET in the setting of oxLDL and AngII compared to AngII alone, which was blocked by an antibody to AT1R. The result is supportive of their conclusions. Limiting enthusiasm for these results is the fact that there isn't a good explanation as to why only 1 sensor showed a difference, and the study should have included a non-specific antibody to control for non-specific effects.
We sincerely appreciate the reviewer’s thorough and insightful feedback, especially regarding the variability observed in our experimental results. As the reviewer pointed out, the differences in activation levels between the calcium influx assay and the IP1 assay, particularly between AngII and AngII/oxLDL co-treatment, were indeed significant. These differences can be attributed to the inherent sensitivity of these assays, which are used to indirectly evaluate Gq activity. Despite the variability, we believe that the reliability of our results is supported by the consistent directional trends across both assays, which align with our hypothesis.
Regarding the inconsistencies in intracellular calcium dynamics observed in Fig. 1i, we have performed additional analysis of calcium kinetics during ligand stimulation, similar to the analysis in Fig. 1g. As shown in Author response image 1, the background signal in the experiment related to Fig. 1i was relatively higher than in Fig. 1g and 1h. This elevated background, which may have been influenced by variations between cells and experimental days, resulted in a higher percent change from baseline in samples treated with AngII alone. However, the combined effect of AngII with oxLDL was still apparent. This clarification further supports the consistency of our findings.
Author response image 1.
In reference to the BRET sensor experiments, we acknowledge the reviewer’s concern regarding the variability in sensor responses. As outlined in Devost et al. (J Biol Chem. 2017), the sensitivity of AT1 intramolecular FlAsH-BRET biosensors in detecting conformational changes induced by AngII is highly dependent on the insertion site of the FlAsH sequence. In our experiments, co-treatment with oxLDL and AngII enhanced AT1 conformational changes, but this effect was only detectable with the CHO-LOX-1-AT1-3p3 sensor (with FlAsH inserted in the third intracellular loop), and not with the CHO-LOX-1-AT1-C-tail P1 sensor (with FlAsH inserted at the C-terminal tail). This differential sensitivity likely explains why only one sensor showed a significant response, highlighting the critical role of FlAsH insertion site selection in these assays. We hope these clarifications address the reviewer’s concerns and improve confidence in the significance of our findings.
(2) The authors then repeated similar studies using publicly available rat kidney epithelial and fibroblast cell lines that have an endogenous expression of AT1R and LOX1. In these studies, oxLDL in combination with AngiI also enhanced Gq signaling, while knocking down either AT1R or LOX1, and treatment with inhibitors of Gq and AT1R blocked the effects. Like the prior set of studies, however, the effects are very modest and there was significant inter-experimental variability, reducing confidence in the significance of the findings. The authors then tested for evidence that the enhanced Gq signaling could result in renal injury by comparing qPCR results for target genes. While the results show some changes, their significance is difficult to assess. A more global assessment of gene expression patterns would have been more appropriate. In parallel with the transcriptional studies, they tested for evidence of epithelial-mesenchymal transition (EMT) using a single protein marker (alpha-smooth muscle actin) and found that its expression increased significantly in cells treated with oxLDL and AngII, which was blocked by inhibition of Gq inhibition and AT1R. While the data are sound, their significance is also unclear since EMT is a highly controversial cell culture phenomenon. Compelling in vivo studies have shown that most if not all fibroblasts in the kidney are derived from interstitial cells and not a product of EMT. In the last set of studies using these cell lines, the authors examined the effects of AngII and oxLDL on cell proliferation as assayed using BrdU. These results are puzzling---while the two agents together enhanced proliferation which was effectively blocked by an inhibitor to either AT1R or Gq, silencing of LOX1 had no effect.
Thank you for your thorough review and comments. We acknowledge your concerns regarding the modest effects observed and the variability in experimental outcomes. We would like to address your points systematically.
(1) Gq signaling and experimental variability:
Regarding the question of Gq signaling in Fig. 3, as previously mentioned, the observed differences in the IP1 assay are likely due to the sensitivity of the assay and the technical issues associated with detecting calcium influx and IP1 levels. While the overall differences between treatments may appear modest, the most critical comparison— between AngII alone and AngII combined with oxLDL—consistently showed significant differences, which aligns with the calcium influx results shown in Fig. 1. Notably, we found that the EC50 for IP1 production decreased by 80% in response to co-treatment with oxLDL and AngII, compared to AngII treatment alone. These findings demonstrate the robustness of Gq signaling enhancement with co-treatment, even if the absolute differences in the IP1 assay appear small.
(2) Gene expression in Fig. 4:
Regarding the gene expression analysis in Fig. 4, we used relatively low concentrations of oxLDL (5 μg/ml) compared to the higher concentrations typically employed in other studies (mostly exceeding 20 μg/ml). This may explain the lack of robust responses in some conditions. However, in combination with AngII, the co-treatment significantly upregulated several genes, particularly pro-inflammatory markers such as IL-6, TNFα, IL1β, and MCP-1 in NRK49F cells. These results suggest that the co-treatment induces a complex response, potentially activating multiple downstream signaling pathways beyond just Gq signaling, which may obscure more straightforward effects.
While we agree that a more global assessment of gene expression would provide further insights, due to cost constraints, we focused on key representative genes that are highly relevant to inflammation and fibrosis in this study.
(3) EMT in renal fibrosis:
We appreciate the reviewer’s insightful comments regarding the role of EMT in renal fibrosis. Regarding full EMT, in which epithelial cells completely transition into mesenchymal cells, previous studies using the unilateral ureteral obstruction (UUO) model suggest that full EMT may not play a significant role (J Clin Invest. 2011 Feb;121(2):468-74). The role of full EMT remains controversial in the context of renal fibrosis, with most kidney fibroblasts thought to originate from interstitial cells rather than through full EMT.
Recent studies, however, suggest that partial epithelial-mesenchymal transition (pEMT) could be involved in CKD, especially in association with inflammation, oxidative stress, and elevated TGF-β levels—conditions also present in our model involving Ang II infusion combined with an HFD. pEMT refers to a state in which epithelial cells acquire mesenchymal traits, such as increased α-SMA expression and secretion of pro-fibrotic cytokines, while remaining attached to the basement membrane without fully transitioning into fibroblasts (Front Physiol. 2020 Sep 15;11:569322). This phenomenon has been observed in kidney fibrosis models, including UUO, which shares inflammatory and oxidative stress conditions with our Ang II and HFD treatment model. The observed increase in α-SMA in our model may thus indicate a pEMT-like state, indirectly contributing to fibrosis through the secretion of growth factors and cytokines.
We are mindful of the importance of not overstating EMT's role. Accordingly, we interpret increased α-SMA expression as a potential marker of the pEMT process rather than definitive evidence of its presence or direct role in fibroblast formation. Furthermore, we acknowledge limitations in providing direct in vivo evidence for pEMT and recognize that further mechanistic studies are needed to elucidate its specific role in renal fibrosis, despite inherent challenges.
In response to the reviewer’s concern, we have revised the manuscript to clarify that our data support the possibility of pEMT contributing to fibrosis in this model, without overstating its impact. We also acknowledge the challenges in translating in vitro pEMT findings to in vivo models, where detecting the subtle effects of pEMT is inherently challenging.
(4) BrdU assay and fibroblast proliferation (Fig. 6b):
In Fig. 6b, the BrdU assay shows that fibroblast proliferation was significantly enhanced by the co-treatment with AngII and oxLDL, and this effect was abolished by LOX-1 knockdown, similar to the results observed with AT1 knockdown. These findings strongly suggest a combinatorial effect of AT1/LOX-1 interaction in promoting fibroblast proliferation, supporting the idea that the co-treatment operates through a coordinated mechanism involving both receptors. Notably, LOX-1 silencing did not affect the proliferation induced by AngII alone, as this response is independent of LOX-1.
We will incorporate these points into the Discussion section of the manuscript, specifically regarding the differences in sensitivity between the Ca influx and IP1 assays, as well as the emerging role of partial EMT in renal fibrosis. This will provide a clearer context for the interpretation of our findings and further strengthen the discussion on the significance of these phenomena.
Thank you again for your valuable feedback, which has helped us improve the clarity and depth of our manuscript.
(3) The final set of studies looked to test the hypothesis in mice by treating WT and Lox1KO mice with different doses of AngII and either a normal or high-fat diet (to induce oxLDL formation). The authors found that the combination of high dose AngII and a highfat diet (HFD) increased markers of renal injury (urinary 8-ohdg and urine albumin) in normal mice compared to mice treated with just AngII or HFD alone, which was blunted in Lox1-KO mice). These results are consistent with their hypothesis. However, there are other aspects of these studies that are either inconsistent or complicating factors that limit the strength of the conclusions. For example, Lox1- KO had no effect on renal injury marker expression in mice treated with low-dose AngII and HFD. It also should be noted that Lox1-KO mice had a lower BP response to AngII, which could have reduced renal injury independent of any effects mediated by the AT1R/LOX1 interaction. Another confounding factor was the significant effect the HFD diet had on body weight. While the groups did not differ based on AngII treatment status, the HFD consistently was associated with lower total body weight, which is unexplained. Next, the authors sought to find more direct evidence of renal injury using qPCR of candidate genes and renal histology. The transcriptional results are difficult to interpret; moreover, there were no significant histologic differences between groups. They conclude the study by showing the pattern of expression of LOX1 and AT1R in the kidney by immunofluorescence and conclude that the proteins overlap in renal tubules and are absent from the glomerulus. Unfortunately, they did not co-stain with any other markers to identify the specific cell types. However, these results are inconsistent with other studies that show AT1R is highly expressed in mesangial cells, renal interstitial cells, near the vascular pole, JG cells, and proximal tubules but generally absent from most other renal tubule segments.
Thank you for your valuable comments and for raising these important points. We appreciate the opportunity to clarify several aspects of our study and address the limitations and inconsistencies you have pointed out.
(1) Renal injury markers (urinary albumin and 8-OHdG) and the effect of LOX-1 loss of- function:
Our results showed that the combination of high-dose AngII and HFD led to a significant increase in renal injury markers, such as urinary albumin and 8-OHdG, in WT mice. In LOX-1 KO mice, this increase was significantly blunted, supporting a protective role of LOX-1 loss-of-function. However, as you noted, at low-dose AngII, there was no significant difference in urinary 8-OHdG between ND-fed and HFD-fed mice. Despite this, we observed a significant increase in urinary albumin in HFD-fed WT mice compared to ND-fed mice under low-dose AngII, and this difference was abolished in LOX-1 KO mice. Moreover, gene expression analysis showed that oxidative stress markers such as p67phox and p91phox (Fig. 8b), as well as p40phox, p47phox (Fig. S8), and inflammatory markers like IL1β (Fig. 8b), were significantly elevated in HFD-fed WT mice even with low-dose AngII, while these increases were absent in LOX-1 KO mice. These results suggest that the LOX-1/AT1 interaction contributes to renal injury under both low- and high-dose AngII conditions.
We acknowledge that the treatment duration may have influenced our results, as urine and renal tissue samples were only examined at a single time point (1.5 months after treatment initiation). The impact of AT1/LOX-1 interaction may evolve over time, and different treatment durations might yield varying outcomes. This is a limitation of our study, which we have addressed in the revised manuscript.
(2) Blood pressure and its effect on renal injury:
As shown in Fig. 7b and Fig S6f, LOX-1 KO mice exhibited a lower blood pressure response to high-dose AngII compared to WT mice, which could indeed have contributed to the reduced renal injury in the LOX-1 KO group, independent of the AT1/LOX-1 interaction. However, it is important to note that the differences in renal injury markers between AngII alone and AngII + HFD were largely abolished in LOX-1 KO mice, suggesting the in vivo relevance of the LOX-1/AT1 interaction observed in vitro. Additionally, as shown in Fig. 7d (urinary albumin), Fig. 8b (p67phox, p91phox), and Fig. S8b (p40phox, p47phox), even under subpressor doses of AngII, where no significant blood pressure differences were observed, HFD-fed WT mice exhibited exacerbated renal injury compared to ND-fed mice. These effects were ameliorated in LOX-1 KO mice, indicating that the protective effects in LOX-1 KO mice are at least partly independent of blood pressure changes and that the AT1/LOX-1 interaction plays a significant role in modulating renal injury under co-treatment with AngII and HFD.
(3) HFD and body weight changes:
We agree with your observation regarding the effect of HFD on body weight, which was consistently lower in HFD-fed groups, despite no differences in AngII treatment status. This is an atypical presentation compared to previous studies mostly showing increased body weight by feeding of HFD. The HFD used in this study was intended to elevate oxLDL levels, as previously reported (Atherosclerosis 200:303–309 (2008)). As shown in Fig. S6d and S6e, this can be attributed to reduced food intake in HFD-fed mice. Although modest, this weight reduction may influence renal function. This point is added in the limitation.
(4) Histological findings and qPCR results:
As discussed in the manuscript, despite significant changes in urinary markers and gene expression, we did not observe histological evidence of fibrosis or mesangial expansion, even under co-treatment with AngII and HFD. This may be due to the relatively short treatment period of 4 weeks, and a longer duration might be necessary to detect such changes. Additionally, we acknowledge that we did not detect increased Gq signaling in kidney tissue, which is another limitation of the study. Nevertheless, the gene expression data on oxidative stress, fibrosis, inflammation, and renal injury markers (e.g., p67phox, IL1β) are consistent with our hypothesis that the AT1/LOX-1 interaction exacerbates renal injury under AngII and HFD conditions.
(5) Immunostaining for AT1 and LOX-1:
Due to the use of rabbit-derived antibodies for both AT1 and LOX-1, it was technically not feasible to perform co-immunostaining for both receptors simultaneously. Instead, we performed co-immunofluorescent staining using megalin, a well-established marker of proximal renal tubules, to help localize these receptors. As shown in Fig. S10, both AT1 and LOX-1 were co-localized with megalin, particularly at the brush borders of proximal tubules. This pattern suggests the presence of these receptors in renal compartments relevant to AT1/LOX-1 signaling. While we did not perform additional co-staining with other markers to identify specific cell types, the strong localization with megalin provides robust evidence of their expression in proximal renal tubules, which is consistent with the literature on AT1R in this nephron segment. We acknowledge that previous studies have identified AT1R expression in mesangial cells, renal interstitial cells, the vascular pole, juxtaglomerular (JG) cells, and proximal tubules. In our immunofluorescence experiments, we did not detect significant AT1R expression in the glomerulus or mesangium. This finding aligns with other reports showing strong expression of AT1R in proximal tubules (Am J Physiol Renal Physiol. 2021 Apr 1;320(4)), although it does not exclude the possibility of AT1 expression in other compartments, given the sensitivity limitations of the immunofluorescence. Our focus on proximal tubules allowed us to observe clear AT1/LOX-1 co-localization in this region, particularly in the context of oxLDL and AngII signaling. Given that the AT1/LOX-1 interaction is crucial in kidney disease pathogenesis, this co-localization in proximal tubules highlights a key site of action for these receptors in the renal system.
In summary, while our study focused on the co-localization of AT1 and LOX-1 in proximal tubules, we agree that further exploration of AT1R expression in other renal cell types would provide a more comprehensive understanding of its role across different kidney compartments. We have addressed this in the revised discussion.
Reviewer #1 (Recommendations For The Authors):
Minor points:
(1) In this study, AT1/LOX1 receptor complex was mainly observed in some renal cells, how about other types of cells that also highly express LOX1 and AT1r? Such as cardiomyocytes? Vascular endothelial cells?
Thank you for your insightful comment. In our study, we demonstrated that enhanced Gq signaling through co-treatment with AngII and oxLDL was not observed in other cell types, including vascular endothelial cells, smooth muscle cells, and macrophages, as indicated by the lack of an IP1 increase in response to the co-treatment (Fig. S2). The factors contributing to this heterogeneous response remain unclear, and further investigation is needed to explore this observation more thoroughly.
(2) Has the author detected such an effect on the AT2 receptor?
We greatly appreciate the reviewer’s insightful inquiry regarding the potential interaction between the AT2 receptor and LOX-1. In our previous work (Yamamoto et al., FASEB J 2015), we conducted an immunoprecipitation (IP) assay to investigate the interaction between LOX-1 and AT2 on cell membranes. The results of this assay demonstrated that, unlike AT1, LOX-1 exhibits minimal binding to the AT2 receptor under the experimental conditions tested. Specifically, our IP studies showed that while LOX-1 readily coimmunoprecipitated with AT1, indicating a strong interaction, this was not the case with AT2, where the binding was negligible. These findings suggest that the interaction between LOX-1 and AT1 is receptor-specific and that LOX-1 does not significantly associate with AT2 to influence signaling pathways.
(3) Which kind of ARBs are more effective for the inhibition of this AT1/LOX1 receptor conformational change?
Thank you for your insightful question regarding the effectiveness of ARBs in inhibiting the AT1/LOX-1 receptor conformational change. Based on our current understanding, any ARB should similarly block the downstream signaling resulting from the interaction between AT1 and LOX-1. This is because all ARBs function by inhibiting the binding of Ang II to AT1, thereby preventing receptor activation and the conformational changes that facilitate its interaction with LOX-1. Additionally, our previous study (FASEB J. 2015) demonstrated that even in the absence of Ang II, the activation of AT1 via the binding of oxLDL to LOX-1 was similarly blocked by ARBs, including olmesartan, telmisartan, valsartan, and losartan.
When oxLDL and Ang II are co-treated, the Gq signaling pathway is significantly amplified due to the interaction between LOX-1 and AT1. In this setting, all ARBs act by competitively inhibiting Ang II binding to AT1, effectively reducing Gq signaling.
However, a subtle but important difference arises when considering the inverse agonist activity of certain ARBs. Olmesartan, telmisartan, and valsartan are thought to act not only as competitive inhibitors of Ang II but also as inverse agonists, meaning they reduce the baseline activity of the AT1 receptor by preventing the conformational changes in the absence of Ang II. This inverse agonist property is particularly relevant in pathological conditions where AT1 receptor activation can occur independently of Ang II binding, such as in the presence of oxLDL. In these cases, ARBs with inverse agonist activity may offer an additional therapeutic advantage by reducing receptor activation beyond what is achieved by simple antagonism.
Thus, while the general efficacy of ARBs in blocking the AT1/LOX-1 interaction could be under similar conditions of oxLDL and Ang II co-treatment, ARBs with inverse agonist properties may provide additional benefit by further reducing AT1 activity.
We have revised the manuscript to clarify these points and to highlight the role of inverse agonist activity in ARB efficacy under these conditions.
Thank you again for your valuable comment, which has allowed us to refine our discussion on the relative efficacy of ARBs in inhibiting AT1/LOX-1 receptor interaction.
Reviewer #2 (Recommendations For The Authors):
My comments were pretty thorough in the public review. The only other comments I would add are the following:
(1) Why are there so few overlapping LOX1 and ATR puncta in Supplementary Figure 1 if the receptors co-localize? The figure would suggest a very small proportion of the receptors actually are co-localized.
Thank you for your insightful comment regarding the apparent scarcity of overlapping LOX-1 and AT1R puncta in Fig. S1. We agree that at first glance, the low number of colocalized puncta may raise questions about the extent of interaction between these receptors. However, based on our previous findings reported in FASEB J 2015, we believe this phenomenon can be explained by the dynamic nature of the LOX-1 and AT1 interaction.
As we reported in FASEB J 2015, the interaction between LOX-1 and AT1 is sensitive to buffer conditions. Specifically, in non-reducing conditions, LOX-1 and AT1 form complexes, whereas in reducing buffer, this interaction is not observed. This suggests that the interaction between these receptors is not stabilized by strong covalent (disulfide) bonds but is instead transient, likely involving non-covalent interactions. Thus, LOX-1 and AT1 may form and dissociate repeatedly, contributing to a dynamic receptor complex rather than a permanent colocalization. This transient interaction could explain the relatively low number of overlapping puncta observed at a given time point in the liveimaging analysis.
Moreover, as you pointed out, it is likely that only a small fraction of LOX-1 and AT1 are physically co-localized at any one moment. However, when these receptors do interact, co-treatment with oxLDL and Ang II has been shown to significantly enhance Gq signaling. This suggests that the functional consequence of the LOX-1/AT1 interaction, particularly in response to stimuli such as oxLDL and Ang II, is more critical than the frequency of receptor colocalization at any one time.
We have revised the manuscript to include this explanation and to clarify the dynamic nature of the LOX-1/AT1 interaction. This revision also highlights the importance of considering not just the number of colocalized receptors but also the functional outcomes of their interaction, such as enhanced Gq signaling in response to co-treatment.
Thank you again for your careful observation, which has allowed us to better communicate the complexity of the receptor dynamics in our study.
(2) Tubulin is misspelled in Figure 5 ("tublin").
Thank you for pointing out the typographical error in Fig. 5. We have corrected the spelling of "tubulin" in the revised figure. We appreciate your attention to detail, and we apologize for the oversight.
(3) Why does the number of replicates differ for some experimental sets (i.e. Figure 1h vs other panels in Figure 1, Figure 2d vs other panels in Figure 2, Figure 7: Lox-1KO treated with High dose AngII and HFD? There aren't obvious reasons why the number of replicates should differ so much within a set of studies.
We are grateful to the reviewer for highlighting the discrepancies in the number of replicates across different figures in our manuscript. We would like to provide detailed explanations for each case.
(1) Fig. 1h vs Other Panels in Fig. 1:
The calcium influx assay (Fig. 1h) required a higher number of replicates due to the inherent biological variability associated with calcium signaling. To achieve statistical significance and account for variability in these measurements, we conducted additional replicates. Other panels, such as those measuring IP1 accumulation (Fig. 1a–f), displayed more consistent and reproducible results, allowing us to use fewer replicates while still maintaining statistical power.
(2) Fig. 2d vs Fig. 2b and 2c:
The difference in the number of replicates between Fig. 2d (N=8) and Fig. 2b and 2c (N=4) is due to the distinct nature of the measurements and the variability expected in each assay. In Fig. 2d, which measures the effects of a LOX-1 neutralizing antibody on BRET, additional replicates were needed to ensure the robustness of the statistical analysis due to the greater complexity and sensitivity of the assay. The inclusion of an antibody treatment introduces more variability, necessitating a higher number of replicates (N=8) to confidently assess the effects of the neutralizing antibody. In contrast, Fig. 2b and 2c involved BRET measurements of AT1 conformational changes without antibody intervention. These assays are more reproducible and have less experimental variability, allowing for a smaller sample size (N=4) while still achieving reliable and statistically significant results. The differences in sample size across these panels were carefully considered to ensure appropriate statistical power for each specific experimental condition.
(3) Fig. 7: LOX-1 KO Mice Treated with High-dose AngII vs Saline:
We acknowledge the reviewer’s concern regarding the higher number of LOX-1 KO mice treated with high-dose Ang II compared to the saline group. The number of saline-treated mice was indeed sufficient for reliable statistical analysis. However, the decision to increase the number of mice in the high-dose Ang II group was driven by the anticipated higher variability in the physiological responses under these conditions, such as blood pressure and renal injury. To ensure that we captured the full spectrum of responses and to maintain robust statistical power in the high-dose group, we opted to include more mice in this cohort.
We hope this response provides clarity on the rationale behind the varying number of replicates across different experiments. We have rigorously applied appropriate statistical methods to account for these differences, ensuring that the conclusions drawn are robust and scientifically sound. We appreciate the reviewer’s understanding of the experimental constraints and variations that can arise in complex studies such as these.
-
-
www.biorxiv.org www.biorxiv.org
-
eLife assessment
This fundamental work describes for the first time the combined gene expression and chromatin structure at the genome level in isolated chondrocytes and classical (cranial) and non-classical (notochordal) osteoblasts. In a compelling analysis of RNA-Seq and ATAC data, the authors characterize the two osteoblast populations relative to their associated chondrocyte cells and further proceed with a convincing analysis of the crucial entpd5a gene regulatory elements by investigating their respective transcriptional activity and specificity in developing zebrafish.
-
Reviewer #1 (Public Review):
Summary:
This work uses transgenic reporter lines to isolate entpd5a+ cells representing classical osteoblasts in the head and non-classical (osterix-) notochordal sheath cells. The authors also include entpd5a- cells, col2a1a+ cells to represent the closely associated cartilage cells. In a combination of ATAC and RNA-Seq analysis, the genome-wide transcriptomic and chromatin status of each cell population is characterized, validating their methodology and providing fundamental insights into the nature of each cell type, especially the less well-studied notochordal sheath cells. Using these data, the authors then turn to a thorough and convincing analysis of the regulatory regions that control the expression of the entpd5a gene in each cell population. Determination of transcriptional activities in developing zebrafish, again combined with ATAC data and expression data of putative regulators, results in a compelling and detailed picture of the regulatory mechanisms governing the expression of this crucial gene.
Strengths:
The major strength of this paper is the clever combination of RNA-Seq and ATAC analysis, further combined with functional transcriptional analysis of the regulatory elements of one crucial gene. This results in a very compelling story.
Weaknesses:
No major weaknesses were identified, except for all the follow-up experiments that one can think of, but that would be outside of the scope of this paper.
-
Reviewer #2 (Public Review):
Summary:
Complementary to mammalian models, zebrafish has emerged as a powerful system to study vertebrate development and to serve as a go-to model for many human disorders. All vertebrates share the ancestral capacity to form a skeleton. Teleost fish models have been a key model to understand the foundations of skeletal development and plasticity, pairing with more classical work in amniotes such as the chicken and mouse. However, the genetic foundation of the diversity of skeletal programs in teleosts has been hampered by mapping similarities from amniotes back and not objectively establishing more ancestral states. This is most obvious in systematic, objective analysis of transcriptional regulation and tissue specification in differentiated skeletal tissues. Thus, the molecular events regulating bone-producing cells in teleosts have remained largely elusive. In this study, Petratou et al. leverage spatial experimental delineation of specific skeletal tissues -- that they term 'classical' vs 'non-classical' osteoblasts -- with associated cartilage of the endo/peri-chondrial skeleton and inter-segmental regions of the forming spine during development of the zebrafish, to delineate molecular specification of these cells by current chromatin and transcriptome analysis. The authors further show functional evidence of the utility of these datasets to identify functional enhancer regions delineating entp5 expression in 'classical' or 'non-classical' osteoblast populations. By integration with paired RNA-seq, they delineate broad patterns of transcriptional regulation of these populations as well as specific details of regional regulation via predictive binding sites within ATACseq profiles. Overall the paper was very well written and provides an essential contribution to the field that will provide a foundation to promote modeling of skeletal development and disease in an evolutionary and developmentally informed manner.
Strengths:
Taken together, this study provides a comprehensive resource of ATAC-seq and RNA-seq data that will be very useful for a wide variety of researchers studying skeletal development and bone pathologies. The authors show specificity in the different skeletal lineages and show the utility of the broad datasets for defining regulatory control of gene regulation in these different lineages, providing a foundation for hypothesis testing of not only agents of skeletal change in evolution but also function of genes and variations of unknown significance as it pertains to disease modeling in zebrafish. The paper is excellently written, integrating a complex history and experimental analysis into a useful and coherent whole. The terminology of 'classical' and 'non-classical' will be useful for the community in discussing the biology of skeletal lineages and their regulation.
Weaknesses:
Two items arose that were not critical weaknesses but areas for extending the description of methods and integration into the existing data on the role of non-classical osteoblasts and establishment/canalization of this lineage of skeletal cells.
(1) In reading the text it was unclear how specific the authors' experimental dissection of the head/trunk was in isolating different entp5a osteoblast populations. Obviously, this was successful given the specificity in DEG of results, however, analysis of contaminating cells/lineages in each population would be useful - e.g. using specific marker genes to assess. The text uses terms such as 'specific to' and 'enriched in' without seemingly grounded meaning of the accuracy of these comments. Is it really specific - e.g. not seen in one or other dataset - or is there some experimental variation in this?
(2) Further, it would be valuable to discuss NSC-specific genes such as calymmin (Peskin 2020) which has species and lineage-specific regulation of non-classical osteoblasts likely being a key mechanistic node for ratcheting centra-specific patterning of the spine in teleost fishes. What are dynamics observed in this gene in datasets between the different populations, especially when compared with paralogues - are there obvious cis-regulatory changes that correlate with the co-option of this gene in the early regulation of non-classical osteoblasts? The addition of this analysis/discussion would anchor discussions of the differential between different osteoblasts lineages in the paper.
-
Reviewer #3 (Public Review):
Summary:
This study characterizes classical and nonclassical osteoblasts as both types were analyzed independently (integrated ATAC-seq and RNAseq). It was found that gene expression in classical and nonclassical osteoblasts is not regulated in the same way. In classical osteoblasts, Dlx family factors seem to play an important role, while Hox family factors are involved in the regulation of spinal ossification by nonclassical osteoblasts. In the second part of the study, the authors focus on the promoter structure of entpd5a. Through the identification of enhancers, they reveal complex modes of regulation of the gene. The authors suggest candidate transcription factors that likely act on the identified enhancer elements. All the results taken together provide comprehensive new insights into the process of bone development, and point to spatio-temporally regulated promoter/enhancer interactions taking place at the entpd5a locus.
Strengths:
The authors have succeeded in justifying a sound and consistent buildup of their experiments, and meaningfully integrating the results into the design of each of their follow-up experiments. The data are solid, insightfully presented, and the conclusion valid. This makes this manuscript of great value and interest to those studying (fundamental) skeletal biology.
Weaknesses:
The study is solidly constructed, the manuscript is clearly written and the discussion is meaningful - I see no real weaknesses.
-
-
www.biorxiv.org www.biorxiv.org
-
eLife Assessment
Graca et al. reports a fundamental missing link in the ethanol metabolism of mycobacteria and illuminates the role of a flavoprotein dehydrogenase that acts as an electron shuttle between an uncommon redox cofactor and the electron transport chain. Overall, the data presented are compelling, supported by a range of well designed and meticulous experiments. The findings will be of broad interest to researchers investigating bacterial metabolism.
-
Reviewer #1 (Public review):
Using genetically engineered Mycolicibacterium smegmatis strains, the authors tried to decipher the role of the last gene in the mycofactocin operon, mftG. They found that MftG was essential for growth in the presence of ethanol as the sole carbon source, but not for the metabolism of ethanol, evidenced by the equal production of acetaldehyde in the mutant and wild type strains when grown with ethanol (Fig 3). The phenotypic characterization of ΔmftG cells revealed a growth-arrest phenotype in ethanol, reminiscent of starvation conditions (Fig 4). Investigation of cofactor metabolism revealed that MftG was not required to maintain redox balance via NADH/NAD+, but was important for energy production (ATP) in ethanol. Since mycobacteria cannot grow via substrate-level phosphorylation alone, this pointed to a role of MftG in respiration during ethanol metabolism. The accumulation of reduced mycofactocin points to impaired cofactor cycling in the absence of MftG, which would impact the availability of reducing equivalents to feed into the electron transport chain for respiration (Fig 5). This was confirmed when looking at oxygen consumption in membrane preparations from the mutant and wild type strains with reduced mycofactocin electron donors (Fig 7). The transcriptional analysis supported the starvation phenotype, as well as perturbations in energy metabolism.
The link between mycofactocin oxidation and respiration is shown by whole-cell and membrane respiration measurements. I look forward to seeing what the electron acceptor/s are for MftG. Overall, the data and conclusions support the role of MftG in ethanol metabolism as a mycofactocin redox enzyme.
-
Reviewer #3 (Public review):
Summary:
The work by Graca et al. describes a GMC flavoprotein dehydrogenase (MftG) in the ethanol metabolism of mycobacteria and provides evidence that it shuttles electrons from the mycofactocin redox cofactor to the electron transport chain.
Strengths:
Overall, this study is compelling, exceptionally well-designed and thoroughly conducted. An impressively diverse set of different experimental approaches is combined to pin down the role of this enzyme and scrutinize the effects of its presence or absence in mycobacteria cells growing on ethanol and other substrates. Other strengths of this work are the clear writing style and stellar data presentation in the figures, which makes it easy also for non-experts to follow the logic of the paper. Overall, this work therefore closes an important gap in our understanding of ethanol oxidation in mycobacteria, with possible implications for the future treatment of bacterial infections.
Weaknesses:
I see no major weaknesses in this work, which in my opinion leaves no doubt about the role of MftG.
-
Reviewer #4 (Public review):
Summary:
The manuscript by Graça et al. explores the role of MftG in the ethanol metabolism of mycobacteria. The authors hypothesise that MftG functions as a mycofactocin dehydrogenase, regenerating mycofactocin by shuttling electrons to the respiratory chain of mycobacteria. Although the study primarily uses M. smegmatis as a model microorganism, the findings have more general implications for understanding mycobacterial metabolism. Identifying the specific partner to which MftG transfers its electrons within the respiratory chain of mycobacteria would be an important next step, as pointed out by the authors.
Strengths
The authors have used a wide range of tools to support their hypothesis, including co-occurrence analyses, gene knockout and complementation experiments, as well as biochemical assays and transcriptomics studies.<br /> An interesting observation that the mftG deletion mutant grown on ethanol as the sole carbon source exhibited a growth defect resembling a starvation phenotype.<br /> MftG was shown to catalyse the electron transfer from mycofactocinol to components of the respiratory chain, highlighting the flexibility and complexity of mycobacterial redox metabolism.
The authors have taken on the majority of recommendations by the reviewers and made changes in the manuscript accordingly. I don't have any further suggestions.
-
Author response:
The following is the authors’ response to the previous reviews.
Public Reviews:
Reviewer #1 (Public review):
Using a knock-out mutant strain, the authors tried to decipher the role of the last gene in the mycofactocin operon, mftG. They found that MftG was essential for growth in the presence of ethanol as the sole carbon source, but not for the metabolism of ethanol, evidenced by the equal production of acetaldehyde in the mutant and wild type strains when grown with ethanol (Fig 3). The phenotypic characterization of ΔmftG cells revealed a growth-arrest phenotype in ethanol, reminiscent of starvation conditions (Fig 4). Investigation of cofactor metabolism revealed that MftG was not required to maintain redox balance via NADH/NAD+, but was important for energy production (ATP) in ethanol. Since mycobacteria cannot grow via substrate-level phosphorylation alone, this pointed to a role of MftG in respiration during ethanol metabolism. The accumulation of reduced mycofactocin points to impaired cofactor cycling in the absence of MftG, which would impact the availability of reducing equivalents to feed into the electron transport chain for respiration (Fig 5). This was confirmed when looking at oxygen consumption in membrane preparations from the mutant and would type strains with reduced mycofactocin electron donors (Fig 7). The transcriptional analysis supported the starvation phenotype, as well as perturbations in energy metabolism, and may be beneficial if described prior to respiratory activity data.
The data and conclusions support the role of MftG in ethanol metabolism.
We thank the reviewer for the positive evaluation of our manuscript.
Reviewer #3 (Public review):
Summary:
The work by Graca et al. describes a GMC flavoprotein dehydrogenase (MftG) in the ethanol metabolism of mycobacteria and provides evidence that it shuttles electrons from the mycofactocin redox cofactor to the electron transport chain.
Strengths:
Overall, this study is compelling, exceptionally well designed and thoroughly conducted. An impressively diverse set of different experimental approaches is combined to pin down the role of this enzyme and scrutinize the effects of its presence or absence in mycobacteria cells growing on ethanol and other substrates. Other strengths of this work are the clear writing style and stellar data presentation in the figures, which makes it easy also for non-experts to follow the logic of the paper. Overall, this work therefore closes an important gap in our understanding of ethanol oxidation in mycobacteria, with possible implications for the future treatment of bacterial infections.
Weaknesses:
I see no major weaknesses of this work, which in my opinion leaves no doubt about the role of MftG.
We thank the reviewer for the positive evaluation of our manuscript.
Reviewer #4 (Public review):
Summary:
The manuscript by Graça et al. explores the role of MftG in the ethanol metabolism of mycobacteria. The authors hypothesise that MftG functions as a mycofactocin dehydrogenase, regenerating mycofactocin by shuttling electrons to the respiratory chain of mycobacteria. Although the study primarily uses M. smegmatis as a model microorganism, the findings have more general implications for understanding mycobacterial metabolism. Identifying the specific partner to which MftG transfers its electrons within the respiratory chain of mycobacteria would be an important next step, as pointed out by the authors.
Strengths:
The authors have used a wide range of tools to support their hypothesis, including co-occurrence analyses, gene knockout and complementation experiments, as well as biochemical assays and transcriptomics studies.
An interesting observation that the mftG deletion mutant grown on ethanol as the sole carbon source exhibited a growth defect resembling a starvation phenotype.
MftG was shown to catalyse the electron transfer from mycofactocinol to components of the respiratory chain, highlighting the flexibility and complexity of mycobacterial redox metabolism.
Weaknesses:
Could the authors elaborate more on the differences between the WT strains in Fig. 3C and 3E? in Fig. 3C, the ethanol concentration for the WT strain is similar to that of WT-mftG and ∆mftG-mftG, whereas the acetate concentration in thw WT strain differs significantly from the other two strains. How this observation relates to ethanol oxidation, as indicated on page 12.
This is a good question, and we agree with the reviewer that the sum of processes leading to the experimental observations shown in Figure 3 are not completely understood. For instance, when looking at ethanol concentrations, evaporation is a dominating effect and the situation is furthermore confounded by the fact that the rate of ethanol evaporation appears to be inversely correlated to the optical density of the samples (see Figure 3E and compare media control as well as the samples of DmftG and DmftG at OD<sub>600</sub> = 1). Additionally, the growth rate and thus the OD<sub>600</sub> of all strains monitored are different at each time point, thus further complicating the analysis. This is why we assume that the rate of ethanol oxidation is mirrored more clearly by acetate formation, at least in the early phase before 48 h (Figure 3E),i.e., before acetate consumption becomes dominant in DmftG-mftG and WT-mftG. Here, we see that the rate of acetate formation is zero for media controls, low for DmftG, but high for WT as well as DmftG-mftG and WT-mftG. The latter two strains also showed an earlier starting point of growth as well as acetate formation and the following phase of acetate depletion.
All of these observations are in line with our general statement, i.d., “Parallel to the accelerated and enhanced growth described above (Figure 3A), the overexpression strains displayed higher rates of ethanol consumption as well as an earlier onset of acetate overflow metabolism and acetate consumption (Figure 3D).” We are still convinced that this summary describes the findings well and avoids unnecessary speculation.
The authors conclude from their functional assays that MftG catalyses single-turnover reactions, likely using FAD present in the active site as an electron acceptor. While this is plausible, the current experimental set up doesn't fully support this conclusions, and the language around this claim should be softened.
This is a fair point. We revised our claim accordingly. In particular, we changed:
Page 28: we added “possibly”
Page 28 we changed “single-turnover reactions” to “reactions reminiscent of a single-turnover process”.
The authors suggest in the manuscript that the quinone pool (page 24) may act as the electron acceptor from mycofactocinol, but later in the discussion section (page 30) they propose cytochromes as the potential recipients. If the authors consider both possibilities valid, I suggest discussing both options in the manuscript.
This is true. However, no change to the manuscript is necessary, since both options were discussed on page 30.
Recommendations for the authors:
Reviewer #1 (Recommendations for the authors):
The authors addressing some of the original recommendations is appreciated e.g. title change. Other recommendations that were not adequately addressed would mostly improve the clarity and help comprehension for the reader, but they are at the author's discretion.
Reviewer #3 (Recommendations for the authors):
Abstract: "Here, we show that MftG enzymes strictly require mft biosynthetic genes and are found in 75% of organisms harboring these genes". I read this sentence several times and I am still somewhat confused and not sure what exactly is meant here. I suggest to rephrase, e.g., to "Here, we show that in 75% of all organisms that harbour the mft biosynthetic genes, MftG enzymes are also encoded and functionally associated with these genes" (if that was meant; also the abbreviation mft should be introduced in the abstract or otherwise the full name be used).
We thank the reviewer for the good hint. We changed the sentence to “Here, we show that MftG enzymes are almost exclusively found in genomes containing mycofactocin biosynthetic genes and are present in 75% of organisms harboring these genes”.
p.3, 2nd paragraph: "Although the role of MFT in alcohol metabolism is well established, further biological roles of mycofactocin appear to exist." Mycofactocin is once written as MFN and once in full length, which is slightly confusing. Consider rephrasing, e.g., to "...further biological roles of this cofactor appear to exist".
Thank you, we adopted the suggested change.
Fig. 1: Consider adding MftG in brackets after "mycofactocin dehydrogenase" in panel B.
Good suggestion. We added (MftG) to the figure.
Fig. 3: Legend should be corrected. The color of the signs should be teal diamond for "M. smegmatis double presence of the mftG gene" and orange upward facing triangle for "Medium with 10 g L-1 of ethanol without bacterial inoculation". Aside from the coloration, the order should ideally also be identical to the one shown in the upper right part.
Thank you for the valuable hint! We corrected the legend and unified the legends in the figure caption and figure.
p.20 : It is not exactly clear to me why "semipurified cell-free extracts from M. smegmatis ∆mftG-mftGHis6 " were used here rather than the purified enzyme. Was the purification by HisTrap columns not feasible or was the protein unstable when fully purified? In any case, it would help the reader to quickly state the reason in this section.
Indeed, the problem with M. smegmatis as an expression host was a combination of low protein yield and poor binding to Ni-NTA columns. In E. coli, poor expression, low solubility or poor binding was the issue. Unfortunately, the usage of other affinity tags resulted in either poor expression or inactive protein. We have shortly mentioned the major issues on page 21 and prefer not to focus on failed attempts too much.
p. 21: "We, therefore, concluded that MftG can indeed interact with mycofactocins as electron donors but might require complex electron acceptors, for instance, proteins present in the respiratory chain." I agree. For the future it might be worthwhile to determine the redox potential of MftG, which could provide hints on the natural electron acceptor.
Thank you for the suggestion. We will consider this question in our future work.
p. 23: "In M. smegmatis, cyanide is a known inhibitor of the cytochrome bc/aa3 but not of cytochrome bd (34), therefore, the decrease of oxygen consumption when MFTs were added to the membrane fractions in combination with KCN (Figure 7), revealed that MFT-induced oxygen consumption is indeed linked to mycobacterial respiration." It might be a good idea to quickly recapitulate the functions of these cytochromes here. Also, I think it should read "bc1aa3" (also correct in legend of Fig. 8 that says "bcc-aa3").
Thank you for the good observation. We changed all instances to the correct designation (bc1-aa3).
Reviewer #4 (Recommendations for the authors):
Abstract: revise the wording "MftG enzymes strictly require mft biosynthetic genes". It should be either mftG gene with the mft biosynthetic genes or MftG enzyme with the Mft biosynthetic proteins. I also suggest replacing "require" with a more appropriate term.
This was taken care of. See above.
Page 3, end of the first paragraph; does the alcohol dehydrogenase refer to Mno/Mdo?
Partially, yes, but also to other alcohol dehydrogenases.
Page 4, radical SAM; define upon first use
Good, point, we changed “radical SAM” to radical S-adenosyl methionine (rSAM)
Page 6; Rossman fold refers to the fold and not only the FAD binding pocket.
Good point. We deleted “(Rossman fold)”
Page 11; not exactly sure what this means "the growth curve of the complemented strain, which could be dysregulated in mftG expression"
By “dysregulated” expression, we mean that the expression of mftG could be higher or lower than in the WT and could follow different regulatory signals than in the wild type. Since this phenomenon is not well understood, we would like to avoid speculative discussions.
Page 11; Figures 2E and 2C should be 3E and 3C. Likewise on page 12 Figure 2D.
Thank you very much for the valuable hint. We corrected the figure numbers as suggested.
Page 12; the last Figure 3D in the page should be 3E?
Yes, good catch, we corrected the Figure number.
Page 17, KO; define upon first use.
Good suggestion, we changed both instances of “KO” to “knockout”
Page 24; revise: "for instance. For example"
We deleted “for instance”.
Page 26; change 6.506 to 6,506
Corrected.
Page 23; "In M. smegmatis, cyanide is a known inhibitor ..." is too long and not easy to understand/follow.
Good suggestion. We simplified the sentence to “Therefore, the decrease of oxygen consumption in the presence of KCN (Figure 7) revealed…”
Page 29; "single-turnover reactions could be observed". There are no experiments to support this statement, except the results shown in Figure 7F. I suggest softening the language, as it has been done on page 21. To claim single-turnover, a proper kinetic analysis would be necessary, which is not included in the current manuscript.
This is true and has been taken care of. See above.
Figure 1; Indicate mycofactocin dehydrogenase as MftG
Done.
Figure 5A; what is the significance of comparing ∆mftG glucose with WT ethanol?
We agree, that, although the difference of the two columns is significant, this does not have any relevant meaning. Therefore, we removed the bracket with p-value in Panel A.
Make HdB-Tyl/HdB-tyloxapol usage consistent throughout the document. Likewise, re the usage of mycobacteria/Mycobacteria/Mycobacteria
Thank you for the valuable hint, we unified the usage throughout the document
-
-
www.biorxiv.org www.biorxiv.org
-
eLife Assessment
In this valuable study, Roiuk et al employed a combination of ribosome profiling and reporter assays to provide convincing evidence that eIF2A is not involved in translational regulation in cultured human cells. In conjunction with several recent publications (spanning yeast to mammalian systems), these findings disaffirm the previously proposed role of eIF2A in directing protein synthesis, including its implication in translational reprogramming under stress. Whilst clearly delinating something eIF2A does not do, identifying cellular role(s) for eIF2A could further strengthen this article.
-
Reviewer #1 (Public review):
Summary:
Beyond what is stated in the title of this paper, not much needs to be summarized. eIF2A in HeLa cells promotes translation initiation of neither the main ORFs nor short uORFs under any of the conditions tested.
Strengths:
Very comprehensive, in fact, given the huge amount of purely negative data, an admirably comprehensive and well-executed analysis of the factor of interest.
Weaknesses:
The study is limited to the HeLa cell line, focusing primarily on KO of eIF2A and neglecting the opposite scenario, higher eIF2A expression which could potentially result in an increase in non-canonical initiation events.
-
Reviewer #2 (Public review):
Summary
Roiuk et al describe a work in which they have investigated the role of eIF2A in translation initiation in mammals without much success. Thus, the manuscript focuses on negative results. Further, the results, while original, are generally not novel, but confirmatory, since related claims have been made before independently in different systems with Haikwad et al study recently published in eLife being the most relevant.
Despite this, we find this work highly important. This is because of a massive wealth of unreliable information and speculations regarding eIF2A role in translation arising from series of artifacts that began at the moment of eIF2A discovery. This, in combination with its misfortunate naming (eIF2A is often mixed up with alpha subunit of eIF2, eIF2S1) has generated a widespread confusion among researchers who are not experts in eukaryotic translation initiation. Given this, it is not only justifiable but critical to make independent efforts to clear up this confusion and I very much appreciate the authors' efforts in this regard.
Strengths
The experimental investigation described in this manuscript is thorough, appropriate and convincing.
Weaknesses
However, we are not entirely satisfied with the presentation of this work which we think should be improved.
-
Reviewer #3 (Public review):
Summary:
This is a valuable study providing solid evidence that the putative non-canonical initiation factor eIF2A has little or no role in the translation of any expressed mRNAs in cultured human (primarily HeLa) cells. Previous studies have implicated eIF2A in GTP-independent recruitment of initiator tRNA to the small (40S) ribosomal subunit, a function analogous to canonical initiation factor eIF2, and in supporting initiation on mRNAs that do not require scanning to select the AUG codon or that contain near-cognate start codons, especially upstream ORFs with non-AUG start codons, and may use the cognate elongator tRNA for initiation. Moreover, the detected functions for eIF2A were limited to, or enhanced by, stress conditions where canonical eIF2 is phosphorylated and inactivated, suggesting that eIF2A provides a back-up function for eIF2 in such stress conditions. CRISPR gene editing was used to construct two different knock-out cell lines that were compared to the parental cell line in a large battery of assays for bulk or gene-specific translation in both unstressed conditions and when cells were treated with inhibitors that induce eIF2 phosphorylation. None of these assays identified any effects of eIF2A KO on translation in unstressed or stressed cells, indicating little or no role for eIF2A as a back-up to eIF2 and in translation initiation at near-cognate start codons, in these cultured cells.
The study is very thorough and generally well executed, examining bulk translation by puromycin labeling and polysome analysis and translational efficiencies of all expressed mRNAs by ribosome profiling, with extensive utilization of reporters equipped with the 5'UTRs of many different native transcripts to follow up on the limited number of genes whose transcripts showed significant differences in translational efficiencies (TEs) in the profiling experiments. They also looked for differences in translation of uORFs in the profiling data and examined reporters of uORF-containing mRNAs known to be translationally regulated by their uORFs in response to stress, going so far as to monitor peptide production from a uORF itself. The high precision and reproducibility of the replicate measurements instil strong confidence that the myriad of negative results they obtained reflects the lack of eIF2A function in these cells rather than data that would be too noisy to detect small effects on the eIF2A mutations. They also tested and found no evidence for a recent claim that eIF2A localizes to the cytoplasm in stress and exerts a global inhibition of translation. Given the numerous papers that have been published reporting functions of eIF2A in specific and general translational control, this study is important in providing abundant, high-quality data to the contrary, at least in these cultured cells.
Strengths:
The paper employed two CRISPR knock-out cell lines and subjected them to a combination of high-quality ribosome profiling experiments, interrogating both main coding sequences and uORFs throughout the translatome, which was complemented by extensive reporter analysis, and cell imaging in cells both unstressed and subjected to conditions of eIF2 phosphorylation, all in an effort to test previous conclusions about eIF2A functioning as an alternative to eIF2.
Weaknesses:
There is some question about whether their induction of eIF2 phosphorylation using tunicamycin was extensive enough to state forcefully that eIF2A has little or no role in the translatome when eIF2 function is strongly impaired. Also, similar conclusions regarding the minimal role of eIF2A were reached previously for a different human cell line from a study that also enlisted ribosome profiling under conditions of extensive eIF2 phosphorylation; although that study lacked the extensive use of reporters to confirm or refute the identification by ribosome profiling of a small group of mRNAs regulated by eIF2A during stress.
-
Author response:
Reviewer #1:
Summary:
Beyond what is stated in the title of this paper, not much needs to be summarized. eIF2A in HeLa cells promotes translation initiation of neither the main ORFs nor short uORFs under any of the conditions tested.
Strengths:
Very comprehensive, in fact, given the huge amount of purely negative data, an admirably comprehensive and well-executed analysis of the factor of interest.
Weaknesses:
The study is limited to the HeLa cell line, focusing primarily on KO of eIF2A and neglecting the opposite scenario, higher eIF2A expression which could potentially result in an increase in non-canonical initiation events.
We thank the reviewer for the positive evaluation. As suggested by the reviewer in the detailed recommendations, we will clarify in the title, abstract and text that our conclusions are limited to HeLa cells. Furthermore, as suggested we will test the effect of eIF2A overexpression on the luciferase reporter constructs, and will upload a revised manuscript.
Reviewer #2:
Summary
Roiuk et al describe a work in which they have investigated the role of eIF2A in translation initiation in mammals without much success. Thus, the manuscript focuses on negative results. Further, the results, while original, are generally not novel, but confirmatory, since related claims have been made before independently in different systems with Haikwad et al study recently published in eLife being the most relevant.
Despite this, we find this work highly important. This is because of a massive wealth of unreliable information and speculations regarding eIF2A role in translation arising from series of artifacts that began at the moment of eIF2A discovery. This, in combination with its misfortunate naming (eIF2A is often mixed up with alpha subunit of eIF2, eIF2S1) has generated a widespread confusion among researchers who are not experts in eukaryotic translation initiation. Given this, it is not only justifiable but critical to make independent efforts to clear up this confusion and I very much appreciate the authors' efforts in this regard.
Strengths
The experimental investigation described in this manuscript is thorough, appropriate and convincing.
Weaknesses
However, we are not entirely satisfied with the presentation of this work which we think should be improved.
We thank the reviewer for the positive evaluation. We will revise the manuscript according to the reviewer's suggestions made in the detailed recommendations.
Reviewer #3:
Summary:
This is a valuable study providing solid evidence that the putative non-canonical initiation factor eIF2A has little or no role in the translation of any expressed mRNAs in cultured human (primarily HeLa) cells. Previous studies have implicated eIF2A in GTP-independent recruitment of initiator tRNA to the small (40S) ribosomal subunit, a function analogous to canonical initiation factor eIF2, and in supporting initiation on mRNAs that do not require scanning to select the AUG codon or that contain near-cognate start codons, especially upstream ORFs with non-AUG start codons, and may use the cognate elongator tRNA for initiation. Moreover, the detected functions for eIF2A were limited to, or enhanced by, stress conditions where canonical eIF2 is phosphorylated and inactivated, suggesting that eIF2A provides a back-up function for eIF2 in such stress conditions. CRISPR gene editing was used to construct two different knock-out cell lines that were compared to the parental cell line in a large battery of assays for bulk or gene-specific translation in both unstressed conditions and when cells were treated with inhibitors that induce eIF2 phosphorylation. None of these assays identified any effects of eIF2A KO on translation in unstressed or stressed cells, indicating little or no role for eIF2A as a back-up to eIF2 and in translation initiation at near-cognate start codons, in these cultured cells.
The study is very thorough and generally well executed, examining bulk translation by puromycin labeling and polysome analysis and translational efficiencies of all expressed mRNAs by ribosome profiling, with extensive utilization of reporters equipped with the 5'UTRs of many different native transcripts to follow up on the limited number of genes whose transcripts showed significant differences in translational efficiencies (TEs) in the profiling experiments. They also looked for differences in translation of uORFs in the profiling data and examined reporters of uORF-containing mRNAs known to be translationally regulated by their uORFs in response to stress, going so far as to monitor peptide production from a uORF itself. The high precision and reproducibility of the replicate measurements instil strong confidence that the myriad of negative results they obtained reflects the lack of eIF2A function in these cells rather than data that would be too noisy to detect small effects on the eIF2A mutations. They also tested and found no evidence for a recent claim that eIF2A localizes to the cytoplasm in stress and exerts a global inhibition of translation. Given the numerous papers that have been published reporting functions of eIF2A in specific and general translational control, this study is important in providing abundant, high-quality data to the contrary, at least in these cultured cells.
Strengths:
The paper employed two CRISPR knock-out cell lines and subjected them to a combination of high-quality ribosome profiling experiments, interrogating both main coding sequences and uORFs throughout the translatome, which was complemented by extensive reporter analysis, and cell imaging in cells both unstressed and subjected to conditions of eIF2 phosphorylation, all in an effort to test previous conclusions about eIF2A functioning as an alternative to eIF2.
Weaknesses:
There is some question about whether their induction of eIF2 phosphorylation using tunicamycin was extensive enough to state forcefully that eIF2A has little or no role in the translatome when eIF2 function is strongly impaired. Also, similar conclusions regarding the minimal role of eIF2A were reached previously for a different human cell line from a study that also enlisted ribosome profiling under conditions of extensive eIF2 phosphorylation; although that study lacked the extensive use of reporters to confirm or refute the identification by ribosome profiling of a small group of mRNAs regulated by eIF2A during stress.
We thank the reviewer for the positive evaluation. We will revise the manuscript according to the recommendations made in the detailed recommendations. Regarding the two points mentioned here:
(1) the reason eIF2alpha phosphorylation does not increase appreciably is because unfortunately the antibody is very poor. The fact that the Integrated Stress Response (ISR) is induced by our treatment can be seen, for instance, by the fact that ATF4 protein levels increase strongly (in the very same samples where eIF2alpha phosphorylation does not increase much, in Suppl. Fig. 5E). We will strengthen the conclusion that the ISR is indeed activated with additional experiments/data as suggested by the reviewer.
(2) We agree that our results are in line with results from the previous study mentioned by the reviewer, so we will revise the manuscript to mention this other study more extensively in the discussion.
-
-
www.biorxiv.org www.biorxiv.org
-
eLife Assessment
Notch1 is expressed uniformly throughout the mouse endocardium during the initial stages of heart valve formation, yet it remains unclear how Notch signaling is activated specifically in the AVC region to induce valve formation. To answer this question, the authors used a combination of in vivo and ex vivo experiments in mice to demonstrate ligand-independent activation of Notch1 by circulation induced-mechanical stress and provide evidence for stimulation of a novel mechanotransduction pathway involving post-translational modification of mTORC2 and Protein Kinase C (PKC) upstream of Notch1. These findings represent an important advance in our understanding of valve formation and the conclusions are supported by convincing data.
-
Reviewer #2 (Public review):
Summary:
In mice, Notch1 is expressed uniformly throughout the endocardium during the initial stages of heart valve formation. How, then, is Notch activated specifically in the valve forming regions? To answer this question, the authors use a combination of in vivo and ex vivo experiments to demonstrate the critical role of hemodynamic forces on Notch1 activation and provide strong evidence for a novel mechanotransduction pathway involving PKC and mTORC2.
Strengths:
(1) Novel insights into the role of PKC and mTOR were obtained using a combination of mutant studies and pharmacological studies.<br /> (2) Novel insights on the role of mechanical forces on caveolin-1 localisation.<br /> (3) Mechanical forces were manipulated using the class III antiarrhythmic drug dofetilide, which transiently blocks heartbeat. Care was taken to minimise the confounding effects of hypoxia.
Weaknesses:
The authors suggest that shear stress activates the mTORC2-PKC-Notch signalling pathway by altering the membrane lipid microstructure. Although this is a fascinating hypothesis, more evidence will be needed to prove this. In particular, it is not clear how the general addition of cholesterol in dofetilide-treated hearts would result in a rescue of regionalized membrane distribution within the AVC and in high-shear stress areas.
-
Reviewer #3 (Public review):
Summary:
The overall goal of this manuscript is to understand how Notch signaling is activated in specific regions of the endocardium, including the OFT and AVC, that undergo EMT to form the endocardial cushions. Using dofetilide to transiently block circulation in E9.5 mice, the authors show that Notch receptor cleavage still occurs in the valve-forming regions due to mechanical sheer stress as Notch ligand expression and oxygen levels are unaffected. The authors go on to show that changes in lipid membrane structure activate mTOR signaling, which causes phosphorylation of PKC and Notch receptor cleavage. The data are largely convincing and support their hypothesis. The conclusions are also novel and significantly add to the field of endocardial cushion biology.
The strengths of the manuscript include the dual pharmacological and genetic approaches to block blood flow in the mouse, the inclusion of many controls including those for hypoxia, the quality of the imaging, and the clarity of the text. In the revision, the authors put forth a good faith effort to address experimentally or textually the concerns of the reviewers. Most weaknesses that were identified in the first submission were addressed and the main claims are convincing. In general, the authors achieved their aims and the results support their conclusions.
-
Author response:
The following is the authors’ response to the original reviews.
Public Review:
The overall goal of this manuscript is to understand how Notch signaling is activated in specific regions of the endocardium, including the OFT and AVC, that undergo EMT to form the endocardial cushions. Using dofetilide to transiently block circulation in E9.5 mice, the authors show that Notch receptor cleavage still occurs in the valve-forming regions due to mechanical sheer stress as Notch ligand expression and oxygen levels are unaffected. The authors go on to show that changes in lipid membrane structure activate mTOR signaling, which causes phosphorylation of PKC and Notch receptor cleavage.
The strengths of the manuscript include the dual pharmacological and genetic approaches to block blood flow in the mouse, the inclusion of many controls including those for hypoxia, the quality of the imaging, and the clarity of the text. However, several weaknesses were noted surrounding the main claims where the supporting data are incomplete.
PKC - Notch1 activation:
(1) Does deletion of Prkce and Prkch affect blood flow, and if so, might that be suppressing Notch1 activation indirectly?
To address this concern, we performed echocardiography of Prkce<sup>+/-</sup>;Prkch<sup>+/-</sup>, Prkce<sup>-/-</sup>;Prkch<sup>+/-</sup>, and Prkce<sup>+/-</sup>;Prkch<sup>-/-</sup> mouse hearts (Figure 3-supplement figure 2D), showing no significant effect in heartbeat and blood flow. (Line 308)
(2) It would be helpful to visualize the expression of prkce and prkch by in situ hybridization in E9.5 embryos.
We now added immunofluorescence staining results for both PKCE and PKCH as shown in Figure 3-supplement figure 2B. In E9.5 embryonic heart, PKCH is mainly expressed in the endocardium overlying AV canal and the base of trabeculae, overlapping with the expression pattern of NICD and pPKC<sup>Ser660</sup>. PKCE is expressed in both endocardium and myocardium. In the endocardium, PKCE is mainly expressed in the endocardium overlying AV canal (Line312-314)
(2) PMA experiments: Line 223-224: A major concern is related to the conclusion that "blood flow activates Notch in the cushion endocardium via the mTORC2-PKC signaling pathway". To make that claim, the authors show that a pharmacological activation with a potent PKC activator, PMA, rescues NICD levels in the AVC in dofetilide-treated embryos. This claim would also need proof that a lack of blood flow alters the activity of mTORC2 to phosphorylate the targets of PKC phosphorylation. Also, this observation does not explain the link between PKC activity and Notch activation.
Both AKT Ser473 and PKC Ser660 are well characterized phosphorylation sites regulated by mTORC2 (Baffi TR et. al, mTORC2 controls the activity of PKC and Akt by phosphorylating a conserved TOR interaction motif. Sci Signal. 2021;14.). pAKT<sup>Ser473</sup> is widely used as an indicator of mTORC2 activity. Therefore, the reduced staining intensity of pAKT<sup>Ser473</sup> and pPKC<sup>Ser660</sup> observed in the dofetilide treated embryos should reflect the reduced activity of their common upstream activator mTORC2. This information is provided in Line 317-321.
As PMA is a well-characterized specific activator of PKC, we believe the rescue of NICD by PMA could explain the link between PKC activity and Notch activation.
(3) In addition, the authors hypothesise that shear stress lies upstream of PKC and Notch activation, and that because shear stress is highest at the valve-forming regions, PKC and Notch activity is localised to the valve-forming regions. Since PMA treatment affects the entire endocardium which expresses Notch1, NICD should be seen in areas outside of the AVC in the PMA+dofetilide condition. Please clarify.
As shown in Figure 3C and Figure 3-supplement figure 2B, pPKC, PKCH and PKCE expression are all confined in the AVC region. This explains PMA activates NICD specifically in the valve-forming region. This information is added in Line 312-314.
Lipid Membrane:
(1) It is not clear how the authors think that the addition of cholesterol changes the lipid membrane structure or alters Cav-1 distribution. Can this be addressed? Does adding cholesterol make the membrane more stiff? Does increased stiffness result from higher shear stress?
We do not know how exactly addition of cholesterol alters membrane structure and influence mTORC2-PKC-Notch signaling. As cholesterol is an important component of lipid raft and caveolae, it is possible that enrichment of cholesterol might alter the membrane structure to make the lipid raft structure less dependent on sheer stress. This hypothesis need to be tested in further in vitro studies. This information is added to Line 433-436.
(2) The loss of blood flow apparently affects Cav1 membrane localization and causes a redistribution from the luminal compartment to lateral cell adhesion sites. Cholesterol treatment of dofetilide-treated hearts (lacking blood flow) rescued Cav1 localization to luminal membrane microdomains and rescued NICD expression. It remains unclear how the general addition of cholesterol would result in a rescue of regionalized membrane distribution within the AVC and in high-shear stress areas.
We do not know the exact mechanism. As replied in the previous question, future cell-based work is needed to address these important questions. (Line 433-436)
(3) The authors do not show the entire heart in that rescue treatment condition (cholesterol in dofetilide-treated hearts). Also, there is no quantification of that rescue in Figure 4B. Currently, only overview images of the heart are shown but high-resolution images on a subcellular scale (such as electron microscopy) are needed to resolve and show membrane microdomains of caveolae with Cav1 distribution. This is important because Cav-1could have functions independent of caveolae.
In Figure 4C, most panels display the large part of the heart including AVC, atrium and ventricle. The images in the third column appear to be more restricted to AVC. We have now replaced these images to reveal AVC and part of the atrium and ventricle.
The quantification has also been provided in Figure 4C. We also added a new panel of scanning EM of AVC endocardium, showing numerous membrane invaginations on the luminal surface of the endocardial cells. The size of the invaginations ranges from 50 to 100 nm, consistent with the reported size of caveolae. Dofetilide significantly reduced the number of membrane invaginations, which recovered after restore of blood flow at 5 hours post dofetilide treatment. The reduction of membrane invaginations could also be rescued by ex vivo cholesterol treatment. This information is added to Line 342-349.
Figure Legends, missing data, and clarity:
(1) The number of embryos used in each experiment is not clear in the text or figure legends. In general, figure legends are incomplete (for instance in Figure 1).
Thanks for reminding. we have now added numbers of embryos in the figure legends.
(2) Line 204: The authors refer to unpublished endocardial RNAseq data from E9.5 embryos. These data must be provided with this manuscript if it is referred to in any way in the text.
The RNAseq data of PKC isoforms is now provided in Figure3-Figure supplement 2A, Line 301-302.
(3) Figure 1 shows Dll4 transcript levels, which do not necessarily correlate with protein levels. It would be important to show quantifications of these patterns as Notch/Dll4 levels are cycling and may vary with time and between different hearts.
The Dll4 immuno-staining in Figure 1B,C is indeed Dll4 protein, not transcript. The quantification is added in Figure 1—Figure supplement 1C. Line 215.
(4) Line 212-214: The authors describe cardiac cushion defects due to the loss of blood flow and refer to some quantifications that are not completely shown in Figure 3. For instance, quantifications for cushion cellularity and cardiac defects at three hours (after the start of treatment?) are missing.
The formation of the defects is a developmental process and time dependent. To address this concern, we quantified the cushion cellularity at 5 hours post dofetilide treatment and showed that cell density significantly decreased in the dofetilide treated embryos, albeit less pronounced than the difference at E10.5. (Line 256-257)
(5) Related to Figure 5. The work would be strengthened by quantification of the effects of dofetilide and verapamil on heartbeat at the doses applied. Is the verapamil dosage used here similar to the dose used in the clinic?
We are grateful to this suggestion. The effect of dofetilide on heartbeat has already been shown in Figure 2A. We have now additionally measured the heartbeat rate of verapamil treated embryos, and provided the results in Figure 5E. For verapamil injection in mice, a single i.p. dose of 15 mg/kg was used, which is equivalent to 53 mg/m<sup>2</sup> body surface. Verapamil is used in the clinic at dosage ranging from 200 to 480 mg/day, equivalent to 3.33 - 8 mg/kg or 117 - 282 mg/m<sup>2</sup> body surface. Therefore, the dosage used in the mouse is not excessively high compared to the clinic uses. (Line 361-365)
Overstated Claims:
(1) The authors claim that the lipid microstructure/mTORC2/PKC/Notch pathway is responsive to shear stress, rather than other mechanical forces or myocardial function. Their conclusions seem to be extrapolated from various in vitro studies using non-endocardial cells. To solidify this claim, the authors would need additional biomechanical data, which could be obtained via theoretical modelling or using mouse heart valve explants. This issue could also be addressed by the authors simply softening their conclusions.
We aggrege with the reviewer’s comment. We have now revised the statement as “Our data support a model that membrane lipid microdomain acts as a shear stress sensor and transduces the mechanical cue to activate intracellular mTORC2-PKC-Notch signaling pathway in the developing endocardium. (line 416-418) It is noteworthy that the methodology used to alter blood flow in this study inevitably affects myocardial contraction. Additional work to uncouple sheer stress with other changes of mechanical properties of the myocardium with the aid of theoretical modelling or using mouse heart valve explants is needed to fully characterize the effect of sheer stress on mouse endocardial development.” (Line 436-440)
(2) Line 263-264: In the discussion, the authors conclude that "Strong fluid shear stress in the AVC and OFT promotes the formation of caveolae on the luminal surface of the endocardial cells, which enhances PKCε phosphorylation by mTORC2." This link was shown rather indirectly, rather than by direct evidence, and therefore the conclusion should be softened. For example, the authors could state that their data are consistent with this model.
We have revised the statement as “Strong fluid shear stress in the AVC and OFT enhances PKC phosphorylation by mTORC2 possibly by maintaining a particular membrane microstructure.” (Line 372-374)
(3) In the Discussion, it says: "Mammalian embryonic endocardium undergoes extensive EMT to form valve primordia while zebrafish valves are primarily the product of endocardial infolding (Duchemin et al., 2019)." In the paper cited, Duchemin and colleagues described the formation of the zebrafish outflow tract valve. The zebrafish atrioventricular valve primordia is formed via partial EMT through Dll-Notch signaling (Paolini et al. Cell Reports 2021) and the collective cell migration of endocardial cells into the cardiac jelly. Then, a small subset of cells that have migrated into the cardiac jelly give rise to the valve interstitial cells, while the remainder undergo mesenchymal-to-endothelial transition and become endothelial cells that line the sinus of the atrioventricular valve (Chow et al., doi: 10.1371/journal.pbio.3001505). The authors should modify this part of the Discussion and cite the relevant zebrafish literature.
Thanks for valuable comments. We have now revised the statement as “Mammalian embryonic endocardium undergoes extensive EMT to form valve primordia while zebrafish atrioventricular valve primordia is formed via partial EMT and the collective cell migration of endocardial cells into the cardiac jelly followed by tissue sheet delamination.” with relevant references added. (Line 411-414)
Recommendations to the Authors:
(1) One issue that the authors could address is the organization of figures. There are several cases where positive data that are central to the conclusions are placed in the supplement and should be moved to the main figures. Places where this occurred are listed below:
- The Tie2 conditional deletion of Dll4 showing retention of NICD in the OFT and AVC regions is highly supportive of the model. The authors should consider moving these data to main Figure 1.
Thanks for the suggestion. We have reorganized the figure as requested.
- The ligand expression data in Figure 2- Supplement Figure 1 A is VERY important to the conclusions drawn from the dofetilide treatment. The authors should move these data to main Figure 2.
The ligand expression data in Figure 2- Supplement Figure 1A are now moved to Figure 2B.
- In Figure 3A - the area in the field of view should be stated in the Figure (is it the AVC?) Figure 3 - Supplement 1 proximal OFT data should be moved to main Figure 3 as it is central to the conclusions. Negative DA data can be left in the supplement. Again, for Figure 3 - Supplement 1 Stauroporine treatment data should be moved to the main figure as it is positive data that are central to the conclusions.
Thanks for the suggestion. We have reorganized the figure as requested.
(2) Antibody used for Twist1 detection is not listed in the resource table.
Twist1 is purchased from abcam, the detailed information is now available in the resource table.
(3) Missing arrowhead in Figure 4A, last row.
Sorry for the negligence. Arrowhead is now added.
(4) Line 286. "OFT" pasted on the word "endothelium".
“OFT” is now removed.
(5) Related to Figure 2C. The fast response of NICD to flow cessation was used as an argument to support post-translational modification. It is not clear why Sox9 and Twist1 expression also responds so quickly.
Sox9 and Twist1 expression does seem to respond very quickly. Whether there exists additional regulatory pathways such as Wnt, Vegf signaling that also respond to sheer stress needs to be investigated in the future.
(6) Line 200: The sentence should end with a period.
Sorry for the oversight. It is now corrected.
(7) Lines 34 to 35: the authors phrase that Notch is "allowed" to be specifically activated in the AVC and outflow tract by shear stress.
We have rephrased the statement with “enabling Notch to be specifically activated in AVC and OFT by regional increased shear stress.” Line 27
(8) Lines 96-100: At the end of the introduction, the text is copied from the abstract. New text should be written or summarized in a different way.
The last sentence of introduction is now changed to “The results uncovered a new mechanism whereby mechanical force serves as a primary cue for endocardial patterning in mammalian embryonic heart.” (Line 93-95)
(9) Line 125: The term "agreed with the Dll4 transcript.."should be replaced with a better term like "overlapped" or "was identical with".
The word “agreed” is now “overlapped”. (Line 219)
(10) Line 291: "Thus, through these sophisticated mechanisms, the developing mouse hearts may achieve three purposes:"- The English should be adjusted here since it sounds like hearts are aiming to achieve a purpose, which is unlikely what was meant by the authors.
This sentence is rephrased to “Thus, in the developing mouse hearts: (1) VEGF signaling is reduced to permit endocardial EMT; (2) Dll4 expression is reduced to prevent widespread endocardial Notch activation and make endocardium sensitive to flow; (3) a proper cushion size and shape is maintained by limiting the flanking endocardium to undergo EMT despite physically close to the field of BMP2 derived from of AVC myocardium (Figure 6).” (Line 402-406)
-
-
www.biorxiv.org www.biorxiv.org
-
eLife Assessment
This manuscript reports useful data suggesting a critical role of two cyclin-dependent kinases, CDK8 and CDK19, in spermatogenesis. However, the data supporting the conclusion remains incomplete. This work may be of interest to reproductive biologists and physicians working on male fertility.
-
Reviewer #1 (Public review):
Summary:
In this paper, Bruter and colleagues report effects of inducible deletion of the genes encoding the two paralogous kinases of the Mediator complex in adult mice. The physiological roles of these two kinases, CDK8 and CDK19, are currently rather poorly understood; although conserved in all eukaryotes, and among the most highly conserved kinases in vertebrates, individual knockouts of genes encoding CDK8 homologues in different species have revealed generally rather mild and specific effects, in contrast to Mediator itself. Here, the authors provide evidence that neither CDK8 nor CDK19 are required for adult homeostasis but they are functionally redundant for maintenance of reproductive tissue morphology and fertility in males.
Strengths:
The morphological data on the atrophy of the male reproductive system and the arrest of spermatocyte meiosis are solid and are reinforced by single cell transcriptomics data, which is a challenging technique to implement in vivo. The main findings are important and will be of interest to scientists in the fields of transcription and developmental biology.
Weaknesses:
There are several major weaknesses.
The first is that data on general health of mice with single and double knockouts is not shown, nor are there any data on effects in any other tissues. This gives the impression that the only phenotype is in the male reproductive system, which would be misleading if there were phenotypes in other tissues that are not reported. Furthermore, given that the new data show differing expression of CDK8 and CDK19 between cell types in the testis, data for the genitourinary system in single knockouts are very sparse; data are described for fertility in figure 1E, ploidy and cell number in figure 3B and C, plasma testosterone and luteinizing hormone levels in figure 6C and 6D and morphology of testis and prostate tissue for single Cdk8 knockout in supplementary figure 1C (although in this case the images do not appear very comparable between control and CDK8 KO, thus perhaps wider fields should be shown), but, for example, there is no analysis of different meiotic stages or of gene expression in single knockouts. This might have provided insight into the sterility of induced CDK8 knockout.
The second major weakness is that the correlation between double knockout and reduced expression of genes involved in steroid hormone biosynthesis is portrayed as a likely causal mechanism for the phenotypes observed. While this is a possibility, there are no experiments performed to provide evidence that this is the case. Furthermore, there is no evidence shown that CDK8 and/or CDK19 are directly responsible for transcription of the genes concerned.
Finally, the authors propose that the phenotypes are independent of the kinase activity of CDK8 or CDK19 because treatment of mice for a month with an inhibitor does not recapitulate the effects of the knockout, and nor does expression of two steroidogenic genes change in cultured Leydig cells upon treatment with an inhibitor. However, there are no controls for effective target inhibition shown.
Comments on revisions:
This manuscript is in some ways improved - mainly by toning down the conclusions - but a few major weaknesses have not been addressed. I do not agree that it is not justified to perform experiments to investigate the sterility of single CDK8 knockout mice since this could be important and given that the new data show that while there is some overlap in expression of the two prologues, there are also significant differences in the testis. At the least, it would have been interesting and easy to do to show the expression of CDK8 and CDK19 in the single cell transcriptomics, since this might help to identify the different populations.
The only definitive way of concluding a kinase-independent phenotype is to rescue with a kinase dead mutant. While I agree that the inhibitors have been well validated, since they did not have any effects, it is hard to be sure that they actually reached their targets in the tissue concerned. This could have been done by cell thermal shift assay. In the absence of any data on this, the conclusion of a kinase-independent effect is weak.
Figure 2 legend includes (G) between (B) and (C), and appears to, in fact, refer to Fig 1E, for which the legend is missing the description.
Finally, Figure S1C appears wrong. Goblet cells are not in the crypt but on the villi (so the graph axis label is wrong), and there are normally between 5 and 15 per villus, so the iDKO figure is normal, but there are a surprisingly high number of goblet cells in the controls. And normally there are 10-15 Paneth cells/crypt, so it looks like these have been underestimated everywhere. I wonder how the counting was done - if it is from images such as those shown here then I am not surprised as the quality is insufficient for quantification. How many crypts and villi were counted? Given the difficulty in counting and the variability per crypt/villus, with quantitative differences like this it is important to do quantifications blind. I personally wouldn't conclude anything from this data and I would recommend to either improve it or not include it. If these data are shown, then data showing efficient double knockout in this tissue should also accompany it, by IF, Western or PCR. Otherwise, given a potentially strong phenotype, repopulation of the intestine by unrecombined crypts might have occurred - this is quite common (see Ganuza et al, EMBO J. 2012).
-
Reviewer #2 (Public review):
Summary:
The authors tried to test the hypothesis that Cdk8 and Cdk19 stabilize the cytoplasmic CcNC protein, the partner protein of Mediator complex including CDK8/19 and Mediator protein via a kinase-independent function by generating induced double knockout of Cdk8/19. However the evidence presented suffer from a lack of focus and rigor and does not support their claims.
Strengths:
This is the first comprehensive report on the effect of a double knockout of CDK8 and CDK19 in mice on male fertility, hormones and single cell testicular cellular expression. The inducible knockout mice led to male sterility with severe spermatogenic defects, and the authors attempted to use this animal model to test the kinase-independent function of CDK8/19, previously reported for human. Single cell RNA-seq of knockout testis presented a high resolution of molecular defects of all the major cell types in the testes of the inducible double knockout mice. The authors also have several interesting findings such as reentry into cell cycles by Sertoli cells, loss of Testosterone in induced dko that could be investigated further.
Weaknesses:
The claim of reproductive defects in the induced double knockout of CDK8/19 resulted from the loss of CCNC via a kinase-independent mechanism is interesting but was not supported by the data presented. While the construction and analysis of the systemic induced knockout model of Cdk8 in Cdk19KO mice is not trivial, the analysis and data is weakened by systemic effect of Cdk8 loss, making it difficult to separate the systemic effect from the local testis effect.
The analysis of male sterile phenotype is also inadequate with poor image quality, especially testis HE sections. Male reproductive tract picture is also small and difficult to evaluate. The mice crossing scheme is unusual as you have three mice to cross to produce genotypes, while we could understand that it is possible to produce pups of desired genotypes with different mating schemes, such vague crossing scheme is not desirable and of poor genetics practice. Also using TAM treated wild type as control is ok, but a better control will be TAM treated ERT2-cre; CDK8f/f or TAM treated ERT2 Cre CDK19/19 KO, so as to minimize the impact from well-recognized effect of TAM.
While the authors proposed that the inducible loss of CDK8 in the CDK19 knockout background is responsible for spermatogenic defects, it was not clear in which cells CDK8/19 genes are interested and which cell types might have a major role in spermatogenesis. The authors also put forward the evidence that reduction/loss of Testosterone might be the main cause of spermatogenic defects, which is consistent with the expression change in genes involved in steroigenesis pathway in Leydig cells of inducible double knockout. But it is not clear how the loss of Testosterone contributed to the loss of CcnC protein.
The authors should clarify or present the data on where CDK8 and CDK19 as well as CcnC are expressed so as to help the readers to understand which tissues that both CDK might be functioning and cause the loss of CcnC. It should be easier to test the hypothesis of CDK8/19 stabilize CcnC protein using double knock out primary cells, instead of the whole testis.
Since CDK8KO and CDK19KO both have significantly reduced fertility in comparison with wildtype, it might be important to measure the sperm quantity and motility among CDK8 KO, CDK19KO and induced DKO to evaluate spermatogenesis based on their sperm production.
Some data for the inducible knockout efficiency of Cdk8 were presented in Supplemental figure 1, but there is no legend for the supplemental figures, it was not clear which band represented deletion band, which tissues were examined? Tail or testis? It seems that two months after the injection of Tam, all the Cdk8 were completely deleted, indicating extremely efficient deletion of Tam induction by two-month post administration. Were the complete deletion of Cdk8 happening even earlier ? an examination of timepoints of induced loss would be useful and instructional as to when is the best time to examine phenotypes.
The authors found that Sertoli cells re-entered cell cycle in the inducible double knockout but stop short of careful characterization other than increased expression of cell cycle genes.
Overall this work suffered from a lack of focus and rigor in the analysis and lack of sufficient evidence to support their main conclusions.
Comments on revisions:
This reviewer appreciated the authors' effort in improving the quality of this manuscript during their revision. While some concerns remain, the revision is a much improved work and the authors addressed most of my major concerns.<br /> Figure 2E CDK8 and CDK19 immunofluorescent staining images seem to show CDK8 and CDK19 location are completely distinct and in different cells, the authors need to elaborate on this results and discuss what such a distinct location means in line of their double knockout data.
Minor comments:
Supplemental figure 1(C) legend typo : (C) Periodic acid-Schiff stained sections of ilea of tamoxifen treated R26/Cre/ERI2 and DKO mice.
While the effort to identify and generate new antibodies is appreciated, the specificity of the antibodies used should be examined and presented if available.
-
Author response:
The following is the authors’ response to the original reviews.
The mice crossing scheme is unusual as you have three mice to cross to produce genotypes, while we could understand that it is possible to produce pups of desired genotypes with different mating schemes, such a vague crossing scheme is not desirable and of poor genetics practice.
We thank the reviewer for this suggestion. Indeed, our scheme is not a representation of the actual breeding scheme but just a brief explanation of lineages used for the acquisition of the triple transgenic mice. We will include the full crossing scheme into the revision.
We added to the text the explanation that all used genotypes were maintained as homozygotes and put a full breeding scheme in the supplementary figure S1A
It is worth mentioning that single knockouts seem to show a corresponding upregulation of the level of the paralogue kinase, indicating that any lack of phenotypes might be due to feedback compensation, which would be an interesting finding if confirmed; this has not been mentioned.
We thank the reviewer for raising an important point about the paralog upregulation. Indeed, our data on primary cells (supplementary 1B) suggests the upregulation of CDK19 in CDK8KO and vice versa. We will point this out in discussion. We plan to examine the data for the testis as soon as more tissues are available.
We addressed this question by performing additional western blot (added to the paper fig. 2D) and found no paralogue upregulation in testes. To do that we also manufactured novel rabbit anti-mouse CDK19 antibodies described in Materials and Methods.
The authors should clarify or present the data on where CDK8 and CDK19 as well as CcnC are expressed so as to help the readers understand which tissues both CDK might be functioning in and cause the loss of CcnC.
Due to a limited sensitivity of single cell sequencing (only ~5,000 transcripts are sequenced from total of average 500,000 transcripts per cell, so the low expressed transcripts are not sequenced in all cells) it is challenging to firmly establish CDK8/19 positive and -negative tissues from single cell data because both transcripts are minor. This image will be included in the next version.
In this version we have added staining by CDK8 and CDK19 antibodies on paraffin sections, showing expression in variety of cells. Additionally, we have analyzed Cdk8/CcnC presence in different testicular cell types by flow cytometry. Both methods show that not only spermatogonial stem cells express Cdk8 as was shown in McCleland et al. 2005, but also some 1n cells, 4n cells and a significant part of cKit<sup>- </sup>2n cells. We added a corresponding paragraph and figures (2E-K) to the paper. We consider this a more definitive answer to the question than RNA data.
Furthermore, data for the genitourinary system in single knockouts are very sparse; data are described for fertility in Figure 1H, ploidy, and cell number in Figures 2B and C, plasma testosterone and luteinizing hormone levels in Figures 5C and 5D, and morphology of testis and prostate tissue for single Cdk8 knockout in Supplementary Figure 1C (although in this case the images do not appear very comparable between control and CDK8 KO, thus perhaps wider fields should be shown), but, for example, there is no analysis of different meiotic stages or of gene expression in single knockouts. It is worth mentioning that single knockouts seem to show a corresponding upregulation of the level of the paralogue kinase, indicating that any lack of phenotypes might be due to feedback compensation, which would be an interesting finding if confirmed; this has not been mentioned.
We agree that a description of the single KO could be beneficial, but we expect no big differences with the WT or Cre-Ert. We found neither histological differences nor changes in cell counts or ratios of cell types. Our ethical committee also has concerns about sacrificing mice without major phenotypic changes, without a well formulated hypothesis about the observed effects. We plan to add histological pictures to the next version of the article.
We have updated histological figures with new figures for iDKO and Cre+Tam mice with additional fields of view and better quality staining (2A-B).
The second major weakness is that the correlation between double knockout and reduced expression of genes involved in steroid hormone biosynthesis is portrayed as a causal mechanism for the phenotypes observed. While this is a possibility, there are no experiments performed to provide evidence that this is the case. Furthermore, there is no evidence showing that CDK8 and/or CDK19 are directly responsible for the transcription of the genes concerned.
We agree with the reviewer that the effects on CDK8/CDK19/CCNC could lead to the observed transcriptional changes in multiple indirect steps. There are, however, major technical challenges in examining the binding of transcription factors in the tissue, especially in Leydig cells which are a relatively minor population. We will clarify it in the revision and strengthen this point in the discussion.
We have added corresponding explanation in the Discussion: “We hypothesize that all these changes are caused by disruption of testosterone synthesis in Leydig cells, although, at this point, we cannot definitively prove that the affected genes are regulated by CDK8/19 directly.”
The claim of reproductive defects in the induced double knockout of CDK8/19 resulted from the loss of CCNC via a kinase-independent mechanism is interesting but was not supported by the data presented. While the construction and analysis of the systemic induced knockout model of Cdk8 in Cdk19KO mice is not trivial, the analysis and data are weakened by the systemic effect of Cdk8 loss, making it difficult to separate the systemic effect from the local testis effect.
We agree with the reviewer that the effects on the testes could be due to the systemic loss of CDK8 rather than specifically in the testis, and we will clarify it in the revision. We will also clarify that although our results are suggestive that the effects of CDK8/19 knockout are kinase-independent, and that the loss of Cyclin C is a likely explanation for the kinase independence, but we do not claim that it is *the* mechanism.
In this version we added several caveats indicating that the proposed mechanism is likely, but not the only one possible.
Also using TAM-treated wild type as control is ok, but a better control will be TAM-treated ERT2-cre; CDK8f/f or TAM-treated ERT2 Cre CDK19/19 KO, so as to minimize the impact from the well-recognized effect of TAM.
We used TAM-treated ERT2-cre for most of the experiments, and did not observe any major histological or physiological differences with the WT+TAM. We will make sure to present them in the revision.
The authors found that Sertoli cells re-entered the cell cycle in the inducible double knockout but stopped short of careful characterization other than increased expression of cell cycle genes.
Unfortunately, we were not able to perform satisfactory Ki67 staining to address this point.
Dko should be appropriately named iDKO (induced dKO). We will make the corresponding change.
We performed necropsy ? not the right wording here.
Colchicine-like apoptotic bodies ? what does this mean? Not clear.
We made appropriate changes - all DKO were renamed iDKO, necropsy changed to autopsy and cells designated as “apoptotic”.
Recommendations for the authors:
Reviewer #1 (Recommendations For The Authors):
Given the proprietary claims of the authors ("We have for the first time generated mice with the systemic inducible Cdk8 knockout on the background of Cdk19 constitutive knockout"), it does not appear acceptable and indeed might be misleading, to not describe the overall phenotypes of the mice. Are mice normal size/weight? Does an autopsy reveal anything other than atrophied genital tissue in males? Do the authors find a phenotype in the intestinal epithelium, as previously reported? (N.B. this could potentially clarify a discrepancy in the literature since the loss of the secretory lineages in double knockouts reported by the Firestein lab was not reproduced by intestinal organoid double knockout in the paper by the Fisher lab).
We have removed the statement “for the first time”, although to the best of our knowledge this is the fact. We did not attempt to describe all the phenotypic effects of the Cdk8/19 knockout in this paper, since some of the phenotypic observations related to mouse weight and behavior varied between different laboratories involved and require additional analysis. The effect on the urogenital system was by far the most striking histological feature observed and it was carefully addressed in this paper. Other findings require additional experiments and are out of the scope of this paper and we plan to focus on them later. As per suggestion of the reviewer we performed histological analysis of DKO intestines and found the same decrease in the Paneth and goblet cells numbers as described by Dannappel et al. We added corresponding figures (Supplemental fig. 1C) to the paper.
If the authors wish to reinforce their claims about causality of steroidogenic gene expression and phenotype, they could try rescuing the phenotype by treating mice with testosterone.
As stated in Discussion, we hypothesized that injection of testosterone would not rescue the phenotype, as the androgen receptor signaling is also affected. However we would like to perform such an experiment, but we were not able to procure testosterone pellets at this time.
If they wish to claim a direct effect of CDK8/19 on the expression of steroidogenic genes, they could also assess CDK8/19 binding to promoters of the genes analysed by ChIP.
There are big technical challenges in examining the binding of transcription factors in the primary tissue, especially in Leydig cells, a minor population, so we cannot perform such an experiment.
In order to conclude that their CDK8/19 inhibitor treatment worked, they could show target engagement by cell thermal shift assay, loss of CDK8/19 kinase-dependent gene expression, or loss of CDK8/19 substrate phosphorylation (eg interferon-induced STAT1 S727 phosphorylation) under the conditions used. Alternatively, they could show rescue with a kinase-dead allele.
As noted in public comments - we thank the reviewer for raising this concern. The target selectivity and target engagement by the inhibitors used in this study (Senexin B and SNX631-6) have been described in other models and published. CDK8/19 engagement and target selectivity of Senexin B, used in our vitro studies, have been extensively characterized in cell-based assays (Chen et al., Cells 2019, 8(11), 1413; Zhang et al., J Med Chem. 2022 Feb 24;65(4):3420-3433.) Similar characterization has been published for SNX631-6 and its equipotent analog SNX631, which showed drastic antitumor activity when used in vivo at the same dosing regimen as in this paper (Li et al., J Clin Invest. 2024;134(10):e176709). The comparison of the pharmacokinetics data obtained in the present study and in vitro activity of SNX631-6 in a cell-based assay suggests that the tissue concentrations of this drug should have provided substantial inhibition of Cdk8/19. Unfortunately, there are no known phosphorylation substrates specific for Cdk8/19 that can be used as pharmacodynamic markers. The widely used STAT1 phosphorylation at S727 is exerted not only by CDK8/19 but also by other kinases and shows variable response to CDK8/19 inhibition (Chen et al., Cells 2019, 8(11), 1413). In the revised MS, we have added a Western blot with pSTAT1 S727 staining of WT, 8KO, 19KO and iDKO testes. Cdk8/19 knockout did not decrease and apparently even increased the level of pSTAT1 S727, which demonstrates that this marker of CDK8/19 activity it is not suitable for our tissue type. While the evidence that Cdk8/19 kinase inhibition in the testes after in vivo drug treatment does not match the phenotype of iDKO is admittedly indirect, the same result has been obtained in the cell culture studies with Sertoli cells, where the inhibitor concentration (1 µM Senexin B) was much higher than needed for the maximal Cdk8/19 inhibition.
Finally, I did not find any legends to supplementary figures anywhere.
We apologize for not including legends for supplementary figures, and will correct that in the next version of the manuscript.
Additionally, we addressed the question about the sufficiency of the lipid supply for steroidogenesis in testes. There was a possibility that steroidogenesis is impossible due to the lack of cholesterol input, but OilRed staining revealed that the situation is the opposite: lipid content in iDKO testes is significantly higher than in WT testes. We added corresponding text to the article and the supplementary Fig. S6.
-
-
www.biorxiv.org www.biorxiv.org
-
eLife Assessment
Data presented in this useful report suggest a potentially new model for chemotaxis regulation in the gram-negative bacterium P. putida. Data supporting interactions between CheA and the copper-binding protein CsoR, reveal potential mechanisms for coordinating chemotaxis and copper resistance. There was, however, concern about the large number of CheA interactors identified in the initial screen and it was felt that the study was incomplete without a substantial number of additional experiments to test the model and bolster the authors' conclusions.
-
Reviewer #2 (Public review):
Summary:
This manuscript focuses on the apparent involvement of a proposed copper-responsive regulator in the chemotactic response of Pseudomonas putida to Cu(II), a chemorepellent. Broadly, this area is of interest because it could provide insight into how soil microbes mitigate metal stress. Additionally, copper has some historical agricultural use as an antimicrobial, thus can accumulate in soil. The manuscript bases its conclusions on an in vitro screen to identify interacting partners of CheA, an essential kinase in the P. putida chemotaxis-signaling pathway. Much of the subsequent analysis focuses on a regulator of the CsoR/RcnR family (PP_2969).
Weaknesses:
The data presented in this work does not support the model (Figure 8). In particular, PP_2969 is linked to Ni/Co resistance not Cu resistance. Further, it is not clear how the putative new interactions with CheA would be integrated into diverse responses to various chemoattract/repellents. These two comments are justified below.
PP_2969
• The authors present a sequence alignment (Figure S5) that is the sole based for their initial assignment of this ORF as a CsoR protein. There is conservation of the primary coordinating ligands (highlighted with asterisks) known to be involved in Cu(I) binding to CsoR (ref 31). There are some key differences, though, in residues immediately adjacent to the conserved Cys (the preceding Ala, which is Tyr in the other sequences). The effect of these change may be significant in a physiological context.
• The gene immediately downstream of PP_2969 is homologous to E. coli RcnA, a demonstrated Ni/Co efflux protein, suggesting that P2969 may be Ni or Co responsive. Indeed PP_2970 has previously been reported as Ni/Co responsive (J. Bact 2009 doi:10.1128/JB.00465-09). The host cytosol plays a critical role in determining metal-response, in addition to the protein, which can explain the divergence from the metal response expected from the alignment.
• The previous JBact study also explains the lack of an effect (Figure 5b) of deleting PP_2969 on copper-efflux gene expression (copA-I, copA-II, and copB-II) as these are regulated by CueR not PP_2969 consistent with the previous report. Deletion of CsoR/RcnR family regulator will result in constitutive expression of the relevant efflux/detoxification gene, at a level generally equivalent to the de-repression observed in the presence of the signal.
• Further, CsoR proteins are Cu(I) responsive so measuring Cu(II) binding affinity is not physiologically relevant (Figures 5a and S5b). The affinities of demonstrated CsoR proteins are 10-18 M and these values are determined by competition assay. The MTS assay and resulting affinities are not physiologically relevant.
• The DNA-binding assays are carried out at protein concentrations well above physiological ranges (Figs 5c and d, and S5c, d). The weak binding will in part result from using DNA-sequences upstream of the copA genes and not from from PP_2970.
CheA interactions
There is no consideration given to the likely physiological relevance of the new interacting partners for CheA.
• How much CheA is present in the cell (copies) and how many copies of other proteins are present? How would specific responses involving individual interacting partners be possible with such a heterogenous pool of putative CheA-complexes in a cell. For PP_2969, the affinity reported (Figure 5A) may lay at the upper end of the CsoR concentration range (for example, CueR in Salmonella is present at ~40 nM).
• The two-hybrid system experiment uses a long growth time (60 h) before analysis. Even low LacZ activity levels will generate a blue colour, depending upon growth medium (see doi: 10.1016/0076-6879(91)04011-c). It is also not clear how Miller units can be accurately or precisely determined from a solid plate assay (the reference cited describes a protocol for liquid culture).
Comments on revised version:
The authors have replied in detail to the various comments about the original manuscripts. However, the responses are generally lengthy rationalisations of the original interpretation of the data and do not fundamentally address critical concerns raised about the physiological relevance of the results. The response appears to rest on the assumption that the numerous interacting partners obtained from the initial screen are all true positives and that all subsequent experimental results are interpreted to justify that assumption. In the case of CsoR, the experimental results and interpretation are inconsistent with previously published studies of the metal and DNA-binding properties of CsoR proteins. The following points reiterate comments from the previous review, in the hopes that the authors will, at the very least, consider the likelihood that the "CsoR" protein they have identified is in fact responsive to a different metal. Further, that the authors consider multiple possible interpretations of the data, particularly those that are inconsistent with the model/hypothesis (and take this into account in their experimental design.
• (Figure 4) Almost all purified proteins will bind Cu(II) most tightly in vitro, followed by Zn(II) and Ni(II). This behaviour is a consequence of the Irving-Williams affinity series (doi.org/10.1038/162746a0 and doi.org/10.1039/JR9530003192, especially Figure 4) and is not considered an indicator of physiological metal preference. Biomolecules will exhibit the same behaviour as small organic ligands towards first row transition ions because of the flexibility of their structures. Thus, the results obtained are unsurprising and, because of the method used, have no physiological relevance.
• The authors cite other in vivo work as evidence for varied metal-response by regulator proteins. However, experiments in these citations are of limited relevance because some focus on other structural classes of metalloregulator proteins (so not relevant here) while others focus on changes in metal accumulation by overexpression of the regulator protein, with no examination of the metal-specificity of the efflux protein (the key determinant of the physiological response of the regulator protein - why turn on expression of an efflux protein that can't pump out a particular metal? Finally, adding equivalent concentrations of metals to growing cells is not a good comparison as metals are toxic at different concentrations. The regulators will only have evolved to be just good enough, not perfect, with respect to selectivity. Laboratory experimental conditions often explore non-physiological conditions.
• It is also important to re-emphasise the authors' own statements on lines 90-93 that P. putida has a CueR protein. This is consistent with the phylogenetic distribution of CueR proteins in gram-negative bacteria. The CsoR proteins, in contrast, are found only in gram-positive bacteria. This inconsistency is ignored by the authors.
• The implications of the Irving-Williams series on metal-specific responses of bacterial metalloregulator proteins are described in the following references: 10.1016/j.cbpa.2021.102095, 10.1074/jbc.R114.588145, and 10.1038/s41589-018-0211-4). The last reference of this set provides an experimental basis for why metalloregulator affinities for Cu (and Zn and Ni) are so tight (and why the values obtained in Figure 4 in this manuscript are not relevant).
• Similarly, the previous experimental studies of CsoR proteins not cited by the authors (10.1021/ja908372b 10.1021/bi900115w) provide rigourous experimental approaches for measuring metal and DNA-binding affinities and further highlight the weakness of the experimental design in this manuscript.
• The DNA-binding assays are not physiologically relevant because they do not use DNA from the operator regulated by the candidate protein (why this was not explored in the revision is difficult to understand). The mobility shift observed at these high protein concentrations will result from non-specific binding. It is unsurprising that Cu(II) has an effect on DNA binding as it is added at such high concentrations relative to both protein and DNA so as to compete for DNA-binding with the protein (which binds weakly because there is no specific recognition site). The 10:1 ratio of Cu:CsoR is 10-times higher than needed as this class of proteins will show decreases in DNA-affinity in the presence of the correct metal at 1:1 stoichiometry. As indicated above, the authors need to consider alternative interpretations for their results rather than try to rationalise the results to fit the model.
The points raised above readily address the authors' own comments in the response as to their surprise at some of the results and their inconsistency with the model.
Even if the authors were to identify the correct metal to which the protein responds, there are still fundamental issues with experimental design and interpretation that would need to be addressed to indicate any link between the protein and chemotaxis.
-
Author response:
The following is the authors’ response to the original reviews.
Reviewer #1 (Public Review):
This report contains two parts. In the first part, several experiments were carried out to show that CsoR binds to CheA, inhibits CheA phosphorylation, and impairs P. putida chemotaxis. The second part provides some evidence that CsoR is a copper-binding protein, binds to CheA in a copper-dependent manner, and regulates P. putida response to copper, a chemorepellent. Based on these results, a working model is proposed to describe how CsoR coordinates chemotaxis and resistance to copper in P. putida. While the second part of the study is relatively solid, there are some major concerns about the first part.
Critiques:
(1) The rigor from prior research is not clear. In addition to talking about other bacterial chemotaxis, the Introduction should briefly summarize previous work on P. putida chemotaxis and copper resistance.
We summarized previous results on P. putida copper resistance and added those results to the introduction section of the revised manuscript. As for chemotaxis, most studies in P. putida focused on the sensing/responding of the bacteria to different chemical compounds and the methyl-accepting chemotaxis proteins (MCPs) involved in the sensing, which is not relevant to the main content of this study. The component of the chemotaxis system in P. putida is similar to that in E. coli, and the signaling mechanism is presumably similar.
(2) The rationale for identifying those CheA-binding proteins is vague. CheA has been extensively studied and its functional domains (P1 to P5) have been well characterized. Compared to its counterparts from other bacteria, does P. putida CheA contain a unique motif or domain? Does CsoR bind to other bacterial CheAs or only to P. putida CheA?
The original purpose of the pull-down assay was to detect the interaction between CheA and c-di-GMP metabolizing enzymes, which was another project. However, we ignored that most c-di-GMP metabolizing enzymes were membrane proteins, and we made a mistake by using whole-cell lysate in the pull-down experiment. Thus, we failed to identify c-di-GMP metabolizing enzymes in “target” proteins of the pull-down assay. However, we found several novel “target” proteins in the pull-down assay. We wondered about the function of these proteins and the physiological roles of the interaction between CheA and these proteins, which was the primary purpose of this study. Although the function of CheA has been well characterized, most previous results focused on the role of CheA in chemotaxis, and its role in other bacterial processes was poorly studied. To extend our knowledge about CheA, we analyzed the results of the pull-down assay and decided to test the interaction between CheA and identified proteins, as well as the physiological roles of the interaction.
BLAST results showed that the CheA of P. putida shared 41.12% sequence similarity with the CheA of E. coli, and the CheA of P. putida had a similar domain pattern to those CheAs from other bacteria. To test whether CsoR<sub>P. putida</sub> interacted with CheA from other bacteria, we performed a BTH assay to investigate the interaction between CsoR<sub>P. putida</sub> and eight CheAs, including CheA from E. coli, CheA from A. caldus, CheA from B. diazoefficiens, CheA from B. subtilis, CheA from L. monocytogenes, CheA from P. fluorescens, CheA from P. syringae, and CheA from P. stutzeri. As shown in the following Fig. 1, CsoR<sub>P. putida</sub> could interact with CheA from A. caldus, B. subtilis, L. monocytogenes, P. fluorescens, P. syringae, and P. stutzeri. Besides, among these strains, cheA and csoR coexist in A. caldus, B. diazoefficiens, B. subtilis, L. monocytogenes, P. fluorescens, P. syringae, and P. stutzeri. We previously tested the interaction of the two proteins from these bacterial species. The results showed that the CheA-CsoR interaction existed between proteins from A. caldus, B. subtilis, P. syringae, and P. stutzeri (Fig. 7 in the manuscript). However, CheA and CsoR from B. diazoefficiens, L. monocytogenes, and P. fluorescens showed no apparent interaction (Fig. 7 in the manuscript). These results suggested that unique amino acid sequences in the two proteins might be required to achieve interaction.
(3) Line 133-136, "Collectively, using pull-down, BTH, and BiFC assays, we identified 16 new CheA-interacting proteins in P. putida." It is surprising that so many proteins were identified but none of them were chemotaxis proteins, in particular those known to interact with CheA, such as CheW, CheY and CheZ, which raises a concern about the specificity of these methods. BTH and BiFC often give false-positive results and thus should be substantiated by other approaches such as co-IP, surface plasmon resonance (SPR), or isothermal titration calorimetry (ITC) along with mutagenesis studies.
The response regulator CheY and the phosphatase CheZ (two proteins known to be associated with CheA) were identified in the pull-down assay (Table S1), and the two proteins showed high Log<sub>2</sub>(fold change) values, indicating that they were obtained in the pull-down assay with high amount in the experimental group and low amount in the control group. Our study aimed to identify new CheA-interacting proteins; thus, the two proteins (CheY and CheZ) were not included in subsequent investigations. The CheA-interacting proteins were initially obtained through an in vitro assay (pull-down), followed by an in vivo assay (BTH and BiFC) to test the interaction further. Only proteins that showed positive results in all three assays were considered trustworthy CheA-interacting proteins and kept for further study.
(4) Line 147-149, "Fig. 2a, five strains (WT+pcsoR, WT+pispG, WT+pnfuA, WT+pphaD, and WT+pPP_1644) displayed smaller colony than the control strain (WT+pVec), indicating a weaker chemotaxis ability in these five strains." If copper is a chemorepellent, these strains should swim away from high concentrations of copper; thus, the sizes of colonies couldn't be used to measure this response. In the cited reference (reference 29), bacterial response to phenol was measured using a response index (RI).
Except for CsoR, the rest of the CheA-interacting proteins had no direct connection with copper and were involved in different processes (Table S1). A reasonable speculation is that these proteins involved in different processes can integrate signals from specific processes into chemotaxis by regulating CheA autophosphorylation, leading to better regulation of chemotaxis according to intracellular physiological state. We used semisolid nutrient agar plates to test and compare bacterial chemotaxis ability. In a fixed attractant/repellent gradient, chemokine, such as copper, can lead to two subpopulations traveling at different speeds, with the slower one being held back by the chemokinetic drift. In the case of semisolid plate migration, bacteria with chemotaxis ability formed large colonies by generating their gradient by consuming nutrients/producing toxic metabolic waste and following attractant/repellent gradients leading outward from the colony origin (Cremer et al., 2019. Nature 575:658–663). The observation of successive sharp circular bands (rings) progressing outward from the inoculation point was taken to confirm the chemotaxis genotype, and mutants without chemotaxis spread out uniformly and formed a small colony (Wolfe and Berg, PNAS. 1989, 86:6973-6977). In our experiment, we were unsure about the signals/chemokines of each target protein, so we could not design a fixed attractant/repellent gradient. Besides, all target proteins interacted with CheA, which is a crucial factor in chemotaxis, and we assume that these proteins would affect chemotaxis under overexpression conditions. Thus, we used semisolid nutrient plates to test and compare bacterial chemotaxis ability.
(5) Figures 2 and 3 show both CsoR and PhaD bind to CheA and inhibit CheA autophosphorylation. Do these two proteins share any sequence or structural similarity? Does PhaD also bind to copper? Otherwise, it is difficult to understand these results.
Thanks a lot. This is an enlightening comment. CsoR is a protein with a size of 10.8 kDa, and PhaD is 23.1 kDa. Because of the difference in size, we took it for granted that the two proteins were not similar. We recently compared their sequence on NCBI BLAST. Although both CsoR and PhaD are transcriptional regulators and interact with CheA, they have no significant sequence similarity. In terms of protein structure, we predicted their structures using AlphaFold. The results showed that CsoR consisted of three α-helixes and PhaD consisted of nine α-helixes (new Fig. S5a and S5b in the manuscript). We further compared their structure using Pymol but found no significant similarity between the two proteins (new Fig. S5c in the manuscript).
PhaD is a TetR family transcriptional regulator located adjacent to the genes involved in PHA biosynthesis, and it behaves as a carbon source-dependent activator of the pha cluster related to polyhydroxyalkanoates (PHAs) biosynthesis (de Eugenio et al., Environ Microbiol. 2010, 12:1591-1603; Tarazona et al., Environ Microbiol. 2020, 22:3922-3936). Bacterial PHAs are isotactic polymers synthesized under unfavorable growth conditions in the presence of excess carbon sources. PHAs are critical in central metabolism, acting as dynamic carbon reservoirs and reducing equivalents (Gregory et al., Trends Mol Med. 2022, 28:331-342). The interaction between PhaD and CheA leads us to speculate that there might be some connection between PHA synthesis and bacterial chemotaxis. For example, chemotaxis helps bacteria move towards specific carbon sources that favor PHA synthesis, and the interaction between PhaD and CheA weakens chemotaxis, causing bacteria to linger in areas rich in these carbon sources. This is an interesting hypothesis worth testing in the future.
(6) Line 195-196, "CsoR/PhaD had no apparent influence on the phosphate transfer between CheA and CheY". CheA controls bacterial chemotaxis through CheY phosphorylation. If this is true, how do CsoR and PhaD affect chemotaxis?
During the autophosphorylation assay, CheA was mixed with CsoR/PhaD and incubated for about 10 min before adding [<sup>32</sup>P]ATP[γP]. Thus, the effect of CsoR/PhaD on CheA autophosphorylation happened through the assay, and a significant inhibition effect was observed in the final result. Regarding transphosphorylation, CheA was mixed with ATP and incubated for about 30 min, at which time the autophosphorylation of CheA happened. Then, CsoR/PhaD and CheY were added to the phosphorylated CheA to investigate transphosphorylation. CsoR and PhaD affected chemotaxis via inhibiting CheA autophosphorylation, which was a crucial step in chemotaxis signaling, and the decrease in CheA autophosphorylation caused decreased chemotaxis.
(7) Figure 3 shows that CsoR/PhaD bind to CheA through P1, P3, and P4. This result is intriguing. All CheA proteins contain these three domains. If this is true, CsoR/PhaD should bind to other bacterial CheAs too. That said, this experiment is premature and needs to be confirmed by other approaches.
As replied to comment (2) above, we performed a BTH assay to investigate whether CsoR<sub>P. putida</sub> interacts with CheA from other bacterial species. The results revealed that CsoR<sub>P. putida</sub> interacted with CheA from A. caldus, B. subtilis, L. monocytogenes, P. fluorescens, P. syringae, and P. stutzeri, but not with CheA from E. coli and B. diazoefficiens. This result suggested that CheA-CsoR interaction required specific/unique amino acid sequence patterns in the two proteins, and similar domain composition alone was insufficient.
(8) Figure 5, does PhaD contain these three residues (C40, H65, and C69)? If not, how does PhaD inhibit CheA autophosphorylation and chemotactic response to copper?
No, there is no significant sequence similarity between PhaD and CsoR, and PhaD contains none of the three residues of CsoR (C40, H65, and C69). The size of the two proteins is also quite different (CsoR 10.8 kDa, PhaD 23.1 kDa). The structure alignment also revealed no apparent similarity between the predicted structures of PhaD and CsoR (new Fig. S5c in the manuscript). Nevertheless, CsoR and PhaD interacted with CheA through its P1, P3, and P4 domains. It is interesting how the two proteins interacted with CheA, but we currently have no answer.
(9) Does deletion of cosR or cheA have any impact on P. putida resistance to high concentrations of copper?
No, deletion of cosR/cheA had no noticeable impact on P. putida's resistance to high concentrations of copper. We performed a growth assay to test the effect of CsoR and CheA on copper resistance under both liquid and solid medium conditions. The copper concentration was set at 0, 200, 500, 1000 μM. With the increase of copper concentration, the growth of bacteria was gradually inhibited, but the growth trends of csoR mutant, cheA mutant, and complementary strains were similar to that of the wild-type strain (new Fig. S6b and S6c in the manuscript). We speculated that this might be attributed to CsoR being a repressor and inhibiting gene expression in the absence of copper. When copper existed, the inhibitory effect of CsoR was relieved, which is the same as that in the csoR mutant. Besides, although deletion of cosR led to a slight increase (about 1.3-fold) in the expression of copper resistance genes (Fig. 4b in the manuscript), its effect on gene expression was much weaker than its homologous protein in other bacterial species. In M. tuberculosis, B. subtilis, C. glutamicum, L. monocytogenes, and S. aureus, deletion of csoR resulted in an about 10-fold increase in the expression of target genes in the absence of copper. This difference might be attributed to several vital regulators that activated the expression of copper-resistance genes in response to copper in P. putida, such as CueR and CopR (Adaikkalam and Swarup, Microbiology. 2002, 148:2857-2867; Hofmann et al., Int J Mol Sci, 2021, 22:2050; Quintana et al., J Biol Chem, 2017, 292:15691-15704). CueR positively regulated the expression of cueA, encoding a copper-transporting P1-type ATPase that played a crucial role in copper resistance. CopR was essential for expressing several genes implicated in cytoplasmic copper homeostasis, such as copA-II, copB-II, and cusA. The existence of these positive regulators makes the function of CosR a secondary or even dispensable insurance in the expression of copper-resistance genes. Consistent with this, there is no CosR homolog in P. aeruginosa, and copper homeostasis is mainly controlled by CueR and CopR.
Reviewer #2 (Public Review):
This manuscript focuses on the apparent involvement of a proposed copper-responsive regulator in the chemotactic response of Pseudomonas putida to Cu(II), a chemorepellent. Broadly, this area is of interest because it could provide insight into how soil microbes mitigate metal stress. Additionally, copper has some historical agricultural use as an antimicrobial, thus can accumulate in soil. The manuscript bases its conclusions on an in vitro screen to identify interacting partners of CheA, an essential kinase in the P. putida chemotaxis-signaling pathway. Much of the subsequent analysis focuses on a regulator of the CsoR/RcnR family (PP_2969).
Weaknesses:
The data presented in this work does not support the model (Figure 8). In particular, PP_2969 is linked to Ni/Co resistance, not Cu resistance. Further, it is not clear how the putative new interactions with CheA would be integrated into diverse responses to various chemoattract/repellents. These two comments are justified below.
Thanks a lot for all these comments. Before designing experiments to explore the function of PP_2969, we found three clues: (i) its sequence showed 38% similarity to the copper-responsive regulator CsoR of M. tuberculosis, and the three conserved amino acids essential for copper-binding were conserved in PP_2969; (ii) it located next to a Ni<sup>2+</sup>/Co<sup>2+</sup> transporter (PP_2968) on the genome; (iii) a previous report revealed that PP_2969 (also named MreA) expression increased during metal stress, and overexpression of PP_2969 in P. putida and E. coli led to metal accumulation (Zn, Cd, and Cr) (Lunavat et al., Curr Microbiol. 2022, 79:142). These clues indicate that the function of PP_2969 is related to metal-binding, but it remains to be explored which metal(s) PP_2969 binds to. Thus, we played MST assay to test the interaction between PP_2969 and metals, including copper (Cu<sup>2+</sup>), zinc (Zn<sup>2+</sup>), nickel (Ni<sup>2+</sup>), cobalt (Co<sup>2+</sup>), cadmium (Cd<sup>2+</sup>), and magnesium (Mg<sup>2+</sup>). The result showed that PP_2969 was bound to three metal ions (Cu<sup>2+</sup>, Zn<sup>2+</sup>, Ni<sup>2+</sup>), and the binding to Cu<sup>2+</sup> was the strongest. Besides, the EMSA assay revealed that Cu<sup>2+</sup>/Ni<sup>2+</sup>/Zn<sup>2+</sup> inhibited the interaction between PP_2969 and promoter DNA, and Cu<sup>2+</sup> showed the most substantial inhibitory effect at the same concentration. These results suggested that PP_2969 was mainly bound to Cu<sup>2+</sup>, followed by Zn<sup>2+</sup> and Ni<sup>2+</sup>. To further test whether PP_2969 functioned as a metal-responsive repressor and which metal resistance was related to its target gene, we constructed a PP_2969 deletion mutant and complementary strain and performed a qPCR assay to compare the expression of metal resistance-related genes. 14 metal-resistant-related genes were chosen as targets. The results showed that PP_2969 deletion led to a weak but significant increase (about 1.3-fold) in expression of 10 genes, including three copper-resistance genes (copA-I, copA-II, and copB-II), one nickel-resistance gene (nikB), two cadmium-resistance genes (cadA-I and cadA-III), one cobalt-resistance gene (cbtA), and three multiple metal-resistance genes (czcC-I, czcB-II, and PP_0026) (Fig. 4b, Fig. S5a in the manuscript). Meanwhile, complementation with a multicopy plasmid containing the PP_2969 gene decreased the gene expression in Δ_PP_2969_. Although PP_2969 regulated the expression of multiple metal resistance genes, it showed the most robust binding to Cu<sup>2+</sup>. Thus, we considered its primary function as a Cu<sup>2+</sup>-responsive regulator.
As for the second comment, “How would the putative new interactions with CheA be integrated into diverse responses to various chemoattract/repellents?”, We have some speculations based on our results and previous reports. For example, PP_2969 interacted with CheA and decreased its autophosphorylation activity, and copper inhibited the interaction between CheA and PP_2969. In the absence of copper, PP_2969 binds to promoters to inhibit the expression of copper resistance genes, and it also binds to CheA to inhibit its autophosphorylation, resulting in lower chemotaxis. When the bacteria move to an area of high copper concentration, PP_2969 binds to copper and falls off the DNA promoter, leading to higher expression of copper resistance genes. Meanwhile, copper-binding of PP_2969 decreases its interaction with CheA, increasing CheA autophosphorylation promoting chemotaxis, and bacteria swim away from the high copper concentration. Another attractive target protein is PhaD, a TetR family transcriptional regulator located adjacent to the genes involved in PHA biosynthesis, and it behaves as a carbon source-dependent activator of the pha cluster related to polyhydroxyalkanoates (PHAs) biosynthesis (de Eugenio et al., Environ Microbiol. 2010, 12:1591-1603; Tarazona et al., Environ Microbiol. 2020, 22:3922-3936). Bacterial PHAs are isotactic polymers synthesized under unfavorable growth conditions in the presence of excess carbon sources. PHAs are critical in central metabolism, acting as dynamic carbon reservoirs and reducing equivalents (Gregory et al., Trends Mol Med. 2022, 28:331-342). The interaction between PhaD and CheA leads us to speculate that there might be some connection between PHA synthesis and bacterial chemotaxis. For example, chemotaxis helps bacteria move towards particular carbon sources that favor PHA synthesis; the regulator PhaD activates the genes related to PHA synthesis. Meanwhile, the interaction between PhaD and CheA weakens chemotaxis, causing bacteria to linger in areas rich in these carbon sources. Collectively, we speculate that by interacting with CheA and modulating its autophosphorylation, target proteins such as CsoR/PhaD integrate signals from their original process pathway into chemotaxis signaling.
PP_2969
(1) The authors present a sequence alignment (Figure S5) that is the sole basis for their initial assignment of this ORF as a CsoR protein. There is a conservation of the primary coordinating ligands (highlighted with asterisks) known to be involved in Cu(I) binding to CsoR (ref 31). There are some key differences, though, in residues immediately adjacent to the conserved Cys (the preceding Ala, which is Tyr in the other sequences). The effect of these changes may be significant in a physiological context.
We constructed a point mutation in PP_2969 by replacing the Ala residue before the conserved Cys with a Tyr (CsoR<sub>A39Y</sub>) and then analyzed the effect of this mutation on CsoR. As shown in Author response image 1a, CsoR<sub>A39Y</sub> showed similar promoter-binding ability as the wild-type CsoR and the presence of Cu<sup>2+</sup> abolished the interaction between CsoR<sub>A39Y</sub> and DNA, suggesting that the A39 residue in PP_2969 was not essential for the DNA-binding and Cu<sup>2+</sup>-binding abilities. Besides, CsoR<sub>A39Y</sub> interacted with CheA as the wild-type CsoR did (Author response image 1b), indicating that the Ala39 residue was not required to interact with CheA.
The CsoR from B. subtilis has a Tyr before the conserved Cys, which is the same as other sequences, and the BTH result showed that interaction existed between CsoR and CheA from B. subtilis (Fig. 7 in the manuscript).
Author response image 1.
The effect of CsoR point mutation (CsoR<sub>A39Y</sub>) on the DNA-binding and Cu<sup>2+</sup>-binding abilities of CsoR. (a) Analysis for interactions between CsoR/CsoR<sub>A39Y</sub> and copA-I promoter DNA using EMSA. The concentrations of CsoR/CsoR<sub>A39Y</sub> and Cu<sup>2+</sup> added in each lane are shown above the gel. Free DNA and protein-DNA complexes are indicated. (b) The interaction between CsoR/CsoR<sub>A39Y</sub> and CheA was tested by BTH. Blue indicates protein-protein interaction in the colony after 60 h of incubation, while white indicates no protein-protein interaction. CK+ represents positive control, and CK- represents negative control.
(2) The gene immediately downstream of PP_2969 is homologous to E. coli RcnA, a demonstrated Ni/Co efflux protein, suggesting that P2969 may be Ni or Co responsive. Indeed PP_2970 has previously been reported as Ni/Co responsive (J. Bact 2009 doi:10.1128/JB.00465-09). The host cytosol plays a critical role in determining metal response, in addition to the protein, which can explain the divergence from the metal response expected from the alignment.
Correction: The gene immediately upstream (not downstream) of PP_2969 (the ID is PP_2968, not PP_2970) is homologous to E. coli RcnA, a demonstrated Ni/Co efflux protein. The previous JBact study (J. Bact 2009 doi:10.1128/JB.00465-09) named PP_2968 as MrdH, and mrdH disruption led to sensitivity to cadmium, zinc, nickel, and cobalt, but not copper. Their results also revealed that MrdH was a broad-spectrum metal efflux transporter with a substrate range including Cd<sup>2+</sup>, Zn<sup>2+</sup>, and Ni<sup>2+</sup>. However, the role of MrdH in Cu<sup>2+</sup> efflux was not tested. Commonly, metal efflux transporter has a broad substrate spectrum, allowing transporters to influence bacterial resistance to a variety of metals (Munkelt et al., J Bacteriol. 2004, 186:8036-8043; Grass et al., J Bacteriol. 2005, 187:1604-1611; Nies et al., J Ind Microbiol. 1995, 14:186-199; Kelley et al., Metallomics. 2021, 13:mfaa002). Our results showed that PP_2969 bound to Cu<sup>2+</sup>, Zn<sup>2+</sup>, and Ni<sup>2+</sup> under our experimental conditions, and CsoR regulated the expression of genes related to Cu<sup>2+</sup>, Zn<sup>2+</sup>, and Ni<sup>2+</sup> resistance, indicating that CsoR was involved in resistance to these metals. But the binding of CsoR to Cu<sup>2+</sup> was the strongest, and Cu<sup>2+</sup> showed the most substantial inhibitory effect on CsoR-DNA interaction. Thus, we considered its primary function as a Cu<sup>2+</sup>-responsive regulator.
(3) The previous JBact study also explains the lack of an effect (Figure 5b) of deleting PP_2969 on copper-efflux gene expression (copA-I, copA-II, and copB-II) as these are regulated by CueR not PP_2969 consistent with the previous report. Deletion of CsoR/RcnR family regulator will result in constitutive expression of the relevant efflux/detoxification gene, at a level generally equivalent to the de-repression observed in the presence of the signal.
We performed qPCR to test the effect of PP_2969 on gene expression, and we chose 14 target genes, including copper-resistance genes, nickel-resistance genes, zinc-resistance genes, cadmium-resistance genes, and cobalt-resistance genes. The results showed that PP_2969 deletion led to a weak but significant increase (about 1.3-fold) in the expression of 10 genes (Fig. 4b, new Fig. S5a in the manuscript), and complementation with a multicopy plasmid containing PP_2969 gene decreased the gene expression in Δ_PP_2969_. We were confused about these results. Why was the effect of PP_2969 on gene expression so weak? Did we pick the wrong target genes? In other bacteria, deletion of csoR led to an about ten-fold increase in gene expression, generally equivalent to the de-repression observed in the presence of metal. Thus, to further identify target genes, we performed RNA-seq to compare the gene expression in WT and Δ_PP_2969_ without copper. The result surprised us because no gene expression levels changed more than two-fold (data not shown). This result might be attributed to several vital regulators that activated the expression of metal-resistance genes in response to metal in P. putida, such as CueR and CopR (Adaikkalam and Swarup, Microbiology. 2002, 148:2857-2867; Hofmann et al., Int J Mol Sci, 2021, 22:2050; Quintana et al., J Biol Chem, 2017, 292:15691-15704). CueR positively regulated the expression of cueA, encoding a copper-transporting P1-type ATPase that played a crucial role in copper resistance. CopR was essential for expressing several genes implicated in cytoplasmic copper homeostasis, such as copA-II, copB-II, and cusA. The existence of these positive regulators might make the function of CosR a secondary or even dispensable insurance in the expression of copper-resistance genes. Consistent with this, there is no CosR homolog in P. aeruginosa, and copper homeostasis is mainly controlled by CueR and CopR.
(4) Further, CsoR proteins are Cu(I) responsive so measuring Cu(II) binding affinity is not physiologically relevant (Figures 5a and S5b). The affinities of demonstrated CsoR proteins are 10-18 M and these values are determined by competition assay. The MTS assay and resulting affinities are not physiologically relevant.
Thank you for this enlightening comment. This question also confused us during our experiment. The first study on CsoR from Mycobacterium tuberculosis showed that CsoR bound a single-monomer mole equivalent of Cu(I) to form a trigonally coordinated complex, and that was a convincing result from protein structure analysis (Liu et al., Nat Chem Biol. 2007, 3:60-68). They further revealed that the presence of Cu(I) in the EMSA assay abolished the DNA-binding ability of CsoR, but the impact of Cu(II) was not tested. Besides, their results also showed that adding CuCl<sub>2</sub> in the medium induced the expression of the cso operon involved in copper resistance. Perhaps Cu(II) converted to Cu(I) and then bound to CsoR in bacterial cells. Later studies in diverse bacterial species (including Listeria monocytogenes, Corynebacterium glutamicum, Deinococcus radiodurans, and Thermus thermophilus) showed that in vitro assays with Cu(II) abolished the DNA-binding ability of CsoR, indicating that CsoR bound to both Cu (I) and Cu(II) (Corbett et al., Mol Microbiol. 2011, 81:457-472; Teramoto et al., Biosci Biotechnol Biochem. 2012, 76:1952-1958; Zhao et al., Mol Biosyst. 2014, 10:2607-2616; Sakamoto et al., Microbiology. 2010, 156:1993-2005). Here, our results from in vitro assays (MST and EMSA) showed that CsoR bound to Cu(II) and Cu(II) affected the interaction between CsoR and promoter DNA. Compounds containing Cu(I) are poorly soluble in water and easily oxidized by Cu(II). DTT can reduce Cu(II) to Cu(I) (Krzel et al., J Inorg Biochem. 2001, 84:77-88). To test whether Cu(I) bound to CsoR and affected its DNA-binding ability, we recently performed an EMSA assay with the addition of CuCl<sub>2</sub>/DTT/CuCl<sub>2</sub>+DTT. As shown in Fig. 4d, the addition of DTT (0.1 and 1 mM) decreased CsoR-DNA interaction in the presence of 0.2 mM CuCl<sub>2</sub>, while the addition of DTT alone had no apparent influence on CsoR-DNA interaction, indicating that DTT enhanced the inhibition of CuCl<sub>2</sub> on CsoR-DNA interaction, and the Cu(I) converted from Cu(II) by DTT had stronger inhibitory effect than Cu(II) on CsoR-DNA interaction. Together, these results suggested that CsoR bound to Cu(I) more strongly than it bound to Cu(II). We have added these results to the new version of manuscript.
(5) The DNA-binding assays are carried out at protein concentrations well above physiological ranges (Figures 5c and d, and S5c, d). The weak binding will in part result from using DNA sequences upstream of the copA genes and not from PP_2970.
We performed the vitro DNA-binding assay several times, and the lowest CsoR concentration used to obtain a shifted band was about 3 μM, and a higher concentration (15 μM) caused total DNA binding. Thus, we used the concentration of 15 and 20 μM to test the effect of metal on protein-DNA interaction in the assay. We also realized that these concentrations were above physiological ranges. We considered that the in vitro DNA-binding assay was only a mimic of the in vivo process, and the extracellular physiological conditions in EMSA might restrict the activity of CsoR. Besides, we recently performed EMSA to investigate the interaction between CsoR and its own promoter (csoRpro). As shown in Author response image 2, CsoR bound to csoRpro with a similar intensity to that it bound to copA-Ipro. Thus, the weak binding was not caused by the promoter used in the assay.
Author response image 2.
The binding of CsoR to its own promoter (csoRpro) and copA-I promoter (copA-1pro) in EMSA. The concentrations of CsoR added in each lane are shown above the gel. Free DNA and CsoR-DNA complex are indicated.
CheA interactions
(1) There is no consideration given to the likely physiological relevance of the new interacting partners for CheA.
Thank you for this comment. The initial purpose of this research was to identify new CheA-interacting proteins to broaden our knowledge of CheA and bacterial chemotaxis. Thus, we are currently focusing on the effect of the interaction on CheA and chemotaxis and trying to find the link between different processes and bacterial chemotaxis. We infer that the interaction between these new interacting partners and CheA can integrate signals from different pathways into the chemotaxis signaling pathway so that bacteria can better sense and adapt to different environments. Besides, the other role of the interaction, which is the influence of CheA on these new interacting partners, is also an exciting question that remains to be answered. Among the 16 new CheA-interacting proteins, five showed significant influence on chemotaxis, and the remaining 11 proteins had no obvious impact on chemotaxis (Fig. 2a in the manuscript). CsoR and PhaD inhibited CheA autophosphorylation, and here we focused on the effect of CsoR on chemotaxis. We also investigated the impact of CheA on CsoR, such as gene regulation and copper resistance. However, the results showed that CheA had no obvious influence on these functions of CsoR. The interactions between CheA and these proteins may be physiologically biased, with some interactions affecting the function of CheA and others mainly affecting the function of partners. Future studies on the function of these new CheA-interacting proteins and the role of CheA in regulating their functions would further expand our knowledge of CheA.
(2) How much CheA is present in the cell (copies) and how many copies of other proteins are present? How would specific responses involving individual interacting partners be possible with such a heterogenous pool of putative CheA-complexes in a cell? For PP_2969, the affinity reported (Figure 5A) may lay at the upper end of the CsoR concentration range (for example, CueR in Salmonella is present at ~40 nM).
Thank you for this insightful comment. We don’t know the copy number of CheA and other proteins in the cell. We were also initially surprised and felt skeptical about the reliability of CheA interaction with so many proteins. CheA interacts with CheY, CheW, and CheB in the classical chemotaxis pathway. This study found 16 new CheA-interacting proteins using pull-down assay and subsequent analysis. Moreover, in another unpublished result, we found that CheA interacted with eight c-di-GMP-metabolizing proteins, and CheA transferred the phosphate group to one of them. Together, it seemed that CheA could interact with at least 27 proteins. With such a heterogeneous pool of CheA-complexes, performing a specific response seemed difficult. However, several previous studies have reported the example of one protein interacting with dozens of proteins. For example, the c-di-GMP effector LapD in Pseudomonas fluorescens and Pseudomonas putida can interact with a dozen different c-di-GMP-metabolizing proteins (Giacalone et al., mBio. 2018, 9:e01254-18; Nie et al., Mol Microbiol. 2024, 121:1-17.) In Escherichia coli, a subset of DGCs and PDEs operated as central interaction hubs in a larger “supermodule” by interacting with dozens of proteins (Sarenko et al., mBio. 2017, 8:e01639-17). We infer that the expression of different CheA-interacting proteins might happen at different growth stages or under different conditions, and their interaction with CheA under that stage/condition changed bacterial chemotaxis or the process in which the target protein was involved.
(3) The two-hybrid system experiment uses a long growth time (60 h) before analysis. Even low LacZ activity levels will generate a blue color, depending upon growth medium (see doi: 10.1016/0076-6879(91)04011-c). It is also not clear how Miller units can be accurately or precisely determined from a solid plate assay (the reference cited describes a protocol for liquid culture).
We didn’t observe a blue color on the colony after 60 h growth on a plate under our experimental conditions. The BTH experiment was described as follows: After transforming the two plasmids into E. coli BTH101 cells, the plates containing transformants were placed at 28° for 48 h, at which time the colonies of the transformants were big enough to be picked up and incubated in a liquid medium for 24 h at 28°. Then, 5 μL of the culture was spotted onto an LB agar plate supplemented with antibiotics, X-gal, and IPTG and incubated for 60 h at 28° before taking the photos. After the photos were taken, the bacteria on the plate were scraped off and resuspended with buffer, and then the LacZ activity of the bacteria was tested. According to our experience, culture at 28°(lower than 30°) is a critical condition, and we have not observed false positives in BTH assays under this condition.
Reviewer #1 (Recommendations For The Authors):
In addition to genetic and biochemical approaches, structural studies should be conducted to elucidate the molecular interaction between CheA and CsoR with/without copper.
It would be more logical to first establish the role of CsoR in copper regulation and chemotaxis (the second part of this report) and then investigate its underpinning mechanism (the first part).
Thank you for these recommendations. Structural analysis can reveal more details about the molecular mechanism of CheA-CsoR interaction, but we currently don’t have sufficient experimental conditions for such structural analysis.
As for the presentation logic of the results, we wrote the manuscript following the sequence of experiments. Firstly, screening of CheA interacting proteins (pull-down assay) was conducted, and then the influence of interacting proteins on the chemotaxis of strains and CheA autophosphorylation activity was detected. Based on these results, we obtained two proteins, CsoR and PhaD, and decided to go deeper into the function of CsoR and its effect on chemotaxis. We considered that this writing logic reflected our research design better and could also lay a foundation for future exploration of the functions of other interacting proteins and the physiological significance of interactions.
Reviewer #2 (Recommendations For The Authors):
A huge amount of effort has gone into this work.
It would be good to see at least one of the newly identified interactions turn out to be physiologically relevant.
The experimental tools appear to be available to do this, but it is critical to consider how these tools can lead to attempts to prove rather than test and possibly refute a model or hypothesis. In particular, please consider some of the comments about the physiological relevance of affinities when generating models.
Thank you for these recommendations. Our study aimed to screen new interacting proteins of CheA and explore how new interacting proteins affect CheA activity and bacterial chemotaxis, thereby broadening our understanding of chemotaxis. However, the impact of each protein-protein interaction has two sides: the influence of A to B and B to A. During experimental design, we focused more on the influence of identified interacting proteins on CheA function and chemotaxis but paid less attention to the function of interacting proteins and the influence of the interaction on their function. Moreover, our study found that the influence of protein-protein interaction was biased. In the interaction between CsoR and CheA, CsoR mainly affected the function of CheA and then affected the chemotaxis, while CheA had no significant effect on the function of CsoR. This might be attributed to the weak effect of CsoR in regulating metal resistance in P. putida, and we speculated that this interaction was more about favoring the sensing and avoiding metal stress. In addition, we planned to explore the interaction between CheA and another interacting protein (PhaD) in the future, reveal the effect of the interaction on PhaD function (regulation of PHAS synthesis in bacteria), and explore the effect of the interaction on CheA function and chemotaxis, to find out whether the association existed between PHAS anabolism and bacterial chemotaxis. Besides, for those proteins that did not have significant effects on CheA autophosphorylation and bacterial chemotaxis, we speculated that CheA might affect their function/activity through interactions, which meant that the physiological effects of the interaction mainly reflected through the interacting protein rather than CheA. These are speculations that need to be tested by experiments.
-
-
www.biorxiv.org www.biorxiv.org
-
eLife Assessment
This important study identifies a new class of small molecules that activate the integrated stress response (ISR) via the kinase HRI. Convincing evidence, including the image analysis pipeline, indicates that two of these compounds promote mitochondrial elongation and protect against mitochondrial fragmentation caused by chemical stress conditions or by genetic alterations. These findings open an avenue for new strategies for mitochondrial dysfunction targeting linked to ISR alterations.
-
Reviewer #1 (Public review):
Summary:
This manuscript (Baron, Oviedo et al., 2024) builds on a previous study from the Wiseman lab (Perea, Baron et al., 2023) and describes the identification of novel nucleoside mimetics that activate the HRI branch of the ISR and drive mitochondrial elongation. The authors develop an image processing and analysis pipeline to quantify the effects of these compounds on mitochondrial networks and show that these HRI activators mitigate ionomycin driven mitochondrial fragmentation. They then show that these compounds rescue mitochondrial morphology defects in patient-derived MFN2 mutant cell lines.
Strengths:
The identification of new ISR modulators opens new avenues for biological discovery surrounding the interplay between mitochondrial form/function and the ISR, a topic that is of broad interest. Conceptually, this work suggests that such compounds might represent new potential therapeutics for certain mitochondrial disorders. Additionally, the development of a quantitative image analysis pipeline is valuable and has the potential to extract subtle effects of various treatments on mitochondrial morphology.
Weaknesses:
While the ISR modulators described here correct the morphology of mitochondria in MFN2.D414V mutant cells, the impact of these compounds on the function of mitochondria in the mutant cells remains unaddressed. Sharma et al., 2022 provide data for a deficit in mitochondrial OCR in MFN2.D414V cells which, if rescued by these compounds, would strengthen the argument that pharmacological ISR kinase activation is a strategy for targeting the functional consequences of the dysregulation of mitochondrial form.
-
Reviewer #2 (Public review):
Summary.
Mitochondrial dysfunction is associated with a wide spectrum of genetic and age-related diseases. Healthy mitochondria form a dynamic reticular network and constantly fuse, divide, and move. In contrast, dysfunctional mitochondria have altered dynamic properties resulting in fragmentation of the network and more static mitochondria. It has recently been reported that different types of mitochondrial stress or dysfunction activate kinases that control the integrated stress response, including HRI, PERK and GCN2. Kinase activity results in decreased global translation and increased transcription of stress response genes via ATF4, including genes that encode mitochondrial protein chaperones and proteases (HSP70 and LON). In addition, the ISR kinases regulate other mitochondrial functions including mitochondrial morphology, phospholipid composition, inner membrane organization, and respiratory chain activity. Increased mitochondrial connectivity may be a protective mechanism that could be initiated by pharmacological activation of ISR kinases, as was recently demonstrated for GCN2.
A small molecule screening platform was used to identify nucleoside mimetic compounds that activate HRI. These compounds promote mitochondrial elongation and protect against acute mitochondrial fragmentation induced by a calcium ionophore. Mitochondrial connectivity is also increased in patient cells with a dominant mutation in MFN2 by treatment with the compounds.
Strengths:
(1) The screen leverages a well-characterized reporter of the ISR: translation of ATF4-FLuc is activated in response to ER stress or mitochondrial stress. Nucleoside mimetic compounds were screened for activation of the reporter, which resulted in the identification of nine hits. The two most efficacious in dose response tests were chosen for further analysis (0357 and 3610). The authors clearly state that the compounds have low potency. These compounds were specific to the ISR and did not activate the unfolded protein response or the heat shock response. Kinases activated in the ISR were systematically depleted by CRISPRi revealing that the compounds activate HRI.<br /> (2) The status of the mitochondrial network was assessed with an Imaris analysis pipeline and attributes such as length, sphericity, and ellipsoid principal axis length were quantified. The characteristics of the mitochondrial network in cells treated with the compounds were consistent with increased connectivity. Rigorous controls were included. These changes were attenuated with pharmacological inhibition of the ISR.<br /> (3) Treatment of cells with the calcium ionophore results in rapid mitochondrial fragmentation. This was diminished by pre-treatment with 0357 or 3610 and control treatment with thapsigargin and halofuginone.<br /> (4) Pathogenic mutations in MFN2 result in the neurodegenerative disease Charcot-Marie-Tooth Syndrome Type 2A (CMT2A). Patient cells that express Mfn2-D414V possess fragmented mitochondrial networks and treatment with 0357 or 3610 increased mitochondrial connectivity in these cells.
Weaknesses:
The weakness is the limited analysis of cellular changes following treatment with the compounds.<br /> (1) Unclear how 0357 or 3610 alter other aspects of cellular physiology. While this would be satisfying to know, it may be that the authors determined that broad, unbiased experiments such as RNAseq or proteomic analysis are not justified due to the limited translational potential of these specific compounds.<br /> (2) There are many changes in Mfn2-D414V patient cells including reduced respiratory capacity, reduced mtDNA copy number, and fewer mitochondrial-ER contact sites. These experiments are relatively narrow in scope and quantifying more than mitochondrial structure would reveal if the compounds improve mitochondrial function, as is predicted by their model.
Comments on revisions:
Many reviewer concerns have been addressed or will be addressed in forthcoming manuscripts.
-
Reviewer #3 (Public review):
Summary:
Mitochondrial injury activates eiF2α kinases-PERK, GCN2, HRI and PKR-which collectively regulate the Integrated Stress Response (ISR) to preserve mitochondrial function and integrity. Previous work has demonstrated that stress-induced and pharmacologic stress-independent ISR activation promotes adaptive mitochondrial elongation via the PERK and GCN2 kinases, respectively. Here, the authors demonstrate that pharmacologic ISR inducers of HRI and GCN2 enhance mitochondrial elongation and suppress mitochondrial fragmentation in two disease models, illustrating the therapeutic potential of pharmacologic ISR activators. Specifically, the authors first used an innovative ISR translational reporter to screen for nucleoside mimetic compounds that induce ISR signaling, and identified two compounds, 0357 and 3610, that preferentially activate HRI. Using a mitochondrial-targeted GFP MEF cell line, the authors next determined that these compounds (as well as the GCN2 activator, halofuginone) enhance mitochondrial elongation in an ISR-dependent manner. Moreover, pretreatment of MEFs with these ISR kinase activators suppressed pathological mitochondrial fragmentation caused by a calcium ionophore. Finally, pharmacologic HRI and GCN2 activation was found to preserve mitochondrial morphology in human fibroblasts expressing a pathologic variant in MFN2, a defect that leads to mitochondrial fragmentation and is a cause of Charcot Marie Tooth Type 2A disease.
Strengths:
This well-written manuscript has several notable strengths, including the demonstration of the potential therapeutic benefit of ISR modulation. New chemical entities with which to further interrogate this stress response pathway are also reported. In addition, the authors used an elegant screen to isolate compounds that selectively activate the ISR and identify which of the four kinases was responsible for activation. Special attention was also paid to a thorough evaluation of the effect of their compounds on other stress response pathways (i.e. the UPR, and heat and oxidative stress responses), thereby minimizing the potential for off-target effects. The implementation of automated image analysis rather than manual scoring to quantify mitochondrial elongation is not only practical but also adds to the scientific rigor, as does the complementary use of both the calcium ionophore and MFN2 models to enhance confidence and the broad therapeutic potential for pharmacology ISR manipulation.
Weaknesses:
The only minor concerns are with regard to effects on cell health and the timing of pharmacological administration.
Comments on revisions:
In this revised manuscript the authors demonstrate that pharmacological activation of the eiF2α kinases, HRI and GCN2, induce adaptive mitochondrial elongation and suppress mitochondrial fragmentation in two disease models, illustrating the translational potential of pharmacological ISR modulation.
In revising their manuscript the authors adequately addressed the concerns. In response to comments about the potential toxicity of their compounds, 0357 and 3610, the authors furnish evidence that neither compound significantly reduced viability of HEK293 cells (Figure S1G). Understandably, the authors focused the present work on the acute effects of their compounds. Several other attributes are noteworthy: First, that injury attributable to chronic ISR activation in cell culture may ultimately be circumvented by altering the in vivo pharmacodynamic and pharmacodynamic properties of the compounds, thereby preserving the translation potential for these (and related) compounds. Second, the authors also reasonably explain that the rapidity of ionomycin-induced injury, necessitating that the inducers are administered prior to treatment. Their assessment of the effects of the compounds on mitochondrial fragmentation in MFN2 mutant fibroblasts-in combination with the preserved viability of HEK293 cells-is sufficient to demonstrate the practical pharmacological potential for these (or related) agents.
-
Author response:
The following is the authors’ response to the original reviews.
Public Reviews:
Reviewer #1 (Public review):
Summary:
This manuscript (Baron, Oviedo et al., 2024) builds on a previous study from the Wiseman lab (Perea, Baron et al., 2023) and describes the identification of novel nucleoside mimetics that activate the HRI branch of the ISR and drive mitochondrial elongation. The authors develop an image processing and analysis pipeline to quantify the effects of these compounds on mitochondrial networks and show that these HRI activators mitigate ionomycin-driven mitochondrial fragmentation. They then show that these compounds rescue mitochondrial morphology defects in patient-derived MFN2 mutant cell lines.
Strengths:
The identification of new ISR modulators opens new avenues for biological discovery surrounding the interplay between mitochondrial form/function and the ISR, a topic that is of broad interest. It also reinforces the possibility that such compounds might represent new potential therapeutics for certain mitochondrial disorders. The development of a quantitative image analysis pipeline is valuable and has the potential to extract the subtle effects of various treatments on mitochondrial morphology.
We thank the reviewer for the positive feedback on our manuscript. We address all of the reviewer’s valuable concerns in the revised submission, as highlighted below.
Weaknesses:
I have three main concerns.
First, support for the selectivity of compounds 0357 and 3610 acting downstream of HRI comes from using knockdown ISR kinase cell lines and measuring the fluorescence of ATF4-mApple (Figure 1G and 1H). However, the selectivity of these compounds acting through HRI is not shown for mitochondrial morphology. Is mitochondrial elongation blocked in HRI knockdown cells treated with the compounds? While the ISRIB treatment does block mitochondrial elongation, ISRIB acts downstream of all ISR kinases and doesn't necessarily define selectivity for the HRI branch of the ISR. Additionally, are the effects of these compounds on ATF4 production and mitochondrial elongation blocked in a non-phosphorylatable eIF2alpha mutant?
We thank the reviewer for highlighting this point. As indicated by the reviewer, we show that compounddependent increases in mitochondrial elongation are blocked by co-treatment with ISRIB, indicating that this effect can be attributed to ISR activation. We prefer the use of this highly selective pharmacologic approach to block ISR activation, as opposed to the MEF<sup>A/A</sup> cells, as the use of pharmacologic approaches provide more temporal control over ISR inhibition and can prevent the type of chronic disruption to mitochondria associated with these types of genetic perturbations. However, the reviewer is correct that ISRIB blocks downstream of all ISR kinases, meaning that we cannot explicitly demonstrate that 0357 and 3610 induce mitochondrial elongation downstream of HRI-dependent ISR activation using this tool. Thus, to address this point, we have clarified the discussion of these results to make it clear that our results show that our compounds induce mitochondrial elongation downstream of the ISR, omitting the direct implications of HRI in this phenotype.
This point of selectivity/specificity of the compounds gets at a semantic stumbling block I encountered in the text where it was often stated "stress-independent activation" of ISR kinases. Nucleoside mimetics are likely a very biologically active class of molecules and are likely driving some level of cell stress independent of a classical ISR, UPR, heat-shock response, or oxidative stress response.
A major challenge in defining stress-independent activation of stress-responsive signaling pathways is the fact that the activation of these pathways is often used as a primary marker of cellular stress. While this can be overcome by transcriptome-wide profiling (e.g., RNAseq), the reviewer is correct that our focused profiling of select stress-responsive signaling pathways is insufficient to claim the stress-independent activation of the ISR by our prioritized compounds. To address this, we removed this terminology from the revised submission.
Second, it is difficult for me to interpret the data for the quantification of mitochondrial morphology. In the legend for Figure 2, it is stated that "The number of individual measurements for each condition are shown above." Are the individual measurements the number of total cells quantified? If not, how many total cells were analyzed? If the individual measurements are distinct mitochondrial structures that could be quantified why are the n's for each parameter (bounding box, ellipsoid principal axis, and sphericity) so different? Does this mean that for some mitochondria certain parameters were not included in the analysis? For me, it seems more intuitive that each mitochondrial unit should have all three parameters associated with it, but if this isn't the case it needs to be more carefully described why.
The number of individual measurements refers to the number of 3D segmentations generated using the “surfaces’ module in Imaris. As the reviewer noted, we expect each surface segmentation to represent a single “mitochondrial unit.” We have now further clarified this in the figure legend.
Regarding differences in sample size for each group, we used an outlier test (i.e., ROUT outlier test in PRISM 10) to remove apparent outliers in our data. Often, these outliers result from errors in the automatic quantification that inaccurately merge two mitochondria into one large segmentation. This explains the discrepancy in the number of measurements made for each experimental group. We have made this point more clear in the Materials and Methods section of the revised manuscript.
Third, the impact of these compounds on the physiological function of mitochondria in the MFN2.D414V mutants needs to be measured. Sharma et al., 2021 showed a clear deficit in mitochondrial OCR in MFN2.D414V cells which, if rescued by these compounds, would strengthen the argument that pharmacological ISR kinase activation is a strategy for targeting the functional consequences of the dysregulation of mitochondrial form.
In this manuscript, we demonstrate that pharmacologic activation of the ISR using 0357 and 3610 rescue mitochondrial morphology in patient fibroblasts expressing the disease-associated MFN2<sup>D414V</sup> mutant. The reviewer is correct that there are other mitochondrial phenotypes linked to the expression of this mutant. We are currently pursuing this question with more potent ISR activating compounds developed in our laboratory identified using the HTS screening platform described in this manuscript. However, this work, which builds on the studies described herein, uses other ISR activating compounds, which we feel would be best described in subsequent manuscripts that can fully define the activity of these new compounds.
Reviewer #2 (Public review):
Summary.
Mitochondrial dysfunction is associated with a wide spectrum of genetic and age-related diseases. Healthy mitochondria form a dynamic reticular network and constantly fuse, divide, and move. In contrast, dysfunctional mitochondria have altered dynamic properties resulting in fragmentation of the network and more static mitochondria. It has recently been reported that different types of mitochondrial stress or dysfunction activate kinases that control the integrated stress response, including HRI, PERK, and GCN2. Kinase activity results in decreased global translation and increased transcription of stress response genes via ATF4, including genes that encode mitochondrial protein chaperones and proteases (HSP70 and LON). In addition, the ISR kinases regulate other mitochondrial functions including mitochondrial morphology, phospholipid composition, inner membrane organization, and respiratory chain activity. Increased mitochondrial connectivity may be a protective mechanism that could be initiated by pharmacological activation of ISR kinases, as was recently demonstrated for GCN2.
A small molecule screening platform was used to identify nucleoside mimetic compounds that activate HRI. These compounds promote mitochondrial elongation and protect against acute mitochondrial fragmentation induced by a calcium ionophore. Mitochondrial connectivity is also increased in patient cells with a dominant mutation in MFN2 by treatment with the compounds.
Strengths:
(1) The screen leverages a well-characterized reporter of the ISR: translation of ATF4-FLuc is activated in response to ER stress or mitochondrial stress. Nucleoside mimetic compounds were screened for activation of the reporter, which resulted in the identification of nine hits. The two most efficacious dose-response tests were chosen for further analysis (0357 and 3610). The authors clearly state that the compounds have low potency. These compounds were specific to the ISR and did not activate the unfolded protein response or the heat shock response. Kinases activated in the ISR were systematically depleted by CRISPRi revealing that the compounds activate HRI.
(2) The status of the mitochondrial network was assessed with an Imaris analysis pipeline and attributes such as length, sphericity, and ellipsoid principal axis length were quantified. The characteristics of the mitochondrial network in cells treated with the compounds were consistent with increased connectivity. Rigorous controls were included. These changes were attenuated with pharmacological inhibition of the ISR.
(3) Treatment of cells with the calcium ionophore results in rapid mitochondrial fragmentation. This was diminished by pre-treatment with 0357 or 3610 and control treatment with thapsigargin and halofuginone
(4) Pathogenic mutations in MFN2 result in the neurodegenerative disease Charcot-Marie-Tooth Syndrome Type 2A (CMT2A). Patient cells that express Mfn2-D414V possess fragmented mitochondrial networks and treatment with 0357 or 3610 increased mitochondrial connectivity in these cells.
We appreciate the reviewer’s positive response to these aspects of our manuscript. We address the reviewer’s valuable comments in the revised submission as highlighted below.
Weaknesses:
The weakness is the limited analysis of cellular changes following treatment with the compounds.
(1) Unclear how 0357 or 3610 alter other aspects of cellular physiology. While this would be satisfying to know, it may be that the authors determined that broad, unbiased experiments such as RNAseq or proteomic analysis are not justified due to the limited translational potential of these specific compounds.
The reviewer is correct. The low potency of 0357 and 3610 limit the translational potential for these compounds. However, building on the work described herein, we recently identified more potent HRI activating compounds with higher translational potential. Using RNAseq profiling, we found that these compounds show transcriptomewide selectivity for the ISR and can promote adaptive remodeling of mitochondrial morphology and function in cellular models of multiple other diseases. These compounds will be further described in subsequent studies that expand on the efforts outlined here demonstrating the potential for pharmacologic HRI activators to promote adaptive mitochondrial remodeling.
(2) There are many changes in Mfn2-D414V patient cells including reduced respiratory capacity, reduced mtDNA copy number, and fewer mitochondrial-ER contact sites. These experiments are relatively narrow in scope and quantifying more than mitochondrial structure would reveal if the compounds improve mitochondrial function, as is predicted by their model.
In this manuscript, we demonstrate that pharmacologic activation of the ISR using 0357 and 3610 rescue mitochondrial morphology in patient fibroblasts expressing the disease-associated MFN2<sup>D414V</sup> mutant. The reviewer is correct that there are other mitochondrial phenotypes linked to the expression of this mutant. We are currently pursuing this question with more potent ISR activating compounds developed in our laboratory using the HTS screening platform described in this manuscript. However, this work, which builds on the studies described herein, uses other ISR activating compounds, which we feel would be best described in subsequent manuscripts that can fully define the activity of these new compounds.
Reviewer #3 (Public review):
Summary:
Mitochondrial injury activates eiF2α kinases - PERK, GCN2, HRI, and PKR - which collectively regulate the Integrated Stress Response (ISR) to preserve mitochondrial function and integrity. Previous work has demonstrated that stress-induced and pharmacologic stress-independent ISR activation promotes adaptive mitochondrial elongation via the PERK and GCN2 kinases, respectively. Here, the authors demonstrate that pharmacologic ISR inducers of HRI and GCN2 enhance mitochondrial elongation and suppress mitochondrial fragmentation in two disease models, illustrating the therapeutic potential of pharmacologic ISR activators. Specifically, the authors first used an innovative ISR translational reporter to screen for nucleoside mimetic compounds that induce ISR signaling and identified two compounds, 0357 and 3610, that preferentially activate HRI. Using a mitochondrial-targeted GFP MEF cell line, the authors next determined that these compounds (as well as the GCN2 activator, halofuginone) enhance mitochondrial elongation in an ISR-dependent manner. Moreover, pretreatment of MEFs with these ISR kinase activators suppressed pathological mitochondrial fragmentation caused by a calcium ionophore. Finally, pharmacologic HRI and GCN2 activation were found to preserve mitochondrial morphology in human fibroblasts expressing a pathologic variant in MFN2, a defect that leads to mitochondrial fragmentation and is a cause of Charcot Marie Tooth Type 2A disease.
Strengths:
This well-written manuscript has several notable strengths, including the demonstration of the potential therapeutic benefit of ISR modulation. New chemical entities with which to further interrogate this stress response pathway are also reported. In addition, the authors used an elegant screen to isolate compounds that selectively activate the ISR and identify which of the four kinases was responsible for activation. Special attention was also paid to a thorough evaluation of the effect of their compounds on other stress response pathways (i.e. the UPR, and heat and oxidative stress responses), thereby minimizing the potential for off-target effects. The implementation of automated image analysis rather than manual scoring to quantify mitochondrial elongation is not only practical but also adds to the scientific rigor, as does the complementary use of both the calcium ionophore and MFN2 models to enhance confidence and the broad therapeutic potential for pharmacology ISR manipulation.
We thank the reviewer for their positive response to our manuscript. We address the reviewer’s remaining concerns as outlined below.
Weaknesses:
The only minor concerns are with regard to effects on cell health and the timing of pharmacological administration.
The two compounds described in this manuscript were found to not induce any overt toxicity over a 24 h period in cell culture models. In the revised manuscript, we show data showing that treatment with increasing doses of either 0357 or 3610 do not significantly reduce cellular viability in HEK293 cells (Fig. S1G).
With regards to treatments, we include all of the relevant information for the timing and dosage of compound treatment in the revised manuscript.
Recommendations for the authors:
Reviewer #1 (Recommendations for Authors)
(1) Figure S1 "B. ATF4-Gluc activity" -> Fluc, The number of replicates is not consistently stated for each experiment. p-values are not given for D and F.
We have changed the legend for Fig. S1B to ATF4-FLuc. We show individual replicates for all experiments for all panels described in this figure, except panels C and G, in the revised Figure S1. We explicitly state the number of replicates in panel C and G in the accompanying figure legend. We have repeated the qPCR described in panels C,F and statistics are included in the revised manuscript.
(2) Figure 2 - no p-values for BtdCPU.
Yes. We found that BtdCPU-dependent increases in mitochondrial fragmentation (described in Fig. 2A-D) were not significant when analyzing all the data included in these figures by Brown-Forsythe and Welch ANOVA test. However, the DMSO and BtdCPU conditions were significantly different when directly compared using a Welch’s t-test (p<0.005). Since the statistics in this manuscript are being analyzed by ANOVA, we decided not to include a significance marker for BtdCPU, as it was not observed in this more stringent test and is not the main focus of this manuscript.
(3) Figure S4 (Supplement to Figure 5) -> Supplement to Figure 4.
We have corrected this error in the revised manuscript.
(4) Error in references - duplicated 24 and 46, duplicated 10 and 11.
This is now corrected in the revised submission.
Reviewer #2 (Recommendations for the authors):
I would love to see an assessment of mitochondrial function and mtDNA in the D414 cells following treatment.
As indicated above, we are continuing to probe the impact of more potent HRI activating compounds in patientderived cell models expressing disease-relevant MFN2 mutants. Initial experiments suggest that this approach can mitigate additional pathologies beyond deficient elongation in these cells, although we are continuing to pursue these results with our improved HRI activating compounds. We are excited by these results, but feel that they are best suited for a follow-up manuscript describing these new HRI activators.
Reviewer #3 (Recommendations for the authors):
The only suggestion to broaden the manuscript's impact might be to perform a basic assessment of the impact of pharmaceutical ISR activation on cell viability. Though mitochondrial elongation is often considered a surrogate for mitochondrial health, whether mitochondrial elongation improves cell viability (or not) would be informative. Similarly, the authors did not address the time-dependent effects of the ISR modulators, choosing to focus on the acute rather more chronic outcomes. Finally, does simultaneous (rather than pre-) treatment with an activator and the ionomycin produce similar effects on mitochondrial morphology, especially since therapeutics are typically administered post-injury?
We now include cell viability experiments showing that the two HRI activators discussed in this manuscript, 0357 and 3610, do not significantly reduce viability in HEK293 cells. This work is included in the revised manuscript (see Fig. S1G).
With respect to acute vs chronic outcomes of ISR activation. As highlighted by the reviewer, we primarily focus this work on defining the impact of acute ISR treatment on mitochondrial morphology. As discussed above, we now show that our prioritized ISR activating compounds 0357 and 3610 do not significantly impact cellular viability over a 24 h timecourse. However, as suggested by the reviewer, additional studies on the potential implications of chronic pharmacologic ISR activation on mitochondrial biology remains to be further explored.
We are continuing to address this in subsequent studies using more potent ISR kinase activating compounds established in our lab. However, we would like to highlight that detrimental phenotypes linked to chronic ISR kinase activation in cell culture does not preclude the translational potential for this approach, as in vivo PK/PD of these compounds can be controlled to prevent complications arising from chronic pathway activity. We previously demonstrated the potential for controlling compound activity through its PK/PD in our establishment of highly selective activators of other stress-responsive signaling pathways such as the IRE1/XBP1s arm of the UPR (e.g., Madhavan et al (2022) Nat Comm).
We appreciate the reviewer’s comments regarding the timing of compound treatment in them ionomycin experiment. Ionomycin works extremely quick to induce fragmentation (minutes), which would be prior to activation of the ISR induced by these compounds (hours). Thus, co-treatment would lead to fragmentation. It is an interesting question to ask if co-treatment with ISR activators could rescue this fragmentation as the pathway is activated, but we did not explicitly address this question in this manuscript. However, we do show that pharmacologic GCN2 or HRI activators can rescue mitochondrial morphology in patient fibroblasts expressing a MFN2 mutant, where mitochondria are fragmented, indicating that our approach can restore mitochondrial morphology in this context. We feel that these results, in combination with others described in our manuscript, demonstrate the potential for this approach to mitigate pathologic mitochondrial fragmentation associated with different conditions.
-
-
www.biorxiv.org www.biorxiv.org
-
eLife Assessment
This fundamental work describes for the first time the combined gene expression and chromatin structure at the genome level in isolated chondrocytes and classical (cranial) and non-classical (notochordal) osteoblasts. In a compelling analysis of RNA-Seq and ATAC data, the authors characterize the two osteoblast populations relative to their associated chondrocyte cells and further proceed with a convincing analysis of the crucial entpd5a gene regulatory elements by investigating their respective transcriptional activity and specificity in developing zebrafish.
-
Reviewer #1 (Public review):
Summary:
This work uses transgenic reporter lines to isolate entpd5a+ cells representing classical osteoblasts in the head and non-classical (osterix-) notochordal sheath cells. The authors also include entpd5a- cells, col2a1a+ cells to represent the closely associated cartilage cells. In a combination of ATAC and RNA-Seq analysis, the genome-wide transcriptomic and chromatin status of each cell population is characterized, validating their methodology and providing fundamental insights into the nature of each cell type, especially the less well-studied notochordal sheath cells. Using these data, the authors then turn to a thorough, and convincing analysis of the regulatory regions that control the expression of the entpd5a gene in each cell population. Determination of transcriptional activities in developing zebrafish, again combined with ATAC data and expression data of putative regulators results in a compelling, and detailed picture of the regulatory mechanisms governing expression of this crucial gene.
Strengths:
The major strength of this paper is the clever combination of RNA-Seq and ATAC analysis, further combined with functional transcriptional analysis of the regulatory elements of one crucial gene. This results in a very compelling story.
Weaknesses:
No major weakness, except for all the follow-up experiments that one can think of, but that would be outside of the scope of this paper.
Comments on revisions:
The description of Supplementary Figure 1 is still confusing: in the results section, it says "We photo converted and directly imaged entpd5a:Kaede positive embryos starting from the 15 somite- stage (s), when we could first detect the fluorophore along the newly-formed notochord progenitor cells (Suppl. Fig. 1E). We repeated photoconversion and imaging at 18, 21 and 24s (Suppl. Fig. 1F-H). ...(Suppl. Fig 1E)"<br /> In the response, the authors say "we could see new Kaede expression under the control of the entpd5a promoter region within 1.5 hours of photoconversion, as shown in Suppl. Figure 1E-H."<br /> In the legend to Suppl. Fig. 1, it says "Using the entpd5a:Kaede photoconversion line we first detect entpd5a expression at the 15 somite-stage (E). Following the same embryo, active expression of the gene continues until prior to 24 hpf (F-H)."<br /> So my questions are: -was there a delay between photoconversion and imaging - was the same delay used for all pictures - was there indeed additional photoconversion for Fig.1 F-H before imaging?<br /> This could be stated in Materials and Methods, and maybe in the legend to Suppl. Fig. 1
All other issues have been addressed.
-
Reviewer #2 (Public review):
Summary:
Complementary to mammalian models, zebrafish has emerged as a powerful system to study vertebrate development and serve as a go-to model for many human disorders. All vertebrates share the ancestral capacity to form a skeleton. Teleost fish models have been a key model to understand the foundations of skeletal development and plasticity, pairing with more classical work in amniotes such as the chicken and mouse. However, the genetic foundation of the diversity of skeletal programs in teleosts have been hampered by mapping similarities from amniotes back and not objectively establishing more ancestral states. This is most obvious in systematic, objective analysis of transcriptional regulation and tissue specification in differentiated skeletal tissues. Thus, the molecular events regulating bone-producing cells in teleosts have remained largely elusive. In this study, Petratou et al. leverage spatial experimental delineation of specific skeletal tissues -- that they term 'classical' vs 'non-classical' osteoblasts -- with associated cartilage of the endo/peri-chondrial skeleton and inter-segmental regions of the forming spine during development of the zebrafish, to delineate molecular specification of these cells by current chromatin and transcriptome analysis. The authors further show functional evidence of the utility of these datasets to identify functional enhancer regions delineating entp5 expression delineated in 'classical' or 'non-classical' osteoblast populations. By integration with paired RNA-seq, they delineate broad patterns of transcriptional regulation of these populations as well as specific detail of regional regulation via predictive binding sites within ATACseq profiles. Overall the paper was very well written and provides an essential contribution to the field that will provide a foundation to promote modeling of skeletal development and disease in an evolutionary and developmentally informed manner.
Strengths:
Taken together, this study provides a comprehensive resource of ATAC-seq and RNA-seq data that will be very useful for a wide variety of researchers studying skeletal development and bone pathologies. The authors show specificity in the different skeletal lineages and show utility of the broad datasets for defining regulatory control of gene regulation in these different lineages, providing the foundation for hypothesis testing of not only agents of skeletal change in evolution but also function of genes and variations of unknown significance as it pertains to disease modeling in zebrafish. The paper is excellently written, integrating a complex history and experimental analysis into a useful and coherent whole. The terminology of 'classical' and 'non-classical' will be useful for the community in discussing biology of skeletal lineages and their regulation.
Weaknesses:
Two items arose that proposed areas for extending the description to integrate the data into the existing data on role of non-classical osteobasts and establishment/canalization of this lineage of skeletal cells.
(1) It was unclear how specific the authors' experimental dissection of head/trunk was in isolating different entp5a osteoblast populations. Obviously, this was successful given the specificity in DEG of results, however an analysis of contaminating cells/lineages in each population would be useful - e.g. maybe use specific marker genes to assess. The text uses terms such as 'specific to' and 'enriched in' without seemingly grounded meaning of the accuracy of these comments. Is it really specific e.g. not seen in one or other dataset, or is there some experimental variation in this?
(2) Further, it would be valuable to discuss NSC-specific genes such as calymmin (Peskin 2020) which has species and lineage specific regulation of non-classical osteoblasts likely being a key mechanistic node for ratcheting centra-specific patterning of the spine in teleost fishes. What are dynamics observed in this gene in datasets between the different populations, especially when compared with paralogues - is there obvious cis-regulatory changes that correlate with the co-option of this gene in early regulation of non-classical osteoblasts? The addition of this analysis/discussion would anchor discussions of a differential between different osteoblasts lineages in the paper.
Comments on revisions: All issues have been addressed.
-
Reviewer #3 (Public review):
Summary:
This study characterizes classical and nonclassical osteoblasts as both types were analyzed independently (integrated ATAC-seq and RNAseq). It was found that gene expression in classical and nonclassical osteoblasts is not regulated in the same way. In classical osteoblasts Dlx family factors seem to play an important role, while Hox family factors are involved in the regulation of spinal ossification by nonclassical osteoblasts. In the second part of the study, the authors focus on the promoter structure of entpd5a. Through the identification of enhancers they reveal complex modes of regulation of the gene. The authors suggest candidate transcription factors that likely act on the identified enhancer elements. All the results taken together provide comprehensive new insights into the process of bone development, and point to spatio-temporally regulated promoter/enhancer interactions taking place at the entpd5a locus.
Strengths:
The authors have succeeded in justifying a sound and consistent buildup of their experiments, and meaningfully integrate the results into the design of each of their follow-up experiments. The data are solid, insightfully presented, and the conclusion valid. This makes this manuscript of great value and interest to those studying (fundamental) skeletal biology.
Weaknesses:
The study is solidly constructed, the manuscript is clearly written and the discussion is meaningful - I see no real weaknesses.
-
Author response:
The following is the authors’ response to the original reviews.
Public Reviews:
Reviewer #1 (Public Review):
Summary:
This work uses transgenic reporter lines to isolate entpd5a+ cells representing classical osteoblasts in the head and non-classical (osterix-) notochordal sheath cells. The authors also include entpd5a- cells, col2a1a+ cells to represent the closely associated cartilage cells. In a combination of ATAC and RNA-Seq analysis, the genome-wide transcriptomic and chromatin status of each cell population is characterized, validating their methodology and providing fundamental insights into the nature of each cell type, especially the less well-studied notochordal sheath cells. Using these data, the authors then turn to a thorough and convincing analysis of the regulatory regions that control the expression of the entpd5a gene in each cell population. Determination of transcriptional activities in developing zebrafish, again combined with ATAC data and expression data of putative regulators, results in a compelling and detailed picture of the regulatory mechanisms governing the expression of this crucial gene.
Strengths:
The major strength of this paper is the clever combination of RNA-Seq and ATAC analysis, further combined with functional transcriptional analysis of the regulatory elements of one crucial gene. This results in a very compelling story.
Weaknesses:
No major weaknesses were identified, except for all the follow-up experiments that one can think of, but that would be outside of the scope of this paper.
Reviewer #2 (Public Review):
Summary:
Complementary to mammalian models, zebrafish has emerged as a powerful system to study vertebrate development and to serve as a go-to model for many human disorders. All vertebrates share the ancestral capacity to form a skeleton. Teleost fish models have been a key model to understand the foundations of skeletal development and plasticity, pairing with more classical work in amniotes such as the chicken and mouse. However, the genetic foundation of the diversity of skeletal programs in teleosts has been hampered by mapping similarities from amniotes back and not objectively establishing more ancestral states. This is most obvious in systematic, objective analysis of transcriptional regulation and tissue specification in differentiated skeletal tissues. Thus, the molecular events regulating bone-producing cells in teleosts have remained largely elusive. In this study, Petratou et al. leverage spatial experimental delineation of specific skeletal tissues -- that they term 'classical' vs 'non-classical' osteoblasts -- with associated cartilage of the endo/peri-chondrial skeleton and inter-segmental regions of the forming spine during development of the zebrafish, to delineate molecular specification of these cells by current chromatin and transcriptome analysis. The authors further show functional evidence of the utility of these datasets to identify functional enhancer regions delineating entp5 expression in 'classical' or 'non-classical' osteoblast populations. By integration with paired RNA-seq, they delineate broad patterns of transcriptional regulation of these populations as well as specific details of regional regulation via predictive binding sites within ATACseq profiles. Overall the paper was very well written and provides an essential contribution to the field that will provide a foundation to promote modeling of skeletal development and disease in an evolutionary and developmentally informed manner.
Strengths:
Taken together, this study provides a comprehensive resource of ATAC-seq and RNA-seq data that will be very useful for a wide variety of researchers studying skeletal development and bone pathologies. The authors show specificity in the different skeletal lineages and show the utility of the broad datasets for defining regulatory control of gene regulation in these different lineages, providing a foundation for hypothesis testing of not only agents of skeletal change in evolution but also function of genes and variations of unknown significance as it pertains to disease modeling in zebrafish. The paper is excellently written, integrating a complex history and experimental analysis into a useful and coherent whole. The terminology of 'classical' and 'non-classical' will be useful for the community in discussing the biology of skeletal lineages and their regulation.
Weaknesses:
Two items arose that were not critical weaknesses but areas for extending the description of methods and integration into the existing data on the role of non-classical osteoblasts and establishment/canalization of this lineage of skeletal cells.
(1) In reading the text it was unclear how specific the authors' experimental dissection of the head/trunk was in isolating different entp5a osteoblast populations. Obviously, this was successful given the specificity in DEG of results, however, analysis of contaminating cells/lineages in each population would be useful - e.g. using specific marker genes to assess. The text uses terms such as 'specific to' and 'enriched in' without seemingly grounded meaning of the accuracy of these comments. Is it really specific - e.g. not seen in one or other dataset - or is there some experimental variation in this?
We thank the reviewer for pointing this out. Given that the separation from head and trunk is done manually, there will be some experimental variability. We have used anatomical hallmarks (cleithrum and swim bladder), and therefore would expect the variability to be small. Regarding classical osteoblasts contaminating trunk tissue, head removal was consistently performed using the aforementioned anatomical hallmarks in a manner that ensures that the cleithrum does not remain in the trunk tissue. In order to alleviate concerns regarding trunk cell populations contaminating cranial populations, and to further clarify our strategy, we add the following statement to the Materials and Methods section: “The procedure does not allow for a complete separation of notochordal non-classical osteoblasts from cranial classical osteoblasts, as the notochord extends into the cranium. However, the amount of sheath cells in that portion of the notochord is negligible, compared both to the number of classical (cranial) osteoblasts in head samples, and to notochord cells isolated in trunk samples.”
(2) Further, it would be valuable to discuss NSC-specific genes such as calymmin (Peskin 2020) which has species and lineage-specific regulation of non-classical osteoblasts likely being a key mechanistic node for ratcheting centra-specific patterning of the spine in teleost fishes. What are dynamics observed in this gene in datasets between the different populations, especially when compared with paralogues - are there obvious cis-regulatory changes that correlate with the co-option of this gene in the early regulation of non-classical osteoblasts? The addition of this analysis/discussion would anchor discussions of the differential between different osteoblasts lineages in the paper.
This is an interesting concept and idea, that we will consider in a possible revision or, if requiring substantial additional efforts, in a possible new research line. An excellent starting point for further studies using our datasets.
Reviewer #3 (Public Review):
Summary:
This study characterizes classical and nonclassical osteoblasts as both types were analyzed independently (integrated ATAC-seq and RNAseq). It was found that gene expression in classical and nonclassical osteoblasts is not regulated in the same way. In classical osteoblasts, Dlx family factors seem to play an important role, while Hox family factors are involved in the regulation of spinal ossification by nonclassical osteoblasts. In the second part of the study, the authors focus on the promoter structure of entpd5a. Through the identification of enhancers, they reveal complex modes of regulation of the gene. The authors suggest candidate transcription factors that likely act on the identified enhancer elements. All the results taken together provide comprehensive new insights into the process of bone development, and point to spatio-temporally regulated promoter/enhancer interactions taking place at the entpd5a locus.
Strengths:
The authors have succeeded in justifying a sound and consistent buildup of their experiments, and meaningfully integrating the results into the design of each of their follow-up experiments. The data are solid, insightfully presented, and the conclusion valid. This makes this manuscript of great value and interest to those studying (fundamental) skeletal biology.
Weaknesses:
The study is solidly constructed, the manuscript is clearly written and the discussion is meaningful - I see no real weaknesses.
Recommendations for the authors:
Reviewer #1 (Recommendations For The Authors):
Minor issues that may need to be addressed or detailed:
Supplementary Figures 1I-J, text page 4, line 24: "photoconversion and imaging": this needs some more detailed description: green fluorescent cells should be actively expressing Kaede, but only if there is a delay between photoconversion and imaging. What is the reason that Supplementary Figure 1F shows mainly green fluorescent cells, contrary to 1G-J?
In our experiments, we could see new Kaede expression under the control of the entpd5a promoter region within 1.5 hours of photoconversion, as shown in Suppl. Figure 1E-H, suggesting that this time window was sufficient for protein generation. The reason for Suppl. Fig 1F showing more green fluorescence we believe relates to the high rate of transcriptional activity at that stage, in the entirety of the notochord progenitor cells. In addition, this is an effect which we attribute to the relatively small number of cells producing red fluorescence at that stage, due to photoconversion of only a few Kaede+ cells at the 15 somites stage (Suppl. Fig. 1E). Therefore, the masking effect of the green fluorescence by the red is not as significant as in G and H, where the red fluorescence resulting from photoconversion right after imaging at 18s and 21s, respectively, significantly overlaps with new green fluorescence. This can be seen in the image as the presence of orange fluorescence in G and H, instead of the clear red shown in E, I and J.
In addition to this, we would like to point out that in Suppl. Fig. 1I, J the reason that green fluorescence is only detected in the ventral region of the notochord, is because the promoter of entpd5a only remains active in the ventral-most sheath cells at that stage. This is stated in the results section of the main text, first subsection, paragraph 3. The reason for this very interesting, strictly localised expression pattern remains unclear.
Somewhat intriguing: green fluorescence in Figure 1B, C (osx:GAL4FF) and Supplementary Figure 1C (entpd5a:GAL4FF) in the CNS? Would that be an artefact of the GAL4FF/UAS:GFP system?
We are confident that the fluorescence pointed out by the reviewer is not an artefact of the GAL4FF/UAS system, for a few reasons. Firstly, osx (Sp7) has been shown to be expressed and to function in the nervous system in mice (Park et al, BBRC, 2011; Elbaz et al, Neuron, 2023). Secondly, not only osx, but also entpd5a can be readily detected in a subset of cranial and spinal neurons in early development using the entpd5a:GAL4FF; UAS:GFP transgenic line (Suppl. Fig 1C). Finally, when establishing transgenic lines with the entpd5a(1.1):GFP construct, expression was almost invariably present in diverse elements of the nervous system, but not in bone (data not shown). This led us to hypothesise that the minimal promoter of entpd5a (and possibly also that of osx) is activated by transcription factors active in the nervous system, and this effect is likely controlled by the surrounding enhancers, but also the genome location. It is unclear at present what the endogenous neural expression of the two genes is like, and we did not further investigate this in this study, as the focus was on the skeleton.
Figure 2: What exactly is "Corrected Total Cell Fluorescence"? Is it green + red fluorescence?
We thank the reviewer for pointing out the absence of more information on this. Corrected total cell fluorescence does not correspond to green+ red fluorescence, rather it is calculated as follows for a single channel:
CTCF = Integrated Density – (Area of selected cell X Mean fluorescence of background readings)
More details can be found in the following website: https://theolb.readthedocs.io/en/latest/imaging/measuring-cell-fluorescence-using-imagej.html
We have edited the Materials and Methods section under “Imaging and image analysis” to include the aforementioned information.
Page 11, line 34: The authors may have missed the recently published "Raman et al., Biomolecules 2024 Vol. 14; doi:10.3390/biom14020139" describing RNA-Seq in 4 dpf osterix+ osteoblasts.
We thank the reviewer for drawing our attention to the Raman et al publication. The reference has now been added in the manuscript.
Figure 5A and B: use a higher resolution version to make the numbers and gene names more readable. Figures 5C and 6A could also use a larger font for the text and numbers.
High resolution files are now included with the revised manuscript, which should significantly help in making figures more easily readable. Although we agree with the reviewer that larger fonts would improve readability, due to the nature of the graphs (very small spaces in some cases, where the numbers would have to fit) this would not be easy to achieve. However, we believe that this issue will be resolved with the availability of higher resolution files. If readability remains a concern, we would be happy to attempt re-organising the graphs to allow for larger fonts.
Reviewer #2 (Recommendations For The Authors):
I suggest no further experiments, but do suggest that a few points be clarified.
In the Discussion, the text "the less evolved osteoblasts of fish and amphibians..." is not accurate. These cells are not less evolved as they represent an independent lineage to tetrapods that have evolved with different stresses for a similar time. However, as teleost fishes and amphibians share characteristics and all share a common ancestor, these signatures represent a putative ancestral state of skeletal differentiation not seen in amniotes, including humans.
We thank the reviewer for pointing out the unfortunate phrasing. The text has now been modified as follows: “Specifically, the osteoblasts of teleost fish and amphibians, whose characteristics are putatively closer to a more ancestral state of skeletal differentiation compared to amniotes, appear to share gene expression with chondrocytes”.
The title could potentially be shortened to reach a broader audience by removing the initial clause of 'integration of ATAC and RNA seq' as this is a commonly performed analysis - "Chromatin and transcriptomic signature in classical and non-classical zebrafish osteoblasts indicate mechanisms of ancestral skeletal differentiation" is more descriptive of the findings and not focused on the method.
We have discussed this internally, but would prefer to retain the current title. The reason is (1) because we would like to see our methodology and datasets be used as platform for further studies, and the current title, in our opinion, facilitates this. In regards to replacing “mechanisms of entpd5a regulation” with “mechanisms of ancestral skeletal differentiation”, we think this does not give an accurate description of our work, which is primarily focused on elucidating entpd5a promoter dynamics.
All datasets should be made available as soon as possible for use in the field.
The datasets (raw and processed) are available on the GEO database. The corresponding accession numbers can be found in our data availability statement.
Minor comments:
(1) Figure 1A. The labels are missing for grey and light blue structures.
These structures are together making up the “notochord sheath”, which is comprised of the basal lamina (grey), the medial layer of fibrillar collagen (light blue) and the outer layer of loosely arranged matrix (lighter blue). We modified the figure legend to indicate that the three layers all correspond to the notochord sheath.
(2) Figure 2A. The constructs in the lower part of the panel are not discussed in the legend and seem out of place in terms of data type and analysis.
We would argue that indicating which non-coding regions and which ATAC peaks were responsible for driving GFP expression in each construct aids in a better understanding of our results. We thank the reviewer for pointing out the lack of mention of these constructs in the figure legend. This issue has now been resolved.
(3) Be wary of red/green color combinations, especially in the figures where these are juxtaposed with each other.
We apologise for the use of red/green colour. Although it is not possible for this manuscript to change the colour patterns, we will make sure to avoid the use of these colours in conjunction in the future.
(4) The use of fish as a term should be classified as teleost fish, as authors are not addressing non-teleost basal ray-finned fishes or the fact that tetrapods are within bony fishes overall.
This is well spotted, we have now remedied this by editing the manuscript. Where the term “fish” was used, we now state “teleost fish”.
(5) Age information is missing in several Figures (e.g. 1D and 2C).
In some of the figures space constrains did not allow for including the stage on the figure itself. However, we have made sure that in those cases the stage is incorporated in the figure legend.
(6) The resolution of several Figures (e.g. Figure 5 and Supplementary Figure 3) is low.
We address this issue by providing high resolution figures with the revised manuscript.
(7) In the sentence (top page before Discussion) "The same conclusion was reached upon isolation from these three..", it was unclear what 'upon isolation' referred to.
We agree with the reviewer that this phrasing is unclear. To enhance clarity, the manuscript now reads as follows: “The same conclusion was reached upon isolation of the DEGs highlighted by our RNA-seq results, from the three aforementioned groups of genes associated with ATAC peaks for each cell population.”
-
-
www.biorxiv.org www.biorxiv.org
-
eLife Assessment
In this potentially important study, the authors report results of QM/MM simulations and kinetic measurements for the phosphoryl-transfer step in adenylate kinase. The results point to the mechanistic proposal that the transition state ensemble is broader in the most efficient form of the enzyme (i.e., in the presence of Mg2+ in the active site) and thus a different activation entropy. With a broad set of computations and experimental analyses, the level of evidence is considered solid by some reviewers. On the other hand, there remain limitations in the computational analyses, especially regarding free energy profiles using different methodologies (shape of free energy profiles with DFTB vs. PBE QM/MM, and barriers with steered MD and umbrella sampling) and the activation entropy, leading some reviewers to the evaluation that the level of evidence is incomplete.
-
Reviewer #1 (Public Review):
Summary:
This study investigated the phosphoryl transfer mechanism of the enzyme adenylate kinase, using SCC-DFTB quantum mechanical/molecular mechanical (QM/MM) simulations, along with kinetic studies exploring the temperature and pH dependence of the enzyme's activity, as well as the effects of various active site mutants. Based on a broad free energy landscape near the transition state, the authors proposed the existence of wide transition states (TS), characterized by the transferring phosphoryl group adopting a meta-phosphate-like geometry with asymmetric bond distances to the nucleophilic and leaving oxygens. In support of this finding, kinetic experiments were conducted with Ca2+ ions at different temperatures and pH, which revealed a reduced entropy of activation and unique pH-dependence of the catalyzed reaction.
Strengths:
A combined application of simulation and experiments is a strength.
Weaknesses:
The conclusion that the enzyme-catalyzed reaction involves a wide transition state is not sufficiently clarified with some concerns about the determined free energy profiles compared to the experimental estimate. (See Recommendations for the authors.)
Comments on revisions:
While the authors have made some improvements in clarifying the manuscript, questions still remain about their conclusion regarding the wide-TS, which appears this may be a misinterpretation of the simulation results. Also, they should clearly point out the large discrepancies between DFTB QM/MM and PBE QM/MM results (shape of free energy files) and also between steered MD and umbrella sampling results (barriers). Another question is the large change in activation entropy (between the reaction with and without divalent cations). This difference may be difficult to attribute sorely to the difference in the reaction geometries near TS.
-
Reviewer #2 (Public Review):
Summary:
The authors report results of QM/MM simulations and kinetic measurements for the phosphoryl-transfer step in adenylate kinase. The main assertion of the paper is that a wide transition state ensemble is a key concept in enzyme catalysis as a strategy to circumvent entropic barriers. This assertion is based on observation of a "structurally wide" set of energetically equivalent configurations that lie along the reaction coordinate in QM/MM simulations, together with kinetic measurements that suggest a decrease of the entropy of activation.
Strengths:
The study combines theoretical calculations and supporting experiments.
Weaknesses:
The current paper hypothesizes a "wide" transition state ensemble as a catalytic strategy and key concept in enzyme catalysis. Overall, it is not clear the degree to which this hypothesis is fully supported by the data. The reasons are as follows:
(1) Enzyme catalysis reflects a rate enhancement with respect to a baseline reaction in solution. In order to assert that something is part of a catalytic strategy of an enzyme, it would be necessary to demonstrate from simulations that the activation entropy for the baseline reaction is indeed greater and the transition state ensemble less "wide". Alternatively stated, when indicating there is a "wide transition state ensemble" for the enzyme system - one needs to indicate that is with respect to the non-enzymatic reaction. However, these simulations were not performed and the comparisons not demonstrated. The authors state "This chemical step would take about 7000 years without the enzyme" making it impossible to measure; nonetheless, the simulations of the nonenzymatic reaction would be fairly straightforward to perform in order to demonstrate this key concept that is central to the paper. Rather, the authors examine the reaction in the absence of a catalytically important Mg ion.
(2) The observation of a "wide conformational ensemble" is not a quantitative measure of entropy. In order to make a meaningful computational prediction of the entropic contribution to the activation free energy, one would need to perform free energy simulations over a range of temperatures (for the enzymatic and non-enzymatic systems). Such simulations were not performed, and the entropy of activation was thus not quantified by the computational predictions. The authors instead use a wider TS ensemble as a proxy for larger entropy, and miss an opportunity to compare directly to the experimental measurements.
Comments on revisions:
Overall, I do not think the authors have been able to quantitatively support their conclusion, and the qualitative support is somewhat weak. This makes the interpretation of the computational results somewhat speculative. Nonetheless, comparison was made for models with and without divalent ions, and the experimental data is valuable.
-
Author response:
The following is the authors’ response to the previous reviews.
Public Reviews:
Reviewer #1 (Public Review):
Summary:
This study investigated the phosphoryl transfer mechanism of the enzyme adenylate kinase, using SCC-DFTB quantum mechanical/molecular mechanical (QM/MM) simulations, along with kinetic studies exploring the temperature and pH dependence of the enzyme's activity, as well as the effects of various active site mutants. Based on a broad free energy landscape near the transition state, the authors proposed the existence of wide transition states (TS), characterized by the transferring phosphoryl group adopting a meta-phosphate-like geometry with asymmetric bond distances to the nucleophilic and leaving oxygens. In support of this finding, kinetic experiments were conducted with Ca2+ ions at different temperatures and pH, which revealed a reduced entropy of activation and unique pH-dependence of the catalyzed reaction.
Strengths:
A combined application of simulation and experiments is a strength.
Weaknesses:
The conclusion that the enzyme-catalyzed reaction involves a wide transition state is not sufficiently clarified with some concerns about the determined free energy profiles compared to the experimental estimate. (See Recommendations for the authors.)
Reviewer #2 (Public Review):
Summary:
The authors report results of QM/MM simulations and kinetic measurements for the phosphoryl-transfer step in adenylate kinase. The main assertion of the paper is that a wide transition state ensemble is a key concept in enzyme catalysis as a strategy to circumvent entropic barriers. This assertion is based on observation of a "structurally wide" set of energetically equivalent configurations that lie along the reaction coordinate in QM/MM simulations, together with kinetic measurements that suggest a decrease of the entropy of activation.
Thank you for your feedback. The reviewer’s questions are answered below, hoping to clarify them.
Strengths:
The study combines theoretical calculations and supporting experiments.
Weaknesses:
The current paper hypothesizes a "wide" transition state ensemble as a catalytic strategy and key concept in enzyme catalysis. Overall, it is not clear the degree to which this hypothesis is fully supported by the data. The reasons are as follows:
(1) Enzyme catalysis reflects a rate enhancement with respect to a baseline reaction in solution. In order to assert that something is part of a catalytic strategy of an enzyme, it would be necessary to demonstrate from simulations that the activation entropy for the baseline reaction is indeed greater and the transition state ensemble less "wide". Alternatively stated, when indicating there is a "wide transition state ensemble" for the enzyme system - one needs to indicate that is with respect to the non-enzymatic reaction. However, these simulations were not performed and the comparisons not demonstrated. The authors state "This chemical step would take about 7000 years without the enzyme" making it impossible to measure; nonetheless, the simulations of the nonenzymatic reaction would be fairly straight forward to perform in order to demonstrate this key concept that is central to the paper. Rather, the authors examine the reaction in the absence of a catalytically important Mg ion.
Thank you for your thoughtful feedback. QM/MM calculations for uncatalysed phosphoryl-transfer reactions involving either diphosphates or triphosphates have been well documented in the literature showing narrow and symmetric TSE (Klan et al., JACS 2006, 128 (47) 15310-15323; Cui Wang et al., JPCB 2015, 119(9), 3720-3726). We added these references to the revised manuscript.
(2) The observation of a "wide conformational ensemble" is not a quantitative measure of entropy. In order to make a meaningful computational prediction of the entropic contribution to the activation free energy, one would need to perform free energy simulations over a range of temperatures (for the enzymatic and non-enzymatic systems). Such simulations were not performed, and the entropy of activation was thus not quantified by the computational predictions. The authors instead use a wider TS ensemble as a proxy for larger entropy, and miss an opportunity to compare directly to the experimental measurements.
Although we share the reviewers desire to quantify entropies from QM/MM simulations, we agree with discussions in the literature that calculating quantitative entropies from performing QM/MM simulations at different temperatures is not reliable. We therefore felt strongly to stay with a qualitative assessment of entropy differences from our simulations. As the reviewer highlighted, our study combines theoretical calculations and experiments. The entropy of activation is well estimated by the experiments from the experimental accuracy of these temperature-dependent changes in rate constants for the chemical step. Our computational results agree well with the experimental results and were further validated in 2 rounds of reviews/revisions by additional different free energy calculation methods (MSMD and US), plus committor analysis.
Reviewer #3 (Public Review):
Summary:
By conducting QM/MM free energy simulations, the authors aimed to characterize the mechanism and transition state for the phosphoryl transfer in adenylate kinase. The qualitative reliability of the QM/MM results has been supported by several interesting experimental kinetic studies. However, the interpretation of the QM/MM results is not well supported by the current calculations.
Thank you for your feedback. We appreciate the recognition of our experimental validation but understand your concern about the interpretation of our QM/MM results. To address this, we answer the specific questions below and added clearer explanations of the computational approach, including its limitations. We also better aligned the QM/MM results with both experimental data and theoretical expectations to strengthen the overall interpretation.
Strengths:
The QM/MM free energy simulations have been carefully conducted. The accuracy of the semi-empirical QM/MM results was further supported by DFT/MM calculations, as well as qualitatively by several experimental studies.
Weaknesses:
(1) One key issue is the definition of the transition state ensemble. The authors appear to define this by simply considering structures that lie within a given free energy range from the barrier. However, this is not the rigorous definition of transition state ensemble, which should be defined in terms of committor distribution. This is not simply an issue of semantics, since only a rigorous definition allows a fair comparison between different cases - such as the transition state in an enzyme vs in solution, or with and without the metal ion. For a chemical reaction in a complex environment, it is also possible that many other variables (in addition to the breaking and forming P-O bonds) should be considered when one measures the diversity in the conformational ensemble.
In the revised manuscript, the authors included committor analysis. However, the discussion of the result is very brief. In particular, if we use the common definition of the transition state ensemble (TSE) as those featuring the committor around 0.5, the reaction coordinate of the TSE would span a much narrower range than those listed in Table 1. This point should be carefully addressed.
The reviewer is right, the TSE is rigorously defined in terms of the committor distribution. We actually calculated the committor distribution for the reaction with and without Mg. We now added the figure showing the committor distribution for both reactions (Figure 3 – supplement 9). We did not include these results before because the committor distribution histogram would need more points to have a more accurate shape, requiring a high computational cost. We followed the reviewer’s suggestion and updated table 1 with the values from the committor distribution analysis.
(2) While the experimental observation that the activation entropy differs significantly with and without the Ca2+ ion is interesting, it is difficult to connect this result with the "wide" transition state ensemble observed in the QM/MM simulations so far. Even without considering the definition of the transition state ensemble mentioned above, it is unlikely that a broader range of P-O distances would explain the substantial difference in the activation entropy measured in the experiment. Since the difference is sufficiently large, it should be possible to compute the value by repeating the free energy simulations at different temperatures, which would lead to a much more direct evaluation of the QM/MM model/result and the interpretation.
See our answer above about this point.
Recommendations for the authors:
Reviewer #1 (Recommendations For The Authors):
Major comments:
One of the remaining issues with this revision is the assertion of the wide transition states in the presence of Mg2+ ion. When discussing the transition state of phosphoryl transfer reactions, it is important to consider their nature as involving both the cleavage and formation of P-O bonds. While these two events can occur in concert with a single transition state, many studies have shown that one event often precedes the other. Sometimes, there is a slight drop in free energy between the two events, forming a transient intermediate. However, due to its very short lifetime, this intermediate state may not be detectable experimentally. Depending on the sequence of events, the transition state or the transient intermediate may exhibit characteristics of a metaphosphate or phosphorane-like species. Based on the DFTB simulation results presented in the paper, it appears that the reaction forms a metaphosphate-like transition state. In the present reaction, since the two oxygen atoms involved in the reaction are very good leaving groups with similar reactivity, it is not surprising to observe the two events near the TS with very similar relative free energies, and therefore, the free energy profile can be very flat near the TS. This is consistent with the statement that "the transferring phosphate can be much closer to the leaving oxygen than the attacking oxygen and vice versa" on page 9. In my opinion, however, this should not be considered as a wide transition state but rather a consequence of the two events occurring very close to each other along the reaction coordinate. This distinction can be considered a semantic issue, and as long as the authors clearly discuss this issue and clarify the meaning of the TS ensemble, the reviewer is okay with that. In its current form, the statement of the wide TS ensemble may lead to a misleading interpretation of the reaction under study.
An intermediate is clearly defined as a minimum in the free energy landscape. We see no evidence in any of your simulations of a minimum flanked by two transitions states, nor do we see any evidence in our NMR relaxation data or crystal structure ensemble refinement. We report our experimental and computational results, so that the reader can directly interpret the free energy landscapes for this system, avoiding semantics due to language ambiguity.
Second, based on the kinetic study, the free energy of the catalytic reaction is approximately zero. The authors suggest that at pH near 7, the ADP exists as a roughly
50-50 mixture between the singly protonated and fully charged states and consequently, the reaction free energies between the two scenarios cancel each other out. However, this argument is not correct. If [ADP(H)]/[ADP] is close to 1, the two reaction free energies, one with +6 kcal/mol and the other with -6 kcal/mol, imply that the protonation of the products (either ATP or AMP) requires ~12 kcal/mol (i.e., 9 pKa unit shift). Given the symmetric nature of the reaction and the similar pKa values between ATP, ADP versus AMP, such a large shift in the pKa of the product state is not expected, and for the calculated results to be accurate, the pKa shifts in the reactant state versus the product state must be opposite, with a total relative shift of 9 pKa units. This is difficult to understand given the nature of the reaction catalyzed by the adenylate kinase enzyme.
We thank this reviewer for this question, which made us realize that we cannot compare the free energies of our QM/MD simulations with the experimentally determined ADP and ATP/AMP ratios. In the experiment we determine the entire pool of ADP and AMP/ATP bound to the enzyme, but could not distinguish if the protonated and or nonprotonated states are contributing to the measured observed rate constants (Kerns, S. et al.,(2015). In the present study, we now discovered that the nonprotonated forms have a lower activation barrier, but the protonated states also contribute to the overall reaction. Therefore, we removed this paragraph from our discussion.
Minor comments:
The difference in the free energy barrier determined by the MSMD and umbrella sampling is not negligible. Considering that umbrella sampling is commonly used in this type of research, the MSMD method appears to overestimate the barrier by more than 3 kcal/mol. Would the TS geometries obtained by umbrella sampling be comparable to those obtained by MSMD?
This is an excellent suggestion, since the umbrella sampling is the more accurate method. The TSE from both methods are indeed comparable, and we added new figure panels about this results to Fig. 4.
Figure 5 shows that the enthalpy of activation is similar for reactions with and without Ca2+. Do the authors expect the enthalpy of activation to decrease when Ca2+ is replaced by Mg2+ without a significant change in the entropy of activation? Any justification?
In (Kerns, S. et al.,(2015) we had experimentally determined the dependence of the observed rate of the P-transfer on the nature of the divalent metal, with Mg2+ being by far superior to the other divalent metals. We proposed that this majorly is an effect on the enthalpy of activation, that other divalent metals provide poor orbital overlap, in agreement with published work on P-transfer reactions that show selectivity for a specific metal.
Please provide proper citations for SHAKE and WHAM.
The citations were added.
Reviewer #2 (Recommendations For The Authors):
The authors did not really address in the revised manuscript the main points of the previous review, which included examination of non-enzymatic reaction (via simulation, not measurement) and quantification of the connection between the reported wide TS ensemble and the increase in entropy (by additional simulations). The authors should also add reference to the AM1/d-PhoT model of Nam et al. which is now discussed.
QM/MM calculations for uncatazlysed phosphoryl-transfer reactions involving either diphosphates or triphosphates have been well documented in the literature showing narrow and symmetric TSE (Klahn et al., JACS 2006, 128 (47) 15310-15323; Cui Wang et al., JPCB 2015, 119(9), 3720-3726). We added these references to the revised manuscript.
The reference to AM1/d-PhoT model was added.
Reviewer #3 (Recommendations For The Authors):
In the revised ms, the authors indeed addressed many of the points raised in the previous round of review. In addition to the issue of TSE and committor mentioned above, another point that needs to be carefully explained is the very significant difference between umbrella sampling results and those in Fig. 1C - especially for the case without Mg2+ - the difference of more than 20 kcal/mol is not something that can be ignored at a qualitative level.
We thank the reviewer for pointing out that the difference in free energy profiles between umbrella sampling (US) and MSMD, especially in the case without Mg<sup>2</sup>+ needs to be addressed.
We believe that the key reason for this difference lies in the methodological approaches of these techniques.
Umbrella sampling is an equilibrium enhanced sampling method, that allows for a balanced and thorough exploration of the free energy landscape, the MSMD is a non-equilibrium method and estimation depends of the averaging scheme used and the number of trajectories. In the present work, the free energy was estimated using an exponential average. This averaging scheme has a slow convergence, small variance and may overestimate the free energy barrier, specially if the barrier as seen in the absence of Mg is quite high. This factor could explain the significant difference between umbrella sampling and MSMD combined with Jarzynski’s equality.
We have added new panels to Fig. 4 to compare the TSE from the more accurate umbrella sampling to the MSMD simulations, buttressing the validity of our original findings. We revised the manuscript discuss the differences between the MSMD and the umbrella sampling free energy profiles.
-
-
www.biorxiv.org www.biorxiv.org
-
eLife Assessment
This valuable work suggests a new physical model of centrosome maturation: a catalytic growth model with a shared enzyme pool. The authors provide compelling evidence to show that the model is able to reproduce various experimental results such as centrosome size scaling with cell size and centrosome growth curves in C. elegans, and that the final centrosome size is more robust to differences in initial centrosome size. While direct experimental support for this theory is currently lacking, the authors propose concrete experiments that could distinguish their shared-enzyme model from previously proposed alternatives.
-
Reviewer #1 (Public review):
The work analyzes how centrosomes mature before cell division. A critical aspect is the accumulation of pericentriolar material (PCM) around the centrioles to build competent centrosomes that can organize the mitotic spindle. The present work builds on the idea that the accumulation of PCM is catalyzed either by the centrioles themselves (leading to a constant accumulation rate) or by enzymes activated by the PCM itself (leading to autocatalytic accumulation). These ideas are captured by a previous model derived for PCM accumulation in C. elegans (Zwicker et al, PNAS 2014) and are succinctly summarized by Eq. 1. The main addition of the present work is to allow the activated enzymes to diffuse in the cell, so they can also catalyze the accumulation of PCM in other centrosomes (captured by Eqs. 2-4). The authors show that this helps centrosomes to reach the same size, independent of potential initial mismatches.
A strength of the paper is the simplicity of the equations, which are reduced to the bare minimum and thus allow a detailed inspection of the physical mechanism, e.g., using linear stability analysis. The possible shortcoming of this approach, namely that all equations assume that the diffusion of molecules is much faster than any of the reactive time scales, is addressed in Appendix 4. The authors show convincingly that their model compensates for initial size differences in centrosomes and leads to more similar final sizes. They carefully discuss parameter values used in their model, and they propose concrete experiments to test the theory. The model could thus stimulate additional experiments and help us understand how cells tightly control their centrosomes, which is crucial for faithful mitosis.
Comments on revised version:
The authors addressed my comments satisfactorily.
-
Reviewer #2 (Public review):
In this paper, Banerjee & Banerjee argue that a solely autocatalytic assembly model of the centrosome leads to size inequality. The authors instead propose a catalytic growth model with a shared enzyme pool. Using this model, the authors predict that size control is enzyme-mediate and are able to reproduce various experimental results such as centrosome size scaling with cell size and centrosome growth curves in C. elegans.
The paper contains interesting results and is well-written and easy to follow/understand.
Comments on revised version:
The authors made a number of revisions that significantly improved the manuscript, including analyzing the impact of finite diffusion, more thorough stability analysis, and enhanced comparison to experimental results.
-
Author response:
The following is the authors’ response to the original reviews.
Public Reviews:
Reviewer #1 (Public Review):
The work analyzes how centrosomes mature before cell division. A critical aspect is the accumulation of pericentriolar material (PCM) around the centrioles to build competent centrosomes that can organize the mitotic spindle. The present work builds on the idea that the accumulation of PCM is catalyzed either by the centrioles themselves (leading to a constant accumulation rate) or by enzymes activated by the PCM itself (leading to autocatalytic accumulation). These ideas are captured by a previous model derived for PCM accumulation in C. elegans (ref. 8) and are succinctly summarized by Eq. 1. The main addition of the present work is to allow the activated enzymes to diffuse in the cell, so they can also catalyze the accumulation of PCM in other centrosomes (captured by Eqs. 2-4). The authors claim that this helps centrosomes to reach the same size, independent of potential initial mismatches.
A strength of the paper is the simplicity of the equations, which are reduced to the bare minimum and thus allow a detailed inspection of the physical mechanism. One shortcoming of this approach is that all equations assume that the diffusion of molecules is much faster than any of the reactive time scales, although there is no experimental evidence for this.
We appreciate the reviewer’s recognition of the strengths of our work. Indeed, the centrosome growth model incorporates multiple timescales corresponding to various reactions, and existing experimental data do not directly provide diffusion constants for the cytosolic proteins. However, we can estimate these diffusion constants using protein mass, based on the Stokes-Einstein relation, and compare the diffusion timescales with the reaction timescales obtained from FRAP analysis. For example, we estimate that the diffusion timescale for centrosomes separated by 5-10 micrometers is much smaller than the reaction timescales deduced from the FRAP experiments. Specifically, for SPD-5, a scaffold protein with a mass of ~150 kDa, the estimated diffusion constant is ~17 µm<sup>2</sup>/s, using the Stokes-Einstein relation and a reference diffusion constant of ~30 µm<sup>2</sup>/s for a 30 kDa GFP protein (reference: Bionumbers book). This results in a diffusion timescale of ~1 second for centrosomes 10 µm apart. In contrast, FRAP recovery timescales for SPD-5 in C. elegans embryos are on the order of several minutes, suggesting that scaffold protein binding reactions are much slower than diffusion. Therefore, a reaction-limited model is appropriate for studying PCM self-assembly during centrosome maturation. We have revised the manuscript to clarify this point and to include a discussion of the diffusion and reaction timescales.
Spatially extended model with diffusion
Both the reviewers have pointed out the importance of considering diffusion effects in centrosome size dynamics, and we agree that this is important to explore. We have developed a spatially extended 3D version of the centrosome growth model, incorporating stochastic reactions and diffusion (see Appendix 4). In this model, the system is divided into small reaction volumes (voxels), where reactions depend on local density, and diffusion is modeled as the transport of monomers/building blocks between voxels.
We find that diffusion can alter the timescales of growth, particularly when the diffusion timescale is comparable to or slower than the reaction timescale, potentially mitigating size inequality by slowing down autocatalysis. However, the main conclusions of the catalytic growth model remain unchanged, showing robust size regulation independent of diffusion constant or centrosome separation (Figure 2—figure supplement 3). Hence, we focused on the effect of subunit diffusion on the autocatalytic growth model. We find that in the presence of diffusion, the size inequality reduces with increasing diffusion timescale, i.e., increasing distance between centrosomes and decreasing diffusion constant (Figure 2—figure supplement 4). However, the lack of robustness in size control in the autocatalyic growth model remains, i.e., the final size difference increases with increasing initial size difference. Notably, in the diffusion-limited regime (very small diffusion or large distances), the growth curve loses its sigmoidal shape, resembling the behavior in the non-autocatalytic limit (Figure 2). These findings are discussed in the revised manuscript.
Another shortcoming of the paper is that it is not clear what species the authors are investigating and how general the model is. There are huge differences in centrosome maturation and the involved proteins between species. However, this is not mentioned in the abstract or introduction. Moreover, in the main body of the paper, the authors mention C. elegans on pages 2 and 3, but refer to Drosophila on page 4, switching back to C. elegans on page 5, and discuss Drosophila on page 6. This is confusing and looks as if they are cherry-picking elements from various species. The original model in ref. 8 was constructed for C. elegans and it is not clear whether the autocatalytic model is more general than that. In any case, a more thorough discussion of experimental evidence would be helpful.
We believe one strength of our approach is its applicability across organisms. Our goal in comparing the theoretical model with experimental data from C. elegans and D.
melanogaster is to demonstrate that the apparent qualitative differences in centrosome growth across species (see e.g., the extent of size scaling discussed in the section “Cytoplasmic pool depletion regulates centrosome size scaling with cell size”) may arise from the same underlying mechanisms in the theoretical model, albeit with different parameter values. We acknowledge differences in regulatory molecules between species, but the core pathways remain conserved see e.g. Raff, Trends in Cell Biology 2019, section: “Molecular Components of the Mitotic Centrosome Scaffold Appear to Have Been Conserved in Evolution from Worms to Humans”. In the revised manuscript, we have expanded the introduction to clarify this point and explain how our theory applies across species. We have also provided a clearer discussion of the experimental systems used throughout the manuscript and the available experimental evidence.
The authors show convincingly that their model compensates for initial size differences in centrosomes and leads to more similar final sizes. These conclusions rely on numerical simulations, but it is not clear how the parameters listed in Table 1 were chosen and whether they are representative of the real situation. Since all presented models have many parameters, a detailed discussion on how the values were picked is indispensable. Without such a discussion, it is not clear how realistic the drawn conclusions are. Some of this could have been alleviated using a linear stability analysis of the ordinary differential equations from which one could have gotten insight into how the physical parameters affect the tendency to produce equal-sized centrosomes.
Following the suggestion of the reviewer, we have revised the manuscript to add references and discussions justifying the choice of the parameter values used for the numerical simulations. These references and parameter choices can be found in Table 1 and Table 2, and are also discussed in relevant figure captions and within the manuscript text.
We thank the reviewer for the excellent suggestion of including linear stability analysis of the ODE models of centrosome growth. We included linear stability analyses of the catalytic and autocatalytic growth models in Appendix 3. Analysis of the catalytic growth model reaffirms the robustness of size equality and the analysis of autocatalytic growth provides an approximate condition of size inequality. We have modified the revised manuscript to discuss these results.
The authors use the fact that their model stabilizes centrosome size to argue that their model is superior to the previously published one, but I think that this conclusion is not necessarily justified by the presented data. The authors claim that "[...] none of the existing quantitative models can account for robustness in centrosome size equality in the presence of positive feedback." (page 1; similar sentence on page 2). This is not shown convincingly. In fact, ref 8. already addresses this problem (see Fig. 5 in ref. 8) to some extent.
The linear stability analysis shown in Fig 5 in ref 8 (Zwicker et al, PNAS, 2014) shows that the solutions are stable around the fixed point and it was inferred from this result that Ostwald ripening can be suppressed by the catalytic activity of the centriole, therefore stabilizing the centrosomes (droplets) against coarsening by Ostwald ripening. But, if size discrepancy arises from the growth process (e.g., due to autocatalysis) the timescale of relaxation for such discrepancy is not clear from the above-mentioned result. We show (in figure 2 - figure supplement 3) that for any appreciable amount of positive feedback, the solution moves very slowly around the fixed point (almost like a line attractor) and cannot reach the fixed point in a biologically relevant timescale. Hence the model in ref 8 does not provide a robust mechanism for size control in the presence of autocatalytic growth. We have added this discussion in the Discussion section.
More importantly, the conclusion seems to largely be based on the analysis shown in Fig. 2A, but the parameters going into this figure are not clear (see the previous paragraph). In particular, the initial size discrepancy of 0.1 µm^3 seems quite large, since it translates to a sphere of a radius of 300 nm. A similarly large initial discrepancy is used on page 3 without any justification. Since the original model itself already showed size stability, a careful quantitative comparison would be necessary.
We thank the reviewer for the valuable suggestions. The parameters used in Fig. 2A are listed in Table 1 with corresponding references, and we used the parameter values from Zwicker et al. (2014) for rate constants and concentrations.
The issue of initial size differences between centrosomes is important, but quantitative data on this are not readily available for C. elegans and Drosophila. Centrosomes may differ initially due to disparities in the amount and incorporation rate of PCM between the mother and daughter centrioles. Based on available images and videos (Cabral et al, Dev. Cell, 2019, DOI: https://doi.org/10.1016/j.devcel.2019.06.004), we estimated an initial radius of ~0.5 μm for centrosomes. Accounting for a 5% radius difference would lead to a volume difference of ~0.1 μm<sup>3</sup>, which was used in our analysis (Fig. 2A). These differences likely arise from distinct growth conditions of centrosomes containing different centrioles (older mother and newer daughter).
More importantly, we emphasize that the initial size difference does not qualitatively alter the results presented in Figure 2. We agree that a quantitative analysis will further clarify our conclusions, and we have revised the manuscript accordingly. For example, Figure 2—figure supplement 3 provides a detailed analysis of how the final centrosome size depends on initial size differences across various parameter values. Additionally, Appendix 3 now includes analytical estimates of the onset of size inequality as a function of these parameters.
The analysis of the size discrepancy relies on stochastic simulations (e.g., mentioned on pages 2 and 4), but all presented equations are deterministic. It's unclear what assumptions go into these stochastic equations, and how they are analyzed or simulated. Most importantly, the noise strength (presumably linked to the number of components) needs to be mentioned. How is this noise strength determined? What are the arguments for this choice? This is particularly crucial since the authors quote quantitative results (e.g., "a negligible difference in steady-state size (∼ 2% of mean size)" on page 4).
As described in the Methods, we used the exact Gillespie method (Gillespie, JPC, 1977) to simulate the evolution of the stochastic trajectories of the systems, corresponding to the deterministic growth and reaction kinetics outlined in the manuscript. We've expanded the Methods to include further details on the stochastic simulations and refer to Appendix 1, where we describe the chemical master equations governing autocatalytic growth..
The noise strength (fluctuations about the mean size of centrosome) does depend on the total monomer concentration (the pool size), and this may affect size inequality. Similar values of the total monomer concentration were used in the catalytic (0.04 uM) and autocatalytic growth (0.33 uM) simulations. These values for the pool size are similar to previous studies (Zwicker et al, PNAS, 2012) and have been optimized to obtain a good fit with experimental growth curves from C. elegans embryo data.
To present more quantitative results, we have revised our manuscript to add data showing the effect of pool size on centrosome size inequality (Figure 3 - figure supplement 2). We find the size inequality in catalytic growth to increase with decreasing pool size as the origin of this inequality is the stochastic fluctuation in individual centrosome size. The size inequality (ratio of dv/<V>) in the autocatalytic growth does not depend (strongly) on the pool size (dv and <V> both increase similarly with pool size).
Moreover, the two sets of testable predictions that are offered at the end of the paper are not very illuminative: The first set of predictions, namely that the model would anticipate an "increase in centrosome size with increasing enzyme concentration, the ability to modify the shape of the sigmoidal growth curve, and the manipulation of centrosome size scaling patterns by perturbing growth rate constants or enzyme concentrations.", are so general that they apply to all models describing centrosome growth. Consequently, these observations do not set the shared enzyme pool apart and are thus not useful to discriminate between models. The second part of the first set of predictions about shifting "size scaling" is potentially more interesting, although I could not discern whether "size scaling" referred to scaling with cell size, total amount of material, or enzymatic activity at the centrioles. The second prediction is potentially also interesting and could be checked directly by analyzing published data of the original model (see Fig. 5 of ref. 8). It is unclear to me why the authors did not attempt this.
In response to the reviewers' valuable feedback, we have revised the manuscript to include results on potential methods for distinguishing catalytic growth from autocatalytic growth. Since the growth dynamics of a single centrosome do not significantly differ between these two models, it is necessary to experimentally examine the growth dynamics of a centrosome pair under various initial size perturbations. In Figure 3-figure supplement 2, we present theoretical predictions for both catalytic and autocatalytic growth models, illustrating the correlation between initial and final sizes after maturation. The figure demonstrates that the initial size difference and final size difference should be correlated only in the autocatalytic growth and the relative size inequality decreases with increasing subunit pool size in catalytic growth while remains almost unchanged in autocatalytic growth. These predictions can be experimentally examined by inducing varying centrosome sizes at the early stage of maturation for different expression levels of the scaffold former proteins.
A second experimentally testable feature of the catalytic growth model involves sharing of the enzyme between both centrosomes. This could be tested through immunofluorescent staining of the kinase or by constructing a FRET reporter for PLK1 activity, where it can be studied if the active form of the PLK1 is found in the cytoplasm around the centrosomes indicating a shared pool of active enzyme. Additionally, photoactivated localization microscopy could be employed, where fluorescently tagged enzyme can be selectively photoactivated in one centrosome and intensity can be measured at the other centrosome to find the extent of enzyme sharing between the centrosomes.
We also discuss shifts in centrosome size scaling behavior with cell size by varying parameters of the catalytic growth model (Fig 4). While quantitative analysis of size scaling in Drosophila is currently unavailable, such an investigation could enable us to distinguish catalytic growth mode with other models. We have included this point in the Discussion section.
“The second prediction is potentially also interesting …” We assume the reviewer is referencing the scenario in Zwicker et al. (ref 8), where differences in centriole activity lead to unequal centrosome sizes. The data in that study represent a case of centrosome growth with variable centriole activity, resulting in size differences in both autocatalytic and catalytic growth models. This differs from our proposed experiment, where we induce unequal centrosome sizes without modifying centriole activity. We have now revised the text to clarify this distinction.
Taken together, I think the shared enzyme pool is an interesting idea, but the experimental evidence for it is currently lacking. Moreover, the model seems to make little testable predictions that differ from previous models.
We appreciate the reviewer’s interest in the core idea of our work. As mentioned earlier, we have improved the clarity in model predictions in the revised discussion section. Unfortunately, the lack of publicly available experimental data limits our ability to provide more direct experimental evidence. However, we are hopeful that our theoretical model will inspire future experiments to test these model predictions.
Reviewer #2 (Public Review):
Summary:
In this paper, Banerjee & Banerjee argue that a solely autocatalytic assembly model of the centrosome leads to size inequality. The authors instead propose a catalytic growth model with a shared enzyme pool. Using this model, the authors predict that size control is enzyme-mediate and are able to reproduce various experimental results such as centrosome size scaling with cell size and centrosome growth curves in C. elegans.
The paper contains interesting results and is well-written and easy to follow/understand.
We are delighted that the reviewer finds our work interesting, and we appreciate the thoughtful suggestions provided. In response, we have revised the text and figures to incorporate these recommendations. Below, we address each of the reviewer’s comments point by point:
Suggestions:
● In the Introduction, when the authors mention that their "theory is based on recent experiments uncovering the interactions of the molecular components of centrosome assembly" it would be useful to mention what particular interactions these are.
As the reviewer suggested, we have modified the introduction section to add the experimental observations upon which we build our model.
● In the Results and Discussion sections, the authors note various similarities and differences between what is known regarding centrosome formation in C. elegan and Drosophila. It would have been helpful to already make such distinctions in the Introduction (where some phenomena that may be C. elegans specific are implied to hold centrosomes universally). It would also be helpful to include more comments for the possible implications for other systems in which centrosomes have been studied, such as human, Zebrafish, and Xenopus.
We thank the reviewer for this suggestion. We have modified the Introduction to motivate the comparative study of centrosome growth in different organisms and draw relevant connections to centrosome growth in other commonly studied organisms like Zebrafish and Xenopus.
● For Fig 1.C, the two axes are very close to being the same but are not. It makes the graph a little bit more difficult to interpret than if they were actually the same or distinctly different. It would be more useful to have them on the same scale and just have a legend.
We have modified the Figure 1C in the revised manuscript. The plot now shows the growth of a single and a pair of centrosomes both on the same y-axis scale.
● The authors refer to Equation 1 as resulting from an "active liquid-liquid phase separation", but it is unclear what that means in this context because the rheology of the centrosome does not appear to be relevant.
We used the term “active liquid-liquid phase separation” simply to refer to a previous model proposed by Zwicker et al (PNAS, 2014) where the underlying process of growth results from liquid-liquid phase separation. We agree with the reviewer that the rheological property of the centrosome is not very relevant in our discussions and we have thus removed the sentence from the revised manuscript to avoid any confusion.
● The authors reject the non-cooperative limit of Eq 1 because, even though it leads to size control, it does not give sigmoidal dynamics (Figure 2B). While I appreciate that this is just meant to be illustrative, I still find it to be a weak argument because I would guess a number of different minor tweaks to the model might keep size control while inducing sigmoidal dynamics, such as size-dependent addition of loss rates (which could be due to reactions happen on the surface of the centrosome instead of in its bulk, for example). Is my intuition incorrect? Is there an alternative reason to reject such possible modifications?
The reviewer raises an interesting point here. However, we disagree with the idea that minor adjustments to the model can produce sigmoidal growth curves while still maintaining size control. In the absence of an external, time-dependent increase in building block concentration (which would lead to an increasing growth rate), achieving sigmoidal growth requires a positive feedback mechanism in the growth rate. This positive feedback alone could introduce size inequality unless shared equally between the centrosomes, as it is in our model of catalytic growth in a shared enzyme pool. The proposed modification involving size-dependent addition or loss rates due to surface assembly/disassembly may result in unequal sizes precisely because of this positive feedback. A similar example is provided in Appendix 1, where assembly and disassembly across the pericentriolic material volume lead to sigmoidal growth but also generate significant size inequality and lack of robustness in size control.
● While the inset of Figure 3D is visually convincing, it would be good to include a statistical test for completeness.
Following the reviewer’s suggestion, we present a statistical analysis in Figure 3 - Figure supplement 2 in the modified manuscript to enhance clarity. We show that the size difference values are uncorrelated (Pearson’s correlation coefficient ~ 0) with the initial size difference indicating the robustness of the size regulation mechanism.
● The authors note that the pulse in active enzyme in their model is reminiscent of the Polo kinase pulse observed in Drosophila. Can the authors use these published experimental results to more tightly constrain what parameter regime in their model would be relevant for Drosophila? Can the authors make predictions of how this pulse might vary in other systems such as C. elegans?
Thank you for the insightful suggestion regarding the use of pulse dynamics in experiments to better constrain the model’s parameter regime. In our revised manuscript, we attempted this analysis; however, the data from Wong et al. (EMBO 2022) for Drosophila are presented as normalized intensity in arbitrary units, rather than as quantitative measures of centrosome size or Polo enzyme concentration. This lack of quantitative data limits our ability to benchmark the model beyond capturing qualitative trends. We thus believe that quantitative measurements of centrosome size and enzyme concentration are necessary to achieve a tighter alignment between model predictions and biological data.
We discuss the enzyme dynamics in C. elegans in the revised manuscript. We find the enzyme dynamics corresponding to the fitted growth curves of C. elegans centrosomes are distinctly different from the ones observed in Drosophila. Instead of the pulse-like feature, we find a step-like increase in (cytosolic) active enzyme concentration.
● The authors mention that the shared enzyme pool is likely not diffusion-limited in C. elegans embryos, but this might change in larger embryos such as Drosophila or Xenopus. It would be interesting for the authors to include a more in-depth discussion of when diffusion will or will not matter, and what the consequence of being in a diffusion-limit regime might be.
Both the reviewers have pointed out the importance of considering diffusion effects in centrosome size dynamics, and we agree that this is important to explore. We have developed a spatially extended 3D version of the centrosome growth model, incorporating stochastic reactions and diffusion (see Appendix 4). In this model, the system is divided into small reaction volumes (voxels), where reactions depend on local density, and diffusion is modeled as the transport of monomers/building blocks between voxels.
We find that diffusion can alter the timescales of growth, particularly when the diffusion timescale is comparable to or slower than the reaction timescale, potentially mitigating size inequality by slowing down autocatalysis. However, the main conclusions of the catalytic growth model remain unchanged, showing robust size regulation independent of diffusion constant or centrosome separation (Figure 2—figure supplement 3). Hence, we focused on the effect of subunit diffusion on the autocatalytic growth model. We find that in the presence of diffusion, the size inequality reduces with increasing diffusion timescale, i.e., increasing distance between centrosomes and decreasing diffusion constant (Figure 2—figure supplement 4). However, the lack of robustness in size control in the autocatalyic growth model remains, i.e., the final size difference increases with increasing initial size difference. Notably, in the diffusion-limited regime (very small diffusion or large distances), the growth curve loses its sigmoidal shape, resembling the behavior in the non-autocatalytic limit (Figure 2). These findings are discussed in the revised manuscript.
● The authors state "Firstly, our model posits the sharing of the enzyme between both centrosomes. This hypothesis can potentially be experimentally tested through immunofluorescent staining of the kinase or by constructing FRET reporter of PLK1 activity." I don't understand how such experiments would be helpful for determining if enzymes are shared between the two centrosomes. It would be helpful for the authors to elaborate.
Our results indicate the necessity of the centrosome-activated enzyme to be shared for the robust regulation of centrosome size equality. If a FRET reporter of the active form of the enzyme (e.g., PLK1) can be constructed then the localization of the active form of the enzyme may be determined in the cytosol. We propose this based on reports of studying PLK activities in subcellular compartments using FRET as described in Allen & Zhang, BBRC (2006). Such experiments will be a direct proof of the shared enzyme pool. Following the reviewer’s suggestion, we have modified the description of the FRET based possible experimental test for the shared enzyme pool hypothesis in the revised manuscript.
Additionally, we have added another possible experimental test based on photoactivated localization microscopy (PALM), where tagged enzyme can be selectively photoactivated in one centrosome and intensity measured at the other centrosome to indicate whether the enzyme is shared between the centrosomes.
Recommendations for the authors:
The manuscript needs to clarify better what species the model describes, how alternative models were rejected, and how the parameters were chosen.
In the revised manuscript, we have connect the chemical species in our model to those documented in organisms like Drosophila and C. elegans. This connection is detailed in the main text under the Catalytic Growth Model section and summarized in Table 2. We discuss alternative models and our reasons for excluding them in the first results section on autocatalytic growth, with additional details provided in Appendix 1 and the accompanying supplementary figures. The selection of model parameters is addressed in the main text and methods, with references listed in Table 1. We believe that these revisions, along with our point-by-point responses to reviewer comments, comprehensively address all reviewer concerns.
Reviewer #1 (Recommendations For The Authors):
I think the style and structure of the paper could be improved on at least two accounts:
(1) What's the role of the last section ("Multi-component centrosome model reveals the utility of shared catalysis on centrosome size control.")? It seems to simply add another component, keeping the essential structure of the model untouched. Not surprisingly, the qualitative features of the model are preserved and quantitative features are not discussed anyway.
This model provides a more realistic description of centrosome growth by incorporating the dynamics of the two primary scaffold-forming subunits and their interactions with an enzyme. It is based on the observation that the major interaction pathways among centrosome components are conserved across many organisms (see Raff, Trends in Cell Biology, 2019 and Table 2), typically involving two scaffold-forming proteins and one enzyme that mediates positive feedback between them. These pathways may involve homologous proteins in different species.
This model allows us to validate the experimentally observed spatial spread of the two subunits, Cnn and Spd-2, in Drosophila. Additionally, we used it to investigate the impact of relaxing the assumption of a shared enzyme pool on size control. Although similar insights could be obtained using a single-component model, the two-component model offers a more biologically relevant framework. We have highlighted these points in the revised manuscript to ensure clarity.
(2 ) The very long discussion section is not very helpful. First, it mostly reiterates points already made in the main text. Second, it makes arguments for the choice of modeling (top left column of page 8), which probably should have been made when introducing the model. Third, it introduces new results (lower left column of page 8), which should probably be moved to the main text. Fourth, the interpretation of the model in light of the known biochemistry is useful and should probably be expanded although I think it would be crucial to keep information from different organisms clearly separate (this last point actually holds for the entire manuscript).
We thank the reviewer for the feedback. We have modified the discussion section to focus more on the interpretation of the results, model predictions and future outlook with possible experiments to validate crucial aspects of the model. We have moved most of the justifications to the main text model description.
Here are a few additional minor points:
* page 1: Typo "for for" → "for"
* Page 8: Typo "to to" → "to"
We thank the reviewer for the useful recommendations. We have corrected all the typos in the revised manuscript.
* Why can diffusion be neglected in Eq. 1? This is discussed only very vaguely in the main text (on page 3). Strangely, there is some discussion of this crucial initial step in the discussion section, although the diffusion time of PLK1 is compared to the centrosome growth time there and not the more relevant enzyme-mediate conversion rate or enzyme deactivation rate.
We now discuss the justification of neglecting diffusion while motivating the model. We have added a more detailed discussion in the Methods section. We estimate the timescale of diffusion for the scaffold formers and the enzyme and compare them with the turnover timescales of the respective proteins Spd-2, Cnn and Polo. We find the proteins to diffuse fast compared to their FRAP recovery timescales indicating reaction timescales to be slower than the timescales of diffusion. Nevertheless, following the reviewer’s suggestion, we have also investigated the effect of diffusion on the growth process in Appendix 4.
* Page 3: The comparison k_0^+ ≫ k_1^+ is meaningless without specifying the number of subunits n. I even doubt that this condition is the correct one since even if k_0^+ is two orders of magnitude larger than k_1^+, the autocatalytic term can dominate if there are many subunits.
We thank the reviewer for the insightful comment on the comparison between the growth rates k^+_0 and k^+_1. Indeed, the pool size matters and we have now included a linear stability analysis of the autocatalytic growth equations in Appendix 3 to estimate the condition for size inequality. We have commented on these new findings in the revised manuscript.
* The Eqs. 2-4 are difficult to follow in my mind. For instance, it is not clear why the variables N_av and N_av^E are introduced when they evidently are equivalent to S_1 and E. It would also help to explicitly mention that V_c is the cell volume. Moreover, do these equations contain any centriolar activity? If so, I could not understand what term mediates this. If not, it might be good to mention this explicitly.
Following the reviewer’s suggestion, we have modified the equations 2-4 and added the definition of V_c to enhance clarity in the revised manuscript. The centriole activity is given by k^+ in the catalytic model. We now explicitly mention it.
* Page 4: The observed peak of active enzyme (Fig 3C) is compared to experimental observation of a PLK1 peak at centrosomes in Drosophila (ref. 28). However, if I understand correctly, the peak in the model refers to active enzyme in the entire cell (and the point of the model is that this enzymatic pool is shared everywhere), whereas the experimental measurement quantified the amount of PLK1 at the centrosome (and not the activity of the enzyme). How are the quantity in the model related to the experimental measurements?
The reviewer is correct in pointing out the difference between the quantities calculated from our model and those measured in the experiment by Wong et al. We have clarified this point in the revised manuscript. We hypothesize that if, in future experiments, the active (phosphorylated) polo can be observed by using a possible FRET reporter of activity then the cytosolic pulse can be observed too. We discuss this point in the revised manuscript.
* Page 6: The asymmetry due to differences in centriolar activity is apparently been done for both models (Eq. 1 and Eqs. 2-4), referring to a parameter k_0^+ in both cases. How does this parameter enter in the latter model? More generally, I don't really understand the difference in the two rows in Fig. 5 - is the top row referring to growth driven by centriolar activity while the lower row refers to pure autocatalytic growth? If so, what about the hybrid model where both mechanisms enter? This is particularly relevant, since ref. 8 claims that such a hybrid model explains growth curves of asymmetric centrosomes quantitatively. Along these lines, the analysis of asymmetric growth is quite vague and at most qualitative. Can the models also explain differential growth quantitatively?
We believe the reviewer’s comment on centrosome size asymmetry may stem from a lack of clarity in our initial explanation. In this section, as shown in Figure 5, we compare the full autocatalytic model (where both k_0^+ and k_1^+ are non-zero) with the catalytic model. The confusion might have arisen due to an unclear definition of centriolar activity in the catalytic growth model, which we have clarified in the revised manuscript. Specifically, we use k+ in the catalytic model and k0+ in the autocatalytic model as indicators of centriolar activity.
Our findings quantitatively demonstrate that variations in centriole activity can robustly drive size asymmetry in catalytic growth, independent of initial size differences. However, in autocatalytic growth, increased initial size differences make the system more vulnerable to a loss of regulation, as positive feedback can amplify these differences, ultimately influencing the final size asymmetry. Our results do not contradict Zwicker et al. (ref 8); rather, they complement it. We show that size asymmetry in autocatalytic growth is governed by both centriole activity and positive feedback, highlighting that centriole activity alone cannot robustly regulate centrosome size asymmetry within this framework.
* The code for performing the simulations does not seem to be available
We have now made the main codes available in a GitHub repository. Link: https://github.com/BanerjeeLab/Centrosome_growth_model
-
-
www.biorxiv.org www.biorxiv.org
-
eLife Assessment
This manuscript describes the identification and characterization of 12 specific phosphomimetic mutations in the recombinant full-length human tau protein that trigger tau to form fibrils. This fundamental study will allow in vitro mechanistic investigations. The presented evidence is solid but a higher purity of these fibril types might be required for future studies. This manuscript will be of interest to all scientists in the amyloid formation field.
-
Reviewer #1 (Public review):
Summary and Strengths:
The very well-written manuscript by Lövestam et al. from the Scheres/Goedert groups entitled "Twelve phosphomimetic mutations induce the assembly of recombinant full-length human tau into paired helical filaments" demonstrates the in vitro production of the so-called paired helical filament Alzheimer's disease (AD) polymorph fold of tau amyloids through the introduction of 12 point mutations that attempt to mimic the disease-associated hyper-phosphorylation of tau. The presented work is very important because it enables disease-related scientific work, including seeded amyloid replication in cells, to be performed in vitro using recombinant-expressed tau protein.
Weaknesses:
The following points are asked to be addressed by the authors:
(i) In the discussion it would be helpful to note the findings that in AD the chemical structure tau (including phosphorylation) is what defines the polymorph fold and not the buffer/cellular environment. It would be further interesting to discuss these findings in respect to the relationship between disease and structure. The presented findings suggest that due to a cellular/organismal alteration, such as aging or Abeta aggregation, tau is specifically hyper-phosphorylated which then leads to its aggregation into the paired helical filaments that are associated with AD.
(ii) The conditions used for each assembly reaction are a bit hard to keep track of and somewhat ambiguous. In order to help the reader, I would suggest making a table to show conditions used for each type of assembly (including the diameter / throw of the orbital shaker) and the results (structural/biological) of those conditions. For example, presumably the authors did not have ThT in the samples used for cryo-EM but the methods section does not specify this. Also, the presence of trace NaCl is proposed as a possible cause for the CTE fold to appear in the 0N4R sample (page 4) but no explanation of why this particular sample would have more NaCl than the others. Furthermore, it appears that NaCl was actually used in the seeded assembly reactions that produced the PHF and not the CTE fold. This would seem to indicate the CTE structure of 0N4R-PAD12 is not actually induced by NaCl (like it was for tau297-391). In order for the reader to better understand the reproducibility of the polymorphs, it would be helpful to indicate in how many different conditions and how many replicates with new protein preparations each polymorph was observed (could be included in the same table)
(iii) It is not clear how the authors calculate the percentage of each filament type. In Figure 1 it is stated "discarded solved particles (coloured) and discarded filaments in grey" which leaves the reviewer wondering what a "discarded solved particle" is and which filaments were discarded. From the main text one guesses that the latter is probably false positives from automated picking but if so, these should not be referred to as filaments. Also, are the percentages calculated for filaments or segments? In any case, it would be more helpful in such are report to know the best estimate of the ratio of identified filament types without confusing the reader with a measure of the quality of the picking algorithm. Please clarify. Also, a clarification is asked for the significance of the varying degrees of PHF and AD monomer filaments in the various assembly conditions. It could be expected that there is significant variability from sample to sample but it would be interesting to know if there has been any attempt to reproduce the samples to measure this variability. If not, it might be worth mentioning so that the % values are taking with the appropriate sized grain of salt. Finally, the representation of the data in Figure 1 would seem to imply that the 0N3R forms less or no monofilament AD fold because no cross-section is shown for this structure, however it is very similar to (or statistically the same as) the 1:1 mix of 0N3R:0N4R.
(iv) The interpretation of the NMR data on soluble tau that the mutations on the second site are suppressing in part long range dynamic interaction around the aggregation-initiation site (FIA) is sound. It is in particular interesting to find that the mutations have a similar effect as the truncation at residue 391. An additional experiment using solvent PREs to elaborate on the solvent exposed sequence-resolved electrostatic potential and the intra-molecular long range interactions would likely strengthen the interpretation significantly (Iwahara, for example, Yu et al, in JACS 2024). Figure 6D Figure supplement shows the NMR cross peak intensities between tau 151-391 and PAD12tau151-391. Overall the intensities of the PAD12 tau construct are more intense which could be interpreted with less conformational exchange between long range dynamic interactions. There are however several regions which do not show any intensity anymore when compared with the corresponding wildtype construct such as 259-262, 292-294 which should be discussed/explained.
(v) Concerning the Cryo-EM data from the different hyper-phosphorylation mimics, it would seem that the authors could at least comment on the proportion of monofilament and paired-filaments even if they could not solve the structures. Nonetheless, based on their previous publications, one would also expect that they could show whether the non-twisted filaments are likely to have the same structure (by comparing the 2D classes to projections of non-twisted models). Also, it is very interesting to note that the twist could be so strongly controlled by the charge distribution on the non-structured regions (and may be also related to the work by Mezzenga on twist rate and buffer conditions). Is the result reported in Figure 2 a one-off case or was it also reproducible?
-
Reviewer #2 (Public review):
Summary:
This manuscript addresses an important impediment in the field of Alzheimer's disease (AD) and tauapathy research by showing that 12 specific phosphomimetic mutations in full-length tau allow the protein to aggregate into fibrils with the AD fold and the fold of chronic traumatic encephalopathy fibrils in vitro. The paper presents comprehensive structural and cell based seeding data indicating the improvement of their approach over previous in vitro attempts on non-full-length tau constructs. The main weaknesses of this work results from the fact that only up to 70% of the tau fibrils form the desired fibril polymorphs. In addition, some of the figures are of low quality and confusing.
Strengths:
This study provides significant progress towards a very important and timely topic in the amyloid community, namely the in vitro production of tau fibrils found in patients.
The 12 specific phosphomimetic mutations presented in this work will have an immediate impact in the field since they can be easily reproduced.
Multiple high-resolution structures support the success of the phosphomimetic mutation approach.
Additional data show the seeding efficiency of the resulting fibrils, their reduced tendency to bundle, and their ability to be labeled without affecting core structure or seeding capability.
Weaknesses:
Despite the success of making full-length AD tau fibrils, still ~30% of the fibrils are either not PHF, or not accounted for. A small fraction of the fibrils are single filaments and another ~20% are not accounted for. The authors mention that ~20% of these fibrils were not picked by the automated algorithm. However, it would be important to get additional clarity about these fibrils. Therefore, it would improve the impact of the paper if the authors could manually analyze passed-over particles to see if they are compatible with PHF or fall into a different class of fibrils. In addition, it would be helpful if the authors could comment on what can be done/tried to get the PHF yield closer to 90-100%
-
Author response:
We thank the reviewers for their constructive comments. While we work on a revision that addresses all points raised, we would already like to point out that both reviewers seem to have misunderstood how we reported the percentages of filament types in our reactions. Because we included all picked images in our calculations (including false positives from the picking, as well as damaged, overlapping or otherwise unsuitable filaments), we may have inadvertently given the impression that these filament preparations are not pure. In fact, the opposite is true: 0N3R PAD12 tau and the mixture of 0N3R:0N4R PAD12 tau assemble into highly pure paired helical filaments with the Alzheimer fold. Discarding images is common practice for high-resolution cryo-EM structure determination. Our reported percentages of discarded images (20-30%) are much lower than in typical cryo-EM studies, which is another reflection of the high quality of these samples. The main impurity lies in smaller fractions (~10%) of single protofilaments with the Alzheimer fold. We will make this clearer in our revised manuscript.
-
-
www.biorxiv.org www.biorxiv.org
-
eLife Assessment
Cardiolipin is known to play an important role in modulating the assembly and function of membrane proteins in bacterial and mitochondrial membranes. In this study, authors convincingly define the molecular determinants of cardiolipin binding on de novo-designed and native membrane proteins combining the coarse-grained molecular dynamics simulation with the state-of-the-art experimental approaches such as native mass spectrometry and cryogenic electron microscopy. The major findings in this study, which are the identification of degenerate cardiolipin binding motifs and their role in membrane protein stability and activity, will provide much needed insight into the still poorly understood nature of protein-cardiolipin interactions.
-
Reviewer #1 (Public review):
Summary:
The study combines predictions from MD simulations with sophisticated experimental approaches including native mass spectrometry (nMS), cryo-EM, and thermal protein stability assays to investigate the molecular determinants of cardiolipin (CDL) binding and binding-induced protein stability/function of an engineered model protein (ROCKET), as well as of the native E. coli intramembrane rhomboid protease, GlpG.
Strengths:
State-of-the-art approaches and sharply focused experimental investigation lend credence to the conclusions drawn. Stable CDL binding is accommodated by a largely degenerate protein fold that combines interactions from distant basic residues with greater intercalation of the lipid within the protein structure. Surprisingly, there appears to be no direct correlation between binding affinity/occupancy and protein stability.
Weaknesses:
(i) While aromatic residues (in particular Trp) appear to be clearly involved in the CDL interaction, there is no investigation of their roles and contributions relative to the positively charged residues (R and K) investigated here. How do aromatics contribute to CDL binding and protein stability, and are they differential in nature (W vs Y vs F)? (ii) In the case of GlpG, a WR pair (W136-R137) present at the lipid-water on the periplasmic face (adjacent to helices 2/3) may function akin to the W12-R13 of ROCKET in specifically binding CDL. Investigation of this site might prove to be interesting if it indeed does. (iii) Examples of other native proteins that utilize combinatorial aromatic and electrostatic interactions to bind CDL would provide a broader perspective of the general applicability of these findings to the reader (for e.g. the adenine nucleotide translocase (ANT/AAC) of the mitochondria as well as the mechanoenzymatic GTPase Drp1 appear to bind CDL using the common "WRG' motif.)
Overall, using both model and native protein systems, this study convincingly underscores the molecular and structural requirements for CDL binding and binding-induced membrane protein stability. This work provides much-needed insight into the poorly understood nature of protein-CDL interactions.
-
Reviewer #2 (Public review):
Summary:
The work in this paper discusses the use of CG-MD simulations and nMS to describe cardiolipin binding sites in a synthetically designed that can be extrapolated to a naturally occurring membrane protein. While the authors acknowledge their work illuminates the challenges in engineering lipid binding they are able to describe some features that highlight residues within GlpG that may be involved in lipid regulation of protease activity, although further study of this site is required to confirm it's role in protein activity.
Comments<br /> Discrepancy between total CDL binding in CG simulations (Fig 1d) and nMS (Fig 2b,c) should be further discussed. Limitations in nMS methodology selecting for tightest bound lipids?<br /> Mutation of helical residues to alanine not only results in loss of lipid binding residues but may also impact overall helix flexibility, is this observed by the authors in CG-MD simulations? Change in helix overall RMSD throughout simulation? The figures shown in Fig.1H show what appear to be quite significant differences in APO protein arrangement between ROCKET and ROCKET AAXWA.<br /> CG-MD force experiments could be corroborated experimentally with magnetic tweezer unfolding assays as has been performed for the unfolding of artificial protein TMHC2. Alternatively this work could benefit to referencing Wang et al 2019 "On the Interpretation of Force-Induced Unfolding Studies of Membrane Proteins Using Fast Simulations" to support MD vs experimental values.<br /> Did the authors investigate if ROCKET or ROCKETAAXWA copurifies with endogenous lipids? Membrane proteins with stabilising CDL often copurify in detergent and can be detected by MS without the addition of CDL to the detergent solution. Differences in retention of endogenous lipid may also indicate differences in stability between the proteins and is worth investigation.<br /> Do the AAXWA and ROCKET have significantly similar intensities from nMS? The AAXWA appears to show slight lower intensities than the ROCKET.<br /> Can the authors extend their comments on why densities are observed only around site 2 in the cryo-em structures when site 1 is the apparent preferential site for ROCKET.<br /> The authors state that nMS is consistent with CDL binding preferentially to Site 1 in ROCKET and preferentially to Site 2 in the ROCKET AAXWA variant, yet it unclear from the text exactly how these experiments demonstrate this.<br /> As carried out for ROCKET AAXWA the total CDL binding to A61P and R66A would add to supporting information of characterisation of lipid stabilising mutations.<br /> Did the authors investigate a double mutation to Site 2 (e.g. R66A + M16A)?<br /> Was the stability of R66A ever compared to the WT or only to AAXWA?<br /> How many CDL sites in the database used are structurally verified?<br /> The work on GlpG could benefit from mutagenesis or discussion of mutagenesis to this site. The Y160F mutation has already been shown to have little impact on stability or activity (Baker and Urban Nat Chem Biol. 2012).
-
Reviewer #3 (Public review):
Summary:
The relationships of proteins and lipids: it's complicated. This paper illustrates how cardiolipins can stabilize membrane protein subunits - and not surprisingly, positively charged residues play an important role here. But more and stronger binding of such structural lipids does not necessarily translate to stabilization of oligomeric states, since many proteins have alternative binding sites for lipids which may be intra- rather than intermolecular. Mutations which abolish primary binding sites can cause redistribution to (weaker) secondary sites which nevertheless stabilize interactions between subunits. This may be at first sight counterintuitive but actually matches expectations from structural data and MD modelling. An analogous cardiolipin binding site between subunits is found in E.coli tetrameric GlpG, with cardiolipin (thermally) stabilizing the protein against aggregation.
Strengths:
The use of the artificial scaffold allows testing of hypothesis about the different roles of cardiolipin binding. It reveals effects which are at first sight counterintuitive and are explained by the existence of a weaker, secondary binding site which unlike the primary one allows easy lipid-mediated interaction between two subunits of the protein. Introducing different mutations either changes the balance between primary and secondary binding sites or introduced a kink in a helix - thus affecting subunit interactions which are experimentally verified by native mass spectrometry.
Weaknesses:
The artificial scaffold is not necessarily reflecting the conformational dynamics and local flexibility of real, functional membrane proteins. The example of GlpG, while also showing interesting cardiolipin dependency, illustrates the case of a binding site across helices further but does not add much to the main story. It should be evident that structural lipids can be stabilizing in more than one way depending on how they bind, leading to different and possibly opposite functional outcomes.
-
Author response:
(1) discuss the non-native properties of ROCKET and compare CDL binding in native proteins
ROCKET is indeed a non-native protein with exceptional stability, which makes it immune to mutations with subtle effects on structure or dynamics. We would argue that this is an advantage, allowing us to find the features with the most pronounced impact on CDL-mediated stability. The reviewers are right that there certainly are other structural features which impact CDL binding, which cannot be investigated using ROCKET. This is the reason we then apply our findings to GlpG - to translate back to native systems.
The CDL binding site geometry that we tested experimentally was derived by Corey et al (Sci Adv 2022) from large-scale computational analysis of native protein structures. Our data adds some basic rules for flexibility, which helped us to identify GlpG as a potentially CDL-regulated protein. Following the reviewers’ suggestion, we will screen the dataset from Corey et al. for experimentally confirmed examples of CDL-mediated stabilization and analyze whether they conform to the rules derived from analysis of ROCKET. In this way, we may be able to assess how general our findings are.
(2) clarify the limitations of combining MS and nMS
The reviewers correctly point out that there are differences between the MD and MS data: although the binding Site 1 has nearly 100% occupancy in MD, MS shows that ca 50% of the protein is CDL-free and that not all subunits in the tetramer have a CDL bound. Furthermore, MD shows that aromatic residues are important, but this is not tested by MS. Both points relate to the shortcomings of nMS, which requires desolvation, ionization, and detergent stripping to detect protein-lipid complexes. These processes can potentially affect lipid binding, e.g. by leading to loss of lipids that are not tightly bound. As a result, absolute quantitative comparisons between MD and MS are challenging, and contributions from subtle non-electrostatic interactions involving aromatic residues are difficult to detect. For this reason, we use relative changes in lipid interactions between different ROCKET variants to compare MD and MS data. We will discuss these factors in the revision.
(3) more detailed investigation of the structure-function relationship in GlpG-CDL complexes
We use the insights from ROCKET to identify a stabilizing CDL site in GlpG and find that CDL binding switches substrate preference from transmembrane to soluble substrates. We do not verify the binding site with mutagenesis in our study, but the MD and MS data are very unambiguous that there is only one site, and its location provides a rationale for how CDL affects substrate binding, which is described in the supplementary data.
We agree that the regulatory effect of CDL on GlpG activity raises a wide range of interesting questions relating to the mechanism of allosteric inhibition, the evolutionary background, and biological implications of E. coli using changes in membrane CDL content to steer GlpG activity. Work in our labs is on-going to investigate this further, including the mutational analysis suggested by the reviewers, but it moves beyond of the scope of the current study. We will discuss our rationale for the absence of mutagenesis data in the revision.
-
-
www.biorxiv.org www.biorxiv.org
-
eLife Assessment
The bacterial cell wall is crucial to maintain viability. It has previously been suggested that Gram-positive bacteria have a periplasmic region between the cell membrane and peptidoglycan cell wall that this is maintained by the presence of teichoic acids. In this valuable study, Nguyen et al. make clever use of electron microscopy and metabolic labelling to interrogate the role of teichoic acids in supporting the maintenance of the periplasmic region in Streptococcus pneumoniae. The findings are potentially significant but incomplete to fully support the conclusions drawn.
-
Reviewer #1 (Public review):
The authors set out to analyse the roles of the teichoic acids of Streptococcus pneumoniae in supporting the maintenance of the periplasmic region. Previous work has proposed the periplasm to be present in Gram positive bacteria and here advanced electron microscopy approach was used. This also showed a likely role for both wall and lipo-teichoic acids in maintaining the periplasm. Next, the authors use a metabolic labelling approach to analyse the teichoic acids. This is a clear strength as this method cannot be used for most other well studied organisms. The labelling was coupled with super-resolution microscopy to be able to map the teichoic acids at the subcellular level and a series of gel separation experiments to unravel the nature of the teichoic acids and the contribution of genes previously proposed to be required for their display. The manuscript could be an important addition to the field but there are a number of technical issues which somewhat undermine the conclusions drawn at the moment. These are shown below and should be addressed. More minor points are covered in the private Recommendations for Authors.
Weaknesses to be addressed:
(1) l. 144 Was there really only one sample that gave this resolution? Biological repeats of all experiments are required.
(2) Fig. 4A. Is the pellet recovered at "low" speeds not just some of the membrane that would sediment at this speed with or without LTA? Can a control be done using an integral membrane protein and Western Blot? Using the tacL mutant would show the behaviour of membranes alone.
(3) Fig. 4A. Using enzymatic digestion of the cell wall and then sedimentation will allow cell wall associated proteins (and other material) to become bound to the membranes and potentially effect sedimentation properties. This is what is in fact suggested by the authors (l. 1000, Fig. S6). In order to determine if the sedimentation properties observed are due to an artefact of the lysis conditions a physical breakage of the cells, using a French Press, should be carried out and then membranes purified by differential centrifugation. This is a standard, and well-established method (low-speed to remove debris and high-speed to sediment membranes) that has been used for S. pneumoniae over many years but would seem counter to the results in the current manuscript (for instance Hakenbeck, R. and Kohiyama, M. (1982), Purification of Penicillin-Binding Protein 3 from Streptococcus pneumoniae. European Journal of Biochemistry, 127: 231-236).
(4) l. 303-305. The authors suggest that the observed LTA-like bands disappear in a pulse chase experiment (Fig. 6B). What is the difference between this and Fig. 5B, where the bands do not disappear? Fig. 5C is the WT and was only pulse labelled for 5 min and so would one not expect the LTA-like bands to disappear as in 6B?
(5) Fig. 6B, l. 243-269 and l. 398-410. If, as stated, most of the LTA-like bands are actually precursor then how can the quantification of LTA stand as stated in the text? The "Titration of Cellular TA" section should be re-evaluated or removed? If you compare Fig. 6C WT extract incubated at RT and 110oC it seems like a large decrease in amount of material at the higher temperature. Thus, the WT has a lot of precursors in the membrane? This needs to be quantified.
(6) L. 339-351, Fig. 6A. A single lane on a gel is not very convincing as to the role of LytR. Here, and throughout the manuscript, wherever statements concerning levels of material are made, quantification needs to be done over appropriate numbers of repeats and with densitometry data shown in SI.
(7) 14. l. 385-391. Contrary to the statement in the text, the zwitterionic TA will have associated counterions that result in net neutrality. It will just have both -ve and +ve counterions in equal amounts (dependent on their valency), which doesn't matter if it is doing the job of balancing osmolarity (rather than charge).
-
Reviewer #2 (Public review):
The Gram-positive cell wall contains for a large part of TAs, and is essential for most bacteria. However, TA biosynthesis and regulation is highly understudied because of the difficulties in working with these molecules. This study closes some of our important knowledge gaps related to this and provides new and improved methods to study TAs. It also shows an interesting role for TAs in maintaining a 'periplasmic space' in Gram positives. Overall, this is an important piece of work. It would have been more satisfying if the possible causal link between TAs and periplasmic space would have been more deeply investigated with complemented mutants and CEMOVIS. For the moment, there is clearly something happening but it is not clear if this only happens in TA mutants or also in strains with capsules/without capsules and in PG mutants, or in lafB (essential for production of another glycolipid) mutants. Finally, some very strong statements are made suggesting several papers in the literature are incorrect, without actually providing any substantiation/evidence supporting these claims. This work pioneers some new methods that will definitively move the field forward.
-
-
www.biorxiv.org www.biorxiv.org
-
eLife Assessment
This study estimates the fraction of apoptotic motor neurons during the development of the zebrafish spinal cord. The results are useful, but incomplete. Importantly, the data are inadequate to support the title or the conclusions presented in the abstract. A correct title could be: "A surprisingly small percentage of early developing zebrafish motor neurons die through apoptosis in non-limb innervating regions of the spinal cord."
-
Reviewer #1 (Public review):
Summary:
The authors aim at measuring the apoptotic fraction of motorneurons in developing zebrafish spinal cord to assess the extent of neuronal apoptosis during the development of of a vertebrate embryo in an in vivo context
Strengths:
The transgenic fish line tg(mnx1:sensor C3) appears to be a good reagent for motorneuron apoptosis studies, while further validation of its motorneuron specificity should be performed
Weaknesses:
The results do not support the conclusions. The main "selling point" as summarized in the title is that the apoptotic rate of zebrafish motorneurons during development is strikingly low (~2% ) as compared to the much higher estimate (~50%) by previous studies in other systems. The results used to support the conclusion are that only a small percentage (under 2%) of apoptotic cells were found over a large population at a variety of stages 24-120hpf. This is fundamentally flawed logic, as a short-time window measure of percentage cannot represent the percentage on the long-term. For example, at any year under 1% of human population die, but over 100 years >99% of the starting group will have died. To find the real percentage of motorneurons that died, the motorneurons born at different times must be tracked over long term, or the new motorneuron birth rate must be estimated.
Similar argument can be applied to the macrophage results.
The conclusion regarding timing of axon and cell body caspase activation and apoptosis timing also has clear issues. The ~minutes measurement are too long as compared to the transport/diffusion timescale between the cell body and the axon, caspase activity could have been activated in the cell body and either caspase or the cleaved sensor move to the axon in several seconds. The authors' results are not high frequency enough to resolve these dynamics
Many statements suggest oversight of literature, for example, in abstract "however, there is still no real-time observation showing this dying process in live animals.".
Many statements should use more scholarly terms and descriptions from the spinal cord or motorneuron, neuromuscular development fields, such as line 87 "their axons converged into one bundle to extend into individual somite, which serves as a functional unit for the development and contraction of muscle cells"
The transgenic line is perhaps the most meaningful contribution to the field as the work stands. However, mnx1 promoter is well known for its non-specific activation - while the images do suggest the authors' line is good, motorneuron markers should be used to validate the line. This is especially important for assessing this population later as mnx1 may be turned off in mature neurons. The author's response regarding mnx1 specificity does not mitigate the original concern.
Overall, this work does not substantiate its biological conclusions and therefore do not advance the field. The transgenic line has the potential for addressing the questions raised but requires different sets of experiments. The line and the data as reported are useful on their own by providing a short-term rate of apoptosis of the motorneuron population.
-
Reviewer #2 (Public review):
Summary:
Jia and colleagues developed a fluorescence resonance energy transfer (FRET)-based biosensor to study programmed cell death in the zebrafish spinal cord. They applied this tool to study death of zebrafish spinal motor neurons.
Strengths:
Their analysis shows that the tool is a useful biosensor of motor neuron apoptosis in living zebrafish and can reveal which part of the neuron undergoes caspase activation first, achieving two of their aims.
Weaknesses:
The third aim, to provide novel insights into the spatiotemporal properties and occurrence rates of motor neuron death requires additional context and investigation, especially to understand the significance of the differences they report between zebrafish motor neuron programmed cell death and what has been previously described in chicks and rodents. For example, mnx1 expresses not only in motor neurons, but also in interneurons. However, the way the authors counted living and dead cells does not take this into consideration, potentially underestimating the percentage of motor neurons that died. Previous studies of chicks and rodents showed widespread differences in the timing of motor neuron programmed cell death and the number of cells that died depending on the spinal cord region examined. The authors have not described which spinal cord segments they examined or whether they examined motor neurons in limb-bearing segments which have been best studied in other species. Previous literature investigated the death of an identified zebrafish motor neuron and provided experimental evidence that it is independent of limitations in muscle innervation area, suggesting it is not coupled to muscle-derived neurotrophic factors. Thus, the authors need to acknowledge that even previous to their study, there was literature suggesting that programmed cell death of at least one motor neuron in zebrafish does not easily fit into the "neurotrophic hypothesis" as it is generally formulated. Finally, the authors need to be mindful that showing that something does not happen in an observational study cannot reveal the capabilities of the cells involved without an experimental test.
-
Author response:
The following is the authors’ response to the original reviews.
Reviewer 1:
We thank the reviewer for the time and effort in providing very useful comments and suggestions for our manuscript.
(1) The results do not support the conclusions. The main "selling point" as summarized in the title is that the apoptotic rate of zebrafish motorneurons during development is strikingly low (~2% ) as compared to the much higher estimate (~50%) by previous studies in other systems. The results used to support the conclusion are that only a small percentage (under 2%) of apoptotic cells were found over a large population at a variety of stages 24-120hpf. This is fundamentally flawed logic, as a short-time window measure of percentage cannot represent the percentage in the long term. For example, at any year under 1% of the human population dies, but over 100 years >99% of the starting group will have died. To find the real percentage of motorneurons that died, the motorneurons born at different times must be tracked over the long term or the new motorneuron birth rate must be estimated. A similar argument can be applied to the macrophage results. Here the authors probably want to discuss well-established mechanisms of apoptotic neuron clearance such as by glia and microglia cells.
We chose the time window of 24-120 hpf based on the following two reasons: 1) Previous studies showed that although the time windows of motor neuron death vary in chick (E5-E10), mouse (E11.5-E15.5), rat (E15-E18), and human (11-25 weeks of gestation), the common feature of these time windows is that they are all the developmental periods when motor neurons contact with muscle cells. The contact between zebrafish motor neurons and muscle cells occurs before 72 hpf, which is included in our observation time window of 24-120 hpf. 2) Zebrafish complete hatching during 48-72 hpf, and most organs form before 72 hpf. More importantly, zebrafish start swimming around 72 hpf, indicating that motor neurons are fully functional at 72 hpf. Thus, we are confident that this 24-120 hpf time window covers the time window during which motor neurons undergo programmed cell death during zebrafish early development. We have added this information to the revised manuscript.
We frequently used “early development” in this manuscript to describe our observation. However, we missed “early” in our title. We therefore have added this ket word of “early” in the title in the revised manuscript.
Previous studies in zebrafish have shown that the production of spinal cord motor neurons largely ceases before 48 hpf, and then the motor neurons remain largely constant until adulthood (doi: 10.1016/j.celrep.2015.09.050; 10.1016/j.devcel.2013.04.012; 10.1007/BF00304606; 10.3389/fcell.2021.640414). Our observation time window covers the major motor neuron production process. Therefore, we believe that neurogenesis will not affect our findings and conclusions.
We discussed the engulfment of dead motor neurons by other types of cells in the discussion section.
(2) The transgenic line is perhaps the most meaningful contribution to the field as the work stands. However, the mnx1 promoter is well known for its non-specific activation - while the images suggest the authors' line is good, motor neuron markers should be used to validate the line. This is especially important for assessing this population later as mnx1 may be turned off in mature neurons.
The mnx1 promoter has been widely used to label motor neurons in transgenic zebrafish. Previous studies have shown that most of the cells labeled in the mnx1 transgenic zebrafish are motor neurons. In this study, we observed that the neuronal cells in our sensor zebrafish formed green cell bodies inside of the spinal cord and extended to the muscle region, which is an important morphological feature of the motor neurons.
Reviewer 2:
We thank the reviewer for the time and effort in making very useful comments and suggestions for our manuscript.
The FRET-based programmed cell death biosensor described in this manuscript could be very useful. However, the authors have not considered what is already known about the development and programmed cell death of zebrafish spinal motor neurons, and potential differences between motor neuron populations innervating different types of muscles in different vertebrate models. Without this context, the application of their new biosensor tool does not provide new insights into zebrafish motor neuron programmed cell death. In addition, the authors have not carried out controls to show the efficacy and specificity of their morpholinos. Nor have they described how they counted dying motor neurons, or why they chose the specific developmental time points they addressed. These issues are addressed more specifically below.
(1) Lines 12-13: Previous studies in zebrafish showed death of identified spinal motor neurons.
Line 103: In Figure 2A the cell body in the middle is that of identified motor neuron VaP. VaP death has previously been described in several publications. The cell body on the right of the same panel appears to belong to an interneuron whose axon can be seen extending off to the left in one of the rostrocaudal axon bundles that traverse the spinal cord. Higher-resolution imaging would clarify this.
Lines 163-164: Is this the absolute number of motor neurons that died? How were the counts done? Were all the motor neurons in every segment counted? There are approximately 30 identifiable VaP motor neurons in each embryo and they have previously been reported to die between 24-36 hpf. So this analysis is likely capturing those cells.
Our study examined the overall motor neuron apoptosis rather than a specific type of motor neuron death, so we did not emphasize the death of VaP motor neurons. We agree that the dead motor neurons observed in our manuscript contain VaP motor neurons. However, there were also other types of dead motor neurons observed in our study. The reasons are as follows: 1) VaP primary motor neurons die before 36 hpf, but our study found motor neuron cells died after 36 hpf and even at 84 hpf (revised Figure 4A). 2) The position of the VaP motor neuron is together with that of the CaP motor neuron, that is, at the caudal region of the motor neuron cluster. Although it’s rare, we did observe the death of motor neurons in the rostral region of the motor neuron cluster (revised Figure 2C). 3) There is only one or zero VaP motor neuron in each motor neuron cluster. Although our data showed that usually one motor neuron died in each motor neuron cluster, we did observe that sometimes more than one motor neuron died in the motor neuron cluster (revised Figure 2C). We included this information in the revised discussion.
(2) Lines 82-83: It is published that mnx1 is expressed in at least one type of spinal interneuron derived from the same embryonic domain as motor neurons.
The mnx1 promoter has been widely used to label motor neurons in transgenic zebrafish. Previous studies have shown that most of the cells labeled in the mnx1 transgenic zebrafish are motor neurons. In this study, we observed that the neuronal cells in our sensor zebrafish formed green cell bodies inside of the spinal cord and extended to the muscle region, which is an important morphological feature of the motor neurons.
Furthermore, a few of those green cell bodies turned into blue apoptotic bodies inside the spinal cord and changed to blue axons in the muscle regions at the same time, which strongly suggests that those apoptotic neurons are not interneurons. Although the mnx1 promoter might have labeled some interneurons, this will not affect our major finding that only a small portion of motor neurons died during zebrafish early development.
(3) Lines 161-162: Although this may be the major time window of neurogenesis, there are many more motor neurons in adults than in larvae. Neither of these references describes the increase in motor neuron numbers over this particular time span, so the rationale for this choice is unclear.
Lines 168-171: It is known that later developing motor neurons are still being generated in the spinal cord at this time, suggesting that if there is a period of programmed cell death similar to that described in chick and mouse, it would likely occur later. In addition, most of the chick and mouse studies were performed on limb-innervating motor neurons, rather than the body wall muscle-innervating motor neurons examined here.
Lines 237-238: Especially since new motor neurons are still being generated at this time.
Previous studies have shown that the production of spinal cord motor neurons largely ceases before 48 hpf in zebrafish, and then the motor neurons remain largely constant until the adulthood (doi: 10.1016/j.celrep.2015.09.050; 10.1016/j.devcel.2013.04.012; 10.1007/BF00304606; 10.3389/fcell.2021.640414). Our observation time window covers the major motor neuron production process. Therefore, we believe that neurogenesis will not affect our data and conclusions.
The death of motor neurons in limb-innervating motor neurons has been extensively studied in chicks and rodents, as it is easy to undergo operations such as amputation. However, previous studies have shown this dramatic motor neuron death does not only occur in limb-innervating motor neurons but also occurs in other spinal cord motor neurons (doi: 10.1006/dbio.1999.9413). In our manuscript, we studied the naturally occurring motor neuron death in the whole spinal cord during the early stage of zebrafish development.
(4) Lines 184-187: Previous publications showed that death of VaP is independent of limitations in muscle innervation area, suggesting it is not coupled to muscle-derived neurotrophic factors.
Lines 328-334: There have been many publications describing appropriate morpholino controls. The authors need to describe their controls and show that they know that the genes they were targeting were downregulated.
For the morpholinos, we did not confirm the downregulation of the target genes. These morpholino-related data are a minor part of our manuscript and shall not affect our major findings. We have removed the neurotrophic factors and morpholino-related data in the revised manuscript.
-
-
52.53.155.43 52.53.155.43
-
eLife Assessment
This study presents a valuable finding on the role of secretory leukocyte protease inhibitors (SLPI) in developing Lyme disease in mice infected with Borrelia burgdorferi. The evidence supporting the claims of the authors is solid, although there are a few concerns that need to be addressed, including patient sample sizes, and the potential contribution of the greater bacterial burden to the enhanced inflammation. This paper would be of interest to scientists in the infectious inflammatory disease field.
-
Reviewer #1 (Public review):
Summary:
This study demonstrates the significant role of secretory leukocyte protease inhibitor (SLPI) in regulating B. burgdorferi-induced periarticular inflammation in mice. They found that SLPI-deficient mice showed significantly higher B. burgdorferi infection burden in ankle joints compared to wild-type controls. This increased infection was accompanied by infiltration of neutrophils and macrophages in periarticular tissues, suggesting SLPI's role in immune regulation. The authors strengthened their findings by demonstrating a direct interaction between SLPI and B. burgdorferi through BASEHIT library screening and FACS analysis. Further investigation of SLPI as a target could lead to valuable clinical applications.
The conclusions of this paper are mostly well supported by data, but two aspects need attention:
(1) Cytokine Analysis:<br /> The serum cytokine/chemokine profile analysis appears without TNF-alpha data. Given TNF-alpha's established role in inflammatory responses, comparing its levels between wild-type and infected B. burgdorferi conditions would provide valuable insight into the inflammatory mechanism.<br /> (2) Sample Size Concerns:<br /> While the authors note limitations in obtaining Lyme disease patient samples, the control group is notably smaller than the patient group. This imbalance should either be addressed by including additional healthy controls or explicitly justified in the methodology section.
-
Reviewer #2 (Public review):
Summary:
This manuscript by Yu and coworkers investigates the potential role of Secretory leukocyte protease inhibitor (SLPI) in Lyme arthritis. They show that, after needle inoculation of the Lyme disease (LD) agent, B. burgdorferi, compared to wild type mice, a SLPI-deficient mouse suffers elevated bacterial burden, joint swelling and inflammation, pro-inflammatory cytokines in the joint, and levels of serum neutrophil elastase (NE). They suggest that SLPI levels of Lyme disease patients are diminished relative to healthy controls. Finally, they find that SLPI may interact directly the B. burgdorferi.
Strengths:
Many of these observations are interesting and the use of SLPI-deficient mice is useful (and has not previously been done).
Weaknesses:
(a) The known role of SLPI in dampening inflammation and inflammatory damage by inhibition of NE makes the enhanced inflammation in the joint of B. burgdorferi-infected mice a predicted result; (b) The potential contribution of the greater bacterial burden to the enhanced inflammation is not addressed; (c) The relationship of SLPI binding by B. burgdorferi to the enhanced disease of SLPI-deficient mice is not clear; and (d) Several methodological aspects of the study are unclear.
-
Reviewer #3 (Public review):
Summary:
The authors investigated the role of secretory leukocyte protease inhibitors (SLPI) in developing Lyme disease in mice infected with Borrelia burgdorferi. Using a combination of histological, gene expression, and flow cytometry analyses, they demonstrated significantly higher bacterial burden and elevated neutrophil and macrophage infiltration in SLPI-deficient mouse ankle joints. Furthermore, they also showed direct interaction of SLPI with B. burgdorferi, which likely depletes the local environment of SLPI and causes excessive protease activity. These results overall suggest ankle tissue inflammation in B. burgdorferi-infected mice is driven by unchecked protease activity.
Strengths:
Utilizing a comprehensive suite of techniques, this is the first study showing the importance of anti-protease-protease balance in the development of periarticular joint inflammation in Lyme disease.
Weaknesses:
Due to the limited sample availability, the authors investigated the serum level of SLPI in both in Lyme arthritis patients and patients with earlier disease manifestations.
-
Author response:
Public Reviews:
Reviewer #1 (Public review):
Summary:
This study demonstrates the significant role of secretory leukocyte protease inhibitor (SLPI) in regulating B. burgdorferi-induced periarticular inflammation in mice. They found that SLPI-deficient mice showed significantly higher B. burgdorferi infection burden in ankle joints compared to wild-type controls. This increased infection was accompanied by infiltration of neutrophils and macrophages in periarticular tissues, suggesting SLPI's role in immune regulation. The authors strengthened their findings by demonstrating a direct interaction between SLPI and B. burgdorferi through BASEHIT library screening and FACS analysis. Further investigation of SLPI as a target could lead to valuable clinical applications.
The conclusions of this paper are mostly well supported by data, but two aspects need attention:
(1) Cytokine Analysis:
The serum cytokine/chemokine profile analysis appears without TNF-alpha data. Given TNF-alpha's established role in inflammatory responses, comparing its levels between wild-type and infected B. burgdorferi conditions would provide valuable insight into the inflammatory mechanism.
(2) Sample Size Concerns:
While the authors note limitations in obtaining Lyme disease patient samples, the control group is notably smaller than the patient group. This imbalance should either be addressed by including additional healthy controls or explicitly justified in the methodology section.
We thank the reviewer for the careful review and positive comments.
(1) We did look into the level of TNF-alpha in both WT and SLPI-/- mice with and without B. burgdorferi infection. At serum level, using ELISA, we did not observe any significant difference between all four groups. At gene expression level, using RT-qPCR on the tibiotarsal tissue, we also did not observe any significant differences. Our RT-qPCR result is consistent with the previous microarray study using the whole murine joint tissue (DOI: 10.4049/jimmunol.177.11.7930). The microarray study did not show significant changes in TNF-alpha level in C57BL/6 mice following B. burgdorferi infection. The above data suggest that TNF-alpha does not involve in SLPI-regulated immune responses in the murine tibiotarsal tissue following B. burgdorferi infection. A brief discussion will be added, and the above data will be provided as a supplemental figure in the revised manuscript.
(2) We agree with the reviewer that the control group is smaller than the patient group. Among the archived samples that are available, the number of adult healthy controls are limited. It has been shown that the serum level of SLPI in healthy volunteers is in average about 40 ng/ml (DOI: 10.3389/fimmu.2019.00664 and 10.1097/00003246-200005000-00003). The median level in the healthy control in our data was 38.92 ng/ml, which is comparable to the previous results. A brief discussion will be added in the revised manuscript.
Reviewer #2 (Public review):
Summary:
This manuscript by Yu and coworkers investigates the potential role of Secretory leukocyte protease inhibitor (SLPI) in Lyme arthritis. They show that, after needle inoculation of the Lyme disease (LD) agent, B. burgdorferi, compared to wild type mice, a SLPI-deficient mouse suffers elevated bacterial burden, joint swelling and inflammation, pro-inflammatory cytokines in the joint, and levels of serum neutrophil elastase (NE). They suggest that SLPI levels of Lyme disease patients are diminished relative to healthy controls. Finally, they find that SLPI may interact directly the B. burgdorferi.
Strengths:
Many of these observations are interesting and the use of SLPI-deficient mice is useful (and has not previously been done).
We appreciate the reviewer’s careful reading and positive comments.
Weaknesses:
(a) The known role of SLPI in dampening inflammation and inflammatory damage by inhibition of NE makes the enhanced inflammation in the joint of B. burgdorferi-infected mice a predicted result;
We agree that the observation of the elevated NE level and the enhanced inflammation is theoretically likely. Indeed, that was the hypothesis that we explored, and often what is theoretically possible does not turn out to occur. In addition, despite the known contribution of neutrophils to the severity of murine Lyme arthritis, the importance of the neutrophil serine proteases and anti-protease has not been specifically studied, and neutrophils secrete many factors. Therefore, our data fill an important gap in the knowledge of murine Lyme arthritis development – and set the stage for the further exploration of this hypothesis in the genesis of human Lyme arthritis.
(b) The potential contribution of the greater bacterial burden to the enhanced inflammation is not addressed;
We agree with the reviewer’s viewpoint that the increased infection burden in the tibiotarsal tissue of the infected SLPI-/- mice could contribute to the enhanced inflammation. A brief discussion of this possibility will be added to the revised manuscript.
(c) The relationship of SLPI binding by B. burgdorferi to the enhanced disease of SLPI-deficient mice is not clear; and
We agree with the reviewer that we have not shown the importance of the SLPI-B. burgdorferi binding in the development of periarticular inflammation. It is an ongoing project in our lab to identify the SLPI binding partner in B. burgdorferi. Our hypothesis is that SLPI could bind and inhibit an unknown B. burgdorferi virulence factor that contributes to murine Lyme arthritis. We will include the above discussion in the revised manuscript.
(d) Several methodological aspects of the study are unclear.
We appreciate the critique and will modify the method session in greater detail in the revised manuscript.
Reviewer #3 (Public review):
Summary:
The authors investigated the role of secretory leukocyte protease inhibitors (SLPI) in developing Lyme disease in mice infected with Borrelia burgdorferi. Using a combination of histological, gene expression, and flow cytometry analyses, they demonstrated significantly higher bacterial burden and elevated neutrophil and macrophage infiltration in SLPI-deficient mouse ankle joints. Furthermore, they also showed direct interaction of SLPI with B. burgdorferi, which likely depletes the local environment of SLPI and causes excessive protease activity. These results overall suggest ankle tissue inflammation in B. burgdorferi-infected mice is driven by unchecked protease activity.
Strengths:
Utilizing a comprehensive suite of techniques, this is the first study showing the importance of anti-protease-protease balance in the development of periarticular joint inflammation in Lyme disease.
We greatly appreciate the reviewer’s careful reading and positive comments.
Weaknesses:
Due to the limited sample availability, the authors investigated the serum level of SLPI in both in Lyme arthritis patients and patients with earlier disease manifestations.
We agree with the reviewer that it would be ideal to have more samples from Lyme arthritis patients. However, among the available archived samples, samples from Lyme arthritis patients are limited. For the samples from patients with single EM, the symptom persisted into 3-4 month after diagnosis, the same timeframe when arthritis is developed. We will add the above discussion in the revised manuscript.
Recommendations for the authors:
Reviewer #1 (Recommendations for the authors):
(1) In Figure 2, for histological scoring, do they have similar n numbers?
In panel B, 20 infected WT mice and 19 infected SLPI-/- mice were examined. In panel D, 13 infected WT and SLPI-/- mice were examined. Without infection, WT and SLPI-/- mice do not develop spontaneous arthritis. Due to the slow breeding of the SLPI-/- mice, a small number of uninfected control animals were used.
(2) In Figure 3, for macrophage population analysis, maybe consider implementing Ly6G-negative gating strategy to prevent neutrophil contamination in macrophage population?
We appreciate reviewer’s suggestion. We will analyze the data using the Ly6G-negative gating strategy and provide the result in a supplemental figure. We will compare the results using the two gating strategies in the revised manuscript.
Reviewer #2 (Recommendations for the authors):
(1) The investigators should address the possibility that much of the enhanced inflammatory features of infected SLPI-deficient mice are simply due to the higher bacterial load in the joint.
We agree with the reviewer’s viewpoint that the increased infection burden in the tibiotarsal tissue of the infected SLPI-/- mice could contribute to the enhanced inflammation. A brief discussion of this possibility will be added to the revised manuscript.
(2) Fig. 1. (A) There is no statistically significant difference in the bacterial load in the heart or skin, in contrast to the tibiotarsal joint. It would be of interest to know whether other tissues that are routinely sampled to assess the bacterial load, such as injection site, knee, and bladder, also harbored increased bacterial load in SLPI-deficient mice. (B) Heart and joint burden were measured at "21-28" days. The two time points should be analyzed separately rather than pooled.
(A) We appreciate the reviewer’s suggestion. We agree that looking into the infection load in other tissues is helpful. However, studies into murine Lyme arthritis have been predominantly focused on tibiotarsal tissue, which displays the most consistent and prominent swelling that’s easy to observe and measure. Thus, we focused on the tibiotarsal joint in our study. (B) We collected the heart and joint tissue approximately 3-week post infection within a 3-day window based on the feasibility and logistics of the laboratory. Using “21-28 d”, we meant to describe between 21-24 days post infection. We apologize for the mislabeling and will correct it in the revised manuscript, stating approximately 3 weeks in the results, and defining approximately 3-weeks as between 21-24 days in the methods.
(3) Fig. 2. (A) The same ambiguity as to the days post-infection as cited above in Point 2B exists in this figure. (B) Panel B: Caliper measurements to assess joint swelling should be utilized rather than visual scoring. (In addition, the legend should make clear that the black circles represent mock-infected mice.)
(A) The histology scoring, and histopathology examination were performed at the same time as heart and joint tissue collection, approximately 3 weeks post infection within a 3-day window based on the feasibility and logistics of the laboratory. We apologize for the mislabeling and will correct it in the revised manuscript. (B) We appreciate the reviewer’s suggestion. However, our extensive experience is that caliper measurement can alter the assessment of swelling by placing pressure on the joints and did not produce consistent results. Double blinded scoring was thus performed. Histopathology examination was performed by an independent pathologist and confirmed the histology score and provided additional measurements.
(4) Fig. 3. (A) See Point 2B. (B) For Panels C-E, uninfected controls are lacking.
We apologize for this omission. Uninfected controls will be provided in the revised manuscript.
(5) Fig. 4. Fig. 4. Some LD subjects were sampled multiple times (5 samples from 3 subjects with Lyme arthritis; 13 samples from 4 subjects with EM), and samples from same individuals apparently are treated as biological replicates in the statistical analysis. In contrast, the 5 healthy controls were each sampled only once.
We agree with the reviewer that the control group is smaller than the patient group. Among the archived samples that are available, the number of adult healthy controls are limited, and sampled once. We used these samples to establish the baseline level of SLPI in the serum. It has been shown that the serum level of SLPI in healthy volunteers is in average about 40 ng/ml (DOI: 10.3389/fimmu.2019.00664 and 10.1097/00003246-200005000-00003). The median level in the healthy control in our data was 38.92 ng/ml, which is comparable to the previous results. A brief discussion will be added in the revised manuscript.
(6) Fig. 5. (A) Panel A: does binding occur when intact bacteria are used? (B) Panels B, C: Were bacteria probed with PI to indicate binding likely to occur to surface? How many biological replicates were performed for each panel? Is "antibody control" a no SLPI control? What is the blue line?
Actively growing B. burgdorferi were collected and used for binding assays. We do not permeabilize the bacteria for flow cytometry. Thus, all the binding detected occurs to the bacterial surface. Three biological replicates were performed for each panel. The antibody control is no SLPI control. For panel D, the bacteria were stained with Hoechst, which shows the morphology of bacteria. We apologize for the missing information. A complete and detailed description of Figure 5 will be provided in the revised manuscript.
(7) Sup Fig. 1. (A) Panel A: Was this experiment performed multiple times? I.e., how many biological replicates? (B) Panel B: Strain should be specified.
The binding assay to B. burgdorferi B31A was performed two times. In panel B, B. burgdorferi B31A3 was used. We apologize for the missing information. A complete and detailed description will be provided in the revised manuscript.
(8) Fig. S2. It is not clear that the condition (20% serum) has any bactericidal activity, so the potential protective activity of SLPI cannot be determined. (Typical serum killing assays in the absence of specific antibody utilized 40% serum.)
In Fig. S2, panel B, the first two bars (without SLPI, with 20% WT anti serum) showed around 40% viability. It indicates that the 20% WT anti serum has bactericidal activity. Serum was collected from B. burgdorferi-infected WT mice at 21 dpi, which should contain polyclonal antibody against B. burgdorferi.
Reviewer #3 (Recommendations for the authors):
It was a pleasure to review! I congratulate the authors on this elegant study. I think the manuscript is very well-written and clearly conveys the research outcomes. I only have minor suggestions to improve the readability of the text.
We greatly appreciate the reviewer’s recognition of our work.
Line 92: Please briefly summarize the key results of the study at the end of the introduction section.
We appreciate the reviewer’s suggestion. A brief summary will be added in the revised manuscript.
Line 108: Why is the inflammation significantly occurred only in ankle joints of SLPI-I mice? Could you please provide a brief explanation?
The inflammation may also happen in other joints the B. burgdorferi infected SLPI-/- mice, which has not been studied. The study into murine Lyme arthritis has been predominantly done in the tibiotarsal tissue, which displays the most prominent swelling that’s easy to observe and measure. Thus, we focused on the tibiotarsal joint in our study.
Line 136: Please also include the gene names in Figure 3.
We apologize for the omission. Gene names will be included in the revised manuscript.
Line 181: Please briefly introduce BASEHIT. Why did you use this tool? What are the benefits?
We appreciate the reviewer’s suggestion. We will provide more background information on BASEHIT in the revised manuscript.
-
-
www.biorxiv.org www.biorxiv.org
-
eLife Assessment
This valuable study investigates how the proteins of the Cdv division system in Metallosphaera sedula archaea sequentially interact with curved membranes in vitro, extending our understanding of this reduced ESCRT-like machinery. While the data support key aspects of protein recruitment and membrane remodeling, missing controls and statistical analysis information, unaddressed discrepancies, and limitations in recapitulating native geometry leave the data incomplete to fully support the proposed conclusions. The work will be of interest to evolutionary and synthetic biologists as membrane biophysicists but would benefit from additional experiments and a more cautious interpretation of results.
-
Reviewer #1 (Public review):
Summary:
The authors aimed to elucidate the recruitment order and assembly of the Cdv proteins during Sulfolobus acidocaldarius archaeal cell division using a bottom-up reconstitution approach. They employed liposome-binding assays, EM, and fluorescence microscopy with in vitro reconstitution in dumbbell-shaped liposomes to explore how CdvA, CdvB, and the homologues of ESCRT-III proteins (CdvB, CdvB1, and CdvB2) interact to form membrane remodeling complexes.<br /> The study sought to reconstitute the Cdv machinery by first analyzing their assembly as two sub-complexes: CdvA:CdvB and CdvB1:CdvB2ΔC. The authors report that CdvA binds lipid membranes only in the presence of CdvB and localizes preferentially to membrane necks. Similarly, the findings on CdvB1:CdvB2ΔC indicate that truncation of CdvB2 facilitates filament formation and enhances curvature sensitivity in interaction with CdvB1. Finally, while the authors reconstitute a quaternary CdvA:CdvB:CdvB1:CdvB2 complex and demonstrate its enrichment at membrane necks, the mechanistic details of how these complexes drive membrane remodeling by subcomplexes removal by the proteasome and/or CdvC remain speculative.<br /> Although the work highlights intriguing similarities with eukaryotic ESCRT-III systems and explores unique archaeal adaptations, the conclusions drawn would benefit from stronger experimental validation and a more comprehensive mechanistic framework.
Strengths:
The study of machinery assembly and its involvement in membrane remodeling, particularly using bottom-up reconstituted in vitro systems, presents significant challenges. This is particularly true for systems like the ESCRT-III complex, which localizes uniquely at the lumen of membrane necks prior to scission. The use of dumbbell-shaped liposomes in this study provides a promising experimental model to investigate ESCRT-III and ESCRT-III-like protein activity at membrane necks.<br /> The authors present intriguing evidence regarding the sequential recruitment of ESCRT-III proteins in crenarchaea-a close relative of eukaryotes. This finding suggests that the hierarchical recruitment characteristic of eukaryotic systems may predate eukaryogenesis, which is a significant and exciting contribution. However, the broader implications of these findings for membrane remodeling mechanisms remain speculative, and the study would benefit from stronger experimental validation and expanded contextualization within the field.
Weaknesses:
This manuscript presents several methodological inconsistencies and lacks key controls to validate its claims. Additionally, there is insufficient information about the number of experimental repetitions, statistical analyses, and a broader discussion of the major findings in the context of open questions in the field.
-
Reviewer #2 (Public review):
Summary:
The Crenarchaeal Cdv division system represents a reduced form of the universal and ubiquitous ESCRT membrane reverse-topology scission machinery, and therefore a prime candidate for synthetic and reconstitution studies. The work here represents a solid extension of previous work in the field, clarifying the order of recruitment of Cdv proteins to curved membranes.
Strengths:
The use of a recently developed approach to produce dumbbell-shaped liposomes (De Franceschi et al. 2022), which allowed the authors to assess recruitment of various Cdv assemblies to curved membranes or membrane necks; reconstitution of a quaternary Cdv complex at a membrane neck.
Weaknesses:
The manuscript is a bit light on quantitative detail, across the various figures, and several key controls are missing (CdvA, B alone to better interpret the co-polymerisation phenotypes and establish the true order of recruitment, for example) - addressing this would make the paper much stronger. The authors could also include in the discussion a short paragraph on implications for our understanding of ESCRT function in other contexts and/or in archaeal evolution, as well as a brief exploration of the possible reasons for the discrepancy between the foci observed in their liposome assays and the large rings observed in cells - to better serve the interests of a broad audience.
-
Reviewer #3 (Public review):
Summary:
In this report, De Franceschi et al. purify components of the Cdv machinery in archaeon M. sedula and probe their interactions with membrane and with one-another in vitro using two main assays - liposome flotation and fluorescent imaging of encapsulated proteins. This has the potential to add to the field by showing how the order of protein recruitment seen in cells is related to the differential capacity of individual proteins to bind membranes when alone or when combined.
Strengths:
Using the floatation assay, they demonstrate that CdvA and CdvB bind liposomes when combined. While CdvB1 also binds liposomes under these conditions, in the floatation assay, CdvB2 lacking its C-terminus is not efficiently recruited to membranes unless CdvAB or CdvB1 are present. The authors then employ a clever liposome assay that generates chained spherical liposomes connected by thin membrane necks, which allows them to accurately control the buffer composition inside and outside of the liposome. With this, they show that all four proteins accumulate in necks of dumbbell-shaped liposomes that mimic the shape of constricting necks in cell division. Taken altogether, these data lead them to propose that Cdv proteins are sequentially recruited to the membrane as has also been suggested by in vivo studies of ESCRT-III dependent cell division in crenarchaea.
Weaknesses:
These experiments provide a good starting point for the in vitro study the interaction of Cdv system components with the membrane and their consecutive recruitment. However, several experimental controls are missing that complicate their ability to draw strong conclusions. Moreover, some results are inconsistent across the two main assays which make the findings difficult to interpret.
(1) Missing controls.
Various protein mixtures are assessed for their membrane-binding properties in different ways. However, it is difficult to interpret the effect of any specific protein combination, when the same experiment is not presented in a way that includes separate tests for all individual components. In this sense, the paper lacks important controls.
For example, Fig 1C is missing the CdvB-only control. The authors remark that CdvB did not polymerise (data not shown) but do not comment on whether it binds membrane in their assays. In the introduction, Samson et al., 2011 is cited as a reference to show that CdvB does not bind membrane. However, here the authors are working with protein from a different organism in a different buffer, using a different membrane composition and a different assay. Given that so many variables are changing, it would be good to present how M. sedula CdvB behaves under these conditions.
Similarly, there is no data showing how CdvB alone or CdvA alone behave in the dumbbell liposome assay. Without these controls, it's impossible to say whether CdvA recruits CdvB or the other way around.
The manuscript would be much stronger if such data could be added.
(2) Some of the discrepancies in the data generated using different assays are not discussed.
The authors show that CdvB2∆C binds membrane and localizes to membrane necks in the dumbbell liposome assay, but no membrane binding is detected in the flotation assay. The discrepancy between these results further highlights the need for CdvB-only and CdvA-only controls.
(3) Validation of the liposome assay.
The experimental setup to create dumbbell-shaped liposomes seems great and is a clever novel approach pioneered by the team. Not only can the authors manipulate liposome shape, they also state that this allows them to accurately control the species present on the inside and outside of the liposome. Interpreting the results of the liposome assay, however, depends on the geometry being correct. To make this clearer, it would seem important to include controls to prove that all the protein imaged at membrane necks lie on the inside of liposomes. In the images in SFig3 there appears to be protein outside of the liposome. It would also be helpful to present data to show test whether the necks are open, as suggested in the paper, by using FRAP or some other related technique.
(4) Quantification of results from the liposome assay.
The paper would be strengthened by the inclusion of more quantitative data relating to the liposome assay. Firstly, only a single field of view is shown for each condition. Because of this, the reader cannot know whether this is a representative image, or an outlier? Can the authors do some quantification of the data to demonstrate this? The line scan profiles in the supplemental figures would be an example of this, but again in these Figures only a single image is analyzed.
We would recommend that the authors present quantitative data to show the extent of co-localization at the necks in each case. They also need a metric to report instances in which protein is not seen at the neck, e.g. CdvB2 but not CdvB1 in Fig2I, which rules out a simple curvature preference for CdvB2 as stated in line 182.
Secondly, the authors state that they see CdvB2∆C recruited to the membrane by CdvB1 (lines 184-187, Fig 2I). However, this simple conclusion is not borne out in the data. Inspecting the CdvB2∆C panels of Fig 2I, Fig3C, and Fig3D, CdvB2∆C signal can be seen at positions which don't colocalize with other proteins. The authors also observe CdvB2∆C localizing to membrane necks by itself (Fig 2E). Therefore, while CdvB1 and CdvB2∆C colocalize in the flotation assay, there is no strong evidence for CdvB2∆C recruitment by CdvB1 in dumbbells. This is further underscored by the observation that in the presented data, all Cdv proteins always appear to localize at dumbbell necks, irrespective of what other components are present inside the liposome. Although one nice control is presented (ZipA), this suggests that more work is required to be sure that the proteins are behaving properly in this assay. For example, if membrane binding surfaces of Cdv proteins are mutated, does this lead to the accumulation of proteins in the bulk of the liposome as expected?
(5) Rings.
The authors should comment on why they never observe large Cdv rings in their experiments. In crenarchaeal cell division, CdvA and CdvB have been observed to form large rings in the middle of the 1 micron cell, before constriction. Only in the later stages of division are the ESCRTs localized to the constricting neck, at a time when CdvA is no longer present in the ring. Therefore, if the in vitro assay used by the authors really recapitulated the biology, one would expect to see large CdvAB rings in Figs 1EF. This is ignored in the model. In the proposed model of ring assembly (line 252), CdvAB ring formation is mentioned, but authors do not discuss the fact that they do not observe CdvAB rings - only foci at membrane necks. The discussion section would benefit from the authors commenting on this.
(6) Stoichiometry
It is not clear why 100% of the visible CdvA and 100% of the the visible CdvB are shifted to the lipid fraction in 1C. Perhaps this is a matter of quantification. Can the authors comment on the stoichiometry here?
(7) Significance of quantification of MBP-tagged filaments.
Authors use tagging and removal of MBP as a convenient, controllable system to trigger polymerisation of various Cdv proteins. However, it is unclear what is the value and significance of reporting the width and length of the short linear filaments that are formed by the MBP-tagged proteins. Presumably they are artefactual assemblies generated by the presence of the tag? Similar Figure 2C doesn't seem a useful addition to the paper.
-
Author response:
We thank the three Reviewers for the extensive evaluation of our work, which was largely positive and constructive. Prompted by their reviews and the many suggestions, we plan to do additional control experiments to add further data in a revised manuscript in order to improve the statistics and quantitation. Furthermore, we plan to expand the discussion. We agree that a more comprehensive mechanistic framework would be welcome but note that the system is a complex multicomponent system which is challenging. We plan to expand the work in future follow-up research.
-
-
www.biorxiv.org www.biorxiv.org
-
eLife Assessment
This important study reveals a role for IκBα in the regulation of embryonic stem cell pluripotency. The solid data in mouse embryonic stem cells include separation of function mutations in IκBα to dissect its non-canonical role as a chromatin regulator and its canonical function as NF-κB inhibitor. The conclusions could be strengthened by including better markers of differentiation status and additional controls or orthogonal approaches.
-
Reviewer #1 (Public review):
Summary:
This study probes the role of the NF-κB inhibitor IκBa in the regulation of pluripotency in mouse embyronic stem cells (mESCs). It follows from previous work that identified a chromatin-specific role for IκBa in the regulation of tissue stem cell differentiation. The work presented here shows that a fraction of IκBa specifically associates with chromatin in pluripotent stem cells. Using three Nfkbia-knockout lines, the authors show that IκBa ablation impairs the exit from pluripotency, with embryonic bodies (an in vitro model of mESC multi-lineage differentiation) still expressing high levels of pluripotency markers after sustained exposure to differentiation signals. The maintenance of aberrant pluripotency gene expression under differentiation conditions is accompanied by pluripotency-associated epigenetic profiles of DNA methylation and histone marks. Using elegant separation of function mutants identified in a separate study, the authors generate versions of IκBa that are either impaired in histone/chromatin binding or NF-κB binding. They show that the provision of the WT IκBa, or the NF-κB-binding mutant can rescue the changes in gene expression driven by loss of IκBa, but the chromatin-binding mutant can not. Thus the study identifies a chromatin-specific, NF-κB-independent role of IκBa as a regulator of exit from pluripotency.
Strengths:
The strengths of the manuscript lie in: (a) the use of several orthogonal assays to support the conclusions on the effects of exit from pluripotency; (b) the use of three independent clonal Nfkbia-KO mESC lines (lacking IκBa), which increase confidence in the conclusions; and (c) the use of separation of function mutants to determine the relative contributions of the chromatin-associated and NF-κB-associated IκBa, which would otherwise be very difficult to unpick.
Weaknesses:
In this reviewer's view, the term "differentiation" is used inappropriately in this manuscript. The data showing aberrant expression of pluripotency markers during embryoid body formation are supported by several lines of evidence and are convincing. However, the authors call the phenotype of Nfkbia-KO cells a "differentiation impairment" while the data on differentiation markers are not shown (beyond the fact that H3K4me1, marking poised enhancers, is reduced in genes underlying GO processes associated with differentiation and organ development). Data on differentiation marker expression from the transcriptomic and embryoid body immunofluorescent experiments, for example, should be at hand without the need to conduct many more experiments and would help to support the conclusions of the study or make them more specific. The lack of probing the differentiation versus pluripotency genes may be a missed opportunity in gaining in-depth understanding of the phenotype associated with loss of the chromatin-associated function of IκBa.
-
Reviewer #2 (Public review):
Summary:
This manuscript investigates the role of IκBα in regulating mouse embryonic stem cell (ESC) pluripotency and differentiation. The authors demonstrate that IκBα knockout impairs the exit from the naïve pluripotent state during embryoid body differentiation. Through mechanistic studies using various mutants, they show that IκBα regulates ESC differentiation through chromatin-related functions, independent of the canonical NF-κB pathway.
Strengths:
The authors nicely investigate the role of IκBα in pluripotency exit, using embryoid body formation and complementing the phenotypic analysis with a number of genome-wide approaches, including transcriptomic, histone marks deposition, and DNA methylation analyses. Moreover, they generate a first-of-its-kind mutant set that allows them to uncouple IκBα's function in chromatin regulation versus its NF-κB-related functions. This work contributes to our understanding of cellular plasticity and development, potentially interesting a broad audience including developmental biologists, chromatin biology researchers, and cell signaling experts.
Weaknesses:<br /> - The study's main limitation is the lack of crucial controls using bona fide naïve cells across key experiments, including DNA methylation analysis, gene expression profiling in embryoid bodies, and histone mark deposition. This omission makes it difficult to evaluate whether the observed changes in IκBα-KO cells truly reflect naïve pluripotency characteristics.<br /> - Several conclusions in the manuscript require a more measured interpretation. The authors should revise their statements regarding the strength of the pluripotency exit block, the extent of hypomethylation, and the global nature of chromatin changes.<br /> - From a methodological perspective, the manuscript would benefit from additional orthogonal approaches to strengthen the knockout findings, which may be influenced by clonal expansion of ES cells.
Overall, this study makes an important contribution to the field. However, the concerns raised regarding controls, data interpretation, and methodology should be addressed to strengthen the manuscript and support the authors' conclusions.
-
Author response:
eLife Assessment
This important study reveals a role for IκBα in the regulation of embryonic stem cell pluripotency. The solid data in mouse embryonic stem cells include separation of function mutations in IκBα to dissect its non-canonical role as a chromatin regulator and its canonical function as NF-κB inhibitor. The conclusions could be strengthened by including better markers of differentiation status and additional controls or orthogonal approaches.
We are thankful to the two reviewers and editors for their kind feedback and for highlighting the impact of NF-kB-independent IkBa function in stabilizing naïve pluripotency.
In order to address reviewer’s comments, we will perform further analysis of differentiation trajectories, as well as a deeper comparison of the epigenetic features in our IkBa-KO mESCs with the Serum/LIF and 2i/LIF conditions. Moreover, we recognize that some sentences need to be modified to soften our conclusions in terms of effects on block in the naïve state or the global epigenetic effects, as the reviewers pointed out.
Public Reviews:
Reviewer #1 (Public review):
Summary:
This study probes the role of the NF-κB inhibitor IκBa in the regulation of pluripotency in mouse embyronic stem cells (mESCs). It follows from previous work that identified a chromatin-specific role for IκBa in the regulation of tissue stem cell differentiation. The work presented here shows that a fraction of IκBa specifically associates with chromatin in pluripotent stem cells. Using three Nfkbia-knockout lines, the authors show that IκBa ablation impairs the exit from pluripotency, with embryonic bodies (an in vitro model of mESC multi-lineage differentiation) still expressing high levels of pluripotency markers after sustained exposure to differentiation signals. The maintenance of aberrant pluripotency gene expression under differentiation conditions is accompanied by pluripotency-associated epigenetic profiles of DNA methylation and histone marks. Using elegant separation of function mutants identified in a separate study, the authors generate versions of IκBa that are either impaired in histone/chromatin binding or NF-κB binding. They show that the provision of the WT IκBa, or the NF-κB-binding mutant can rescue the changes in gene expression driven by loss of IκBa, but the chromatin-binding mutant can not. Thus the study identifies a chromatin-specific, NF-κB-independent role of IκBa as a regulator of exit from pluripotency.
Strengths:
The strengths of the manuscript lie in: (a) the use of several orthogonal assays to support the conclusions on the effects of exit from pluripotency; (b) the use of three independent clonal Nfkbia-KO mESC lines (lacking IκBa), which increase confidence in the conclusions; and (c) the use of separation of function mutants to determine the relative contributions of the chromatin-associated and NF-κB-associated IκBa, which would otherwise be very difficult to unpick.
Weaknesses:
In this reviewer's view, the term "differentiation" is used inappropriately in this manuscript. The data showing aberrant expression of pluripotency markers during embryoid body formation are supported by several lines of evidence and are convincing. However, the authors call the phenotype of Nfkbia-KO cells a "differentiation impairment" while the data on differentiation markers are not shown (beyond the fact that H3K4me1, marking poised enhancers, is reduced in genes underlying GO processes associated with differentiation and organ development). Data on differentiation marker expression from the transcriptomic and embryoid body immunofluorescent experiments, for example, should be at hand without the need to conduct many more experiments and would help to support the conclusions of the study or make them more specific. The lack of probing the differentiation versus pluripotency genes may be a missed opportunity in gaining in-depth understanding of the phenotype associated with loss of the chromatin-associated function of IκBa.
Specific answer to weaknesses for Reviewer 1:
We have data showing the lack of expression of specific differentiation markers that we will add to the manuscript. Moreover, we will also globally analyse differentiation markers in our transcriptomic data to have a more accurate description of the phenotype.
Reviewer #2 (Public review):
Summary:
This manuscript investigates the role of IκBα in regulating mouse embryonic stem cell (ESC) pluripotency and differentiation. The authors demonstrate that IκBα knockout impairs the exit from the naïve pluripotent state during embryoid body differentiation. Through mechanistic studies using various mutants, they show that IκBα regulates ESC differentiation through chromatin-related functions, independent of the canonical NF-κB pathway.
Strengths:
The authors nicely investigate the role of IκBα in pluripotency exit, using embryoid body formation and complementing the phenotypic analysis with a number of genome-wide approaches, including transcriptomic, histone marks deposition, and DNA methylation analyses. Moreover, they generate a first-of-its-kind mutant set that allows them to uncouple IκBα's function in chromatin regulation versus its NF-κB-related functions. This work contributes to our understanding of cellular plasticity and development, potentially interesting a broad audience including developmental biologists, chromatin biology researchers, and cell signaling experts.
Weaknesses:
- The study's main limitation is the lack of crucial controls using bona fide naïve cells across key experiments, including DNA methylation analysis, gene expression profiling in embryoid bodies, and histone mark deposition. This omission makes it difficult to evaluate whether the observed changes in IκBα-KO cells truly reflect naïve pluripotency characteristics.
- Several conclusions in the manuscript require a more measured interpretation. The authors should revise their statements regarding the strength of the pluripotency exit block, the extent of hypomethylation, and the global nature of chromatin changes.
- From a methodological perspective, the manuscript would benefit from additional orthogonal approaches to strengthen the knockout findings, which may be influenced by clonal expansion of ES cells.
Overall, this study makes an important contribution to the field. However, the concerns raised regarding controls, data interpretation, and methodology should be addressed to strengthen the manuscript and support the authors' conclusions.
Specific answer to weaknesses for Reviewer 2:
- As the reviewer pointed out, we have not performed all the analysis by comparing with cells in 2i LIF since our initial study was focused on Serum LIF and differentiation. However, it was the transcriptome analysis in Serum LIF which showed that KO cells resembled naïve ES cells in 2i LIF by GSEA. We have repeated key experiments with all conditions (Figure 1B, 1D, Figure 3C and 3), but we do not think that repeating all ‘omics’ experiments with 2i LIF conditions will add important information. Nevertheless, we will analyze different chromatin data (DNA methylation and different histone post-translational modifications) from previously published works in 2i/LIF and Serum/LIF and compare them with our IκBα-WT and IκBα-KO mESCs to better confirm the stabilization of the ground state pluripotency in IκBα-KO mESCs under Serum/LIF conditions.
- We agree about reducing the strength of the pluripotency exit block, extend of hypomethylation and the global nature of chromatin changes. There are many changes in the chromatin that we are trying to better characterize by HiC in ongoing studies that are out of the scope of this manuscript.
We have performed studies in 3 different IkBa KO and WT clones. In addition, the reconstitution studies with IkBa separation-of-function (SOF) mutants with differential effect after expressing the NFkB binding form (IkBaDChrom) or the chromatin binding form (IkBaDNFkB) also support the robustness of this phenotype.
-
-
www.biorxiv.org www.biorxiv.org
-
eLife Assessment
This paper reports the analysis of coevolutionary patterns and dynamical information for identifying functionally relevant sites. These findings are considered important due to the broad utility of the unified framework and network analysis capable of revealing communities of key residues that go beyond the residue-pair concept. The data is solid, and the results are clearly presented.
-
Reviewer #1 (Public review):
Summary:<br /> As reported above, this paper by Xu et al reports on a new method to combine the analysis of coevolutionary patterns with dynamic profiles to identify functionally important residues and reveal correlations between binding sites.
Strengths:<br /> In general, coevolutionary analysis and MD analysis are carried out separately and while there have been attempts to compare the information provided by the two, no unified framework exists. Here, the authors convincingly demonstrate that integrating signals from Dynamics and coevolution gives information that substantially overcomes the one provided by either method in isolation. While other methods are useful, they do not capture how dynamics is fundamental to define function and thus sculpts coevolution, via the 3D structure of the protein. At the same time, the authors demonstrate how coevolution in turn also influences internal dynamics. The Networks they rebuild unveil information at an even higher level: the model starts pairwise but through network representation the authors arrive to community analysis, reporting on interaction patterns that are larger than simple couples.
Weaknesses:<br /> The authors should<br /> -Make an effort in suggesting/commenting the limits of applicability of their method;<br /> -Expand discussion on how DyNoPy compares to other methods;<br /> -Dynamic is not essential in all systems (structural proteins): The authors may want to comment on possible strategies they would use for other systems where their framework may not be suitable/applicable.
-
Reviewer #2 (Public review):
Summary:<br /> Authors introduced a computational framework, DyNoPy, that integrates residue coevolution analysis with molecular dynamics (MD) simulations to identify functionally important residues in proteins. DyNoPy identifies key residues and residue-residue coupling to generate an interaction graph and attempts to validate using two clinically relevant β-lactamases (SHV-1 and PDC-3).
Strengths:<br /> DyNoPy could not only show clinically relevance of mutations but also predict new potential evolutionary mutations. Authors have provided biologically relevant insights into protein dynamics which can have potential applications in drug discovery and understanding molecular evolution.
Weaknesses:<br /> Although DyNoPy could show the relevance of key residues in active and non-active site residues, no experiments have been performed to validate their predictions. In addition, they should compare their method with conventional techniques and show how their method could be different.
An explanation of "communities" divided in the work and how these communities are relevant to the article should be provided. In addition, choice of collective variables and their relevance in residue coupling movement is also not very well explained. Dynamics cross correlation map can also be a good method for understanding the residue movements and can explain the residue-residue coupling, it is not explained how DyNoPy is different from the conventional methods or can perform better.
In the sentence "DyNoPy identified eight significant communities of strongly coupled residues within SHV-1 (Supporting Fig. S4A)" I could not find a clear description of eight significant communities.
Again the description of communities is not clear to me in the following sentence "Detailed description of the other three communities is provided in the supporting information (Fig. S6)."
In the sentence "N170 acts as an intermediary between N136 and E166". Kindly cite the reference figure to show N179 as intermediate residue.
Please be careful with the numbers. In the sentence "These residues not only interact with each other directly but are also indirectly coupled via 21 other residues." I could count 22 other residues and not 21.
In the sentence "Unlike other substitution sites that are adjacent to the active site, R205 is situated more than 16 Å away from catalytic serine S70". Please add this label somewhere in the figure.
Please cite a reference in the sentence "This indicates that mutations on G238 would result in an alteration on protein catalytic function, as well as an increased flexibility of the protein, which strongly aligns with previous finding."
-
Reviewer #3 (Public review):
Summary:<br /> In this paper, Xu, Dantu and coworkers report a protocol for analyzing coevolutionary and dynamical information to identify a subset of communities that capture functionally relevant sites in beta-lactamases.
Strengths:<br /> The combination of coevolutionary information and metrics from MD simulations is interesting for capturing functionally relevant sites, which can have implications in the fields of drug discovery but also in protein design.
Weaknesses:<br /> The combination of coevolutionary information and metrics from MD simulations is not new as other protocols have been proposed along the years (the current version of the paper neglects some of them, see below), and there are a few parameters of the protocol that, in my opinion, should be better analyzed and discussed.
(1) As mentioned, the introduction of the paper lacks some important publications in the field of using graph theory to represent important interaction networks extracted from MD simulations (DOI: 10.1002/pro.4911), and also combining MD data with MSA to identify functionally relevant sites for enzyme design (doi: 10.1021/acscatal.4c04587, 10.1093/protein/gzae005).<br /> (2) The matrix used to apply graph theory (J_ij) is built from summing the scaled coevolution and degree of correlation values. The alpha and beta weights are defined, and the authors mention that alpha is set to 0.5, thus beta as well to fulfil with the alpha + beta = 1. Why a value of 0.5 has been selected? How this affects the overall results and conclusions extracted? The finding that many catalytically relevant residues are identified in the communities is not surprising given that such sites usually present a high conservation score.<br /> (3) Another important point that needs further explanation is the selection of the relevant descriptor of protein dynamics. In this study two different strategies have been used (one more global the other more local), but more details should be provided regarding their choice. What is the best strategy according to the authors? Why not using the same strategy for both related systems? The obtained results using one methodology or the other will have a large impact on the dynamical score. Another related point is: what is the impact of the MD simulation length, how the MSA is generated and number of sequences used for MSA construction?
-
-
www.biorxiv.org www.biorxiv.org
-
eLife Assessment
Based on the perceived low efficacy of current therapies targeted to FGFR2 in gastric cancer (GC), the authors investigate an approach which combines SHP2 inhibition with existing FGFR2 inhibitors. The data were largely collected and analysed using solid and validated methodology. There is some useful data regarding combination therapy in a new clinical cohort, which supports previous studies that have reported the potential of targeting RTKs together with phosphatases.
-
Reviewer #1 (Public review):
The manuscript entitled "Blocking SHP2 1 benefits FGFR2 inhibitor and overcomes its resistance in 2 FGFR2-amplified gastric cancer" by Zhang, et al., reports that FGFR2 was amplification in 6.2% (10/161) of gastric cancer samples and that dual blocking SHP2 and FGFR2 enhanced the effects of FGFR2 inhibitor (FGFR2i) in FGFR2-amplified GC both in vitro and in vivo via suppressing RAS/ERK and PI3K/AKT pathways. Furthermore, the authors also showed that SHP2 blockade suppressed PD-1 expression and promoted IFN-γ secretion of CD8+ 46 T cells, enhancing the cytotoxic functions of T cells. Thus, the authors concluded that dual blocking SHP2 and FGFR2 is a compelling strategy for treatment of FGFR2-amplified gastric cancer. Although the finding is interesting, the finding that FGFR2 is amplified in gastric cancer and that FGFR inhibitors have some effect on treating gastric cancer is not novel. The data quality is not high, and the effects of double inhibitions are not significant. It appears that the conclusions are largely overstatement, the supporting data is weak and not compelling.
The data in Figure 1 is not novel, similar data has been reported elsewhere.
It is unclear why the two panels in Fig 2a and 2b can not be integrated into one panel, which will make it easier to compare the activities.
The synergetic effects of azd4547 and shp099 are not significant in Fig 2e and 2f, as well as in Fig. 3g and fig. 4f
Data in Fig. 5 is weak and can be removed. It is unclear why FGFR inhibitor has some activities toward t cells since t cells do not express FGFR.
-
Reviewer #2 (Public review):
Summary:
This manuscript reports the application of a combined targeted therapeutic approach to gastric cancer treatment. The RTK, FGFR2 and the phosphatase, SHP2 are targeted with existing drugs; AZD457 and SHP099 respectively. Having shown increased mRNA levels of FGFR2 and SHP2 in a patient population and highlighted the issue of resistance to single therapies the combination of inhibitors is shown to reduce cancer-related signalling in two gastric cell lines. The efficacy of the dual therapy is further demonstrated in a single patient case study and mouse xenograft models. Finally, the rationale for SHP2 inhibition is shown to be linked to immune response.
Strengths:
The data is generally well presented and the study invokes a novel patient data set which could have wider value. The study provides additional evidence to support the combined therapeutic approach of RTK and phosphatase inhibition.
Weaknesses:
Combined therapy approaches targeting RTKs and SHP2 have been widely reported. Indeed, SHP099 in combination with FGFR inhibitors has been shown to overcome adaptive resistance in FGFR-driven cancers. Furthermore, the inhibition of SHP2 has been documented to have important implications in both targeting proliferative signalling as well as immune response. Thus, it is difficult to see novelty or a significant scientific advance in this manuscript. Although the data is generally well presented, there is inconsistency in the interpretation of the experimental outcomes from ex vivo, patient and mouse systems investigated. In addition, the study provides only minor or circumstantial understanding of the dual mechanism.
Using data from a 161 patient cohort FGFR2 was identified as displaying amplification of FGFR2 in ~6% with concomitant elevation of mRNA of patients which correlated with PTPN11 (SHP2) mRNA expression. The broader context of this data is of value and could add a different patient demographic to other data on gastric cancer. However, there is no detail on patient stratification or prior therapeutic intervention.
In SNU16 and KATOIII cells the combined therapy is shown to be effective and appears to be correlated with increased apoptotic effects (i.e. not immune response).
Fig 2E suggests that the combined therapy in SNU16 cells is a little better than FGFR2-directed AZD457 inhibitor alone, particularly at the higher dose.
The individual patient case study described via Fig 3 suggests efficacy of the combined therapy (at very high dosage), however, the cell biopsies only show reduced phosphorylation of ERK, but not AKT. This is at odds with the ex vivo cell-based assays. Thus, it is not clear how relevant this study is.
The mouse xenograft study shows a convincing reduction in tumor mass/volume and clear reduction in pAKT, whilst pERK remains largely unaffected by the combined therapeutic approach. This is in conflict with the previous data which seems to show the opposite effect. In all, the impact of the dual therapy is unclear with respect to the two pathways mediated by ERK and AKT.
Finally, the authors demonstrate the impact of SHP2 on PD-1 expression and propose that the SHP099/AZD4547 combination therapy significantly induces the production of IFN-γ in CD8+ T cells. This part of the study is unconvincing and would benefit from the investigation of the tumor micro-environment to assess T cell infiltration.
-
Reviewer #3 (Public review):
Summary:
Fibroblast growth factor receptor 2 (FGFR2) is a receptor tyrosine kinase that can be amplified in gastric cancer and serves as a potential therapeutic target for this patient population. However, targeting FGFR2 has shown limited efficacy. Thus, this study seeks to identify additional molecules that can be effectively targeted in FGFR2 amplified gastric cancer, with a focus on Src homology region 2-containing protein tyrosine phosphatase 2 (SHP2). The authors first demonstrate that 6% of gastric cancer patients in a cohort of human patient samples exhibit FGFR2 amplification. Furthermore, they demonstrate that FGFR2 mRNA expression is positively correlated with PTPN11 gene expression (which is the gene that encodes the SHP2 protein). Using human gastric cancer cell lines with amplified FGFR2, the authors then test the effects of combining the FGFR inhibitor AZD4547 with the SHP2 inhibitor SHP099 on tumor cell death and signaling molecules. They demonstrate that combining the two inhibitors is more effective at tumor cell killing and reducing activation of downstream signaling pathways than either inhibitor alone. In further studies, the authors obtained gastric cancer cells with FGFR2 amplification from a patient that was treated with FGFR2 inhibitor. While this patient initially showed a partial response, the patient ultimately progressed, demonstrating resistance to FGFR2 inhibition. Following isolation of tumor cells from the patient's ascites, the authors demonstrate that these cells are sensitive to the combination treatment of AZD4547 and SHP099. Further studies were performed using a xenograft model using athymic nude mice in which the combination of SHP099 and AZD4547 were found to reduce tumor growth more significantly than either treatment alone. Finally, the authors demonstrate using an in vitro culture model that this combination treatment enhances T cell mediated cytotoxicity. The authors conclude that targeting FGFR2 and SHP2 represents a potential combination strategy in gastric patients with FGFR2 amplification.
Strengths:
The authors demonstrate that FGFR2 amplification positively correlates with PTPN11 in human gastric cancer samples, providing rationale for combination therapies. Furthermore, convincing data are provided demonstrating that targeting both FGFR and SHP2 is more effective than targeting either pathway alone using in vitro and in vivo models. The use of cells derived from a gastric cancer patient that progressed following treatment with an FGFR inhibitor is also a strength. The findings from this study support the conclusion that SHP2 inhibitors enhance the efficacy of FGFR-targeted therapies in cancer patients. This study also suggests that targeting SHP2 may also be an effective strategy for targeting cancers that are resistant to FGFR-targeted therapies.
Weaknesses:
The main caveat with these studies is the lack of an immune competent model with which to test the finding that this combination therapy enhances T cell cytotoxicity in vivo. Discussing this limitation within the context of these findings and future directions for this work, particularly since the combination therapy appears to work quite well without the presence of T cells in the environment, would be beneficial.
-
-
www.biorxiv.org www.biorxiv.org
-
eLife Assessment
In this manuscript, the authors present useful findings demonstrating that the RNA modification enzyme Mettl5 regulates sleep in Drosophila. Through transcriptome- and proteome-wide analyses, the authors identified downstream targets affected in heterozygous mutants and proposed that Mettl5 regulates the translation and degradation of clock genes to maintain normal sleep function. However, the mechanisms by which Mettl5 achieves these functions, and whether they are direct or indirect, remain incomplete and would benefit from further analysis.
-
Reviewer #1 (Public review):
Summary:
Here the authors attempted to test whether the function of Mettl5 in sleep regulation was conserved in drosophila, and if so, by which molecular mechanisms. To do so they performed sleep analysis, as well as RNA-seq and ribo-seq in order to identify the downstream targets. They found that the loss of one copy of Mettl5 affects sleep and that its catalytic activity is important for this function. Transcriptional and proteomic analyses show that multiple pathways were altered, including the clock signaling pathway and the proteasome. Based on these changes the authors propose that Mettl5 modulate sleep through regulation of the clock genes, both at the level of their production and degradation.
Strengths:
The phenotypical consequence of the loss of one copy of Mettl5 on sleep function is clear and well-documented.
Weaknesses:
The imaging and molecular parts are less convincing.<br /> - The colocalization of Mettl5 with glial and neuronal cells is not very clear<br /> - The section on gene ontology analysis is long and confusing<br /> - Among all the pathways affected the focus on proteosome sounds like cherry picking. And there is no experiment demonstrating its impact in the Mettl5 phenotype<br /> - The ribo seq shows some changes at the level of translation efficiency but there is no connection with the Mettl5 phenotypes. In other words, how the increased usage of some codons impact clock signalling. Are the genes enriched for these codons?<br /> - A few papers already demonstrated the role of Mettl5 in translation, even at the structural level (Rong et al, Cell reports 2020) and this was not commented by the authors. In Peng et al, 2022 the authors show that the m6A bridges the 18S rRNA with RPL24. Is this conserved in Drosophila?<br /> - The text will require strong editing and the authors should check and review extensively for improvements to the use of English.
Conclusion
Despite the effort to identify the underlying molecular defects following the loss of Mettl5 the authors felt short in doing so. Some of the results are over-interpreted and more experiments will be needed to understand how Mettl5 controls the translation of its targets. References to previous works was poorly commented.
-
Reviewer #2 (Public review):
Summary:
The authors define the m6A methyltransferase Mettl5 as a novel sleep-regulatory gene that contributes to specific aspects of Drosophila sleep behaviors (i.e., sleep drive and arousal at early night; sleep homeostasis) and propose the possible implication of Mettl5-dependent clocks in this process. The model was primarily based on the assessment of sleep changes upon genetic/transgenic manipulations of Mettl5 expression (including CRISPR-deletion allele); differentially expressed genes between wild-type vs. Mettl5 mutant; and interaction effects of Mettl5 and clock genes on sleep. These findings exemplify how a subclass of m6A modifications (i.e., Mettl5-dependent m6A) and possible epi-transcriptomic control of gene expression could impact animal behaviors.
Strengths:
Comprehensive DEG analyses between control and Mettl5 mutant flies reveal the landscape of Mettl5-dependent gene regulation at both transcriptome and translatome levels. The molecular/genetic features underlying Mettl5-dependent gene expression may provide important clues to molecular substrates for circadian clocks, sleep, and other physiology relevant to Mettl5 function in Drosophila.
Weaknesses:
While these findings indicate the potential implication of Mettl5-dependent gene regulation in circadian clocks and sleep, several key data require substantial improvement and rigor of experimental design and data interpretation for fair conclusions. Weaknesses of this study and possible complications in the original observations include but are not limited to:
(1) Genetic backgrounds in Mettl5 mutants: the heterozygosity of Mettl5 deletion causes sleep suppression at early night and long-period rhythms in circadian behaviors. The transgenic rescue using Gal4/UAS may support the specificity of the Mettl5 effects on sleep. However, it does not necessarily exclude the possibility that the Mettl5 deletion stocks somehow acquired long-period mutation allelic to other clock genes. Additional genetic/transgenic models of Mettl5 (e.g., homozygous or trans-heterozygous mutants of independent Mettl5 alleles; Mettl5 RNAi etc.) can address the background issue and determine 1) whether sleep suppression tightly correlates with long-period rhythms in Mettl5 mutants; and 2) whether Mettl5 effects are actually mapped to circadian pacemaker neurons (e.g., PDF- or tim-positive neurons) to affect circadian behaviors, clock gene expression, and synaptic plasticity in a cell-autonomous manner and thereby regulate sleep. Unfortunately, most experiments in the current study rely on a single genetic model (i.e., Mettl5 heterozygous mutant).
(2) Gene expression and synaptic plasticity: gene expression profiles and the synaptic plasticity should be assessed by multiple time-point analyses since 1) they display high-amplitude oscillations over the 24-h window and 2) any phase-delaying mutation (e.g., Mettl5 deletion) could significantly affect their circadian changes. The current study performed a single time-point assessment of circadian clock/synaptic gene expression, misleading the conclusion for Mettl5 effects. Considering long-period rhythms in Mettl5 mutant clocks, transcriptome/translatome profiles in Mettl5 cannot distinguish between direct vs. indirect targets of Mettl5 (i.e., gene regulation by the loss of Mettl5-dependent m6A vs. by the delayed circadian phase in Mettl5 mutants).
(3) The text description for gene expression profiling and Mettl5-dependent gene regulation was very detailed, yet there is a huge gap between gene expression profiling and sleep/behavioral analyses. The model in Figure 5 should be better addressed and validated.
-
Reviewer #3 (Public review):
Xiaoyu Wu and colleagues examined the potential role in sleep of a Drosophila ribosomal RNA methyltransferase, mettl5. Based on sleep defects reported in CRISPR generated mutants, the authors performed both RNA-seq and Ribo-seq analyses of head tissue from mutants and compared to control animals collected at the same time point. While these data were subjected to a thorough analysis, it was difficult to understand the relative direction of differential expression between the two genotypes. In any case, a major conclusion was that the mutant showed altered expression of circadian clock genes, and that the altered expression of the period gene in particular accounted for the sleep defect reported in the mettl5 mutant. As noted above, a strength of this work is its relevance to a human developmental disorder as well as the transcriptomic and ribosomal profiling of the mutant. However, there are numerous weaknesses in the manuscript, most of which stem from misinterpretation of the findings, some methodological approaches, and also a lack of method detail provided. The authors seemed to have missed a major phenotype associated with the mettl5 mutant, which is that it caused a significant increase in period length, which was apparent even in a light: dark cycle. Thus the effect of the mutant on clock gene expression more likely contributed to this phenotype than any associated with changes in sleep behavior.
-
-
www.biorxiv.org www.biorxiv.org
-
eLife Assessment
This manuscript describes a method using EM polyclonal epitope mapping to help elucidate endogenous antibodies. Overall the work described is interesting and the contribution will be of use to the field that is expected to only increase in impact and value over time. The significance of the work is considered valuable and the strength of evidence to support its findings is considered solid.
-
Reviewer #1 (Public review):
Summary:
The paper addresses the problem of optimising the mapping of serum antibody responses against a known antigen. It uses the croEM analysis of polyclonal Fabs to antibody genes, with the ultimate aim of getting complete and accurate antibody sequences. The method, commonly termed EMPEM, is becoming increasingly used to understand responses in convalescent sera and optimisation of the workflows and provision of openly available tools is of genuine value to a growing number of people.
The authors do not address the experimental aspects of the methods and do not present novel computational tools, rather they use a series of established computational methods to provide workflows that simplify the interpretation of the EM map in terms of the sequences of dominant antibodies.
Strengths:
The paper is well-written and clearly argued. The tests constructed seem appropriate and fair and demonstrate that the workflow works pretty well. For a small subset (~17%) of the EMPEM maps analysed the workflow was able to get convincing assignments of the V-genes.
Weaknesses:
The AI methods used are not a substitute for high quality data and at present very few of the results obtained from EMPEM will be of sufficient quality to robustly assign the sequence of the antibody. However, rather more are likely to be good enough, especially in combination with MS data, to provide a pretty good indication of the V-gene family.
-
Reviewer #2 (Public review):
In this manuscript, the authors seek to demonstrate that it is possible to sequence antibody variable domains from cryoEM reconstructions in combination with bottom-up LC-MSMS. In particular, they extract de novo sequences from single particle-cryo-EM-derived maps of antibodies using the "deep-learning tool ModelAngelo", which are run through the program Stitch to try to select the top scoring V-gene and construct a placeholder sequence for the CDR3 of both the heavy and light chain of the antibody under investigation. These reconstructed variable domains are then used as templates to guide the assembly of de novo peptides from LC-MS/MS data to improve the accuracy of the candidate sequence.
Using this approach the authors claim to have demonstrated that "cryoEM reconstructions of monoclonal antigen-antibody complexes may contain sufficient information to accurately narrow down candidate V-genes and that this can be integrated with proteomics data to improve the accuracy of candidate sequences".
WhiIe the approach is clearly a work in progress, the manuscript should made easier to understand for the general reader. Indeed, I had a hard time understanding the workflow until I got to Fig. 3. So re-ordering the figures, for example, may be helpful in this regard.
It would be useful to provide additional concrete examples where the described workflow would assist in the elucidation of CDR3's, in cases where this isn't already known. (In the benchmark dataset from the Electron Microscopy Data Bank, all the antibodies and Fabs are presumably known, as is the case for the monoclonal antibody CR3022). I am having difficulty envisioning how one would prepare samples from actual plasma samples that would be appropriate for single particle cryo-EM and MS data on dominant antibodies of interest. In my experience, most of these samples tend to be quite complex mixtures. So additional discussion of this point would be helpful.
-
-
www.biorxiv.org www.biorxiv.org
-
eLife Assessment
This fundamental work presents two clinically relevant BMP4 mutations that contribute to vertebrate development. The convincing evidence supports that the site-specific cleavage at the BMP4 pro-domain precisely regulates its function and provides mechanistic insight into how homodimers and heterodimers behave differently. The work will be of broad interest to researchers working on growth factor signaling mechanisms and vertebrate development.
-
Reviewer #1 (Public review):
Summary:
The authors demonstrate that two human preproprotein human mutations in the BMP4 gene cause a defect in proprotein cleavage and BMP4 mature ligand formation, leading to hypomorphic phenotypes in mouse knock-in alleles and in Xenopus embryo assays.
Strengths:
They provide compelling biochemical and in vivo analyses supporting their conclusions, showing the reduced processing of the proprotein and concomitant reduced mature BMP4 ligand protein from impressively mouse embryonic lysates. They perform excellent analysis of the embryo and post-natal phenotypes demonstrating the hypomorphic nature of these alleles. Interesting phenotypic differences between the S91C and E93G mutants are shown with excellent hypotheses for the differences. Their results support that BMP4 heterodimers act predominantly throughout embryogenesis whereas BMP4 homodimers play essential roles at later developmental stages.
Weaknesses:
A control of BMP7 alone in the Xenopus assays seems important to exclude BMP7 homodimer activity in these assays.
The Discussion could be strengthened by more in-depth explanations of how BMP4 homodimer versus heterodimer signaling is supported by the results, so that readers do not have to think it all through themselves. Similarly, a discussion of why the S91C mutant has a stronger phenotype than E93G early in the Discussion would be helpful or least mention that it will be addressed later.
-
Reviewer #2 (Public review):
Summary:
Kim et al. report that two disease mutations in proBMP4, Ser91Cys and Glu93Gly, which disrupt the Ser91 FAM20C phosphorylation site, block the activation of proBMP4 homodimers. Consequently, analysis of DMZ explants from Xenopus embryos expressing the proBMP4 S91C or E93G mutants showed reduced pSmad1 and tbxt1 expression. The block in BMP4 activity caused by the mutations could be overcome by co-expression of BMP7, suggesting that the missense mutations selectively affect the activity of BMP4 homodimers but not BMP4/7 heterodimers. The expert amphibian tissue transplant studies were extended to in vivo studies in Bmp4S91C/+ and Bmp4E93G/+ mice, demonstrating the impact of these mutations on embryonic development, particularly in female mice, in line with patient studies. Finally, studies in MEFs revealed that the mutations did not affect proBMP4 glycosylation or ER-to-Golgi transport but appeared to inhibit the furin-dependent cleavage of proBMP4 to BMP4. Based on these findings and AI (AlphaFold) modeling of proBMP4, the authors speculate that pSer91 influences access of furin to its cleavage site at Arg289AlaLysArg292.
Strengths:
The Xenopus and mouse studies are valuable and elegantly describe the impact of the S91C and E93G disease mutations on BMP signaling and embryonic development.
Weaknesses:
The interpretation of how the mutations may disturb the furin-mediated cleavage of proBMP4 is underdeveloped and does not consider all of their data. Understanding how pS91 influences the furin-dependent cleavage at Arg292 seems to be the crux of this work and thus warrants more consideration. Specifically:
(1) Figure S1 may be significantly more informative than implied. The authors report that BMP4S91D activates pSmad1 only incrementally better than S91C and much less than WT BMP4. However, Fig. S1B does not support the conclusion on page 7 (numbering beginning with title page); "these findings suggest that phosphorylation of S91 is required to generate fully active BMP4 homodimers". The authors rightly note that the S91C change likely has manifold effects beyond inhibiting furin cleavage. The E93G change may also affect proBMP4 beyond disturbing FAM20C phosphorylation. Additional mutation analyses would strengthen the work.
(2) These findings in Figure S1 are potentially significant because they may inform how proBMP4 is protected from cleavage during transit through the TGN and entry into peripheral cellular compartments. Intriguing modeling studies in Figure 6 suggest that pSer91 is proximal to the furin cleavage site. Based on their presentation, pSer91 may contact Arg289, the critical P4 residue at the furin site. If so, might that suggest how pS91 may prevent furin cleavage, thus explaining why the S91D mutation inhibits processing as presented, and possibly how proBMP4 processing is delayed until transit to distal compartments (perhaps activated by a change in the endosomal microenvironment or a Ser91 phosphatase)? Have the authors considered or ruled out these possibilities? In addition to additional mutation analyses of the FAM20C site, moving the discussion of this model to an "Ideas and Speculation" subsection may be warranted.
(3) The lack of an in vitro protease assay to test the effect of the S91 mutations on furin cleavage is problematic.
-
Reviewer #3 (Public review):
Summary:
The authors describe important new biochemical elements in the synthesis of a class of critical developmental signaling molecules, BMP4. They also present a highly detailed description of developmental anomalies in mice bearing known human mutations at these specific elements.
Strengths:
Exceptionally detailed descriptions of pathologies occurring in mutant mice. Novel findings regarding the interaction of propeptide phosphorylation and convertase cleavage, both of which will move the field forward. Provocative hypothesis regarding furin access to cleavage sites, supported by Alphafold predictions.
Weaknesses:
Figure 6A presents two testable models for pre-release access of furin to cleavage sites since physical separation of enzyme from substrate only occurs in one model; could immunocytochemistry resolve?
-
-
www.biorxiv.org www.biorxiv.org
-
eLife Assessment
This useful study introduces the peptidisc-TPP approach as a promising solution to challenges in membrane proteomics, enabling thermal proteome profiling in a detergent-free system. While the concept is innovative and holds significant potential, the demonstration of its utility and validation remains incomplete. The method presents a strong foundation for broader applications in identifying physiologically and pharmacologically relevant membrane protein-ligand interactions.
-
Reviewer #1 (Public review):
Summary:
The idea is appealing, but the authors have not sufficiently demonstrated the utility of this approach.
Strengths:
Novelty of the approach, potential implications for discovering novel interactions
Weaknesses:
The Duong had introduced their highly elegant peptidisc approach several years ago. In this present work, they combine it with thermal proteome profiling (TPP) and attempt to demonstrate the utility of this combination for identifying novel membrane protein-ligand interactions.<br /> While I find this idea intriguing, and the approach potentially useful, I do not feel that the authors had sufficiently demonstrated the utility of this approach.<br /> My main concern is that no novel interactions are identified and validated. For the presentation of any new methodology, I think this is quite necessary.<br /> In addition, except for MsbA, no orthogonal methods are used to support the conclusions, and the authors rely entirely of quantifying rather small differences in abundances using either iBAQ or LFQ.<br /> Furthermore, the reported changes in abundances are solely based on iBAQ or LFQ analysis. This must be supported by a more quantitative approach such as SILAC or labeled peptides<br /> In summary, I think this story requires a stronger and broader demonstration of the ability of peptidisc-TPP to identify novel physiologically/pharmacologically relevant interactions.
-
Reviewer #2 (Public review):
Summary:
The membrane mimetic thermal proteome profiling (MM-TPP) presented by Jandu et al. seems to be a useful way to minimize the interference of detergents in efficient mass spectrometry analysis of membrane proteins. Thermal proteome profiling is a mass spectrometric method that measures binding of a drug to different proteins in a cell lysate by monitoring thermal stabilization of the proteins because of the interaction with the ligands that are being studied. This method has been underexplored for membrane proteome because of the inefficient mass spectrometric detection of membrane proteins and because of the interference from detergents that are used often for membrane protein solubilization.
Strengths:
In this report the binding of ligands to membrane protein targets has been monitored in crude membrane lysates or tissue homogenates exalting the efficacy of the method to detect both intended and off-target binding events in a complex physiologically relevant sample setting.
The manuscript is lucidly written and the data presented seems clear. The only insignificant grammatical error I found was that the 'P' in the word peptidisc is not capitalized in the beginning of the methods section "MM-TPP profiling on membrane proteomes". The clear writing made it easy to understand and evaluate what has been presented. Kudos to the authors.
Weaknesses:
While this is a solid report and a promising tool for analyzing membrane protein drug interactions, addressing some of the minor caveats listed below could make it much more impactful.
The authors claim that MM-TPP is done by "completely circumventing structural perturbations invoked by detergents". This may not be entirely accurate, because before reconstitution of the membrane proteins in peptidisc, the membrane fractions are solubilized by 1% DDM. The solubilization and following centrifugation step lasts at least for 45 min. It is less likely that all the structural perturbations caused by DDM to various membrane proteins and their transient interactions become completely reversed or rescued by peptidisc reconstitution. In the introduction, the authors make statements such as "..it is widely acknowledged that even mild detergents can disrupt protein structures and activities, leading to challenges in accurately identifying drug targets.." and "[peptidisc] libraries are instrumental in capturing and stabilizing IMPs in their functional states while preserving their interactomes and lipid allosteric modulators...'. These need to be rephrased, as it has been shown by countless studies that even with membrane protein suspended in micelles robust ligand binding assays and binding kinetics have been performed leading to physiologically relevant conclusions and identification of protein-protein and protein-ligand interactions.
If the method involves detergent solubilization, for example using 1% DDM, it is a bit disingenuous to argue that 'interactomes and lipid allosteric modulators' characterized by low-affinity interactions will remain intact or can be rescued upon detergent removal. Authors should discuss this or at least highlight the primary caveat of the peptidisc method of membrane protein reconstitution - which is that it begins with detergent solubilization of the proteome and does not completely circumvent structural perturbations invoked by detergents.
It would also be important to test detergents that are even milder than 1% DDM and ones which are harsher than 1% DDM to show that this method of reconstitution can indeed rescue the perturbations to the structure and interactions of the membrane protein done by detergents during solubilization step. Based on the methods provided, it appears that the final amount of detergent in peptidisc membrane protein library was 0.008%, which is ~150 uM. The CMC of DDM depending on the amount of NaCl could be between 120-170 uM. Perhaps, to completely circumvent the perturbations from detergents other methods of detergent-free solubilization such as using SMA polymers and SMALP reconstitution could be explored for a comparison. Moreover, a comparison of the peptidisc reconstitution with detergent-free extraction strategies, such as SMA copolymers, could lend more strength to the presented method.
Cross-verification of the identified interactions, and subsequent stabilization or destabilizations, should be demonstrated by other in vitro methods of thermal stability and ligand binding analysis using purified protein to support the efficacy of the MM-TPP method. An example cross-verification using SDS-PAGE, of the well-studied MsbA, is shown in Figure 2. In a similar fashion, other discussed targets such as, BCS1L, P2RX4, DgkA, Mao-B, and some un-annotated IMPs shown in supplementary figure 3 that display substantial stabilization or destabilization should be cross-verified.
-
-
www.biorxiv.org www.biorxiv.org
-
eLife Assessment
This valuable study addresses a gap in our understanding of how the size of the attentional field is represented within the visual cortex. The evidence supporting the role of visual cortical activity is solid, based on a novel modeling analysis of fMRI data. The results will be of interest to psychologists and cognitive neuroscientists.
-
Reviewer #1 (Public review):
The authors conducted an fMRI study to investigate the neural effects of sustaining attention to areas of different sizes. Participants were instructed to attend to alphanumeric characters arranged in a circular array. The size of attention field was manipulated in four levels, ranging from small (18 deg) to large (162 deg). They used a model-based method to visualize attentional modulation in early visual cortex V1 to V3, and found spatially congruent modulations of the BOLD response, i.e., as the attended area increased in size, the neural modulation also increased in size in the visual cortex. They suggest that this result is a neural manifestation of the zoom-lens model of attention and that the model-based method can effectively reconstruct the neural modulation in the cortical space.
The study is well-designed with sophisticated and comprehensive data analysis. The results are robust and show strong support for a well-known model of spatial attention, the zoom-lens model. Overall, I find the results interesting and useful for the field of visual attention research. I have questions about some aspects of the results and analysis as well as the bigger picture.
(1) It appears that the modulation in V1 is weaker than V2 and V3 (Fig 2). In particular, the width modulation in V1 is not statistically significant (Fig 5). This result seems a bit unexpected. Given the known RF properties of neurons in these areas, in particular, smaller RF in V1, one might expect more spatially sensitive modulation in V1 than V2/V3. Some explanations and discussions would be helpful. Relatedly, one would also naturally wonder if this method can be applied to other extrastriate visual areas such as V4 and what the results look like.
(2) I'm a bit confused about the angular error result. Fig 4 shows that the mean angular error is close to zero, but Fig 5 reports these values to be about 30-40 deg. Why the big discrepancy? Is it due to the latter reporting absolute errors? It seems reporting the overall bias is more useful than absolute value.
(3) A significant effect is reported for amplitude in V3 (line 78), but the graph in Fig 5 shows hardly any difference. Please confirm the finding and also explain the directionality of the effect if there is indeed one.
(4) The purpose of the temporal interval analysis is rather unclear. I assume it has to do with how much data is needed to recover the cortical modulation and hence how dynamic a signal the method can capture. While the results make sense (i.e., more data is better), there is no obvious conclusion and/or interpretation of its meaning.
(5) I think it would be useful for the authors to make a more explicit connection to previous studies in this literature. In particular, two studies seem particularly relevant. First, how do the present results relate to those in Muller et al (2003, reference 37), which also found a zoom-lens type of neural effects. Second, how does the present method compare with spatial encoding model in Sprague & Serences (2013, reference 56), which also reconstructs the neural modulation of spatial attention. More discussions of these studies will help put the current study in the larger context.
(6) Fig 4b, referenced on line 123, does not exist.
-
Reviewer #2 (Public review):
Summary:
The study in question utilizes functional magnetic resonance imaging (fMRI) to dynamically estimate the locus and extent of covert spatial attention from visuocortical activity. The authors aim to address an important gap in our understanding of how the size of the attentional field is represented within the visual cortex. They present a novel paradigm that allows for the estimation of the spatial tuning of the attentional field and demonstrate the ability to reliably recover both the location and width of the attentional field based on BOLD responses.
Strengths:
(1) Innovative Paradigm: The development of a new approach to estimate the spatial tuning of the attentional field is a significant strength of this study. It provides a fresh perspective on how spatial attention modulates visual perception.<br /> (2) Refined fMRI Analysis: The use of fMRI to track the spatial tuning of the attentional field across different visual regions is methodologically rigorous and provides valuable insights into the neural mechanisms underlying attentional modulation.<br /> (3) Clear Presentation: The manuscript is well-organized, and the results are presented clearly, which aids in the reader's comprehension of the complex data and analyses involved.
Weaknesses:
(1) Lack of Neutral Cue Condition: The study does not include a neutral cue condition where the cue width spans 360{degree sign}, which could serve as a valuable baseline for assessing the BOLD response enhancements and diminishments in both attended and non-attended areas.<br /> (2) Clarity on Task Difficulty Ratios: The explicit reasoning for the chosen letter-to-number ratios for various cue widths is not detailed. Ensuring clarity on these ratios is crucial, as it affects the task difficulty and the comparability of behavioral performance across different cue widths. It is essential that observed differences in behavior and BOLD signals are attributable solely to changes in cue width and not confounded by variations in task difficulty.
-
Reviewer #3 (Public review):
Summary:
In this report, the authors tested how manipulating the contiguous set of stimuli on the screen that should be used to guide behavior - that is, the scope of visual spatial attention - impacts the magnitude and profile of well-established attentional enhancements in visual retinotopic cortex. During fMRI scanning, participants attended to a cued section of the screen for blocks of trials and performed a letter vs digit discrimination task at each attended location (and judged whether the majority of characters were letters/digits). Importantly, the visual stimulus was identical across attention conditions, so any observed response modulations are due to top-down task demands rather than visual input. The authors employ population receptive field (pRF) models, which are used to sort voxel activation with respect to the location and scope of spatial attention and fit a Gaussian-like function to the profile of attentional enhancement from each region and condition. The authors find that attending to a broader region of space expands the profile of attentional enhancement across the cortex (with a larger effect in higher visual areas), but does not strongly impact the magnitude of this enhancement, such that each attended stimulus is enhanced to a similar degree. Interestingly, these modulations, overall, mimic changes in response properties caused by changes to the stimulus itself (increase in contrast matching the attended location in the primary experiment). The finding that attentional enhancement primarily broadens, but does not substantially weaken in most regions, is an important addition to our understanding of the impact of distributed attention on neural responses, and will provide meaningful constraints to neural models of attentional enhancement.
Strengths:
- Well-designed manipulations (changing location and scope of spatial attention), and careful retinotopic/pRF mapping, allow for a robust assay of the spatial profile of attentional enhancement, which has not been carefully measured in previous studies<br /> - Results are overall clear, especially concerning width of the spatial region of attentional enhancement, and lack of clear and consistent evidence for reduction in the amplitude of enhancement profile<br /> - Model-fitting to characterize spatial scope of enhancement improves interpretability of findings
Weaknesses:
- Task difficulty seems to vary as a function of spatial scope of attention, with varying ratios of letters/digits across spatial scope conditions, which may complicate interpretations of neural modulation results<br /> - Some aspects of analysis/data sorting are unclear (e.g., how are voxels selected for analyses?)<br /> - While the focus of this report is on modulations of visual cortex responses due to attention, the lack of inclusion of results from other retinotopic areas (e.g. V3AB, hV4, IPS regions like IPS0/1) is a weakness<br /> - Additional analyses comparing model fits across amounts of data analyzed suggest the model fitting procedure is biased, with some parameters (e.g., FWHM, error, gain) scaling with noise.
-
Author response:
We thank the three reviewers for their insightful feedback. We look forward to addressing the raised concerns in a revised version of the manuscript. There were a few common themes among the reviews that we will briefly touch upon now, and we will provide more details in the revised manuscript.
First, the reviewers asked for the reasoning behind the task ratios we implemented for the different attentional width conditions. The different ratios were selected to be as similar as possible given the size and spacing of our stimuli (aside from the narrowest cue width of one bin, the ratios for the others were 0.67, 0.60, and 0.67). As Figure 1b shows, task accuracy showed small and non-monotonic changes across the three larger cue widths, dissociable from the monotonic pattern seen for the model-estimated width of the attentional field. Furthermore, prior work has indicated that there is a relationship between task difficulty and the overall magnitude of the BOLD response, however we don’t suspect that this will influence the width of the modulation. How task difficulty influences the BOLD response is an important topic, and we hope that future work will investigate this relationship more directly.
Second, reviewers expressed interest in the distribution of spatial attention in higher visual areas. In our study we focus only on early visual regions (V1-V3). This was primarily driven by pragmatic considerations, in that we only have retinotopic estimates for our participants in these early visual areas. Our modeling approach is dependent on having access to the population receptive field estimates for all voxels, and while the main experiment was scanned using whole brain coverage, retinotopy was measured in a separate session using a field of view only covering the occipital cortex.
Lastly, we appreciate the opportunity to clarify the purpose of the temporal interval analysis. The reviewer is correct in assuming we set out to test how much data is needed to recover the cortical modulation and how dynamic a signal the method can capture. This analysis does show that more data provided more reliable estimates. The more important finding, however, is that the model was still able to recover the location and width of the attentional cue at shorter timescales of as few as two TRs. This has implications for the potential applicability of our approach to paradigms that involve more dynamic adaptation of the attentional field.
-
-
www.biorxiv.org www.biorxiv.org
-
eLife Assessment
Understanding bacterial growth mechanisms can potentially help uncover novel drug targets that are crucial for maintaining cellular viability, particularly for bacterial pathogens. In this important study, the authors investigate the role of mycobacterial Wag31 in lipid and peptidoglycan biosynthesis. A detailed analysis of Wag31 domain architecture revealed a role in membrane tethering, more specifically, the N-terminal and C-terminal domains appear to display distinct functional roles therein. Whilst the data presented are of use, the experimental evidence is currently incomplete and does not yet fully support the conclusions made.
-
Reviewer #1 (Public review):
This a comprehensive study that sheds light on how Wag31 functions and localises in mycobacterial cells. A clear link to interactions with CL is shown using a combination of microscopy in combination with fusion fluorescent constructs, and lipid specific dyes. Furthermore, studies using mutant versions of Wag31 shed light on the functionalities of each domain in the protein. My concerns/suggestions for the manuscript are minor:
(1) Ln 130. A better clarification/discussion is required here. It is clear that both depletion and overexpression have an effect on levels of various lipids, but subsequent descriptions show that they affect different classes of lipids.<br /> (2) The pulldown assays results are interesting, but links are tentative.<br /> (3) The authors may perhaps like to rephrase claims of effects lipid homeostasis, as my understanding is that lipid localisation rather than catabolism/breakdown is affected.
-
Reviewer #2 (Public review):
Summary:
Kapoor et. al. investigated the role of the mycobacterial protein Wag31 in lipid and peptidoglycan synthesis and sought to delineate the role of the N- and C- terminal domains of Wag31. They demonstrated that modulating Wag31 levels influences lipid homeostasis in M. smegmatis and cardiolipin (CL) localisation in cells. Wag31 was found to preferentially bind CL-containing liposomes, and deleting the N-terminus of the protein significantly decreased this interaction. Novel interactions between Wag31 and proteins involved in lipid metabolism and cell wall synthesis were identified, suggesting that Wag31 recruits proteins to the intracellular membrane domain by direct interaction.
Strengths:
(1) The importance of Wag31 in maintaining lipid homeostasis is supported by several lines of evidence.<br /> (2) The interaction between Wag31 and cardiolipin, and the role of the N-terminus in this interaction was convincingly demonstrated.
Weaknesses:
(1) MS experiments provide some evidence for novel protein-protein interactions, however, the pull-down experiments are lacking a valid negative control.<br /> (2) The role of the N-terminus in the protein-protein interaction has not been ruled out.
-
Reviewer #3 (Public review):
Summary:
This manuscript describes the characterization of mycobacterial cytoskeleton protein Wag31, examining its role in orchestrating protein-lipid and protein-protein interactions essential for mycobacterial survival. The most significant finding is that Wag31, which directs polar elongation and maintains the intracellular membrane domain, was revealed to have membrane tethering capabilities.
Strengths:
The authors provided a detailed analysis of Wag31 domain architecture, revealing distinct functional roles: the N-terminal domain facilitates lipid binding and membrane tethering, while the C-terminal domain mediates protein-protein interactions. Overall, this study offers a robust and new understanding of Wag31 function.
Weaknesses:
The following major concerns should be addressed.
• Authors use 10-N-Nonyl-acridine orange (NAO) as a marker for cardiolipin localization. However, given that NAO is known to bind to various anionic phospholipids, how do the authors know that what they are seeing is specifically visualizing cardiolipin and not a different anionic phospholipid? For example, phosphatidylinositol is another abundant anionic phospholipid in mycobacterial plasma membrane.
• Authors' data show that the N-terminal region of Wag31 is important for membrane tethering. The authors' data also show that the N-terminal region is important for sustaining mycobacterial morphology. However, the authors' statement in Line 256 "These results highlight the importance of tethering for sustaining mycobacterial morphology and survival" requires additional proof. It remains possible that the N-terminal region has another unknown activity, and this yet-unknown activity rather than the membrane tethering activity drives the morphological maintenance. Similarly, the N-terminal region is important for lipid homeostasis, but the statement in Line 270, "the maintenance of lipid homeostasis by Wag31 is a consequence of its tethering activity" requires additional proof. The authors should tone down these overstatements, or provide additional data to support their claims.
• Authors suggest that Wag31 acts as a scaffold for the IMD (Fig. 8). However, Meniche et. al. has shown that MurG as well as GlfT2, two well-characterized IMD proteins, do not colocalize with Wag31 (DivIVA) (https://doi.org/10.1073/pnas.1402158111). IMD proteins are always slightly subpolar while Wag31 is located to the tip of the cell. Therefore, the authors' biochemical data cannot be easily reconciled with microscopic observations in the literature. This raises a question regarding the validity of protein-protein interaction shown in Figure 7. Since this pull-down assay was conducted by mixing E. coli lysate expressing Wag31 and Msm lysate expression Wag31 interactors like MurG, it is possible that the interactions are not direct. Authors should interpret their data more cautiously. If authors cannot provide additional data and sufficient justifications, they should avoid proposing a confusing model like Figure 8 that contradicts published observations.
-
Author response:
Public Reviews:
Reviewer #1 (Public review):
This a comprehensive study that sheds light on how Wag31 functions and localises in mycobacterial cells. A clear link to interactions with CL is shown using a combination of microscopy in combination with fusion fluorescent constructs, and lipid specific dyes. Furthermore, studies using mutant versions of Wag31 shed light on the functionalities of each domain in the protein. My concerns/suggestions for the manuscript are minor:
(1) Ln 130. A better clarification/discussion is required here. It is clear that both depletion and overexpression have an effect on levels of various lipids, but subsequent descriptions show that they affect different classes of lipids.
We thank the reviewer for the comments. We will improve Ln130 in the manuscript. The lipid classes that get impacted by the depletion of Wag31 vs overexpression are different. Wag31 is an adaptor protein that interacts with proteins of the ACCase complex (Meniche et al., 2014; Xu et al., 2014) that synthesize fatty acid precursors and regulate their activity (Habibi Arejan et al., 2022).
The varied response to lipid homeostasis could be attributed to a change in the stoichiometry of these interactions with Wag31. While Wag31 depletion would prevent such interactions from occurring and might affect lipid synthesis that directly depends on Wag31-protein partner interactions, its overexpression would lead to promiscuous interactions and a change in the stoichiometry of native interactions, ultimately modulating lipid synthesis pathways.
(2) The pulldown assays results are interesting, but links are tentative.
The interactome of Wag31 was identified through the immunoprecipitation of Flag-tagged Wag31 complemented at an integrative locus in Wag31 mutant background to avoid overexpression artifacts. We used Msm::gfp expressing an integrative copy (at L5 locus) of FLAG-GFP as a control to subtract non-specific interactions. The experiment was performed in biological triplicates, and interactors that appeared in all replicates were selected for further analysis. Although we identified more than 100 interactors of Wag31, we analyzed only the top 25 hits, with a PSM cut-off ≥18 and unique peptides≥5. Additionally, two of Wag31's established interactors, AccD5 and Rne, were among the top five hits, thus validating our data.
Though we agree that the interactions can either be direct or through a third partner, the fact that we obtained known interactors of Wag31 makes us believe these interactions are genuine. Moreover, we performed pulldown experiments for validation by mixing E. coli lysates expressing His-Wag31 full-length or truncated protein with M. smegmatis lysates expressing FLAG-tagged interacting proteins. The wash conditions used were quite stringent for these pull-down assays—the wash buffer contained 1% Triton X100, eliminating all non-specific and indirect interactions. However, we agree that we cannot conclusively state that the interactions are direct without purifying the proteins and performing the experiment. We will describe this caveat in the revised manuscript.
(3) The authors may perhaps like to rephrase claims of effects lipid homeostasis, as my understanding is that lipid localisation rather than catabolism/breakdown is affected.
In this manuscript, we are trying to convey that Wag31 is a spatiotemporal regulator of lipid metabolism. It is a peripheral protein that is hooked to the membrane via Cardiolipin and forms a scaffold at the poles, which helps localize several enzymes involved in lipid metabolism.
Homeostasis is the process by which an organism maintains a steady-state of balance and stability in response to changes. Depletion of Wag31 not only results in delocalisation of lipids in intracellular lipid inclusions but also leads to changes in the levels of various lipid classes. Advancement in the field of spatial biology underscores the importance of native localization of various biological molecules crucial for maintaining a steady-cell of the cell. Hence, we have used the word “homeostasis” to describe both the changes observed in lipid metabolism.
Reviewer #2 (Public review):
Summary
Kapoor et. al. investigated the role of the mycobacterial protein Wag31 in lipid and peptidoglycan synthesis and sought to delineate the role of the N- and C- terminal domains of Wag31. They demonstrated that modulating Wag31 levels influences lipid homeostasis in M. smegmatis and cardiolipin (CL) localisation in cells. Wag31 was found to preferentially bind CL-containing liposomes, and deleting the N-terminus of the protein significantly decreased this interaction. Novel interactions between Wag31 and proteins involved in lipid metabolism and cell wall synthesis were identified, suggesting that Wag31 recruits proteins to the intracellular membrane domain by direct interaction.
Strengths:
(1) The importance of Wag31 in maintaining lipid homeostasis is supported by several lines of evidence.
(2) The interaction between Wag31 and cardiolipin, and the role of the N-terminus in this interaction was convincingly demonstrated.
Weaknesses:
(1) MS experiments provide some evidence for novel protein-protein interactions. However, the pull-down experiments lack a valid negative control.
We thank the reviewer for the comments. We will include a valid negative control in the experiment. We would choose ~2 mycobacterial proteins that are not a part of our interactome study and perform a similar pull-down experiment with them and a positive control (known interactor of Wag31).
(2) The role of the N-terminus in the protein-protein interaction has not been ruled out.
Previously, we attempted to express the N-terminal (1-60 aa) and the C-terminal (60-212 aa) proteins in various mycobacterial shuttle vectors to perform MS/MS experiments. Despite numerous efforts, neither was expressed with the N/C-terminal FLAG tag nor without any tag in episomal or integrative vectors due to the instability of the protein. Eventually, we successfully expressed the C-terminal Wag31 with an N and C-terminal hexa-His tag. However, this expression was not sufficient or stable enough for us to perform Ni affinity pull-down experiments for mass spectrometry. The N-terminal of Wag31 could not be expressed in M. smegmatis even with N and C-terminal Hexa-His tags.
To rule out the role of the N-terminal in mediating protein-protein interactions, we plan to attempt to express N-terminal of Wag31with N and C-terminal hexa-His tag in E. coli. If this clone successfully expresses in E. coli, we will perform pull-down experiments as described in Figure 7.
Reviewer #3 (Public review):
Summary:
This manuscript describes the characterization of mycobacterial cytoskeleton protein Wag31, examining its role in orchestrating protein-lipid and protein-protein interactions essential for mycobacterial survival. The most significant finding is that Wag31, which directs polar elongation and maintains the intracellular membrane domain, was revealed to have membrane tethering capabilities.
Strengths:
The authors provided a detailed analysis of Wag31 domain architecture, revealing distinct functional roles: the N-terminal domain facilitates lipid binding and membrane tethering, while the C-terminal domain mediates protein-protein interactions. Overall, this study offers a robust and new understanding of Wag31 function.
Weaknesses:
The following major concerns should be addressed.
• Authors use 10-N-Nonyl-acridine orange (NAO) as a marker for cardiolipin localization. However, given that NAO is known to bind to various anionic phospholipids, how do the authors know that what they are seeing is specifically visualizing cardiolipin and not a different anionic phospholipid? For example, phosphatidylinositol is another abundant anionic phospholipid in mycobacterial plasma membrane.
We thank the reviewer for the comments. Despite its promiscuous binding to other anionic phospholipids, 10-N-Nonyl-acridine orange is widely used to stain Cardiolipin and determine its localisation in bacterial cells and mitochondria of eukaryotes (Garcia Fernandez et al., 2004; Mileykovskaya & Dowhan, 2000; Renner & Weibel, 2011). This is because it has a stronger affinity for Cardiolipin than other anionic phospholipids with the affinity constant being 2 × 10<sup>6</sup> M<sup>−1</sup> for Cardiolipin association and 7 × 10<sup>4</sup> M<sup>−1</sup> for that of phosphatidylserine and phosphatidylinositol association (Petit et al., 1992). Additionally, there is not yet another stain available for detecting Cardiolipin. Our protein-lipid binding assays suggest that Wag31 preferentially binds to Cardiolipin over other anionic phospholipids (Fig. 4b), hence it is likely that the majority of redistribution of NAO fluorescence that we observe might be contributed by Cardiolipin mislocalization due to altered Wag31 levels, with smaller degree of NAO redistribution intensity coming indirectly from other anionic phospholipids displaced from the membrane due to the loss of membrane integrity and cell shape changes due to Wag31.
• Authors' data show that the N-terminal region of Wag31 is important for membrane tethering. The authors' data also show that the N-terminal region is important for sustaining mycobacterial morphology. However, the authors' statement in Line 256 "These results highlight the importance of tethering for sustaining mycobacterial morphology and survival" requires additional proof. It remains possible that the N-terminal region has another unknown activity, and this yet-unknown activity rather than the membrane tethering activity drives the morphological maintenance. Similarly, the N-terminal region is important for lipid homeostasis, but the statement in Line 270, "the maintenance of lipid homeostasis by Wag31 is a consequence of its tethering activity" requires additional proof. The authors should tone down these overstatements or provide additional data to support their claims.
We agree with the reviewer that there exists a possibility for another function of the N-terminal that may contribute to sustaining mycobacterial physiology and survival. We would revise our statements in the paper to accurately reflect the data. Results shown suggest that the tethering activity of the N-terminal region may contribute to mycobacterial morphology and survival. However, additional functions of this region can’t be ruled out. Similarly, the maintenance of lipid homeostasis by Wag31 may be associated with its tethering activity, although other mechanisms could also contribute to this process.
• Authors suggest that Wag31 acts as a scaffold for the IMD (Fig. 8). However, Meniche et. al. has shown that MurG as well as GlfT2, two well-characterized IMD proteins, do not colocalize with Wag31 (DivIVA) (https://doi.org/10.1073/pnas.1402158111). IMD proteins are always slightly subpolar while Wag31 is located to the tip of the cell. Therefore, the authors' biochemical data cannot be easily reconciled with microscopic observations in the literature. This raises a question regarding the validity of protein-protein interaction shown in Figure 7. Since this pull-down assay was conducted by mixing E. coli lysate expressing Wag31 and Msm lysate expression Wag31 interactors like MurG, it is possible that the interactions are not direct. Authors should interpret their data more cautiously. If authors cannot provide additional data and sufficient justifications, they should avoid proposing a confusing model like Figure 8 that contradicts published observations.
In the literature, MurG and GlfT2 have been shown to have polar localization (Freeman et al., 2023; Hayashi et al., 2016; Kado et al., 2023), and two groups have shown slightly sub-polar localization of MurG (García-Heredia et al., 2021; Meniche et al., 2014). Additionally, (Freeman et al., 2023) they showed SepIVA to be a spatio-temporal regulator of MurG. MS/MS analysis of Wag31 immunoprecipitation data yielded both MurG and SepIVA to be interactors of Wag31 (Fig. 3). Given Wag31 also displays polar localisation, it likely associates with the polar MurG. However, since a sub-polar localization of MurG has also been reported, it is possible that they do not interact directly, and another protein mediates their interaction. We will modify the model proposed in Fig. 8 based on the above.
We agree that for validation of interaction, we performed pulldown experiments by mixing E. coli lysates expressing His-Wag31 full-length or truncated protein with M. smegmatis lysates expressing FLAG-tagged interacting proteins. The wash conditions used were quite stringent for these pull-down assays—the wash buffer containing 1% Triton X100, which eliminates all non-specific and indirect interactions. However, we agree that we cannot conclusively state that the interactions are direct without purifying the proteins and performing the experiment. We will describe this caveat in the revised manuscript and propose a model reflecting our results.
References:
Freeman, A. H., Tembiwa, K., Brenner, J. R., Chase, M. R., Fortune, S. M., Morita, Y. S., & Boutte, C. C. (2023). Arginine methylation sites on SepIVA help balance elongation and septation in Mycobacterium smegmatis. Mol Microbiol, 119(2), 208-223. https://doi.org/10.1111/mmi.15006
Garcia Fernandez, M. I., Ceccarelli, D., & Muscatello, U. (2004). Use of the fluorescent dye 10-N-nonyl acridine orange in quantitative and location assays of cardiolipin: a study on different experimental models. Anal Biochem, 328(2), 174-180. https://doi.org/10.1016/j.ab.2004.01.020
García-Heredia, A., Kado, T., Sein, C. E., Puffal, J., Osman, S. H., Judd, J., Gray, T. A., Morita, Y. S., & Siegrist, M. S. (2021). Membrane-partitioned cell wall synthesis in mycobacteria. eLife, 10. https://doi.org/10.7554/eLife.60263
Habibi Arejan, N., Ensinck, D., Diacovich, L., Patel, P. B., Quintanilla, S. Y., Emami Saleh, A., Gramajo, H., & Boutte, C. C. (2022). Polar protein Wag31 both activates and inhibits cell wall metabolism at the poles and septum. Front Microbiol, 13, 1085918. https://doi.org/10.3389/fmicb.2022.1085918
Hayashi, J. M., Luo, C. Y., Mayfield, J. A., Hsu, T., Fukuda, T., Walfield, A. L., Giffen, S. R., Leszyk, J. D., Baer, C. E., Bennion, O. T., Madduri, A., Shaffer, S. A., Aldridge, B. B., Sassetti, C. M., Sandler, S. J., Kinoshita, T., Moody, D. B., & Morita, Y. S. (2016). Spatially distinct and metabolically active membrane domain in mycobacteria. Proc Natl Acad Sci U S A, 113(19), 5400-5405. https://doi.org/10.1073/pnas.1525165113
Kado, T., Akbary, Z., Motooka, D., Sparks, I. L., Melzer, E. S., Nakamura, S., Rojas, E. R., Morita, Y. S., & Siegrist, M. S. (2023). A cell wall synthase accelerates plasma membrane partitioning in mycobacteria. eLife, 12, e81924. https://doi.org/10.7554/eLife.81924
Meniche, X., Otten, R., Siegrist, M. S., Baer, C. E., Murphy, K. C., Bertozzi, C. R., & Sassetti, C. M. (2014). Subpolar addition of new cell wall is directed by DivIVA in mycobacteria. Proc Natl Acad Sci U S A, 111(31), E3243-3251. https://doi.org/10.1073/pnas.1402158111
Mileykovskaya, E., & Dowhan, W. (2000). Visualization of phospholipid domains in Escherichia coli by using the cardiolipin-specific fluorescent dye 10-N-nonyl acridine orange. J Bacteriol, 182(4), 1172-1175. https://doi.org/10.1128/JB.182.4.1172-1175.2000
Petit, J. M., Maftah, A., Ratinaud, M. H., & Julien, R. (1992). 10N-nonyl acridine orange interacts with cardiolipin and allows the quantification of this phospholipid in isolated mitochondria. Eur J Biochem, 209(1), 267-273. https://doi.org/10.1111/j.1432-1033.1992.tb17285.x
Renner, L. D., & Weibel, D. B. (2011). Cardiolipin microdomains localize to negatively curved regions of Escherichia coli membranes. Proc Natl Acad Sci U S A, 108(15), 6264-6269. https://doi.org/10.1073/pnas.1015757108
Xu, W. X., Zhang, L., Mai, J. T., Peng, R. C., Yang, E. Z., Peng, C., & Wang, H. H. (2014). The Wag31 protein interacts with AccA3 and coordinates cell wall lipid permeability and lipophilic drug resistance in Mycobacterium smegmatis. Biochem Biophys Res Commun, 448(3), 255-260. https://doi.org/10.1016/j.bbrc.2014.04.116
-
-
www.biorxiv.org www.biorxiv.org
-
eLife Assessment
This valuable study combines massively parallel reporter assays and regression analysis to identify sequence features in untranslated regions contributing to the stability of in vitro transcribed mRNA delivered to cells. The strength of evidence presented is solid, although some points about half-life measurements and the relevance of identified sequence features to native transcript stability will inform future discussion surrounding the present study. Taken together, the work will be of interest to a broad swath of colleagues studying post-transcriptional gene regulation and especially to those using massively parallel reporter assays.
-
Reviewer #1 (Public review):
In the manuscript by Su et al., the authors present a massively parallel reporter assay (MPRA) measuring the stability of in vitro transcribed mRNAs carrying wild-type or mutant 5' or 3' UTRs transfected into two different human cell lines. The goal presented at the beginning of the manuscript was to screen for effects of disease-associated point mutations on the stability of the reporter RNAs carrying partial human 5' or 3' UTRs. However, the majority of the manuscript is dedicated to identifying sequence components underlying the differential stability of reporter constructs. This analysis showed that UA dinucleotides are the most predictive feature of RNA stability in both cell lines and both UTRs.
The effect of AU rich elements (AREs) on RNA stability is well established in multiple systems, and the present study confirms this general trend, but points out variability in the consequence of seemingly similar motifs on RNA stability. For example, the authors report that a long stretch of Us has extreme opposite effects on RNA stability depending on whether it is preceded by an A (strongly destabilizing) or followed by an A (strongly stabilizing). While the authors interpretation of a context-dependence of the effect is certainly well-founded, it seems counterintuitive that the preceding or following A would be the (only) determining factor. This points to a generally reductionist approach taken by the authors in the analysis of the data and in their attempt to dissect the contribution of "AU rich sequences" to RNA stability, with a general tendency to reduce the size and complexity of the features (e.g. to dinucleotides). While this certainly increases the statistical power of the analysis due to the number of occurrences of these motifs, it limits the interpretability of the results. How do UA dinucleotides per se contribute to destabilizing the RNA, both in 5' and 3' UTRs, but (according to limited data presented) not in coding sequences? What is the mechanism? RBPs binding to UA dinucleotide containing sequences are suggested to "mask" the destabilizing effect, thereby leading to a more stable RNA. Gain of UA dinucleotides is reported to have a destabilizing effect, but again no hypothesis is provided as to the underlying molecular mechanism. In addition to reducing the motif length to dinucleotides, the notion of "context dependence" is used in a very narrow sense.
The present MPRA measures the effect of UTR sequences in one specific reporter context and using one experimental approach (following the decay of in vitro transcribed and transfected RNAs). While this method certainly has its merits compared to other approaches, it also comes with some caveats: RNA is delivered naked, without bound RBPs and no nuclear history, e.g. of splicing (no EJCs), editing and modifications. Therefore, it remains to be seen whether UA dinucleotide frequency is a substantial factor in determining the half-lives of endogenous mRNAs.
The authors conclude their study with a meta-analysis of genes with increased UA dinucleotides in 5' and 3'UTRs, showing that specific functional groups are overrepresented among these genes. In addition, they provide evidence for an effect of disease-associated UTR mutations on endogenous RNA stability. While these elements link back to the original motivation of the study (screening for effects of point mutations in 5' and 3' UTRs), they provide only a limited amount of additional insights.
In summary, this manuscript presents an interesting addition to the long-standing attempts at dissecting the sequence basis of RNA stability in human cells. The analysis is in general comprehensive and sound; however, it remains unclear to what extent the findings can be generalized beyond the method and the experimental system used here.
Comments on revisions:
Parts of my original comments have been adequately addressed by the reviewers.<br /> After reading the revised manuscript and the rebuttal, my main concern is related to the figure comparing the half-lives as measured in the two different cell lines that was included in the response to reviewer 2, but not in the revised manuscript. The complete lack of correlation between the half-lives of the 3'UTR library measured in the two cell lines is concerning. While variability and cell type-specific effects can be expected, some principles should be the same (such as the effect of UA dinucleotides that the authors report), leading to at least some correlation.<br /> In addition, it is unclear to me why the half-lives measured for the two libraries in HEK cells are shifted (median ln(t 1/2)=6-7 for the 5'UTR library and ln(t 1/2)=4-4.5 for the 3'UTR library), but not in SH.
I feel that this figure contains important information that should be included in the final manuscript.
-
Reviewer #2 (Public review):
Summary of goals:
Untranslated regions are key cis-regulatory elements that control mRNA stability, translation, and translocation. Through interactions with small RNAs and RNA binding proteins, UTRs form complex transcriptional circuitry that allows cells to fine-tune gene expression. Functional annotation of UTR variants has been very limited, and improvements could offer insights into disease relevant regulatory mechanisms. The goals were to advance our understanding of the determinants of UTR regulatory elements and characterize the effects of a set of "disease-relevant" UTR variants.
Strengths:
The use of a massively parallel reporter assay allowed for analysis of a substantial set (6,555 pairs) of 5' and 3' UTR fragments compiled from known disease associated variants. Two cell types were used.
The findings confirm previous work about the importance of AREs, which helps show validity and adds some detailed comparisons of specific AU-rich motif effects in these two cell types.
Using a Lasso regression, TA-dinucleotide content is identified as a strong regulator of RNA stability in a context dependent manner based on GC content and presence of RNA binding protein binding motifs. The findings have potential importance, drawing attention to a UTR feature that is not well characterized.
The use of complementary datasets, including from half-life analyses of RNAs and from random sequence library MRPA's, is a useful addition and supports several important findings. The finding the TA dinucleotides have explanatory power separate from (and in some cases interacting with) GC content is valuable.
The functional enrichment analysis suggests some new ideas about how UTRs may contribute to regulation of certain classes of genes.
Weaknesses:
In this section, original reviewer comments about the initial submission and the responses of the authors are listed together with new reviewer responses to the authors:
Reviewer original comment 1: It is difficult to understand how the calculations for half-life were performed. The sequencing approach measures the relative frequency of each sequence at each time point (less stable sequences become relatively less frequent after time 0, whereas more stable sequences become relatively more frequent after time 0). Since there is no discussion of whether the abundance of the transfected RNA population is referenced to some external standard (e.g., housekeeping RNAs), it is not clear how absolute (rather than relative) half-lives were determined.
Author response: [The authors showed the equations used to calculate half lives based on read counts.] They stated that "The absolute abundance was not required for the half-life calculation."
Reviewer response to authors: The methods section states that DESeq2 was used to normalize read counts. DESeq2 normalization assumes that levels of most RNAs are not different between samples. That assumption is not valid here, since RNAs in the library are introduced into cells at time 0 and all RNAs decrease over time. If DESeq2 is applied without modification to normalize across timepoints, normalized reads from less stable RNAs will decrease over time (as expected) but normalized reads from more stable RNAs will increase. Can the authors please clarify in the methods how the read counts were normalized to account for this issue?
Reviewer original comment 2: Fig. S1A and B are used to assess reproducibility. They show that read counts at a given time point correlate well across replicate experiments. However, this is not a good way to assess reproducibility or accuracy of the measurements of t1/2 are. (The major source of variability in read counts in these plots - especially at early time points - is likely starting abundance of each RNA sequence, not stability.) This creates concerns about how well the method is measuring t1/2. Also creating concern is the observation that many RNAs are associated with half-lives that are much longer than the time points analyzed in the study. For example, based upon Figure S1 and Table S1 correctly, the median t1/2 for the 5' UTR library in HEK cells appears to be >700 minutes. Given that RNA was collected at 30, 75, and 120 minutes, accurate measurements of RNAs with such long half lives would seem to be very difficult.
Author response: ... The calculation of the half-life involves first determining the decay constant 𝜆, which represents a constant rate of decay. Since 𝜆 is a constant, it is possible to accurately calculate it without needing data over the entire decay range. Our experimental design considers this by selecting appropriate time points to ensure a reliable estimation of 𝜆, and thus, the half-life. To determine the most suitable time points, we conducted preliminary experiments using RT-PCR. These experiments indicated that 30, 75, and 120 minutes provided an effective range for capturing the decay dynamics of the transcripts.
Reviewer response to author comments: Based on Fig. S1D, for 3' UTRs in both cell types and for 5' UTRs in SH-SY5Y cells, median t1/2 is in the range of ~30 to 90 minutes (corresponding to ln t1/2 = 3.5 to 4.5). Measuring RNAs at 30, 75, and 120 minutes would therefore be a good choice for these cases, However, median t1/2 in HEK cells appears to be ~600 minutes (corresponding to ln t1/2 ~6.4) for HEK cells. For t1/2 of 600 minutes, RNA levels at the final time point (120 minutes) would be 90% of the those at the first time point (30 minutes), which illustrates why the method would need to be able to reliably capture very small changes in RNA abundance to accurately measure t1/2 for transcripts with half-lives much longer than 120 minutes. As suggested in our original review, this concern could be addressed by showing the correlation of half-lives across replicates for the 5' and 3' UTR libraries in both cell types. Alternatively, the authors could show other measures of reproducibility for the half-life measurements across replicates. This requires no additional experimentation and can be done using the data from replicate runs shown in Fig. S1A and B. We remain concerned that for sequences with very long half-lives, extrapolating the half-life from small changes between 30 and 120 minutes will lead to imprecise measurements.
Reviewer original comment 3: There is no direct comparison of t1/2 between the two cell types studied for the full set of sequences studied. This would be helpful in understanding whether the regulatory effects of UTRs are generally similar across cell lines (as has been shown in some previous studies) or whether there are fundamental differences. The distribution of t1/2's is clearly quite different in the two cell lines, but it is important to know if this reflects generally slow RNA turnover in HEK cells or whether there are a large number of sequence-specific effects on stability between cell lines. A related issue is that it is not clear whether the relatively small number of significant variant effects detected in HEK cells versus SH-SY5Y cells is attributable to real biological differences between cell types or to technical issues (many fewer read counts and much longer half lives in HEK cells).
Author response: For both cell lines, we selected oligonucleotides with R2 > 0.5 and mean squared error (MSE) < 1 for analysis when estimating half-life (λ) by linear regression. This selection criterion was implemented to minimize the effect of experimental noise. After quality control, we selected common UTRs and compared the RNA half-lives of the two cell lines using a scatter plot. The figure below shows that RNA half-lives are quite different between the cell lines, with a moderate similarity observed in the 5' UTRs (R = 0.21), while the correlation in the 3' UTRs is non-significant. Despite the low correlation of mRNA half-life between the two cell lines, UA-dinucleotide and UA-rich sequences consistently emerge as the most significant destabilizing features, suggesting a shared regulatory mechanism across diverse cellular environments.
Reviewer response to author comments: We appreciate that the authors shared this additional analysis of the data. We believe that this is an important finding and that the additional figure showing correlations of half-lives across cell types should be included in the manuscript or supplement. Discussion of this result in the manuscript would also be useful for readers. This result is surprising to us since we would have expected that widely expressed RNA-binding proteins would have led to more similar effects between the two cell types, as previously found using other approaches (e.g., studies of 3' UTR effects in MPRAs). It would also be appropriate to discuss that differences seen between the two cell types indicate that caution is warranted when trying to generalize the results of this study to other cell types.
Reviewer original comment 4 has been addressed adequately in the revised manuscript.
Appraisal and impact:
Reviewer original comment 1: The work adds to existing studies that previously identified sequence features, including AREs and other RNA binding protein motifs, that regulate stability and puts a new emphasis on the role of "TA" (better "UA") dinucleotides. It is not clear how potential problems with the RNA stability measurements discussed above might influence the overall conclusions, which may limit the impact unless these can be addressed.
It is difficult to understand whether the importance of TA dinucleotides is best explained by their occurrence in a related set of longer RBP binding motifs (see Fig 5J, these motifs may be encompassed by the "WWWWWW cluster") or whether some other explanation applies. Further discussion of this would be helpful. Does the LASSO method tend to collapse a more diverse set of longer motifs that are each relatively rare compared to the dinucleotide? It remains unclear whether TA dinucleotides are associated with less stability independent of the presence of the known larger WWWWWWW motif. As noted above, the importance of TA dinucleotides in the HEK experiments appears to be less than is implied in the text.
Author response: To ensure the representativeness of the features entered into the LASSO model, we pre-selected those with an occurrence greater than 10% among all UTRs. There is no evidence to support a preference for dinucleotides by LASSO. To address whether the destabilizing effect of UA dinucleotides is part of the broader WWWWWW motif, we divided UA dinucleotides into two groups: those within the WWWWWW motif and those outside of it. Specifically, we divided UTRs into two categories: 'at least one UA within a WWWWWW motif' and 'no UA within a WWWWWW motif,' and visualized the results using a boxplot. As shown in [figures provided to the reviewers], the destabilizing trend still remains for UA dinucleotides outside of the WWWWWW motif, although the effect appears to be more pronounced when UA is within the WWWWWW motif. This suggests that while UA dinucleotides have a destabilizing effect independently, their impact is amplified when they are part of the broader WWWWWW motif.
Reviewer response to authors: These are useful additional analyses, and we suggest that the additional figure and discussion should be included in the manuscript/supplement so that readers can benefit from them.
Reviewer original comment 2: The inclusion of more than a single cell type is an acknowledgement of the importance of evaluating cell type-specific effects. The work suggests a number of cell type-specific differences, but due to technical issues (especially with the HEK data, as outlined above) and the use of only two cell lines, it is difficult to understand cell type effects from the work.
The inclusion of both 3' and 5' UTR sequences distinguishes this work from most prior studies in the field. Contrasting the effects of these regions on stability is of interest, although the role of these UTRs (especially the 5' UTR) in translational regulation is not assessed here.
Author response: We examined the role of UTR and UTR variants in translation regulation using polysome profiling. By both univariate analysis and an elastic regression model, we identified motifs of short repeated sequences, including SRSF2 binding sites, as mutation hotspots that lead to aberrant translation. Furthermore, these polysome-shifting mutations had a considerable impact on RNA secondary structures, particularly in upstream AUG-containing 5' UTRs. Integrating these features, our model achieved high accuracy (AUROC > 0.8) in predicting polysome-shifting mutations in the test dataset. Additionally, metagene analysis indicated that pathogenic variants were enriched at the upstream open reading frame (uORF) translation start site, suggesting changes in uORF usage underlie the translation deficiencies caused by these mutations. Illustrating this, we demonstrated that a pathogenic mutation in the IRF6 5' UTR suppresses translation of the primary open reading frame by creating a uORF. Remarkably, site-directed ADAR editing of the mutant mRNA rescued this translation deficiency. Because the regulation of translation and stability does not converge, we illustrate these two mechanisms in two separate manuscripts (this one and doi.org/10.1101/2024.04.11.589132).
Reviewer response to authors: This is useful context. No further comment.
-
Reviewer #3 (Public review):
Summary:
In their manuscript titled "Multiplexed Assays of Human Disease‐relevant Mutations Reveal UTR Dinucleotide Composition as a Major Determinant of RNA Stability" the authors aim to investigate the effect of sequence variations in 3'UTR and 5'UTRs on the stability of mRNAs in two different human cell lines.
To do so, the authors use a massively parallel reporter assay (MPRA). They transfect cells with a set of mRNA reporters that contain sequence variants in their 3' or 5' UTRs, which were previously reported in human diseases. They follow their clearance from cells over time relative to the matching non-variant sequence. To analyze their results, they define a set of factors (RBP and miRNA binding sites, sequence features, secondary structure etc.) and test their association with differences in mRNA stability. For features with a significant association, they use clustering to select a subset of factors for LASSO regression and identify factors that affect mRNA stability.<br /> They conclude that the TA dinucleotide content of UTRs is the strongest destabilizing sequence feature. Within that context, elevated GC content and protein binding can protect susceptible mRNAs from degradation. They also show that TA dinucleotide content of UTRs affects native mRNA stability and that it is associated with specific functional groups. Finally, they link disease associated sequence variants with differences in mRNA stability of reporters.
Strengths:
(1) This work introduces a different MPRA approach to analyze the effect of genetic variants. While previous works in tissue culture use DNA transfections that require normalization for transcription efficiency, here the mRNA is directly introduced into cells at fixed amounts, allowing a more direct view of the mRNA regulation.
(2) The authors also introduce a unique analysis approach, which takes into account multiple factors that might affect mRNA stability. This approach allows them to identify general sequence features that affect mRNA stability beyond specific genetic variants, and reach important insights on mRNA stability regulation. Indeed, while the conclusions to genetic variants identified in this work are interesting, the main strength of the work involves general effect of sequence features rather than specific variants.
(3) The authors provide adequate support for their claims and validate their analysis using both their reporter data and native genes. For the main feature identified, TA di-nucleotides, they perform follow-up experiments with modified reporters that further strengthen their claims, and also validate the effect on native cellular transcripts (beyond reporters), demonstrating its validity also within native scenarios.
(4) The work provides a broad analysis of mRNA stability, across two mRNA regulatory segments (3'UTR and 5'UTR) and is performed in two separate cell-types. Comparison between two different cell-types is adequate, and the results demonstrate, as expected, the dependence of mRNA stability on the cellular context. Analysis of 3'UTR and 5'UTR regulatory effects also shows interesting differences and similarities between these two regulatory regions.
Weaknesses:
In their revised manuscripts, the authors successfully address many of the weaknesses raised in the original review, including the effect of possible confounding effects, and additional methodology details. Notably, two of the issues raised in the original report, have only been partially addressed in the revision.
(1) The analysis and regression models built in this work are not thoroughly investigated relative to native genes within cells.<br /> While using MPRAs indeed allows to isolate regulatory effects that are less influential in-vivo, the resulting effects still provide some regulatory function in-vivo. The goal of such an analysis would not be to demonstrate the predictive power of the models, or to make any claims regarding using these models to fully explain or predict the stability of native transcripts. Clearly, additional more prominent factors could function in controlling endogenous RNA stability.<br /> Instead, the goal of such an investigation is to simply assess the fraction of in-vivo regulation that the factors identified in this work contribute in native contexts, and what is the relative contribution of the phenomena captured by the well-controlled MPRA study.<br /> This reviewer believes that even if the effects identified by the current MPRA study only contribute a small fraction of in-vivo variation, an analysis that aim to estimate what this fraction is, will be very relevant to this study for several reasons. First, in order to appreciate the results of this study within their in-vivo context. Second, in light of the questions raised as motivation for this study, and particularly the need to identify the effect of disease-associated 3'UTR variants, which clearly have an in-vivo effect.
(2) Methodology validation can be performed with simulated data (generated in-silico by the authors) to provide an independent support for the ability of the current methodology to correctly extract regulatory effects from the data.
-
Author response:
The following is the authors’ response to the original reviews.
Public Reviews:
Reviewer #1 (Public Review):
In the manuscript by Su et al., the authors present a massively parallel reporter assay (MPRA) measuring the stability of in vitro transcribed mRNAs carrying wild-type or mutant 5' or 3' UTRs transfected into two different human cell lines. The goal presented at the beginning of the manuscript was to screen for effects of disease-associated point mutations on the stability of the reporter RNAs carrying partial human 5' or 3' UTRs. However, the majority of the manuscript is dedicated to identifying sequence components underlying the differential stability of reporter constructs. This shows that TA dinucleotides are the most predictive feature of RNA stability in both cell lines and both UTRs.
The effect of AU rich elements (AREs) on RNA stability is well established in multiple systems, and the present study confirms this general trend but points out variability in the consequence of seemingly similar motifs on RNA stability. For example, the authors report that a long stretch of Us has extreme opposite effects on RNA stability depending on whether it is preceded by an A (strongly destabilizing) or followed by an A (strongly stabilizing). While the authors interpretation of a context- dependence of the effect is certainly well-founded, it seems counterintuitive that the preceding or following A would be the (only) determining factor. This points to a generally reductionist approach taken by the authors in the analysis of the data and in their attempt to dissect the contribution of "AU rich sequences" to RNA stability, with a general tendency to reduce the size and complexity of the features (e.g. to dinucleotides). While this certainly increases the statistical power of the analysis due to the number of occurrences of these motifs, it limits the interpretability of the results. How do TA dinucleotides per se contribute to destabilizing the RNA, both in 5' and 3' UTRs, but (according to limited data presented) not in coding sequences? What is the mechanism? RBPs binding to TA dinucleotide containing sequences are suggested to "mask" the destabilizing effect, thereby leading to a more stable RNA. Gain of TA dinucleotides is reported to have a destabilizing effect, but again no hypothesis is provided as to the underlying molecular mechanism. In addition to reducing the motif length to dinucleotides, the notion of "context dependence" is used in a very narrow sense; especially when focusing on simple and short motifs, a more extensive analysis of the interdependence of these features (beyond the existing analysis of the relationship between TA- diNTs and GC content) could potentially reveal more of the context dependence underlying the seemingly opposite behavior of very similar motifs.
(We have used UA instead of TA, as per the reviewer's suggestion)
The contribution of coding region sequence to RNA stability has been extensively discussed (For example: doi.org/10.1016/j.molcel.2022.03.032; doi.org/10.1186/s13059-020-02251-5; doi.org/10.15252/embr.201948220; doi.org/10.1371/journal.pone.0228730; doi.org/10.7554/eLife.45396). While UA content at the third codon position (wobble position) has been implicated as a pro-degradation signal, codon optimality has emerged as the most prominent determinant for RNA stability. This indicates that the role of coding regions in RNA stability differs from that of UTRs due to the involvement of translation elongation. We did not intend to suggest that UA-dinucleotides in UTRs and coding regions have the same effect.
To ensure the representativeness of the features entered into the LASSO model, we pre-selected those with an occurrence greater than 10% among all UTRs. As a result, while motifs with very low occurrences were excluded from the analysis, there is no evidence to indicate a preference for dinucleotides by the LASSO model.
We hypothesize that UA-dinucleotide may recruit endonucleases RNase A family, whose catalytic pockets exhibit a strong bias for UA dinucleotide (doi.org/10.1016/j.febslet.2010.04.018). Structures or protein bindings that block this recognition might stabilize RNAs. To gain further insight into the motif interactions, we investigated the interactions between UA and other 15 dinucleotides through more detailed analyses. We conducted a linear regression analysis investigating interactions between UA and the other 15 dinucleotides. The formula used below includes UA:
, where all 𝛽 terms represent the regression coefficients, and
,
, and
represent the number of UA dinucleotides, the number of other dinucleotides (other than UA), and the GC content of the i<sup>th</sup> UTR, respectively, and 𝜖<sub>i</sub> denotes the error term. For each dinucleotide, we tested the significance of 𝛽<sub>UAxGC%</sub> and 𝛽<sub>UAxDiNT</sub>, and compared their p-values using a quantile-quantile (QQ) plot. Author response image 1 shows that the interaction effect of UA dinucleotides with GC% is much more significant than interactions with the other 15 dinucleotides, as indicated by the inflated QQ plot of p-values. This suggests that GC content is a more critical contextual factor influencing UA dinucleotides' impact on RNA stability.
Author response image 1.
The present MPRAs measures the effect of UTR sequences in one specific reporter context and using one experimental approach (following the decay of in vitro transcribed and transfected RNAs). While this approach certainly has its merits compared to other approaches, it also comes with some caveats: RNA is delivered naked, without bound RBPs and no nuclear history, e.g. of splicing (no EJCs), editing and modifications. One way to assess the generalizability of the results as well as the context dependence of the effects is to perform the same analysis on existing datasets of RNA stability measurements obtained through other methods (e.g. transcription inhibition). Are TA dinucleotides universally the most predictive feature of RNA half-lives?
Our system studies the stability control of RNA synthesized in vitro and delivered into human cells. While we did not intend to generalize our conclusions to endogenous RNAs, our approach contributes to the understanding of in vitro synthesized RNA used for cellular expression, such as in vaccines. It is known that endogenous RNAs undergo very different regulation. The most prominent factors controlling endogenous RNA stability are the density of splice junctions and the length of UTRs (doi.org/10.1186/s13059-022-02811-x; doi.org/10.1186/s12915-021-00949-x). To decipher the sequence regulation, these factors are controlled in our experiments. Therefore, we do not expect the dinucleotide features found by our approach to be generalized as the most predictive feature of RNA half-life in vivo.
The authors conclude their study with a meta-analysis of genes with increased TA dinucleotides in 5' and 3'UTRs, showing that specific functional groups are overrepresented among these genes. In addition, they provide evidence for an effect of disease-associated UTR mutations on endogenous RNA stability. While these elements link back to the original motivation of the study (screening for effects of point mutations in 5' and 3' UTRs), they provide only a limited amount of additional insights.
We utilized the Taiwan Biobank to investigate whether mutations significantly affecting RNA stability also impact human biochemical measurements. Our findings indicate that these mutations indeed have a significant effect on various biochemical indices. This highlights the importance of our study, as it bridges basic science with potential applications in precision medicine. By linking specific UTR mutations with measurable changes in biochemical indices, our research underscores the potential for these findings to inform targeted medical interventions in the future.
In summary, this manuscript presents an interesting addition to the long-standing attempts at dissecting the sequence basis of RNA stability in human cells. The analysis is in general very comprehensive and sound; however, at times the goal of the authors to find novelty and specificity in the data overshadows some analyses. One example is the case where the authors try to show that TA-dinucleotides and GC content are decoupled and not merely two sides of the same coin.
They claim that the effect of TA dinucleotides is different between high- and low-GC content contexts but do not control for the fact that low GC-content regions naturally will contain more TA dinucleotides and therefore the effect sizes and the resulting correlation between TA-diNT rate and stability will be stronger (Fig. 5A). A more thorough analysis and greater caution in some of the claims could further improve the credibility of the conclusions.
Low GC content implies a higher UA content but does not directly equate to a high UA-dinucleotide ratio. For instance, the sequence AUUGAACCUU has a lower GC content (0.3) compared to UAUAGGCCGC (0.6), yet it also has a lower UA-dinucleotide ratio (0 vs. 0.22). To address this concern more rigorously, we performed a stratified analysis based on UA-diNT rate. As shown in our Fig. S7C, even after stratifying by UA- dinucleotide ratio (upper panel high UA- dinucleotide ratio / lower panel low UA- dinucleotide ratio), we still observe that the destabilizing effect of UA is stronger in the low GC content group.
Reviewer #2 (Public Review):
Summary of goals:
Untranslated regions are key cis-regulatory elements that control mRNA stability, translation, and translocation. Through interactions with small RNAs and RNA binding proteins, UTRs form complex transcriptional circuitry that allows cells to fine-tune gene expression. Functional annotation of UTR variants has been very limited, and improvements could offer insights into disease relevant regulatory mechanisms. The goals were to advance our understanding of the determinants of UTR regulatory elements and characterize the effects of a set of "disease-relevant" UTR variants.
Strengths:
The use of a massively parallel reporter assay allowed for analysis of a substantial set (6,555 pairs) of 5' and 3' UTR fragments compiled from known disease associated variants. Two cell types were used.
The findings confirm previous work about the importance of AREs, which helps show validity and adds some detailed comparisons of specific AU-rich motif effects in these two cell types.
Using a Lasso regression, TA-dinucleotide content is identified as a strong regulator of RNA stability in a context dependent manner based on GC content and presence of RNA binding protein binding motifs. The findings have potential importance, drawing attention to a UTR feature that is not well characterized.
The use of complementary datasets, including from half-life analyses of RNAs and from random sequence library MRPA's, is a useful addition and supports several important findings. The finding the TA dinucleotides have explanatory power separate from (and in some cases interacting with) GC content is valuable.
The functional enrichment analysis suggests some new ideas about how UTRs may contribute to regulation of certain classes of genes.
Weaknesses:
It is difficult to understand how the calculations for half-life were performed. The sequencing approach measures the relative frequency of each sequence at each time point (less stable sequences become relatively less frequent after time 0, whereas more stable sequences become relatively more frequent after time 0). Since there is no discussion of whether the abundance of the transfected RNA population is referenced to some external standard (e.g., housekeeping RNAs), it is not clear how absolute (rather than relative) half-lives were determined.
We estimated decay constant λ and half-life (t<sub>1/2</sub>) by the following equations:
where C<sub>i(t)</sub> and C<sub>i(t=0)</sub> are read count values of the ith replicate at time points 𝑡 and 0 (see also Methods). The absolute abundance was not required for the half-life calculation.
Fig. S1A and B are used to assess reproducibility. They show that read counts at a given time point correlate well across replicate experiments. However, this is not a good way to assess reproducibility or accuracy of the measurements of t1/2 are. (The major source of variability in read counts in these plots - especially at early time points - is likely the starting abundance of each RNA sequence, not stability.) This creates concerns about how well the method is measuring t1/2. Also creating concern is the observation that many RNAs are associated with half-lives that are much longer than the time points analyzed in the study. For example, based upon Figure S1 and Table S1 correctly, the median t1/2 for the 5' UTR library in HEK cells appears to be >700 minutes. Given that RNA was collected at 30, 75, and 120 minutes, accurate measurements of RNAs with such long half lives would seem to be very difficult.
We estimated the half-life based on the following equations:
where C<sub>i(t)</sub> and C<sub>i(t=0)</sub> are read count values of the ith replicate at time points 𝑡 and 0 (see also Methods). The calculation of the half-life involves first determining the decay constant 𝜆, which represents a constant rate of decay. Since 𝜆 is a constant, it is possible to accurately calculate it without needing data over the entire decay range. Our experimental design considers this by selecting appropriate time points to ensure a reliable estimation of 𝜆, and thus, the half-life. To determine the most suitable time points, we conducted preliminary experiments using RT-PCR.
These experiments indicated that 30, 75, and 120 minutes provided an effective range for capturing the decay dynamics of the transcripts.
There is no direct comparison of t1/2 between the two cell types studied for the full set of sequences studied. This would be helpful in understanding whether the regulatory effects of UTRs are generally similar across cell lines (as has been shown in some previous studies) or whether there are fundamental differences. The distribution of t1/2's is clearly quite different in the two cell lines, but it is important to know if this reflects generally slow RNA turnover in HEK cells or whether there are a large number of sequence-specific effects on stability between cell lines. A related issue is that it is not clear whether the relatively small number of significant variant effects detected in HEK cells versus SH-SY5Y cells is attributable to real biological differences between cell types or to technical issues (many fewer read counts and much longer half lives in HEK cells).
For both cell lines, we selected oligonucleotides with R<sup>2</sup> > 0.5 and mean squared error (MSE) < 1 for analysis when estimating half-life (λ) by linear regression. This selection criterion was implemented to minimize the effect of experimental noise. After quality control, we selected common UTRs and compared the RNA half-lives of the two cell lines using a scatter plot. Author response image 2 shows that RNA half-lives are quite different between the cell lines, with a moderate similarity observed in the 5' UTRs (R = 0.21), while the correlation in the 3' UTRs is non-significant.
Author response image 2.
Despite the low correlation of mRNA half-life between the two cell lines, UA-dinucleotide and UA-rich sequences consistently emerge as the most significant destabilizing features, suggesting a shared regulatory mechanism across diverse cellular environments.
The general assertion is made in many places that TA dinucleotides are the most prominent destabilizing element in UTRs (e.g., in the title, the abstract, Fig. 4 legend, and on p. 12). This appears to be true for only one of the two cell lines tested based on Fig. 3.
UA-dinucleotides and other UA-rich sequences exhibit similar effects on RNA stability, as illustrated in Fig. S5A-C. In two cell lines, UA-dinucleotide and WWWWWW sequences were representatives of the same stability-affecting cluster. While the impact of UA-dinucleotides can be generalized, we have rephrased some statements for clarification to avoid any potential misunderstanding. For examples:
Abstract: “...We found that UA dinucleotides and UA-rich motifs are the most prominent destabilizing element.“
p.10: “UA dinucleotides and UA-rich motifs are the most common and effective RNA destabilizing factor”
Figure 4: “The UTR UA dinucleotides and UA-rich motifs are the most common and influential RNA destabilizing factor.”
Appraisal and impact:
The work adds to existing studies that previously identified sequence features, including AREs and other RNA binding protein motifs, that regulate stability and puts a new emphasis on the role of "TA" (better "UA") dinucleotides. It is not clear how potential problems with the RNA stability measurements discussed above might influence the overall conclusions, which may limit the impact unless these can be addressed.
It is difficult to understand whether the importance of TA dinucleotides is best explained by their occurrence in a related set of longer RBP binding motifs (see Fig 5J, these motifs may be encompassed by the "WWWWWW cluster") or whether some other explanation applies. Further discussion of this would be helpful. Does the LASSO method tend to collapse a more diverse set of longer motifs that are each relatively rare compared to the dinucleotide? It remains unclear whether TA dinucleotides are associated with less stability independent of the presence of the known larger WWWWWWW motif. As noted above, the importance of TA dinucleotides in the HEK experiments appears to be less than is implied in the text.
To ensure the representativeness of the features entered into the LASSO model, we pre-selected those with an occurrence greater than 10% among all UTRs. There is no evidence to support a preference for dinucleotides by LASSO. To address whether the destabilizing effect of UA dinucleotides is part of the broader WWWWWW motif, we divided UA dinucleotides into two groups: those within the WWWWWW motif and those outside of it. Specifically, we divided UTRs into two categories: 'at least one UA within a WWWWWW motif' and 'no UA within a WWWWWW motif,' and visualized the results using a boxplot. As shown in Author response image 3, the destabilizing trend still remains for UA dinucleotides outside of the WWWWWW motif, although the effect appears to be more pronounced when UA is within the WWWWWW motif. This suggests that while UA dinucleotides have a destabilizing effect independently, their impact is amplified when they are part of the broader WWWWWW motif.
Author response image 3.
The inclusion of more than a single cell type is an acknowledgement of the importance of evaluating cell type-specific effects. The work suggests a number of cell type-specific differences, but due to technical issues (especially with the HEK data, as outlined above) and the use of only two cell lines, it is difficult to understand cell type effects from the work.
The inclusion of both 3' and 5' UTR sequences distinguishes this work from most prior studies in the field. Contrasting the effects of these regions on stability is of interest, although the role of these UTRs (especially the 5' UTR) in translational regulation is not assessed here.
We examined the role of UTR and UTR variants in translation regulation using polysome profiling. By both univariate analysis and an elastic regression model, we identified motifs of short repeated sequences, including SRSF2 binding sites, as mutation hotspots that lead to aberrant translation. Furthermore, these polysome-shifting mutations had a considerable impact on RNA secondary structures, particularly in upstream AUG-containing 5’ UTRs. Integrating these features, our model achieved high accuracy (AUROC > 0.8) in predicting polysome-shifting mutations in the test dataset. Additionally, metagene analysis indicated that pathogenic variants were enriched at the upstream open reading frame (uORF) translation start site, suggesting changes in uORF usage underlie the translation deficiencies caused by these mutations. Illustrating this, we demonstrated that a pathogenic mutation in the IRF6 5’ UTR suppresses translation of the primary open reading frame by creating a uORF. Remarkably, site-directed ADAR editing of the mutant mRNA rescued this translation deficiency. Because the regulation of translation and stability does not converge, we illustrate these two mechanisms in two separate manuscripts (this one and doi.org/10.1101/2024.04.11.589132).
Reviewer #3 (Public Review):
Summary:
In their manuscript titled "Multiplexed Assays of Human Disease‐relevant Mutations Reveal UTR
Dinucleotide Composition as a Major Determinant of RNA Stability" the authors aim to investigate the effect of sequence variations in 3'UTR and 5'UTRs on the stability of mRNAs in two different human cell lines.
To do so, the authors use a massively parallel reporter assay (MPRA). They transfect cells with a set of mRNA reporters that contain sequence variants in their 3' or 5' UTRs, which were previously reported in human diseases. They follow their clearance from cells over time relative to the matching non-variant sequence. To analyze their results, they define a set of factors (RBP and miRNA binding sites, sequence features, secondary structure etc.) and test their association with differences in mRNA stability. For features with a significant association, they use clustering to select a subset of factors for LASSO regression and identify factors that affect mRNA stability.
They conclude that the TA dinucleotide content of UTRs is the strongest destabilizing sequence feature. Within that context, elevated GC content and protein binding can protect susceptible mRNAs from degradation. They also show that TA dinucleotide content of UTRs affects native mRNA stability, and that it is associated with specific functional groups. Finally, they link disease associated sequence variants with differences in mRNA stability of reporters.
Strengths:
This work introduces a different MPRA approach to analyze the effect of genetic variants. While previous works in tissue culture use DNA transfections that require normalization for transcription efficiency, here the mRNA is directly introduced into cells at fixed amounts, allowing a more direct view of the mRNA regulation.
The authors also introduce a unique analysis approach, which takes into account multiple factors that might affect mRNA stability. This approach allows them to identify general sequence features that affect mRNA stability beyond specific genetic variants, and reach important insights on mRNA stability regulation. Indeed, while the conclusions to genetic variants identified in this work are interesting, the main strength of the work involve general effect of sequence features rather than specific variants.
The authors provide adequate supports for their claims, and validate their analysis using both their reporter data and native genes. For the main feature identified, TA di-nucleotides, they perform follow-up experiments with modified reporters that further strengthen their claims, and also validate the effect on native cellular transcripts (beyond reporters), demonstrating its validity also within native scenarios.
The work provides a broad analysis of mRNA stability, across two mRNA regulatory segments (3'UTR and 5'UTR) and is performed in two separate cell-types. Comparison between two different cell-types is adequate, and the results demonstrate, as expected, the dependence of mRNA stability on the cellular context. Analysis of 3'UTR and 5'UTR regulatory effects also shows interesting differences and similarities between these two regulatory regions.
Weaknesses:
(1) The authors fail to acknowledge several possible confounding factors of their MPRA approach in the discussion.
First, while transfection of mRNA directly into cells allows to avoid the need to normalize for differences in transcription, the introduction of naked mRNA molecules is different than native cellular mRNAs and could introduce biases due to differences in mRNA modifications, protein associations etc. that may occur co-transcriptionally.
Second, along those lines, the authors also use in-vitro polyadenylation. The length of the polyA tail of the transfected transcripts could potentially be very different than that of native mRNAs and also affect stability.
The transcripts used in our study were polyadenylated in vitro with approximately 100 nucleotides
(Fig. S1C), similar to the polyA tail lengths typically observed in vivo (dx.doi.org/10.1016/j.molcel.2014.02.007). Additionally, these transcripts were capped to emulate essential mRNA characteristics and to minimize immune responses in recipient cells. This design allows us to study RNA decay for in vitro-synthesized RNA delivered into human cells, akin to RNA vaccines, but it does not necessarily extend to endogenous RNAs. As mentioned, endogenous RNAs undergo nuclear processing and are decorated by numerous trans factors, resulting in distinct regulatory mechanisms. We therefore provided a more discussion on these differences and their implications in the revised manuscript: “However, while our approach effectively assesses the stability of synthesized RNA in human cells, it may not fully capture the decay dynamics of nuclear-synthesized RNA, which can be influenced by endogenous modifications and trans-acting RNA binding factors. (p. 18)”
(2) The analysis approach used in this work for identifying regulatory features in UTRs was not previously used. As such, lack of in-depth details of the methodology, and possibly also more general validation of the approach, is a drawback in convincing the reader in the validity of this approach and its results.
In particular, a main point that is not addressed is how the authors decide on the set of "factors" used in their analysis? As choosing different sets of factors might affect the results of the analysis.
In our study, we employed the calculation of the Variance Inflation Factor (VIF) as a basis for selecting variables. This well-established method is widely used to detect variables with high collinearity, thus ensuring the robustness and reliability of our analysis. By identifying and excluding highly collinear variables, we aimed to minimize multicollinearity and improve the accuracy of our regression models. For more detailed information on the use of VIF in regression analysis, please refer to Akinwande, M., Dikko, H., and Samson, A. (2015). Variance Inflation Factor: As a Condition for the Inclusion of Suppressor Variable(s) in Regression Analysis. Open Journal of Statistics, 5, 754-767. doi: 10.4236/ojs.2015.57075. We have included the method details in the revised manuscript (p. 28) :”… to avoid multicollinearity caused by similar features that perturb feature selection, all features were clustered using single-linkage hierarchical clustering with the distance metric defined as one minus the absolute value of the Spearman correlation coefficient. We cut the tree at a specific height, and the feature that had the greatest influence on RNA stability, which was examined using a simple linear regression model, was selected to be the representative of each cluster. Then we calculated the variance inflation factor (VIF) value of the representative features. The VIFs were obtained by the following linear model and equations:
where
and
are the estimated value of the jth feature and the value of the kth feature of the ith UTR (note that the kth feature is a feature other than the jth feature),
and
are the intercept and the regression coefficients of the linear model that regressed the jth feature on the other remaining features, and
is the mean level of the jth feature of all UTRs.”
For example, the choice to use 7-mer sequences within the factors set is not explained, particularly when almost all motifs that are eventually identified (Figure 3B-E) are shorter.
The known RBP motifs are primarily 6-mer. To explore the possibility of discovering novel motifs that could significantly impact our model, we started with 7-mer sequences. However, our analysis revealed that including these additional variables did not improve the explanatory power of the model; instead, it reduced it. Consequently, our final model focuses on motifs shorter than 7-mer. We explained the motif selections in the revised manuscript (p. 9): “Given our discovery that the effect of AREs is heavily dependent on sequence content, we decided to further explore the effects of other sequence elements, i.e., beyond known regulatory motifs, in more detail. Since most reported RBP motifs are 6-mers, we initiated a search for novel motifs by analyzing the presence of all 7-mers in our massively parallel reporter assay (MPRA) library, correlating their occurrence with mRNA half-life.”
In addition, the authors do not perform validations to demonstrate the validity of their approach on simulated data or well-established control datasets. Such analysis would be helpful to further convince the reader in the usefulness and robustness of the analysis.
We acknowledge the importance of validating our approach on simulated data or well-established control datasets to demonstrate its robustness and reliability. However, to the best of our knowledge, there are currently no well-established control datasets available that perfectly correspond to our specific study context. Despite this, we will continue to search for any relevant datasets that could be utilized for this purpose in future work. This effort will help to further reinforce the confidence in our methodology and its findings.
(3) The analysis and regression models built in this work are not thoroughly investigated relative to native genes within cells. The effect of sequence "factors" on native cellular transcripts' stability is not investigated beyond TA di-nucleotides, and it is unclear to what degree do other predicted factors also affect native transcripts.
Our system studies the stability control of RNA synthesized in vitro and delivered into human cells. While we validated the UTR UA-dinucleotide effect in vivo, we did not intend to conclude that this is the most influential regulation for endogenous RNAs. It is known that endogenous RNAs undergo very different regulation. The most prominent factors controlling endogenous RNA stability are the density of splice junctions and the length of UTRs (doi.org/10.1186/s13059-022-02811-x; doi.org/10.1186/s12915-021-00949-x). To decipher the sequence regulation, we controlled for these factors in our experiments. Therefore, we acknowledge that several endogenous features, which were excluded by our approach, may serve as predictive features of RNA half-life in vivo.
Recommendations for the authors:
Reviewer #1 (Recommendations For The Authors):
Specific comments:
Some references are missing, e.g for the sentence:
Please see the response below.
"Similarly, point mutation of the GFPT1 3' UTR results in congenital myasthenic syndrome." (p5)
The reference has been added to the text:
Dusl, M., Senderek, J., Muller, J. S., Vogel, J. G., Pertl, A., Stucka, R., Lochmuller, H., David, R., & Abicht, A. (2015). A 3'-UTR mutation creates a microRNA target site in the GFPT1 gene of patients with congenital myasthenic syndrome. Human Molecular Genetics, 24(12), 34183426. https://doi.org/10.1093/hmg/ddv090
"...but there have been no systematic assessments of the explicit effects of variants of both UTRs on stability regulation." (not true in the current phrasing; e.g. PMIDs 32719458, 36156153, 34849835)
These references have been added to the text. However, we have to point out that these studies do not focus on the effects of the disease-relevant variants. To clarify, we modified the sentence to "... systematic assessments of the explicit effects of disease-relevant variants in both UTRs on stability regulation are still absent."
"Multiple approaches have revealed AREs as exerting a destabilizing effect on RNA stability (Barreau et al., 2005). (p8)
The reference has been added to the text:
Barreau, C., Paillard, L., & Osborne, H. B. (2005). AU-rich elements and associated factors: are there unifying principles? Nucleic Acids Research, 33(22), 7138-7150. https://doi.org/10.1093/nar/gki1012
"This effect is specific, as such ratios in the coding region are inconsequential." (p12)
This refers to our findings of Fig. 4G and Supplemental Fig. S5F.
What are the sequences at the 5' and 3'UTR without insertion of a library? 5'UTR library (especially in SH) has much longer half-life compared to 3'utr library (Fig S1D).
There is no designed 5’UTR of the 3’UTR library, only the Kozak sequence derived from the pEGFPC1 vector. This may partially underlie the shorter half-life of the 3’ UTR library.
Fig2A: What are the units? "half-life (log)" Do the numbers correspond to log10(min)?
It represents ln (min). To clarify, we now use ‘ln t<sub>1/2</sub> (min)’ in all figures.
Fig 2 and 3: This was done only on the wild-type sequences? Or all tested sequences together, wt and mut?
It was done only on the wild-type sequences. To clarify, we modified the text to “we examined the effect of AREs on RNA stability of the ref alleles according to specific sequence content….(p.8)” and “We considered as many factors as possible to explain the half-life of our ref UTR libraries,…. (p.9)”. ‘ref’ stands for reference.
"Furthermore, to avoid collinearity confounding our model, e.g., the effects of very similar factors (such as 'AA' and 'AAA' sequences), we clustered the factors according to their properties, and then only one representative factor from within a cluster (i.e., the one with the highest correlation to halflife within a cluster) was subjected to LASSO regression": Given the observed context dependence, e.g. in the case of poly-U stretches: Isn't this clustering leading to similar/identical motifs with different context being grouped together (such as polyU preceded by an A (strongly destabilizing, according to Fig 2B) or followed by one (strongly stabilizing, according to Fig 2B), resulting in ignoring the context or using one potential outcome while a motif from the same cluster can have the opposite effect?
Thank you very much for pointing this out. To determine if considering different contextual effects within each feature cluster would enhance model performance, we modified our feature selection by choosing both the feature with the largest positive and the largest negative effect on RNA half-life in Step III of Figure 3A. We then split the data into a 2:1 training and testing set and repeated this process 100 times. Model performance was evaluated using mean average error (MAE), root mean squared error (RMSE), and adjusted R-squared. From Author response image 4, we observed no significant improvement in model performance using this new approach. Notably, in the SH-SY5Y 5' UTR model, our original method even outperformed the modified one, with statistically lower MAE and RMSE and a higher adjusted R-squared. Therefore, we believe our current approach remains appropriate.
Author response image 4.
"Overall, motifs that are at least two nucleotides long proved critical for RNA stability, supporting the sequence specificity of the decay process." Unclear why this supports the "sequence specificity"
No monomers were selected as an explanatory factor. On the contrary, specific sequence combinations and order are important for the regulation. These findings suggest sequence-specific recognition for the decay process.
Fig3: The same features were used in both cell lines? If yes: Since they were selected for their highest correlation with half-life, how was a common set chosen? If no: problematic to compare.
Thank you for your question regarding feature selection across cell lines. Initially, the features were collected uniformly for both cell lines. However, subsequent feature selection steps were cell-type specific, focusing on identifying features with the greatest impact on RNA half-life in each context. This approach allows us to still compare model performance and discuss the similarities and differences in selected features across cell types. By maintaining a consistent starting point, we ensure that any observed differences reflect cell-specific regulatory dynamics.
uORFs were not used as features?
Thank you for pointing this out. At the beginning of our study, we investigated the impact of Kozak sequence strength (categorized as weak, moderate, strong, or optimal) on RNA half-life. However, we found that this feature performed poorly in predicting RNA stability, and as a result, we decided not to include upstream open reading frames (uORFs) or Kozak sequences in our subsequent analyses.
Experimental reproducibility: Only correlations between replicates for the same time point is shown, but no comparison between time points or between decay rates. How reproducible were the paired differences between mut/wt?
The decay rate was calculated by modeling the slope of a linear regression of all time points. Therefore, there is only one decay rate associated with a genotype. To rule out inconsistent data, we excluded any regression with a mean square error greater than 1, as this indicates a poor fit of the data points.
Fig 7C/p17: This does not establish a "causal relationship" as the authors claim.
We agree with the reviewer’s suggestion. We have modified the text on p.17 to “to establish a correlation between UTR variants and health outcomes,…..”
In the discussion, the authors claim that TA-diNTs are not only an opposite of the GC percentage and base this on Fig 5A.
Fig 5A: The range of TA-diNTs is naturally much higher in the low GC group. To make the high and low GC content comparable (as the authors aim to do), the correlation should be assessed for the same range of TA dint in both cases.
To address this concern more rigorously, we performed a stratified analysis based on UA-diNT rate. As shown in our Fig. S7C, even after stratifying by UA- dinucleotide ratio (upper panel high UA- dinucleotide ratio / lower panel low UA- dinucleotide ratio), we still observe that the destabilizing effect of UA is stronger in the low GC content group.
Supplemental Figure S7. Interplay of GC content and TA dinucleotide on stability regulation, related to Figure 5. (C) Stratifications of both TA dinucleotide ratio and GC content showed that the destabilizing effect of TA dinucleotide is the most prominent under conditions of low TA dinucleotide ratio and low GC content. The same trend was observed for 5’ UTR (left) and 3’ UTR (right).
The injection of in vitro transcribed and polyA/capped RNA certainly has advantages over other methods, but delivering naked mRNA without nuclear history might also lead to artifacts. The caveats of the approach should be discussed more extensively.
We appreciate the suggestion and have hence added the following in the Discussion (p.18): “However, while our approach effectively assesses the stability of synthesized RNA in human cells, it may not fully capture the decay dynamics of nuclear-synthesized RNA, which can be influenced by endogenous modifications and trans-acting RNA binding factors.”
"We unexpectedly identified many crucial regulatory features in 5' UTRs." Why was this unexpected?
We initially thought the 3’ UTR would play a major role in stability regulation. To avoid confusion, we have removed the word ‘unexpected’ from the text (p. 20): "We identified many crucial regulatory features in 5' UTRs."
"...a massively parallel reporter assay in which coding regions and human 5'/3' UTRs with diseaserelevant mutations were generated in vitro and then directly transfected into human cell lines to assess their decay patterns by next‐generation sequencing": also coding regions?
Thanks for the question. Indeed, the coding region was not synthesized together with the UTR library. Therefore, we modified the text of p. 6 to “…we developed a massively parallel reporter assay in which human 5’/3’ UTRs with disease-relevant mutations were generated in vitro, ligated with the enhanced green fluorescence protein (EGFP) coding region, and then directly transfected into human cell lines to assess their decay patterns by next-generation sequencing.”
Reviewer #2 (Recommendations For The Authors):
Nomenclature: When discussing RNA sequences, "U" should be used in place of "T" (e.g., "UA dinucleotide").
We have replaced the RNA sequence “T” with “U” of the text and figures.
Abstract: "We examined the RNA degradation patterns mediated by the UTR library in multiple cell lines" - It would be clearer to state that two cell lines (rather than multiple) were used.
We appreciate the suggestion. We have modified the abstract as suggested: “We examined the RNA degradation patterns mediated by the UTR library in two cell lines…"
The manuscript refers to "wild-type (WT) and mutant (mt) alleles." (p. 7 and elsewhere). It would be better to use "reference" instead of "wild type" given that these are human populations.
We appreciate the suggestion. All instances of ‘wild-type’ or ‘WT’ in the text and figures have been replaced with ‘reference’ or ‘ref’.
In the introduction, it is stated that traditional MPRAs "cannot differentiate the effect of the UTRs on transcription, stability and, in some cases, even protein production, greatly limiting scientific interpretation." This is confusing, since these assays can and have been used in association with both RNA decay measurements and measurements of reporter protein levels that allow assessment of effects on stability and protein production (including in the cited references).
We reason that the RNA steady-state level (e.g., sequencing the overall RNA normalized to DNA) or protein steady-state level (e.g., detecting the fluorescence signal) does not precisely reveal the decay kinetics of the RNA. Steady-state level is a result of production and decay, both of which UTRs contribute to. Similarly, the protein level is not a perfect estimate of the RNA decay.
To clarify, we have modified the introduction (p. 5) to “Nevertheless, because the steady-state level is a result of production and decay, these approaches cannot differentiate the effect of the UTRs on transcription, stability and, in some cases, even protein production, greatly limiting scientific interpretation.”
Adding raw and normalized read count data from individual experiments (e.g., to Table S1) would make it more likely for others to use this dataset to address additional questions.
All raw and processed sequencing data generated in this study have been submitted to the NCBI Gene Expression Omnibus (GEO; https://www.ncbi.nlm.nih.gov/geo/) under accession number GSE217518 (reviewer token snspaakujtsdpcv).
The manuscript would benefit from further clarification about model selection. Additional details regarding how the features were clustered, and the actual clusters themselves should be included.
It should be discussed why Lasso was chosen vs Ridge or Elastic Net, in the context of handling multicollinearity. Often, data is subsetted for training and validation, and model performance metrics are presented.
Thank you for pointing out the need for further clarification on model selection. The features were clustered using single-linkage hierarchical clustering with the distance metric defined as one minus the absolute value of the Spearman correlation coefficient (this information has been added to the manuscript on p. 28: “…to avoid multicollinearity caused by similar features that perturb feature selection, all features were clustered using single-linkage hierarchical clustering with the distance metric defined as one minus the absolute value of the Spearman correlation coefficient.”). The resulting feature clusters are available in Supplemental Table S3.
Regarding model selection, we chose LASSO over ridge and elastic net primarily for feature selection, as ridge does not perform feature selection. Elastic net is essentially a hybrid of ridge regression and LASSO regularization, but we opted for LASSO for its simplicity and effectiveness in selecting a sparse set of important features.
We also performed a 2:1 training and testing set analysis and have included these details in the manuscript. Model performance metrics, including correlation coefficient between observed and predicted values in the testing set, mean absolute error (MAE), root mean squared error (RMSE), mean absolute percentage error (MAPE), and R-squared, are provided in new Supplemental Table S4.
Recommend reviewing and correcting verb tenses in the methods section.
We appreciate the reviewer’s suggestion. We have corrected verb tenses in the methods section, which includes “The UTRs were defined by NCBI RefSeq and ENCODE V27. (p.21)”, “The variant was placed in the middle of the sequence….(p.22)”, and “eCLIP signals with value < 1 or p value > 0.05 were removed. (p.26)”
Please add information about which cell type(s) are being used in each of the figure legends (e.g., in Figs. 2B and 5).
We appreciate the reviewer’s suggestion. We have added the cell type information in the figure legends: “Figure 2…. (B) The ten most influential AREs in terms of RNA stability in SH-SY5Y cells.” And “Figure 5…..(A) MPRA data of SH-SY5Y cells stratified according to the GC content (GC%) of UTRs.”
Recommend review of axis labels and consistency in formatting the log(half-lives) and including the base of the log and the time unit (minutes). Even better, converting axis labels from log minutes to minutes would make this easier to understand.
Thank you for the suggestion regarding axis labels and consistency. We have unified the half-life label to ‘ln t<sub>1/2</sub> (min)’ in all figures. We chose not to convert the axis from logarithmic minutes to minutes because the original scale is highly skewed, which would hinder clear data visualization.
The discussion refers to Figure 1D but Figure 1 only has A-C
Thank you for pointing out this mistake. ‘Fig. 1D’ has been changed to ‘Fig. 1B’ in the text (p. 7 and p. 20).
The analyses in Fig. 2 are interpreted as demonstrating that AREs destabilize RNAs. These analyses are examining associations, so it would be more appropriate to say that AREs are associated with destabilization (since it is formally possible that other sequences that are present in these UTR fragment cause destabilization). A similar issue arises on p. 10: "TA dinucleotides alone can negatively regulate RNA stability, with a Pearson's correlation coefficient of ‐0.287 for 5' UTRs and ‐0.377 for 3' UTRs (Fig. 4A,C)." This is an association and does not establish causation. Again on p. 17: "We identified several SNPs in UTRs that induce aberrant RNA expression and/or protein expression (Supplemental Table S7)." These may be causal but may simply be in LD with other variants that are causal.
We agree that the association observed is not proven to be causal. Therefore, we modified the text as suggested:
“AUUUA/AUUA-containing AREs are associated with RNA destabilization.” (p. 8)
“UA dinucleotides alone present a negative correlation with RNA stability, with a Pearson’s correlation coefficient of -0.287 for 5’ UTRs and -0.377 for 3’ UTRs.” (p.10)
“We identified several SNPs in UTRs that correlated with aberrant RNA expression and/or protein expression.” (p. 17)
Figure 4C is important in that it examines whether variant sequences that differ in a manner that changes the number of dinucleotide repeats affect stability. Please show the number (not just the percentage) of sequences in each category.
Thank you for your insightful comment. We believe the figure you referred to is Figure 4E. We have updated the figure to include the number of sequences in each category.
Figure 6A and B: The horizontal axes appear to be misaligned since the dotted vertical lines do not cross at 0. ?
The dotted vertical lines represent the genomic background of the UA-diNT ratio. To clarify it, we have modified the legend to: “Figure 6……(A) The top ten biological processes for which the 5’ UTR UA-dinucleotide ratio most significantly deviated from the genomic background (dashed line).”
It may be helpful to state what the dashed and solid lines represent on Figure 6 E/F. Please correct spelling of "Biological" in 6E.
As per the reviewer’s suggestions, we have modified the legend of Figure 6 to: “………..(E) Biological processes for RNAs in which the UA-dinucleotide ratios of both 5’ and 3’ UTRs are significantly different from the genomic background (dashed lines). (F) Molecular functions for RNAs in which the UA-dinucleotide ratios of both 5’ and 3’ UTRs are significantly different from the genomic background (dashed lines). The thin solid lines represent the standard deviation of the UAdinucleotide ratio within the gene group.”
In addition, the spelling of “Biological” in Fig. 6E has been corrected.
Reviewer #3 (Recommendations For The Authors):
I have 3 points that I think could improve science and its presentation within the manuscript.
(1) Most importantly, how well do LASSO regression models predict the stability of native transcripts? Such analysis can also be useful for comparison between two different cell-types. How well does the regression model learned (on reporters) within one cell-type predict mRNA stability (of reporters and native genes) in this cell-type and in the other cell-type? Similarly, models can also help to analyze the effects of 5'UTR and 3'UTR sequences on mRNA stability. In particular, how well does the regression model of each separate regulatory sequence (3'UTR or 5'UTR) is able to predict the stability of native genes in the cell? Can the predictions be improved by combining both 3'UTR and 5'UTR sequence features within the regression models?
The decay model for native transcripts has been established in prior research (doi.org/10.1186/s13059-022-02811-x; doi.org/10.1186/s12915-021-00949-x), which indicates that exon junction density and transcript length are the primary determinants of RNA stability. Based on these findings, we designed the MPRA with fixed length and without splicing to focus on the contribution of primary sequences. We validated the destabilizing effect of UA dinucleotide on endogenous RNAs (Fig. 4G and Supplemental Fig. S5F) but do not recommend using our model to fully explain or predict the stability of native transcripts.
To assess the model's cross-cell type predictive performance for RNA half-life, we employed the Regression Error Characteristic (REC) curve (Bi & Bennett, 2003). Similar to the receiver operating characteristic (ROC) curve, the REC curve illustrates the trade-off between error tolerance and accuracy, with better performance indicated by curves trending toward the upper left. We also computed the Area Over the Curve (AOC) as a performance metric, where lower values indicate better predictive ability. From Author response image 5, the REC curves reveal that cross-cell type prediction performance is suboptimal. The y-axis represents prediction accuracy, while the x-axis denotes error tolerance for the natural logarithm of RNA half-life (ln(𝑡<sub>1/2</sub>), in minutes).
Author response image 5.
In response to the suggestion of combining 5' and 3' UTR sequence features in the regression model, we believe this approach may not be ideal. As shown in Figure S1D, the distribution of RNA half-lives between 5' and 3' UTRs is significantly different, reflecting their distinct regulatory roles. Additionally, the base composition differs, with 5' UTRs having a higher GC content compared to 3' UTRs. Combining these datasets would likely make the origin of the sequence (5' or 3' UTR) the most predictive feature, thereby reducing the model's interpretability. Furthermore, our MPRA results, derived from separate 5’ or 3’ UTR library, do not support a combined model, further suggesting this approach may not be suitable with our data.
The conclusions regarding genetic variants are interesting, yet the main strength of the work involves identifying general sequence features that affect mRNA stability rather than specific variants. I wonder if the authors have considered to shift the focus of the motivation part to reflect that?
We appreciated the reviewer’s suggestion. We have revised the abstract and introductions to emphasize the general UTR regulation. Here is the revised abstract:
UTRs contain crucial regulatory elements for RNA stability, translation and localization, so their integrity is indispensable for gene expression. Approximately 3.7% of genetic variants associated with diseases occur in UTRs, yet a comprehensive understanding of UTR variant functions remains limited due to inefficient experimental and computational assessment methods. To systematically evaluate the effects of UTR variants on RNA stability, we established a massively parallel reporter assay on 6,555 UTR variants reported in human disease databases. We examined the RNA degradation patterns mediated by the UTR library in two cell lines, and then applied LASSO regression to model the influential regulators of RNA stability. We found that UA dinucleotides and UA-rich motifs are the most prominent destabilizing element. Gain of UA dinucleotide outlined mutant UTRs with reduced stability. Studies on endogenous transcripts indicate that high UA-dinucleotide ratios in UTRs promote RNA degradation. Conversely, elevated GC content and protein binding on UA dinucleotides protect high-UA RNA from degradation. Further analysis reveals polarized roles of UA-dinucleotide-binding proteins in RNA protection and degradation. Furthermore, the UA-dinucleotide ratio of both UTRs is a common characteristic of genes in innate immune response pathways, implying a coordinated stability regulation through UTRs at the transcriptomic level. We also demonstrate that stability-altering UTRs are associated with changes in biobank-based health indices, underscoring the importance of precise UTR regulation for wellness. Our study highlights the importance of RNA stability regulation through UTR primary sequences, paving the way for further exploration of their implications in gene networks and precision medicine.
Plots presenting correlations (e.g., Figure 4A, 4C) are more informative when plotted as density plots (i.e., using colorscale to show density of the dots at each part of the plot).
We greatly appreciate the reviewer's insightful suggestion regarding the use of density plots for presenting correlations. We have modified Figures 4A and 4C in the revised manuscript to implement density plotting. The updated figures now utilize a colorscale that highlights areas of high and low data density.
-
-
www.biorxiv.org www.biorxiv.org
-
eLife Assessment
This important study enhances our understanding of the foraging behaviour of aerial insectivorous birds. Using solid methodology, the authors have collected extensive data on bird movements and prey availability, which in turn provide support for the main claim of the study. The work will be of broad interest to behavioural ecologists.
-
Reviewer #1 (Public review):
This study tests whether Little Swifts exhibit optimal foraging, which the data seem to indicate is the case. This is unsurprising as most animals would be expected to optimize the energy income : expenditure ratio, however it hasn't been explicitly quantified before the way it was in this manuscript.
The major strength of this work is the sheer volume of tracking data and the accuracy of those data. The ATLAS tracking system really enhanced this study and allowed for pinpoint monitoring of the tracked birds. These data could be used to ask and answer many questions beyond just the one tested here.
The major weakness of this work lies in the sampling of insect prey abundance at a single point on the landscape, 6.5 km from the colony. This sampling then requires the authors to work under the assumption that prey abundance is simultaneously even across the study region. It may be fair to say that prey populations might be correlated over space but are not equal. It is uncertain whether other aspects of the prey data are problematic. For example, the radar only samples insects at 50m or higher from the ground - how often do Little Swifts forage under 50m high?
The finding that Little Swifts forage optimally is indeed supported by the data, notwithstanding some of the shortcomings in the prey abundance data. The authors achieved their aims and the results support their conclusions.
At its centre, this work adds to our understanding of Little Swift foraging and extends to a greater understanding of aerial insectivores in general. While unsurprising that Little Swifts act as optimal foragers, it is good to have quantified this and show that the population declines observed in so many aerial insectivores are not necessarily a function of inflexible foraging habits. Further, the methods used in this research have great potential for other work. For example, the ATLAS system poses some real advantages and an exciting challenge to existing systems, like MOTUS. The radar that was used to quantify prey abundance also presents exciting possibilities if multiple units could be deployed to get a more spatially-explicit view.
To improve the context of this work, it is worth noting that this research goes into much further depth than any previous studies on a similar topic in several flycatcher and swallow species. A further justification is posited that this research is needed due to dramatic insect population declines, however, the magnitude and extent of such declines are fiercely debated in the literature.
-
Reviewer #2 (Public review):
Summary:
Bloch et al. studied the relationships between aerial foragers (lesser swifts) tracked using an automated radio telemetry system (Atlas) and their prey (flying insects) monitored using a small vertical-looking radar (BirdScan MR1). The aim of the study was to check whether swifts optimise their foraging according to the abundance of their prey. The results provide evidence that small swifts can increase their foraging rate when aerial insect abundance is high, but found no correlation between insect abundance and flight energy expenditure.
Key points:
This study fills gaps in fundamental knowledge of prey-predator dynamics in the air. It describes the coincidence between the abundance of flying insects and the characteristics derived from monitoring individual swifts.
Weaknesses:
The paper uses assumptions largely derived from optimal foraging theory, but mixes up the form of natural selection: parental energy, parental survival (predation risk), nestling foraging and reproductive success. The results are partly inconsistent, and confounding factors (e.g., the brooding phase versus the nestling phase) remained ignored. In conclusion, the analyses performed are insufficient to rigorously assess whether lesser swifts are optimising their foraging beyond making shorter foraging trips.
The filters applied to the monitoring data are necessary but may strongly influence the characteristics derived based on maximum or mean values. Sensitivity tests or the use of characteristics that are less dependent on extreme values could provide more robust results.
-
Author response:
The following is the authors’ response to the previous reviews.
Reviewer #1 (Recommendations for the authors):
I am generally satisfied with the authors' revisions and response to my previous comments. I have amended my previous review.
We thank Reviewer #1 for his valuable comments and suggestions, which improved this manuscript.
Thank you for considering the comments in your revised version. I still feel a strong mismatch between the claims of optimal foraging behaviour and the results with little compelling evidence.
On terminology: MTR means Migration Traffic Rates. The authors responded that in their study, MTR is defined as Movement traffic rates. I have two problems with this definition: i) it creates confusion in the literature on the definition of MTR, ii) a traffic inherently describes a movement, and this pleonasm is not necessary.
We revised the acronyms in this article, replacing MTR with MoTR to clearly distinguish between Migration Traffic Rate (MTR) and Movement Traffic Rate (MoTR).
Minimal size of insects: Please detail radar settings (power sent, STC; detection thresholds). These parameters define the minimal size of the detected animals.
We added the following paragraph to provide additional information regarding the radar's detection capabilities:
" with decreasing detection probability at increasing altitudes. The detection threshold, defined by the STC setting, was 93 dBm, and the transmit power was 25 kW."
-
-
www.biorxiv.org www.biorxiv.org
-
eLife Assessment
In this valuable study, Li et al., set out to understand the mechanisms of audiovisual temporal recalibration - the brain's ability to adjust to the latency differences that emerge due to different (distance-dependent) transduction latencies of auditory and visual signals - through psychophysical measurements and modeling. The analysis and specification of a formal model for this process provide convincing evidence to supports a role for causal inference in recalibration.
-
Reviewer #1 (Public review):
This study asks whether the phenomenon of crossmodal temporal recalibration, i.e. the adjustment of time perception by consistent temporal mismatches across the senses, can be explained by the concept of multisensory causal inference. In particular they ask whether the explanation offered by causal inference better explains temporal recalibration better than a model assuming that crossmodal stimuli are always integrated, regardless of how discrepant they are.
The study is motivated by previous work in the spatial domain, where it has been shown consistently across studies that the use of crossmodal spatial information is explained by the concept of multisensory causal inference. It is also motivated by the observation that the behavioral data showcasing temporal recalibration feature nonlinearities that, by their nature, cannot be explained by a fixed integration model (sometimes also called mandatory fusion).
To probe this the authors implemented a sophisticated experiment that probed temporal recalibration in several sessions. They then fit the data using the two classes of candidate models and rely model criteria to provide evidence for their conclusion. The study is sophisticated, conceptually and technically state-of-the-art and theoretically grounded. The data clearly support the authors conclusions.
I find the conceptual advance somewhat limited. First, by design the fixed integration model cannot explain data with a nonlinear dependency on multisensory discrepancy, as already explained in many studies on spatial multisensory perception. Hence, it is not surprising that the causal inference model better fits the data. Second, and again similar to studies on spatial paradigms, the causal inference model fails to predict the behavioral data for large discrepancies. The model predictions in Figure 5 show the (expected) vanishing recalibration for large delta, while the behavioral data don't' decay to zero. Either the range of tested SOAs is too small to show that both the model and data converge to the same vanishing effect at large SOAs, or the model's formula is not the best for explaining the data. Again, the studies using spatial paradigms have the same problem, but in my view this poses the most interesting question here.
In my view there is nothing generally wrong with the study, it does extend the 'known' to another type of paradigm. However, it covers little new ground on the conceptual side.<br /> On that note, the small sample size of n=10 is likely not an issue, but still it is on the very low end for this type of study.
Comments on revision:
The revision has addressed most of these points and makes for a much stronger contribution. The issue of sample size remains.
-
Reviewer #2 (Public review):
Summary:
Li et al.'s goal is to understand the mechanisms of audiovisual temporal recalibration. This is an interesting challenge that the brain readily solves in order to compensate for real-world latency differences in the time of arrival of audio/visual signals. To do this they perform a 3-phase recalibration experiment on 9 observers that involves a temporal order judgment (TOJ) pretest and posttest (in which observers are required to judge whether an auditory and visual stimulus were coincident, auditory leading or visual leading) and a conditioning phase in which participants are exposed to a sequence of AV stimuli with a particular temporal disparity. Participants are required to monitor both streams of information for infrequent oddballs, before being tested again in the TOJ, although this time there are 3 conditioning trials for every 1 TOJ trial. Like many previous studies, they demonstrate that conditioning stimuli shift the point of subjective simultaneity (pss) in the direction of the exposure sequence.
These shifts are modest - maxing out at around -50 ms for auditory leading sequences and slightly less than that for visual leading sequences. Similar effects are observed even for the longest offsets where it seems unlikely listeners would perceive the stimuli as synchronous (and therefore under a causal inference model you might intuitively expect no recalibration, and indeed simulations in Figure 5 seem to predict exactly that which isn't what most of their human observers did). Overall I think their data contribute evidence that a causal inference step is likely included within the process of recalibration.
Strengths:
The manuscript performs comprehensive testing over 9 days and 100s of trials and accompanies this with mathematical models to explain the data. The paper is reasonably clearly written and the data appear to support the conclusions.
Comments on revision:
In the revised manuscript the authors incorporate an alternative model (the asynchrony contingent model), and demonstrate that the causal inference model still out performs this. They provide additional analysis with Bayes factors to perform model comparisons, and provide significant individual subject data in the supplementary materials. Overall they have addressed most of the key points that my original review raised, including a demonstration of the conditions under which recalibration effects do not delay to zero over long delays. The number of subjects remains rather low, but at least we can now appreciate the heterogeneity within them. I still have some reservations about the magnitude of the conceptual advance that this study makes.
-
Reviewer #3 (Public review):
Summary:
Li et al. describe an audiovisual temporal recalibration experiment in which participants perform baseline sessions of ternary order judgments about audiovisual stimulus pairs with various stimulus-onset asynchronies (SOAs). These are followed by adaptation at several adapting SOAs (each on a different day), followed by post-adaptation sessions to assess changes in psychometric functions. The key novelty is the formal specification and application/fit of a causal-inference model for the perception of relative timing, providing simulated predictions for the complete set of psychometric functions both pre and post adaptation.
Strengths:
(1) Formal models are preferable to vague theoretical statements about a process, and prior to this work, certain accounts of temporal recalibration (specifically those that do not rely on a population code) had only qualitative theoretical statements to explain how/why the magnitude of recalibration changes non-linearly with the stimulus-onset asynchrony of the adaptor.<br /> (2) The experiment is appropriate, the methods are well described, and the average model prediction is a good match to the average data (Figure 4). Conclusions are supported by the data and modelling.<br /> (3) The work should be impactful. There seems a good chance that this will become the go-to modelling framework for those exploring non population-code accounts of temporal recalibration (or comparing them with population-code accounts).<br /> (4) Key issues for the generality of the model, such as recalibration asymmetries reported by other authors that are inconsistent with those reported here, are thoughtfully discussed.
Weaknesses:
(1) Models are not compared using a gold-standard measure such as leave-one-out cross validation. However, this is legitimate given lengthy model fitting times, and a sensible approximation is presented.<br /> (2) The model misses in a systematic way for the psychometric functions of some participants/conditions. In addition to misses relating to occasional failures to estimate the magnitude of recalibration, some of the misses are because all functions are only permitted to shift in central tendency (whereas some participants show changes better characterized at one or both decision criteria). Given the fact that the modelling in general embraces individual differences, it might have been worth allowing different kinds of change for different participants. However, this is not really critical for the central concern (changes in the magnitude of recalibration for different adaptors) and there is a limit to how much can be done along these lines without making the model too flexible to test.<br /> (3) As a minor point, the model relies on simulation, which may limit its take-up/application by others in the field (although open access code will be provided).
-
Author response:
The following is the authors’ response to the original reviews.
Public Reviews:
Reviewer #1 (Public Review):
This study asks whether the phenomenon of crossmodal temporal recalibration, i.e. the adjustment of time perception by consistent temporal mismatches across the senses, can be explained by the concept of multisensory causal inference. In particular, they ask whether the explanation offered by causal inference better explains temporal recalibration better than a model assuming that crossmodal stimuli are always integrated, regardless of how discrepant they are.
The study is motivated by previous work in the spatial domain, where it has been shown consistently across studies that the use of crossmodal spatial information is explained by the concept of multisensory causal inference. It is also motivated by the observation that the behavioral data showcasing temporal recalibration feature nonlinearities that, by their nature, cannot be explained by a fixed integration model (sometimes also called mandatory fusion).
To probe this the authors implemented a sophisticated experiment that probed temporal recalibration in several sessions. They then fit the data using the two classes of candidate models and rely on model criteria to provide evidence for their conclusion. The study is sophisticated, conceptually and technically state-of-the-art, and theoretically grounded. The data clearly support the authors’ conclusions.
I find the conceptual advance somewhat limited. First, by design, the fixed integration model cannot explain data with a nonlinear dependency on multisensory discrepancy, as already explained in many studies on spatial multisensory perception. Hence, it is not surprising that the causal inference model better fits the data.
We have addressed this comment by including an asynchrony-contingent model, which is capable of predicting the nonlinearity of recalibration effects by employing a heuristic approximation of the causal-inference process (Fig. 3). We also updated the previous competitor model with a more reasonable asynchrony-correction model as the baseline of model comparison, which assumes recalibration aims to restore synchrony whenever the sensory measurement of SOA indicates an asynchrony. The causal-inference model outperformed both models, as indicated by model evidence (Fig. 4A). Furthermore, model predictions show that the causal-inference model more accurately captures recalibration at large SOAs at both the group (Fig. 4B) and the individual levels (Fig. S4).
Second, and again similar to studies on spatial paradigms, the causal inference model fails to predict the behavioral data for large discrepancies. The model predictions in Figure 5 show the (expected) vanishing recalibration for large delta, while the behavioral data don’t decay to zero. Either the range of tested SOAs is too small to show that both the model and data converge to the same vanishing effect at large SOAs, or the model's formula is not the best for explaining the data. Again, the studies using spatial paradigms have the same problem, but in my view, this poses the most interesting question here.
We included an additional simulation (Fig. 5B) to show that the causal-inference model can predict non-zero recalibration for long adapter SOAs, especially in observers with a high common-cause prior and low sensory precision. This ability to predict a non-zero recalibration effect even at large SOA, such as 0.7 s, is one key feature of the causal-inference model that distinguishes it from the asynchrony-contingent model.
In my view there is nothing generally wrong with the study, it does extend the 'known' to another type of paradigm. However, it covers little new ground on the conceptual side.
On that note, the small sample size of n=10 is likely not an issue, but still, it is on the very low end for this type of study.
This study used a within-subject design, which included 3 phases each repeated in 9 sessions, totaling 13.5 hours per participant. This extensive data collection allows us to better constrain the model for each participant. Our conclusions are based on the different models’ ability to fit individual data.
Reviewer #2 (Public Review):
Summary:
Li et al.’s goal is to understand the mechanisms of audiovisual temporal recalibration. This is an interesting challenge that the brain readily solves in order to compensate for real-world latency differences in the time of arrival of audio/visual signals. To do this they perform a 3-phase recalibration experiment on 9 observers that involves a temporal order judgment (TOJ) pretest and posttest (in which observers are required to judge whether an auditory and visual stimulus were coincident, auditory leading or visual leading) and a conditioning phase in which participants are exposed to a sequence of AV stimuli with a particular temporal disparity. Participants are required to monitor both streams of information for infrequent oddballs, before being tested again in the TOJ, although this time there are 3 conditioning trials for every 1 TOJ trial. Like many previous studies, they demonstrate that conditioning stimuli shift the point of subjective simultaneity (pss) in the direction of the exposure sequence.
These shifts are modest - maxing out at around -50 ms for auditory leading sequences and slightly less than that for visual leading sequences. Similar effects are observed even for the longest offsets where it seems unlikely listeners would perceive the stimuli as synchronous (and therefore under a causal inference model you might intuitively expect no recalibration, and indeed simulations in Figure 5 seem to predict exactly that which isn't what most of their human observers did). Overall I think their data contribute evidence that a causal inference step is likely included within the process of recalibration.
Strengths:
The manuscript performs comprehensive testing over 9 days and 100s of trials and accompanies this with mathematical models to explain the data. The paper is reasonably clearly written and the data appear to support the conclusions.
Weaknesses:
While I believe the data contribute evidence that a causal inference step is likely included within the process of recalibration, this to my mind is not a mechanism but might be seen more as a logical checkpoint to determine whether whatever underlying neuronal mechanism actually instantiates the recalibration should be triggered.
We have addressed this comment by replacing the fixed-update model with an asynchrony-correction model, which assumes that the system first evaluates whether the measurement of SOA is asynchronous, thus indicating a need for recalibration (Fig. 3). If it does, it shifts the audiovisual bias by a proportion of the measured SOA. We additionally included an asynchrony-contingent model, which is capable of replicating the nonlinearity of recalibration effects by a heuristic approximation of the causal-inference process.
Model comparisons indicate that the causal-inference model of temporal recalibration outperforms both alternative models (Fig. 4A). Furthermore, the model predictions demonstrate that the causal-inference model more accurately captures recalibration at large SOAs at both the group level (Fig. 4B) and individual level (Fig. S4).
The authors’ causal inference model strongly predicts that there should be no recalibration for stimuli at 0.7 ms offset, yet only 3/9 participants appear to show this effect. They note that a significant difference in their design and that of others is the inclusion of longer lags, which are unlikely to originate from the same source, but don’t offer any explanation for this key difference between their data and the predictions of a causal inference model.
We added further simulations to show that the causal-inference model can predict non-zero recalibration also for longer adapter SOAs, especially in observers with a large common-cause prior (Fig. 5A) and low sensory precision (Fig. 5B). This ability to predict a non-zero recalibration effect even at longer adapter SOAs, such as 0.7 s, is a key feature of the causal-inference model that distinguishes it from the asynchrony-contingent model.
I’m also not completely convinced that the causal inference model isn’t ‘best’ simply because it has sufficient free parameters to capture the noise in the data. The tested models do not (I think) have equivalent complexity - the causal inference model fits best, but has more parameters with which to fit the data. Moreover, while it fits ‘best’, is it a good model? Figure S6 is useful in this regard but is not completely clear - are the red dots the actual data or the causal inference prediction? This suggests that it does fit the data very well, but is this based on predicting held-out data, or is it just that by having more parameters it can better capture the noise? Similarly, S7 is a potentially useful figure but it's not clear what is data and what are model predictions (what are the differences between each row for each participant; are they two different models or pre-test post-test or data and model prediction?!).
I'm not an expert on the implementation of such models but my reading of the supplemental methods is that the model is fit using all the data rather than fit and tested on held-out data. This seems problematic.
We recognize the risk of overfitting with the causal-inference model. We now rely on Bayesian model comparisons, which use model evidence for model selection. This method automatically incorporates a penalty for model complexity through the marginalization over the parameter space (MacKay, 2003).
Our design is not suitable for cross-validation because the model-fitting process is computationally intensive and time-consuming. Each fit of the causal-inference model takes approximately 30 hours, and multiple fits with different initial starting points are required to rule out that the parameter estimates correspond to local minima.
I would have liked to have seen more individual participant data (which is currently in the supplemental materials, albeit in a not very clear manner as discussed above).
We have revised Supplementary Figures S4-S6 to show additional model predictions of the recalibration effect for individual participants, and participants’ temporal-order judgments are now shown in Supplement Figure S7. These figures confirm the better performance of the causal-inference model.
The way that S3 is described in the text (line 141) makes it sound like everyone was in the same direction, however, it is clear that 2 /9 listeners show the opposite pattern, and 2 have confidence intervals close to zero (albeit on the -ve side).
We have revised the text to clarify that the asymmetry occurs in both directions and is idiosyncratic (lines 168-171). We summarized the distribution of the individual asymmetries of the recalibration effect across visual-leading and auditory-leading adapter SOAs in Supplementary Figure S2.
Reviewer #3 (Public Review):
Summary:
Li et al. describe an audiovisual temporal recalibration experiment in which participants perform baseline sessions of ternary order judgments about audiovisual stimulus pairs with various stimulus-onset asynchronies (SOAs). These are followed by adaptation at several adapting SOAs (each on a different day), followed by post-adaptation sessions to assess changes in psychometric functions. The key novelty is the formal specification and application/fit of a causal-inference model for the perception of relative timing, providing simulated predictions for the complete set of psychometric functions both pre and post-adaptation.
Strengths:
(1) Formal models are preferable to vague theoretical statements about a process, and prior to this work, certain accounts of temporal recalibration (specifically those that do not rely on a population code) had only qualitative theoretical statements to explain how/why the magnitude of recalibration changes non-linearly with the stimulus-onset asynchrony of the adapter.
(2) The experiment is appropriate, the methods are well described, and the average model prediction is a fairly good match to the average data (Figure 4). Conclusions may be overstated slightly, but seem to be essentially supported by the data and modelling.
(3) The work should be impactful. There seems a good chance that this will become the go-to modelling framework for those exploring non-population-code accounts of temporal recalibration (or comparing them with population-code accounts).
(4) A key issue for the generality of the model, specifically in terms of recalibration asymmetries reported by other authors that are inconsistent with those reported here, is properly acknowledged in the discussion.
Weaknesses:
(1) The evidence for the model comes in two forms. First, two trends in the data (non-linearity and asymmetry) are illustrated, and the model is shown to be capable of delivering patterns like these. Second, the model is compared, via AIC, to three other models. However, the main comparison models are clearly not going to fit the data very well, so the fact that the new model fits better does not seem all that compelling. I would suggest that the authors consider a comparison with the atheoretical model they use to first illustrate the data (in Figure 2). This model fits all sessions but with complete freedom to move the bias around (whereas the new model constrains the way bias changes via a principled account). The atheoretical model will obviously fit better, but will have many more free parameters, so a comparison via AIC/BIC or similar should be informative
In the revised manuscript, we switched from AIC to Bayesian model selection, which approximates and compares model evidence. This method incorporates a strong penalty for model complexity through marginalization over the parameter space (MacKay, 2003).
We have addressed this comment by updating the former competitor model into a more reasonable version that induces recalibration only for some measured SOAs and by including another (asynchrony-contingent) model that is capable of predicting the nonlinearity and asymmetry of recalibration (Fig. 3) while heuristically approximating the causal inference computations. The causal-inference model outperformed the asynchrony-contingent model, as indicated by model evidence (Fig. 4A). Furthermore, model predictions show that the causal-inference model more accurately captures recalibration at large SOAs at both the group (Fig. 4B) and the individual level (Fig. S4).
(2) It does not appear that some key comparisons have been subjected to appropriate inferential statistical tests. Specifically, lines 196-207 - presumably this is the mean (and SD or SE) change in AIC between models across the group of 9 observers. So are these differences actually significant, for example via t-test?
We statistically compared the models using Bayes factors (Fig. 4A). The model evidence for each model was approximated using Variational Bayesian Monte Carlo. Bayes factors provided strong evidence in support of the causal-inference model relative to the other models.
(3) The manuscript tends to gloss over the population-code account of temporal recalibration, which can already provide a quantitative account of how the magnitude of recalibration varies with adapter SOA. This could be better acknowledged, and the features a population code may struggle with (asymmetry?) are considered.
We simulated a population-code model to examine its prediction of the recalibration effect for different adapter SOAs (lines 380–388, Supplement Section 8). The population-code model can predict the nonlinearity of recalibration, i.e., a decreasing recalibration effect as the adapter SOA increases. However, to capture the asymmetry of recalibration effects across auditory-leading and visual-leading adapter stimuli, we would need to assume that the auditory-leading and visual-leading SOAs are represented by neural populations with unequal tuning curves.
(4) The engagement with relevant past literature seems a little thin. Firstly, papers that have applied causal inference modeling to judgments of relative timing are overlooked (see references below). There should be greater clarity regarding how the modelling here builds on or differs from these previous papers (most obviously in terms of additionally modelling the recalibration process, but other details may vary too). Secondly, there is no discussion of previous findings like that in Fujisaki et al.’s seminal work on recalibration, where the spatial overlap of the audio and visual events didn’t seem to matter (although admittedly this was an N = 2 control experiment). This kind of finding would seem relevant to a causal inference account.
References:
Magnotti JF, Ma WJ and Beauchamp MS (2013) Causal inference of asynchronous audiovisual speech. Front. Psychol. 4:798. doi: 10.3389/fpsyg.2013.00798
Sato, Y. (2021). Comparing Bayesian models for simultaneity judgement with different causal assumptions. J. Math. Psychol., 102, 102521.
We have revised the Introduction and Discussion to better situate our study within the existing literature. Specifically, we have incorporated the suggested references (lines 66–69) and provided clearer distinctions on how our modeling approach builds on or differs from previous work on causal-inference models, particularly in terms of modeling the recalibration process (lines 75–79). Additionally, we have discussed findings that might contradict the assumptions of the causal-inference model (lines 405–424).
(5) As a minor point, the model relies on simulation, which may limit its take-up/application by others in the field.
Upon acceptance, we will publicly share the code for all models (simulation and parameter fitting) to enable researchers to adapt and apply these models to their own data.
(6) There is little in the way of reassurance regarding the model’s identifiability and recoverability. The authors might for example consider some parameter recovery simulations or similar.
We conducted a model recovery for each of the six models described in the main text and confirmed that the asynchrony-contingent and causal-inference models are identifiable (Supplement Section 11). Simulations of the asynchrony-correction model were sometimes best fit by causal-inference models, because the latter behaves similarly when the prior of a common cause is set to one.
We also conducted a parameter recovery for the winning model, the causal-inference model with modality-specific precision (Supplement Section 13).
Key parameters, including audiovisual bias , amount of auditory latency noise , amount of visual latency noise , criterion, lapse rate showed satisfactory recovery performance. The less accurate recovery of is likely due to a tradeoff with learning rate .
(7) I don't recall any statements about open science and the availability of code and data.
Upon acceptance of the manuscript, all code (simulation and parameter fitting) and data will be made available on OSF and publicly available.
Recommendations for the authors:
Reviewing Editor (Recommendations For The Authors):
In addition to the comments below, we would like to offer the following summary based on the discussion between reviewers:
The major shortcoming of the work is that there should ideally be a bit more evidence to support the model, over and above a demonstration that it captures important trends and beats an account that was already known to be wrong. We suggest you:
(1) Revise the figure legends (Figure 5 and Figure 6E).
We revised all figures and figure legends.
(2) Additionally report model differences in terms of BIC (which will favour the preferred model less under the current analysis);
We now base the model comparison on Bayesian model selection, which approximates and compares model evidence. This method incorporates a strong penalty for model complexity through marginalization over the parameter space (MacKay, 2003).
(3) Move to instead fitting the models multiple times in order to get leave-one-out estimates of best-fitting loglikelihood for each left-out data point (and then sum those for the comparison metric).
Unfortunately, our design is not suitable for cross-validation methods because the model-fitting process is computationally intensive and time-consuming. Each fit of the causal-inference model takes approximately 30 hours, and multiple fits with different initial starting points are required to rule out local minima.
(4) Offering a comparison with a more convincing model (for example an atheoretical fit with free parameters for all adapters, e.g. as suggested by Reviewer 3.
We updated the previous competitor model and included an asynchrony-contingent model, which is capable of predicting the nonlinearity of recalibration (Fig. 3). The causal-inference model still outperformed the asynchrony-contingent model (Fig. 4A). Furthermore, model predictions show that only the causal-inference model captures non-zero recalibration effects for long adapter SOAs at both the group level (Fig. 4B) and individual level (Figure S4).
Reviewer #1 (Recommendations For The Authors):
A larger sample size would be better.
This study used a within-subject design, which included 9 sessions, totaling 13.5 hours per participant. This extensive data collection allows us to better constrain the model for each participant. Our conclusions are based on the different models’ ability to fit individual data rather than on group statistics.
It would be good to better put the study in the context of spatial ventriloquism, where similar model comparisons have been done over the last ten years and there is a large body of work to connect to.
We now discuss our model in relation to models of cross-modal spatial recalibration in the Introduction (lines 70–78) and Discussion (lines 324–330).
Reviewer #2 (Recommendations For The Authors):
Previous authors (e.g. Yarrow et al.,) have described latency shift and criterion change models as providing a good fit of experimental data. Did the authors attempt a criterion shift model in addition to a shift model?
We have considered criterion-shift variants of our atheoretical recalibration models in Supplement Section 1. To summarize the results, we varied two model assumptions: 1) the use of either a Gaussian or an exponential measurement distribution, and 2) recalibration being implemented either as a shift of bias or a criterion. We fit each model variant separately to the ternary TOJ responses of all sessions. Bayesian model comparisons indicated that the bias-shift model with exponential measurement distributions best captured the data of most participants.
Figure 4B - I'm not convinced that the modality-independent uncertainty is anything but a straw man. Models not allowed to be asymmetric do not show asymmetry? (the asymmetry index is irrelevant in the fixed update model as I understand it so it is not surprising the model is identical?).
We included the assumption that temporal uncertainty might be modality-independent for several reasons. First, there is evidence suggesting that a central mechanism governs the precision of temporal-order judgments (Hirsh & Sherrick, 1961), indicating that precision is primarily limited by a central mechanism rather than the sensory channels themselves. Second, from a modeling perspective, it was necessary to test whether an audio-visual temporal bias alone, i.e., assuming modality-independent uncertainty, could introduce asymmetry across adapter SOAs. Additionally, most previous studies implicitly assumed symmetric likelihoods, i.e., modality-independent latency noise, by fitting cumulative Gaussians to the psychometric curves derived from 2AFC-TOJ tasks (Di Luca et al., 2009; Fujisaki et al., 2004; Harrar & Harris, 2005; Keetels & Vroomen, 2007; Navarra et al., 2005; Tanaka et al., 2011; Vatakis et al., 2007, 2008; Vroomen et al., 2004).
Why does a zero SOA adapter shift the pss towards auditory leading? Is this a consequence of the previous day’s conditioning - it’s not clear from the methods whether all listeners had the same SOA conditioning sequence across days.
The auditory-leading recalibration effect for an adapter SOA of zero has been consistently reported in previous studies (e.g., Fujisaki et al., 2004; Vroomen et al., 2004). This effect symbolizes the asymmetry in recalibration. This asymmetry can be explained by differences across modalities in the noisiness of the latencies (Figure 5C) in combination with audiovisual temporal bias (Figure S8).
We added details about the order of testing to the Methods section (lines 456–457).
Reviewer #3 (Recommendations For The Authors):
Abstract
“Our results indicate that human observers employ causal-inference-based percepts to recalibrate cross-modal temporal perception” Your results indicate this is plausible. However, this statement (basically repeated at the end of the intro and again in the discussion) is - in my opinion - too strong.
We have revised the statement as suggested.
Intro and later
Within the wider literature on relative timing perception, the temporal order judgement (TOJ) task refers to a task with just two response options. Tasks with three response options, as employed here, are typically referred to as ternary judgments. I would suggest language consistent with the existing literature (or if not, the contrast to standard usage could be clarified).
Ref: Ulrich, R. (1987). Threshold models of temporal-order judgments evaluated by a ternary response task. Percept. Psychophys., 42, 224-239.
We revised the term for the task as suggested throughout the manuscript.
Results, 2.2.2
“However, temporal precision might not be due to the variability of arrival latency.” Indeed, although there is some recent evidence that it might be.
Ref: Yarrow, K., Kohl, C, Segasby, T., Kaur Bansal, R., Rowe, P., & Arnold, D.H. Neural-latency noise places limits on human sensitivity to the timing of events. Cognition, 222, 105012 (2022).
We included the reference as suggested (lines 245–248).
Methods, 4.3.
Should there be some information here about the order of adaptation sessions (e.g. random for each observer)?
We added details about the order of testing to the Methods section (lines 456–457).
Supplemental material section 1.
Here, you test whether the changes resulting from recalibration look more like a shift of the entire psychometric function or an expansion of the psychometric function on one side (most straightforwardly compatible with a change of one decision criterion). Fine, but the way you have done this is odd, because you have introduced a further difference in the models (Gaussian vs. exponential latency noise) so that you cannot actually conclude that the trend towards a win for the bias-shift model is simply down to the bias vs. criterion difference. It could just as easily be down to the different shapes of psychometric functions that the two models can predict (with the exponential noise model permitting asymmetry in slopes). There seems to be no reason that this comparison cannot be made entirely within the exponential noise framework (by a very simple reparameterization that focuses on the two boundaries rather than the midpoint and extent of the decision window). Then, you would be focusing entirely on the question of interest. It would also equate model parameters, removing any reliance on asymptotic assumptions being met for AIC.
We revised our exploration of atheoretical recalibration models. To summarize the results, we varied two model assumptions: 1) the use of either a Gaussian or an exponential measurement distribution, and 2) recalibration being implemented either as a shift of the cross-modal temporal bias or as a shift of the criterion. We fit each model separately to the ternary TOJ responses of all sessions. Bayesian model comparisons indicated that the bias-shift model with exponential measurement distributions best described the data of most participants.
References
Di Luca, M., Machulla, T.-K., & Ernst, M. O. (2009). Recalibration of multisensory simultaneity:
cross-modal transfer coincides with a change in perceptual latency. Journal of Vision, 9(12), Article 7.
Fujisaki, W., Shimojo, S., Kashino, M., & Nishida, S. ’ya. (2004). Recalibration of audiovisual simultaneity. Nature Neuroscience, 7(7), 773–778.
Harrar, V., & Harris, L. R. (2005). Simultaneity constancy: detecting events with touch and vision. Experimental Brain Research. Experimentelle Hirnforschung. Experimentation Cerebrale, 166(3-4), 465–473.
Hirsh, I. J., & Sherrick, C. E., Jr. (1961). Perceived order in different sense modalities. Journal of Experimental Psychology, 62(5), 423–432.
Keetels, M., & Vroomen, J. (2007). No effect of auditory-visual spatial disparity on temporal recalibration. Experimental Brain Research. Experimentelle Hirnforschung. Experimentation Cerebrale, 182(4), 559–565.
MacKay, D. J. (2003). Information theory, inference and learning algorithms.https://citeseerx.ist.psu.edu/document?repid=rep1&type=pdf&doi=201b835c3f3a3626ca07b e68cc28cf7d286bf8d5
Navarra, J., Vatakis, A., Zampini, M., Soto-Faraco, S., Humphreys, W., & Spence, C. (2005). Exposure to asynchronous audiovisual speech extends the temporal window for audiovisual integration. Brain Research. Cognitive Brain Research, 25(2), 499–507.
Tanaka, A., Asakawa, K., & Imai, H. (2011). The change in perceptual synchrony between auditory and visual speech after exposure to asynchronous speech. Neuroreport, 22(14), 684–688.
Vatakis, A., Navarra, J., Soto-Faraco, S., & Spence, C. (2007). Temporal recalibration during asynchronous audiovisual speech perception. Experimental Brain Research. Experimentelle Hirnforschung. Experimentation Cerebrale, 181(1), 173–181.
Vatakis, A., Navarra, J., Soto-Faraco, S., & Spence, C. (2008). Audiovisual temporal adaptation of speech: temporal order versus simultaneity judgments. Experimental Brain Research. Experimentelle Hirnforschung. Experimentation Cerebrale, 185(3), 521–529.
Vroomen, J., Keetels, M., de Gelder, B., & Bertelson, P. (2004). Recalibration of temporal order perception by exposure to audio-visual asynchrony. Brain Research. Cognitive Brain Research, 22(1), 32–35.
-
-
www.biorxiv.org www.biorxiv.org
-
eLife Assessment
This valuable study presents the design of a new device for using high-density electrophysiological probes ('Neuropixels') in freely moving rodents. The evidence demonstrating the system's versatility and ability to record high-quality extracellular data in both mice and rats is compelling. This study will be of significant interest to neuroscientists performing chronic electrophysiological recordings.
-
Reviewer #1 (Public review):
Summary:
In this manuscript by Bimbard et al., a new method to perform stable recordings over long periods of time with neuropixels as well as the technical details on how the electrodes can be explanted for a follow up reuse is provided. I think the description of all parts of the method are very clear, and the validation analyses (n of units per day over time, RMS over recording days...) are very convincing. I however missed a stronger emphasis on why this could provide a big impact on the ephys community, by enabling new analyses, new behavior correlation studies or neurophysiological mechanisms across temporal scales that were previously inaccessible with high temporal resolution (i.e. not with imaging).
Strengths:
Open source method. Validation across laboratories. Across species (mice and rats) demonstration of its use and in different behavioral conditions (head-fixed and freely moving). The implant offers a major advance compared to previous methods and that will help the community generate richer datasets.
Weaknesses:
None noted.
-
Reviewer #2 (Public review):
Summary:
This work by Bimbard et al., introduces a new implant for Neuropixels probes. While Neuropixels probes have critically improved and extended our ability to record the activity of a large number of neurons with high temporal resolution, the use of these expensive devices in chronic experiments has so far been hampered by the difficulty of safely implanting them and, importantly, to explant and reuse them after conclusion of the experiment. The authors present a newly designed two-part implant, consisting of a docking and a payload module, that allows for secure implantation and straightforward recovery of the probes. The implant is lightweight, making it amenable for use in mice and rats, and customizable. The authors provide schematics and files for printing of the implants, which can be easily modified and adapted to custom experiments by researchers with little to no design experience. Importantly, the authors demonstrate the successful use of this implant across multiple use cases, in head-fixed and freely moving experiments, in mice and rats, with different versions of Neuropixels probes and across 8 different labs. Taken together, the presented implants promise to make chronic Neuropixels recordings and long-term studies of neuronal activity significantly easier and attainable for both current and future Neuropixels users.
Strengths:<br /> - The implants have been successfully tested across 8 different laboratories, in mice and rats, in head-fixed and freely moving conditions and have been adapted in multiple ways for a number of distinct experiments.<br /> - Implants are easily customizable and authors provide a straightforward approach for customization across multiple design dimensions even for researchers not experienced in design.<br /> - The authors provide clear and straightforward descriptions of the construction, implantation and explant of the described implants.<br /> - The split of the implant into a docking and payload module makes reuse even in different experiments (using different docking modules) easy.<br /> - The authors demonstrate that implants can be re-used multiple times and still allow for high-quality recordings.<br /> - The authors show that the chronic implantations allow for the tracking of individual neurons across days and weeks (using additional software tracking solutions), which is critical for a large number of experiments requiring the description of neuronal activity, e.g. throughout learning processes.<br /> - The authors show that implanted animals can even perform complex behavioral tasks, with no apparent reduction in their performance.
-
Reviewer #3 (Public review):
Summary:
In this manuscript, Bimbard and colleagues describe a new implant apparatus called "Apollo Implant", which should facilitate recording in freely moving rodents (both mice and rats) using Neuropixels probes. The authors collected data from both mice and rats, they used 3 different versions of Neuropixels, multiple labs have already adopted this method, which is impressive. They openly share their CAD designs and surgery protocol to further facilitate the adaptation of their method.
Strengths:
Overall, the "Apollo Implant" is easy to use and adapt, as it has been used in other laboratories successfully and custom modifications are already available. The device is reproducible using common 3D printing services and can be easily modified thanks to its CAD design (the video explaining this is extremely helpful). The weight and price are amazing compared to other systems for rigid silicon probes allowing a wide range of use of the "Apollo Implant".
Weaknesses:
The "Apollo Implant" can only handle Neuropixels probes. It cannot hold other widely used and commercially available silicon probes. Certain angles and distances may be better served by 2 implants.
-
Author response:
The following is the authors’ response to the original reviews.
Reviewer 1 (Public Review):
Summary:
In this manuscript by Bimbard et al., a new method to perform stable recordings over long periods of time with neuropixels, as well as the technical details on how the electrodes can be explanted for follow-up reuse, is provided. I think the description of all parts of the method is very clear, and the validation analyses (n of units per day over time, RMS over recording days...) are very convincing. I however missed a stronger emphasis on why this could provide a big impact on the ephys community, by enabling new analyses, new behavior correlation studies, or neurophysiological mechanisms across temporal scales.
Strengths:
Open source method. Validation across laboratories. Across species (mice and rats) demonstration of its use and in different behavioral conditions (head-fixed and freely moving).
Weaknesses:
Weak emphasis on what can be enabled with this new method that didn't exist before.
We thank the reviewer for highlighting the limited discussion around scientific impact. Our implant has several advantages which combine to make it much more accessible than previous solutions. This enables a variety of recording configurations that would not have been possible with previous designs, facilitating recordings from a wider range of brain regions, animals, and experimental setups. In short, there are three key advances which we now emphasise in the manuscript:
Adaptability: The CAD files can be readily adapted to a wide range of configurations (implantation depth, angle, position of headstage, etc.). Labs have already modified the design for their needs, and re-shared with the community (Discussion, Para 5).
Weight: Because of the lightweight design, experimenters can i) perform complex and demanding freely moving tasks as we exemplify in the manuscript, and ii) implant female and water restricted mice while respecting animal welfare weight limitations (Flexible design, Para 1).
Cost: At ~$10, our implant is significantly cheaper than published alternatives, which makes it affordable to more labs and means that testing modifications is cost-effective (Discussion, Para 4).
Reviewer 1 (Recommendations For The Authors):
- Differences between mice and rats seem very significant. Although this is probably not surprising, I suggest that the authors comment on this to make it clear to anyone trying to use in different species that are not quantified in the main figures.
The reviewer is correct—there are qualitative differences between mice and rats, particularly with respect to the unit median amplitude. We have added a comment in the discussion to highlight these inter-species variations (Discussion, Para 7)
- Another comment that would be useful to have would be how to tackle the problem of tracking the same neuron across days. Even if currently impossible, it could be useful to provide discussion along those lines as to where future improvements (either in hardware or software) can be made.
We thank the reviewer for highlighting this. Figure. 5 does show data from tracking the same neuron across days (and even months). We have modified the language to make this clear.
Reviewer 2 (Public Review):
Summary:
This work by Bimbard et al., introduces a new implant for Neuropixels probes. While Neuropixels probes have critically improved and extended our ability to record the activity of a large number of neurons with high temporal resolution, the use of these expensive devices in chronic experiments has so far been hampered by the difficulty of safely implanting them and, importantly, to explant and reuse them after conclusion of the experiment. The authors present a newly designed two-part implant, consisting of a docking and a payload module, that allows for secure implantation and straightforward recovery of the probes. The implant is lightweight, making it amenable for use in mice and rats, and customizable. The authors provide schematics and files for printing of the implants, which can be easily modified and adapted to custom experiments by researchers with little to no design experience. Importantly, the authors demonstrate the successful use of this implant across multiple use cases, in head-fixed and freely moving experiments, in mice and rats, with different versions of Neuropixels probes, and across 8 different labs. Taken together, the presented implants promise to make chronic Neuropixel recordings and long-term studies of neuronal activity significantly easier and attainable for both current and future Neuropixels users.
Strengths:
The implants have been successfully tested across 8 different laboratories, in mice and rats, in headfixed and freely moving conditions, and have been adapted in multiple ways for a number of distinct experiments.
Implants are easily customizable and the authors provide a straightforward approach for customization across multiple design dimensions even for researchers not experienced in design.
The authors provide clear and straightforward descriptions of the construction, implantation, and explant of the described implants.
The split of the implant into a docking and payload module makes reuse even in different experiments (using different docking modules) easy.
The authors demonstrate that implants can be re-used multiple times and still allow for high-quality recordings.
The authors show that the chronic implantations allow for the tracking of individual neurons across days and weeks (using additional software tracking solutions), which is critical for a large number of experiments requiring the description of neuronal activity, e.g. throughout learning processes.
The authors show that implanted animals can even perform complex behavioral tasks, with no apparent reduction in their performance.
Weaknesses:
While implanted animals can still perform complex behavioral tasks, the authors describe that the implants may reduce the animals' mobility, as measured by prolonged reaction times. However, the presented data does not allow us to judge whether this effect is specifically due to the presented implant or whether any implant or just tethering of the animals per se would have the same effects.
The reviewer is correct: some of the differences in mouse reaction time could be due to the tether rather than the implant. As these experiments were also performed in water-restricted female mice with the heavier Neuropixels 1.0 implant, our data represent the maximal impact of the implant, and we have highlighted this point in the revision (Freely behaving animals, Para 2).
While the authors make certain comparisons to other, previously published approaches for chronic implantation and re-use of Neuropixels probes, it is hard to make conclusive comparisons and judge the advantages of the current implant. For example, while the authors emphasize that the lower weight of their implant allows them to perform recordings in mice (and is surely advantageous), the previously described, heavier implants they mention (Steinmetz et al., 2021; van Daal et al., 2021), have also been used in mice. Whether the weight difference makes a difference in practice therefore remains somewhat unclear.
The reviewer is correct: without a direct comparison, we cannot be certain that our smaller, lighter implant improves behavioural results (although this is supported by the literature, e.g. Newman et al, 2023). However, the reduced weight of our implant is critical for several laboratories represented in this manuscript due to animal welfare requirements. Indeed, in van Daal et al the authors “recommend a [mouse] weight of >25 g for implanting Neuropixels 1.0 probes.” This limit precludes using (the vast majority of) female mice, or water-restricted animals. Conversely, our implant can be routinely used with lighter, water-restricted male and female mice. We emphasised this point in the revision (Discussion, Para 2).
The non-permanent integration of the headstages into the implant, while allowing for the use of the same headstage for multiple animals in parallel, requires repeated connections and does not provide strong protection for the implant. This may especially be an issue for the use in rats, requiring additional protective components as in the presented rat experiments.
We apologise for not clarifying the various headstage holder options in the manuscript and we have now addressed this in the revision (Freely behaving animals, Para 1&2). Our repository has headstage holder designs (in the XtraModifications/Mouse_FreelyMoving folder). This allows leaving the headstage on the implant, and thus minimize the number of connections (albeit increasing the weight for the mouse). Indeed, mice recorded while performing the task described in our manuscript had the head-stage semi-permanently integrated to the implant, and we now highlight this in the revision (Freely behaving animals, Para 1).
Reviewer 2 (Recommendations For The Authors):
The description of the different versions of the head-stage holders should be more clear, listing also advantages/disadvantages of the different solutions. It would be also useful if the authors could comment on the use of these head-stage holders in rats, since they do not seem to offer much protection.
We thank the reviewer for this point, and we have added notes to the manuscript to clarify the various advantages of the different headstage-holders, and that the headstage can be permanently attached to the implant (Freely behaving animals, Para 1&2). This is the primary advantage of these solutions compared with the minimal implant—at the expense of increasing the implant weight.
The reviewer’s concerns regarding the lack of protection for implants in rats is well-placed, and we now emphasise that these experiments benefited from the additional protection of an external 3D casing, which is likely critical for use in larger animals (Freely behaving animals, Para 1).
While re-used probes seem to show similar yields across multiple uses (Figure 4C), it seems as if there is a much higher variability of the yield for probes that are used for the first (maybe also second) time. There are probes with much higher than average yields, but it seems none of the re-used probes show such high yields. Is this a real effect? Is this because the high-yield probes happened to have not been used multiple times? Is there an analysis the authors could provide to reduce the concern that yields may generally be lower for re-used probes/that there are no very high yields for re-used probes?
We understand the reviewer’s concern with respect to Figure 4C, however, the re-use of any given probe was determined only by the experimental needs of the project. It is therefore not possible that there is a relationship between probes selected for re-use and unit-yield. We now specify this in the revised legend of Figure 4C. This variability (and the consistency in yield across uses) likely stems from differences between labs, brain region, and implantation protocol.
The authors claim that a 'large fraction' of units could be tracked for the entire duration of the experiment (Figure 5A,B). They mention in the discussion that quantification can be found in a different manuscript (van Beest et al., 2023), but this should also be quantified here in at least some more detail, also for other animals in addition to the one mouse which was recorded for ~100 days. What fraction can be held for different durations? What is the average holding time, etc.?
We agree with the reviewer, and have now added new panels quantifying the probability and reliability of tracking a neuron across days (Figure 5E-F). We also comment on the change in tracking probability across time, and its variability across recordings (Stability, Para 4).
Reviewer 3 (Public Reviews):
Summary:
In this manuscript, Bimbard and colleagues describe a new implant apparatus called "Apollo Implant", which should facilitate recording in freely moving rodents (mice and rats) using Neuropixels probes. The authors collected data from both mice and rats, they used 3 different versions of Neuropixels, multiple labs have already adopted this method, which is impressive. They openly share their CAD designs and surgery protocol to further facilitate the adaptation of their method.
Strengths:
Overall, the "Apollo Implant" is easy to use and adapt, as it has been used in other laboratories successfully and custom modifications are already available. The device is reproducible using common 3D printing services and can be easily modified thanks to its CAD design (the video explaining this is extremely helpful). The weight and price are amazing compared to other systems for rigid silicon probes allowing a wide range of use of the "Apollo Implant".
Weaknesses:
The "Apollo Implant" can only handle Neuropixels probes. It cannot hold other widely used and commercially available silicon probes. Certain angles and distances are not possible in their current form (distance between probes 1.8 to 4mm, implantation depth 2-6.5 mm, or angle of insertion up to 20 degrees).
As we now discuss in the manuscript (Discussion, Para 4), one implant accommodating the diversity of the existing probes is beyond the scope of this project. However, because the design is adaptable, groups should be able to modify the current version of the implant to adapt to their electrodes’ size and format (and can highlight any issues in the Github “Discussions” area).
With Neuropixels, the current range of depths covers practically all trajectories in the mouse brain. In rats, where deeper penetrations may be useful, the experimenter can attach the probe at a lower point in the payload module to expose more of the shank. We now specify this in the Github repository.
We have now extended the range of inter-probe distances from a maximum of 4 mm to 6.5 mm. Distances beyond this may be better served by 2 implants, and smaller distances could be achieved by attaching two probes on the same side of the docking module. These points are now specified in the revised manuscript (Flexible design, Para 2).
Reviewer 3 (Recommendations For The Authors):
I have only a few questions and suggestions:
Is it possible to create step-by-step instructions for explantation (similar to Figure-1 with CAD schematics)? You mention that payload holder is attached to a micromanipulator, but it is unclear how this is achieved. How was the payload secured with a screw (which screw)? My understanding is that as you turn the screw in the payload holder, it will grab onto the payload module from both sides, but the screw is not in contact with the payload module, correct? I found the screw type on your GitHub, but it would be great if you could add a bill of materials in a table format, so readers don't have to jump between GitHub and article.
We have now added a bill of materials to the revised manuscript (Implant design and materials, Para 2), although up-to-date links are still provided on the Github repository due to changing availability.
What happens if you do a dual probe implant and cannot avoid blood vessels in one or both of the craniotomies due to the pre-defined geometry? Is this a frequent issue? How can you overcome this during the surgery?
Blood vessels can be difficult to avoid in some cases, but we are typically able to rotate/reposition the probes to solve this issue. In some cases, with 4-shank probes, the blood vessel can be positioned between individual probe shanks. We now detail this in the revised manuscript (Assembly and implantation, Para 3).
I assume if the head is not aligned (line-332) the probe can break during recovery. Have you experienced this during explanation?
As we now specify in the manuscript (Explantation, Para 2), we are careful when explanting the probe to avoid this issue, and due to the flexibility of the shanks, it does not appear to be a major concern.
Why did you remove the UV glue (line 435)? How can you level the skull? I assume you have covered bregma and lambda in the first surgery which can create an uneven surface to measure even after you remove the UV glue.
We thank the reviewer for highlighting this omission from the methods. We now explain (Implantation, Carandini-Harris laboratory) that the UV-glue is completely removed during the second surgery, and the skull is cleaned and scored. This improves the adhesion of the dental cement, and allows for reliable levelling of the skull.
In line 112 you mentioned that the number of recorded neurons was stable; however, you found a 3% mean decrease in unit count per day (line 120). Stability is great until day 10 (in Figure 4A), but it deteriorates quickly after that. I think it would help readers if you could add the mean{plus minus}SEM of recorded units in the text for days 1-10, days 11-50, and days 51-100 (using the data from Figure 4A).
We have now added Supplementary Figure 4 to show unit count across bins of days, and a corresponding comment in the text (Stability, Para 2).
A full survey of the probe (Figure 4B) means that you recorded neuronal activity across 4-5000 channels (depending on how many channels were in the brain). While it is clear that a full probe survey can reduce the number of animals needed for a study, it is also clear in this figure that by day 25 you can record ~300 neurons on 4000 channels. It would be great to discuss this in the discussion and give a balanced view of the long-term stability of these recordings.
Overall, keeping a large number of units for a long time still remains a challenge. Here, we could record on average 85 neurons per bank during the first 10 days, and then only 45 after 50 days. It is important to note that our quantification averages across all banks recorded, including those in a ventricle or partly outside of the brain. Thus, our results represent a lower estimate of the total neurons recorded. Our new Supplementary Figure 4 helps to highlight the diversity of neuron number recorded per animal. Further improvements in surgical techniques and spike sorting will likely improve stability further and we have now added this comment in the manuscript (Stability, Para 2). For example, we observed excellent stability in a mouse where the craniotomy was stabilized with KwikSil (Supplementary Figure 5).
The RMS value was around 20 uV in some of the recordings, and according to Figure 4G it is around 16 uV on average. Is it safe to accept putative single units with 20 uV amplitudes, when the baseline noise level is this close to the spike peak-to-peak amplitude?
On average, less than 1% of the units selected using all the other metrics except the amplitude had an amplitude below 30 µV, and 2.6% below 50 µV. Increasing the threshold to 30 µV, or even 50 µV, did not affect the results. We have now added this comment in the Methods (Data processing, Para 3).
Can you add the waveform and ISIH of the example unit from day 106 to Figure 5?
We have now added 4 units tracked up to day 106 in Figure 5.
Could you move Supplementary Figure 3A to Figure 4? The number of units is more valuable information than the RMS noise level. I understand that you don't have such a nice coverage of all the days as in Figure 3 and 4, but you might be able to group for the first 3 days and the last 3 days (and if data is available, the middle 3 days) as a boxplot. The goal would be for the reader to be able to see whether there is any change in the number of single units over time.
We agree with the reviewer, the number of units is more valuable. We had included this information in Figure 4A-F, but we have made edits to the text to make it clearer that this is what is being shown. The data from Figure 3A is already contained within Figure 4, but in 3A the data is separated by individual labs.
Product numbers are missing in multiple places: line-285 (screw), line-288 (screw), line-290 (screw), line-309 (manipulator), line-374 (gold pin and silver wire), line-384 (Mill-Max), line-394 (silver wire), and many more. It would be great if you could add all these details, so people can replicate your protocol.
We thank the reviewer for highlighting this, and we have added details of screw thread-size and length to relevant parts of the manuscript, although any type of screw can be used. Similarly, other components are non-specific (e.g. multiple silver-wire diameters were used across labs), so we have not included specific product numbers for general consumer items (like screws and silver wires) to avoid indicating that a specific part must be purchased.
While it is great to see lab-specific methods, I am not sure in their current form it helps to understand the protocol better. The information is conveyed in different ways (I assume these were written by different people), in different orders, and in different depths (some mention probe implant location relative to bregma and midline, some don't). There are many different glues, epoxies, cement, wires, and pins. I would recommend rewriting these methods sections under a unified template, so it is easier to follow.
We thank the reviewer for this suggestion and we have rewritten this section of the methods accordingly. We now use a template structure to simplify the comparisons between labs: the same template is used for each lab in each section (payload module assembly, implantation, and data acquisition).
Line-307: why is a skull screw optional for grounding? What did you use for ground and reference if not a ground screw?
We now specify in the manuscript that during head-fixed experiments, the animal’s headplate can be used for grounding, and combined with internal referencing provided by the Neuropixels, yielded lownoise recordings (Implantation protocol, Methods).
-
-
www.biorxiv.org www.biorxiv.org
-
eLife Assessment
The manuscript provides important new insights into the mechanisms of statistical learning in early human development, showing that statistical learning in neonates occurs robustly and is not limited to linguistic features but occurs across different domains. The evidence is convincing and the findings are highly relevant for researchers working in several domains, including developmental cognitive neuroscience, developmental psychology, linguistics, and speech pathology.
-
Reviewer #1 (Public review):
Summary:
Parsing speech into meaningful linguistic units is a fundamental yet challenging task that infants face while acquiring the native language. Computing transitional probabilities (TPs) between syllables is a segmentation cue well-attested since birth. In this research, the authors examine whether newborns compute TPs over any available speech feature (linguistic and non-linguistic), or whether by contrast newborns favor computation of TPs over linguistic content over non-linguistic speech features such as speaker voice. Using EEG and the artificial language learning paradigm, they record the neural responses of two groups of newborns presented with speech streams in which either phonetic content or speaker voice are structured to provide TPs informative of word boundaries, while the other dimension provides uninformative information. They compare newborns' neural responses to these structured streams to their processing of a stream in which both dimensions vary randomly. After the random and structured familiarization streams, the newborns are presented with (pseudo)words as defined by their informative TPs, as well as partwords (that is, sequences that straddle a word boundary), extracted from the same streams. Analysis of the neural responses show that while newborns neural activity entrained to the syllabic rate (2 Hz) when listening to the random and structured streams, it additionally entrained at the word rate (4 Hz) only when listening to the structured streams, finding no differential response between the streams structured around voice or phonetic information. Newborns showed also different neural activity in response to the words and part words. In sum, the study reveals that newborns compute TPs over linguistic and non-linguistic features of speech, these are calculated independently, and linguistic features do not lead to a processing advantage.
Strengths:
This interesting research furthers our knowledge of the scope of the statistical learning mechanism, which is confirmed to be a general-purpose powerful tool that allows humans to extract patterns of co-occurring events while revealing no apparent preferential processing for linguistic features. To answer its question, the study combines a highly replicated and well-established paradigm, i.e. the use of an artificial language in which pseudowords are concatenated to yield informative TPs to word boundaries, with a state-of-the-art EEG analysis, i.e. neural entrainment. The sample size of the groups is sufficient to ensure power, and the design and analysis are solid and have been successfully employed before.
Weaknesses:
There are no significant weaknesses to signal in the manuscript. However, in order to fully conclude that there is no obvious advantage for the linguistic dimension in neonates, future studies should pit both dimensions against each other, to determine whether statistical learning weighs linguistic and non-linguistic features equally, or whether phonetic content is preferentially processed.
To sum up, the authors achieved their central aim of determining whether TPs are computed over both linguistic and non-linguistic features, and their conclusions are supported by the results. This research is important for researchers working on language and cognitive development, and language processing, as well as for those working on cross-species comparative approaches.
Comments on revisions:
The authors have addressed my suggestions. I have no further comments.
-
Reviewer #2 (Public review):
Summary:
The manuscript investigates to what degree neonates show evidence for statistical learning from regularities in streams of syllables, either with respect to phonemes or with respect to speaker identity. Using EEG, the authors found evidence for both, stronger entrainment to regularities as well as ERP differences in response to violations of previously introduced regularities. In addition, violations of phoneme regularities elicited an ERP pattern which the authors argue might index a precursor of the N400 response in older children and adults.
Strengths:
All in all, this is a very convincing paper, which uses a clever manipulation of syllable streams to target the processing of different features. The combination of neural entrainment and ERP analysis allows for the assessment of different processing stages, and implementing this paradigm in a comparably large sample of neonates is impressive.
Weaknesses
The authors addressed all the concerns I previously raised well and I have no further comments.
-
Reviewer #3 (Public review):
Summary:
This study is focused on testing whether statistical learning (a mechanism for parsing the speech signal into smaller chunks) preferentially operates over certain features of the speech at birth in humans. The features under investigation are phonetic content and speaker identity. Newborns are tested in an EEG paradigm in which they are exposed to a long stream of syllables. In Experiment 1, newborns are familiarized with a sound stream that comprises regularities (transitional probabilities) over syllables (e.g., "pe" followed by "tu" in "petu" with 1.0 probability) while the voices uttering the syllables remain random. In Experiment 2, newborns are familiarized with the same sound stream but, this time, the regularities are built over voices (e.g., "green voice" followed by "red voice" with 1.0 probability) while the concatenation of syllables stays random. At the test, all newborns listened to duplets (individual chunks) that either matched or violated the structure of the familiarization. In both experiments, newborns showed neural entrainment to the regularities implemented in the stream, but only the duplets defined by transitional probabilities over syllables (aka word forms) elicited a N400 ERP component. These results suggest that statistical learning operates in parallel and independently on different dimensions of the speech already at birth and that there seems to be an advantage for processing statistics defining word forms rather than voice patterns.
Strengths:
This paper presents an original experimental design that combines two types of statistical regularities in a speech input. The design is robust and appropriate for EEG with newborns. I appreciated the clarity of the Methods section. There is also a behavioral experiment with adults that acts like a control study for newborns. The research question is interesting, and the results add new information about how statistical learning works at the beginning of postnatal life, and on which features of the speech. The figures are clear and helpful in understanding the methods, especially the stimuli and how the regularities were implemented.
Weaknesses:
I appreciated how the authors addressed my previous comments and concerns. I am satisfied with the changes made by the authors. I believe the paper reads much better. Also, the adjustment to the theoretical framework suits well.
-
Author response:
The following is the authors’ response to the original reviews.
We thank the three reviewers for their positive comments and useful suggestions. We have implemented most of the reviewers’ recommendations and hope the manuscript is clearer now.
The main modifications are:
- A revision of the introduction to better explain what Transitional Probabilities are and clarify the rationale of the experimental design
- A revision of the discussion
- To tune down and better explain the interpretation of the different responses between duplets after a stream with phonetic or voice regularities (possibly an N400).
- To better clarify the framing of statistical learning as a universal learning mechanism that might share computational principles across features (or domains).
Below, we provide detailed answers to each reviewer's point.
Response to Reviewer 1:
There are no significant weaknesses to signal in the manuscript. However, in order to fully conclude that there is no obvious advantage for the linguistic dimension in neonates, it would have been most useful to test a third condition in which the two dimensions were pitted against each other, that is, in which they provide conflicting information as to the boundaries of the words comprised in the artificial language.
This last condition would have allowed us to determine whether statistical learning weighs linguistic and non-linguistic features equally, or whether phonetic content is preferentially processed.
We appreciate the reviewers' suggestion that a stream with conflicting information would provide valuable insights. In the present study, we started with a simpler case involving two orthogonal features (i.e., phonemes and voices), with one feature being informative and the other uninformative, and we found similar learning capacities for both. Future work should explore whether infants—and humans more broadly—can simultaneously track regularities in multiple speech features. However, creating a stream with two conflicting statistical structures is challenging. To use neural entrainment, the two features must lead to segmentation at different chunk sizes so that their effects lead to changes in power/PLV at different frequencies—for instance, using duplets for the voice dimension and triplets for the linguistic dimension (or vice versa). Consequently, the two dimensions would not be directly comparable within the same participant in terms of the number of distinguishable syllables/voices, memory demand, or SNR given the 1/F decrease in amplitude of background EEG activity. This would involve comparisons between two distinct groups counter-balancing chunk size and linguistic non-linguistic dimension. Considering the test phase, words for one dimension would have been part-words for the other dimension. As we are measuring differences and not preferences, interpreting the results would also have been difficult. Additionally, it may be difficult to find a sufficient number of clearly discriminable voices for such a design (triplets imply 12 voices). Therefore, an entirely different experimental paradigm would need to be developed.
If such a design were tested, one possibility is that the regularities for the two dimensions are calculated in parallel, in line with the idea that the calculation of statistical regularities is a ubiquitous implicit mechanism (see Benjamin et al., 2024, for a proposed neural mechanism). Yet, similar to our present study, possibly only phonetic features would be used as word candidates. Another possibility is that only one informative feature would be explicitly processed at a time due to the serial nature of perceptual awareness, which may prioritise one feature over the other.
We added one sentence in the discussion stating that more research is needed to understand whether infants can track both regularities simultaneously (p.13, l.270 “Future work could explore whether they can simultaneously track multiple regularities.”).
Note: The reviewer’s summary contains a typo: syllabic rate (4 Hz) –not 2 Hz, and word rate (2 Hz) –not 4 Hz.
Response to Reviewer 2:
N400: I am skeptical regarding the interpretation of the phoneme-specific ERP effect as a precursor of the N400 and would suggest toning it down. While the authors are correct in that infant ERP components are typically slower and more posterior compared to adult components, and the observed pattern is hence consistent with an adult N400, at the same time, it could also be a lot of other things. On a functional level, I can't follow the author's argument as to why a violation in phoneme regularity should elicit an N400, since there is no evidence for any semantic processing involved. In sum, I think there is just not enough evidence from the present paradigm to confidently call it an N400.
The reviewer is correct that we cannot definitively determine the type of processing reflected by the ERP component that appears when neonates hear a duplet after exposure to a stream with phonetic regularities. We interpreted this component as a precursor to the N400, based on prior findings in speech segmentation tasks without semantic content, where a ~400 ms component emerged when adult participants recognised pseudowords (Sander et al., 2002) or during structured streams of syllables (Cunillera et al., 2006, 2009). Additionally, the component we observed had a similar topography and timing to those labelled as N400 in infant studies, where semantic processing was involved (Parise et al., 2010; Friedrich & Friederici, 2011).
Given our experimental design, the difference we observed must be related to the type of regularity during familiarisation (either phonemes or voices). Thus, we interpreted this component as reflecting lexical search— a process which could be triggered by a linguistic structure but which would not be relevant to a non-linguistic regularity such as voices. However, we are open to alternative interpretations. In any case, this difference between the two streams reveals that computing regularities based on phonemes versus voices does not lead to the same processes.
We revised the abstract (p.2, l.33) and the discussion of this result (p.15, l.299), toning them down. We hope the rationale of the interpretation is clearer now, as is the fact that it is just one possible interpretation of the results.
Female and male voices: Why did the authors choose to include male and female voices? While using both female and male stimuli of course leads to a higher generalizability, it also introduces a second dimension for one feature that is not present for this other (i.e., phoneme for Experiment 1 and voice identity plus gender for Experiment 2). Hence, couldn't it also be that the infants extracted the regularity with which one gender voice followed the other? For instance, in List B, in the words, one gender is always followed by the other (M-F or F-M), while in 2/3 of the part-words, the gender is repeated (F-F and M-M). Wouldn't you expect the same pattern of results if infants learned regularities based on gender rather than identity?
We used three female and three male voices to maximise acoustic variability. The streams were synthesised using MBROLA, which provides a limited set of artificial voices. Indeed, there were not enough French voices of acceptable quality, so we also used two Italian voices (the phonemes used existed in both Italian and French).
Voices differ in timbre, and female voices tend to be higher pitched. However, it is sometimes difficult to categorise low-pitched female voices and high-pitched male voices. Given that gender may be an important factor in infants' speech perception (newborns, for instance, prefer female voices at birth), we conducted tests to assess whether this dimension could have influenced our results.
We report these analyses in SI and referred to them in the methods section (p.25, l.468 “We performed post-hoc tests to ensure that the results were not driven by a perception of two voices: female and male (see SI).”).
We first quantified the transitional probabilities matrices during the structured stream of Experiment 2, considering that there are only two types of voices: Female and Male.
For List A, all transition probabilities are equal to 0.5 (P(M|F), P(F|M), P(M|M), P(F|F)), resulting in flat TPs throughout the stream (see Author response image 1, top). Therefore, we would not expect neural entrainment at the word rate (2 Hz), nor would we anticipate ERP differences between the presented duplets in the test phase.
For List B, P(M|F)=P(F|M)=0.66 while P(M|M)=P(F|F)=0.33. However, this does not produce a regular pattern of TP drops throughout the stream (see Author response image 1, bottom). As a result, strong neural entrainment at 2 Hz was unlikely, although some degree of entrainment might have occasionally occurred due to some drops occurring at a 2 Hz frequency. Regarding the test phase, all three Words and only one Part-word presented alternating patterns (TP=0.6). Therefore, the difference in the ERPs between Words and Part- words in List B might be attributed to gender alternation.
However, it seems unlikely that gender alternation alone explains the entire pattern of results, as the effect is inconsistent and appears in only one of the lists. To rule out this possibility, we analysed the effects in each list separately.
Author response image 1.
Transition probabilities (TPs) across the structured stream in Experiment 2, considering voices processed by gender (Female or Male). Top: List A. Bottom: List B.
We computed the mean activation within the time windows and electrodes of interest and compared the effects of word type and list using a two-way ANOVA. For the difference between Words and Part-words over the positive cluster, we observed a main effect of word type (F(1,31) = 5.902, p = 0.021), with no effects of list or interactions (p > 0.1). Over the negative cluster, we again observed a main effect of word type (F(1,31) = 10.916, p = 0.0016), with no effects of list or interactions (p > 0.1). See Author response image 2.
Author response image 2:
Difference in ERP voltage (Words – Part-words) for the two lists (A and B); W=Words; P=Part-Words,
We conducted a similar analysis for neural entrainment during the structured stream on voices. A comparison of entrainment at 2 Hz between participants who completed List A and List B showed no significant differences (t(30) = -0.27, p = 0.79). A test against zero for each list indicated significant entrainment in both cases (List A: t(17) = 4.44, p = 0.00036; List B: t(13) = 3.16, p = 0.0075). See Author response image 3.
Author response image 3.
Neural entrainment at 2Hz during the structured stream of Experiment 2 for Lists A and B.
Words entrainment over occipital electrodes: Do you have any idea why the duplet entrainment effect occurs over the electrodes it does, in particular over the occipital electrodes (which seems a bit unintuitive given that this is a purely auditory experiment with sleeping neonates).
Neural entrainment might be considered as a succession of evoked response induced by the stream. After applying an average reference in high-density EEG recordings, the auditory ERP in neonates typically consists of a central positivity and a posterior negativity with a source located at the electrical zero in a single-dipole model (i.e. approximately in the superior temporal region (Dehaene-Lambertz & Dehaene, 1994). In adults, because of the average reference (i.e. the sum of voltages is equal to zero at each time point) and because the electrodes cannot capture the negative pole of the auditory response, the negativity is distributed around the head. In infants, however, the brain is higher within the skull, allowing for a more accurate recording of the negative pole of the auditory ERP (see Figure 4 for the location of electrodes in an infant head model).
Besides the posterior electrodes, we can see some entrainment on more anterior electrodes that probably corresponds to the positive pole of the auditory ERP.
We added a phrase in the discussion to explain why we can expect phase-locked activity in posterior electrodes (p.14, l.277: “Auditory ERPs, after reference-averaged, typically consist of a central positivity and posterior negativity”).
Author response image 4:
International 10–20 sensors' location on the skull of an infant template, with the underlying 3-D reconstruction of the grey-white matter interface and projection of each electrode to the cortex. Computed across 16 infants (from Kabdebon et al, Neuroimage, 2014). The O1, O2, T5, and T6 electrodes project lower than in adults.
Response to Reviewer 3:
(1) While it's true that voice is not essential for language (i.e., sign languages are implemented over gestures; the use of voices to produce non-linguistic sounds, like laughter), it is a feature of spoken languages. Thus I'm not sure if we can really consider this study as a comparison between linguistic and non-linguistic dimensions. In turn, I'm not sure that these results show that statistical learning at birth operates on non-linguistic features, being voices a linguistic dimension at least in spoken languages. I'd like to hear the authors' opinions on this.
On one hand, it has been shown that statistical learning (SL) operates across multiple modalities and domains in human adults and animals. On the other hand, SL is considered essential for infants to begin parsing speech. Therefore, we aimed to investigate whether SL capacities at birth are more effective on linguistic dimensions of speech, potentially as a way to promote language learning.
We agree with the reviewer that voices play an important role in communication (e.g., for identifying who is speaking); however, they do not contribute to language structure or meaning, and listeners are expected to normalize across voices to accurately perceive phonemes and words. Thus, voices are speech features but not linguistic features. Additionally, in natural speech, there are no abrupt voice changes within a word as in our experiment; instead, voice changes typically occur on a longer timescale and involve only a limited number of voices, such as in a dialogue. Therefore, computing regularities based on voice changes would not be useful in real-life language learning. We considered that contrasting syllables and voices was an elegant way to test SL beyond its linguistic dimension, as the experimental paradigm is identical in both experiments.
We have rephrased the introduction to make this point clearer. See p.5, l.88-92: “To test this, we have taken advantage of the fact that syllables convey two important pieces of information for humans: what is being said and who is speaking, i.e. linguistic content and speaker’s identity. While statistical learning…”.
Along the same line, in the Discussion section, the present results are interpreted within a theoretical framework showing statistical learning in auditory non-linguistic (string of tones, music) and visual domains as well as visual and other animal species. I'm not sure if that theoretical framework is the right fit for the present results.
(2) I'm not sure whether the fact that we see parallel and independent tracking of statistics in the two dimensions of speech at birth indicates that newborns would be able to do so in all the other dimensions of the speech. If so, what other dimensions are the authors referring to?
The reviewer is correct that demonstrating the universality of SL requires testing additional modalities and acoustic dimensions. However, we postulate that SL is grounded in a basic mechanism of long-term associative learning, as proposed in Benjamin et al. (2024), which relies on a slow decay in the representation of a given event. This simple mechanism, capable of operating on any representational output, accounts for many types of sequence learning reported in the literature (Benjamin et al., in preparation).
We have revised the discussion to clarify this theoretical framework.
In p.13, l.264: “This mechanism might be rooted in associative learning processes relying on the co- existence of event representations driven by slow activation decays (Benjamin et al., 2024). ”
In p., l. 364: “Altogether, our results show that statistical learning works similarly on different speech features in human neonates with no clear advantage for computing linguistically relevant regularities in speech. This supports the idea that statistical learning is a general learning mechanism, probably operating on common computational principles across neural networks (Benjamin et al., 2024)…”.
(3) Lines 341-345: Statistical learning is an evolutionary ancient learning mechanism but I do not think that the present results are showing it. This is a study on human neonates and adults, there are no other animal species involved therefore I do not see a connection with the evolutionary history of statistical learning. It would be much more interesting to make claims on the ontogeny (rather than philogeny) of statistical learning, and what regularities newborns are able to detect right after birth. I believe that this is one of the strengths of this work.
We did not intend to make claims about the phylogeny of SL. Since SL appears to be a learning mechanism shared across species, we use it as a framework to suggest that SL may arise from general operational principles applicable to diverse neural networks. Thus, while it is highly useful for language acquisition, it is not specific to it.
We have removed the sentence “Statistical learning is an evolutionary ancient learning mechanism.”, and replaced it by (p.18, l.364) “Altogether, our results show that statistical learning works similarly on different speech features in human neonates with no clear advantage for computing linguistically relevant regularities in speech.” We now emphasise in the discussion that infants compute regularities on both features and propose that SL might be a universal learning mechanism sharing computational principles (Benjamin et al., 2024) (see point 2).
(4) The description of the stimuli in Lines 110-113 is a bit confusing. In Experiment 1, e.g., "pe" and "tu" are both uttered by the same voice, correct? ("random voice each time" is confusing). Whereas in Experiment 2, e.g., "pe" and "tu" are uttered by different voices, for example, "pe" by yellow voice and "tu" by red voice. If this is correct, then I recommend the authors to rephrase this section to make it more clear.
To clarify, in Experiment 1, the voices were randomly assigned to each syllable, with the constraint that no voice was repeated consecutively. This means that syllables within the same word were spoken by different voices, and each syllable was heard with various voices throughout the stream. As a result, neonates had to retrieve the words based solely on syllabic patterns, without relying on consistent voice associations or specific voice relationships.
In Experiment 2, the design was orthogonal: while the syllables were presented in a random order, the voices followed a structured pattern. Similar to Experiment 1, each syllable (e.g., “pe” and “tu”) was spoken by different voices. The key difference is that in Experiment 2, the structured regularities were applied to the voices rather than the syllables. In other words, the “green” voice was always followed by the “red” voice for example but uttered different syllables.
We have revised the description of the stimuli and the legend of Figure 1 to clarify these important points.
See p.6, l. 113: “The structure consisted of the random concatenation of three duplets (i.e., two-syllable units) defined only by one of the two dimensions. For example, in Experiment 1, one duplet could be petu with each syllable uttered by a random voice each time they appear in the stream (e.g pe is produced by voice1 and tu by voice6 in one instance and in another instance pe is produced by voice3 and tu by
voice2). In contrast, in Experiment 2, one duplet could be the combination [voice1- voice6], each uttering randomly any of the syllables.”
p.20, l. 390 (Figure 1 legend): “For example, the two syllables of the word “petu” were produced by different voices, which randomly changed at each presentation of the word (e.g. “yellow” voice and “green” voice for the first instance, “blue” and “purple” voice for the second instance, etc..). In Experiment 2, the statistical structure was based on voices (TPs alternated between 1 and 0.5), while the syllables changed randomly (uniform TPs of 0.2). For example, the “green” voice was always followed by the “red” voice, but they were randomly saying different syllables “boda” in the first instance, “tupe” in the second instance, etc... “
(5) Line 114: the sentence "they should compute a 36 x 36 TPs matrix relating each acoustic signal, with TPs alternating between 1/6 within words and 1/12 between words" is confusing as it seems like there are different acoustic signals. Can the authors clarify this point?
Thank you for highlighting this point. To clarify, our suggestion is that neonates might not track regularities between phonemes and voices as separate features. Instead, they may treat each syllable-voice combination as a distinct item—for example, "pe" spoken by the "yellow" voice is one item, while "pe" spoken by the "red" voice is another. Under this scenario, there would be a total of 36 unique items (6 syllables × 6 voices), and infants would need to track regularities between these 36 combinations.
We have modified this sentence in the manuscript to make it clearer.
See p.7, l. 120: “If infants at birth compute regularities based on a neural representation of the syllable as a whole, i.e. comprising both phonetic and voice content, this would require computing a 36 × 36 TPs matrix relating each token.”
Reviewer #1 (Recommendations for the authors):
(1) The acronym TP should be spelled out, and a brief description of the fact that dips in TPs signal boundaries while high TPs signal a cohesive unit could be useful for non-specialist readers.
We have added it at the beginning of the introduction (lines 52-60)
(2) p.5, l.76: "Here, we aimed to further characterise the characteristics of this mechanism...". I suggest this is rephrased as "to further characterise this mechanism".
We have changed it as suggested by the reviewer (now p.5, l.81)
(3) p.9, l.172: "[...] this contribution is unlikely since the electrodes differ from the electrodes, showing enhanced word-rate activity at 2 Hz."
It is unclear which electrodes differ from which electrodes. I figure that the authors mean that the electrodes showing stronger activity at 2 Hz differ from those showing it at 4 Hz, but the sentence could use rephrasing.
This part has been rephrased (p.9, l.177-181)
(4) p.10, l.182: "[...] the entrainment during the first minute of the structure stream [… ]".
Structured stream.
It has been corrected (p.10, l.190)
(5) p.12, l.234: "we compared STATISTICAL LEARNING"
Why the use of capitals?
This was an error and it was corrected (p.12, l.242).
(6) p.15, l.298: "[...] suggesting that such negativity might be related to semantic."
The sentence feels incomplete. To semantics? To the processing of semantic information?
The phrase has been corrected (p.15, l.314). Additionally, the discussion of the posterior negativity observed for duplets after familiarisation with a stream with regularities over phonemes has been rephrased (p.15, l.)
(7) Same page, l.301: "3-mo-olds" 3-month-olds.
It has been corrected (now in p.16, l.333)
(8) Same page, l.307: "(see also (Bergelson and Aslin, 2017)" (see also Bergelson and Aslin, 2017).
It has been corrected (now in p.17, l.340)
(9) Same page, l.310: "[...] would be considered as possible candidate" As possible candidates.
This has been rephrased and corrected (now in p.17, l.343)
Reviewer #2 (Recommendations for the authors):
(1) Figure 2: The authors mention a "thick orange line", which I think should be a "thick black line".
We are sorry for this. It has been corrected.
(2) Ln 166: Should be Figure 2C rather than 3C.
It has been corrected (now in p.9, l.173)
(3) Figure 4 is not referenced in the manuscript.
We referred to it now on p. 12, l.236
-
-
www.biorxiv.org www.biorxiv.org
-
eLife Assessment
This study presents a valuable finding on how the interplay between transcription factors SOX2 and OCT4 establishes the pluripotency network in early mouse embryos. The evidence supporting the claims of the authors is solid, although inclusion of additional omics data would further strengthen the study. The work will be of interest to biologists working on embryonic development and gene regulation.
-