Author response:
We are grateful for the effort and time invested in reviewing our manuscript. We find the comments and suggestions very helpful for improving the manuscript, and we will address them in a revised submission.
Author response:
We are grateful for the effort and time invested in reviewing our manuscript. We find the comments and suggestions very helpful for improving the manuscript, and we will address them in a revised submission.
eLife Assessment
This valuable study examined how sensory adaptation supports visual perception in the presence of noise. The authors used a combination of human psychophysics, electroencephalography (EEG), and deep neural networks to show that adaptation to noise can improve perception. The results are solid but are, at present, weakened by a number of concerns, including some related to the experimental design and some regarding the interpretation of the results in terms of particular mechanisms. With these concerns adequately addressed, the study and conclusions would be likely to be of broad interest to the neuroscience community.
Reviewer #1 (Public review):
The authors sought to investigate the role of adaptation in supporting object recognition. In particular, the extent to which adaptation to noise improves subsequent recognition of objects embedded in the same or similar noise, and how this interacts with target contrast. The authors approach this question using a combination of psychophysics, electroencephalography, and deep neural networks. They find better behavioural performance and multivariate decoding of stimuli preceded by noise, suggesting a beneficial effect of adaptation to noise. The neural network analysis seeks to provide a deeper explanation of the results by comparing how well different adaptation mechanisms capture the empirical behavioural results. The results show that models incorporating intrinsic adaptation mechanisms, such as additive suppression and divisive normalisation, capture the behavioural results better than those that incorporate recurrent interactions. The study has the potential to provide interesting insights into adaptation, but there are alternative (arguably more parsimonious) explanations for the results that have not been refuted (or even recognised) in the manuscript. If these confounds can be compellingly addressed, then I expect the results would be of interest to a broad range of readers.
The study uses a multi-modal approach, which provides a rich characterisation of the phenomenon. The methods are described clearly, and the accompanying code and data are made publicly available. The comparison between univariate and multivariate analyses is interesting, and the application of neural networks to distinguish between different models of adaptation seems quite promising.
There are several concerning confounding factors that need to be addressed before the results can be meaningfully interpreted. In particular, differences in behavioural accuracy may be explained by a simple change detection mechanism in the "same noise" condition, and temporal cuing by the "adaptor" stimulus may explain differences in reaction time. Similarly, interference between event-related potentials may explain the univariate EEG results, and biased decoder training may explain the multivariate results. Thus, it is currently unclear if any of the results reflect adaptation.
My main concerns relate to how adaptation is induced and how differences between conditions are interpreted. The adaptation period is only 1.5 s. Although brief adaptors (~1 s) can produce stimulus history effects, it is unclear whether these reflect the same mechanisms as those observed with standard, longer adaptation durations (e.g., 10-30 s). Prior EEG work on visual adaptation using longer adaptors has shown that feature-specific effects emerge very early (<100 ms) after test onset in both univariate and multivariate responses (Rideaux et al., 2023, PNAS). In contrast, the present study finds no difference between same and different adaptor conditions until much later (>300 ms). These later effects likely reflect cognitive processes such as template matching or decision-making, rather than sensory adaptation. Although early differences appear between blank and adaptor conditions, these could be explained by interactions between ERPs elicited by adaptor onset/offset and those elicited by the test stimulus; therefore, they cannot be attributed to adaptation. This contradicts the statement in the Discussion that "Our EEG measurements show clear evidence of repetition suppression, in the form of reduced responses to the repeated noise pattern early in time."
A second concern is the brief inter-stimulus interval. The adaptor is shown for 1.5 s, followed by only a 134 ms blank before the target. When the "adaptor" and test noise are identical, improved performance could simply arise from detecting the pixels that change, namely, those forming the target number. Such change detection does not require adaptation; even simple motion detector units would suffice. If the blank period were longer-beyond the temporal window of motion detectors-then improved performance would more convincingly reflect adaptation. Given the very short blank, however, a more parsimonious explanation for the behavioural effect in the same-noise condition is that change detection mechanisms isolate the target.
Differences between the blank and adaptor conditions may also be explained by temporal cueing. In the noise conditions, the noise reliably signals the upcoming target time, whereas the blank condition provides no such cue. Given the variable inter-trial interval and the brief target presentation, this temporal cue would strongly facilitate target perception. This account is consistent with the reaction time results: both adaptor conditions produce faster reaction times than the blank condition, but do not differ from each other.
The decoding analyses are also difficult to interpret, given the training-testing protocol. All trials from the three main conditions (blank, same, different) were used to train the classifier, and then held-out trials - all from one condition-were decoded. Because ERPs in the adaptor conditions differ substantially from those in the blank condition, and because there are twice as many adaptor trials, the classifier is biased toward patterns from the adaptor conditions and will naturally perform worse on blank trials. To compare decoding accuracy meaningfully across conditions, the classifier should be trained on a separate unbiased dataset (e.g., the "clean" data), or each condition should be trained and tested separately using cross-fold validation.
Reviewer #2 (Public review):
Summary:
Neurons adapt to prolonged or repeated sensory inputs. One function of such adaptation may be to save resources to avoid representing the same inputs over and over again. However, it has been hypothesized that adaptation could additionally help improve the representation of sensory stimuli, especially during difficult recognition scenarios. This study sheds light on this question and provides behavioral evidence for such enhancement. The behavioral results are interesting and compelling. The paper also includes scalp electroencephalographic (EEG) data, which are noisy but point toward similar conclusions. The authors finally implement a deep convolutional neural network (DCNN) with adaptation mechanisms, which nicely capture human behavior.
Strengths:
(1) The authors introduce an interesting hypothesis about the role of adaptation in visual recognition.
(2) The authors present interesting and compelling behavioral data consistent with the hypothesis.
(3) The authors introduce a computational model that can capture mechanisms that can lead to adaptation, enhancing visual recognition.
Weaknesses:
(1) The main weakness is the scalp EEG data. As detailed below, the results are minimal at best and do not contribute to understanding the mechanisms of adaptation. The paper would be stronger without the EEG data.
(2) I wonder whether the hypothesis also holds with real-world objects in natural scenes, beyond the confines of MNIST digits.
Reviewer #3 (Public review):
Summary:
Brands and colleagues investigate how temporal adaptation can aid object recognition, and what neural computations may underlie these effects. They employed a previously published experimental paradigm to study how adaptation to temporally constant distractor input facilitates the recognition of a newly appearing target object. Specifically, they studied how this effect is modulated by the contrast of the target object.
They found that adaptation enhances the recognition of high-contrast objects more than that of low-contrast objects. This behavioral effect was mirrored by a larger effect of adaptation on the response to the high-contrast objects in relatively higher visual areas.
To investigate what neural computations can support this interaction, they implement several candidate neural mechanisms in a deep convolutional neural network: additive suppression, divisive suppression, and lateral recurrence. The authors conclude that divisive and additive suppression, which are intrinsic to the neuron, best explain the interaction between contrast and adaptation in the human data. They further show that these mechanisms, and divisive suppression in particular, show increased robustness to spatial shifts of the adaptor stimulus, hinting and potential perceptual benefits.
Strengths:
(1) Overall, this is a well-written paper, supported by thorough analyses and illustrated with clear, well-designed figures that effectively show overall trends as well as data variance. The authors tell a compelling story while responsibly steering away from overreaching conclusions.
(2) What makes this paper stand out is its comprehensive approach to understanding the behavioral benefit of neural adaptation and its mechanistic underpinnings. The authors effectively achieve this through integrating new behavioral and neural data with simulations using neural network models.
(3) The findings convincingly demonstrate that neuronally intrinsic adaptation mechanisms are sufficient to explain the observed interaction between temporal adaptation, contrast, and object recognition. Furthermore, the paper highlights that these intrinsic mechanisms offer superior robustness compared to learned lateral recurrence mechanisms, which, while being more expressive, can also be more brittle.
Weaknesses:
While the results and conclusion are well supported, there were a few major points that need clarification for me.
(1) Divisive normalization
I was confused by the author's classification of divisive normalization as a neuronally intrinsic mechanism, that is, one that operates within a single neuron, independent of interactions with other neurons.
My understanding is that divisive normalization, as originally proposed by Heeger in the early nineties, describes a mechanism where neurons integrate pooled activity from neighboring cells to mutually inhibit one another. In this form, divisive normalization is fundamentally an interneuronal mechanism involving recurrence. Adding to the confusion, the authors highlight in the introduction their interest in divisive normalization for its relation to stimulus contrast, a relation likely linked to neuronal pooling.
However, my reading of the methods section (Equations 6 and 7) suggests the authors implemented only a temporal feedback component, leaving out the pooling across neurons (Equation 5). This distinction should be disambiguated early in the paper. I recommend choosing a less ambiguous term than "divisive normalization". Even "temporal divisive normalization" is still ambiguous, as lateral neuronal interactions are also inherently temporal.
(2) Parietal electrodes
The paper's adapter-specific effects are centered around the P9/P10 electrodes, which the authors identify as "parietal." However, it is unclear to me which part of the cortex drives these electrodes, particularly whether it is actually the parietal cortex. I am no expert in EEG, but based on the topomaps in Figures 4 and 5, it appears that these electrodes cover more posterior occipito-temporal regions rather than truly parietal regions. Given the central role of P9/P10 to the main findings, the paper would be significantly improved for non-EEG readers by clarifying which cortical regions are covered by these electrodes.
(3) Interpretation of non-significant statistical results
In some places, the authors attach relatively strong claims to non-significant statistical results. For example, in Figure 5D, they claim that there is no effect of contrast on occipital electrodes, based on a non-significant p-value. P-values do not quantify evidence for the null hypothesis, so the authors should be careful with such claims. In fact, Figure 5D shows such a clear negative slope, with variance comparable to Figure 5A, that I am surprised that the p-value for the slope of Figure 5D was in fact so large. A similar issue arises in the discussion for Figure 6, where the authors claim that the effect of contrast is adapter-specific. However, this claim is based on the observation that is significant for same-noise trials, but not for different-noise or blank trials. To statistically substantiate the claims that there is an adapter-specific effect, the authors should directly compare the slope for same-noise trials with the slope for different-noise/blank trials.
(4) The match between behavior and models
The authors' claim that models with intrinsic adaptation better match the interaction between contrast and temporal adaptation observed in human behavior is not fully substantiated. This conclusion appears to be based on a qualitative assessment of Figure 8, which, in my view, does not unambiguously rule out an interaction for lateral recurrence. Furthermore, a potential confounding factor is the ceiling effect that limits higher accuracy values. Indeed, conditions where the interaction was not/less (i.e., shorter time sequences and lateral inhibition) are also the conditions where accuracy values are closer to this ceiling, which may mask a potential interaction.
eLife Assessment
This study presents a valuable and well-documented computational pipeline for the scalable analysis and spike sorting of large extracellular electrophysiology datasets, with particular relevance for high-density recordings such as Neuropixels. The authors demonstrate the pipeline's utility for benchmarking spike sorter performance and evaluating the effects of data compression, supported by thorough testing, clear figures, and openly available code. The workflow is reproducible, portable, and practical, providing concrete guidance on computational cost and runtime. Overall, the evidence supporting the pipeline's performance and output quality is compelling, and this work will be of broad interest to the systems neuroscience community.
Reviewer #1 (Public review):
Summary:
Extracellular electrophysiology datasets are growing in both number and size, and recordings with thousands of sites per animal are now commonplace. Analyzing these datasets to extract the activity of single neurons (spike sorting) is challenging: signal-to-noise is low, the analysis is computationally expensive, and small changes in analysis parameters and code can alter the output. The authors address the problem of volume by packaging the well-characterized SpikeInterface pipeline in a framework that can distribute individual sorting jobs across many workers in a compute cluster or cloud environment. Reproducibility is ensured by running containerized versions of the processing components.
The authors apply the pipeline in two important examples. The first is a thorough study comparing the performance of two widely used spike-sorting algorithms (Kilosort 2.5 and Kilosort 4). They use hybrid datasets created by injecting measured spike waveforms (templates) into existing recordings, adjusting those waveforms according to the measured drift in the recording. These hybrid ground truth datasets preserve the complex noise and background of the original recording. Similar to the original Kilosort 4 paper, which uses a different method for creating ground truth datasets that include drift, the authors find Kilosort 4 significantly outperforms Kilosort 2.5. The second example measures the impact of compression of raw data on spike sorting with Kilosort 4, showing that accuracy, precision, and recall of the ground truth units are not significantly impacted even by lossy compression. As important as the individual results, these studies provide good models for measuring the impact of particular processing steps on the output of spike sorting.
Strengths:
The pipeline uses the Nextflow framework, which makes it adaptable to different job schedulers and environments. The high-level documentation is useful, and the GitHub code is well organized. The two example studies are thorough and well-designed, and address important questions in the analysis of extracellular electrophysiology data.
Weaknesses:
The pipeline is very complete, but also complex. Workflows - the optimal artifact removal, best curation for data from a particular brain area or species - will vary according to experiment. Therefore, a discussion of the adaptability of the pipeline in the "Limitations" section would be helpful for readers.
Reviewer #2 (Public review):
Summary:
This work presents a reproducible, scalable workflow for spike sorting that leverages parallelization to handle large neural recording datasets. The authors introduce both a processing pipeline and a benchmarking framework that can run across different computing environments (workstations, HPC clusters, cloud). Key findings include demonstrating that Kilosort4 outperforms Kilosort2.5 and that 7× lossy compression has minimal impact on spike sorting performance while substantially reducing storage costs.
Strengths:
(1) Extremely high-quality figures with clear captions that effectively communicate complex workflow information.
(2) Very detailed, well-written methods section providing thorough documentation.
(3) Strong focus on reproducibility, scalability, modularity, and portability using established technologies (Nextflow, SpikeInterface, Code Ocean).
(4) Pipeline publicly available on GitHub with documentation.
(5) Clear cost analysis showing ~$5/hour for AWS processing with transparent breakdown.
(6) Good overview of previous spike sorting benchmarking attempts in the introduction.
(7) Practical value for the community by lowering barriers to processing large datasets.
Weaknesses:
No significant weaknesses were identified, although it is noted that the limitations section of the discussion could be expanded.
Reviewer #3 (Public review):
Summary:
The authors provide a highly valuable and thoroughly documented pipeline to accelerate the processing and spike sorting of high-density electrophysiology data, particularly from Neuropixels probes. The scale of data collection is increasing across the field, and processing times and data storage are growing concerns. This pipeline provides parallelization and benchmarking of performance after data compression that helps address these concerns. The authors also use their pipeline to benchmark different spike sorting algorithms, providing useful evidence that Kilosort4 performs the best out of the tested options. This work, and the ability to implement this pipeline with minimal effort to standardize and speed up data processing across the field, will be of great interest to many researchers in systems neuroscience.
Strengths:
The paper is very well written and clear in most places. The accompanying GitHub and ReadTheDocs are well organized and thorough. The authors provide many benchmarking metrics to support their claims, and it is clear that the pipeline has been very thoroughly tested and optimized by users at the Allen Institute for Neural Dynamics. The pipeline incorporates existing software and platforms that have also been thoroughly tested (such as SpikeInterface), so the authors are not reinventing the wheel, but rather putting together the best of many worlds. This is a great contribution to the field, and it is clear that the authors have put a lot of thought into making the pipeline as accessible as possible.
Weaknesses:
There are no major weaknesses. I have only a handful of very minor questions and suggestions that could clarify/generalize aspects of the pipeline or make the text more understandable to non-specialists.
(1) Could the authors please expand on the statement on line 274, that processing their test dataset serially "on a single GPU-capable cloud workstation... would take approximately 75 hours and cost over 90 USD." How were these values calculated? I was a bit surprised that this is a >4-fold slow-down from their pipeline, but only increases the cost by ~1.35x, if I understood correctly. More context on why this is, and maybe some context on what a g4dn.4xlarge is compared to the other instances, might help readers who are less familiar with AWS and cloud computing.
(2) One of the most commonly used preprocessing pipelines for Neuropixels data is the CatGT/ecephys pipeline from the developers of SpikeGLX at Janelia. It may be worth commenting very briefly, either in the preprocessing section or in the discussion, on how the preprocessing steps available in this pipeline compare to the steps available in CatGT. For example, is "destriping" similar to the "-gfix" option in catGT to remove high-amplitude artifacts?
(3) Why are there duplicate units (line 194), and how often is this an issue? I understand that this is likely more of a spike sorter issue than an issue with this pipeline, but 1-2 sentences elaborating why might be helpful for readers.
(4) It seems from the parameter files on GitHub that the cluster curation parameters are customizable - correct? If so, it may be worth explicitly saying so in the curation section of the text, as the presented recipe will not always be appropriate. A presence ratio of >0.8 could be particularly problematic for some recordings, for example, if a cell is only active during a specific part of the behavior, that may be a feature of the experiment, or the animal could be transitioning between sleep and wake states, in which different units may become active at different times.
(5) The axis labels in Figures 3d-e are too small to see, and Figure 3d would benefit from a brief description of what is shown.
(6) What is the difference between "neural" and "passing QC" in Figure 4?
(7) I understand the current paper is focused on spike data, so there may not be an answer to this, but I am curious about the NP2.0 probes that save data in wideband. Does the lossy compression negatively affect the LFP data? Is software filtering applied for the spike band before or after compression?
eLife Assessment
This manuscript presents a novel investigation of organizational principles governing brain activity at both global and local scales during naturalistic viewing paradigms, an important advance for theoretical neuroscience, functional neuroimaging, and neurology. The authors demonstrate that brain activity during naturalistic viewing is dominated by two anti-correlated states that toggle between each other with a third transitional state mediating between them. The evidence supporting this finding is compelling, with the successful replication across three independent datasets (StudyForrest, NarrattenTion, and CamCAN) a particular strength.
Reviewer #1 (Public review):
In this work, the authors provide a comprehensive investigation of antagonistic dynamics across large-scale brain networks. They characterize this phenomenon at the global (regional dynamics) and local (multivariate patterns of voxels within regions) levels.
Furthermore, as opposed to studying these dynamics under resting-state or explicit task conditions, the authors make use of naturalistic narratives, both auditory and visual.
Perhaps most importantly, this work provides evidence that event boundaries in narratives drive sensory responses, which, in turn, predict anticorrelated activity in task-positive networks and the default mode network. These findings open up new questions regarding the interaction across perceptual systems and these higher-order dynamics in association networks.
This work is methodologically solid and presents compelling findings that will surely invite new approaches and questions in this area.
Importantly, these data do not speak to the order or causal structure of these interactions. Time-resolved methods and direct causal interventions will be needed to understand how these interactions drive one another more precisely.
Reviewer #2 (Public review):
This manuscript presents an impressive and novel investigation of organizational principles governing brain activity at both global and local scales during naturalistic viewing paradigms. The proposed multi-scale nested structure offers valuable new insights into functional brain states and their dynamics. Importantly, investigation of global brain states in the context of a naturalistic viewing context represents an important and timely contribution that addresses unresolved issues about global signals and anticorrelations in resting-state fMRI. This manuscript presents a novel investigation of organizational principles governing brain activity at both global and local scales during naturalistic viewing paradigms. The authors demonstrate that brain activity during naturalistic viewing is dominated by two anti-correlated states that toggle between each other with a third transitional state mediating between them. The successful replication across three independent datasets (StudyForrest, NarrattenTion, and CamCAN) is a particular strength. The successful replication across three independent datasets (StudyForrest, NarrattenTion, and CamCAN) is a particular strength, and I appreciate the authors' careful documentation of both convergent and divergent findings across these samples.
Overall, this manuscript makes important contributions to our understanding of large-scale brain organization during naturalistic cognition. The multi-scale framework and robust replication across datasets are notable strengths. Addressing the concerns raised below will substantially strengthen the impact and interpretability of this work.
(1) Network Definition and Specificity
(a) The authors adopt an overly broad characterization of the Default Mode Network (DMN). The statement that "areas most active in the default mode state... consist of the precuneus, angular gyrus, large parts of the superior and middle temporal cortex, large parts of the somatomotor areas, frontal operculi, insula, parts of the prefrontal cortex and limbic areas" includes regions typically assigned to other networks. The insula is canonically considered a core node of the Salience Network/Ventral Attention Network (VAN), not the DMN. Also, not clear which limbic areas? The DMN findings reported need to be critically reassessed in this context.
(b) Given the proposed role of state switching in your framework, a detailed analysis of salience network nodes (particularly insula and dorsal ACC) would be highly informative.
(c) While you report transition-related signals in the visual and auditory cortex, the involvement of insular and frontal control systems in state transitions remains unaddressed.
(d) My recommendation is to provide a more anatomically precise characterization of network involvement, particularly distinguishing DMN from salience/VAN regions, and analyze the specific role of salience network nodes in mediating state transitions.
(2) Distinguishing Top-Down from Stimulus-Driven Effects
(a) The finding that "the superior parietal lobe (SPL) and the frontal eye fields (FEF) show the greatest overlap between their local ROI state switches and the global state switches" raises an important question: To what extent are these effects driven by overt changes in visual gaze or attention shifts triggered by stimulus features versus internally-generated state changes?
(b) Similarly, the observation that DAN areas show the highest overlap with global state changes in StudyForrest and NarrattenTion, while VAN shows the highest overlap in CamCAN, lacks sufficient anatomical detail regarding which specific nodes are involved. This information would help clarify whether insular regions and other VAN components play distinct roles in state switching.
(c) It will be important to (i) discuss potential confounds from eye movements and stimulus-driven attention shifts; (ii) provide detailed anatomical breakdowns of network nodes involved in state transitions, particularly for VAN; (iii) if eye-tracking data or any other relevant stimulus-related data are available, include analyses examining relationships between these measures and state transitions.
(3) Physiological Interpretation of the "Down" State
The linkage between the "Down" state and the Default Mode State (DMS) is intriguing but requires deeper physiological grounding. Recent work by Epp et al. (Nature Neuroscience, 2025) demonstrates that decreased BOLD signal in DMN regions does not necessarily indicate reduced metabolic activity and can reflect neurovascular coupling modes with specific metabolic profiles. It would be useful to discuss whether your "Down" state might represent a particular neurovascular coupling mode with distinct metabolic demands rather than simply reduced neural activity. Alternatively, your analytical approach might be insensitive to or unconfounded by such neurovascular uncoupling. This discussion would substantially enrich the biological interpretation of the DMS versus TPS dual mechanism framework.
(4) Statistical Validation of Bimodality Detection
The method of selecting bimodal timepoints using the Dip test followed by sign-alignment is novel and creative. However, this filter-then-align procedure could potentially introduce circularity by imposing the anticorrelated structure the authors aim to detect. It would be important to implement validation analyses to confirm that anticorrelation is an intrinsic property rather than a methodological artifact. Approaches include leave-one-subject-out cross-validation, unsupervised dimensionality reduction (e.g., PCA) applied independently to verify the anticorrelated structure, and split-half reliability analysis. Such validation would significantly strengthen the statistical foundation of findings.
(5) Quantifying Hyperalignment Contribution
The appendix notes that non-hyperaligned data show a coarser structure, but the specific contribution of hyperalignment to your findings requires more thorough quantification. Please provide a systematic comparison of results with and without hyperalignment, demonstrating that similar (even if weaker) anatomical correspondence exists in native subject space. This would establish that the mesoscale organizational principles you identify are not artifacts of the alignment procedure but reflect genuine neurobiological organization. Consider presenting correlation coefficients or overlap metrics quantifying the similarity of state structures before and after hyperalignment.
(6) Functional Characterization of the Unimodal State
The observation that the brain spends approximately 34% of its time in a "Unimodal State" is presented primarily as a transition period. This is an interesting observation. However, it would be useful to characterize the functional connectivity profile of the unimodal state. Specifically, investigate whether it represents a distinct functional state with its own characteristic connectivity pattern. More detailed analysis would provide a more complete picture of temporal brain dynamics during naturalistic viewing and could yield new perspectives on how the brain reorganizes between stable states.
eLife Assessment
This valuable study uses a computer vision pipeline to infer the motor control of cephalopod skin, revealing that individual chromatophores exhibit anisotropic deformations and can be associated with multiple putative motor units. The evidence supporting these claims is solid, although the study's conclusions are limited to stationary or sedated animals, and the analyses of motor unit characteristics and electrophysiological validation remain incomplete. This work will be of significant interest to biologists studying cephalopod behavior and motor control.
Reviewer #1 (Public review):
Summary:
Renard, Ukrow et al. applied their recently published computational pipeline (CHROMAS) to the skin of Euprymna berryi and Sepia officinalis to track the dynamics of cephalopod chromatophore expansion. By segmenting each chromatophore into radial slices and analyzing the co-expansion of slices across regions of the skin, they inferred the motor control underlying chromatophore groups.
Strengths:
The authors demonstrate that most motor units of cephalopod skin include a subregion of multiple chromatophores, creating "virtual chromatophores" in between the fixed chromatophores. This is an interesting concept that challenges prevailing models of chromatophore organization, and raises interesting possibilities for how chromatophore arrays may be patterned during development.
This study introduces new analyses of cephalopod skin that will be valuable for the quantitative study of cephalopod behavior.
Weaknesses:
The authors chose to image spontaneous skin changes in sedated animals, rather than visually-evoked skin changes in awake, freely-moving animals. Spontaneous chromatophore changes tend to be small shimmers of expansion and contraction, rather than obvious, sizable expansions. This may make it more challenging to distinguish truly co-occurring expansions from background activity. The authors don't provide any raw data (videos) of the skin, so it is difficult to independently assess the robustness of the inferred chromatophore groupings.
The patch-clamp experiments in E. berryi are used to test the validity of their approach for inferring motor units. The stimulations evoke expansions of sub-regions of each chromatophore, creating "virtual chromatophores" as predicted from the behavioral analysis. However, the authors were not able to predict these specific motor units from behavioral analysis before confirming them with patch-clamp, limiting the strength of the validation. It would be informative to quantify the results of the patch-clamp experiments - are the inferred motor units of similar sizes to those predicted from behavior?
The authors report testing multiple experimental conditions (e.g., age, size, behavioral stimuli, sedation, head-fixation, and lighting), but only a small subset of these data are presented. It is difficult to determine which conditions were used for which experiments, and the manuscript would benefit from pooling data from multiple experiments to draw general conclusions about the motor control of cephalopod skin.
The authors use a different clustering algorithm for E. berryi and S. officinalis, but do not discuss why different clustering approaches were required for the two species.
Impact:
The authors use their computational pipeline to generate a number of interesting predictions about chromatophore control, including motor unit size, their spatial distribution within the skin, and the independent control of subregions within individual chromatophores by putatively distinct motor neurons. While these observations are interesting, the current data do not yet fully support them.
The CHROMAS tool is likely to be valuable to the field, given the need for quantitative frameworks in cephalopod biology. The predictions outlined here provide a useful foundation for future experimental investigation.
Reviewer #2 (Public review):
Summary:
Overall, this is an excellent paper, making use of a newly developed system for monitoring the behaviour of chromatophores in the skin of (mostly) free-swimming bobtail squid and European cuttlefish. The manuscript is very well-written, clearly presented and very well-structured. The central finding, that individual chromatophores are connected to multiple motor neurones, is not new. Novelty instead comes from the ability to measure the actuation of chromatophore sections across wide areas of skin in free-swimming animals, showing the diversity of local motor units and reinforcing the notion that individual chromatophores are not necessarily the individual units of colour change, but rather local motor units that cover multiple neighbour and near-neighbour chromatophore muscles. This is an excellent finding and one that will shape our understanding of the neural control of cephalopod skin colour.
Strengths:
The methodological approach to collecting large amounts of data about local variations in the expansion of sections of chromatophores is exciting, and the analysis pipeline for clustering sections of chromatophores whose spontaneous activity correlated over time is powerful and exciting.
Weaknesses:
Some minor edits and typographical errors need correcting. I also had some concerns that the preparation for the electrophysiological section of the manuscript complies with the journal's ethical requirements, so I would urge that this be carefully checked.
Reviewer #3 (Public review):
Summary:
This study uses high-resolution videography and a custom computer-vision pipeline to dissect the motor control of cephalopod chromatophores in Euprymna berryi and Sepia officinalis. By quantifying anisotropic chromatophore deformations and applying dimensionality reduction methods, the authors infer that individual chromatophores can be a part of multiple motor units. Clustering analyses reveal putative motor units that often span multiple chromatophores, with diverse and overlapping geometries. Chromatophore expansion dynamics are faster and more stereotyped than relaxation, consistent with active neural contraction followed by passive recoil. Together, the results show that chromatophores function not as uniform pixels but as fractionated, coordinately controlled elements that enable flexible pattern generation
Strengths:
The authors present compelling, direct evidence that a). chromatophore deformations are anisotropic, and indirect evidence that b) individual chromatophores can be split across multiple putative motor units. This evidence is provided through data collected over large spatial scales, but also at a sub-chromatophore resolution. This combination of scale and resolution is not possible using traditional neuroanatomical and physiological approaches alone.
The authors also develop a new non-invasive, image analysis approach to extract information about chromatophore deformation across large spatial scales on the organism's body. In principle, this approach is applicable across species and may allow for further comparative characterization of chromatophore motor control. It is therefore a promising new tool and useful resource for the community.
Weaknesses:
An important weakness of the work is that the methods the authors develop can only be applied during resting, spontaneous 'flickering' activity of chromatophores. The inability to reliably apply their technique during any kind of realistic camouflage is a large limitation, as it means this method cannot be used to study the dynamics of motor control during realistic camouflage behaviors.
Another weakness of this paper is the rather limited electrophysiological validation of the computational findings. The authors present only one electrophysiology experiment in E. berryi, the species that they used only for 'methodological development' and not for detailed characterization. A complementary electrophysiological experiment in S. officinalis, or some visualization of neuron morphology confirming that motor neurons do indeed project to multiple chromatophores, would strengthen the generalizability of their computational analysis. This would be particularly pertinent to validate the author's claim that some motor units contain chromatophores that are quite distant from one another on the animal.
Overall, the authors' technical contributions and method development are an important advance. This work serves as an excellent proof of concept that their method can extract useful information about chromatophore motor control. Further validation of their method is needed to fully trust the fine-scale conclusions drawn about the distribution and composition of multi-innervated chromatophores. Furthermore, the authors raise many interesting ideas about developmental constraints on circuit wiring and potential adaptive significance of multi-innervated chromatophores for certain features of camouflage patterning. Their method may be able to help resolve some of these questions in the future if it is refined and applied across developmental stages, regions of the animal, and across species
Author response:
We thank all reviewers for their comments. We appreciate the acknowledgement that the paper is important and that results support the major conclusions. We are planning to address the specific concerns as noted by the reviewers in the following way:
Public Reviews:
Reviewer #2 (Public review):
(1) The authors generate a new tool, a Gal4 knock-in of the jam2b locus, to track EGFP-expressing cells over time and follow the developmental trajectory of jam2b-expressing cells. Figure 1 characterizes the line. However, it lacks quantification, e.g., how many etv2-expressing cells also show EGFP expression or the contribution of EGFP-expressing cells to different types of blood vessels. This type of quantification would be useful, as it would also allow for comparison of their findings to their previous data examining the contribution of SVF cells to different types of blood vessels. All the authors state that at 30 hpf, EGFP-expressing cells can be seen in the vasculature (apparently the PCV).
It is not clear why the authors do not use a nuclear marker for both ECs (as they did in their previous publication) and for jam2b-expressing cells. UAS:nEGFP and UAS:NLS-mcherry (e.g. pt424tg) transgenic lines are available. This would circumvent the problem the authors encounter with the strong fluorescence visible in the yolk extension. It would also facilitate quantifying the contribution of jam2b cells to different types of blood vessels.
We agree with the importance of quantification. We had performed quantification of jam2b<sup>Gt(2A-Gal4)</sup>;UAS:GFP contribution to different vascular beds, which was shown in Suppl. Fig. S3. We will clarify this in the revision. We also agree that nuclear GFP or mCherry would help to visualize and quantify cells. Unfortunately, we do not have nuclear UAS:GFP or UAS:mCherry line in our possession, and it will take too long to import it for the standard revision timeline. We are working on the construct, and will attempt to establish the line; therefore we are hoping to clarify these results with the nuclear line in the revised manuscript.
(2) The time-lapse movie in Figure 2 is not very informative, as it just provides a single example of a dividing cell contributing to the PCV. Also, quantifications are needed. As SVF cells appear to expand significantly after their initial specification, it would be informative to know how many cell divisions and which types of blood vessels jam2b-expressing cells contribute to. Can the authors observe cells that give rise to different types of blood vessels? Jam2b expression in LPM cells apparently precedes expression of etv2. Is etv2 needed for maintenance, or do Jam2b-expressing cells contribute to different types of tissues in etv2 mutant embryos? Comparing time-lapse analysis in wildtype and etv2 mutant embryos would address this question.
The time-lapse was meant to serve as an illustration and confirmation of jam2b cell contribution to vasculature. As noted above, Suppl. Fig. S3 provides quantification of jam2b cell contribution to different vascular beds. We had previously performed detailed time-lapse analysis and quantification of SVF cell migration to PCV, SIA and SIV using etv2-2A-Venus line (Metikala et al 2022, Dev Cell), which has some of the same (or similar) information. It is very challenging to obtain this data using jam2b reporter line due to extensive and bright GFP expression in the mesothelial layer over the yolk and yolk extension; for that reason we can only trace some GFP cells but not all of them. Regarding etv2 requirement for jam2b maintenance, we intend to address this question by analyzing jam2b cell contribution in etv2 MO injected embryos, which recapitulates the phenotype in jam2b mutants.
(3) In Figure 3, the authors generate UAS:Cre and UAS:Cre-ERT2 transgenic lines to lineage trace the jam2b-expressing cells. It is again not clear why the authors do not use a responder line containing nuclear-localized fluorescent proteins to circumvent the strong expression of fluorescent proteins in the yolk extension. It is also unclear why the two transgenic lines give very different results regarding the number of cells being labelled. The ERT2 fusions label around 3 cells in the SIA, while the Cre line labels only about 1.5 cells per embryo, with very little contribution of labelled cells to other blood vessels. One would expect the Cre line requiring tamoxifen induction to label fewer cells when compared to the constitutive Cre line. What is the reason for this discrepancy? Are the lines single integration? Is there silencing? This needs to be better characterized, also regarding the reproducibility of the experiments. If the Cre lines were to be multiple copy integrations, outcrossing the line might lead to lower expression levels in future generations.
It is also not clear how the authors conclude from these findings that "SVF cells show major contribution to the SIA and SIV" when only 1.5 or 3 cells of the SIA are labelled, with even fewer cells labelled in other blood vessels. They speculate that this might be due to low recombination efficiency, a question they then set out to answer using photoconversion of etv2:KAEDE expressing cells, an experiment that they also performed in their 2014 and 2022 publications. To check for low recombination efficiency, the authors could examine the expression of Cre mRNA in their transgenic embryos. Do many more jam2b expressing cells express Cre mRNA than they observe in their switch lines? They could also compare their experiments using Cre recombinase with those using EGFP expression in jam2b cells. EGFP is relatively stable, and the time frames the authors analyze are short. As no quantification of EGFP-expressing cells is provided in Figure 1, this comparison is currently not possible. Do these two different approaches answer different questions here?
The reviewer brings up important points, we appreciate that. Unfortunately, we do not have a nuclear switch line in our possession, and it is not possible to obtain it in the normal manuscript revision time line. Regarding UAS:Cre and UAS:CreERT2 lines, they both show rather similar labeling, with most labeled cells present in the SIA. The difference in cell number (1.5 versus 3) is likely due to different levels of Cre expression, which may vary dependent on the integration site. The lines most likely are multi-copy integrations, which can be helpful, as this would result in higher Cre expression. We will address the silencing question by performing in situ hybridization or HCR analysis for Cre or CreERT2 and comparing it with endogenous jam2b expression, as the reviewer suggested. We have noticed that the switch line used, actb2:loxP-BFP-loxP-dsRed, exhibits lower recombination frequency compared to other switch lines (we used it because it was compatible with endothelial fli1:GFP line). We will attempt to answer this question by crossing to other switch lines, which may exhibit higher recombination frequency. In principle, UAS:GFP and switch lines should produce a similar result, except that GFP decays over time and therefore our initial expectation was that switch lines may produce a more accurate result. However, this may not be the case due to low recombination efficiency, which we will attempt to address in the revision.
(4) Concerning the etv2:KAEDE photoconversion experiments: The percentages the authors report for SVF cells' contribution to the SIV and SIA differ from their previous study (Dev Cell, 2022). In that publication, SVF cells contributed 28% to the SIA and 48% to the SIV. In the present study, the numbers are close to 80% for both vessels. The difference is that the previous study analyzed 2dpf old embryos and the new one 4dpf old embryos. Do SVF-derived cells proliferate more than PCV-derived cells, or is there another explanation for this change in percentage contribution?
These numbers refer to different experiments; we apologize for the confusion. As reported earlier in Metikala et 2022, 28% of SVF cells contributed to the SIA and 48% to the SIV by 3 dpf (not 2 dpf; only PCV analysis was done at 2 dpf); SIA and SIV analysis was done based on time-lapse image analysis of etv2-2A-Venus line at 3 dpf, shown in Fig. 3C in Metikala et al. However, this only refers to SVF cell contribution. It does not mean that 28% or 48% cells in SIA or SIV are derived from SVF. The total fraction of SIA and SIV cells that are derived from SVF has not been quantified in the previous study, because that would require accurate tracking of all SVF cells, which is experimentally challenging. Etv2:Kaede experiment is slighly different, because it reports newly formed cells after 24 hpf. It cannot tell if new cells are all derived from SVF cells, although we are not aware of any other source of new endothelial cells at these stages. In the previous study by Metikala et al 2022, we reported ~22 newly formed SIA and ~50 newly formed cells in SIV by 3 dpf (Fig. 1 in Metikala et al 2022), although the entire number of cells was not quantified, therefore the percentage was not known. In the current study, we attempted to estimate the entire percentage of green only Kaede cells, which was close to 80% in both SIA or SIV at 4 dpf. Please note that this estimate was performed in the posterior portion of SIA and SIV that overlies the yolk extension and where SVF cells are observed. We did not quantify cells in the anterior SIV portion, which forms the basket over the yolk.
(5) Single-cell sequencing data: Why do the authors not show jam2b expression in their single-cell sequencing data? They sorted for (presumably) jam2b-expressing cells and hypothesize that jam2b expression in ECs at this time point is important for the generation of intestinal vasculature. Do ECs in cluster 15 express jam2b? Why are no other top marker genes (tal1, etv2, egfl7, npas4l) included in the dot blot in Figure 5b?
We appreciate the suggestion and will include additional marker genes as well as jam2b in the revised version of the manuscript.
(6) Concerns about cell autonomy of mutant phenotypes: The authors need to perform in situ hybridization to characterize jam2a expression. Can it be seen in SVF cells? The double mutants show a clear phenotype in intestinal vessel development; however, it is unclear whether this is due to a cell-autonomous function of jam2a/b within SVF cells. The authors need to address this issue, as jam2b and potentially also jam2a are expressed within the tissue surrounding the forming SVF. For instance, do transplanted mutant cells contribute to the intestinal vasculature to the same extent as wild-type cells do?
jam2a expression has been characterized in the previous studies and it is shown in the Suppl. Fig. S4E. It is primarily enriched in the skeletal muscle. However, our single-cell RNA-seq analysis shows that SVF cells also express jam2a. We will include additional data on jam2a expression in the revised manuscript. We agree that transplation to address cell autonomy is an important experiment, yet there are some practical challenges to it. Jam2a,jam2b mutant phenotype is only partially penetrant, and about 50% reduction in SVF cell number, as well as partial SIA and SIV phenotypes are observed. Only a small number of transplanted cells may contribute to intestinal vasculature, therefore it may be challenging to see the differences, given the partial penetrance. In an attempt to address cell -autonomy question, we will try a different approach. We will overexpress jam2b labeled with 2A-mCherry, and test if it can rescue the mutant phenotype in cell autonomous manner. Overexpression will be done in a mosaic manner, with higher number of cells labeled than in a typical transplantation experiment.
(7) Finally, the authors analyze the phenotypes of hand2 mutants and their impact on the expression of jam2b and etv2. They observe a reduction in jam2b and etv2 expression in SVF cells. However, they do not show the vascular phenotypes of hand2 mutants. Is the formation of the SIA and SIV disturbed? Is hand2 cell autonomously needed in ECs? The authors suggest that hand2 controls SVF development through the regulation of jam2b. However, they also show that jam2b mutants do not have a phenotype on their own. Clearly, hand2, if it were to be required in ECs, regulates other genes important for SVF development. These might then regulate jam2b expression. The clear linear relationship, as the title suggests, is not convincingly shown by the data.
As suggested, we will add the analysis of SIA and SIV in hand2 mutants during the revision process. We could not assess that easily because the line was not maintained in vascular fli1:GFP background. We do not know if hand2 is required cell-autonomously. This is an important question, but it may be answered better in a separate study. Regarding hand2-jam2b axis, it is very clear that jam2b expression in the posterior lateral plate mesoderm is completely lost in hand2 mutants, except for its more anterior domain over the yolk. This does support the idea that hand2 functions upstream of jam2b. However, the relationship may not be necessarily direct. We agree that hand2 may regulate additional genes involved in SVF cell development. We will attempt to clarify this relationship and test if jam2b overexpression may rescue hand2 mutant phenotype.
Reviewer #3 (Public review):
(1) Overall molecular mechanisms of Jam2 function are not fully uncovered in the study. How do the adhesion molecules Jam2a and Jam2b regulate SVF cell formation? Are they responsible for migration, adhesion or fate determination of these structures? The authors should provide a more in-depth study of the jam2a, jam2b mutations and assess the processes affected in these mutants. Combining these mutants with etv2:Kaede can also provide a stronger causative link between their functions and defects in SVF formation.
Our data argue that the initial SVF cell specification (based on etv2 expression) is reduced in jam2a;jam2b mutants. We do not know if the migration or fate determination of the remaining SVF cells is also affected, although this may be more challenging to answer, as there are only few SVF cells remaining. We agree that further mechanistic studies of jam2a,jam2b function are needed. However, we think that this would be better addressed in a separate study. We are currently raising mutants crossed into fli1:Kaede line, which should confirm that there are fewer new cells that emerge after Kaede photoconversion in jam2a,jam2b mutants.
(2) Have the authors tested the specificity of the jam2b knock-in reporter line? This is an important experiment, as many of the conclusions derive from lineage tracing and fluorescence reporting from this knock-in line. One suggestion is to cross the jam2b:GFP or jam2b:Gal4, UAS:GFP line to the generated jam2b mutants, and examine the expression pattern of these lines. Considering that the ISH experiment showed lack of jam2b expression, the reporter line should not be expressed in the jam2b mutants.
We show in Suppl. Fig. 2 that jam2b<sup>Gt(2A-Gal4)</sup>;UAS:GFP knock-in line has similar expression pattern as jam2b mRNA by in situ hybridization, which argues for its specificity. In the revision, we plan to use HCR analysis to confirm than jam2b mRNA is expressed in the same cells as jam2b<sup>Gt(2A-Gal4)</sup>;UAS:GFP, as an additional evidence for its specificity. Unfortunately, it is not feasible to cross jam2b knock-in line into jam2b mutants, as suggested by the reviewer. Because jam2b knock-in line targets the endogenous jam2b genomic locus, which is very close in the genome to jam2b promoter deletion in jam2b mutants, the recombination frequency would be very low, and we would not get double jam2b knock-in and knock-out events in the same chromosome.
(3) The rationale behind the regeneration study is not clear, and the mechanisms underlying the phenotype are not well described. How do the authors explain the phenotype with the impaired regeneration, and what is the significance of this finding as it relates to SVF formation and function?
We apologize for this omission. This experiment was more thouroughly described in our previous study by Metikala et al 2022. In that study we showed that when endothelial cells are ablated by treating with MTZ from 6 to 45 hpf, this results in ablation of all vascular endothelial cells except for SVF cells, because they originate later than other cells. We subsequently showed that these SVF cells can partially form PCV and intestinal vasculature, helping them regenerate, which was confirmed by time-lapse imaging. In the current study, we tested if jam2a; jam2b double mutants show defects in such vascular regeneration. Indeed, regeneration after cell ablation was reduced, which correlated with reduction in SVF cell number. This argues that jam2a/b function is required for SVF cell emergence and vascular recovery after endothelial cell ablation. We will provide better description of this experiment and discuss interpretations in the revised manuscript.
(4) The authors need to include representative images of jam2b>CreERT2 with 4-OH activation at different timepoints in Figure 3.
Yes, thanks for noting this; these images will be included in the revised manuscript.
(5) The etv2:Kaede photoconversion experiment to show that the majority of intestinal vasculature derives after 24 hours needs to be supplemented with additional data on photoconverted post-24-hour-old endothelial cells, with the expectation that the majority of intestinal endothelial cells at 4 days will then be labeled with red Kaede. In addition, there have been data that show the red Kaede protein is not stable past several days in vivo, and 3 days might be sufficient for the removal or degradation of this photoconverted protein. Thus, the statement that intestinal vasculature forms largely by new vasculogenesis might be too strong based on existing data.
It is apparent from Fig. 4B that many other vessels, such as the dorsal aorta and many intersegmental vessels show robust red Kaede expression at 4 dpf, arguing that there is sufficient photoconverted Kaede present at this stage, and its degradation is unlikely to be the reason. However, we are planning to include additional control experiments, as suggested by the reviewer, to make this argument stronger.
(6) To strengthen the claim that hand2 acts upstream of jam2b, the authors can perform combinatorial genetic epistatic analysis and examine whether jam2b mutations worsen hand2 homozygous or heterozygous effects on the SVF. Similarly, overexpressing jam2b might rescue the loss of SVF/etv2 expression in hand2 mutants.
We appreciate this suggestion. Double epistatic analysis, while informative, can be tricky. In this case, we are dealing with jam2a; jam2b redundancy and also the maternal effect. It may take a while considerable effort to generate different combinations of tripple mutant lines (jam2a,jam2b,hand2), and it is unclear whether double or tripple heterozygous embryos will show any defects to clarify their epistatic relationship. Instead, as suggested, we are planning to overexpress jam2b in wild-type and hand2 mutants to address this point.
eLife Assessment
This important study addresses the question of how organ-specific blood vessels form during different stages of development, and how specific genes may regulate these processes. New genetic tools were developed to label distinct endothelial cell populations and track them over time in different mutant backgrounds. The results are solid; however, additional data quantification, lineage tracing, and cell autonomy experiments would further strengthen the conclusions.
Reviewer #1 (Public review):
The manuscript by Griciunaite et al. explores jam2b functions in the formation of late vascular precursors in what is termed the secondary heart field. The authors nicely show that expression of jam2b defines these cells in the lateral plate mesoderm and the intestinal vasculature using a target integration of Gal4 into the jam2b locus. This analysis is followed by using a UAS:cre approach to follow the lineage of jam2b expressing cells, demonstrating their contributions to the vasculature during a second round of specification of vascular precursors. This is confirmed with single-cell analysis of jam2b-gal4 expressing cells. The authors then explore the genetic requirements of jam2a and b in zebrafish and also show that hand2 functions in the secondary heart field upstream of jam2b.
Overall, the experimental evidence and results support the major conclusions. The study elucidates a novel role for jam2 in the specification of vascular precursors at later stages of development.
This understanding has important implications for treating vascular disease and regenerative therapies. The manuscript is very clearly written, and the major conclusions are likely to have a lasting impact on the field.
Reviewer #2 (Public review):
Summary:
Griciunaite et al. report on the function of jam2b and hand2 in the formation of the intestinal vasculature derived from late-forming endothelial cells (ECs) within the secondary vascular field (SVF). They generate transgenic lines that allow for the tracking of jam2b-expressing cells, both with fluorescent proteins and through Cre-mediated recombination in reporter lines. They also show that double maternal zygotic mutants in jam2a and jam2b, as well as hand2 mutants, display defects in the formation of the intestinal vasculature.
Strengths:
The results are interesting, as they address the important question of how blood vessels form during later developmental time points and potentially identify specific genes regulating this process.
Weaknesses:
(1) The authors generate a new tool, a Gal4 knock-in of the jam2b locus, to track EGFP-expressing cells over time and follow the developmental trajectory of jam2b-expressing cells. Figure 1 characterizes the line. However, it lacks quantification, e.g., how many etv2-expressing cells also show EGFP expression or the contribution of EGFP-expressing cells to different types of blood vessels. This type of quantification would be useful, as it would also allow for comparison of their findings to their previous data examining the contribution of SVF cells to different types of blood vessels. All the authors state that at 30 hpf, EGFP-expressing cells can be seen in the vasculature (apparently the PCV).
It is not clear why the authors do not use a nuclear marker for both ECs (as they did in their previous publication) and for jam2b-expressing cells. UAS:nEGFP and UAS:NLS-mcherry (e.g. pt424tg) transgenic lines are available. This would circumvent the problem the authors encounter with the strong fluorescence visible in the yolk extension. It would also facilitate quantifying the contribution of jam2b cells to different types of blood vessels.
(2) The time-lapse movie in Figure 2 is not very informative, as it just provides a single example of a dividing cell contributing to the PCV. Also, quantifications are needed. As SVF cells appear to expand significantly after their initial specification, it would be informative to know how many cell divisions and which types of blood vessels jam2b-expressing cells contribute to. Can the authors observe cells that give rise to different types of blood vessels? Jam2b expression in LPM cells apparently precedes expression of etv2. Is etv2 needed for maintenance, or do Jam2b-expressing cells contribute to different types of tissues in etv2 mutant embryos? Comparing time-lapse analysis in wildtype and etv2 mutant embryos would address this question.
(3) In Figure 3, the authors generate UAS:Cre and UAS:Cre-ERT2 transgenic lines to lineage trace the jam2b-expressing cells. It is again not clear why the authors do not use a responder line containing nuclear-localized fluorescent proteins to circumvent the strong expression of fluorescent proteins in the yolk extension. It is also unclear why the two transgenic lines give very different results regarding the number of cells being labelled. The ERT2 fusions label around 3 cells in the SIA, while the Cre line labels only about 1.5 cells per embryo, with very little contribution of labelled cells to other blood vessels. One would expect the Cre line requiring tamoxifen induction to label fewer cells when compared to the constitutive Cre line. What is the reason for this discrepancy? Are the lines single integration? Is there silencing? This needs to be better characterized, also regarding the reproducibility of the experiments. If the Cre lines were to be multiple copy integrations, outcrossing the line might lead to lower expression levels in future generations.
It is also not clear how the authors conclude from these findings that "SVF cells show major contribution to the SIA and SIV" when only 1.5 or 3 cells of the SIA are labelled, with even fewer cells labelled in other blood vessels. They speculate that this might be due to low recombination efficiency, a question they then set out to answer using photoconversion of etv2:KAEDE expressing cells, an experiment that they also performed in their 2014 and 2022 publications. To check for low recombination efficiency, the authors could examine the expression of Cre mRNA in their transgenic embryos. Do many more jam2b expressing cells express Cre mRNA than they observe in their switch lines? They could also compare their experiments using Cre recombinase with those using EGFP expression in jam2b cells. EGFP is relatively stable, and the time frames the authors analyze are short. As no quantification of EGFP-expressing cells is provided in Figure 1, this comparison is currently not possible. Do these two different approaches answer different questions here?
(4) Concerning the etv2:KAEDE photoconversion experiments: The percentages the authors report for SVF cells' contribution to the SIV and SIA differ from their previous study (Dev Cell, 2022). In that publication, SVF cells contributed 28% to the SIA and 48% to the SIV. In the present study, the numbers are close to 80% for both vessels. The difference is that the previous study analyzed 2dpf old embryos and the new one 4dpf old embryos. Do SVF-derived cells proliferate more than PCV-derived cells, or is there another explanation for this change in percentage contribution?
(5) Single-cell sequencing data: Why do the authors not show jam2b expression in their single-cell sequencing data? They sorted for (presumably) jam2b-expressing cells and hypothesize that jam2b expression in ECs at this time point is important for the generation of intestinal vasculature. Do ECs in cluster 15 express jam2b? Why are no other top marker genes (tal1, etv2, egfl7, npas4l) included in the dot blot in Figure 5b?
(6) Concerns about cell autonomy of mutant phenotypes: The authors need to perform in situ hybridization to characterize jam2a expression. Can it be seen in SVF cells? The double mutants show a clear phenotype in intestinal vessel development; however, it is unclear whether this is due to a cell-autonomous function of jam2a/b within SVF cells. The authors need to address this issue, as jam2b and potentially also jam2a are expressed within the tissue surrounding the forming SVF. For instance, do transplanted mutant cells contribute to the intestinal vasculature to the same extent as wild-type cells do?
(7) Finally, the authors analyze the phenotypes of hand2 mutants and their impact on the expression of jam2b and etv2. They observe a reduction in jam2b and etv2 expression in SVF cells. However, they do not show the vascular phenotypes of hand2 mutants. Is the formation of the SIA and SIV disturbed? Is hand2 cell autonomously needed in ECs? The authors suggest that hand2 controls SVF development through the regulation of jam2b. However, they also show that jam2b mutants do not have a phenotype on their own. Clearly, hand2, if it were to be required in ECs, regulates other genes important for SVF development. These might then regulate jam2b expression. The clear linear relationship, as the title suggests, is not convincingly shown by the data.
Reviewer #3 (Public review):
Summary:
This study by Griciunaite et al. investigates the function of the adhesion molecule Jam2 in initiating the formation of organ (intestinal)-specific vasculature in zebrafish. Their previous studies identified a group of late-forming vascular progenitors from the lateral plate mesoderm along the yolk extension termed the secondary vascular field (SVF), which can contribute to intestinal vasculature. Transcriptomic analysis of the zebrafish trunk region identified SVF-enriched marker genes, which include jam2b. They then performed expression analysis of jam2b using whole-mount in situ hybridization and Gal4 knock-in transgenic line analysis. These analyses show that jam2b is expressed in the SVF cells that correspond to etv2 and kdrl expression past 24 hours. Lineage tracing combining jam2b:Gal4 and UAS:Cre or UAS:CreERT2 show the contribution of jam2b in SVF and intestinal vasculature formation. jam2b mutations did not cause observable defects in the vasculature, but combined jam2a; jam2b mutations led to impaired ISV, PCV, SIA, SIV and thoracic duct lymphatic vasculature formation. Finally, the authors show that mutations in the transcription factor hand2 led to reduced jam2b expression and impaired SVF formation.
Strengths:
The authors accomplished many feats in generating new reporter lines and mutations that are valuable to the community. The study provided an interesting perspective on organ-specific vascular development and origin heterogeneity. The genetic aspects of the study are clean, and the mutational phenotypes are convincing.
Several suggestions and major comments that can improve the manuscript include:
(1) Overall molecular mechanisms of Jam2 function are not fully uncovered in the study. How do the adhesion molecules Jam2a and Jam2b regulate SVF cell formation? Are they responsible for migration, adhesion or fate determination of these structures? The authors should provide a more in-depth study of the jam2a, jam2b mutations and assess the processes affected in these mutants. Combining these mutants with etv2:Kaede can also provide a stronger causative link between their functions and defects in SVF formation.
(2) Have the authors tested the specificity of the jam2b knock-in reporter line? This is an important experiment, as many of the conclusions derive from lineage tracing and fluorescence reporting from this knock-in line. One suggestion is to cross the jam2b:GFP or jam2b:Gal4, UAS:GFP line to the generated jam2b mutants, and examine the expression pattern of these lines. Considering that the ISH experiment showed lack of jam2b expression, the reporter line should not be expressed in the jam2b mutants.
(3) The rationale behind the regeneration study is not clear, and the mechanisms underlying the phenotype are not well described. How do the authors explain the phenotype with the impaired regeneration, and what is the significance of this finding as it relates to SVF formation and function?
(4) The authors need to include representative images of jam2b>CreERT2 with 4-OH activation at different timepoints in Figure 3.
(5) The etv2:Kaede photoconversion experiment to show that the majority of intestinal vasculature derives after 24 hours needs to be supplemented with additional data on photoconverted post-24-hour-old endothelial cells, with the expectation that the majority of intestinal endothelial cells at 4 days will then be labeled with red Kaede. In addition, there have been data that show the red Kaede protein is not stable past several days in vivo, and 3 days might be sufficient for the removal or degradation of this photoconverted protein. Thus, the statement that intestinal vasculature forms largely by new vasculogenesis might be too strong based on existing data.
(6) To strengthen the claim that hand2 acts upstream of jam2b, the authors can perform combinatorial genetic epistatic analysis and examine whether jam2b mutations worsen hand2 homozygous or heterozygous effects on the SVF. Similarly, overexpressing jam2b might rescue the loss of SVF/etv2 expression in hand2 mutants.
eLife Assessment
This important work investigates cooperative behaviors in adolescents using a repeated Prisoner's Dilemma game. The approach used in the study is solid. The impact of this work could be further enhanced with more rigorous modelling procedures and more modeling selection/comparison details, as well as by framing the findings in terms of the specific game-theoretic context, rather than general cooperation. Findings from this study will be of interest to developmental psychologists, economists, and social psychologists.
Reviewer #1 (Public review):
Summary:
Wu and colleagues aimed to explain previous findings that adolescents, compared to adults, show reduced cooperation following cooperative behaviour from a partner in several social scenarios. The authors analysed behavioural data from adolescents and adults performing a zero-sum Prisoner's Dilemma task and compared a range of social and non-social reinforcement learning models to identify potential algorithmic differences. Their findings suggest that adolescents' lower cooperation is best explained by a reduced learning rate for cooperative outcomes, rather than differences in prior expectations about the cooperativeness of a partner. The authors situate their results within the broader literature, proposing that adolescents' behaviour reflects a stronger preference for self-interest rather than a deficit in mentalising.
Strengths:
The work as a whole suggests that, in line with past work, adolescents prioritise value accumulation, and this can be, in part, explained by algorithmic differences in weighted value learning. The authors situate their work very clearly in past literature, and make it obvious the gap they are testing and trying to explain. The work also includes social contexts which move the field beyond non-social value accumulation in adolescents. The authors compare a series of formal approaches that might explain the results and establish generative and model-comparison procedures to demonstrate the validity of their winning model and individual parameters. The writing was clear, and the presentation of the results was logical and well-structured.
Weaknesses:
I had some concerns about the methods used to fit and approximate parameters of interest. Namely, the use of maximum likelihood versus hierarchical methods to fit models on an individual level, which may reduce some of the outliers noted in the supplement, and also may improve model identifiability.
There was also little discussion given the structure of the Prisoner's Dilemma, and the strategy of the game (that defection is always dominant), meaning that the preferences of the adolescents cannot necessarily be distinguished from the incentives of the game, i.e. they may seem less cooperative simply because they want to play the dominant strategy, rather than a lower preferences for cooperation if all else was the same.
The authors have now addressed my comments and concerns in their revised version.
Appraisal & Discussion:
Overall, I believe this work has the potential to make a meaningful contribution to the field. Its impact would be strengthened by more rigorous modelling checks and fitting procedures, as well as by framing the findings in terms of the specific game-theoretic context, rather than general cooperation.
Comments on revisions:
Thank you to the authors for addressing my comments and concerns.
Reviewer #2 (Public review):
Summary:
This manuscript investigates age-related differences in cooperative behavior by comparing adolescents and adults in a repeated Prisoner's Dilemma Game (rPDG). The authors find that adolescents exhibit lower levels of cooperation than adults. Specifically, adolescents reciprocate partners' cooperation to a lesser degree than adults do. Through computational modeling, they show that this relatively low cooperation rate is not due to impaired expectations or mentalizing deficits, but rather a diminished intrinsic reward for reciprocity. A social reinforcement learning model with asymmetric learning rate best captured these dynamics, revealing age-related differences in how positive and negative outcomes drive behavioral updates. These findings contribute to understanding the developmental trajectory of cooperation and highlight adolescence as a period marked by heightened sensitivity to immediate rewards at the expense of long-term prosocial gains.
Strengths:
Rigid model comparison and parameter recovery procedure. Conceptually comprehensive model space. Well-powered samples.
Weaknesses:
A key conceptual distinction between learning from non-human agents (e.g., bandit machines) and human partners is that the latter are typically assumed to possess stable behavioral dispositions or moral traits. When a non-human source abruptly shifts behavior (e.g., from 80% to 20% reward), learners may simply update their expectations. In contrast, a sudden behavioral shift by a previously cooperative human partner can prompt higher-order inferences about the partner's trustworthiness or the integrity of the experimental setup (e.g., whether the partner is truly interactive or human). The authors may consider whether their modeling framework captures such higher-order social inferences. Specifically, trait-based models-such as those explored in Hackel et al. (2015, Nature Neuroscience)-suggest that learners form enduring beliefs about others' moral dispositions, which then modulate trial-by-trial learning. A learner who believes their partner is inherently cooperative may update less in response to a surprising defection, effectively showing a trait-based dampening of learning rate.
This asymmetry in belief updating has been observed in prior work (e.g., Siegel et al., 2018, Nature Human Behaviour) and could be captured using a dynamic or belief-weighted learning rate. Models incorporating such mechanisms (e.g., dynamic learning rate models as in Jian Li et al., 2011, Nature Neuroscience) could better account for flexible adjustments in response to surprising behavior, particularly in the social domain.
Second, the developmental interpretation of the observed effects would be strengthened by considering possible non-linear relationships between age and model parameters. For instance, certain cognitive or affective traits relevant to social learning-such as sensitivity to reciprocity or reward updating-may follow non-monotonic trajectories, peaking in late adolescence or early adulthood. Fitting age as a continuous variable, possibly with quadratic or spline terms, may yield more nuanced developmental insights.
Finally, the two age groups compared-adolescents (high school students) and adults (university students)-differ not only in age but also in sociocultural and economic backgrounds. High school students are likely more homogenous in regional background (e.g., Beijing locals), while university students may be drawn from a broader geographic and socioeconomic pool. Additionally, differences in financial independence, family structure (e.g., single-child status), and social network complexity may systematically affect cooperative behavior and valuation of rewards. Although these factors are difficult to control fully, the authors should more explicitly address the extent to which their findings reflect biological development versus social and contextual influences.
Comments on revisions:
The authors have addressed most of my previous comments adequately. I only have a minor question: The models with some variations of RL seem to have very similar AIC. What were the authors' criteria in deciding which model is the "winning" model when several models have similar AIC? Are there ways of integrating models with similar structures into a "model family"? Alternatively, is it possible that different models fit better for different subgroups of participants (e.g., high schoolers vs. college students)?
Author response:
The following is the authors’ response to the previous reviews
Public Reviews:
Reviewer #1 (Public review):
Summary:
Wu and colleagues aimed to explain previous findings that adolescents, compared to adults, show reduced cooperation following cooperative behaviour from a partner in several social scenarios. The authors analysed behavioural data from adolescents and adults performing a zero-sum Prisoner's Dilemma task and compared a range of social and non-social reinforcement learning models to identify potential algorithmic differences. Their findings suggest that adolescents' lower cooperation is best explained by a reduced learning rate for cooperative outcomes, rather than differences in prior expectations about the cooperativeness of a partner. The authors situate their results within the broader literature, proposing that adolescents' behaviour reflects a stronger preference for self-interest rather than a deficit in mentalising.
Strengths:
The work as a whole suggests that, in line with past work, adolescents prioritise value accumulation, and this can be, in part, explained by algorithmic differences in weighted value learning. The authors situate their work very clearly in past literature, and make it obvious the gap they are testing and trying to explain. The work also includes social contexts that move the field beyond non-social value accumulation in adolescents. The authors compare a series of formal approaches that might explain the results and establish generative and modelcomparison procedures to demonstrate the validity of their winning model and individual parameters. The writing was clear, and the presentation of the results was logical and wellstructured.
We thank the reviewer for recognizing the strengths of our work.
Weaknesses:
(Q1) I also have some concerns about the methods used to fit and approximate parameters of interest. Namely, the use of maximum likelihood versus hierarchical methods to fit models on an individual level, which may reduce some of the outliers noted in the supplement, and also may improve model identifiability.
We thank the reviewer for this suggestion. Following the comment, we added a hierarchical Bayesian estimation. We built a hierarchical model with both group-level (adolescent group and adult group) and individual-level structures for the best-fitting model. Four Markov chains with 4,000 samples each were run, and the model converged well (see Figure supplement 7)
We then analyzed the posterior parameters for adolescents and adults separately. The results were consistent with those from the MLE analysis (see Figure 2—figure supplement 5). These additional results have been included in the Appendix Analysis section (also see Figure supplement 5 and 7). In addition, we have updated the code and provided the link for reference. We appreciate the reviewer’s suggestion, which improved our analysis.
(Q2) There was also little discussion given the structure of the Prisoner's Dilemma, and the strategy of the game (that defection is always dominant), meaning that the preferences of the adolescents cannot necessarily be distinguished from the incentives of the game, i.e. they may seem less cooperative simply because they want to play the dominant strategy, rather than a lower preferences for cooperation if all else was the same.
We thank the reviewer for this comment and agree that adolescents’ lower cooperation may partly reflect a rational response to the incentive structure of the Prisoner’s Dilemma.
However, our computational modeling explicitly addressed this possibility. Model 4 (inequality aversion) captures decisions that are driven purely by self-interest or aversion to unequal outcomes, including a parameter reflecting disutility from advantageous inequality, which represents self-oriented motives. If participants’ behavior were solely guided by the payoff-dominant strategy, this model should have provided the best fit. However, our model comparison showed that Model 5 (social reward) performed better in both adolescents and adults, suggesting that cooperative behavior is better explained by valuing social outcomes beyond payoff structures.
Besides, if adolescents’ lower cooperation is that they strategically respond to the payoff structure by adopting defection as the more rewarding option. Then, adolescents should show reduced cooperation across all rounds. Instead, adolescents and adults behaved similarly when partners defected, but adolescents cooperated less when partners cooperated and showed little increase in cooperation even after consecutive cooperative responses. This pattern suggests that adolescents’ lower cooperation cannot be explained solely by strategic responses to payoff structures but rather reflects a reduced sensitivity to others’ cooperative behavior or weaker social reciprocity motives. We have expanded our Discussion to acknowledge this important point and to clarify how the behavioral and modeling results address the reviewer’s concern.
“Overall, these findings indicate that adolescents’ lower cooperation is unlikely to be driven solely by strategic considerations, but may instead reflect differences in the valuation of others’ cooperation or reduced motivation to reciprocate. Although defection is the payoffdominant strategy in the Prisoner’s Dilemma, the selective pattern of adolescents’ cooperation and the model comparison results indicate that their reduced cooperation cannot be fully explained by strategic incentives, but rather reflects weaker valuation of social reciprocity.”
Appraisal & Discussion:
(Q3) The authors have partially achieved their aims, but I believe the manuscript would benefit from additional methodological clarification, specifically regarding the use of hierarchical model fitting and the inclusion of Bayes Factors, to more robustly support their conclusions. It would also be important to investigate the source of the model confusion observed in two of their models.
We thank the reviewer for this comment. In the revised manuscript, we have clarified the hierarchical Bayesian modeling procedure for the best-fitting model, including the group- and individual-level structure and convergence diagnostics. The hierarchical approach produced results that fully replicated those obtained from the original maximumlikelihood estimation, confirming the robustness of our findings. Please also see the response to Q1.
Regarding the model confusion between the inequality aversion (Model 4) and social reward (Model 5) models in the model recovery analysis, both models’ simulated behaviors were best captured by the baseline model. This pattern arises because neither model includes learning or updating processes. Given that our task involves dynamic, multi-round interactions, models lacking a learning mechanism cannot adequately capture participants’ trial-by-trial adjustments, resulting in similar behavioral patterns that are better explained by the baseline model during model recovery. We have added a clarification of this point to the Results:
“The overlap between Models 4 and 5 likely arises because neither model incorporates a learning mechanism, making them less able to account for trial-by-trial adjustments in this dynamic task.”
(Q4) I am unconvinced by the claim that failures in mentalising have been empirically ruled out, even though I am theoretically inclined to believe that adolescents can mentalise using the same procedures as adults. While reinforcement learning models are useful for identifying biases in learning weights, they do not directly capture formal representations of others' mental states. Greater clarity on this point is needed in the discussion, or a toning down of this language.
We sincerely thank the reviewer for this professional comment. We agree that our prior wording regarding adolescents’ capacity to mentalise was somewhat overgeneralized. Accordingly, we have toned down the language in both the Abstract and the Discussion to better align our statements with what the present study directly tests. Specifically, our revisions focus on adolescents’ and adults’ ability to predict others’ cooperation in social learning. This is consistent with the evidence from our analyses examining adolescents’ and adults’ model-based expectations and self-reported scores on partner cooperativeness (see Figure 4). In the revised Discussion, we state:
“Our results suggest that the lower levels of cooperation observed in adolescents stem from a stronger motive to prioritize self-interest rather than a deficiency in predicting others’ cooperation in social learning”.
(Q5) Additionally, a more detailed discussion of the incentives embedded in the Prisoner's Dilemma task would be valuable. In particular, the authors' interpretation of reduced adolescent cooperativeness might be reconsidered in light of the zero-sum nature of the game, which differs from broader conceptualisations of cooperation in contexts where defection is not structurally incentivised.
We thank the reviewer for this comment and agree that adolescents’ lower cooperation may partly reflect a rational response to the incentive structure of the Prisoner’s Dilemma. However, our behavioral and computational evidence suggests that this pattern cannot be explained solely by strategic responses to payoff structures, but rather reflects a reduced sensitivity to others’ cooperative behavior or weaker social reciprocity motives. We have expanded the Discussion to acknowledge this point and to clarify how both behavioral and modeling results address the reviewer’s concern (see also our response to Q2).
(Q6) Overall, I believe this work has the potential to make a meaningful contribution to the field. Its impact would be strengthened by more rigorous modelling checks and fitting procedures, as well as by framing the findings in terms of the specific game-theoretic context, rather than general cooperation.
We thank the reviewer for the professional comments, which have helped us improve our work.
Reviewer #2 (Public review):
Summary:
This manuscript investigates age-related differences in cooperative behavior by comparing adolescents and adults in a repeated Prisoner's Dilemma Game (rPDG). The authors find that adolescents exhibit lower levels of cooperation than adults. Specifically, adolescents reciprocate partners' cooperation to a lesser degree than adults do. Through computational modeling, they show that this relatively low cooperation rate is not due to impaired expectations or mentalizing deficits, but rather a diminished intrinsic reward for reciprocity. A social reinforcement learning model with asymmetric learning rate best captured these dynamics, revealing age-related differences in how positive and negative outcomes drive behavioral updates. These findings contribute to understanding the developmental trajectory of cooperation and highlight adolescence as a period marked by heightened sensitivity to immediate rewards at the expense of long-term prosocial gains.
Strengths:
(1) Rigid model comparison and parameter recovery procedure.
(2) Conceptually comprehensive model space.
(3) Well-powered samples.
We thank the reviewer for highlighting the strengths of our work.
Weaknesses:
(Q1) A key conceptual distinction between learning from non-human agents (e.g., bandit machines) and human partners is that the latter are typically assumed to possess stable behavioral dispositions or moral traits. When a non-human source abruptly shifts behavior (e.g., from 80% to 20% reward), learners may simply update their expectations. In contrast, a sudden behavioral shift by a previously cooperative human partner can prompt higher-order inferences about the partner's trustworthiness or the integrity of the experimental setup (e.g., whether the partner is truly interactive or human). The authors may consider whether their modeling framework captures such higher-order social inferences. Specifically, trait-based models-such as those explored in Hackel et al. (2015, Nature Neuroscience)-suggest that learners form enduring beliefs about others' moral dispositions, which then modulate trial-bytrial learning. A learner who believes their partner is inherently cooperative may update less in response to a surprising defection, effectively showing a trait-based dampening of learning rate.
We thank the reviewer for this thoughtful comment. We agree that social learning from human partners may involve higher-order inferences beyond simple reinforcement learning from non-human sources. To address this, we had previously included such mechanisms in our behavioral modeling. In Model 7 (Social Reward Model with Influence), we tested a higher-order belief-updating process in which participants’ expectations about their partner’s cooperation were shaped not only by the partner’s previous choices but also by the inferred influence of their own past actions on the partner’s subsequent behavior. In other words, participants could adjust their belief about the partner’s cooperation by considering how their partner’s belief about them might change. Model comparison showed that Model 7 did not outperform the best-fitting model, suggesting that incorporating higher-order influence updates added limited explanatory value in this context. As suggested by the reviewer, we have further clarified this point in the revised manuscript.
Regarding trait-based frameworks, we appreciate the reviewer’s reference to Hackel et al. (2015). That study elegantly demonstrated that learners form relatively stable beliefs about others’ social dispositions, such as generosity, especially when the task structure provides explicit cues for trait inference (e.g., resource allocations and giving proportions). By contrast, our study was not designed to isolate trait learning, but rather to capture how participants update their expectations about a partner’s cooperation over repeated interactions. In this sense, cooperativeness in our framework can be viewed as a trait-like latent belief that evolves as evidence accumulates. Thus, while our model does not include a dedicated trait module that directly modulates learning rates, the belief-updating component of our best-fitting model effectively tracks a dynamic, partner-specific cooperativeness, potentially reflecting a prosocial tendency.
(Q2) This asymmetry in belief updating has been observed in prior work (e.g., Siegel et al., 2018, Nature Human Behaviour) and could be captured using a dynamic or belief-weighted learning rate. Models incorporating such mechanisms (e.g., dynamic learning rate models as in Jian Li et al., 2011, Nature Neuroscience) could better account for flexible adjustments in response to surprising behavior, particularly in the social domain.
We thank the reviewer for the suggestion. Following the comment, we implemented an additional model incorporating a dynamic learning rate based on the magnitude of prediction errors. Specifically, we developed Model 9: Social reward model with Pearce–Hall learning algorithm (dynamic learning rate), in which participants’ beliefs about their partner’s cooperation probability are updated using a Rescorla–Wagner rule with a learning rate dynamically modulated by the Pearce–Hall (PH) Error Learning mechanism. In this framework, the learning rate increases following surprising outcomes (larger prediction errors) and decreases as expectations become more stable (see Appendix Analysis section for details).
The results showed that this dynamic learning rate model did not outperform our bestfitting model in either adolescents or adults (see Figure supplement 6). We greatly appreciate the reviewer’s suggestion, which has strengthened the scope of our analysis. We now have added these analyses to the Appendix Analysis section (also Figure Supplement 6) and expanded the Discussion to acknowledge this modeling extension and further discuss its implications.
(Q3) Second, the developmental interpretation of the observed effects would be strengthened by considering possible non-linear relationships between age and model parameters. For instance, certain cognitive or affective traits relevant to social learning-such as sensitivity to reciprocity or reward updating-may follow non-monotonic trajectories, peaking in late adolescence or early adulthood. Fitting age as a continuous variable, possibly with quadratic or spline terms, may yield more nuanced developmental insights.
We thank the reviewer for this professional comment. In addition to the linear analyses, we further conducted exploratory analyses to examine potential non-linear relationships between age and the model parameters. Specifically, we fit LMMs for each of the four parameters as outcomes (α+, α-, β, and ω). The fixed effects included age, a quadratic age term, and gender, and the random effects included subject-specific random intercepts and random slopes for age and gender. Model comparison using BIC did not indicate improvement for the quadratic models over the linear models for α<sup>+</sup> (ΔBIC<sub>quadratic-linear</sub> = 5.09), α<sup>-</sup>(ΔBIC<sub>quadratic-linear</sub> = 3.04), β (ΔBIC<sub>quadratic-linear</sub> = 3.9), or ω (ΔBIC<sub>quadratic-linear</sub>= 0). Moreover, the quadratic age term was not significant for α<sup>+</sup>, α<sup>−</sup>, or β (all ps > 0.10). For ω, we observed a significant linear age effect (b = 1.41, t = 2.65, p = 0.009) and a significant quadratic age effect (b = −0.03, t = −2.39, p = 0.018; see Author response image 1). This pattern is broadly consistent with the group effect reported in the main text. The shaded area in the figure represents the 95% confidence interval. As shown, the interval widens at older ages (≥ 26 years) due to fewer participants in that range, which limits the robustness of the inferred quadratic effect. In consideration of the limited precision at older ages and the lack of BIC improvement, we did not emphasize the quadratic effect in the revised manuscript and present these results here as exploratory.
Author response image 1.
Linear and quadratic model fits showing the relationship between age and the ω parameter, with 95% confidence intervals.
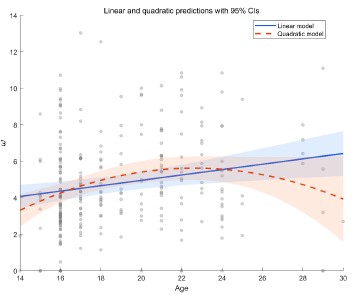
(Q4) Finally, the two age groups compared - adolescents (high school students) and adults (university students) - differ not only in age but also in sociocultural and economic backgrounds. High school students are likely more homogenous in regional background (e.g., Beijing locals), while university students may be drawn from a broader geographic and socioeconomic pool. Additionally, differences in financial independence, family structure (e.g., single-child status), and social network complexity may systematically affect cooperative behavior and valuation of rewards. Although these factors are difficult to control fully, the authors should more explicitly address the extent to which their findings reflect biological development versus social and contextual influences.
We appreciate this comment. Indeed, adolescents (high school students) and adults (university students) differ not only in age but also in sociocultural and socioeconomic backgrounds. In our study, all participants were recruited from Beijing and surrounding regions, which helps minimize large regional and cultural variability. Moreover, we accounted for individual-level random effects and included participants’ social value orientation (SVO) as an individual difference measure.
Nonetheless, we acknowledge that other contextual factors, such as differences in financial independence, socioeconomic status, and social experience—may also contribute to group differences in cooperative behavior and reward valuation. Although our results are broadly consistent with developmental theories of reward sensitivity and social decisionmaking, sociocultural influences cannot be entirely ruled out. Future work with more demographically matched samples or with socioeconomic and regional variables explicitly controlled will help clarify the relative contributions of biological and contextual factors. Accordingly, we have revised the Discussion to include the following statement:
“Third, although both age groups were recruited from Beijing and nearby regions, minimizing major regional and cultural variation, adolescents and adults may still differ in socioeconomic status, financial independence, and social experience. Such contextual differences could interact with developmental processes in shaping cooperative behavior and reward valuation. Future research with demographically matched samples or explicit measures of socioeconomic background will help disentangle biological from sociocultural influences.”
Reviewer #3 (Public review):
Summary:
Wu and colleagues find that in a repeated Prisoner's Dilemma, adolescents, compared to adults, are less likely to increase their cooperation behavior in response to repeated cooperation from a simulated partner. In contrast, after repeated defection by the partner, both age groups show comparable behavior.
To uncover the mechanisms underlying these patterns, the authors compare eight different models. They report that a social reward learning model, which includes separate learning rates for positive and negative prediction errors, best fits the behavior of both groups. Key parameters in this winning model vary with age: notably, the intrinsic value of cooperating is lower in adolescents. Adults and adolescents also differ in learning rates for positive and negative prediction errors, as well as in the inverse temperature parameter.
Strengths:
The modeling results are compelling in their ability to distinguish between learned expectations and the intrinsic value of cooperation. The authors skillfully compare relevant models to demonstrate which mechanisms drive cooperation behavior in the two age groups.
We thank the reviewer’s recognition of our work’s strengths.
Weaknesses:
(Q1) Some of the claims made are not fully supported by the data:
The central parameter reflecting preference for cooperation is positive in both groups. Thus, framing the results as self-interest versus other-interest may be misleading.
We thank the reviewer for this insightful comment. In the social reward model, the cooperation preference parameter is positive by definition, as defection in the repeated rPDG always yields a +2 monetary advantage regardless of the partner’s action. This positive value represents the additional subjective reward assigned to mutual cooperation (e.g., reciprocity value) that counterbalances the monetary gain from defection. Although the estimated social reward parameter ω was positive, the effective advantage of cooperation is Δ=p×ω−2. Given participants’ inferred beliefs p, Δ was negative for most trials (p×ω<2), indicating that the social reward was insufficient to offset the +2 advantage of defection. Thus, both adolescents and adults valued cooperation positively, but adolescents’ smaller ω and weaker responsiveness to sustained partner cooperation suggest a stronger weighting on immediate monetary payoffs.
In this light, our framing of adolescents as more self-interested derives from their behavioral pattern: even when they recognized sustained partner cooperation and held high expectations of partner cooperation, adolescents showed lower cooperative behavior and reciprocity rewards compared with adults. Whereas adults increased cooperation after two or three consecutive partner cooperations, this pattern was absent among adolescents. We therefore interpret their behavior as relatively more self-interested, reflecting reduced sensitivity to the social reward from mutual cooperation rather than a categorical shift from self-interest to other-interest, as elaborated in the Discussion.
(Q2) It is unclear why the authors assume adolescents and adults have the same expectations about the partner's cooperation, yet simultaneously demonstrate age-related differences in learning about the partner. To support their claim mechanistically, simulations showing that differences in cooperation preference (i.e., the w parameter), rather than differences in learning, drive behavioral differences would be helpful.
We thank the reviewer for raising this important point. In our model, both adolescents and adults updated their beliefs about partner cooperation using an asymmetric reinforcement learning (RL) rule. Although adolescents exhibited a higher positive and a lower negative learning rate than adults, the two groups did not differ significantly in their overall updating of partner cooperation probability (Fig. 4a-b). We then examined the social reward parameter ω, which was significantly smaller in adolescents and determined the intrinsic value of mutual cooperation (i.e., p×ω). This variable differed significantly between groups and closely matched the behavioral pattern.
Following the reviewer’s suggestion, we conducted additional simulations varying one model parameter at a time while holding the others constant. The difference in mean cooperation probability between adults and adolescents served as the index (positive = higher cooperation in adults). As shown in the Author response image 2, decreases in ω most effectively reproduced the observed group difference (shaded area), indicating that age-related differences in cooperation are primarily driven by variation in the social reward parameter ω rather than by others.
Author response image 2.
Simulation results showing how variations in each model parameter affect the group difference in mean cooperation probability (Adults – Adolescents). Based on the bestfitting Model 8 and parameters estimated from all participants, each line represents one parameter (i.e., α+, α-, ω, β) systematically varied within the tested range (α±:0.1–0.9; ω, β:1–9) while other parameters were held constant. Positive values indicate higher cooperation in adults. Smaller ω values most strongly reproduced the observed group difference, suggesting that reduced social reward weighting primarily drives adolescents’ lower cooperation.
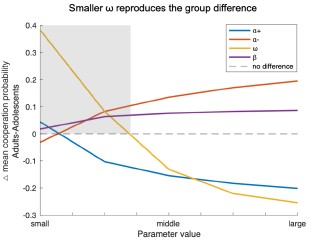
(Q3) Two different schedules of 120 trials were used: one with stable partner behavior and one with behavior changing after 20 trials. While results for order effects are reported, the results for the stable vs. changing phases within each schedule are not. Since learning is influenced by reward structure, it is important to test whether key findings hold across both phases.
We thank the reviewer for this thoughtful and professional comment. In our GLMM and LMM analyses, we focused on trial order rather than explicitly including the stable vs. changing phase factor, due to concerns about multicollinearity. In our design, phases occur in specific temporal segments, which introduces strong collinearity with trial order. In multi-round interactions, order effects also capture variance related to phase transitions.
Nonetheless, to directly address this concern, we conducted additional robustness analyses by adding a phase variable (stable vs. changing) to GLMM1, LMM1, and LMM3 alongside the original covariates. Across these specifications, the key findings were replicated (see GLMM<sub>sup</sub>2 and LMM<sub>sup</sub>4–5; Tables 9-11), and the direction and significance of main effects remained unchanged, indicating that our conclusions are robust to phase differences.
(Q4) The division of participants at the legal threshold of 18 years should be more explicitly justified. The age distribution appears continuous rather than clearly split. Providing rationale and including continuous analyses would clarify how groupings were determined.
We thank the reviewer for this thoughtful comment. We divided participants at the legal threshold of 18 years for both conceptual and practical reasons grounded in prior literature and policy. In many countries and regions, 18 marks the age of legal majority and is widely used as the boundary between adolescence and adulthood in behavioral and clinical research. Empirically, prior studies indicate that psychosocial maturity and executive functions approach adult levels around this age, with key cognitive capacities stabilizing in late adolescence (Icenogle et al., 2019; Tervo-Clemmens et al., 2023). We have clarified this rationale in the Introduction section of the revised manuscript.
“Based on legal criteria for majority and prior empirical work, we adopt 18 years as the boundary between adolescence and adulthood (Icenogle et al., 2019; Tervo-Clemmens et al., 2023).”
We fully agree that the underlying age distribution is continuous rather than sharply divided. To address this, we conducted additional analyses treating age as a continuous predictor (see GLMM<sub>sup</sub>1 and LMM<sub>sup</sub>1–3; Tables S1-S4), which generally replicated the patterns observed with the categorical grouping. Nevertheless, given the limited age range of our sample, the generalizability of these findings to fine-grained developmental differences remains constrained. Therefore, our primary analyses continue to focus on the contrast between adolescents and adults, rather than attempting to model a full developmental trajectory.
(Q5) Claims of null effects (e.g., in the abstract: "adults increased their intrinsic reward for reciprocating... a pattern absent in adolescents") should be supported with appropriate statistics, such as Bayesian regression.
We thank the reviewer for highlighting the importance of rigor when interpreting potential null effects. To address this concern, we conducted Bayes factor analyses of the intrinsic reward for reciprocity and reported the corresponding BF10 for all relevant post hoc comparisons. This approach quantifies the relative evidence for the alternative versus the null hypothesis, thereby providing a more direct assessment of null effects. The analysis procedure is now described in the Methods and Materials section:
“Post hoc comparisons were conducted using Bayes factor analyses with MATLAB’s bayesFactor Toolbox (version v3.0, Krekelberg, 2024), with a Cauchy prior scale σ = 0.707.”
(Q6) Once claims are more closely aligned with the data, the study will offer a valuable contribution to the field, given its use of relevant models and a well-established paradigm.
We are grateful for the reviewer’s generous appraisal and insightful comments.
Recommendations for the authors:
Reviewer #1 (Recommendations for the authors):
(1) I commend the authors on a well-structured, clear, and interesting piece of work. I have several questions and recommendations that, if addressed, I believe will strengthen the manuscript.
We thank the reviewer for commending the organization of our paper.
(2) Introduction: - Why use a zero-sum (Prisoner's Dilemma; PD) versus a mixed-motive game (e.g. Trust Task) to study cooperation? In a finite set of rounds, the dominant strategy can be to defect in a PD.
We thank the reviewer for this helpful comment. We agree that both the rationale for using the repeated Prisoner’s Dilemma (rPDG) and the limitations of this framework should be clarified. We chose the rPDG to isolate the core motivational conflict between selfinterest and joint welfare, as its symmetric and simultaneous structure avoids the sequential trust and reputation dependencies/accumulation inherent to asymmetric tasks such as the Trust Game (King-Casas et al., 2005; Rilling et al., 2002).
Although a finitely repeated rPDG theoretically favors defection, extensive prior research shows that cooperation can still emerge in long repeated interactions when players rely on learning and reciprocity rather than backward induction (Rilling et al., 2002; Fareri et al., 2015). Our design employed 120 consecutive rounds, allowing participants to update expectations about partner behavior and to establish stable reciprocity patterns over time. We have added the following clarification to the Introduction:
“The rPDG provides a symmetric and simultaneous framework that isolates the motivational conflict between self-interest and joint welfare, avoiding the sequential trust and reputation dynamics characteristic of asymmetric tasks such as the Trust Game (Rilling et al., 2002; King-Casas et al., 2005)”
(3) Methods:
Did the participants know how long the PD would go on for?
Were the participants informed that the partner was real/simulated?
Were the participants informed that the partner was going to be the same for all rounds?
We thank the reviewer for the meticulous review work, which helped us present the experimental design and reporting details more clearly. the following clarifications: I. Participants were not informed of the total number of rounds in the rPDG. This prevented endgame expectations and avoided distraction from counting rounds, which could introduce additional effects. II. Participants were told that their partner was another human participant in the laboratory. However, the partner’s behavior was predetermined by a computer program. This design enabled tighter experimental control and ensured consistent conditions across age groups, supporting valid comparisons. III. Participants were informed that they would interact with the same partner across all rounds, aligning with the essence of a multiround interaction paradigm and stabilizing partner-related expectations. For transparency, we have clarified these points in the Methods and Materials section:
“Participants were told that their partner was another human participant in the laboratory and that they would interact with the same partner across all rounds. However, in reality, the actions of the partner were predetermined by a computer program. This setup allowed for a clear comparison of the behavioral responses between adolescents and adults. Participants were not informed of the total number of rounds in the rPDG.”
(4) The authors mention that an SVO was also recorded to indicate participant prosociality. Where are the results of this? Did this track game play at all? Could cooperativeness be explained broadly as an SVO preference that penetrated into game-play behaviour?
We thank the reviewer for pointing this out. We agree that individual differences in prosociality may shape cooperative behavior, so we conducted additional analyses incorporating SVO. Specifically, we extended GLMM1 and LMM3 by adding the measured SVO as a fixed effect with random slopes, yielding GLMM<sub>sup</sub>3 and LMM<sub>sup</sub>6 (Tables 12–13). The results showed that higher SVO was associated with greater cooperation, whereas its effect on the reward for reciprocity was not significant. Importantly, the primary findings remained unchanged after controlling for SVO. These results indicate that cooperativeness in our task cannot be explained solely by a broad SVO preference, although a more prosocial orientation was associated with greater cooperation. We have reported these analyses and results in the Appendix Analysis section.
(5) Why was AIC chosen rather an BIC to compare model dominance?
Sorry for the lack of clarification. Both the Akaike Information Criterion (AIC, Akaike, 1974) and Bayesian Information Criterion (BIC, Schwarz, 1978) are informationtheoretic criterions for model comparison, neither of which depends on whether the models to be compared are nested to each other or not (Burnham et al., 2002). We have added the following clarification into the Methods.
“We chose to use the AICc as the metric of goodness-of-fit for model comparison for the following statistical reasons. First, BIC is derived based on the assumption that the “true model” must be one of the models in the limited model set one compares (Burnham et al., 2002; Gelman & Shalizi, 2013), which is unrealistic in our case. In contrast, AIC does not rely on this unrealistic “true model” assumption and instead selects out the model that has the highest predictive power in the model set (Gelman et al., 2014). Second, AIC is also more robust than BIC for finite sample size (Vrieze, 2012).”
(6) I believe the model fitting procedure might benefit from hierarchical estimation, rather than maximum likelihood methods. Adolescents in particular seem to show multiple outliers in a^+ and w^+ at the lower end of the distributions in Figure S2. There are several packages to allow hierarchical estimation and model comparison in MATLAB (which I believe is the language used for this analysis;
see https://journals.plos.org/ploscompbiol/article?id=10.1371/journal.pcbi.1007043).
We thank the reviewer for this helpful comment and for referring us to relevant methodological work (Piray et al., 2019). We have addressed this point by incorporating hierarchical Bayesian estimation, which effectively mitigates outlier effects and improves model identifiability. The results replicated those obtained with MLE fitting and further revealed group-level differences in key parameters. Please see our detailed response to Reviewer#1 Q1 for the full description of this analysis and results.
(7) Results: Model confusion seems to show that the inequality aversion and social reward models were consistently confused with the baseline model. Is this explained or investigated? I could not find an explanation for this.
The apparent overlap between the inequality aversion (Model 4) and social reward (Model 5) models in the recovery analysis likely arises because neither model includes a learning mechanism, making them unable to capture trial-by-trial adjustments in this dynamic task. Consequently, both were best fit by the baseline model. Please see Response to Reviewer #1 Q3 for related discussion.
(8) Figures 3e and 3f show the correlation between asymmetric learning rates and age. It seems that both a^+ and a^- are around 0.35-0.40 for young adolescents, and this becomes more polarised with age. Could it be that with age comes an increasing discernment of positive and negative outcomes on beliefs, and younger ages compress both positive and negative values together? Given the higher stochasticity in younger ages (\beta), it may also be that these values simply represent higher uncertainty over how to act in any given situation within a social context (assuming the differences in groups are true).
We appreciate this insightful interpretation. Indeed, both α+ and α- cluster around 0.35–0.40 in younger adolescents and become increasingly polarized with age, suggesting that sensitivity to positive versus negative feedback is less differentiated early in development and becomes more distinct over time. This interpretation remains tentative and warrants further validation. Based on this comment, we have revised the Discussion to include this developmental interpretation.
We also clarify that in our model β denotes the inverse temperature parameter; higher β reflects greater choice precision and value sensitivity, not higher stochasticity. Accordingly, adolescents showed higher β values, indicating more value-based and less exploratory choices, whereas adults displayed relatively greater exploratory cooperation. These group differences were also replicated using hierarchical Bayesian estimation (see Response to Reviewer #1 Q1). In response to this comment, we have added a statement in the Discussion highlighting this developmental interpretation.
“Together, these findings suggest that the differentiation between positive and negative learning rates changes with age, reflecting more selective feedback sensitivity in development, while higher β values in adolescents indicate greater value sensitivity. This interpretation remains tentative and requires further validation in future research.”
(9) A parameter partial correlation matrix (off-diagonal) would be helpful to understand the relationship between parameters in both adolescents and adults separately. This may provide a good overview of how the model properties may change with age (e.g. a^+'s relation to \beta).
We thank the reviewer for this helpful comment. We fully agree that a parameter partial correlation matrix can further elucidate the relationships among parameters. Accordingly, we conducted a partial correlation analysis and added the visually presented results to the revised manuscript as Figure 2-figure supplement 4.
(10) It would be helpful to have Bayes Factors reported with each statistical tests given that several p-values fall within the 0.01 and 0.10.
We thank the reviewer for this important recommendation. We have conducted Bayes factor analyses and reported BF10 for all relevant post hoc comparisons. We also clarified our analysis in the Methods and Materials section:
“Post hoc comparisons were conducted using Bayes factor analyses with MATLAB’s bayesFactor Toolbox (version v3.0, Krekelberg, 2024), with a Cauchy prior scale σ = 0.707.”
(11) Discussion: I believe the language around ruling out failures in mentalising needs to be toned down. RL models do not enable formal representational differences required to assess mentalising, but they can distinguish biases in value learning, which in itself is interesting. If the authors were to show that more complex 'ToM-like' Bayesian models were beaten by RL models across the board, and this did not differ across adults and adolescents, there would be a stronger case to make this claim. I think the authors either need to include Bayesian models in their comparison, or tone down their language on this point, and/or suggest ways in which this point might be more thoroughly investigated (e.g., using structured models on the same task and running comparisons: https://journals.plos.org/plosone/article?id=10.1371/journal.pone.0087619).
We thank the reviewer for the comments. Please see our response to Reviewer 1 (Appraisal & Discussion section) for details.
Reviewer #2 (Recommendations for the authors):
(1) The authors may want to show the winning model earlier (perhaps near the beginning of the Results section, when model parameters are first mentioned).
We thank the reviewer for this suggestion. We agree that highlighting the winning model early improves clarity. Currently, we have mentioned the winning model before the beginning of the Results section. Specifically, in the penultimate paragraph of the Introduction we state:
“We identified the asymmetric RL learning model as the winning model that best explained the cooperative decisions of both adolescents and adults.”
Reviewer #3 (Recommendations for the authors):
(1) In addition to the points mentioned above, I suggest the following:
Clarify plots by clearly explaining each variable. In particular, the indices 1 vs. 1,2 vs 1,2,3 were not immediately understandable.
We thank the reviewer for this suggestion. We agree that the indices were not immediately clear. We have revised the figure captions (Figure 1 and 4) to explicitly define these terms more clearly:
“The x-axis represents the consistency of the partner’s actions in previous trials (t<sub>−1</sub>: last trial; t<sub>−1,2</sub>: last two trials;<sub>t−1,2,3</sub>: last three trials).”
(2) It's unclear why the index stops at 3. If this isn't the maximum possible number of consecutive cooperation trials, please consider including all relevant data, as adolescents might show a trend similar to adults over more trials.
We thank the reviewer for raising this point. In our exploratory analyses, we also examined longer streaks of consecutive partner cooperation or defection (up to four or five trials). Two empirical considerations led us to set the cutoff at three in the final analyses. First, the influence of partner behavior diminished sharply with temporal distance. In both GLMMs and LMMs, coefficients for earlier partner choices were small and unstable, and their inclusion substantially increased model complexity and multicollinearity. This recency pattern is consistent with learning and decision models emphasizing stronger weighting of recent evidence (Fudenberg & Levine, 2014; Fudenberg & Peysakhovich, 2016). Second, streaks longer than three were rare, especially among some participants, leading to data sparsity and inflated uncertainty. Including these sparse conditions risked biasing group estimates rather than clarifying them. Balancing informativeness and stability, we therefore restricted the index to three consecutive partner choices in the main analyses, which we believe sufficiently capture individuals’ general tendencies in reciprocal cooperation.
(3) The term "reciprocity" may not be necessary. Since it appears to reflect a general preference for cooperation, it may be clearer to refer to the specific behavior or parameter being measured. This would also avoid confusion, especially since adolescents do show negative reciprocity in response to repeated defection.
We thank you for this comment. In our work, we compute the intrinsic reward for reciprocity as p × ω, where p is the partner cooperation expectation and ω is the cooperation preference. In the rPDG, this value framework manifests as a reciprocity-derived reward: sustained mutual cooperation maximizes joint benefits, and the resulting choice pattern reflects a value for reciprocity, contingent on the expected cooperation of the partner. This quantity enters the trade-off between U<sub>cooperation</sub> and U<sub>defection</sub> and captures the participant’s intrinsic reward for reciprocity versus the additional monetary reward payoff of defection. Therefore, we consider the term “reciprocity” an acceptable statement for this construct.
(4) Interpretation of parameters should closely reflect what they specifically measure.
We thank the reviewer for pointing this out. We have refined the relevant interpretations of parameters in the current Results and Discussion sections.
(5) Prior research has shown links between Theory of Mind (ToM) and cooperation (e.g., Martínez-Velázquez et al., 2024). It would be valuable to test whether this also holds in your dataset.
We thank the reviewer for this thoughtful comment. Although we did not directly measure participants’ ToM, our design allowed us to estimate participants’ trial-by-trial inferences (i.e., expectations) about their partner’s cooperation probability. We therefore treat these cooperation expectations as an indirect representation for belief inference, which is related to ToM processes. To test whether this belief-inference component relates to cooperation in our dataset, we further conducted an exploratory analysis (GLMM<sub>sup</sub>4) in which participants’ choices were regressed on their cooperation expectations, group, and the group × cooperation-expectation interaction, controlling for trial number and gender, with random effects. Consistent with the ToM–cooperation link in prior research (MartínezVelázquez et al., 2024), participants’ expectations about their partner’s cooperation significantly predicted their cooperative behavior (Table 14), suggesting that decisions were shaped by social learning about others’ inferred actions. Moreover, the interaction between group and cooperation expectation was not significant, indicating that this inference-driven social learning process likely operates similarly in adolescents and adults. This aligns with our primary modeling results showing that both age groups update beliefs via an asymmetric learning process. We have reported these analyses in the Appendix Analysis section.
(6) More informative table captions would help the reader. Please clarify how variables are coded (e.g., is female = 0 or 1? Is adolescent = 0 or 1?), to avoid the need to search across the manuscript for this information.
We thank the reviewer for raising this point. We have added clear and standardized variable coding in the table notes of all tables to make them more informative and avoid the need to search the paper. We have ensured consistent wording and formatting across all tables.
(7) I hope these comments are helpful and support the authors in further strengthening their manuscript.
We thank the three reviewers for their comments, which have been helpful in strengthening this work.
References
(1) Fudenberg, D., & Levine, D. K. (2014). Recency, consistent learning, and Nash equilibrium. Proceedings of the National Academy of Sciences of the United States of America, 111(Suppl. 3), 10826–10829. https://doi.org/10.1073/pnas.1400987111.
(2) Fudenberg, D., & Peysakhovich, A. (2016). Recency, records, and recaps: Learning and nonequilibrium behavior in a simple decision problem. ACM Transactions on Economics and Computation, 4(4), Article 23, 1–18. https://doi.org/10.1145/2956581
(3) Hackel, L., Doll, B., & Amodio, D. (2015). Instrumental learning of traits versus rewards: Dissociable neural correlates and effects on choice. Nature Neuroscience, 18, 1233– 1235. https://doi.org/10.1038/nn.4080
(4) Icenogle, G., Steinberg, L., Duell, N., Chein, J., Chang, L., Chaudhary, N., Di Giunta, L., Dodge, K. A., Fanti, K. A., Lansford, J. E., Oburu, P., Pastorelli, C., Skinner, A. T.Sorbring, E., Tapanya, S., Uribe Tirado, L. M., Alampay, L. P., Al-Hassan, S. M.,Takash, H. M. S., & Bacchini, D. (2019). Adolescents’ cognitive capacity reaches adult levels prior to their psychosocial maturity: Evidence for a “maturity gap” in a multinational, cross-sectional sample. Law and Human Behavior, 43(1), 69–85. https://doi.org/10.1037/lhb0000315
(5) Krekelberg, B. (2024). Matlab Toolbox for Bayes Factor Analysis (v3.0) [Computer software]. Zenodo. https://doi.org/10.5281/zenodo.13744717
(6) Martínez-Velázquez, E. S., Ponce-Juárez, S. P., Díaz Furlong, A., & Sequeira, H. (2024). Cooperative behavior in adolescents: A contribution of empathy and emotional regulation? Frontiers in Psychology, 15,1342458. https://doi.org/10.3389/fpsyg.2024.1342458
(7) Tervo-Clemmens, B., Calabro, F. J., Parr, A. C., et al. (2023). A canonical trajectory of executive function maturation from adolescence to adulthood. Nature Communications, 14, 6922. https://doi.org/10.1038/s41467-023-42540-8
(8) King-Casas, B., Tomlin, D., Anen, C., Camerer, C. F., Quartz, S. R., & Montague, P. R. (2005). Getting to know you: reputation and trust in a two-person economic exchange. Science, 308(5718), 78-83. https://doi.org/10.1126/science.1108062
(9) Rilling, J. K., Gutman, D. A., Zeh, T. R., Pagnoni, G., Berns, G. S., & Kilts, C. D. (2002).A neural basis for social cooperation. Neuron, 35(2), 395-405. https://doi.org/10.1016/s0896-6273(02)00755-9
(10) Fareri, D. S., Chang, L. J., & Delgado, M. R. (2015). Computational substrates of social value in interpersonal collaboration. Journal of Neuroscience, 35(21), 8170-8180. https://doi.org/10.1523/JNEUROSCI.4775-14.2015
(11) Akaike, H. (2003). A new look at the statistical model identification. IEEE transactions on automatic control, 19(6), 716-723. https://doi.org/10.1109/TAC.1974.1100705
(12) Schwarz, G. (1978). Estimating the dimension of a model. The annals of statistics, 461464. https://doi.org/10.1214/aos/1176344136
(13) Burnham, K. P., & Anderson, D. R. (2002). Model selection and multimodel inference: A practical information-theoretic approach (2nd ed.). Springer.https://doi.org/10.1007/b97636
(14) Gelman, A., & Shalizi, C. R. (2013). Philosophy and the practice of Bayesian statistics. British Journal of Mathematical and Statistical Psychology, 66(1), 8–38. https://doi.org/10.1111/j.2044-8317.2011.02037.x
(15) Gelman, A., Carlin, J. B., Stern, H. S., Dunson, D. B., Vehtari, A., & Rubin, D. B. (2014). Bayesian data analysis (3rd ed.). Chapman and Hall/CRC. https://doi.org/10.1201/b16018
(16) Vrieze, S. I. (2012). Model selection and psychological theory: A discussion of the differences between the Akaike Information Criterion (AIC) and the Bayesian Information Criterion (BIC). Psychological Methods, 17(2), 228–243. https://doi.org/10.1037/a0027127
eLife Assessment
This important and compelling study establishes a robust computational and experimental framework for the large-scale identification of metallophore biosynthetic clusters. The work advances beyond current standards, providing theoretical and practical value across microbiology, bioinformatics, and evolutionary biology.
Reviewer #1 (Public review):
This work by Reitz, Z. L. et al. developed an automated tool for high-throughput identification of microbial metallophore biosynthetic gene clusters (BGCs) by integrating knowledge of chelating moiety diversity and transporter gene families. The study aimed to create a comprehensive detection system combining chelator-based and transporter-based identification strategies, validate the tool through large-scale genomic mining, and investigate the evolutionary history of metallophore biosynthesis across bacteria.
Major strengths include providing the first automated, high-throughput tool for metallophore BGC identification, representing a significant advancement over manual curation approaches. The ensemble strategy effectively combines complementary detection methods, and experimental validation using HPLC-HRMS strengthens confidence in computational predictions. The work pioneers global analysis of metallophore diversity across the bacterial kingdom and provides a valuable dataset for future computational modeling.
Some limitations merit consideration. First, ground truth datasets derived from manual curation may introduce selection bias toward well-characterized systems, potentially affecting performance assessment accuracy. Second, the model's dependence on known chelating moieties and transporter families constrains its ability to detect novel metallophore architectures, limiting discovery potential in metagenomic datasets. Third, while the proposed evolutionary hypothesis is internally consistent, it lacks further validation.
The authors successfully achieved their stated objectives. The tool demonstrates robust performance metrics and practical utility through large-scale application to representative genomes. Results strongly support their conclusions through rigorous validation, including experimental confirmation of predicted metallophores via HPLC-HRMS analysis.
The work provides significant and immediate impact by enabling transition from labor-intensive manual approaches to automated screening. The comprehensive phylogenetic framework advances understanding of bacterial metal acquisition evolution, informing future studies on microbial metal homeostasis. Community utility is substantial, since the tool and accompanying dataset create essential resources for comparative genomics, algorithm development, and targeted experimental validation of novel metallophores.
Comments on revisions:
I am satisfied with the revisions made by the authors, and they have adequately addressed the concerns raised in the previous version of the manuscript.
Reviewer #2 (Public review):
Summary:
This study presents a systematic and well-executed effort to identify and classify bacterial NRP metallophores. The authors curate key chelator biosynthetic genes from previously characterized NRP-metallophore biosynthetic gene clusters (BGCs) and translate these features into an HMM-based detection module integrated within the antiSMASH platform.
The new algorithm is compared with a transporter-based siderophore prediction approach, demonstrating improved precision and recall. The authors further apply the algorithm to large-scale bacterial genome mining and, through reconciliation of chelator biosynthetic gene trees with the GTDB species tree using eMPRess, infer that several chelating groups may have originated prior to the Great Oxidation Event.<br /> Overall, this work provides a valuable computational framework that will greatly assist future in silico screening and preliminary identification of metallophore-related BGCs across bacterial taxa.
Strengths:
(1) The study provides a comprehensive curation of chelator biosynthetic genes involved in NRP-metallophore biosynthesis and translates this knowledge into an HMM-based detection algorithm, which will be highly useful for the initial screening and annotation of metallophore-related BGCs within antiSMASH.
(2) The genome-wide survey across a large bacterial dataset offers an informative and quantitative overview of the taxonomic distribution of NRP-metallophore biosynthetic chelator groups, thereby expanding our understanding of their phylogenetic prevalence.
(3) The comparative evolutionary analysis, linking chelator biosynthetic genes to bacterial phylogeny, provides an interesting and valuable perspective on the potential origin and diversification of NRP-metallophore chelating groups.
Weaknesses:
(1) Although the rule-based HMM detection performs well in identifying major categories of NRP-metallophore biosynthetic modules, it currently lacks the resolution to discriminate between fine-scale structural or biochemical variations among different metallophore types.
(2) While the comparison with the transporter-based siderophore prediction approach is convincing overall, more information about the dataset balance and composition would be appreciated. In particular, specifying the BGC identities, source organisms, and Gram-positive versus Gram-negative classification would improve transparency. In the supplementary tables, the "Just TonB" section seems to include only BGCs from Gram-negative bacteria-if so, this should be clearly stated, as Gram type strongly influences siderophore transport systems.
Comments on revisions:
The authors have adequately addressed all of my previous comments. I have no further comments on the revised manuscript.
Author response:
The following is the authors’ response to the original reviews.
Public Reviews:
Reviewer #1 (Public review):
This work by Reitz, Z. L. et al. developed an automated tool for high-throughput identification of microbial metallophore biosynthetic gene clusters (BGCs) by integrating knowledge of chelating moiety diversity and transporter gene families. The study aimed to create a comprehensive detection system combining chelator-based and transporter-based identification strategies, validate the tool through large-scale genomic mining, and investigate the evolutionary history of metallophore biosynthesis across bacteria.
Major strengths include providing the first automated, high-throughput tool for metallophore BGC identification, representing a significant advancement over manual curation approaches. The ensemble strategy effectively combines complementary detection methods, and experimental validation using HPLC-HRMS strengthens confidence in computational predictions. The work pioneers a global analysis of metallophore diversity across the bacterial kingdom and provides a valuable dataset for future computational modeling.
Some limitations merit consideration. First, ground truth datasets derived from manual curation may introduce selection bias toward well-characterized systems, potentially affecting performance assessment accuracy. Second, the model's dependence on known chelating moieties and transporter families constrains its ability to detect novel metallophore architectures, limiting discovery potential in metagenomic datasets. Third, while the proposed evolutionary hypothesis is internally consistent, it lacks direct validation and remains speculative without additional phylogenetic studies.
The authors successfully achieved their stated objectives. The tool demonstrates robust performance metrics and practical utility through large-scale application to representative genomes. Results strongly support their conclusions through rigorous validation, including experimental confirmation of predicted metallophores via HPLC-HRMS analysis.
The work provides a significant and immediate impact by enabling the transition from labor-intensive manual approaches to automated screening. The comprehensive phylogenetic framework advances understanding of bacterial metal acquisition evolution, informing future studies on microbial metal homeostasis. Community utility is substantial, since the tool and accompanying dataset create essential resources for comparative genomics, algorithm development, and targeted experimental validation of novel metallophores.
We thank the reviewer for their valuable feedback. We appreciate the positive words, and agree with their listed limitations. Regarding the following comment:
“Third, while the proposed evolutionary hypothesis is internally consistent, it lacks direct validation and remains speculative without additional phylogenetic studies.”
We agree that additional phylogenetic analyses are needed in future studies. For the revised manuscript, we have validated our evolutionary hypotheses by additionally analyzing two gene families using the likelihood-based tool AleRax, which implements a probabilistic DTL model. The results were consistent with the eMPRess parsimony-based reconstructions, showing comparable patterns of rare duplication, moderate gene loss, and extensive horizontal transfer. Both methods identified similar lineages as the most probable origin and major recipients of transfer events. This agreement between independent reconciliation frameworks supports the reliability of our evolutionary conclusions. We have added a statement referencing this cross-method validation in the revised manuscript.
Reviewer #2 (Public review):
Summary:
This study presents a systematic and well-executed effort to identify and classify bacterial NRP metallophores. The authors curate key chelator biosynthetic genes from previously characterized NRP-metallophore biosynthetic gene clusters (BGCs) and translate these features into an HMM-based detection module integrated within the antiSMASH platform.
The new algorithm is compared with a transporter-based siderophore prediction approach, demonstrating improved precision and recall. The authors further apply the algorithm to large-scale bacterial genome mining and, through reconciliation of chelator biosynthetic gene trees with the GTDB species tree using eMPRess, infer that several chelating groups may have originated prior to the Great Oxidation Event.
Overall, this work provides a valuable computational framework that will greatly assist future in silico screening and preliminary identification of metallophore-related BGCs across bacterial taxa.
Strengths:
(1) The study provides a comprehensive curation of chelator biosynthetic genes involved in NRP-metallophore biosynthesis and translates this knowledge into an HMM-based detection algorithm, which will be highly useful for the initial screening and annotation of metallophore-related BGCs within antiSMASH.
(2) The genome-wide survey across a large bacterial dataset offers an informative and quantitative overview of the taxonomic distribution of NRP-metallophore biosynthetic chelator groups, thereby expanding our understanding of their phylogenetic prevalence.
(3) The comparative evolutionary analysis, linking chelator biosynthetic genes to bacterial phylogeny, provides an interesting and valuable perspective on the potential origin and diversification of NRP-metallophore chelating groups.
We greatly appreciate these comments.
Weaknesses:
(1) Although the rule-based HMM detection performs well in identifying major categories of NRP-metallophore biosynthetic modules, it currently lacks the resolution to discriminate between fine-scale structural or biochemical variations among different metallophore types.
We agree that this is a current limitation to the methodology. More specific metallophore structural prediction is among our future goals for antiSMASH. We have added a statement to this effect in the conclusion.
(2) While the comparison with the transporter-based siderophore prediction approach is convincing overall, more information about the dataset balance and composition would be appreciated. In particular, specifying the BGC identities, source organisms, and Gram-positive versus Gram-negative classification would improve transparency. In the supplementary tables, the "Just TonB" section seems to include only BGCs from Gram-negative bacteria - if so, this should be clearly stated, as Gram type strongly influences siderophore transport systems.
The reviewer raises good points here. An additional ZIP file containing all BGCs used for the manual curation was inadvertently left out of the supplemental dataset for the first version of the manuscript. We have added columns with source organisms and Gram stain (retrieved from Bacdive) to Table S2. F1 scores were similar for Gram positive and negative subsets, as seen in the new Table S2.
We thank the reviewer for suggesting this additional analysis, and have added a brief statement in the revised manuscript.
The “Just TonB” section (in which we tested the performance of requiring TonB without another transporter) was not used for the manuscript. We will preserve it in the revised Table S2 for transparency.
Recommendations for the authors:
Reviewer #1 (Recommendations for the authors):
(1) In line 43:
"excreted" should be replace by "secreted".
Done.
(2) In lines 158-159:
"we manually predicted metallophore production among a large set of BGCs."
If they are first "annotated with default antiSMASH v6.1", then it is not entirely manual, right? I would suggest making this sentence clearer.
We have revised the language.
(3) In lines 165-169:
It would be good to show the confusion matrix of these results.
The confusion matrices are found in Table S2, columns AL-AR.
(4) In Table 1:
Method names (AntiSMASH rules/Transporter genes) could be misleading, since they are all AntiSMASH-based, right?
We have adjusted the methods to clarify that while the transporter genes were detected using a modified version of antiSMASH, they are not related to our chelator-based detection rule (which is now correctly singular throughout the text).
(5) Line 198:
There are accidental spaces and characters inserted here.
We could not find any accidental spaces and characters here.
(6) Line 209:
"In total, 3,264 NRP metallophore BGC regions were detected"
Is this number correct? I don't see a correspondence in Table 1.
We have added the following sentence to the Table 1 legend: “An additional 54 BGC regions were detected as NRP metallophores without meeting the requirements for the antiSMASH NRPS rule.”
(7) Line 294:
"From B. brennerae, we identified four catecholic compounds"
From the bacterial cells or the culture supernatant? I think it is important to state this in a more precise way. If it is from the supernatant, it could be from EVs.
We state in line 292 that “organic compounds were extracted from the culture supernatants”. As our goal was only to confirm the ability of the strains to produce the predicted metallophores, the precise localization (including cell pellet or EVs) was not explored.
(8) Lines 349-357:
These results would benefit greatly from a visualization strategy.
Thank you, we have added a reference to the existing visualization in Fig. 5, Ring C.
(9) Lines 452-454:
How could clusters be de-replicated? Is there an identity equivalence scheme or similarity metric?
The BGC regions were de-replicated with BiG-SCAPE, which uses multiple similarity metrics as described in Navarro-Muñoz et al, 2020. Clusters could be dereplicated further using a more strict cutoff.
(10) Line 457:
"relatively low number of published genomes."
Could metagenome-assembled genomes help in that matter?
This is a good question, but we find that MAGs are usually too fragmented to yield complete NRPS BGC regions. We’ve added additional sentences earlier in the discussion: “Detection rates were also lower for fragmented genomes; unfortunately, this limitation (inherent to antiSMASH itself) may hinder the identification of metallophore biosynthesis in metagenomes. As long-read sequencing of metagenomes becomes more common, we expect that detection will improve.”
(11) Lines 514-515:
"Adequately-performing pHMMs for Asp and His β-hydroxylase subtypes could not be constructed using the above method."
What is the overall impact of this discrepancy in the methodology for these specific groups?
The phylogeny-based methodology was used to reduce false positives. We expect this method will have improved precision at the possible expense of recall.
(12) Lines 543-545:
"RefSeq representative bacterial genomes were dereplicated at the genus level using R, randomly selecting one genome for each of the 330 genera determined by GTDB"
Isn't it more of a random sampling than a dereplication? Dereplication would involve methods such as ANI computation.
You are correct; we have adjusted the language to clarify.
(13) Lines 559-560: "were filtered to remove clusters on contig edges."
This sentence is confusing because networks will be mentioned soon, and they also have edges (not the edges mentioned here), and they could also be clustered (not the clusters mentioned here). Is there a way to make the terminology clearer?
Thank you, we have adjusted the text to read “BGC regions on contig boundaries”
(14) Line 560:
"The resulting 2,523 BGC regions, as well as 78 previously reported BGCs "
How many were there before filtering?
We have added the number: 3,264
(15) Lines 579-580:
Confusing terminology, as mentioned in Lines 559-560.
Adjusted as above.
General comments and questions:
An objective suggestion to enrich the discussion is to address the role of bacterial extracellular vesicles (EVs) as metallophore carriers. Studies show that EVs, such as outer membrane vesicles, can transport siderophores or other metallophores for iron acquisition in various bacteria, functioning as "public goods" for community-wide nutrient sharing. Highlighting this mechanism would add ecological and functional context to the manuscript. In the future, EV-associated metallophore transport could also be considered for integration into computational detection tools.
We thank the reviewer for the suggestion; however, we do not think that such a discussion is needed. We briefly discuss the ecological function of metallophores as public goods (and public bads) in the first paragraph of the introduction. We did not find any reports that EV-associated genes co-localize with metallophore BGCs, which would be required for their presence to be a useful marker of metallophore production.
Is there a feasible path to more generalizable detection of chelating motifs using chemistry-aware features? For example, a machine learning classifier trained on submolecular descriptors (e.g., functional groups, coordination motifs, SMARTS patterns, graph fingerprints, metal-binding propensity scores) could complement the current genome-based approach and broaden coverage beyond known metallophore families. While the discussion mentions future extensions centered on genomic features, integrating chemical information from predicted or known products (or biosynthetic logic inferred from BGC composition) could be explored. A hybrid framework-linking BGC-derived features with chemistry-derived features-may improve both recall for novel metallophore classes and precision in distinguishing true chelators from confounders, thereby increasing overall accuracy.
We can envision a classifier that uses submolecular descriptors to predict the ability of a molecule to bind metal ions. However, starting with a BGC and accurately predicting the structure of a hitherto unknown chelating moiety will likely prove difficult. We have added a sentence to the discussion stating that a future tool could use accessory genes to more completely predict chemical structure.
Although the initial analysis was conducted using RefSeq genomes, what are the anticipated challenges and limitations when scaling this method for BGC prospecting in metagenome-assembled genomes (MAGs), particularly considering the inherent quality differences, assembly fragmentation, and taxonomic uncertainties that characterize MAG datasets compared to curated reference genomes?
Please see our response to comment 10, line 457. Our pHMM-based approach is designed to be robust to organism taxonomy; however, fragmentation is a significant barrier to accurate antiSMASH-based BGC detection (including in contig-level single-isolate genomes, see Table 1).
Reviewer #2 (Recommendations for the authors):
(1) In the "Chemical identification of genome-predicted siderophores across taxa" section, it would be helpful to annotate the cross-species similarities between predicted metallophore BGCs and their reference clusters (Ref BGCs). As currently described, the main text seems to highlight the cross-species resolving power of BiG-SCAPE itself rather than demonstrating the taxonomic generalizability of the chelator HMM-based detection module.
Thank you for this comment. We intended to display that the new rule is useful for detecting BGCs in unexplored taxa, but we acknowledge that there is not a great diversity in the strains we selected. We have removed “across taxa” to avoid misleading the reader and clarify our intent.
(2) In addition to using eMPRess for gene-species reconciliation, it may be beneficial to explore or at least reference alternative reconciliation tools to validate the inferred duplication, transfer, and loss (DTL) scenarios. Incorporating such cross-method comparisons would enhance the robustness and credibility of the evolutionary conclusions.
We appreciate this valuable suggestion. To validate the robustness of our reconciliation-based inferences, we additionally analyzed two gene families using the likelihood-based tool AleRax, which implements a probabilistic DTL model. The results were consistent with the eMPRess parsimony-based reconstructions, showing comparable patterns of rare duplication, moderate gene loss, and extensive horizontal transfer. Both methods identified similar lineages as the most probable origin and major recipients of transfer events. This agreement between independent reconciliation frameworks supports the reliability of our evolutionary conclusions. We have added a brief statement referencing this cross-method validation in the revised manuscript.
eLife Assessment
This manuscript describes a series of studies using four different Go/No Go task variants in combination with fast-scan cyclic voltammetry to determine the role of dopamine release in the ventromedial striatum in action selection, controllability of reward pursuit, effort, and reward approach. The authors conclude that dopamine signals in the ventromedial striatum integrate the invigoration of action initiation with continuous estimation of spatial, but not temporal, proximity to rewards. There are, however, a number of concerns regarding methodology that could affect the interpretation of the results. Thus, while the findings are useful, they are considered incomplete, with the primary claims only partially supported.
Reviewer #1 (Public review):
Summary:
Poh and colleagues investigate dopamine signaling in the nucleus accumbens (ventromedial striatum) in rats engaged in several forms of Go/No Go tasks, which differed in reward controllability (self-initiated reward seeking or cue-evoked/quasi-pavlovian), and in the specific timing of the action-reward contingencies. They analyze dopamine recordings made with fast scan cyclic voltammetry, and find that dopamine signals vary most consistently to cues that signal a required action (Go cues) vs cues signaling action withholding (No Go cues). Through various analyses, they report that dopamine signals align most clearly with action initiation and with the approach to the reward-delivery location. Collectively, these data support aspects of a variety of frameworks related to accumbens dopamine signaling in movement, action vigor, approach, etc.
Strengths:
These studies use several task variants that consolidate a few different components of dopamine signal functions and allow for a broad comparison of many psychological and behavioral aspects. The behavioral analysis is detailed. These results touch on many previous findings, largely showing consistent results with past studies.
Weaknesses:
The paper could heavily benefit from some revision to increase clarity of the figures, the methods, and the analysis. The inclusion of many tasks is a strength, but also somewhat overshadows specific points in the data, which could be improved with some revision/reworking.
Some conclusions are not fully justified. As shown, support for the conclusion "dopamine reflects action initiation but not controllability or effort" is lacking without more analyses and additional context. Further, the notion that the dopamine signals reported here reflect spatial information could be justified more strongly.
Additional details on subjects used in each study, analysis details on trialwise vs subjects-wise data, and other context would be helpful for improving the paper.
Reviewer #2 (Public review):
Here, the authors record dopamine release using fast-scan cyclic voltammetry in the nucleus accumbens/ ventromedial striatum (VMS) while rats perform variants of a Go/No Go task. Two versions are self-paced, in that the rat can initiate a trial by nosepoking at the odor port at any time once the ITI has elapsed, whereas the other two require the rat to wait for a cue-light before responding. Two "long" variants also require either more lever-presses on Go trials, or a longer nosepoke time for No Go trials, and also incorporate "free" trials in which the rat is rewarded for just heading straight to the food tray. The authors find that dopamine levels increase more during the response requirement for Go than No Go trials, indicating a role for invigorating to-be-rewarded actions. Dopamine levels also steadily increased as rats approached the site of reward delivery, and the authors demonstrate quite elegantly that this was not due to orientation to the food tray, or time-to-reward, or action initiation, but instead reflects spatial proximity to the rewarded location. Contrary to previous reports, the authors did not discern any differences in dopamine dynamics depending on whether the trials were cue- or self-paced, and dopamine release did not scale with effort requirements.
The manuscript is well-written, and the authors use figures to great effect to explain what could otherwise be a hard-to-parse set of data. The authors make good use of the richness of their behavioral data to justify or negate potential conclusions. I have the following comments.
Re: The lack of relationship between effort to acquire reward in the current study and the magnitude of dopamine release, can the authors unpack this a bit more? Why the difference between the Walton and Bouret studies? Were the shifts in effort requirements comparable across the behavioral tasks? What else could be different between the methodologies?
I would argue that the cue- vs self-initiated distinction was pretty minor, given that there was a fixed ITI of 5s. How does this task modification compare to those used previously to show that dopamine release corresponds to behavioral controllability? It would help the reader if the authors could spend more time discussing these disparate findings and looking for points of methodological divergence/ commonality.
Reviewer #3 (Public review):
Summary:
The manuscript by Poh et al. investigated whether dopamine release in the ventral medial striatum integrates information about action selection, controllability of reward pursuit, effort, and reward approach. Rats were implanted with FSCV probes and trained in four Go/No Go task variants:
(1) trials were self-initiated and had two trial types (Go vs. No Go) that were auditorily cued,
(2) trials were cue-initiated and had two trial types (Go vs. No Go) that were auditorily cued,
(3) trials were self-initiated and had three trial types (Go vs. No Go vs. free reward) that were auditorily cued, and effort was increased,
(4) trials were cue-initiated and had three trial types (Go vs. No Go vs. free reward) that were auditorily cued.
The authors report that dopamine levels rose during Go trials and slowly rose in No Go trials, but this pattern did not differ across task variants that modified effort and whether trials were cued or initiated. They also report that dopamine levels rose as rats approached the reward location and were greater in rats that bit the noseport while holding during the No Go response.
Strengths:
(1) Interesting task and variants within the task paradigm that would allow the authors to isolate specific behavioral metrics.
(2) The goal of determining precisely what VMS dopamine signals do is highly significant and would be of interest to many researchers.
Weaknesses:
(1) This Go/No-Go procedure is different from the traditional tasks, and this leads to several problems with interpreting the results:
(a) Go/No Go tasks typically require subjects to refrain from doing any action. In this task, a response is still required for the No Go trials (e.g., continue holding the nosepoke). The problem with this modified design is that failure to withhold a response on No Go trials could be because i) rats could not continue holding the response, as holding responses are difficult for rodents, or ii) rats could not suppress the prepotent go response. This makes interpreting the behavior and the dopamine signal in No Go trials very difficult.
(b) Most Go/No Go tasks bias or overrepresent Go trials so that the Go response is prepotent, and consequently, successful suppression of the Go response is challenging. I didn't see any information in the manuscript about how often each trial type was presented or how the authors ensured that No Go responses (or lack thereof) were reflecting a suppression of the Go response.
(2) The authors observe relatively consistent differences in the DA signal between Go and No Go trials after the action-cue onset. However, the response type was not randomized between trial type, so there is a confound between trial type (Go/No Go) and response (lever/nosepoke). The difference in DA signal may have nothing to do with the cue type, but reflects differences in DA signal elicited by levers vs. nosepokes.
(3) Both Go and No Go trials start with the rat having their nose in the noseport. One cue (Go cue) signals the rat to remove their nose from the noseport and make two lever responses in 5 seconds, whereas the other cue (No Go cue) signals the rat to keep their nose in the noseport for an additional 1.7-1.9 s. The authors state that the time between cue onset and reward delivery was kept the same for all trial types, and Figure 1 suggests this is 2 s, so was reward delivered before rats completed the two lever presses? I would imagine reward was only delivered if rats completed the FR requirement, but again, the descriptions in the text and figures are incongruent.
(4) The manuscript is difficult to understand because key details are not in the main text or are not mentioned at all. I've outlined several points below:
(a) The author's description in the manuscript makes it appear as a discrimination task versus a Go/No Go task. I suggest including more details in the main text that clarify what is required at each step in the task. Additionally, providing clarity regarding what task events the voltammetry traces are aligned to would be very useful.
(b) How many subjects were included in each task variant? The text makes it seem like all rats complete each task variant, but the behavioral data suggest otherwise. Moreover, it appears that some rats did more than one version. Was the order counterbalanced? If not, might this influence the DA signal?
(5) There is a major challenge in their design and interpretation of the dopamine signal. Both trial types (Go and No Go) start with the rat having their nose in the noseport. An auditory cue is presented for 2-3 s signaling to the rat to either leave the noseport and make a lever response (Go trial) or to stay in the noseport (No Go trial). The timing of these actions and/or decisions is entirely independent, so it is not clear to me how the authors would ever align these traces to the exact decision point for each trial type. They attempt to do this with the nose-port exit analysis, but exiting the noseport for a Go trial (a rat needs to make 2 lever presses and then get a reward) versus a No Go trial (a rat needs to go retrieve the reward) is very different and not comparable.
(6) The voltammetry analysis did not appear to test the hypotheses the authors outlined in the intro. All comparisons were done within task variants (DA dynamics in Go vs. No Go trials, aligned to different task events), but there were no comparisons across task variants to determine if the DA signal differed in cued vs self-initiated trials.
(7) Classification of No Go behaviors was interesting, but was not well integrated with the rest of the paper and was underdeveloped. It also raised more questions for me than answers. For example:
(a) Was the behavior classification consistent across rats for all No Go trials? If not, did the DA signal change within subjects between biting vs digging vs calm?
(b) If "biting rats" were not always biting rats on every No Go trial, then is it fair to collapse animals into a single measure (Figure 3C).
(c) Some of the classification groups only had 2 or fewer rats in them, making any statistical comparison and inference difficult.
eLife Assessment
This important study by Zeng et al characterizes a novel Legionella pneumophila effector, Llfat1 (Lpg1387), which binds actin through a newly identified actin-binding domain. Data is convincing; structural analysis of the Llfat1 ABD-F-actin complex enabled the development of this domain as a probe for F-actin. Additionally, the authors show that Llfat1 functions as a lysine fatty acyltransferase targeting small GTPases, highlighting its importance in both bacterial pathogenesis and cytoskeletal biology.
Reviewer #1 (Public review):
The manuscript by Zeng et al. describes the discovery of an F-actin-binding Legionella pneumophila effector, which they term Lfat1. Lfat1 contains a putative fatty acyltransferase domain that structurally resembles the Rho-GTPase Inactivation (RID) domain toxin from Vibrio vulnificus, which targets small G-proteins. Additionally, Lfat1 contains a coiled-coil (CC) domain.
The authors identified Lfat1 as an actin-associated protein by screening more than 300 Legionella effectors, expressed as GFP-fusion proteins, for their co-localization with actin in HeLa cells. Actin binding is mediated by the CC domain, which specifically binds to F-actin in a 1:1 stoichiometry. Using cryo-EM, the authors determined a high-quality structure of F-actin filaments bound to the actin-binding domain (ABD) of Lfat1. The structure reveals that actin binding is mediated through a hydrophobic helical hairpin within the ABD (residues 213-279). A Y240A mutation within this region increases the apparent dissociation constant by two orders of magnitude, indicating a critical role for this residue in actin interaction.
The ABD alone was also shown to strongly associate with F-actin upon overexpression in cells. The authors used a truncated version of the Lfat1 ABD to engineer an F-actin-binding probe, which can be used in a split form. Finally, they demonstrate that full-length Lfat1, when overexpressed in cells, fatty acylates host small G-proteins, likely on lysine residues.
Comments on revisions:
Since LFAT1 cannot be produced in E. coli, it may be worth considering immunoprecipitating the protein from mammalian cells to see if it has activity in vitro. Presumably, actin will co-IP but the actin binding mutant can also be used. These are just suggestions to improve an already solid manuscript. Otherwise, I am happy with the paper.
Reviewer #2 (Public review):
Summary:
The manuscript by Zeng et al reports the structural and biochemical study of a novel effectors from the bacterial pathogen Legionella pneumophila. The authors continued from results from their earlier screening for L. pneumophila proteins that that affect host F-actin dynamics to show that Llfat1 (Lpg1387) interacts with actin via a novel actin-binding domain (ABD). The authors also determined the structure of the Lfat1 ABD-F-actin complex, which allowed them to develop this ABD as probe for F-actin. Finally, the authors demonstrated that Llfat1 is a lysine fatty acyltransferase that targets several small GTPases in host cells. Overall, this is a very exciting study and should be of great interest to scientists in both bacterial pathogenesis and actin cytoskeleton of eukaryotic cells.
Author response:
The following is the authors’ response to the original reviews
Reviewer #1:
(1) Legionella effectors are often activated by binding to eukaryote-specific host factors, including actin. The authors should test the following: a) whether Lfat1 can fatty acylate small G-proteins in vitro; b) whether this activity is dependent on actin binding; and c) whether expression of the Y240A mutant in mammalian cells affects the fatty acylation of Rac3 (Figure 6B), or other small G-proteins.
We were not able to express and purify the full-length recombinant Lfat1 to perform fatty acylation of small GTPases in vitro. However, In cellulo overexpression of the Y240A mutant still retained ability to fatty acylate Rac3 and another small GTPase RheB (see Figure 6-figure supplement 2). We postulate that under infection conditions, actin-binding might be required to fatty acylate certain GTPases due to the small amount of effector proteins that secreted into the host cell.
(2) It should be demonstrated that lysine residues on small G-proteins are indeed targeted by Lfat1. Ideally, the functional consequences of these modifications should also be investigated. For example, does fatty acylation of G-proteins affect GTPase activity or binding to downstream effectors?
We have mutated K178 on RheB and showed that this mutation abolished its fatty acylation by Lfat1 (see Author response image 1 below). We were not able to test if fatty acylation by Lfat1 affect downstream effector binding.
Author response image 1.
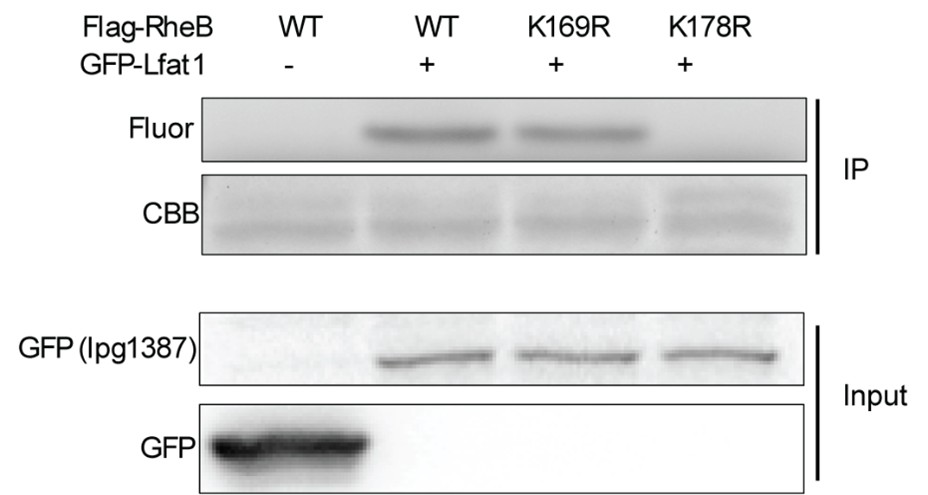
(3) Line 138: Can the authors clarify whether the Lfat1 ABD induces bundling of F-actin filaments or promotes actin oligomerization? Does the Lfat1 ABD form multimers that bring multiple filaments together? If Lfat1 induces actin oligomerization, this effect should be experimentally tested and reported. Additionally, the impact of Lfat1 binding on actin filament stability should be assessed. This is particularly important given the proposed use of the ABD as an actin probe.
The ABD domain does not form oligomer as evidenced by gel filtration profile of the ABD domain. However, we do see F-actin bundling in our in vitro -F-actin polymerization experiment when both actin and ABD are in high concentration (data not shown). Under low concentration of ABD, there is not aggregation/bundling effect of F-actin.
(4) Line 180: I think it's too premature to refer to the interaction as having "high specificity and affinity." We really don't know what else it's binding to.
We have revised the text and reworded the sentence by removing "high specificity and affinity."
(5) The authors should reconsider the color scheme used in the structural figures, particularly in Figures 2D and S4.
Not sure the comments on the color scheme of the structure figures.
(6) In Figure 3E, the WT curve fits the data poorly, possibly because the actin concentration exceeds the Kd of the interaction. It might fit better to a quadratic.
We have performed quadratic fitting and replaced Figure 3E.
(7) The authors propose that the individual helices of the Lfat1 ABD could be expressed on separate proteins and used to target multi-component biological complexes to F-actin by genetically fusing each component to a split alpha-helix. This is an intriguing idea, but it should be tested as a proof of concept to support its feasibility and potential utility.
It is a good suggestion. We plan to thoroughly test the feasibility of this idea as one of our future directions.
(8) The plot in Figure S2D appears cropped on the X-axis or was generated from a ~2× binned map rather than the deposited one (pixel size ~0.83 Å, plot suggests ~1.6 Å). The reported pixel size is inconsistent between the Methods and Table 1-please clarify whether 0.83 Å refers to super-resolution.
Yes, 0.83 Å is super-resolution. We have updated in the cryoEM table
Reviewer #2:
Weaknesses:
(1) The authors should use biochemical reactions to analyze the KFAT of Llfat1 on one or two small GTPases shown to be modified by this effector in cellulo. Such reactions may allow them to determine the role of actin binding in its biochemical activity. This notion is particularly relevant in light of recent studies that actin is a co-factor for the activity of LnaB and Ceg14 (PMID: 39009586; PMID: 38776962; PMID: 40394005). In addition, the study should be discussed in the context of these recent findings on the role of actin in the activity of L. pneumophila effectors.
We have new data showed that Actin binding does not affect Lfat1 enzymatic activity. (see response to Reviewer #1). We have added this new data as Figure S7 to the paper. Accordingly, we also revised the discussion by adding the following paragraph.
“The discovery of Lfat1 as an F-actin–binding lysine fatty acyl transferase raised the intriguing question of whether its enzymatic activity depends on F-actin binding. Recent studies have shown that other Legionella effectors, such as LnaB and Ceg14, use actin as a co-factor to regulate their activities. For instance, LnaB binds monomeric G-actin to enhance its phosphoryl-AMPylase activity toward phosphorylated residues, resulting in unique ADPylation modifications in host proteins (Fu et al, 2024; Wang et al, 2024). Similarly, Ceg14 is activated by host actin to convert ATP and dATP into adenosine and deoxyadenosine monophosphate, thereby modulating ATP levels in L. pneumophila–infected cells (He et al, 2025). However, this does not appear to be the case for Lfat1. We found that Lfat1 mutants defective in F-actin binding retained the ability to modify host small GTPases when expressed in cells (Figure S7). These findings suggest that, rather than serving as a co-factor, F-actin may serve to localize Lfat1 via its actin-binding domain (ABD), thereby confining its activity to regions enriched in F-actin and enabling spatial specificity in the modification of host targets.”
(2) The development of the ABD domain of Llfat1 as an F-actin domain is a nice extension of the biochemical and structural experiments. The authors need to compare the new probe to those currently commonly used ones, such as Lifeact, in labeling of the actin cytoskeleton structure.
We fully agree with the reviewer’s insightful suggestion. However, a direct comparison of the Lfat1 ABD domain with commonly used actin probes such as Lifeact, as well as evaluation of the split α-helix probe (as suggested by Reviewer #1), would require extensive and technically demanding experiments. These are important directions that we plan to pursue in future studies.
For all other minors, we have made corrections/changes in our revised text and figures.
eLife Assessment
This fundamental work by Yamamoto and colleagues advances our understanding of how positional information is coordinated between axes during limb outgrowth and patterning. They provide convincing evidence that the dorsal-ventral axis feeds into anterior-posterior signaling, and identify the responsible molecules by combining transplantations with molecular manipulations. This work will be of broad interest to regeneration, tissue engineering, and evolutionary biologists.
Reviewer #1 (Public review):
Summary:
The manuscript by Yamamoto et al. presents a model by which the four main axes of the limb are required for limb regeneration to occur in the axolotl. A longstanding question in regeneration biology is how existing positional information is used to regenerate the correct missing elements. The limb provides an accessible experimental system by which to study the involvement of the anteroposterior, dorsoventral, and proximodistal axes in the regenerating limb. Extensive experimentation has been performed in this area using grafting experiments. Yamamoto et al. use the accessory limb model and some molecular tools to address this question. There are some interesting observations in the study. In particular, one strength the potent induction of accessory limbs in the dorsal axis with BMP2+Fgf2+Fgf8 is very interesting. Although interesting, the study makes bold claims about determining the molecular basis of DV positional cues, but the experimental evidence is not definitive and does not take into account the previous work on DV patterning in the amniote limb. Also, testing the hypothesis on blastemas after limb amputation would be needed to support the strong claims in the study.
Strengths:
The manuscript presents some novel new phenotypes generated in axolotl limbs due to Wnt signaling. This is generally the first example in which Wnt signaling has provided a gain of function in the axolotl limb model. They also present a potent way of inducing limb patterning in the dorsal axis by the addition of just beads loaded with Bmp2+Fgf8+Fgf2.
Comments on revised version:
Re-evaluation: The authors have significantly improved the manuscript and their conclusions reflect the current state of knowledge in DV patterning of tetrapod limbs. My only point of consideration is their claim of mesenchymal and epithelial expression of Wnt10b and the finding that Fgf2 and Wnt10b are lowly expressed. It is based upon the failed ISH, but this doesn't mean they aren't expressed. In interpreting the Li et al. scRNAseq dataset, conclusions depend heavily on how one analyzes and interprets it. The 7DPA sample shows a very low representation of epithelial cells compared to other time points, but this is likely a technical issue. Even the epithelial marker, Krt17, and the CT/fibroblast marker show some expression elsewhere. If other time points are included in the analysis, Wnt10b, would be interpreted as relatively highly expressed almost exclusively in the epithelium. By selecting the 7dpa timepoint, which may or may not represent the MB stage as it wasn't shown in the paper, the conclusions may be based upon incomplete data. I don't expect the authors to do more work, but it is worth mentioning this possibility. The authors have considered and made efforts to resolve previous concerns.
Reviewer #2 (Public review):
Summary:
This study explores how signals from all sides of a developing limb, front/back and top/bottom, work together to guide the regrowth of a fully patterned limb in axolotls, a type of salamander known for its impressive ability to regenerate limbs. Using a model called the Accessory Limb Model (ALM), the researchers created early staged limb regenerates (called blastemas) with cells from different sides of the limb. They discovered that successful limb regrowth only happens when the blastema contains cells from both the top (dorsal) and bottom (ventral) of the limb. They also found that a key gene involved in front/back limb patterning, called Shh (Sonic hedgehog), is only turned on when cells from both the dorsal and ventral sides come into contact. The study identified two important molecules, Wnt10B and FGF2, that help activate Shh when dorsal and ventral cells interact. Finally, the authors propose a new model that explains how cells from all four sides of a limb, dorsal, ventral, anterior (front), and posterior (back), contribute at both the cellular and molecular level to rebuilding a properly structured limb during regeneration
Strengths:
The techniques used in this study, like delicate surgeries, tissue grafting, and implanting tiny beads soaked with growth factors, are extremely difficult, and only a few research groups in the world can do them successfully. These methods are essential for answering important questions about how animals like axolotls regenerate limbs with the correct structure and orientation. To understand how cells from different sides of the limb communicate during regeneration, the researchers used a technique called in situ hybridization, which lets them see where specific genes are active in the developing limb. They clearly showed that the gene Shh, which helps pattern the front and back of the limb, only turns on when cells from both the top (dorsal) and bottom (ventral) sides are present and interacting. The team also took a broad, unbiased approach to figure out which signaling molecules are unique to dorsal and ventral limb cells. They tested these molecules individually and discovered which could substitute for actual dorsal and ventral cells, providing the same necessary signals for proper limb development. Overall, this study makes a major contribution to our understanding of how complex signals guide limb regeneration, showing how different regions of the limb work together at both the cellular and molecular levels to rebuild a fully patterned structure.
Weaknesses:
Because the expressional analyses are performed on thin sections of regenerating tissue, in the original manuscript, they provided only a limited view of the gene expression patterns in their experiments, opening the possibility that they could be missing some expression in other regions of the blastema. Additionally, the quantification method of the expressional phenotypes in most of the experiments did not appear to be based on a rigorous methodology. The authors' inclusion of an alternate expression analysis, qRT-PCR, on the entire blastema helped validate that the authors are not missing something in the revised manuscript.
Overall, the number of replicates per sample group in the original manuscript was quite low (sometimes as low as 3), which was especially risky with challenging techniques like the ones the authors employ. The authors have improved the rigor of the experiment in the revised manuscript by increasing the number of replicates. The authors have not performed a power analysis to calculate the number of animals used in each experiment that is sufficient to identify possible statistical differences between groups. However, the authors have indicated that there was not sufficient preliminary data to appropriately make these quantifications.
Likewise, in the original manuscript, the authors used an AI-generated algorithm to quantify symmetry on the dorsal/ventral axis, and my concern was that this approach doesn't appear to account for possible biases due to tissue sectioning angles. They also seem to arbitrarily pick locations in each sample group to compare symmetry measurements. There are other methods, which include using specific muscle groups and nerve bundles as dorsal/ventral landmarks, that would more clearly show differences in symmetry. The authors have now sufficiently addressed this concern by including transverse sections of the limbs annd have explained the limitations of using a landmark-based approach in their quantification strategy.
Reviewer #3 (Public review):
Summary:
After salamander limb amputation, the cross-section of the stump has two major axes: anterior-posterior and dorsal-ventral. Cells from all axial positions (anterior, posterior, dorsal, ventral) are necessary for regeneration, yet the molecular basis for this requirement has remained unknown. To address this gap, Yamamoto et al. took advantage of the ALM assay, in which defined positional identities can be combined on demand and their effects assessed through the outgrowth of an ectopic limb. They propose a compelling model in which dorsal and ventral cells communicate by secreting Wnt10b and Fgf2 ligands respectively, with this interaction inducing Shh expression in posterior cells. Shh was previously shown to induce limb outgrowth in collaboration with anterior Fgf8 (PMID: 27120163). Thus, this study completes a concept in which four secreted signals from four axial positions interact for limb patterning. Notably, this work firmly places dorsal-ventral interactions upstream of anterior-posterior, which is striking for a field that has been focussed on anterior-posterior communication. The ligands identified (Wnt10b, Fgf2) are different to those implicated in dorsal-ventral patterning in the non-regenerative mouse and chick models. The strength of this study is in the context of ALM/ectopic limb engineering. Although the authors attempt to assay the expression of Wnt10b and Fgf2 during limb regeneration after amputation, they were unable to pinpoint the precise expression domains of these genes beyond 'dorsal' and 'ventral' blastema. Given that experimental perturbations were not performed in regenerating limbs - almost exclusively under ALM conditions - this author finds the title "Dorsoventral-mediated Shh induction is required for axolotl limb regeneration" a little misleading.
Strengths:
(1) The ALM and use of GFP grafts for lineage tracing (Figures 1-3) take full advantage of the salamander model's unique ability to outgrow patterned limbs under defined conditions. As far as I am aware, the ALM has not been combined with precise grafts that assay 2 axial positions at once, as performed in Figure 3. The number of ALMs performed in this study deserves special mention, considering the challenging surgery involved.
(2) The authors identify that posterior Shh is not expressed unless both dorsal and ventral cells are present. This echoes previous work in mouse limb development models (AER/ectoderm-mesoderm interaction) but this link between axes was not known in salamanders. The authors elegantly reconstitute dorsal-ventral communication by grafting, finding that this is sufficient to trigger Shh expression (Figure 3 - although see also section on Weaknesses).
(3) Impressively, the authors discovered two molecules sufficient to substitute dorsal or ventral cells through electroporation into dorsal- or ventral- depleted ALMs (Figure 5). These molecules did not change the positional identity of target cells. The same group previously identified the ventral factor (Fgf2) to be a nerve-derived factor essential for regeneration. In Figure 6, the authors demonstrate that nerve-derived factors, including Fgf2, are alone sufficient to grow out ectopic limbs from a dorsal wound. Limb induction with a 3-factor cocktail without supplementing with other cells is conceptually important for regenerative engineering.
(4) The writing style and presentation of results is very clear.
Overall appraisal:
This is a logical and well-executed study that creatively uses the axolotl model to advance an important framework for understanding limb patterning. The relevance of the mechanisms to normal limb regeneration are not yet substantiated, in the opinion of this reviewer. Additionally, Wnt10b and Fgf2 should be considered molecules sufficient to substitute dorsal and ventral identity (solely in terms of inducing Shh expression). It is not yet clear whether these molecules are truly necessary (loss of function would address this).
Comments on revisions:
Congratulations - I still find this an elegant and easy-to-read study with significant implications for the field! Linking your mechanisms to normal limb regeneration (i.e. regenerating blastema, not ALM), as well as characterising the cell populations involved, will be interesting directions for the future.
Author response:
The following is the authors’ response to the current reviews.
Public Reviews:
Reviewer #1 (Public review):
Summary:
The manuscript by Yamamoto et al. presents a model by which the four main axes of the limb are required for limb regeneration to occur in the axolotl. A longstanding question in regeneration biology is how existing positional information is used to regenerate the correct missing elements. The limb provides an accessible experimental system by which to study the involvement of the anteroposterior, dorsoventral, and proximodistal axes in the regenerating limb. Extensive experimentation has been performed in this area using grafting experiments. Yamamoto et al. use the accessory limb model and some molecular tools to address this question. There are some interesting observations in the study. In particular, one strength the potent induction of accessory limbs in the dorsal axis with BMP2+Fgf2+Fgf8 is very interesting. Although interesting, the study makes bold claims about determining the molecular basis of DV positional cues, but the experimental evidence is not definitive and does not take into account the previous work on DV patterning in the amniote limb. Also, testing the hypothesis on blastemas after limb amputation would be needed to support the strong claims in the study.
Strengths:
The manuscript presents some novel new phenotypes generated in axolotl limbs due to Wnt signaling. This is generally the first example in which Wnt signaling has provided a gain of function in the axolotl limb model. They also present a potent way of inducing limb patterning in the dorsal axis by the addition of just beads loaded with Bmp2+Fgf8+Fgf2.
Comments on revised version:
Re-evaluation: The authors have significantly improved the manuscript and their conclusions reflect the current state of knowledge in DV patterning of tetrapod limbs. My only point of consideration is their claim of mesenchymal and epithelial expression of Wnt10b and the finding that Fgf2 and Wnt10b are lowly expressed. It is based upon the failed ISH, but this doesn't mean they aren't expressed. In interpreting the Li et al. scRNAseq dataset, conclusions depend heavily on how one analyzes and interprets it. The 7DPA sample shows a very low representation of epithelial cells compared to other time points, but this is likely a technical issue. Even the epithelial marker, Krt17, and the CT/fibroblast marker show some expression elsewhere. If other time points are included in the analysis, Wnt10b, would be interpreted as relatively highly expressed almost exclusively in the epithelium. By selecting the 7dpa timepoint, which may or may not represent the MB stage as it wasn't shown in the paper, the conclusions may be based upon incomplete data. I don't expect the authors to do more work, but it is worth mentioning this possibility. The authors have considered and made efforts to resolve previous concerns.
We are grateful for the constructive comments. As Reviewer #1 suggested, we noted that clearer expression patterns of Wnt10b and Fgf2 may be detectable in scRNA-seq analyses at other stages, and we also clarified that low-level signals of epithelial and CT/fibroblast markers outside their expected clusters may reflect technical bias in the Discussion section. In addition, we agree with the reviewer’s point that our unsuccessful ISH experiments and the low abundance detected by RT-qPCR do not demonstrate absence of expression, and that conclusions from reanalyzing the Li et al. scRNA-seq dataset can depend strongly on analytical choices; therefore, while we focused on the 7 dpa sample because our RT-qPCR data suggested that Wnt10b and Fgf2 may be most enriched around the MB stage (the original study refers to 7 dpa as MB), we explicitly acknowledged that analyzing a single time point—especially one with a low representation of epithelial cells—may yield incomplete or stage-biased interpretations, and that inclusion of additional datasets could reveal clearer and potentially different expression patterns in the Discussion section. We also tempered our wording regarding the inferred cellular sources to avoid over-interpretation based on the current data in the Results section.
Reviewer #2 (Public review):
Summary:
This study explores how signals from all sides of a developing limb, front/back and top/bottom, work together to guide the regrowth of a fully patterned limb in axolotls, a type of salamander known for its impressive ability to regenerate limbs. Using a model called the Accessory Limb Model (ALM), the researchers created early staged limb regenerates (called blastemas) with cells from different sides of the limb. They discovered that successful limb regrowth only happens when the blastema contains cells from both the top (dorsal) and bottom (ventral) of the limb. They also found that a key gene involved in front/back limb patterning, called Shh (Sonic hedgehog), is only turned on when cells from both the dorsal and ventral sides come into contact. The study identified two important molecules, Wnt10B and FGF2, that help activate Shh when dorsal and ventral cells interact. Finally, the authors propose a new model that explains how cells from all four sides of a limb, dorsal, ventral, anterior (front), and posterior (back), contribute at both the cellular and molecular level to rebuilding a properly structured limb during regeneration.
Strengths:
The techniques used in this study, like delicate surgeries, tissue grafting, and implanting tiny beads soaked with growth factors, are extremely difficult, and only a few research groups in the world can do them successfully. These methods are essential for answering important questions about how animals like axolotls regenerate limbs with the correct structure and orientation. To understand how cells from different sides of the limb communicate during regeneration, the researchers used a technique called in situ hybridization, which lets them see where specific genes are active in the developing limb. They clearly showed that the gene Shh, which helps pattern the front and back of the limb, only turns on when cells from both the top (dorsal) and bottom (ventral) sides are present and interacting. The team also took a broad, unbiased approach to figure out which signaling molecules are unique to dorsal and ventral limb cells. They tested these molecules individually and discovered which could substitute for actual dorsal and ventral cells, providing the same necessary signals for proper limb development. Overall, this study makes a major contribution to our understanding of how complex signals guide limb regeneration, showing how different regions of the limb work together at both the cellular and molecular levels to rebuild a fully patterned structure.
Weaknesses:
Because the expressional analyses are performed on thin sections of regenerating tissue, in the original manuscript, they provided only a limited view of the gene expression patterns in their experiments, opening the possibility that they could be missing some expression in other regions of the blastema. Additionally, the quantification method of the expressional phenotypes in most of the experiments did not appear to be based on a rigorous methodology. The authors' inclusion of an alternate expression analysis, qRT-PCR, on the entire blastema helped validate that the authors are not missing something in the revised manuscript.
Overall, the number of replicates per sample group in the original manuscript was quite low (sometimes as low as 3), which was especially risky with challenging techniques like the ones the authors employ. The authors have improved the rigor of the experiment in the revised manuscript by increasing the number of replicates. The authors have not performed a power analysis to calculate the number of animals used in each experiment that is sufficient to identify possible statistical differences between groups. However, the authors have indicated that there was not sufficient preliminary data to appropriately make these quantifications.
Likewise, in the original manuscript, the authors used an AI-generated algorithm to quantify symmetry on the dorsal/ventral axis, and my concern was that this approach doesn't appear to account for possible biases due to tissue sectioning angles. They also seem to arbitrarily pick locations in each sample group to compare symmetry measurements. There are other methods, which include using specific muscle groups and nerve bundles as dorsal/ventral landmarks, that would more clearly show differences in symmetry. The authors have now sufficiently addressed this concern by including transverse sections of the limbs annd have explained the limitations of using a landmark-based approach in their quantification strategy.
We are grateful for the careful evaluation of the technical rigor and quantification. We have benefited from the reviewer’s earlier feedback, which guided revisions that improved the manuscript’s rigor and presentation.
Reviewer #3 (Public review):
Summary:
After salamander limb amputation, the cross-section of the stump has two major axes: anterior-posterior and dorsal-ventral. Cells from all axial positions (anterior, posterior, dorsal, ventral) are necessary for regeneration, yet the molecular basis for this requirement has remained unknown. To address this gap, Yamamoto et al. took advantage of the ALM assay, in which defined positional identities can be combined on demand and their effects assessed through the outgrowth of an ectopic limb. They propose a compelling model in which dorsal and ventral cells communicate by secreting Wnt10b and Fgf2 ligands respectively, with this interaction inducing Shh expression in posterior cells. Shh was previously shown to induce limb outgrowth in collaboration with anterior Fgf8 (PMID: 27120163). Thus, this study completes a concept in which four secreted signals from four axial positions interact for limb patterning. Notably, this work firmly places dorsal-ventral interactions upstream of anterior-posterior, which is striking for a field that has been focussed on anterior-posterior communication. The ligands identified (Wnt10b, Fgf2) are different to those implicated in dorsal-ventral patterning in the non-regenerative mouse and chick models. The strength of this study is in the context of ALM/ectopic limb engineering. Although the authors attempt to assay the expression of Wnt10b and Fgf2 during limb regeneration after amputation, they were unable to pinpoint the precise expression domains of these genes beyond 'dorsal' and 'ventral' blastema. Given that experimental perturbations were not performed in regenerating limbs - almost exclusively under ALM conditions - this author finds the title "Dorsoventral-mediated Shh induction is required for axolotl limb regeneration" a little misleading.
Strengths:
(1) The ALM and use of GFP grafts for lineage tracing (Figures 1-3) take full advantage of the salamander model's unique ability to outgrow patterned limbs under defined conditions. As far as I am aware, the ALM has not been combined with precise grafts that assay 2 axial positions at once, as performed in Figure 3. The number of ALMs performed in this study deserves special mention, considering the challenging surgery involved.
(2) The authors identify that posterior Shh is not expressed unless both dorsal and ventral cells are present. This echoes previous work in mouse limb development models (AER/ectoderm-mesoderm interaction) but this link between axes was not known in salamanders. The authors elegantly reconstitute dorsal-ventral communication by grafting, finding that this is sufficient to trigger Shh expression (Figure 3 - although see also section on Weaknesses).
(3) Impressively, the authors discovered two molecules sufficient to substitute dorsal or ventral cells through electroporation into dorsal- or ventral- depleted ALMs (Figure 5). These molecules did not change the positional identity of target cells. The same group previously identified the ventral factor (Fgf2) to be a nerve-derived factor essential for regeneration. In Figure 6, the authors demonstrate that nerve-derived factors, including Fgf2, are alone sufficient to grow out ectopic limbs from a dorsal wound. Limb induction with a 3-factor cocktail without supplementing with other cells is conceptually important for regenerative engineering.
(4) The writing style and presentation of results is very clear.
Overall appraisal:
This is a logical and well-executed study that creatively uses the axolotl model to advance an important framework for understanding limb patterning. The relevance of the mechanisms to normal limb regeneration are not yet substantiated, in the opinion of this reviewer. Additionally, Wnt10b and Fgf2 should be considered molecules sufficient to substitute dorsal and ventral identity (solely in terms of inducing Shh expression). It is not yet clear whether these molecules are truly necessary (loss of function would address this).
Comments on revisions:
Congratulations - I still find this an elegant and easy-to-read study with significant implications for the field! Linking your mechanisms to normal limb regeneration (i.e. regenerating blastema, not ALM), as well as characterising the cell populations involved, will be interesting directions for the future.
We are grateful for the constructive comments. To mitigate the concerns raised by Reviewer #3, we cited a previous study suggesting that ALM was used as the alternative experimental system for studying limb regeneration (Nacu et al., 2016, Nature, PMID: 27120163; Satoh et al., 2007, Developmental Biology, PMID: 17959163) in the Introduction section. We are confident that our ALM-based data provide a reasonable basis for understanding limb regeneration. We agree that there are important remaining questions—such as which cell populations express Wnt10b and Fgf2 and how endogenous WNT10B and FGF2 signals induce Shh expression in normal regeneration—which should be investigated in future studies to deepen our understanding of limb regeneration.
The following is the authors’ response to the original reviews.
Recommendations for the authors:
Reviewing Editor Comments:
The authors should be commended for addressing this gap - how cues from the DV axis interact with the AP axis during limb regeneration. Overall, the concept presented in this manuscript is extremely interesting and could be of high value to the field. However, the manuscript in its current form is lacking a few important data and resolution to fully support their conclusions, and the following needs to be addressed before publication:
(1) ISH data on Wnt10b and FGF2 from various regeneration time points are essential to derive the conclusion. Preferably multiplex ISH of Wnt10b/Fgf2/Shh or at least canonical ISH on serial sections to demonstrate their expression in dermis/epidermis and order of gene expression i.e. Shh is only expressed after expression of Wnt10b/FGF2. It would certainly help if this can also be shown in regular blastema.
We are grateful for the constructive suggestion on assessing Wnt10b and Fgf2 expression during regular regeneration, and we agree that clarifying their expression patterns in regular blastemas is important for strengthening the conclusions of our study. Because we cannot currently ensure sufficient sensitivity with multiplex FISH in our laboratory—partly due to high background—, we conducted conventional ISH on serial sections of regular blastemas at several time points (Fig. S5A). However, the expression patterns of Wnt10b and Fgf2 were not clear. To complement the ISH results, we performed RT-qPCR on microdissected dorsal and ventral halves of regular blastemas at the MB stage (Fig. S5B). We found that Wnt10b and Fgf2 were expressed at significantly higher levels in the dorsal and ventral halves, respectively, compared to the opposite half. This dorsal/ventral biased expression of Wnt10b/Fgf2 is consistent with our RNA-seq data. We further quantified expression levels of Wnt10b, Fgf2, and Shh across stages (intact, EB, MB, LB, and ED) and found that Wnt10b and Fgf2 peaked at the MB stage, whereas Shh peaked at the LB stage—consistent with the editor’s request regarding the order of gene expression (Fig. S5C). This temporal offset in upregulation supports our model. These results are now included in the revised manuscript (Line 294‒306).
To identify the cell types expressing Wnt10b or Fgf2, we analyzed published single-cell RNA-seq data (7 dpa blastema (MB), Li et al., 2021). As a result, Fgf2 expression was observed in the mesenchymal cluster, whereas Wnt10b expression was observed in both mesenchymal and epithelial clusters (Fig. S6). However, because only a small fraction of cells expressed Wnt10b, the principal cellular source of WNT10B protein remains unclear. The apparent low abundance likely contributes to the weak ISH signals and reflects current technical limitations. In addition, Wnt10b and Fgf2 expression did not follow Lmx1b expression (Fig. S6J, K), and Wnt10b and Fgf2 themselves were not exclusive (Fig. S6L). These results are now included in the revised manuscript (Line 307‒321). Together with the RT-qPCR data (Fig. S5B), these results suggest that Wnt10b and Fgf2 are not exclusively confined to purely dorsal or ventral cells at the single-cell level, even though they show dorsoventral bias when assessed in bulk tissue. These results suggest that Wnt10b/Fgf2 expression is not restricted to dorsal/ventral cells but mediated by dorsal/ventral cells, and co-existence of both signals should provide a permissive environment for Shh induction. Defining the precise spatial patterns of Wnt10b and Fgf2 in regular regeneration will therefore be an important goal for future work.
(2) Validation of the absence of gene expression via qRT PCR in the given sample will increase the rigor, as suggested by reviewers.
We thank for this important suggestion and agree that validation by qRT-PCR increases the rigor of our study. Accordingly, we performed RT-qPCR on AntBL, PostBL, DorBL, and VentBL to corroborate the ISH results. The results are now included in Fig. 2. We also verified by RT-qPCR that Shh expression following electroporation and the quantitative results are now provided in Fig. 5.
(3) Please increase n for experiments where necessary and mention n values in the figures.
We thank for this helpful comment and agree on the importance of providing sufficient sample sizes. Accordingly, we increased the n for the relevant experiments and have indicated the n values in the corresponding figure legends.
(4) Most comments by all three reviewers are constructive and largely focus on improving the tone and language of the manuscript, and I expect that the authors should take care of them.
We thank the reviewers for their constructive feedback on the tone and language of the manuscript. We have carefully revised the text according to each comment, and we hope these modifications have improved both clarity and readability.
In addition, in revising the manuscript we also refined the conceptual framework. Our new analysis of Wnt10b and Fgf2 expression during normal regeneration suggests that these genes are not expressed in a strictly dorsal- or ventral-specific manner at the single-cell level. When these observations are considered together with (i) the RNA-seq comparison of dorsally and ventrally induced ALM blastemas, (ii) RT-qPCR of microdissected dorsal and ventral halves of regenerating blastemas, and (iii) the functional electroporation experiments, our interpretation is that Wnt10b and Fgf2 act as dorsal- and ventral-mediated signals, respectively: their production is regulated by dorsal or ventral cells, and the presence of both signals is required to induce Shh expression. Given those, we now think our conclusion might be explained without using the confusing term, “positional cue”. Because the distinction between “positional cue” and “positional information” could be confusing as noted by the reviewers, we rewrote our manuscript without using “positional cue.”
Reviewer #1 (Recommendations for the authors):
(1) Line 61: More explanation for what a double-half limb means is needed.
We thank the reviewer for this suggestion. We have revised the manuscript (Line 73‒76). Specifically, we now explain that a double-dorsal limb, for example, is a chimeric limb generated by excising the ventral half and replacing it with a dorsal half from the contralateral limb while preserving the anteroposterior orientation.
(2) Line 63-65: "Such blastemas form hypomorphic, spike-like structures or fail to regenerate entirely." This statement does not represent the breadth of work on the APDV axis in limb regeneration. The cited Bryant 1976 reference tested only double-posterior and double-anterior newt limbs, demonstrating the importance of disposition along the AP axis, not DV. Others have shown that the regeneration of double-half limbs depends upon the age of the animal and the length of time between the grafting of double-half limbs and amputation. Also, some double-dorsal or double-ventral limbs will regenerate complete AP axes with symmetrical DV duplications (Burton, Holder, and Jesani, 1986). Also, sometimes half dorsal stylopods regenerate half dorsal and half ventral, or regenerate only half ventral, suggesting there are no inductive cues across the DV axis as there are along the AP axis. Considering this is the basis of the study under question, more is needed to convince that the DV axis is necessary for the generation of the AP axis.
We thank the reviewer for this detailed and constructive comment. We acknowledge that previous studies have reported a range of outcomes for double-half limbs. For example, Burton et al. (1986) described regeneration defects in double-dorsal (DD) and double-ventral (VV) limbs, although limb patterning did occur in some cases (Burton et al., 1986, Table 1). As the reviewer notes, regenerative outcomes depend on variables such as animal age and the interval between construction of the double-half limb and amputation, sometimes called the effect of healing time (Tank and Holder, 1978). Moreover, variability has been reported not only in DD/VV limbs but also in double-anterior (AA) and double-posterior (PP) limbs (e.g., Bryant, 1976; Bryant and Baca, 1978; Burton et al., 1986). In the revised manuscript, we have therefore modified the statement to avoid over-generalization and to emphasize that regeneration can be incomplete under these conditions (Line 76‒82). Importantly, in order to provide the additional evidence requested and to directly re-evaluate whether dorsal and ventral cells are required for limb patterning, we performed the ALM experiments shown in Fig. 1. The ALM system allows us to assess this question in a binary manner (regeneration vs. non-regeneration), thereby strengthening the rationale for our conclusions regarding the necessity of the APDV orientations. We also revised a sentence at the beginning of the Results section to emphasize this point (Line 139‒140).
(3) Line 71: These findings suggest that specific signals from all four positional domains must be integrated for successful limb patterning, such that the absence of any one of them leads to failure." I was under the impression that half posterior limbs can grow all elements, but half anterior can only grow anterior elements.
We thank the reviewer for this helpful clarification. As summarized by Stocum, half-limb experiments show that while some digit formation can occur, limb patterning remains incomplete in both anterior-half and posterior-half limbs in some cases (Stocum, 2017). We see this point as closely related to the broader question of whether proper limb patterning requires the integration of signals from all four positional domains. As noted in our response above, our ALM experiments in Fig. 1 were designed to test this point directly, and our data support the interpretation that cells from all four orientations are necessary for correct limb patterning.
(4) Line 79-81: This is stated later in lines 98-105. I suggest expanding here or removing it here.
We thank the reviewer for this suggestion. In the original version, lines 79–81 introduced our use of the terms “positional cue” and “positional information,” and this content partially overlapped with what later appeared in lines 98–105. In the revised manuscript, we have substantially rewritten this section (Line 82‒84), including the sentences corresponding to lines 79–81 in the original version, to remove the term “positional cue,” as explained in our response to the Editor’s comment (4); our revision reflects new analyses indicating that Wnt10b and Fgf2 appear not be strictly restricted to dorsal or ventral cell populations, and we now describe these factors as dorsal- or ventral-mediated signals that act across dorsoventral domains to induce Shh expression. Accordingly, we no longer maintain the original use of “positional cue” and “positional information.”
(5) Line 92 - 93: "Similarly, an ALM blastema can be induced in a position-specific manner along the limb axes. In this case, the induced ALM blastema will lack cells from the opposite side." This sentence is difficult to follow. Isn't it the same thing stated in lines 88-90?
We thank the reviewer for this comment. We revised the sentence to improve readability and to avoid redundancy with original Lines 88–90 (Line 104‒106).
(6) Line 107: I think the appropriate reference is McCusker et al., 2014 (Position-specific induction of ectopic limbs in non-regenerating blastemas on axolotl forelimbs), although Vieira et al., 2019 can be included here. In addition, Ludolph et al 1990 should be cited.
We thank the reviewer for this suggestion. We have added McCusker et al. (2014) and Ludolph et al. (1990) as references in the revised manuscript (Line 120‒121).
(7) Line 107-109: A missing point is how the ventral information is established in the amniote limb. From what I remember, it is the expression of Engrailed 1, which inhibits the ventral expression of Wnt7a, and hence Lmx1b. This would suggest that there is no secreted ventral cue. This is a relatively large omission in the manuscript.
We thank the reviewer for this comment. We agree that ventral fate in amniotes is specified by En1 in the ventral ectoderm, which represses Wnt7a and thereby prevents induction of Lmx1b; accordingly, a secreted ventral morphogen analogous to dorsal Wnt7a has not been established. We added this point to the revised Introduction (Line 61‒64).
By contrast, in axolotl limb regeneration, our previous work on Lmx1b expression suggests that DV identities reflect the original positional identity rather than being re-specified during regeneration (Yamamoto et al., 2022). Within this framework, our original use of the term “ventral positional cue” does not imply a ventral patterning morphogen in the amniote sense; rather, it denotes downstream signals induced by cells bearing ventral identity that are required for the blastema to form a patterned limb. This interpretation is consistent with classic studies on double-half chimeras and ectopic contacts between opposite regions (Iten & Bryant, 1975; Bryant & Iten, 1976; Maden, 1980; Stocum, 1982) as well as with our ALM data (Fig. 1). For this reason, we intentionally used the term “positional cues” to refer to signals provided by cells bearing ventral identity, which can be considered separable from the DV patterning mechanism itself, in the original text. As explained in our response to the Editor’s comment (4), we describe these signals as “signals mediated by dorsal/ventral cells,” rather than “positional cues” in the revised manuscript.
The necessity of dorsal- and ventral-mediated signals is supported by classic studies on the double-half experiment. In the non-regenerating cases, structural patterns along the anteroposterior axis appear to be lost even though both anterior and posterior cells should, in principle, be present in a blastema induced from a double-dorsal or double-ventral limbs. In limb development of amniotes, Wnt7a/Lmx1b or En-1 mutants show that limbs can exhibit anteroposterior patterning even when tissues are dorsalized or ventralized—that is, in the relative absence of ventral or dorsal cells, respectively (Riddle et al., 1995; Chen et al., 1998; Loomis et al., 1996). Taken together, axolotl limb regeneration, in which the presence of both dorsal and ventral cells plays a role in anteroposterior patterning, should differ from other model organisms. It is reasonable to predict the dorsal- and ventral-mediated signals in axolotl limb regeneration. We included this point in the revised manuscript (Line 82‒89). However, there is no evidence that these signals are secreted molecules. For this reason, we have carefully used the term “dorsal-/ventral-mediated signals” in the Introduction without implying secretion.
(8) Introduction - In general, the argument is a bit misleading. It is written as if it is known that a ventral cue is necessary, but the evidence from other animal models is lacking, from what I know. I may be wrong, but further argument would strengthen the reasoning for the study.
We thank the reviewer for this thoughtful comment. We agree that it should not read as if it is known that a ventral cue is necessary. In the revised Introduction, we have addressed this in several ways. First, as described in our response to comment (7), we now explicitly note that in amniote limb development ventral identity is specified by En1-mediated repression of Wnt7a, and that a secreted ventral morphogen equivalent to dorsal Wnt7a has not been established. Second, we removed the term “positional cue” and no longer present “ventral positional cue” as a defined entity. Instead, we use mechanistic phrasing such as “signals mediated by ventral cells” and “signals mediated by dorsal cells,” which does not assume that such signals are secreted morphogens or universally conserved. Third, we have reframed the role of dorsal- and ventral-mediated signals as a working hypothesis specific to axolotl limb regeneration, rather than as a general conclusion across model systems.
(9) Line 129: Remove "As mentioned before".
We thank the reviewer for this suggestion. We have removed the phrase “As mentioned before” in the revised manuscript (Line 143).
(10) Figure 1: Are Lmx1, Fgf8, and Shh mutually exclusive? Multiplexed FISH would provide this information, and is a relatively important question considering the strong claims in the study.
We thank the reviewer for raising this important point. As noted in our response to the editor’s comment, we cannot currently ensure sufficiently high detection sensitivity with multiplex FISH in our laboratory. However, based on previous reports (Nacu et al., 2016), Fgf8 and Shh should be mutually exclusive. In contrast, with respect to Lmx1b, our analysis suggests that its expression is not mutually exclusive with either Fgf8 or Shh, at least their expression domains. To confirm this, we analyzed the published scRNA-seq data and the results were added to the supplemental figure 6. Fgf8 and Shh were expressed in both Lmx1b-positive and Lmx1b-negative cells (Fig. S6H, I), but Fgf8 and Shh themselves were mutually exclusive (Fig. S6M). This point is now included in the revised manuscript (Line 314‒317).
(11) Results section and Figure 2: More evidence is needed for the lack of Shh expression ISH in tissue sections. Demonstrating the absence of something needs some qPCR or other validation to make such a claim.
We thank the reviewer for this suggestion. We performed qRT-PCR on ALM blastemas to complement the ISH data (Fig. 2).
(12) Line 179: I think they are likely leucistic d/d animals and not wild-type animals based upon the images.
We thank the reviewer for this observation. In the revised manuscript, we have corrected the description to “leucistic animals” (Line 194).
(13) Line 183-186: I'm a bit confused about this interpretation. If Shh turns on in just a posterior blastema, wouldn't it turn on in a grafted posterior tissue into a dorsal or ventral region? Isn't this independent of environment, meaning Shh turns on if the cells are posterior, regardless of environment?
Our interpretation is that only posterior-derived cells possess the competency to express Shh. In other words, whether a cell is capable of expressing Shh depends on its original positional identity (Iwata et al., 2020), but whether it actually expresses Shh depends on the environment in which the cell is placed. The results of Fig. 3E and G indicate that Shh activation is dependent on environment and that the posterior identity is not sufficient to activate Shh expression. We have revised the manuscript to emphasize this distinction more clearly (Line 198‒203).
(14) Figure 4: Do the limbs have an elbow, or is it just a hand?
We thank the reviewer for this thoughtful question. From the appearance, an elbow-like structure can occasionally be seen; however, we did not examine the skeletal pattern in detail because all regenerated limbs used for this analysis were sectioned for the purpose of symmetry evaluation, and we therefore cannot state this conclusively. While this is indeed an important point, analyzing proximodistal patterning would require a very large number of additional experiments, which falls outside the main focus of the present study. For this reason, and also to minimize animal use in accordance with ethical considerations, we did not pursue further experiments here. In response to this point, we have added a description of the skeletal morphology of ectopic limbs induced by BMP2+FGF2+FGF8 bead implantation (Fig. 6). In these experiments, multiple ectopic limbs were induced along the same host limb. In most cases, these ectopic limbs did not show fusion with the proximal host skeleton, similar to standard ALM-induced limbs, although in one case we observed fusion at the stylopod level. We now note this observation in the revised manuscript (Line 347‒354).
We regard the relationship between APDV positional information and proximodistal patterning as an important subject for future investigation.
(15) Line 203 - 237: I appreciate the symmetry score to estimate the DV axis. Are there landmarks that would better suggest a double-dorsal or double-ventral phenotype, like was done in the original double-half limb papers?
We thank the reviewer for this thoughtful comment. In most cases, the limbs induced by the ALM exhibit abnormal and highly variable morphologies compared to normal limbs, making it difficult to apply consistent morphological landmarks as used in the original double-half limb studies. For this reason, we focused our analysis on “morphological symmetry” as a quantitative measure of DV axis patterning, and we have added this explanation to the manuscript (Line 232‒235). Additionally, we provided transverse sections along the proximodistal axis as supplemental figures (Figs. S2 and S4). In addition to reporting the symmetry score, we have explicitly stated in the text that symmetry was also assessed by visual inspection of these sections.
(16) Line 245-247: The experiment was done using bulk sequencing, so both the epithelium and mesenchyme were included in the sample. The posterior (Shh) and anterior (Fgf8) patterning cues are mesenchymally expressed. In amniotes, the dorsal cue has been thought to be Wnt7a from the epithelium. Can ISH, FISH, or previous scRNAseq data be used to identify genes expressed in the mesenchyme versus epithelium? This is very important if the authors want to make the claim for defining "The molecular basis of the dorsal and ventral positional cues" as was stated by the authors.
We thank the reviewer for highlighting this important point. As the reviewer notes, our bulk RNA-seq data do not distinguish between epithelial and mesenchymal expression domains. As noted in our response to the editor’s comment, we performed ISH and qPCR on regular blastemas. However, these approaches did not provide definitive information regarding the specific cell types expressing Wnt10b and Fgf2. To complement this, we re-analyzed publicly available single-cell RNA-seq data (from Li et al., 2021). As a results, Fgf2 was expressed mainly by the mesenchymal cells, and Wnt10b expression was observed in both mesenchymal and epithelial cells. These results are now included in the revised manuscript (Line 294‒321) and in supplemental figures (Fig. S6, S7).
(17) Was engrailed 1, lmx1b, or Wnt7a differentially expressed along the DV axis, suggesting similar signaling between? Are these expressed in mesenchyme? Previous work suggests Wnt7a is expressed throughout the mesenchyme, but publicly available scRNAseq suggests that it is expressed in the epithelium.
We thank the reviewer for this important comment. As noted, the reported expression patterns of DV-related genes are not consistent across studies, which likely reflects the technical difficulty of detecting these genes with high sensitivity. In our own experiments, expression of DV markers other than Lmx1b has been very weak or unclear by ISH. Whether these genes are expressed in the epithelium or mesenchyme also appears to vary depending on the detection method used. In our RNA-seq dataset, Wnt7a expression was detected at very low levels and showed no significant difference along the DV axis, while En1 expression was nearly absent. We have clarified these results in the revised manuscript (Line 437‒441). Our reanalysis of the published scRNA-seq likewise detected Wnt7a in only a very small fraction of cells. Accordingly, we consider it premature to reach a definitive conclusion—such as whether Wnt7a is broadly mesenchymal or restricted to epithelium—as suggested in prior reports. We also note that whether Wnt7a is epithelial or mesenchymal does not affect the conclusions or arguments of the present study. Although the roles of Wnt7a and En1 in axolotl DV patterning are certainly important, we feel that drawing a definitive conclusion on this issue lies beyond the scope of the present study, and we have therefore limited our description to a straightforward presentation of the data.
(18) Line 247-249: The sentence suggests that all the ligands were tried. This should be included in the supplemental data.
We thank the reviewer for this clarification. In fact, we tested only Wnt4, Wnt10b, Fgf2, Fgf7, and Tgfb2, and all of these results are presented in the figures. To avoid misunderstanding, we have revised the text to explicitly state that our analysis focused on these five genes (Line 272‒274).
(19) Line 249: An n =3 seems low and qPCR would be a more sensitive means of measuring gene induction compared to ISH. The ISH would confirm the qPCR results. Figure 5C is also not the most convincing image of Shh induction without support from a secondary method.
We have increased the sample size for these experiments (Line 277‒280). In addition, to complement the ISH results, we confirmed Shh induction by qPCR following electroporation of Wnt10b and Fgf2 (Fig. 5D, E). In addition, because Shh signal in the Wnt10b-electroporated VentBL images was particularly weak and difficult to discern, we replaced that panel with a representative example in which Shh signal is more clearly visible. These data are now included in the revised manuscript (Line 280‒282).
(20) Line 253: It is confusing why Wnt10b, but not Wnt4 would work? As far as I know, both are canonical Wnt ligands. Was Wnt7a identified as expressed in the RNAseq, but not dorsally localized? Would electroporation of Wnt7a do the same thing as Wnt10b and hence have the same dorsalizing patterning mechanisms as amniotes?
We thank the reviewer for raising this challenging but important question. Wnt10b was identified directly from our bulk RNA-seq analysis, as was Wnt4. The difference in the ability of Wnt10b and Wnt4 to induce Shh expression in VentBL may reflect differences in how these ligands activate downstream WNT signaling programs. WNT10B is a potent activator of the canonical WNT/β-catenin pathway (Bennett et al., 2005), although WNT10B has also been reported to trigger a β-catenin–independent pathway (Lin et al., 2021). By contrast, WNT4 can signal through both canonical and non-canonical (β-catenin–independent) pathways, and the balance between these outputs is known to depend on cellular context (Li et al., 2013; Li et al., 2019). Consistent with a requirement for canonical WNT signaling, we found that pharmacological activation of canonical WNT signaling with BIO (a GSK3 inhibitor) was also sufficient to induce Shh expression in VentBL. However, despite this, it is still unclear why Wnt10b, but not Wnt4, was able to induce Shh under our experimental conditions. One possible explanation is that different WNT ligands can engage the same receptors (e.g., Frizzled/LRP6) yet can drive distinct downstream transcriptional programs (This may depend on the state of the responding cells, as Voss et al. predicted), resulting in ligand-specific outputs (Voss et al., 2025). This point is now included in the revised discussion section (Line 402‒412). At present, we cannot distinguish between these possibilities experimentally, and we therefore refrain from making a stronger mechanistic claim.
With respect to Wnt7a, we detected Wnt7a expression at very low levels, and without a clear dorsoventral bias, in our RNA-seq analysis of ALM blastemas (we describe this point in Line 437‒440). This is consistent with previous work suggesting that axolotl Wnt7a is not restricted to the dorsal region in regeneration. Because of this low and unbiased expression, and because our data already implicated Wnt10b as a dorsal-mediated signal that can act across dorsoventral domains to permit Shh induction, we did not prioritize Wnt7a electroporation in the present study. We therefore cannot conclude whether Wnt7a would behave similarly to Wnt10b in this context.
Importantly, these uncertainties about ligand-specific mechanisms do not alter our main conclusion. Our data support the idea that a dorsal-mediated WNT signal (represented here by WNT10B and canonical WNT activation) and a ventral-mediated FGF signal (FGF2) must act together to permit Shh induction, and that the coexistence of these dorsal- and ventral-mediated signals is required for patterned limb formation in axolotl limb regeneration.
(21) Is canonical Wnt signaling induced after electroporation of Wnt10b or Wnt4? qPCR of Lef1 and axin is the most common way of showing this.
We thank the reviewer for this helpful suggestion. In addition to examining Shh expression, we also assessed canonical WNT signaling by qPCR analysis of Axin2 and Lef1 following Wnt10b electroporation. The data is now included in Fig. 5.
(22) Line 255-256: qPCR was presented for Figure 5D, but ISH was used for everything else. Is there a technical reason that just qPCR was used for the bead experiments?
We thank the reviewer for this helpful comment. In the original submission, our goal was to test whether treatment with commercial FGF2 protein or BIO could reproduce the results obtained by electroporation. In the revised manuscript, to avoid confusion between distinct experimental aims, we removed the FGF2–bead data from this section and instead used RT-qPCR to quantitatively corroborate Shh induction after electroporation (Fig. 5D–E). RT-qPCR provided a sensitive, whole-blastema readout and allowed a paired design (left limb: factor; right limb: GFP control) that increased statistical power while minimizing animal use. To address the reviewer’s point more directly, we additionally performed ISH for the BIO treatment and now include those results in Supplementary Figure 3 (Line 287‒288).
(23) Line 261-263: The authors did not show where Wnt10B or Fgf2 is expressed in the limb as claimed. The RNAseq was bulk, so ISH of these genes is needed to make this claim. Where are Wnt10b and Fgf2 expressed in the amputated limb? Do they show a dorsal (Wnt10b) and ventral (Fgf2) expression pattern?
We thank the reviewer for raising this important point. As noted in our response to the editor’s comment, we performed ISH on serial sections of regular blastemas at several time points (Fig. S5A). However, the expression patterns of Wnt10b and Fgf2 along the dorsoventral axis were not clear. To complement the ISH results, we performed RT-qPCR on microdissected dorsal and ventral halves of regular blastemas at the MB stage (Fig. S5B). We found that Wnt10b and Fgf2 were expressed at significantly higher levels in the dorsal and ventral halves, respectively, compared to the opposite half. This dorsal/ventral biased expression of Wnt10b/Fgf2 is consistent with our RNA-seq data. To identify the cell types expressing Wnt10b or Fgf2, we analyzed published single-cell RNA-seq data (7 dpa blastema (MB), Li et al., 2021). As a result, Fgf2 expression was observed in the mesenchymal cluster, whereas Wnt10b expression was observed in both mesenchymal and epithelial clusters (Fig. S6). However, because only a small fraction of cells expressed Wnt10b, the principal cellular source of WNT10B protein remains unclear. The apparent low abundance likely contributes to the weak ISH signals and reflects current technical limitations. In addition, Wnt10b and Fgf2 expression did not follow Lmx1b expression (Fig. S6J, K), and Wnt10b and Fgf2 themselves were not exclusive (Fig. S6L). Together with the RT-qPCR data (Fig. S5B), these results suggest that Wnt10b and Fgf2 are not exclusively confined to purely dorsal or ventral cells at the single-cell level, even though they show dorsoventral bias when assessed in bulk tissue, suggesting that Wnt10b/Fgf2 expression is not dorsal-/ventral-specific but mediated by dorsal/ventral cells. Defining the precise spatial patterns of Wnt10b and Fgf2 in regular regeneration will therefore be an important goal for future work. These points are now included in the revised manuscript (Line 485‒501).
(24) Line 266-288: The formation of multiple limbs is impressive. Do these new limbs correspond to the PD location they are generated?
We thank the reviewer for this interesting question. Interestingly, from our observations, there does appear to be a tendency for the induced limbs to vary in length depending on their PD location. The skeletal patterns of the induced multiple limbs are now included in Fig. 6. However, as noted earlier, the supernumerary limbs exhibit highly variable morphologies, and a rigorous analysis of PD correlation would require a large number of induced limbs. Since this lies outside the main focus of the present study, we have not pursued this point further in the manuscript.
(25) Line 288: The minimal requirement for claiming the molecular basis for DV signaling was identified is to ISH or multiplexed FISH for Wnt10b and Fgf2 in amputated limb blastemas to show they are expressed in the mesenchyme or epithelium and are dorsally and ventrally expressed, respectively. In addition, the current understanding of DV patterning through Wnt7a, Lmx1b, and En1 shown not to be important in this model.
We thank the reviewer for this comment and fully agree with the point raised. We would like to clarify that we are not claiming to have identified the molecular basis of DV patterning. As the reviewer notes, molecules such as Lmx1b, Wnt7a, and En1 are well identified in other animal models as key regulators of DV positional identity. There is no doubt that these molecules play central roles in DV patterning. However, in axolotl limb regeneration, clear DV-specific expression has not been demonstrated for these genes except for Lmx1b. Therefore, further studies will be required to elucidate the molecular basis of DV patterning in axolotls.
Our focus here is more limited: we aim to identify the molecular basis for the mechanisms in which positional domain-mediated signals (FGF8, SHH, WNT10B, and FGF2) regulate the limb patterning process, rather than the molecular basis of DV patterning. In fact, our results on Wnt10b and Fgf2 suggest that these genes did not affect dorsoventral identities.
We recognize that this distinction was not sufficiently clear in the original text, and we have revised the manuscript to describe DV patterning mechanisms in other animals and clarify that the dorsal- and ventral-mediated signals are distinct from DV patterning (Line 444‒450). At least, we avoid claiming that the molecular basis for DV signaling was identified.
(26) Line 335: References are needed for this statement. From what I found, Wnt4 can be canonical or non-canonical.
We thank the reviewer for this helpful comment. We have revised the manuscript (Line 404‒407). We added these citations at the relevant location and adjusted nearby wording to avoid implying pathway exclusivity, in alignment with our response to comment (20).
(27) Line 337-338: The authors cannot claim "that canonical, but not non-canonical, WNT signaling contributes to Shh induction" as this was not thoroughly tested is based upon the negative result that Wnt4 electroporation did not induce Shh expression.
We thank the reviewer for this important clarification. We agree that our data do not allow us to conclude that non-canonical WNT signaling in general does not contribute to Shh induction. Accordingly, we have removed the phrase “but not non-canonical” and revised the text to emphasize that, within the scope of our experiments, Shh induction was not observed following Wnt4 electroporation, whereas it was observed with Wnt10b.
(28) Line 345: In order to claim "WNT10B via the canonical WNT pathway...appears to regulate Shh expression" needs at least qPCR to show WNT10B induces canonical signaling.
We thank the reviewer for this comment. As noted in our response to comment (21), we also assessed canonical WNT signaling by qPCR analysis of Axin2 and Lef1 following Wnt10b electroporation (Line 282‒285).
(29) Lines 361-372: A few studies have been performed on DV patterning of the mouse digit regeneration in regards to Lmx1b and En1. It may be good to discuss how the current study aligns with these findings.
We appreciate the reviewer’s suggestion. As the reviewer refers, several studies have been performed on dorsoventral (DV) patterning in mouse digit tip regeneration in relation to Lmx1b and En1 (e.g., Johnson et al., 2022; Castilla-Ibeas et al., 2023). In the present study, however, our main conclusion is different in the scope of studies on mouse digit tip regeneration. We show that, in the axolotl, pre-existing dorsal and ventral identities (as reflected by dorsally derived and ventrally derived cells in the ALM blastema) are required together to induce Shh expression, and that this Shh induction in turn supports anteroposterior interaction at the limb level. This mechanism—dorsal-mediated and ventral-mediated signals acting in combination to permit Shh expression—does not have a clear direct counterpart in the mouse digit tip literature. Moreover, even with respect to Lmx1b, the two systems behave differently. In mouse digit tip regeneration, loss of Lmx1b during regeneration does not grossly affect DV morphology of the regenerate (Johnson et al., 2022). By contrast, in our axolotl ALM system, the presence or absence of Lmx1b-positive dorsal tissue correlates with the final dorsoventral organization of the induced limb-like structures (e.g., production of double-dorsal or double-ventral symmetric structures in the absence of appropriate dorsoventral contact). Thus, the role of dorsoventral identity in our model is directly tied to patterned limb outgrowth at the whole-limb scale, whereas in the mouse digit tip it has been reported primarily in the context of digit tip regrowth and bone regeneration competence, not robust DV repatterning (Johnson et al., 2022).
For these reasons, we believe that an extended discussion of mouse digit tip regeneration would risk implying a mechanistic equivalence between axolotl limb regeneration and mouse digit tip regeneration that is not supported by current data. Because the regenerative contexts differ, and because Lmx1b does not appear to re-establish DV patterning in the mouse regenerates (Johnson et al., 2022), we have chosen not to include an explicit discussion of mouse digit tip regeneration in the main text.
(30) Line 408-433: Although I appreciate generating a model, this section takes some liberties to tell a narrative that is not entirely supported by previous literature or this study. For example, lines 415-416 state "Wnt10b and Fgf2 are expressed at higher levels in dorsal and the ventral blastemal cells, respectively" which were not shown in the study or other studies.
We thank the reviewer for this important comment. We agree that the original model based on RNA-seq data overstated the evidence. To address this point experimentally, we examined Wnt10b and Fgf2 expression in regular blastemas (Supplemental Figure 5 and 6). Accordingly, our model is now framed as an inductive mechanism for Shh expression—supported by results in ALM (WNT10B in VentBL; FGF2 in DorBL) and by DV-biased expression. Concretely, the sentence previously paraphrased as “Wnt10b and Fgf2 are expressed at higher levels in dorsal and ventral blastemal cells, respectively” has been replaced with wording that (i) avoids single-cell DV specificity and (ii) emphasizes dorsal-/ventral-mediated regulation and the requirement for both signals to allow Shh induction (Line 510‒511).
Reviewer #2 (Recommendations for the authors):
(1) Introduction:
The authors' definitions of positional cues vs positional information are a little hard to follow, and do not appear to be completely accurate. From my understanding of what the authors explain, "positional information" is defined as a signal that generates positional identities in the regenerating tissue. This is a somewhat different definition than what I previously understood, which is the intrinsic (likely epigenetic) cellular identity associated with specific positional coordinates. On the other hand, the authors define "positional cues" as signals that help organize the cells according to the different axes, but don't actually generate positional identities in the regenerating cells. The authors provide two examples: Wnt7a as an example of positional information, and FGF8 as a positional cue. I think that coording to the authors definitions, FGF8 (and probobly Shh) are bone fide positional cues, since both signals work together to organize the regenerating limb cells - yet do not generate positional identities, because ectopic limbs formed from blastemas where these pathways have been activated do not regenerate (Nacu et al 2016). However, I am not sure Wnt7a constitutes an example of a "positional information" signal, since as far as I know, it has not been shown to generate stable dorsal limb identities (that remain after the signal has stopped) - at least yet. If it has, the authors should cite the paper that showed this. I think that some sort of diagram to help define these visually will be really helpful, especially to people who do not study regenerative patterning.
We thank the reviewer for this thoughtful comment. We now agree with the reviewer that our use of “positional cue” and “positional information” may have been confusing. In the revision—and as noted in our response to the Editor’s comment (4)—we have removed the term “positional cue” and no longer attempt to contrast it with “positional information.” Instead, we adopt phrasing that reflects our data and hypothesis: during limb patterning, dorsal-mediated signals act on ventral cells and ventral-mediated signals act on dorsal cells to induce Shh expression. This wording avoids implying that these signals specify dorsoventral identity.
Regarding WNT7A, we agree it has not been shown to generate a stable dorsal identity after signal withdrawal. In the revised Introduction we therefore describe WNT7A in amniote limb development as an extracellular regulator that induces Lmx1b in dorsal mesenchyme (with En1 repressing Wnt7a ventrally), rather than labeling it as “positional information” in a strict, identity-imprinting sense. We highlight this contrast because, in our axolotl experiments, WNT10B and FGF2 did not alter Lmx1b expression or dorsal–ventral limb characteristics when overexpressed, consistent with the idea that they act downstream of DV identity to enable Shh induction, not to establish DV identity.
(2) Results:
It would be helpful if the number of replicates per sample group were reported in the figure legends.
We thank the reviewer for this suggestion. In accordance with the comment, we have added the number of replicates (n) for each sample group in the figure legends.
Figure 2 shows ISH for A/P and D/V transcripts in different-positioned blastemas without tissue grafts. The images show interesting patterns, including the lack of Shh expression in all blastemas except in posterior-located blastemas, and localization of the dorsal transcript (Lmx1b) to the dorsal half of A or P located blastemas. My only concern about this data is that the expression patterns are described in only a small part of the ectopic blastema (how representative is it?) and the diagrams infer that these expression patterns are reflective of the entire blastema, which can't be determined by the limited field of view. It is okay if the expression patterns are not present in the entire blastema -in fact, that might be an important observation in terms of who is generating (and might be receiving) these signals.
We thank the reviewer for this insightful comment. Because Fgf8 and Shh expression was detectable only in a limited subset of cells, the original submission included only high-magnification images. In response to the reviewer’s valid concern about representativeness, we have now added low-magnification overviews of the entire blastema as a supplemental figure (Fig. S1) and clarified in the figure legend that these expression patterns can be focal rather than pan-blastemal (Line 795‒796).
In Figure 3, they look at all of these expression patterns in the grafted blastemas, showing that Shh expression is only visible when both D and V cells are present in the blastema. My only concern about this data is that the number of replicates is very low (some groups having only an N=3), and it is unclear how many sections the authors visualized for each replicate. This is especially important for the sample groups where they report no Shh expression -I agree that it is not observable in the single example sections they provide, but it is uncertain what is happening in other regions of the blastema.
We thank the reviewer for this important comment. To increase the reliability of the results, we have increased the number of biological replicates in groups where n was previously low. For all samples, we collected serial sections spanning the entire blastema. For blastemas in which Shh expression was observed, we present representative sections showing the signal. For blastemas without detectable Shh expression, we selected a section from the central region that contains GFP-positive cells for the Figure. To make these points explicit, we have added the following clarification to the Fig. 3 legend (Line 811‒815).
Figure 4: Shh overexpression in A/P/D/V blastemas - expression induces ectopic limbs in A/D/V locations. They analyzed the symmetry of these regenerates (assuming that Do and V located blastemas will exhibit D/V symmetry because they only contain cells from one side of that axis. I am a little concerned about how the symmetry assay is performed, since oblique sections through the digits could look asymmetric, while they are actually symmetric. It is also unclear how the angle of the boxes that the symmetry scores were based on was decided - I imagine that the score would change depending on the angle. It also appears that the authors picked different digits to perform this analysis on the different sample groups. I also admit that the logic of classification scheme that the authors used AI to perform their symmetry scoring analysis (both in Figures 4 and 5) is elusive to me. I think it would have been more informative if the authors leveraged the structural landmarks, like the localization of specific muscle groups. (If this experiment were performed in WT animals, the authors could have used pigment cell localization)... or generate more proximal sections to look at landmarks in the zeugopod.
We thank the reviewer for these detailed comments regarding the symmetry analysis. Because reliance on a computed symmetry score alone could raise the concerns noted by the reviewer, we now provide transverse sections along the proximodistal axis as supplemental figures (Figs. S2 and S4). These include levels corresponding to the distal end of the zeugopod and the proximal end of the autopod. In addition to reporting the symmetry score, we have explicitly stated in the text that symmetry was also assessed by visual inspection of these sections.
As also noted in our response to Reviewer #1 (comment 15), ALM-induced limbs frequently exhibit abnormal and highly variable morphologies, which makes it difficult to use consistent anatomical landmarks such as particular digits or muscle groups. For this reason, we focused our analysis on morphological symmetry rather than landmark-based metrics, and we emphasize this rationale in the revised text (Line 232‒235).
Regarding the use of bounding boxes, this procedure was chosen to minimize the effects of curvature or fixation-induced distortion. For each section, the box angle was adjusted so that the outer contour (epidermal surface) was aligned symmetrically; this procedure was applied uniformly across all conditions to avoid bias. We analyzed multiple biological replicates in each group, which helps mitigate potential artifacts due to oblique sectioning. To further reduce bias, we increased the number of fields included in the analysis to n = 24 per group in the revised version.
In addition, staining intensity varied among samples, such that a region identified as “muscle” in one sample could be assigned differently in another if classification were based solely on color. To avoid this problem, we used a machine-learning classifier trained separately for each sample, allowing us to group the same tissues consistently within that sample irrespective of intensity differences. In the context of ALM-induced limbs, where stable anatomical landmarks are not available, we consider this strategy the most appropriate. We have added this rationale to the revised manuscript for clarity (Line 239‒247).
Figure 5: The number of replicates in sample groups is relatively low and is quite variable between groups (ranging between 3 and 7 replicates). Zoom in to visualize Shh expression is small relative to the blastema, and it is difficult to discern why the authors positioned the window where they did, and how they maintained consistency among their different sample groups. In the examples of positive Shh expression - the signal is low and hard to see. Validating these expression patterns using some sort of quantitative transcriptional assay (like qRTPCR) would increase the rigor of this experiment ... especially given that they will be able to analyze gene expression in the entire blastema as opposed to sections that might not capture localized expression.
We thank the reviewer for this important comment. To increase the rigor of these experiments, we have increased the number of biological replicates in groups where n was previously low. In addition, because Shh signal in the Wnt10b-electroporated VentBL images was particularly weak and difficult to discern, we replaced that panel with a representative example in which Shh signal is more clearly visible. We also validated the Shh expression for Wnt10b–electroporated VentBL and Fgf2–electroporated DorBL by RT-qPCR, which assesses gene expression across the entire blastema. These results are now included in Fig. 5 and Line 280‒282. Finally, we clarified in the figure legend how the “window” for imaging was chosen: for samples with detectable Shh expression, the window was placed in the region where the signal was observed; for conditions without detectable Shh expression, the window was positioned in a comparable region containing GFP-positive cells (Line 836‒839). These revisions are included in the revised manuscript.
Figure 6: They treat dorsal and ventral wounds with gelatin beads soaked in a combination of BMP2+FGF8 (nerve factors) and FGF2 proposed ventral factor). Remarkably, they observe ectopic limb expression in only dorsal wounds, further supporting the idea that FGF2 provides the "ventral" signal. They show examples of this impressive phenotype on limbs with multiple ectopic structures that formed along the Pr/Di axis. Including images of tubulin staining (as they have in Figures 1 and 2) to ensure that the blastemas (or final regenerates) are devoid of nerves. The authors' whole-mount skeletal staining which shows fusion of the ectopic humerus with the host humerus, is a phenotype associated with deep wounding, which could provide an opportunity for more cellular contribution from different limb axes.
We thank the reviewer for these constructive comments. As noted in the prior study, when beads are used to induce blastemas without surgical nerve orientation, fine nerve ingrowth can still occur (Makanae et al., 2014), and the induced blastemas are not completely devoid of nerves. While it is still uncertain whether these recruited nerves are functional after blastema induction, it is an important point, and we added sentences about this in the revised manuscript (Line 341‒345).
Regarding the skeletal phenotype, despite careful implantation to avoid injuring deep tissues, bead-induced ectopic limbs on the dorsal side occasionally displayed fusion of the stylopod with the host humerus—a phenotype associated with deep wounding, as the reviewer notes. This observation suggests that contributions from a broader cellular population cannot be excluded. However, because fusion was observed in only 1 of 16 induced limbs analyzed, and because ectopic limbs induced at the forearm (zeugopod) level did not exhibit such fusion (n=1/6 for stylopod-level inductions; n=0/10 for zeugopod-level inductions), we believe that our main conclusion remains valid. Because fusion is not a typical outcome, we now present representative non-fusion cases—including zeugopod-origin examples—in the figure (Fig. 6L1, L2), and we report the fusion incidence explicitly in the text (Line 350‒354). We also note in the revised manuscript that stylopod fusion can occur in a minority of cases (Line 347‒349).
Figure 7 nicely summarizes their findings and model for patterning.
We thank the reviewer for this positive comment.
The table is cut off in the PDF, so it cannot be evaluated at this time.
In our copy of the PDF, the table appears in full, so this may have been a formatting issue. We have carefully checked the file and ensured that the table is completely included in the revised submission.
There is a supplemental figure that doesn't seem to be referenced in the text.
The supplemental figure (Fig. S1 of the original manuscript) is referenced in the text, but it may have been overlooked. To improve clarity, we have expanded the description in the manuscript so that the supplemental figure is more clearly referenced (Line 285‒291).
(3) Materials and Methods:
No power analysis was performed to calculate sample group sizes. The authors have used these experimental techniques in the past and could have easily used past data to inform these calculations.
We thank the reviewer for this important comment. We did not include a power analysis in the manuscript because this was the first time we compared Shh and other gene expression levels among ALM blastemas of different positional origins using RT-qPCR in our experimental system. As we did not have prior knowledge of the expected variability under these specific conditions, it was difficult to predetermine appropriate sample sizes.
Reviewer #3 (Recommendations for the authors):
General:
Congratulations - I found this an elegant and easy-to-read study with significant implications for the field! If possible, I would urge you to consider adding some more characterisation of Wnt10b and Fgf2- which cell types are they expressed in? If you can link your mechanisms to normal limb regeneration too (i.e., regenerating blastema, not ALM), this would significantly elevate the interest in your study.
We sincerely thank the reviewer for these encouraging comments. As also noted in our response to the editor’s comment, we have analyzed the expression patterns of Wnt10b and Fgf2 in regular blastemas (Line 294‒306). Although clear specific expression patterns along dorsoventral axis were not detected by ISH, likely due to technical limitations of sensitivity, RT-qPCR revealed significantly higher expression levels of Wnt10b in the dorsal half and Fgf2 in the ventral half of a regular blastema (Fig. S5). In addition, we analyzed published single-cell RNA-seq data (7 dpa blastema, Li et al., 2021) (Line 307‒321). As a result, Fgf2 expression was observed in the mesenchymal clusters, whereasWnt10b expression was observed in both mesenchymal and epithelial clusters (Fig. S6). However, because only a small fraction of cells expressed Wnt10b, the principal cellular source of WNT10B protein remains unclear. Therefore, defining the precise spatial patterns of Wnt10b and Fgf2 in regular regeneration will be an important goal for future work.
Data availability:
I assume that the RNA-sequencing data will be deposited at a public repository.
RNA-seq FASTQ files have been deposited in the DNA Data Bank of Japan (DDBJ; https://www.ddbj.nig.ac.jp/) under BioProject accession PRJDB38065. We have added a Data availability section to the revised manuscript.
References
Castilla-Ibeas, A., Zdral, S., Oberg, K. C., & Ros, M. A. (2024). The limb dorsoventral axis: Lmx1b’s role in development, pathology, evolution, and regeneration. Developmental Dynamics, 253(9), 798–814. https://doi.org/10.1002/dvdy.695
Johnson, G. L., Glasser, M. B., Charles, J. F., Duryea, J., & Lehoczky, J. A. (2022). En1 and Lmx1b do not recapitulate embryonic dorsal-ventral limb patterning functions during mouse digit tip regeneration. Cell Reports, 41(8), 111701. https://doi.org/10.1016/j.celrep.2022.111701
Stocum, D. (2017). Mechanisms of urodele limb regeneration. Regeneration, 4. https://doi.org/10.1002/reg2.92
Tank, P. W., & Holder, N. (1978). The effect of healing time on the proximodistal organization of double-half forelimb regenerates in the axolotl, Ambystoma mexicanum. Developmental Biology, 66(1), 72–85. https://doi.org/10.1016/0012-1606(78)90274-9
eLife Assessment
This valuable study investigates whether the activity of an ABC transporter, BmrA, can be modulated by mechanical stimuli. The authors develop a single-molecule experimental system to address this question, although aspects of the methodological framework are incomplete. This work also develops a convincing theoretical model to explain the effect of membrane curvature on the conformational transitions observed during the activity cycle of this membrane protein. This study is of interest to the fields of membrane biophysics and membrane transport.
Reviewer #1 (Public review):
Summary:
This study uses single-molecule FRET to analyze the conformational ensemble of an ABC transporter at different temperatures, with different substrate analogs, and under different membrane curvatures (i.e., two populations of vesicles with different radii). The authors combine this data into a general model that describes the influence of membrane curvature on membrane protein conformation.
Strengths:
This interesting and quantitative work uses detailed FRET measurements at two different temperatures and in the presence of substrate and two substrate analogs to tease out the energetic contribution of membrane curvature in the conformational change of an ABC transporter. The mechanistic model distinguishes between equilibrium conditions (non-hydrolyzable ATP analog) and steady-state conditions (ATP analog), and describes the data well. The authors are careful with the experimental measurement of the liposome size distribution and perform appropriate controls to ensure it is maintained throughout the experiment.
Weaknesses:
An important aspect of this paper is the difference in mechanism between inhibitors AMP-PNP (a substrate analog) and vanadate (together with ADP, forms a transition state analog inhibitor). The mechanisms and inhibitory constants/binding affinities of these inhibitors are not very well-supported in the current form of the manuscript, either through citations or through experiments. Related to this, the interpretation of the different curvature response of BmrA in the presence of vanadate vs AMPPNP is not very clear.
Overall, the energetic contribution of the membrane curvature is subtle (less than a kT), so while the principles seem generalizable among membrane proteins, whether these principles impact transport or cell physiology remains to be established.
Reviewer #2 (Public review):
Summary:
Membrane transport proteins function by the alternating access model in which a central substrate binding site is alternately exposed to the soluble phase on either side of the membrane. For many members of the ABC transporter family, the transport cycle involves conformational isomerization between an outward-facing V-shaped conformation and an inward-facing Λ-shaped conformation. In the present manuscript, it is hypothesized that the difference in free energy between these conformational states depends on the radius of curvature of the membrane and hence, that transport activity can be modulated by this parameter.
To test this, BmrA, a multidrug exporter in Bacillus subtilis, was reconstituted into spherical proteoliposomes of different diameters and hence different radii of curvature. By measuring flux through the ATP turnover cycle in an enzymatic assay and conformational isomerization by single-molecule FRET, the authors argue that the activity of BmrA can be experimentally manipulated by altering the radius of curvature of the membrane. Flux through the transport cycle was found to be reduced at high membrane curvature. It is proposed that the potential to modulate transport flux through membrane curvature may allow ABC transporters to act as mechanosensors by analogy to mechanosensitive ion channels such as the Piezo channels and K2P channels.
Although an interesting methodology is established, additional experimentation and analyses would be required to support the major claims of the manuscript.
Strengths:
Mechanosensitivity of proteins is an understudied phenomenon, in part due to a scarcity of methods to study the activity of proteins in response to mechanical stimuli in purified systems. Useful experimental and theoretical frameworks are established to address the hypothesis, which potentially could have implications for a large class of membrane proteins. The tested hypothesis for the mechanosensitivity of the BmrA transporter is intuitive and compelling.
Weaknesses and comments:
(1) Although this study may be considered as a purely biophysical investigation of the sensitivity of an ABC transporter to mechanical perturbation of the membrane, the impact would be strengthened if a physiological rationale for this mode of regulation were discussed. Many factors, including temperature, pH, ionic strength, or membrane potential, are likely to affect flux through the transport cycle to some extent, without justifying describing BmrA as a sensor for changes in any of these. Indeed, a much stronger dependence on temperature than on membrane curvature was measured. It is not clear what radii of curvature BmrA would normally be exposed to, and whether this range of curvatures corresponds to the range at which modulation of transport activity could occur. Similarly, it is not clear what biological condition would involve a substantial change to membrane curvature or tension that would necessitate altered BmrA activity.
(2) The size distributions of vesicles were estimated by cryoEM. However, grid blotting leaves a very thin layer of vitreous ice that could sterically exclude large vesicles, leading to a systematic underestimation of the vesicle size distribution.
(3) The relative difference in ATP turnover rates for BmrA in small versus large vesicles is modest (~2-fold) and could arise from different success rates of functional reconstitution with the different protocols.
(4) The conformational state of the NBDs of BmrA was measured by smFRET imaging. Several aspects of these investigations could be improved or clarified. Firstly, the inclusion and exclusion criteria for individual molecules should be more quantitatively described in the methods. Secondly, errors were estimated by bootstrapping. Given the small differences in state occupancies between conditions, true replicates and statistical tests would better establish confidence in their significance. Thirdly, it is concerning that very few convincing dynamic transitions between states were observed. This may in part be due to fast photobleaching compared to the rate of isomerization, but this could be overcome by reducing the imaging frequency and illumination power. Alternatively, several labs have established the ability to exchange solution during imaging to thereby monitor the change in FRET distribution as a ligand is delivered or removed. Visualizing dynamic and reversible responses to ligands would greatly bolster confidence in the condition-dependent changes in FRET distributions. Such pre-steady state experiments would also allow direct comparison of the kinetics of isomerization from the inward-facing to the outward-facing conformation on delivery of ATP between small and large vesicles.
(5) A key observation is that BmrA was more prone to isomerize ATP- or AMP-PNP-dependently to the outward-facing conformations in large vesicles. Surprisingly, the same was not observed with vanadate-trapping, although the sensitivity of state occupancy to membrane curvature would be predicted to be greatest when state occupancies of both inward- and outward-facing states are close to 50%. It is argued that this was due to irreversibility of vanadate-trapping, but both vanadate and AMP-PNP should work fully reversibly on ABC transporters (see e.g. PMID: 7512348 for vanadate). Further, if trapping were fully irreversible, a quantitative shift to the outward-facing condition would be predicted.
Reviewer #3 (Public review):
Summary:
The manuscript explores the dependence of ABC transporter activity on membrane curvature. The underlying concept being analysed here is whether membrane mechanics can regulate the conformation of the protein and thereby its activity.
Strengths:
The protein of choice here is BmrA, a bacterial transmembrane ABC transporter. This protein was previously found to exhibit two states: open conformation with Nucleotide Binding domains (NBDs) separated from each other and an ATP-bound closed conformation with dimerised NBDs. The protein was purified and reconstituted into liposomes of varying diameters, largely categorised as Small vesicles (SV) and Large vesicles (LV). The authors find that the activity of the protein is reduced with the changing curvature of the membrane vesicles used to make the proteoliposomes. This could be modulated by making vesicles at different temperatures, LV at high and SV at lower temperature (4 {degree sign}C), following which they perform biochemical measurement of activity or smFRET experiments at HT or RT. They use well-characterized single-molecule FRET-based measurements to assess the change in conformation of the protein during the ATPase cycle. They find that a significant fraction of the protein is in an open (inactive) conformation in vesicles of higher curvature (SVs) at a given temperature. The authors develop a simple yet elegant theoretical model based on the energy of protein configuration states and their coupling to membrane energetics (bending rigidity) and curvature to explain these findings. The model provides a parameter-free fit that predicts the open/closed state distributions as well as the ATPase activity differences between SV and LV. Using experimentally determined values of the protein conicity, the authors to extract reasonable values of membrane rigidity, consistent with available literature.
The data and theoretical model together convincingly support the claim that membrane mechanics via local curvature modulation may bias membrane protein conformation states and thereby modify the activity of membrane proteins. This is an important and general conclusion that the authors also elaborate on in their discussion.
Weaknesses:
The authors say that the protein activity is irreversibly inhibited by orthovanadate, but 50% of the proteins are still in open conformation, while being accessible to the analogue (Table 2). It is unclear what this means in the context of activity vs. conformation.
The difference in the fraction of proteins in closed conformation is quite similar between LV and SV treated with AMP-PNP at 20 {degree sign}C (Figure 2B), and it is not clear if the difference is significant. The presence of a much higher FRET tail in the plots of smFRET experiment in SVs at 20 {degree sign}C or 33 {degree sign}C in the apo conformation of the protein (Figure 3A-B) is cause of some concern since one would not expect BmrA to access the closed states more frequently in the Apo conformation especially when incorporated in the SV. This is because the subtraction of the higher fraction of closed states in the Apo conformation contributes directly to enhancing the bias between the closed states in SV versus LV membrane bilayers.
Author response:
Global answer about the ATP analogs (concerns the 3 reviewers)
We use ATP-Vanadate essentially for detecting the FRET efficiency for the closed state. But these data are not included in our theoretical model. Thus, even if the comments of the reviewers on the observation of a non-negligible fraction of proteins in the open state in the presence of ATP-vanadate are justified, this has no consequence on our conclusions on the effect of curvature on BmrA on the conformational changes with ATP or AMP-PNP.
We agree with the comments of the reviewers that the binding of vanadate is not irreversible, but the reported lifetime of the closed state is very long compared to our experimental conditions (see (Urbatsch et al. JBC (1995)) on PgP).
Nevertheless, we will perform new experiments independent of ATP analogs using the E504A BmrA mutant. It has been shown structurally and enzymatically to bind and not hydrolyze ATP and to be 100% in a closed conformation at 5 mM ATP (A. Gobet et al., Nat. Commun. 16, 1745 (2025)). It will clear up all doubts about our experiments.
We will also add new references:
I. L. Urbatsch, B. Sankaran, J. Weber, A. E. Senior, J. Biol. Chem. 270, 19383 (1995)
T. Baukrowitz, T.-C. Hwang, A. C. Nairn, D. C. Gadsby, Neuron 12, 473 (1994)
A. Gobet et al., Nat. Commun. 16, 1745 (2025)
Y. Liu, M. Liao, Sci. Adv. 11, eadv9721 (2025) (on the effect of vanadate and temperature on a plant ABC)
Public Reviews:
Reviewer #1 (Public review):
(1) An important aspect of this paper is the difference in mechanism between inhibitors AMP-PNP (a substrate analog) and vanadate (together with ADP, forms a transition state analog inhibitor). The mechanisms and inhibitory constants/binding affinities of these inhibitors are not very well-supported in the current form of the manuscript, either through citations or through experiments. Related to this, the interpretation of the different curvature response of BmrA in the presence of vanadate vs AMPPNP is not very clear.
See the global answer about ATP-analogs (above)
(2) Overall, the energetic contribution of the membrane curvature is subtle (less than a kT), so while the principles seem generalizable among membrane proteins, whether these principles impact transport or cell physiology remains to be established.
This is correct that the effect is limited to high curvature in the case of BmrA. Our theoretical model allows predictions for different protein parameters. The effect is particularly dependent on the protein size and on protein conicity, which can vary over a wide range. We show that larger proteins, such as piezo 1 are in principle expected to display a much stronger curvature dependence than BmrA. But testing our predictions on other proteins and on their physiological function is indeed an exciting perspective but beyond the objective of the current manuscript.
Reviewer #2 (Public review):
(1) Although this study may be considered as a purely biophysical investigation of the sensitivity of an ABC transporter to mechanical perturbation of the membrane, the impact would be strengthened if a physiological rationale for this mode of regulation were discussed. Many factors, including temperature, pH, ionic strength, or membrane potential, are likely to affect flux through the transport cycle to some extent, without justifying describing BmrA as a sensor for changes in any of these. Indeed, a much stronger dependence on temperature than on membrane curvature was measured. It is not clear what radii of curvature BmrA would normally be exposed to, and whether this range of curvatures corresponds to the range at which modulation of transport activity could occur. Similarly, it is not clear what biological condition would involve a substantial change to membrane curvature or tension that would necessitate altered BmrA activity.
Reviewers 1 and 2 both stressed that we showed that activity and conformational changes are mechanosensitive, not that the function of the protein is to be a mechanosensor. This will be corrected.
Regarding the physiological relevance of the mechanosensitivity of BmrA, we have addressed this point in the manuscript (bottom of page 10 and top of page 11). This discussion was positively appreciated by Reviewer #3. We stress that we have used BmrA as a model system, but considering our results and the theoretical model, we can predict the parameters that are relevant for future studies on the sensitivity of other transmembrane proteins to membrane mechanical properties. And, as stated by the reviewer, "mechanosensitivity of proteins is an understudied phenomenon".
(2) The size distributions of vesicles were estimated by cryoEM. However, grid blotting leaves a very thin layer of vitreous ice that could sterically exclude large vesicles, leading to a systematic underestimation of the vesicle size distribution.
We used Lacey carbon grids with large mesh size ranges for our cryoEM images, and we blot on the backside, precisely to measure the largest size range accessible to cryoEM. In our hands, this was not the case when using Quantifoil or C-Flat grids with uniform hole sizes and a large fraction of carbon where the vesicles adhere. With our grids, we are able to image vesicles from 20 to 200 nm diameter and the precision on the diameter is high, but the statistics might not be as good as with DLS or other diffusion-based methods. DLS is an indirect method (as compared to cryoEM) to measure vesicle size distribution, that may overestimate the fraction of large objects and underestimate the small ones. We will perform DLS experiments for comparison purpose.
(3) The relative difference in ATP turnover rates for BmrA in small versus large vesicles is modest (~2-fold) and could arise from different success rates of functional reconstitution with the different protocols.
The ATPase activity is sensitive to several parameters. We thus carefully characterized our reconstituted samples, including ATPase activity, yield of incorporation and orientation of proteins that are often reported. In addition, we showed by cryo-EM the unilamellarity of the proteoliposomes and their stability during the experiments, which were never reported. The ATPase activity of our samples reconstituted in liposomes at 20 ° and at 4°C are high, among the highest reported for BmrA, and less sensitive to errors as compared to the low activities in micelles of detergent.
We would also like to stress that with our protocol, we have prepared the same batch of lipid/protein mixture that we have split it 2 for the reconstitution at 4°C and 20°C conversely. Both preparations contain the same amount of detergent. The only difference is that we include more BioBeads for the preparation at 4°C to account for the difference of absorption of the detergent on the beads at low temperature (D. Lévy, A. Bluzat, M. Seigneuret, J.L. Rigaud Biochim. Biophys. Acta. 179 (1990)), but we also showed that the proteins do not adsorb on the BioBeads (J.-L. Rigaud, B. Pitard, D. Levy, Biochim. Biophys. Acta 1231, 223 (1995)). In addition, the activity of the protein at 37°C is high and comparable to those reported in the literature (E. Steinfels et al., Biochemistry 43, 7491 (2004)., W. Mi et al., Nature 549, 233 (2017).), which speaks for a good functional reconstitution. Finally, our results are consistent between the smFRET where we have only one protein maximum per vesicle and the activity measurements where the amount of protein is higher.
We also performed reconstitution from molar LPR= 1:13600 to 1:1700 and found the same activity per protein, confirming that the proteins are functional, independently of their surface fraction. We will add these data in the revision.
Altogether, these data suggest that we correctly estimate the rate of functional reconstitution in our experiments.
Nevertheless, we will design additional experiments to further compare the activity of the proteins before and after reconstitution.
(4) The conformational state of the NBDs of BmrA was measured by smFRET imaging. Several aspects of these investigations could be improved or clarified. Firstly, the inclusion and exclusion criteria for individual molecules should be more quantitatively described in the methods. Secondly, errors were estimated by bootstrapping. Given the small differences in state occupancies between conditions, true replicates and statistical tests would better establish confidence in their significance. Thirdly, it is concerning that very few convincing dynamic transitions between states were observed. This may in part be due to fast photobleaching compared to the rate of isomerization, but this could be overcome by reducing the imaging frequency and illumination power. Alternatively, several labs have established the ability to exchange solution during imaging to thereby monitor the change in FRET distribution as a ligand is delivered or removed. Visualizing dynamic and reversible responses to ligands would greatly bolster confidence in the condition-dependent changes in FRET distributions. Such pre-steady state experiments would also allow direct comparison of the kinetics of isomerization from the inward-facing to the outward-facing conformation on delivery of ATP between small and large vesicles.
(a) We will better detail the inclusion and exclusion criteria.
(b) For the smFRET, we have performed N=3 true replicates. We will add statistical tests on our graphs.
(c) We will detail more how we have optimized our illumination protocol, considering the signal to noise ratio and the photobleaching. Practically, we cannot add ATP to our sealed observation chamber on our TIRF system to detect dynamical changes on our immobilized liposomes. The experiment suggested by the reviewer would imply to build a flow chamber to exchange the medium around immobilized liposomes, compatible with TIRF microscopy. This is an excellent idea, which has been achieved only recently (S. N. Lefebvre, M. Nijland, I. Maslov, D. J. Slotboom, Nat. Commun. 16, 4448 (2025)). It will require a full new study to optimize both the flow chamber and the dyes to track the smFRET changes over long periods of time.
Nevertheless, we would like to stress that our objective is not to study the dynamics of the conformational changes, and that we expect it to be slow for BmrA, even at 33°C.
(5) A key observation is that BmrA was more prone to isomerize ATP- or AMP-PNP-dependently to the outward-facing conformations in large vesicles. Surprisingly, the same was not observed with vanadate-trapping, although the sensitivity of state occupancy to membrane curvature would be predicted to be greatest when state occupancies of both inward- and outward-facing states are close to 50%. It is argued that this was due to irreversibility of vanadate-trapping, but both vanadate and AMP-PNP should work fully reversibly on ABC transporters (see e.g. PMID: 7512348 for vanadate). Further, if trapping were fully irreversible, a quantitative shift to the outward-facing condition would be predicted.
See the global answer about ATP-analogs (above)
Reviewer #3 (Public review):
(1) The authors say that the protein activity is irreversibly inhibited by orthovanadate, but 50% of the proteins are still in open conformation, while being accessible to the analogue (Table 2). It is unclear what this means in the context of activity vs. conformation.
See the global answer about ATP-analogs (above)
(2) The difference in the fraction of proteins in closed conformation is quite similar between LV and SV treated with AMP-PNP at 20 {degree sign}C (Figure 2B), and it is not clear if the difference is significant. The presence of a much higher FRET tail in the plots of smFRET experiment in SVs at 20 {degree sign}C or 33 {degree sign}C in the apo conformation of the protein (Figure 3A-B) is cause of some concern since one would not expect BmrA to access the closed states more frequently in the Apo conformation especially when incorporated in the SV. This is because the subtraction of the higher fraction of closed states in the Apo conformation contributes directly to enhancing the bias between the closed states in SV versus LV membrane bilayers.
We have consistently observed, both at 20°C and at 33°C, a fraction of proteins with a high FRET signal in our measurements, higher in SV (about 15% and 17%) than in LV (about 10% and 6%). We have quantified the fraction of proteins with NBDs facing inside the liposomes (page 5), 20% in LV and 23.85% in SV. Considering the inverted curvature of the membrane, this orientation could favor the closed conformation, even in the absence of ATP, more for SV than LV. The fraction with inverted orientation could explain our higher fraction of high FRET signal in SV.
Moreover, for part of it, it can be due to a fraction of proteins with a non-specific labeling that would produce a higher FRET signal. We will add data with Cys-less mutants showing that less than 4% are labeled.
eLife Assessment
This valuable work explores how synaptic activity encodes information during memory tasks. All reviewers agree that the work is of very high quality and that the methodological approach is praiseworthy. The experimental data support the possibility that phospholipase diacylglycerol signaling and synaptotagmin 7 (Syt7) dynamically regulate the vesicle pool required for presynaptic release. Overall, this is a convincing study.
Reviewer #3 (Public review):
The new results fill a key gap in the logic by strongly supporting the foundational premise that the very quickly reverting paired pulse depression at layer 2/3 synapses is caused by pool depletion. They are particularly critical because a previous study (Dobrunz, Huang, and Stevens, 1997) showed that a similar phenomenon is caused by a completely different category of mechanisms at Schaffer collateral synapses. This does not seem to be a case where the previous study was incorrect because, unlike here, synaptic strength at Schaffer collateral synapses is highly sensitive to extracellular Ca2+. Overall, such a fundamental difference between layer 2/3 and Schaffer synapses is highly noteworthy, given the similarities at the level of morphology and timing, and should be highlighted in the Discussion as an important result of its own. My only hesitation is that the authors do not seem to have done the control experiments, that I suggested, that would have confirmed that the synaptic strength remains stable when switching back to 1.3 mM Ca2+.
Author response:
The following is the authors’ response to the previous reviews
Public Reviews:
Reviewer #3 (Public review):
To summarize: The authors' overfilling hypothesis depends crucially on the premise that the very quickly reverting paired-pulse depression seen after unusually short rest intervals of << 50 ms is caused by depletion of release sites whereas Dobrunz and Stevens (1997) concluded that the cause was some other mechanism that does not involve depletion on. The authors now include experiments where switching extracellular Ca2+ from 1.2 to 2.5 mM increases synaptic strength on average, but not by as much as at other synapse types. They contend that the result supports the depletion on hypothesis. I didn't agree because the model used to generate the hypothesis had no room for any increase at all, and because a more granular analysis revealed a mixed population with a subset where: (a) synaptic strength increased by as much as at standard synapses; and yet (b) the quickly reverting depression for the subset was the same as the overall population.
The authors raise the possibility of additional experiments, and I do think this could clarify things if they pre-treat with EGTA as I recommended initially. They've already shown they can do this routinely, and it would allow them to elegantly distinguish between pv and pocc explanations for both the increases in synaptic strength and the decreases in the paired pulse ratio upon switching Ca2+ to 2.5 mM. Plus/minus EGTA pre-treatment trials could be interleaved and done blind with minimal additional effort.
Showing reversibility would be a great addition too, because, in our experience, this does not always happen in whole-cell recordings in ex-vivo tissue even when electrical properties do not change. If the goal is to show that L2/3 synapses are less sensitive to changes in Ca2+ compared to other synapse types - which is interesting but a bit off point - then I would additionally include a positive control, done by the same person with the same equipment, at one of those other synapse types using the same kind of presynaptic stimulation (i.e. ChRs).
Specific points (quotations are from the Authors' rebuttal)
(1) Regarding the Author response image 1, I was instead suggesting a plot of PPR in 1.2 mM Ca2+ versus the relative increase in synaptic strength in 2.5 versus in 1.2 mM. This continues to seem relevant.
Complying with your suggestion, we studied the effects of external [Ca<sup>2+</sup>] ([Ca<sup>2+</sup>]<sub>o</sub>) after pre-incubating the slice in aCSF containing 50 μM EGTA-AM, and added the results as Figure 3—figure supplement 3C-D. Elevation of ([Ca<sup>2+</sup>]<sub>o</sub>) from 1.3 to 2.5 mM produced no significant change in either baseline EPSC amplitude or PPR, supporting that the p<sub>v</sub> is already saturated at 1.3 mM [Ca<sup>2+</sup>]<sub>o</sub> and implying that the modest Ca<sup>2+</sup> dependence of baseline EPSCs and PPR in the absence of EGTA (Figure 3—figure supplement 3A-B) is mediated by the change in baseline vesicular occupancy of release sites (p<sub>occ</sub>) rather than fusion probability of docked vesicles (p<sub>v</sub>).
We found some correlation of high Ca<sup>2+</sup>-induced relative increase in synaptic strength with the PPR at low Ca<sup>2+</sup> (Author response image 1-A). But this correlation was abolished by pre-incubating the slices in EGTA-AM too (Author response image 1-B). It should be noted that high PPR does not always mean low p<sub>v</sub>. For example, when the replenishment is equal between high and low baseline p<sub>occ</sub> synapses, the PPR would be higher at low p<sub>occ</sub> synapses than that at high p<sub>occ</sub> synapses, even if p<sub>v</sub> is close to unity. Therefore, high baseline release probability (Pr), whatever it is attributed to high p<sub>v</sub> or high p<sub>occ</sub>, can result in low PPR, considering that Pr = p<sub>occ</sub> x p<sub>v</sub>.
As we have already mentioned in our previous letter, the relationship of PPR with refilling rate is complicated and can be bidirectional, whereas an increase in p<sub>v</sub> always results in a reduction of PPR. For example, PPR can be reduced by both a decrease and an increase in the refilling rate (Figure 2— figure supplement 1 and Lin et al., 2025). Therefore, the PPR analysis alone is insufficient to differentiate the contributions of p<sub>v</sub> and p<sub>occ</sub> Thanks to your suggestion, we could resolve this ambiguity by the EGTA-AM pre-incubation study (Figure 3—figure supplement 3C-D).
Author response image 1.
Plot of PPR at low [Ca<sup>2+</sup>]<sub>o</sub> (1.3 mM) as a function of the baseline EPSC at high [Ca<sup>2+</sup>]<sub>o</sub> (2.5 mM) normalized to that at low [Ca<sup>2+</sup>]<sub>o</sub> measured at recurrent excitatory synapses in L2/3 of the prelimbic cortex under the conditions without EGTA-AM (A) and after pre-incubating the slices in EGTA-AM (50 μM) (B)
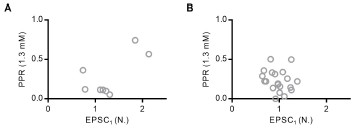
(2) "Could you explain in detail why two-fold increase implies pv < 0.2?"
(a) start with power((2.5/(1 + (2.5/K1) + 1/2.97)),4) = 2<sup>*</sup>power((1.3/(1 + (1.3/K1) + 1/2.97)),4);
(b) solve for K1 (this turns out to be 0.48);
(c) then implement the premise that pv -> 1.0 when Ca2+ is high by calculating Max = power((C/(1 + (C/K1) + 1/2.97)),4) where C is [Ca] -> infinity.
(d) pv when [Ca] = 1.3. mM must then be power((1.3/(1 + (1.3/K1) + 1/2.97)),4)/Max, which is <0.2. Note that modern updates of Dodge and Rahamimoff typically include a parameter that prevents pv from approaching 1.0; this is the gamma parameter in the versions from Neher group.
Thank you very much for your kind explanation. This interpretation, however, based on the premise that pv is not saturated at low[Ca<sup>2+</sup>]<sub>o</sub>, and that Pr = p<sub>v</sub>. In the present study, however, we presented multiple convergent lines of evidence supporting that p<sub>v</sub> is already saturated at 1.3 mM [Ca<sup>2+</sup>]<sub>o</sub> as follows: (1) little effect of EGTA-AM on the baseline EPSCs (Figure 2—figure supplement 1); (2) high double failure rates (Figure 3—figure supplement 2); (3) little effect of high [Ca<sup>2+</sup>]<sub>o</sub> on baseline EPSC (Figure 3—figure supplement 3). Therefore, our results suggest that the classical Dodge-Rahamimoff fourth-power relationship can not be applied to estimate p<sub>v</sub> at the L2/3 recurrent excitatory synapses.
(3) "If so, we can not understand why depletion-dependent PPD should lead to PPF." When PPD is caused by depletion and pv < 0.2, the number of occupied release sites should not be decreased by more than one-filth at the second stimulus so, without facilitation, PPR should be > 0.8. The EGTA results then indicate there should be strong facilitation, driving PPR to something like 1.2 with conservative assumptions. And yet, a value of < 0.4 is measured, which is a large miss.
As mentioned above, the framework used for inferring that p<sub>v</sub> < 0.2, the Dodge-Rahamimoff equation, is not applicable to our experimental system. Consequently, the subsequent deduction— that depletion-dependent PPD should logically lead to PPF—is based on a model that does not compatible with aforementioned multiple convergent lines of evidence, which supports high p<sub>v</sub> rather than the low p<sub>v</sub> facilitation model.
(4) Despite the authors' suggestion to the contrary, I continue to think there is a substantial chance that Ca2+-channel inactivation is the mechanism underlying the very quickly reverting paired-pulse depression. However, this is only one example of a non-depletion mechanism among many, with the main point being that any non-depletion mechanism would undercut the reasoning for overfilling. And, this is what Dobrunz and Stevens claimed to show; that the mechanism - whatever it is - does not involve depletion. The most effective way to address this would be affirmative experiments showing that the quickly reverting depression is caused by depletion after all. Attempting to prove that Ca2+channel inactivation does not occur does not seem like a worthwhile strategy because it would not address the many other possibilities.
We have systematically ruled out alternative possibilities that may underlie the strong PPD observed at our synapses and demonstrated that it arises from high p<sub>v</sub>-induced vesicle depletion through multiple independent lines of evidence. First, we excluded (1) AMPAR desensitization or saturation (Figure 1—figure supplement 5), (2) Ca<sup>2+</sup> channel inactivation (Figure 2—figure supplement 2), (3) channelrhodopsin inactivation (Figure 1—figure supplement 2), (4) artificial bouton stimulation (Figure 1—figure supplement 4), and (5) transient vesicle undocking (Figure 5; addressed in our previous rebuttal). Second, EGTA-AM experiments (Figure 2, Figure 2—figure supplement 1) revealed that release sites are tightly coupled to Ca<sup>2+</sup> channels, and that EGTA further exacerbates PPD. Third, we validated high baseline p<sub>v</sub> through analysis of double failure rates (Figure 3—figure supplement 2). Fourth, the minimal increase in baseline EPSCs upon elevation of external [Ca<sup>2+</sup>] (Figure 3—figure supplement 3) further supports that baseline p<sub>v</sub> is already saturated at low [Ca<sup>2+</sup>]<sub>o</sub>. Additionally, to further validate our hypothesis, we performed the specific experiment suggested by the reviewer. We have now added EGTA pre-incubation experiments (Figure 3—figure supplement 3C-D) and have revised the manuscript. Specifically, when slices were pre-incubated with 50 μM EGTA-AM, elevation of extracellular [Ca<sup>2+</sup>] from 1.3 to 2.5 mM produced no significant change in either baseline EPSC amplitude or PPR, strongly supporting that the high [Ca<sup>2+</sup>]<sub>o</sub> effects in the absence of EGTA are primarily mediated by changes in p<sub>occ</sub> rather than p<sub>v</sub>
(5) True that Kusick et al. observed morphological re-docking, but then vesicles would have to re-prime and Mahfooz et al. (2016) showed that re-priming would have to be slower than 110 ms (at least during heavy use at calyx of Held).
As previously discussed, Kusick et al. (2020) demonstrated that the transient destabilization of the docked vesicle pool recovers very rapidly within 14 ms after stimulation. This implies that any posts stimulation undocking events are likely recovered before the 20 ms ISI used in our PPR experiments. Consequently, transient undocking/re-docking events are unlikely to significantly influence the PPR measured at this interval. Furthermore, regarding the slow re-priming kinetics (>100 ms) reported by Mahfooz et al. (2016) and Kusick et al., (2020), our 20 ms ISI effectively falls into a me window that avoids the potential confounds of both processes: it is long enough for the rapid morphological recovery (~14 ms) of docked vesicles to occur, yet too short for the slow re-priming process to make a substantial contribution. Furthermore, Vevea et al. (2021) showed that post-stimulus undocking is facilitated in synaptotagmin-7 (Syt7) knockout synapses. In our study, however, Syt7 knockdown did not affect PPR at 20 ms ISI, suggesting that the undocking process described in Kusick et al. (2020) is not a major contributor to the PPD observed at 20 ms intervals in our experiments. Therefore, we conclude that the 20 ms ISI used in our experiments falls within a me window that is influenced neither by the rapid undocking (<14 ms) reported nor by the slow re-priming process (>100 ms).
eLife Assessment
This set of experiments provides important knowledge for how the infralimbic cortex is recruited to inhibit behavior after extinction training. The evidence supporting the conclusions is convincing with multiple sophisticated behavioral designs providing converging lines of evidence, though reviewers note possible alternative interpretations and limitations of small group sizes in some cases. This work will be of interest to those interested in cortical function, learning and memory, aversive behavior, and/or related psychiatric factors.
Reviewer #1 (Public review):
The revised manuscript presents an interesting and technically competent set of experiments exploring the role of the infralimbic cortex (IL) in extinction learning. The inclusion of histological validation in the supplemental material improves the transparency and credibility of the results, and the overall presentation has been clarified. However, several key issues remain that limit the strength of the conclusions.
The behavioral effects reported are modest, as evident from the trial-by-trial data included in the supplemental figures. Although the authors interpret their findings as evidence that IL stimulation facilitates extinction only after prior inhibitory learning, this conclusion is not directly supported by their data. The experiments do not include a condition in which IL stimulation is delivered during extinction training alone, without prior inhibitory experience. Without this control, the claim that prior inhibitory memory is necessary for facilitation remains speculative.
The electrophysiological example provided shows that IL stimulation induces a sustained inhibition that outlasts the stimulation period. This prolonged suppression could potentially interfere with consolidation processes following tone presentation rather than facilitating them. The authors should consider and discuss this alternative interpretation in light of their behavioral data.
It is unfortunate that several animals had to be excluded after histological verification, but the resulting mismatch between groups remains a concern. Without a power analysis indicating the number of subjects required to achieve reliable effects, it is difficult to determine whether the modest behavioral differences reflect genuine biological variability or insufficient statistical power. Additional animals may be needed to properly address this imbalance.
Overall, while the manuscript is improved in clarity and methodological detail, the behavioral effects remain weak, and the mechanistic interpretation requires stronger experimental support and consideration of alternative explanations.
Reviewer #2 (Public review):
Summary:
In this manuscript, the authors examine the mechanisms by which stimulation of the infralimbic cortex (IL) facilitates the retention and retrieval of inhibitory memories. Previous work has shown that optogenetic stimulation of the IL suppresses freezing during extinction but does not improve extinction recall when extinction memory is probed one day later. When stimulation occurs during a second extinction session (following a prior stimulation-free extinction session), freezing is suppressed during the second extinction as well as during the tone test the following day. The current study was designed to further explore the facilitatory role of the IL in inhibitory learning and memory recall. The authors conducted a series of experiments to determine whether recruitment of IL extends to other forms of inhibitory learning (e.g., backward conditioning) and to inhibitory learning involving appetitive conditioning. Further, they assessed whether their effects could be explained by stimulus familiarity. The results of their experiments show that backward conditioning, another form of inhibitory learning, also enabled IL stimulation to enhance fear extinction. This phenomenon was not specific to aversive learning as backward appetitive conditioning similarly allowed IL stimulation to facilitate extinction of aversive memories. Finally, the authors ruled out the possibility that IL facilitated extinction merely because of prior experience with the stimulus (e.g., reducing the novelty of the stimulus). These findings significantly advance our understanding of the contribution of IL to inhibitory learning. Namely, they show that the IL is recruited during various forms of inhibitory learning and its involvement is independent of the motivational value associated with the unconditioned stimulus.
Strengths to highlight:
(1) Transparency about the inclusion of both sexes and the representation of data from both sexes in figures.
(2) Very clear representation of groups and experimental design for each figure.
(3) The authors were very rigorous in determining the neurobehavioral basis for the effects of IL stimulation on extinction. They considered multiple interpretations and designed experiments to address these possible accounts of their data.
(4) The rationale for and the design of the experiments in this manuscript are clearly based on a wealth of knowledge about learning theory. The authors leveraged this expertise to narrow down how the IL encodes and retrieves inhibitory memories.
Reviewer #3 (Public review):
Summary:
This is a really nice manuscript with different lines of evidence to show that the IL encodes inhibitory memories that can then be manipulated by optogenetic stimulation of these neurons during extinction. The behavioral designs are excellent, with converging evidence using extinction/re-extinction, backwards/forwards aversive conditioning, and backwards appetitive/forwards aversive conditioning. Additional factors, such as nonassociative effects of the CS or US, also are considered, and the authors evaluate the inhibitory properties of the CS with tests of conditioned inhibition. The authors have addressed the prior reviews. I still think it is unfortunate that the groups were not properly balanced in some of the figures (as noted by the authors, they were matched appropriately in real time, but some animals had to be dropped after histology, which caused some balancing issues). I think the overall pattern of results is compelling enough that more subjects do not need to be added, but it would still be nice to see more acknowledgement and statistical analyses of how these pre-existing differences may have impacted test performance.
Strengths:
The experimental designs are very rigorous with an unusual level of behavioral sophistication.
Weaknesses:
The various group differences in Figure 2 prior to any manipulation are still problematic. There was a reliable effect of subsequent group assignment in Figure 2 (p<0.05, described as "marginal" in multiple places). Then there are differences in extinction (nonsignificant at p=.07). The test difference between ReExt OFF/ON is identical to the difference at the end of extinction and the beginning of Forward 2, in terms of absolute size. I really don't think much can be made of the test result. The authors state in their response that this difference was not evident during the forward phase, but there clearly is a large ordinal difference on the first trial. I think it is appropriate to only focus on test differences when groups are appropriately matched, but when there are pre-existing differences (even when not statistically significant) then they really need to be incorporated into the statistical test somehow.
The same problem is evident in Figure 4B, but here the large differences in the Same groups are opposite to the test differences. It's hard to say how those large differences ultimately impacted the test results. I suppose it is good that the differences during Forward conditioning did not ultimately predict test differences, but this really should have been addressed with more subjects in these experiments. The authors explore the interactions appropriately but with n=6 in the various subgroups, it's not surprising that some of these effects were not detected statistically.
It is useful to see the trial-by-trial test data now presented in the supplement. I think the discussion does a good job of addressing the issues of retrieval, but the ideas of Estes about session cues that the authors bring up in their response haven't really held up over the years (e.g., Robbins, 1990, who explicitly tested this; other demonstrations of within-session spontaneous recovery), for what it's worth.
Author response:
The following is the authors’ response to the current reviews.
Public Reviews:
Reviewer #1 (Public review):
The revised manuscript presents an interesting and technically competent set of experiments exploring the role of the infralimbic cortex (IL) in extinction learning. The inclusion of histological validation in the supplemental material improves the transparency and credibility of the results, and the overall presentation has been clarified. However, several key issues remain that limit the strength of the conclusions.
We thank the Reviewer for their positive assessment of our revised manuscript. We discussed the issues raised by the Reviewer below.
The behavioral effects reported are modest, as evident from the trial-by-trial data included in the supplemental figures. Although the authors interpret their findings as evidence that IL stimulation facilitates extinction only after prior inhibitory learning, this conclusion is not directly supported by their data. The experiments do not include a condition in which IL stimulation is delivered during extinction training alone, without prior inhibitory experience. Without this control, the claim that prior inhibitory memory is necessary for facilitation remains speculative.
The manuscript provides evidence across five experiments (Figures 2-6) that IL stimulation fails to facilitate extinction training in the absence of prior inhibitory experience. We therefore remain confident that the data support our conclusion: prior inhibitory learning enables IL stimulation to facilitate subsequent inhibitory learning.
The electrophysiological example provided shows that IL stimulation induces a sustained inhibition that outlasts the stimulation period. This prolonged suppression could potentially interfere with consolidation processes following tone presentation rather than facilitating them. The authors should consider and discuss this alternative interpretation in light of their behavioral data.
The possibility that IL stimulation exerted its effects by interfering with consolidation processes is inconsistent with the literature. Disrupting consolidation processes in the IL impairs extinction learning (1), even when animals have prior inhibitory learning experience (2). Yet our experiments found that IL stimulation failed to interfere with initial extinction learning but instead facilitated subsequent learning. Furthermore, the electrophysiological example demonstrates that the inhibitory effect is transient: the cell returned to firing properties similar to those observed pre-stimulation, making it unlikely that inhibition persists during the consolidation window.
It is unfortunate that several animals had to be excluded after histological verification, but the resulting mismatch between groups remains a concern. Without a power analysis indicating the number of subjects required to achieve reliable effects, it is difficult to determine whether the modest behavioral differences reflect genuine biological variability or insufficient statistical power. Additional animals may be needed to properly address this imbalance.
As noted in the revised manuscript, we are confident about the reliability of the findings reported. The manuscript provides evidence across five experiments that IL stimulation fails to facilitate brief extinction in the absence of prior inhibitory experience, replicating previous findings (3, 4). The manuscript also replicates these prior studies by demonstrating that experience with either fear or appetitive extinction enables IL stimulation to facilitate subsequent fear extinction. Furthermore, the present experiments replicate the facilitative effects of IL stimulation following fear or appetitive backward conditioning.
Overall, while the manuscript is improved in clarity and methodological detail, the behavioral effects remain weak, and the mechanistic interpretation requires stronger experimental support and consideration of alternative explanations.
We respectfully disagree with the assertion that the reported results are weak. The manuscript replicates all main findings internally or reproduces findings from previously published studies. While alternative explanations cannot be entirely excluded, we are not aware of any competing account that predicts the pattern of results reported here.
Reviewer #2 (Public review):
Summary:
In this manuscript, the authors examine the mechanisms by which stimulation of the infralimbic cortex (IL) facilitates the retention and retrieval of inhibitory memories. Previous work has shown that optogenetic stimulation of the IL suppresses freezing during extinction but does not improve extinction recall when extinction memory is probed one day later. When stimulation occurs during a second extinction session (following a prior stimulation-free extinction session), freezing is suppressed during the second extinction as well as during the tone test the following day. The current study was designed to further explore the facilitatory role of the IL in inhibitory learning and memory recall. The authors conducted a series of experiments to determine whether recruitment of IL extends to other forms of inhibitory learning (e.g., backward conditioning) and to inhibitory learning involving appetitive conditioning. Further, they assessed whether their effects could be explained by stimulus familiarity. The results of their experiments show that backward conditioning, another form of inhibitory learning, also enabled IL stimulation to enhance fear extinction. This phenomenon was not specific to aversive learning as backward appetitive conditioning similarly allowed IL stimulation to facilitate extinction of aversive memories. Finally, the authors ruled out the possibility that IL facilitated extinction merely because of prior experience with the stimulus (e.g., reducing the novelty of the stimulus). These findings significantly advance our understanding of the contribution of IL to inhibitory learning. Namely, they show that the IL is recruited during various forms of inhibitory learning and its involvement is independent of the motivational value associated with the unconditioned stimulus.
We thank the Reviewer for their positive assessment.
Strengths to highlight:
(1) Transparency about the inclusion of both sexes and the representation of data from both sexes in figures
We thank the Reviewer for their positive assessment.
(2) Very clear representation of groups and experimental design for each figure
We thank the Reviewer for their positive assessment.
(3) The authors were very rigorous in determining the neurobehavioral basis for the effects of IL stimulation on extinction. They considered multiple interpretations and designed experiments to address these possible accounts of their data.
We thank the Reviewer for their positive assessment.
(4) The rationale for and the design of the experiments in this manuscript are clearly based on a wealth of knowledge about learning theory. The authors leveraged this expertise to narrow down how the IL encodes and retrieves inhibitory memories.
We thank the Reviewer for their positive assessment.
Reviewer #3 (Public review):
Summary:
This is a really nice manuscript with different lines of evidence to show that the IL encodes inhibitory memories that can then be manipulated by optogenetic stimulation of these neurons during extinction. The behavioral designs are excellent, with converging evidence using extinction/re-extinction, backwards/forwards aversive conditioning, and backwards appetitive/forwards aversive conditioning. Additional factors, such as nonassociative effects of the CS or US, also are considered, and the authors evaluate the inhibitory properties of the CS with tests of conditioned inhibition. The authors have addressed the prior reviews. I still think it is unfortunate that the groups were not properly balanced in some of the figures (as noted by the authors, they were matched appropriately in real time, but some animals had to be dropped after histology, which caused some balancing issues). I think the overall pattern of results is compelling enough that more subjects do not need to be added, but it would still be nice to see more acknowledgement and statistical analyses of how these pre-existing differences may have impacted test performance.
We thank the Reviewer for their positive assessment of our revised manuscript. We discussed the comments regarding group balancing below.
Strengths:
The experimental designs are very rigorous with an unusual level of behavioral sophistication.
We thank the Reviewer for their positive assessment
Weaknesses:
The various group differences in Figure 2 prior to any manipulation are still problematic. There was a reliable effect of subsequent group assignment in Figure 2 (p<0.05, described as "marginal" in multiple places). Then there are differences in extinction (nonsignificant at p=.07). The test difference between ReExt OFF/ON is identical to the difference at the end of extinction and the beginning of Forward 2, in terms of absolute size. I really don't think much can be made of the test result. The authors state in their response that this difference was not evident during the forward phase, but there clearly is a large ordinal difference on the first trial. I think it is appropriate to only focus on test differences when groups are appropriately matched, but when there are pre-existing differences (even when not statistically significant) then they really need to be incorporated into the statistical test somehow.
We carefully considered the Reviewer's suggestion, but it is not possible to adjust the statistical analyses at test because these analyses do not directly compare the two ReExt groups. Any scaling of performance would require including the two Ext groups, which is not feasible since these groups did not receive initial extinction. Moreover, the analyses provide no conclusive evidence of pre-existing differences between the two ReExt groups: the difference was not significant during initial extinction and was absent during the Forward 2 stage. We acknowledge that closer performance between the two ReExt groups during initial extinction would have been preferable. However, we remain confident in the results obtained because they replicate previous experiments in which the two ReExt groups displayed identical performance during initial extinction.
The same problem is evident in Figure 4B, but here the large differences in the Same groups are opposite to the test differences. It's hard to say how those large differences ultimately impacted the test results. I suppose it is good that the differences during Forward conditioning did not ultimately predict test differences, but this really should have been addressed with more subjects in these experiments. The authors explore the interactions appropriately but with n=6 in the various subgroups, it's not surprising that some of these effects were not detected statistically.
As the Reviewer noted, the unexpected differences in Figure 4B are opposite in direction to the test differences. Importantly, Figure 4B replicates the main findings from Figure 3, which did not show these unexpected differences.
It is useful to see the trial-by-trial test data now presented in the supplement. I think the discussion does a good job of addressing the issues of retrieval, but the ideas of Estes about session cues that the authors bring up in their response haven't really held up over the years (e.g., Robbins, 1990, who explicitly tested this; other demonstrations of within-session spontaneous recovery), for what it's worth.
We thank the Reviewer for bringing our attention to Robbins’ work on session cues. We understand that the issue of retrieval is important but as we noted before, our manuscript and its conclusions do not claim to differentiate retrieval from additional learning.
References
(1) K. E. Nett, R. T. LaLumiere, Infralimbic cortex functioning across motivated behaviors: Can the differences be reconciled Neurosci Biobehav Rev 131, 704–721 (2021).
(2) V. Laurent, R. F. Westbrook, Inactivation of the infralimbic but not the prelimbic cortex impairs consolidation and retrieval of fear extinction Learn Mem 16, 520–529 (2009).
(3) N. W. Lingawi, R. F. Westbrook, V. Laurent, Extinction and Latent Inhibition Involve a Similar Form of Inhibitory Learning that is Stored in and Retrieved from the Infralimbic Cortex Cereb Cortex 27, 5547–5556 (2017).
(4) N. W. Lingawi, N. M. Holmes, R. F. Westbrook, V. Laurent, The infralimbic cortex encodes inhibition irrespective of motivational significance Neurobiol Learn Mem 150, 64–74 (2018).
The following is the authors’ response to the original reviews.
Public Reviews:
Reviewer #1 (Public review):
Summary:
The manuscript reports a series of experiments designed to test whether optogenetic activation of infralimbic (IL) neurons facilitates extinction retrieval and whether this depends on animals' prior experience. In Experiment 1, rats underwent fear conditioning followed by either one or two extinction sessions, with IL stimulation given during the second extinction; stimulation facilitated extinction retrieval only in rats with prior extinction experience. Experiments 2 and 3 examined whether backward conditioning (CS presented after the US) could establish inhibitory properties that allowed IL stimulation to enhance extinction, and whether this effect was specific to the same stimulus or generalized to different stimuli. Experiments 5 - 7 extended this approach to appetitive learning: rats received backward or forward appetitive conditioning followed by extinction, and then fear conditioning, to determine whether IL stimulation could enhance extinction in contexts beyond aversive learning and across conditioning sequences. Across studies, the key claim is that IL activation facilitates extinction retrieval only when animals possess a prior inhibitory memory, and that this effect generalizes across aversive and appetitive paradigms.
Strengths:
(1) The design attempts to dissect the role of IL activity as a function of prior learning, which is conceptually valuable.
We thank the Reviewer for their positive assessment.
(2) The experimental design of probing different inhibitory learning approaches to probe how IL activation facilitates extinction learning was creative and innovative.
We thank the Reviewer for their positive assessment.
Weaknesses:
(1) Non-specific manipulation.
ChR2 was expressed in IL without distinction between glutamatergic and GABAergic populations. Without knowing the relative contribution of these cell types or the percentage of neurons affected, the circuit-level interpretation of the results is unclear.
ChR2 was intentionally expressed in the infralimbic cortex (IL) without distinction between local neuronal populations for two reasons. First, the primary aim of this was to uncover some of the features characterizing the encoding of inhibitory memories in the IL, and this encoding likely engages interactions among various neuronal populations within the IL. Second, the hypotheses tested in the manuscript derived from findings that indiscriminately stimulated the IL using the GABA<sub>A</sub> receptor antagonist picrotoxin, which is best mimicked by the approach taken. We agree that it is also important to determine the respective contributions of distinct IL neuronal populations to inhibitory encoding; however, the global approach implemented in the present experiments represents a necessary initial step. These matters have been incorporated in the Discussion of the revised manuscript.
(2) Extinction retrieval test conflates processes
The retrieval test included 8 tones. Averaging across this many tone presentations conflate extinction retrieval/expression (early tones) with further extinction learning (later tones). A more appropriate analysis would focus on the first 2-4 tones to capture retrieval only. As currently presented, the data do not isolate extinction retrieval.
It is unclear when retrieval of what has been learned across extinction ceases and additional extinction learning occurs. In fact, it is only the first stimulus presentation that unequivocally permits a distinction between retrieval and additional extinction learning, as the conditions for this additional learning have not been fulfilled at that presentation. However, confining evidence for retrieval to the first stimulus presentation introduces concerns that other factors could influence performance. For instance, processing of the stimulus present at the start of the session may differ from that present at the end of the previous session, thereby affecting what is retrieved. Such differences between the stimuli present at the start and end of an extinction session have been long recognized as a potential explanation for spontaneous recovery (Estes, 1955). More importantly, whether the test data presented confound retrieval and additional extinction learning or not, the interpretation remains the same with respect to the effects of a prior history of inhibitory learning on enabling the facilitative effects of IL stimulation. Finally, it is unclear how these facilitative effects could occur in the absence of the subjects retrieving the extinction memory formed under the stimulation. Nevertheless, the revised manuscript now provides the trial-by-trial performance (see Supplemental Figure 3) during the post-extinction retrieval tests and addresses this issue in the Discussion.
(3) Under-sampling and poor group matching.
Sample sizes appear small, which may explain why groups are not well matched in several figures (e.g., 2b, 3b, 6b, 6c) and why there are several instances of unexpected interactions (protocol, virus, and period). This baseline mismatch raises concerns about the reliability of group differences.
Efforts were made to match group performance upon completion of each training stage and before IL stimulation. Unfortunately, these efforts were not completely successful due to exclusions following post-mortem analyses. This has been made explicit in the revised manuscript (Materials and Methods, Subjects section). However, we acknowledge that the unexpected interactions deserve further discussion, and this has been incorporated into the revised manuscript (see also comment from Reviewer 2). Although we cannot exclude the possibility that sample sizes may have contributed to some of these interactions, we remain confident about the reliability of the main findings reported, especially given their replication across the various protocols. Overall, the manuscript provides evidence that IL stimulation does not facilitate brief extinction in the absence of prior inhibitory experience in five different experiments, replicating previous findings (Lingawi et al., 2018; Lingawi et al., 2017). It also replicates these previous findings by showing that prior experience with either fear or appetitive extinction enables IL stimulation to facilitate subsequent fear extinction. Furthermore, the facilitative effects of such stimulation following fear or appetitive backward conditioning are replicated in the present manuscript. This is discussed in the Discussion of the revised manuscript.
(4) Incomplete presentation of conditioning data
Figure 3 only shows a single conditioning session despite five days of training. Without the full dataset, it is difficult to evaluate learning dynamics or whether groups were equivalent before testing.
We apologize, as we incorrectly labeled the X axis for the backward conditioning data in Figures 3B, 4B, 4D and 5B. It should have indicated “Days” instead of “Trials”. This error has been corrected in the revised manuscript (see also second comment from Reviewer 2).
(5) Interpretation stronger than evidence.
The authors conclude that IL activation facilitates extinction retrieval only when an inhibitory memory has been formed. However, given the caveats above, the data are insufficient to support such a strong mechanistic claim. The results could reflect nonspecific facilitation or disruption of behavior by broad prefrontal activation. Moreover, there is compelling evidence that optogenetic activation of IL during fear extinction does facilitate subsequent extinction retrieval without prior extinction training (DoMonte et al 2015, Chen et al 2021), which the authors do not directly test in this study.
As noted above, the interpretations of the main findings stand whether the test data confounds retrieval with additional extinction learning or not. The revised manuscript also clarifies the plotting of the data for the backward conditioning stages. We do agree that further discussion of the unexpected interactions is necessary, and this has been incorporated into the revised manuscript. However, the various replications of the core findings provide strong evidence for their reliability and the interpretations advanced in the original manuscript. The proposal that the results reflect non-specific facilitation or disruption of behavior seems highly unlikely. Indeed, the present experiments and previous findings (Lingawi et al., 2018; Lingawi et al., 2017) provide multiple demonstrations that IL stimulation fails to produce any facilitation in the absence of prior inhibitory experience with the target stimulus. Although these demonstrations appear inconsistent with previous studies (Do-Monte et al., 2015; Chen et al., 2021), this inconsistency is likely explained by the fact that these studies manipulated activity in specific IL neuronal populations. Previous work has already revealed differences between manipulations targeting discrete IL neuronal populations as opposed to general IL activity (Kim et al., 2016). Importantly, as previously noted, the present manuscript aimed to generally explore inhibitory encoding in the IL that is likely to engage several neuronal populations within the IL. Adequate statements on these matters have been included in the Discussion of the revised manuscript.
Reviewer #2 (Public review):
Summary:
In this manuscript, the authors examine the mechanisms by which stimulation of the infralimbic cortex (IL) facilitates the retention and retrieval of inhibitory memories. Previous work has shown that optogenetic stimulation of the IL suppresses freezing during extinction but does not improve extinction recall when extinction memory is probed one day later. When stimulation occurs during a second extinction session (following a prior stimulation-free extinction session), freezing is suppressed during the second extinction as well as during the tone test the following day. The current study was designed to further explore the facilitatory role of the IL in inhibitory learning and memory recall. The authors conducted a series of experiments to determine whether recruitment of IL extends to other forms of inhibitory learning (e.g., backward conditioning) and to inhibitory learning involving appetitive conditioning. Further, they assessed whether their effects could be explained by stimulus familiarity. The results of their experiments show that backward conditioning, another form of inhibitory learning, also enabled IL stimulation to enhance fear extinction. This phenomenon was not specific to aversive learning, as backward appetitive conditioning similarly allowed IL stimulation to facilitate extinction of aversive memories. Finally, the authors ruled out the possibility that IL facilitated extinction merely because of prior experience with the stimulus (e.g., reducing the novelty of the stimulus). These findings significantly advance our understanding of the contribution of IL to inhibitory learning. Namely, they show that the IL is recruited during various forms of inhibitory learning, and its involvement is independent of the motivational value associated with the unconditioned stimulus.
Strengths:
(1) Transparency about the inclusion of both sexes and the representation of data from both sexes in figures.
We thank the Reviewer for their positive assessment.
(2) Very clear representation of groups and experimental design for each figure.
We thank the Reviewer for their positive assessment.
(3) The authors were very rigorous in determining the neurobehavioral basis for the effects of IL stimulation on extinction. They considered multiple interpretations and designed experiments to address these possible accounts of their data.
We thank the Reviewer for their positive assessment.
(4) The rationale for and the design of the experiments in this manuscript are clearly based on a wealth of knowledge about learning theory. The authors leveraged this expertise to narrow down how the IL encodes and retrieves inhibitory memories.
We thank the Reviewer for their positive assessment.
Weaknesses:
(1) In Experiment 1, although not statistically significant, it does appear as though the stimulation groups (OFF and ON) differ during Extinction 1. It seems like this may be due to a difference between these groups after the first forward conditioning. Could the authors have prevented this potential group difference in Extinction 1 by re-balancing group assignment after the first forward conditioning session to minimize the differences in fear acquisition (the authors do report a marginally significant effect between the groups that would undergo one vs. two extinction sessions in their freezing during the first conditioning session)?
Efforts were made daily to match group performance across the training stages, but these efforts were ultimately hampered by the necessary exclusions following postmortem analyses. This has been made explicit in the revised manuscript (Materials and Methods, Subjects section). Regarding freezing during Extinction 1, as noted by the Reviewer, the difference, which was not statistically significant, was absent across trials during the subsequent forward fear conditioning stage. Likewise, the protocol difference observed during the initial forward fear conditioning was absent in subsequent stages. We are therefore confident that these initial differences (significant or not) did not impact the main findings at test. Importantly, these findings replicate previous work using identical protocols in which no differences were present during the training stages. These considerations have been addressed in the revised manuscript (see Results for Experiment 1).
(2) Across all experiments (except for Experiment 1), the authors state that freezing during the initial conditioning increased across "days". The figures that correspond to this text, however, show that freezing changes across trials. In the methods, the authors report that backward conditioning occurred over 5 days. It would be helpful to understand how these data were analyzed and collated to create the final figures. Was the freezing averaged across the five days for each trial for analyses and figures?
We apologize, as noted above, for having incorrectly labeled the X axis across the backward conditioning data sets in Figures 3B, 4B, 4D and 5B. It should have indicated “Days” instead of “Trials”. The data shown in these Figures use the average of all trials on a given day. This has been clarified in the methods section of the revised manuscript (Statistical Analyses section). The labeling errors on the Figures have been corrected.
(3) In Experiment 3, the authors report a significant Protocol X Virus interaction. It would be useful if the authors could conduct post-hoc analyses to determine the source of this interaction. Inspection of Figure 4B suggests that freezing during the two different variants of backward conditioning differs between the virus groups. Did the authors expect to see a difference in backward conditioning depending on the stimulus used in the conditioning procedure (light vs. tone)? The authors don't really address this confounding interaction, but I do think a discussion is warranted.
We agree with the Reviewer that further discussion of the Protocol x Virus interaction that emerged during the backward conditioning and forward conditioning stages of Experiment 3 is warranted. This discussion has been provided in the revised manuscript (see Results section). Briefly, during both stages, follow-up analyses did not reveal any differences (main effects or interactions) between the two groups trained with the light stimulus (Diff-EYFP and Diff-ChR2). By contrast, the ChR2 group trained with the tone (Back-ChR2) froze more overall than the EYFP group (Back-EYFP), but there were no other significant differences between the two groups. Based on these analyses, the Protocol x Virus interaction appears to be driven by greater freezing in the ChR2 group trained with the tone rather than a difference in the backward conditioning performance based on stimulus identity. Consistent with this, the statistical analyses did not reveal a main effect of Protocol during either the backward conditioning stage or the stimulus trials during the forward conditioning stage. Nevertheless, during this latter stage, a main effect of Protocol emerged during baseline performance, but once again, this seems to be driven by the Back-ChR2 group. Critically, it is unclear how greater stimulus freezing in the Back-ChR2 group during forward conditioning would lead to lower freezing during the post-extinction retrieval test.
We note that an unexpected Protocol x Period interaction was found during appetitive backward conditioning in Experiment 5. For consistency, we conducted additional analyses to determine the source of this interaction (see Results section). As previously noted, performance during appetitive backward conditioning is noisy and cannot be taken as a failure to generate inhibitory learning. It is therefore unlikely that this interaction implied a difference in such learning.
(4) In this same experiment, the authors state that freezing decreased during extinction; however, freezing in the Diff-EYFP group at the start of extinction (first bin of trials) doesn't look appreciably different than their freezing at the end of the session. Did this group actually extinguish their fear? Freezing on the tone test day also does not look too different from freezing during the last block of extinction trials.
We confirm that overall, there was a significant decline in freezing across the extinction session shown in Figure 4B. The Reviewer is correct to point out that this decline was modest (if not negligible) in the Diff-EYFP group, which was receiving its first inhibitory training with the target tone stimulus. It is worth noting that across all experiments, most groups that did not receive infralimbic stimulation displayed a modest decline in freezing during the extinction session since it was relatively brief, involving only 6 or 8 tone alone presentations. This was intentional, as we aimed for the brief extinction session to generate minimal inhibitory learning and thereby to detect any facilitatory effect of infralimbic stimulation. This has been clarified and explained in the revised version of the manuscript (see Results section, description of Experiment 1).
(5) The Discussion explored the outcomes of the experiments in detail, but it would be useful for the authors to discuss the implications of their findings for our understanding of circuits in which the IL is embedded that are involved in inhibitory learning and memory. It would also be useful for the authors to acknowledge in the Discussion that although they did not have the statistical power to detect sex differences, future work is needed to explore whether IL functions similarly in both sexes.
In line with the Reviewer’s suggestion (see also Reviewer 3), the Discussion section has been substantially altered in the revised manuscript. Among other things, it does mention that future studies will need to examine the role of additional brain regions in the effects reported and it acknowledges the need to further explore sex differences and IL functions.
Reviewer #3 (Public review):
Summary:
This is a really nice manuscript with different lines of evidence to show that the IL encodes inhibitory memories that can then be manipulated by optogenetic stimulation of these neurons during extinction. The behavioral designs are excellent, with converging evidence using extinction/re-extinction, backwards/forwards aversive conditioning, and backwards appetitive/forwards aversive conditioning. Additional factors, such as nonassociative effects of the CS or US, are also considered, and the authors evaluate the inhibitory properties of the CS with tests of conditioned inhibition.
Strengths:
The experimental designs are very rigorous with an unusual level of behavioral sophistication.
We thank the Reviewer for their positive assessment
Weaknesses:
(1) More justification for parametric choices (number of days of backwards vs forwards conditioning) could be provided.
All experimental parameters were based on previously published experiments showing the capacity of the backward conditioning protocols to generate inhibitory learning and the forward conditioning protocols to produce excitatory learning. Although this was mentioned in the methods section, we acknowledge that further explanation was required to justify the need for multiple days of backward training. This has been provided in the revised manuscript (see Results section and description of the backward parameters.
(2) The current discussion could be condensed and could focus on broader implications for the literature.
The discussion has been severely condensed and broader implications have been discussed with respect to the existing literature looking at the neural circuitry underlying inhibitory learning.
Recommendations for the authors:
Reviewer #1 (Recommendations for the authors):
(1) Re-analyze extinction retrieval, focusing only on the first 2-4 tones to capture extinction expression.
This recommendation corresponds to the second public comment made by the Reviewer, and we have replied to this comment.
(2) Directly test whether activation of IL during fear extinction is insufficient to facilitate extinction retrieval without prior extinction training.
The manuscript provides five separate demonstrations that the optogenetic approach to stimulate IL activity did not facilitate the initial brief extinction session. This reproduces what had been found with indiscriminate pharmacological stimulation in our previous research (Lingawi et al., 2018; Lingawi et al., 2017). We appreciate that other work that stimulated specific IL neuronal populations has observed facilitation of extinction but, the present manuscript focuses on the role of all IL neuronal populations in encoding inhibitory memories. The Reviewer’s request would imply contrasting the role of various neuronal populations, which is beyond the scope of this manuscript. Nevertheless, we have modified our discussion to indicate that future research should establish which IL neuronal population(s) contribute to the effects reported here.
(3) Show the percentage of neurons that exhibit excitatory or inhibitory responses in IL after non-specific optogenetic activation to better understand how this manipulation is affecting IL circuitry.
All electrophysiological recordings (n = 10 cells) are presented in Figure 1C. ChR2 excitation was substantial and overwhelming. Based on the physiological and morphological characteristics of the recorded cells, one was non-pyramidal and was excited by LED light delivery. The remaining 9 cells were pyramidal. One did not respond to LED delivery, but we cannot exclude the possibility that this was due to a lack of ChR2 expression in the somatic compartment. Another cell showed a mild reduction in activity following LED stimulation, while the remaining 7 cells displayed clear excitation upon LED stimulation. We have modified our manuscript to reflect these observations. We did not include percentages since only 10 recordings are shown.
(4) Present data from all five conditioning sessions, not just one, to allow evaluation of learning history.
This recommendation corresponds to the fourth public comment made by the Reviewer, and we have replied to this comment.
(5) Address the issue of small and poorly matched groups, particularly in Figures 2b, 3b, 6b, and 6c.
This recommendation corresponds to the third public comment made by the Reviewer, and we have replied to this comment.
(6) Temper the conclusions to reflect the limitations of sampling, group matching, and the lack of specificity in the manipulation.
We have modified our Discussion to address potential issues related to sampling and group matching. However, we are unsure how the lack of specificity of the IL stimulation has any impact on the interpretations made, since no statement is made about neuronal specificity. That said, as noted above, “we have modified our discussion to indicate that future research should establish which IL neuronal population(s) contribute to the effects reported here”.
Reviewer #2 (Recommendations for the authors):
Nothing additional to include beyond what is written for public view.
Reviewer #3 (Recommendations for the authors):
This is a really nice manuscript with different lines of evidence to show that the IL encodes inhibitory memories that can then be manipulated by optogenetic stimulation of these neurons during extinction. The behavioral designs are excellent, with converging evidence using extinction/re-extinction, backwards/forwards aversive conditioning, and backwards appetitive/forwards aversive conditioning. Additional factors, such as nonassociative effects of the CS or US, are also considered, and the authors evaluate the inhibitory properties of the CS with tests of conditioned inhibition. I only have a couple of comments that the authors may want to consider.
We thank the Reviewer for their positive assessment.
First, in Figure 2, it is unfortunate that there is a general effect of the LED assignment before the LED experience (p=.07 during that first extinction session). This is in the same direction as the difference during the test, so it is not clear that the test difference really reflects differences due to Extinction 2 treatment or to preexisting differences based on group assignments.
The Reviewer’s comment is identical to the first public comment of Reviewer 2, which has been addressed.
Second, it is notable that the backwards fear conditioning phase was conducted over 5 days, but the forward conditioning phase was conducted over one day. The rationale for these differences should be presented. There is an old idea going back to Konorski that backwards conditioning may lead to excitation initially, and it is only after more extensive trials that inhibitory conditioning occurs (a finding supported by Heth, 1976). Some discussion of the potential biphasic nature of backwards conditioning would be useful, especially for people who want to run this type of experiment but with only a single session of backwards conditioning.
In line with the Reviewer’s suggestion, the revised manuscript (see results section) provide an explanation for conducting backward conditioning across multiple days.
Third, as written, each paragraph of the discussion is mostly a recapitulation of the findings from each experiment. This could be condensed significantly, and it would be nice to see more integration with the current literature and how these results challenge or suggest nuance in current thinking about IL function.
We have significantly condensed the recapitulation of our findings in the Discussion of the revised manuscript. The Discussion now dedicates space to address comments from the other Reviewers and integrate the present findings with the current literature.
References
Chen, Y.-H., Wu, J.-L., Hu, N.-Y., Zhuang, J.-P., Li, W.-P., Zhang, S.-R., Li, X.-W., Yang, J.-M., & Gao, T.-M. (2021). Distinct projections from the infralimbic cortex exert opposing effects in modulating anxiety and fear. J Clin Invest, 131(14), e145692. https://doi.org/10.1172/JCI145692
Do-Monte, F. H., Manzano-Nieves, G., Quiñones-Laracuente, K., Ramos-Medina, L., & Quirk, G. J. (2015). Revisiting the role of infralimbic cortex in fear extinction with optogenetics. J Neurosci, 35(8), 3607-3615. https://doi.org/10.1523/JNEUROSCI.3137-14.2015
Estes, W. K. (1955). Statistical theory of spontaneous recovery and regression. Psychol Rev, 62(3), 145-154. https://doi.org/10.1037/h0048509
Kim, H.-S., Cho, H.-Y., Augustine, G. J., & Han, J.-H. (2016). Selective Control of Fear Expression by Optogenetic Manipulation of Infralimbic Cortex after Extinction. Neuropsychopharmacology, 41(5), 1261-1273. https://doi.org/10.1038/npp.2015.276
Lingawi, N. W., Holmes, N. M., Westbrook, R. F., & Laurent, V. (2018). The infralimbic cortex encodes inhibition irrespective of motivational significance. Neurobiol Learn Mem, 150, 64-74. https://doi.org/10.1016/j.nlm.2018.03.001
Lingawi, N. W., Westbrook, R. F., & Laurent, V. (2017). Extinction and Latent Inhibition Involve a Similar Form of Inhibitory Learning that is Stored in and Retrieved from the Infralimbic Cortex. Cereb Cortex, 27(12), 5547-5556.
eLife Assessment
This valuable study introduces CAAMO, a computational framework that combines structure prediction, in silico mutagenesis, molecular simulations, and energy calculations to design RNA aptamers with improved binding affinity. The computational methodology is solid, demonstrating strong theoretical foundations and systematic integration of multiple prediction techniques. However, the experimental validation is incomplete, with methodological weaknesses that limit the strength of support for the computational predictions.
Reviewer #4 (Public review):
Summary:
The authors demonstrate a computational rational design approach for developing RNA aptamers with improved binding to the Receptor Binding Domain (RBD) of the SARS-CoV-2 spike protein. They demonstrate the ability of their approach to improve binding affinity using a previously identified RNA aptamer, RBD-PB6-Ta, which binds to the RBD. They also computationally estimate the binding energies of various RNA aptamers with the RBD and compare against RBD binding energies for a few neutralizing antibodies from the literature. Finally, experimental binding affinities are estimated by electrophoretic mobility shift assays (EMSA) for various RNA aptamers and a single commercially available neutralizing antibody to support the conclusions from computational studies on binding. The authors conclude that their computational framework, CAAMO, can provide reliable structure predictions and effectively support rational design of improved affinity for RNA aptamers towards target proteins. Additionally, they claim that their approach achieved design of high affinity RNA aptamer variants that bind to the RBD as well or better than a commercially available neutralizing antibody.
Strengths:
The thorough computational approaches employed in the study provide solid evidence of the value of their approach for computational design of high affinity RNA aptamers. The theoretical analysis using Free Energy Perturbation (FEP) to estimate relative binding energies supports the claimed improvement of affinity for RNA aptamers and provides valuable insight into the binding model for the tested RNA aptamers in comparison to previously studied neutralizing antibodies. The multimodal structure prediction in the early stages of the presented CAAMO framework, combined with the demonstrated outcome of improved affinity using the structural predictions as a starting point for rational design, provide moderate confidence in the structure predictions.
Weaknesses:
The experimental characterization of RBD affinities for the antibody and RNA aptamers in this study present serious concerns regarding the methods used and the data presented in the manuscript, which call into question the major conclusions regarding affinity towards the RBD for their aptamers compared to antibodies. The claim that structural predictions from CAAMO are reasonable is rational, but this claim would be significantly strengthened by experimental validation of the structure (i.e. by chemical footprinting or solving the RBD-aptamer complex structure).
The conclusions in this work are somewhat supported by the data, but there are significant issues with experimental methods that limit the strength of the study's conclusions.
(1) The EMSA experiments have a number of flaws that limit their interpretability. The uncropped electrophoresis images, which should include molecular size markers and/or positive and negative controls for bound and unbound complex components to support interpretation of mobility shifts, are not presented. In fact, a spliced image can be seen for Figure 4E, which limits interpretation without the full uncropped image. Additionally, he volumes of EMSA mixtures are not presented when a mass is stated (i.e. for the methods used to create Figure 3D), which leaves the reader without the critical parameter, molar concentration, and therefore leaves in question the claim that the tested antibody is high affinity under the tested conditions. Additionally, protein should be visualized in all gels as a control to ensure that lack of shifts is not due to absence/aggregation/degradation of the RBD protein. In the case of Figure 3E, for example, it can be seen that there are degradation products included in the RBD-only lane, introducing a reasonable doubt that the lack of a shift in RNA tests (i.e. Figure 2F) is conclusively due to a lack of binding. Finally, there is no control for nonspecific binding, such as BSA or another non-target protein, which fails to eliminate the possibility of nonspecific interactions between their designed aptamers and proteins in general. A nonspecific binding control should be included in all EMSA experiments.
(2) The evidence supporting claims of better binding to RBD by the aptamer compared to the commercial antibody is flawed at best. The commercial antibody product page indicates an affinity in low nanomolar range, whereas the fitted values they found for the aptamers in their study are orders of magnitude higher at tens of micromolar. Moreover, the methods section is lacking in the details required to appropriately interpret the competitive binding experiments. With a relatively short 20-minute equilibration time, the order of when the aptamer is added versus the antibody makes a difference in which is apparently bound. The issue with this becomes apparent with the lack of internal consistency in the presented results, namely in comparing Fig 3E (which shows no interference of Ta binding with 5uM antibody) and Fig 5D (which shows interference of Ta binding with 0.67-1.67uM antibody). The discrepancy between these figures calls into question the methods used, and it necessitates more details regarding experimental methods used in this manuscript.
(3) The utility of the approach for increasing affinity of RNA aptamers for their targets is well supported through computational and experimental techniques demonstrating relative improvements in binding affinity for their G34C variant compared to the starting Ta aptamer. While the EMSA experiments do have significant flaws, the observations of relative relationships in equilibrium binding affinities among the tested aptamer variants can be interpreted with reasonable confidence, given that they were all performed in a consistent manner.
(4) The claim that the structure of the RBD-Aptamer complex predicted by the CAAMO pipeline is reliable is tenuous. The success of their rational design approach based on the structure predicted by several ensemble approaches supports the interpretation of the predicted structure as reasonable, however, no experimental validation is undertaken to assess the accuracy of the structure. This is not a main focus of the manuscript, given the applied nature of the study to identify Ta variants with improved binding affinity, however the structural accuracy claim is not strongly supported without experimental validation (i.e. chemical footprinting methods).
(5) Throughout the manuscript, the phrasing of "all tested antibodies" was used, despite there being only one tested antibody in experimental methods and three distinct antibodies in computational methods. While this concern is focused on specific language, the major conclusion that their designed aptamers are as good or better than neutralizing antibodies in general is weakened by only testing only three antibodies through computational binding measurements and a fourth single antibody for experimental testing. The contact residue mapping furthermore lacks clarity in the number of structures that were used, with a vague description of structures from the PDB including no accession numbers provided nor how many distinct antibodies were included for contact residue mapping.
Overall, the manuscript by Yang et al presents a valuable tool for rational design of improved RNA aptamer binding affinity toward target proteins, which the authors call CAAMO. Notably, the method is not intended for de novo design, but rather as a tool for improving aptamers that have been selected for binding affinity by other methods such as SELEX. While there are significant issues in the conclusions made from experiments in this manuscript, the relative relationships of observed affinities within this study provide solid evidence that the CAAMO framework provides a valuable tool for researchers seeking to use rational design approaches for RNA aptamer affinity maturation.
Author response:
The following is the authors’ response to the current reviews.
Reviewer #4 (Public review):
Summary:
The authors demonstrate a computational rational design approach for developing RNA aptamers with improved binding to the Receptor Binding Domain (RBD) of the SARS-CoV-2 spike protein. They demonstrate the ability of their approach to improve binding affinity using a previously identified RNA aptamer, RBD-PB6-Ta, which binds to the RBD. They also computationally estimate the binding energies of various RNA aptamers with the RBD and compare against RBD binding energies for a few neutralizing antibodies from the literature. Finally, experimental binding affinities are estimated by electrophoretic mobility shift assays (EMSA) for various RNA aptamers and a single commercially available neutralizing antibody to support the conclusions from computational studies on binding. The authors conclude that their computational framework, CAAMO, can provide reliable structure predictions and effectively support rational design of improved affinity for RNA aptamers towards target proteins. Additionally, they claim that their approach achieved design of high affinity RNA aptamer variants that bind to the RBD as well or better than a commercially available neutralizing antibody.
Strengths:
The thorough computational approaches employed in the study provide solid evidence of the value of their approach for computational design of high affinity RNA aptamers. The theoretical analysis using Free Energy Perturbation (FEP) to estimate relative binding energies supports the claimed improvement of affinity for RNA aptamers and provides valuable insight into the binding model for the tested RNA aptamers in comparison to previously studied neutralizing antibodies. The multimodal structure prediction in the early stages of the presented CAAMO framework, combined with the demonstrated outcome of improved affinity using the structural predictions as a starting point for rational design, provide moderate confidence in the structure predictions.
We thank the reviewer for this accurate summary and for recognizing the strength of our integrated computational–experimental workflow in improving aptamer affinity.
Weaknesses:
The experimental characterization of RBD affinities for the antibody and RNA aptamers in this study present serious concerns regarding the methods used and the data presented in the manuscript, which call into question the major conclusions regarding affinity towards the RBD for their aptamers compared to antibodies. The claim that structural predictions from CAAMO are reasonable is rational, but this claim would be significantly strengthened by experimental validation of the structure (i.e. by chemical footprinting or solving the RBD-aptamer complex structure).
The conclusions in this work are somewhat supported by the data, but there are significant issues with experimental methods that limit the strength of the study's conclusions.
(1) The EMSA experiments have a number of flaws that limit their interpretability. The uncropped electrophoresis images, which should include molecular size markers and/or positive and negative controls for bound and unbound complex components to support interpretation of mobility shifts, are not presented. In fact, a spliced image can be seen for Figure 4E, which limits interpretation without the full uncropped image.
Thank you for your valuable comments and careful review.
In response to your suggestion, we will provide all uncropped electrophoresis raw images corresponding to the results in the main figures and supplementary figures (Figure 2F, 3D, 3E, 4E, S9A and S10 of the original manuscript) in the revised version. Regarding the spliced image in Figure 4E, the uncropped raw gel image clearly shows that the two C23U samples were run on an adjacent lane of the same gel due to the total number of samples exceeding the well capacity of a single lane. All samples were electrophoresed and signal-detected under identical experimental conditions in one single experiment, ensuring the validity of direct signal intensity comparison across all samples. These complete uncropped raw images will be supplemented in the revised manuscript as Figure S12 (also see Author response image 1).
Author response image 1.
Uncropped electrophoresis images corresponding to Figures 2F, 3D, 3E, 4E, S9A and S10 of the original manuscript.
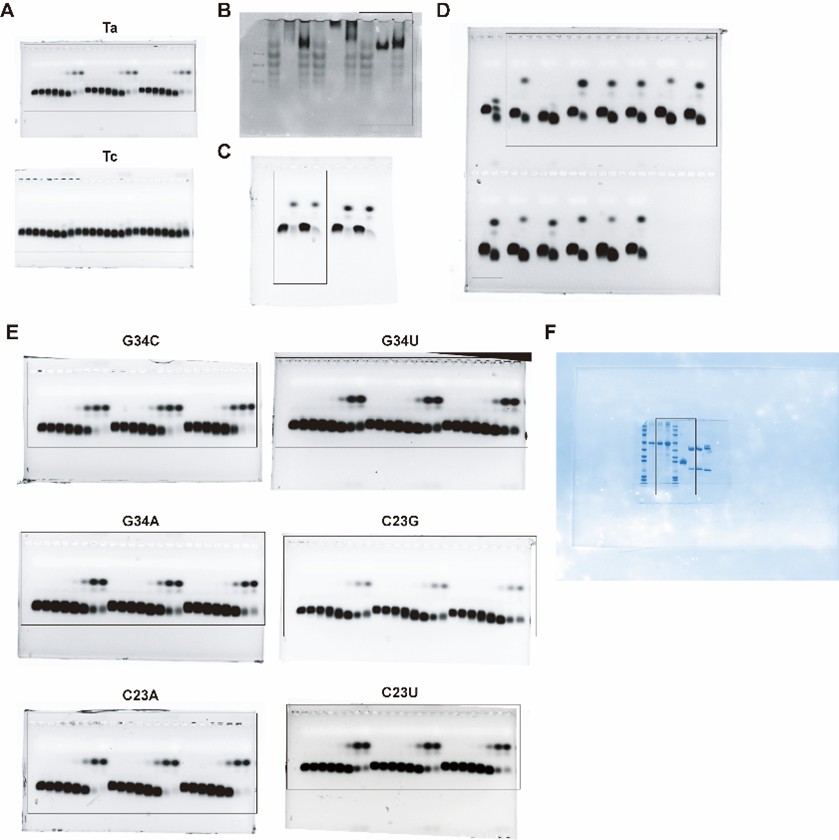
Additionally, he volumes of EMSA mixtures are not presented when a mass is stated (i.e. for the methods used to create Figure 3D), which leaves the reader without the critical parameter, molar concentration, and therefore leaves in question the claim that the tested antibody is high affinity under the tested conditions.
Thank you for your valuable comment on this oversight.
For the EMSA assay in Figure 3D, the reaction mixture (10 μL total volume) contained 3 μg of RBD protein and 3 μg of antibody (40592-R001), either individually or in combination, with incubation at room temperature for 20 minutes. Based on the molecular weights (35 kDa for RBD and 150 kDa for the IgG antibody), the corresponding molar concentrations in the mixture were calculated as 8.57 μM for RBD and 2 μM for the antibody. To ensure consistency, clarity and provide the critical molar concentration parameter, we will revise the legend of Figure 3D, replacing the mass values with the calculated molar concentrations as you suggested in the revised manuscript.
Additionally, protein should be visualized in all gels as a control to ensure that lack of shifts is not due to absence/aggregation/degradation of the RBD protein. In the case of Figure 3E, for example, it can be seen that there are degradation products included in the RBD-only lane, introducing a reasonable doubt that the lack of a shift in RNA tests (i.e. Figure 2F) is conclusively due to a lack of binding.
We sincerely appreciate your careful evaluation of our work, which helps us further clarify the experimental details and data reliability.
First, we would like to clarify the nature of the gel electrophoresis in Figure 3E: the RBD protein was separated by native-PAGE rather than denaturing SDS-PAGE. The RBD protein used in all experiments was purchased from HUABIO (Cat. No. HA210064) with guaranteed quality, and its integrity and purity were independently verified in our laboratory via denaturing SDS-PAGE (see Author response image 2), which showed a single, intact band without any degradation products. The ladder-like bands observed in the RBD-only lane of the native-PAGE gel are not a result of protein degradation. Instead, they arise from two well-characterized properties of recombinant SARS-CoV-2 Spike RBD protein expressed in human cells: intrinsic conformational heterogeneity (the RBD domain exists in multiple dynamic conformations due to its structural flexibility) (Cai et al., Science, 2020; Wrapp et al., Science, 2020) and heterogeneity in N-glycosylation modification (variable glycosylation patterns at the conserved N-glycosylation sites of RBD) (Casalino et al., ACS Cent. Sci., 2020; Ives et al., eLife, 2024), both of which could cause distinct migration bands in native-PAGE under non-denaturing conditions.
Second, to ensure the reliability of the RNA-binding results, the EMSA experiments for determining the binding affinity (K<sub>d</sub>) of RBD to Ta, Tc and Ta variants were performed with three independent biological replicates (the original manuscript includes all replicate data in Figure 2F and S9). Consistent results were obtained across all replicates, which effectively rules out false-negative outcomes caused by accidental absence or loss of functional RBD protein in the reaction system. In addition, our gel images (Figure 2F and S9 in the original manuscript) and uncropped raw images of all EMSA gels (see Author response image 1) show no significant signal accumulation in the sample wells, confirming the absence of RBD protein aggregation in the binding reactions—an issue that would otherwise interfere with RNA-protein interaction and band shift detection.
New results for RBD analysis by denaturing SDS-PAGE, along with the associated discussion, will be added to the revised manuscript as Figure S10 (also see Author response image 2).
Author response image 2.
SDS-PAGE analysis of the SARS-CoV-2 Spike RBD protein, neutralizing antibody (40592-R001) and BSA reference. This gel validates the high purity and structural integrity of the commercially sourced RBD protein and neutralizing antibody used in this study.
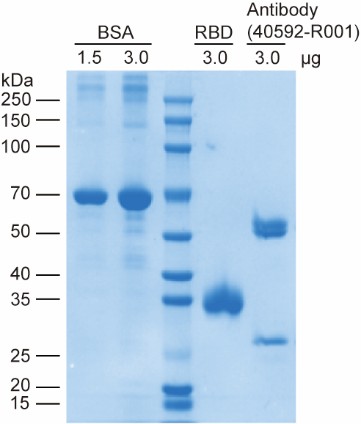
References
Cai, Y. et al. Distinct conformational states of SARS-CoV-2 spike proteins. Science 369, 1586-1592 (2020).
Casalino, L. et al. Beyond shielding: the roles of glycans in the SARS-CoV-2 spike protein. ACS Cent. Sci. 6, 1722-1734 (2020).
Ives, C.M. et al. Role of N343 glycosylation on the SARS-CoV-2 S RBD structure and co-receptor binding across variants of concern. eLife 13, RP95708 (2024).
Wrapp, D. et al. Cryo-EM structure of the 2019-nCoV spike in the prefusion conformation. Science 367, 1260-1263 (2020).
Finally, there is no control for nonspecific binding, such as BSA or another non-target protein, which fails to eliminate the possibility of nonspecific interactions between their designed aptamers and proteins in general. A nonspecific binding control should be included in all EMSA experiments.
Thank you for this constructive comment.
Following your recommendation, we are currently supplementing the EMSA assays with BSA as a non-target protein control to rigorously exclude potential non-specific binding between our designed aptamers (Ta and Ta variants) and exogenous proteins. These additional experiments are designed to directly assess whether the aptamers exhibit unintended interactions with unrelated proteins and to further validate the protein specificity of the RBD–aptamer interaction observed in our study.
The resulting nonspecific binding control data will be formally incorporated into the revised manuscript as Figure S11, and the corresponding Results and Discussion sections will be updated accordingly to reflect this critical validation once the experiments are completed.
(2) The evidence supporting claims of better binding to RBD by the aptamer compared to the commercial antibody is flawed at best. The commercial antibody product page indicates an affinity in low nanomolar range, whereas the fitted values they found for the aptamers in their study are orders of magnitude higher at tens of micromolar. Moreover, the methods section is lacking in the details required to appropriately interpret the competitive binding experiments. With a relatively short 20-minute equilibration time, the order of when the aptamer is added versus the antibody makes a difference in which is apparently bound. The issue with this becomes apparent with the lack of internal consistency in the presented results, namely in comparing Fig 3E (which shows no interference of Ta binding with 5uM antibody) and Fig 5D (which shows interference of Ta binding with 0.67-1.67uM antibody). The discrepancy between these figures calls into question the methods used, and it necessitates more details regarding experimental methods used in this manuscript.
Thank you for your insightful comments, which have helped us refine the rigor of our study. We address each of your concerns in detail below:
First, we agree with your observation that the commercial neutralizing antibody (Sino Biological, Cat# 40592-R001) is reported to bind Spike RBD with low nanomolar affinity on its product page. However, this discrepancy in affinity values (nanomolar vs. micromolar) stems from the use of distinct analytical methods. The product page affinity was determined via the Octet RED System, a technique analogous to Surface Plasmon Resonance (SPR) that offers high sensitivity for kinetic and affinity measurements. In contrast, our study employed EMSA, a method primarily optimized for semi-quantitative assessment of binding interactions. The inherent differences in sensitivity and principle between these two techniques—with Octet RED System enabling real-time monitoring of biomolecular interactions and EMSA relying on gel separation—account for the observed variation in affinity values.
Second, regarding the competitive binding experiments, we appreciate your note on the critical role of reagent addition order and equilibration time. To eliminate potential biases from sequential addition, we clarify that Cy3-labeled RNAs, RBD proteins, and the neutralizing antibody were added simultaneously to the reaction system. We will revise the Methods section in the revised manuscript to provide a detailed protocol for the EMSA experiments, to ensure full reproducibility and appropriate interpretation of the results.
Third, we acknowledge and apologize for a critical error in the figure legends of Figure 3E: the concentrations reported (5 μM aptamer and antibody 40592-R001) refer to stock solutions, not the final concentrations in the EMSA reaction mixture. The correct final concentrations are 0.5 μM for aptamer Ta, and 0.5 μM for the antibody. This correction resolves the apparent inconsistency between Figure 3E and Figure 5D, as the final antibody concentration in Figure 3E is now consistent with the concentration range used in Figure 5D. We will update the figure legends for Figure 3E and revise the Methods section to explicitly distinguish between stock and final reaction concentrations, ensuring clarity and internal consistency of the results.
We sincerely thank you for highlighting these issues, which will prompt important revisions to improve the clarity, accuracy, and rigor of our manuscript.
(3) The utility of the approach for increasing affinity of RNA aptamers for their targets is well supported through computational and experimental techniques demonstrating relative improvements in binding affinity for their G34C variant compared to the starting Ta aptamer. While the EMSA experiments do have significant flaws, the observations of relative relationships in equilibrium binding affinities among the tested aptamer variants can be interpreted with reasonable confidence, given that they were all performed in a consistent manner.
We sincerely appreciate your valuable concerns and constructive feedback, which have greatly facilitated the improvement of our manuscript. Regarding the flaws of the EMSA experiments you pointed out, we have provided a detailed response to clarify the related issues and supplemented necessary experimental details to enhance the rigor and reproducibility of our work (see corresponding response above). It is worth noting that EMSA remains a classic and widely used technique for studying biomolecular interactions, and its reliability in qualitative and semi-quantitative analysis of binding events has been well recognized in the field. Furthermore, we fully agree with and are grateful for your view that, since all tested aptamer variants were analyzed using a consistent experimental protocol, the observations on the relative relationships of their equilibrium binding affinities can be interpreted with reasonable confidence. This recognition reinforces the validity of the relative affinity improvements we observed for the G34C variant compared to the parental Ta aptamer, which is a key finding of our study.
(4) The claim that the structure of the RBD-Aptamer complex predicted by the CAAMO pipeline is reliable is tenuous. The success of their rational design approach based on the structure predicted by several ensemble approaches supports the interpretation of the predicted structure as reasonable, however, no experimental validation is undertaken to assess the accuracy of the structure. This is not a main focus of the manuscript, given the applied nature of the study to identify Ta variants with improved binding affinity, however the structural accuracy claim is not strongly supported without experimental validation (i.e. chemical footprinting methods).
We thank the reviewer for this comment and agree that experimental validation would be required to establish the structural accuracy of the predicted RBD–aptamer complex. We note, however, that the primary aim of this study is not structural determination, but the development of a general computational framework for aptamer affinity maturation. In most practical applications, experimentally resolved structures of aptamer–protein complexes are unavailable. Accordingly, CAAMO is designed to operate under such conditions, using computationally generated binding models as working hypotheses to guide rational optimization rather than as definitive structural descriptions. In this context, the predicted structure is evaluated by its utility for affinity improvement, rather than by direct structural validation. We will revise the manuscript accordingly to further clarify this scope.
(5) Throughout the manuscript, the phrasing of "all tested antibodies" was used, despite there being only one tested antibody in experimental methods and three distinct antibodies in computational methods. While this concern is focused on specific language, the major conclusion that their designed aptamers are as good or better than neutralizing antibodies in general is weakened by only testing only three antibodies through computational binding measurements and a fourth single antibody for experimental testing. The contact residue mapping furthermore lacks clarity in the number of structures that were used, with a vague description of structures from the PDB including no accession numbers provided nor how many distinct antibodies were included for contact residue mapping.
We thank the reviewer for this important comment regarding language precision, experimental scope, and clarity of the antibody dataset used in this study. We agree that the phrase “all tested antibodies” was imprecise and could lead to overgeneralization. We will carefully revise the manuscript to use more accurate and explicit wording throughout, clearly distinguishing between experimentally tested antibodies, computationally analyzed antibodies, and antibody structures used for large-scale contact analysis.
Specifically, the experimental comparison in this study was performed using one commercially available SARS-CoV-2 neutralizing antibody, whereas free energy–based computational analyses were conducted on three representative neutralizing antibodies with available structural data. We will revise the manuscript to explicitly state these distinctions and avoid general statements referring to neutralizing antibodies as a class.
Importantly, the residue-level contact frequency analysis was not based solely on these individual antibodies. Instead, this analysis leveraged a comprehensive set of experimentally resolved SARS-CoV-2 RBD–antibody complex structures curated from the Coronavirus Antibody Database (CoV-AbDab), a publicly available and actively maintained resource developed by the Oxford Protein Informatics Group. CoV-AbDab aggregates all published coronavirus-binding antibodies with associated PDB structures and provides a systematic and unbiased structural foundation for antibody–RBD interaction analysis. All available high-resolution RBD–antibody complex structures indexed in CoV-AbDab at the time of analysis were included to compute contact residue frequencies across the structural ensemble. We will explicitly state this data source, clarify the number and nature of structures used, and add the appropriate citation (Raybould et al., Bioinformatics, 2021, doi: 10.1093/bioinformatics/btaa739).
Finally, we will revise the conclusions to avoid claims that extend beyond the scope of the data. The comparison between aptamers and antibodies is now framed in terms of representative antibodies and consensus interaction patterns derived from a large structural ensemble, rather than as a general statement about all neutralizing antibodies. These revisions will improve the clarity, rigor, and reproducibility of the manuscript, while preserving the core conclusion that the CAAMO framework enables effective structure-guided affinity maturation of RNA aptamers.
Overall, the manuscript by Yang et al presents a valuable tool for rational design of improved RNA aptamer binding affinity toward target proteins, which the authors call CAAMO. Notably, the method is not intended for de novo design, but rather as a tool for improving aptamers that have been selected for binding affinity by other methods such as SELEX. While there are significant issues in the conclusions made from experiments in this manuscript, the relative relationships of observed affinities within this study provide solid evidence that the CAAMO framework provides a valuable tool for researchers seeking to use rational design approaches for RNA aptamer affinity maturation.
The following is the authors’ response to the original reviews.
Public Reviews:
Reviewer #1 (Public review):
Summary:
In this study, the authors attempt to devise general rules for aptamer design based on structure and sequence features. The main system they are testing is an aptamer targeting a viral sequence.
Strengths:
The method combines a series of well-established protocols, including docking, MD, and a lot of system-specific knowledge, to design several new versions of the Ta aptamer with improved binding affinity.
We thank the reviewer for this accurate summary and for recognizing the strength of our integrated computational–experimental workflow in improving aptamer affinity.
Weaknesses:
The approach requires a lot of existing knowledge and, importantly, an already known aptamer, which presumably was found with SELEX. In addition, although the aptamer may have a stronger binding affinity, it is not clear if any of it has any additional useful properties such as stability, etc.
Thanks for these critical comments.
(1) On the reliance on a known aptamer: We agree that our CAAMO framework is designed as a post-SELEX optimization platform rather than a tool for de novo discovery. Its primary utility lies in rationally enhancing the affinity of existing aptamers that may not yet be sequence-optimal, thereby complementing experimental technologies such as SELEX. The following has been added to “Introduction” of the revised manuscript. (Page 5, line 108 in the revised manuscript)
‘Rather than serving as a de novo aptamer discovery tool, CAAMO is designed as a post-SELEX optimization platform that rationally improves the binding capability of existing aptamers.’
(2) On stability and developability: We also appreciate the reviewer’s important reminder that affinity alone is not sufficient for therapeutic development. We acknowledge that the present study has focused mainly on affinity optimization, and properties such as nuclease resistance, structural stability, and overall developability were not evaluated. The following has been added to “Discussion and conclusion” of the revised manuscript. (Page 25, line 595 in the revised manuscript)
‘While the present study primarily focused on affinity optimization, we acknowledge that other key developability traits—such as nuclease resistance, structural and thermodynamic stability, and in vivo persistence—are equally critical for advancing aptamers toward therapeutic applications. These properties were not evaluated here but will be systematically addressed in future iterations of the CAAMO framework to enable comprehensive optimization of aptamer candidates.’
Reviewer #2 (Public review):
Summary:
This manuscript proposes a workflow for discovering and optimizing RNA aptamers, with application in the optimization of a SARS-CoV-2 RBD. The authors took a previously identified RNA aptamer, computationally docked it into one specific RBD structure, and searched for variants with higher predicted affinity. The variants were subsequently tested for RBD binding using gel retardation assays and competition with antibodies, and one was found to be a stronger binder by about three-fold than the founding aptamer.
Overall, this would be an interesting study if it were performed with truly high-affinity aptamers, and specificity was shown for RBD or several RBD variants.
Strengths:
The computational workflow appears to mostly correctly find stronger binders, though not de novo binders.
We thank the reviewer for the clear summary and for acknowledging that our workflow effectively prioritizes stronger binders.
Weaknesses:
(1) Antibody competition assays are reported with RBD at 40 µM, aptamer at 5 µM, and a titration of antibody between 0 and 1.2 µg. This approach does not make sense. The antibody concentration should be reported in µM. An estimation of the concentration is 0-8 pmol (from 0-1.2 µg), but that's not a concentration, so it is unknown whether enough antibody molecules were present to saturate all RBD molecules, let alone whether they could have displaced all aptamers.
Thanks for your insightful comment. We have calculated that 0–1.2 µg antibody corresponds to a final concentration range of 0–1.6 µM (see Author response image 1). In practice, 1.2 µg was the maximum amount of commercial antibody that could be added under the conditions of our assay. In the revised manuscript, all antibody amounts previously reported in µg have been converted to their corresponding molar concentrations in Fig. 1F and Fig. 5D. In addition, the exact antibody concentrations used in the EMSA assays are now explicitly stated in the Materials and Methods section under “EMSA experiments.” The following has been added to “EMSA experiments” of the revised manuscript. (Page 30 in the revised manuscript)
‘For competitive binding experiments, 40 μM of RBP proteins, 5 μM of annealed Cy3-labelled RNAs and increasing concentrations of SARS-CoV-2 neutralizing antibody 40592-R001 (0–1.67 μM) were mixed in the EMSA buffer and incubated at room temperature for 20 min.’
Author response image 1.
Estimation of antibody concentration. Assuming a molecular weight of 150 kDa, dissolving 1.2 µg of antibody in a 5 µL reaction volume results in a final concentration of 1.6 µM.
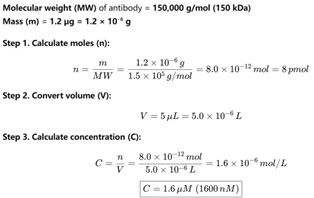
As shown in Figure 5D, the purpose of the antibody–aptamer competition assay was not to achieve full saturation but rather to compare the relative competitive binding of the optimized aptamer (Ta<sup>G34C</sup>) versus the parental aptamer (Ta). Molecular interactions at this scale represent a dynamic equilibrium of binding and dissociation. While the antibody concentration may not have been sufficient to saturate all available RBD molecules, the experimental results clearly reveal the competitive binding behavior that distinguishes the two aptamers. Specifically, two consistent trends emerged:
(1) Across all antibody concentrations, the free RNA band for Ta was stronger than that of Ta<sup>G34C</sup>, while the RBD–RNA complex band of the latter was significantly stronger, indicating that Ta<sup>G34C</sup> bound more strongly to RBD.
(2) For Ta, increasing antibody concentration progressively reduced the RBD–RNA complex band, consistent with antibody displacing the aptamer. In contrast, for Ta<sup>G34C</sup>, the RBD–RNA complex band remained largely unchanged across all tested antibody concentrations, suggesting that the antibody was insufficient to displace Ta<sup>G34C</sup> from the complex.
Together, these observations support the conclusion that Ta<sup>G34C</sup> exhibits markedly stronger binding to RBD than the parental Ta aptamer, in line with the predictions and objectives of our CAAMO optimization framework.
(2) These are not by any means high-affinity aptamers. The starting sequence has an estimated (not measured, since the titration is incomplete) K<sub>d</sub> of 110 µM. That's really the same as non-specific binding for an interaction between an RNA and a protein. This makes the title of the manuscript misleading. No high-affinity aptamer is presented in this study. If the docking truly presented a bound conformation of an aptamer to a protein, a sub-micromolar K<sub>d</sub> would be expected, based on the number of interactions that they make.
In fact, our starting sequence (Ta) is a high-affinity aptamer, and then the optimized sequences (such as Ta<sup>G34C</sup>) with enhanced affinity are undoubtedly also high-affinity aptamers. See descriptions below:
(1) Origin and prior characterization of Ta. The starting aptamer Ta (referred to as RBD-PB6-Ta in the original publication by Valero et al., PNAS 2021, doi:10.1073/pnas.2112942118) was selected through multiple positive rounds of SELEX against SARS-CoV-2 RBD, together with counter-selection steps to eliminate non-specific binders. In that study, Ta was reported to bind RBD with an IC₅₀ of ~200 nM as measured by biolayer interferometry (BLI), supporting its high affinity and specificity. The following has been added to “Introduction” of the revised manuscript. (Page 4 in the revised manuscript)
‘This aptamer was originally identified through SELEX and subsequently validated using surface plasmon resonance (SPR) and biolayer interferometry (BLI), which confirmed its high affinity (sub-nanomolar) and high specificity toward the RBD. Therefore, Ta provides a well-characterized and biologically relevant starting point for structure-based optimization.’
(2) Methodological differences between EMSA and BLI measurements. We acknowledge that the discrepancy between our obtained binding affinity (K<sub>d</sub> = 110 µM) and the previously reported one (IC<sub>50</sub> ~ 200 nM) for the same Ta sequence arises primarily from methodological and experimental differences between EMSA and BLI. Namely, different experimental measurement methods can yield varied binding affinity values. While EMSA may have relatively low measurement precision, its relatively simple procedures were the primary reason for its selection in this study. Particularly, our framework (CAAMO) is designed not as a tool for absolute affinity determination, but as a post-SELEX optimization platform that prioritizes relative changes in binding affinity under a consistent experimental setup. Thus, the central aim of our work is to demonstrate that CAAMO can reliably identify variants, such as Ta<sup>G34C</sup>, that bind more strongly than the parental sequence under identical assay conditions. The following has been added to “Discussion and conclusion” of the revised manuscript. (Page 24 in the revised manuscript)
‘Although the absolute K<sub>d</sub> values determined by EMSA cannot be directly compared with surface-based methods such as SPR or BLI, the relative affinity trends remain highly consistent. While EMSA provides semi-quantitative affinity estimates, the close agreement between experimental EMSA trends and FEP-calculated ΔΔG values supports the robustness of the relative affinity changes reported here. In future studies, additional orthogonal biophysical techniques (e.g., filter-binding, SPR, or BLI) will be employed to further validate and refine the protein–aptamer interaction models.’
(3) Evidence of specific binding in our assays. We emphasize that the binding observed in our EMSA experiments reflects genuine aptamer–protein interactions. As shown in Figure 2G, a control RNA (Tc) exhibited no detectable binding to RBD, whereas Ta produced a clear binding curve, confirming that the interaction is specific rather than non-specific.
(3) The binding energies estimated from calculations and those obtained from the gel-shift experiments are vastly different, as calculated from the K<sub>d</sub> measurements, making them useless for comparison, except for estimating relative affinities.
Author Reply: We thank the reviewer for raising this important point. CAAMO was developed as a post-SELEX optimization tool with the explicit goal of predicting relative affinity changes (ΔΔG) rather than absolute binding free energies (ΔG). Empirically, CAAMO correctly predicted the direction of affinity change for 5 out of 6 designed variants (e.g., ΔΔG < 0 indicates enhanced binding free energy relative to WT); such predictive power for relative ranking is highly valuable for prioritizing candidates for experimental testing. Our prior work on RNA–protein interactions likewise supports the reliability of relative affinity predictions (see: Nat Commun 2023, doi:10.1038/s41467-023-39410-8). The following has been added to “Discussion and conclusion” of the revised manuscript. (Page 24 in the revised manuscript)
‘While EMSA provides semi-quantitative affinity estimates, the close agreement between experimental EMSA trends and FEP-calculated ΔΔG values supports the robustness of the relative affinity changes reported here.’
Recommendations for the Authors:
Reviewer #1 (Recommendations for the authors)
(1) Overall, the paper is well-written and, in the opinion of this reviewer, could remain as it is.
We thank the reviewer for the positive evaluation and supportive comments regarding our manuscript. We are grateful for the endorsement of its quality and suitability for publication.
Reviewer #2 (Recommendations for the authors)
(1) All molecules present in experiments need to be reported with their final concentrations (not µg).
We thank the reviewer for raising this important point. In the revised manuscript, all antibody amounts previously reported in µg have been converted to their corresponding molar concentrations in Fig. 1F and Fig. 5D. In addition, the exact antibody concentrations used in the EMSA assays are now explicitly stated in the Materials and Methods section under “EMSA experiments.” The following has been added to “EMSA experiments” of the revised manuscript. (Page 30 in the revised manuscript)
‘For competitive binding experiments, 40 μM of RBP proteins, 5 μM of annealed Cy3-labelled RNAs and increasing concentrations of SARS-CoV-2 neutralizing antibody 40592-R001 (0–1.67 μM) were mixed in the EMSA buffer and incubated at room temperature for 20 min.’
(2) An independent K<sub>d</sub> measurement, for example, using a filter binding assay, would greatly strengthen the results.
We thank the reviewer for this constructive suggestion and agree that an orthogonal biophysical measurement (e.g., a filter-binding assay, SPR or BLI) would further strengthen confidence in the reported dissociation constants. Unfortunately, all available SARS-CoV-2 RBD protein used in this study has been fully consumed and, due to current supply limitations, we were unable to perform new orthogonal binding experiments for the revised manuscript. We regret this limitation and have documented it in the Discussion as an item for future work.
Importantly, although we could not perform a new filter-binding experiment at this stage, we have multiple independent lines of evidence that support the reliability of the EMSA-derived affinity trends reported in the manuscript:
(1) Rigorous EMSA design and reproducibility. All EMSA binding curves reported in the manuscript (e.g., Figs. 2F–G, 4E–F, 5A and Fig. S9) are derived from three independent biological replicates and include standard deviations; the measured binding curves show good reproducibility across replicates.
(2) Appropriate positive and negative controls. Our gel assays include clear internal controls. The literature-reported strong binder Ta forms a distinct aptamer–RBD complex band under our conditions, whereas the negative-control aptamer Tc shows no detectable binding under identical conditions (see Fig. 2F). These controls demonstrate that the EMSA system discriminates specific from non-binding sequences with high sensitivity.
(3) Orthogonal computational validation (FEP) that agrees with experiment. The central strength of the CAAMO framework is the integration of rigorous physics-based calculations with experiments. We performed FEP calculations for the selected single-nucleotide mutations and computed ΔΔG values for each mutant. The direction and rank order of binding changes predicted by FEP are in good agreement with the EMSA measurements: five of six FEP-predicted improved mutants (Ta<sup>G34C</sup>, Ta<sup>G34U</sup>, Ta<sup>G34A</sup>, Ta<sup>C23A</sup>, Ta<sup>C23U</sup>) were experimentally confirmed to have stronger apparent affinity than wild-type Ta (see Fig. 4D–F, Table S2), yielding a success rate of 83%. The concordance between an independent, rigorous computational method and our experimental measurements provides strong mutual validation.
(4) Independent competitive binding experiments. We additionally performed competitive EMSA assays against a commercial neutralizing monoclonal antibody (40592-R001). These competition experiments show that Ta<sup>G34C</sup>–RBD complexes are resistant to antibody displacement under conditions that partially displace the wild-type Ta–RBD complex (see Fig. 5D). This result provides an independent, functionally relevant line of evidence that Ta<sup>G34C</sup> binds RBD with substantially higher affinity and specificity than WT Ta under our assay conditions.
Given these multiple, independent lines of validation (rigorous EMSA replicates and controls, FEP agreement, and antibody competition assays), we are confident that the relative affinity improvements reported in the manuscript are robust, even though the absolute K<sub>d</sub> values measured by EMSA are not directly comparable to surface-based methods (EMSA typically reports larger apparent K<sub>d</sub> values than SPR/BLI due to methodological differences). The following has been added to “Discussion and conclusion” of the revised manuscript. (Page 24 in the revised manuscript)
‘Although the absolute K<sub>d</sub> values determined by EMSA cannot be directly compared with surface-based methods such as SPR or BLI, the relative affinity trends remain highly consistent. While EMSA provides semi-quantitative affinity estimates, the close agreement between experimental EMSA trends and FEP-calculated ΔΔG values supports the robustness of the relative affinity changes reported here. In future studies, additional orthogonal biophysical techniques (e.g., filter-binding, SPR, or BLI) will be employed to further validate and refine the protein–aptamer interaction models.’
(3) The project would really benefit from a different aptamer-target system. Starting with a 100 µM aptamer is really not adequate.
We thank the reviewer for this important suggestion and for highlighting the value of testing the CAAMO framework in additional aptamer–target systems.
First, we wish to clarify the rationale for selecting the Ta–RBD system as the proof-of-concept. The Ta aptamer is not an arbitrary or weak binder: it was originally identified by independent SELEX experiments and subsequently validated by rigorous biophysical assays (SPR and BLI) (see: Proc. Natl. Acad. Sci. 2021, doi: 10.1073/pnas.2112942118). That study confirmed that Ta exhibits high-affinity and high-specificity binding to the SARS-CoV-2 RBD, which is why it serves as a well-characterized and biologically relevant system for method validation and optimization. We have added a brief clarification to the “Introduction” to emphasize these points. The following has been added to “Introduction” of the revised manuscript. (Page 4 in the revised manuscript)
‘This aptamer was originally identified through SELEX and subsequently validated using surface plasmon resonance (SPR) and biolayer interferometry (BLI), which confirmed its high affinity and high specificity toward the RBD. Therefore, Ta provides a well-characterized and biologically relevant starting point for structure-based optimization.’
Second, we agree that apparent discrepancies in absolute K<sub>d</sub> values can arise from different experimental platforms. Surface-based methods (SPR/BLI) and gel-shift assays (EMSA) have distinct measurement principles; EMSA yields semi-quantitative, solution-phase, apparent K<sub>d</sub> values that are not directly comparable in absolute magnitude to surface-based measurements. Crucially, however, our study focuses on relative affinity change. EMSA is well suited for parallel, comparative measurements across multiple variants when all samples are assayed under identical conditions, and thus provides a reliable readout for ranking and validating designed mutations. We have added a short statement in the “Discussion and conclusion”. The following has been added to “Discussion and conclusion” of the revised manuscript. (Page 24 in the revised manuscript)
‘Although the absolute K<sub>d</sub> values determined by EMSA cannot be directly compared with surface-based methods such as SPR or BLI, the relative affinity trends remain highly consistent. While EMSA provides semi-quantitative affinity estimates, the close agreement between experimental EMSA trends and FEP-calculated ΔΔG values supports the robustness of the relative affinity changes reported here. In future studies, additional orthogonal biophysical techniques (e.g., filter-binding, SPR, or BLI) will be employed to further validate and refine the protein–aptamer interaction models.’
Third, and importantly, CAAMO is inherently generalizable. In addition to the Ta–RBD application presented here, we have already begun applying CAAMO to other aptamer–target systems. In particular, we have successfully deployed the framework in preliminary optimization studies of RNA aptamers targeting the epidermal growth factor receptor (EGFR) (see: Gastroenterology 2021, doi: 10.1053/j.gastro.2021.05.055) (see Author response image 2). These preliminary results support the transferability of the CAAMO pipeline beyond the SARS-CoV-2 RBD system. We have added a short statement in the “Discussion and conclusion”. The following has been added to “Discussion and conclusion” of the revised manuscript. (Page 259 in the revised manuscript)
‘In addition to the Ta–RBD system, the CAAMO framework itself is inherently generalizable. More work is currently underway to apply CAAMO to optimize aptamers targeting other therapeutically relevant proteins, such as the epidermal growth factor receptor (EGFR) [45], in order to further explore its potential for broader aptamer engineering.’
Author response image 2.
Overview of the predicted binding model of the EGFR–aptamer complex generated using the CAAMO framework.
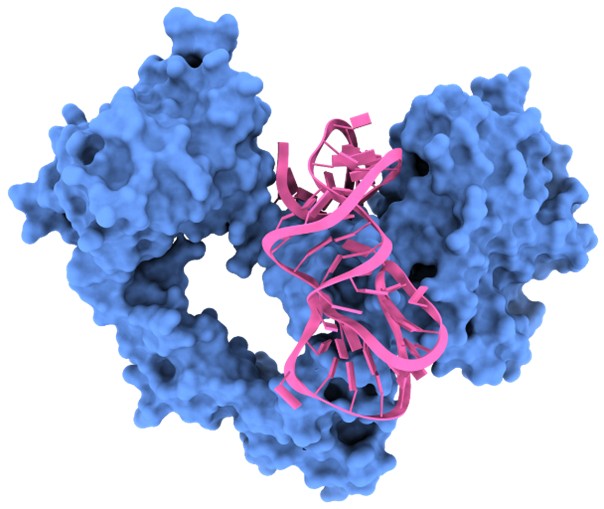
(4) Several RBD variants should be tested, as well as other proteins, for specificity. At such weak affinities, it is likely that these are non-specific binders.
We thank the reviewer for this important concern. Below we clarify the basis for selecting Ta and its engineered variants, summarize the experimental controls that address specificity, and present the extensive in silico variant analysis we performed to assess sensitivity and breadth of binding.
(1) Origin and validation of Ta. As noted in our response to “Comment (3)”, the Ta aptamer was not chosen arbitrarily. Ta was identified by independent SELEX with both positive and negative selection and subsequently validated using surface-based biophysical assays (SPR and BLI), which reported low-nanomolar affinity and high specificity for the SARS-CoV-2 RBD. Thus, Ta is a well-characterized, experimentally validated starting lead for method development and optimization.
(2) Experimental specificity controls. We appreciate the concern that weak apparent affinities can reflect non-specific binding. As noted in our response to “Comment (2)”, we applied multiple experimental controls that argue against non-specificity: (i) a literature-reported weak binder (Tc) was used as a negative control and produced no detectable complex under identical EMSA conditions (see Figs. 2F–G), demonstrating the assay’s ability to discriminate non-binders from specific binders; (ii) competitive EMSA assays with a commercial neutralizing monoclonal antibody (40592-R001) show that both Ta and Ta<sup>G34C</sup> engage the same or overlapping RBD site as the antibody, and that Ta<sup>G34C</sup> is substantially more resistant to antibody displacement than WT Ta (see Figs. 3D–E, 5D). Together, these wet-lab controls support that the observed aptamer-RBD bands reflect specific interactions rather than general, non-specific adsorption.
(3) Variant and specificity analysis by rigorous FEP calculations. To address the reviewer’s request to evaluate variant sensitivity, we performed extensive free energy perturbation combined with Hamiltonian replica-exchange molecular dynamics (FEP/HREX) for improved convergence efficiency and increased simulation time to estimate relative binding free energy changes (ΔΔG) of both WT Ta and the optimized Ta<sup>G34C</sup> against a panel of RBD variants. Results are provided in Tables S4 and S5. Representative findings include: For WT Ta versus early lineages, FEP reproduces the experimentally observed trends: Alpha (B.1.1.7; N501Y) yields ΔΔG<sub>FEP</sub> = −0.42 ± 0.07 kcal/mol (ΔΔG<sub>exp</sub> = −0.24), while Beta (B.1.351; K417N/E484K/N501Y) gives ΔΔG<sub>FEP</sub> = 0.64 ± 0.25 kcal/mol (ΔΔG<sub>exp</sub> = 0.36) (see Table S4). The agreement between the computational and experimental results supports the fidelity of our computational model for variant assessment. For the engineered Ta<sup>G34C</sup>, calculations across a broad panel of variants indicate that Ta<sup>G34C</sup> retains or improves binding (ΔΔG < 0) for the majority of tested variants, including Alpha, Beta, Gamma and many Omicron sublineages. Notable examples: BA.1 (ΔΔG = −3.00 ± 0.52 kcal/mol), BA.2 (ΔΔG = −2.54 ± 0.60 kcal/mol), BA.2.75 (ΔΔG = −5.03 ± 0.81 kcal/mol), XBB (ΔΔG = −3.13 ± 0.73 kcal/mol) and XBB.1.5 (ΔΔG = −2.28 ± 0.96 kcal/mol). A minority of other Omicron sublineages (e.g., BA.4 and BA.5) show modest positive ΔΔG values (2.11 ± 0.67 and 2.27 ± 0.68 kcal/mol, respectively), indicating a predicted reduction in affinity for those specific backgrounds. Overall, these data indicate that the designed Ta<sup>G34C</sup> aptamer can maintain its binding ability with most SARS-CoV-2 variants, showing potential for broad-spectrum antiviral activity (see Table S5). The following has been added to “Results” of the revised manuscript. (Page 22 in the revised manuscript)
‘2.6 Binding performance of Ta and Ta<sup>G34C</sup> against SARS-CoV-2 RBD variants
To further evaluate the binding performance and specificity of the designed aptamer Ta<sup>G34C</sup> toward various SARS-CoV-2 variants [39], we conducted extensive free energy perturbation combined with Hamiltonian replica-exchange molecular dynamics (FEP/HREX) [40–42] for both the wild-type aptamer Ta and the optimized Ta<sup>G34C</sup> against a series of RBD mutants. The representative variants include the early Alpha (B.1.1.7) and Beta (B.1.351) lineages, as well as a panel of Omicron sublineages (BA.1–BA.5, BA.2.75, BQ.1, XBB, XBB.1.5, EG.5.1, HK.3, JN.1, and KP.3) carrying multiple mutations within the RBD region (residues 333–527). For each variant, mutations within 5 Å of the bound aptamer were included in the FEP to accurately estimate the relative binding free energy change (ΔΔG).
For the wild-type Ta aptamer, the FEP-predicted binding affinities toward the Alpha and Beta RBD variants were consistent with the previous experimental results, further validating the reliability of our model (see Table S4). Specifically, Ta maintained comparable or slightly enhanced binding to the Alpha variant and showed only marginally reduced affinity for the Beta variant.
In contrast, the optimized aptamer Ta<sup>G34C</sup> exhibited markedly improved and broad-spectrum binding capability toward most tested variants (see Table S5). For early variants such as Alpha, Beta, and Gamma, Ta<sup>G34C</sup> maintained enhanced affinities (ΔΔG < 0). Notably, for multiple Omicron sublineages—including BA.1, BA.2, BA.2.12.1, BA.2.75, XBB, XBB.1.5, XBB.1.16, XBB.1.9, XBB.2.3, EG.5.1, XBB.1.5.70, HK.3, BA.2.86, JN.1 and JN.1.11.1—the calculated binding free energy changes ranged from −1.89 to −7.58 kcal/mol relative to the wild-type RBD, indicating substantially stronger interactions despite the accumulation of multiple mutations at the aptamer–RBD interface. Only in a few other Omicron sublineages, such as BA.4, BA.5, and KP.3, a slight reduction in binding affinity was observed (ΔΔG > 0).
These computational findings demonstrate that the Ta<sup>G34C</sup> aptamer not only preserves high affinity for the RBD but also exhibits improved tolerance to the extensive mutational landscape of SARS-CoV-2. Collectively, our results suggest that Ta<sup>G34C</sup> holds promise as a high-affinity and potentially cross-variant aptamer candidate for targeting diverse SARS-CoV-2 spike protein variants, showing potential for broad-spectrum antiviral activity.’
The following has been added to “Materials and Methods” of the revised manuscript. (Page 29 in the revised manuscript)
‘4.7 FEP/HREX
To evaluate the binding sensitivity of the optimized aptamer Ta<sup>G34C</sup> toward SARS-CoV-2 RBD variants, we employed free energy perturbation combined with Hamiltonian replica-exchange molecular dynamics (FEP/HREX) simulations for enhanced sampling efficiency and improved convergence. The relative binding free energy changes (ΔΔG) upon RBD mutations were estimated as:
ΔΔ𝐺 = Δ𝐺<sub>bound</sub> − Δ𝐺<sub>free</sub>
where ΔG<sub>bound</sub> and ΔG<sub>free</sub> represent the RBD mutations-induced free energy changes in the complexed and unbound states, respectively. All simulations were performed using GROMACS 2021.5 with the Amber ff14SB force field. For each mutation, dual-topology structures were generated in a pmx-like manner, and 32 λ-windows (0.0, 0.01, 0.02, 0.03, 0.06, 0.09, 0.12, 0.16, 0.20, 0.24, 0.28, 0.32, 0.36, 0.40, 0.44, 0.48, 0.52, 0.56, 0.60, 0.64, 0.68, 0.72, 0.76, 0.80, 0.84, 0.88, 0.91, 0.94, 0.97, 0.98, 0.99, 1.0) were distributed uniformly between 0.0 and 1.0. To ensure sufficient sampling, each window was simulated for 5 ns, with five independent replicas initiated from distinct velocity seeds. Replica exchange between adjacent λ states was attempted every 1 ps to enhance phase-space overlap and sampling convergence. The van der Waals and electrostatic transformations were performed simultaneously, employing a soft-core potential (α = 0.3) to avoid singularities. For each RBD variant system, this setup resulted in an accumulated simulation time of approximately 1600 ns (5 ns × 32 windows × 5 replicas × 2 states). The Gromacs bar analysis tool was used to estimate the binding free energy changes.’
Tables S4 and S5 have been added to Supplementary Information of the revised manuscript.
eLife Assessment
This fundamental study uses the Drosophila mushroom body as a model to understand the molecular machinery that controls the temporal specification of neuronal cell types. With convincing experimental evidence, the authors make the finding that the Pipsqueak domain-containing transcription factor Eip93F plays a central role in specifying a later-born neuronal subtype while repressing gene expression programs for earlier subtypes.
Reviewer #1 (Public review):
Summary:
The temporal regulation of neuronal specification and its molecular mechanisms are important problems in developmental neurobiology. This study focuses on Kenyon cells (KCs), which form the mushroom body in Drosophila melanogaster, in order to address this issue. Building on previous findings, the authors examine the role of the transcription factor Eip93F in the development of late-born KCs. The authors revealed that Eip93F controls the activity of flies at night through the expression of the calcium channel Ca-α1T. Thus, the study clarifies the molecular machinery that controls temporal neuronal specification and animal behavior.
Strengths:
The convincing results are based on state-of-the-art molecular genetics, imaging, and behavioral analysis.
Reviewer #2 (Public review):
Summary:
Understanding the mechanisms of neural specification is a central question in neurobiology. In Drosophila, the mushroom body (MB), which is the associative learning region in the brain, consists of three major cell types: γ, α'/β' and α/β kenyon cells. These classes can be further subdivided into seven subtypes, together comprising ~2000 KCs per hemi-brain. Remarkably, all of these neurons are derived from just four neuroblasts in each hemisphere. Therefore, a lot of endeavours are put to understand how the neuron is specified in the fly MB.
Over the past decade, studies have revealed that MB neuroblasts employ a temporal patterning mechanism, producing distinct neuronal types at different developmental stages. Temporal identity is conveyed through transcription factor expression in KCs. High levels of Chinmo, a BTB-zinc finger transcription factor, promote γ-cell fate (Zhu et al., Cell, 2006). Reduced Chinmo levels trigger expression of mamo, a zinc finger transcription factor that specifies α'/β' identity (Liu et al., eLife, 2019). However, the specification of α/β neurons remains poorly understood. Some evidence suggests that microRNAs regulate the transition from α'/β' to α/β fate (Wu et al., Dev Cell, 2012; Kucherenko et al., EMBO J, 2012). One hypothesis even proposes that α/β represents a "default" state of MB neurons, which could explain the difficulty in identifying dedicated regulators.
The study by Chung et al. challenges this hypothesis. By leveraging previously published RNA-seq datasets (Shih et al., G3, 2019), they systematically screened BAC transgenic lines to selectively label MB subtypes. Using these tools, they analyzed the consequences of manipulating E93 expression and found that E93 is required for α/β specification. Furthermore, loss of E93 impairs MB-dependent behaviors, highlighting its functional importance.
Strengths:
The authors conducted a thorough analysis of E93 manipulation phenotypes using LexA tools generated from the Janelia Farm and Bloomington collections. They demonstrated that E93 knockdown reduces expression of Ca-α1T, a calcium channel gene identified as an α/β marker. Supporting this conclusion, one LexA line driven by a DNA fragment near EcR (R44E04) showed consistent results. Conversely, overexpression of E93 in γ and α'/β' Kenyon cells led to downregulation of their respective subtype markers.
Another notable strength is the authors' effort to dissect the genetic epistasis between E93 and previously known regulators. Through MARCM and reporter analyses, they showed that Chinmo and Mamo suppress E93, while E93 itself suppresses mamo. This work establishes a compelling molecular model for the regulatory network underlying MB cell-type specification.
Weaknesses:
The interpretation of E93's role in neuronal specification requires caution. Typically, two criteria are used to establish whether a gene directs neuronal identity:
(1) gene manipulation shifts the neuronal transcriptome from one subtype to another, and
(2) gene manipulation alters axonal projection patterns.
The results presented here only partially satisfy the first criterion. Although markers are affected, it remains possible that the reporter lines and subtype markers used are direct transcriptional targets of E93 in α/β neurons, rather than reflecting broader fate changes. Future studies using transcriptomics would provide a more comprehensive assessment of neuronal identity following E93 perturbation.
With respect to the second criterion, the evidence is also incomplete. While reporter patterns were altered, the overall morphology of the α/β lobes appeared largely intact after E93 knockdown. Overexpression of E93 in γ neurons produced a small subset of cells with α/β-like projections, but this effect warrants deeper characterization before firm conclusions can be drawn.
Overall, this study has nicely shown that E93 can regulate α/β neural identities. Further studies on the regulatory network will help to better understand the mechanism of neurogenesis in mushroom body.
Author response:
The following is the authors’ response to the original reviews.
Public Reviews:
Reviewer #1 (Public review):
Summary:
The temporal regulation of neuronal specification and its molecular mechanisms are important problems in developmental neurobiology. This study focuses on Kenyon cells (KCs), which form the mushroom body in Drosophila melanogaster, in order to address this issue. Building on previous findings, the authors examine the role of the transcription factor Eip93F in the development of late-born KCs. The authors revealed that Eip93F controls the activity of flies at night through the expression of the calcium channel Ca-α1T. Thus, the study clarifies the molecular machinery that controls temporal neuronal specification and animal behavior.
Strengths:
The convincing results are based on state-of-the-art molecular genetics, imaging, and behavioral analysis.
Weaknesses:
Temporal mechanisms of neuronal specification are found in many nervous systems. However, the relationship between the temporal mechanisms identified in this study and those in other systems remains unclear.
We have discussed the temporal mechanisms between different nervous systems at the beginning of the Discussion section.
Reviewer #2 (Public review):
Summary:
Understanding the mechanisms of neural specification is a central question in neurobiology. In Drosophila, the mushroom body (MB), which is the associative learning region in the brain, consists of three major cell types: γ, α'/β', and α/β kenyon cells. These classes can be further subdivided into seven subtypes, together comprising ~2000 KCs per hemi-brain. Remarkably, all of these neurons are derived from just four neuroblasts in each hemisphere. Therefore, a lot of endeavors are put into understanding how the neuron is specified in the fly MB.
Over the past decade, studies have revealed that MB neuroblasts employ a temporal patterning mechanism, producing distinct neuronal types at different developmental stages. Temporal identity is conveyed through transcription factor expression in KCs. High levels of Chinmo, a BTB-zinc finger transcription factor, promote γ-cell fate (Zhu et al., Cell, 2006). Reduced Chinmo levels trigger expression of mamo, a zinc finger transcription factor that specifies α'/β' identity (Liu et al., eLife, 2019). However, the specification of α/β neurons remains poorly understood. Some evidence suggests that microRNAs regulate the transition from α'/β' to α/β fate (Wu et al., Dev Cell, 2012; Kucherenko et al., EMBO J, 2012). One hypothesis even proposes that α/β represents a "default" state of MB neurons, which could explain the difficulty in identifying dedicated regulators.
The study by Chung et al. challenges this hypothesis. By leveraging previously published RNA-seq datasets (Shih et al., G3, 2019), they systematically screened BAC transgenic lines to selectively label MB subtypes. Using these tools, they analyzed the consequences of manipulating E93 expression and found that E93 is required for α/β specification. Furthermore, loss of E93 impairs MB-dependent behaviors, highlighting its functional importance.
Strengths:
The authors conducted a thorough analysis of E93 manipulation phenotypes using LexA tools generated from the Janelia Farm and Bloomington collections. They demonstrated that E93 knockdown reduces expression of Ca-α1T, a calcium channel gene identified as an α/β marker. Supporting this conclusion, one LexA line driven by a DNA fragment near EcR (R44E04) showed consistent results. Conversely, overexpression of E93 in γ and α'/β' Kenyon cells led to downregulation of their respective subtype markers.
Another notable strength is the authors' effort to dissect the genetic epistasis between E93 and previously known regulators. Through MARCM and reporter analyses, they showed that Chinmo and Mamo suppress E93, while E93 itself suppresses Mamo. This work establishes a compelling molecular model for the regulatory network underlying MB cell-type specification.
Weaknesses:
The interpretation of E93's role in neuronal specification requires caution. Typically, two criteria are used to establish whether a gene directs neuronal identity:
(1) gene manipulation shifts the neuronal transcriptome from one subtype to another, and
(2) gene manipulation alters axonal projection patterns.
The results presented here only partially satisfy the first criterion. Although markers are affected, it remains possible that the reporter lines and subtype markers used are direct transcriptional targets of E93 in α/β neurons, rather than reflecting broader fate changes. Future studies using single-cell transcriptomics would provide a more comprehensive assessment of neuronal identity following E93 perturbation.
We do plan conduct multi-omics experiments to provide a more comprehensive assessment of neuronal identity upon loss-of-function of E93. However, omics results take time to be conducted and analyzed, so the result will be summarized in a future manuscript.
With respect to the second criterion, the evidence is also incomplete. While reporter patterns were altered, the overall morphology of the α/β lobes appeared largely intact after E93 knockdown. Overexpression of E93 in γ neurons produced a small subset of cells with α/β-like projections, but this effect warrants deeper characterization before firm conclusions can be drawn. While the results might be an intrinsic nature of KC types in flies, the interpretation of the reader of the data should be more careful, and the authors should also mention this in their main text.
We have toned down our description on the effect of E93 (especially in the loss-offunction) in specifying the α/β-specific cell identity and discussed whether unidentified regulators would work together with E93 in α/β neural fate specification.
Recommendations for the authors:
Reviewer #1 (Recommendations for the authors):
(1) Changes in nighttime activity in flies upon knocking down Ca_α1T and Eip93F are interesting (Fig. 2C). However, examining the morphological changes in the mushroom body under these conditions would be essential.
We did not find the morphological change of mushroom body lobes by examining with the Fas2 staining (shown in Figure S8D).
(2) Temporal mechanisms of neuronal specification have been identified in various nervous systems, including the embryonic central nervous system (CNS), the optic lobe of Drosophila, and the nervous systems of other organisms. The Discussion section should address the relationship between the temporal mechanisms identified in this study and those identified in other systems.
We have discussed the temporal mechanisms between different nervous systems at the beginning of the Discussion section.
(3) Eip93F is an Ecdysone-induced protein. In the Discussion section, the authors should discuss the relationship between the ecdysone signal and the roles of Eip93F.
We have added the discussion on the relationship between the ecdysone signal and the roles of Eip93F.
Reviewer #2 (Recommendations for the authors):
(1) The behavioral effect of Ca-α1T knockdown is pretty interesting. But how the downregulation of Ca-α1T in the mushroom body can affect locomotion is puzzling. Even though the mushroom body is known to suppress locomotion (Matin et al., Learn Mem, 1998), the real results are opposite. Can authors give further explanation in the discussion? Also, the behavioral experiments are hard to interpret, given that Figure 2C(1) and Figure 2C(3) as a control, also vary a lot. Since the behavioral experiments don't affect the main conclusion of the paper, I would suggest removing that part or adding more explanation in the discussion.
First, we have discussed the puzzling part on the MB influence in locomotion between the previous study using tetanus toxin light chain (TeNT-Ln) and our Ca-α1T knockdown result. It is possible that the different effect is derived from TeNT-Ln’s function in MB axons and Ca-α1T’s function in MB dendrites. Secondly, we have re-conducted the behavioral results using a new α/β driver (13F02-AD/70F05-DBD) to replace our initial behavioral results (using c739-GAL4, which would cause the abnormal wing when drives E93 RNAi expression; see S8C(2) Fig). Current results (now in Fig 2I) are more consistent in control groups.
(2) In the manuscript, the authors use "subtype" to describe γKC, α'/β'KC and α/βKC in the fly MB. However, in most of the literature, people use "main types" to summarize these three types, and "subtype" is mostly about the difference in γd, γm, α'/β'ap, α'/β'm, α/βp, α/βs and α/βc KC (Shih et al., G3, 2019). Replacing "subtypes" with "main types" will help to increase the clarity.
We have replaced "KC subtypes" with "main KC types" or just “KC types”.
(3) The authors have identified a lot of new markers for the KC cell types, and some of them are used in this manuscript. It will be helpful if they can have a figure to summarize the markers they used in this study and what cell types they labeled.
We have summarized expression patterns of these markers in Supplemental table 1.
(4) In the method, the authors mentioned that only females were selected for analysis of Ca-α1T-GFSTF. Could the authors explain the reasons in more detail?
Since homozygous Ca-α1T-GFSTF female flies and hemizygous Ca-α1T-GFSTF male are a bit sick and hard to collect, we therefore used heterozygous Ca-α1T-GFSTF female in our experiments. I have added this description in the Materials and Methods section.
(5) Figure S1: The legend of magenta fluorescence is missing. Please add which protein is shown in magenta.
We have added the legend of magenta fluorescence, which is Trio.
(6) The detailed genotypes of Figure 2C and Figure S7 are missing in Supplementary Table 1. Please include that, so that readers can know the genetic background.
We have added genotypes of Figure 2I (previously Figure 2C) and Figure S8 (previously as Figure S7) in Supplementary Table 2.
(7) Figure 2D-G: It will be helpful if the authors can outline the lobe (γ, α'/β', and α/β) in the figure, which will help readers to understand the images.
We have outlined α, α', β, β' and γ lobes in Figure 2C-F (previously as Figure 2D-G).
eLife Assessment
This important study describes a computational model of the rat spinal locomotor circuits and how they could be plastically reconfigured after lateral hemisection or contusion injuries to replicate gaits observed experimentally in vivo. Overall, the simulation results convincingly mirror the gait parameters observed experimentally. The model suggests the emergence of detour circuits after lateral hemisection, whereas after a midline contusion, the model suggests plasticity of left-right and sensory inputs below the injury.
Reviewer #1 (Public review):
Summary:
This is a rigorous data-driven modeling study extending the authors' previous model of spinal locomotor central pattern generator (CPG) circuits developed for the mouse spinal cord and adapted here to the rat to explore potential circuit-level changes underlying altered speed-dependent gaits due to asymmetric (lateral) thoracic spinal hemisection and symmetric midline contusion. The model reproduces key features of the rat speed-dependent gait-related experimental data before injury and after recovery from these two different thoracic spinal cord injuries and suggests injury-specific mechanisms of circuit reorganization underlying functional recovery. There is much interest in the mechanisms of locomotor behavior recovery after spinal cord injury, and data-driven behaviorally relevant circuit modeling is an important approach. This study represents an important advance of the authors' previous experimental and modeling work on locomotor circuitry and in the motor control field.
Strengths:
(1) The authors use an advanced computational model of spinal locomotor circuitry to investigate potential reorganization of neural connectivity underlying locomotor control following recovery from symmetrical midline thoracic contusion and asymmetrical (lateral) hemisection injuries, based on an extensive dataset for the rat model of spinal cord injury.
(2) The rat dataset used is from an in vivo experimental paradigm involving challenging animals to perform overground locomotion across the full range of speeds before and after the two distinct spinal cord injury models, enabling the authors to more completely reveal injury-specific deficits in speed-dependent interlimb coordination and locomotor gaits.
(3) The model reproduces the rat gait-related experimental data before injury and after recovery from these two different thoracic spinal cord injuries, which exhibit roughly comparable functional recovery, and suggests injury-specific, compensatory mechanisms of circuit reorganization underlying recovery.
(4) The model simulations suggest that recovery after lateral hemisection mechanistically involves partial functional restoration of descending drive and long propriospinal pathways, whereas recovery following midline contusion relies on reorganization of sublesional lumbar circuitry combined with altered descending control of cervical networks.
(5) These observations suggest that symmetrical (contusion) and asymmetrical (lateral hemisection) injuries induce distinct types of plasticity in different spinal cord regions, suggesting that injury symmetry partly dictates the location and type of neural plasticity supporting recovery.
(6) The authors suggest therapeutic strategies may be more effective by targeting specific circuits according to injury symmetry.
Weaknesses:
(1) The recovery mechanisms implemented in the model involve circuit connectivity/connection weights adjustment based on assumptions about the structures involved and compensatory responses to the injury. As the authors acknowledge, other factors affecting locomotor patterns and compensation, such as somatosensory afferent feedback, neurochemical modulator influences, and limb/body biomechanics, are not considered in the model. The authors have now more adequately discussed the limitations of the modeling and associated implications for functional interpretation.
Comments on revisions:
The authors have substantially improved the manuscript by including model parameter sensitivity analyses and by more adequately discussing the limitations of the modeling and associated implications for functional interpretation.
Reviewer #2 (Public review):
Summary:
In this paper, the authors present a detailed computational model and experimental data concerning over-ground locomotion in rats before and after recovery from spinal cord injury. They are able to manually tune the parameters of this physiologically based, detailed model to reproduce many aspects of the observed animals' locomotion in the naive case and in two distinct injury cases.
Strengths:
The strengths are that the model is driven to closely match clean experimental data, and the model itself has detailed correspondence to proposed anatomical reality. As such this makes the model more readily applicable to future experimental work. It can make useful suggestions. The model reproduces are large number of conditions, across frequencies, and with model structure changed by injury and recovery. The model is extensive and is driven by known structures, has links to genetic identities, and has been validated extensively across a number of experiments and manipulations over the years. It models a system of critical importance to the field, and the tight coupling to experimental data is a real strength.
Weaknesses:
A downside is that scientifically, here, the only question tackled is one of sufficiency. With manual tuning of parameters in a way that matches what the field believes/knows from experimental work, the detailed model can reproduce the experimental findings. One of the benefits of computational models is that the counter-factual can be tested to provide evidence against alternate hypotheses. That isn't really done here. I'm pretty sure there are competing theories of what happens during recovery from a hemi-section injury and contusion injury. The model could be used to make predictions for some alternate hypothesis, supporting or rejecting theories of recovery. This may be part of future plans. Here, the focus is on showing that the model is capable of reproducing the experimental results at all, for any set of parameters, however tuned.
Comments on revisions:
The authors have addressed my prior concerns and clearly discuss the sufficiency of the model, and strengthen the discussion with interesting findings for the role of propriospinal and commissural interneuronal pathways. This is a very nice contribution.
Reviewer #3 (Public review):
Summary:
This study describes a computational model of the rat spinal locomotor circuit and how it could be reconfigured after lateral hemisection or contusion injuries to replicate gaits observed experimentally.
The model suggests the emergence of detour circuits after lateral hemisection whereas after a midline contusion, the model suggests plasticity of left-right and sensory inputs below the injury.
Strengths:
The model accurately models many known connections within and between forelimb and hindlimb spinal locomotor circuits.
The simulation results mirror closely gait parameters observed experimentally. Many gait parameters were studied as well as variability in these parameters in intact versus injured conditions.
A sensitivity analysis provides some sense of the relative importance of the various modified connectivity after injury in setting the changes in gait seen after the two types of injuries
Overall, the authors achieved their aims and the model provides solid support for the changes in connectivity after the two types of injuries modelled. This work emphasizes specific changes in connectivity after lateral hemisection or after contusion that could be investigated experimentally. The model is available to be used by the public and could be a tool used to investigate the relative importance of various highlighted or undiscovered changes in connectivity that could underlie the recovery of locomotor function in spinalized rats.
Comments on revisions:
The authors addressed the comments made by the reviewers. The sensitivity analysis adds insights to the manuscript
Author response:
The following is the authors’ response to the original reviews.
Reviewer #1 (Public review):
Summary:
This is a rigorous data-driven modeling study, extending the authors' previous model of spinal locomotor central pattern generator (CPG) circuits developed for the mouse spinal cord and adapted here to the rat to explore potential circuit-level changes underlying altered speeddependent gaits, due to asymmetric (lateral) thoracic spinal hemisection and symmetric midline contusion. The model reproduces key features of the rat speed-dependent gait-related experimental data before injury and after recovery from these two different thoracic spinal cord injuries and suggests injury-specific mechanisms of circuit reorganization underlying functional recovery. There is much interest in the mechanisms of locomotor behavior recovery after spinal cord injury, and data-driven behaviorally relevant circuit modeling is an important approach. This study represents an important advance in the authors' previous experimental and modeling work on locomotor circuitry and in the motor control field.
Strengths:
(1) The authors use an advanced computational model of spinal locomotor circuitry to investigate potential reorganization of neural connectivity underlying locomotor control following recovery from symmetrical midline thoracic contusion and asymmetrical (lateral) hemisection injuries, based on an extensive dataset for the rat model of spinal cord injury.
(2) The rat dataset used is from an in vivo experimental paradigm involving challenging animals to perform overground locomotion across the full range of speeds before and after the two distinct spinal cord injury models, enabling the authors to more completely reveal injury-specific deficits in speed-dependent interlimb coordination and locomotor gaits.
(3) The model reproduces the rat gait-related experimental data before injury and after recovery from these two different thoracic spinal cord injuries, which exhibit roughly comparable functional recovery, and suggests injury-specific, compensatory mechanisms of circuit reorganization underlying recovery.
(4) The model simulations suggest that recovery after lateral hemisection mechanistically involves partial functional restoration of descending drive and long propriospinal pathways. In contrast, recovery following midline contusion relies on reorganization of sublesional lumbar circuitry combined with altered descending control of cervical networks.
(5) These observations suggest that symmetrical (contusion) and asymmetrical (lateral hemisection) injuries induce distinct types of plasticity in different spinal cord regions, suggesting that injury symmetry partly dictates the location and type of neural plasticity supporting recovery.
(6) The authors suggest that therapeutic strategies may be more effective by targeting specific circuits according to injury symmetry.
Weaknesses:
The recovery mechanisms implemented in the model involve circuit connectivity/connection weights adjustment based on assumptions about the structures involved and compensatory responses to the injury. As the authors acknowledge, other factors affecting locomotor patterns and compensation, such as somatosensory afferent feedback, neurochemical modulator influences, and limb/body biomechanics, are not considered in the model.
We appreciate the positive review and critical comments. We added a dedicate limitation and future direction section (see response recommendations below). Further, we also performed a sensitivity analysis: while the model still relies on a set of hypothesized connectivity changes, this analysis quantifies how robust our conclusions are to these parameter choices and indicates which pathways most strongly affect the recovered locomotor pattern.
Reviewer #1 (Recommendations for the authors):
The authors have used an advanced model of rodent spinal locomotor CPG circuits, adapted to the rat spinal cord, which remarkably reproduces the key features of the rat speed-dependent gait-related experimental data before injury and after recovery from the two different thoracic spinal cord injuries studied. Importantly, they have exploited the extensive dataset for the in vivo rat spinal cord injury model involving overground locomotion across the full range of speeds before and after the two distinct spinal cord injuries, enabling the authors to more completely reveal injury-specific deficits in speed-dependent interlimb coordination and locomotor gaits. The paper is well-written and well-illustrated.
(1) My only general suggestion is that the authors include a section that succinctly summarizes the limitations of the modeling and points to elaborations of the model and experimental data required for future studies. Some important caveats are dispersed throughout the Discussion, but a more consolidated section would be useful.
We added a dedicated Limitations and future directions section (page XX) that consolidates shortcomings and broadly outlines potential next steps in terms of modeling and experimental data. Specifically, we highlight the issue of lack of afferent feedback connections in the model, lack of consideration of biomechanic mechanisms, and restriction of the model to beneficial plasticity. To resolve these issues, we need neuromechancial models (integration of the neural circuits with a model of the musculoskeletal system), experimental data validating our predictions and data to constrain future models to be able to distinguish between beneficial and maladaptive plasticity.
(2) Please correct the Figure 11 legend title to indicate recovery after contusion (not hemisection).
Done. Thanks for noticing.
Reviewer #2 (Public review):
Summary:
In this paper, the authors present a detailed computational model and experimental data concerning overground locomotion in rats before and after recovery from spinal cord injury. They are able to manually tune the parameters of this physiologically based, detailed model to reproduce many aspects of the observed animals locomotion in the naive case and in two distinct injury cases.
Strengths:
The strengths are that the model is driven to closely match clean experimental data, and the model itself has detailed correspondence to proposed anatomical reality. As such, this makes the model more readily applicable to future experimental work. It can make useful suggestions. The model reproduces a large number of conditions across frequencies, and with the model structure changed by injury and recovery. The model is extensive and is driven by known structures, with links to genetic identities, and has been extensively validated across multiple experiments and manipulations over the years. It models a system of critical importance to the field, and the tight coupling to experimental data is a real strength.
Weaknesses:
A downside is that, scientifically, here, the only question tackled is one of sufficiency. By manually tuning parameters in a manner that aligns with the field's understanding from experimental work, the detailed model can accurately reproduce the experimental findings. One of the benefits of computational models is that the counterfactual can be tested to provide evidence against alternative hypotheses. That isn't really done here. I'm fairly certain that there are competing theories regarding what happens during recovery from a hemi-section injury and a contusion injury. The model could be used to make predictions for some alternative hypotheses, supporting or rejecting theories of recovery. This may be part of future plans. Here, the focus is on showing that the model is capable of reproducing the experimental results at all, for any set of parameters, however tuned.
We agree with the reviewer that the present study focuses on sufficiency, and we now explicitly acknowledge this in the revised limitations section. We also added sensitivity analysis (for details see response to reviewer 3) that provides an initial assessment of robustness to the assumed connectivity changes. We note that the model reproduces a broad set of experimentally observed features across the full range of locomotor frequencies (including loss and emergence of specific gaits, reduced maximum stepping frequency, and altered variability of interlimb phase differences) using only a small set of hypothesized circuit reorganizations that have been experimentally observed but previously only correlated with recovery. Our results therefore suggest that this limited set of changes is indeed sufficient to account for the complex pattern of recovered locomotor behavior.
Finally, although exploring alternative solutions is of interest, we believe such efforts will be most informative once afferent feedback is incorporated, which we see as the logical next step in our studies.
Reviewer #2 (Recommendations for the authors):
The paper could be strengthened with some more scientific interpretation and future directions. What are some novel predictions that can be made with the model, now that it has shown sufficiency here, that could guide future experimental work? Does it contradict in any way theories of CPG structure or neuronal plastic recovery?
The sensitivity analysis that we performed in response to reviewer 3’s suggestion expanded our interpretation/conclusions by showing that, although injury symmetry (contusion vs. lateral hemisection) influences which pathways reorganize, recovered locomotion across injury type depends most strongly on restored activation of lumbar rhythm-generating and strengths of lumbar commissural circuits.
Interestingly, this sensitivity analysis also showed that variations of strengths of long propriospinal pathways (ascending, descending, spared, injured-and-recovered) have a much smaller, almost negligible effect, when compared to variations of drive to lumbar rhythm generators or lumbar commissural interneuron connection weights in the same range (see Fig 13, 13-supplement 1 and 2). This is in accordance with our initial model suggestions that after contusion LPN connections weight had to be lowered to values substantially lower than what was expected by the severity of the injury. Which is also corroborated by our anatomical findings that in parallel to recovery from contusion, the number of synaptic connections by LAPNs to the cervical enlargement were reduced, and that silencing of LPNs post-contusion improves locomotion. These surprising findings have been extensively discussed in the discussion section.
Together, these findings suggest that experimental characterization of reorganization of the lumbar circuitry with a specific focus on commissural interneurons and inputs to the lumbar circuitry that could restore activation of sublesional lumbar rhythm generators is a crucial next step for understanding post-injury plasticity and recovery of locomotor function. This is now clearly discussed.
Finally, we note that a key contribution of this work is that the model demonstrates a plausible mechanistic link between specific circuit reorganizations and recovered locomotor function, a relationship previously supported mainly by correlative evidence.
Reviewer #3 (Public review):
Summary:
This study describes a computational model of the rat spinal locomotor circuit and how it could be reconfigured after lateral hemisection or contusion injuries to replicate gaits observed experimentally.
The model suggests the emergence of detour circuits after lateral hemisection, whereas after a midline contusion, the model suggests plasticity of left-right and sensory inputs below the injury.
Strengths:
The model accurately models many known connections within and between forelimb and hindlimb spinal locomotor circuits.
The simulation results mirror closely gait parameters observed experimentally. Many gait parameters were studied, as well as variability in these parameters in intact versus injured conditions.
Weaknesses:
The study could provide some sense of the relative importance of the various modified connectivities after injury in setting the changes in gait seen after the two types of injuries.
We performed a local sensitivity analysis of the hemisection and contusion models to identify which connectivity changes most strongly influence post-injury locomotor behavior. Key parameters (descending drive to sublesional rhythm generators and the strength of selected commissural and propriospinal pathways) were perturbed within 80–125% of their baseline values, and for each perturbation we quantified changes in model output using the Earth Mover’s Distance between baseline and perturbed simulations in a 7-dimensional space (six interlimb phase differences plus locomotor frequency). We then trained a surrogate model and computed Sobol first- and total-order sensitivity indices, which quantify how much each parameter and its interactions contribute to variability in this distance measure. This analysis showed that, across both injuries, variations in drive to sublesional lumbar rhythm generators and in lumbar V0/V3 commissural connectivity have the largest impact on recovered gait expression, whereas other pathways had comparatively minor effects within the tested range.
The sensitivity analysis further refined our conclusions by showing that, although injury symmetry (contusion vs. lateral hemisection) influences which pathways reorganize, effective recovery in both cases depends on re-engaging lumbar rhythm-generating and commissural circuits, highlighting these networks as key therapeutic targets.
Overall, the authors achieved their aims, and the model provides solid support for the changes in connectivity after the two types of injuries were modelled. This work emphasizes specific changes in connectivity after lateral hemisection or after contusion that could be investigated experimentally. The model is available for public use and could serve as a tool to analyze the relative importance of various highlighted or previously undiscovered changes in connectivity that may underlie the recovery of locomotor function in spinalized rats.
Reviewer #3 (Recommendations for the authors):
(1) It would be useful to study the sensitivity of the injured models to small changes in the connectivity changes to determine which ones play a greater role in the gait after injury.
See response above on the added sensitivity analysis.
(2) Was there any tissue analysis from the original experiments with the contusion experiments, as contusion experiments can be variable, so it would be good to know the level of variability in the injuries?
Unfortunately, we were unable to complete tissue analysis of the injury epicenters for these animals because the tissue was not handled appropriately for histology. However, in the past, comparable animals with T10 12.5g-cm contusion injuries delivered by the NYU (MASCIS) Impactor had variability of up to ~30% of the mean (spared white matter, e.g. see Smith et al., 2006). It is also worth noting that spared white matter at the epicenter, at least in our hands, is generally well-correlated with BBB overground locomotor scale scores.
(3) There is more variability in phase difference in rats than model in the lateral hemisection. Is there any way to figure out which of the connectivity changes is most responsible for that variability?
We agree that the variability of phase differences after lateral hemisection is larger in rats than in the model. One possible contributor to this discrepancy is the strength of spared long propriospinal neuron (LPN) pathways, which we kept fixed at pre-injury levels in the model. As an exploratory analysis, we varied the weights of these spared LPN connections and quantified the circular standard deviation of the phase differences (Author response image 1). Decreasing spared LPN weights increased the variability of all phase differences. This suggests that plasticity of spared LPNs (potentially reducing their effective connectivity and partly compensating for the asymmetry introduced by the lesion) could contribute to the higher variability seen in vivo. However, because these results remain speculative, we chose to include them in this response only and not in the main manuscript.
Author response image 1.
Variability of phase differences as a function of spared long propriospinal neuron connection weights (hemisection model).
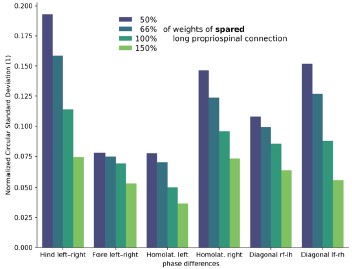
eLife Assessment
This paper provides important findings towards understanding the role of the lncRNA EPB41L4A-AS1 in a human cell line. The data is generally convincing, supported by extensive and clever integrative analysis. The work provides insights into how this lncRNA regulates gene expression via complex mechanisms; however the biological relevance awaits validation in other models.
Reviewer #1 (Public review):
Monziani and Ulitsky present a large and exhaustive study on the lncRNA EPB41L4A-AS1 using a variety of genomic methods. They uncover a rather complex picture of a RNA transcript that appears to act via diverse pathways to regulate large numbers of genes' expression, including many snoRNAs. The activity of EPB41L4A-AS1 seems to be intimately linked with the protein SUB1, via both direct physical interactions and direct/indirect of SUB1 mRNA expression.
The study is characterised by thoughtful, innovative, integrative genomic analysis. It is shown that EPB41L4A-AS1 interacts with SUB1 protein and that this may lead to extensive changes in SUB1's other RNA partners. Disruption of EPB41L4A-AS1 leads to widespread changes in non-polyA RNA expression, as well as local cis changes. At the clinical level, it is possible that EPB41L4A-AS1 plays disease relevant roles, although these seem to be somewhat contradictory with evidence supporting both oncogenic and tumour suppressive activities.
A couple of issues could be better addressed here. Firstly, the copy number of EPB41L4A-AS1 is an important missing piece of the puzzle. It is apparently highly expressed from the FISH experiments. To get an understanding of how EPB41L4A-AS1 regulates SUB1, an abundant protein, we need to know the relative stoichiometry of these two factors. Secondly, while many of the experiments use two independent Gapmers for EPB41L4A-AS1 knockdown, the RNA-sequencing experiments apparently use just one, with one negative control (?). Evidence is emerging that Gapmers produce extensive off target gene expression effects in cells, potentially exceeding the amount of on-target changes arising through the intended target gene. Therefore, it is important to estimate this through use of multiple targeting and non-targeting ASOs, if one is to get a true picture of EPB41L4A-AS1 target genes. In this Reviewer's opinion, this casts some doubt over interpretation of RNA-seq experiments until that work is done. Nonetheless, the Authors have designed thorough experiments, including overexpression rescue overexpression constructs, to quite confidently assess the role of EPB41L4A-AS1 in snoRNA expression.
It is possible that EPB41L4A-AS1 plays roles in cancer, either as oncogene or tumour suppressor. However it will in future be important to extend these observations to a greater variety of cell contexts.
This work is valuable in providing an extensive and thorough analysis of the global mechanisms of an important regulatory lncRNA, and highlights the complexity of such mechanisms via cis and trans regulation and extensive protein interactions.
Reviewer #2 (Public review):
Summary:
In this manuscript, Monziani et al. identified long noncoding RNAs (lncRNAs) that act in cis and are coregulated with their target genes located in close genomic proximity. The authors mined the GeneHancer database, and this analysis led to the identification of four lncRNA-target pairs. The authors decided to focus on lncRNA EPB41L4A-AS1.
They thoroughly characterised this lncRNA, demonstrating that it is located in the cytoplasm and the nuclei, and that its expression is altered in response to different stimuli. Furthermore, the authors showed that EPB41L4A-AS1 regulates EPB41L4A transcription, leading to a mild reduction in EPB41L4A protein levels. This was not recapitulated with sirna-mediated depletion of EPB41L4AAS1. RNA-seq in EPB41L4A-AS1 depleted cells with single LNA revealed 2364 DEGs linked to pathways including the cell cycle, cell adhesion, and inflammatory response. To understand the mechanism of action of EPB41L4A-AS1, the authors mined the ENCODE eCLIP data and identified SUB1 as an lncRNA interactor. The authors also found that the loss of EPB41L4A-AS1 and SUB1 leads to the accumulation of snoRNAs, and that SUB1 localisation changes upon the loss of EPB41L4A-AS1. Finally, the authors showed that EPB41L4A-AS1 deficiency did not change the steady-state levels of SNORA13 nor RNA modification driven by this RNA. The phenotype associated with the loss of EPB41L4A-AS1 is linked to increased invasion and EMT gene signature.
Overall, this is an interesting and nicely done study on the versatile role of EPB41L4A-AS1 and the multifaceted interplay between SUB1 and this lncRNA, but some conclusions and claims need to be supported with additional experiments before publication. My primary concerns are using a single LNA gapmer for critical experiments, increased invasion and nucleolar distribution of SUB1- in EPB41L4A-AS1-depleted cells.
Strengths:
The authors used complementary tools to dissect the complex role of lncRNA EPB41L4A-AS1 in regulating EPB41L4A, which is highly commendable. There are few papers in the literature on lncRNAs at this standard. They employed LNA gapmers, siRNAs, CRISPRi/a, and exogenous overexpression of EPB41L4A-AS1 to demonstrate that the transcription of EPB41L4A-AS1 acts in cis to promote the expression of EPB41L4A by ensuring spatial proximity between the TAD boundary and the EPB41L4A promoter. At the same time, this lncRNA binds to SUB1 and regulates snoRNA expression and nucleolar biology. Overall, the manuscript is easy to read, and the figures are well presented. The methods are sound, and the expected standards are met.
Weaknesses:
The authors should clarify how many lncRNA-target pairs were included in the initial computational screen for cis-acting lncRNAs and why MCF7 was chosen as the cell line of choice. Most of the data uses a single LNA gapmer targeting EPB41L4A-AS1 lncrna (eg, Fig. 2c, 3B and RNA-seq), and the critical experiments should be using at least 2 LNA gapmers. The specificity of SUB1 CUT&RUN is lacking, as well as direct binding of SUB1 to lncRNA EPB41L4A-AS1, which should be confirmed by CLIP qPCR in MCF7 cells. Finally, the role of EPB41L4A-AS1 in SUB1 distribution (Fig. 5) and cell invasion (Fig. 8) needs to be complemented with additional experiments, which should finally demonstrate the role of this lncRNA in nucleolus and cancer-associated pathways. The use of MCF7 as a single cancer cell line is not ideal.
Revised version of the manuscript:
The authors have addressed many of my concerns in their revised manuscript:
The use of single gapmers has been adequately addressed in the revised version of the manuscript, as well as CUT RUN for SUb1.
Future studies will address the role of this lncRNA in invasion and migration using more relevant and appropriate cellular assays. In addition, nucleolar fractionation and analysis of rRNA synthesis are recommended in the follow-up studies for EPB41L4A-AS1.
Reviewer #3 (Public review):
Summary:
In Monziani et al. paper entitled: "EPB41L4A-AS1 long noncoding RNA acts in both cis- and trans-acting transcriptional regulation and controls nucleolar biology", the authors made some interesting observations that EPB41L4A-AS1 lncRNA can regulate the transcription of both the nearby coding gene and genes on other chromosomes. They started by computationally examining lncRNA-gene pairs by analyzing co-expression, chromatin features of enhancers, TF binding, HiC connectome and eQTLs. They then zoomed in on four pairs of lncRNA-gene pairs and used LNA antisense oligonucleotides to knock down these lncRNAs. This revealed EPB41L4A-AS1 as the only one that can regulate the expression of its cis-gene target EPB41L4A. By RNA-FISH, the authors found this lncRNA to be located in all three parts of a cell: chromatin, nucleoplasm and cytoplasm. RNA-seq after LNA knockdown of EPB41L4A-AS1 showed that this increased >1100 genes and decreased >1250 genes, including both nearby genes and genes on other chromosomes. They later found that EPB41L4A-AS1 may interact with SUB1 protein (an RNA binding protein) to impact the target genes of SUB1. EPB41L4A-AS1 knockdown reduced the mRNA level of SUB1 and altered the nuclear location of SUB1. Later, the authors observed that EPB41L4A-AS1 knockdown caused increase of snRNAs and snoRNAs, likely via disrupted SUB1 function. In the last part of the paper, the authors conducted rescue experiments that suggested that the full-length, intron- and SNORA13-containing EPB41L4A-AS1 is required to partially rescue snoRNA expression. They also conducted SLAM-Seq and showed that the increased abundance of snoRNAs is primarily due to their hosts' increased transcription and stability. They end with data showing that EPB41L4A-AS1 knockdown reduced MCF7 cell proliferation but increased its migration, suggesting a link to breast cancer progression and/or metastasis.
Strengths:
The strength of the paper includes: it is overall well-written; the results are overall presented with good technical rigor and appropriate interpretation. The observation that a complex lncRNA EPB41L4A-AS1 regulates both cis and trans target genes, if fully proven, is interesting and important.
Weaknesses:
The weakness includes: the paper is a bit disjointed as it started from cis and trans gene regulation, but later it switched to a partially relevant topic of snoRNA metabolism via SUB1; the paper was limited in the mechanisms as to how these trans genes (including SUB1 or NPM1 genes themselves) are affected by EPB41L4A-AS1 knockdown; there are discrepancy of results upon EPB41L4A-AS1 knockdown by LNA versus by CRISPR activation, or by plasmid overexpression of this lncRNA.
Overall, the data is supportive of a role of this lncRNA in regulating cis and trans target genes, and thereby impacting cellular phenotypes.
Author response:
The following is the authors’ response to the original reviews.
Public Reviews:
Reviewer #1 (Public review):
Monziani and Ulitsky present a large and exhaustive study on the lncRNA EPB41L4A-AS1 using a variety of genomic methods. They uncover a rather complex picture of an RNA transcript that appears to act via diverse pathways to regulate the expression of large numbers of genes, including many snoRNAs. The activity of EPB41L4A-AS1 seems to be intimately linked with the protein SUB1, via both direct physical interactions and direct/indirect of SUB1 mRNA expression.
The study is characterised by thoughtful, innovative, integrative genomic analysis. It is shown that EPB41L4A-AS1 interacts with SUB1 protein and that this may lead to extensive changes in SUB1's other RNA partners. Disruption of EPB41L4A-AS1 leads to widespread changes in non-polyA RNA expression, as well as local cis changes. At the clinical level, it is possible that EPB41L4A-AS1 plays disease-relevant roles, although these seem to be somewhat contradictory with evidence supporting both oncogenic and tumour suppressive activities.
A couple of issues could be better addressed here. Firstly, the copy number of EPB41L4A-AS1 is an important missing piece of the puzzle. It is apparently highly expressed in the FISH experiments. To get an understanding of how EPB41L4A-AS1 regulates SUB1, an abundant protein, we need to know the relative stoichiometry of these two factors. Secondly, while many of the experiments use two independent Gapmers for EPB41L4A-AS1 knockdown, the RNA-sequencing experiments apparently use just one, with one negative control (?). Evidence is emerging that Gapmers produce extensive off-target gene expression effects in cells, potentially exceeding the amount of on-target changes arising through the intended target gene. Therefore, it is important to estimate this through the use of multiple targeting and non-targeting ASOs, if one is to get a true picture of EPB41L4A-AS1 target genes. In this Reviewer's opinion, this casts some doubt over the interpretation of RNA-seq experiments until that work is done. Nonetheless, the Authors have designed thorough experiments, including overexpression rescue constructs, to quite confidently assess the role of EPB41L4A-AS1 in snoRNA expression.
It is possible that EPB41L4A-AS1 plays roles in cancer, either as an oncogene or a tumour suppressor. However, it will in the future be important to extend these observations to a greater variety of cell contexts.
This work is valuable in providing an extensive and thorough analysis of the global mechanisms of an important regulatory lncRNA and highlights the complexity of such mechanisms via cis and trans regulation and extensive protein interactions.
Reviewer #2 (Public review):
Summary:
In this manuscript, Monziani et al. identified long noncoding RNAs (lncRNAs) that act in cis and are coregulated with their target genes located in close genomic proximity. The authors mined the GeneHancer database, and this analysis led to the identification of four lncRNA-target pairs. The authors decided to focus on lncRNA EPB41L4A-AS1.
They thoroughly characterised this lncRNA, demonstrating that it is located in the cytoplasm and the nuclei, and that its expression is altered in response to different stimuli. Furthermore, the authors showed that EPB41L4A-AS1 regulates EPB41L4A transcription, leading to a mild reduction in EPB41L4A protein levels. This was not recapitulated with siRNA-mediated depletion of EPB41L4AAS1. RNA-seq in EPB41L4A-AS1-depleted cells with single LNA revealed 2364 DEGs linked to pathways including the cell cycle, cell adhesion, and inflammatory response. To understand the mechanism of action of EPB41L4A-AS1, the authors mined the ENCODE eCLIP data and identified SUB1 as an lncRNA interactor. The authors also found that the loss of EPB41L4A-AS1 and SUB1 leads to the accumulation of snoRNAs, and that SUB1 localisation changes upon the loss of EPB41L4A-AS1. Finally, the authors showed that EPB41L4A-AS1 deficiency did not change the steady-state levels of SNORA13 nor RNA modification driven by this RNA. The phenotype associated with the loss of EPB41L4A-AS1 is linked to increased invasion and EMT gene signature.
Overall, this is an interesting and nicely done study on the versatile role of EPB41L4A-AS1 and the multifaceted interplay between SUB1 and this lncRNA, but some conclusions and claims need to be supported with additional experiments. My primary concerns are using a single LNA gapmer for critical experiments, increased invasion, and nucleolar distribution of SUB1- in EPB41L4A-AS1-depleted cells. These experiments need to be validated with orthogonal methods.
Strengths:
The authors used complementary tools to dissect the complex role of lncRNA EPB41L4A-AS1 in regulating EPB41L4A, which is highly commendable. There are few papers in the literature on lncRNAs at this standard. They employed LNA gapmers, siRNAs, CRISPRi/a, and exogenous overexpression of EPB41L4A-AS1 to demonstrate that the transcription of EPB41L4A-AS1 acts in cis to promote the expression of EPB41L4A by ensuring spatial proximity between the TAD boundary and the EPB41L4A promoter. At the same time, this lncRNA binds to SUB1 and regulates snoRNA expression and nucleolar biology. Overall, the manuscript is easy to read, and the figures are well presented. The methods are sound, and the expected standards are met.
Weaknesses:
The authors should clarify how many lncRNA-target pairs were included in the initial computational screen for cis-acting lncRNAs and why MCF7 was chosen as the cell line of choice. Most of the data uses a single LNA gapmer targeting EPB41L4A-AS1 lncRNA (eg, Fig. 2c, 3B, and RNA-seq), and the critical experiments should be using at least 2 LNA gapmers. The specificity of SUB1 CUT&RUN is lacking, as well as direct binding of SUB1 to lncRNA EPB41L4A-AS1, which should be confirmed by CLIP qPCR in MCF7 cells. Finally, the role of EPB41L4A-AS1 in SUB1 distribution (Figure 5) and cell invasion (Figure 8) needs to be complemented with additional experiments, which should finally demonstrate the role of this lncRNA in nucleolus and cancer-associated pathways. The use of MCF7 as a single cancer cell line is not ideal.
Reviewer #3 (Public review):
Summary:
In this paper, the authors made some interesting observations that EPB41L4A-AS1 lncRNA can regulate the transcription of both the nearby coding gene and genes on other chromosomes. They started by computationally examining lncRNA-gene pairs by analyzing co-expression, chromatin features of enhancers, TF binding, HiC connectome, and eQTLs. They then zoomed in on four pairs of lncRNA-gene pairs and used LNA antisense oligonucleotides to knock down these lncRNAs. This revealed EPB41L4A-AS1 as the only one that can regulate the expression of its cis-gene target EPB41L4A. By RNA-FISH, the authors found this lncRNA to be located in all three parts of a cell: chromatin, nucleoplasm, and cytoplasm. RNA-seq after LNA knockdown of EPB41L4A-AS1 showed that this increased >1100 genes and decreased >1250 genes, including both nearby genes and genes on other chromosomes. They later found that EPB41L4A-AS1 may interact with SUB1 protein (an RNA-binding protein) to impact the target genes of SUB1. EPB41L4A-AS1 knockdown reduced the mRNA level of SUB1 and altered the nuclear location of SUB1. Later, the authors observed that EPB41L4A-AS1 knockdown caused an increase of snRNAs and snoRNAs, likely via disrupted SUB1 function. In the last part of the paper, the authors conducted rescue experiments that suggested that the full-length, intron- and SNORA13-containing EPB41L4A-AS1 is required to partially rescue snoRNA expression. They also conducted SLAM-Seq and showed that the increased abundance of snoRNAs is primarily due to their hosts' increased transcription and stability. They end with data showing that EPB41L4A-AS1 knockdown reduced MCF7 cell proliferation but increased its migration, suggesting a link to breast cancer progression and/or metastasis.
Strengths:
Overall, the paper is well-written, and the results are presented with good technical rigor and appropriate interpretation. The observation that a complex lncRNA EPB41L4A-AS1 regulates both cis and trans target genes, if fully proven, is interesting and important.
Weaknesses:
The paper is a bit disjointed as it started from cis and trans gene regulation, but later it switched to a partially relevant topic of snoRNA metabolism via SUB1. The paper did not follow up on the interesting observation that there are many potential trans target genes affected by EPB41L4A-AS1 knockdown and there was limited study of the mechanisms as to how these trans genes (including SUB1 or NPM1 genes themselves) are affected by EPB41L4A-AS1 knockdown. There are discrepancies in the results upon EPB41L4A-AS1 knockdown by LNA versus by CRISPR activation, or by plasmid overexpression of this lncRNA.
Recommendations for the authors:
Reviewer #1 (Recommendations for the authors):
(1) Copy number:
Perhaps I missed it, but it seems that no attempt is made to estimate the number of copies of EPB41L4A-AS1 transcripts per cell. This should be possible given RNAseq and FISH. At least an order of magnitude estimate. This is important for shedding light on the later observations that EPB41L4A-AS1 may interact with SUB1 protein and regulate the expression of thousands of mRNAs.
We thank the reviewer for the insightful suggestion. We agree that an estimate of EPB41L4A-AS1 copy number might further strengthen the hypotheses presented in the manuscript. Therefore, we analyzed the smFISH images and calculated the copy number per cell of this lncRNA, as well as that of GAPDH as a comparison.
Because segmenting MCF-7 cells proved to be difficult due to the extent of the cell-cell contacts they establish, we imaged multiple (n = 14) fields of view, extracted the number of EPB41L4A-AS1/GAPDH molecules in each field and divided them by the number of cells (as assessed by DAPI staining, 589 cells in total). We detected an average of 33.37 ± 3.95 EPB41L4A-AS1 molecules per cell, in contrast to 418.27 ± 61.79 GAPDH molecules. As a comparison, within the same qPCR experiment the average of the Ct values of these two RNAs is about 22.3 and 17.5, the FPKMs in the polyA+ RNA-seq are ~ 2479.4 and 35.6, and the FPKMs in the rRNA-depleted RNA-seq are ~ 3549.9 and 19.3, respectively. Thus, our estimates of the EPB41L4A-AS1 copy number in MCF-7 cells fits well into these observations.
The question whether an average of ~35 molecules per cell is sufficient to affect the expression of thousands of genes is somewhat more difficult to ascertain. As discussed below, it is unlikely that all the genes dysregulated following the KD of EPB41L4A-AS1 are all direct targets of this lncRNA, and indeed SUB1 depletion affects an order of magnitude fewer genes. It has been shown that lncRNAs can affect the behavior of interacting RNAs and proteins in a substoichiometric fashion (Unfried & Ulitsky, 2022), but whether this applies to EPB41L4A-AS1 remains to be addressed in future studies. Nonetheless, this copy number appears to be sufficient for a trans-acting functions for this lncRNA, on top of its cis-regulatory role in regulating EPB41L4A. We added this information in the text as follows:
“Using single-molecule fluorescence in-situ hybridization (smFISH) and subcellular fractionation we found that EPB41L4A-AS1 is expressed at an average of 33.37 ± 3.95 molecule per cell, and displays both nuclear and cytoplasmic localization in MCF-7 cells (Fig. 1D), with a minor fraction associated with chromatin as well (Fig. 1E).”
We have updated the methods section as well:
“To visualize the subcellular localization of EPB41L4A-AS1 in vivo, we performed single-molecule fluorescence in situ hybridization (smFISH) using HCR™ amplifiers. Probe sets (n = 30 unique probes) targeting EPB41L4A-AS1 and GAPDH (positive control) were designed and ordered from Molecular Instruments. We followed the Multiplexed HCR v3.0 protocol with minor modifications. MCF-7 cells were plated in 8-well chambers (Ibidi) and cultured O/N as described above. The next day, cells were fixed with cold 4% PFA in 1X PBS for 10 minutes at RT and then permeabilized O/N in 70% ethanol at -20°C. Following permeabilization, cells were washed twice with 2X SSC buffer and incubated at 37°C for 30 minutes in hybridization buffer (HB). The HB was then replaced with a probe solution containing 1.2 pmol of EPB41L4A-AS1 probes and 0.6 pmol of GAPDH probes in HB. The slides were incubated O/N at 37°C. To remove excess probes, the slides were washed four times with probe wash buffer at 37°C for 5 minutes each, followed by two washes with 5X SSCT at RT for 5 minutes. The samples were then pre-amplified in amplification buffer for 30 minutes at RT and subsequently incubated O/N in the dark at RT in amplification buffer supplemented with 18 pmol of the appropriate hairpins. Finally, excess hairpins were removed by washing the slides five times in 5X SSCT at RT. The slides were mounted with ProLong™ Glass Antifade Mountant (Invitrogen), cured O/N in the dark at RT, and imaged using a Nikon CSU-W1 spinning disk confocal microscope. In order to estimate the RNA copy number, we imaged multiple distinct fields, extracted the number of EPB41L4A-AS1/GAPDH molecules in each field using the “Find Maxima” tool in ImageJ/Fiji, and divided them by the number of cells (as assessed by DAPI staining).”
(2) Gapmer results:
Again, it is quite unclear how many and which Gapmer is used in the genomics experiments, particularly the RNA-seq. In our recent experiments, we find very extensive off-target mRNA changes arising from Gapmer treatment. For this reason, it is advisable to use both multiple control and multiple targeting Gapmers, so as to identify truly target-dependent expression changes. While I acknowledge and commend the latter rescue experiments, and experiments using multiple Gapmers, I'd like to get clarification about how many and which Gapmers were used for RNAseq, and the authors' opinion on the need for additional work here.
We agree with the Reviewer that GapmeRs are prone to off-target and unwanted effects (Lai et al., 2020; Lee & Mendell, 2020; Maranon & Wilusz, 2020). Early in our experiments, we found out that LNA1 triggers a non-specific CDKN1A/p21 activation (Fig. S5A-C), and thus, we have initially performed some experiments such as RNA-seq with only LNA2.
Nonetheless, other experiments were performed using both GapmeRs, such as multiple RT-qPCRs, UMI-4C, SUB1 and NPM1 imaging, and the in vitro assays, among others, and consistent results were obtained with both LNAs.
To accommodate the request by this and the other reviewers, we have now performed another round of polyA+ RNA-seq following EPB41L4A-AS1 knockdown using LNA1 or LNA2, as well as the previously used and an additional control GapmeR. The FPKMs of the control samples are highly-correlated both within replicates and between GapmeRs (Fig. S6A). More importantly, the fold-changes to control are highly correlated between the two on-target GapmeRs LNA1 and LNA2, regardless of the GapmeR used for normalization (Fig. S6B), thus showing that the bulk of the response is shared and likely the direct result of the reduction in the levels of EPB41L4A-AS1. Notably, key targets NPM1 and MTREX (see discussion, Fig. S12A-C and comments to Reviewer 3) were found to be downregulated by both LNAs (Fig. S6C).
However, we acknowledge that some of the dysregulated genes are observed only when using one GapmeR and not the other, likely due to a combination of indirect, secondary and non-specific effects, and as such it is difficult to infer the direct response. Supporting this, LNA2 yielded a total of 1,069 DEGs (617 up and 452 down) and LNA1 2,493 DEGs (1,328 up and 1,287 down), with the latter triggering a stronger response most likely as a result of the previously mentioned CDKN1A/p21 induction. Overall, 45.1% of the upregulated genes following LNA2 transfection were shared with LNA1, in contrast to only the 24.3% of the downregulated ones.
We have now included these results in the Results section (see below) and in Supplementary Figure (Fig. S6).
“Most of the consequences of the depletion of EPB41L4A-AS1 are thus not directly explained by changes in EPB41L4A levels. An additional trans-acting function for EPB41L4A-AS1 would therefore be consistent with its high expression levels compared to most lncRNAs detected in MCF-7 (Fig. S5G). To strengthen these findings, we have transfected MCF-7 cells with LNA1 and a second control GapmeR (NT2), as well as the previous one (NT1) and LNA2, and sequenced the polyadenylated RNA fraction as before. Notably, the expression levels (in FPKMs) of the replicates of both control samples are highly correlated with each other (Fig. S6A), and the global transcriptomic changes triggered by the two EPB41L4A-AS1-targeting LNAs are largely concordant (Fig. S6B and S6C). Because of this concordance and the cleaner (i.e., no CDKN1A upregulation) readout in LNA2-transfected cells, we focused mainly on these cells for subsequent analyses.”
(3) Figure 1E:
Can the authors comment on the unusual (for a protein-coding mRNA) localisation of EPB41L4A, with a high degree of chromatin enrichment?
We acknowledge that mRNAs from protein-coding genes displaying nuclear and chromatin localizations are quite unusual. The nuclear and chromatin localization of some mRNAs are often due to their low expression, length, time that it takes to be transcribed, repetitive elements and strong secondary structures (Bahar Halpern et al., 2015; Didiot et al., 2018; Lubelsky & Ulitsky, 2018; Ly et al., 2022).
We now briefly mention this in the text:
“In contrast, both EPB41L4A and SNORA13 were mostly found in the chromatin fraction (Fig. 1E), the former possibly due to the length of its pre-mRNA (>250 kb), which would require substantial time to transcribe (Bahar Halpern et al., 2015; Didiot et al., 2018; Lubelsky & Ulitsky, 2018; Ly et al., 2022).”
Supporting our results, analysis of the ENCODE MCF-7 RNA-seq data of the cytoplasmic, nuclear and total cell fractions indeed shows a nuclear enrichment of the EPB41L4A mRNA (Author response image 1), in line with what we observed in Fig. 1E by RT-qPCR.
Author response image 1.
The EPB41L4A transcript is nuclear-enriched in the MCF-7 ENCODE subcellular RNA-seq dataset. Scatterplot of gene length versus cytoplasm/nucleus ratio (as computed by DESeq2) in MCF-7 cells. Each dot represents an unique gene, color-coded reflecting if their DESeq2 adjusted p-value < 0.05 and absolute log<sub>2</sub>FC > .41 (33% enrichment or depletion).GAPDH and MALAT1 are shown as representative cytoplasmic and nuclear transcripts, respectively. Data from ENCODE.
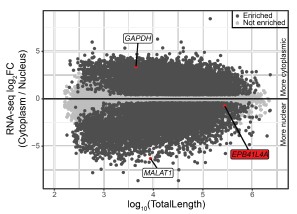
(4) Annotation and termini of EPB41L4A-AS1:
The latest Gencode v47 annotations imply an overlap of the sense and antisense, different from that shown in Figure 1C. The 3' UTR of EPB41L4A is shown to extensively overlap EPB41L4A-AS1. This could shed light on the apparent regulation of the former by the latter that is relevant for this paper. I'd suggest that the authors update their figure of the EPB41L4A-AS1 locus organisation with much more detail, particularly evidence for the true polyA site of both genes. What is more, the authors might consider performing RACE experiments for both RNAs in their cells to definitely establish whether these transcripts contain complementary sequence that could cause their Watson-Crick hybridisation, or whether their two genes might interfere with each other via some kind of polymerase collision.
We thank the reviewer for pointing this out. Also in previous GENCODE annotations, multiple isoforms were reported with some overlapping the 3’ UTR of EPB41L4A. In the EPB41L4A-AS1 locus image (Fig. 1C), we report at the bottom the different transcripts isoforms currently annotated, and a schematics of the one that is clearly the most abundant in MCF-7 cells based on RNA-seq read coverage. This is supported by both the polyA(+) and ribo(-) RNA-seq data, which are strand-specific, as shown in the figure.
We now also examined the ENCODE/CSHL MCF-7 RNA-seq data from whole cell, cytoplasm and nucleus fractions, as well as 3P-seq data (Jan et al., 2011) (unpublished data from human cell lines), reported in Author response image 2. All these data support the predominant use of the proximal polyA site in human cell lines. This shorter isoform does not overlap EPB41L4A.
Author response image 2.
Most EPB41L4A-AS1 transcripts end before the 3’ end of EPB41L4A. UCSC genome browser view showing tracks from 3P-seq data in different cell lines and neural crest (top, with numbers representing the read counts, i.e. how many times that 3’ end has been detected), and stranded ENCODE subcellular RNA-seq (bottom).
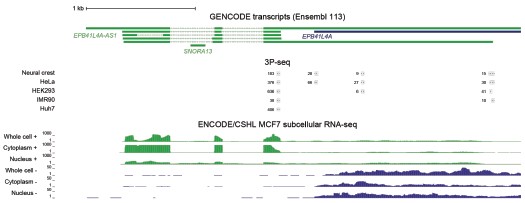
Based on these data, the large majority of cellular transcripts of EPB41L4A-AS1 terminate at the earlier polyA site and don’t overlap with EPB41L4A. There is a small fraction that appears to be restricted to the nucleus that terminates later at the annotated isoform. 3' RACE experiments are not expected to provide substantially different information beyond what is already available.
(5) Figure 3C:
There is an apparent correlation between log2FC upon EPB41L4A-AS1 knockdown, and the number of clip sites for SUB1. However, I expect that the clip signal correlates strongly with the mRNA expression level, and that log2FC may also correlate with the same. Therefore, the authors would be advised to more exhaustively check that there really is a genuine relationship between log2FC and clip sites, after removing any possible confounders of overall expression level.
As the reviewer suggested, there is a correlation between the baseline expression level and the strength of SUB1 binding in the eCLIP data. To address this issue, we built expression-matched controls for each group of SUB1 interactors and checked the fold-changes following EPB41L4A-AS1 KD, similarly to what we have done in Fig. 3C. The results are presented, and are now part of Supplementary Figure 7 (Fig. S7C).
Based on this analysis, while there is a tendency of increased expression with increased SUB1 binding, when controlling for expression levels the effect of down-regulation of SUB1-bound RNAs upon lncRNA knockdown remains, suggesting that it is not merely a confounding effect. We have updated the text as follows:
“We hypothesized that loss of EPB41L4A-AS1 might affect SUB1, either via the reduction in its expression or by affecting its functions. We stratified SUB1 eCLIP targets into confidence intervals, based on the number, strength and confidence of the reported binding sites. Indeed, eCLIP targets of SUB1 (from HepG2 cells profiled by ENCODE) were significantly downregulated following EPB41L4A-AS1 KD in MCF-7, with more confident targets experiencing stronger downregulation (Fig. 3C). Importantly, this still holds true when controlling for gene expression levels (Fig. S7C), suggesting that this negative trend is not due to differences in their baseline expression.”
(6) The relation to cancer seems somewhat contradictory, maybe I'm missing something. Could the authors more clearly state which evidence is consistent with either an Oncogene or a Tumour Suppressive function, and discuss this briefly in the Discussion? It is not a problem if the data are contradictory, however, it should be discussed more clearly.
We acknowledge this apparent contradiction. Cancer cells are characterized by a multitude of hallmarks depending on the cancer type and stage, including high proliferation rates and enhanced invasive capabilities. The notion that cells with reduced EPB41L4A-AS1 levels exhibit lower proliferation, yet increased invasion is compatible with a function as an oncogene. Cells undergoing EMT may reduce or even completely halt proliferation/cell division, until they revert back to an epithelial state (Brabletz et al., 2018; Dongre & Weinberg, 2019). Notably, downregulated genes following EPB41L4A-AS1 KD are enriched in GO terms related to cell proliferation and cell cycle progression (Fig. 2I), whereas those upregulated are enriched for terms linked to EMT processes. Thus, while we cannot rule out a potential function as tumor suppressor gene, our data fit better the notion that EPB41L4A-AS1 promotes invasion, and thus, primarily functions as an oncogene. We now address this in point in the discussion:
“The notion that cells with reduced EPB41L4A-AS1 levels exhibit lower proliferation (Fig. 8C), yet increased invasion (Fig. 8A and 8B) is compatible with a function as an oncogene by promoting EMT (Fig. 8D and 8E). Cells undergoing this process may reduce or even completely halt proliferation/cell division, until they revert back to an epithelial state (Brabletz et al., 2018; Dongre & Weinberg, 2019). Notably, downregulated genes following EPB41L4A-AS1 KD are enriched in GO terms related to cell proliferation and cell cycle progression (Fig. 2I), whereas those upregulated for terms linked to EMT processes. Thus, while we cannot rule out a potential function as tumor suppressor gene, our data better fits the idea that this lncRNA promotes invasion, and thus, primarily functions as an oncogene.”
Reviewer #2 (Recommendations for the authors):
Below are major and minor points to be addressed. We hope the authors find them useful.
(1) Figure 1:
Where are LNA gapmers located within the EPB41L4A-AS1 gene? Are they targeting exons or introns of the EPB41L4A-AS1? Please clarify or include in the figure.
We now report the location of the two GapmeRs in Fig. 1C. LNA1 targets the intronic region between SNORA13 and exon 2, and LNA2 the terminal part of exon 1.
(2) Figure 2B:
Why is a single LNA gapmer used for EPB41L4A Western? In addition, are the qPCR data in Figure 2B the same as in Figure 1B? Please clarify.
The Western Blot was performed after transfecting the cells with either LNA1 or LNA2. We now have replaced Fig. 2C with the full Western Blot image, in order to show both LNAs. With respect to the qPCRs in Fig. 1B and 2B, they represent the results from two independent experiments.
(3) Figure 2F:
2364 DEGs for a single LNA is a lot of deregulated genes in RNA-seq data. How do the authors explain such a big number in DEGs? Is that because this LNA was intronic? Additional LNA gapmer would minimise the "real" lncRNA target and any potential off-target effect.
We agree with the Reviewer that GapmeRs are prone to off-target and unwanted effects (Lai et al.,2020; Lee & Mendell, 2020; Maranon & Wilusz, 2020). Early in our experiments, we found out that LNA1 triggers a non-specific CDKN1A/p21 activation (Fig. S5A-C), and thus, we have initially performed some experiments such as RNA-seq with only LNA2.
Nonetheless, other experiments were performed using both GapmeRs, such as multiple RT-qPCRs, UMI-4C, SUB1 and NPM1 imaging, and the in vitro assays, among others, and consistent results were obtained with both LNAs.
To accommodate the request by this and the other reviewers, we have now performed another round of polyA+ RNA-seq following EPB41L4A-AS1 knockdown using LNA1 or LNA2, as well as the previously used and an additional control GapmeR. The FPKMs of the control samples are highly-correlated both within replicates and between GapmeRs (Fig. S6A). More importantly, the fold-changes to control are highly correlated between the two on-target GapmeRs LNA1 and LNA2, regardless of the GapmeR used for normalization (Fig. S6B), thus showing that despite significant GapmeR-specific effects, the bulk of the response is shared and likely the direct result of the reduction in the levels of EPB41L4A-AS1. Notably, key targets NPM1 and MTREX (see discussion, Fig. S12A-C and comments to Reviewer 3) were found to be downregulated by both LNAs (Fig. S6C).
However, we acknowledge that some of the dysregulated genes are observed only when using one GapmeR and not the other, likely due to a combination of indirect, secondary and non-specific effects, and as such it is difficult to infer the direct response. Supporting this, LNA2 yielded a total of 1,069 DEGs (617 up and 452 down) and LNA1 2,493 DEGs (1,328 up and 1,287 down), with the latter triggering a stronger response most likely as a result of the previously mentioned CDKN1A/p21 induction. Overall, 45.1% of the upregulated genes following LNA2 transfection were shared with LNA1, in contrast to only the 24.3% of the downregulated ones.
We have now included these results in the Results section (see below) and in Supplementary Figure (Fig. S6).
“Most of the consequences of the depletion of EPB41L4A-AS1 are thus not directly explained by changes in EPB41L4A levels. An additional trans-acting function for EPB41L4A-AS1 would therefore be consistent with its high expression levels compared to most lncRNAs detected in MCF-7 (Fig. S5G). To strengthen these findings, we have transfected MCF-7 cells with LNA1 and a second control GapmeR (NT2), as well as the previous one (NT1) and LNA2, and sequenced the polyadenylated RNA fraction as before. Notably, the expression levels (in FPKMs) of the replicates of both control samples are highly correlated with each other (Fig. S6A), and the global transcriptomic changes triggered by the two EPB41L4A-AS1-targeting LNAs are largely concordant (Fig. S6B and S6C). Because of this concordance and the cleaner (i.e., no CDKN1A upregulation) readout in LNA2-transfected cells, we focused mainly on these cells for subsequent analyses.”
(4) Figure 3B: Does downregulation of SUB1 and NPM1 reflect at the protein level with both LNA gapmers? The authors should show a heatmap and metagene profile for SUB1 CUT & RUN. How did the author know that SUB1 binding is specific, since CUT & RUN was not performed in SUB1-depleted cells?
As requested by both Reviewer #2 and #3, we have performed WB for SUB1, NPM1 and FBL following EPB41L4A-AS1 KD with two targeting (LNA1 and LNA2) and the previous control GapmeRs. Interestingly, we did not detect any significant downregulation of either proteins (Author response image 3), although this might be the result of the high variability observed in the control samples. Moreover, the short timeframe in which the experiments have been conducted━that is, transient transfections for 3 days━might not be sufficient time for the existing proteins to be degraded, and thus, the downregulation is more evident at the RNA (Fig. 3B and Supplementary Figure 6C) rather than protein level.
Author response image 3.
EPB41L4A-AS1 KD has only marginal effects on the levels of nucleolar proteins. (A) Western Blots for the indicated proteins after the transfection for 3 days of the control and targeting GapmeRs. (B) Quantification of the protein levels from (A). All experiments were performed in n=3 biological replicates, with the error bars in the barplots representing the standard deviation. ns - P>0.05; * - P<0.05; ** - P<0.01; *** - P<0.001 (two-sided Student’s t-test).
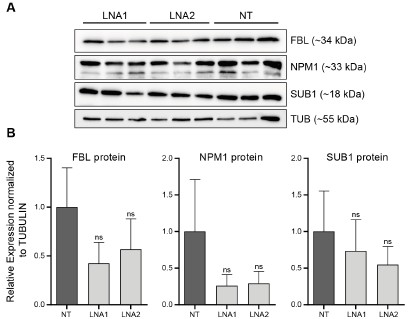
Following the suggestion by the Reviewer, we now show both the SUB1 CUT&RUN metagene profile (previously available as Fig. 3F) and the heatmap (now Fig. 3G) around the TSS of all genes, stratified by their expression level. Both graphs are reported.
We show that the antibody signal is responsive to SUB1 depletion via siRNAs in both WB (Fig. S8F) and IF (Fig. 5E) experiments. As mentioned below, this and the absence of non-specific signals makes us confident in the CUT&RUN data. Performing CUT&RUN in SUB1 depleted cells would be difficult to interpret as perturbations are typically not complete, and so the remaining protein can still bind the same regions. Since there isn’t a clear way to add spike-ins to CUT&RUN experiments, it is very difficult to show specificity of binding by CUT&RUN in siRNA-knockdown cells.
(5) Figure 3D: The MW for the depicted proteins are lacking. Why is there no SUB1 protein in the input? Please clarify. Since the authors used siRNA to deplete SUB1, it would be good to know if the antibody is specific in their CUT & RUN (see above)
We apologize for the lack of the MW in Fig. 3D. As shown in Fig. S8F, SUB1 is ~18 kDa and the antibody signal is responsive to SUB1 depletion via siRNAs in both WB (Fig. S8F) and IF (Fig. 5E) experiments. Thus, given its 1) established specificity in those two settings and 2) the lack of generalized signal at most open chromatin regions, which is typical of nonspecific CUT&RUN experiments, we are confident in the specificity of the CUT&RUN results.
We now mention the MW of SUB1 in Fig. 3D as well and we provide in Author response image 4 the full SUB1 WB picture, enhancing the contrast to highlight the bands. We agree that the SUB1 band in the input is weak, likely reflecting the low abundance in that fraction and the detection difficulty due to its low MW (see Fig. S8F).
Author response image 4.
Western blot for SUB1 following RIP using either a SUB1 or IgG antibody. IN - input, SN - supernatant/unbound, B - bound.

(6) Supplementary Figure 6C:
The validation of lncRNA EPB41L4A-AS1 binding to SUB1 should be confirmed by CLIP qPCR, since native RIP can lead to reassociation of RNA-protein interactions (PMID: 15388877). Additionally, the eclip data presented in Figure 3a were from a different cell line and not MCF7.
We acknowledge that the SUB1 eCLIP data was generated in a different cell line, as we mentioned in the text:
“Indeed, eCLIP targets of SUB1 (from HepG2 cells profiled by ENCODE) were significantly downregulated following EPB41L4A-AS1 KD in MCF-7, with more confident targets experiencing stronger downregulation (Fig. 3C). Importantly, this still holds true when controlling for gene expression levels (Fig. S7C), suggesting that this negative trend is not due to differences in their baseline expression. To obtain SUB1-associated transcripts in MCF-7 cells; we performed a native RNA immunoprecipitation followed by sequencing of polyA+ RNAs (RIP-seq) (Fig. 3D, S7D and S7E).”
Because of this, we resorted to native RIP, in order to get binding information in our experimental system. As we show independent evidence for binding using both eCLIP and RIP, and the substantial challenge in establishing the CLIP method, which has not been successfully used in our group, we respectfully argue that further validations are out of scope of this study. We nonetheless agree that several genes which are nominally significantly enriched in our RIP data are likely not direct targets of SUB1, especially given that it is difficult to assign the perfect threshold that discriminates between bound and unbound RNAs.
We now additionally mention this at the beginning of the paragraph as well:
“In order to identify potential factors that might be associated with EPB41L4A-AS1, we inspected protein-RNA binding data from the ENCODE eCLIP dataset(Van Nostrand et al., 2020). The exons of the EPB41L4A-AS1 lncRNA were densely and strongly bound by SUB1 (also known as PC4) in both HepG2 and K562 cells (Fig. 3A).”
(7) Figure 3G:
Can the authors distinguish whether loss of EPB41L4A-AS1 affects SUB1 chromatin binding or its activity as RBP? Please discuss.
Distinguishing between altered SUB1 chromatin and RNA binding is challenging, as this protein likely does not interact directly with chromatin and exhibits rather promiscuous RNA binding properties (Ray et al., 2023). In particular, SUB1 (also known as PC4) interacts with and regulates the activity of all three RNA polymerases, and was reported to be involved in transcription initiation and elongation, response to DNA damage, chromatin condensation (Conesa & Acker, 2010; Das et al., 2006; Garavís & Calvo, 2017; Hou et al., 2022) and telomere maintenance (Dubois et al., 2025; Salgado et al., 2024).
Based on our data, genes whose promoters are occupied by SUB1 display marginal, yet highly significant changes in their steady-state expression levels upon lncRNA perturbations. We also show that upon EPB41L4A-AS1 KD, SUB1 acquires a stronger nucleolar localization (Fig. 5A), which likely affects its RNA interactome as well. However, further elucidating these activities would require performing RIP-seq and CUT&RUN in lncRNA-depleted cells, which we argue is out of the scope of the current study. We note that KD of SUB1 with siRNAs have milder effects than that of EPB41L4A-AS1 (Fig. S8G), suggesting that additional players and effects shape the observed changes. Therefore, it is highly likely that the loss of this lncRNA affects both SUB1 chromatin binding profile and RNA binding activity, with the latter likely resulting in the increased snoRNAs abundance.
(8) Figure 4: Can the authors show that a specific class of snorna is affected upon depletion of SUB1 and EPB41L4A-AS1? Can they further classify the effect of their depletion on H/ACA box snoRNAs, C/D box snoRNAs, and scaRNAs?
Such potential distinct effect on the different classes of snoRNAs was considered, and the results are available in Fig. S8B and S8H (boxplots, after EPB41L4A-AS1 and SUB1 depletion), as well as Fig. 4F and S9F (scatterplots between EPB41L4A-AS1 and SUB1 depletion, and EPB41L4A-AS1 and GAS5 depletion, respectively). We see no preferential effect on one group of snoRNAs or the other.
(9) Figure 5: From the representative images, it looks to me that LNA 2 targeting EPB41L4A-AS1 has a bigger effect on nucleolar staining of SUB1. To claim that EPB41L4A-AS1 depletion "shifts SUB1 to a stronger nucleolar distribution", the authors need to perform IF staining for SUB1 and Fibrillarin, a known nucleolar marker. Also, how does this data fit with their qPCR data shown in Figure 3B? It is instrumental for the authors to demonstrate by IF or Western blotting that SUB1 levels decrease in one fraction and increase specifically in the nucleolus. They could perform Western blot for SUB1 and Fibrillarin in EPB41L4A-AS1-depleted cells and isolate cytoplasmic, nuclear, and nucleolar fractions.This experiment will strengthen their finding. The scale bar is missing for all the images in Figure 5. The authors should also show magnified images of a single representative cell at 100x.
We apologize for the confusion regarding the scale bars. As mentioned here and elsewhere, the scale bars are present in the top-left image of each panel only, in order to avoid overcrowding the panel. All the images are already at 100X, with the exception of Fig. 5E (IF for SUB1 upon siSUB1 transfection) which is 60X in order to better show the lack of signal. We however acknowledge that the images are sometimes confusing, due to the PNG features once imported into the document. In any case, in the submission we have also provided the original images in high-quality PDF and .ai formats. The suggested experiment would require establishing a nucleolar fractionation protocol which we currently don’t have available and we argue that it is out of scope of the current study.
(10) Additionally, is rRNA synthesis affected in SUB1- and EPB41L4A-AS1-depleted cells? The authors could quantify newly synthesised rRNA levels in the nucleoli, which would also strengthen their findings about the role of this lncRNA in nucleolar biology.
We acknowledge that there are many aspects of the role of EPB41L4A-AS1 in nucleolar biology that remain to be explored, as well as in nucleolar biology itself, but given the extensive experimental data we already provide in this and other subjects, we respectfully suggest that this experiment is out of scope of the current work. We note that a recent study has shown that SUB1 is required for Pol I-mediated rDNA transcription in the nucleolus (Kaypee et al., 2025). In the presence of nucleolar SUB1, rDNA transcription proceeds as expected, but when SUB1 is depleted or its nucleolar localization is affected—by either sodium butyrate treatment or inhibition of KAT5-mediated phosphorylation at its lysine 35 (K35)—the levels of the 47S pre-rRNA are significantly reduced. In our settings, SUB1 enriches into the nucleolus following EPB41L4A-AS1 KD; thus, we might expect to see a slightly increased rDNA transcription or no effect at all, given that SUB1 localizes in the nucleolus in baseline conditions as well. We now mention this novel role of SUB1 both in the results and discussion.
“SUB1 interacts with all three RNA polymerases and was reported to be involved in transcription initiation and elongation, response to DNA damage, chromatin condensation(Conesa & Acker, 2010; Das et al., 2006; Garavís & Calvo, 2017; Hou et al., 2022), telomere maintenance(Dubois et al., 2025; Salgado et al., 2024) and rDNA transcription(Kaypee et al., 2025). SUB1 normally localizes throughout the nucleus in various cell lines, yet staining experiments show a moderate enrichment for the nucleolus (source: Human Protein Atlas; https://www.proteinatlas.org/ENSG00000113387-SUB1/subcellular)(Kaypee et al., 2025).”
“Several features of the response to EPB41L4A-AS1 resemble nucleolar stress, including altered distribution of NPM1(Potapova et al., 2023; Yang et al., 2016). SUB1 was shown to be involved in many nuclear processes, including transcription(Conesa & Acker, 2010), DNA damage response(Mortusewicz et al., 2008; Yu et al., 2016), telomere maintenance(Dubois et al., 2025), and nucleolar processes including rRNA biogenesis(Kaypee et al., 2025; Tafforeau et al., 2013). Our results suggest a complex and multi-faceted relationship between EPB41L4A-AS1 and SUB1, as SUB1 mRNA levels are reduced by the transient (72 hours) KD of the lncRNA (Fig. 3B), the distribution of the protein in the nucleus is altered (Fig. 5A and 5C), while the protein itself is the most prominent binder of the mature EPB41L4A-AS1 in ENCODE eCLIP data (Fig. 3A). The most striking connection between EPB41L4A-AS1 and SUB1 is the similar phenotype triggered by their loss (Fig. 4). We note that a recent study has shown that SUB1 is required for Pol I-mediated rDNA transcription in the nucleolus(Kaypee et al., 2025). In the presence of nucleolar SUB1, rDNA transcription proceeds as expected, but when SUB1 is depleted or its nucleolar localization is affected—by either sodium butyrate treatment or inhibition of KAT5-mediated phosphorylation at its lysine 35 (K35)—the levels of the 47S pre-rRNA are significantly reduced. In our settings, SUB1 enriches into the nucleolus following EPB41L4A-AS1 KD; thus, we might expect to see a slightly increased rDNA transcription or no effect at all, given that SUB1 localizes in the nucleolus in baseline conditions as well. It is however difficult to determine which of the connections between these two genes is the most functionally relevant and which may be indirect and/or feedback interactions. For example, it is possible that EPB41L4A-AS1 primarily acts as a transcriptional regulator of SUB1 mRNA, or that its RNA product is required for proper stability and/or localization of the SUB1 protein, or that EPB41L4A-AS1 acts as a scaffold for the formation of protein-protein interactions of SUB1.”
(11) Figure 8: The scratch assay alone cannot be used as a measure of increased invasion, and this phenotype must be confirmed with a transwell invasion or migration assay. Thus, I highly recommend that the authors conduct this experiment using the Boyden chamber. Do the authors see upregulation of N-cadherin, Vimentin, and downregulation of E-cadherin in their RNA-seq?
We agree with the reviewer that those phenotypes are complex and normally require multiple in vitro, as well as in vivo assays to be thoroughly characterized. However, we respectfully consider those as out of scope of the current work, which is more focused on RNA biology and the molecular characterization and functions of EPB41L4A-AS1.
Nevertheless, in Fig. 8D we show that the canonical EMT signature (taken from MSigDB) is upregulated in cells with reduced expression of EPB41L4A-AS1. Notably, EMT has been found to not possess an unique gene expression program, but it rather involves distinct and partially overlapping gene signatures (Youssef et al., 2024). In Fig. 8D, the most upregulated gene is TIMP3, a matrix metallopeptidase inhibitor linked to a particular EMT signature that is less invasive and more profibrotic (EMT-T2, (Youssef et al., 2024)). Interestingly, we observed a strong upregulation of other genes linked to EMT-T2, such as TIMP1, FOSB, SOX9, JUNB, JUN and KLF4, whereas MPP genes (linked to EMT-T1, which is highly proteolytic and invasive) are generally downregulated or not expressed. With regards to N- and E-cadherin, the first does not pass our cutoff to be considered expressed, and the latter is not significantly changing. Vimentin is also not significantly dysregulated. All these examples are reported, which were added as Fig. 8E:
The text has also been updated accordingly:
“These findings suggest that proper EPB41L4A-AS1 expression is required for cellular proliferation, whereas its deficiency results in the onset of more aggressive and migratory behavior, likely linked to the increase of the gene signature of epithelial to mesenchymal transition (EMT) (Fig. 8D). Because EMT is not characterized by a unique gene expression program and rather involves distinct and partially overlapping gene signatures (Youssef et al., 2024), we checked the expression level of marker genes linked to different types of EMTs (Fig. 8E). The most upregulated gene in Fig. 8D is TIMP3, a matrix metallopeptidase inhibitor linked to a particular EMT signature that is less invasive and more profibrotic (EMT-T2) (Youssef et al., 2024). Interestingly, we observed a stark upregulation of other genes linked to EMT-T2, such as TIMP1, FOSB, SOX9, JUNB, JUN and KLF4, whereas MPP genes (linked to EMT-T1, which is highly proteolytic and invasive) are generally downregulated or not expressed. This suggests that the downregulation of EPB41L4A-AS1 is primarily linked to a specific EMT program (EMT-T2), and future studies aimed at uncovering the exact mechanisms and relevance will shed light upon a possible therapeutic potential of this lncRNA.”
(12) Minor points:
(a) What could be the explanation for why only the EPB41L4A-AS1 locus has an effect on the neighbouring gene?
There might be multiple reasons why EPB41L4A-AS1 is able to modulate the expression of the neighboring genes. First, it is expressed from a TAD boundary exhibiting physical contacts with several genes in the two flanking TADs (Fig. 1F and 2A), placing it in the right spot to regulate their expression. Second, it is highly expressed when compared to most of the genes nearby, with transcription having been linked to the establishment and maintenance of TAD boundaries (Costea et al., 2023). Accordingly, the (partial) depletion of EPB41L4A-AS1 via GapmeRs transfection slightly reduces the contacts between the lncRNA and EPB41L4A loci (Fig. 2E and S4J), although this effect could also be determined by a premature transcription termination triggered by the GapmeRs.
There are a multitude of mechanisms by which lncRNAs with regulatory functions modulate the expression of one or more target genes in cis (Gil & Ulitsky, 2020), and our data do not unequivocally point to one of them. Distinguishing between these possibilities is a major challenge in the field and would be difficult to address in the context of this one study. It could be that the processive RNA polymerases at the EPB41L4A-AS1 locus are recruited to the neighboring loci, facilitated by the close proximity in the 3D space. It could also be possible that chromatin remodeling factors are recruited by the nascent RNA, and then promote and/or sustain the opening of chromatin at the target site. The latter possibility is intriguing, as this mechanism is proposed to be widespread among lncRNAs (Gil & Ulitsky, 2020; Oo et al., 2025) and we observed a significant reduction of H3K27ac levels at the EPB41L4A promoter region (Fig. 2D). Future studies combining chromatin profiling (e.g., CUT&RUN and ATAC-seq) and RNA pulldown experiments will shed light upon the exact mechanisms by which this lncRNA regulates the expression of target genes in cis and its interacting partners.
(b) The scale bar is missing on all the images in the Supplementary Figures as well.
The scale bars are present in the top-left figure of each panel. We acknowledge that due to the export as PNG, some figures (including those with microscopy images) display abnormal font sizes and aspect ratio. All images were created using consistent fonts, sizes and ratio, and are provided as high-quality PDF in the current submission.
(13) Methods:
The authors should double-check if they used sirn and LNA gapmers at 25 and 50um concentrations, as that is a huge dose. Most papers used these reagents in the range of 5-50nM maximum.
We apologize for the typo, the text has been fixed. We performed the experiments at 25 and 50nM, respectively, as suggested by the manufacturer’s protocol.
(14) Discussion:
Which cell lines were used in reference 27 (Cheng et al., 2024 Cell) to study the role of SNORA13? It may be useful to include this in the discussion.
We already mentioned the cell system in the discussion, and now we edited to include the specific cell line that was used:
“A recent study found that SNORA13 negatively regulates ribosome biogenesis in TERT-immortalized human fibroblasts (BJ-HRAS<Sup>G12V</sup>), by decreasing the incorporation of RPL23 into the maturing 60S ribosomal subunits, eventually triggering p53-mediated cellular senescence(Cheng et al., 2024).”
Reviewer #3 (Recommendations for the authors):
Major comments on weaknesses:
(1) The paper is quite disjointed:
(a) Figures1/2 studied the cis- and potential trans target genes altered by EPB41L4A-AS1 knockdown. They also showed some data about EPB41L4A-AS1 overlaps a strong chromatin boundary.
(b) Figures3/4/5 studied the role of SUB1 - as it is altered by EPB41L4A-AS1 knockdown - in affecting genes and snoRNAs, which may partially underlie the gene/snoRNA changes after EPB41L4A-AS1 knockdown.
(c) Figure 6 showed that EPB41L4A-AS1 knockdown did not directly affect SNORA13, the snoRNA located in the intron of EPB41L4A-AS1. Thus, the upregulation of many snoRNAs is not due to SNORA13.
(d) Figure 7 studied whether the changes of cis genes or snoRNAs are due to transcriptional stability.
(e) Figure 8 studied cellular phenotypes after EPB41L4A-AS1 knockdown.
These points are overly spread out and this dilutes the central theme of these results, which this Reviewer considered to be on cis or trans gene regulation by this lncRNA.The title of the paper implies EPB41L4A-AS1 knockdown affected trans target genes, but the paper did not focus on studying cis or trans effects, except briefly mentioning that many genes were changed in Figure 2. The many changes of snoRNAs are suggested to be partially explained by SUB1, but SUB1 itself is affected (>50%, Figure 3B) by EPB41L4A-AS1 knockdown, so it is unclear if these are mostly secondary changes due to SUB1 reduction. Given the current content of the paper, the authors do not have sufficient evidence to support that the changes of trans genes are due to direct effects or indirect effects. And so they are encouraged to revise their title to be more on snoRNA regulation, as this area took the majority of the efforts in this paper.
We respectfully disagree with the reviewer. We show that the effect on the proximal genes are cis-acting, as they are not rescued by exogenous expression, whereas the majority of the changes observed in the RNA-seq datasets appear to be indirect, and the snoRNA changes, that indeed might be indirect and not necessarily involve direct interaction partners of the lncRNA, such as SUB1, appear to be trans-regulated, as they can be rescued partially by exogenous expression of the lncRNA. We also show that KD of the main cis-regulated gene, EPB41L4A, results in a much milder transcriptional response, further solidifying the contribution of trans-acting effects. While we agree that the snoRNA effects are interesting, we do not consider them to be the main result, as they are accompanied by many additional changes in gene expression, and changes in the subnuclear distribution of the key nucleolar proteins, so it is difficult for us to claim that EPB41L4A-AS1 is specifically relevant to the snoRNAs rather than to the more broad nucleolar biology. Therefore, we prefer not to mention snoRNAs specifically in the title.
(2) EPB41L4A-AS1 knockdown caused ~2,364 gene changes. This is a very large amount of change on par with some transcriptional factors. It thus needs more scrutiny. First, on Page 9, second paragraph, the authors used|log2Fold-change| >0.41 to select differential genes, which is an unusual cutoff. What is the rationale? Often |log2Fold-change| >1 is more common. How many replicates are used? To examine how many gene changes are likely direct target genes, can the authors show how many of the cist-genes that are changed by EPB41L4A-AS1 knockdown have direct chromatin contacts with EPB41L4A-AS1 in HiC data? Is there any correlation between HiC contact with their fold changes? Without a clear explanation of cis target genes as direct target genes, it is more difficult to establish whether any trans target genes are directly affected by EPB41L4A-AS1 knockdown.
A |log<sub>2</sub>Fold-change| >0.41 equals a change of 33% or more, which together with an adjusted P < 0.05 is a threshold that has been used in the past. All RNA-seq experiments have been performed in triplicates, in line with the standards in the field. While it is possible that the EPB41L4A-AS1 establishes multiple contacts in trans—a process that has been observed in at least another lncRNA, namely Firre but involving its mature RNA product—we do believe this to be less likely that the alternative, namely that the > 2,000 DEGs are predominantly result from secondary changes rather than genes directly regulated by EPB41L4A-AS1 contacts.
In any case, we have inspected our UMI-4C data to identify other genes exhibiting higher contact frequencies than background levels, and thus, potentially regulated in cis. To this end, we calculated the UMI-4C coverage in a 10kb window centered around the TSS of the genes located on chromosome 5, which we subsequently normalized based on the distance from EPB41L4A-AS1, in order to account for the intrinsic higher DNA recovery the closer to the target DNA sequence. However, in our UMI-4C experiment we have employed baits targeting three different genes—EPB41L4A-AS1, EPB41L4A and STARD4—and therefore such approach assumes that the lncRNA locus has the most regulatory features in this region. As expected, we detected a strong negative correlation between the normalized coverage and the distance from the EPB41L4A-AS1 locus (⍴ = -0.51, p-value < 2.2e-16), and the genes in the two neighboring TADs exhibited the strongest association with the bait region (Author response image 5). The genes that we see are down-regulated in the adjacent TADs, namely NREP, MCC and MAN2A1 (Fig. 2F) show substantially higher contacts than background with the EPB41L4A-AS1 gene, thus potentially constituting additional cis-regulated targets of this lncRNA. We note that both SUB1 and NPM1 are located on chromosome 5 as well, albeit at distances exceeding 75 and 50 Mb, respectively, and they do not exhibit any striking association with the lncRNA locus.
Author response image 5.
UMI-4C coverage over the TSS of the genes located on chromosome 5. (A) Correlation between the normalized UMI-4C coverage over the TSS (± 5kb) of chromosome 5 genes and the absolute distance (in megabases, Mb) from EPB41L4A-AS1. (B) Same as in (A), but with the x axis showing the relative distance from EPB41L4A-AS1. In both cases, the genes in the two flanking TADs are colored in red and their names are reported.
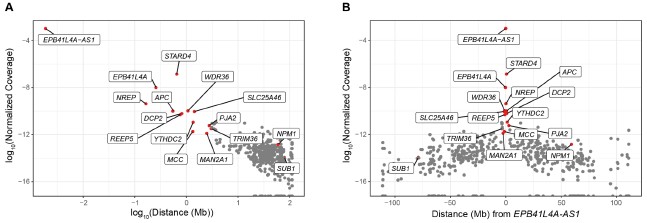
To increase the confidence in our RNA-seq data, we have now performed another round of polyA+ RNA-seq following EPB41L4A-AS1 knockdown using LNA1 or LNA2, as well as the previously used and an additional control GapmeR. The FPKMs of the control samples are highly-correlated both within replicates and between GapmeRs (Fig. S6A). More importantly, the fold-changes to control are highly correlated between the two on-target GapmeRs LNA1 and LNA2, regardless of the GapmeR used for normalization (Fig. S6B), thus showing that despite significant GapmeR-specific effects, the bulk of the response is shared and likely the direct result of the reduction in the levels of EPB41L4A-AS1. Notably, key targets NPM1 and MTREX (see discussion, Fig. S12A-C and comments to Reviewer 3) were found to be downregulated by both LNAs (Fig. S6C).
However, we acknowledge that some of the dysregulated genes are observed only when using one GapmeR and not the other, likely due to a combination of indirect, secondary and non-specific effects, and as such it is difficult without short time-course experiments (Much et al., 2024) to infer the direct response. Supporting this, LNA2 yielded a total of 1,069 DEGs (617 up and 452 down) and LNA1 2,493 DEGs (1,328 up and 1,287 down), with the latter triggering a stronger response most likely as a result of the previously mentioned CDKN1A/p21 induction. Overall, 45.1% of the upregulated genes following LNA2 transfection were shared with LNA1, in contrast to only the 24.3% of the downregulated ones.
We have now included these results in the Results section (see below) and in Supplementary Figure (Fig. S6).
“Most of the consequences of the depletion of EPB41L4A-AS1 are thus not directly explained by changes in EPB41L4A levels. An additional trans-acting function for EPB41L4A-AS1 would therefore be consistent with its high expression levels compared to most lncRNAs detected in MCF-7 (Fig. S5G). To strengthen these findings, we have transfected MCF-7 cells with LNA1 and a second control GapmeR (NT2), as well as the previous one (NT1) and LNA2, and sequenced the polyadenylated RNA fraction as before. Notably, the expression levels (in FPKMs) of the replicates of both control samples are highly correlated with each other (Fig. S6A), and the global transcriptomic changes triggered by the two EPB41L4A-AS1-targeting LNAs are largely concordant (Fig. S6B and S6C). Because of this concordance and the cleaner (i.e., no CDKN1A upregulation) readout in LNA2-transfected cells, we focused mainly on these cells for subsequent analyses.”
Figure 3B, SUB1 mRNA is reduced >half by EPB41L4A-AS1 KD. How much did SUB1 protein reduce after EPB41L4A-AS1 KD? Similarly, how much is the NPM1 protein reduced? If these two important proteins were affected by EPB41L4A-AS1 KD simultaneously, it is important to exclude how many of the 2,364 genes that changed after EPB41L4A-AS1 KD are due to the protein changes of these two key proteins. For SUB1, Figures S7E,F,G provided some answers. But NPM1 KD is also needed to fully understand such. Related to this, there are many other proteins perhaps changed in addition to SUB1 and NPM1, this renders it concerning how many of the EPB41L4A-AS1 KD-induced changes are directly caused by this RNA. In addition to the suggested study of cist targets, the alternative mechanism needs to be fully discussed in the paper as it remains difficult to fully conclude direct versus indirect effect due to such changes of key proteins or ncRNAs (such as snoRNAs or histone mRNAs).
As requested by both Reviewer #2 and #3, we have performed WB for SUB1, NPM1 and FBL following EPB41L4A-AS1 KD with two targeting (LNA1 and LNA2) and the previous control GapmeRs. Interestingly, we did not detect any significant downregulation of either proteins (Author response image 3), although this might be the result of the high variability observed in the control samples. Moreover, the short timeframe in which the experiments have been conducted━that is, transient transfections for 3 days━might not be sufficient time for the existing proteins to be degraded, and thus, the downregulation is more evident at the RNA (Fig. 3B and Supplementary Figure 6C) rather than protein level.
We acknowledge that many proteins might change simultaneously, and to pinpoint which ones act upstream of the plethora of indirect changes is extremely challenging when considering such large-scale changes in gene expression. In the case of SUB1 and NPM1━which were prioritized for their predicted binding to the lncRNA (Fig. 3A)━we show that the depletion of the former affects the latter in a similar way than that of the lncRNA (Fig. 5F). Moreover, snoRNAs changes are also similarly affected (as the reviewer pointed out, Fig. 4F), suggesting that at least this phenomenon is predominantly mediated by SUB1. Other effects might also be indirect consequences of cellular responses, such as the decrease in histone mRNAs (Fig. 4A) that might reflect the decrease in cellular replication (Fig. 8C) and cell cycle genes (Fig. 2I) (although a link between SUB1 and histone mRNA expression has been described (Brzek et al., 2018)).
Supporting the notion that additional proteins might be involved in driving the observed phenotypes, one of the genes that most consistently was affected by EPB41L4A-AS1 KD with GapmeRs is MTREX (also known as MTR4), that becomes downregulated at both the RNA and protein levels (now presented in the main text as Supplementary Figure 12). MTREX it’s part of the NEXT and PAXT complexes (Contreras et al., 2023), that target several short-lived RNAs for degradation, and the depletion of either MTREX or other complex members leads to the upregulation of such RNAs, that include PROMPTs, uaRNAs and eRNAs, among others. Given the lack in our understanding in snoRNA biogenesis from introns in mammalian systems(Monziani & Ulitsky, 2023), it is tempting to hypothesize a role for MTREX-containing complexes in trimming and degrading those introns and release the mature snoRNAs.
We updated the discussion section to include these observations:
“Beyond its site of transcription, EPB41L4A-AS1 associates with SUB1, an abundant protein linked to various functions, and these two players are required for proper distribution of various nuclear proteins. Their dysregulation results in large-scale changes in gene expression, including up-regulation of snoRNA expression, mostly through increased transcription of their hosts, and possibly through a somewhat impaired snoRNA processing and/or stability. To further hinder our efforts in discerning between these two possibilities, the exact molecular pathways involved in snoRNAs biogenesis, maturation and decay are still not completely understood. One of the genes that most consistently was affected by EPB41L4A-AS1 KD with GapmeRs is MTREX (also known as MTR4), that becomes downregulated at both the RNA and protein levels (Fig. S12A-C). Interestingly, MTREX it is part of the NEXT and PAXT complexes(Contreras et al., 2023), that target several short-lived RNAs for degradation, and the depletion of either MTREX or other complex members leads to the upregulation of such RNAs, that include PROMPTs, uaRNAs and eRNAs, among others. It is therefore tempting to hypothesize a role for MTREX-containing complexes in trimming and degrading those introns, and releasing the mature snoRNAs. Future studies specifically aimed at uncovering novel players in mammalian snoRNA biology will both conclusively elucidate whether MTREX is indeed involved in these processes.”
With regards to the changes in gene expression between the two LNAs, we provide a more detailed answer above and to the other reviewers as well.
(3) A Strong discrepancy of results by different approaches of knockdown or overexpression:
(a) CRISPRa versus LNA knockdown: Figure S4 - CRISPRa of EPB41L4A-AS1 did not affect EPB41L4A expression (Figure S4B). The authors should discuss how to interpret this result. Did CRISPRa not work to increase the nuclear/chromatin portion of EPB41L4A-AS1? Did CRISPRa of EPB41L4A-AS1 affect the gene in the upstream, the STARD4? Did CRISPRa of EPB41L4A-AS1 also affect chromatin interactions between EPB41L4A-AS1 and the EPB41L4A gene? If so, this may argue that chromatin interaction is not necessary for cis-gene regulation.
There are indeed several possible explanations, the most parsimonious is that since the lncRNA is already very highly transcribed, the relatively modest effect of additional transcription mediated by CRISPRa is not sufficient to elicit a measurable effect. For this reason, we did not check by UMI-4C the contact frequency between the lncRNA and EPB41L4A upon CRISPRa.
CRISPRa augments transcription at target loci, and thus, the nuclear and chromatin retention of EPB41L4A-AS1 are not expected to be affected. We did not check the expression of STARD4, because we focused on EPB41L4A which appears to be the main target locus according to Hi-C (Fig. 2A), UMI-4C (Fig. 2E and S4J) and GeneHancer (Fig. S1).
We already provide extensive evidence of a cis-regulation of EPB41L4A-AS1 over EPB41L4A, and show that EPB41L4A is lowly-expressed and likely has a limited role in our experimental settings. Thus, we respectfully propose that an in-deep exploration of the mechanism of action of this regulatory axis is out of scope of the current study, that instead focused more on the global effects of EPB41L4A-AS1 perturbation.
(b) Related to this, while CRISPRa alone did not show an effect, upon LNA knockdown of EPB41L4A-AS1, CRISPRa of EPB41L4A-AS1 can increase EPB41L4A expression. It is perplexing as to why, upon LNA treatment, CRISPRa will show an effect (Figure S4H)? Actually, Figures S4H and I are very confusing in the way they are currently presented. They will benefit from being separated into two panels (H into 2 and I into two). And for Ectopic expression, please show controls by empty vector versus EPB41L4A-AS1, and for CRISPRa, please show sgRNA pool versus sgRNA control.
The results are consistent with the parsimonious assumption mentioned above that the high transcription of the lncRNA at baseline is sufficient for maximal positive regulation of EPB41L4A, and that upon KD, the reduced transcription and/or RNA levels are no longer at saturating levels, and so CRISPRa can have an effect. We now mention this interpretation in the text:
“Levels of EPB41L4A were not affected by increased expression of EPB41L4A-AS1 from the endogenous locus by CRISPR activation (CRISPRa), nor by its exogenous expression from a plasmid (Fig. S4B and S4C). The former suggests that endogenous levels of EPB41L4A-AS1—that are far greater than those of EPB41L4A—are sufficient to sustain the maximal expression of this target gene in MCF7 cells.”
We apologize for the confusion regarding the control used in the rescue experiments in Fig. S4H and S4I. The “-” in the Ectopic overexpression and CRISPRa correspond to the Empty Vector and sgControl, respectively, and not the absence of any vector. We changed the text in the figure legends:
“(H) Changes in EPB41L4A-AS1 expression after rescuing EPB41L4A-AS1 with an ectopic plasmid or CRISPRa following its KD with GapmeRs. In both panels (Ectopic OE and CRISPRa) the “-” samples represent those transfected with the Empty Vector or sgControl. Asterisks indicate significance relative to the –/– control (transfected with both the control GapmeR and vector). (I) Same as in (H), but for changes in EPB41L4A expression.”
(c) siRNA versus LNA knockdown: Figure S3A showed that siRNA KD of EPB41L4A-AS1 does not affect EPB41L4A expression. How to understand this data versus LNA?
As explained in the text, siRNA-mediated KD presumably affects mostly the cytoplasmic pool of EPB41L4A-AS1 and not the nuclear one, which we assume explains the different effects of the two perturbations, as observed for other lncRNAs (e.g., (Ntini et al., 2018)). However, we acknowledge that we do not know what aspect of the nuclear RNA biology is relevant, let it be the nascent EPB41L4A-AS1 transcription, premature transcriptional termination or even the nuclear pool of this lncRNA, and this can be elucidated further in future studies.
(d) EPB41L4A-AS1 OE versus LNA knockdown: Figure 6F showed that EPB41L4A-AS1 OE caused reduction of EPB41L4A mRNA, particularly at 24hr. How to interpret that both LNA KD and OE of EPB41L4A-AS1 reduce the expression of EPB41L4A mRNA?
We do not believe that the OE of EPB41L4A-AS1, and in particular the one elicited by an ectopic plasmid affects EPB41L4A RNA levels. In the experiment in Fig. 6F, EPB41L4A relative expression at 24h is ~0.65 (please note the log<sub>2</sub> scale in the graph), which is significant as reported. However, throughout this study (and as shown in Fig. S4C for the ectopic and Fig. S4B for the CRISPRa overexpression, respectively), we observed no such behavior, suggesting that the effect reported in Fig. 6F is the result of either that particular setting, and unlikely to reflect a general phenomenon.
(e) Did any of the effects on snoRNAs or trans target genes after EPB41L4A-AS1 knockdown still appear by CRISPRa?
As mentioned above, we did a limited number of experiments after CRISPRa, prompted by the fact that endogenous levels of EPB41L4A-AS1 are already high enough to sustain its functions. Pushing the expression even higher will likely result in no or artifactual effects, which is why we respectfully propose such experiments are not essential in this current work, which instead mostly relies on loss-of-function experiments.
For issue 3, extensive data repetition using all these methods may be unrealistic, but key data discrepancy needs to be fully discussed and interpreted.
Other comments on weakness:
(1) This manuscript will benefit from having line numbers so comments from Reviewers can be made more specifically.
We added line numbers as suggested by the reviewer.
(2) Figure 2G, to distinguish if any effects of EPB41L4A-AS1 come from the cytoplasmic or nuclear portion of EPB41L4A-AS1, an siRNA KD RNA-seq will help to filter out the genes affected by EPB41L4A-AS1 in the cytoplasm, as siRNA likely mainly acts in the cytoplasm.
This experiment would be difficult to interpret as while the siRNAs mostly deplete the cytoplasmic pool of their target, they can have some effects in the nucleus as well (e.g., (Sarshad et al., 2018)) and so siRNAs knockdown will not necessarily report strictly on the cytoplasmic functions.
(3) Figure 2H, LNA knockdown of EPB41L4A should check the protein level reduction, is it similar to the change caused by knockdown of EPB41L4A-AS1?
As suggested by reviewer #2, we have now replaced the EPB41L4A Western Blot that now shows the results with both LNA1 and LNA2. Please note that the previous Fig. 2C was a subset of this, i.e., we have previously cropped the results obtained with LNA1. Unfortunately, we did not have sufficient antibody to check for EPB41L4A protein reduction following LNA KD of EPB41L4A in a timely manner.
(4) There are two LNA Gapmers used by the paper to knock down EPB41L4A-AS1, but some figures used LNA1, some used LNA2, preventing a consistent interpretation of the results. For example, in Figures 2A-D, LNA2 was used. But in Figures 2E-H, LNA1 was used. How consistent are the two in changing histone H3K27ac (like in Figure 2D) versus gene expression in RNA-seq? The changes in chromatin interaction appear to be weaker by LNA2 (Figure S4J) versus LNA1 (Figure 2E).
As explained above and in response to Reviewer #1, we now provide more RNA-seq data for LNA1 and LNA2. We note that besides the unwanted and/or off-target effects, these two GapmeRs might be not equally effective in knocking down EPB41L4A-AS1, which could explain why LNA1 seems to have a stronger effect on chromatin than LNA2. Nonetheless, when we have employed both we have obtained similar and consistent results (e.g., Fig. 5A-D and 8A-C), suggesting that these and the other effects are indeed on target effects due to EPB41L4A-AS1 depletion.
(5) It will be helpful if the authors provide information on how long they conducted EPB41L4A-AS1 knockdown for most experiments to help discern direct or indirect effects.
The length of all perturbations was indicated in the Methods section, and we now mention them also in the Results. Unless specified otherwise, they were carried out for 72 hours. We agree with the reviewer that having time course experiments can have added value, but due to the extensive effort that these will require, we suggest that they are out of scope of the current study.
(6) In Figures 1C and F, the authors showed results about EPB41L4A-AS1 overlapping a strong chromatin boundary. But these are not mentioned anymore in the later part of the paper. Does this imply any mechanism? Does EPB41L4A-AS1 knockdown or OE, or CRISPRa affect the expression of genes near the other interacting site, STARD4? Do genes located in the two adjacent TADs change more strongly as compared to other genes far away?
We discuss this point in the Discussion section:
“At the site of its own transcription, which overlaps a strong TAD boundary, EPB41L4A-AS1 is required to maintain expression of several adjacent genes, regulated at the level of transcription. Strikingly, the promoter of EPB41L4A-AS1 ranks in the 99.8th percentile of the strongest TAD boundaries in human H1 embryonic stem cells(Open2C et al., 2024; Salnikov et al., 2024). It features several CTCF binding sites (Fig. 2A), and in MCF-7 cells, we demonstrate that it blocks the propagation of the 4C signal between the two flanking TADSs (Fig. 1F). Future studies will help elucidate how EPB41L4A-AS1 transcription and/or the RNA product regulate this boundary. So far, we found that EPB41L4A-AS1 did not affect CTCF binding to the boundary, and while some peaks in the vicinity of EPB41L4A-AS1 were significantly affected by its loss, they did not appear to be found near genes that were dysregulated by its KD (Fig. S11C). We also found that KD of EPB41L4A-AS1—which depletes the RNA product, but may also affect the nascent RNA transcription(Lai et al., 2020; Lee & Mendell, 2020)—reduces the spatial contacts between the TAD boundary and the EPB41L4A promoter (Fig. 2E). Further elucidation of the exact functional entity needed for the cis-acting regulation will require detailed genetic perturbations of the locus, that are difficult to carry out in the polypoid MCF-7 cells, without affecting other functional elements of this locus or cell survival as we were unable to generate deletion clones despite several attempts.”
As mentioned in the text (pasted below) and in Fig. 2F, most genes in the two flanking TADs become downregulated following EPB41L4A-AS1 KD. While STARD4 – which was chosen because it had spatial contacts above background with EPB41L4A-AS1 – did not reach statistical significance, others did and are highlighted. Those included NREP, which we also discuss:
“Consistently with the RT-qPCR data, KD of EPB41L4A-AS1 reduced EPB41L4A expression, and also reduced expression of several, but not all other genes in the TADs flanking the lncRNA (Fig. 2F).Based on these data, EPB41L4A-AS1 is a significant cis-acting activator according to TransCistor (Dhaka et al., 2024) (P=0.005 using the digital mode). The cis-regulated genes reduced by EPB41L4A-AS1 KD included NREP, a gene important for brain development, whose homolog was downregulated by genetic manipulations of regions homologous to the lncRNA locus in mice(Salnikov et al., 2024). Depletion of EPB41L4A-AS1 thus affects several genes in its vicinity.”
(7) Related to the description of SUB1 regulation of genes are DNA and RNA levels: "Of these genes, transcripts of only 56 genes were also bound by SUB1 at the RNA level, suggesting largely distinct sets of genes targeted by SUB1 at both the DNA and the RNA levels." SUB1 binding to chromatin by Cut&Run only indicates that it is close to DNA/chromatin, and this interaction with chromatin may still likely be mediated by RNAs. The authors used SUB1 binding sites in eCLIP-seq to suggest whether it acts via RNAs, but these binding sites are often from highly expressed gene mRNAs/exons. Standard analysis may not have examined low-abundance RNAs close to the gene promoters, such as promoter antisense RNAs. The authors can examine whether, for the promoters with cut&run peaks of SUB1, SUB1 eCLIP-seq shows binding to the low-abundance nascent RNAs near these promoters.
In response to a related comment by Reviewer 1, we now show that when considering expression level–matched control genes, knockdown of EPB41L4A-AS1 still significantly affects expression of SUB1 targets over controls. The results are presented in Supplementary Figure 7 (Fig. S7C).
Based on this analysis, while there is a tendency of increased expression with increased SUB1 binding, when controlling for expression levels the effect of down-regulation of SUB1-bound RNAs upon lncRNA knockdown remains, suggesting that it is not merely a confounding effect. We have updated the text as follows:
“We hypothesized that loss of EPB41L4A-AS1 might affect SUB1, either via the reduction in its expression or by affecting its functions. We stratified SUB1 eCLIP targets into confidence intervals, based on the number, strength and confidence of the reported binding sites. Indeed, eCLIP targets of SUB1 (from HepG2 cells profiled by ENCODE) were significantly downregulated following. EPB41L4A-AS1 KD in MCF-7, with more confident targets experiencing stronger downregulation (Fig. 3C). Importantly, this still holds true when controlling for gene expression levels (Fig. S7C), suggesting that this negative trend is not due to differences in their baseline expression.”
(8) Figure 8, the cellular phenotype is interesting. As EPB41L4A-AS1 is quite widely expressed, did it affect the phenotypes similarly in other breast cancer cells? MCF7 is not a particularly relevant metastasis model. Can a similar phenotype be seen in commonly used metastatic cell models such as MDA-MB-231?
We agree that further expanding the models in which EPB41L4A-AS1 affects cellular proliferation, migration and any other relevant phenotype is of potential interest before considering targeting this lncRNA as a therapeutic approach. However, given that 1) others have already identified similar phenotypes upon the modulation of EPB41L4A-AS1 in a variety of different systems (see Results and Discussion), and 2) we were most interested in the molecular consequences following the loss of this lncRNA, we respectfully suggest that these experiments are out of scope of the current study.
References
Bahar Halpern, K., Caspi, I., Lemze, D., Levy, M., Landen, S., Elinav, E., Ulitsky, I., & Itzkovitz, S. (2015). Nuclear Retention of mRNA in Mammalian Tissues. Cell Reports, 13(12), 2653–2662.
Brabletz, T., Kalluri, R., Nieto, M. A., & Weinberg, R. A. (2018). EMT in cancer. Nature Reviews. Cancer, 18(2), 128–134.
Brzek, A., Cichocka, M., Dolata, J., Juzwa, W., Schümperli, D., & Raczynska, K. D. (2018). Positive cofactor 4 (PC4) contributes to the regulation of replication-dependent canonical histone gene expression. BMC Molecular Biology, 19(1), 9.
Cheng, Y., Wang, S., Zhang, H., Lee, J.-S., Ni, C., Guo, J., Chen, E., Wang, S., Acharya, A., Chang, T.-C., Buszczak, M., Zhu, H., & Mendell, J. T. (2024). A non-canonical role for a small nucleolar RNA in ribosome biogenesis and senescence. Cell, 187(17), 4770–4789.e23.
Conesa, C., & Acker, J. (2010). Sub1/PC4 a chromatin associated protein with multiple functions in transcription. RNA Biology, 7(3), 287–290.
Contreras, X., Depierre, D., Akkawi, C., Srbic, M., Helsmoortel, M., Nogaret, M., LeHars, M., Salifou, K., Heurteau, A., Cuvier, O., & Kiernan, R. (2023). PAPγ associates with PAXT nuclear exosome to control the abundance of PROMPT ncRNAs. Nature Communications, 14(1), 6745.
Costea, J., Schoeberl, U. E., Malzl, D., von der Linde, M., Fitz, J., Gupta, A., Makharova, M., Goloborodko, A., & Pavri, R. (2023). A de novo transcription-dependent TAD boundary underpins critical multiway interactions during antibody class switch recombination. Molecular Cell, 83(5), 681–697.e7.
Das, C., Hizume, K., Batta, K., Kumar, B. R. P., Gadad, S. S., Ganguly, S., Lorain, S., Verreault, A., Sadhale, P. P., Takeyasu, K., & Kundu, T. K. (2006). Transcriptional coactivator PC4, a chromatin-associated protein, induces chromatin condensation. Molecular and Cellular Biology, 26(22), 8303–8315.
Dhaka, B., Zimmerli, M., Hanhart, D., Moser, M. B., Guillen-Ramirez, H., Mishra, S., Esposito, R., Polidori, T., Widmer, M., García-Pérez, R., Julio, M. K., Pervouchine, D., Melé, M., Chouvardas, P., & Johnson, R. (2024). Functional identification of cis-regulatory long noncoding RNAs at controlled false discovery rates. Nucleic Acids Research, 52(6), 2821–2835.
Didiot, M.-C., Ferguson, C. M., Ly, S., Coles, A. H., Smith, A. O., Bicknell, A. A., Hall, L. M., Sapp, E., Echeverria, D., Pai, A. A., DiFiglia, M., Moore, M. J., Hayward, L. J., Aronin, N., & Khvorova, A. (2018). Nuclear Localization of Huntingtin mRNA Is Specific to Cells of Neuronal Origin. Cell Reports, 24(10), 2553–2560.e5.
Dongre, A., & Weinberg, R. A. (2019). New insights into the mechanisms of epithelial-mesenchymal transition and implications for cancer. Nature Reviews. Molecular Cell Biology, 20(2), 69–84.
Dubois, J.-C., Bonnell, E., Filion, A., Frion, J., Zimmer, S., Riaz Khan, M., Teplitz, G. M., Casimir, L., Méthot, É., Marois, I., Idrissou, M., Jacques, P.-É., Wellinger, R. J., & Maréchal, A. (2025). The single-stranded DNA-binding factor SUB1/PC4 alleviates replication stress at telomeres and is a vulnerability of ALT cancer cells. Proceedings of the National Academy of Sciences of the United States of America, 122(2), e2419712122.
Garavís, M., & Calvo, O. (2017). Sub1/PC4, a multifaceted factor: from transcription to genome stability. Current Genetics, 63(6), 1023–1035.
Gil, N., & Ulitsky, I. (2020). Regulation of gene expression by cis-acting long non-coding RNAs. Nature Reviews. Genetics, 21(2), 102–117.
Hou, Y., Gan, T., Fang, T., Zhao, Y., Luo, Q., Liu, X., Qi, L., Zhang, Y., Jia, F., Han, J., Li, S., Wang, S., & Wang, F. (2022). G-quadruplex inducer/stabilizer pyridostatin targets SUB1 to promote cytotoxicity of a transplatinum complex. Nucleic Acids Research, 50(6), 3070–3082.
Jan, C. H., Friedman, R. C., Ruby, J. G., & Bartel, D. P. (2011). Formation, regulation and evolution of Caenorhabditis elegans 3’UTRs. Nature, 469(7328), 97–101.
Kaypee, S., Ochiai, K., Shima, H., Matsumoto, M., Alam, M., Ikura, T., Kundu, T. K., & Igarashi, K. (2025). Positive coactivator PC4 shows dynamic nucleolar distribution required for rDNA transcription and protein synthesis. Cell Communication and Signaling : CCS, 23(1), 283.
Lai, F., Damle, S. S., Ling, K. K., & Rigo, F. (2020). Directed RNase H Cleavage of Nascent Transcripts Causes Transcription Termination. Molecular Cell, 77(5), 1032–1043.e4.
Lee, J.-S., & Mendell, J. T. (2020). Antisense-Mediated Transcript Knockdown Triggers Premature Transcription Termination. Molecular Cell, 77(5), 1044–1054.e3.
Lubelsky, Y., & Ulitsky, I. (2018). Sequences enriched in Alu repeats drive nuclear localization of long RNAs in human cells. Nature, 555(7694), 107–111.
Ly, S., Didiot, M.-C., Ferguson, C. M., Coles, A. H., Miller, R., Chase, K., Echeverria, D., Wang, F., Sadri-Vakili, G., Aronin, N., & Khvorova, A. (2022). Mutant huntingtin messenger RNA forms neuronal nuclear clusters in rodent and human brains. Brain Communications, 4(6), fcac248.
Maranon, D. G., & Wilusz, J. (2020). Mind the Gapmer: Implications of Co-transcriptional Cleavage by Antisense Oligonucleotides. Molecular Cell, 77(5), 932–933.
Monziani, A., & Ulitsky, I. (2023). Noncoding snoRNA host genes are a distinct subclass of long noncoding RNAs. Trends in Genetics : TIG, 39(12), 908–923.
Mortusewicz, O., Roth, W., Li, N., Cardoso, M. C., Meisterernst, M., & Leonhardt, H. (2008). Recruitment of RNA polymerase II cofactor PC4 to DNA damage sites. The Journal of Cell Biology, 183(5), 769–776.
Much, C., Lasda, E. L., Pereira, I. T., Vallery, T. K., Ramirez, D., Lewandowski, J. P., Dowell, R. D., Smallegan, M. J., & Rinn, J. L. (2024). The temporal dynamics of lncRNA Firre-mediated epigenetic and transcriptional regulation. Nature Communications, 15(1), 6821.
Ntini, E., Louloupi, A., Liz, J., Muino, J. M., Marsico, A., & Ørom, U. A. V. (2018). Long ncRNA A-ROD activates its target gene DKK1 at its release from chromatin. Nature Communications, 9(1), 1636.
Oo, J. A., Warwick, T., Pálfi, K., Lam, F., McNicoll, F., Prieto-Garcia, C., Günther, S., Cao, C., Zhou, YGavrilov, A. A., Razin, S. V., Cabrera-Orefice, A., Wittig, I., Pullamsetti, S. S., Kurian, L., Gilsbach, R., Schulz, M. H., Dikic, I., Müller-McNicoll, M., … Leisegang, M. S. (2025). Long non-coding RNAs direct the SWI/SNF complex to cell type-specific enhancers. Nature Communications, 16(1), 131.
Open2C, Abdennur, N., Abraham, S., Fudenberg, G., Flyamer, I. M., Galitsyna, A. A., Goloborodko, A., Imakaev, M., Oksuz, B. A., Venev, S. V., & Xiao, Y. (2024). Cooltools: Enabling high-resolution Hi-C analysis in Python. PLoS Computational Biology, 20(5), e1012067.
Potapova, T. A., Unruh, J. R., Conkright-Fincham, J., Banks, C. A. S., Florens, L., Schneider, D. A., & Gerton, J. L. (2023). Distinct states of nucleolar stress induced by anticancer drugs. https://doi.org/10.7554/eLife.88799.
Ray, D., Laverty, K. U., Jolma, A., Nie, K., Samson, R., Pour, S. E., Tam, C. L., von Krosigk, N., Nabeel-Shah, S., Albu, M., Zheng, H., Perron, G., Lee, H., Najafabadi, H., Blencowe, B., Greenblatt, J., Morris, Q., & Hughes, T. R. (2023). RNA-binding proteins that lack canonical RNA-binding domains are rarely sequence-specific. Scientific Reports, 13(1), 5238.
Salgado, S., Abreu, P. L., Moleirinho, B., Guedes, D. S., Larcombe, L., & Azzalin, C. M. (2024). Human PC4 supports telomere stability and viability in cells utilizing the alternative lengthening of telomeres mechanism. EMBO Reports, 25(12), 5294–5315.
Salnikov, P., Korablev, A., Serova, I., Belokopytova, P., Yan, A., Stepanchuk, Y., Tikhomirov, S., & Fishman, V. (2024). Structural variants in the Epb41l4a locus: TAD disruption and Nrep gene misregulation as hypothetical drivers of neurodevelopmental outcomes. Scientific Reports, 14(1), 5288.
Sarshad, A. A., Juan, A. H., Muler, A. I. C., Anastasakis, D. G., Wang, X., Genzor, P., Feng, X., Tsai, P.-F., Sun, H.-W., Haase, A. D., Sartorelli, V., & Hafner, M. (2018). Argonaute-miRNA Complexes Silence Target mRNAs in the Nucleus of Mammalian Stem Cells. Molecular Cell, 71(6), 1040–1050.e8.
Tafforeau, L., Zorbas, C., Langhendries, J.-L., Mullineux, S.-T., Stamatopoulou, V., Mullier, R., Wacheul, L., & Lafontaine, D. L. J. (2013). The complexity of human ribosome biogenesis revealed by systematic nucleolar screening of Pre-rRNA processing factors. Molecular Cell, 51(4), 539–551.
Unfried, J. P., & Ulitsky, I. (2022). Substoichiometric action of long noncoding RNAs. Nature Cell Biology, 24(5), 608–615.
Van Nostrand, E. L., Freese, P., Pratt, G. A., Wang, X., Wei, X., Xiao, R., Blue, S. M., Chen, J.-Y.,Cody, N. A. L., Dominguez, D., Olson, S., Sundararaman, B., Zhan, L., Bazile, C., Bouvrette, L. P. B., Bergalet, J., Duff, M. O., Garcia, K. E., Gelboin-Burkhart, C., … Yeo, G. W. (2020). A large-scale binding and functional map of human RNA-binding proteins. Nature, 583(7818), 711–719.
Yang, K., Wang, M., Zhao, Y., Sun, X., Yang, Y., Li, X., Zhou, A., Chu, H., Zhou, H., Xu, J., Wu, M., Yang, J., & Yi, J. (2016). A redox mechanism underlying nucleolar stress sensing by nucleophosmin. Nature Communications, 7, 13599.
Youssef, K. K., Narwade, N., Arcas, A., Marquez-Galera, A., Jiménez-Castaño, R., Lopez-Blau, C., Fazilaty, H., García-Gutierrez, D., Cano, A., Galcerán, J., Moreno-Bueno, G., Lopez-Atalaya, J. P., & Nieto, M. A. (2024). Two distinct epithelial-to-mesenchymal transition programs control invasion and inflammation in segregated tumor cell populations. Nature Cancer, 5(11), 1660–1680.
Yu, L., Ma, H., Ji, X., & Volkert, M. R. (2016). The Sub1 nuclear protein protects DNA from oxidative damage. Molecular and Cellular Biochemistry, 412(1-2), 165–171.
eLife Assessment
In this important work, it is demonstrated that certain high-resolution cryo-EM structures can be obtained by using concentrated cell extracts without purification. The compelling results with the mammalian ribosomes demonstrate the utility of this approach for this molecule and complexes with elongation factor 2. Moreover, this work also demonstrates the utility of 2D template matching for particle picking for structure determination by single-particle averaging pipelines.
Reviewer #1 (Public review):
Summary:
The manuscript by Seraj et al. introduces a transformative structural biology methodology termed "in extracto cryo-EM." This approach circumvents the traditional, often destructive, purification processes by performing single-particle cryo-EM directly on crude cellular lysates. By utilizing high-resolution 2D template matching (2DTM), the authors localize ribosomal particles within a complex molecular "crowd," achieving near-atomic resolution (~2.2 Å). The biological centerpiece of the study is the characterization of the mammalian translational apparatus under varying physiological states. The authors identify elongation factor 2 (eEF2) as a nearly universal hibernation factor, remarkably present not only on non-translating 80S ribosomes but also on 60S subunits. The study provides a detailed structural atlas of how eEF2, alongside factors like SERBP1, LARP1, and IFRD2, protects the ribosome's most sensitive functional centers (the PTC, DC, and SRL) during cellular stress.
Strengths:
The "in extracto" approach is a significant leap forward. It offers the high resolution typically reserved for purified samples while maintaining the "molecular context" found in in situ studies. This addresses a major bottleneck in structural biology: the loss of transiently bound or labile factors during biochemical purification.
The finding that eEF2 binds and sequesters 60S subunits is a major biological insight. This suggests a "pre-assembly" hibernation state that allows for rapid mobilization of the translation machinery once stress is relieved, which was previously uncharacterized in mammalian cells.
The authors successfully captured eIF5A and various hibernation factors in states that are traditionally disrupted. The identification of eIF5A across nearly all translating and non-translating states highlights the power of this method to detect ubiquitous but weakly bound regulators.
The manuscript beautifully illustrates the "shielding" mechanism of the ribosome. By mapping the binding sites of eEF2 and its co-factors, the authors provide a clear chemical basis for how the cell prevents nucleolytic cleavage of ribosomal RNA during nutrient deprivation.
Weaknesses:
While 2DTM is a powerful search tool, it inherently relies on a known structural "template." There is a risk that this methodology may be "blind" to highly divergent or novel macromolecular complexes that do not share sufficient structural similarity with the search model. The authors should discuss the limitations of using a vacant 60S/80S template in identifying highly remodeled stress-induced complexes. For instance, what happens if an empty 40S subunit is used as a template? In the current work, while 60S and 80S particles are picked, none are 40S. The authors should comment on this.
In the GTPase center, the authors identify density for "DRG-like" proteins. However, due to limited local resolution in that specific region, they are unable to definitively distinguish between DRG1 and DRG2. While the structural similarity is high, the functional implications differ, and the identification remains somewhat speculative. The authors should acknowledge this in the text.
While "in extracto" is superior to purified SPA, the act of cell lysis (even rapid permeabilization) still involves a change in the chemical environment (pH, ion concentration, and dilution of metabolites). The authors could strengthen the manuscript by discussing how post-lysis changes might affect the occupancy of factors like GTP vs. GDP states.
The study provides excellent snapshots of stationary states (translating vs. hibernating), but the kinetic transition, specifically how the 60S-eEF2 complex is recruited back into active translation, is not well discussed. On page 13, the authors present eEF2 bound to 60S but do not mention anything regarding which nucleotide is bound to the factor. It only becomes clear that it is GDP after looking at Figure S9. This should be clarified in the text. Similarly, the observations that eEF2 is bound to GDP in the 60S and 80S raise questions as to how the factor dissociates from the ribosome. This could also be discussed.
Overall Assessment:
The work reported in this manuscript likely represents the future of structural proteomics. The combination of high-resolution structural biology with minimal sample perturbation provides a new standard for investigating the cellular machines that govern life. After addressing minor points regarding template bias, protein identification, and transition dynamics, this work may become a landmark in the field of translation.
Reviewer #2 (Public review):
In this manuscript, the authors describe using "in extracto" cryo-EM to obtain high-resolution structures of mammalian ribosomes from concentrated cell extracts without further purification or reconstitution. This approach aims to solve two related problems. The first is that purified ribosomes often lose cellular cofactors, which are often reconstituted in vitro; this precludes the ability to find novel interactions. The second is that while it is possible to perform cryo-EM on cellular lamella, FIB milling is a slow and laborious process, making it unfeasible to collect datasets sufficiently large to allow for high-resolution structure determination. Extracts should contain all cellular cofactors and allow for grid preparation similar to standard single-particle analysis (SPA) approaches. While cryo-EM of cell extracts is not in itself novel, this manuscript uses 2D template matching (2DTM) for particle picking prior to structure determination using more standard SPA pipelines. This should allow for improved picking over other approaches in order to obtain large datasets for high-resolution SPA.
This manuscript has two main results: novel structures of ribosomes in hibernating states; and a proof-of-principle for in extracto cryo-EM using 2DTM. Overall, I think the results presented here are strong and serve as a proof-of-principle for an approach that may be useful to many others. However, without presenting the logic of how parameters were optimized, this manuscript is limited in its direct utility to readers.
Reviewer #3 (Public review):
Summary:
The authors describe a new structural biology framework termed "in extracto cryo-EM," which aims to bridge the gap between single-particle cryo-EM of purified complexes and in situ cryo-electron tomography (cryo-ET). By utilizing high-resolution 2D template matching (2DTM) on mammalian cell lysates, the authors sought to visualize the translational apparatus in a near-native environment while maintaining near-atomic resolution. The study identifies elongation factor 2 (eEF2) as a major hibernation factor bound to both 60S and 80S particles and describes a variety of hibernation scenarios involving factors such as SERBP1, LARP1, and CCDC124.
Strengths:
(1) The use of 2DTM effectively overcomes the signal-to-noise challenges posed by the dense and viscous nature of cellular extracts, yielding maps as high as 2.2 Å.
(2) The discovery of eEF2-GDP as a ubiquitous shield for ribosomal functional centers, particularly its unexpected stabilization on the 60S subunit, provides a compelling model for ribosome preservation during stress.
Weaknesses:
(1) Representative nature of cell samples and lower detection limit
The cells used in this study (MCF-7, BSC-1, and RRL) are either fast-growing cancer cell lines or specialized protein-synthetic systems. For cells with naturally low ribosomal abundance (such as quiescent primary cells), achieving the target concentration (e.g., A260 > 1000 ng/uL) would require an exponentially larger starting cell population.
Is there a defined lower limit of ribosomal concentration in the raw lysate below which the 2DTM algorithm fails to yield high-resolution classes? In ribosome-sparse lysates, A260 becomes an unreliable proxy for ribosome density due to the high background of other RNA species and proteins. How do the authors estimate specific ribosome abundance in such heterogeneous fields?
(2) Quantitation in heterogeneous lysates and crowding effects
The authors utilize A260 as a key quality control measure before grid preparation. However, if extreme physical concentration is required to see enough particles, the background concentration of other cytoplasmic components also increases. This may lead to molecular crowding or sample viscosity that interferes with the formation of optimal thin ice. How do the authors calculate or estimate the specific abundance of ribosomes in the cryo-EM field of view when they represent a much smaller percentage of the total cellular content?
(3) Optimization of sample preparation
The authors describe lysates as dense and viscous, requiring multiple blotting steps (2-3 times) for 3-8 seconds. Have the authors tested whether a larger molecular weight cutoff (e.g., 100 kDa) during concentration could improve the ribosome-to-background ratio without losing small factors like eIF5A (approx. 17 kDa)? Could repeated blotting of a concentrated, viscous lysate introduce shearing forces or increased exposure to the air-water interface that perturbs the native conformation of the complexes?
(4) The regulatory switch and mechanism of eEF2
The finding that eEF2-GDP occupies dormant ribosomes is striking. What drives eEF2 from its canonical role in translocation to this hibernation state? Is this transition purely driven by stoichiometry (lack of mRNA/tRNA) and the GDP/GTP ratio, or is there a role for post-translational modifications? How do these eEF2-bound dormant ribosomes rapidly re-enter the translation pool upon stress relief?
(5) Hibernation diversity and LARP1 contextualization
The study reveals that hibernation strategies vary across cell types. Does the high hibernation rate in RRL reflect a physiological state, or does it hint at "preparation-induced stress" due to resource exhaustion or mRNA degradation in the cell-free system? How do the authors reconcile their discovery of LARP1 on 80S particles with recent 2024 reports that primarily describe LARP1 as an SSU-bound repressor?
eLife Assessment
This important study provides solid evidence to support the anti-tumor potential of citalopram, originally an anti-depression drug, in hepatocellular carcinoma (HCC). In addition to their previous report on directly targeting tumor cells via glucose transporter 1 (GLUT1), the authors tried to uncover additional working mechanisms of citalopram in HCC treatment in the current study. The data here suggests that citalopram may regulate the phagocytotic function of TAM via C5aR1 or CD8+T cell function to suppress HCC growth in vivo.
Reviewer #1 (Public review):
Summary:
In their previous publication (Dong et al. Cell reports 2024), the authors showed that citalopram treatment resulted in reduced tumor size by binding to the E380 site of GLUT1 and inhibiting the glycolytic metabolism of HCC cells, instead of the classical citalopram receptor. Given that C5aR1 was also identified as the potential receptors of citalopram in the previous report, the authors focused on exploring the potential of immune-dependent anti-tumor effect of citalopram via C5aR1. C5aR1 was found to be expressed on tumor-associated macrophages (TAMs) and citalopram administration showed potential to improve the stability of C5aR1 in vitro. Through macrophage depletion and adoptive transfer approaches in HCC mouse models, the data demonstrated the potential importance of C5aR1-expressing macrophage in the anti-tumor effect of citalopram in vivo. Mechanistically, their data suggested that citalopram may regulate the phagocytosis potential and polarization of macrophages through C5aR1, thereby potentiated CD8+T cell responses in vivo. Finally, as the systemic 5-HT level is down-regulated by citalopram, the authors analyzed the association between a low 5-HT and a superior CD8+T cell function against tumor.
Strengths:
The idea of repurposing clinical-in-used drugs showed great potential for immediate clinical translation. The data here suggested that the anti-depression drug, citalopram displayed immune regulatory role on TAM via a new target C5aR1 in HCC.
Comments on revised version:
The authors have already addressed the previous comments.
Reviewer #2 (Public review):
Summary:
Dong et al. present a thorough investigation into the potential of repurposing citalopram, an SSRI, for hepatocellular carcinoma (HCC) therapy. The study highlights the dual mechanisms by which citalopram exerts anti-tumor effects: reprogramming tumor-associated macrophages (TAMs) toward an anti-tumor phenotype via C5aR1 modulation and suppressing cancer cell metabolism through GLUT1 inhibition, while enhancing CD8+ T cell activation. The findings emphasize the potential of drug repurposing strategies and position C5aR1 as a promising immunotherapeutic target.
Strength:
It provides detailed evidence of citalopram's non-canonical action on C5aR1, demonstrating its ability to modulate macrophage behavior and enhance CD8+ T cell cytotoxicity. The use of DARTS assays, in silico docking, and gene signature network analyses offers robust validation of drug-target interactions. Additionally, the dual focus on immune cell reprogramming and metabolic suppression presents a comprehensive strategy for HCC therapy. By highlighting the potential of existing drugs like citalopram for repurposing, the study also underscores the feasibility of translational applications. During revision, the authors experimentally demonstrated that TAM has lower GLUT1 levels, further strengthening their claim of C5aR1 modulation-dependent TAM improvement for tumor therapy.
Comments on revised version:
The authors have addressed most of my concerns about the paper.
Author response:
The following is the authors’ response to the previous reviews.
Public Reviews:
Reviewer #1 (Public review):
Summary:
In their previous publication (Dong et al. Cell Reports 2024), the authors showed that citalopram treatment resulted in reduced tumor size by binding to the E380 site of GLUT1 and inhibiting the glycolytic metabolism of HCC cells, instead of the classical citalopram receptor. Given that C5aR1 was also identified as the potential receptors of citalopram in the previous report, the authors focused on exploring the potential of immune-dependent anti-tumor effect of citalopram via C5aR1. C5aR1 was found to be expressed on tumor-associated macrophages (TAMs) and citalopram administration showed potential to improve the stability of C5aR1 in vitro. Through macrophage depletion and adoptive transfer approaches in HCC mouse models, the data demonstrated the potential importance of C5aR1-expressing macrophage in the anti-tumor effect of citalopram in vivo. Mechanistically, their in vitro data suggested that citalopram may regulate the phagocytosis potential and polarization of macrophages through C5aR1. Next, they tried to investigate the direct link between citalopram and CD8+T cells by including an additional MASH-associated HCC mouse model. Their data suggest that citalopram may upregulate the glycolytic metabolism of CD8+T cells, probability via GLUT3 but not GLUT1-mediated glucose uptake. Lastly, as the systemic 5-HT level is down-regulated by citalopram, the authors analyzed the association between a low 5-HT and a superior CD8+T cell function against tumor. Although the data is informative, the rationale for working on additional mechanisms and logical link among different parts are not clear. In addition, some of the conclusion is also not fully supported by the current data.
Strengths:
The idea of repurposing clinical-in-used drugs showed great potential for immediate clinical translation. The data here suggested that the anti-depression drug, citalopram displayed immune regulatory role on TAM via a new target C5aR1 in HCC.
Comments on revised version:
The authors have addressed most of my concerns about the paper.
We thank you the reviewer. We appreciate the reviewer’s constructive suggestions that helped improve the clarity and robustness of the study.
Reviewer #2 (Public review):
Summary:
Dong et al. present a thorough investigation into the potential of repurposing citalopram, an SSRI, for hepatocellular carcinoma (HCC) therapy. The study highlights the dual mechanisms by which citalopram exerts anti-tumor effects: reprogramming tumor-associated macrophages (TAMs) toward an anti-tumor phenotype via C5aR1 modulation and suppressing cancer cell metabolism through GLUT1 inhibition, while enhancing CD8+ T cell activation. The findings emphasize the potential of drug repurposing strategies and position C5aR1 as a promising immunotherapeutic target.
Strengths:
It provides detailed evidence of citalopram's non-canonical action on C5aR1, demonstrating its ability to modulate macrophage behavior and enhance CD8+ T cell cytotoxicity. The use of DARTS assays, in silico docking, and gene signature network analyses offers robust validation of drug-target interactions. Additionally, the dual focus on immune cell reprogramming and metabolic suppression presents a comprehensive strategy for HCC therapy. By highlighting the potential for existing drugs like citalopram to be repurposed, the study also emphasizes the feasibility of translational applications. During revision, the authors experimentally demonstrated that TAM has lower GLUT1, which further strengthens their claim of C5aR1 modulation-dependent TAM improvement for tumor therapy.
Weaknesses:
The authors proposed that CD8+ T cells have an TAM-independent role upon Citalopram treatment. However, this claim requires further investigation to confirm that the effect is truly "TAM independent".
We appreciate the reviewer’s insightful comment regarding the interpretation of CD8<sup>+</sup> T cell roles. In this study, in vitro analyses show that citalopram directly enhances CD8<sup>+</sup>T cell activity, as evidenced by increased CFSE proliferation, upregulation of activation markers, and cytotoxic effector readouts (Figures S10A–E). Accordingly, we infer a TAM-independent CD8<sup>+</sup> T cell activation by citalopram in vitro.
Our in vivo data indicate that the primary anti-tumor mechanism of citalopram involves targeting C5aR1<sup>+</sup> TAMs, which subsequently enhances CD8<sup>+</sup> T cell immunity. This conclusion is supported by the near-complete ablation of citalopram’s therapeutic effect upon TAM depletion with clodronate liposomes (Figure S5). Additionally, citalopram reduces serum serotonin (5-HT) levels (Figure 4E), recapitulating the serotonergic state of Tph1<sup>−/−</sup> mice. Notably, the anti-tumor effect and CD8<sup>+</sup> T cell activation induced by citalopram exceed those observed in Tph1<sup>−/−</sup> mice (Figures 4G–I), suggesting that 5-HT reduction contributes to CD8<sup>+</sup> T cell activation but operates alongside other mechanisms in vivo, prominently including TAM targeting. As suggested, we further tested CD8<sup>+</sup> T cell activity in the context of macrophage depletion. The result showed that citalopram did not further enhance CD8<sup>+</sup> T cell cytotoxicity after macrophage depletion, indicating that TAM-dependent pathways are central to CD8<sup>+</sup> T cell–mediated anti-tumor immunity and largely underlie the anti-tumor effects of citalopram.
To accurately reflect our main findings, we had made several revisions to the manuscript. First, we have revised the title to “Citalopram exhibits immune-dependent anti-tumor effects by modulating C5aR1<sup>+</sup> TAMs”. In the Results section, the Conclusions have been updated to: “These data not only corroborate recent reports that SSRIs modulate CD8<sup>+</sup> T cell function via serotonergic-dependent mechanism, but also reveals additional in vivo regulatory avenues by which citalopram affects CD8<sup>+</sup> T cells, such as its ability to reprogram C5aR1<sup>+</sup> TAMs. Notably, in the context of macrophage depletion, CD8<sup>+</sup> T cell cytotoxicity was not further enhanced by citalopram, indicating that TAM-dependent pathways are central to CD8<sup>+</sup> T cell-mediated anti-tumor immunity and largely underlie the anti-tumor effects of citalopram”. In the Discussion part, we have included the following content: “Although citalopram directly stimulates CD8<sup>+</sup> T cells in vitro, the TAM-independent activation is not evident in vivo within the complex TME, as CD8<sup>+</sup> T cell responses are abolished by macrophage depletion, indicating that the in vivo effects of citalopram on CD8<sup>+</sup> T cells and tumor growth are largely TAM-dependent”.
Recommendations for the authors:
Reviewer #2 (Recommendations for the authors):
Fig S5 and Fig 3: To improve clarity regarding the roles of TAMs and CD8+ T cells, can the authors experimentally demonstrate the macrophage-independent function of CD8+ T cells? An experiment in Fig 3J using or not using Clodro-Liposome to deplete TAMs would be more informative.
We thank the reviewer for the insightful suggestion. In this study, in vitro analyses show that citalopram directly enhances CD8<sup>+</sup> T cell activity, as evidenced by increased CFSE proliferation, upregulation of activation markers, and cytotoxic effector readouts (Figures S10A–E). Therefore, we conclude a TAM-independent CD8<sup>+</sup> T cell activation induced by citalopram. Previously, in Figure S5, we analyzed the therapeutic effect of citalopram after macrophage depletion by clodronate liposomes and also probed the immune profiles. The result showed that CD8<sup>+</sup> T cell cytotoxic activities were not significantly affected by citalopram in this context (Figure S5E), indicating that the TAM-dependent pathway is central to CD8<sup>+</sup> T cell-mediated anti-tumor immunity and to the anti-tumor effects of citalopram. We have incorporated this result into the revised manuscript.
Fig S4: The figure panel showing sample/treatment annotations is missing.
Thank you for pointing this out. We have updated Fig. S4 to include explicit sample identifiers, treatment group labels, and drug concentrations.
Since Glut3 is vital in both TAMs and CD8+ T cells, the authors should discuss the interaction between Glut3 and Citalopram. Additionally, include details about the structural homology between Glut1 and Glut3 in the discussion.
Thank you for the suggestion. Citalopram was docked into the GLUT1 substrate-binding pocket, with the best poses showing an electrostatic interaction centered on E380 accompanied by hydrophobic contacts within the pocket (Our previous publication, Dong et al. Cell Reports 2024). Although GLUT1 and GLUT3 share a highly conserved core substrate-binding pocket, isoform-specific regulation arises from features outside the canonical site. Structural homology between GLUT1 and GLUT3 is high in the transmembrane core, but regulatory features, such as the cytosolic Sugar Porter (SP) motif network, the conserved A motif, lipid interfaces, and gating dynamics, differ between the two isoforms (PMID: 33536238). These regulatory differences can alter pocket accessibility, coupling to conformational transitions, and allosteric communication with the cytosol, such that a ligand binding GLUT1 in the inward-facing state may not stabilize a GLUT3 conformation that yields appreciable transport inhibition. Consistently, functional experiments have indicated robust GLUT1 engagement in cancer cells (Dong et al. Cell Reports 2024), while equivalent GLUT3 inhibition has not been observed in TAMs (Figure S8), suggesting isoform-selective targeting by citalopram. We have included these discussion in the revised manuscript.
Fig 3O: Please clarify the statement regarding the requirements of CD8 T cells for the pro-tumor phenotype of C5aR1+ TAMs. Specify whether this relates to a pro- or anti-tumor effect of CD8 T cells.
Thanks. As suggested, we have improved the statement as follows: “depletion of CD8<sup>+</sup> T cells abrogated the C5aR1<sup>+</sup> TAM-mediated enhancement of tumor growth (Figure 3O), suggesting that the anti-tumor effects of CD8<sup>+</sup> T cells are required for the pro-tumor phenotype of C5aR1<sup>+</sup> TAMs”.
eLife Assessment
This fundamental work significantly advances our understanding of gravity sensing and orientation behavior in the ctenophore, an animal of major importance in understanding the evolution of nervous systems. Through comprehensive reconstruction with volumetric electron microscopy, and time-lapse imaging of cilia motion, the authors provide compelling evidence that the aboral nerve net coordinates the activity of balancer cilia. The resemblance to the ciliomotor circuit in marine annelids provides a fascinating example of how neural circuits may convergently evolve to solve common sensorimotor challenges.
Reviewer #1 (Public review):
Summary:
This work presents an interesting circuit dissection of the neural system allowing a ctenophore to keep its balance and orientation in its aquatic environment by using a fascinating structure called the statocyst. By combining serial-section electron microscopy with behavioral recordings, the authors found a population of neurons which exists as a syncytium and could associate these neurons with specific functions related to controlling the beating of cilia located in the statocyst. The type A ANN neurons participate in arresting cilia beating, and the type B ANN neurons participate in resuming cilia beating and increasing their beating frequency.
Moreover, the authors found that bridge cells are connected with the ANN neurons, giving them the role of rhythmic modulators.
From these observations, the authors conclude that the control is coordination instead of feedforward sensory-motor function, a hypothesis that had been put forth in the past but could not be validated until now. They also compare it to the circuitry implementing a similar behavior in a species that belongs to a different phylum where the nervous system is thought to have evolved separately.
Therefore, this work significantly advances our knowledge of the circuitry implementing the control of the cilia that participate in statocyst function which ultimately allow the animal to correct its orientation. It explains how the nervous system allows an animal to solve a specific problem and puts it in an evolutionary perspective showing a convincing case of convergent evolution.
Strengths:
The evidence for how the circuitry is connected is convincing. Pictures of synapses showing the direction of connectivity are clear and there are good reasons to believe that the diagram inferred is valid, even though we can always expect that some connections are missing.
The evidence for how the cilia change their beating frequency is also convincing, and the paradigm and recording methods seem pretty robust.
The authors achieved their aims and the results support their conclusions. This work impacts its field by presenting a mechanism by which ctenophores correct their balance, which will provide a template for comparison with other sensory systems.
Reviewer #2 (Public review):
Summary:
In this manuscript, the authors describe the production of a high-resolution connectome for the statocyst of a ctenophore nervous system. This study is of particular interest because of the apparent independent evolution of the ctenophore nervous system. The statocyst is a component of the aboral organ, which is used by ctenophores to sense gravity and regulate the activity of the organ's balancer cilia. The EM reconstruction of the aboral organ was carried out on a five-day old larva of the model ctenophore Mnemiopsis leidyi. To place their connectome data in a functional context, the authors used high-speed imaging of ciliary beating in immobilized larvae. With these data, the authors were able to model the circuitry used for gravity sensing in a ctenophore larva.
Strengths:
Because of it apparently being the sister phylum to all other metazoans, Ctenophora is a particularly important group for studies of metazoan evolution. Thus, this work has much to tell us about how animals evolved. Added to that is the apparent independent evolution of the ctenophore nervous system. This study provides the first high-resolution connectomic analysis of a portion of a ctenophore nervous system, extending previous studies of the ctenophore nervous system carried out by Sid Tamm. As such it establishes the methodology for high-resolution analysis of the ctenophore nervous system. While the generation of a connectome is in and of itself an important accomplishment, the coupling of the connectome data with analysis of the beating frequency of balancer cell cilia provides a functional context for understanding how the organization of the neural circuitry in the aboral organ carries out gravity sensing. In addition, the authors identified a new type of syncytial neuron in Mnemiopsis. Interestingly, the authors show that the neural circuitry controlling cilia beating in Mnemiopsis shares features with the circuitry that controls ciliary movement in the annelid Platynereis, suggesting convergent evolution of this circuity in the two organisms. The data in this paper are of high quality, and the analyses have been thoroughly and carefully done.
Weaknesses:
The paper has no obvious weaknesses.
Comments on revisions:
The authors have satisfactorily addressed the minor issues that I brought up in my original review.
Reviewer #3 (Public review):
Summary:
It has been a long time since I enjoyed reviewing a paper as much as this one. In it, the authors generate an unprecedented view of the aboral organ of a 5-day old ctenophore. They proceed to derive numerous insights by reconstructing the populations and connections of cell types, with up to 150 connections from the main Q1-4 neuron.
Strengths:
The strengths of the analysis are the sophisticated imaging methods used, the labor-intensive reconstruction of individual neurons and organelles, and especially the mapping of synapses. The synaptic connections to and from the main coordinating neurons allow the authors to created a polarized network diagram for these components of the aboral organ. These connections give insight about the potential functions of the major neurons, which also giving some unexpected results, particularly the lack of connections from the balancer system to the coordinating system.
Weaknesses:
There were no significant weaknesses in the paper - only a slate of interesting unanswered questions to motivate future studies.
Comments on revisions:
This manuscript was already strong from the start, and I am fully satisfied with the revisions, which corrected a few glitches and points of clarification.
Author response:
The following is the authors’ response to the original reviews.
Public Reviews:
Reviewer #1 (Public review):
Summary:
This work presents an interesting circuit dissection of the neural system allowing a ctenophore to keep its balance and orientation in its aquatic environment by using a fascinating structure called the statocyst. By combining serial-section electron microscopy with behavioral recordings, the authors found a population of neurons that exists as a syncytium and could associate these neurons with specific functions related to controlling the beating of cilia located in the statocyst. The type A ANN neurons participate in arresting cilia beating, and the type B ANN neurons participate in resuming cilia beating and increasing their beating frequency.
Moreover, the authors found that bridge cells are connected with the ANN neurons, giving them the role of rhythmic modulators.
From these observations, the authors conclude that the control is coordination instead of feedforward sensory-motor function, a hypothesis that had been put forth in the past but could not be validated until now. They also compare it to the circuitry implementing a similar behavior in a species that belongs to a different phylum, where the nervous system is thought to have evolved separately.
Therefore, this work significantly advances our knowledge of the circuitry implementing the control of the cilia that participate in statocyst function, which ultimately allows the animal to correct its orientation. It represents an example of systems neuroscience explaining how the nervous system allows an animal to solve a specific problem and puts it in an evolutionary perspective, showing a convincing case of convergent evolution.
Strengths:
The evidence for how the circuitry is connected is convincing. Pictures of synapses showing the direction of connectivity are clear, and there are good reasons to believe that the diagram inferred is valid, even though we can always expect that some connections are missing.
The evidence for how the cilia change their beating frequency is also convincing, and the paradigm and recording methods seem pretty robust.
The authors achieved their aims, and the results support their conclusions. This work impacts its field by presenting a mechanism by which ctenophores correct their balance, which will provide a template for comparison with other sensory systems.
Thank you very much for these comments.
Weaknesses:
The evidence supporting the claim that the neural circuitry presented here controls the cilia beating is more correlational because it only relies on the fact that the location of the two types of ANN neurons coincides with the quadrants that are affected in the behavioral recordings. Discussing ways by which causality could be established might be helpful.
We have now added additional discussions in a new “Future Directions” section explaining that for example calcium imaging or targeted neuron ablations could be used in future work to establish causality. This would require the development of genetic delivery techniques to e.g. introduce GCaMP calcium sensor or transgenic reporters.
The explanation of the relevance of this work could be improved. The conclusion that the work hints at coordination instead of feedforward sensory-motor control is explained over only a few lines. The authors could provide a more detailed explanation of how the two models compete (coordination vs feedforward sensory-motor control), and why choosing one option over the other could provide advantages in this context.
We added a more detailed explanation about the two types of model and why we believe that a coordination model is more compatible with our connectome data.
“An alternative model for the function of the nerve net would be a feedforward sensory-motor system, in which balancer cells provide mechanosensory input to motor effectors via the nerve net, similar to a reflex arc. None of our observations support such a sensory-motor model. There are no synaptic pathways from balancer cells or any other sensory cells to the nerve net. The only synaptic input to ANNs comes from the bridge cells (discussed below) and from each other. The three synaptically interconnected ANNs may generate endogenous rhythm that controls balancer cilia and is influenced by bridge input. ANNs may also be influenced by neuropeptides secreted by other aboral organ neurons. Such chemical inputs may underlie the flexibility of gravitaxis and its modulation by other cues (e.g. light). Overall, the coordination model parsimoniously explains both the ANN wiring topology and the observed dynamics, whereas a simple feedforward reflex does not.”
Since the fact that the ANN neurons form a syncytium is an important finding of this study, it would be useful to have additional illustrations of it. For instance, pictures showing anastomosing membranes could typically be added in Figure 2.
We have now included a movie (Video 3) showing a volumetric reconstruction of a segment of an ANN neuron, which highlights the anastomosing morphology in greater detail than static images.
“Video 3. Volumetric reconstruction of a single ANN Q1-4 neuron showing syncytial soma (cyan) and nuclei (magenta). The rotating view highlights the anastomosing morphology, although not all fine details could be reconstructed due to data limitations.”
Also, to better establish the importance of the study, it could be useful to explain why the balancers’ cilia spontaneously beat in the first place (instead of being static and just acting as stretch sensors).
We have discussed in more detail why it may be important for the balancer cilia to beat.
“The observation that balancer cilia beat spontaneously, even in the absence of external tilt, suggests that they are active sensory oscillators rather than static stretch sensors. Their spontaneous beating could set a dynamic baseline of sensitivity, which can then be modulated by ANN inputs or sensory changes during tilt. Such a dynamic system may be more sensitive to small deflections and be more responsive [@Lowe1997]. Thus, the regulated beating of balancer cilia should not be seen as noise, but as an adaptive feature that enables flexible and robust graviceptive responses. The ctenophore balancer may thus use active ciliary oscillations for enhanced sensorimotor integration similar to other sensory systems [@Wan_2023].”
Reviewer #2 (Public review):
Summary:
In this manuscript, the authors describe the production of a high-resolution connectome for the statocyst of a ctenophore nervous system. This study is of particular interest because of the apparent independent evolution of the ctenophore nervous system. The statocyst is a component of the aboral organ, which is used by ctenophores to sense gravity and regulate the activity of the organ’s balancer cilia. The EM reconstruction of the aboral organ was carried out on a five-day-old larva of the model ctenophore Mnemiopsis leidyi. To place their connectome data in a functional context, the authors used high-speed imaging of ciliary beating in immobilized larvae. With these data, the authors were able to model the circuitry used for gravity sensing in a ctenophore larva.
Strengths:
Because of it apparently being the sister phylum to all other metazoans, Ctenophora is a particularly important group for studies of metazoan evolution. Thus, this work has much to tell us about how animals evolved. Added to that is the apparent independent evolution of the ctenophore nervous system. This study provides the first high-resolution connectomic analysis of a portion of a ctenophore nervous system, extending previous studies of the ctenophore nervous system carried out by Sid Tamm. As such, it establishes the methodology for high-resolution analysis of the ctenophore nervous system. While the generation of a connectome is in and of itself an important accomplishment, the coupling of the connectome data with analysis of the beating frequency of balancer cell cilia provides a functional context for understanding how the organization of the neural circuitry in the aboral organ carries out gravity sensing. In addition, the authors identified a new type of syncytial neuron in Mnemiopsis. Interestingly, the authors show that the neural circuitry controlling cilia beating in Mnemiopsis shares features with the circuitry that controls ciliary movement in the annelid Platynereis, suggesting convergent evolution of this circuitry in the two organisms. The data in this paper are of high quality, and the analyses have been thoroughly and carefully done.
Weaknesses:
The paper has no obvious weaknesses.
We thank the reviewer for these comments.
Reviewer #3 (Public review):
Summary:
It has been a long time since I enjoyed reviewing a paper as much as this one. In it, the authors generate an unprecedented view of the aboral organ of a 5-day-old ctenophore. They proceed to derive numerous insights by reconstructing the populations and connections of cell types, with up to 150 connections from the main Q1-4 neuron.
Strengths:
The strengths of the analysis are the sophisticated imaging methods used, the labor-intensive reconstruction of individual neurons and organelles, and especially the mapping of synapses. The synaptic connections to and from the main coordinating neurons allow the authors to create a polarized network diagram for these components of the aboral organ. These connections give insight into the potential functions of the major neurons. This also gives some unexpected results, particularly the lack of connections from the balancer system to the coordinating system.
Thank you for these positive comments on the paper.
Weaknesses:
There were no significant weaknesses in the paper - only a slate of interesting unanswered questions to motivate future studies.
Recommendations for the authors:
Reviewing Editor Comments:
In consultation, the reviewers recommend that improving the evidence to “exceptional” would require additional perturbation experiments (e.g., ablation of specific neurons), as Reviewer 1 suggests. They also recommend adding a “Future Directions” section to the manuscript, because it opens up so many new experimental directions.
We have added a new “Future Directions” section at the end of the Discussion. To carry out the proposed perturbation or calcium imaging experiments would require significant additional work and method development. We are actively working in establishing mRNA and DNA injection into ctenophore zygotes to enable live imaging, cell labelling or ablations in the future.
Reviewer #1 (Recommendations for the authors):
Suggestions for improved or additional experiments, data, or analyses:
To establish causality (neurons control balancer cilia), an important experiment would be to manipulate each of these neuronal populations (e.g., by ablating them) and measure the effect of these ablations on the beating frequency of the balancer cilia of the four quadrants. Moreover, direct observation of neuronal activity (e.g., by using calcium imaging) would also provide more compelling evidence for neuronal control.
We agree with the reviewer that such perturbation experiments would be needed to establish causality. Such experiments are currently still not possible in ctenophoes and would require significant technology development. We discuss such experiments in the “Future directions” section and also place this in the context of the currently available techniques in ctenophores. We are actively working on this but waiting for such technological breakthroughs and new experiments would significantly delay the publication of a version of record of the paper.
Recommendations for improving the writing and presentation:
ANN neurons are described in great detail, though SNN neurons are described more loosely. Perhaps a more detailed description of SNN neurons would be helpful.
We added the information on SNNs to show that these cells are distinct from the ANN neurons. Since our focus is on the aboral organ, we did not aim for a comprehensive reconstruction of SNNs. Several of the processes of the SNNs are also truncated and outside our EM volume. We have nevertheless added additional details about the morphology and connectivity of SNN neurons.
“Near the perifery of the aboral organ, we identified four further anastomosing nerve-net neurons. These resembled the previously reported syncytial subepithelial nerve net (SNN) neurons in the body wall of Mnemiopsis (Figure 2–figure supplement 1C–G) and were clearly distinct from the ANN neurons (both in location and morphology). SNN neurons show a blebbed morphology and contain dense core vesicles @Burkhardt2023 but no synapses.”
Minor corrections to the text and figures:
(1) Figure 2 C): “mitochondia” instead of “mitochondria”.
corrected
(2) Figure 3. Title: “balancer and and bridge”.
corrected
(3) Figure 3.C) “shown in xxx color”
corrected
Reviewer #2 (Recommendations for the authors):
Clearer usage of the terms statocyst, aboral organ, aboral nerve net, statolith, dome, and lithocytes would be helpful. For readers not familiar with ctenophore anatomy, things can get a bit confusing. A single schematic with all of these terms would be helpful. In Figure 1E, there is a label “dc”. Should this be “do”?
We have added an annotated schematic to Figure 1, explaining these terms.
Figure 1C “The statocyst is a cavity-like organ enclosed by the dome cilia (do), which contains the statolith formed by lithocytes (li) and supported by the balancer cilia (bal).”
Reviewer #3 (Recommendations for the authors):
My comments are numerous, but mostly minor suggestions for improving the clarity.
[Suggested insertions/changes are indicated by square brackets]
(1) [It would be much easier to review this if there were line numbers, or with a double-spaced manuscript that was more accommodating for markup.]
Thank you for this comment. We have increased the line spacing in the revised version. (We set the CSS line-height property on the html ‘body’ element to 2em).
(2) The terms statolith, statocyst, and lithocytes can be confusing, so it would be nice to have an upfront definition of how they relate to each other.
We have now explain these terms in the Introduction and also have improved the annotation of Figure 1.
Figure1C. “The statocyst is a cavity-like organ enclosed by the dome cilia (do), which contains the statolith formed by lithocytes (li) and supported by the balancer cilia (bal).”
(3) Statolith is spelled as statolyth in the early pages, but statolith in the later pages. I think -lith is more common, but in any case, these should be standardized.
corrected to ‘statolith’
ABSTRACT:
(1) Differential load[s] on the balancer cilia [lead] to altered
changed
(2) We used volume electron microscopy (vEM) to image the aboral organ.
changed
(3) also form reciprocal connections with the bridge cells.
corrected
INTRODUCTION:
(1) “identify conserved neuronal markers in ctenophores” - confusing - does this mean conserved across ctenophores, or conserved in ctenophores and other animals?
changed to “classical neuronal markers”
(2) “either increase or decrease their [ciliary] activity, indicating” - otherwise it sounds like the balancers are increasing activity.
changed to “balancer cells may either increase or decrease their ciliary activity”
(3) after “matches the setup used in high-speed imagine experiments”, it might be nice to add a statement like “Future studies could potentially investigate activity in the inverted orientation, when the statolith is suspended below the cilia, to see if the response differs.”
In this sentence we referred to the orientation of the animals in our figures. There is a consensus among ctenophore researchers that when depicting ctenophores, the aboral organ should face downwards. However, for this paper we chose the opposite orientation to better match our experiments and help interpreting the results. We changed the text to: “In this study, we represent ctenophores with their aboral organ facing upwards (”balancer-up” posture), as this configuration facilitates intuitive interpretation of balance-like functions and matches the setup used in high-speed imaging experiments. ”
We added the sentences “Future experiments could also explore how orientation affects the response of balancer cilia. For example, when the statolith is suspended below the cilia (the”balancer-down” posture), ciliary beating patterns may differ from what we observed here in the “balancer-up” configuration.” to the section Future Directions”.
(4) “abolished by calcium[-]channel inhibitors”
corrected
(5) “By functional imaging, we uncovered” - It is not clear what functional imaging is. Maybe a fewword definition here, and be sure to explain in the methods.
changed to “By high-speed ciliary imaging”. The details of the imaging are explained in the Methods section under “Imaging the Activity of Balancer Cilia”.
RESULTS:
(1) “five-day-old” - is it worth saying post-fertilization here?
Thank you for pointing this out. In accordance with Presnell et al. (2022), we use post-hatching as the reference. We have revised the text in the Materials and Methods section to read: “5-day-old (5 days post-hatching)”
(2) “We classified these cells into cell types [based on …]” - specify a bit about how you classified them based on morphology, the presence of organelles, etc.
We added a clarification. “Our classification was based on i) ultrastructural features (e.g. number of cilia), ii) cell morphology (e.g. nerve net or bridge cells), iii) unique organelles (e.g. lamellate body, plumose cells), iv) and similarities to cell types previously described by EM. Our classification agrees with the cell types identified in the 1-day-old larva [@ferraioli2025].”
(3) “CATMAID only supports [bifurcating] skeleton trees” - Correct?
yes, a node in CATMAID cannot be fused to another node of the same skeleton to represent anastomoses
FIGURE 1:
(1) It is not worth redrawing and renumbering everything, but I wish the lateral view in A matched the rotated aboral view in B, instead of having to do two rotations to get the alignment to coincide. (Rotating panel B 90{degree sign} clockwise would make them match, but then it wouldn’t coincide with all the subsequent figures.)
Thank you for the suggestion. We have replaced panel A with a lateral view that now matches panel B.
(2) The labels on Figure 1 are a mix of two typefaces (Helvetica and Myriad?). They should be standardized to all use one typeface (preferably Helvetica).
we have changed the font to Helvetica
(3) Panel C legend: arrows are not really arrows. Say “Eye icons” or something like that. Can you show the location of the anal pores in the DIC image?
Changed to ‘eye icons’. The anal pores are usually closed and only open briefly therefore it is not clear where exactly they would be, so indicating their position would be misleading.
(4) Panel F, I cannot see the lines mentioned in the legend at all, except for maybe a tiny wisp in a couple of places. Either omit or make visible.
changed to “The spheres indicate the position of nuclei in the reconstructed cells.”
(5) Panel G. “Cells are color coded according to quadrants”… but unfortunately, the color scale is 90{degree sign} off of what is presented in the rest of the panels and the paper. Q1 and Q3 have been blue, but now Q2+4 are blue/purple, while Q1+3 are orange/yellow. Again, it seems like too much work to recolor panel G, but in future, it would be nice to maintain that consistency, especially since other panels specifically mention the consistent colors.
We have changed the color code in panels B, C and E to match G and the subsequent panels/figures.
RESULTS: Aboral synaptic nerve net
(1)“We reconstructed three aboral nerve-net (ANN) neurons” - out of how many total? Were these three just the first ones traced, or are they likely to be all of the multi-domain neurons? One can’t tell if these are the top 3 (out of X), or if there are other multi-quad neurons that were not traced. Are there any Q1Q4 or Q2Q3 neurona? Specify overall composition.
There are only three ANN neurons in the aboral organ. These are all completely reconstructed and contained within the volume. We have clarified this in the text. “We identified and reconstructed three aboral nerve-net (ANN) neurons, each exhibiting a syncytial morphology characterized by anastomosing membranes and multiple nuclei (ranging from two to five) (Figure 2A and B, Figure 2–figure supplement 1C). These three neurons are the only fully reconstructed ANN neurons contained within the volume. Several small ANN-like fragments were also observed at the periphery of the aboral organ, but their connectivity to the main ANN remains uncertain.”
FIGURE 2:
(1) Panel C: “N > 2 cells for each cell type” - is that supposed to say “N > 2 mitochondria”? More than 2 cells in all the types shown in the graph.
It is number of cells for each cell type
(2) Panel D: Is this the wrong caption? I can only see green and black circles, not red, yellow, or blue. Make them larger or “flat” (circled, not shaded spheres) if they are supposed to be visible
Thank you for pointing this out. The caption was incorrect and has been corrected to match the figure.
(3) Panel E: Amazing to see the cross-network connections!
Thank you
(4) Again, it is great to see the three ANN mapped out, but … are there other connections that weren’t mapped in this study? Other high-level coordinating neurons? ANN_Q1Q4 or Q2Q3?
The reconstruction is complete and there are no other neurons or connections. Given the large size of ctenophore synapses, we are confident that we identified all or most synapses and their connections.
RESULTS: Synaptic connectome
(1) “displaying rotational symmetry” - This is one of the things I am most curious about. Where is the evidence of rotational symmetry in the network diagram? Is it the larger number of connections to Q2 and Q4? Any evidence of rotational symmetry, like Q1 and Q3 connect to Q2 and Q4 respectively, but not the other way around?
changed to “displaying biradial symmetry”, we do not consider the slight difference in synapse number from ANN Q1-4 to the Q1-Q3 vs. Q2-Q4 balancers as significant or strong enough evidence for a single rotational symmetry (i.e. 180 degrees rotation)
(2) “Surprisingly” - this *was* really surprising. There have to be some afferent neurons connecting from the balancers, don’t there? I can’t remember the connections to the SNN, but is there a tertiary set of ANNs that connect between the balancers and the top 3 ANNs? I would like a little more discussion about this.
Indeed, this is why this is so surprising. Most people would have expected some output connections from the balancer to the nerve net or elsewhere. There are none. We have the complete balancer network and all balancer cells are ‘sink nodes’ (inputs only)(Figure3–figure supplement 1).
we added a short statement in the beginning of the Bridge Cells as Feedback Regulators of Ciliary Rhythms section noting that no direct connections from the balancers to the ANN were found and that all balancer cells act as sink nodes (inputs only; Figure 3–figure supplement 1). This highlights that bridge cells are indeed the sole neuronal input to the ANN circuit.
Figure 3:
(1) As you know, during development, the diagonally opposite cells have a shared heritage and shared functionality. Are there neuronal signatures that correspond to the rotational symmetry that we see, for example, in the position of the anal pores?
We did not find any evidence in neuronal complement for a diagonal symmetry, suggesting that neuronal organization does not simply mirror the organism’s rotational body symmetry.
(2) Do you have the information to say whether there are any diagonal or asymmetric connections? Can’t tell if those would have shown up in the mapping efforts or if you focused on the major ones only.
Based on our complete mapping, we did not find evidence for a diagonal pattern. The connectivity instead shows a biradial organization.
(3) “extending across opposite quadrant regions” - to me, opposite would be diagonally opposite, but this looks like a set of cells between Q1 and Q2 is connecting to a sister-set in Q3+Q4. I wonder if, in a more detailed view, you could see whether this is a rotational correspondence, rather than a reflection. There are some subtle hints of this in the aboral view, with some cells on the right of the blue cluster and the left of the magenta cluster.
changed to “extending across tentacular-axis-symmetric quadrant regions” for clarity
(4) As with Figure 2, I do not see any circles/spheres that are yellow, red, or blue! There are some traces of what appear to be other neurons that have these colors, but nothing that would suggest the localization of mitochondria.
Thank you for pointing this out. We have corrected the caption to match the figure, as in the previous item.
(5) The connectivity map is very cool, but the caption does not seem to correspond to the version included in the manuscript. I don’t see any hexagons; all arrows seem to have the same thickness.
changed to: “Complete connectivity map of the gravity-sensing neural circuit. Cells belonging to the same group are shown as diamonds, and the number of cells is added to their labels. The number of synapses is shown on the arrows.”
RESULTS: Dynamics of balancer cilia
(1) The orientation of the stage+larvae is a bit hard to follow. Maybe say the sagittal or tentacular plane is parallel to the sample stage and the gravity vector?
we added “Larvae were oriented with their sagittal or tentacular plane parallel to the sample stage.”
(2) “We could simultaneously image Q1(3) and Q2(4). The meaning of the numbers in () is not clear. Either way that I try to interpret it does not match the diagrams. Should this say viewing the tentacular plane, you can image Q1 and 4 or Q2 and 3?
Thank you for spotting this mistake, we have changed to: “In larvae with their sagittal plane facing the objective, we could compare balancer-cilia movements between Q1 vs. Q2 or Q3 vs. Q4. In other larvae oriented in the tentacular plane, we could simultaneously image Q1 and Q4 or Q2 and Q3.”
(3) Typo: episod[e]s were excluded
Corrected
DISCUSSION:
This section is quite clean. Maybe mention some future directions:
We have added a “Future Directions” section
(1) Do these networks change during development? Five-days-old is still quite undeveloped - what would it look like in an adult specimen? Would you expect a larger version of the same or more diverse connections?
As far as we know from work on aboral organs in adult ctenophores, the same structures and cells can be found. We do not know how the network will develop. We know that at 5 days the balancer is fully functional and the animals can orient and their behaviour is coordinated. So the wiring may not change extensively later in development. In the 1-day-old larva, Ferraioli et al. did not distinguish ANN neurons as a separate population, as these were merged with SNNs in their dataset. This suggests that significant cellular and circuit maturation likely occurs between 1 and 5 days.
METHODS: Imaging the Activity of Balancer Cilia
(1) “we selected only larvae whose aboral-oral axis was oriented nearly perpendicular to the gravitational vector”. Shouldn’t this be “nearly parallel to the gravity vector” not perpendicular?
Thank you for spotting this, corrected.
eLife Assessment
This study presents an important study into the molecular function of AT-HOOK MOTIF NUCLEAR LOCALIZED 15 (AHL15), a member of the AHL protein family, identifying it as a potential regulator of three-dimensional gene-loop organization within transcribed gene bodies. The authors support this claim with compelling genome-wide evidence, integrating AHL15 binding profiles with transcriptional and chromatin accessibility changes, as well as demonstrating overlap with genes known to form loops across transcribed regions. The evidence supporting the claims of the authors is solid. Collectively, these findings will be of broad interest to biologists seeking to understand the core regulatory mechanisms underlying gene expression.
Reviewer #1 (Public review):
The study by Luden et al. seeks to elucidate the molecular functions of AHL15, a member of the AT-HOOK MOTIF NUCLEAR LOCALIZED (AHL) protein family, whose overexpression has been shown to extend plant longevity in Arabidopsis. To address this question, the authors conducted genome-wide ChIP-sequencing analyses to identify AHL15 binding sites. They further integrated these data with RNA-sequencing and ATAC-sequencing analyses to compare directly bound AHL15 targets with genes exhibiting altered expression and chromatin accessibility upon ectopic AHL15 overexpression.
The analyses indicate that AHL15 preferentially associates with regions near transcription start sites (TSS) and transcription end sites (TES). Notably, no clear consensus DNA-binding motif was identified, suggesting that AHL15 binding may be mediated through interactions with other regulatory factors rather than through direct sequence recognition. The authors further show that AHL15 predominantly represses its direct target genes; however, this repression appears to be largely independent of detectable changes in chromatin accessibility.
In addition to the AHL protein family, the globular H1 domain-containing high-mobility group A (GH1-HMGA) protein family also harbors AT-hook DNA-binding domains. Recent studies have shown that GH1-HMGA proteins repress FLC, a key regulator of flowering time, by interfering with gene-loop formation. The observed enrichment of AHL15 at both TSS and TES regions, therefore, raises the intriguing possibility that AHL15 may also participate in regulating gene-loop architecture. Consistent with this idea, the authors report that several direct AHL15 target genes are known to form gene loops.
Overall, the conclusions of this study are well supported by the presented data and provide new mechanistic insights into how AHL family proteins may regulate gene expression.
However, it is important to note that the genome-wide analyses in this study rely predominantly on ectopic overexpression of AHL15 at developmental stages when the gene is not usually expressed. Moreover, loss-of-function phenotypes for AHL15 have not been reported, leaving unresolved whether AHL15 plays a physiological role in regulating plant longevity under native conditions. It therefore remains possible that longevity control is mediated by other AHL family members rather than by AHL15 itself. In this regard, the manuscript's title would benefit from more accurately reflecting this broader implication.
Reviewer #2 (Public review):
Summary:
The manuscript by Luden et al. investigates the molecular function and DNA-binding modes of AHL15, a transcription factor with pleiotropic effects on plant development. The results contribute to our understanding of AHL15 function in development, specifically, and transcriptional regulation in plants, more broadly.
Strengths:
The authors developed a set of genetic tools for high-resolution profiling of AHL15 DNA binding and provided exploratory analyses of chromatin accessibility changes upon AHL15 overexpression. The generated data (CHiP-Seq, ATAC-Seq and RNA-Seq is a valuable resource for further studies. The data suggest that AHL15 does not operate as a pioneer TF, but is likely involved in gene looping.
Weaknesses:
While the overall message is conveyed clearly and convincingly, I see one major issue concerning motif discovery and interpretation. The authors state that because HOMER detected highly enriched motifs at frequencies below 1%, they conclude that "a true DNA binding motif would be present in a large portion of the AHL15 peaks (targets) and would be rare in other regions of the genome (background)."
I agree that the frequency below 1% is unexpectedly low; however, this more likely reflects problems in data preprocessing or motif discovery rather than intrinsic biological properties of the transcriptional factor that possesses a DNA-binding domain and is known to bind AT_rich motifs. As it is, Figure 2 cannot serve as a main figure in the manuscript: it rather suggests that the generated CHiP-Seq peakset is dominated by noise (or motif discovery was done improperly) than that AHL15 binds nonspecifically.
Since key methodological details on the HOMER workflow are missing in the M&M section, it is not possible to determine what went wrong. Looking at other results, i.e. the reasonably structured peak distribution around TSS/TTS and consistent overlap of the peaks between the replicas, I assume that the motif discovery step was done improperly.
Therefore, I recommend redoing the motif analysis, for example, by restricting the search to the top-ranked peaks (e.g. TOP1000) and by using an appropriate background set (HOMER can generate good backgrounds, but it was not documented in the manuscript how the authors did it). If HOMER remains unsuccessful, the authors should consider complementary methods such as STREME or MEME, similar to the approach used for GH1-HMGA (https://pmc.ncbi.nlm.nih.gov/articles/PMC8195489). If the peakset is of good quality, I would expect the analysis to identify an AT-rich motif with a frequency substantially higher than 1%-more likely in the range of at least 30%. If such a motif is detected, it should be reported clearly, ideally with positional enrichment information relative to TSS or TTS. It would also be informative to compare the recovered motif with known GH1-HMGA motifs.
If de novo motif discovery remains inconclusive, the authors should, at a minimum, assess enrichment of known AHL binding motifs using available PWMs (e.g. from JASPAR). As it stands, the claim that "our ChIP-seq data show that AHL15 binds to AT-rich DNA throughout the Arabidopsis genome with limited sequence specificity (Figure 2A, Figure S2-S4)" is not convincingly supported.
Another point concerns the authors' hypothesis regarding the role of AHL15 in gene looping. While I like this hypothesis and it is good to discuss it in the discussion section, the data presented are not sufficient to support the claim, stated in the abstract, that AHL15 "regulates 3D genome organization," as such a conclusion would require additional, dedicated experiments.
Reviewer #3 (Public review):
Summary:
This study investigated the role of AHL15 in the regulation of gene expression using AHL15 overexpression lines. Their results do show that more genes are downregulated when AHL15 is upregulated, and its binding does not affect the chromatin accessibility. Further, they investigated AHL15 binds in regions depleted in histone modifications and other epigenetic signatures. Subsequently, they investigated the presence of AHL15 in the gene chromatin loops. They found overlaps with both upregulated and downregulated genes. The methods are appropriately described, but could be improved to include the analysis of self-looping gene boundaries.
Strengths:
Their study clearly showed a lack of any specific sequence enrichment in the AHL15 binding sites, other than these being AT-rich, suggesting that AHL proteins do not recognize a specific DNA sequence but are recruited to their AT-rich target sites in another way. The study does suggest significant enrichment of AHL15 binding sites at TSS and TES, and AHL15 sites are depleted of any histone marks. They also identified that AHL15 binding sites overlap with self-looping gene boundaries.
Weaknesses:
The claim that AHL15 acts as a repressor and genes regulated by it are downregulated needs to be investigated based on AHL15 binding sites, to show enrichment/ depletion of AHL15 binding sites in overexpressing genes and repressed genes. The authors should provide data to support plant longevity with AHL15 overexpression using the DEX-induced system to support the claims in the title. Calculation of the enrichment score of AHL15 peaks in the self-looping genes that are upregulated or downregulated, and discussion about the different effects of AHL15 binding on self-looping regions to regulate gene expression may be helpful to understand the significance of the study. Motif enrichment in upregulated and downregulated genes separately to identify binding sequence preferences may be useful. It is not clear how the overlap of AHL15 peaks with self-looping genes has been carried out.
Author response:
Public Reviews:
Reviewer #1 (Public review):
The study by Luden et al. seeks to elucidate the molecular functions of AHL15, a member of the AT-HOOK MOTIF NUCLEAR LOCALIZED (AHL) protein family, whose overexpression has been shown to extend plant longevity in Arabidopsis. To address this question, the authors conducted genome-wide ChIP-sequencing analyses to identify AHL15 binding sites. They further integrated these data with RNA-sequencing and ATAC-sequencing analyses to compare directly bound AHL15 targets with genes exhibiting altered expression and chromatin accessibility upon ectopic AHL15 overexpression.
The analyses indicate that AHL15 preferentially associates with regions near transcription start sites (TSS) and transcription end sites (TES). Notably, no clear consensus DNA-binding motif was identified, suggesting that AHL15 binding may be mediated through interactions with other regulatory factors rather than through direct sequence recognition. The authors further show that AHL15 predominantly represses its direct target genes; however, this repression appears to be largely independent of detectable changes in chromatin accessibility.
In addition to the AHL protein family, the globular H1 domain-containing high-mobility group A (GH1-HMGA) protein family also harbors AT-hook DNA-binding domains. Recent studies have shown that GH1-HMGA proteins repress FLC, a key regulator of flowering time, by interfering with gene-loop formation. The observed enrichment of AHL15 at both TSS and TES regions, therefore, raises the intriguing possibility that AHL15 may also participate in regulating gene-loop architecture. Consistent with this idea, the authors report that several direct AHL15 target genes are known to form gene loops.
Overall, the conclusions of this study are well supported by the presented data and provide new mechanistic insights into how AHL family proteins may regulate gene expression.
However, it is important to note that the genome-wide analyses in this study rely predominantly on ectopic overexpression of AHL15 at developmental stages when the gene is not usually expressed. Moreover, loss-of-function phenotypes for AHL15 have not been reported, leaving unresolved whether AHL15 plays a physiological role in regulating plant longevity under native conditions. It therefore remains possible that longevity control is mediated by other AHL family members rather than by AHL15 itself. In this regard, the manuscript's title would benefit from more accurately reflecting this broader implication.
The ahl15 loss-of-function phenotype has previously been described in Karami et al., 2020 (Nat. Plants), Rahimi et al., 2022a (New Phyt.), and Rahimi et al., 2022b (Curr. Biol.), showing that ahl15 loss-of-function among others results in accelerated vegetative phase change and flowering, a reduced number of leaves produced by axillary meristems in short day grown plants and reduced secondary growth in the inflorescence stem. The dominant-negative ahl15 delta-G allele, expressing a mutant protein lacking the conserved G motif in the PPC domain, shows these phenotypes more clearly in the heterozygous ahl15 +/- background, and is embryo lethal in the homozygous ahl15 background (Karami et al., 2021, Nature Comm.). In addition, we recently show that leaf senescence is significantly accelerated in the ahl15 loss-of-function mutant (Luden et al., 2025, BioRxiv). These results show that AHL15 is involved in several aspects of ageing in Arabidopsis, and we will adjust the introduction to discuss these previous findings more explicitly.
I agree with reviewer 1 on the possibility that multiple AHLs could have an effect on longevity, which is partially supported by the delayed flowering time observed in the AHL20, AHL27, or AHL29 overexpression lines (Karami et al., 2020, Street et al., 2008). However, the induction of the AHL15-GR fusion alone by DEX shows a clear delay of developmental phase transitions and the aging process in general, indicating that AHL15 by itself is able to extend longevity as other AHLs are not affected by DEX treatment (proven by the fact that their expression is not significantly changed in our RNA-seq analysis of DEX-treated 35S:AHL15-GR seedlings).
Reviewer #2 (Public review):
Summary:
The manuscript by Luden et al. investigates the molecular function and DNA-binding modes of AHL15, a transcription factor with pleiotropic effects on plant development. The results contribute to our understanding of AHL15 function in development, specifically, and transcriptional regulation in plants, more broadly.
Strengths:
The authors developed a set of genetic tools for high-resolution profiling of AHL15 DNA binding and provided exploratory analyses of chromatin accessibility changes upon AHL15 overexpression. The generated data (CHiP-Seq, ATAC-Seq and RNA-Seq is a valuable resource for further studies. The data suggest that AHL15 does not operate as a pioneer TF, but is likely involved in gene looping.
Weaknesses:
While the overall message is conveyed clearly and convincingly, I see one major issue concerning motif discovery and interpretation. The authors state that because HOMER detected highly enriched motifs at frequencies below 1%, they conclude that "a true DNA binding motif would be present in a large portion of the AHL15 peaks (targets) and would be rare in other regions of the genome (background)."
I agree that the frequency below 1% is unexpectedly low; however, this more likely reflects problems in data preprocessing or motif discovery rather than intrinsic biological properties of the transcriptional factor that possesses a DNA-binding domain and is known to bind AT_rich motifs. As it is, Figure 2 cannot serve as a main figure in the manuscript: it rather suggests that the generated CHiP-Seq peakset is dominated by noise (or motif discovery was done improperly) than that AHL15 binds nonspecifically.
Since key methodological details on the HOMER workflow are missing in the M&M section, it is not possible to determine what went wrong. Looking at other results, i.e. the reasonably structured peak distribution around TSS/TTS and consistent overlap of the peaks between the replicas, I assume that the motif discovery step was done improperly.
Therefore, I recommend redoing the motif analysis, for example, by restricting the search to the top-ranked peaks (e.g. TOP1000) and by using an appropriate background set (HOMER can generate good backgrounds, but it was not documented in the manuscript how the authors did it). If HOMER remains unsuccessful, the authors should consider complementary methods such as STREME or MEME, similar to the approach used for GH1-HMGA (https://pmc.ncbi.nlm.nih.gov/). If the peakset is of good quality, I would expect the analysis to identify an AT-rich motif with a frequency substantially higher than 1%-more likely in the range of at least 30%. If such a motif is detected, it should be reported clearly, ideally with positional enrichment information relative to TSS or TTS. It would also be informative to compare the recovered motif with known GH1-HMGA motifs.
If de novo motif discovery remains inconclusive, the authors should, at a minimum, assess enrichment of known AHL binding motifs using available PWMs (e.g. from JASPAR). As it stands, the claim that "our ChIP-seq data show that AHL15 binds to AT-rich DNA throughout the Arabidopsis genome with limited sequence specificity (Figure 2A, Figure S2-S4)" is not convincingly supported.
Another point concerns the authors' hypothesis regarding the role of AHL15 in gene looping. While I like this hypothesis and it is good to discuss it in the discussion section, the data presented are not sufficient to support the claim, stated in the abstract, that AHL15 "regulates 3D genome organization," as such a conclusion would require additional, dedicated experiments.
The motifs discovered by HOMER are ranked by their enrichment over background, of which the highest-scoring motifs are very rare in the AHL15-bound targets, but even rarer in the background, which is why they score highly on the percent enrichment score. As expected by reviewer 2, we identified AT-rich motifs that were present in a larger percentage of AHL15 targets (found in 3-18% of targets, depending on the motif, see for example motif #5 in figure S4A), which can be seen at the right tail of the histograms shown in figures 2B-C and figures S2-S4B-C. However, these motifs were also common in the background and were therefore not considered as significantly enriched in the AHL15-bound regions, with a target:background ratio of <2. As most of these motifs were flagged by HOMER as possible false-positives, and to limit the size of the (supplemental) figures, we did not show each of the motifs identified by HOMER in table form. We can include the full tables of de novo motifs identified by HOMER, including possible false-positive results for clarification.
Although the identification of AT-rich motifs shows that AHL15 (and very likely most other AHL proteins as well) binds AT-rich regions, it does not sufficiently explain the binding of AHL15 to its target genes, as these motifs are found at almost equal frequencies in non-AHL15-bound regions. In addition, a sequence found at this frequency in the genomic background is, in our view, too unspecific to be considered as a transcription factor binding site. Based on this, we concluded that AHL15 lacks a specific binding motif that can define the genes it binds.
We will update the methods section to include more details on the HOMER analysis, and will also run the analysis in the top1000 shared peaks as suggested by reviewer 2.
Reviewer #3 (Public review):
Summary:
This study investigated the role of AHL15 in the regulation of gene expression using AHL15 overexpression lines. Their results do show that more genes are downregulated when AHL15 is upregulated, and its binding does not affect the chromatin accessibility. Further, they investigated AHL15 binds in regions depleted in histone modifications and other epigenetic signatures. Subsequently, they investigated the presence of AHL15 in the gene chromatin loops. They found overlaps with both upregulated and downregulated genes. The methods are appropriately described, but could be improved to include the analysis of self-looping gene boundaries.
Strengths:
Their study clearly showed a lack of any specific sequence enrichment in the AHL15 binding sites, other than these being AT-rich, suggesting that AHL proteins do not recognize a specific DNA sequence but are recruited to their AT-rich target sites in another way. The study does suggest significant enrichment of AHL15 binding sites at TSS and TES, and AHL15 sites are depleted of any histone marks. They also identified that AHL15 binding sites overlap with self-looping gene boundaries.
Weaknesses:
The claim that AHL15 acts as a repressor and genes regulated by it are downregulated needs to be investigated based on AHL15 binding sites, to show enrichment/ depletion of AHL15 binding sites in overexpressing genes and repressed genes. The authors should provide data to support plant longevity with AHL15 overexpression using the DEX-induced system to support the claims in the title. Calculation of the enrichment score of AHL15 peaks in the self-looping genes that are upregulated or downregulated, and discussion about the different effects of AHL15 binding on self-looping regions to regulate gene expression may be helpful to understand the significance of the study. Motif enrichment in upregulated and downregulated genes separately to identify binding sequence preferences may be useful. It is not clear how the overlap of AHL15 peaks with self-looping genes has been carried out.
A metagenome plot of AHL15 binding around genes that are differentially expressed upon DEX treatment can be found in Figure 3F. This analysis shows that AHL15 binding near differentially expressed genes is more pronounced compared to all AHL15-bound genes, and that AHL15 binding near the TSS is especially enriched for upregulated genes.
As also suggested by reviewer 2, we will run a motif enrichment analysis on the differentially expressed genes that are bound by AHL15 to see if any motifs are enriched compared to the background and overrepresented in the AHL15-bound genes.
Plant longevity in 35S:AHL15-GR plants treated with DEX has been shown by Karami et al. (2020; Nature Plants). DEX treatment extended vegetative development after flowering in Arabidopsis and tobacco, enhanced overall biomass in Arabidopsis and tobacco, re-initiation of vegetative growth in senescent tobacco) and recently we showed that it delays leaf senescence in Arabidopsis (Luden et al., 2025, bioRxiv). All these observations will be discussed in more detail in the text. In addition, we show that 35S:AHL15-GR plants treated a single time with DEX at 10 days after germination show a significantly delayed flowering time in figure 4C-D of this manuscript.
The enrichment of AHL15 ChIP-seq peaks in self-looping genes will be analyzed as suggested and compared to a random set of genes as a control, and the methods section will be updated to clarify how the analyses on self-looping genes were carried out.
eLife Assessment
This fundamental study advances our understanding of population-level immune responses to influenza in both children and adults. The strength of the evidence supporting the conclusions is compelling, with high-throughput profiling assays and mathematical modeling. The work will be of interest to immunologists, virologists, vaccine developers, and those working on mathematical modeling of infectious diseases.
Reviewer #1 (Public review):
The authors present exciting new experimental data on the antigenic recognition of 78 H3N2 strains (from the beginning of the 2023 Northern Hemisphere season) against a set of 150 serum samples. The authors compare protection profiles of individual sera and find that the antigenic effect of amino acid substitutions at specific sites depends on the immune class of the sera, differentiating between children and adults. Person-to-person heterogeneity in the measured titers is strong, specifically in the group of children's sera. The authors find that the fraction of sera with low titers correlates with the inferred growth rate using maximum likelihood regression (MLR), a correlation that does not hold for pooled sera. The authors then measure the protection profile of the sera against historical vaccine strains and find that it can be explained by birth cohort for children. Finally, the authors present data comparing pre- and post- vaccination protection profiles for 39 (USA) and 8 (Australia) adults. The data shows a cohort-specific vaccination effect as measured by the average titer increase, and also a virus-specific vaccination effect for the historical vaccine strains. The generated data is shared by the authors and they also note that these methods can be applied to inform the bi-annual vaccine composition meetings, which could be highly valuable.
Comments on revisions:
Thanks to the authors for the revised version of the manuscript. This version contains extended explanations clarifying the growth analysis by MLR. The other points of the initial report were addressed as well by language adjustments. As discussed during the revision process, future work might focus on the observed heterogeneity among the serum titers to different strains and its causes, which requires additional in-depth analysis.
Reviewer #2 (Public review):
This is an excellent paper. The ability to measure the immune response to multiple viruses in parallel is a major advancement for the field, that will be relevant across pathogens (assuming the assay can be appropriately adapted). I only had a few comments, focused on maximising the information provided by the sera.
Comments on revisions:
These concerns were all addressed in the revised paper.
Author response:
The following is the authors’ response to the previous reviews
Public Reviews:
Reviewer #1 (Public review):
The authors present exciting new experimental data on the antigenic recognition of 78 H3N2 strains (from the beginning of the 2023 Northern Hemisphere season) against a set of 150 serum samples. The authors compare protection profiles of individual sera and find that the antigenic effect of amino acid substitutions at specific sites depends on the immune class of the sera, differentiating between children and adults. Person-to-person heterogeneity in the measured titers is strong, specifically in the group of children's sera. The authors find that the fraction of sera with low titers correlates with the inferred growth rate using maximum likelihood regression (MLR), a correlation that does not hold for pooled sera. The authors then measure the protection profile of the sera against historical vaccine strains and find that it can be explained by birth cohort for children. Finally, the authors present data comparing pre- and post- vaccination protection profiles for 39 (USA) and 8 (Australia) adults. The data shows a cohort-specific vaccination effect as measured by the average titer increase, and also a virus-specific vaccination effect for the historical vaccine strains. The generated data is shared by the authors and they also note that these methods can be applied to inform the bi-annual vaccine composition meetings, which could be highly valuable.
We appreciate the reviewer’s clear summary of our work.
Thanks to the authors for the revised version of the manuscript. A few concerns remain after the revision:
(1) We appreciate the additional computational analysis the authors have performed on normalizing the titers with the geometric mean titer for each individual, as shown in the new Supplemental Figure 6. We agree with the authors statement that, after averaging again within specific age groups, "there are no obvious age group-specific patterns." A discussion of this should be added to the revised manuscript, for example in the section "Pooled sera fail to capture the heterogeneity of individual sera," referring to the new Supplemental Figure 6.
However, we also suggested that after this normalization, patterns might emerge that are not necessarily defined by birth cohort. This possibility remains unexplored and could provide an interesting addition to support potential effects of substitutions at sites 145 and 275/276 in individuals with specific titer profiles, which as stated above do not necessarily follow birth cohort patterns.
The reviewer is correct that there remains heterogeneity among the serum titers to different strains that we cannot easily explain via age group, and suggests that additional patterns could emerge. We certainly agree that explaining this heterogeneity remains an interesting goal, but as described in the manuscript we have analyzed the possible causes of the heterogeneity as exhaustively as possible given the available metadata. At this point, the most we can say is that the strain-specific neutralization titers are highly heterogeneous in a way that cannot be completely explained by birth cohort. We agree that further analysis of the cause is an area for future work, and have made all of our data available so that others can continue to explore additional hypotheses. It may be that these questions can only be answered by experiments on sera from newer cohorts where more detailed metadata on infection and vaccination history are available.
(2) Thank you for elaborating further on the method used to estimate growth rates in your reply to the reviewers. To clarify: the reason that we infer from Fig. 5a that A/Massachusetts has a higher fitness than A/Sydney is not because it reaches a higher maximum frequency, but because it seems to have a higher slope. The discrepancy between this plot and the MLR inferred fitness could be clarified by plotting the frequency trajectories on a log-scale.
For the MLR, we understand that the initial frequency matters in assessing a variant's growth. However, when starting points of two clades differ in time (i.e., in different contexts of competing clades), this affects comparability, particularly between A/Massachusetts and A/Ontario, as well as for other strains. We still think that mentioning these time-dependent effects, which are not captured by the MLR analysis, would be appropriate. To support this, it could be helpful to include the MLR fits as an appendix figure, showing the different starting and/or time points used.
Multinomial logistic regression is a widely used technique to estimate viral growth rates from sequencing counts (PLoS Computational Biology, 20:e1012443; Nature, 597:703-708; Science, 376:1327-1332). As the reviewer points out, it does assume that the relative viral growth rates are constant over the time period analyzed. However, most of the patterns mentioned by the reviewer are not deviations from this assumption, but rather just due to the fact that frequencies are plotted on a linear scale. More specifically, our multinomial logistic regression implementation defines two parameters per variant: the initial frequency and the growth rate. The absolute variant growth rate is effectively the slope of the logit-transformed variant frequencies. Each variant's relative fitness depends on that variant's growth rate relative to a predefined baseline variant. Plotting frequencies on a logit scale does help emphasize the importance of the slope by showing exponential growth as a linear trajectory. We have added a new Supplemental Figure 9 that plots the frequencies from Figure 5A on a logit scale. As can be seen the frequency trajectories are closer to linear on the logit scale.
We have updated the results text to clarify the nature of the fixed relative growth rates per strain and to refer to this new supplemental figure as follows:
To estimate the evolutionary success of different human H3N2 influenza strains during 2023, we used multinomial logistic regression, which uses sequence counts to estimate fixed strain growth rates relative to a baseline strain for the entire analysis time period (in this case, 2023) [50–52]. Relative growth rates estimated by multinomial logistic regression represent relative fitnesses of strains over that time period. There were sufficient sequencing counts to reliably estimate growth rates in 2023 for 12 of the HAs for which we measured titers using our sequencing-based neutralization assay libraries (Figure 5a,b and Supplemental Figure 9). We estimated strain growth rates relative to the baseline strain of A/Massachusetts/18/2022. Note that these growth rates estimate how rapidly each strain grows relative to the baseline strain, rather than the absolute highest frequency reached by each strain. Each strain’s absolute growth rate corresponds to the slope of the strain’s logit-transformed frequencies at the end of the analysis time period (Supplemental Figure 9).
As the reviewer notes, the multinomial logistic regression implementation assumes a fixed growth rate for each strain over the time period being analyzed. This limitation causes the inferred growth rates to emphasize the latest trends in the analysis time period. For example, at the end of December 2023 in Figure 5A, the A/Ontario/RV00796/2023 strain is growing rapidly and replacing all other variants. Correspondingly, the multinomial logistic regression infers a high growth rate for that Ontario strain relative to the A/Massachusetts/18/2022 baseline strain. However, the A/Massachusetts/18/2022 strain was growing relative to other strains in the first half of 2023 since it has a higher growth rate than they do. However, there are modest deviations from linearity on the logit scale shown in the added supplementary figure likely because the assumption of a fixed set of relative growth rates over the analyzed time period is an approximation.
We have added the following text to the discussion to highlight this limitation of the multinomial logistic regression:
Our comparisons of the neutralization titers to the growth rates of different H3N2 strains was limited by the fact that only a modest number of strains had adequate sequence data to estimate their growth rates. Strains with more sequencing counts tend to be those with moderate-to-high fitness, which therefore limited the dynamic range of growth rates across strains we were able to analyze. Relatedly, the multinomial logistic regression infers a single fixed growth rate per strain for the entire analysis time period of 2023, and cannot represent changes in relative fitness of strains over that relatively short time period. Additionally, because the strains for which we estimated growth rates are phylogenetically related it is difficult to assess the statistical significance of the correlation [53], so it will be important for future work to reassess the correlations with new neutralization data against the dominant strains in future years.
(3) Regarding my previous suggestion to test an older vaccine strain than A/Texas/50/2012 to assess whether the observed peak in titer measurements is virus-specific: We understand that the authors want to focus the scope of this paper on the relative fitness of contemporary strains, and that this additional experimental effort would go beyond the main objectives outlined in this manuscript. However, the authors explicitly note that "Adults across age groups also have their highest titers to the oldest vaccine strain tested, consistent with the fact that these adults were first imprinted by exposure to an older strain." This statement gives the impression that imprinting effects increase titers for older strains, whereas this does not seem to be true from their results, but only true for A/Texas. It should be modified accordingly.
We agree with the reviewer’s suggestion that the specific language describing the potential trend of adults having the highest titers to the oldest strain tested could be further caveated. To this end, we have made the following edits to the portion of the main text that they highlighted:
Adults across age groups also have their highest titers to the oldest vaccine strain tested (Figure 6), consistent with the fact that these adults were likely first imprinted by exposure to an older strain more antigenically similar to A/Texas/50/2012 (the oldest strain tested here) than more recent strains. Note that a similar trend towards adult sera having higher titers to older vaccine strains was also observed in a more recent study we have performed using the same methodology described here [60].
Notably, this trend of adults across age groups having the highest titers to the oldest vaccine strains tested has held true in subsequent work we’ve performed with H1N1 viruses (Kikawa et al., 2025 Virus Evolution, DOI: https://doi.org/10.1093/ve/veaf086). In that more recent study, we again saw that adults (cohorts EPIHK, NIID, and UWMC) tended to have their highest titers to the oldest cell-passaged strain tested (A/California/07/2009), whereas children (cohort SCH) had more similar neutralization titers across strains. These additional data therefore support the idea that adults tend to have their highest titers to older vaccine strains, a finding that is also consistent with substantial prior work (eg, Science, 346:996-1000).
Reviewer #2 (Public review):
This is an excellent paper. The ability to measure the immune response to multiple viruses in parallel is a major advancement for the field, that will be relevant across pathogens (assuming the assay can be appropriately adapted). I only had a few comments, focused on maximising the information provided by the sera. These concerns were all addressed in the revised paper.
We thank this reviewer for the summary of our work and their helpful comments in the first revision.
Reviewer #3 (Public review):
The authors use high throughput neutralisation data to explore how different summary statistics for population immune responses relate to strain success, as measured by growth rate during the 2023 season. The question of how serological measurements relate to epidemic growth is an important one, and I thought the authors present a thoughtful analysis tackling this question, with some clear figures. In particular, they found that stratifying the population based on the magnitude of their antibody titres correlates more with strain growth than using measurements derived from pooled serum data. The updated manuscript has a stronger motivation, and there is substantial potential to build on this work in future research.
Comments on revisions:
I have no additional recommendations. There are several areas where the work could be further developed, which were not addressed in detail in the responses, but given this is a strong manuscript as it stands, it is fine that these aspects are for consideration only at this point.
We appreciate this reviewer’s summary of our work, and we are glad they feel the motivation is stronger in the revised manuscript.
eLife Assessment
This important manuscript evaluates how sample size and demographic balance of reference cohorts affect the reliability of normative models. The evidence supporting the conclusions is convincing. This work will be of interest to clinicians and scientists working with normative models.
Reviewer #1 (Public review):
This is a well-designed and carefully executed study that delivers clear and actionable guidance on the sample size and representative demographic requirements for robust normative modelling in neuroimaging. The central claims are convincingly supported.
The study has multiple strengths. First, it offers a comprehensive and methodologically rigorous analysis of sample size and age distribution, supported by multiple complementary fit indices. Second, the learning-curve results are compelling and reproducible and will be of immediate utility to researchers planning normative modelling projects. Third, the study includes both replication in an independent dataset and an adaptive transfer analysis from UK Biobank, highlighting both the robustness of the results and the practical advantages of transfer learning for smaller clinical cohorts. Finally, the clinical validation effectively ties the methodological work back to real-world clinical application.
One dataset-dependent limitation worth noting concerns age-distribution coverage: the larger negative effects observed under left-skewed sampling reflect a mismatch between younger training samples and older test cohorts. Importantly, the authors explicitly quantify this effect using simulation-based coverage analyses and demonstrate that it accounts for the observed asymmetry in sampling performance. By identifying and empirically characterising this constraint, the study appropriately bounds the generalisability of its conclusions while strengthening their interpretability.
Reviewer #2 (Public review):
Summary:
The authors test how sample size and demographic balance of reference cohorts affect the reliability of normative models in ageing and Alzheimer's disease. Using OASIS-3 and replicating in AIBL, they change age and sex distributions and number of samples and show that age alignment is more important than overall sample size. They also demonstrate that models adapted from a large dataset (UK Biobank) can achieve stable performance with fewer samples. The results suggest that moderately sized but demographically well-balanced cohorts can provide robust performance.
Strengths:
The study is thorough and systematic, varying sample size, age, and sex distributions in a controlled way. Results are replicated in two independent datasets with relatively large sample sizes, thereby strengthening confidence in the findings. The analyses are clearly presented and use widely applied evaluation metrics. Clinical validation (outlier detection, classification) adds relevance beyond technical benchmarks.The comparison between within-cohort training and adaptation from a large dataset is valuable for real-world applications.
The work convincingly shows that age alignment is crucial and that adapted models can reach good performance with fewer samples.
Author response:
The following is the authors’ response to the original reviews
Reviewer #1:
Summary:
Overall, this is a well-designed and carefully executed study that delivers clear and actionable guidance on the sample size and representative demographic requirements for robust normative modelling in neuroimaging. The central claims are convincingly supported.
Strengths:
The study has multiple strengths. First, it offers a comprehensive and methodologically rigorous analysis of sample size and age distribution, supported by multiple complementary fit indices. Second, the learning-curve results are compelling and reproducible and will be of immediate utility to researchers planning normative modelling projects. Third, the study includes both replication in an independent dataset and an adaptive transfer analysis from UK Biobank, highlighting both the robustness of the results and the practical advantages of transfer learning for smaller clinical cohorts. Finally, the clinical validation ties the methodological work back to clinical application.
We are grateful for the reviewer’s positive overall evaluation and for the constructive feedback, which has helped us refine and clarify the manuscript.
Weaknesses:
There are two minor points for consideration:
(1) Calibration of percentile estimates could be shown for the main evaluation (similar to that done in Figure 4E). Because the clinical utility of normative models often hinges on identifying individuals outside the 5th or 95th percentiles, readers would benefit from visual overlays of model-derived percentile curves on the curves from the full training data and simple reporting of the proportion of healthy controls falling outside these bounds for the main analyses (i.e., 2.1. Model fit evaluation).
We thank the reviewer for this helpful point. To address this, we implemented two complementary analyses that evaluate the accuracy of percentile estimates in the main evaluation (Section 2.1, Model fit evaluation).
(a) Percentage of healthy controls (HC) outside the extreme centiles (added to the main figure)
For each sampling strategy and sample size, we now report the proportion of healthy controls falling outside the predicted 2.5th and 97.5th percentiles, to remain consistent with the 1.96 threshold used throughout the study. Under perfect calibration, this proportion should be close to 2.5%. This metric was computed for every ROI, model run, sample size, and sampling condition. The results are now shown in the main model-fit figure alongside MSLL, EV, Rho, SMSE, and ICC, and the corresponding statistics have been added throughout. This directly quantifies how well the centile estimates capture tail behavior, which is essential for the clinical interpretation of normative deviations. See the added plots to Figure 2 and Figure 3 (see also Table 2-3 in the revised main manuscript and replication in AIBL and transfer leaning experiments in Supplementary Materials Figure S1, S10-11, S18-19, S2829, Table S1-2, S5-6, S9-10).
(b) Centile curve overlays (added to the Supplementary Figures)
To visually demonstrate calibration, we now include additional overlays of model-derived percentile curves against those obtained using the full training set. These are shown for key ROIs, multiple sample sizes and different sampling strategies in Supplementary Materials (Figure S9 and S27). These overlays illustrate where centile estimation diverges, particularly at age extremes.
Together, these additions provide both quantitative and qualitative evidence of percentile calibration across sampling regimes and sample sizes.
(2) The larger negative effect of left-skewed sampling likely reflects a mismatch between the younger training set and the older test set; accounting explicitly for this mismatch would make the conclusions more generalizable.
We agree with the reviewer that the large negative effect of left-skewed training reflects a mismatch between the training and test age distributions.
To characterize the expected age distributions produced by each sampling strategy, we simulated the procedures used in the main analyses by repeatedly drawing training samples under all sampling conditions (representative, left-skewed, right-skewed, and the predefined sex-ratio settings). Simulations were performed at a fixed sample size (n = 200), generating 1000 samples per condition, and the resulting age distributions were summarized separately for males and females (Supplementary Materials section 5.1). These simulated distributions show that left-skewed sampling produces a more pronounced shift toward younger ages than the corresponding shift toward older ages under rightskewed sampling, particularly in OASIS-3, with smaller differences observed in AIBL (Tables S14– S15).
To further quantify how these sampling-induced age profiles align with the empirical age structure of the test cohorts, we computed an age-bin coverage metric based on distribution intersection. Age was discretized into 20 quantile-based bins using the full training set of each dataset (OASIS-3 and AIBL) as reference.
For each sampling strategy (Representative, Left-skewed, Right-skewed), sample size, and dataset, we generated 1000 independent training samples using the same sampling procedures as in the main analyses. For each sampled training set, age-bin count distributions were computed and compared to the corresponding HC test-set age-bin counts.
Coverage was defined as:

where, 𝑖 indexes age bins, 𝑛<sub>train</sub> and 𝑛<sub>test</sub> are the numbers of individuals in bin i in the sampled training set and HC test set, respectively. This metric quantifies the fraction of the test-set age distribution that is “covered” by the sampled training set and ranges from 0 (no test-set ages covered) to 1 (complete coverage of the test-set age distribution). For each condition, the mean and standard deviation of the coverage across repetitions were computed.
We show that under left-skewed sampling, age coverage remains markedly reduced across all sample sizes in OASIS-3 in comparison with AIBL dataset (see Figures S37). This suggests that the poorer performance observed with left-skewed training may stem from a reduced coverage of the test age range. We added the following in the Discussion (page 27):
“The left-skewed sampling had overall a greater effect than right-skewed sampling in both model evaluation and clinical validation, likely due to (1) the dataset’s original bias toward older individuals, making younger-skewed samples less representative, and (2) the older age structure of the AD population, which exacerbates mismatch when younger HC are used to calibrate models in the clinical population. This asymmetry is also reflected in the coverage analysis, where left-skewed sampling resulted in poorer age coverage of the target population at the same sample size (Supplementary Materials section 5.4.)”
Reviewer #2:
Summary:
The authors test how sample size and demographic balance of reference cohorts affect the reliability of normative models in ageing and Alzheimer's disease. Using OASIS-3 and replicating in AIBL, they change age and sex distributions and number of samples and show that age alignment is more important than overall sample size. They also demonstrate that models adapted from a large dataset (UK Biobank) can achieve stable performance with fewer samples. The results suggest that moderately sized but demographically well-balanced cohorts can provide robust performance.
Strengths:
The study is thorough and systematic, varying sample size, age, and sex distributions in a controlled way. Results are replicated in two independent datasets with relatively large sample sizes, thereby strengthening confidence in the findings. The analyses are clearly presented and use widely applied evaluation metrics. Clinical validation (outlier detection, classification) adds relevance beyond technical benchmarks. The comparison between within-cohort training and adaptation from a large dataset is valuable for real-world applications.
The work convincingly shows that age alignment is crucial and that adapted models can reach good performance with fewer samples. However, some dataset-specific patterns (noted above) should be acknowledged more directly, and the practical guidance could be sharper.
We are grateful for the reviewer’s positive overall evaluation and for the constructive comments that guided our revisions strengthened the manuscript.
Weaknesses:
The paper uses a simple regression framework, which is understandable for scalability, but limits generalization to multi-site settings where a hierarchical approach could better account for site differences. This limitation is acknowledged; a brief sensitivity analysis (or a clearer discussion) would help readers weigh trade-offs.
We thank the reviewer for this insightful point. We agree that hierarchical Bayesian regression provides clear advantages in multi-site settings, particularly when site-level variability is substantial or when federated learning is required. In our case, both OASIS-3 and AIBL include only a small number of sites, and the primary aim of the study was to isolate the effects of sample size and covariate composition rather than to model site-related structure. For these reasons, implementing HBR was beyond the scope of the present work, but we fully acknowledge its relevance for studies with larger or more heterogeneous site configurations. To clarify this distinction, we added a dedicated paragraph in the Discussion (page 28) that situates warped BLR and HBR within different data scenarios and outlines the circumstances under which each approach is preferable.
“From a methodological perspective, the choice between warped BLR and HBR should primarily be guided by the structure of site effects and by computational constraints. HBR explicitly models sitelevel variation through hierarchical random effects, enabling information sharing across sites and supporting federated-learning implementations in which site-specific updates can be combined without sharing raw data (Bayer et al., 2022; Kia et al., 2021; Maccioni et al., 2025). This structure provides more stable estimates when site-specific sample sizes are small or acquisition differences are substantial. In contrast, wrapped BLR treats site as a fixed-effect covariate when site adjustment is required and does not implement hierarchical pooling, but offers simpler inference and substantially lower computational cost while accommodating non-Gaussian data distributions through the warping transformation (C. J. Fraza et al., 2021). These properties make wrapped BLR practical in settings where site heterogeneity is limited or adequately controlled, whereas HBR may be preferable in strongly multisite contexts or when federated learning is required for privacy-preserving data integration.”
Other than that, there are some points that are not fully explained in the paper:
(1) The replication in AIBL does not fully match the OASIS results. In AIBL, left-skewed age sampling converges with other strategies as sample size grows, unlike in OASIS. This suggests that skew effects depend on where variability lies across the age span.
Recommendation: Replication differences across datasets (age skew):
In OASIS, left-skewed (younger-heavy) training harms performance and does not fully recover with more data; in AIBL, performance under left-skew appears to converge toward the other conditions as training size grows. Given AIBL's smaller size and older age range, please explain this discrepancy. Does this imply that the effect of skew depends on where biological variability is highest across the age span (e.g., more variability from ~45-60 in OASIS vs {greater than or equal to}60 in AIBL), rather than on "skew" per se? If so, the paper should say explicitly that skewness must be interpreted relative to the age-variability profile of the target population, not just counts.
We thank the reviewer for this thoughtful comment. To examine whether differences in age-related variability could explain the replication patterns, we quantified how regional variance changed with age by computing age-binned variance profiles in the HC training sets of OASIS-3 and AIBL. Age was discretized into 10 quantile-based bins for each dataset separately. For each ROI and each age bin, we calculated the sample variance of the ROI values within that bin. The bin center was defined as the mean age of individuals in the corresponding bin. We then summarized variance across ROIs by computing, for each age bin, the median variance and its interquartile range (25th–75th percentile). These summary profiles (median and IQR across ROIs as a function of bin-centered age) are shown in Author response image 1. As shown in this plot, OASIS-3 and AIBL display comparable levels of variance across their respective age ranges, and the profiles do not suggest pronounced shifts in variability that would account for the divergent behavior of the left-skewed models.
Author response image 1.
Median ROI variance across age bins for OASIS-3 and AIBL. Shaded areas represent variability across regions within each age bin.
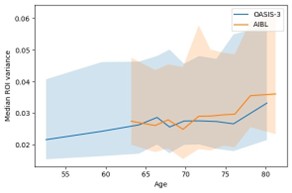
Instead, the coverage analysis recommended by the reviewer in comment #5 and introduced in our response to Reviewer 1, comment #2 indicates that the replication differences between OASIS-3 and AIBL are primarily driven by the age coverage of the sampled training sets relative to the test cohorts. In AIBL, which has a narrower and predominantly older age range, left-skewed sampling shows slightly lower coverage than right-skewed sampling, but coverage increases steadily with sample size, and the strategies converge as n grows. In contrast, OASIS-3 spans a broader lifespan and is itself skewed toward older ages; under left-skewed sampling, coverage of the test-set age range increases more slowly and remains comparatively lower even at large n. This slower recovery of age coverage explains why leftskewed performance does not recover in OASIS-3 and why the discrepancies between left- and rightskewed sampling are more pronounced in this dataset. The corresponding age-coverage curves are reported in Supplementary Figures S37.
Furthermore, this difference is also reflected in the expected age distributions obtained from repeated simulations of the sampling procedures (Supplementary Materials section 5.1. Tables S14–S15), where left-skewed sampling induces a larger shift toward younger ages than right-skewed sampling induces toward older ages, especially in OASIS-3, with smaller differences observed in AIBL.
For more details on both analyses see also our response to Reviewer 1, comment #2.
(2) Sex imbalance effects are difficult to interpret, since sex is included only as a fixed effect, and residual age differences may drive some errors.
Recommendation: Sex effects may be confounded with age:
Because sex is treated only as a fixed effect, it is unclear whether errors under sex-imbalance scenarios partly reflect residual age differences between female and male subsets. Please report (or control for) age distributions within each sex-imbalance condition, and clarify whether the observed error changes are truly attributable to sex composition rather than age composition.
To address the concern that sex-imbalance effects could be driven by residual age differences we now explicitly report the age distributions by sex for the original training and test datasets, as well as the expected age distributions induced by each sampling condition, obtained by repeated simulation of the sampling procedure (Supplementary Materials section 5.1, Tables S13-15). Table S13 shows very similar distributions of age for HC train and test sets across sexes within each dataset. Tables S14–S15 further show that, within each sampling strategy, the age distributions of females and males are highly similar, including under sex-imbalanced conditions. These summaries confirm that the sampling procedures do not introduce systematic age-structure differences between sexes.
In addition, we extended the statistical models for tOC and MSE to explicitly include age, sex, and all higher-order interactions with the diagnosis, sample size, and sex-ratio sampling (Supplementary Materials section 5.2., Tables S17 for direct training, and S19 for transferred models). For completion we also included age and sex for age samplings models (Supplementary Tables S16 for direct training, S18 for transferred models). These analyses revealed no significant main effects of age under seximbalanced sampling and only very small effect sizes in isolated higher-order interactions. Together, these results indicate that age did not introduce residual confounding in our analyses.
We now report in the Results section (page 15) the following:
“Supplementary analysis (Tables S17,19) also showed that main effect of age was not significant for either MSE or tOC, and no significant age × sex-ratio interactions were observed. While some higherorder interactions involving age, diagnosis, and sex-ratio reached statistical significance, all associated effect sizes were very small and inconsistent across outcomes, indicating that the observed error changes are not driven by residual age confounding.”
And in the Methods section (page 36):
“Age distributions were summarized separately for males and females in the original training and test sets (Supplementary Table S13) and the expected age distributions resulting from the skewed-age sampling and the sex-imbalance sampling procedures were obtained by repeated simulations at a fixed sample size and are reported in Supplementary Tables S14–S15.”
(3) In Figure 3, performance drops around n≈300 across conditions. This consistent pattern raises the question of sensitivity to individual samples or sub-sampling strategy.
Recommendation: Instability around n ≈ 300 (Figure 3):
Several panels show a consistent dip in performance near n=300. What drives this? Is the model sensitive to particular individuals being included/excluded at that size, or does it reflect an interaction with the binning/selection scheme? A brief ablation (e.g., alternative sub-sampling seeds or bins) would help rule out artefacts.
We thank the reviewer for highlighting this point. To assess whether the observed dip at n=300 reflected sensitivity to the specific individuals selected or to the sub-sampling scheme, we re-ran the analysis at n = 300 using 20 independent random seeds (Supplementary Materials sections 5.3.). This ablation showed no systematic decrease in performance across repetitions, indicating that the original effect was driven by stochastic sampling variability rather than a stable model instability or binning interaction. We now report this control analysis in the Supplementary Materials (Figure S36). We have clarified this point in the Results page 10:
“A consistent dip in performance was observed around n = 300 for the left-skewed sampling condition in the original analysis (Figure 3). To assess whether this reflected sensitivity to the specific subsampling or stochastic sampling variability, we repeated the analysis for this specific sample using 20 independent random seeds (Figure S36); the absence of a consistent effect across repetitions indicates that the original pattern was driven by sampling variability rather than a systematic model artifact.”
(4) The total outlier count (tOC) analysis is interesting but hard to generalize. For example, in AIBL, left-skew sometimes performs slightly better despite a weaker model fit. Clearer guidance on how to weigh model fit versus outlier detection would strengthen the practical message.
Recommendation: Interpreting total outlier count (tOC):
The tOC findings are interesting but hard to operationalize. In AIBL, even for n>40, left-skewed training sometimes yields slightly better tOC discrimination and other strategies plateau. Does this mean that a better model fit on the reference cohort does not necessarily produce better outlier-based case separation? Please add a short practical rule-set: e.g., when optimizing for deviation mapping/outlier detection, prioritize coverage of the patient-relevant age band over global fit metrics; report both fit and tOC sensitivity to training-set age coverage.
We thank the reviewer for this important point. Apparent improvements in tOC-based separation under left-skewed training should not be interpreted as indicating a better model or superior deviation mapping. In particular, in AIBL, left-skew can sometimes yield slightly larger group differences in tOC despite weaker overall model fit. This reflects an inflation of deviation magnitude in AD rather than improved separation per se. Crucially, relative ranking between HC and AD remains preserved across sampling strategies, as shown by the classification analysis in the main manuscript (Figure 5C), indicating that enhanced tOC contrast under left-skew does not translate into improved case discrimination. Instead, it reflects a systematic shift in deviation scale due to age-mismatched training.
We now clarify this distinction in the Discussion of the main manuscript on page 26:
“Importantly, apparent increases in HC–AD separation in total outlier count should not be interpreted as evidence of superior model quality. Age-mismatched training can rescale deviation magnitudes and inflate tOC in specific subgroups without improving true case–control separability, as shown by classification task (Figure 5C). Model fit metrics and outlier-based measures, therefore capture complementary but distinct aspects of normative model behavior and should be interpreted jointly rather than in isolation.”
(5) The suggested plateau at n≈200 seems context dependent. It may be better to frame sample size targets in relation to coverage across age bins rather than as an absolute number.
Recommendation: "n≈200" as a plateau is context-dependent:
The suggested threshold for stable fits (about 200 people) likely depends on how variable the brain features are across the covered ages. Rather than an absolute number, consider reporting a coverageaware target, such as a minimum per-age-bin coverage or an effective sample size relative to the age range. This would make the guidance transferable to cohorts with different age spans.
We agree that the observed performance plateau around n≈200 is context dependent and may shift with the covered age range, anatomical variability, and feature of interest. In the present study, this stabilization was evaluated within the specific datasets and age spans considered and extending it to broader lifespan or different biological contexts will require dedicated future work.
To clarify this point, we added an explicit age-coverage analysis in the Supplementary Materials (section 5.4.) as introduced in response to reviewer 1 on comment #2. This analysis shows that, under representative sampling, the point at which age coverage becomes complete closely coincides with the saturation of model fit and stability metrics. At the same time, we note that normative models operate in continuous covariate space, such that reliable interpolation can still be achieved even when intermediate age ranges are less densely sampled, provided that surrounding age ranges are sufficiently represented. This makes rigid minimum per-bin requirements difficult to define in a generalizable way.
Rather than proposing a universal sample-size threshold, we now emphasize that both learning-curve analyses and age-coverage assessments offer a more transferable way to identify when performance approaches saturation for a given dataset. This clarification is now included in the Discussion on page 25:
“This is further supported by the coverage analysis reported in the Supplementary Materials (section 5.4), which shows that under representative sampling, the point of full age coverage closely coincides with the saturation of model fit and stability metrics. Rather than proposing a universal sample size threshold, we therefore encourage readers to perform learning-curve analyses, complemented by age coverage assessments, in their own datasets to empirically assess when performance approaches saturation for their specific age range and population.”
And we also address it in the limitations page 29:
“In addition, the observed stabilization of model performance around 200–300 participants was evaluated within the specific age ranges and cohorts examined here and may shift in broader lifespan settings or in populations with different sources of biological variability.”
(5) Minor inconsistency in training-set size:
The manuscript mentions 691 in Methods, but the figures/scripts label is 692. Please correct for consistency.
Thank you for pointing out this inconsistency, the error in the methods section has been corrected.
eLife Assessment
This valuable study provides insights into the role of Pten mutations in SHH-medulloblastoma, by using mouse models to resolve the effects of heterozygous vs homozygous mutations on proliferation and cell death throughout tumorigenesis. The experiments presented are convincing, with rigorous quantifications and orthogonal experimentation provided throughout, and the models employing sporadic oncogene induction, rather than EGL-wide genetic modifications, represent an advancement in experimental design. However, additional experimentation focused on a greater characterization of macrophage phenotypes (e.g., microglia vs circulating monocytes) would enhance this study. The work will be of interest to medical biologists studying general cancer mechanisms, as the function of Pten may be similar across tumor types.
Reviewer #1 (Public review):
This study investigates how Pten loss influences medulloblastoma development in mouse models of Shh-driven MB. Previous studies have shown that Pten heterozygosity can accelerate tumorigenesis in models where the entire GNP compartment harbours MB-promoting mutations, raising questions about how Pten levels and context interact, especially when MB-initiating mutations occur sporadically in the cerebellum. Here, the authors create an allelic series combining sporadic, cell-autonomous induction of oncogenic SmoM2 with Pten loss in granule neuron progenitors. In contrast to previous studies, Pten heterozygosity does not significantly impact tumour development from sporadic SmoM2 induction, whereas complete Pten loss accelerates tumour onset. Analysis of Pten-deficient tumours reveals accumulation of death-resistant differentiated cells and reduced macrophage infiltration. At early stages, Pten-deficient pre-tumour cells exhibit increased proliferation and EGL hyperplasia, indicating that Pten loss drives proliferation but shifts cells towards differentiation.
Strengths
This study raises the bar for modelling and interpreting the effects of secondary mutations on MB development. It is carefully executed, and the models-using sporadic oncogene induction rather than EGL-wide genetic manipulations-represent an advance in experimental design. The deeper phenotyping, including single-cell RNA-seq and target validation, adds rigor. This work extends previous work on ShhMB and Pten by showing that Pten heterozygosity in GNPs is likely not responsible for the accelerated tumour development reported in earlier studies. The evolution of these Pten-deficient tumours from proliferative to post-mitotic and death-resistant is an important observation with potential clinical significance.
Minor weakness
The absence of an effect of Pten heterozygosity on tumour development in their model suggests non-cell-autonomous effects, but this is not directly demonstrated. Changes in macrophage recruitment warrant further exploration and represent an interesting avenue for future investigation.
Reviewer #2 (Public review):
The authors sought to answer several questions about the role of the tumor suppressor PTEN in SHH-medulloblastoma formation. Namely, whether Pten loss increases metastasis, understanding why Pten loss accelerates tumor growth, and the effect of single-copy vs double-copy loss on tumorigenesis. Using an elegant mouse model, the authors found that Pten mutations do not increase metastasis in a SmoD2-driven SHH-medullolbastoma mouse model, based on extensive characterization of the presence of spinal cord metastases. Upon examining the cellular phenotype of Pten-null tumors in the cerebellum, the authors made the interesting and puzzling observation that Pten loss increased the differentiation state of the tumor, with less cycling cells, seemingly in contrast to the higher penetrance and decreased latency of tumor growth.
The authors then examined the rate of cell death in the tumor. Interestingly, Pten-null tumors had less dying cells, as assessed by TUNEL. In addition, the tumors expressed differentiaton markers NeuN and SyP, which are rare in SHH-MB mouse models. This reduction in dying cells is also evident at earlier stages of tumor growth. By looking shortly after Pten-loss induction, the authors found that Pten loss had an immediate impact on increasing the proliferative state of GCPs, followed by enhancing survival of differentiated cells. These two pro-tumor features together account for the increased penetrance and decreased latency of the model. While heterozygous loss of Pten also promoted proliferation, it did not protect against cell death.<br /> Interestingly, loss of Pten alone in GCPs caused an increase in cerebellar size throughout development. The authors suggest that Pten normally constrants GCP proliferation, although they did not check whether reduced cell death is also contributing to cerebellum size.
Lastly, the authors examined macrophage infiltration and found that there was less macrophage infiltration to the Pten-null tumors. Using scRNA-seq, they suggest that the observed reduction in macrophages might be due to immunosuppressive tumor microenvironment.
This mouse model will be of high relevance to the medulloblastoma community, as current models do not reflect the heterogeneity of the disease. In addition, the elegant experimentation into Pten function may be relevant to cancer biologists outside of the medulloblastoma field.
Strengths:
The in-depth characterisation of the mouse model is a major strength of the study, including multiple time points and quantifications. The single-cell sequencing adds a nice molecular feature, and this dataset may be relevant to other researchers with specific questions of Pten function.
Weaknesses:
Adequately addressed in revisions.
Author response:
The following is the authors’ response to the original reviews.
eLife Assessment
This valuable study provides insights into the role of Pten mutations in SHH-medulloblastoma, by using mouse models to resolve the effects of heterozygous vs homozygous mutations on proliferation and cell death throughout tumorigenesis. The experiments presented are convincing, with rigorous quantifications and orthogonal experimentation provided throughout, and the models employing sporadic oncogene induction, rather than EGL-wide genetic modifications, represent an advancement in experimental design. However, the study remains incomplete, such that the biological conclusions do not extend greatly from those in the extant literature; this could be addressed with additional experimentation focused on cell cycle kinetic changes at early stages, as well as greater characterization of macrophage phenotypes (e.g., microglia vs circulating monocytes). The work will be of interest to medical biologists studying general cancer mechanisms, as the function of Pten may be similar across tumor types.
We appreciate the summary of the importance of our work and agree that it provides a foundation for future experiments addressing underlying mechanisms including the role of macrophages in tumor progression/regression
Public Reviews:
Reviewer #1 (Public review):
Summary:
This paper investigates how Pten loss influences the development of medulloblastoma using mouse models of Shh-driven MB. Previous studies have shown that Pten heterozygosity can accelerate tumorigenesis in models where the entire GNP compartment has MB-promoting mutations, raising questions about how Pten levels and context interact, especially when cancer-causing mutations are more sporadic. Here, the authors create an allelic series combining sporadic, cell-autonomous induction of SmoM2 with Pten loss in granule neuron progenitors. In their models, Pten heterozygosity does not significantly impact tumor development, whereas complete Pten loss accelerates tumour onset. Notably, Pten-deficient tumours accumulate differentiated cells, reduced cell death, and decreased macrophage infiltration. At early stages, before tumour establishment, they observe EGL hyperplasia and more pre-tumour cells in S phase, leading them to suggest that Pten loss initially drives proliferation but later shifts towards differentiation and accumulation of death-resistant, postmitotic cells. Overall, this is a well-executed and technically elegant study that confirms and extends earlier findings with more refined models. The phenotyping is strong, but the mechanistic insight is limited, especially with respect to dosage effects and macrophage biology.
Strengths:
The work is carefully executed, and the models-using sporadic oncogene induction rather than EGL-wide genetic manipulations-represent an advance in experimental design. The deeper phenotyping, including singlecell RNA-seq and target validation, adds rigor.
Weaknesses:
The biological conclusions largely confirm findings from previous studies (Castellino et al, 2010; Metcalf et al, 2013), showing that germline or conditional Pten heterozygosity accelerates tumorigenesis, generates tumors with a very similar phenotype, including abundant postmitotic cells, and reduced cell death.
We respectfully would like to point out that we have added new insights not covered in the previous more abbreviated studies. First, we are the first to show that in a sporadic model, heterozygous loss of Pten does not lead to accelerated or more aggressive disease. This is an important finding, since this is the case for many patients and only germline PTEN mutant humans are likely to have more aggressive tumors. Also, the previous studies did not examine tumor progress by analyzing neonatal stages or analyze spinal cord metastasis. We found a different phenotype at some early stages then at end stage, thus they provide new insights. Our study also is the only one to apply a mosaic analysis to study cell behaviors at early stages of progression, including proliferation and differentiation/survival. We are also the first to demonstrate a reduction in macrophages in Pten mutant SHH-MB.
The second stated goal - to understand why Pten dosage might matter - remains underdeveloped. The difference between earlier models using EGL-wide SmoA1 or Ptch loss versus sporadic cell-autonomous SmoM2 induction and Pten loss in this study could reflect model-specific effects or non-cell-autonomous contributions from Pten-deficient neighbouring cells in the EGL, for example. However, the study does not explore these possibilities. For instance, examining germline Pten loss in the sporadic SmoM2 context could have provided insight into whether dosage effects are cell-autonomous or dependent on the context.
We thank the reviewer for suggesting this experiment and agree it would be an informative one for other groups to perform as a follow up to our work to allow a direct comparison in the same sporadic SHH-MB model of mosaic vs germline loss of Pten. Also, we would like to point out that we do show a dosage effect of lowering vs removing Pten when only sporadic GCPs also have an activating mutation in SMO. Please see above comments for additional new mechanistic insight we have provided.
The observations on macrophages are intriguing but preliminary. The reduction in Iba1+ cells could reflect changes in microglia, barrier-associated macrophages, or infiltrating peripheral macrophages, but these populations are not distinguished. Moreover, the functional relevance of these immune changes for tumor initiation or progression remains unexplored.
We agree, further studies of the influence of Pten mutations on macrophage phenotypes will be interesting.
Reviewer #2 (Public review):
The authors sought to answer several questions about the role of the tumor suppressor PTEN in SHHmedulloblastoma formation. Namely, whether Pten loss increases metastasis, understanding why Pten loss accelerates tumor growth, and the effect of single-copy vs double-copy loss on tumorigenesis. Using an elegant mouse model, the authors found that Pten mutations do not increase metastasis in a SmoD2-driven SHH-medulloblastoma mouse model, based on extensive characterization of the presence of spinal cord metastases. Upon examining the cellular phenotype of Pten-null tumors in the cerebellum, the authors made the interesting and puzzling observation that Pten loss increased the differentiation state of the tumor, with fewer cycling cells, seemingly in contrast to the higher penetrance and decreased latency of tumor growth.
The authors then examined the rate of cell death in the tumor. Interestingly, Pten-null tumors had fewer dying cells, as assessed by TUNEL. In addition, the tumors expressed differentiation markers NeuN and SyP, which are rare in SHH-MB mouse models. This reduction in dying cells is also evident at earlier stages of tumor growth. By looking shortly after Pten-loss induction, the authors found that Pten loss had an immediate impact on increasing the proliferative state of GCPs, followed by enhancing the survival of differentiated cells. These two pro-tumor features together account for the increased penetrance and decreased latency of the model. While heterozygous loss of Pten also promoted proliferation, it did not protect against cell death.
Interestingly, loss of Pten alone in GCPs caused an increase in cerebellar size throughout development. The authors suggest that Pten normally constrains GCP proliferation, although they did not check whether reduced cell death is also contributing to cerebellum size.
Lastly, the authors examined macrophage infiltration and found that there was less macrophage infiltration in the Pten-null tumors. Using scRNA-seq, they suggest that the observed reduction in macrophages might be due to an immunosuppressive tumor microenvironment.
This mouse model will be of high relevance to the medulloblastoma community, as current models do not reflect the heterogeneity of the disease. In addition, the elegant experimentation into Pten function may be relevant to cancer biologists outside of the medulloblastoma field.
Strengths:
The in-depth characterisation of the mouse model is a major strength of the study, including multiple time points and quantifications. The single-cell sequencing adds a nice molecular feature, and this dataset may be relevant to other researchers with specific questions of Pten function.
Weaknesses:
One weakness of the study was the examination of the macrophage phenotype, which did not include quantification (only single images), so it is difficult to assess whether this reduction of macrophages holds true across multiple samples. Future studies will also be needed to assess whether Pten-mutated patient medulloblastomas also have a differentiation phenotype, but this is difficult to assess given the low number of samples worldwide.
We thank the reviewer for highlighting the importance of our sporadic mutant approach and new findings. As stated above, we agree, further studies of the influence of Pten mutations on macrophage phenotypes will be interesting as well as of human samples once large numbers can be obtained. All conclusions about macrophages are based on analyzing 3 independent tumors/genotype, which was stated in the Figure legends, and for all end stage tumors the sections were collected from one lateral edge of the tumor to the midline and for earlier stage from one side of the brain to the other, thus we believe the reported phenotypes are consistent within tumor and stages
Recommendations for the authors:
Reviewer #1 (Recommendations for the authors):
Minor points
(1) The authors should state explicitly that early EGL analyses sample the same cerebellar region across animals (e.g., matched lobule or distance from the midline) because position-dependent effects are possible.
We agree this is an important aspect of the rigor of the study and are sorry this was not clear enough. We had stated in the legends to Figures 4 and 5 that midline sections were analyzed and when it was not the entire EGL quantified the region analyzed was shown, but we now include more details in all relevant Figure legends and in the Methods section.
(2) It is not clear from Figure 3i-k that TUNEL density in Syp-high regions differs between Pten+/- and Pten-/- tumors.
We have added a new graph as Figure 3 Supplemental Figure 1D with this direct comparison. Indeed, there is no difference between the Syp-high regions of Pten+/- and Pten-/- tumors as these regions of Pten+/- tumors have no detectable PTEN protein and thus have the same behavior as Pten-/- tumors (reduced cell death).
(3) The authors interpret the increase in the %EdU+ GFP+ cells in the EGL as evidence of a faster cell cycle. However, EdU labeling alone does not demonstrate altered cell cycle kinetics; this would require a dedicated assay. It would also be informative to combine EdU with Ki67 staining. This could clarify whether the effect reflects changes in differentiation - for example, if a higher proportion of GFP+ pre-tumor cells remain Ki67+-or whether the increase in EdU simply reflects a greater fraction of cells being in cycle. Such an analysis might even reveal no change in cycling if the proliferation index in controls is lower.
We are sorry we did not make our analysis sufficiently clear in Figure 5 and Figure 6. The quantification of EdU+ cells was restricted to the outer EGL (region defined by containing GFP+ and EdU+ cells) where all cells should be Ki67+. We cannot perform co-staining of Ki67 and GFP, since antigen retrieval for Ki67 removes the epitope for our GFP antibody. We have revised the wording in the figure legends and results sections.
(4) Some of the stains are unconvincing - for example, Figure 2 E,F, the p27 staining is difficult to distinguish from the background, Figure 7G,E- CD31+ blood vessels are difficult to see.
As requested, in Fig. 2 we adjusted the level of the green color for P27 to reduce the background in A, B, E , F using Photoshop. In Fig. 7G, H we adjusted the level of the green color for CD31 to reduce the background.
(5) Line 158: "unlike a SmoA2 model with germline or broad deletion of Pten in the cerebellum, where heterozygous deletion is sufficient..." That paper refers to the Neuro-D2SmoA1 mouse model. So this statement should be clarified.
We have made this edit.
Reviewer #2 (Recommendations for the authors):
(1) I find the final discussion paragraph about Kmt2d does not add much to the study, as it seems obvious that the mechanisms of tumor formation would differ between two different tumor suppressor genes, but this is only my opinion.
We respectfully think it is interesting, even if expected, so have left it in the Discussion.
(2) There is also a typo on line 342 that changes the meaning of the sentence: mTORC1 signaling is significantly 'unregulated';
We thank the reviewer for noticing this mistake. We have changed 'unregulated' to ‘upregulated’.
(3) Figure 9Q,R mislabeled: not mTORC1, but instead UPR
Asns is included in the mTOR pathway in Hallmark MTOR1 signaling as well as in the Unfolded Protein Response gene list. We have made a note of this in the Figure legend.
eLife Assessment
This manuscript presents a valuable study of the activity and functional relevance of different circuits in the dentate gyrus of mice performing a pattern separation task. The study is likely to be of interest to those studying the subregional organization and cell type-specific functions of the dentate gyrus. However, the strength of evidence for the study's conclusions is currently incomplete.
Reviewer #1 (Public review):
This manuscript investigates how dentate gyrus (DG) granule cell subregions, specifically suprapyramidal (SB) and infrapyramidal (IB) blades, are differentially recruited during a high cognitive demand pattern separation task. The authors combine TRAP2 activity labeling, touchscreen-based TUNL behavior, and chemogenetic inhibition of adult-born dentate granule cells (abDGCs) or mature granule cells (mGCs) to dissect circuit contributions.
This manuscript presents an interesting and well-designed investigation into DG activity patterns under varying cognitive demands and the role of abDGCs in shaping mGC activity. The integration of TRAP2-based activity labeling, chemogenetic manipulation, and behavioral assays provides valuable insight into DG subregional organization and functional recruitment. However, several methodological and quantitative issues limit the interpretability of the findings. Addressing the concerns below will greatly strengthen the rigor and clarity of the study.
Major points:
(1) Quantification methods for TRAP+ cells are not applied consistently across panels in Figure 1, making interpretation difficult. Specifically, Figure 1F reports TRAP+ mGCs as density, whereas Figure 1G reports TRAP+ abDGCs as a percentage, hindering direct comparison. Additionally, Figure 1H presents reactivation analysis only for mGCs; a parallel analysis for abDGCs is needed for comparison across cell types.
(2) The anatomical distribution of TRAP+ cells is different between low- and high-cognitive demand conditions (Figure 2). Are these sections from dorsal or ventral DG? Is this specific to dorsal DG, as itis preferentially involved in cognitive function? What happens in ventral DG?
(3) The activity manipulation using chemogenetic inhibition of abDGCs in AsclCreER; hM4 mice was performed; however, because tamoxifen chow was administered for 4 or 7 weeks, the labeled abDGC population was not properly birth-dated. Instead, it consisted of a heterogeneous cohort of cells ranging from 0 to 5-7 weeks old. Thus, caution should be taken when interpreting these results, and the limitations of this approach should be acknowledged.
(4) There is a major issue related to the quantification of the DREADD experiments in Figure 4, Figure 5, Figure 6, and Figure 7. The hM4 mouse line used in this study should be quantified using HA, rather than mCitrine, to reliably identify cells derived from the Ascl lineage. mCitrine expression in this mouse line is not specific to adult-born neurons (off-targets), and its expression does not accurately reflect hM4 expression.
(5) Key markers needed to assess the maturation state of abDGCs are missing from the quantification. Incorporating DCX and NeuN into the analysis would provide essential information about the developmental stage of these cells.
Minor points:
(1) The labeling (Distance from the hilus) in Figure 2B is misleading. Is that the same location as the subgranular zone (SGZ)? If so, it's better to use the term SGZ to avoid confusion.
(2) Cell number information is missing from Figures 2B and 2C; please include this data.
(3) Sample DG images should clearly delineate the borders between the dentate gyrus and the hilus. In several images, this boundary is difficult to discern.
(4) In Figure 6, it is not clear how tamoxifen was administered to selectively inhibit the more mature 6-7-week-old abDGC population, nor how this paradigm differs from the chow-based approach. Please clarify the tamoxifen administration protocol and the rationale for its specificity.
Reviewer #2 (Public review):
Summary
In this manuscript, the authors combine an automated touchscreen-based trial-unique nonmatching-to-location (TUNL) task with activity-dependent labeling (TRAP/c-Fos) and birth-dating of adult-born dentate granule cells (abDGCs) to examine how cognitive demand modulates dentate gyrus (DG) activity patterns. By varying spatial separation between sample and choice locations, the authors operationally increase task difficulty and show that higher demand is associated with increased mature granule cell (mGC) activity and an amplified suprapyramidal (SB) versus infrapyramidal (IB) blade bias. Using chemogenetic inhibition, they further demonstrate dissociable contributions of abDGCs and mGCs to task performance and DG activation patterns.
The combination of behavioral manipulation, spatially resolved activity tagging, and temporally defined abDGC perturbations is a strength of the study and provides a novel circuit-level perspective on how adult neurogenesis modulates DG function. In particular, the comparison across different abDGC maturation windows is well designed and narrows the functionally relevant population to neurons within the critical period (~4-7 weeks). The finding that overall mGC activity levels, in addition to spatially biased activation patterns, are required for successful performance under high cognitive demand is intriguing.
Major Comments
(1) Individual variability and the relationship between performance and DG activation.
The manuscript reports substantial inter-animal variability in the number of days required to reach the criterion, particularly during large-separation training. Given this variability, it would be informative to examine whether individual differences in performance correlate with TRAP+ or c-Fos+ density and/or spatial bias metrics. While the authors report no correlation between success and TRAP+ density in some analyses, a more systematic correlation across learning rate, final performance, and DG activation patterns (mGC vs abDGC, SB vs IB) could strengthen the interpretation that DG activity reflects task engagement rather than performance only.
(2) Operational definition of "cognitive demand".
The distinction between low (large separation) and high (small separation) cognitive demand is central to the manuscript, yet the definition remains somewhat broad. Reduced spatial separation likely alters multiple behavioral variables beyond cognitive load, including reward expectation, attentional demands, confidence, engagement, and potentially motivation. The authors should more explicitly acknowledge these alternative interpretations and clarify whether "cognitive demand" is intended as a composite construct rather than a strictly defined cognitive operation.
(3) Potential effects of task engagement on neurogenesis.
Given the extensive behavioral training and known effects of experience on adult neurogenesis, it remains unclear whether the task itself alters the size or maturation state of the abDGC population. Although the focus is on activity and function rather than cell number, it would be useful to clarify whether neurogenesis rates were assessed or controlled for, or to explicitly state this as a limitation.
(4) Temporal resolution of activity tagging.
TRAP and c-Fos labeling provide a snapshot of neural activity integrated over a temporal window, making it difficult to determine which task epochs or trial types drive the observed activation patterns. This limitation is partially acknowledged, but the conclusions occasionally imply trial-specific or demand-specific encoding. The authors should more clearly distinguish between sustained task engagement and moment-to-moment trial processing, and temper interpretations accordingly. While beyond the scope of the current study, this also motivates future experiments using in vivo recording approaches.
(5) Interpretation of altered spatial patterns following abDGC inhibition.
In the abDGC inhibition experiments, Cre+ DCZ animals show delayed learning relative to controls. As a result, when animals are sacrificed, they may be at an intermediate learning stage rather than at an equivalent behavioral endpoint. This raises the possibility that altered DG activation patterns reflect the learning stage rather than a direct circuit effect of abDGC inhibition. Additional clarification or analysis controlling for the learning stage would strengthen the causal interpretation.
(6) Relationship between c-Fos density and behavioral performance.
The study reports that abDGC inhibition increases c-Fos density while impairing performance, whereas mGC inhibition decreases c-Fos density and also impairs performance. This raises an important conceptual question regarding the relationship between overall activity levels and task success. The authors suggest that both sufficient activity and appropriate spatial patterning are required, but the manuscript would benefit from a more explicit discussion of how different perturbations may shift the identity, composition, or coordination of the active neuronal ensemble rather than simply altering total activity levels.
Reviewer #3 (Public review):
Summary:
The authors used genetic models and immunohistochemistry to identify how training in a spatial discrimination working memory task influences activity in the dentate gyrus subregion of the hippocampus. Finding that more cognitively challenging variants of the task evoked more and distinct patterns of activity, they then investigated whether newborn neurons in particular were important for learning this task and regulating the spatial activity patterns.
Strengths:
The focus on precise anatomical locations of activity is relatively novel and potentially important, given that little is known about how DG subregions contribute to behavior. The authors also use a task that is known to depend on this memory-related part of the brain.
Weaknesses:
Statistical rigor is insufficient. Many statistical results are not stated, inappropriate tests are used, and sample sizes differ across experiments (which appear to potentially underlie null results). The chemogenetic approach to inhibit adult-born neurons also does not appear to be targeting these neurons, as judged by their location in the DG.
eLife Assessment
This useful study by Palo et al proposes that FRG1 functions as a negative regulator of Nonsense-Mediated mRNA decay (NMD) by associating with the exon junction complex (EJC) and destabilizing UPF1 independently of DUX4. The authors present solid evidence to dissect the relationship between FRG1 and DUX4 in NMD. However, the evidence to support the claim that FRG1 is a component of the EJC or the NMD machinery is incomplete.
Reviewer #1 (Public review):
Summary:
In this manuscript, Dixit and colleagues investigate the role of FRG1 in modulating nonsense-mediated mRNA decay using human cell lines and zebrafish embryos. They present data from experiments that test the effect of normal, reduced or elevated levels of FRG1 on NMD of a luciferase-based NMD reporter and on endogenous mRNA substrates of NMD. They also carry out experiments to investigate FRG1's influence on UPF1 mRNA and protein levels, with a particular focus on the possibility that FRG1 regulates UPF1 protein levels through ubiquitin-mediated proteolysis of UPF1. The experiments described also test whether DUX4's effect on UPF1 protein levels and NMD could be mediated through FRG1. Finally, the authors also present experiments that test for physical interaction between UPF1, the spliceosome and components of the exon junction complex.
Strengths:
A key strength of the work is its focus on an intriguing model of NMD regulation by FRG1, which is of particular interest as FRG1 is positively regulated by DUX4, which has been previously implicated in subjecting UPF1 to proteosome-mediated degradation and thereby causing NMD inhibition. The data that shows that DUX4-mediated effect on UPF1 levels is diminished upon FRG1 depletion suggests that DUX4's regulation of NMD could be mediated by FRG1.
Weaknesses:
A major weakness and concern is that many of the key conclusions drawn by the authors are not supported by the data, and there are also some significant concerns with experimental design. More specific comments below describe these issues:
(1) Multiple issues lower the confidence in the experiments testing the effect of FRG1 on NMD.
(a) All reporter assays presented in the manuscript are based on quantification of luciferase activity, and in most cases, the effect on luciferase activity is quite small. This assay is the key experimental approach throughout the manuscript. However, no evidence is provided that the effect captured by this assay is due to enhanced degradation of the mRNA encoding the luciferase reporter, which is what is implied in the interpretation of these experiments. Crucially, there is also no control for the reporter that can account for the effects of experimental manipulations on transcriptional versus post-transcriptional effects. A control reporter lacking a 3'UTR intron is described in Barid et al, where the authors got their NMD reporter from. Due to small effects observed on luciferase activity upon FRG1 depletion, it is necessary to not only measure NMD reporter mRNA steady state levels, but it will be equally important to ascertain that the effect of FRG1 on NMD is at the level of mRNA decay and not altered transcription of NMD substrates. This can be accomplished by testing decay rates of the beta-globin reporter mRNA.
(b) It is unusual to use luciferase enzymatic activity as a measurement of RNA decay status. Such an approach can at least be justified if the authors can test how many-fold the luciferase activity changes when NMD is inhibited using a chemical inhibitor (e.g., SMG1 inhibitor) or knockdown of a core NMD factor.
(c) The concern about the direct effect of FRG1 on NMD is further amplified by the small effects of FRG1 knockout on steady-state levels of endogenous NMD targets (Figure 1A and B: ~20% reduction in reporter mRNA in MCF7 cells; Figure 1M, only 18 endogenous NMD targets shared between FRG1_KO and FRG1_KD).
(d) The question about transcriptional versus post-transcriptional effects is also important in light of the authors' previous work that FRG1 can act as a transcriptional regulator.
(2) In the experiments probing the relationship between DUX4 and FRG1 in NMD regulation, there are some inconsistencies that need to be resolved.
(a) Figure 3 shows that the inhibition of NMD reporter activity caused by DUX4 induction is reversed by FRG1 knockdown. Although levels of FRG1 and UPF1 in DUX4 uninduced and DUX4 induced + FRG1 knockdown conditions are similar (Figure 5A), why is the reporter activity in DUX4 induced + FRG1 knockdown cells much lower than DUX4 uninduced cells in Figure 3?
(b) In Figure 3, it is important to know the effect of FRG1 knockdown in DUX4 uninduced conditions.
(c) On line 401, the authors claim that MG132 treatment leads to "time-dependent increase in UPF1 protein levels" in Figure 5C. However, upon proteasome inhibition, UPF1 levels significantly increase only at 8h time point, while the change at 12 and 24 hours is not significantly different from the control.
(3) There are multiple issues with experiments investigating ubiquitination of UPF1:
(a) Ubiquitin blots in Figure 6 are very difficult to interpret. There is no information provided either in the text or figure legends as to which bands in the blots are being compared, or about what the sizes of these bands are, as compared to UPF1. Also, the signal for Ub in most IP samples looks very similar to or even lower than the input.
(b) Western blot images in Figure 6D appear to be adjusted for brightness/contrast to reduce background, but are done in such a way that pixel intensities are not linearly altered. This image appears to be the most affected, although some others have also similar patterns (e.g., Figure 5C).
(4) The experiments probing physical interactions of FRG1 with UPF1, spliceosome and EJC proteins need to consider the following points:
(a) There is no information provided in the results or methods section on whether immunoprecipitations were carried out in the absence or presence of RNases. Each RNA can be bound by a plethora of proteins that may not be functionally engaged with each other. Without RNase treatment, even such interactions will lead to co-immunoprecipitation. Thus, experiments in Figure 6 and Figure 7A-D should be repeated with and without RNase treatment.
(b) Also, the authors claim that FRG1 is a "structural component" of EJC and NMD complexes seems to be an overinterpretation. As noted in the previous comment, these interactions could be mediated by a connecting RNA molecule.
(c) A negative control (non-precipitating protein) is missing in Figure 7 co-IP experiments.
(d) Polysome analysis is missing important controls. FRG1 and EIF4A3 co-sedimentation with polysomes could simply be due to their association with another large complex (e.g., spliceosome), which will also co-sediment in these gradients. This possibility can at least be tested by Western blotting for some spliceosome components across the gradient fractions. More importantly, a puromycin treatment control needs to be performed to confirm that FRG1 and EIF4A3 are indeed bound to polysomes, which are separated into ribosome subunits upon puromycin treatment. This leads to a shift of the signal for ribosomal proteins and any polysome-associated proteins to the left.
Reviewer #2 (Public review):
Summary:
In this manuscript, Palo et al present a novel role for FRG1 as a multifaceted regulator of nonsense-mediated mRNA decay (NMD). Through a combination of reporter assays, transcriptome-wide analyses, genetic models, protein-protein interaction studies, ubiquitination assays, and ribosome-associated complex analyses, the authors propose that FRG1 acts as a negative regulator of NMD by destabilizing UPF1 and associating with spliceosomal, EJC, and translation-related complexes. Overall, the data, while consistent with the authors' central conclusions, are undermined by several claims-particularly regarding structural roles and mechanistic exclusivity. To really make the claims presented, further experimental evidence would be required.
Strengths:
(1) The integration of multiple experimental systems (zebrafish and cell culture).
(2) Attempts to go into a mechanistic understanding of the relationship between FGR1 and UPF1.
Weaknesses:
(1) Overstatement of FRG1 as a structural NMD component.
Although FRG1 interacts with UPF1, eIF4A3, PRP8, and CWC22, core spliceosomal and EJC interactions (PRP8-CWC22 and eIF4A3-UPF3B) remain intact in FRG1-deficient cells. This suggests that, while FRG1 associates with these complexes, this interaction is not required for their assembly or structural stability. Without further functional or reconstitution experiments, the presented data are more consistent with an interpretation of FRG1 acting as a regulatory or accessory factor rather than a core structural component.
(2) Causality between UPF1 depletion and NMD inhibition is not fully established.
While reduced UPF1 levels provide a plausible explanation for decreased NMD efficiency, the manuscript does not conclusively demonstrate that UPF1 depletion drives all observed effects. Given FRG1's known roles in transcription, splicing, and RNA metabolism, alterations in transcript isoform composition and apparent NMD sensitivity may arise from mechanisms independent of UPF1 abundance. To directly link UPF1 depletion to altered NMD efficiency, rescue experiments testing whether UPF1 re-expression restores NMD activity in FRG1-overexpressing cells would be important.
(3) Mechanism of FRG1-mediated UPF1 ubiquitination requires clarification.
The ubiquitination assays support a role for FRG1 in promoting UPF1 degradation; however, the mechanism underlying this remains unexplored. The relationship between FRG1-UPF1 what role FRG1 plays in this is unclear (does it function as an adaptor, recruits an E3 ubiquitin ligase, or influences UPF1 ubiquitination indirectly through transcriptional or signaling pathways?).
(4) Limited transcriptome-wide interpretation of RNA-seq data.
Although the RNA-seq data analysis relies heavily on a small subset of "top 10" genes. Additionally, the criteria used to define NMD-sensitive isoforms are unclear. A more comprehensive transcriptome-wide summary-indicating how many NMD-sensitive isoforms are detected and how many are significantly altered-would substantially strengthen the analysis.
(5) Clarification of NMD sensor assay interpretation.
The logic underlying the NMD sensor assay should be explained more clearly early in the manuscript, as the inverse relationship between luciferase signal and NMD efficiency may be counterintuitive to readers unfamiliar with this reporter system. Inclusion of a schematic or brief explanatory diagram would improve accessibility.
(6) Potential confounding effects of high MG132 concentration.
The MG132 concentration used (50 µM) is relatively high and may induce broad cellular stress responses, including inhibition of global translation (its known that proteosome inhibition shuts down translation). Controls addressing these secondary effects would strengthen the conclusion that UPF1 stabilization specifically reflects proteasome-dependent degradation would be essential.
(7) Interpretation of polysome co-sedimentation data.
While the co-sedimentation of FRG1 with polysomes is intriguing, this approach does not distinguish between direct ribosomal association and co-migration with ribosome-associated complexes. This limitation should be explicitly acknowledged in the interpretation.
(8) Limitations of PLA-based interaction evidence.
The PLA data convincingly demonstrate close spatial proximity between FRG1 and eIF4A3; however, PLA does not provide definitive evidence of direct interaction and is known to be susceptible to artefacts. Moreover, a distance threshold of ~40 nm still allows for proteins to be in proximity without being part of the same complex. These limitations should be clearly acknowledged, and conclusions should be framed accordingly.
Reviewer #3 (Public review):
The manuscript by Palo and colleagues demonstrates identification of FRG1 as a novel regulator of nonsense-mediated mRNA decay (NMD), showing that FRG1 inversely modulates NMD efficiency by controlling UPF1 abundance. Using cell-based models and a frg1 knockout zebrafish, the authors show that FRG1 promotes UPF1 ubiquitination and proteasomal degradation, independently of DUX4. The work further positions FRG1 as a structural component of the spliceosome and exon junction complex without compromising its integrity. Overall, the manuscript provides mechanistic insight into FRG1-mediated post-transcriptional regulation and expands understanding of NMD homeostasis. The authors should address the following issues to improve the quality of their manuscript.
(1) Figure 7A-D, appropriate positive controls for the nuclear fraction (e.g., Histone H3) and the cytoplasmic fraction (e.g., GAPDH or α-tubulin) should be included to validate the efficiency and purity of the subcellular fractionation.
(2) To strengthen the conclusion that FRG1 broadly impacts the NMD pathway, qRT-PCR analysis of additional core NMD factors (beyond UPF1) in the frg1⁻/⁻ zebrafish at 48 hpf would be informative.
(3) Figure labels should be standardized throughout the manuscript (e.g., consistent use of "Ex" instead of mixed terms such as "Oex") to improve clarity and readability.
(4) The methods describing the generation of the frg1 knockout zebrafish could be expanded to include additional detail, and a schematic illustrating the CRISPR design, genotyping workflow, and validation strategy would enhance transparency and reproducibility.
(5) As FRG1 is a well-established tumor suppressor, additional cell-based functional assays under combined FRG1 and UPF1 perturbation (e.g., proliferation, migration, or survival assays) could help determine whether FRG1 influences cancer-associated phenotypes through modulation of the NMD pathway.
(6) Given the claim that FRG1 inversely regulates NMD efficacy via UPF1, an epistasis experiment such as UPF1 overexpression in an FRG1-overexpressing background followed by an NMD reporter assay would provide stronger functional validation of pathway hierarchy.
Author response:
Public Reviews:
Reviewer #1 (Public review):
Summary:
In this manuscript, Dixit and colleagues investigate the role of FRG1 in modulating nonsense-mediated mRNA decay using human cell lines and zebrafish embryos. They present data from experiments that test the effect of normal, reduced or elevated levels of FRG1 on NMD of a luciferase-based NMD reporter and on endogenous mRNA substrates of NMD. They also carry out experiments to investigate FRG1's influence on UPF1 mRNA and protein levels, with a particular focus on the possibility that FRG1 regulates UPF1 protein levels through ubiquitin-mediated proteolysis of UPF1. The experiments described also test whether DUX4's effect on UPF1 protein levels and NMD could be mediated through FRG1. Finally, the authors also present experiments that test for physical interaction between UPF1, the spliceosome and components of the exon junction complex.
Strengths:
A key strength of the work is its focus on an intriguing model of NMD regulation by FRG1, which is of particular interest as FRG1 is positively regulated by DUX4, which has been previously implicated in subjecting UPF1 to proteosome-mediated degradation and thereby causing NMD inhibition. The data that shows that DUX4-mediated effect on UPF1 levels is diminished upon FRG1 depletion suggests that DUX4's regulation of NMD could be mediated by FRG1.
Weaknesses:
A major weakness and concern is that many of the key conclusions drawn by the authors are not supported by the data, and there are also some significant concerns with experimental design. More specific comments below describe these issues:
(1) Multiple issues lower the confidence in the experiments testing the effect of FRG1 on NMD.
(a) All reporter assays presented in the manuscript are based on quantification of luciferase activity, and in most cases, the effect on luciferase activity is quite small. This assay is the key experimental approach throughout the manuscript. However, no evidence is provided that the effect captured by this assay is due to enhanced degradation of the mRNA encoding the luciferase reporter, which is what is implied in the interpretation of these experiments. Crucially, there is also no control for the reporter that can account for the effects of experimental manipulations on transcriptional versus post-transcriptional effects. A control reporter lacking a 3'UTR intron is described in Barid et al, where the authors got their NMD reporter from. Due to small effects observed on luciferase activity upon FRG1 depletion, it is necessary to not only measure NMD reporter mRNA steady state levels, but it will be equally important to ascertain that the effect of FRG1 on NMD is at the level of mRNA decay and not altered transcription of NMD substrates. This can be accomplished by testing decay rates of the beta-globin reporter mRNA.
We thank the reviewer for raising these points and for the careful evaluation of our experimental approach. Here we provide our response to comment (a) in three parts
Reliance on luciferase-based reporter assays
While luciferase-based NMD reporter assays represent an important experimental component of this study, our conclusions do not rely exclusively on this approach. The reporter-based findings are independently supported by RNA sequencing analyses of FRG1-perturbed cells, which demonstrate altered abundance of established PTC-containing NMD target transcripts. This genome-wide analysis provides an unbiased and physiologically relevant validation of FRG1 involvement in NMD regulation.
All reporter assays presented in the manuscript are based on quantification of luciferase activity, and in most cases, the effect on luciferase activity is quite small.
We respectfully disagree with the comment that the magnitude of the luciferase effects is low. Increased expression of FRG1, which leads to reduced UPF1 levels, results in a ~3.5-fold increase in relative luciferase activity (Fig. 1C), indicating a robust effect. Furthermore, in the in vivo zebrafish model, FRG1 knockout causes a pronounced decrease in relative luciferase activity (Fig. 1H), consistent with elevated UPF1 levels and enhanced NMD activity.
It is also important to note that FRG1 functions as a negative regulator of UPF1; therefore, its depletion is expected to increase UPF1 levels. However, excessive elevation of UPF1 is likely constrained by additional regulatory mechanisms, which may limit the observable effects of FRG1 knockdown or knockout. In line with this, our previous study (1) demonstrated that FRG1 positively regulates multiple NMD factors while exerting an inverse regulatory effect on UPF1. This dual role suggests that FRG1 may act as a compensatory modulator of the NMD machinery, which likely explains the relatively subtle net effects observed in FRG1 knockdown/knockout conditions in vitro (Fig. 1A and 1B). This interpretation is explicitly discussed in the manuscript (Discussion, paragraph para 4).
However, no evidence is provided that the effect captured by this assay is due to enhanced degradation of the mRNA encoding the luciferase reporter, which is what is implied in the interpretation of these experiments. Crucially, there is also no control for the reporter that can account for the effects of experimental manipulations on transcriptional versus post-transcriptional effects. A control reporter lacking a 3'UTR intron is described in Barid et al, where the authors got their NMD reporter from. Due to small effects observed on luciferase activity upon FRG1 depletion, it is necessary to not only measure NMD reporter mRNA steady state levels, but it will be equally important to ascertain that the effect of FRG1 on NMD is at the level of mRNA decay and not altered transcription of NMD substrates. This can be accomplished by testing decay rates of the beta-globin reporter mRNA.
Thank you for your suggestion. We will test decay rates of the beta-globin reporter mRNA.
(b) It is unusual to use luciferase enzymatic activity as a measurement of RNA decay status. Such an approach can at least be justified if the authors can test how many-fold the luciferase activity changes when NMD is inhibited using a chemical inhibitor (e.g., SMG1 inhibitor) or knockdown of a core NMD factor.
We respectfully disagree that the use of luciferase enzymatic activity as a readout for NMD is unusual. Multiple prior studies have successfully employed identical or closely related luciferase-based/fluorescence-based reporters to quantify NMD activity (2–5). Importantly, the goal of our study was not to measure RNA decay kinetics per se, but rather to assess how altered FRG1 levels influence the functional efficiency of the NMD pathway. Given that FRG1 is a structural component of the spliceosome C complex (6) and is previously indirectly linked to NMD regulation (1,7) this approach was well-suited to address our central question.
As suggested by the reviewer, we will also assess luciferase activity following pharmacological inhibition of NMD to further validate the reporter system's responsiveness.
(c) The concern about the direct effect of FRG1 on NMD is further amplified by the small effects of FRG1 knockout on steady-state levels of endogenous NMD targets (Figure 1A and B: ~20% reduction in reporter mRNA in MCF7 cells; Figure 1M, only 18 endogenous NMD targets shared between FRG1_KO and FRG1_KD).
The modest changes observed upon FRG1 loss do not preclude a direct role in NMD. As detailed in our response to comment (a) and discussed in paragraph 4 of the Discussion, limited effects on steady-state levels of endogenous NMD targets are expected given the buffering capacity of the NMD pathway and the contribution of compensatory regulatory mechanisms.
(d) The question about transcriptional versus post-transcriptional effects is also important in light of the authors' previous work that FRG1 can act as a transcriptional regulator.
We agree that distinguishing between transcriptional and post-transcriptional effects is important, particularly in light of our previous work demonstrating that FRG1 can function as a transcriptional regulator of multiple NMD genes (1). Consistent with this, the current manuscript shows that FRG1 influences the transcript levels of UPF1. In addition, we demonstrate that FRG1 regulates UPF1 at the protein level. We therefore conclude that FRG1 regulates UPF1 dually, at both transcriptional and post-transcriptional levels, supporting a dual role for FRG1 in the regulation of NMD.
This conclusion is further supported by prior studies indicating post-transcriptional functions of FRG1. FRG1 is a nucleocytoplasmic shuttling protein(8), interacts with the NMD factor ROD1 (7), and has been identified as a component of the spliceosomal C complex (6). FRG1 has also been reported to associate with the hnRNPK family of proteins (8), which participate in extensive protein–protein interaction networks. Collectively, these observations are consistent with a role for FRG1 in regulating NMD components at multiple levels.
(2) In the experiments probing the relationship between DUX4 and FRG1 in NMD regulation, there are some inconsistencies that need to be resolved.
(a) Figure 3 shows that the inhibition of NMD reporter activity caused by DUX4 induction is reversed by FRG1 knockdown. Although levels of FRG1 and UPF1 in DUX4 uninduced and DUX4 induced + FRG1 knockdown conditions are similar (Figure 5A), why is the reporter activity in DUX4 induced + FRG1 knockdown cells much lower than DUX4 uninduced cells in Figure 3?
We appreciate the reviewer’s comment. Figures 3 and 5A represent independent experiments in which FRG1 knockdown was achieved by transient transfection. As such, variability in transfection efficiency is expected and likely accounts for the quantitative difference. We want to highlight that compared to DUX4_induced lane (Fig. 5A, lane 2), when we knock down FRG1 on the DUX4_induced background, it shows a clear increase in the UPF1 level (Fig. 5A, lane 3). We will add one more replicate to 5 A with better FRG1_KD transfection to the experiment.
(b) In Figure 3, it is important to know the effect of FRG1 knockdown in DUX4 uninduced conditions.
We thank the reviewer for this thoughtful suggestion. The effect of FRG1 knockdown under DUX4-uninduced conditions is presented in Figure 1A, where FRG1 levels are reduced without altering DUX4 expression. In contrast, Figure 3 is specifically designed to assess the rescue effect—namely, how reduction of FRG1 expression under DUX4-induced conditions influences NMD efficiency. Therefore, inclusion of an FRG1 knockdown–only group in Figure 3 was not relevant to the objective of this experiment.
(c) On line 401, the authors claim that MG132 treatment leads to "time-dependent increase in UPF1 protein levels" in Figure 5C. However, upon proteasome inhibition, UPF1 levels significantly increase only at 8h time point, while the change at 12 and 24 hours is not significantly different from the control.
We thank the reviewer for this observation and agree that the statement of a “time-dependent increase in UPF1 protein levels” was inaccurate. A significant increase is observed only at the 8 h time point following MG132 treatment, with no significant changes at 12 h or 24 h. The text will be revised accordingly to reflect Figure 5C.
(3) There are multiple issues with experiments investigating ubiquitination of UPF1:
(a) Ubiquitin blots in Figure 6 are very difficult to interpret. There is no information provided either in the text or figure legends as to which bands in the blots are being compared, or about what the sizes of these bands are, as compared to UPF1. Also, the signal for Ub in most IP samples looks very similar to or even lower than the input.
We agree that the ubiquitin blots in Figure 6 require clearer presentation. In the revised figure, we will annotate the ubiquitin immunoblots to indicate the region corresponding to UPF1 (~140 kDa), which is the relevant molecular weight for interpretation. Because UPF1 is polyubiquitinated, ubiquitinated species are expected to appear as multiple bands rather than a single discrete signal; therefore, ubiquitination was assessed across the full blot. Importantly, interpretation is based on comparisons between UPF1 immunoprecipitated samples within each panel (Fig. 6C–F), rather than between input and IP lanes. For example, in Figure 6 C UPF1 IP FRG1_KD compared to UPF1 IP FRG1_Ex, in Figure 6 D UPF1 IP FRG1_WT compared to UPF1 IP FRG1_KO, in Figure 6 E UPF1 IP FRG1_KO compared to UPF1 IP FRG1_KO+FRG1_Ex, and in Figure 6 F UPF1 IP FRG1_Ex compared to UPF1 IP FRG1_Ex+MG132 TRT.
(b) Western blot images in Figure 6D appear to be adjusted for brightness/contrast to reduce background, but are done in such a way that pixel intensities are not linearly altered. This image appears to be the most affected, although some others have also similar patterns (e.g., Figure 5C).
We thank the reviewer for raising this point. The appearance noted in Figure 6D was not due to non-linear alteration of pixel intensities, but rather resulted from the poor quality of the ubiquitin antibody, which required prolonged exposure times. To address this, we replaced the antibody and repeated the ubiquitin immunoblots shown in Figures 6D, 6E, and 6F.
For Figure 5C, only uniform contrast adjustment was applied for clarity. Importantly, all adjustments were performed linearly and applied to the entire image. Raw, unprocessed images for all blots are provided in the Supplementary Information. Updated versions of Figures 5 and 6 will be included in the revised manuscript.
(4) The experiments probing physical interactions of FRG1 with UPF1, spliceosome and EJC proteins need to consider the following points:
(a) There is no information provided in the results or methods section on whether immunoprecipitations were carried out in the absence or presence of RNases. Each RNA can be bound by a plethora of proteins that may not be functionally engaged with each other. Without RNase treatment, even such interactions will lead to co-immunoprecipitation. Thus, experiments in Figure 6 and Figure 7A-D should be repeated with and without RNase treatment.
We thank the reviewer for this important point. The co-immunoprecipitation experiments shown in Figures 6 and 7A–D were performed in the absence of RNase treatment; this information was inadvertently omitted and will be added to the Methods section and the relevant figure legends. To directly assess whether the observed interactions are RNA-dependent, we will repeat the key co-immunoprecipitation experiments in the presence of RNase treatment and include these results in the revised manuscript.
(b) Also, the authors claim that FRG1 is a "structural component" of EJC and NMD complexes seems to be an overinterpretation. As noted in the previous comment, these interactions could be mediated by a connecting RNA molecule.
We thank the reviewer for this insightful comment. As noted, previous studies have suggested that FRG1 interacts with components of the EJC and NMD machinery. Specifically, Bertram et al. (6) identified FRG1 as a component of the spliceosomal C complex via Cryo-EM structural analysis, and pull-down studies have shown direct interaction between FRG1 and ROD1, a known EJC component (7). These findings support a protein-protein interaction rather than one mediated solely by RNA. To further address the reviewer’s concern, we will perform key co-immunoprecipitation experiments in the presence of RNase treatment to distinguish RNA-dependent from RNA-independent interactions.
(c) A negative control (non-precipitating protein) is missing in Figure 7 co-IP experiments.
We agree that including a non-precipitating protein as a negative control is important, and we will perform the co-IP experiment incorporating this control.
(d) Polysome analysis is missing important controls. FRG1 and EIF4A3 co-sedimentation with polysomes could simply be due to their association with another large complex (e.g., spliceosome), which will also co-sediment in these gradients. This possibility can at least be tested by Western blotting for some spliceosome components across the gradient fractions. More importantly, a puromycin treatment control needs to be performed to confirm that FRG1 and EIF4A3 are indeed bound to polysomes, which are separated into ribosome subunits upon puromycin treatment. This leads to a shift of the signal for ribosomal proteins and any polysome-associated proteins to the left.
As recommended, we will examine the distribution of a spliceosome component across the gradient fractions to assess potential co-sedimentation. Additionally, we will perform a puromycin treatment control to confirm that FRG1 and EIF4A3 are genuinely associated with polysomes.
Reviewer #2 (Public review):
Summary:
In this manuscript, Palo et al present a novel role for FRG1 as a multifaceted regulator of nonsense-mediated mRNA decay (NMD). Through a combination of reporter assays, transcriptome-wide analyses, genetic models, protein-protein interaction studies, ubiquitination assays, and ribosome-associated complex analyses, the authors propose that FRG1 acts as a negative regulator of NMD by destabilizing UPF1 and associating with spliceosomal, EJC, and translation-related complexes. Overall, the data, while consistent with the authors' central conclusions, are undermined by several claims-particularly regarding structural roles and mechanistic exclusivity. To really make the claims presented, further experimental evidence would be required.
Strengths:
(1) The integration of multiple experimental systems (zebrafish and cell culture).
(2) Attempts to go into a mechanistic understanding of the relationship between FGR1 and UPF1.
Weaknesses:
(1) Overstatement of FRG1 as a structural NMD component.
Although FRG1 interacts with UPF1, eIF4A3, PRP8, and CWC22, core spliceosomal and EJC interactions (PRP8-CWC22 and eIF4A3-UPF3B) remain intact in FRG1-deficient cells. This suggests that, while FRG1 associates with these complexes, this interaction is not required for their assembly or structural stability. Without further functional or reconstitution experiments, the presented data are more consistent with an interpretation of FRG1 acting as a regulatory or accessory factor rather than a core structural component.
We thank the reviewer for this clarification. We would like to emphasize that we do not claim FRG1 to be a core structural component of either the spliceosome or the EJC. Consistent with the reviewer’s interpretation, our data indicate that FRG1 deficiency does not disrupt the structural integrity of these complexes. Our intended conclusion is that FRG1 functions as a regulatory or accessory factor in NMD rather than being required for complex assembly or stability. We will carefully revise the manuscript to remove any language that could be interpreted as an overstatement. In addition, we are currently performing further experiments to better define the association of FRG1 with the EJC.
(2) Causality between UPF1 depletion and NMD inhibition is not fully established.
While reduced UPF1 levels provide a plausible explanation for decreased NMD efficiency, the manuscript does not conclusively demonstrate that UPF1 depletion drives all observed effects. Given FRG1's known roles in transcription, splicing, and RNA metabolism, alterations in transcript isoform composition and apparent NMD sensitivity may arise from mechanisms independent of UPF1 abundance. To directly link UPF1 depletion to altered NMD efficiency, rescue experiments testing whether UPF1 re-expression restores NMD activity in FRG1-overexpressing cells would be important.
As suggested, to directly test causality, we will perform rescue experiments to determine whether UPF1 re-expression restores NMD activity in FRG1-overexpressing MCF7 cells.
(3) Mechanism of FRG1-mediated UPF1 ubiquitination requires clarification.
The ubiquitination assays support a role for FRG1 in promoting UPF1 degradation; however, the mechanism underlying this remains unexplored. The relationship between FRG1-UPF1 what role FRG1 plays in this is unclear (does it function as an adaptor, recruits an E3 ubiquitin ligase, or influences UPF1 ubiquitination indirectly through transcriptional or signaling pathways?).
We agree with the reviewer that the precise mechanism by which FRG1 promotes UPF1 ubiquitination remains to be defined. Our ubiquitination assays support a role for FRG1 in facilitating UPF1 degradation; however, whether FRG1 functions directly as an adaptor or E3 ligase, or instead influences UPF1 stability indirectly, is currently unclear. Notably, a prior study by Geng et al. reported that DUX4 expression alters the expression of numerous genes involved in protein ubiquitination, including multiple E3 ubiquitin ligases (9), and FRG1 itself has been reported to be upregulated upon DUX4 expression in muscle cells. We will expand the Discussion to address these potential mechanisms and place our findings in the context of indirect transcriptional or signaling pathways that may regulate UPF1 proteolysis. A detailed mechanistic dissection of FRG1-mediated ubiquitination is beyond the scope of the present study.
(4) Limited transcriptome-wide interpretation of RNA-seq data.
Although the RNA-seq data analysis relies heavily on a small subset of "top 10" genes. Additionally, the criteria used to define NMD-sensitive isoforms are unclear. A more comprehensive transcriptome-wide summary-indicating how many NMD-sensitive isoforms are detected and how many are significantly altered-would substantially strengthen the analysis.
We thank the reviewer for this comment and agree that the current presentation may place a disproportionate emphasis on a limited subset of genes. These genes were selected as illustrative examples from an isoform-level analysis performed using IsoformSwitchAnalyzeR (ISAR) (10); however, we acknowledge that this approach does not fully convey the transcriptome-wide scope of the analysis.
Using quantified RNA-seq data, ISAR was employed to identify significant isoform switches and transcripts predicted to be NMD-sensitive. Isoforms were annotated using GENCODE v47, and NMD sensitivity was assigned based on the established 50-nucleotide rule, as described in the Materials and Methods. To address the reviewer’s concern, we will revise the Results section to include a transcriptome-wide summary derived from the ISAR analysis.
(5) Clarification of NMD sensor assay interpretation.
The logic underlying the NMD sensor assay should be explained more clearly early in the manuscript, as the inverse relationship between luciferase signal and NMD efficiency may be counterintuitive to readers unfamiliar with this reporter system. Inclusion of a schematic or brief explanatory diagram would improve accessibility.
We agree with the reviewer and would provide a schematic as well as the experimental setup diagram to improve accessibility to the readers.
(6) Potential confounding effects of high MG132 concentration.
The MG132 concentration used (50 µM) is relatively high and may induce broad cellular stress responses, including inhibition of global translation (its known that proteosome inhibition shuts down translation). Controls addressing these secondary effects would strengthen the conclusion that UPF1 stabilization specifically reflects proteasome-dependent degradation would be essential.
We acknowledge the reviewer’s concern regarding the relatively high concentration of MG132 used in this study. While proteasome inhibition can indeed induce global translation inhibition, our interpretation is based on the specific stabilization of UPF1 observed under these conditions. Since inhibition of global translation would generally reduce protein levels rather than cause selective accumulation, the observed increase in UPF1 is unlikely to result from translational effects. To address this point, we plan to repeat selected experiments using a lower MG132 concentration to further confirm that UPF1 stabilization reflects proteasome-dependent degradation.
(7) Interpretation of polysome co-sedimentation data.
While the co-sedimentation of FRG1 with polysomes is intriguing, this approach does not distinguish between direct ribosomal association and co-migration with ribosome-associated complexes. This limitation should be explicitly acknowledged in the interpretation.
We acknowledge that polysome co-sedimentation alone cannot definitively distinguish between direct ribosomal binding and co-migration with ribosome-associated complexes. Importantly, our interpretation does not rely solely on this assay; when combined with co-immunoprecipitation and proximity ligation assay results, the data consistently support an association of FRG1 with the exon junction complex. We are also conducting additional experiments with appropriate controls to further validate the specificity of FRG1’s association with ribosomes and to address the possibility of nonspecific co-migration.
(8) Limitations of PLA-based interaction evidence.
The PLA data convincingly demonstrate close spatial proximity between FRG1 and eIF4A3; however, PLA does not provide definitive evidence of direct interaction and is known to be susceptible to artefacts. Moreover, a distance threshold of ~40 nm still allows for proteins to be in proximity without being part of the same complex. These limitations should be clearly acknowledged, and conclusions should be framed accordingly.
We thank the reviewer for highlighting this important point. We agree that PLA indicates close spatial proximity but does not constitute definitive evidence of direct interaction and can be susceptible to artefacts. We will explicitly acknowledge this limitation in the revised manuscript. Importantly, our conclusions are not solely based on PLA data; they are supported by complementary co-immunoprecipitation and polysome co-sedimentation assays, which provide biochemical evidence consistent with an association between FRG1 and eIF4A3.
Reviewer #3 (Public review):
The manuscript by Palo and colleagues demonstrates identification of FRG1 as a novel regulator of nonsense-mediated mRNA decay (NMD), showing that FRG1 inversely modulates NMD efficiency by controlling UPF1 abundance. Using cell-based models and a frg1 knockout zebrafish, the authors show that FRG1 promotes UPF1 ubiquitination and proteasomal degradation, independently of DUX4. The work further positions FRG1 as a structural component of the spliceosome and exon junction complex without compromising its integrity. Overall, the manuscript provides mechanistic insight into FRG1-mediated post-transcriptional regulation and expands understanding of NMD homeostasis. The authors should address the following issues to improve the quality of their manuscript.
(1) Figure 7A-D, appropriate positive controls for the nuclear fraction (e.g., Histone H3) and the cytoplasmic fraction (e.g., GAPDH or α-tubulin) should be included to validate the efficiency and purity of the subcellular fractionation.
We thank the reviewer for the suggestion. We will include appropriate positive controls for the nuclear fraction (Histone H3) and the cytoplasmic fraction (GAPDH or α-tubulin) in Figure 7A–D to validate the efficiency and purity of the subcellular fractionation.
(2) To strengthen the conclusion that FRG1 broadly impacts the NMD pathway, qRT-PCR analysis of additional core NMD factors (beyond UPF1) in the frg1⁻/⁻ zebrafish at 48 hpf would be informative.
We appreciate the reviewer’s insightful comment. We will perform qRT-PCR analysis of additional core NMD factors in the frg1⁻/⁻ zebrafish at 48 hpf to further strengthen the conclusion that FRG1 broadly impacts the NMD pathway.
(3) Figure labels should be standardized throughout the manuscript (e.g., consistent use of "Ex" instead of mixed terms such as "Oex") to improve clarity and readability.
We thank the reviewer for noticing the inconsistency. We will ensure that all figure labels are standardized throughout the manuscript (e.g., using “Ex” consistently) to improve clarity and readability.
(4) The methods describing the generation of the frg1 knockout zebrafish could be expanded to include additional detail, and a schematic illustrating the CRISPR design, genotyping workflow, and validation strategy would enhance transparency and reproducibility.
We appreciate the reviewer’s suggestion and will expand the Methods section to provide additional detail on the generation of the frg1 knockout zebrafish. A schematic illustrating the CRISPR design, genotyping workflow, and validation strategy will also be included to enhance transparency and reproducibility.
(5) As FRG1 is a well-established tumor suppressor, additional cell-based functional assays under combined FRG1 and UPF1 perturbation (e.g., proliferation, migration, or survival assays) could help determine whether FRG1 influences cancer-associated phenotypes through modulation of the NMD pathway.
We thank the reviewer for this thoughtful and constructive suggestion. While FRG1 is indeed a well-established tumor suppressor, incorporating additional cell-based functional assays under combined FRG1 and UPF1 perturbation would significantly broaden the scope of the current study. The present work is focused on elucidating the molecular relationship between FRG1 and the NMD pathway. Investigation of downstream cancer-associated phenotypes represents an important and interesting direction for future studies, but is beyond the scope of the current manuscript.
(6) Given the claim that FRG1 inversely regulates NMD efficacy via UPF1, an epistasis experiment such as UPF1 overexpression in an FRG1-overexpressing background followed by an NMD reporter assay would provide stronger functional validation of pathway hierarchy.
We agree with the reviewer’s suggestion. To strengthen the functional validation of the proposed pathway hierarchy, we will perform an epistasis experiment by overexpressing UPF1 in an FRG1-overexpressing background and assess NMD activity using an established NMD reporter assay. The results of this experiment will be included in the revised manuscript.
References
(1) Palo A, Patel SA, Shubhanjali S, Dixit M. Dynamic interplay of Sp1, YY1, and DUX4 in regulating FRG1 transcription with intricate balance. Biochim Biophys Acta Mol Basis Dis. 2025 Mar;1871(3):167636.
(2) Sato H, Singer RH. Cellular variability of nonsense-mediated mRNA decay. Nat Commun. 2021 Dec 10;12(1):7203.
(3) Baird TD, Cheng KCC, Chen YC, Buehler E, Martin SE, Inglese J, et al. ICE1 promotes the link between splicing and nonsense-mediated mRNA decay. eLife. 2018 Mar 12;7:e33178.
(4) Chu V, Feng Q, Lim Y, Shao S. Selective destabilization of polypeptides synthesized from NMD-targeted transcripts. Mol Biol Cell. 2021 Dec 1;32(22):ar38.
(5) Udy DB, Bradley RK. Nonsense-mediated mRNA decay uses complementary mechanisms to suppress mRNA and protein accumulation. Life Sci Alliance. 2022 Mar;5(3):e202101217.
(6) Bertram K, El Ayoubi L, Dybkov O, Agafonov DE, Will CL, Hartmuth K, et al. Structural Insights into the Roles of Metazoan-Specific Splicing Factors in the Human Step 1 Spliceosome. Mol Cell. 2020 Oct 1;80(1):127-139.e6.
(7) Brazão TF, Demmers J, van IJcken W, Strouboulis J, Fornerod M, Romão L, et al. A new function of ROD1 in nonsense-mediated mRNA decay. FEBS Lett. 2012 Apr 24;586(8):1101–10.
(8) Sun CYJ, van Koningsbruggen S, Long SW, Straasheijm K, Klooster R, Jones TI, et al. Facioscapulohumeral muscular dystrophy region gene 1 is a dynamic RNA-associated and actin-bundling protein. J Mol Biol. 2011 Aug 12;411(2):397–416.
(9) Geng LN, Yao Z, Snider L, Fong AP, Cech JN, Young JM, et al. DUX4 activates germline genes, retroelements, and immune mediators: implications for facioscapulohumeral dystrophy. Dev Cell. 2012 Jan 17;22(1):38–51.
(10) Vitting-Seerup K, Sandelin A. The Landscape of Isoform Switches in Human Cancers. Mol Cancer Res MCR. 2017 Sep;15(9):1206–20.
eLife Assessment
This study presents a valuable finding on maternal SETDB1 as a key chromatin repressor that shuts down the 2C gene program and enables normal mouse embryonic development. The evidence supporting the claims of the authors is solid, although the inclusion of a causality test, a mechanistic understanding of SETDB1 targeting, and phenotypic quantification would have greatly strengthened the study. The work will be of broad interest to biologists working on embryonic development, stem cells and gene regulation.
Reviewer #1 (Public review):
Summary:
During the earliest stages of mouse development, the zygote and 2-cell (2C) embryo are totipotent, capable of generating all embryonic and extra-embryonic lineages, and they transiently express a distinctive set of "2C-stage" genes, many driven by MERVL long terminal repeat (LTR) promoters. Although activation of these transcripts is a normal feature of totipotency, they must be rapidly silenced as development proceeds to the 4-cell and 8-cell stages; failure to shut down the 2C program results in developmental arrest. This study examines the role of maternal SETDB1, a histone H3K9 methyltransferase, in suppressing the 2C transcriptional network. Using an oocyte-specific conditional knockout that removes maternal Setdb1 while leaving the paternal allele intact, the authors demonstrate that embryos lacking maternal SETDB1 arrest during cleavage, with very few progressing beyond the 8-cell stage and no morphologically normal blastocysts forming. Transcriptomic analyses reveal persistent expression of MERVL-LTR-driven transcripts and other totipotency markers, indicating a failure to terminate the totipotent state. Together, the data demonstrate that maternally deposited SETDB1 is required to silence the MERVL-driven 2C program and enable the transition from totipotency to pluripotency. More broadly, the work identifies maternal SETDB1 as a key chromatin repressor that deposits repressive H3K9 methylation to shut down the transient 2C gene network and to permit normal preimplantation development.
Strengths:
(1) Closes a key knowledge gap.
The study tackles a central open question - how embryos exit the totipotent 2-cell (2C) state - and provides direct in vivo evidence that epigenetic repression is required to terminate the 2C program for development to proceed. By identifying maternal SETDB1 as the responsible factor, the work substantially advances our understanding of the maternal-to-zygotic transition and early lineage specification.
(2) Clean genetics paired with rigorous genomics.
An oocyte-specific Setdb1 knockout cleanly isolates a maternal-effect requirement, ensuring that early phenotypes arise from loss of maternal protein. The resulting cleavage-stage arrest is unambiguous (most embryos stall before or around the 8-cell stage). State-of-the-art single-embryo RNA-seq across stages - well-matched to low-cell-number constraints - captures genome-wide mis-expression, including persistent 2C transcripts in mutants, strongly supporting the conclusions.
(3) Compelling molecular linkage to phenotype.
Transcriptome data show that without maternal SETDB1, embryos fail to repress a suite of 1-cell/2C-specific genes by the 8-cell stage. The tight correlation between continued activation of the MERVL-driven totipotency network and developmental arrest provides a specific molecular explanation for the observed failure to progress.
(4) Mechanistic insight grounded in chromatin biology.
SETDB1, a H3K9 methyltransferase classically linked to heterochromatin and transposon repression, targets MERVL LTRs and MERVL-driven chimeric transcripts in early embryos. Bioinformatic evidence indicates that these loci normally acquire H3K9me3 during the 2C→4C transition. The data articulate a coherent mechanism: maternal SETDB1 deposits repressive H3K9me3 at 2C gene loci to shut down the totipotency network, extending observations from ESC systems to bona fide embryos.
(5) Broad implications for development and stem-cell biology.
By pinpointing a maternal gatekeeper of the totipotent-to-pluripotent transition, the work suggests that some cases of cleavage-stage arrest (e.g., in IVF) may reflect faulty epigenetic silencing of transposon-driven genes. It also informs stem-cell efforts to control totipotent-like states in vitro (e.g., 2C-like cells), linking epigenetic reprogramming, transposable-element regulation, and developmental potency.
Weaknesses:
(1) Causality not directly demonstrated.
The link among loss of SETDB1, persistence of 2C transcripts, and developmental arrest is compelling but remains correlative. No rescue experiments test whether dampening the 2C/MERVL program restores development. Targeted interventions-e.g., knocking down key 2C drivers (such as Dux) or pharmacologically curbing MERVL-linked transcription in maternal Setdb1 mutants-would strengthen the claim that unchecked 2C activity is causal rather than a by-product of other SETDB1 functions.
(2) Limited mechanistic resolution of SETDB1 targeting.
The study establishes a requirement for maternal SETDB1 but does not define how it is recruited to MERVL loci. Given SETDB1's canonical cooperation with TRIM28/KAP1 and KRAB-ZNFs, upstream sequence-specific factors and/or pre-existing chromatin features likely guide targeting. Direct occupancy and mark-placement evidence (e.g., SETDB1/TRIM28 CUT&RUN or ChIP, and H3K9me3 profiling at MERVL LTRs during the 2C→4C window) would convert inferred mechanisms into demonstrated ones.
(3) Narrow scope on MERVL; broader epigenomic consequences underexplored.
Maternal SETDB1 may restrain additional repeat classes or genes beyond the 2C network. A systematic repeatome analysis (LINEs/SINEs/ERV subfamilies) would clarify specificity versus a general loss of heterochromatin control. Moreover, potential effects on imprinting or DNA methylation balance are not examined; perturbations there could also contribute to arrest. Bisulfite-based DNA methylation maps at imprinted loci and allele-specific expression analyses would help rule in/out these mechanisms.
(4) Phenotype quantitation and transcriptomic breadth could be clearer.
The developmental phenotype is described qualitatively ("very few beyond 8-cell") without precise stage-wise arrest rates or representative morphology. Tabulated counts (2C/4C/8C/blastocyst), images, and statistics would increase clarity. On the RNA-seq side, the narrative emphasizes known 2C markers; reporting novel/unannotated misregulated transcripts, as well as downregulated pathways (e.g., failure to activate normal 8-cell programs, metabolism, or early lineage markers), would present a fuller portrait of the mutant state.
Reviewer #2 (Public review):
Zeng et al. report that Setdb1-/- embryos fail to extinguish the 1- and 2-cell embryo transcriptional program and have permanent expression of MERVL transposable elements. The manuscript is technically sound and well performed, but, in my opinion, the results lack conceptual novelty.
(1) The manuscript builds on previous observations that: 1, Setbd1 is necessary for early mouse development, with knockout embryos rarely reaching the 8-cell stage; 2, SETB1 mediates H3K9me3 deposition at transposable elements in mouse ESCs; 3, SETB1silences MERVLs to prevent 2CLC-state acquisition in mouse ESCs. The strength of the current work is the demonstration that this is not due to a general transcriptional collapse; but otherwise, the findings are not surprising. The well-known (several Nature papers of years ago) crosstalk between m6A RNA modification and H3K9me3 in preventing 2CLC generation also partly compromises the novelty of this work.
(2) The conclusions regarding H3K9me3 deposition are inferred based on previously reported datasets, but there is no direct demonstration.
(3) The detection of chimeric transcripts is somewhat unreliable using short-read sequencing.
Author response:
eLife Assessment
This study presents a valuable finding on maternal SETDB1 as a key chromatin repressor that shuts down the 2C gene program and enables normal mouse embryonic development. The evidence supporting the claims of the authors is solid, although the inclusion of a causality test, a mechanistic understanding of SETDB1 targeting, and phenotypic quantification would have greatly strengthened the study. The work will be of broad interest to biologists working on embryonic development, stem cells and gene regulation.
Thank you for this positive evaluation of our work. Please find the point-by point responses to the Reviewer’s comments below.
Public Reviews:
Reviewer #1 (Public review):
Summary:
During the earliest stages of mouse development, the zygote and 2-cell (2C) embryo are totipotent, capable of generating all embryonic and extra-embryonic lineages, and they transiently express a distinctive set of "2C-stage" genes, many driven by MERVL long terminal repeat (LTR) promoters. Although activation of these transcripts is a normal feature of totipotency, they must be rapidly silenced as development proceeds to the 4-cell and 8-cell stages; failure to shut down the 2C program results in developmental arrest. This study examines the role of maternal SETDB1, a histone H3K9 methyltransferase, in suppressing the 2C transcriptional network. Using an oocyte-specific conditional knockout that removes maternal Setdb1 while leaving the paternal allele intact, the authors demonstrate that embryos lacking maternal SETDB1 arrest during cleavage, with very few progressing beyond the 8-cell stage and no morphologically normal blastocysts forming. Transcriptomic analyses reveal persistent expression of MERVL-LTR-driven transcripts and other totipotency markers, indicating a failure to terminate the totipotent state. Together, the data demonstrate that maternally deposited SETDB1 is required to silence the MERVL-driven 2C program and enable the transition from totipotency to pluripotency. More broadly, the work identifies maternal SETDB1 as a key chromatin repressor that deposits repressive H3K9 methylation to shut down the transient 2C gene network and to permit normal preimplantation development.
Strengths:
(1) Closes a key knowledge gap.
The study tackles a central open question - how embryos exit the totipotent 2-cell (2C) state - and provides direct in vivo evidence that epigenetic repression is required to terminate the 2C program for development to proceed. By identifying maternal SETDB1 as the responsible factor, the work substantially advances our understanding of the maternal-to-zygotic transition and early lineage specification.
(2) Clean genetics paired with rigorous genomics.
An oocyte-specific Setdb1 knockout cleanly isolates a maternal-effect requirement, ensuring that early phenotypes arise from loss of maternal protein. The resulting cleavage-stage arrest is unambiguous (most embryos stall before or around the 8-cell stage). State-of-the-art single-embryo RNA-seq across stages - well-matched to low-cell-number constraints - captures genome-wide mis-expression, including persistent 2C transcripts in mutants, strongly supporting the conclusions.
(3) Compelling molecular linkage to phenotype.
Transcriptome data show that without maternal SETDB1, embryos fail to repress a suite of 1-cell/2C-specific genes by the 8-cell stage. The tight correlation between continued activation of the MERVL-driven totipotency network and developmental arrest provides a specific molecular explanation for the observed failure to progress.
(4) Mechanistic insight grounded in chromatin biology.
SETDB1, a H3K9 methyltransferase classically linked to heterochromatin and transposon repression, targets MERVL LTRs and MERVL-driven chimeric transcripts in early embryos. Bioinformatic evidence indicates that these loci normally acquire H3K9me3 during the 2C→4C transition. The data articulate a coherent mechanism: maternal SETDB1 deposits repressive H3K9me3 at 2C gene loci to shut down the totipotency network, extending observations from ESC systems to bona fide embryos.
(5) Broad implications for development and stem-cell biology.
By pinpointing a maternal gatekeeper of the totipotent-to-pluripotent transition, the work suggests that some cases of cleavage-stage arrest (e.g., in IVF) may reflect faulty epigenetic silencing of transposon-driven genes. It also informs stem-cell efforts to control totipotent-like states in vitro (e.g., 2C-like cells), linking epigenetic reprogramming, transposable-element regulation, and developmental potency.
We thank Reviewer 1 for recognizing the strengths in our work and for the suggestions below.
Weaknesses:
(1) Causality not directly demonstrated.
The link among loss of SETDB1, persistence of 2C transcripts, and developmental arrest is compelling but remains correlative. No rescue experiments test whether dampening the 2C/MERVL program restores development. Targeted interventions-e.g., knocking down key 2C drivers (such as Dux) or pharmacologically curbing MERVL-linked transcription in maternal Setdb1 mutants-would strengthen the claim that unchecked 2C activity is causal rather than a by-product of other SETDB1 functions.
We agree that rescue experiments might strengthen causality. Those experiments, however, would be extremely challenging technically because the knockdowns would need to be precisely timed to follow (and not prevent) the wave of 2c-specific activation. Knocking down 2c drivers in the zygote, for example, may prevent switching on the totipotency program. In addition, while sustained MERVL expression—such as that induced by forced DUX expression—disrupts totipotency exit and embryo development (1, 2), derepression of transcription is very broad in Setdb1<sup>mat-/+</sup> embryos and knocking down individual 2C drivers may not be sufficient to rescue development or restore the exit from totipotency.
(2) Limited mechanistic resolution of SETDB1 targeting.
The study establishes a requirement for maternal SETDB1 but does not define how it is recruited to MERVL loci. Given SETDB1's canonical cooperation with TRIM28/KAP1 and KRAB-ZNFs, upstream sequence-specific factors and/or pre-existing chromatin features likely guide targeting. Direct occupancy and mark-placement evidence (e.g., SETDB1/TRIM28 CUT&RUN or ChIP, and H3K9me3 profiling at MERVL LTRs during the 2C→4C window) would convert inferred mechanisms into demonstrated ones.
We do show H3K9me3 patterns at MERVL LTRs during the early2c-late2c-2c-4c-8c-morula window from a published dataset. Please see the genome browser images in Figures 4C, 4D, 4E, 6D, 6E and Figure S6. We agree that mapping of SETDB1/TRIM28 to those locations would strengthen the mechanistic insight. However, ChIPseq or CUT&RUN of those proteins in preimplantation embryos are not technically feasible. We do provide genetic evidence for the collaboration between SETDB1 and DUXBL, a DNA-binding factor, by showing that DUXBL cannot switch off its top targets without SETDB1 (Figure 6). Future studies will characterize the molecular mechanisms underlying this (likely indirect) collaboration. We do not think that DUXBL and SETDB1 directly interact, because such interaction was not detected by DUXBL IP-MS (3).
(3) Narrow scope on MERVL; broader epigenomic consequences underexplored.
Maternal SETDB1 may restrain additional repeat classes or genes beyond the 2C network. A systematic repeatome analysis (LINEs/SINEs/ERV subfamilies) would clarify specificity versus a general loss of heterochromatin control. Moreover, potential effects on imprinting or DNA methylation balance are not examined; perturbations there could also contribute to arrest. Bisulfite-based DNA methylation maps at imprinted loci and allele-specific expression analyses would help rule in/out these mechanisms.
We did examine genes and repeat elements beyond the 2c network. We evaluated gene and TE expression changes using four-way comparisons. Please find the results regarding gene expression in Figure 1C-J, Figure S2, Figure S3, Figure S4., Table S2, Table S3, and Table S4. Please find results on TE expression in Figure S5. Table S6, Table S7, and Table S8 and in the text. We agree that DNA methylation may be altered in Setdb1<sup>mat-/+</sup> embryos. In our hands, evaluating this possibility using bisulfite sequencing requires a larger number of embryos than what we can feasibly obtain (the number of obtained mutant embryos is very small). Regarding imprinted gene expression, one cannot fully assess and interpret imprinted gene expression in preimplantation stage embryos before the maternally deposited transcripts are gone. We reported earlier that clear somatic parental-specific patterns of imprinted gene expression may only start later in development, around 8.5 dpc (4).
(4) Phenotype quantitation and transcriptomic breadth could be clearer.
The developmental phenotype is described qualitatively ("very few beyond 8-cell") without precise stage-wise arrest rates or representative morphology. Tabulated counts (2C/4C/8C/blastocyst), images, and statistics would increase clarity. On the RNA-seq side, the narrative emphasizes known 2C markers; reporting novel/unannotated misregulated transcripts, as well as downregulated pathways (e.g., failure to activate normal 8-cell programs, metabolism, or early lineage markers), would present a fuller portrait of the mutant state.
Tabulated counts are displayed in Figure 1A, and morphology is shown in Figure S1A. We do say that 4% Setdb1<sup>mat-/+</sup> embryos reached the 8-cel stage by 2.5 dpc. We recovered zero Setdb1<sup>mat-/+</sup> blastocysts at 4.5 dpc (not shown). On the RNA-seq side we do report a more global assessment of transcription of genes and TEs (please see above at point 3), including novel chimeric transcripts (Table S6). Developmental pathways are shown in Figure S3 and Figure S4. Metabolic pathways are displayed in Figure S2.
Reviewer #2 (Public review):
Zeng et al. report that Setdb1-/- embryos fail to extinguish the 1- and 2-cell embryo transcriptional program and have permanent expression of MERVL transposable elements. The manuscript is technically sound and well performed, but, in my opinion, the results lack conceptual novelty.
(1) The manuscript builds on previous observations that: 1, Setbd1 is necessary for early mouse development, with knockout embryos rarely reaching the 8-cell stage; 2, SETB1 mediates H3K9me3 deposition at transposable elements in mouse ESCs; 3, SETB1silences MERVLs to prevent 2CLC-state acquisition in mouse ESCs. The strength of the current work is the demonstration that this is not due to a general transcriptional collapse; but otherwise, the findings are not surprising. The well-known (several Nature papers of years ago) crosstalk between m6A RNA modification and H3K9me3 in preventing 2CLC generation also partly compromises the novelty of this work.
We thank the Reviewer for appreciating the technical quality of our work. Regarding novelty, please consider that prior work in ES cells included contradictory findings (please see our Introduction). Prior embryology work (please see our Introduction) did not explain the preimplantation-stage phenotype. We highly appreciate those earlier works. Our work here answers the expectations drawn from prior studies and unequivocally shows that SETDB1 carries out the developmentally essential function of suppressing MERVLs and the 2-cell program in the mouse embryo.
(2) The conclusions regarding H3K9me3 deposition are inferred based on previously reported datasets, but there is no direct demonstration.
Dynamic H3K9me3 deposition is displayed at MERVL LTRs during the early2c-late2c-2c-4c-8c-morula window (Figures 4C, 4D, 4E, 6D, 6E and Figure S6) from a published work that has very high-quality data. We agree that demonstrating loss off H3K9me3 in Setdb1<sup>mat-/+</sup> embryos would confirm that the H3K9me3 histone methyltransferase function of SETDB1 (as opposed to any, yet unidentified, non-HMT specific activity of SETDB1) is responsible for shutting down MERVL LTRs. However, ChIP-seq, CUT&RUN, or similar assays are not feasible due to the rarity of Setdb1<sup>mat-/+</sup> embryos.
(3) The detection of chimeric transcripts is somewhat unreliable using short-read sequencing.
We used single embryo total RNA-seq and we report detecting chimeric transcripts (Table S6), which is considered more reliable than mRNA-seq for detecting chimeric transcripts, because many are not polyadenylated. We acknowledge, however, that long-read sequencing, which recently is becoming available, but which is still very expensive, is currently the most powerful method for detecting chimeric transcripts. This, however, does not affect the major conclusions or the significance of our work.
eLife Assessment
This study presents a method for expressing single-stranded DNA fluorescent aptamers in E. coli using a retron-based strategy. The evidence supporting the successful expression and folding of DNA aptamers is solid, with clear demonstration of fluorescence after extraction, though the aptamers do not function in living cells. The method represents an important technical advance that will likely become standard for DNA aptamer expression in bacterial systems.
Reviewer #1 (Public review):
Summary:
The authors use an interesting expression system called a retron to express single-stranded DNA aptamers. Expressing DNA as a single-stranded sequence is very hard - DNA is naturally double stranded. However, the successful demonstration by the authors of expressing Lettuce, which is a fluorogenic DNA aptamer, allowed visual demonstration of both expression and folding, but only after extraction in cells, but not in vivo (possibly because of the low fluorescence of Lettuce, or perhaps more likely, some factor in cells preventing Lettuce fluorescence). This method will likely be the main method for expressing and testing DNA aptamers of all kinds, including fluorogenic aptamers like Lettuce and the future variants / alternatives.
Strengths:
This has an overall simplicity which will lead to ready adoption. I am very excited about this work. People will be able to express other fluorogenic aptamers or DNA aptamers tagged with Lettuce with this system.
Weaknesses:
Some things could be addressed/shown in more detail, e.g. half-lives of different types of DNA aptamers and ways to extend this to mammalian cells.
Reviewer #2 (Public review):
Summary:
This manuscript explores a DNA fluorescent light up aptamer (FLAP) with the specific goal of comparing activity in vitro to that in bacterial cells. In order to achieve expression in bacteria, the authors devise an expression strategy based on retrons and test four different constructs with the aptamer inserted at different points in the retron scaffold.
The initial version of this manuscript made several claims about the fluorescence activity of the aptamers in cells, and the observed fluorescence signal has now been found to result from cellular auto-fluorescence. Thus, all data regarding the function of the aptamers in cells have been removed.
Negative data are important to the field, especially when it comes to research tools that may not work as many people think that they will. Thus, there would have been an opportunity here for the authors to dig into why the aptamers don't seem to work in cells.
In the absence of insight into the negative result, the manuscript is now essentially a method for producing aptamers in cells. If this is the main thrust, then it would be beneficial for the authors to clearly outline why this is superior to other approaches for synthesizing aptamers.
Author response:
The following is the authors’ response to the original reviews
Comment to both reviewers:
We are very grateful for the thoughtful and constructive comments from both reviewers. During the revision, and in direct response to these comments, we performed additional control experiments for the cellular fluorescence measurements. These new data revealed that the weak increase in green fluorescence reported in our original submission does not depend on retron-expressed Lettuce RT-DNA or the DFHBI-1T fluorophore, but instead reflects stress-induced autofluorescence of E. coli (e.g. upon inducer and antibiotic treatment).
We also benchmarked the fluorogenic properties of Lettuce against the RNA FLAP Broccoli and found that Lettuce is ~100-fold less fluorogenic under optimal in vitro conditions. Consequently, with the currently available, in vitro- but not in vivo-optimized Lettuce variants, intracellular fluorescence cannot be reliably detected by microscopy or flow cytometry. We have therefore removed the original flow cytometry / and in-culture-fluorescence data and no longer claim detectable intracellular Lettuce fluorescence.
In the revised manuscript, we now directly demonstrate that retron-produced Lettuce RT-DNA can be purified from cells and remains functional ex vivo with a gel-based fluorophore-binding assays. Together, these data clarify the current limitations of DNA-based FLAPs for in vivo imaging, while still establishing retrons as a viable platform for intracellular production of functional DNA aptamers.
Reviewer #1 (Public Review):
Summary:
The authors use an interesting expression system called a retron to express single-stranded DNA aptamers. Expressing DNA as a single-stranded sequence is very hard - DNA is naturally double-stranded. However, the successful demonstration by the authors of expressing Lettuce, which is a fluorogenic DNA aptamer, allowed visual demonstration of both expression and folding. This method will likely be the main method for expressing and testing DNA aptamers of all kinds, including fluorogenic aptamers like Lettuce and future variants/alternatives.
Strengths:
This has an overall simplicity which will lead to ready adoption. I am very excited about this work. People will be able to express other fluorogenic aptamers or DNA aptamers tagged with Lettuce with this system.
We thank the reviewer for their thoughtful assessment and appreciate their encouraging remarks.
Weaknesses:
Several things are not addressed/shown:
(1) How stable are these DNA in cells? Half-life?
We thank the reviewer for this insightful question.
Retron RT-DNA forms a phage surveillance complex with the associated RT and effector protein[1-4]. Moreover, considering the unique ‘closed’ structure of RT-DNA[5] (with the ends of msr and msd bound either by 2’-5’ linkage and base paired region) and its noncoding function, we hypothesized that the RT-DNA must be exceptionally stable. Nevertheless, we attempted to determine half-life of the RT-DNA using qPCR for Eco2 RT-DNA. To this end, we designed an assay where we would first induce RT-DNA expression, use the induced cells to start a fresh culture without the inducers. We would then take aliquots from this fresh culture at different timepoints and determine RT-DNA abundance by qPCR.
We induced RT-DNA expression of retron Eco2 in BL21AI cells as described in the Methods. After overnight induction, cells were washed to remove IPTG and arabinose, diluted to OD<sub>600</sub> = 0.2 into fresh LB without inducers, and grown at 37°C. At the indicated time points, aliquots corresponding to OD<sub>600</sub> = 0.1 were boiled (95°C, 5 min), and 1 µL of the lysate was used as template in 20 µL qPCR reactions (see revised Methods for details).
Assuming RT-DNA degradation would occur by active degradation mechanisms (nuclease-mediated degradation) and dilution (cell growth and division), we determined the rate of degradation by the following equation
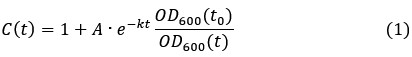
where is the degradation rate constant and the ratio  is the dilution factor which takes into account dilution by cell division. OD<sub>600</sub>(t) was determined by fitting the OD<sub>600</sub> measurements by the following the equation describing logistic growth:
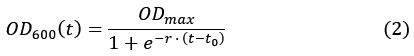
Which yields the plots shown in Figure 2–figure supplement 1.
After substituting OD<sub>600</sub>(t) by the function in equation (2), we fit the experimental data for the fold-change of the RT-DNA to equation (1). Interestingly, the best fit (red) was obtained with a converging towards zero suggesting that the half-life of the RT-DNA is beyond the detection limit of our assay. To showcase typical half-lives of RNA, which are in the range of minutes in growing E. coli cells[6], we refitted the data using constant half-life of 15 and 30 minutes. In both cases, simulated curve deviated significantly from the experimental data further confirming that the half-life of the RT-DNA is probably orders of magnitude higher than the doubling time of E. coli under these optimal conditions. While we cannot exclude that the RT-DNA is still produced as a result of promotor leakiness, but we expect this effect to be low as the expression of RT-DNA in E. coli AI cells requires both the presence of IPGT and arabinose, which were thoroughly removed before inoculating the growth media with the starter culture. Overall, our data therefore argues for an exceptional stability of the RT-DNA in growing bacterial cells.
We have now included this new experimental data in the supplementary information.
(2) What concentration do they achieve in cells/copy numbers? This is important since it relates to the total fluorescence output and, if the aptamer is meant to bind a protein, it will reveal if the copy number is sufficient to stoichiometrically bind target proteins. Perhaps the gels could have standards with known amounts in order to get exact amounts of aptamer expression per cell?
The copy number of RT-DNA can be estimated based on the qPCR experiments. We use a pET28a plasmid, which is low-copy with typical copy number 15-20 per cell[7]. We determined the abundance of RT-DNA over plasmid/RT-DNA, upon induction, to be 8-fold, thereby indicating copy number of Eco2 RT-DNA to be roughly around 100-200. Assuming an average aqueous volume of E. coli of 1 femtoliter[6], the concentration of RT-DNA is ~250-500 nM. We have added this information to the revised version of the manuscript.
(3) Microscopic images of the fluorescent E. coli - why are these not shown (unless I missed them)? It would be good to see that cells are fluorescent rather than just showing flow sorting data.
In the original submission, we used flow cytometry as an orthogonal method to quantify the fluorescence output of intracellularly expressed Lettuce aptamer, anticipating that it would provide high-throughput, quantitative information on a large population of cells. During the revision, additional controls revealed that the weak increase in fluorescence we had previously attributed to Lettuce expression was in fact a stress-induced autofluorescence signal that occurred independently of retron RT-DNA and DFHBI-1T. We have therefore removed these data from the manuscript and no longer claim detectable intracellular Lettuce fluorescence.
To understand this limitation, we compared the in vitro fluorescence of Lettuce with that of the RNA FLAP Broccoli, which is commonly used for RNA live-cell imaging. Under optimal in vitro conditions, Lettuce shows ~100-fold lower fluorescence output than Broccoli (new Figure 3–figure supplement 5). Given this poor fluorogenicity and the low intracellular concentration of retron RT-DNA (now derived from the qPCR experiments), we conclude that the current Lettuce variants are below the detection threshold for in vivo imaging in our system. We now explicitly discuss this limitation and the need for further (in vivo) evolution of DNA-based FLAPs in the revised manuscript.
(4) I would appreciate a better Figure 1 to show all the intermediate steps in the RNA processing, the subsequent beginning of the RT step, and then the final production of the ssDNA. I did not understand all the processing steps that lead to the final product, and the role of the 2'OH.
We thank the referee for this comment. We have now made changes to Figure 1, showing the intermediate steps as well as a better illustration of the 2’-5’ linkage.
(5) I would like a better understanding or a protocol for choosing insertion sites into MSD for other aptamers - people will need simple instructions.
We appreciate the reviewer for bringing up this important point. We simulated the ssDNA structure using Vienna RNA fold with DNA parameters. Based on the resulting structure, we inserted Lettuce sequence in the single stranded and/or loop regions to minimise interference with the native msd fold. We have now included this information in the description of Figure 3.
(6) Can the gels be stained with DFHBI/other dyes to see the Lettuce as has been done for fluorogenic RNAs?
Yes. We have now included experiments where we performed in-gel staining with DFHBI-1T for both chemically synthesized Eco2-Lettuce surrogates as well as the heterologously expressed Eco2-Lettuce RT-DNA. We have added this data to the revised Figure 3 (panel C and E).
(7) Sometimes FLAPs are called fluorogenic RNA aptamers - it might be good to mention both terms initially since some people use fluorogenic aptamer as their search term.
We thank the referee for this useful suggestion. We have now included both terms in the introduction of the revised version.
(8) What E coli strains are compatible with this retron system?
Experimental and bioinformatic analysis have shown that retrons abundance varies drastically across different strains of E. coli[8-10]. For example, in an experimental investigation of 113 independent clinical isolates of E. coli, only 7 strains contained RT-DNA[8]. In our experiments, we have found that BL21AI strain is compatible with plasmid-borne Eco2. The fact that this strain has a native retron system (Eco1) allowed us to use it as internal standard. However, we were also able express Eco2 RT-DNA in conventional lab strains such as E. coli Top 10 (data not shown), indicating both ncRNA and the RT alone are sufficient for intracellular RT-DNA synthesis.
(9) What steps would be needed to use in mammalian cells?
We appreciate the reviewer’s thoughtful inquiry. Expression of retrons has been demonstrated in mammalian cells by Mirochnitchenko et al[11] and Lopez et al[12]. For example, Lopez et al demonstrate expression of retrons in mammalian cell lines using the Lipofectamine 3000 transfection protocol (Invitrogen) and a PiggyBac transposase system[12]. We also mention this in the discussion section of the revised manuscript. Expression of retron-encoded DNA aptamers in mammalian cells should be possible with these systems.
(10) Is the conjugated RNA stable and does it degrade to leave just the DNA aptamer?
We are grateful to the reviewer for their perceptive question. This usually depends on the specific retron system. For example, in case of certain retron systems such as retron Sen2, Eco4 and Eco7, the RNA is cleaved off, leaving behind just the ssDNA. In our case, with retron Eco2, the RNA remains stably bound to the ssDNA, thereby maintaining a stable hybrid RNA-DNA structure[10,13]. During the extraction of RT-DNA, the conjugated RNA is degraded during the RNase digestion step, and therefore is not visible in the gel images.
Reviewer #2 (Public Review):
Summary:
This manuscript explores a DNA fluorescent light-up aptamer (FLAP) with the specific goal of comparing activity in vitro to that in bacterial cells. In order to achieve expression in bacteria, the authors devise an expression strategy based on retrons and test four different constructs with the aptamer inserted at different points in the retron scaffold. They only observe binding for one scaffold in vitro, but achieve fluorescence enhancement for all four scaffolds in bacterial cells. These results demonstrate that aptamer performance can be very different in these two contexts.
Strengths:
Given the importance of FLAPs for use in cellular imaging and the fact that these are typically evolved in vitro, understanding the difference in performance between a buffer and a cellular environment is an important research question.
The return strategy utilized by the authors is thoughtful and well-described.
The observation that some aptamers fail to show binding in vitro but do show enhancement in cells is interesting and surprising.
We appreciate the reviewer’s thorough assessment.
Weaknesses:
This study hints toward an interesting observation, but would benefit from greater depth to more fully understand this phenomenon. Particularly challenging is that FLAP performance is measured in vitro by affinity and in cells by enhancement, and these may not be directly proportional. For example, it may be that some constructs have much lower affinity but a greater enhancement and this is the explanation for the seemingly different performance.
We thank the reviewer for this insightful comment. In response, we conducted a series of additional control experiments to better understand the apparent discrepancy between the in vitro and in vivo data. These experiments revealed that the previously reported increase in intracellular green fluorescence is independent of retron-expressed Lettuce RT-DNA and DFHBI-1T, and instead reflects stress-induced autofluorescence of E. coli upon inducer and antibiotic treatment. Our original negative controls (empty wild-type Eco2, uninduced cells in the presence of DFHBI-1T) were therefore not sufficient to rule out this effect.
As a consequence, we have removed the earlier FACS data from the manuscript and no longer claim detectable intracellular Lettuce fluorescence. The reviewer’s comment prompted us to re-examine the fluorogenicity of our constructs in vitro. We found that the 4Lev4 construct folds poorly and produces very low signal in in-gel staining assays with DFHBI-1T. In contrast, the 8LE variant (8-nt P1 stem at position v4) shows the highest fluorescence in these in-gel assays (new Figure 3C). Nevertheless, even this construct remains 100-fold less fluorogenic than the RNA-based FLAP Broccoli (new Figure 3–figure supplement 5), and we were unable to detect its intracellular fluorescence above background (new Figure 3–figure supplement 4).
To still directly demonstrate that retron-embedded Lettuce domains that are synthesized under intracellular conditions are functional, we modified our strategy in the revision and purified the expressed RT-DNA from E. coli, followed by in-gel staining with DFHBI-1T (new Figure 3E). Despite the challenge of obtaining sufficient amounts of ssDNA, this ex vivo approach clearly shows that the retron-produced Lettuce RT-DNA retains fluorogenic activity.
The authors only test enhancement at one concentration of fluorophore in cells (and this experimental detail is difficult to find and would be helpful to include in the figure legend). This limits the conclusions that can be drawn from the data and limits utility for other researchers aiming to use these constructs.
We appreciate this excellent suggestion. In the original experiments, the DFHBI-1T concentration in cells was chosen based on published conditions for live-cell imaging of the Broccoli RNA aptamer[14], which is substantially more fluorogenic than Lettuce. Motivated by the reviewer’s comment, we explored different fluorophore concentrations and additional controls to optimize the in vivo readout. These experiments showed that the weak intracellular fluorescence signal is dominated by stress-induced autofluorescence[15] (possibly due to the weaker antitoxin activity of the modified msd) and does not depend on the presence of Lettuce RT-DNA or DFHBI-1T.
Given the combination of low Lettuce fluorogenicity and low intracellular RT-DNA levels, we concluded that varying the fluorophore concentration alone does not provide a meaningful way to deconvolute these confounding factors in cells. Instead, we shifted our focus to a more direct assessment of Lettuce activity: we now demonstrate that retron-produced Lettuce RT-DNA can be purified from E. coli and retains fluorogenic activity in an in-gel staining assay with DFHBI-1T (new Figure 3E). We believe this revised strategy provides a clearer and more quantitative characterization of the system’s capabilities and limitations than the initial in vivo fluorescence measurements.
The FLAP that is used seems to have a relatively low fluorescence enhancement of only 2-3 fold in cells. It would be interesting to know if this is also the case in vitro. This is lower than typical FLAPs and it would be helpful for the authors to comment on what level of enhancement is needed for the FLAP to be of practical use for cellular imaging.
In the revised manuscript, we directly address this point by comparing the in vitro fluorescence of Lettuce (DNA) and Broccoli (RNA) under optimized buffer conditions. These experiments show that Broccoli is nearly two orders of magnitude more fluorogenic than Lettuce (new Figure 3-figure supplement 5). Thus, the low enhancement observed for Lettuce in cells is consistent with its intrinsically poor fluorogenicity in vitro.
Based on this comparison and on reported properties of RNA FLAPs such as Broccoli, we conclude that robust cellular imaging typically requires substantially higher fluorogenicity and dynamic range than currently provided by DNA-based Lettuce. In other words, under our conditions, Lettuce is close to or below the practical detection limit for in vivo imaging, whereas Broccoli performs well. We now explicitly state in the Discussion that further evolution and optimization of DNA FLAPs will be required to achieve fluorescence enhancements that are suitable for routine cellular imaging, and we position our work as a first demonstration that functional DNA aptamers can be produced in cells via retrons, while also delineating the current sensitivity limits.
Recommendations for the authors:
Reviewer #1 (Recommendations For The Authors):
Addgene accession numbers are not listed - how is this plasmid obtained?
The sequence was obtained from Millman et al[16], and ordered as gblock from IDT. The gblock was then cloned into a pET28a vector by Gibson assembly. We have now included this in the methods section.
Reviewer #2 (Recommendations For The Authors):
Page 2, line 40 - FLAPS should be FLAPs
We have corrected this typo in the revised version.
References
(1) Rousset, F. & Sorek, R. The evolutionary success of regulated cell death in bacterial immunity. Curr. Opin. Microbiol. 74, 102312; 10.1016/j.mib.2023.102312 (2023).
(2) Gao, L. et al. Diverse enzymatic activities mediate antiviral immunity in prokaryotes. Science 369, 1077–1084; 10.1126/science.aba0372 (2020).
(3) Carabias, A. et al. Retron-Eco1 assembles NAD+-hydrolyzing filaments that provide immunity against bacteriophages. Mol. Cell 84, 2185-2202.e12; 10.1016/j.molcel.2024.05.001 (2024).
(4) Wang, Y. et al. DNA methylation activates retron Ec86 filaments for antiphage defense. Cell Rep. 43, 114857; 10.1016/j.celrep.2024.114857 (2024).
(5) Wang, Y. et al. Cryo-EM structures of Escherichia coli Ec86 retron complexes reveal architecture and defence mechanism. Nat. Microbiol. 7, 1480–1489; 10.1038/s41564-022-01197-7 (2022).
(6) Milo, R. & Phillips, R. Cell biology by the numbers (Garland Science Taylor & Francis Group, New York NY, 2016).
(7) Sathiamoorthy, S. & Shin, J. A. Boundaries of the origin of replication: creation of a pET-28a-derived vector with p15A copy control allowing compatible coexistence with pET vectors. PLOS ONE 7, e47259; 10.1371/journal.pone.0047259 (2012).
(8) Sun, J. et al. Extensive diversity of branched-RNA-linked multicopy single-stranded DNAs in clinical strains of Escherichia coli. Proc. Natl. Acad. Sci. U. S. A. 86, 7208–7212; 10.1073/pnas.86.18.7208 (1989).
(9) Rice, S. A. & Lampson, B. C. Bacterial reverse transcriptase and msDNA. Virus Genes 11, 95–104; 10.1007/BF01728651 (1995).
(10) Simon, A. J., Ellington, A. D. & Finkelstein, I. J. Retrons and their applications in genome engineering. Nucleic Acids Res. 47, 11007–11019; 10.1093/nar/gkz865 (2019).
(11) Mirochnitchenko, O., Inouye, S. & Inouye, M. Production of single-stranded DNA in mammalian cells by means of a bacterial retron. J. Biol. Chem. 269, 2380–2383; 10.1016/S0021-9258(17)41956-9 (1994).
(12) Lopez, S. C., Crawford, K. D., Lear, S. K., Bhattarai-Kline, S. & Shipman, S. L. Precise genome editing across kingdoms of life using retron-derived DNA. Nat. Chem. Biol. 18, 199–206; 10.1038/s41589-021-00927-y (2022).
(13) Lampson, B. C. et al. Reverse transcriptase in a clinical strain of Escherichia coli: production of branched RNA-linked msDNA. Science 243, 1033–1038; 10.1126/science.2466332 (1989).
(14) Filonov, G. S., Moon, J. D., Svensen, N. & Jaffrey, S. R. Broccoli: rapid selection of an RNA mimic of green fluorescent protein by fluorescence-based selection and directed evolution. J. Am. Chem. Soc. 136, 16299–16308; 10.1021/ja508478x (2014).
(15) Renggli Sabine, Keck Wolfgang, Jenal Urs & Ritz Daniel. Role of Autofluorescence in Flow Cytometric Analysis of Escherichia coli Treated with Bactericidal Antibiotics. J. Bacteriol. 195, 4067–4073; 10.1128/jb.00393-13. (2013).
(16) Millman, A. et al. Bacterial Retrons Function In Anti-Phage Defense. Cell 183, 1551-1561.e12; 10.1016/j.cell.2020.09.065 (2020).
eLife Assessment
This study offers important insights into how entorhinal and hippocampal activity support human thinking in feature spaces. It replicates hexagonal symmetry in entorhinal cortex, reports a novel three-fold symmetry in both behavior and hippocampal signals, and links these findings with a computational model. The task and analyses are sophisticated, and the results appear convincing and of broad interest to neuroscientists.
Reviewer #1 (Public review):
Summary:
Zhang and colleagues examine neural representations underlying abstract navigation in entorhinal cortex (EC) and hippocampus (HC) using fMRI. This paper replicates a previously identified hexagonal modulation of abstract navigation vectors in abstract space in EC in a novel task involving navigating in a conceptual Greeble space. In HC, the authors identify a three-fold signal of the navigation angle. They also use a novel analysis technique (spectral analysis) to look at spatial patterns in these two areas and identify phase coupling between HC and EC. Interestingly, the three-fold pattern identified in the hippocampus explains quirks in participants' behavior where navigation performance follows a three-fold periodicity. Finally, the authors propose a EC-HPC PhaseSync Model to understand how the EC and HC construct cognitive maps. The wide array and creativity of the techniques used is impressive but because of their unique nature, the paper would benefit from more details on how some of these techniques were implemented.
Reviewer #2 (Public review):
The authors report results from behavioral data, fMRI recordings, and computer simulations during a conceptual navigation task. They report 3-fold symmetry in behavioral and simulated model performance, 3-fold symmetry in hippocampal activity, and 6-fold symmetry in entorhinal activity (all as a function of movement directions in conceptual space). The analyses seem thoroughly done, and the results and simulations are very interesting.
[Editors' note: this version was assessed by the editors without consulting the reviewers further.]
Author response:
The following is the authors’ response to the previous reviews
Public Reviews:
Reviewer #1 (Public review):
Summary:
Zhang and colleagues examine neural representations underlying abstract navigation in entorhinal cortex (EC) and hippocampus (HC) using fMRI. This paper replicates a previously identified hexagonal modulation of abstract navigation vectors in abstract space in EC in a novel task involving navigating in a conceptual Greeble space. In HC, the authors identify a three-fold signal of the navigation angle. They also use a novel analysis technique (spectral analysis) to look at spatial patterns in these two areas and identify phase coupling between HC and EC. Interestingly, the three-fold pattern identified in the hippocampus explains quirks in participants' behavior where navigation performance follows a three-fold periodicity. Finally, the authors propose a EC-HPC PhaseSync Model to understand how the EC and HC construct cognitive maps. The wide array and creativity of the techniques used is impressive but because of their unique nature, the paper would benefit from more details on how some of these techniques were implemented.
Comments on revisions:
Most of my concerns were adequately addressed, and I believe the paper is greatly improved. I have two more points. I noticed that the legend for Figure 4 still refers to some components of the previous figure version, this should be updated to reflect the current version of the figure. I also think the paper would benefit from more details regarding some of the analyses.
Specifically, the phase-amplitude coupling analysis should have a section in the methods which should be sure to clarify how the BOLD signals were reconstructed.
(1)“…I noticed that the legend for Figure 4 still refers to some components of the previous figure version, this should be updated to reflect the current version of the figure…”.
Thank you for pointing this out. We have revised the legend of Figure 4 by removing the significance notation “***: p < 0.001”, which referred to elements from a previous version of the figure.
(2)“…I also think the paper would benefit from more details regarding some of the analyses. Specifically, the phase-amplitude coupling analysis should have a section in the methods which should be sure to clarify how the BOLD signals were reconstructed”.
We agree and appreciate the reviewer’s helpful suggestion. We have added a dedicated subsection entitled “Phase–amplitude coupling” to the Materials and Methods, in which we provide a detailed description of how the EC and HPC BOLD signals were reconstructed and how the coupling analysis was implemented. Correspondingly, we refined the description of this analysis in the Results section under “Phase synchronization between the HPC and EC activity”. The revised sections have been included below for your convenience.
Materials and Methods: Phase–amplitude coupling
To quantify the spatial peak relationship between EC and HPC BOLD activity, we implemented a cross-frequency amplitude–phase coupling analysis in the directional space (Canolty et al., 2006). Rather than analyzing raw BOLD signals, we reconstructed 6-fold EC activity and 3-fold HPC activity in each voxel using sinusoidal modulation weights (β<sub>sine</sub> and β<sub>cosine</sub>) estimated from the raw BOLD signals. Specifically, activity was modeled as β<sub>cosine</sub>cos(kθ) + β<sub>sine</sub>sin(kθ), where k denotes the rotational symmetry. This approach selectively captures the hypothesized spatial symmetries of neural activity (e.g., 6-fold or 3-fold periodicity) as a function of movement direction. For this coupling analysis, we used participants’ original movement directions (i.e., without applying orientation calibration). The reconstructed 6-fold EC and 3-fold HPC activity were then converted into analytic representations using the Hilbert transform, yielding the instantaneous phase of the HPC (ϕ<sub>HPC</sub>) and the amplitude envelope of the EC (A<sub>ERC</sub>). HPC phases were classified into nine bins. The composite analytic signal, defined as z = A<sub>ERC</sub>e<sup>iϕHPC</sup>, was used to compute the modulation index M (Canolty et al., 2006), defined as the absolute value of the mean of z values, quantifying the scalar coupling strength between EC amplitude and HPC phase within each bin. A surrogate dataset, a null distribution of the modulation indices (M<sup>-</sup>), was generated by spatially offsetting the EC amplitude relative to the HPC phase across all possible spatial lags. The mean of this surrogate distribution was used as the baseline reference against which the observed coupling strength was compared.
Results: Phase synchronization between the HPC and EC activity
To examine whether the spatial phase structure in one region could predict that in another, we tested whether the orientations of the 6-fold EC and 3-fold HPC periodic activities, estimated from odd-numbered sessions using sinusoidal modulation with rotationally symmetric parameters, were correlated across participants. A cross-participant circular correlation was conducted between the spatial phases of the two areas to quantify the spatial correspondence of their activity patterns (EC: purple dots; HPC: green dots) (Jammalamadaka & Sengupta, 2001). The analysis revealed a significant circular correlation (Fig. 4a; r = 0.42, p < 0.001), as reflected by the continuous color progression across the participants (i.e., the colored lines connecting each pair of the EC and HPC dots in Fig. 4a), suggesting that participants with smaller hippocampal phases (green, outer ring) tended to have smaller entorhinal phases (purple, inner ring), and vice versa.
In addition to the across-participant phase correlation, we further examined the spatial alignment between the 6-fold EC and 3-fold HPC activity patterns. Given that the spatial phase of the HPC is hypothesized to depend on EC projections, particularly along the three primary axes of the hexagonal code, we examined whether the periodic activities of the EC and HPC were spatially peak-aligned. Notably, unlike previous studies that focused on temporal coherence of neural oscillations (Buzsaki, 2006; Maris et al., 2011; Friese et al., 2013), our analysis focused on periodic coupling between brain areas in the directional space. To test spatial peak alignment between EC and HPC, a cross-frequency spatial coupling analysis (adapted from the amplitude–phase coupling framework; Canolty et al., 2006) was employed to identify at which HPC phase the EC exhibited maximal amplitude modulation. If the activities of both areas were peak-aligned (i.e., no peak offset), a strong coupling at phase 0 of the HPC would be expected as shown by the one-cyclebased schema in Fig. 4b. In doing so, the instantaneous phase of the HPC and the amplitude envelope of the EC were extracted from the reconstructed activity using the Hilbert transform (see methods for details). HPC phases were classified into nine bins, and the modulation index (M), quantifying the scalar coupling strength between EC amplitude and HPC phase, was computed within each bin. As a result, significant coupling was observed in the bin centered at phase 0 of the HPC (Fig. 4c; t(32) = 2.57, p = 0.02, Bonferroni-corrected across tests; Cohen’s d = 0.45). In contrast, no significant coupling was found in other bins (p > 0.05). To rule out the possibility that the observed coupling was driven by a potential harmonic (integer multiple) relationship between the 3-fold and 6-fold periodicities, we additionally conducted control analyses using 9-fold and 12-fold EC components. However, no significant coupling was observed in these controls (Fig. 4c; p > 0.05). Together, these results confirmed selective alignments of spatial peaks between the 6fold EC and 3-fold HPC periodicity in the conceptual direction domain.
Reviewer #2 (Public review):
The authors report results from behavioral data, fMRI recordings, and computer simulations during a conceptual navigation task. They report 3-fold symmetry in behavioral and simulated model performance, 3-fold symmetry in hippocampal activity, and 6-fold symmetry in entorhinal activity (all as a function of movement directions in conceptual space). The analyses seem thoroughly done, and the results and simulations are very interesting.
We thank the reviewer for the positive assessment of our work.
We thank both reviewers again for their constructive and insightful feedback, which has substantially strengthened the manuscript.
eLife Assessment
This valuable study introduces a model to help researchers understand how multivariate processes affect observed relationships in genetic data. The authors provide a tool to estimate model parameters. Overall, the authors provide solid evidence that their tool can obtain median-unbiased estimates of the true parameters when using simulated data under the model.
Reviewer #1 (Public review):
Summary:
The authors develop a multivariate extension of SEM models incorporating transmitted and non-transmitted polygenic scores to disentangle genetic and environmental intergenerational effects across multiple traits. Their goal is to enable unbiased estimation of cross-trait vertical transmission, genetic nurture, gene-environment covariance, and assortative mating within a single coherent framework. By formally deriving multivariate path-tracing rules and validating the model through simulation, they show that ignoring cross-trait structure can severely bias both cross- and within-trait estimates. The proposed method provides a principled tool for studying complex gene-environment interplay in family genomic data.
Strengths:
It has become apparent in recent years that multivariate processes play an important role in genetic effects that are studied (e.g., Border et al., 2022), and these processes can affect the interpretation of these studies. This paper develops a comprehensive framework for polygenic score studies using trio data. Their model allows for assortative mating, vertical transmission, gene-environment correlation, and genetic nurture. Their study makes it clear that within-trait and cross-trait influences are important considerations. While their exposition and simulation focus on a bivariate model, the authors point out that their approach can be easily extended to higher-dimensional applications.
Weaknesses:
(1) My primary concern is that the paper is very difficult to follow. Perhaps this is inevitable for a model as complicated as this one. Admittedly, I have limited experience working with SEMs, so that might be partly why I really struggled with this paper, but I ultimately still have many questions about how to interpret many aspects of the path diagram, even after spending a considerable amount of time with it. Below, I will try to point out the areas where I got confused (and some where I still am confused). If the authors choose to revise the paper, clarifying some of these points would substantially broaden the paper's accessibility and impact.
(1a) Figure 1 contains a large number of paths and variable names, and it is not always apparent which variables correspond to which paths. For example, at a first glance, the "k + g_c" term next to the "T_m" box could arguably correspond to any of the four paths near it. Disentangling this requires finding other, more reasonable variables for the other lines and sifting through the 3 pages of tables describing the elements of the figure.
(1b) More hand-holding, describing the different parameters in the model, would help readers who don't have experience with SEMs. For example, many parameters show up several times (e.g., delta, a, g_c, i_c, w) and describing what these parameters are and why they show up several times would help. Some of this information is found in the tables (e.g., "Note: [N]T denotes either NT or T, as both share the same matrix content"), though I don't believe it is explained what it means to "share the same matrix content."
(1c) Relatedly, descriptions of the path tracing were very confusing to me. I was relieved to see the example on the bottom of page 10 and top of page 11, but then as I tried to follow the example, I was again confused. Because multiple paths have the same labels, I was not able to follow along which exact path from Figure 1 corresponded to the elements of the sum that made up Theta_{Tm}. Also, based on my understanding of the path-tracing rules described, some paths seemed to be missing. After a while, I think I decided that these paths were captured by the (1/2)*w term since that term didn't seem to be represented by any particular path in the figure, but I'm still not confident I'm right. In this example, rather than referring to things like "four paths through the increased genetic covariance from AM", it might be useful to identify the exact paths represented by indicating the nodes those paths go through. If there aren't space constraints, the authors might even consider adding a figure which just contains the relevant paths for the example
(1d) The paper has many acronyms and variable names that are defined early in the paper and used throughout. Generally, I would limit acronyms wherever possible in a setting like this, where readers are not necessarily specialists. For the variables, while the definitions are technically found in the paper, it would be useful to readers if they were reminded what the variables stood for when they are referred to later, especially if that particular variable hasn't been mentioned for a while. As I read, I found myself constantly having to scroll back up to the several pages of figures and tables to remind myself of what certain variables meant. Then I would have to find where I was again. It really made a dense paper even harder to follow.
(1e) Relatedly, on page 13, the authors make reference to a parameter eta, and I don't see it in Figure 1 or any of the tables. What is that parameter?
(2) This point may be related to me misunderstanding the model, but if LT_p represent the actual genetic factors for the two traits for variants that are transmitted to the child, and T_p represents the PGS of for transmitted variants, shouldn't their be a unidirectional arrow from LT_p to T_p (since the genetic factor affects the PGS and not the other way around) and shouldn't there be no arrow from T_p to Y_0 (since the entire effect of the transmitted SNPs is represented by the arrow from LT_p to Y_0)? If I'm mistaken here, it would be useful to explain why these arrows are necessary.
(3) Some explanation of how the interpretation of the coefficients differs in a univariate model versus a bivariate model would be useful. For example, in a univariate model, the delta parameter represents the "direct effect" of the PGI on the offspring's outcome (roughly corresponding to a regression of the offspring's outcome onto the offspring's PGI and each parent's PGI). Does it have the same interpretation in the bivariate case, or is it more closely related to a regression of one of the outcomes onto the PGIs for both traits?
(4) It appears from the model that the authors are assuming away population stratification since the path coefficient between T_m and T_m is delta (the same as the path coefficient between T_m and Y_0). Similarly, I believe the effect of NT_m on Y_0 only has a genetic nurture interpretation if there is no population stratification. Some discussion of this would be valuable.
References:
Border, R., Athanasiadis, G., Buil, A., Schork, AJ, Cai, N., Young, AI, ... & Zaitlen, N.A. (2022). Cross-trait assortative mating is widespread and inflates genetic correlation estimates. Science , 378 (6621), 754-761.
Reviewer #2 (Public review):
(1) Summary and overall comments:
This is an impressive and carefully executed methodological paper developing an SEM framework with substantial potential. The manuscript is generally very well written, and I particularly appreciated the pedagogical approach: the authors guide the reader step by step through a highly complex model, with detailed explanations of the structure and the use of path tracing rules. While this comes at the cost of length, I think the effort is largely justified given the technical audience and the novelty of the contribution.
The proposed SEM aims to estimate cross-trait indirect genetic effects and assortative mating, using genotype and phenotype data from both parents and one offspring, and builds on the framework introduced by Balbona et al. While I see the potential interest of the model, it is still a bit unclear in which conditions I could use it in practice. However, this paper made a clear argument for the need for cross-traits models, which changed my mind on the topic (I would have accommodated myself with univariate models and only interpreted in the light of likely pleiotropy, but I am now excited by the potential to actually disentangle cross-traits effects).
The paper is written in a way that makes me trust the authors' thoroughness and care, even when I do not fully understand every step of the model. I want to stress that I am probably not well-positioned to identify technical errors in the implementation. My comments should therefore be interpreted primarily from the perspective of a potential user of the method: I focus on what I understand, what I do not, and where I see (or fail to see) the practical benefits.
For transparency, here is some context on my background. I have strong familiarity with the theoretical concepts involved (e.g., genetic nurture, gene-environment covariance, dynastic effects), and I have worked on those with PGS regressions and family-based comparison designs. My experience with SEM is limited to relatively simple models, and I have never used OpenMx. Reading this paper was therefore quite demanding for me, although still a better experience than many similarly technical papers, precisely because of the authors' clear effort to explain the model in detail. That said, keeping track of all moving parts in such a complex framework was difficult, and some components remain obscure to me.
(2) Length, structure, and clarity:
I do not object in principle to the length of the paper. This is specialized work, aimed at a relatively narrow audience, and the pedagogical effort is valuable. However, I think the manuscript would benefit from a clearer and earlier high-level overview of the model and its requirements. I doubt that most readers can realistically "just skim" the paper, and without an early hook clearly stating what is estimated and what data are required, some readers may disengage.
In particular, I would suggest clarifying early on:
• What exactly is estimated?
For example, in the Discussion, the first two paragraphs seem to suggest slightly different sets of estimands: "estimate the effects of both within- and cross-trait AM, genetic nurture, VT, G-E covariance, and direct genetic effects." versus "model provides unbiased estimates of direct genetic effects (a and δ), VT effects (f), genetic nurture effects (ϕ and ρ), G-E covariance w and v, AM effects (μ), and other parameters when its assumptions are met." A concise and consistent summary of parameters would be helpful.
• What data are strictly required?
At several points, I thought that phenotypes for both parents were required, but later in the Discussion, the authors consider scenarios where parental phenotypes are unavailable. I found this confusing and would appreciate a clearer statement of what is required, what is optional, and what changes when data are missing.
• Which parameters must be fixed by assumption, rather than estimated from the data?
Relatedly, in the Discussion, the authors mention the possibility of adding an additional latent shared environmental factor across generations. It would help to clearly distinguish: - the baseline model, - the model actually tested in the paper, and - possible extensions.
Making these distinctions explicit would improve accessibility.
This connects to a broader concern I had when reading Balbona et al. (2021): at first glance, the model seemed readily applicable to commonly available data, but in practice, this was not the case. I wondered whether something similar applies here. A clear statement of what data structures realistically allow the model to be fitted would be very useful.
I found the "Suggested approach for fitting the multivariate SEM-PGS model" in the Supplementary Information particularly helpful and interesting. I strongly encourage highlighting this more explicitly in the main manuscript. If the authors want the method to be widely used, a tutorial or at least a detailed README in the GitHub repository would greatly improve accessibility.
Finally, while the pedagogical repetition can be helpful, there were moments where it felt counterproductive. Some concepts are reintroduced several times with slightly different terminology, which occasionally made me question whether I had misunderstood something earlier. Streamlining some explanations and moving more material to the SI could improve clarity without sacrificing rigor.
(3) Latent genetic score (LGS) and the a parameter
I struggled to understand the role of the latent genetic score (LGS), and I think this aspect could be explained more clearly. In particular, why is this latent genetic factor necessary? Is it possible to run the model without it?
My initial intuition was that the LGS represents the "true" underlying genetic liability, with the PGS being a noisy proxy. Under that interpretation, I expected the i matrix to function as an attenuation factor. However, i is interpreted as assortative-mating-induced correlation, which suggests that my intuition is incorrect. Or should the parameter be interpreted as an attenuation factor?
Relatedly, in the simulation section, the authors mention simulating both PGS and LGS, which confused me because the LGS is not a measured variable. I did not fully understand the logic behind this simulation setup.
Finally, I was unsure whether the values simulated for parameter a in Figures 8-9 are higher than what would typically be expected given the current literature, though this uncertainty may reflect my incomplete understanding of a itself. I appreciated the Model assumptions section of the discussion, and I wonder if this should not be discussed earlier.
(4) Vertical transmission versus genetic nurture
I am not sure I fully understand the distinction between vertical transmission (VT) and genetic nurture as defined in this paper. From the Introduction, I initially had the impression that these concepts were used almost interchangeably, but Table 3 suggests they are distinct.
Relatedly:
• Why are ϕ and ρ not represented in the path diagram?
• Are these parameters estimated in the model?
The authors also mention that these parameters target different estimands compared to other approaches. It would be helpful to elaborate on this point. Relatedly, where would the authors expect dynastic effects to appear in this framework?
(5) Univariate model and misspecification
In the simulations where a univariate model is fitted to data generated under a true bivariate scenario, I have a few clarification questions.
What is the univariate model used (e.g., Table 5)? Is it the same as the model described in Balbona et al. (2025)? Does it include an LGS?
If the genetic correlation in the founder generation is set to zero, does this imply that all pleiotropy arises through assortative mating? If so, is this a realistic mechanism, and does it meaningfully affect the interpretation of the results?
(6) Simulations
Overall, I found the simulations satisfying to read; they largely test exactly the kinds of issues I would want them to test, and the rationale for these tests is clear.
That said, I was confused by the notation Σ and did not fully understand what it represents.
In the Discussion, the authors mention testing the misspecification of social versus genetic homogamy, but I do not recall this being explicitly described in the simulation section. They also mention this issue in the SI ("Suggested approach for fitting..."). I think it would be very helpful to include an example illustrating this form of misspecification.
(7) Cross-trait specific limitations
I am wondering - and I don't think this is addressed - what is the impact of the difference in the noisiness and the heritability of the traits used for this multivariate analysis?
Using the example, the authors mention of BMI and EA, one could think that these two traits have different levels of noise (maybe BMI is self-reported and EA comes from a registry), and similarly for the GWAS of these traits, let's say one GWAS is less powered than the other ones. Does it matter? Should I select the traits I look at carefully in function of these criteria? Should I interpret the estimates differently if one GWAS is more powered than the other one?
eLife Assessment
This manuscript provides valuable insight into how genome organization changes as cells progress through the cell cycle after mitotic exit. The conclusions are supported by solid, rigorous data, and the use of sorted unsynchronized cells rather than cells treated with drugs is a particular strength. Two sharp genome remodeling events are identified at G1-S and to a lesser extent, at S-G2 transitions. A discussion on the limitations of Hi-C and a broader interpretation of results in the context of other mechanistic models would strengthen the overall rigor.
Reviewer #1 (Public review):
This work convincingly shows that, rather than gradually "evolving" throughout interphase, global chromatin architecture undergoes unexpectedly sharp remodeling at G1-S (and to a lesser extent, S-G2) transitions. By applying "standard" Hi-C analyses on carefully sorted cells, the authors provide an excellent temporal view of how global chromatin architecture is changed throughout the cell cycle. They show a surprisingly abrupt increase in compartmentation strength (particularly interactions between the "active" A compartments) at G1-S transition, which is slightly weakened at S-G2 transition. Follow-up experiments show convincingly that the compartment "maturation" does not require the DNA synthesis accompanying S phase per se, but the authors have not identified the responsible factors (work for future publications). The possible biological ramifications of these architectural changes (setting up potential replication "factories", and/or facilitating transcription-replication conflict resolution, both more pertinent for the active A compartments, which are most affected) have been well discussed in the article, but still remain speculative at this stage.
My major criticism of this article is aimed more at the state of the field in general, rather than this specific article, but it should be discussed to give a more balanced view: what actually is a chromatin compartment? Chromosomal tracing and live tracking experiments have shown that the majority of "structures" identified from Hi-C experiments are statistical phenomena, with even "strong" interactions only being infrequent and transient. A-B compartments are "built up" from multiple very low-frequency "interactions", so ascribing causal effects for genome functions is even tougher. As a result, I have very little confidence in the results of the authors' polymer simulations and their inferred "peninsula" A compartment structures without any other supporting experimental data.
Specific minor points:
(1) A better explanation for how Figure 1E was generated is required, because this figure could be very misleading. Figure 1F and all other cis-decay plots (and the Hi-C maps themselves) show that the strongest interactions are always at smaller genomic separations, so why should there be more "heat" at the megabase ranges in Figure 1E?
(2) An ultra-high-resolution Hi-C study (Harris et al., Nat Commun, 2023) identified very small A and B compartments, including distinctions between gene promoters and gene bodies, raising further questions as to what the nature of a compartment really is beyond a statistical phenomenon. It is unreasonable to expect the authors to generate maps as deep as this prior study, but how much do their conclusions change according to the resolution of their compartment calling? The authors should include a balanced discussion on the "meaning" of A/B compartments.
Reviewer #2 (Public review):
Summary:
This manuscript by Choubani et al presents a technically strong analysis of A/B compartment dynamics across interphase using cell-cycle-resolved Hi-C. By combining the elegant Fucci-based staging system with in situ Hi-C, the authors achieve unusually fine temporal resolution across G1, S, and G2, particularly within the short G1 phase of mESCs. The central finding that A/B compartment strength increases abruptly at the G1/S transition, stabilizes during S phase, and subsequently weakens toward G2 challenges the prevailing view that compartmentalization strengthens monotonically throughout interphase. The authors further propose that this "compartment maturation" is triggered by S-phase entry but occurs independently of active DNA synthesis, and that it involves a consolidation and large-scale reorganization of A-compartment domains.
Strengths:
Overall, this is a thoughtfully executed study that will be of broad interest to the 3D genome community. The data are of high quality, and the analyses are extensive, albeit not completely novel. In particular, previous work (Nagano et al 2017 and Zhang et al 2019) has shown that compartments are re-established after mitosis and strengthened during early interphase, and single-cell Hi-C studies have reported changes in compartment association across S phase. In particular, Nagano et al show that DNA replication correlates with a build-up of compartments, similar to what is presented here, with the authors' conclusion that compartment strength peaks in early S. The idea that it weakens toward G2, rather than continuing to strengthen, appears to be novel and differs from the prevailing framing in the literature.
Weaknesses:
That said, several aspects of the conceptual framing and interpretation would also benefit from further clarification, and the mechanistic interpretation of the reported compartment dynamics requires more careful positioning relative to established models of genome organization. Specific concerns are outlined below:
(1) One of the major conclusions of the study is that compartment maturation does not require ongoing DNA replication. However, the interpretation would benefit from more precise wording. Thymidine arrest still permits licensing, replisome assembly, and other S-phase-associated chromatin changes upstream of bulk DNA synthesis. Therefore, their data, as presented, demonstrate independence from DNA synthesis per se, but not necessarily from the broader replication program. Please clarify this distinction in the text and interpretations throughout the manuscript.
(2) A major conceptual issue that is not addressed at all is the well-established anti-correlation between cohesin-mediated loop extrusion and A/B compartmentalization. Numerous studies have shown that loss of cohesin or reduced loop extrusion leads to stronger compartment signals, whereas increased cohesin residence or enhanced extrusion weakens compartmentalization. Given this framework, an obvious alternative explanation for the authors' observations is that the abrupt increase in compartment strength at G1/S, and its decline toward G2, could reflect cell-cycle-dependent modulation of cohesin activity rather than a compartment-intrinsic "maturation" program.
The manuscript does not explicitly consider this possibility, nor does it examine loop extrusion-related features (such as loop strength, insulation, or stripe patterns) across the same cell-cycle stages. Without discussing or analyzing this widely accepted model, it is difficult to distinguish whether the reported compartment dynamics represent a novel architectural mechanism or an indirect consequence of known changes in extrusion behavior during the cell cycle. I strongly encourage the authors to analyze their data to determine if they observe anti-correlated loop changes at the same time they observe compartment changes. Ideally, the authors would remove loop extrusion during interphase using well-established cohesin degrons available in mESCs and determine if the relative differences in compartment dynamics persist.
(3) The proposed "peninsula-like" A-domain structures are inferred from ensemble Hi-C data and polymer modeling, rather than directly observed physical conformations. That is, single-cell imaging data clearly have shown that Hi-C (especially ensemble Hi-C) cannot uniquely specify physical conformations and that different underlying structures can produce similar contact patterns. The "peninsula" language, as written, risks being interpreted as a literal structural model rather than a conceptual visualization. Instead of risking this as just another nuanced Hi-C feature in the field, the authors could strengthen the manuscript by either (i) explicitly framing the peninsula model as a heuristic description of contact redistribution rather than a definitive physical architecture, or (ii) discussing alternative structural scenarios that could give rise to similar Hi-C patterns. Clarifying this distinction would improve the rigor and help readers better understand what aspects of A-compartment consolidation are directly supported by the data versus model-based extrapolations. For example, it would be useful to clarify whether the observed increase in long-range A-A contacts reflects spatial extension of internal A regions, changes in loop extrusion dynamics, increased compartment mixing within the A state, or population-averaged heterogeneity across alleles.
(4) The extension of the analysis to additional cell types using HiRES single-cell data is a valuable addition and supports the idea that compartment maturation is not unique to mESCs. However, the limitations of these data, in particular, the limited phase resolution, in addition to the pseudo-bulk aggregation and variable coverage, should be emphasized more clearly in the main text. Framing these results as evidence for conservation in principle, rather than definitive proof of identical dynamics across tissues, would be a more appropriate framing.
eLife Assessment
This important work demonstrates the role of physically linking the core and CTD kinase modules of TFIIH via separate domains of subunit Tfb3 in confining RNA Polymerase II Serine 5 CTD phosphorylation to promoter regions of transcribed genes in budding yeast. The main findings, resulting from analyses of viable Tfb3 mutants in which the linkage between TFIIH core and kinase modules has been severed, are supported by solid evidence from in vitro and in vivo experiments. There is an intriguing possibility that the Tfb3-mediated connection between core and kinase modules of TFIIH is an evolutionary addition to an ancestral state of physically unconnected enzymes, which could be examined more rigorously with additional evolutionary analyses.
Reviewer #1 (Public review):
Giordano et al. demonstrate that yeast cells expressing separated N- and C-terminal regions of Tfb3 are viable and grow well. Using this creative and powerful tool, the authors effectively uncouple CTD Ser5 phosphorylation at promoters and assess its impact on transcription. This strategy is complementary to previous approaches, such as Kin28 depletion or the use of CDK7 inhibitors. The results are largely consistent with earlier studies, reinforcing the importance of the Tfb3 linkage in mediating CTD Ser5 phosphorylation at promoters and subsequent transcription.
Notably, the authors also observe effects attributable to the Tfb3 linker itself, beyond its role as a simple physical connection between the N- and C-terminal domains. These findings provide functional insight into the Tfb3 linker, which had previously been observed in structural studies but lacked clear functional relevance. Overall, I am very positive about this manuscript and offer a few minor comments below that may help to further strengthen the study.
(1) Page 4
PIC structures show the linker emerging from the N-terminal domain as a long alpha-helix running along the interface between the two ATPase subunits, followed by a turn and a short stretch of helix just N-terminal to a disordered region that connects to the C-terminal region (see schematic in Figure 1A).
The linker helix was only observed in the poised PIC (Abril-Garrido et al., 2023), not in other fully-engaged PIC structures.
(2) Page 8
Recent structures (reviewed in (Yu et al., 2023)) show that the Kinase Module would block interactions between the Core Module and other NER factors. Therefore, TFIIH either enters into the NER complex as the free Core Module, or the Kinase Module must dissociate soon after.
To my knowledge, this is still controversial in the NER field. I note the potential function of the kinase module is likely attributed to the N-terminal region of Tfb3 through its binding to Rad3. Because the yeast strains used in Figure 6 retain the N-terminal region of Tfb3, the UV sensitivity assay presented here is unlikely to directly address the contribution of the kinase module to NER.
(3) Page 11
Notably, release of the Tfb3 Linker contact also results in the long alpha-helix becoming disordered (Abril-Garrido et al., 2023), which could allow the kinase access to a far larger radius of area. This flexibility could help the kinase reach both proximal and distal repeats within the CTD, which can theoretically extend quite far from the RNApII body.
Although the kinase module was resolved at low resolution in all PIC-Mediator structures, these structural studies consistently reveal the same overall positioning of the kinase module on Mediator, indicating that its localization is constrained rather than variable. This observation suggests that the linker region may help position the kinase module at this specific site, likely through direct interactions with the PIC or Mediator. This idea is further supported by numerous cross-links between the linker region and Mediator (Robinson et al., 2016).
Reviewer #2 (Public review):
Summary:
This work advances our understanding of how TFIIH coordinates DNA melting and CTD phosphorylation during transcription initiation. The finding that untethered kinase activity becomes "unfocused," phosphorylating the CTD at ser5 throughout the coding sequence rather than being promoter-restricted, suggests that the TFIIH Core-Kinase linkage not only targets the kinase to promoters but also constrains its activity in a spatial and temporal manner.
Strengths:
The experiments presented are straightforward, and the models for coupling initiation and CTD phosphorylation and for the evolution of these linked processes are interesting and novel. The results have important implications for the regulation of initiation and CTD phosphorylation.
Weaknesses:
Additional data that should be easily obtainable and analysis of existing data would enable an additional test of the models presented and extract additional mechanistic insights.
Reviewer #3 (Public review):
Summary:
Eukaryotic gene transcription requires a large assemblage of protein complexes that govern the molecular events required for RNA Polymerase II to produce mRNAs. One of these complexes, TFIIH, comprises two modules, one of which promotes DNA unwinding at promoters, while the other contains a kinase (Kin28 in yeast) that phosphorylates the repeated motif at the C-terminal domain (CTD) of the largest subunit of Pol II. Kin28 phosphorylation of Ser5 in the YSPTSPS motif of the CTD is normally highly localized at promoter regions, and marks the beginning of a cycle of phosphorylation events and accompanying protein association with the CTD during the transition from initiation to elongation.
The two modules of TFIIH are linked by Tfb3. Tfb3 consists of two globular regions, an N-terminal domain that contacts the Core module of TFIIH and a C-terminal domain that contacts the kinase module, connected by a linker. In this paper, Giordano et al. test the role of Tfb3 as a connector between the two modules of TFIIH in yeast. They show that while no or very slow growth occurs if only the C-terminal or N-terminal region of Tfb3 is present, near normal growth is observed when the two unlinked regions are expressed. Consistent with this result, the separate domains are shown to interact with the two distinct TFIIH modules. ChIP experiments show that the Core module of TFIIH maintains its localization at gene promoters when the Tfb3 domains are separated, while localization of the kinase module and of Ser5 phosphorylation on the CTD of Pol II is disrupted. Finally, the authors examine the effect of separating the Tfb3 domains on another function of TFIIH, namely nucleotide excision repair, and find little or no effect when only the N-terminal region of Tfb3 or the two unlinked domains are present.
Strengths:
Experiments involving expression of Tfb3 domains in yeast are well-controlled, and the data regarding viability, interaction of the separate Tfb3 domains with TFIIH modules, genome-wide localization of the TFIIH modules and of phosphorylated Ser5 CTDs, and of effects on NER, are convincing. The experiments are consistent with current models of TFIIH structure and function and support a model in which Tfb3 tethers the kinase module of TFIIH close to initiation sites to prevent its promiscuous action on elongating Pol II.
Weaknesses:
(1) The work is limited in scope and does not provide any major insights into the mechanism of transcription. One indication of this limitation is that in the Discussion, published structural and functional results on transcription are used to support the interpretations of the results here more than current results inform previous models or findings.
(2) The first described experiment, which purports to show that three kinases cannot function in place of Kin28 when tethered (by fusion) to Tfb3, is missing the crucial control of showing that Kin28 can support viability in the same context. This result also does not connect with the rest of the manuscript.
(3) Finally, the authors present the interesting and reasonable speculation that the TFIIH complex and connecting Tfb3 found in mammals and yeast may have evolved from an earlier state in which the two TFIIH subdomains were present as unconnected, distinct enzymes. This idea is supported by a single example from the literature (T. brucei). A more thorough evolutionary analysis could have tested this idea more rigorously.
eLife Assessment
This manuscript uses adaptive-bandit simulations to describe the dynamics of the Pseudomonas-derived chephalosporinase PDC-3 β-lactamase and its mutants to better understand antibiotic resistance. The finding, that clinically observed mutations alter the flexibility of the Ω- and R2-loops, reshaping the cavity of the active site, is valuable to the field. The evidence is considered incomplete, however, with the need for analysis to demonstrate equilibrium weighting of adaptive trajectories and related measures of statistical significance.
Reviewer #2 (Public review):
Summary:
In the manuscript entitled "Ω-Loop mutations control dynamics 2 of the active site by modulating the 3 hydrogen-bonding network in PDC-3 4 β-lactamase", Chen and coworkers provide a computational investigation of the dynamics of the enzyme Pseudomonas-derived chephalosporinase 3 (PDC3) and some mutants associated with increased antibiotic resistance. After an initial analysis of the enzyme dynamics provided by RMSD/RMSF, the author conclude that the mutations alter the local dynamics within the omega loop and the R2 loop. The authors show that the network of hydrogen bonds in disrupted in the mutants. Constant pH calculations showed that the mutations also change the pKa of the catalytic lysine 67 and pocket volume calculations showed that the mutations expand the catalytic pocket. Finally, time-independent componente analysis (tiCA) showed different profiles for the mutant enzyme as compared to the wild type.
Strengths:
The scope of the manuscript is definitely relevant. Antibiotic resistance is an important problem and, in particular, Pseudomonas aeruginosa resistance is associated with an increasing number of deaths. The choice of the computational methods is also something to highlight here. Although I am not familiar with Adaptive Bandit Molecular Dynamics (ABMD), the description provided in the manuscript that this simulation strategy is well suited for the problem under evaluation.
Weaknesses:
In the revised version, the authors addressed my concerns regarding their use of the MSM, and in my view, their conclusions are now much more robust and well-supported by the data. While it would be very interesting to see a quantitative correlation between the effects of the mutations observed in the MD data and relevant experimental findings, I understand that this may be beyond the scope of the manuscript.
Reviewer #3 (Public review):
Summary:
This manuscript aims to explore how mutations in the PDC-3 3 β-lactamase alter its ability to bind and catalyse reactions of antibiotic compounds. The topic is interesting and the study uses MD simulations and to provide hypotheses about how the size of the binding site is altered by mutations that change the conformation and flexibility of two loops that line the binding pocket. Some greater consideration of the uncertainties and how the method choice affect the ability to compare equilibrium properties would strengthen the quantitative conclusions. While many results appear significant by eye, quantifying this and ensuring convergence would strengthen the conclusions.
Strengths:
The significance of the problem is clearly described the relationship to prior literature is discussed extensively.
Comments on revised version:
I am concerned that the authors state in the response to reviews that it is not possible to get error bars on values due to the use of the AB-MD protocol that guides the simulations to unexplored basins. Yet the authors want to compare these values between the WT and mutants. This relates to RMSD, RMSF, % H-bond and volume calculations. I don't accept that you cannot calculate an uncertainty on a time averaged property calculated across the entire simulation. In these cases you can either run repeat simulations to get multiple values on which to do statistical analysis, or you can break the simulation into blocks and check both convergence and calculate uncertainties.
I note that the authors do provide error bars on the volumes, but the statistics given for these need closer scrutiny (I cant test this without the raw data). For example the authors have p<0.0001 for the following pair of volumes 1072 {plus minus} 158 and 1115 {plus minus} 242, or for SASA p<0.0001 is given for 2 identical numbers 155+/- 3.
I also remain concerned about comparisons between simulations run with the AB-MD scheme. While each simulation is an equilibrium simulation run without biasing forces, new simulations are seeded to expand the conformational sampling of the system. This means that by definition the ensemble of simulations does not represent and equilibrium ensemble. For example, the frequency at which conformations are sampled would not be the same as in a single much longer equilibrium simulation. While you may be able to see trends in the differences between conditions run in this way, I still don't understand how you can compare quantitative information without some method of reweighing the ensemble. It is not clear that such a rewieghting exists for this methods, in which case I advise some more caution in the wording of the comparisons made from this data.
At this stage I don't feel the revision has directly addressed the main comments I raised in the earlier review, although there is a stronger response to the comments of Reviewer #2.
Author response:
The following is the authors’ response to the current reviews.
Reviewer #2 (Public review):
Summary:
In the manuscript entitled "Ω-Loop mutations control dynamics 2 of the active site by modulating the 3 hydrogen-bonding network in PDC-3 4 β-lactamase", Chen and coworkers provide a computational investigation of the dynamics of the enzyme Pseudomonas-derived chephalosporinase 3 (PDC3) and some mutants associated with increased antibiotic resistance. After an initial analysis of the enzyme dynamics provided by RMSD/RMSF, the author conclude that the mutations alter the local dynamics within the omega loop and the R2 loop. The authors show that the network of hydrogen bonds in disrupted in the mutants. Constant pH calculations showed that the mutations also change the pKa of the catalytic lysine 67 and pocket volume calculations showed that the mutations expand the catalytic pocket. Finally, time-independent componente analysis (tiCA) showed different profiles for the mutant enzyme as compared to the wild type.
Strengths:
The scope of the manuscript is definitely relevant. Antibiotic resistance is an important problem and, in particular, Pseudomonas aeruginosa resistance is associated with an increasing number of deaths. The choice of the computational methods is also something to highlight here. Although I am not familiar with Adaptive Bandit Molecular Dynamics (ABMD), the description provided in the manuscript that this simulation strategy is well suited for the problem under evaluation.
Weaknesses:
In the revised version, the authors addressed my concerns regarding their use of the MSM, and in my view, their conclusions are now much more robust and well-supported by the data. While it would be very interesting to see a quantitative correlation between the effects of the mutations observed in the MD data and relevant experimental findings, I understand that this may be beyond the scope of the manuscript.
Thank you for the careful evaluation and constructive comments. Regarding the suggestion of a more quantitative correlation with experimental observables, we agree that this would be valuable, and we have noted it as an important direction for future work.
Reviewer #3 (Public review):
Summary:
This manuscript aims to explore how mutations in the PDC-3 3 β-lactamase alter its ability to bind and catalyse reactions of antibiotic compounds. The topic is interesting and the study uses MD simulations and to provide hypotheses about how the size of the binding site is altered by mutations that change the conformation and flexibility of two loops that line the binding pocket. Some greater consideration of the uncertainties and how the method choice affect the ability to compare equilibrium properties would strengthen the quantitative conclusions. While many results appear significant by eye, quantifying this and ensuring convergence would strengthen the conclusions.
Strengths:
The significance of the problem is clearly described the relationship to prior literature is discussed extensively.
Comments on revised version:
I am concerned that the authors state in the response to reviews that it is not possible to get error bars on values due to the use of the AB-MD protocol that guides the simulations to unexplored basins. Yet the authors want to compare these values between the WT and mutants. This relates to RMSD, RMSF, % H-bond and volume calculations. I don't accept that you cannot calculate an uncertainty on a time averaged property calculated across the entire simulation. In these cases you can either run repeat simulations to get multiple values on which to do statistical analysis, or you can break the simulation into blocks and check both convergence and calculate uncertainties.
We thank the reviewer for raising this point. We would like to clarify that we did not intend to state that error bars are impossible to obtain under AB-MD. In fact, we reported error bars for several quantities derived from the AB-MD trajectories (we also broke the trajectories into blocks and calculated uncertainties for RMSF in our first-round response as you suggested). However, these data are closely related to your concern about comparing quantitative information without an appropriate reweighting of the ensemble. Therefore, in the revised manuscript, we removed quantitative analyses that were calculated directly from the raw AB-MD trajectories. Instead, the quantitative comparisons are now obtained from MSM analysis. We report pocket volumes and key interaction metrics for MSM metastable states, with corresponding error bars for these MSM-based quantities (Figure 6 and its supplementary figure).
I note that the authors do provide error bars on the volumes, but the statistics given for these need closer scrutiny (I cant test this without the raw data). For example the authors have p<0.0001 for the following pair of volumes 1072 {plus minus} 158 and 1115 {plus minus} 242, or for SASA p<0.0001 is given for 2 identical numbers 155+/- 3.
Thank you for this comment. As noted above, we have removed the table from the manuscript, and the pocket-volume results together with their error bars are now shown in Figure 6. To address the concern raised here and to avoid making the same mistake in future analyses, we re-examined how the statistics were computed. We believe the very small p-values were caused by treating per-frame MD values as independent observations in two-sample t-tests. Because consecutive MD frames are strongly time-correlated, they do not satisfy the independence assumption, which can greatly overestimate the effective sample size and lead to artificially small p-values. For the SASA, a p < 0.0001 is reported even though both values are shown as 155 ± 3. This is due to rounding, which can hide subtle underlying differences.
I also remain concerned about comparisons between simulations run with the AB-MD scheme. While each simulation is an equilibrium simulation run without biasing forces, new simulations are seeded to expand the conformational sampling of the system. This means that by definition the ensemble of simulations does not represent and equilibrium ensemble. For example, the frequency at which conformations are sampled would not be the same as in a single much longer equilibrium simulation. While you may be able to see trends in the differences between conditions run in this way, I still don't understand how you can compare quantitative information without some method of reweighing the ensemble. It is not clear that such a rewieghting exists for this methods, in which case I advise some more caution in the wording of the comparisons made from this data.
At this stage I don't feel the revision has directly addressed the main comments I raised in the earlier review, although there is a stronger response to the comments of Reviewer #2.
We thank the reviewer for reiterating this important point, and we agree with the underlying concern. Although AB-MD generates unbiased trajectories, the ensemble of simulations does not represent an equilibrium ensemble. As a result, statistics computed by simply concatenating all AB-MD trajectories should not be used for quantitative comparisons. In the original version, we acknowledge that we reported several quantitative descriptors directly from concatenated AB-MD frames, including (i) distributions of χ1 torsions, (ii) mean pocket volumes and SASA, and (iii) percentages of some key interactions. We agree that this was not appropriate given the adaptive sampling protocol. In the revised manuscript, we have removed these quantitative analyses.
We retained RMSD and RMSF analyses, but we have revised their wording and clarified their purpose. RMSD and RMSF are used only to summarize the structural variability and residue-level mobility observed across the collected trajectory segments and to motivate the selection of structural features for MSM construction. The manuscript now states: “Because AB-MD adaptively seeds new unbiased trajectories to expand conformational sampling, RMSD and RMSF are used here to summarize the structural variability and per-residue mobility observed across the collected trajectories.”
Regarding the reviewer’s question about reweighting, the Markov state model (MSM) provides a principled framework to obtain the stationary distribution π from the transition probability matrix T<sub>τ</sub>. The resulting π<sub>i</sup> gives the equilibrium weight of each microstate i, and the corresponding discrete free energy can be written as F<sup>i</sup>=−k<sub>B</sub>Tln(π<sub>i</sup>). PCCA then coarse-grains the microstate space into a small number of metastable states. In the revised manuscript, quantitative comparisons are therefore derived from the MSM at the level of these metastable states, rather than from unweighted counts of concatenated AB-MD frames.
Accordingly, we have revised the sections “E219K and Y221A mutations facilitate proton transfer” and “Substitutions enlarge the active-site pocket to accommodate bulkier R1 and R2 groups of β-lactams”, and we have added new figures in Figure 6 and its figure supplement. The adjustments to the quantitative analyses do not affect our original conclusions.
The following is the authors’ response to the original reviews.
Reviewer #1 (Public review):
Summary:
This manuscript uses adaptive sampling simulations to understand the impact of mutations on the specificity of the enzyme PDC-3 β-lactamase. The authors argue that mutations in the Ω-loop can expand the active site to accommodate larger substrates.
Strengths:
The authors simulate an array of variants and perform numerous analyses to support their conclusions. The use of constant pH simulations to connect structural differences with likely functional outcomes is a strength.
Weaknesses:
I would like to have seen more error bars on quantities reported (e.g., % populations reported in the text and Table 1).
We appreciate this point. Here, the population we analyze is intended to showcase conformational differences across variants rather than to estimate equilibrium occupancies. Although each system includes 100 trajectories, they were generated using an adaptive-bandit protocol. The protocol deliberately guides towards underexplored basins, therefore conformational heterogeneity betweentrajectories is expected by design. For example, in E219K the MSM decomposition shows that in states 1, 6, and 7 the K67(NZ)–S64(OG) distance is almost entirely > 6 Å, whereas in states 2 and 3 it is almost entirely < 3.5 Å (Figure 5—figure supplement 12). These distances suggest that the hydrogen bond fraction is approximately zero in states 1, 6, and 7, and close to one in states 2 and 3. In addition, the mean first passage time of the Markov state models suggests that the formation and disruption of this hydrogen bond occur on the microsecond timescale, which is far longer than the length of each individual trajectory (300 ns). Consequently, across the 100 replicas, some trajectories exhibit very low fractions, while others display the opposite trend. Under such bimodal, protocol-induced heterogeneity, computing an error bar across trajectories mainly visualizes the protocol’s dispersion and risks being misread as thermodynamic uncertainty, which is not central to our aim of comparing conformational differences between wild-type PDC-3 and variants. We therefore do not include the error bars.
Reviewer #2 (Public review):
Summary:
In the manuscript entitled "Ω-Loop mutations control dynamics of the active site by modulating the 3 hydrogen-bonding network in PDC-3 4 β-lactamase", Chen and coworkers provide a computational investigation of the dynamics of the enzyme Pseudomonas-derived cephalosporinase 3 (PDC3) and some mutants associated with increased antibiotic resistance. After an initial analysis of the enzyme dynamics provided by RMSD/RMSF, the author concludes that the mutations alter the local dynamics within the omega loop and the R2 loop. The authors show that the network of hydrogen bonds is disrupted in the mutants. Constant pH calculations showed that the mutations also change the pKa of the catalytic lysine 67, and pocket volume calculations showed that the mutations expand the catalytic pocket. Finally, time-independent component analysis (tiCA) showed different profiles for the mutant enzyme as compared to the wild type.
Strengths:
The scope of the manuscript is definitely relevant. Antibiotic resistance is an important problem, and, in particular, Pseudomonas aeruginosa resistance is associated with an increasing number of deaths. The choice of the computational methods is also something to highlight here. Although I am not familiar with Adaptive Bandit Molecular Dynamics (ABMD), the description provided in the manuscript suggests that this simulation strategy is well-suited for the problem under evaluation.
Weaknesses:
In the description of many of their results, the authors do not provide enough information for a deep understanding of the biochemistry/biophysics involved. Without these issues addressed, the strength of the evidence is of concern.
We thank the reviewer for pointing out the need for deeper discussion of the biochemical and biophysical implications of our results. In our manuscript, we begin by examining basic structural metrics (e.g., RMSD and RMSF) which clearly indicate that the major conformational changes occur in the Ω-loop and the R2 loop. We have now added a paragraph to describe the importance of the Ωloop and highlighted it in the revised manuscript on lines 142-166 of page 6. This observation guided our subsequent focus on these regions, as well as on the catalytic site. Our analysis revealed notable alterations in the hydrogen bonding network—especially in interactions involving the K67-S64, K67N152, K67-G220, Y150-A292, and N287-N314 pairs. These observations led us to conclude that:
(1) Mutations E219K and Y221A facilitate the proton transfer of catalytic residues. This is consistent with prior experimental data showing that these substitutions produce the most pronounced increase in sensitivity to cephalosporin antibiotics (lines 210-212 in page 8 of the revised manuscript).
(2) Substitutions enlarge the active-site pocket to accommodate bulkier R1 and R2 groups of β-lactams.This is in line with MIC measurements reported by Barnes et al. (2018), which showed that mutants with larger active-site pockets exhibit markedly greater sensitivity to cephalosporins with bulky side chains than others (lines 249-259 in pages 10).
Furthermore, we applied Markov state models (MSMs) to explore the timescales of the transitions between these different conformational states. We believe that these methodological steps support our conclusions.
Reviewer #3 (Public review):
Summary:
This manuscript aims to explore how mutations in the PDC-3 3 β-lactamase alter its ability to bind and catalyse reactions of antibiotic compounds. The topic is interesting, and the study uses MD simulations to provide hypotheses about how the size of the binding site is altered by mutations that change the conformation and flexibility of two loops that line the binding pocket. However, the study doesn't clearly describe the way the data is generated. While many results appear significant by eye, quantifying this and ensuring convergence would strengthen the conclusions.
Strengths:
The significance of the problem is clearly described, and the relationship to prior literature is discussed extensively.
Weaknesses:
The methods used to gain the results are not explained clearly, meaning it was hard to determine exactly how some data was obtained. The convergence and uncertainties in the data were not adequately quantified. The text is also a little long, which obscures the main findings.
We thank the reviewer for the suggestion. We respectfully ask the reviewer to specify which aspects of the data-generation methods are unclear so that we can include the necessary details in the next revision. Moreover, all statistics that are reported in the manuscript are obtained from extensive analyses of 300,000 simulation frames. The Markov state models have been validated by the ITS plots and Chapman-Kolmogorov (CK) test. The two-sample t-tests were also carried out for the volume and SASA.
Reviewer #2 (Recommendations for the authors):
(1) Figure 1D focus on the PDC3 catalytic site. However, the authors mentioned before that the enzyme has two domains, an alpha domain and an alpha/beta domain. The reader would benefit from a more detailed description of the enzyme, its active site, AND the location of the mutants under investigation in the figure.
We have updated Figure 1D and marked the positions of all mutations (V211A/G, G214A/R, E219A/G/K and Y221A/H), which have now been highlighted as spheres.
(2) Since in the journal format, the results come before the methods. It would be interesting to add a brief description of where the results came from. For example, in the first section of the results, the authors describe the flexibility of the omega loop and the R2 loop. However, the reader won't know what kind of simulation was used and for how long, for example. A sentence would add the required context for a deeper understanding here.
At the beginning of the Results and Discussion section we now state: “To investigate how the mutations in the Ω-loop affect PDC-3 dynamics, adaptive-bandit molecular dynamics (AB-MD) simulations were carried out for each system. 100 trajectories of 300 ns each (totaling 30 μs per system) were run.”
(3) Still in the same section, the authors don't define what change in RMSF is considered significant. For example, I can't see a relevant change in the RMSF for the omega loop between the et enzyme and the E219 mutants in Figure 2D. A more objective definition would be of benefit here.
Our analysis reveals that while the wild-type PDC-3 and the G214A, G214R, E214G, and Y221A variants exhibit an average per-residue RMSF of around 4 Å in the Ω-loop, the V211A and V211G variants show markedly lower values (around 1.5 Å), and the E219K and Y221H variants exhibit intermediate values between 2 and 2.5 Å. In addition, the fluctuations around the binding site should be seen collectively along with the fluctuations in the R2-loop. Importantly, we urge the reviewer to focus on the MDLovofit analysis in Figure 2C, where the dynamic differences between the core and the fluctuating loops is clearly evident.
(4) In line 138, the authors state that "Therefore, the flexibility of these proteins is mainly caused by the fluctuations in the Ω-loops and R2-loop". This is quite a bold statement to be drawn at this point. First of all, there is no mention of it in the manuscript, but is there any domain movement? Figure 2C clearly shows that there is some mobility in omega and R2 loops. But there is no evidence shown in the manuscript that shows that "the flexibility of these proteins is mainly caused by the fluctuations in the" loops. Please consider rephrasing this sentence or adding more data, if available.
We have revised the wording to take the reviewer’s concern into account. The sentence now states: “Therefore, flexibility of PDC-3 is predominantly localized to the Ω- and R2-loops, whereas the remainder of the structure is comparatively rigid.” To further explain to the reviewer, the β lactamase enzymes are fairly rigid structures, where no large-scale domain motions occur. Instead, the enzyme communicates structurally via cross correlation of loop dynamics ( https://doi.org/10.7554/eLife.66567 ).
(5) I guess, the most relevant question for the scope of the paper is not answered in this section. The authors show that the mobility of the omega- and R2-loops is altered by some mutations. Why is that? I wish I could see a figure showing where the mutations are and where the loops are. This question will come back in other sections.
We have updated Figure 1D to mark the positions of all mutations (V211A/G, G214A/R, E219A/G/K and Y221A/H) as spheres. The Ω- and R2-loops are also highlighted. All mutations map to the Ω-loop, indicating that these substitutions directly perturb this region. Notably, K67 forms a hydrogen bond with the backbone of G220 within the Ω-loop and another with the phenolic hydroxyl of Y150. Y150, in turn, hydrogen-bonds with A292 in the R2 loop. Together, the residue interaction network (G220– K67–Y150–A292) suggest a pathway by which Ω-loop mutations propagate their effects to the R2 loop.
(6) The authors then analyze the network of polar residues in the active site and the hydrogen bonds observed there. For the K67-N152 hydrogen bond, for example, there is a reduction in the occupancy from ~70% in the wild-type enzyme to ~30% and 40% in the mutants E219K and Y221, respectively. This finding is interesting. The question that remains is "why is that"? From the structural point of view, how does the replacement of E219 with a Lysine alter the hydrogen bond formation between K67 and N152? Is it due to direct competition? Solvent rearrangement? The reader is left without a clue in this section. Also, Figure 3B won't help the reader, since the mutated residues are not shown there. Please consider adding some information about why the authors believe that the mutations are disrupting the active site hydrogen bond network and showing it in Figure 3B.
We appreciate the comment and have updated Figures 1D and 3B to highlight the mutation sites. The change from ~70% in the wild type to ~30–40% in the E219K and Y221T variants reported in Table 1 refers to the S64–K67 hydrogen bond. In the wild type, K67 forms an additional hydrogen bond with G220 on the Ω-loop, which helps anchor the K67 side chain in a geometry that favors the S64–K67 interaction. In the variants, the mutations reshape the Ω-loop and frequently disrupt the K67–G220 contact. The loss of this local anchor increases the conformational dispersion of K67, which is consistent with the observed reduction of the S64–K67 occupancy. Furthermore, our observation that the mutations are disrupting the active-site hydrogen-bond network is a data-driven conclusion rather than a subjective inference. Across ten systems, our AB-MD simulations provided 30 µs of sampling per system. Saving one frame every nanosecond yielded 30,000 conformations per system and 300,000 in total. All hydrogen-bond and salt-bridge statistics were computed over this full ensemble. Thus, the conclusion that the mutations disrupt the active-site hydrogen-bond network follows directly from these ensemble statistics.
(7) The pKa calculations and the pocket volume calculations show that the mutations expand the volume of the catalytic site and alter the microenvironment. Is there any change in the solvation associated with these changes? If the volume expands and the environment becomes more acidic, are there more water molecules in the mutants as compared to the wt enzyme? If so, can changes in solvation be associated with the changes in the hydrogen bond network? Would a simulation in the presence of a substrate be meaningful here? ( I guess it would!).
Regarding solvation, we observe a modest increase in transient water occupancy associated with the increase in volume of the pocket. The conserved deacylation water molecule is the most important and is always present throughout the simulation. Additional waters enter and leave the pocket but do not form persistent interactions that measurably perturb the hydrogen-bond network of the Ω- and R2-loops. We agree that simulations with a bound substrate would be informative. However, our study focuses on how Ω-loop mutations modulate the active site of apo PDC-3 and its variants. Within this scope, we find: (i) Amino acid substitutions change the flexibility of Ω-loops and R2-loops; (ii) E219K and Y221A mutations facilitate the proton transfer; (iii) Substitutions enlarge the active-site pocket to accommodate bulkier R1 and R2 groups of β-lactams.
(8) I have some concerns regarding the Markov State Modeling as shown here. After a time-independent component analysis, the authors show the projections on the components, which is different between wild wild-type enzyme and the mutants, and draw some conclusions from these changes. For example, the authors state that "From the metastable state results, we observe that E219K adopts a highly stable conformation in which all the tridentate hydrogen-bonding interactions (K67(NZ)-S64(OG), K67(NZ)N152(OD1) and K67(NZ)-G220(O) mentioned above are broken". This is conclusion is very difficult to draw from Figure 5 alone. Unless the macrostates observed in the MSM can be shown (their structures) and could confirm the broken interactions, I really don't believe that the reader can come to the same conclusion as drawn by the authors here. I would recommend the authors to map the macrostates back to the coordinates and show them (what structure corresponds to what macrostate). After showing that, it makes sense to discuss what macrostate is being favored by what mutation. Taking conclusions from tiCA projections only is not recommended. I very strongly suggest that the authors revisit this entire section, adding more context so that the reader can draw conclusions from the data that is shown.
We appreciate the reviewer’s concern. In the Markov state modeling section, our objective is to quantify the timescales (via mean first passage times) associated with the formation and disruption of the critical hydrogen bonds (K67(NZ)-S64(OG), K67(NZ)-N152(OD1), K67(NZ)-G220(O), Y150(N)A292(O), N287(ND2)-N314(OD1)) mentioned above. Representative structures illustrating these interactions are shown in Figures 3B and 4A. We agree that the main Figure 5 alone does not convey structural information. Accordingly, we provide Figure 5—figure supplements 12–16. Together, Figure 5B and Figure 5—figure supplements 12–16 map structures to metastable states, whereas Figures 3B and 4A supply atomistic detail of the interactions. Author response image 1 presents selected subplots from Figure 5— figure supplements 12–14. Together with the free-energy landscape in Figure 5A, these data indicate that E219K adopts a highly stable conformation in which all three K67-centered hydrogen bonds (K67(NZ)–S64(OG), K67(NZ)–N152(OD1), and K67(NZ)–G220(O)) are broken.
Author response image 1.
TICA plot illustrates the distribution of E219K with the colour indicating the K67(NZ)-S64(OG), K67(NZ)-N152(OD1) and K67(NZ)-G220(O) distance.
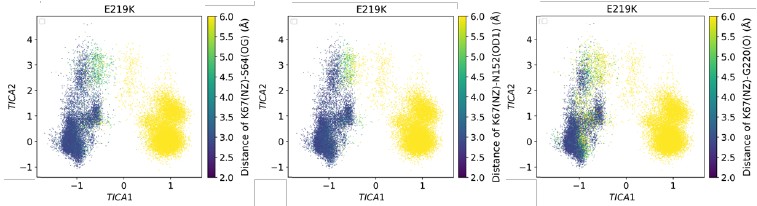
(9) As a very minor issue, there are a few typos in the manuscript text. The authors might want to take some time to revisit their entire text. Examples in lines 70, 197, etc.
Thank you for your comment. We have corrected these typos.
Reviewer #3 (Recommendations for the authors):
This manuscript aims to explore how mutations in the PDC-3 3 β-lactamase alter its ability to bind and catalyse reactions of antibiotic compounds. The topic is interesting, and the study uses MD simulations to provide hypotheses about how the size of the binding site is altered by mutations that change the conformation and flexibility of two loops that line the binding pocket.
However, the study doesn't clearly describe the way the data is generated and potentially lacks statistical rigour, which makes it uncertain if the key results are significant. As such, it is difficult to judge if the conclusions made are supported by data.
All necessary data-acquisition methods are described in the Methods section. The Markov state models have been validated by the ITS plot and the Chapman-Kolmogorov (CK) test (Figure 5—figure supplement 2–11) . The two-sample t-tests were also carried out for the volume and SASA (Table 2).
The results section jumps straight to reporting RMSD and RMSF values; however, it is not clear what simulations are used to generate this information. Indeed, the main text does not mention the simulations themselves at all. The methods section mentions that 10 independent MD simulations were set up for each system, but no information is given as to how long these were run or the equilibration protocol used. Then it says that AB-MD simulations were run, but it is not clear what starting coordinates were used for this or how the 10 replicates were fed into these simulations. Most importantly, are the RMSD and RMSF calculations and later distance distribution information derived from the equilibrium MD runs or from the AB-MD simulations?
Thank you for pointing this out. We have added “To investigate how the mutations in the Ω-loop affect PDC-3 dynamics, adaptive-bandit molecular dynamics (AB-MD) simulations were carried out for each system. 100 trajectories of 300 ns each (totaling 30 μs per system) were run.” to the Results and Discussion section. We didn’t run 10 independent MD simulations per system. We regret the typo in the Methods section that confused the reviewer. The sentence should have read – ‘All-atom MD simulations of wild-type PDC-3 and its variants were performed.’ Each system was equilibrated for 5 ns at 1 atmospheric pressure using Berendsen barostat. AB-MD simulations were initiated from these equilibrated structures. All analyses, apart from CpHMD, are based on the AB-MD trajectories.
If these are taken from the equilibrium simulations, then it is critical that the reproducibility and statistical significance of the simulations is established. This can be done by calculating the RMSD and RMSF values independently for each replicate and determining the error bars. From this, the significance of differences between WT and mutant simulations can be determined. Without this, I have no data to judge if the main conclusions are supported or not. If these are derived from the AB-MD simulations, then I want to know how the independent simulations were combined and reweighted to generate overall RMSD, RMSF, and distance distributions. Unless I misunderstand the approach, the individual simulations no longer sample all regions of conformational space the same relative amount you would see in a standard MD simulation - specific conformational regions are intentionally run more to enhance sampling, then the overall conformational distributions cannot be obtained from these simulations without some form of reweighting scheme. But no such scheme is described. In addition, convergence of the data is required to ensure that the RMSD, RMSF, and distances have reached stable values. It is possible that I am misunderstanding the approach here. But in that case, I hope the authors can clarify the method and provide a means of ensuring that the data presented is converged. Many of the differences are clear by eye, but it is important to know they are not random differences between simulations and rather reflect differences between them.
Thank you for raising this important point. In our AB-MD workflow, the adaptive bandit is used only for starting-structure selection (adaptive seeding). After each epoch, it chooses new starting snapshots from previously sampled conformations and launches the next runs. Each trajectory itself is standard, unbiased MD with no biasing potentials and no modification of the Hamiltonian. In other words, AB decides where we start, but does not alter the physics or sampling dynamics within an individual trajectory. In addition, our goal in this work is to compare variants under the same adaptive-bandit (AB) protocol, rather than to estimate equilibrium (Boltzmann) populations. Hence, we did not apply equilibrium reweighting to RMSD, RMSF, or distance distributions. However, MSM section provides reweighted reference results based on the MSM stationary distribution.
In the response to reviews, the authors state that the "RMSF is a statistical quantity derived from averaging the time series of atomic displacements, resulting in a fixed value without an inherent error bar." But normally we would run multiple replicates and get an error bar from the different values in each. To dismiss the request for uncertainties and error bars seems to miss the point. I strongly agree with the prior reviewer that comparisons between RMSF or other values should be accompanied by uncertainties and estimates of statistical significance.
Regarding the reviewers’ suggestion to present the data as a bar graph with error bars, we would like to note that RMSF is calculated as the time average of the fluctuations of each residue’s Cα atom over the entire simulation. As such, RMSF is a statistical quantity derived from averaging the time series of atomic displacements, resulting in a fixed value without an inherent error bar. We believe that our current presentation clearly and accurately reflects the local flexibility differences among the variants. Nearly all published studies report RMSF in this way, as indicated by the following examples:
Figure 3a in DOI: https://doi.org/10.1021/jacsau.2c00077
Figure 2 in DOI: https://doi.org/10.1021/acs.jcim.4c00089
Supplementary Fig. 1, 2, 5, 9, 12, 20, 22, 24, and 26 in DOI: https://doi.org/10.1038/s41467-022-293313
However, in response to the reviewers’ strong request, we present RMSF plots with error bars in our response letter.
Author response image 2.
The root-mean-square fluctuation (RMSF) profiles of wild-type PDC-3 and its variants. Blue lines show the mean RMSF across 100 independent MD trajectories for each system; red translucent bands denote the standard deviation across trajectories. The Ω-loop (residues G183 to S226) is highlighted in yellow, and the R2-loop (residues L280 to Q310) is highlighted in blue.
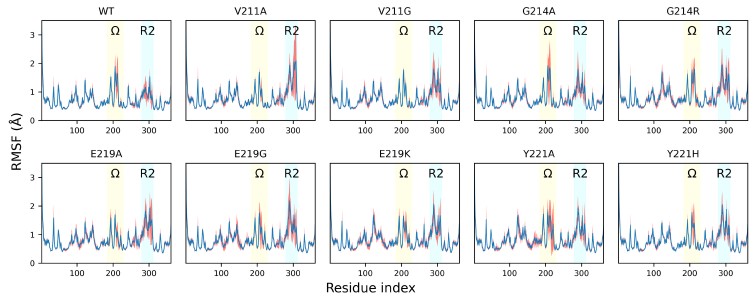
It was good to see that convergence of the constant-pH simulations was shown. While it can be challenging to get absolute pH values from the implicit solvent-based simulations, the differences between the systems are large and the trends appear significant. I was not clear how the starting coordinates were chosen for these simulations. Is the end point of the classical simulations, or is a representative snapshot chosen somehow?
To ensure comparison, all systems used the X-ray crystal structure (PDB ID: 4HEF) with T79A substitution as the initial structure. The E219K and Y221A mutants were generated in silico using the ICM mutagenesis module. We have added the clarification in Methods section: “The starting structures were identical to those used for AB-MD.”
Significant figures: Throughout the text and tables, the authors present data with more figures than are significant. 1071.81+-157.55 should be reported as 1100 +/ 160 or 1070 =- 160 . See the eLife guidelines for advice on this.
Thank you for your suggestion. We have amended these now.
The manuscript is very long for the results presented, and I feel that a clearer story would come across if the authors shortened the text so that the main conclusions and results were not lost.
We appreciate the suggestion. We examined the twenty most recent research articles published in eLife and found that they are either longer than or comparable in length to our manuscript.
eLife Assessment
This study presented valuable findings regarding the basic molecular pathways leading to the cystogenesis of Autosomal Dominant Polycystic Kidney Disease, suggesting BICC1 functions as both a minor causative gene for PKD and a modifier of PKD severity. Solid data were supplied to demonstrate the functional and structural interactions between BICC-1, PC1 and PC2, respectively. The characterization of such interactions remains to be developed further, which renders the specific relevance of these findings for the etiology of relevant diseases unclear.
Reviewer #1 (Public review):
In this manuscript, Tran et al. investigate the interaction between BICC1 and ADPKD genes in renal cystogenesis. Using biochemical approaches, they reveal a physical association between Bicc1 and PC1 or PC2 and identify the motifs in each protein required for binding. Through genetic analyses, they demonstrate that Bicc1 inactivation synergizes with Pkd1 or Pkd2 inactivation to exacerbate PKD-associated phenotypes in Xenopus embryos and potentially in mouse models. Furthermore, by analyzing a large cohort of PKD patients, the authors identify compound BICC1 variants alongside PKD1 or PKD2 variants in trans, as well as homozygous BICC1 variants in patients with early-onset and severe disease presentation. They also show that these BICC1 variants repress PC2 expression in cultured cells.
Overall, the concept that BICC1 variants modify PKD severity is plausible, the data are robust, and the conclusions are largely supported.
Comments on revision:
My comments have been mostly addressed.
Reviewer #2 (Public review):
Tran and colleagues report evidence supporting the expected yet undemonstrated interaction between the Pkd1 and Pkd2 gene products Pc1 and Pc2 and the Bicc1 protein in vitro, in mice, and collaterally, in Xenopus and HEK293T cells. The authors go on to convincingly identify two large and non-overlapping regions of the Bicc1 protein important for each interaction and to perform gene dosage experiments in mice that suggest that Bicc1 loss of function may compound with Pkd1 and Pkd2 decreased function, resulting in PKD-like renal phenotypes of different severity. These results led to examining a cohort of very early onset PKD patients to find three instances of co-existing mutations in PKD1 (or PKD2) and BICC1. Finally, preliminary transcriptomics of edited lines gave variable and subtle differences that align with the theme that Bicc1 may contribute to the PKD defects, yet are mechanistically inconclusive.
These results are potentially interesting, despite the limitation, also recognized by the authors, that BICC1 mutations seem exceedingly rare in PKD patients and may not "significantly contribute to the mutational load in ADPKD or ARPKD". The manuscript has several intrinsic limitations that must be addressed.
The manuscript contains factual errors, imprecisions, and language ambiguities. This has the effect of making this reviewer wonder how thorough the research reported and analyses have been.
Comments on revision:
My comments have been addressed.
Reviewer #3 (Public review):
Summary:
This study investigates the role of BICC1 in the regulation of PKD1 and PKD2 and its impact on cytogenesis in ADPKD. By utilizing co-IP and functional assays, the authors demonstrate physical, functional, and regulatory interactions between these three proteins.
Strengths:
(1) The scientific principles and methodology adopted in this study are excellent, logical, and reveal important insights into the molecular basis of cystogenesis.
(2) The functional studies in animal models provide tantalizing data that may lead to a further understanding and may consequently lead to the ultimate goal of finding a molecular therapy for this incurable condition.
(3) In describing the patients from the Arab cohort, the authors have provided excellent human data for further investigation in large ADPKD cohorts. Even though there was no patient material available, such as HUREC, the authors have studied the effects of BICC1 mutations and demonstrated its functional importance in a Xenopus model.
Weaknesses:
This is a well-conducted study and could have been even more impactful if primary patient material was available to the authors. A further study in HUREC cells investigating the critical regulatory role of BICC1 and potential interaction with mir-17 may yet lead to a modifiable therapeutic target.
Conclusion:<br /> The authors achieve their aims. The results reliably demonstrate the physical and functional interaction between BICC1 and PKD1/PKD2 genes and their products.
The impact is hopefully going to be manifold:
(1) Progressing the understanding of the regulation of the expression of PKD1/PKD2 genes.
Comments on revision:
My comments have been addressed and sorted.
Author response:
The following is the authors’ response to the original reviews.
Reviewer #1 (Public review):
(1) The authors devote significant effort to characterizing the physical interaction between Bicc1 and Pkd2. However, the study does not examine or discuss how this interaction relates to Bicc1's well-established role in posttranscriptional regulation of Pkd2 mRNA stability and translation efficiency.
The reviewer is correct that the present study has not addressed the downstream consequences of uthis interaction considering that Bicc1 is a posttranscriptional regulator of Pkd2 (and potentially Pkd1). We think that the complex of Bicc1/Pkd1/Pkd2 retains Bicc1 in the cytoplasm and thus restrict its activity in participating in posttranscriptional regulation (see Author response image 1). We, however, do not yet have data to support this and thus have not included this model in the manuscript. Yet, we have updated the discussion of the manuscript to further elaborate on the potential mechanism of the Bicc1/Pkd1/Pkd2 complex.
We have updated the discussion to include a discussion on the potential consequences on posttranscriptional regulation by Bicc1.
Author response image 1.
Model of BICC1, PC1 and PC2 self-regulation. In this model Bicc1 acts as a positive regulator of PKD gene expression. In the presence of ‘sufficient’ amounts of PC1/PC2 complex, it is tethered to the complex and remains biologically inactive (Fig. 1A). However, once the levels of the PC1/PC2 complex are reduced, Bicc1 is now present in the cytoplasm to promote expression of the PKD proteins, thereby raising their levels (Fig. 4B), which then in turn will ‘shutdown’ Bicc1 activity by again tethering it to the plasma membrane.
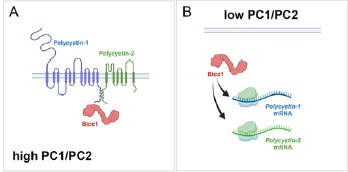
(2) Bicc1 inactivation appears to downregulate Pkd1 expression, yet it remains unclear whether Bicc1 regulates Pkd1 through direct interaction or by antagonizing miR-17, as observed in Pkd2 regulation. This should be further examined or discussed.
This is a very interesting comment. Vishal Patel published that PKD1 is regulated by a mir-17 binding site in its 3’UTR (PMID: 35965273). We, however, have not evaluated whether BICC1 participates in this regulation. A definitive answer would require utilization of the mice described in above reference, which is beyond the scope of this manuscript. We, however, have revised the discussion to elaborate on this potential mechanism.
We have updated the discussion to include a statement on the potential direct regulation of Pkd1 mRNA by Bicc1.
(3) The evidence supporting Bicc1 and ADPKD gene cooperativity, particularly with Pkd1, in mouse models is not entirely convincing, likely due to substantial variability and the aggressive nature of Bpk/Bpk mice. Increasing the number of animals or using a milder Bicc1 strain, such as jcpk heterozygotes, could help substantiate the genetic interaction.
We have initially performed the analysis using our Bicc1 complete knockout, we previously reported on (PMID 20215348) focusing on compound heterozygotes. Yet, similar to the Pkd1/Pkd2 compound heterozygotes (PMID 12140187) no cyst development was observed when we sacrificed the mice as late as P21. Our strain is similar to the above mentioned jcpk, which is characterized by a short, abnormal transcript thought to result in a null allele (PMID: 12682776). We thank the reviewer for pointing us to the reference showing the heterozygous mice exhibit glomerular cysts in the adults (PMID: 7723240). This suggestion is an interesting idea we will investigate. In general, we agree with the reviewer that a better understanding of the contribution of Bicc1 to the adult PKD phenotype will be critical. To this end, we are currently generating a floxed allele of Bicc1 that will allow us to address the cooperativity in the adult kidney, when e.g. crossed to the Pkd1<sup>RC/RC</sup> mice. Yet, these experiments are beyond the timeframe for this revision.
No changes were made in the revised manuscript.
Reviewer #2 (Public review):
(1) These results are potentially interesting, despite the limitation, also recognized by the authors, that BICC1 mutations seem exceedingly rare in PKD patients and may not "significantly contribute to the mutational load in ADPKD or ARPKD". The manuscript has several intrinsic limitations that must be addressed.
As mentioned above, the study was designed to explore whether there is an interaction between BICC1 and the PKD1/PKD2 and whether this interaction is functionally important. How this translates into the clinical relevance will require additional studies (and we have addressed this in the discussion of the manuscript).
(2) The manuscript contains factual errors, imprecisions, and language ambiguities. This has the effect of making this reviewer wonder how thorough the research reported and analyses have been.
We respectfully disagree with the reviewer on the latter interpretation. The study was performed with rigor. We have carefully assessed the critiques raised by the reviewer. As presented below, most of the criticisms raised by the reviewer have been easily addressed in the revised version of the manuscript. Yet, none of the critiques seems to directly impact the overall interpretation of the data.
Reviewer #1 (Recommendations for the authors):
(1) The manuscript requires further editing. For example, figure panels and legends are mismatched in Figure 1
We have corrected the labeling of Figure 1.
(2) Y-axis units and values are inconsistent in Figures 4b-4g, Supplementary Figures S2e and S2f are not referenced in the text, genotypes are missing in Supplementary Figure S3f, and numerous typographical errors are present.
In respect to the y-axis in Figure 4b-g, the scale is different for each of them, but that is intentional as one would lose the differences if they were all scaled identically. But we have now mentioned this in the figure legend to make the reader aware of it. In respect to the Supplemental Figure S2e,f, we included the panels in the description of the mutant BICC1 lines, but unfortunately forgot to reference them. This has now been done.
We have updated the labeling of the Y-axis for the cystic indices adding “[%]” as the unit and updated the figure legend of Figure 4. We have included the genotypes in Supplementary Figure S3f. The Supplementary Figure S2e,f is now mentioned in the supplemental material (page 9, 2<sup>nd</sup> paragraph).
Reviewer #2 (Recommendations for the authors):
(1) Previous data from mouse, Xenopus, and zebrafish suggest a crucial role for the RNAbinding protein Bicc1 in the pathogenesis of PKD, although BICC1 mutations in human PKD have not been previously reported." The cited sources (and others that were not cited) link Bicc1 mutations to renal cysts, similar to a report by Kraus (PMID: 21922595) that the authors cite later. However, a more direct link to PKD was reported by Lian and colleagues using whole Pkd1 mice (PMID: 20219263) and by Gamberi and colleagues using Pkd1 kidneys and human microarrays (PMID: 28406902). Although relevant, neither is cited here, and only the former is cited later in the manuscript.
Thanks for pointing this out. We have added these three citations.
We have added these three citations (PMID: 21922595, PMID: 20219263 and PMID: 28406902) in the indicated sentence.
(2) In Figure 1B, the lanes do not seem to correspond among panels, particularly evident in the panel with myc-mBicc1. Hence, it is difficult to agree with the presented conclusions.
We have corrected the labeling of the lanes in Figure 1b.
(3) In the Figure 1 legend: "(g) Western blot analysis following co-IP experiments, using an anti-mouse Bicc1 or anti-goat PC2 antibody as bait, identified protein interactions between endogenous PC2 and BICC1 in UCL93 cells. Non-immune goat and mouse IgG were included as a negative control." There is no mention of panel H, although this reviewer can imagine what the authors meant. The capitalization differs in the figure and legend. More troublingly, in panel G, a non-defined star indicates a strong band present in both immune and non-immune control.
We have corrected the figure legend of Figure 1 and clarified the non-specific band in the figure legend.
(4) In Figure 4, the authors do not show the matched control for the Bicc1 Pkd1 interaction in panel d, nor do they show a scale bar in either a) or d). Thus, the phenotypic severity cannot be properly assessed.
Thanks for pointing out the missing scale bars, which have now been added. In respect to the two kidneys shown in Figure 4d, the two kidneys shown are from littermates to illustrate the kidney size in agreement with the cumulative data shown in Figure 4e. Unfortunately, this litter did not have a wildtype control. As the data analysis in Figure 4e is based on littermates, mixing and matching kidneys of different litters does not seem appropriate. Thus, we have omitted showing a wildtype control in this panel. However, the size of the wildtype kidney can be seen in Figure 4a.
We have added the scale bar to both panels and have updated the figure legend to emphasize that the kidneys shown are from littermates and that no wildtype littermate was present in this litter.
(5) "Surprisingly, an 8-fold stronger interaction was observed between full-length PC1 and myc-mBicc1-ΔKH compared to mycmBicc1 or myc-mBicc1-ΔSAM." Assuming all the controls for protein folding and expression levels have been carried out and not shown/mentioned, this sentence seems to contradict the previous statement that Bicc1deltaSAM reduced the interaction with PC1 by 55%. Because the full length and SAM deletion have different interaction strengths, the latter sentence makes no sense.
The reduction in the levels of myc-mBicc1-ΔSAM compared to wildtype mycmBicc1 in respect to PC1 binding was not significant. We have clarified this in the text.
We have corrected the sentence and modified the Figure accordingly.
(6) Imprecise statements make a reader wonder how to interpret the data: "More than three independent experiments were analyzed." Stating the sample size or including it in the figure would save space and improve confidence in the data presented.
We have stated the exact number of animals per conditions above each of the bars.
(7) "Next, we performed a similar mouse study for Pkd1 by reducing the gene dose of Pkd1 postnatally in the collecting ducts using a Pkhd1-Cre as previously described40" What did the authors mean?
The reference was included to cite the mouse strain, but realized that it can be mis-interpreted that the exact experiments has been performed previously. We have clarified this in the text.
We have reworded the sentence to avoid misinterpretation.
(8) The authors examined the additive effects of knocking down Bicc1, Pkd1, and Pkd2 with morpholinos in Xenopus and, genetically, in mice. While the Bicc1[+/-] Pkd1 or 2[+/-] double heterozygote mice did not show phenotypes, the authors report that the Bicc1[-/-] Pkd1 or 2 [+/-] did instead show enlarged kidneys. What is the phenotype of a Bicc1[+/-] Pkd1 or 2 [-/-]? What we learn from the author's findings among the PKD population suggests that the latter situation would be potentially translationally relevant.
The mouse experiments were designed to address a cooperativity between Bicc1 and either Pkd1 or Pkd2 and whether removal of one copy of Pkd1 or Pkd2 would further worsen the Bicc1 cystic kidney phenotype. Thus, the parental crosses were chosen to maximize the number of animals obtained for these genotypes. Unfortunately, these crosses did not yield the genotypes requested by the reviewer. To address the contribution of Bicc1 towards the PKD population, we will need to perform a different cross, where we eliminate Pkd1 or Pkd2 in a floxed background of Bicc1 postnatally in adult mice. While we are gearing up to perform such an experiment, this is timewise beyond the scope of the manuscript. In addition, please note that we have addressed the question about the translation towards the PKD population already in the discussion of the original submission (page 13/14, last/first paragraph).
No changes have been made to the revised version of the manuscript.
(9) How do the authors interpret the milder effects of the Bicc1[-/-] Pkd1[+/-] compared to Bicc1[-/-] Pkd2[+/-] relative to the respective protein-protein interactions?
The milder effects are due to the nature of the crosses. While the Pkd2 mutant is a germline mutation, the Pkd1 mutant is a conditional allele eliminating Pkd1 only in the collecting ducts of the kidney. As such, we spare other nephron segments such as the proximal tubules, which also significantly contribute to the cyst load. As such these mouse data support the interaction between Pkd1 and Pkd2 with Bicc1, but do not allow us to directly compare the outcomes. While this was mentioned in the previous version of the manuscript, we have expanded on this in the revised version of the manuscript.
We have expanded the results section in the revised version of the manuscript highlighting that the two different approaches cannot be directly compared.
(10) How do the authors interpret that the strong Bicc1[Bpk] Pkd1 or Pkd2 double heterozygote mice did not have defects and "kidneys from Bicc1+/-:Pkd2+/- did not exhibit cysts (data not shown)", when the VEO PKD patients and - although not a genetic reduction - also the morpholino-treated Xenopus did?
VEO PKD patients are characterized by a loss of function of PKD1 or PKD2 and – as we propose in this manuscript - that BICC1 further aggravates the phenotype. Yet, we do not address either in the mouse or Xenopus experiments whether BICC1 is a genetic modifier. We are simply addressing whether the two genes show a genetic interaction. In the mouse studies, we eliminate one copy of Pkd1 or Pkd2 in the background of a hypomorphic allele of Bicc1. Similarly, in the Xenopus experiments, we employ suboptimal doses of the morpholino oligomers, i.e., concentrations that did not yield a phenotypic change and then asked whether removing both together show cooperativity. It is important to state that this is based on a biological readout and not defined based on the amount of protein. While we have described this already in the original manuscript (page 7, first paragraph), we have amended our description of the Xenopus experiment to make this even clearer.
Finally, we agree with the reviewer that if we were to address whether Bicc1 is a modifier of the PKD phenotype in mouse, we would need to reduce Bicc1 function in a Pkd1 or Pkd2 mutants. Yet, we have recognized this already in the initial version of the manuscript in the discussion (page 14, first paragraph).
We have expanded the results section when discussing the suboptimal amounts of the morpholino oligos (Page 6, 1<sup>st</sup> paragraph).
(11) Unclear: "While variants in BICC1 are very rare, we could identify two patients with BICC1 variants harboring an additional PKD2 or PKD1 variant in trans, respectively." Shortly after, the authors state in apparent contradiction that "the patients had no other variants in any of other PKD genes or genes which phenocopy PKD including PKD1, PKD2, PKHD1, HNF1s, GANAB, IFT140, DZIP1L, CYS1, DNAJB11, ALG5, ALG8, ALG9, LRP5, NEK8, OFD1, or PMM2."
The reviewer is correct. This should have been phrased differently. We have now added “Besides the variants reported below” to clarify this more adequately.
The sentence was changed to start with “Besides the variants reported below, […].”
(12) "The demonstrated interaction of BICC1, PC1, and PC2 now provides a molecular mechanism that can explain some of the phenotypic variability in these families." How do the authors reconcile this statement with their reported ultra-rare occurrence of the BICC1 mutations?
As mentioned in the manuscript and also in response to the other two reviewers, Bicc1 has been shown to regulate Pkd2 gene expression in mice and frogs via an interaction with the miR-17 family of microRNAs. Moreover, the miR-17 family has been demonstrated to be critical in PKD (PMID: 30760828, PMID: 35965273, PMID: 31515477, PMID: 30760828). In fact, both other reviewers have pointed out that we should stress this more since Bicc1 is part of this regulatory pathway. Future experiments are needed to address whether Bicc1 contributes to the variability in ADPKD onset/severity. Yet, this is beyond the scope of this study.
Based on the comments of the two other reviewers we have further addressed the Bicc1/miR-17 interaction.
(13) The manuscript should use correct genetic conventions of italicization and capitalization. This is an issue affecting the entire manuscript. Some exemplary instances are listed below.
(a) "We also demonstrate that Pkd1 and Pkd2 modifies the cystic phenotype in Bicc1 mice in a dose-dependent manner and that Bicc1 functionally interacts with Pkd1, Pkd2 and Pkhd1 in the pronephros of Xenopus embryos." Genes? Proteins?
The data presented in this section show that a hypomorphic allele of Bicc1 in mouse and a knockdown in Xenopus yields this. As both affect the proteins, the spelling should reflect the proteins.
No changes have been made in the revised manuscript.
(b) The sentence seems to use both the human and mouse genetic capitalization, although it refers to experiments in the mouse system “to define the Bicc1 interacting domains for PC2 (Fig. 2d,e). Full-length PC2 (PC2-HA) interacted with full-length myc-mBICC1.”
We agree with the review that stating the species of the molecules used is critical, we have adapted a spelling of Bicc1, where BICC1 is the human homologue, mBicc1 is the mouse homologue and xBicc1 the Xenopus one.
We have highlighted the species spelling in the methods section and labeled the species accordingly throughout the manuscript and figures.
(14) “Together these data supported our biochemical interaction data and demonstrated that BICC1 cooperated with PKD1 and PKD2.” Are the authors implying that these results in mice will translate to the human protein?
We agree that we have not formally shown that the same applies to the human proteins. Thus, we have changed the spelling accordingly.
We have revised the capitalization of the proteins.
(15) The text is often unclear, terse, or inconsistent.
(a) “These results suggested that the interaction between PC1 and Bicc1 involves the SAM but not the KH/KHL domains (or the first 132 amino acids of Bicc1). It also suggests that the N-terminus could have an inhibitory effect on PC1-BICC1 association.” How do the authors define the N-terminus? The first 132 aa? KH/KHL domains?
This was illustrated in the original Figure 2A. The DKH constructs lack the first 351 amino acids.
To make this more evident, we have specified this in the text as well.
(b) Similarly, the authors state below, "Unlike PC1, PC2 interacted with mycmBICC1ΔSAM, but not myc-mBICC1-ΔKH suggesting that PC2 binding is dependent on the N-terminal domains but not the SAM domain." It is unclear if the authors refer to the KH/KHL domains or others. Whatever the reference to the N-terminal region, it should also be consistent with the section above.
This is now specified in the text.
(c) Unclear: "We have previously demonstrated that Pkd2 levels are reduced in a complete Bicc1 null mice,22 performing qRT-PCR of P4 kidneys (i.e. before the onset of a strong cystic phenotype), revealed that Bicc1, Pkd1 and Pkd2 were statistically significantly down9 regulated (Fig. 4h-j)".
We have changed the text to clarify this.
(d) “Utilizing recombinant GST domains of PC1 and PC2, we demonstrated that BICC1 binds to both proteins in GST-pulldown assays (Fig. 1a, b)." GST-tagged domains? Fusions?
We have changed the text to clarify this.
(e) "To study the interaction between BICC1, PKD1 and PKD2 we combined biochemical approaches, knockout studies in mice and Xenopus, genetic engineered human kidney cells" > genetically engineered.
We have changed the text to clarify this.
(f) Capitalization (e.g., see Figure S3, ref. the Bpk allele) and annotation (e.g., Gly821Glu and G821E) are inconsistent.
We have homogenized the labeling of the capitalization and annotations throughout the manuscript.
(g) What do the authors mean by "homozygous evolutionarily well-conserved missense variant"?
We have changed this is the revised version of the manuscript.
Reviewer #3 (Public review/Recommendations to the authors):
(1) A further study in HUREC cells investigating the critical regulatory role of BICC1 and potential interaction with mir-17 may yet lead to a modifiable therapeutic target.
(2) This study should ideally include experiments in HUREC material obtained from patients/families with BICC1 mutations and studying its effects on the PKD1/2 complex in primary cell lines.
This is an excellent suggestion. We agree with the reviewer that it would have been interesting to analyze HUREC material from the affected patients. Unfortunately, besides DNA and the phenotypic analysis described in the manuscript neither human tissue nor primary patient-derived cells collected once the two patients with the BICC1 p.Ser240Pro variant passed away.
No changes to the revised manuscript have been made to address this point.
(3) Please remove repeated words in the following sentence in paragraph 2 of the introduction: "BICC1 encodes an evolutionarily conserved protein that is characterized by 3 K-homology (KH) and 2 KH-like (KHL) RNA-binding domains at the N-terminus and a SAM domain at the C-terminus, which are separated by a by a disordered intervening sequence (IVS).23-28".
This has been changed.
Author response:
Reviewer #1 (Public review):
The authors analysed large-scale brain-state dynamics while humans watched a short video. They sought to identify the role of thalamocortical interactions.
Major concerns
(1) Rationale for using the naturalistic stimulus
In terms of brain state dynamics, previous studies have already reported large-scale neural dynamics by applying some data-driven analyses, like energy landscape analysis and Hidden Markov Model, to human fMRI/EEG data recorded during resting/task states. Considering such prior work, it'd be critical to provide sufficient biological rationales to perform a conceptually similar study in a naturalistic condition, i.e., not just "because no previous work has been done". The authors would have to clarify what type of neural mechanisms could be missed in conventional resting-state studies using, say, energy landscape analysis, but could be revealed in the naturalistic condition.
We appreciate your insightful comments regarding the need for a biological rationale in our study. As you mentioned, there are similar studies, just like Meer et al. utilized Hidden Markov Models to identify various activation modes of brain networks that included subcortical regions[1], Song et al. linked brain states to narrative understandings and attentional dynamics[2, 3]. These studies could answer why we use naturalistic stimuli datasets. Moreover, there is evidence suggesting that the thalamus plays a crucial role in processing information in a more naturalistic context while pointing out the vital role in thalamocortical communications[4, 5]. So, we tended to bridge thalamic activity and cortical state transition using the energy landscape description.
To address these gaps in conventional resting-state studies, we explored an alternative method—maximum entropy modeling based on the energy landscape. This allowed us to validate how the thalamus responds to cortical state transitions. To enhance clarity, we will update our introduction to emphasize the motivations behind our research and the significance of examining these neural mechanisms in a naturalistic setting.
(2) Effects of the uniqueness of the visual stimulus and reproducibility
One of the main drawbacks of the naturalistic condition is the unexpected effects of the stimuli. That is, this study looked into the data recorded from participants who were watching Sherlock, but what would happen to the results if we analyzed the brain activity data obtained from individuals who were watching different movies? To ensure the generalizability of the current findings, it would be necessary to demonstrate qualitative reproducibility of the current observations by analysing different datasets that employed different movie stimuli. In fact, it'd be possible to find such open datasets, like www.nature.com/articles/s41597-023-02458-8.
We appreciate your concern regarding the reproducibility of our findings. The dataset from the "Sherlock" study is of high quality and has shown good generalizability in various research contexts. We acknowledge the importance of validating our results with different datasets to enhance the robustness of our conclusions. While we are open to exploring additional datasets, we intend to pursue this validation once we identify a suitable alternative. Currently, we are considering a comparison with the dataset from "Forrest Gump" as part of our initial plan.
(3) Spatial accuracy of the "Thalamic circuit" definition
One of the main claims of this study heavily relies on the accuracy of the localization of two different thalamic architectures: matrix and core. Given the conventional or relatively low spatial resolution of the fMRI data acquisition (3x3x3 mm^3), it appears to be critically essential to demonstrate that the current analysis accurately distinguished fMRI signals between the matrix and core parts of the thalamus for each individual.
We acknowledge the importance of accurately localizing the different thalamic architectures, specifically the matrix and core regions. To address this, we downsampled the atlas of matrix and core cell populations from the previous study from a resolution of 2x2x2 mm<sup>3</sup> to 3x3x3 mm<sup>3</sup>, which aligns with our fMRI data acquisition. We would report the atlas as Supplementary Figures in our revision.
(4) More detailed analysis of the thalamic circuits
In addition, if such thalamic localisation is accurate enough, it would be greatly appreciated if the authors perform similar comparisons not only between the matrix and core architectures but also between different nuclei. For example, anterior, medial, and lateral groups (e.g., pulvinar group). Such an investigation would meet the expectations of readers who presume some microscopic circuit-level findings.
We appreciate your suggestion regarding a more detailed analysis of thalamic circuits. We have touched upon this in the discussion section as a forward-looking consideration. However, we believe that performing nuclei segmentation with 3T fMRI may not be ideal due to well-documented concerns regarding signal-to-noise ratio and spatial resolution. That said, we are interested in exploring these nuclei-pathway connections to cortical areas in future studies with a proper 7T fMRI naturalistic dataset.
(5) Rationale for different time window lengths
The authors adopted two different time window lengths to examine the neural dynamics. First, they used a 21-TR window for signal normalisation. Then, they narrowed down the window length to 13-TR periods for the following statistical evaluation. Such a seemingly arbitrary choice of the shorter time window might be misunderstood as a measure to relax the threshold for the correction of multiple comparisons. Therefore, it'd be appreciated if the authors stuck to the original 21-TR time window and performed statistical evaluations based on the setting.
Thank you for your valuable feedback regarding the choice of time window lengths. We aimed to maintain consistency in window lengths across our analyses. In light of your comments and suggestions from other reviewers, we plan to test our results using different time window lengths and report findings that generalize across these variations. Should the results differ significantly, we will discuss the implications of this variability in our revised manuscript.
(6) Temporal resolution
After identifying brain states with energy landscape analysis, this study investigated the brain state transitions by directly looking into the fMRI signal changes. This manner seems to implicitly assume that no significant state changes happen in one TR (=1.5sec), which needs sufficient validation. Otherwise, like previous studies, it'd be highly recommended to conduct different analyses (e.g., random-walk simulation) to address and circumvent this problem.
Thank you for raising this important point regarding temporal resolution. Many fMRI studies, such as those examining event boundaries during movie watching, operate under similar assumptions concerning state changes within one TR. For example, Barnett et al. processed the dynamic functional connectivity (dFC) with a window of 20 TRs (24.4s). So, we do not think it is a limitation but is a common question related to fMRI scanning parameters. To strengthen our analysis of state transitions and ensure they are not merely coincidental, we plan to conduct random-walk simulations, as suggested, to validate our findings in accordance with methodologies used in previous research.
Reviewer #2 (Public review):
Summary:
In this study, Liu et al. investigated cortical network dynamics during movie watching using an energy landscape analysis based on a maximum entropy model. They identified perception- and attention-oriented states as the dominant cortical states during movie watching and found that transitions between these states were associated with inter-subject synchronization of regional brain activity. They also showed that distinct thalamic compartments modulated distinct state transitions. They concluded that cortico-thalamo-cortical circuits are key regulators of cortical network dynamics.
Strengths:
A mechanistic understanding of cortical network dynamics is an important topic in both experimental and computational neuroscience, and this study represents a step forward in this direction by identifying key cortico-thalamo-cortical circuits. The analytical strategy employed in this study, particularly the LASSO-based analysis, is interesting and would be applicable to other data types, such as task- and resting-state fMRI.
We thanks for this comment and encouragement.
Weaknesses:
Due to issues related to data preprocessing, support for the conclusions remains incomplete. I also believe that a more careful interpretation of the "energy" derived from the maximum entropy model would greatly clarify what the analysis actually revealed.
Thank you for your valuable suggestions, and we apologize for any misunderstandings regarding the interpretation of the energy landscape in our study. To address this issue, we will include a dedicated paragraph in both the methods and results sections to clarify our use of the term "energy" derived from the maximum entropy model. This addition aims to eliminate any ambiguity and provide a clearer understanding of what our analysis reveals.
(1) I think the method used for binarization of BOLD activity is problematic in multiple ways.
a) Although the authors appear to avoid using global signal regression (page 4, lines 114-118), the proposed method effectively removes the global signal. According to the description on page 4, lines 117-122, the authors binarized network-wise ROI signals by comparing them with the cross-network BOLD signal (i.e., the global signal): at each time point, network-wise ROI signals above the cross-network signal were set to 1, and the rest were set to −1. If I understand the binarization procedure correctly, this approach forces the cross-network signal to be zero (up to some noise introduced by the binarization of network-wise signals), which is essentially equivalent to removing the global signal. Please clarify what the authors meant by stating that "this approach maintained a diverse range of binarized cortical states in data where the global signal was preserved" (page 4, lines 121-122).
Thank you for highlighting the potential issue with our binarization method. We appreciate your insights regarding the comparison of network-wise ROI signals with the cross-network BOLD signal, as this may inadvertently remove the global signal. To address this, we will conduct a comparative analysis of results obtained from both our current approach and the original pipeline. If we decide to retain our current method, we will carefully reconsider the rationale and rephrase our descriptions to ensure clarity regarding the preservation of the global signal and the diversity of binarized cortical states.
b) The authors might argue that they maintained a diverse range of cortical states by performing the binarization at each time point (rather than within each network). However, I believe this introduces another problem, because binarizing network-wise signals at each time point distorts the distribution of cortical states. For example, because the cross-network signal is effectively set to zero, the network cannot take certain states, such as all +1 or all −1. Similarly, this binarization biases the system toward states with similar numbers of +1s and −1s, rather than toward unbalanced states such as (+1, −1, −1, −1, −1, −1). These constraints and biases are not biological in origin but are simply artifacts of the binarization procedure. Importantly, the energy landscape and its derivatives (e.g., hard/easy transitions) are likely to be affected by these artifacts. I suggest that the authors try a more conventional binarization procedure (i.e., binarization within each network), which is more robust to such artifacts.
Related to this point, I have a question regarding Figure S1, in which the authors plotted predicted versus empirical state probabilities. As argued above, some empirical state probabilities should be zero because of the binarization procedure. However, in Figure S1, I do not see data points corresponding to these states (i.e., there should be points on the y-axis). Did the authors plot only a subset of states in Figure S1? I believe that all states should be included. The correlation coefficient between empirical and predicted probabilities (and the accuracy) should also be calculated using all states.
Thank you for your thoughtful examination of our data processing pipeline. We agree that a comparison between the conventional binarization method and our current approach is warranted, and we appreciate your suggestion. Upon reviewing Figure S1, we discovered that there was indeed an error related to the plotting style set to "log10." As you correctly pointed out, the data should reflect that the probabilities for states where all networks are either activated or deactivated are zero. We are very interested in exploring the state distributions obtained from both the original and current approaches, as your comments highlight important considerations. We sincerely appreciate your insightful feedback and will make sure to address these points thoroughly in our first revision.
c) The current binarization procedure likely inflates non-neuronal noise and obscures the relationship between the true BOLD signal and its binarized representation. For example, consider two ROIs (A and B): both (+2%, +1%) and (+0.01%, −0.01%) in BOLD signal changes would be mapped to (+1, −1) after binarization. This suggests that qualitatively different signal magnitudes are treated identically. I believe that this issue could be alleviated if the authors were to binarize the signal within each network, rather than at each time point.
Thank you for your important observation regarding the potential inflation of non-neuronal noise in our current binarization procedure. We recognize that this process could lead to qualitatively different signal magnitudes being treated similarly after binarization, as you illustrated with your example. While we acknowledge your point, we believe that conventional binarization pipelines may also encounter this issue, albeit by comparing signals to a network's temporal mean activity. To address this concern and maintain consistency with previous studies, we will discuss this limitation in our revised manuscript. Additionally, if deemed necessary, we will explore implementing a percentile-based threshold above the baseline to further refine our binarization approach. Your suggestion provides a valuable perspective, and we appreciate your insights.
(2) As the authors state (page 5, lines 145-148), the "energy" described in the energy landscape is not biological energy but rather a statistical transformation of probability distributions derived from the Boltzmann distribution. If this is the case, I believe that Figure 2A is potentially misleading and should be removed. This type of schematic may give the false impression that cortical state dynamics are governed by the energy landscape derived from the maximum entropy model (which is not validated).
Thank you for your valuable feedback regarding Figure 2A. We apologize for any confusion it may have created. While we recognize that similar figures are commonly used in literature involving energy landscapes (maximum entropy model), we agree that Figure 2A may mislead readers into thinking that cortical state dynamics are directly governed by the energy landscape derived from the maximum entropy model, which has not been validated. In light of your comments, we will remove Figure 2A and instead emphasize the analytical strategy presented in Figure 2B. Additionally, we will provide a simplified line graph as an illustrative example to clarify the concepts without the potential for misinterpretation.
Reviewer #3 (Public review):
Summary:
In this study, Liu et al. analyze fMRI data collected during movie watching, applied an energy landscape method with pairwise maximum entropy models. They identify a set of brain states defined at the level of canonical functional networks and quantify how the brain transitions between these states. Transitions are classified as "easy" or "hard" based on changes in the inferred energy landscape, and the authors relate transition probabilities to inter-subject correlation. A major emphasis of the work is the role of the thalamus, which shows transition-linked activity changes and dynamic connectivity patterns, including differential involvement of parvalbumin- and calbindin-associated thalamic subdivisions.
Strengths:
The study is methodologically complex and technically sophisticated. It integrates advanced analytical methods into high-dimensional fMRI data. The application of energy landscape analysis to movie-watching data appears to be novel as well. The finding on the thalamus involved energy state transition and provides a strong linkage to several theories on thalamic control functions, which is a notable strength.
Thanks for your comments on the novelty of our study.
Weaknesses:
The main weakness is the conceptual clarity and advances that this otherwise sophisticated set of analyses affords. A central conceptual ambiguity concerns the energy landscape framework itself. The authors note that the "energy" in this model is not biological energy but a statistical quantity derived from the Boltzmann distribution. After multiple reads, I still have major trouble mapping this measure onto any biological and cognitive operations. BOLD signal is a measure of oxygenation as a proxy of neural activity, and correlated BOLD (functional connectivity) is thought to measure the architecture of information communication of brain systems. The energy framework described in the current format is very difficult for most readers to map onto any neural or cognitive knowledge base on the structure and function of brain systems. Readers unfamiliar with maximum entropy models may easily misinterpret energy changes as reflecting metabolic cost, neural effort, or physiological variables, and it is just very unclear what that measure is supposed to reflect. The manuscript does not clearly articulate what conceptual and mechanistic advances the energy formalism provides beyond a mathematical and statistical report. In other words, beyond mathematical description, it is very hard for most readers to understand the process and function of what this framework is supposed to tell us in regards to functional connectivity, brain systems, and cognition. The brain is not a mathematical object; it is a biological organ with cognitive functions. The impact of this paper is severely limited until connections can be made.
Thank you for your insightful and constructive comments regarding the conceptual clarity of our energy landscape framework. We appreciate your perspective on the challenges of mapping the statistical measure of "energy" derived from the Boltzmann distribution onto biological and cognitive operations. To address these concerns, we will revise our manuscript to clarify our expressions surrounding "energy" and emphasize its probabilistic nature. Additionally, we will incorporate a series of analyses that explicitly relate the features of the energy landscape to cognitive processes and key parameters, such as brain integration and functional connectivity. We believe these changes will help bridge the gap between our mathematical framework and its relevance to understanding brain systems and cognitive functions.
Relatedly, the use of metaphors such as "valleys," "hills," and "routes" in multidimensional measures lacks grounding. Valleys and hills of what is not intuitive to understand. Based on my reading, these features correspond to local minima and barriers in a probability distribution over binarized network activation patterns, but similar to the first point, the manuscript does not clearly explain what it means conceptually, neurobiologically, or computationally for the brain to "move" through such a landscape. The brain is not computing these probabilities; they are measurement tools of "something". What is it? To advance beyond mathematical description, these measurements must be mapped onto neurobiological and cognitive information.
Thank you for your valuable feedback. In our revisions, we would aim to link the concept of rapid transition routes in the energy landscape to cognitive processes, such as narrative understanding and related features. By exploring these connections, we hope to provide a clearer context for how our framework can enhance understanding of cognitive functions and their neural correlates.
This conceptual ambiguity goes back to the Introduction. At the level of motivation, the purpose and deliverables of the study are not defined in the Introduction. The stated goal is "Transitions between distinct cortical brain states modulate the degree of shared neural processing under naturalistic conditions". I do not know if readers will have a clear answer to this question at the end. Is the claim that state transitions cause changes in inter-subject correlation, that they index moments of narrative alignment, or that they reflect changes in attentional or cognitive mode? This level of explanation is largely dissociated from the methods in their current form.
Thank you for highlighting this important point regarding the conceptual clarity in our Introduction. We appreciate your feedback about the motivation and objectives of the study. To clarify the stated goal of investigating how transitions between distinct cortical brain states modulate shared neural processing under naturalistic conditions, we will revise the manuscript to explicitly define the specific claims we aim to address. We will ensure that these explanations are closely tied to the methods employed in our study, providing a clearer framework for our readers.
Several methodological choices can use clarification. The use of a 21-TR window centered on transition offsets is unusually long relative to the temporal scale of fMRI dynamics and to the hypothesized rapidity of state transitions. On a related note, what is the temporal scale of state transition? Is it faster than 21 TRs?
Thank you for your insightful questions regarding our methodological choices. Our focus on specific state transitions necessitated the use of a 21-TR window. While it’s true that other transitions may occur within this window, averaging across the same transitions at different times allows us to identify distinctive thalamic BOLD patterns that precede cortical state transitions. This methodology enables us to capture relevant dynamics while ensuring that we focus on the transitions of interest. We appreciate your feedback, and this clarification will be included in our revised manuscript. We would also add a figure that describe the dwell time of cortical states.
The choice of movie-watching data is a strength. But, many of the analyses performed here, energy landscape estimation, clustering of states, could in principle be applied to resting-state data. The manuscript does not clearly articulate what is gained, mechanistically or cognitively, by using movie stimuli beyond the availability of inter-subject correlation.
Thank you for your question, which closely aligns with a concern raised by Reviewer #1. Our core hypothesis posits that naturalistic stimuli yield a broader set of brain states compared to those observed during resting-state conditions. To support this assertion, we will clearly articulate the findings from previous studies that relate to this hypothesis. Additionally, if appropriate, we will provide a comparative analysis between our data and resting-state data to highlight the differences and emphasize the uniqueness of the brain states elicited by naturalistic stimuli.
Because of the above issues, a broader concern throughout the results is the largely descriptive nature of the findings. For example, the LASSO analysis shows that certain state transitions predict ISC in a subset of regions, with respectable R² values. While statistically robust, the manuscript provides little beyond why these particular transitions should matter, what computations they might reflect, or how they relate to known cognitive operations during movie watching. Similar issues arise in the clustering analyses. Clustering high-dimensional fMRI-derived features will almost inevitably produce structure, whether during rest, task, or naturalistic viewing. What is missing is an explanation of why these specific clusters are meaningful in functional or mechanistic terms.
Thank you for your questions. In our revisions, we will perform additional analyses aimed at linking state transitions to cognitive processes more explicitly. Regarding clustering, we will provide a thorough discussion in the revised manuscript.
Finally, the treatment of the thalamus, while very exciting, could use a bit more anatomical and circuit-level specificity. The manuscript largely treats the thalamus as a unitary structure, despite decades of work demonstrating big functional and connectivity differences across thalamic nuclei. A whole-thalamus analysis without more detailed resolution is increasingly difficult to justify. The subsequent subdivision into PVALB- and CALB-associated regions partially addresses this, but these markers span multiple nuclei with overlapping projection patterns.
This suggestion aligns with the feedback from Reviewer #1. We believe that performing nuclei segmentation with 3T fMRI may not be ideal due to well-documented concerns regarding signal-to-noise ratio and spatial resolution. Therefore, investigating core and matrix cell projections across different thalamic nuclei using 7T fMRI presents a promising avenue for further study.
(1) Van Der Meer J N, Breakspear M, Chang L J, et al. Movie viewing elicits rich and reliable brain state dynamics [J]. Nature Communications, 2020, 11(1): 5004.
(2) Song H, Park B Y, Park H, et al. Cognitive and Neural State Dynamics of Narrative Comprehension [J]. Journal of Neuroscience, 2021, 41(43): 8972-8990.
(3) Song H, Shim W M, Rosenberg M D. Large-scale neural dynamics in a shared low-dimensional state space reflect cognitive and attentional dynamics [J]. Elife, 2023, 12.
(4) Shine J M, Lewis L D, Garrett D D, et al. The impact of the human thalamus on brain-wide information processing [J]. Nature Reviews Neuroscience, 2023, 24(7): 416-430.
(5) Yang M Y, Keller D, Dobolyi A, et al. The lateral thalamus: a bridge between multisensory processing and naturalistic behaviors [J]. Trends in Neurosciences, 2025, 48(1): 33-46.
Reviewer #3 (Public review):
Summary:
In this study, Liu et al. analyze fMRI data collected during movie watching, applied an energy landscape method with pairwise maximum entropy models. They identify a set of brain states defined at the level of canonical functional networks and quantify how the brain transitions between these states. Transitions are classified as "easy" or "hard" based on changes in the inferred energy landscape, and the authors relate transition probabilities to inter-subject correlation. A major emphasis of the work is the role of the thalamus, which shows transition-linked activity changes and dynamic connectivity patterns, including differential involvement of parvalbumin- and calbindin-associated thalamic subdivisions.
Strengths:
The study is methodologically complex and technically sophisticated. It integrates advanced analytical methods into high-dimensional fMRI data. The application of energy landscape analysis to movie-watching data appears to be novel as well. The finding on the thalamus involved energy state transition and provides a strong linkage to several theories on thalamic control functions, which is a notable strength.
Weaknesses:
The main weakness is the conceptual clarity and advances that this otherwise sophisticated set of analyses affords. A central conceptual ambiguity concerns the energy landscape framework itself. The authors note that the "energy" in this model is not biological energy but a statistical quantity derived from the Boltzmann distribution. After multiple reads, I still have major trouble mapping this measure onto any biological and cognitive operations. BOLD signal is a measure of oxygenation as a proxy of neural activity, and correlated BOLD (functional connectivity) is thought to measure the architecture of information communication of brain systems. The energy framework described in the current format is very difficult for most readers to map onto any neural or cognitive knowledge base on the structure and function of brain systems. Readers unfamiliar with maximum entropy models may easily misinterpret energy changes as reflecting metabolic cost, neural effort, or physiological variables, and it is just very unclear what that measure is supposed to reflect. The manuscript does not clearly articulate what conceptual and mechanistic advances the energy formalism provides beyond a mathematical and statistical report. In other words, beyond mathematical description, it is very hard for most readers to understand the process and function of what this framework is supposed to tell us in regards to functional connectivity, brain systems, and cognition. The brain is not a mathematical object; it is a biological organ with cognitive functions. The impact of this paper is severely limited until connections can be made.
Relatedly, the use of metaphors such as "valleys," "hills," and "routes" in multidimensional measures lacks grounding. Valleys and hills of what is not intuitive to understand. Based on my reading, these features correspond to local minima and barriers in a probability distribution over binarized network activation patterns, but similar to the first point, the manuscript does not clearly explain what it means conceptually, neurobiologically, or computationally for the brain to "move" through such a landscape. The brain is not computing these probabilities; they are measurement tools of "something". What is it? To advance beyond mathematical description, these measurements must be mapped onto neurobiological and cognitive information.
This conceptual ambiguity goes back to the Introduction. At the level of motivation, the purpose and deliverables of the study are not defined in the Introduction. The stated goal is "Transitions between distinct cortical brain states modulate the degree of shared neural processing under naturalistic conditions". I do not know if readers will have a clear answer to this question at the end. Is the claim that state transitions cause changes in inter-subject correlation, that they index moments of narrative alignment, or that they reflect changes in attentional or cognitive mode? This level of explanation is largely dissociated from the methods in their current form.
Several methodological choices can use clarification. The use of a 21-TR window centered on transition offsets is unusually long relative to the temporal scale of fMRI dynamics and to the hypothesized rapidity of state transitions. On a related note, what is the temporal scale of state transition? Is it faster than 21 TRs?
The choice of movie-watching data is a strength. But, many of the analyses performed here, energy landscape estimation, clustering of states, could in principle be applied to resting-state data. The manuscript does not clearly articulate what is gained, mechanistically or cognitively, by using movie stimuli beyond the availability of inter-subject correlation.
Because of the above issues, a broader concern throughout the results is the largely descriptive nature of the findings. For example, the LASSO analysis shows that certain state transitions predict ISC in a subset of regions, with respectable R² values. While statistically robust, the manuscript provides little beyond why these particular transitions should matter, what computations they might reflect, or how they relate to known cognitive operations during movie watching. Similar issues arise in the clustering analyses. Clustering high-dimensional fMRI-derived features will almost inevitably produce structure, whether during rest, task, or naturalistic viewing. What is missing is an explanation of why these specific clusters are meaningful in functional or mechanistic terms.
Finally, the treatment of the thalamus, while very exciting, could use a bit more anatomical and circuit-level specificity. The manuscript largely treats the thalamus as a unitary structure, despite decades of work demonstrating big functional and connectivity differences across thalamic nuclei. A whole-thalamus analysis without more detailed resolution is increasingly difficult to justify. The subsequent subdivision into PVALB- and CALB-associated regions partially addresses this, but these markers span multiple nuclei with overlapping projection patterns.
Reviewer #2 (Public review):
Summary:
In this study, Liu et al. investigated cortical network dynamics during movie watching using an energy landscape analysis based on a maximum entropy model. They identified perception- and attention-oriented states as the dominant cortical states during movie watching and found that transitions between these states were associated with inter-subject synchronization of regional brain activity. They also showed that distinct thalamic compartments modulated distinct state transitions. They concluded that cortico-thalamo-cortical circuits are key regulators of cortical network dynamics.
Strengths:
A mechanistic understanding of cortical network dynamics is an important topic in both experimental and computational neuroscience, and this study represents a step forward in this direction by identifying key cortico-thalamo-cortical circuits. The analytical strategy employed in this study, particularly the LASSO-based analysis, is interesting and would be applicable to other data types, such as task- and resting-state fMRI.
Weaknesses:
Due to issues related to data preprocessing, support for the conclusions remains incomplete. I also believe that a more careful interpretation of the "energy" derived from the maximum entropy model would greatly clarify what the analysis actually revealed.
(1) Major Comment 1:
I think the method used for binarization of BOLD activity is problematic in multiple ways.
a) Although the authors appear to avoid using global signal regression (page 4, lines 114-118), the proposed method effectively removes the global signal. According to the description on page 4, lines 117-122, the authors binarized network-wise ROI signals by comparing them with the cross-network BOLD signal (i.e., the global signal): at each time point, network-wise ROI signals above the cross-network signal were set to 1, and the rest were set to −1. If I understand the binarization procedure correctly, this approach forces the cross-network signal to be zero (up to some noise introduced by the binarization of network-wise signals), which is essentially equivalent to removing the global signal. Please clarify what the authors meant by stating that "this approach maintained a diverse range of binarized cortical states in data where the global signal was preserved" (page 4, lines 121-122).
b) The authors might argue that they maintained a diverse range of cortical states by performing the binarization at each time point (rather than within each network). However, I believe this introduces another problem, because binarizing network-wise signals at each time point distorts the distribution of cortical states. For example, because the cross-network signal is effectively set to zero, the network cannot take certain states, such as all +1 or all −1. Similarly, this binarization biases the system toward states with similar numbers of +1s and −1s, rather than toward unbalanced states such as (+1, −1, −1, −1, −1, −1). These constraints and biases are not biological in origin but are simply artifacts of the binarization procedure. Importantly, the energy landscape and its derivatives (e.g., hard/easy transitions) are likely to be affected by these artifacts. I suggest that the authors try a more conventional binarization procedure (i.e., binarization within each network), which is more robust to such artifacts.
Related to this point, I have a question regarding Figure S1, in which the authors plotted predicted versus empirical state probabilities. As argued above, some empirical state probabilities should be zero because of the binarization procedure. However, in Figure S1, I do not see data points corresponding to these states (i.e., there should be points on the y-axis). Did the authors plot only a subset of states in Figure S1? I believe that all states should be included. The correlation coefficient between empirical and predicted probabilities (and the accuracy) should also be calculated using all states.
c) The current binarization procedure likely inflates non-neuronal noise and obscures the relationship between the true BOLD signal and its binarized representation. For example, consider two ROIs (A and B): both (+2%, +1%) and (+0.01%, −0.01%) in BOLD signal changes would be mapped to (+1, −1) after binarization. This suggests that qualitatively different signal magnitudes are treated identically. I believe that this issue could be alleviated if the authors were to binarize the signal within each network, rather than at each time point.
(2) Major Comment 2:
As the authors state (page 5, lines 145-148), the "energy" described in the energy landscape is not biological energy but rather a statistical transformation of probability distributions derived from the Boltzmann distribution. If this is the case, I believe that Figure 2A is potentially misleading and should be removed. This type of schematic may give the false impression that cortical state dynamics are governed by the energy landscape derived from the maximum entropy model (which is not validated).
Reviewer #1 (Public review):
The authors analysed large-scale brain-state dynamics while humans watched a short video. They sought to identify the role of thalamocortical interactions.
Major concerns
(1) Rationale for using the naturalistic stimulus
In terms of brain state dynamics, previous studies have already reported large-scale neural dynamics by applying some data-driven analyses, like energy landscape analysis and Hidden Markov Model, to human fMRI/EEG data recorded during resting/task states. Considering such prior work, it'd be critical to provide sufficient biological rationales to perform a conceptually similar study in a naturalistic condition, i.e., not just "because no previous work has been done". The authors would have to clarify what type of neural mechanisms could be missed in conventional resting-state studies using, say, energy landscape analysis, but could be revealed in the naturalistic condition.
(2) Effects of the uniqueness of the visual stimulus and reproducibility
One of the main drawbacks of the naturalistic condition is the unexpected effects of the stimuli. That is, this study looked into the data recorded from participants who were watching Sherlock, but what would happen to the results if we analyzed the brain activity data obtained from individuals who were watching different movies? To ensure the generalizability of the current findings, it would be necessary to demonstrate qualitative reproducibility of the current observations by analysing different datasets that employed different movie stimuli. In fact, it'd be possible to find such open datasets, like www.nature.com/articles/s41597-023-02458-8.
(3) Spatial accuracy of the "Thalamic circuit" definition
One of the main claims of this study heavily relies on the accuracy of the localization of two different thalamic architectures: matrix and core. Given the conventional or relatively low spatial resolution of the fMRI data acquisition (3x3x3 mm^3), it appears to be critically essential to demonstrate that the current analysis accurately distinguished fMRI signals between the matrix and core parts of the thalamus for each individual.
(4) More detailed analysis of the thalamic circuits
In addition, if such thalamic localisation is accurate enough, it would be greatly appreciated if the authors perform similar comparisons not only between the matrix and core architectures but also between different nuclei. For example, anterior, medial, and lateral groups (e.g., pulvinar group). Such an investigation would meet the expectations of readers who presume some microscopic circuit-level findings.
(5) Rationale for different time window lengths
The authors adopted two different time window lengths to examine the neural dynamics. First, they used a 21-TR window for signal normalisation. Then, they narrowed down the window length to 13-TR periods for the following statistical evaluation. Such a seemingly arbitrary choice of the shorter time window might be misunderstood as a measure to relax the threshold for the correction of multiple comparisons. Therefore, it'd be appreciated if the authors stuck to the original 21-TR time window and performed statistical evaluations based on the setting.
(6) Temporal resolution
After identifying brain states with energy landscape analysis, this study investigated the brain state transitions by directly looking into the fMRI signal changes. This manner seems to implicitly assume that no significant state changes happen in one TR (=1.5sec), which needs sufficient validation. Otherwise, like previous studies, it'd be highly recommended to conduct different analyses (e.g., random-walk simulation) to address and circumvent this problem.
eLife Assessment
This study investigated the dynamics of human cortical network activity with functional magnetic resonance imaging during movie watching and studied the modulation of these dynamics by subcortical areas using an energy landscape mapping method. The authors identified a set of brain states defined at the level of canonical functional networks, quantified how the brain transitions between these states, and related transition probabilities to inter-subject correlations in evoked brain activity. A major emphasis of the work concerns the role of the thalamus, which shows transition-linked activity changes and dynamic connectivity patterns, including differential involvement of parvalbumin- and calbindin-associated thalamic subdivisions. The analytical strategy developed in this study is applicable to other task- and resting-state fMRI data and would be useful for many researchers in the field; however, the evidence supporting the overall conclusions remains incomplete due to limitations associated with fMRI data preprocessing, analysis, and cross-validation.
eLife Assessment
This study investigates whether heavy metal stress can induce maize-like phenotypic and molecular responses in teosinte and whether these responses overlap with genomic regions implicated in domestication. By combining copper and cadmium treatments with quantitative phenotyping, gene-expression analyses, and expanded assessments of nucleotide diversity across a key chromosome 5 interval, the authors provide an integrated view of how abiotic stress responses intersect with domestication-related traits. The significance of the findings is valuable, as the work offers meaningful insights for the subfield of maize evolution and stress biology by extending heavy-metal response analyses to teosinte and linking them to domestication-associated loci, although the evolutionary implications remain indirect. The strength of evidence is solid, with appropriately designed and quantitatively supported experiments that broadly support the claims, but do not yet establish a causal or historical role for heavy metal stress in domestication.
Reviewer #1 (Public review):
In this study, Acosta-Bayona et al. investigate whether heavy metal (HM) stress can induce phenotypic and molecular responses in teosinte parviglumis that resemble traits associated with domestication, and whether genes within a domestication-linked region show patterns consistent with reduced genetic diversity and signatures of selection. The authors exposed both maize and teosinte parviglumis to a fixed dose of copper and cadmium, representing an essential and a non-essential element, respectively. They assessed shoot and root phenotypic traits at a defined developmental stage in plants exposed to HM stress versus control. They then integrated these phenotypic results with expanded analyses of genetic diversity across a broader chromosome 5 interval, which was previously associated with domestication-related traits. Overall, the revisions improve the clarity and the robustness of the analyses, as well as make the conclusions better aligned with the evidence.
The revised manuscript is strengthened by several additions.
(1) The authors broaden the genetic analysis beyond a small set of loci and evaluate nucleotide variability across several genes within the linked chromosome 5 interval, which improves the interpretation of diversity patterns and reduces concerns about a too narrow locus selection or regional linkage effects driving the conclusions.
(2) The expression analyses are now presented with clearer methodological separation and stronger quantitative support. Now, tissue/developmental RT-PCR profiles are distinguished from real-time qPCR assays used to test HM-induced expression changes, with appropriate replication and statistical reporting.
(3) The authors include a transcriptome-scale element by analyzing multiple published and publicly available HM-stress transcriptome datasets and reporting shared differentially expressed genes across studies, which supports the interpretation that the observed expression changes align with broader HM-responsive transcriptional programs.
However, it remains challenging to distinguish which aspects of the HM responses observed here represent novel insight versus patterns already reported in maize HM-stress studies. In addition, the link between HM exposure and domestication history remains indirect: reduced diversity patterns and stress-responsive expression do not, on their own, demonstrate human-driven selection or a specific paleoenvironmental scenario, and alternative explanations related to general stress responses or regional evolutionary processes cannot be fully excluded.
Reviewer #2 (Public review):
Summary:
This work explores the phenotypic developmental traits associated with Cu and Cd responses in teosinte parviglumis, a species evolutionary related to extant maize crops. Cu and Cd could serve as a proxy for heavy metals present in the soils. The manuscript explores potential genetic loci associated with heavy metal responses and domestication. This includes heavy metal transporters which are unregulated during stress. To study that, authors compare the plant architecture of maize defective in ZmHMA1 and speculate on the association of heavy metals with domestication.
Strengths:
Very few studies covered the responses of teosintes to heavy metal stress. The physiological function of ZmHMA1 in maize is also valuable. The idea and speculation section is interesting and well-implemented.
Weaknesses:
Some conclusions are still speculative and future experiment could provide more clues about potential molecular mechanisms for the ideas proposed here.
Author response:
The following is the authors’ response to the original reviews
Public Reviews:
Reviewer #1(Public review):
In this study, Acosta-Bayona et al. aim to better understand how environmental conditions could have influenced specific gene functions that may have been selected for during the domestication of teosinte parviglumis into domesticated maize. The authors are particularly interested in identifying the initial phenotypic changes that led to the original divergence of these two subspecies. They selected heavy metal (HM) stress as the condition to investigate. While the justification for this choice remains speculative, paleoenvironmental data would add value; the authors hypothesize that volcanic activity near the region of origin could have played a role.
The justification of choice to investigate the effects of heavy metal stress is not speculative. As mentioned now in the Abstract, the elucidation of the genome from the Palomero toluqueño maize landrace revealed heavy metal effects during domestication (Vielle-Calzada et al., Science 2009). Our aim was to test the hypothesis that heavy metal (HM) stress influenced the evolutionary transition of teosinte parviglumis to maize.
(1) Although the paper presents some interesting findings, it is difficult to distinguish which observations are novel versus already known in the literature regarding maize HM stress responses. The rationale behind focusing on specific loci is often lacking. For example, a statistically significant region identified via LOD score on chromosome 5 contains over 50 genes, yet the authors focus on three known HM-related genes without discussing others in the region. It is unclear why ZmHMA1 was selected for mutagenesis over ZmHMA7 or ZmSKUs5.
We appreciated the depth and value of this comment.
Maize phenotypic responses to sublethal concentrations to heavy metals – copper (Cu) and cadmium (Cd) in particular - are well characterized and published, and in agreement with our results. In the first section of the Results (pgs 7 and 8), we added pertinent references to clearly show which observations are already known. By contrast, teosinte parviglumis responses are in all cases novel. To our knowledge this is the first study that analyzed in detail the phenotypic response of teosinte to sublethal concentrations of heavy metals, specifically Cu and Cd. We have now emphasized the novelty of these observations (pg 8).
To address the fact that we only focused on three known HM-related genes without discussing others in the statistically significant region identified via LOD score on chr.5, we have added a full section that reads as follows (pgs. 11 to 13 of the new version):
“Large-scale genomic and transcriptomic comparisons indicate that many HM response genes were positively selected across the maize genome.
To expand the results well beyond the analysis of the three genes previously described, we performed a detailed analysis of genetic diversity across the 11.47 Mb genomic region comprised between Z_mSKUs5_ and ZmHMA1. This additional analysis reveals general tendencies in the quantity and nature of loci that were affected by positive selection during the teosinte parviglumis to maize transition in a region identified via LOD score on chr.5. We compared nucleotide variability by using 100 bp bins covering loci composed of two 30 Kb segments up and downstream of coding sequences, respectively, and the coding sequence itself, for 173 genes present within the genomic region comprised between ZmSKUs5 and ZmHMA (Figure S1 and Supplementary File 6). Two types of statistical tests (ANOVA and Wilcoxon) were applied to nucleotide variability comparisons using the entirety of each locus. The Benjamini-Hochber procedure allowed an estimation of the false discovery rate (FDR<0.05) to avoid type I errors (false positives). Although some individual loci appear as differently classified depending on the statistical test applied (22 out of 173 loci), the general differences in nucleotide variability are consistently maintained within the subregions described below. We found that 166 out of 173 loci show signatures of positive selection and are roughly organized in five independent subregions of variable length. The first six loci are consecutively ordered in a 402 Kb subregion that includes ZmSKUs5. A second group of 13 consecutive loci expands over a 1.44 Mb subregion that contains NRAMP ALUMINUM TRANSPORTER1, also involved in HM response through uptake of divalent ions. A third group of 17 consecutive loci expands over 1.28 Mb; eleven contain genes encoding for uncharacterized proteins. The fourth group is composed of 57 consecutive loci expanding over 3.22 Mb and contains genes encoding for DEFECTIVE KERNEL55, AUXIN RESPONSE FACTOR16, and peroxydases involved in responses to oxydative stress. The fifth group contains 12 consecutive loci expanding over 713 Kb and contains ZmHMA1. An additional segment of approximately 1.17 Mb and containing 25 consecutive loci that were positively selected expands away from the ZmSKUs5-ZmHMA1 segment; it also contains several genes encoding for peroxydases. Although multiple loci include genes that could be involved in abiotic stress and oxidative responses, these results suggest that multiple factors other than HM stress could have played a role in the evolutionary mechanisms that affected the genetic diversity of chr.5 during the teosinte parviglumis to maize transition.
To further analyze the possibility that HM response could have played a role in maize emergence and subsequent domestication, we analyzed large scale transcriptomic data corresponding to independent experiments aiming at understanding the response of maize roots to HM stress. Six available transcriptomes were selected for in-depth analysis because they presented a fold change strictly higher than 1, and their results were supported by false discovery rates (FDR<0.05). These six transcriptomes (Table S5) included HM response datasets corresponding to growth conditions that not only incorporated Cu, but also lead (Pb) and chromium (Cr) that were not included in the substrate of our experiments. Transcriptional profiles were obtained from roots of plants at different stages: maize seedlings (Shen et al., 2012; Gao et al., 2015; Zhang et al., 2024a), three week old plantlets (Yang et al., 2023), and plants at V2 stage (Zhang et al., 2024b; Fengxia et al., 2025). A total of 120 genes shared by all six transcriptomes were found to be differentially expressed under HM stress conditions (66 upegulated and 54 downregulated; Figure S3), including ZmSKUs5, ZmHMA1 and ZmHMA7; 52 of them (43.3%) are located in maize loci showing less than 70% of the nucleotide variability found in teosinte parviglumis, suggesting that they were affected by positive selection (Yamasaki et al., 2005; Supplementary File 7). Of 18 mapping in chr.5, twelve are within the 82 cM that fractionates into multiple QTLs under selection during the parviglumis to maize transition. Interestingly, five additional loci containing HM response genes completely lack SNPs within their total length in both parviglumis and maize, and 19 additional loci lack SNPs in at least one 30 Kb segment or their coding region (Supplementary File 7), suggesting the frequent presence of ultraconserved genomic regions in many loci containing HM response genes. When this same analysis was conducted in a set of loci comprising 63 genes previously identified as differentially expressed in response to abiotic stress not directly related to HM responses (hypoxia; nutritional deficiency; soil alkalinity; drought; soil salinity), 18 loci (28.6%) showed less than 70% of the nucleotide variability found in teosinte parviglumis. Only one of them maps in chr.5 and none contained segments or coding regions lacking SNPs in parviglumis or maize. These results suggest that in contrast to other types of abiotic stress response genes, loci comprising a large set of genes that unambiguously respond to HM stress caused by chemical elements of diverse nature were affected by positive selection during the parviglumis to maize transition, irrespectively of their position in the genome.”
The detailed analysis of genetic diversity across 11.47 Mb of chr.5 in the genomic region comprised between ZmSKUs5 and ZmHMA1 in presented as Supplementary File 6.
The analysis of genetic diversity in loci encompassing heavy metal response genes shared by six transcriptomes and abiotic stress controls are described in Supplementary File 7.
In the Discussion (pgs. 21 and 22), we added a paragraph section that reads as follows:
“Although loss of genetic diversity is usually the result of human selection during domestication, it can also represent a consequence of natural selective pressures favoring fitness of specific teosinte parviglumis allelic variants better adapted to environmental changes and subsequently affected by human selection during the domestication process. This possibility is reflected by widely spread selective sweeps affecting a large portion of chr.5 that contains hundreds of genes showing signatures of positive selection. The analysis of 11.47 Mb covering the ZmHMA1ZmSKUs5 segment confirms the presence of large but discrete genomic subregions that were positively selected during the teosinte parviglumis to maize transition. Although several contain genes involved in HM response and oxidative stress, the diversity of gene functions does not necessarily favor abiotic stress over other factors that could be at the origin of selective forces affecting these regions. By contrast, a large scale transcriptomic survey indicates that genes consistently responding to HMs (Cu, Cd, Pb and Cr ) show signatures of positive selection at unusual high frequencies (43.3%) as compared to loci containing genes responding to other types of abiotic stress (28.6%). Our identification of HM response genes affected by positive selection is far from being exhaustive. Nevertheless, it agrees with the expected effects of a widespread selective sweep caused by environmental changes that influenced the parviglumis to maize transition at the genetic level. Of intriguing interest are 24 loci that partially or completely lack SNPs in both teosinte parviglumis and maize, suggesting possible genetic bottlenecks occurred before the teosinte to maize transition. Examples of other edaphological factors driving genetic divergence either in the teosintes or maize include local adaptation to phosphorus concentration in mexicana and parviglumis (Aguirre-Liguori et al. 2019), and fast maize adaptation to changing iron availability through the action of genes involved in its mobilization, uptake, and transport (Benke and Stich 2011). Our results reveal a teosinte parviglumis environmental plasticity that could be related to the function of HM response genes positively selected during the teosinte parviglumis to maize transition. Previous studies have demonstrated that transposable elements (TEs) contribute to activation of maize genes in response to abiotic stress, affecting up to 20% of the genes upregulated in response to abiotic stress, and as many as 33% of genes that are only expressed in response to stress (Makarevitch et al., 2015). It is therefore possible that the HM response of some specific genes that influenced maize emergence or domestication could be mediated by TEs influencing or driving their transcriptional regulation.”
The mutagenic analysis of ZmHMA7 and ZmSKUs5 will be included in a different publication.
(2) The idea that HM stress impacted gene function and influenced human selection during domestication is of interest. However, the data presented do not convincingly link environmental factors with human-driven selection or the paleoenvironmental context of the transition. While lower nucleotide diversity values in maize could suggest selective pressure, it is not sufficient to infer human selection and could be due to other evolutionary processes. It is also unclear whether the statistical analysis was robust enough to rule out bias from a narrow locus selection. Furthermore, the addition of paleoclimate records (Paleoenvironmental Data Sources as a starting point) or conducting ecological niche modeling or crop growth models incorporating climate and soil scenarios would strengthen the arguments.
We think that the detailed analysis of genetic diversity across 11.46 Mb covering the ZmSKUs5 to ZmHMA1 genomic segment – and its statistical validation - provides a precise understanding of the selective sweep dimensions in chr.5.
We do agree that lower nucleotide diversity values in maize are not sufficient to infer human selection. Because many HM response loci show unusually low nucleotide variability in teosinte parviglumis (see the results of the transcriptomic analysis presented above), we cannot discard the possibility that natural selection forces related to environmental changes could have affected native populations of teosinte parviglumis.
To further explore the link between environmental factors, natural or human-driven selection, and the paleoenvironmental context of the parviglumis to maize transition, we revised paleoenvironmental and geological records and added results in two sections that read as follows (pgs. 17 to 20):
“Paleoenvironmental studies reveal periods of climatic instability in the presumed region of maize emergence during the early Holocene.
It is well accepted that temperature fluctuations, volcanism and anthropogenic impact shaped the distribution and abundance of plant species in the Transmexican Volcanic Belt (TMVB) during the last 14,000 years (Torrescano-Valle et al. 2019). The TMVB has produced close to 8000 volcanic structures (Ferrari et al., 2011), transforming the relief multiple times, and causing hydrographic and soil changes that actively modified the distribution and composition of plant communities in Central Mexico. Detailed paleoenvironmental data for the Pleistocene and Holocene is available for several lacustrine zones located within the 50 to 100 km range of the region currently considered the cradle of maize domestication (Matzuoka et al. 2002; Figure 5a). In Lake Zirahuén (102°44′ W; 19°26′ N and approximately 2075 meters above sea level; index [i] in Figure 5a), pollen, microcharcoal and magnetic susceptibility analyses of two sedimentary sequences reveals three periods of major ecological change during the early and middle Holocene.
Between 9500 and 9000 calibrated years before present (cal yr BP), pine forests seem to have been associated with summer insolation increases. A second peak of forest change occurred at around 8200 cal yr BP, coinciding with cold oscillations documented in the North Atlantic. Finally, events occurred between 7500 and 7100 cal yr BP shows an abrupt change in the plant community related to humid Holocene climates and a presumed volcanic event (Lozano-García et al., 2013). The environmental history of the central Balsas watershed has also been documented by pollen, charcoal, and sedimentary analysis conducted in three lakes and a swamp of the Iguala valley (Piperno et al. 2007). Paleoecological records of lake Ixtacyola (8°20N, 99°35W and approximately 720 meters above sea level; index [ii] in Figure 5a) and lake Ixtapa (8°21N, 99°26W) indicate that an important increase in temperature and precipitation occurred between 13000 and 10000 cal yr BP. The pollen record of Ixtacyola showed that members of the genus Zea were already part of the vegetation coverage by 12900 to 13000 cal yr BP, suggesting that some teosintes – likely including parviglumis - were commonly found at elevation areas where they do not presently occur. Lake Almoloya (also named Chignahuapan; 19°05N, 99°20E and approximately 2575 meters above sea level; index [iii] in Figure 5a) in the upper Lerma basin is only 20 Km from the crater of the Nevado de Toluca that is responsible for creating the late Pleistocene Upper Toluca Pumice layer over which the Lerma basin is deposited. Pollen records indicate the presence of Zea species by 11080 to 10780 cal yr BP. As for other locations, an important period of climatic instability prevailed between 11500 and 8500 cal yr BP (Ludlow-Wiechers et al., 2005). Humidity fluctuations occurred until 8000 cal yr BP, with a stable temperate climate between 8500 and 5000 cal yr BP. Although pollen and diatom studies are often difficult to interpret at a regional scale, the overall results presented above suggest consistent periods of Zea plants present in periods of environmental and climatic instability that correlate with the history of volcanic activity during the early Holocene, as described in the next section.
Temporal and geographical convergence between volcanic eruptions and maize emergence during the Holocene.
Current evidence indicates that the emergence and domestication of maize initiated in Mesoamerica some time around 9,000 yr BP (Matsuoka et al. 2002). The current location of teosinte parviglumis populations that are phylogenetically most closely allied with maize are currently distributed in a region located between the Michoacan-Guanajuato Volcanic Field (MGVF) at their northwest, and the Nevado de Toluca and Popocatéptl volcanoes at their east and northeast (Figure 5a; Matsuoka et al. 2002). Precise records of field data indicate that ten accessions were collected in the Balsas river drainage near Teloloapan and Sierra de Huautla (Guerrero), at approximately 100 km south of the Nevado de Toluca crater. Three other accessions were collected near Tejupilco de Hidalgo and Zacazonapan (Estado de México), at approximately 50 to 60 km from the Nevado de Toluca crater (8762, JSG y LOS-161, and JSG-391). And four other accessions were located in Michoacan, at a location within the MGVF (accession 8763), or at mid-distance between the MGVF and the Nevado de Toluca crater (accessions JSG y LOS-130, 8761, and 8766).
The most important source of HMs in ancient soils of Mesoamerica is TMBV-dependent volcanic activity through short- and long-term effects related to lava deposits, ores, hydrothermal flow, and ash (Torrescano-Valle et al. 2019). The Nevado de Toluca volcano produced one of the most powerful eruptions from central Mesoamerica in the Holocene, giving rise to the Upper Toluca Pumice deposit at 12621 to 12025 cal yr BP (Arce et al., 2003; Figure 5b). The pumice fallout blanketed the Lerma and Mexico basins with 40 cm of coarse ash (Bloomfield and Valastro 1977; Arce et al. 2003). A second eruption dated by 36Cl exposure occurred at 9700 cal yr BP (Arce et al. 2003; Figure 5b), and the most recent eruption occurred at 3580 to 3831 cal yr BP (Macías et al. 1997). During the early and middle Holocene, the Popocatéptl volcano produced at least four eruptions dated 13037-12060, 10775–9564, 8328-7591, and 6262-5318 cal yr BP (Siebe et al. 1997); three other important eruptions occurred during the late Holocene, between 2713 and 733 cal yr BP (Siebe and Macías, 2006). In addition, the MGFV is a monogenetic volcanic field for which 23 independent eruptions have been documented during the Holocene, 21 of them located towards the southern part of the field, in close proximity to the region harboring some of the teosinte parviglumis populations most closely related to maize. Three of these eruptions occurred in the early Holocene (El Huanillo 1130 to 9688 cal yr BP; La Taza 10649 to 10300 cal yr BP; Cerro Grande 10173 to 9502 cal yr BP; Figure 5b), and three others during the initial period of the middle Holocene, between 8400 and 7696 cal yr BP (La Mina, Los Caballos, and Cerro Amarillo; Figure 5b). On average, a new volcano forms every ~435 years in the MGFV (Macías and Arce, 2019). No less than 16 other eruptions occurred between 7159 cal yr BP and the present time (Figure 5b). Soils of volcanic origin (andosols) are currently distributed in regions north-west from the Nevado de Toluca and Popocatéptl craters, in close proximity with teosinte parviglumis populations most closely related to maize (Figure S5). Although modern distribution of teosinte populations may differ from their distribution around 9000 yr BP, and unknown populations more closely related to maize may yet to be discovered, this data indicates that the date and region where maize emerged is convergent with the dates and locations of several volcanic eruptions occurred during the Holocene in that same region.”
(3) Despite the interest in examining HM stress in maize and the presence of a pleiotropic phenotype, the assessment of the impact of gene expression is limited. The authors rely on qPCR for two ZmHMA genes and the locus tb1, known to be associated with maize architecture. A transcriptomic analysis would be necessary to 1- strengthen the proposed connection and 2- identify other genes with linked QTLs, such as those in the short arm of chromosome 5.
Real-time qPCR is an accurate and reliable approach to assess the expression of specific genes such as ZMHMA1 and Tb1, but we agree that our results do not allow to establish a direct regulatory link between the function of Tb1, the pleiotropic parviglumis phenotype under HM stress, and the function of ZmHMA1. We also concede that the large transcriptional analysis of HM response in maize (presented above) does not allow to elucidate a possible connection between these two genes. We have substantially downplayed our conclusion in this section by modifying the end of the section in pg. 17, that now reads:
“These results do not allow to directly link the regulation of ZmHMA1 expression to the function of Tb1; however, they open an opportunity to further investigate the possibility that under HM stress, the formation of secondary ramifications in teosinte parviglumis could be repressed by transcription factors of the TCP family, including Tb1.”
This is also emphasized in the Discussion (pg 21) as follows:
“Under HM stress, we also show that Tb1 is overexpressed in the apical meristem of teosinte parviglumis, suggesting that formation of secondary ramifications is repressed by Tb1 function under HM stress, as in extant maize. At this stage we cannot discard the possibility that Tb1 upregulation in parviglumis reflects a more generalized response to abiotic stress; however, the expression ZmHMA1 is downregulated in W22 wild-type maize meristems in the presence of HMs but upregulated in teosinte parviglumis meristems, suggesting that a specific regulatory shift relating HM responses and ZmHMA1 function occurred during the teosinte parviglumis to maize transition.”
On the other hand, the transcriptional analysis the identification of 52 additional HM response genes showing signatures of positive selection occurred during the parviglumis to maize transition; 12 of them map to chr.5 within the region having linked QTLs within the short arm of chr.5. So far, genes involved in HM response and oxidative stress represent the most prevalent class of genes identified within the genomic region showing pleiotropic effects on domestication and multiple linked QTLs in chr.5.
Reviewer #2 (Public review):
Summary:
This work explores the phenotypic developmental traits associated with Cu and Cd responses in teosinte parviglumis, a species evolutionary related to extant maize crops. Cu and Cd could serve as a proxy for heavy metals present in the soils. The manuscript explores potential genetic loci associated with heavy metal responses and domestication identified in previous studies. This includes heavy metal transporters, which are unregulated during stress. To study that, the authors compare the plant architecture of maize defective in ZmHMA1 and speculate on its association with domestication.
Strengths:
Very few studies covered the responses of teosintes to heavy metal stress. The physiological function of ZmHMA1 in maize also gives some novelty in this study. The idea and speculation section is interesting and well-implemented.
Weaknesses:
The authors explored Cu/Cd stress but not a more comprehensive panel of heavy metals, making the implications of this study quite narrow. Some techniques used, such as end-point RT-PCR and qPCR, are substandard for the field. The phenotypic changes explored are not clearly connected with the potential genetic mechanisms associated with them, with the exception of nodal roots. If teosintes in response to heavy metal have phenotypic similarity with modern landraces of maize, then heavy metal stress might have been a confounding factor in the selection of maize and not a potential driving factor. Similar to the positive selection of ZmHMA1 and its phenotypic traits. In that sense, there is no clear hypothesis of what the authors are looking for in this study, and it is hard to make conclusions based on the provided results to understand its importance. The authors do not provide any clear data on the potential influence of heavy metals in the field during the domestication of maize. The potential role of Tb-1 is not very clear either.
Thank you for these comments. We have now emphasized our hypothesis in the abstract and the last paragraph of the Introduction (pg. 6):
“To test the hypothesis that heavy metal (HM) stress influenced the evolutionary transition of teosinte to maize, we exposed both subspecies to sublethal concentrations of copper and cadmium etc…”
A comprehensive panel of heavy metals would not be more accurate in terms of simulating the composition of soils evolving across 9,000 years in the region where maize presumably emerged. Copper (Cu) and cadmium (Cu) correspond each to a different affinity group for proteins of the ZmHMA family. ZmHMA1 has preferential affinity for Cu and Ag (silver), whereas ZmHMA7 has preferential affinity to Cd, Zn (zinc), Co (cobalt), and Pb (lead). Since these P1b-ATPase transporters mediate the movement of divalent cations, their function remains consistent regardless of the specific metal tested, provided it belongs to the respective affinity group. By applying sublethal concentrations of Cd (16 mg/kg) and Cu (400 mg/kg), we caused a measurable physiological response while allowing plants to complete their life cycle, including the reproductive phase, facilitating a comprehensive analysis of metal stress adaptation. Whereas higher doses impair flowering or are lethal, lower Cu/Cd concentrations do not consistently show conventional phenotypic responses such as reduced plant growth (AbdElgawad et al. 2020; Atta et al., 2023)
Based on comments by both reviewers, we present now a large transcriptional analysis that incorporates HM responses to lead (Pb) and chromium (Cr), in addition to Cu. Results show that many genes responding to Pb and Cr were also positively selected across the maize genome, suggesting that HM stress led to a ubiquitous rather than a specific evolutionary response to heavy metals (please see our response to Reviewer#1 and sections in pgs. 11 to 13) .
Real-time qPCR is an accurate and reliable approach to assess the expression of specific genes such as ZMHMA1 and Tb1, but we agree that our results do not allow to establish a direct regulatory link between the function of Tb1, the pleiotropic parviglumis phenotype under HM stress, and the function of ZmHMA1. We also concede that the large transcriptional analysis of HM response in maize (presented above) does not allow to elucidate a possible connection between these two genes. Therefore, we have substantially downplayed our conclusion in this section by modifying the end of the section in pg. 17, that now reads:
“These results do not allow to directly link the regulation of ZmHMA1 expression to the function of Tb1; however, they open an opportunity to further investigate the possibility that under HM stress, the formation of secondary ramifications in teosinte parviglumis could be repressed by transcription factors of the TCP family, including Tb1.”
There are two phenotypic changes clearly connected with the genetic mechanisms involved in the parviglumis to maize transition: plant height and the number of seminal roots (not nodal roots). These changes have been now emphasized in the Abstract and the description of the results.
Regarding the possibility for HM stress to represent a confounding factor in the selection of maize and not a driving factor, we expanded the genomic analysis of genetic diversity well beyond the analysis of the three genes under initial study, to cover a segment of 11.47 Mb comprised between ZmSKUs5 and ZmHMA1. We compared nucleotide variability by using 100 bp bins covering loci composed of two 30 Kb segments up and downstream of coding sequences, respectively, and the coding sequence itself, for 173 genes present within the genomic region comprised between ZmSKUs5 and ZmHMA (Figure S1 and Supplementary File 6). The full analysis is presented in a new section pgs. 11 and 12. We found that 166 out of 173 loci show signatures of positive selection and are roughly organized in five independent subregions of variable length. Four out of five subregions contain more than one HM or oxidative stress response gene within loci showing signatures of positive selection. Although multiple factors other than HM stress could have played a role in the evolutionary mechanisms that affected the genetic diversity of chr.5, large scale transcriptomic data corresponding to independent experiments aiming at understanding the response of maize roots to HM stress allowed the identification of 49 additional HM response genes within loci showing positive selection across the genome, a proportion (43.3%) far greater than the proportion of loci containing response genes to other types of abiotic stress not related to HMs (28.6%). These results are described in detail in pgs. 12 and 13 (Figure S3 and Supplementary File 7). These results provide strong evidence in favor of HM stress and not another factor driving positive selection.
We now provide precise and pertinent paleoenvironmental data on the potential influence of heavy metals in the field. In sections pgs. 17 to 20 we review paleoenvironmental studies revealing periods of climatic instability in the presumed region of maize emergence during the early Holocene, and data indicating that the date and region where maize emerged is convergent with the dates and locations of several volcanic eruptions occurred during the early and middle Holocene in that same region. Please see responses to Reviewer#1 for details.
We agree that our results do not allow to establish a direct regulatory link between the function of Tb1, the pleiotropic parviglumis phenotype under HM stress, and the function of ZmHMA1. We also concede that the large transcriptional analysis of HM response in maize (presented above) does not allow to elucidate a possible connection between these two genes. Therefore, we have substantially downplayed our conclusion in this section by modifying the end of the section in pg. 17, that now reads:
“These results do not allow to directly link the regulation of ZmHMA1 expression to the function of Tb1; however, they open an opportunity to further investigate the possibility that under HM stress, the formation of secondary ramifications in teosinte parviglumis could be repressed by transcription factors of the TCP family, including Tb1.”
This is also emphasized in the Discussion (pg 21) as follows:
“Under HM stress, we also show that Tb1 is overexpressed in the apical meristem of teosinte parviglumis, suggesting that formation of secondary ramifications is repressed by Tb1 function under HM stress, as in extant maize. At this stage we cannot discard the possibility that Tb1 upregulation in parviglumis reflects a more generalized response to abiotic stress; however, the expression ZmHMA1 is downregulated in W22 wild-type maize meristems in the presence of HMs but upregulated in teosinte parviglumis meristems, suggesting that a specific regulatory shift relating HM responses and ZmHMA1 function occurred during the teosinte parviglumis to maize transition.”
Recommendations for the authors:
Reviewer #1 (Recommendations for the authors):
While the dataset generated provides an interesting foundation for hypothesis testing on HM stress and domestication, the current data do not sufficiently support the conclusions of the manuscript.
(1) The description of maize and teosinte architecture under HM stress is well presented.
However, traits like shoot height, leaf size reduction, and biomass loss also occur under other environmental stresses such as drought and salinity. Additional evidence beyond shoot and root architecture would help validate the link between tb1 expression and specific ZmHMA genes under HM stress, or whether it reflects a more generalized stress response.
We have already addressed in detail this point in the public response to Reviewer#1.
(2) The nucleotide variability analysis is interesting, but I would have liked to see additional information to clarify the choice of the data selection and the strength of the conclusions with human selection.
We have already addressed in detail this point in the public response to Reviewer#1.
a) The choice of Tripsacum dactyloides as the outgroup to determine nucleotide variability seems to be distant, and I wonder whether other combinations with a closer outgroup or multiple outgroups were tried to provide a more accurate context.
Nucleotide variability in Tripsacum dactyloides is used to graphically illustrate an external reference and not as an outgroup in the extended analysis of genetic diversity at the locus and genomic level. We did not used Tripsacum dactyloides as an outgroup in our statisticalm analysis. We could have indeed a closer teosinte subspecies as an outgroup, but at this stage no data warrants that environmentally-related selective pressures could have affected genetic diversite in other teosintes. This possibility in currently being investigated.
b) Evolutionary differences not related to human influence could affect the results. The phrase "order of magnitude difference in π values" needs statistical validation (e.g., confidence intervals, p-values).
We agree and have eliminated the sentence, as it is no longer relevant at the light of the detailed genomic analysis of genetic diversity prsented in Supplementary File 6.
c) The comparison with ZmGLB1, a neutral control locus, suggests that domestication-related changes in nucleotide variability are specific to the three candidate genes. However, the concept of neutrality is complex, and while ZmGLB1 may be considered neutral in this case, the argument does not address the possibility of other factors, such as linked selection, that could influence variability in these genes. Referencing Hufford et al. is insufficient and would require a deeper argument.
We also agree with this comment. We think that the influence and consequences of linked selection are now well documented for 11.46 Mb analyzed in chr.5 (pgs 11 and 12) in the main text and Supplementary File 6).
(3) The statement: "Our evidence indicates that HM stress revealed a teosinte parviglumis environmental plasticity that is directly related to the function of specific HM response genes that were affected by domestication through human selection" is not supported by the presented data. The rationale for the specific Cd/Cu dosage used is unclear. A dose-response gradient would better demonstrate the nature and strength of the plastic response.
Previous reports support the rationale for the specific HM dosage in this study; Cu/Cd dosage response gradients have been conducted in maize (AbdElgawad et al. 2020; Atta et al., 202), but since no studies have been conducted in teosinte, we reasoned that it was important to apply the same treatment to both subspecies. We have now emphasized this rationale by adding the following in pg XX: “Whereas higher doses impair flowering or are lethal, lower Cu/Cd concentrations do not consistently show conventional phenotypic responses such as reduced plant growth (AbdElgawad et al. 2020; Atta et al., 2023)”.
We agree that the statement raised by the reviewer needed revision at the light of our results. We did revise the statement to accurately reflect our current evidence as follows: “Our results reveal a teosinte parviglumis environmental plasticity that is likely related to the function of HM response genes positively selected during the teosinte parviglumis to maize transition.”
(4) In maize, TEs are known to influence gene expression under abiotic stress, including for tb1 (PMID: 25569788). Since the author appears to make a causative conclusion between ZmHMA1, TB1, and HM stress, I would have liked to see a whole-transcriptome analysis and not a curation of two genes to determine whether other factors, such as TEs, can have that would lead to similar outcomes.
We agree that is definetely a possibility that we have not investigated at this stage. However, we added a pargraph to reflect this pertinent suggestion:
“Previous studies have demonstrated that transposable elements (TEs) contribute to activation of maize genes in response to abiotic stress, affecting up to 20% of the genes upregulated in response to abiotic stress, and as many as 33% of genes that are only expressed in response to stress (Makarevitch et al., 2015). It is therefore possible that the HM response of some specific genes that influenced maize emergence or domestication could be mediated by TEs influencing or driving their transcriptional regulation.”
(5) I would suggest that the authors carefully review the tables, figures, and the corresponding legends. For example :
a) Table 2 is called before Table 1, I would therefore suggest changing the numbering to reflect the paragraph order.
Thank you for your help, we did change the order of the Tables in the new version.
b) In Table 2, it is not clear whether the P value applies to the mean difference between WT and the mutant zmhma1, either in the presence or the absence of heavy metals. In addition, the authors need to use the P-value to estimate the differences between WT in the absence vs presence of HM, and WT in the absence of HM versus the mutant in the absence of HM (idem for presence).
We did address this issue in detail and added P-values and specific pairwise comparisons to that Table (now Table 1). Data are presented as mean ± standard deviation and were tested by a paired Student’s T-Test. When the effects were significant according to T-Test, the treatments were compared with the Welch two sample T-Test at P < 0.05.
c) Table 1 and Table 2: Indicate what type of statistical test was used and the number of plants used for each experiment (n). Also, I recommend the use of scientific notation for the P-values.
The statistical tests have now been indicated, scientific notation has been added to the P-values; the number of plants and biological replicates are indicated in the Methods section.
d) Lines 202 and 204: I assume Table 1 should be called instead of Table 2.
This error has been corrected.
e) General: In the text, when significance is highlighted along with measurements, the p-value needs to be added.
We have added the P-value along the measurement for all significant differences.
f) In the text, it is also mentioned that "the expression of ZMHMA1 was significantly increased in the presence of HMs (Figure 3c)". We are looking here at an RT-PCR, which is qualitative and without a robust quantitative comparison and statistics, I cannot conclude this assessment based on the presented evidence. No statistical measure is indicated here.
Panel 3c is not RT-PCR but a real-time qPCR, showing relative fold-change, normalized to actin, with a 3-technical triplicate per 3 biological replicates). We have added error bars (SD) and P-values represented by asterisks (calculated with Student's t statistic) to support significant differences (P<0.05 and P<0.01). ZmHMA1 expression was significantly increased in the presence of HMs only in teosinte; there was no significant difference in maize.
g) Figure 3 should at least have the gene name in the figure to quickly understand the figure panel. The key conserved domains should also be identified.
We agree and apologize for the omission. The gene names have been added adjacent to the structures.
h) Sentence at lines 459-460 lacks words and punctuation.
This unfortunate rror has also been corrected.
i) Figure S1, the reference Lemmon and Doebley, 2024 should be Lemmon and Doebley, 2014 to harmonize with the text.
The correct year is 2014. We have corrected this error.
Reviewer #2 (Recommendations for the authors):
(1) The narrative should be clearer, starting with a clearer hypothesis that is later sustained or not in the results, and then discussed in the idea and speculation section.
Thank you for the comment. We have clarified the hypothesis, it is included in the abstract and the last paragraph of the Introduction. We hope it is now clear that the evidence presented supports our hypothesis
(2) Focus more on traits that are relevant, for example, nodal and seminal roots.
We modified the text to emphasize three relevant traits. In the case of teosinte under HM stress, absence of tillering and increase in the number of female inflorescences. In the case of the zmha1 mutant under HM stress, differences in the number of nodal roots, and differences in height.
(3) RNA-seq in Cu/Cd stress could make the work much more useful and complete.
As previously mentioned, we have incorporated a large scale transcriptional analysis on the basis of six transcriptomes statistically validated (Table S5). Please see sections pgs. 11 to 13 for details.
eLife Assessment
This is an important work implementing data mining methods on IMC data to discover spatial protein patterns related to the triple-negative breast cancer patients' chemotherapy response. The evidence supporting the claims of the authors is solid, although more detailed methodology clarification and validation are needed. While the accuracy of the methods is not very high, the work shows potential for translational application.
Reviewer #1 (Public review):
Summary:
The study presents a computational pipeline for Imaging Mass Cytometry (IMC) analysis in triple-negative breast cancer (TNBC). Analyzing over 4 million cells from 63 patients, it uncovers a distinct spatial organization of cell types between chemotherapy responders and non-responders. Using graph neural networks, the framework predicts treatment response from pre-treatment samples and identifies key predictive protein markers and cell types associated with therapeutic outcomes.
Strengths:
(1) The study presents a novel framework leveraging Imaging Mass Cytometry (IMC) to investigate spatial patterns and differences among patient groups, which has been rarely explored.
(2) It uncovers several compelling biological insights, providing a deeper understanding of the complex interactions within the tumor microenvironment.
(3) The analysis pipeline is comprehensive, incorporating batch correction, cell type clustering, and a graph neural network based on cell-cell interactions to predict chemotherapy response, demonstrating methodological innovation and thoughtful design.
Weaknesses:
(1) Some figure references are inconsistent. For example, Figure 4C is cited on Page 11, but it does not appear in the manuscript.
(2) Several explanations and methodological details related to the figures remain unclear. For instance, it is not explained how the overall abundance of cell types in Figures 3D and 3E was calculated, how relative abundance was derived, or how these calculations were adjusted when split by proliferation status. In Table 2, it seems that model performance is reported using different node features (protein abundance or cell type), but the text in the second paragraph suggests that both were used simultaneously. This inconsistency is confusing. Additionally, the process for constructing the cell-cell contact graph, including how edges are defined, should be described more clearly.
(3) The GNN performance appears modest. An AUROC of 0.71 can indicate meaningful predictive power for chemotherapy response, but it remains moderate. Including a baseline comparison would help contextualize the model's effectiveness. Furthermore, the reported value of 0.58 in Table 2 is relatively low, and its meaning or implication is not clearly explained.
(4) Some methodological choices are not well justified. For example, the rationale for selecting the Self-Organizing Map (SOM) for clustering over other clustering methods is not discussed.
(5) The manuscript would benefit from a more explicit discussion of how studies using IMC-based spatial analysis relate to or differ from those employing spatial transcriptomics, particularly in terms of their interpretability.
Reviewer #2 (Public review):
Summary:
The current research presents an end-to-end computational workflow for large-scale Imaging Mass Cytometry (IMC) data and applies it to 813 regions of interest (ROIs) comprising over 4 million cells from 63 TNBC patients. The study integrates image preprocessing (IMC-Denoise and CLAHE), cell segmentation (Mesmer), phenotyping (Pixie), spatial neighborhood analysis (SquidPy), collagen feature extraction, and graph neural network (GNN) modeling to identify spatial-molecular determinants of chemotherapy response. The major observations include T-cell exclusion in non-responders, persistent fibroblast-macrophage co-localization post-therapy, and the identification of B7H4, CD11b, CD366, and FOXP3 as predictive markers via GNN explainability analysis. The work has been implemented on a rich dataset and integrated with spatial and molecular information. The manuscript is well written and addresses an important clinical question.
Strengths:
(1) The study analyzes 813 ROIs and over 4 million cells, which is an exceptionally large IMC dataset, and allows the authors to investigate spatial determinants of chemotherapy response in TNBC with considerably more statistical power than prior studies. It clearly shows an integrated spatial-proteomic analysis on a large IMC dataset.
(2) The work reveals robust, conceptually meaningful tissue patterns with CD8+ T-cell exclusion from tumor regions in non-responders and increased fibroblast-macrophage spatial proximity that align with existing biological understanding of immunosuppressive microenvironments in TNBC. These findings highlight spatial organization, rather than simple cell abundance, as a key differentiator of treatment response.
(3) Novel use of GNNs for chemoresponse prediction in IMC data helps in demonstrating that spatial and molecular features captured simultaneously can provide predictive information about treatment response. The use of GNNExplainer adds interpretability of the selected features, identifying immune-regulatory markers such as B7H4, CD366, FOXP3, and CD11b as contributors to chemoresponse heterogeneity.
(4) The work complements emerging spatial transcriptomic analyses from the same SMART cohort and provides a scalable computational framework likely to be useful to other IMC and spatial-omics researchers.
Weaknesses:
(1) Some analytical components lack quantitative validation, limiting confidence in specific claims, such as CLAHE-based batch correction applied before segmentation are evaluated primarily through qualitative visualization rather than quantitative metrics. Similarly, the cell-type annotations produced via Pixie and manual thresholds lack independent validation, making it harder to assess the accuracy of downstream spatial and predictive analyses.
(2) Predictive modeling performance is moderate and may be influenced by dataset structure; the GNN achieves AUROC ~0.71, which is meaningful but still limited, and the absence of external validation or multiple cross-validation strategies raises questions about generalizability. The predictive insights are promising but not yet sufficiently strong to support clinical decision-making.
(3) Pre- and post-treatment comparisons are constrained to non-responders and pathologist-selected ROIs.
Reviewer #3 (Public review):
Summary:
Luque et al. proposed stratifying chemotherapy response in triple-negative breast cancer based on spatial protein patterns from IMC data. This proposed method combines GNN with GNNexplainer to identify several important protein markers and cell types related to chemotherapy. As one of the most significant challenges in cancer research, this work holds great potential for translational medicine.
Strengths:
(1) Targeting the invention decision-making of TNBC, one of the prominent challenges in the field.
(2) Cutting-edge spatial proteomics data with enough cohort and clinical outcome.
(3) Appropriate usage of cutting-edge machine learning models and comprehensive analysis.
Weaknesses:
(1) More scientific rigor is needed for machine learning benchmarking.
(2) More depth is needed, comparing related works with using similar approaches.
eLife Assessment
This important study focuses on the molecular mechanisms underlying the generation of neuronal diversity. Taking advantage of a well-defined neuroblast lineage in Drosophila, the authors provide convincing evidence that two transcription factors of the conserved forkhead box (FOX) family offer a mechanistic link between transient spatial cues that specify neuroblast identity and terminal selector genes that define post-mitotic neuron identity. The findings will be of interest to developmental neurobiologists.
Reviewer #1 (Public review):
Summary:
Lai and Doe address the integration of spatial information with temporal patterning and genes that specify cell fate. They identify the Forkhead transcription factor Fd4 as a lineage-restricted cell fate regulator that bridges transient spatial transcription factors to terminal selector genes in the developing Drosophila ventral nerve cord. The experimental evidence convincingly demonstrates that Fd4 is both necessary for late-born NB7-1 neurons, but also sufficient to transform other neural stem cell lineages toward the NB7-1 identity. This work addresses an important question that will be of interest to developmental neurobiologists: How cell identities defined by initial transient developmental cues can be maintained in the progeny cells, even if the molecular mechanism remains to be investigated. In addition, the study proposes a broader concept of lineage identity genes that could be utilized in other lineages and regions in the Drosophila nervous system and in other species.
Strengths:
While the spatial factors patterning the neuroepithelium to define the neuroblast lineages in the Drosophila ventral nerve cord are known, these factors are sometimes absent or not required during neurogenesis. In the current work, Lai and Doe identified Fd4 in the NB7-1 lineage that bridges this gap and explains how NB7-1 neurons are specified after Engrailed (En) and Vnd cease their expression. They show that Fd4 is transiently co-expressed with En and Vnd and are present in all nascent NB7-1 progenies. They further demonstrate that Fd4 is required for later-born NB7-1 progenies and sufficient for the induction of NB7-1 markers (Eve and Dbx) while repressing markers of other lineages when force-expressed in neural progenitors, e.g. in the NB5-6 lineage and in the NB7-3 lineage. They also demonstrate that, when Fd4 is ectopically expressed in NB7-3 and NB5-6 lineages, this leads to the ectopic generation of dorsal muscle-innervating neurons. The inclusion of functional validation using axon projections demonstrates that the transformed neurons acquire appropriate NB7-1 characteristics beyond just molecular markers. Quantitative analyses are thorough and well-presented for most experiments.
Original weaknesses and potential extensions:
(1) While Fd4 is required and sufficient for several later-born NB7-1 progeny features, a comparison between early-born (Hb/Eve) and later-born (Run/Eve) appears missing for pan-progenitor gain of Fd4 (with sca-Gal4; Figure 4) and for the NB7-3 lineage (Figure 6). Having a quantification for both could make it clearer whether Fd4 preferentially induces later-born neurons or is sufficient for NB7-1 features without temporal restriction.
(2) Fd4 and Fd5 are shown to be partially redundant, as Fd4 loss of function alone does not alter the number of Eve+ and Dbx+ neurons. This information is critical and should be included in Figure 3.
(3) Several observations suggest that lineage identity maintenance involves both Fd4-dependent and Fd4-independent mechanisms. In particular, the fact that fd4-Gal4 reporter remains active in fd4/fd5 mutants even after Vnd and En disappear indicates that Fd4's own expression, a key feature of NB7-1 identity, is maintained independently of Fd4 protein. This raises questions about what proportion of lineage identity features require Fd4 versus other maintenance mechanisms, which deserves discussion.
(4) Similarly, while gain of Fd4 induces NB7-1 lineage markers and dorsal muscle innervation in NB5-6 and NB7-3 lineages, drivers for the two lineages remain active despite the loss of molecular markers, indicating some regulatory elements retain activity consistent with their original lineage identity. It is therefore important to understand the degree of functional conversion in the gain-of-function experiments. Sparse labeling of Fd4 overexpressing NB5-6 and NB7-3 progenies, as what was done in Seroka and Doe (2019) would be an option.
(5) The less-penetrant induction of Dbx+ neurons in NB5-6 with Fd4-overexpression is interesting. It might be worth discussing whether it is a Fd4 feature or a NB5-6 feature by examining Dbx+ neuron number in NB7-3 with Fd4-overexpression.
(6) It is logical to hypothesize that spatial factors specify early-born neurons directly so only late-born neurons require Fd4, but it was not tested. The model would be strengthened by examining whether Fd4-Gal4-driven Vnd rescues the generation of later-born neurons in fd4/fd5 mutants.
(7) It is mentioned that Fd5 is not sufficient for the NB7-1 lineage identity. The observation is intriguing in how similar regulators serve distinct roles, but the data are not shown. The analysis in Figure 4 should be performed for Fd5 as supplemental information.
Comments on latest version:
We appreciate the thorough revision and the detailed point-by-point responses. Overall, the updated manuscript has addressed the main issues we raised previously, especially around the potential potency differences of Fd4 along the birth order axis and possible redundancy with Vnd in early-born neurons. The additional data are convincing and presented clearly, with figures and supplements that are informative and appropriately labeled.
We noticed one remaining point that could be considered, the necessary-and-sufficient phrasing for Fd4 regulating NB7-1 fates. Given the possible redundancy among Fd4/5 and Vnd and the fact that early-born outputs (U1-3, Figure 3F) are not dependent on Fd4/5, we suggest revising this claim and either (a) limit the claim to necessary and sufficient for late-born NB7-1 progeny identity, or (b) frame Fd4 as sufficient for NB7-1 program induction while being required but redundant (e.g., with Vnd) for early-born features, rather than universally necessary/sufficient across the entire lineage output.
Regarding the lack of phenotype of single Fd4/5 mutants and Fd5 gain of function, we still encourage the authors to include the fd4 and fd5 single-mutant negative results as a brief supplemental item (e.g., a representative panel plus a simple quantification on Eve and Dbx would be sufficient). This would strengthen transparency, remove "data not shown" statements that are not necessary when these data can be presented as supplementary data with no space limitation, and make it easier for readers to evaluate redundancy claims.
Overall, we view the work as substantially complete and appreciate its contribution and conceptual framing. We have updated our public review to reflect the current version and the authors' efforts to address the major points raised in the prior round.
Reviewer #3 (Public review):
The goal of the work is to establish the linkage between the spatial transcription factors (STF's) that function transiently to establish the identities of the individual NBs and the terminal selector genes (typically homeodomain genes) that appear in the new-born post-mitotic neurons. How is the identity of the NB maintained and carried forward after the spatial genes have faded away? Focusing on a single neuroblast (NB 7-1), the authors present evidence that the fork-head transcription factor, fd4, provides a bridge linking the transient spatial cues that initially specified neuroblast identity with the terminal selector genes that establish and maintain the identity of the stem cell's progeny.
The study is systematic, concise and takes full advantage of 40+ years of work on the molecular players that establish neuronal identities in the Drosophila CNS. In the embryonic VNC, fd4 is expressed only in the NB 7-1 and its lineage. They show that Fd4 appears in the NB while the latter is still expressing the Spatial Transcription Factors and continues after the expression of the latter fades out. Fd4 is maintained through the early life of the neuronal progeny but then declines as the neurons turn on their terminal selector genes. Hence, fd4 expression is compatible with it being a bridging factor between the two sets of genes.
Experimental support for the "bridging" role of Fd4 comes from set of loss-of-function and gain-of-function manipulations. The loss of function of fd4, and the partially redundant gene fd5, from lineage 7-1 does not affect the size of the lineage, but terminal markers of late-born neuronal phenotypes, like Eve and Dbx, are reduced or missing. By contrast, ectopic expression of fd4, but not fd5, results in ectopic expression of the terminal markers eve and dbx throughout diverse VNC lineages.
A detailed test of fd4's expression was then carried out using lineages 7-3 and 5-6, two well characterized lineages in Drosophila. Lineage 7-3 is much smaller that 7-1 and continues to be so when subjected to fd4 misexpression. However, under the influence of ectopic fd4 expression, the lineage 7-3 neurons lost their expected serotonin and corazonin expression and showed Eve expression as well as motoneuron phenotypes that partially mimic the U motoneurons of lineage 7-1.
Ectopic expression of Fd4 also produced changes in the 5-6 lineage. Expression of apterous, a feature of lineage 5-6 was suppressed, and expression of the 7-1 marker, Eve, was evident. Dbx expression was also evident in the transformed 5-6 lineages but extremely restricted as compared to a normal 7-1 lineage. Considering the partial redundancy of fd4 and fd5, it would have been interesting to express both genes in the 5-6 lineage. The anatomical changes that are exhibited by motoneurons in response to fd4 expression confirms that these cells do, indeed, show a shift in their cellular identity.
Comments on revisions:
The authors adequately addressed all of the issues that I had with the original submission.
Their responses to the other reviewers are also well-reasoned
Author response:
The following is the authors’ response to the original reviews.
Public Reviews:
Reviewer #1 (Public review):
Lai and Doe address the integration of spatial information with temporal patterning and genes that specify cell fate. They identify the Forkhead transcription factor Fd4 as a lineage-restricted cell fate regulator that bridges transient spatial transcription factors to terminal selector genes in the developing Drosophila ventral nerve cord. The experimental evidence convincingly demonstrates that Fd4 is both necessary for lateborn NB7-1 neurons, but also sufficient to transform other neural stem cell lineages toward the NB7-1 identity. This work addresses an important question that will be of interest to developmental neurobiologists: How can cell identities defined by initial transient developmental cues be maintained in the progeny cells, even if the molecular mechanism remains to be investigated? In addition, the study proposes a broader concept of lineage identity genes that could be utilized in other lineages and regions in the Drosophila nervous system and in other species.
Thanks for the accurate summary and positive comments!
While the spatial factors patterning the neuroepithelium to define the neuroblast lineages in the Drosophila ventral nerve cord are known, these factors are sometimes absent or not required during neurogenesis. In the current work, Lai and Doe identified Fd4 in the NB7-1 lineage that bridges this gap and explains how NB7-1 neurons are specified after Engrailed (En) and Vnd cease their expression. They show that Fd4 is transiently co-expressed with En and Vnd and is present in all nascent NB7-1 progenies. They further demonstrate that Fd4 is required for later-born NB7-1 progenies and sufficient for the induction of NB7-1 markers (Eve and Dbx) while repressing markers of other lineages when force-expressed in neural progenitors, e.g., in the NB56 lineage and in the NB7-3 lineage. They also demonstrate that, when Fd4 is ectopically expressed in NB7-3 and NB5-6 lineages, this leads to the ectopic generation of dorsal muscle-innervating neurons. The inclusion of functional validation using axon projections demonstrates that the transformed neurons acquire appropriate NB7-1 characteristics beyond just molecular markers. Quantitative analyses are thorough and well-presented for all experiments.
Thanks for the positive comments!
(1) While Fd4 is required and sufficient for several later-born NB7-1 progeny features, a comparison between early-born (Hb/Eve) and later-born (Run/Eve) appears missing for pan-progenitor gain of Fd4 (with sca-Gal4; Figure 4) and for the NB7-3 lineage (Figure 6). Having a quantification for both could make it clearer whether Fd4 preferentially induces later-born neurons or is sufficient for NB7-1 features without temporal restriction.
We quantified the percentage of Hb+ and Runt+ cells among Eve+ cells with sca-gal4, and the results are shown in Figure 4-figure supplement 1. We found that the proportion of early-born cells is slightly reduced but the proportion of later-born cells remain similar. Interestingly, we also found a subset of Eve+ cells with a mixed fate (Hb+Runt+) but the reason remains unclear.
(2) Fd4 and Fd5 are shown to be partially redundant, as Fd4 loss of function alone does not alter the number of Eve+ and Dbx+ neurons. This information is critical and should be included in Figure 3.
Because every hemisegment in an fd4 single mutant is normal, we just added it as the following text: “In fd4 mutants, we observe no change in the number of Eve+ neurons or Dbx+ neurons (n=40 hemisegments).”
(3) Several observations suggest that lineage identity maintenance involves both Fd4dependent and Fd4-independent mechanisms. In particular, the fact that fd4-Gal4 reporter remains active in fd4/fd5 mutants even after Vnd and En disappear indicates that Fd4's own expression, a key feature of NB7-1 identity, is maintained independently of Fd4 protein. This raises questions about what proportion of lineage identity features require Fd4 versus other maintenance mechanisms, which deserves discussion.
We agree, thanks for raising this point. We add the following text to the Discussion. “Interestingly, the fd4 fd5 mutant maintains expression of fd4:gal4, suggesting that the fd4/fd5 locus may have established a chromatin state that allows “permanent” expression in the absence of Vnd, En, and Fd4/Fd5 proteins.”
(4) Similarly, while gain of Fd4 induces NB7-1 lineage markers and dorsal muscle innervation in NB5-6 and NB7-3 lineages, drivers for the two lineages remain active despite the loss of molecular markers, indicating some regulatory elements retain activity consistent with their original lineage identity. It is therefore important to understand the degree of functional conversion in the gain-of-function experiments. Sparse labeling of Fd4 overexpressing NB5-6 and NB7-3 progenies, as was done in Seroka and Doe (2019), would be an option.
We agree it is interesting that the NB7-3 and NB5-6 drivers remain on following Fd4 misexpression. To explore this, we used sca-gal4 to overexpress Fd4 and observed that Lbe expression persisted while Eg was largely repressed (Author response image 1). The results show that Lbe and Eg respond differently to Fd4. A non-mutually exclusive possibility is that the continued expression of lbe-Gal4 UAS-GFP or eg-Gal4 UAS-GFP may be due to the lengthy perdurance of both Gal4 and GFP.
Author response image 1.
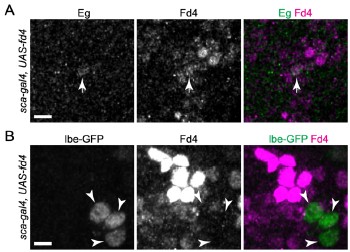
(5) The less-penetrant induction of Dbx+ neurons in NB5-6 with Fd4-overexpression is interesting. It might be worth the authors discussing whether it is an Fd4 feature or an NB56 feature by examining Dbx+ neuron number in NB7-3 with Fd4-overexpression.
In the NB7-3 lineages misexpressing Fd4, only 5 lineages generated Dbx+ cells (0.1±0.4, n=64 hemisegments), suggesting that the low penetrance of Dbx+ induction is an intrinsic feature of Fd4 rather than lineage context. We have added this information in the results section.
(6) It is logical to hypothesize that spatial factors specify early-born neurons directly, so only late-born neurons require Fd4, but it was not tested. The model would be strengthened by examining whether Fd4-Gal4-driven Vnd rescues the generation of laterborn neurons in fd4/fd5 mutants.
When we used en-gal4 driver to express UAS-vnd in the fd4/fd5 mutant background, we found an average 7.4±2.2 Eve+ cells per hemisegment (n=36), significantly higher than fd4/fd5 mutant alone (3.9±0.8 cells, n=52, p=2.6x10<sup>-11</sup>) (Figure 3J). In addition, 0.2±0.5 Eve+ cells were ectopic Hb+ (excluding U1/U2), indicating that Vnd-En integration is sufficient to generate both early-born and late-born Eve+ cells in the fd4/fd5 mutants. We have added the results to the text.
(7) It is mentioned that Fd5 is not sufficient for the NB7-1 lineage identity. The observation is intriguing in how similar regulators serve distinct roles, but the data are not shown. The analysis in Figure 4 should be performed for Fd5 as supplemental information.
Thanks for the suggestion. Because the results are exactly the same as the wild type, we don’t think it is necessary to provide an additional images or analysis as supplemental information.
Reviewer #2 (Public review):
Via a detailed expression analysis, they find that Fd4 is selectively expressed in embryonic NB7-1 and newly born neurons within this lineage. They also undertake a comprehensive genetic analysis to provide evidence that fd4 is necessary and sufficient for the identity of NB7-1 progeny.
Thanks for the accurate summary!
The analysis is both careful and rigorous, and the findings are of interest to developmental neurobiologists interested in molecular mechanisms underlying the generation of neuronal diversity. Great care was taken to make the figures clear and accessible. This work takes great advantage of years of painstaking descriptive work that has mapped embryonic neuroblast lineages in Drosophila.
Thanks for the positive comments!
The argument that Fd4 is necessary for NB7-1 lineage identity is based on a Fd4/Fd5 double mutant. Loss of fd4 alone did not alter the number of NB7-1-derived Eve+ or Dbx+ neurons. The authors clearly demonstrate redundancy between fd4 and fd5, and the fact that the LOF analysis is based on a double mutant should be better woven through the text.The authors generated an Fd5 mutant. I assume that Fd5 single mutants do not display NB7-1 lineage defects, but this is not stated. The focus on Fd4 over Fd5 is based on its highly specific expression profile and the dramatic misexpression phenotypes. But the LOF analysis demonstrates redundancy, and the conclusions in the abstract and through the results should reflect the existence of Fd5 in the conclusions of this manuscript.
We agree, and have added new text to clarify the single mutant phenotypes (there are none) and the double mutant phenotype (loss of NB7-1 molecular and morphological features. The following text is added to the manuscript: “Not surprisingly, we found that fd4 single mutants or fd5 single mutants had no phenotype (Eve+ neurons were all normal). Thus, to assess their roles, we generated a fd4 and fd5 double mutant. Because many Eve+ and Dbx+ cells are generated outside of NB7-1 lineage, it was also essential to identify the Eve+ or Dbx+ cells within NB7-1 lineage in wild type and fd4 mutant embryos. To achieve this, we replaced the open reading frame of fd4 with gal4 (called fd4-gal4) (see Methods); this stock simultaneously knocked out both fd4 and fd5 (called fd4/fd5 mutant hereafter) while specifically labeling the NB7-1 lineage. For the remainder of this paper we use the fd4/fd5 double mutant to assay for loss of function phenotypes.”
It is notable that Fd4 overexpression can rewire motor circuits. This analysis adds another dimension to the changes in transcription factor expression and, importantly, demonstrates functional consequences. Could the authors test whether U4 and U5 motor axon targeting changes in the fd4/fd5 double mutant? To strengthen claims regarding the importance of fd4/fd5 for lineage identity, it would help to address terminal features of U motorneuron identity in the LOF condition.
Thanks for raising this important point. We examined the axon targeting on body wall muscles in both wild type and in fd4/fd5 mutant background and added the results in Figure 3-figure supplement 2. We found that the axon targeting in the late-born neuron region (LL1) is significantly reduced, suggesting that the loss of late-born neurons in fd4/fd5 mutant leads to the absence of innervation of corresponding muscle targets.
Reviewer #3 (Public review):
The goal of the work is to establish the linkage between the spatial transcription factors (STFs) that function transiently to establish the identities of the individual NBs and the terminal selector genes (typically homeodomain genes) that appear in the newborn postmitotic neurons. How is the identity of the NB maintained and carried forward after the spatial genes have faded away? Focusing on a single neuroblast (NB 7-1), the authors present evidence that the fork-head transcription factor, fd4, provides a bridge linking the transient spatial cues that initially specified neuroblast identity with the terminal selector genes that establish and maintain the identity of the stem cell's progeny.
Thanks for the positive comments!
The study is systematic, concise, and takes full advantage of 40+ years of work on the molecular players that establish neuronal identities in the Drosophila CNS. In the embryonic VNC, fd4 is expressed only in the NB 7-1 and its lineage. They show that Fd4 appears in the NB while the latter is still expressing the Spatial Transcription Factors and continues after the expression of the latter fades out. Fd4 is maintained through the early life of the neuronal progeny but then declines as the neurons turn on their terminal selector genes. Hence, fd4 expression is compatible with it being a bridging factor between the two sets of genes.
Thanks for the accurate summary!
Experimental support for the "bridging" role of Fd4 comes from a set of loss-of-function and gain-of-function manipulations. The loss of function of Fd4, and the partially redundant gene Fd5, from lineage 7-1 does not aoect the size of the lineage, but terminal markers of late-born neuronal phenotypes, like Eve and Dbx, are reduced or missing. By contrast, ectopic expression of fd4, but not fd5, results in ectopic expression of the terminal markers eve and Dbx throughout diverse VNC lineages.
Thanks for the accurate summary!
A detailed test of fd4's expression was then carried out using lineages 7-3 and 5-6, two well-characterized lineages in Drosophila. Lineage 7-3 is much smaller than 7-1 and continues to be so when subjected to fd4 misexpression. However, under the influence of ectopic Fd4 expression, the lineage 7-3 neurons lost their expected serotonin and corazonin expression and showed Eve expression as well as motoneuron phenotypes that partially mimic the U motoneurons of lineage 7-1.
Thanks for the positive comments!
Ectopic expression of Fd4 also produced changes in the 5-6 lineage. Expression of apterous, a feature of lineage 5-6, was suppressed, and expression of the 7-1 marker, Eve, was evident. Dbx expression was also evident in the transformed 5-6 lineages, but extremely restricted as compared to a normal 7-1 lineage. Considering the partial redundancy of fd4 and fd5, it would have been interesting to express both genes in the 5-6 lineage. The anatomical changes that are exhibited by motoneurons in response to Fd4 expression confirm that these cells do, indeed, show a shift in their cellular identity.
We appreciate the positive comments. We agree double misexpression of Fd4 and Fd5 might give a stronger phenotype (as the reviewer says) but the lack of this experiment does not change the conclusions that Fd4 can promote NB7-1 molecular and morphological aspects at the expense of NB5-6 molecular markers.
Recommendations for the authors:
Reviewer #2 (Recommendations for the authors):
The title of Figure 4 may be intended to include the term "Widespread", not "Wild spread". (Though the expansion of the Eve and Dbx with Fd4 is quite remarkable…).
Done!
Reviewer #3 (Recommendations for the authors):
(1) Line 138. Is part of the sentence missing? Did the authors mean to say "that fd5 is coexpressed with fd4 in NB7-1 and its .....".
Done!
(2) ln 237: In trying to explain the "U-like" phenotype of the transformed motoneurons in lineage 7-3, the authors speculate that "perhaps their late birth did not give them time to extend to the most distant dorsal muscles ". It is very difficult to convince a motoneuron to stop growing in the absence of a target! An alternate possibility is that since there is only one or two U neurons made instead of the normal five, the growing motoneuron has enough information to direct them to the dorsal domain, but they lack the specification that allows them to recognize a specific muscle target.
We agree there are additional possibilities, and now update the text to say: “We observed that these transformed neurons did not innervate the dorsal muscles, perhaps their late birth did not give them time to extend to the most distant dorsal muscles, or they were incompletely specified.”
(3) In the References, I think that the Anderson et al. reference should also include "BioRxiv" before the DOI.
Done!
(4) Figure 6A for wild-type 7-3 lineage. The corazonin expression appears to be expressed in EW2 as well as EW3. This should be explained.
We agree it looks that way, due to the 3D rotation used; we now replace it with a more representative image. Note that our quantification always shows a single Cor+ neuron per hemisegment.
(5) Figure 7: Issues of terminology. The designation of "longitudinal" for muscles is traditionally in reference to the body axis, such as the Dorsal Longitudinal Muscles (DLM) of the adult thorax. The "longitudinal" muscles in the figure are really "transverse" muscles. I also suggest using "axon" or "neurites" rather than "filament". For the middle and bottom parts of E and F, are these lateral and ventral views? They should be designated as such.
Thanks, we agree and have made the changes, using Axon instead of Filament, and labeling the views (lateral and ventro-lateral).
eLife Assessment
This study presents experiments suggesting intriguing mesoscale reorganization of functional connectivity across distributed cortical and subcortical circuits during learning. The approach is technically impressive and the results are potentially of valuable significance. The authors have also made clear effort to address concerns in revision. However, the strength of evidence remains incomplete. Acquisition of data from additional animals in the primary experiment could bolster these findings.
Reviewer #1 (Public review):
Summary:
This study aims to address an important and timely question: how does the mesoscale architecture of cortical and subcortical circuits reorganize during sensorimotor learning? By using high-density, chronically implanted ultra-flexible electrode arrays, the authors track spiking activity across ten brain regions as mice learn a visual Go/No-Go task. The results indicate that learning leads to more sequential and temporally compressed patterns of activity during correct rejection trials, alongside changes in functional connectivity ranks that reflect shifts in the relative influence of visual, frontal, and motor areas throughout learning. The emergence of a more task-focused subnetwork is accompanied by broader and faster propagation of stimulus information across recorded regions.
Strengths:
A clear strength of this work is its recording approach. The combination of stable, high-throughput multi-region recordings over extended periods represents a significant advance for capturing learning-related network dynamics at the mesoscale. The conceptual framework is well motivated, building on prior evidence that decision-relevant signals are widely distributed across the brain. The analysis approach, combining functional connectivity rankings with information encoding metrics is well motivated but needs refinement. These results provide some valuable evidence of how learning can refine both the temporal precision and the structure of interregional communication, offering new insights into circuit reconfiguration during learning.
Weaknesses:
Several important aspects of the evidence remain incomplete. In particular, it is unclear whether the reported changes in connectivity truly capture causal influences, as the rank metrics remain correlational and show discrepancies with the manipulation results. The absolute response onset latencies also appear slow for sensory-guided behavior in mice, and it is not clear whether this reflects the method used to define onset timing or factors such as task structure or internal state. Furthermore, the small number of animals, combined with extensive repeated measures, raises questions about statistical independence and how multiple comparisons were controlled. The optogenetic experiments, while intended to test the functional relevance of rank-increasing regions, leave it unclear how effectively the targeted circuits were silenced. Without direct evidence of reliable local inhibition, the behavioral effects or lack thereof are difficult to interpret.
Reviewer #2 (Public review):
Summary:
Wang et al. measure from 10 cortical and subcortical brain as mice learn a go/no-go visual discrimination task. They found that during learning, there is a reshaping of inter-areal connections, in which a visual-frontal subnetwork emerges as mice gain expertise. Also visual stimuli decoding became more widespread post-learning. They also perform silencing experiments and find that OFC and V2M are important for the learning process. The conclusion is that learning evoked a brain-wide dynamic interplay between different brain areas that together may promote learning.
Strengths:
The manuscript is written well and the logic is rather clear. I found the study interesting and of interest to the field. The recording method is innovative and requires exceptional skills to perform. The outcomes of the study are significant, highlighting that learning evokes a widespread and dynamics modulation between different brain areas, in which specific task-related subnetworks emerge.
Weaknesses:
I had some major concerns that make the claims of the study less convincing: Low number of mice, insufficient movement analysis, figure visualization and analytic methods.
Nevertheless, I had several major concerns:
(1) The number of mice was small for the ephys recordings. Although the authors start with 7 mice in Figure 1, they then reduce to 5 in panel F. And in their main analysis they minimize their analysis 6/7 sessions from 3 mice only. I couldn't find a rationale for this reduction, but in the methods they do mention that 2 mice were used for fruitless training, which I found no mention in the results. Moreover, in the early case all of the analysis is from 118 CR trials taken from 3 mice. In general, this is a rather low number of mice and trial numbers. I think it is quite essential to add more mice.
(2) Movement analysis was not sufficient. Mice learning a go/no-go task establish a movement strategy that is developed throughout learning and is also biased towards Hit trials. There is an analysis of movement in Fig. S4 but this is rather superficial. I was not even sure that the 3 mice in Figure S4 are the same 3 mice in the main figure. There should be also an analysis of movement as a function of time to see differences. Also for Hits and FAs. I give some more details below. In general, most of the results can be explained by the fact that as mice gain expertise, they move more (also in CR during specific times) which leads to more activation in frontal cortex and more coordination with visual areas. More needs to be done in terms of analysis, or at least a mention of this in the text.
(3) Most of the figures are over-detailed and it is hard to understand the take home message. Although the text is written succinctly and rather short, the figures are mostly overwhelming, especially figures 4-7. For example, Figure 4 presents 24 brain plots! For rank input and output rank during early and late stim and response periods, for early and expert and their difference. All in the same colormap. No significance shown at all. The Δrank maps for all cases look essentially identical across conditions. The division into early and late time periods is not properly justified. But the main take home message is positive Δrank in OFC, V2M, V1 and negative Δrank in ThalMD and Str. In my opinion, one trio maps is enough, and the rest could be bumped to the Supp, if at all. In general, the figures in several cases do not convey the main take home messages.
(4) Analysis is sometimes not intuitive enough. For example, the rank analysis of input and output rank seemed a bit over complex. Figure 3 was hard to follow (although a lot of effort was made by the authors to make it clearer). Was there any difference between output and input analysis? Also time period seem sometimes redundant. Also, there are other network analysis that can be done which are a bit more intuitive. The use of rank within the 10 areas was not the most intuitive. Even a dimensionality reduction along with clustering can be used as an alternative. In my opinion, I don't think the authors should completely redo their analysis, but maybe mention the fact that other analyses exist.
Reviewer comments to the authors' revision:
Thank you for the extensive revision. Most of my concerns were answered and the manuscript is much improved. Still, there are some major issues that remain unconvincing:
(1) The number of learning mice is only 3 which is substantially low as compared to other studies in the field. Thus, statistics are across trials and session pooled from all mice. This is a big limitation in supporting the authors' claims
(2) There is no measurement of movement during the task. Since there are already several studies showing that movement has a strong effect on brain-wide dynamics, and since it is well known that mice change their body movement during learning (at least some mice) the authors cannot disentangle between learning-related and movement-related dynamics. This issue is properly discussed in the paper and also partially addressed with a control group where movement was measured without neural recordings.
(3) The authors do not know exactly where they recorded from, with emphasis on subcortical areas. The authors partially address this in a separate cohort where they regenerate the reproducibility rate of penetration locations, but still this is not a complete address to this concern.
Given the issues above, I strongly recommend including additional mice with body movement measurement in the future. Great job and congratulations on this study!
Reviewer #3 (Public review):
Summary:
In the manuscript " Dynamics of mesoscale brain network during decision-making learning revealed by chronic, large-scale single-unit recording", Wang et al investigated mesoscale network reorganization during visual stimulus discrimination learning in mice using chronic, large-scale single-unit recordings across 10 cortical/subcortical regions. During learning, mice improved task performance mainly by suppressing licking on no-go trials. The authors found that learning induced restructuring of functional connectivity, with visual (V1, V2M) and frontal (OFC, M2) regions forming a task-relevant subnetwork during the acquisition of correct No-Go (CR) trials. Learning also compressed sequential neural activation and broadened stimulus encoding across regions. In addition, a region's network connectivity rank correlated with its timing of peak visual stimulus encoding. Optogenetic inhibition of orbitofrontal cortex (OFC) and high order visual cortex (V2M) impaired learning, validating its role in learning. The work highlights how mesoscale networks underwent dynamic structuring during learning.
Strengths:
The use of ultra-flexible microelectrode arrays (uFINE-M) for chronic, large-scale recordings across 10 cortical/subcortical regions in behaving mice represents a significant methodological advancement. The ability to track individual units over weeks across multiple brain areas will provide a rare opportunity to study mesoscale network plasticity.<br /> While limited in scope, optogenetic inhibition of OFC and V2M directly ties connectivity rank changes to behavioral performance, adding causal depth to correlational observations.
Weaknesses:
The weakness is also related to the strength provided by the method. While the method in principle enables chronic tracking of individual units, the authors have not showed chronically tracked neurons across learning. Without demonstrating that and taking advantage of analyzing chronically tracked neurons, this approach is not different from acute recording in individual days across learning, weaking the attractiveness of the methodology and this study.
Another weakness is that major results are based on analyses of functional connectivity. Functional connection strengthen across areas is ranked 1-10 based on relative strength. And the regional input/out is compared across learning. This approach reveals differential changes in some cortical and subcortical areas. In my view, learning-related changes should be validated using complementary methods.
Author response:
The following is the authors’ response to the original reviews.
Public Reviews:
Reviewer #1 (Public review):
Weaknesses:
The technical approach is strong and the conceptual framing is compelling, but several aspects of the evidence remain incomplete. In particular, it is unclear whether the reported changes in connectivity truly capture causal influences, as the rank metrics remain correlational and show discrepancies with the manipulation results.
We agree that our functional connectivity ranking analyses cannot establish causal influences. As discussed in the manuscript, besides learning-related activity changes, the functional connectivity may also be influenced by neuromodulatory systems and internal state fluctuations. In addition, the spatial scope of our recordings is still limited compared to the full network implicated in visual discrimination learning, which may bias the ranking estimates. In future, we aim to achieve broader region coverage and integrate multiple complementary analyses to address the causal contribution of each region.
The absolute response onset latencies also appear slow for sensory-guided behavior in mice, and it is not clear whether this reflects the method used to define onset timing or factors such as task structure or internal state.
We believe this may be primarily due to our conservative definition of onset timing. Specifically, we required the firing rate to exceed baseline (t-test, p < 0.05) for at least 3 consecutive 25-ms time windows. This might lead to later estimates than other studies, such as using the latency to the first spike after visual stimulus onset (Siegle et al., 2021) or the time to half-max response (Goldbach, Akitake, Leedy, & Histed, 2021).
The estimation of response onset latency in our study may also be affected by potential internal state fluctuations of the mice. We used the time before visual stimulus onset as baseline firing, since firing rates in this period could be affected by trial history, we acknowledge this may increase the variability of the baseline, thus increase the difficulty to statistically detect the onset of response.
Still, we believe these concerns do not affect the observation of the formation of compressed activity sequence in CR trials during learning.
Furthermore, the small number of animals, combined with extensive repeated measures, raises questions about statistical independence and how multiple comparisons were controlled.
We agree that a larger sample size would strengthen the robustness of the findings. However, as noted above, the current dataset has inherent limitations in both the number of recorded regions and the behavioral paradigm. Given the considerable effort required to achieve sufficient unit yields across all targeted regions, we wish to adjust the set of recorded regions, improve behavioral task design, and implement better analyses in future studies. This will allow us to both increase the number of animals and extract more precise insights into mesoscale dynamics during learning.
The optogenetic experiments, while intended to test the functional relevance of rank increasing regions, leave it unclear how effectively the targeted circuits were silenced. Without direct evidence of reliable local inhibition, the behavioral effects or lack thereof are difficult to interpret.
We appreciate this important point. Due to the design of the flexible electrodes and the implantation procedure, bilateral co-implantation of both electrodes and optical fibers was challenging, which prevented us from directly validating the inhibition effect in the same animals used for behavior. In hindsight, we could have conducted parallel validations using conventional electrodes, and we will incorporate such controls in future work to provide direct evidence of manipulation efficacy.
Details on spike sorting are limited.
We have provided more details on spike sorting in method section, including the exact parameters used in the automated sorting algorithm and the subsequent manual curation criteria.
Reviewer #2 (Public review):
Weaknesses:
I had several major concerns:
(1) The number of mice was small for the ephys recordings. Although the authors start with 7 mice in Figure 1, they then reduce to 5 in panel F. And in their main analysis, they minimize their analysis to 6/7 sessions from 3 mice only. I couldn't find a rationale for this reduction, but in the methods they do mention that 2 mice were used for fruitless training, which I found no mention in the results. Moreover, in the early case, all of the analysis is from 118 CR trials taken from 3 mice. In general, this is a rather low number of mice and trial numbers. I think it is quite essential to add more mice.
We apologize for the confusion. As described in the Methods section, 7 mice (Figure 1B) were used for behavioral training without electrode array or optical fiber implants to establish learning curves, and an additional 5 mice underwent electrophysiological recordings (3 for visual-based decision-making learning and 2 for fruitless learning).
As we noted in our response to Reviewer #1, the current dataset has inherent limitations in both the number of recorded regions and the behavioral paradigm. Given the considerable effort required to achieve high-quality unit yields across all targeted regions, we wish to adjust the set of recorded regions, improve behavioral task design, and implement better analyses in future studies. These improvements will enable us to collect data from a larger sample size and extract more precise insights into mesoscale dynamics during learning.
(2) Movement analysis was not sufficient. Mice learning a go/no-go task establish a movement strategy that is developed throughout learning and is also biased towards Hit trials. There is an analysis of movement in Figure S4, but this is rather superficial. I was not even sure that the 3 mice in Figure S4 are the same 3 mice in the main figure. There should be also an analysis of movement as a function of time to see differences. Also for Hits and FAs. I give some more details below. In general, most of the results can be explained by the fact that as mice gain expertise, they move more (also in CR during specific times) which leads to more activation in frontal cortex and more coordination with visual areas. More needs to be done in terms of analysis, or at least a mention of this in the text.
Due to the limitation in the experimental design and implementation, movement tracking was not performed during the electrophysiological recordings, and the 3 mice shown in Figure S4 (now S5) were from a separate group. We have carefully examined the temporal profiles of mouse movements and found it did not fully match the rank dynamics for all regions, and we have added these results and related discussion in the revised manuscript. However, we acknowledge the observed motion energy pattern could explain some of the functional connection dynamics, such as the decrease in face and pupil motion energy could explain the reduction in ranks for striatum.
Without synchronized movement recordings in the main dataset, we cannot fully disentangle movement-related neural activity from task-related signals. We have made this limitation explicit in the revised manuscript and discuss it as a potential confound, along with possible approaches to address it in future work.
(3) Most of the figures are over-detailed, and it is hard to understand the take-home message. Although the text is written succinctly and rather short, the figures are mostly overwhelming, especially Figures 4-7. For example, Figure 4 presents 24 brain plots! For rank input and output rank during early and late stim and response periods, for early and expert and their difference. All in the same colormap. No significance shown at all. The Δrank maps for all cases look essentially identical across conditions. The division into early and late time periods is not properly justified. But the main take home message is positive Δrank in OFC, V2M, V1 and negative Δrank in ThalMD and Str. In my opinion, one trio map is enough, and the rest could be bumped to the Supplementary section, if at all. In general, the figure in several cases do not convey the main take home messages. See more details below.
We thank the reviewer for this valuable critique. The statistical significance corresponding to the brain plots (Figure 4 and Figure 5) was presented in Figure S3 and S5 (now Figure S5 and S7 in the revised manuscript), but we agree that the figure can be simplified to focus on the key results.
In the revised manuscript, we have condensed these figures to focus on the most important comparisons to make the visual presentation more concise and the take-home message clearer.
(4) The analysis is sometimes not intuitive enough. For example, the rank analysis of input and output rank seemed a bit over complex. Figure 3 was hard to follow (although a lot of effort was made by the authors to make it clearer). Was there any difference between the output and input analysis? Also, the time period seems redundant sometimes. Also, there are other network analysis that can be done which are a bit more intuitive. The use of rank within the 10 areas was not the most intuitive. Even a dimensionality reduction along with clustering can be used as an alternative. In my opinion, I don't think the authors should completely redo their analysis, but maybe mention the fact that other analyses exist
We appreciate the reviewer’s comment. In brief, the input- and output-rank analyses yielded largely similar patterns across regions in CR trials, although some differences were observed in certain areas (e.g., striatum) in Hit trials, where the magnitude of rank change was not identical between input and output measures. We have condensed the figures to only show averaged rank results, and the colormap was updated to better covey the message.
We did explore dimensionality reduction applied to the ranking data. However, the results were not intuitive as well and required additional interpretation, which did not bring more insights. Still, we acknowledge that other analysis approaches might provide complementary insights.
Reviewer #3 (Public review):
Weaknesses:
The weakness is also related to the strength provided by the method. It is demonstrated in the original method that this approach in principle can track individual units for four months (Luan et al, 2017). The authors have not showed chronically tracked neurons across learning. Without demonstrating that and taking advantage of analyzing chronically tracked neurons, this approach is not different from acute recording across multiple days during learning. Many studies have achieved acute recording across learning using similar tasks. These studies have recorded units from a few brain areas or even across brain-wide areas.
We appreciate the reviewer’s important point. We did attempt to track the same neurons across learning in this project. However, due to the limited number of electrodes implanted in each brain region, the number of chronically tracked neurons in each region was insufficient to support statistically robust analyses. Concentrating probes in fewer regions would allow us to obtain enough units tracked across learning in future studies to fully exploit the advantages of this method.
Another weakness is that major results are based on analyses of functional connectivity that is calculated using the cross-correlation score of spiking activity (TSPE algorithm). Functional connection strengthen across areas is then ranked 1-10 based on relative strength. Without ground truth data, it is hard to judge the underlying caveats. I'd strongly advise the authors to use complementary methods to verify the functional connectivity and to evaluate the mesoscale change in subnetworks. Perhaps the authors can use one key information of anatomy, i.e. the cortex projects to the striatum, while the striatum does not directly affect other brain structures recorded in this manuscript
We agree that the functional connectivity measured in this study relies on statistical correlations rather than direct anatomical connections. We plan to test the functional connection data with shorter cross-correlation delay criteria to see whether the results are consistent with anatomical connections and whether the original findings still hold.
Recommendations for the authors:
Reviewer #1 (Recommendations for the authors):
(1) The small number of mice, each contributing many sessions, complicates the interpretation of the data. It is unclear how statistical analyses accounted for the small sample size, repeated measures, and non-independence across sessions, or whether multiple comparisons were adequately controlled.
We realized the limitation from the small number of animal subjects, yet the difficulty to achieve sufficient unit yields across all regions in the same animal restricted our sample size. Though we agree that a larger sample size would strengthen the robustness of the findings, however, as noted below the current dataset has inherent limitations in both the scope of recorded regions and the behavioral paradigm.
Given the considerable effort required to achieve sufficient unit yields across all targeted regions, we wish to adjust the set of recorded regions, improve behavioral task design, and implement better analyses in future studies. This will allow us to both increase the number of animals and extract more precise insights into mesoscale dynamics during learning.
(2) The ranking approach, although intuitive for visualizing relative changes in connectivity, is fundamentally descriptive and does not reflect the magnitude or reliability of the connections. Converting raw measures into ordinal ranks may obscure meaningful differences in strength and can inflate apparent effects when the underlying signal is weak.
We agree with this important point. As stated in the manuscript, our motivation in taking the ranking approach was that the differences in firing rates might bias cross-correlation between spike trains, making raw accounts of significant neuron pairs difficult to compare across conditions, but we acknowledge the ranking measures might obscure meaningful differences or inflate weak effects in the data.
We added the limitations of ranking approach in the discussion section and emphasized the necessity in future studies for better analysis approaches that could provide more accurate assessment of functional connection dynamics without bias from firing rates.
(3) The absolute response onset latencies also appear quite slow for sensory-guided behavior in mice, and it remains unclear whether this reflects the method used to determine onset timing or factors such as task design, sensorimotor demands, or internal state. The approach for estimating onset latency by comparing firing rates in short windows to baseline using a t-test raises concerns about robustness, as it may be sensitive to trial-to-trial variability and yield spurious detections.
We agree this may be primarily due to our conservative definition of onset timing. Specifically, we required the firing rate to exceed baseline (t-test, p < 0.05) for at least 3 consecutive 25-ms time windows. This might lead to later estimates than other studies, such as using the latency to the first spike after visual stimulus onset (Siegle et al., 2021) or the time to half-max response (Goldbach, Akitake, Leedy, & Histed, 2021).
The estimation of response onset latency in our study may also be affected by potential internal state fluctuations of the mice. We used the time before visual stimulus onset as baseline firing, since firing rates in this period could be affected by trial history, we acknowledge this may increase the variability of the baseline, thus increase the difficulty to statistically detect the onset of response.
Still, we believe these concerns do not affect the observation of the formation of compressed activity sequence in CR trials during learning.
(4) Details on spike sorting are very limited. For example, defining single units only by an interspike interval threshold above one millisecond may not sufficiently rule out contamination or overlapping clusters. How exactly were neurons tracked across days (Figure 7B)?
We have added more details on spike sorting, including the processing steps and important parameters used in the automated sorting algorithm. Only the clusters well isolated in feature space were accepted in manual curation.
We attempted to track the same neurons across learning in this project. However, due to the limited number of electrodes implanted in each brain region, the number of chronically tracked neurons in each region was insufficient to support statistically robust analyses.
This is now stated more clearly in the discussion section.
(5) The optogenetic experiments, while designed to test the functional relevance of rank-increasing regions, also raise questions. The physiological impact of the inhibition is not characterized, making it unclear how effectively the targeted circuits were actually silenced. Without clearer evidence that the manipulations reliably altered local activity, the interpretation of the observed or absent behavioral effects remains uncertain.
We appreciate this important point. Due to the design of the flexible electrodes and the implantation procedure, bilateral co-implantation of both electrodes and optical fibers was challenging, which prevented us from directly validating the inhibition effect in the same animals used for behavior. In hindsight, we could have conducted parallel validations using conventional electrodes, and we will incorporate such controls in future work to provide direct evidence of manipulation efficacy.
(6) The task itself is relatively simple, and the anatomical coverage does not include midbrain or cerebellar regions, limiting how broadly the findings can be generalized to more flexible or ethologically relevant forms of decision-making.
We appreciate this advice and have expanded the existing discussion to more explicitly state that the relatively simple task design and anatomical coverage might limit the generalizability of our findings.
(7) The abstract would benefit from more consistent use of tense, as the current mix of past and present can make the main findings harder to follow. In addition, terms like "mesoscale network," "subnetwork," and "functional motif" are used interchangeably in places; adopting clearer, consistent terminology would improve readability.
We have changed several verbs in abstract to past form, and we now adopted a more consistent terminology by substituting “functional motif” as “subnetwork”. We still feel the use of
“mesoscale network” and “subnetwork” could emphasize different aspects of the results according to the context, so these words are kept the same.
(8) The discussion could better acknowledge that the observed network changes may not reflect task-specific learning alone but could also arise from broader shifts in arousal, attention, or motivation over repeated sessions.
We have expanded the existing discussion to better acknowledge the possible effects from broader shifts in arousal, attention, or motivation over repeated sessions.
(9) The figures would also benefit from clearer presentation, as several are dense and not straightforward to interpret. For example, Figure S8 could be organized more clearly to highlight the key comparisons and main message
We have simplified the over-detailed brain plots in Figure 4-5, and the plots in Figure 6 and S8 (now S10 in the revised manuscript).
(10) Finally, while the manuscript notes that data and code are available upon request, it would strengthen the study's transparency and reproducibility to provide open access through a public repository, in line with best practices in the field.
The spiking data, behavior data and codes for the core analyses in the manuscript are now shared in pubic repository (Dryad). And we have changed the description in the Data Availability secition accordingly.
Reviewer #2 (Recommendations for the authors):
(A) Introduction:
(1) "Previous studies have implicated multiple cortical and subcortical regions in visual task learning and decision-making". No references here, and also in the next sentence.
The references were in the following introduction and we have added those references here as well.
We also added one review on cortical-subcortical neural correlates in goal-directed behavior (Cruz et al., 2023).
(2) Intro: In general, the citation of previous literature is rather minimal, too minimal. There is a lot of studies using large scale recordings during learning, not necessarily visual tasks. An example for brain-wide learning study in subcortical areas is Sych et al. 2022 (cell reports). And for wide-field imaging there are several papers from the Helmchen lab and Komiyama labs, also for multi-area cortical imaging.
We appreciate this advice. We included mainly visual task learning literature to keep a more focused scope around the regions and task we actually explored in this study. We fear if we expand the intro to include all the large-scale imaging/recording studies in learning field, the background part might become too broad.
We have included (Sych, Fomins, Novelli, & Helmchen, 2022) for its relevance and importance in the field.
(3) In the intro, there is only a mention of a recording of 10 brain regions, with no mention of which areas, along with their relevance to learning. This is mentioned in the results, but it will be good in the intro.
The area names are now added in intro.
(B) Results:
(1) Were you able to track the same neurons across the learning profile? This is not stated clearly.
We did attempt to track the same neurons across learning in this project. However, due to the limited number of electrodes implanted in each brain region, the number of chronically tracked neurons in each region was insufficient to support statistically robust analyses.
We now stated this more clearly in the discussion section.
(2) Figure 1 starts with 7 mice, but only 5 mice are in the last panel. Later it goes down to 3 mice. This should be explained in the results and justified.
We apologize for the confusion. As described in the Methods section, 7 mice (Figure 1B) were used for behavioral training without electrode array or optical fiber implants to establish learning curves, and an additional 5 mice underwent electrophysiological recordings (3 for visual-based decision-making learning and 2 for fruitless learning).
(3) I can't see the electrode tracks in Figure 1d. If they are flexible, how can you make sure they did not bend during insertion? I couldn't find a description of this in the methods also.
The electrode shanks were ultra-thin (1-1.5 µm) and it was usually difficult to recover observable tracks or electrodes in section.
The ultra-flexible probes could not penetrate brain on their own (since they are flexible), and had to be shuttled to position by tungsten wires through holes designed at the tip of array shanks. The tungsten wires were assembled to the electrode array before implantation; this was described in the section of electrode array fabrication and assembly. We also included the description about the retraction of the guiding tungsten wires in the surgery section to avoid confusion.
As an further attempt to verify the accuracy of implantation depth, we also measured the repeatability of implantation in a group of mice and found a tendency for the arrays to end in slightly deeper location in cortex (142.1 ± 55.2 μm, n = 7 shanks), and slightly shallower location in subcortical structure (-122.6 ± 71.7 μm, n = 7 shanks). We added these results as new Figure S1 to accompany Figure 1.
(4) In the spike rater in 1E, there seems to be ~20 cells in V2L, for example, but in 1F, the number of neurons doesn't go below 40. What is the difference here?
We checked Figure 1F, the plotted dots do go below 40 to ~20. Perhaps the file that reviewer received wasn’t showing correctly?
(5) The authors focus mainly on CR, but during learning, the number of CR trials is rather low (because they are not experts). This can also be seen in the noisier traces in Figure 2a. Do the authors account for that (for example by taking equal trials from each group)?
We accounted this by reconstructing bootstrap-resampled datasets with only 5 trials for each session in both the early stage and the expert stage. The mean trace of the 500 datasets again showed overall decrease in CR trial firing rate during task learning, with highly similar temporal dynamics to the original data.
The figure is now added to supplementary materials (as Figure S3 in the revised manuscript).
(6) From Figure 2a, it is evident that Hit trials increase response when mice become experts in all brain areas. The authors have decided to focus on the response onset differences in CRs, but the Hit responses display a strong difference between naïve and expert cases.
Judged from the learning curve in this task the mice learned to inhibit its licking action when the No-Go stimuli appeared, which is the main reason we focused on these types of trials.
The movement effects and potential licking artefacts in Hit trials also restricted our interpretation of these trials.
(7) Figure 3 is still a bit cumbersome. I wasn't 100% convinced of why there is a need to rank the connection matrix. I mean when you convert to rank, essentially there could be a meaningful general reduction in correlation, for example during licking, and this will be invisible in the ranking system. Maybe show in the supp non-ranked data, or clarify this somehow
We agree with this important point. As stated in the manuscript and response to Reviewer #1, our motivation in taking the ranking approach was that the differences in firing rates could bias cross-correlation between spike trains, making raw accounts of significant neuron pairs difficult to compare across conditions, but we acknowledge the ranking measures might obscure meaningful differences or inflate weak effects in the data.
We added the limitations of ranking approach in the discussion section and emphasized the necessity in future studies for better analysis approaches that could provide more accurate assessment of functional connection dynamics without bias from firing rates.
(8) Figure 4a x label is in manuscript, which is different than previous time labels, which were seconds.
We now changed all time labels from Figure 2 to milliseconds.
(9) Figure 4 input and output rank look essentially the same.
We have compressed the brain plots in Figures 4-5 to better convey the take-home message.
(10) Also, what is the late and early stim period? Can you mark each period in panel A? Early stim period is confusing with early CR period. Same for early respons and late response.
The definition of time periods was in figure legends. We now mark each period out to avoid confusion.
(11) Looking at panel B, I don't see any differences between delta-rank in early stim, late stim, early response, and late response. Same for panel c and output plots.
The rankings were indeed relatively stable across time periods. The plots are now compressed and showed a mean rank value.
(12) Panels B and C are just overwhelming and hard to grasp. Colors are similar both to regular rank values and delta-rank. I don't see any differences between all conditions (in general). In the text, the authors report only M2 to have an increase in rank during the response period. Late or early response? The figure does not go well with the text. Consider minimizing this plot and moving stuff to supplementary.
The colormap are now changed to avoid confusion, and brain plots are now compressed.
(13) In terms of a statistical test for Figure 4, a two-way ANOVA was done, but over what? What are the statistics and p-values for the test? Is there a main effect of time also? Is their a significant interaction? Was this done on all mice together? How many mice? If I understand correctly, the post-hoc statistics are presented in the supplementary, but from the main figure, you cannot know what is significant and what is not.
For these figures we were mainly concerned with the post-hoc statistics which described the changes in the rankings of each region across learning.
We have changed the description to “t-test with Sidak correction” to avoid the confusion.
(14) In the legend of Figure 4, it is reported that 610 expert CR trials from 6 sessions, instead of 7 sessions. Why was that? Also, like the previous point, why only 3 mice?
Behavior data of all the sessions used were shown in Figure S1. There were only 3 mice used for the learning group, the difficulty to achieve sufficient unit yields across all regions in the same animal restricted our sample size
(15) Body movement analysis: was this done in a different cohort of mice? Only now do I understand why there was a division into early and late stim periods. In supp 4, there should be a trace of each body part in CR expert versus naïve. This should also be done for Hit trials as a sanity check. I am not sure that the brightness difference between consecutive frames is the best measure. Rather try to calculate frame-to frame correlation. In general, body movement analysis is super important and should be carefully analyzed.
Due to the limitation in the experimental design and implementation, movement tracking was not performed during the electrophysiological recordings, and the 3 mice shown in Figure S4 (now S5) were from a separate group. We have carefully examined the temporal profiles of mouse movements and found it did not fully match the rank dynamics for all regions, and we have added these results and related discussion in the revised manuscript. However, we acknowledge the observed motion energy pattern could explain some of the functional connection dynamics, such as the decrease in face and pupil motion energy could explain the reduction in ranks for striatum.
Without synchronized movement recordings in the main dataset, we cannot fully disentangle movement-related neural activity from task-related signals. We have made this limitation explicit in the revised manuscript and discuss it as a potential confound, along with possible approaches to address it in future work.
(16) For Hit trials, in the striatum, there is an increase in input rank around the response period, and from Figure S6 it is clear that this is lick-related. Other than that, the authors report other significant changes across learning and point out to Figure 5b,c. I couldn't see which areas and when it occurred.
We did naturally expect the activity in striatum to be strongly related to movement.
With Figure S6 (now S7) we wished to show that the observed rank increase for striatum could not simply be attributed to changes in time of lick initiation.
As some readers may argue that during learning the mice might have learned to only intensely lick after response signal onset, causing the observed rise of input rank after response signal, we realigned the spikes in each trial to the time of the first lick, and a strong difference could still be observed between early training stage and expert training stage.
We still cannot fully rule out the effects from more subtle movement changes, as the face motion energy did increase in early response period. This result and related discussion has been added to the results section of revised manuscript.
(17) Figure 6, again, is rather hard to grasp. There are 16 panels, spread over 4 areas, input and output, stim and response. What is the take home message of all this? Visually, it's hard to differentiate between each panel. For me, it seems like all the panels indicate that for all 4 areas, both in output and input, frontal areas increase in rank. This take-home message can be visually conveyed in much less tedious ways. This simpler approach is actually conveyed better in the text than in the figures themselves. Also, the whole explanation on how this analysis was done, was not clear from the text. If I understand it, you just divided and ranked the general input (or output) into individual connections? If so, then this should be better explained.
We appreciate this advice and we have compressed the figures to better convey the main message.The rankings for Figure 6 and Figure S8 (now Figure S9) was explained in the left panel of Figure 3C. Each non-zero element in the connection matrix was ranked to value from 1-10, with a value of 10 represented the 10% strongest non-zero elements in the matrix.
We have updated the figure legends of Figure 3, and we have also updated the description in methods (Connection rank analyses) to give a clearer description of how the analyses were applied in subsequent figures.
(18) Figure 7: Here, the authors perform a ROC analysis between go and no-go stimuli. They balance between choice, but there is still an essential difference between a hit and a FA in terms of movement and licks. That is maybe why there is a big difference in selective units during the response period. For example, during a Hit trial the mouse licks and gets a reward, resulting in more licking and excitement. In FAs,the mouse licks, but gets punished, which causes a reduction in additional licking and movements. This could be a simple explanation why the ROC was good in the late response period. Body movement analysis of Hit and FA should be done as in Figure S4.
We appreciate this insightful advice.
Though we balanced the numbers of basic trial types, we couldn’t rule out the difference in the intrinsic movement amount difference in FA trials and Hit trials, which is likely the reason of large proportion of encoding neurons in response period.
We have added this discussion both in result section and discussion section along with the necessity of more carefully designed behavior paradigm to disentangle task information.
(19) The authors also find selective neurons before stimulus onset, and refer to trial history effects. This can be directly checked, that is if neurons decode trial history.
We attempted encoding analyses on trial history, but regrettably for our dataset we could not find enough trials to construct a dataset with fully balanced trial history, visual stimulus and behavior choice.
(20) Figure 7e. What is the interpretation for these results? That areas which peaked earlier had more input and output with other areas? So, these areas are initiating hubs? Would be nice to see ACC vs Str traces from B superimposed on each other. Having said this, the Str is the only area to show significant differences in the early stim period. But is also has the latest peak time. This is a bit of a discrepancy.
We appreciate this important point.
The limitation in the anatomical coverage of brain regions restricted our interpretation about these findings. They could be initiating hubs or earlier receiver of the true initiating hubs that were not monitored in our study.
The Str trace was in fact above the ACC trace, especially in the response period. This could be explained by the above advice 18: since we couldn’t rule out the difference in the intrinsic movement amount difference in FA trials and Hit trials, and considering striatum activity is strongly related to movement, the Str trace may reflect more in the motion related spike count difference between FA trials and Hit trials, instead of visual stimulus related difference.
This further shows the necessity of more carefully designed behavior paradigm to disentangle task information.
The striatum trace also in fact didn’t show a true double peak form as traces in other regions, it ramped up in the stimulus region and only peaked in response period. This description is now added to the results section.
In the early stim period, the Striatum did show significant differences in average percent of encoding neurons, as the encoding neurons were stably high in expert stage. The striatum activity is more directly affected Still the percentage of neurons only reached peak in late stimulus period.
(21) For the optogenetic silencing experiments, how many mice were trained for each group? This is not mentioned in the results section but only in the legend of Figure 8. This part is rather convincing in terms of the necessity for OFC and V2M
We have included the mice numbers in results section as well.
(C) Discussion
(1) There are several studies linking sensory areas to frontal networks that should be mentioned, for example, Esmaeili et a,l 2022, Matteucci et al., 2022, Guo et a,l 2014,Gallero Salas et al, 2021, Jerry Chen et al, 2015. Sonja Hofer papers, maybe. Probably more.
We appreciate this advice. We have now included one of the mentioned papers (Esmaeili et al., 2022) in the results section and discussion section for its direct characterization of the enhanced coupling between somatosensory region and frontal (motor) region during sensory learning.The other studies mentioned here seem to focus more on the differences in encoding properties between regions along specific cortical pathways, rather than functional connection or interregional activity correlation, and we feel they are not directly related to the observations discussed.
(2) The reposted reorganization of brain-wide networks with shifts in time is best described also in Sych et al. 2021.
We regret we didn’t include this important research and we have now cited this in discussion section.
(3) Regarding the discussion about more widespread stimulus encoding after learning, the results indicate that the striatum emerges first in decoding abilities (Figure 7c left panel), but this is not discussed at all.
We briefly discussed this in the result section. We tend to attribute this to trial history signal in striatum, but since the structure of our data could not support a direct encoding analysis on trial history, we felt it might be inappropriate to over-interpret the results.
(4) An important issue which is not discussed is the contribution of movement which was shown to have a strong effect on brain-wide dynamics (Steinmetz et al 2019; Musall et al 2019; Stringer et al 2019; Gilad et al 2018) The authors do have some movement analysis, but this is not enough. At least a discussion of the possible effects of movement on learning-related dynamics should be added.
We have included these studies in discussion section accordingly. Since the movement analyses were done in a separate cohort of mice, we have made our limitation explicit in the revised manuscript and discuss it as a potential confound, along with possible approaches to address it in future work.
(D) Methods
(1) How was the light delivery of the optogenetic experiments done? Via fiber implantation in the OFC? And for V2M? If the red laser was on the skull, how did it get to the OFC?
The fibers were placed on cortex surface for V2M group, and were implanted above OFC for OFC manipulation group. These were described in the viral injection part of the methods section.
(2) No data given on how electrode tracking was done post hoc
As noted in our response to the advice 3 in results section, the electrode shanks were ultra-thin (1-1.5 µm) and it was usually difficult to recover observable tracks or electrodes in section.
As an attempt to verify the accuracy of implantation depth, we measured the repeatability of implantation in a group of mice and found a tendency for the arrays to end in slightly deeper location in cortex (142.1 ± 55.2 μm, n = 7 shanks), and slightly shallower location in subcortical structure (-122.6 ± 71.7 μm, n = 7 shanks). We added these results as new Figure S1 to accompany Figure 1.
Reviewer #3 (Recommendations for the authors):
(1) The manuscript uses decision-making in the title, abstract and introduction. However, nothing is related to decision learning in the results section. Mice simply learned to suppress licking in no-go trials. This type of task is typically used to study behavioral inhibition. And consistent with this, the authors mainly identified changes related to network on no-go trials. I really think the title and main message is misleading. It is better to rephrase it as visual discrimination learning. In the introduction, the authors also reviewed multiple related studies that are based on learning of visual discrimination tasks.
We do view the Go/No-Go task as a specific genre of decision-making task, as there were literature that discussed this task as decision-making task under the framework of signal detection theory or updating of item values (Carandini & Churchland, 2013; Veling, Becker, Liu, Quandt, & Holland, 2022).
We do acknowledge the essential differences between the Go/No-Go task and the tasks that require the animal to choose between alternatives, and since we have now realized some readers may not accept this task as a decision task, we have changed the title to visual discrimination task as advised.
(2) Learning induced a faster onset on CR trials. As the no-go stimulus was not presented to mice during early stages of training, this change might reflect the perceptual learning of relevant visual stimulus after repeated presentation. This further confirms my speculation, and the decision-making used in the title is misleading.
We have changed the title to visual discrimination task accordingly.
(3) Figure 1E, show one hit trial. If the second 'no-go stimulus' is correct, that trial might be a false alarm trial as mice licked briefly. I'd like to see whether continuous licking can cause motion artifacts in recording.
We appreciate this important point. There were indeed licking artifacts with continuous licking in Hit trials, which was part of the reason we focused our analyses on CR trials. Opto-based lick detectors may help to reduce the artefacts in future studies.
(4) What is the rationale for using a threshold of d' < 2 as the early-stage data and d'>3 as expert stage data?
The thresholds were chosen as a result from trade-off based on practical needs to gather enough CR trials in early training stage, while maintaining a relatively low performance.
Assume the mice showed lick response in 95% of Go stimulus trials, then d' < 2 corresponded to the performance level at which the mouse correctly rejected less than 63.9% of No-Go stimulus trials, and d' > 3 corresponded to the performance level at which the mouse correctly rejected more than 91.2% of No-Go stimulus trials.
(5) Figure 2A, there is a change in baseline firing rates in V2M, MDTh, and Str. There is no discussion. But what can cause this change? Recording instability, problem in spiking sorting, or learning?
It’s highly possible that the firing rates before visual stimulus onset is affected by previous reward history and task engagement states of the mice. Notably, though recorded simultaneously in same sessions, the changes in CR trials baseline firing rates in the V2M region were not observed in Hit trials.
Thus, though we cannot completely rule out the possibility in recording instability, we see this as evidence of the effects on firing rates from changes in trial history or task engagement during learning.
References:
Carandini, M., & Churchland, A. K. (2013). Probing perceptual decisions in rodents. Nat Neurosci, 16(7), 824-831. doi:10.1038/nn.3410.
Cruz, K. G., Leow, Y. N., Le, N. M., Adam, E., Huda, R., & Sur, M. (2023).Cortical-subcortical interactions in goal-directed behavior. Physiol Rev, 103(1), 347-389. doi:10.1152/physrev.00048.2021
Esmaeili, V., Oryshchuk, A., Asri, R., Tamura, K., Foustoukos, G., Liu, Y., Guiet, R., Crochet, S., & Petersen, C. C. H. (2022). Learning-related congruent and incongruent changes of excitation and inhibition in distinct cortical areas. PLOS Biology, 20(5), e3001667. doi:10.1371/journal.pbio.3001667
Goldbach, H. C., Akitake, B., Leedy, C. E., & Histed, M. H. (2021). Performance in even a simple perceptual task depends on mouse secondary visual areas. Elife, 10, e62156. doi:10.7554/eLife.62156.
Siegle, J. H., Jia, X., Durand, S., Gale, S., Bennett, C., Graddis, N., Heller, G.,Ramirez, T. K., Choi, H., Luviano, J. A., Groblewski, P. A., Ahmed, R., Arkhipov, A., Bernard, A., Billeh, Y. N., Brown, D., Buice, M. A., Cain, N.,Caldejon, S., Casal, L., Cho, A., Chvilicek, M., Cox, T. C., Dai, K., Denman, D.J., de Vries, S. E. J., Dietzman, R., Esposito, L., Farrell, C., Feng, D., Galbraith, J., Garrett, M., Gelfand, E. C., Hancock, N., Harris, J. A., Howard, R., Hu, B.,Hytnen, R., Iyer, R., Jessett, E., Johnson, K., Kato, I., Kiggins, J., Lambert, S., Lecoq, J., Ledochowitsch, P., Lee, J. H., Leon, A., Li, Y., Liang, E., Long, F., Mace, K., Melchior, J., Millman, D., Mollenkopf, T., Nayan, C., Ng, L., Ngo, K., Nguyen, T., Nicovich, P. R., North, K., Ocker, G. K., Ollerenshaw, D., Oliver, M., Pachitariu, M., Perkins, J., Reding, M., Reid, D., Robertson, M., Ronellenfitch, K., Seid, S., Slaughterbeck, C., Stoecklin, M., Sullivan, D., Sutton, B., Swapp, J., Thompson, C., Turner, K., Wakeman, W., Whitesell, J. D., Williams, D., Williford, A., Young, R., Zeng, H., Naylor, S., Phillips, J. W., Reid, R. C., Mihalas, S., Olsen, S. R., & Koch, C. (2021). Survey of spiking in the mouse visual system reveals functional hierarchy. Nature, 592(7852), 86-92. doi:10.1038/s41586-020-03171-x
Sych, Y., Fomins, A., Novelli, L., & Helmchen, F. (2022). Dynamic reorganization of the cortico-basal ganglia-thalamo-cortical network during task learning. Cell Rep, 40(12), 111394. doi:10.1016/j.celrep.2022.111394
Veling, H., Becker, D., Liu, H., Quandt, J., & Holland, R. W. (2022). How go/no-go training changes behavior: A value-based decision-making perspective. Current Opinion in Behavioral Sciences, 47,101206.
eLife Assessment
This study provides valuable insight into the role of actin protrusions in mediating early pre-endoyctic steps of human papillomavirus entry at the cell surface. Using state-of-the-art microscopy in an immortalized keratinocyte model, the authors present mostly solid evidence that filopodia actively promote the transfer of heparin sulfate-coated virions from the extracullar matrix to the viral entry factor CD151. Remaining gaps in the mechanistic model could be further supported by including a more expansive analysis of the fixed microscopy samples and live cell imaging to distinguish virion transfer from direct binding.
Reviewer #1 (Public review):
Summary:
The author's goal was to arrest PsV capsids on the extracellular matrix using cytochalasin D. The cohort was then released and interaction with the cell surface, specifically with CD151 was assessed.
The model that fragmented HS associated with released virions mediates the dominant mechanism of infectious entry has only been suggested by research from a single laboratory and has not been verified in the 10+ years since publication. The authors are basing this study on the assumption that this model is correct, and these data are referred to repeatedly as the accepted model despite much evidence to the contrary. The discussion in lines 65-71 concerning virion and HSPG affinity changes is greatly simplified. The structural changes in the capsid induced by HS interaction and the role of this priming for KLK8 and furin cleavage has been well researched. Multiple laboratories have independently documented this. If this study aims to verify the shedding model, additional data needs to be provided.
Note on revisions:
The authors did an excellent job in their revision to include data from the effect of proteolytic priming on their observed virion transfer to the cell body. All other minor issues were addressed adequately.
The work could be especially critical to understanding the process of in vivo infection.
Reviewer #2 (Public review):
The study design involves infecting HaCaT cells (immortalised keratinocytes mimicking basal cells of a target tissue) and observing virus localization with and without actin polymerization inhibition by cytochalasin D (cytoD) to analyze virion transfer from the ECM to the cell via filopodial structures, using cellular proteins as markers.
In the context of the model system, the authors stress in the revised version the importance of using HaCaT cells as a relevant 'polarized' cell model for infection. The term 'polarized' is used in the cell biological literature for epithelial cells to describe a strict apical vs. basolateral demarcation of the plasma membrane with an established diffusion barrier of the tight junction. However, HaCat cells do not form tight junctions. In squamous epithelia, such barriers are only found in granular layers of the epithelium. The published work cited in support of their claims either does not refer to polarity or only in the context of other cells such as CaCo-2 cells.
Overall, the matter of polarity would be important, if indeed the virus could only access cell-associated HSPGs as primary binding receptor, or the elusive secondary receptor via the ECM in the used model system (HaCaT cells), if they would locate exclusively basolaterally. This is at least not the case for binding, as observed in several previous publications (just two examples: Becker et al, 2018, Smith et al., 2008). With only a rather weak attempt at experimental verification of their model system with regards to polarity of binding, the authors then go on to base their conclusions on this unverified assumption.
This is one example of several in the manuscript, where claims for foundational premises, observations, and/or conclusions remain undocumented or not supported by experimental data.
Another such example is the assumption of transfer of the virus from ECM to the tetraspanin CD151. Here, the conclusions are based on the poorly documented inability of the virus to bind to the cell body, which is in stark contrast to several previous publications, and raises questions. Thus, association with CD151 likely occurs both from ECM derived virus AND virus that binds to cells, so that any conclusions on the mode of association is possible only in live cell data (which is not provided). Overall, their proposed model thus remains largely unsubstantiated with regards to receptor switching.
There are a number of important additional issues with the manuscript:
First, none of the inhibitors have been tested in their system for efficacy and specificity, but rely on published work in other cell types. This considerably weakens the confidence on the conclusion drawn by the authors.
Second, the authors aim to study transfer from ECM to the cell body and effects thereof. However, there are still substantial amounts of viruses that bind to the cell body compared to ECM-bound viruses in close vicinity to the cells. This is in part obscured by the small subcellular regions of interest that are imaged by STED microscopy, or by the use of plasma membrane sheets. This remains an issue despite the added Supple. Fig. 1, where also only sub cellular regions are being displayed. As a consequence the obtained data from time point experiments is skewed, and remains for the most part unconvincing, largely because the origin of virions in time and space cannot be taken into account. This is particularly important when interpreting the association with HS, the tetraspanin CD151, and integral alpha 6, as the low degree of association could be originating from cell bound and ECM-transferred virions alike.
Third, the use of fixed images in a time course series also does not allow to understand the issue of a potential contribution of cell membrane retraction upon cytoD treatment due to destabilisation of cortical actin. Or, of cell spreading upon cytoD washout. The microscopic analysis uses an extension of a plasma membrane stain as marker for ECM bound virions, this may introduce a bias and skew the analysis.
Fourth, while the use of randomisation during image analysis is highly recommended to establish significance (flipping), it should be done using only ROIs that have a similar density of objects for which correlations are being established. For instance, if one flips an image with half of the image showing the cell body, and half of the image ECM, it is clear that association with cell membrane structures will only be significant in the original. But given the high density of objects on the plasma membrane, I am not convinced that doing the same by flipping only the plasma membrane will not also obtain similar numbers than the original.
Author response:
The following is the authors’ response to the original reviews.
Public Reviews:
Reviewer #1 (Public review):
The authors' goal was to arrest PsV capsids on the extracellular matrix using cytochalasin D. The cohort was then released, and interaction with the cell surface, specifically with CD151, was assessed.
The model that fragmented HS associated with released virions mediates the dominant mechanism of infectious entry has only been suggested by research from a single laboratory and has not been verified in the 10+ years since publication. The authors are basing this study on the assumption that this model is correct, and these data are referred to repeatedly as the accepted model despite much evidence to the contrary.
We stated in the introduction on line 65/66 ´Two release mechanisms are discussed, that mutually are not exclusive´. This implies that we do not consider the shedding model as ‘the accepted model’. Furthermore, we do not state in the discussion neither that the shedding model is the preferred one. However, we referred to the shedding model in the discussion, because we find HS associated with transferred PsVs, which is in line with this model.
The discussion in lines 65-71 concerning virion and HSPG affinity changes is greatly simplified. The structural changes in the capsid induced by HS interaction and the role of this priming for KLK8 and furin cleavage have been well researched. Multiple laboratories have independently documented this. If this study aims to verify the shedding model, additional data need to be provided.
Our findings are compatible with both models, and we do not aim to verify the shedding model neither want to disprove the priming model. However, as we understand, the referee wishes more visibility of the priming model. Therefore, using inhibitors previously used in the field, we tested whether inhibition of KLK8 or furin reduces PsV translocation to the cell body (after CytD wash off). Leupeptin blocks transport, while Furin inhibitor I still allows some initial translocation. We incorporated this new data as Figure 2 (line 265): “…we would expect that inhibition of L1 processing during the CytD incubation prevents the recovery of PsV translocation from the ECM to the cell body (Figure 2A and D). To test for this possibility, as employed in earlier studies, the protease inhibitor leupeptin was used to inhibit proteases including KLK8 which is required for L1 cleavage (Cerqueira et al. 2015). Employing this inhibitor, the PCC between PsV-L1 and F-actin staining remains negative after CytD removal, showing that for translocation indeed the action of proteases is required (Figure 2B and D). In contrast, inhibition of L2 cleavage by a furin specific inhibitor has no effect on the PCC (Figure 2C and D). However, it should be noted that we occasionally observe PsVs not completely translocating but accumulating at the border of the F-actin stained area (for example see Figure 2C (60 min)). This results in an increase of the PCC almost equal to complete translocation, explaining why the PCC remains unaffected despite a furin inhibitory effect. Hence, furin inhibition may have some effect on translocation that, however, is undetected in this type of analysis.’
Moreover, we have added a paragraph discussing how our data integrates into the established model of the HPV infection cascade (line 604): ‘HPV infection is the result of several steps, starting with the initial binding of virions via electrostatic and polar interactions (Dasgupta et al. 2011) to the primary attachment site HS (Richards et al. 2013), which induces capsid modification (Feng et al. 2024; Cerqueira et al. 2015) and HS cleavage (Surviladze et al. 2015), enabling the virion to be released from the ECM or the glycocalyx. Next, virions bind to the cell surface to a secondary receptor complex that forms over time, and become internalized via endocytosis, before they are trafficked to the nucleus (Ozbun and Campos 2021; Mikuličić et al. 2021). Regarding the transition from the primary attachment site to cell surface binding, as already outlined in the introduction, two models are discussed. In one model, proteases cleave the capsid proteins. After priming, the capsids are structurally modified and the virion can dissociate from its HS attachment site. It has been suggested that capsid priming is mediated by KLK8 (Cerqueira et al. 2015) and furin (Richards et al. 2006). In our system, KLK8 inhibition blocks PsV transport, while furin inhibition has some effect that, however, cannot be detected in this analysis (Figure 2) suggesting furin engagement at later steps in the infection cascade. This is in line with earlier in vitro studies on the role of cell surface furin (Surviladze et al. 2015; Day et al. 2008; Day and Schiller 2009). In any case, our results align with both models of ECM detachment: one involving HS cleavage (HS co-transfer) and another involving capsid modification (by e.g., KLK8).’
The model should be fitted into established entry events,…
Please see our reply above.
or at minimum, these conflicting data, a subset of which is noted below, need to be acknowledged.
(1) The Sapp lab (Richards et al., 2013) found that HSPG-mediated conformational changes in L1 and L2 allowed the release of the virus from primary binding and allowing secondary receptor engagements in the absence of HS shedding.
(2) Becker et al. found that furin-precleaved capsids could infect cells independently of HSPG interaction, but this infection was still inhibited with cytochalasin D.
(3) Other work from the Schelhaas lab showed that cytochalasin D inhibition of infection resulted in the accumulation of capsids in deep invaginations from the cell surface, not on the ECM
(4) Selinka et al., 2007, showed that preventing HSPG-induced conformational changes in the capsid surface resulted in noninfectious uptake that was not prevented with cytochalasin D.
(5) The well-described capsid processing events by KLK8 and furin need to be mechanistically linked to the proposed model. Does inhibition of either of these cleavages prevent engagement with CD151?
The authors need to consider an explanation for these discrepancies.
We do not see any discrepancies; our observations are compatible with aspects of both the shedding and the priming model. That PsVs carry HS-cleavage products doesn´t imply that HS cleavage is sufficient or required for infection, or that the priming model would be wrong. We do not view our data as being in conflict with the priming model. Most of the above-mentioned papers are now cited.
Altogether, we acknowledge that the study gains importance by directly testing the priming model within our experimental system. We are thankful for the above comments and addressed this issue.
Other issues:
(1) Line 110-111. The statement about PsVs in the ECM being too far away from the cell surface to make physical contact with the cell surface entry receptors is confusing. ECM binding has not been shown to be an obligatory step for in vitro infection.
Not obligatory, but strongly supportive (Bienkowska-Haba et al., Plos Path., 2018; Surviladze et al., J. Gen. Viro., 2015). As recently published by the Sapp lab (Bienkowska-Haba et al., Plos Path., 2018), ´Direct binding of HPV16 to primary keratinocytes yields very inefficient infection rates for unknown reasons.´ Moreover, the paper shows that HaCaT cell ECM binding of PsVs increases the infection of NHEK by 10-fold and of HFK by almost 50-fold.
This idea is referred to again on lines 158-159 and 199. The claim (line 158) that PsV does not interact with the cell within an hour needs to be demonstrated experimentally and seems at odds with multiple laboratories' data. PsV has been shown to directly interact with HSPG on the cell surface in addition to the ECM. Why are these PsVs not detected?
The reviewing editor speculated that HaCaT cells may be a model system in which the in vivo relevant binding to the ECM can be better studied as in non-polarized cell types. This is because binding to the ECM cannot be bypassed by direct cell surface binding. The observation that only few PsVs bind to the basal cell membrane indeed suggests restricted diffusional access of PsVs to binding receptors of the basal membrane. The reviewing editor asked for an experiment showing that more PsVs bind after cell detachment. We performed this experiment and indeed find more PsVs binding to the cell surface of detached cells. This point is very important for the understanding of the study and now we mention it in several sections of the manuscript, as outlined in the following.
Line 125: ‘Many PsVs that bind to the ECM may locate distal from the cell surface and are thus unable to establish direct contact with entry receptors. However, they are capable of migrating by an actindependent transport along cell protrusions towards the cell body (Smith et al. 2008; Schelhaas et al. 2008). We aimed for blocking this transport in HaCaT cells, a cell line that is widely used as a cell culture model for HPV infection. HaCaT cells closely resemble primary keratinocytes in key aspects: they are not virally transformed and produce large amounts of ECM that facilitates infection (Bienkowska-Haba et al. 2018; Gilson et al. 2020). In addition, HaCaT cells exhibit cellular polarity that enforces binding of virus particles to the ECM, as the virions cannot bind to receptors/entry components, such as CD151, Itgα6 and HSPGs that co-distribute on the basolateral membrane of polarized keratinocytes (Sterk et al. 2000; Cowin et al. 2006; Mertens et al. 1996), making them inaccessible by diffusion.’
Line 205: ‘During the CytD incubation, PsVs bind to HSPGs of the basolateral membrane for 5 h. Still, in the cell body area hardly any PsVs are present (0.14 PsV/µm<sup>2</sup>, Supplementary Figure 1B). In the control, the PsV density is several-fold larger (Supplementary Figure 1B). This is expected, as the PsVs bind to the ECM and translocate to the cell body. We wondered whether there are more binding sites at the basal membrane that remain inaccessible to PsVs by diffusion because of the insufficient space between glass-coverslip and basolateral membrane. For clarification, we incubated EDTA detached HaCaT cells in suspension with PsVs for 1 h at 4 °C, followed by re-attachment for 1 h. Under these conditions, we find a PsV density 12.4-fold larger than after 5 h of CytD incubation of adhered cells (Supplementary Figure 1B and D). However, it should be noted that these values cannot be directly compared. Aside from the different treatments, another difference lies in the size of the basal membrane, as re-attachment of cells is not complete after only 1 h (compare size of adhered membranes in Supplementary Figure 1A and C). Therefore, the imaged membranes are likely strongly ruffled, which results in the underestimation of the size of the adhered membrane. As a result, we overestimate the PsVs per µm<sup>2</sup> (please note that we cannot re-attach cells for longer times as we would then lose PsVs due to endocytosis). On the other hand, we would underestimate the PsV density at the basal membrane if after re-attachment we image in part also some apical membrane. In any case, the experiment suggests that PsVs bind more efficiently if membrane surface receptors are accessible by diffusion. This is in support of the above notion that the basal membrane may provide more entry receptors than one would expect from the low density of PsVs bound after 5 h CytD (Supplementary Figure 1B). This suggests that under our assay conditions, PsVs cannot easily bypass the translocation from the ECM to the cell body by diffusing directly to the basal membrane. Hence, the large majority of PsVs that enter the cell were previously bound to the ECM. Therefore, HaCaT cells serve as an ideal model for studying the transfer of ECM bound HPV particles to the cell surface, which is similar to in vivo infection of basal keratinocytes after binding to the basement membrane (Day and Schelhaas 2014; Kines et al. 2009; Schiller et al. 2010; Bienkowska-Haba et al. 2018).’
Line 529: ‘Filopodia usage not only facilitates infection but also increases the likelihood of virions to reach their target cells during wound healing, namely the filopodia-rich basal dividing cells. In fact, several types of viruses exploit filopodia during virus entry (Chang et al. 2016), hinting at the possibility that for HPV and other types of viruses actin-driven virion transport may play a more important role than it is currently assumed. If this is the case, sub-confluent HaCaT cells, or even better single HaCaT cells, would be an ideal model system for the study of these very early infection steps that involve ECM attachment and subsequent filopodia-dependent transport. As shown in Supplementary Figure 1, HaCaT cells have many binding sites for the HPV16 PsVs. However, as they are polarized and the binding receptors are only at the basal membrane, they remain relatively inaccessible by diffusion. Therefore, the ECM binding that is also observed in vivo (Day and Schelhaas 2014) and subsequent transport via filopodia are used upon infection of HaCaT cells that locate at the periphery of cell patches. Here, PsVs bind to the ECM which strongly enhances infection of primary keratinocytes (Bienkowska-Haba et al. 2018). In contrast, HPV can readily bind to HSPGs on the cell surface of nonpolarized cells, and by this bypasses ECM mediated virus priming and the filopodia dependency. We propose that HaCaT cells are a valuable system for studying the very early events in HPV infection that allows for dissecting capsid interaction with ECM resident priming factors and cell surface receptors.’
Finally, please note that in the previous version of the manuscript, we did not question that in many cellular systems PsVs interact with heparan sulfate proteoglycans (HSPGs) present on the cell surface, or both on the cell surface and the ECM. We stated on line 59 ´While in cell culture virions bind to HS of the cell surface and the ECM, it has been suggested that in vivo they bind predominantly to HS of the extracellular basement membrane (Day and Schelhaas, 2014; Kines et al., 2009; Schiller et al., 2010).´
We hope that after adding the above explanations and the experiment requested by the reviewing editor it is now clear why only few PsVs bind directly (not via the ECM) to the cell surface. We appreciate the reviewer’s and the reviewing editor’s input that has significantly improved the manuscript.
(2) The experiments shown in Figure 5 need to be better controlled. Why is there no HS staining of the cell surface at the early timepoints? This antibody has been shown to recognize N-sulfated glucosamine residues on HS and, therefore, detects HSPG on the ECM and cell surface.
There is staining. However, as the staining at the periphery is stronger and images are shown at the same settings of brightness and contrast, the impression is given that the cell surface is not stained. We have added more images showing HS cell surface staining.
(i) Supplementary Figure 4C shows an enlarged view of the CytD/0 min cell shown in Figure 6A. In the area stained by Itgα6, that marks the cell body, HS staining is present, although less abundant in comparison to the ECM.
(ii) In Figure 8, CytD/30 min, a cell is shown with abundant HS in the cell body region (compare cyan and green LUT).
(iii) In newly added Figure 3A, lower panel, another cell with HS in the cell body region is shown.
Please note that the staining is highly variable. We indicate this by stating on Line 373: ‘The pattern of the HS staining (cyan LUT) and the overlap of HS with PsVs and Itgα6 are highly variable (Figure 6A).’
Therefore, the conclusion that this confirms HS coating of PsV during release from the ECM (line 430431) is unfounded. How do the authors distinguish between "HS-coated virions" and HSPG-associated virions?
The transient increase in the PCC at CytD/30 min can be interpreted as PsV/HS co-transport or as direct binding of PsVs to cell surface HSPGs. However, two arguments support co-transport.
First, we find that CytD/PsVs increases the HS intensity (see newly added Figure 3, confirming old Figure 5 that is now Figure 6). We state on line 290 ‘… that without actin-dependent PsV translocation HS cleavage products are retained in the ECM, consistent with the hypothesis that cleaved HS remains associated with PsVs (Ozbun and Campos 2021).
Second, the distance between HS and Itgα6 (the cell body marker) decreases over time after CytD removal, which suggests movement of HS to the cell body (Supplementary Figure 8D). We state on line 422: ‘The movement of HS towards the cell body after removal of CytD, which indirectly demonstrates that PsVs are coated with HS, is suggested by a shortening of the HS-Itgα6 distance over time (Supplementary Figure 8D).’
It is difficult to comprehend how the addition of 50 vge/cell of PsV could cause such a global change in HS levels.
Some areas are covered with confluent cells, to which hardly any PsVs are bound, because accessing their basolateral membrane is nearly impossible, and PsVs do not bind to the exposed apical membrane as well. We assume this is a major difference to cultures of unpolarized cells, where PsVs should distribute more or less equally over cells. This means that in our experiments the vge/cell is not a suitable parameter for relating the magnitude of an effect to a defined number of PsVs. In the ECM, the PsV density is very high, enabling one cell to collect, in theory, several hundred PsVs, much more than expected from the 50 vge/cell.
We state on line 135: ‘Frequently, we observe patches of confluent cells which are common to HaCaT cells. Cells at the center of these patches are dismissed during imaging, because there are no anterogradely migrating PsVs at these cells. A second reason for our dismissal of these cells is that hardly any PsVs are bound to them, possibly because their basal membranes are inaccessible by diffusion. Instead, we focus on isolated HaCaT cells or cells at the periphery of cell patches. In these cells, we find more PsVs per cell than one would expect from the employed 50 viral genome equivalents (vge) per cell, indicating that PsVs are unequally distributed between the cells.’
The claim that the HS levels are decreased in the non-cytochalasin-treated cells due to PsV-induced shedding needs to be demonstrated.
We did not claim that PsVs induce shedding, we rather believe they retain shedded HS. Without PsVs, the shedded HS is washed off from the ECM. We have reproduced the observation made in old Figure 5 (now Figure 6) in the newly added Figure 3 that also shows that PsVs alone have no effect on the HS intensity, only when present together with CytD. We state on line 277: ‘As outlined above, during the 5 h incubation with CytD, proteases in the ECM are expected to cleave HS chains. These cleavage products should be able to diffuse out of the ECM, unless they remain associated with nontranslocating PsVs. In the control, PsV associated HS cleavage products would leave the ECM through PsV translocation…. Using an antibody that reacts with an epitope in native heparan sulfate chains, only after CytD and if PsVs are present, the level of HS staining is significantly increased (Figure 3B). As shown in Figure 3A, stronger HS staining at PsVs (open arrows) and as well in PsV free areas (closed arrows) was observed… Collectively, our findings indicate that without actin-dependent PsV translocation HS cleavage products are retained in the ECM, consistent with the hypothesis that cleaved HS remains associated with PsVs (Ozbun and Campos 2021).’
If HS is actually shed, staining of the cell periphery could increase with the antibody 3G10, which detects the HS neoepitope created following heparinase cleavage.
We have tested the antibody by which we obtain only a very weak staining (Supplementary Figure 2), not allowing to differentiate between an increase in the cell periphery and the cell body area. We still include the experiment as it suggests that CytD has no effect on HS processing. We state on line 286: ‘As additional control and shown in Supplementary Figure 2, we use an antibody that reacts with a HS neo-epitope generated by heparitinase-treated heparan sulfate chains (Yokoyama et al. 1999; for details see methods). This neo-epitope staining is independent of the presence of CytD and the incubation time, suggesting that CytD does not directly affect HS processing.’
Reviewer #2 (Public review):
Summary:
Massenberg and colleagues aimed to understand how Human papillomavirus particles that bind to the extracellular matrix (ECM) transfer to the cell body for later uptake, entry, and infection. The binding to ECM is key for getting close to the virus's host cell (basal keratinocytes) after a wounding scenario for later infection in a mouse vaginal challenge model, indicating that this is an important question in the field.
Strengths:
The authors take on a conceptually interesting and potentially very important question to understand how initial infection occurs in vivo. The authors confirm previous work that actin-based processes contribute to virus transport to the cell body. The superresolution microscopy methods and data collection are state-of-the art and provide an interesting new way of analysing the interaction with host cell proteins on the cell surface in certain infection scenarios. The proposed hypothesis is interesting and, if substantiated, could significantly advance the field.
Weaknesses:
As a study design, the authors use infection of HaCaT keratinocytes, and follow virus localisation with and without inhibition of actin polymerisation by cytochalasin D (cytoD) to analyse transfer of virions from the ECM to the cell by filopodial structures using important cellular proteins for cell entry as markers.
First, the data is mostly descriptive besides the use of cytoD, and does not test the main claim of their model, in which virions that are still bound to heparan sulfate proteoglycans are transferred by binding to tetraspanins along filopodia to the cell body.
The study identifies a rapid translocation step from the ECM to CD151 assemblies. We have no data that demonstrates a physical interaction between PsVs and CD151. In the model figure, we draw CD151 as part of the secondary receptor complex. We are sorry for having raised the impression that PsVs would bind directly to CD151 and have modified the model Figure accordingly. In the new model figure (Figure 9), the first contact established is to a CD151 free receptor.
Second, using cytoD is a rather broad treatment that not only affects actin retrograde flow, but also virus endocytosis and further vesicular transport in cells, including exocytosis. Inhibition of myosin II, e.g., by blebbistatin, would have been a better choice as it, for instance, does not interfere with endocytosis of the virus.
As we focus on early events, we are not concerned about CytD blocking as well late steps in the infection cascade, like endocytosis. However, we agree that a comparison between CytD and blebbistatin would be very interesting. We added Figure 8, showing that blebbistatin only partially stops migration.
Line 429: ‘Actin retrograde transport, which underlies the here observed virion transport, is the integrative result of three components (Smith et al. 2008; Schelhaas et al. 2008)…. As CytD broadly interferes with F-actin dependent processes, we investigated the effects upon inhibition of only one of the three components, namely the myosin II mediated retrograde movement towards the cell body. Instead of CytD, we employed in the 5 h preincubation the myosin II inhibitor blebbistatin. For the control (0 min), we show in Figure 8A one example of a cell with comparatively many PsVs at the periphery (as mentioned above, the PsV pattern is highly variable) to better illustrate the difference to the PsV pattern occasionally seen with blebbistatin. After blebbistatin treatment (0 min), PsVs are still distal to the cell body but less dispersed than after CytD treatment, seemingly as if translocation started but stopped in the midst of the pathway (Figure 8A, blebbistatin). The PCC between PsVs and HS, like after CytD (Figure 6C), is elevated after blebbistatin, albeit the effect is not significant (Figure 8C). The cell body PCC, is not at 30 min (CytD) but already at 0 min elevated (compare Figure 6D to Figure 8D), which can be explained by partial translocation. This is further supported by the fact that only 8% of PsVs are closely associated with HS (Figure 8E; blebbistatin, 0 min) compared to 15% after CytD treatment (Figure 6E; 0 min). Furthermore, after 0 min PsV incubation with blebbistatin we observe no effect on the HS intensity (compare Figure 8B to Figure 3B and Figure 6B). Hence, in contrast to CytD, blebbistatin does not trap the PsVs in the ECM where they associate with HS, but ongoing actin polymerization pushes actin filaments along with PsVs towards the cell body.’
Third, the authors aim to study transfer from ECM to the cell body and the effects thereof. However, there are substantial, if not the majority of, viruses that bind to the cell body compared to ECM-bound viruses in close vicinity to the cells.
Please see our detailed reply to referee #1 that has raised the same issue. In brief, we agree that in multiple cell culture systems viruses bind preferentially to the cell surface directly. However, in HaCaT cells, the majority of PsVs does not bind directly to the basal membrane but gets there after initial binding to the ECM. Thus, we believe our system appropriately models the physiologically relevant scenario of ECM-to-cell transfer, as also speculated by the reviewing editor that has suggested an experiment showing that more PsVs bind to detached cells (please see above).
This is in part obscured by the small subcellular regions of interest that are imaged by STED microscopy, or by the use of plasma membrane sheets. As a consequence, the obtained data from time point experiments is skewed, and remains for the most part unconvincing due to the fact that the origin of virions in time and space cannot be taken into account. This is particularly important when interpreting association with HS, the tetraspanin CD151, and integral alpha 6, as the low degree of association could originate from cell-bound and ECM-transferred virions alike.
As already stated above, we observe massive binding of PsVs to the ECM, in contrast to very few PsVs that diffuse beneath the basolateral membrane of the polarized HaCaT cells and do bind directly to the cell surface. In other cellular systems, cells may hardly secrete ECM, are not polarized, and therefore virions can easily bypass ECM binding. Therefore, it is reasonable to assume that in HaCaT cells the large majority of PsVs found on the cell body originates from the ECM.
Fourth, the use of fixed images in a time course series also does not allow for understanding the issue of a potential contribution of cell membrane retraction upon cytoD treatment due to destabilisation of cortical actin. Or, of cell spreading upon cytoD washout.
The newly added blebbistatin experiment suggests that the initial translocation is exclusively dependent on retrograde actin flow. However, we agree that we are not able to unravel more details regarding the different possible contributions to the movement. Importantly, the lack of PCC increase after CytD/leupeptin removal (Figure 2D) suggest there is not much cell spreading into the area of accumulated PsVs. Please see our more detailed reply to the same issue raised by the same referee in the recommendations for the authors.
The microscopic analysis uses an extension of a plasma membrane stain as a marker for ECM-bound virions, which may introduce a bias and skew the analysis.
The dye TMA-DPH stains exclusively cellular membranes and not the ECM. The stain is actually used to delineate the cell body from the ECM area (please see Figure 1).
Fifth, while the use of randomisation during image analysis is highly recommended to establish significance (flipping), it should be done using only ROIs that have a similar density of objects for which correlations are being established.
We agree that the way of how randomization is done is very important. Regarding the association of PsVs with CD151 and HS, we corrected for random background association, which is now explained in more detail in in the Figure legend of Supplementary Figure 7: “On flipped images, we often find values more than half of the values of the original images, demonstrating that many PsVs have a distance ≤ 80 nm to CD151 merely by chance (background association)… (C) Each time point in (A) and (B) obtained from flipped images is the average of three biological replicates. We use these altogether 24 data points, plotting the fraction of closely associated PsVs against the CD151 maxima density. The fraction increases with the maxima density, as the chance of random association increases with the maxima density. The fitted linear regression line describes the dependence of the background association from the maxima density. As a result, the background association (y) can be calculated for any maxima density (x) in original images with the equation y = 2.04x. Please note that the CytD/0 min may be overcorrected as we subtract background association with reference to the CD151 maxima density of the entire ROI (for an example ROI see Supplementary Figure 6A), although the local maxima density at distal PsVs is lower. On the other hand, PsVs at the cell border may have a larger local CD151 maxima density and consequently are undercorrected.’
For instance, if one flips an image with half of the image showing the cell body, and half of the image ECM, it is clear that association with cell membrane structures will only be significant in the original.
We are aware of this problem. For instance, it would produce ‘artificially’ low PCCs after flipping images of PsV/HS stainings (please see negative PCC value after flipping in Supplementary Figure 8). In this case, we do not use as argument that in flipped images the PCC is lower. Instead, we would argue that over time the PCC changes in the original images. We still provide the PCC values of flipped images, as additional information, showing that in most cases we obtain after flipping a PCC of zero, as expected
Hence, we fully agree that careful controls in image analysis is required, and used the above-described method for the correction of background association when the fraction of closely associated PsVs is analyzed. We do not use a lower PCC value in flipped images as argument if not appropriate.
I am rather convinced that using randomisation only on the plasma membrane ROIs will not establish any clear significance of the correlating signals.
Figure 6D and 8D show the PCC specifically of the cell body (only of plasma membrane ROIs). In flipped images (not shown in the previous version for clarity), we obtain significantly lower PCCs (Supplementary Figure 8F/G and Supplementary Figure 10C/D. We propose that in this case it would be appropriate to use a lower PCC of flipped images as argument for specific association. Still, also in this experiment we argue with a change in the PCC over time, and not with a PCC of zero after flipping. As above, we still provide the PCC values of flipped images as additional information.
Also, there should be a higher n for the measurements.
One replicate is based on the average of 14-15 cells for each condition (more for figure 4). Hence, in a typical experiment (Control and CytD with 4 time points) about 120 cells are analyzed, which is a broad basis for the averages of one replicate.
We realize that with three biological replicates we find significant effects only if we have strong effects or moderate effects with very low variance.
Recommendations for the authors:
Reviewing Editor:
The focus on the events of HPV infection between ECM binding and keratinocyte-specific receptor binding is unique and interesting. However, I agree with the reviewers that some of the conclusions could use more experimental support, as detailed in their comments. The failure to detect direct binding of the PsV to HSPGs on the cell surface in in vitro assays contradicts much of the published literature. For example, others have found that HPV capsids bind cultured cell lines in suspension, i.e, in the absence of ECM. Do EDTA-suspended HaCaT cells bind PsV? Is the binding HSPG dependent? If the authors think that failure to detect direct cell binding of HaCaTs is an unusual feature of these cell lines or culture condition,s then it would be helpful to provide an explanation. However, it is worth noting that an in vitro system where the cells do not directly bind capsids through HSPG interactions would be a much better model for studying the stages of HPV infection that are the focus of this study, since there is no direct binding of keratinoctyes in vivo.
We are thankful for this comment that had a strong influence on the revision. The suggested experiment has been incorporated as new Supplementary Figure 1. It shows that many more PsVs bind to the cell surface of cells in suspension than to adhered cells. As suggested by the reviewing editor, we explain now that HaCaT cells are a suitable model system for studying the in vivo transport from the ECM to the cell body that in these cells, due to their polarization, cannot be bypassed (for more details please see our replies above addressing these issues).
Because conclusions drawn regarding HS interactions are largely based on experiments using a single HS mAb, it is important that the specificity of this mAb is described in more detail, either based on the literature or further experimentation.
We provide now detailed information about the HS antibodies used in the study. We state on line 282 ‘Using an antibody that reacts with an epitope in native heparan sulfate chains…’ and on line 286 ‘we use an antibody that reacts with a HS neo-epitope generated by heparitinase-treated heparan sulfate chains…’ and in the methods section ‘For Heparan sulfate (HS) a mouse IgM monoclonal antibody (1:200) (amsbio, cat# 370255-S) was used that reacts with an epitope in native heparan sulfate chains and not with hyaluronate, chondroitin or DNA, and poorly with heparin (mAb 10E4 (David et al., 1992)). For HS neo-epitope (Yokoyama et al., 1999) detection, a mouse monoclonal antibody (1:200) (amsbio, cat#370260-S) was used that reacts only with heparitinase-treated heparan sulfate chains, proteoglycans, or tissue sections, and not with heparinase treated HSPGs. The antibody recognizes desaturated uronic acid residues (mAb 3G10 (David et al., 1992)).’
Reviewer #1 (Recommendations for the authors):
(1) The phrase "tight association" or similar is repeatedly used and is not acceptable for microscopic studies; use "close association", which has no affinity connotations.
Has been changed as suggested by the referee.
(2) Why are lysine-coated coverslips used for microscopy? HaCaT cells adhere tightly to untreated glass, and this coating could affect the distribution of ECM and extracellular PsV.
We believe a tight association of the basal cell membrane to its substrate, as in vivo, where the basal membrane is tightly adhered to other cells, is important in these experiments. In weakly adherent cells more PsVs may bind to the cell surface, bypassing the transport step. Hence, although HaCaT cells may not require the coat and would be able to adhere to glass, the association may not be tight enough to mimic in vivo conditions.
(3) What is the reason to use detection of the pseudogenome for some of the experiments instead of L1 detection throughout? The process of EdU detection is sufficiently denaturing to affect some protein epitopes. The introduction of this potential artifact doesn't seem warranted for capsid detection experiments.
The L1 and the Itgα6 antibody are from the same species, wherefore we have used in Figures 4 and 6 click-labeling of the reporter plasmid. We do not disagree with the notion of the referee, that EdU detection may denature the epitope of some proteins. For instance, we have observed a different staining pattern for CD151; for Itgα6 and HS we saw no obvious difference in the staining patterns. In double staining experiments using L1 antibody and click-labeling, both staining patterns overlapped very well, indicating that click-labeling is suitable to visualize PsVs.
(4) What concentration of TMA-DPH was used?
TMA-DPH is a poorly water-soluble dye that becomes strongly fluorescent upon insertion into a membrane. Because of its poor water solubility, a precise concentration cannot be given. We added 50 µl of a saturated TMA-DPH solution in PBS to 1 ml of PBS in the imaging chamber. We state this now in the methods section.
(5) Line 419: This statement is misleading. Although PsV interaction with HSPG on the ECM is crucial for infectious transfer to cells, the majority of the PsV binding on the ECM has been attributed to interaction with laminin 332. Treatment of PsV with heparin causes sequestration to the ECM.
We are sorry for the confusion and have removed the misleading statement.
(6) Some reference choices are poor:
Line 54: Ozbun and Campos, this is not the correct reference
In the review we cited, in the introduction it is stated that PsVs establish infection via a break in the epithelial barrier? However, we have replaced this reference by a review that focuses more on epithelial wounding: ‘Ozbun, Michelle A. (2019): Extracellular events impacting human papillomavirus infections: Epithelial wounding to cell signaling involved in virus entry. In Papillomavirus research (Amsterdam, Netherlands) 7, pp. 188–192. DOI: 10.1016/j.pvr.2019.04.009.’
Line 2012: Doorbar et al., this is not the correct reference.
Thank you for pointing this out (..we assume the referee refers to line 104 and not line 2012). We have noticed this error during revision. As it is difficult to get a specialized review on this topic, we now cite Ozbun and Campus, 2021 that states PsVs are ‘structurally and immunologically indistinguishable from lesion- and tissue-derived HPVs.’
Minor issues:
(1) It is difficult to appreciate the ECM and cell surface binding pattern from the provided images, which do not even contain an entire cell. We need to see a few representative field views with the ECM delineated with laminin 332 staining, as HS antibodies stain both the ECM and cell surface.
We now provide overview images in Supplementary Figure 4. The only experiment requiring a clear delineation between ECM and cell surface is the experiment of Figure 4. Here, we do not use the HS as a reference staining because it stains both the ECM and the cell surface.
(2) For Figure 1E, the cells were only infected for 24 hours. The half-time for infectious internalization of HaCaT cells was shown to be 8 hours for cell-associated PsV and closer to 20 hours for PsV that was associated with the ECM prior to cell association (Becker et al., 2018). Why was such a short infection time chosen?
During assay establishment it has been observed that after 24 h the luciferase activity is optimal.
(3) Figure 5, the staining of uninfected cells +/- cyto treatment needs to be included.
Now visible in new Figure 3.
I am confused by lines 54-57. It seems as if the authors are claiming that HSPGs are not present on the ECM. This sentence, as written, is misleading.
We agree, and state now on line 58 ‘Here, virions bind to the linear polysaccharide heparan sulfate (HS) that is present in the extracellular matrix (ECM) but as well on the plasma membrane surface. HS is attached to proteins forming so called heparan sulfate proteoglycans (HSPGs).’
Reviewer #2 (Recommendations for the authors):
There are further issues that are not pertaining to the study design that I find important.
(1) It remains speculative whether the virions that are transferred from the ECM are actually structurally modified.
The newly added Figure 2, showing that leupeptin blocks infection in our assay, suggests that virions indeed are primed.
(2) The origin of HS correlated with virions on the cell body after transfer is also not clear: does the virus associate with cell surface HS, or does it bring HS from the ECM? Simply staining HS against Nsulfated moieties does not allow such conclusions.
This issue has been already raised in the public review to which we replied above. In brief, we agree that the transient increase of the PCC between PsVs and HS in the cell body region can be also explained by PsVs coming from the ECM without HS and binding to cell surface HS, or from PsVs binding directly (not via the ECM) to cell surface HSPGs. However, there are two more arguments indicating that PsVs are coated with HS. Please see our detailed reply above.
(3) Figure 1: There are few, if any, filopodia in untreated cells. It would be good to quantify their abundance to substantiate that resting HaCat cells are indeed a good model for filopodial transport bs. membrane retraction / spreading. In HaCat ECM, the virus also binds to laminin-332 for a good part. Would this not also confound the analysis?
At first glance, the number of filopodia appears to be too low to account for such an efficient transport. However, please note that the formation of filopodia is very dynamic, and that they can form and disappear within minutes (see below). We also often observe many PsVs aligned at one filopodium. Moreover, not every cell periphery exhibits large accumulations of PsVs. Therefore, we believe it is in principle possible that filopodia are largely responsible for the transport. We cannot exclude that we overestimate the transport rate due to partial cell spreading after CytD removal, which, however, we consider as rather unlikely as in Figure 2 we observe no increase in the PCC when leupeptin was present during the CytD incubation. Under these conditions, PsVs do not translocate but cells could spread, and this would increase he PCC between PsVs and F-actin if cells would spread into the area of accumulated PsVs.
We now state on line 304: ‘This suggests that the half-time of PsV translocation from the periphery to the cell body is about 15 min. In fact, the half-time maybe longer, as we cannot exclude that cell spreading after CytD removal contributes to less PsVs measured in the cell periphery.’ and on line 477 ‘As mentioned above, the half-time could be longer if cell spreading is in part responsible for the translocation of PsVs onto the cell body. However, we assume that this is rather unlikely, as cell spreading would increase the PCC between PsVs and F-actin under a condition where filopodia mediated transport is blocked but not cell spreading, which is not the case (Figure 2B and D, CytD/leupeptin).’
(4) Figure 2: This would benefit from live cell analysis. There are considerable amounts of virions on the cell body, which partially contradicts statements from Figure 1.
Does the referee refer to the images shown in Figure 4 (old Figure 2)? Please note that at CytD/0 min there are hardly any PsVs in the cell body region, the fluorescence (magenta LUT) is autofluorescence (this is explained in the results section). Only at later time points PsVs are in the cell body region.
The fast transfer to the cell body after cyto D washout is based on the assumption that filopodia formation and transport along them (and not membrane extension) occur quickly. Is this reasonable?
We are no experts on filopodia, but one finds references suggesting that they grow at rates of several µm per minutes and have lifetimes between a few seconds and several minutes. Hence, within the 15 min we determine for the transport, cells may need a few minutes to recover from CytD, a few minutes to form filopodia that reach out into the ECM, and a few minutes for the transport itself. However, we agree that we cannot exclude membrane extension contributing to our observed transport, although we consider this as rather unlikely (see above).
(5) Figure 3: The rationale of claiming the existence of 'endocytic structures' needs to be better explained and quantified in the according supplementary figure.
We now state in the legend ‘We propose that the agglomerated CD151 maxima close to PsVs feature the characteristics of endocytic structures, as CD151 has been shown to co-internalize with PsVs (Scheffer et al. 2013), and as these structures invaginate into the cell, like PsV filled tubular organelles previously described by electron microscopy (Schelhaas et al. 2012).’ For a proper quantification of these highly variable structures a much larger sample would be required.
The formation of virus-filled tubules upon cytoD treatment has been previously reported. Are these viruses that come from the cell body or from the ECM?
With the new data and explanations that have been added to the manuscript, it should be clear that it is reasonable to assume that they come largely from the ECM.
(6) Figure 4: How are the subcellular ROIs chosen? Is there not a bias by not studying a full cell?
We now explain better how we chose cells for analysis. We state on line 138 ‘Instead, we focus on isolated HaCaT cells or cells at the periphery of cell patches. In these cells, we find more PsVs per cell than one would expect from the employed 50 viral genome equivalents (vge) per cell, as PsVs are unequally distributed between the cells. Moreover, these PsVs usually are not homogenously distributed around the cell but concentrate at one region. We investigate the translocation of PsVs from these regions, defining ROIs for analysis that cover PsVs at the periphery and the cell body (see Supplementary Figures 6A and 8A).’
(7) Figure 5/6: The data needs a better analysis on correlation by using randomisation as explained above.
Please see our reply to the same point of the public review raised by the same referee.
(8) Figure 7: This model involves CD151 being a mediator in transfer, but this has not been functionally shown. There are HaCaT CD151 KO cells available (from the Sonnenberg lab), it would be good to use those to test the model and whether transfer indeed involves CD151.
As already stated above, we are sorry for having raised the impression that PsVs bind directly to CD151. The model Figure has been modified. Please see our reply above.
(9) The manuscript would benefit from a number of experiments addressing the most crucial issues:
(a) As mentioned before, the use of blebbistatin, which blocks myosin II function and arrests actin retrograde flow within seconds of addition, would be a good inhibitor to control for transfer in at least some of the most crucial experiments.
In Figure 8 we have tested blebbistatin. Please see our reply above.
(b) Live cell analysis would allow for monitoring of whether membrane retraction upon cytoD treatment would have to be taken into account for the analysis of the data. The same is true for the cytoD washouts, upon which most cells exhibit pronounced membrane spreading. The latter is important to support filopodial transport rather than membrane ruffling and spreading, leading to the clearance of extracellular virions from the ECM.
We agree that this would be desirable. As replied above, we now discuss the issue of possible membrane spreading and reason why we consider it as rather unlikely.
(c) To rid oneself of the issue of plasma membrane-bound virions as a confounding factor, one could use cells treated by sodium chlorate, which leads to undersulfation of HS on the cell surface, and seed them onto ECM with functional HSPGs. This would then indeed establish that the HS and virus are transferred together.
We agree that this would be a smart experiment. As the main focus of our study is not clarifying whether PsVs are coated with HS or not, we gave other experiments priority.
(10) The manuscript is, while carefully and thoughtfully worded on the issue of microscopy analysis, for a good part, extrapolating too strongly from the authors' data and unsubstantiated assumptions to conclude on their model. It would be good if the authors would support their claims with previous or their own experimental work. Just two examples of several: the assumption that cell-bound virions are negligible should be substantiated, as the literature would indicate otherwise.
We determined the PsV density in adhered, CytD treated cells, and find around 0.14 per µm<sup>2</sup> (Supplementary figure 1B), which is 4 to 5-fold less when compared to the PsV density quantified in an area covering the cell body and the periphery (Figure 1B, see line 174 for PsVs/µm<sup>2</sup> values). Quantifying the PsV density only in the periphery would yield a severalfold larger difference. However, due to the limited resolution of the microscope we would strongly underestimate the PsV density in the accumulations. We prefer not to discuss this in detail, as exact numbers are difficult to obtain.
Line 129: Cyto D should not inhibit the enzymes modifying HS or proteins (including virions). This is true, but cytoD may limit their secretion and abundance.
We show in Figure 3 that CytD does not reduce HS staining (e.g., by limiting HS secretion, as suggested by the referee), suggesting that it rather does not limit secretion.
We thank the referee´s and the reviewing editor for their helpful comments!
eLife Assessment
This valuable work advances our understanding of the relationship between multimodal magnetic resonance imaging (MRI) measures, cognition, and mental health. Compelling use of statistical learning techniques in UK Biobank data shows that 48% of the variance between an 11-task derived g-factor and imaging data can be explained. Overall, this paper contributes to the study of brain-behaviour relations and will be of interest for both its methods and its findings on how much variance in g can be explained.
Reviewer #1 (Public review):
Summary:
The authors aimed to examine how the covariation between cognition (represented by a g-factor based on 12 features of 11 cognitive tasks) and mental health (represented by 133 diverse features) is reflected in MR-based neural markers of cognition, as measured through multimodal neuroimaging (structural, rsfMRI and diffusion MR). To integrate multiple neuroimaging phenotypes across MRI modalities the authors used a so-called a stacking approach, which employs two levels of machine learning. First, they build a predictive model from each neuroimaging phenotype to predict a target variable. Next, in the stacking level, they use predicted values (i.e., cognition predicted from each neuroimaging phenotype) from the first level as features to predict the target variable. To quantify the contribution of the neural indicators of cognition explaining the relationship between cognition and mental health, they conducted commonality analyses. Results showed that when they stacked neuroimaging phenotypes within dwMRI, rsMRI, and sMRI, they captured 25.5%, 29.8%, and 31.6% of the predictive relationship between cognition and mental health, respectively. By stacking all 72 neuroimaging phenotypes across three MRI modalities, they enhanced the explanation to 48%. Age and sex shared substantial overlapping variance with both mental health and neuroimaging in explaining cognition, accounting for 43% of the variance in the cognition-mental health relationship.
Strengths:
(1) Big study population (UK Biobank with 14000 subjects)
(2) Description of methods (including Figure 1) is helpful in understanding the approach
(3) Final manuscript improved after revision
Weaknesses:
(1) The relevance of the question is now better described, but the impact of the work is more of conceptual value than of direct clinical value.
(2) The discussion on the interpretation of the positive and negative PLRS loadings is now further explained, but remains a bit counterintuitive.
Note: the computational aspects of the methods fall beyond my expertise.
Reviewer #2 (Public review):
Summary:
The goal of this manuscript was to examine whether neural indicators explain the relationship between cognition and mental health. The authors achieved this aim by showing that the combination of MRI markers better predicted the cognition-mental health covariation. I have reviewed the paper before and the authors addressed my comments very well.
Strengths:
Large sample (UK biobank data) and clear description of advanced analyses.
Weaknesses:
My main concern in my previous review was that it was not completely clear to me what it means to look at the overlap between cognition and mental health. The authors have addressed this in the current version.
Author response:
The following is the authors’ response to the original reviews.
Public Reviews:
Reviewer #1 (Public review):
Summary:
The authors aimed to examine how the covariation between cognition (represented by a g-factor based on 12 features of 11 cognitive tasks) and mental health (represented by 133 diverse features) is reflected in MR-based neural markers of cognition, as measured through multimodal neuroimaging (structural, rsfMRI, and diffusion MR). To integrate multiple neuroimaging phenotypes across MRI modalities, they used a so-called stacking approach, which employs two levels of machine learning. First, they built a predictive model from each neuroimaging phenotype to predict a target variable. Next, in the stacking level, they used predicted values (i.e., cognition predicted from each neuroimaging phenotype) from the first level as features to predict the target variable. To quantify the contribution of the neural indicators of cognition explaining the relationship between cognition and mental health, they conducted commonality analyses. Results showed that when they stacked neuroimaging phenotypes within dwMRI, rsMRI, and sMRI, they captured 25.5%, 29.8%, and 31.6% of the predictive relationship between cognition and mental health, respectively. By stacking all 72 neuroimaging phenotypes across three MRI modalities, they enhanced the explanation to 48%. Age and sex shared substantial overlapping variance with both mental health and neuroimaging in explaining cognition, accounting for 43% of the variance in the cognition-mental health relationship.
Strengths:
(1) A big study population (UK Biobank with 14000 subjects).
(2) The description of the methods (including Figure 1) is helpful in understanding the approach.
(3) This revised manuscript is much improved compared to the previous version.
Weaknesses:
(1) Although the background and reason for the study are better described in this version of the manuscript, the relevance of the question is, in my opinion, still questionable. The authors aimed to determine whether neural markers of cognition explain the covariance between cognition and mental health and which of the 72 MRI-based features contribute to explaining most of the covariance. I would like to invite the authors to make a stronger case for the relevance, keeping the clinical and scientific relevance in mind (what would you explain to the clinician, what would you explain to the people with lived experience, and how can this knowledge contribute to innovation in mental health care?).
Thank you for this insightful observation. We agree that establishing the real-world significance of fundamental research is paramount, and we have revised our manuscript to better articulate this relevance.
For clinicians, our work (a) corroborates the link between cognition and mental health, confirming the transdiagnostic role of cognition, and (b) demonstrates that current neuroimaging tools can capture the neurobiology underlying this relationship. These findings offer several implications for clinical practice. First, they support the development of interventions aimed at enhancing cognitive functioning as a pathway to improving mental health. Second, our work introduces neuroimaging as a potential tool for assessing the neurobiological basis of the cognition–mental health connection. With further research, clinicians may be able to use neuroimaging to track cognitive changes at the neural level, which could help monitor treatment efficacy for interventions (e.g., stimulant medications for ADHD) designed to boost cognitive functioning.
Following your suggestions, we have expanded the Discussion (Line 684) to include future directions and clinical perspectives on the findings.
Line 684: “Neuroimaging offers a unique window into the biological mechanisms underlying cognition–mental health overlap – insights unattainable from behavioural data alone. Our findings validate brain-based neural markers as a core unit of analysis for cognitive functioning, advancing mental health research through the lens of cognition. Beyond this conceptual contribution, the study has clinical implications. First, by demonstrating a transdiagnostic link between cognition and mental health, we support interventions that enhance cognition as a pathway to improving mental health. Second, we show neuroimaging as an effective tool for assessing the neurobiological basis of this link. Quantifying neuroimaging’s capacity to capture this relationship is essential for future research integrating imaging with cognitive testing to monitor treatment-related neural changes. Such work could enable personalised interventions, using neuroimaging to track cognitive changes and treatment efficacy (e.g., stimulant medications for ADHD) aimed at boosting cognitive functioning.”
(2) The discussion on the interpretation of the positive and negative PLRS loadings is not very convincing, and the findings are partly counterintuitive. For example (1) how to explain that distress has a positive loading and anxiety/trauma has a negative loading?; (2) how to explain that mental health features like wellbeing and happiness load in the same direction as psychosis and anxiety/trauma? From both a clinical and a neuroscientific perspective, this is hard to interpret.
Thank you for pointing this out. We appreciate your concern regarding the interpretation of positive and negative PLSR loadings. To clarify:
(1) The directions of PLSR loadings are broadly consistent with univariate correlations, suggesting that the somewhat counterintuitive relationships mentioned are shown even when we apply simply univariate correlations. PLSR extends beyond univariate approaches by modelling multivariate relationships across features and outcomes. It constructs new components – linear combinations of predictors – that simultaneously explain variance in the predictors and their covariance with the response.
(2) The positive loading of distress likely reflects cohort-specific questionnaire design in the UK Biobank, where feeling of distress was tied to seeking medical help. Individuals with higher cognition and socioeconomic status may be more likely to seek professional support, which explains the counterintuitive direction.
(3) The negative loadings of wellbeing and happiness may also reflect cohort-specific effects, such as older age, and align with prior work linking excessive optimism to poorer reasoning and cognitive performance. This suggests that realism or pessimism may sometimes be associated with better cognition, particularly in older adults.
These points are discussed in detail in the manuscript (Lines 493–545). We have emphasised that some of these findings may be cohort-specific and cited supporting literature, as seen below.
(1) How to explain that distress has a positive loading and anxiety/trauma has a negative loading?
Line 493: “The directions of PLSR loadings were broadly consistent with univariate correlations. PLSR extends beyond univariate approaches by modelling multivariate relationships across features and outcomes. Consistently, both univariate correlations and factor loadings derived from the PLSR model indicated that scores for mental distress, alcohol and cannabis use, and self-harm behaviours related positively, and the scores for anxiety, neurological and mental health diagnoses, unusual or psychotic experiences, happiness and subjective well-being, and negative traumatic events related negatively to the g-factor. Positive PLSR loadings of features related to mental distress may indicate greater susceptibility to or exaggerated perception of stressful events, psychological overexcitability, and predisposition to rumination in people with higher cognition [72]. On the other hand, these findings may be specific to the UK Biobank cohort and the way the questions for this mental health category were constructed. In particular, to evaluate mental distress, the UK Biobank questionnaire asked whether an individual sought or received medical help for or suffered from mental distress. In this regard, the estimate for mental distress may be more indicative of whether an individual experiencing mental distress had an opportunity or aspiration to visit a doctor and seek professional help [73]. Thus, people with better cognitive abilities and also with a higher socioeconomic status may indeed be more likely to seek professional help.”
Line 529: “Consistent with previous studies, we showed that anxiety and negative traumatic experiences were inversely associated with cognitive abilities [90–93]. Anxiety may be linked to poorer cognitive performance via reduced working memory capacity, increased focus on negative thoughts, and attentional bias to threatening stimuli that hinder the allocation of cognitive resources to a current task [94–96]. Individuals with PTSD consistently showed impaired verbal and working memory, visual attention, inhibitory function, task switching, cognitive flexibility, and cognitive control [97–100]. Exposure to traumatic events that did not reach the PTSD threshold was also linked to impaired cognition. For example, childhood trauma is associated with worse performance in processing speed, attention, and executive function tasks in adulthood, and age at a first traumatic event is predictive of the rate of executive function decline in midlife [101,102]. In the UK Biobank cohort, adverse life events have been linked to lower cognitive flexibility, partially via depression level [103].”
(2) How to explain that mental health features like wellbeing and happiness load in the same direction as psychosis and anxiety/trauma?
Line 545: “Finally, both negative PLSR loadings and corresponding univariate correlations for features related to happiness and subjective well-being may be specific to the study cohort, as these findings do not agree with some previous research [107–109]. On the other hand, our results agree with the study linking excessive optimism or optimistic thinking to lower cognitive performance in memory, verbal fluency, fluid intelligence, and numerical reasoning tasks, and suggesting that pessimism or realism indicates better cognition [110]. The concept of realism/optimism as indicators of cognition is a plausible explanation for a negative association between the gfactor and friendship satisfaction, as well as a negative PLSR loading of feelings that life is meaningful, especially in older adults who tend to reflect more on the meaning of life [111]. The latter is supported by the study showing a negative association between cognitive function and the search for the meaning of life and a change in the pattern of this relationship after the age of 60 [112]. Finally, a UK Biobank study found a positive association of happiness with speed and visuospatial memory but a negative relationship with reasoning ability [113].”
(3) The analysis plan has not been preregistered (e.g. at OSF).
Note: the computational aspects of the methods fall beyond my expertise.
Thank you for pointing this out. We acknowledge that the analysis plan was not preregistered, as our approach was primarily data‑driven rather than hypothesis‑driven. We essentially applied the machine learning approach to quantify the strength of the cognition-mental health relationship in relation to neuroimaging. To ensure transparency and reproducibility, we have made all analysis code and intermediate outputs publicly available on our GitHub repository (https://github.com/HAM-lab-Otago-University/UKBiobank/) within the constraints of UK Biobank’s ethical policy and provided a detailed description of each methodological step in the Supplementary Materials.
Reviewer #2 (Public review):
Summary:
The goal of this manuscript was to examine whether neural indicators explain the relationship between cognition and mental health. The authors achieved this aim by showing that the combination of MRI markers better predicted the cognition-mental health covariation.
Strengths:
The evidence supporting the conclusions is compelling. There is a large sample (UK biobank data) and a clear description of advanced analyses.
Weaknesses:
In the previous version of the paper, it was not completely clear what it means to look at the overlap between cognition and mental health. The authors have addressed this in the current version.
Thank you for your positive feedback and for recognizing the strengths of our work. We appreciate your comments and are happy that the revisions addressed your concerns.
eLife Assessment
This study offers a valuable methodological advance by introducing a gene panel selection approach that captures combinatorial specificity to define cell identity. The findings address key limitations of current single-gene marker methods. The evidence is compelling, but would be strengthened by further validation of rare cell states and unexpected marker categories.
Joint Public Review:
In this study, the authors introduce CellCover, a gene panel selection algorithm that leverages a minimal covering approach to identify compact sets of genes with high combinatorial specificity for defining cell identities and states. This framework addresses a key limitation in existing marker selection strategies, which often emphasize individually strong markers while neglecting the informative power of gene combinations. The authors demonstrate the utility of CellCover through benchmarking analyses and biological applications, particularly in uncovering previously unresolved cell states and lineage transitions during neocorticogenesis.
The major strengths of the work include the conceptual shift toward combinatorial marker selection, a clear mathematical formulation of the minimal covering strategy, and biologically relevant applications that underscore the method's power to resolve subtle cell-type differences. The authors' analysis of the Telley et al. dataset highlights intriguing cases of ribosomal, mitochondrial, and tRNA gene usage in specific cortical cell types, suggesting previously underappreciated molecular signatures in neurodevelopment. Additionally, the observation that outer radial glia markers emerge prior to gliogenic progenitors in primates offers novel insights into the temporal dynamics of cortical lineage specification.
However, several aspects of the study would benefit from further elaboration. First, the interpretability of gene panels containing individually lowly expressed genes but high combinatorial specificity could be improved by providing clearer guidelines or illustrative examples. Second, the utility of CellCover in identifying rare or transient cell states should be more thoroughly quantified, especially under noisy conditions typical of single-cell datasets. Third, while the findings on unexpected gene categories are provocative, they require further validation - either through independent transcriptomic datasets or orthogonal methods such as immunostaining or single-molecule FISH-to confirm their cell-type-specific expression patterns.
Specifically, the manuscript would benefit from further clarification and additional validation in the following areas:
• A more in-depth explanation of marker panel applications is needed. Specifically, how should users interpret gene panels where individual genes show only moderate or low expression levels, but the combination provides high specificity? Providing a concrete example, along with guidelines for interpreting such combinatorial signatures, would enhance the practical utility of the method.
• Further quantification of CellCover's sensitivity in detecting rare cell subtypes or states would strengthen the evaluation of its performance. Additionally, it would be helpful to assess how CellCover performs under noisy conditions, such as low cell numbers or read depths, which are common challenges in scRNA-seq datasets.
• It is intriguing and novel that CellCover analysis of the dataset from Telley et al. suggests cell-type-specific expression of ribosomal, mitochondrial, or tRNA genes. These findings would be significantly strengthened by additional validation. For example, the reported radial glia-specific expression of Rps18-ps3 and Rps10-ps1, as well as the postmitotic neuron-specific expression of mt-Tv and mt-Nd4l, should be corroborated using independent scRNA-seq or spatial transcriptomic datasets of the developing neocortex. Alternatively, these expression patterns could be directly examined through immunostaining or single-molecule FISH analysis.
• The observation that outer radial glia (oRG) markers are expressed in neural progenitors before the emergence of gliogenic progenitors in primates and humans is compelling. This could be further supported by examining the temporal and spatial expression patterns of early oRG-specific markers versus gliogenic progenitor markers in recent human spatial transcriptomic datasets - such as the one published by Xuyu et al. (PMID: 40369074) or Wang et al. (PMID: 39779846).
Summary:
Overall, this work provides a conceptually innovative and practically useful method for cell type classification that will be valuable to the single-cell and developmental biology communities. Its impact will likely grow as more researchers seek scalable, interpretable, and biologically informed gene panels for multimodal assays, diagnostics, and perturbation studies.
Author response:
A more in-depth explanation of marker panel applications is needed. Specifically, how should users interpret gene panels where individual genes show only moderate or low expression levels, but the combination provides high specificity? Providing a concrete example, along with guidelines for interpreting such combinatorial signatures, would enhance the practical utility of the method.
We appreciate the need to explain and demonstrate how to use the novel combinatorial gene marker sets that CellCover generates. To be clear, individual genes expressed at low levels and in small numbers of cells, in general, have high specificity (the ability to mark cells of a particular type without erroneously marking other cells as this type) and are often used in combinations by CellCover to achieve a panel of genes with high sensitivity (the ability to mark all cells of a particular type). Low or sparsely expressed genes of this type may represent poorly measured genes (i.e. zero inflation known to occur in single-cell data, where genes are measured as zero in cells which actually express the gene) or may represent genes which are truly expressed only in a subset of the annotated class. Because CellCover can borrow strength across genes, it can harness the true information in either class of genes, even if affected by zero inflation. Further investigation of structure within the cell class (and across other cell classes) using the CellCover gene marker panel, as well as other genes, is necessary to clarify this issue in any particular analysis. In the manuscript, we evaluate the expression of individual genes within and across classes in this manner to understand deeper structure in Figures 1A, S6 and S8.
To demonstrate how CellCover selects individual genes with high specificity and low sensitivity, but which are complementary to one another, in order to achieve high collective sensitivity, here we consider a hypothetical dataset of many cells where we focus on one cell class that contains 100 cells composed of four subtypes.
- Subtype A: cells 1–20
- Subtype B: cells 21–30
- Subtype C: cells 31–50
- Subtype D: cells 51–100
To illustrate how CellCover evaluates marker gene panels, in this example, the genes under instigation have very different weights (i.e. the ratio of a gene’s expression in the cell class of interest versus its expression in other cells). Suppose we have two candidate marker panels:
Panel 1 (coarse markers).
- Gene A: covers cells 1–30 (weight = 0.4)
- Gene B: covers cells 30–60 (weight = 0.3)
- Gene C: covers cells 60–100 (weight = 0.2)
Each gene in this panel covers a relatively large portion of the population (> 30%), but their weights are comparatively high, indicating limited specificity to the focal cell type. Although the panel {A,B,C} attains full coverage, its markers are coarse and nonspecific.
Panel 2 (fine-grained, combinatorial markers).
- Gene A’: covers cells 1–20 (weight = 0.05)
- Gene B’: covers cells 20–30 (weight = 0.10)
- Gene C’: covers cells 30–50 (weight = 0.05)
- Gene D’: covers cells 50–100 (weight = 0.10)
Each marker is expressed in a smaller fraction of the population (individually low sensitivity), but the weights are substantially lower, reflecting strong subtype specificity. Importantly, these genes are complementary: their union covers all 100 cells (high combinatorial sensitivity), even though no single gene spans more than 20–50% of the cells.
Under a strict covering requirement (e.g., α \= 0, requiring 100% coverage, i.e. perfect sensitiity), both panels satisfy the constraint. However, CellCover selects the second panel because its total weight (specificity) is smaller. This preference reflects the design of the objective function: the method favors markers that are highly cell-type-specific, even if they individually cover only a subset of the population, as long as their complements yield full coverage. As a result, CellCover can reveal refined subtype structure within what appears to be a single cell population.
Interpretation guidelines. We explicitly note that CellCover marker panels should be interpreted as combinatorial signatures:
- Individual genes may show localized, subtype-restricted expression.
- The union of their expression defines the target cell type.
- Low-weight genes are more specific; CellCover therefore prioritizes them whenever they provide complementary coverage.
- The resulting panel may highlight latent heterogeneity or subpopulations within the cell type that express different subsets of the markers.
In addition to these technical guidelines for interpreting gene panels, throughout the manuscript we use the transfer of CellCover marker gene panels to related datasets to assess the biological function of the gene sets. We propose this as a general tool in the examination of gene lists and have implemented methods to visualize the expression of any gene list (including gene lists uploaded by users) using the Projection Tool within NeMO Anlaytics.
Further quantification of CellCover’s sensitivity in detecting rare cell subtypes or states would strengthen the evaluation of its performance. Additionally, it would be helpful to assess how CellCover performs under noisy conditions, such as low cell numbers or read depths, which are common challenges in scRNA-seq datasets.
While CellCover is a method to define marker gene panels for cell classes that are already defined in a dataset, its performance on rare cell classes, small numbers of cells and low read depths is still a relevant issue. The analyses in the paper can speak to some of these concerns: The Telley dataset, which we use throughout the manuscript, used FlashTag labeling of cells prior to sequencing in order to ascertain the time since terminal division for each cell. This unique metadata linked to each cell’s expression data enabled many of the analyses we performed in the paper, but also limited the number of cells that were sequenced. For this reason, the number of cells in this dataset (total cells = 2756) is much lower than that seen in the vast majority of other single-cell sequencing studies, including those we use for the transfer of marker gene sets defined by CellCover in the Telley data. As a result, the cell classes for which we define marker gene panels in the paper contain relatively small numbers of cells. This is especially true in the 12-class analysis in Figures 4 and 5 where CellCover successfully defines gene panels for all 12 classes which transfer well to other datasets. Total cells per class range from 134 to 301. Figure S6 shows that the discriminative power of the 12 gene panels varied widely, with the most highly discriminative panel being from the E12.1H condition with only 189 cells).
In addition, we note that the behavior of CellCover on rare (or any) cell classes can be characterized deterministically under mild condition. For a fixed cell class and a required covering rate of 1, a depth-k covering gene panel exists if and only if every cell in the class expresses at least k genes. Under this condition, CellCover is guaranteed to find a covering panel of depth-k. Importantly, this guarantee does not impose any restriction on the panel size. Consequently, the compactness of the resulting panel reflects intrinsic properties of the data rather than algorithmic limitations: a small panel indicates that a subset of genes is robustly and consistently expressed across most cells in the class, even if the class itself is rare, whereas a large panel suggests highly heterogeneous expression patterns, where different genes are expressed in different cells. In this sense, the feasibility and structure of a covering panel are determined by the biological and technical characteristics of the dataset (e.g., read depth, expression sparsity, and the specificty of gene expression in the defined cell classes), rather than by the performance of CellCover itself.
It is intriguing and novel that CellCover analysis of the dataset from Telley et al. suggests cell-type-specific expression of ribosomal, mitochondrial, or tRNA genes. These findings would be significantly strengthened by additional validation. For example, the reported radial glia-specific expression of Rps18-ps3 and Rps10-ps1, as well as the postmitotic neuron-specific expression of mt-Tv and mt-Nd4l, should be corroborated using independent scRNA-seq or spatial transcriptomic datasets of the developing neocortex. Alternatively, these expression patterns could be directly examined through immunostaining or single-molecule FISH analysis.
The main problem with such analysis is that most studies have omitted the expression of these genes (especially mitochondrial genes that are primarily viewed as QC metrics) from their datasets. We encourage researchers to retain the expression of these transcripts in their data so that their biological functions can be explored. Where available, the expression of these genes can be visualized in NeMO Analytics in the mouse where the enrichment of Rps18-ps3 expression in radial glia can be seen in the Di Bella 2021 dataset and in the human where the expression of mt-Tv can be seen in neurons in the Polioudakis 2019, Darmanis 2015, Camp 2015, and Liu 2016 datasets.
Taking a broader perspective, a growing body of foundational work in developmental neurobiology supports the observation that mitochondrial state and metabolic programs undergo systematic changes during neuronal differentiation, consistent with our CellCover findings. For example, Khacho 2016 demonstrated that mitochondrial dynamics are essential regulators of neuronal fate commitment and that the maturation of the mitochondrial network is essential for the transition from the progenitor metabolic state to the neuronal state. Iwata 2020 further highlight cell type specific mitochondrial dynamics by showing that daughter cells with highly fragmented mitochondria tend to become neurons.
The observation that outer radial glia (oRG) markers are expressed in neural progenitors before the emergence of gliogenic progenitors in primates and humans is compelling. This could be further supported by examining the temporal and spatial expression patterns of early oRG-specific markers versus gliogenic progenitor markers in recent human spatial transcriptomic datasets - such as the one published by Xuyu et al. (PMID: 40369074) or Wang et al. (PMID: 39779846).
We have added the scRNA-seq data from Wang et al., as well as data from the Nano et al. 2025 meta-atlas to the NeMO Analytics data collection. oRG markers from Liu et al 2023 can now be visualized across the Wang, Nano and many more human in vivo datasets. In the Nano data, these oRG markers can be seen increasing in expression in the human neocortex from GW7-12, leading into peak neurogenesis and prior to gliogenesis. Although with lower age resolution, the peaking of oRG markers in the 2nd trimester (dring peak neurogenesis) and their precipitous drop in the 3rd trimester (during peak gliogenesis) can also be seen in the Wang data. At NeMO Analytics individual marker genes of oRGs can also visualized in these datasets.
eLife Assessment
This manuscript presents a valuable methodological approach to investigating context-dependent activity of cis-regulatory activity within defined genomic loci. The authors combine a locus-specific massively parallel reporter assay, enabling unbiased and high-coverage profiling of enhancer activity across large genomic regions, with a degenerate reporter assay to identify nucleotides critical for enhancer function. The data supporting the conclusions are solid, highlighted by successful identification and characterization of both previously known and new regulatory elements across multiple developmental stages, cell types, and species. While the approach has inherent limitations in sensitivity, and indirect assignment of regulatory elements to target genes, it provides a flexible platform for nominating candidate cis-regulatory elements across defined loci.
Reviewer #1 (Public review):
MPRAs are a high-throughput and powerful tool for assaying the regulatory potential of genomic sequences. However, linking MPRA-nominated regulatory sequences to their endogenous target genes, and identifying the more specific functional regions within these sequences can be challenging. MPRAs that tile a genomic region, and saturation mutagenesis-based MRPAs can help to address these challenges. In this work, Tulloch et al. describe a streamlined MPRA system for the identification and investigation of the regulatory elements surrounding a gene of interest with high resolution. The use of BACs covering a locus of interest to generate MPRA libraries allows for an unbiased, and high-coverage assessment of a particular region. Follow up degenerate MPRAs, where each nucleotide in the nominated sequences are systematically mutated, then can point to key motifs driving their regulatory activity. The authors present this MPRA platform as straightforward, easily customizable, and less time- and resource-intensive than traditional MPRA designs. They demonstrate the utility of their design in the context of the developing mouse retina, where they first use the LS-MPRA to identify active regulatory elements for select retinal genes, followed by d-MPRA which allowed them to dissect the functional regions within those elements and nominate important regulatory motifs. These assays were able to recapitulate some previously known cis-regulatory modules (CRMs), as well as identify some new potential regulatory regions. Follow up experiments assessing co-localization of the gene of interest with the CRM-linked GFP reporter in the target cells, and CUT&RUN assays to confirm transcription factor binding to nominated motifs provided support linking these CRMs to the genes of interest. Overall, this method appears flexible and could be an easy to implement tool for other investigators aiming to study their locus of interest with high resolution.
Strengths:
(1) The method of fragmenting BACs allows for high, overlapping coverage of the region of interest.
(2) The d-MPRA method was an efficient way to identify key functional transcription factor motifs, and nominate specific transcription factor-driven regulatory pathways that could be studied further.
(3) Additional assays like co-expression analyses using the endogenous gene promoter, and use of the Notch inhibitor in the case of Olig2, helped correlate the activity of the CRMs to the expression of the gene of interest, and distinguish false positives from the initial MPRA.
(4) The use of these assays across different time points, tissues, and even species demonstrated that they can be used across many contexts to identify both common and divergent regulatory mechanisms for the same gene.
Weaknesses:
(1) The LS-MPRA assay most strongly identified promoters, which are not usually novel regulatory elements you would try to discover, and the signal to noise ratio for more TSS-distal, non-promoter regulatory elements was usually high, making it difficult to discriminate lower activity CRMs, like enhancers, from the background. For example, NR2 and NR3 in Figure 3 have very minimal activity peaks (NR3 seems non-existent). The ex vivo data in Figure 2 is similarly noisy. Is there a particular metric or calculation that was or could be used to quantitatively or statistically call a peak above the background? The authors mention in the discussion some adjustments that could reduce the noise, such as increased sequencing depth, which I think is needed to make these initial LS-MPRA results and the benchmarking of this assay more convincing and impactful.
Reviewer #2 (Public review):
Summary:
In this study, Tulloch et al. developed two modified massively parallel reporter assays (MPRAs) and applied them to identify cis-regulatory modules (CRMs) - genomic regions that activate gene expression - controlling retinal gene expression. These CRMs usually function at specific developmental stages and in distinct cell types to orchestrate retinal development. Studying them provides insights into how retinal progenitor cells give rise to various retinal cell types.
The first assay, named locus-specific MPRA (LS-MPRA), tests all genomic regions within 150-300 kb of the gene of interest, rather than relying on previously predicted candidate regulatory elements. This approach reduces potential bias introduced during candidate selection, lowers the cost of synthesizing a library of candidate sequences, and simplifies library preparation. The LS-MPRA libraries were electroporated into mouse retinas in vivo or ex vivo. To benchmark the method, the authors first applied LS-MPRA near stably expressed retinal genes (e.g., Rho, Cabp5, Grm6, and Vsx2), and successfully identified both known and novel CRMs. They then used LS-MPRA to identify CRMs in embryonic mouse retinas, near Olig2 and Ngn2, genes expressed in subsets of retinal progenitor cells. Similar experiments were conducted in chick retinas and postnatal mouse retinas, revealing some CRMs with conserved activity across species and developmental stages.
Although the study identified CRMs with robust reporter activity in Olig2+ or Ngn2+ cells, the data do not provide sufficient evidence to support the claims that these CRMs regulate Olig2 or Ngn2, rather than other nearby genes, in a cell type-specific manner. For example, the authors propose that three regions (NR1/2/3) regulate Olig2 specifically in retinal progenitor cells based on: 1) the three regions are close to Olig2, 2) increased Olig2 expression and NR1/2/3 activity upon Notch inhibition, and 3) reporter activity observed in Olig2+ cells (though also present in many Olig2- cells). While these are promising findings, they do not directly support the claims.
The second assay, called degenerate MPRA (d-MPRA), introduces random point mutations into CRMs via error-prone PCR to assess the impact of sequence variations on regulatory activity. This approach was used on NR1/2/3 to identify mutations that alter CRM activity, potentially by influencing transcription factor binding. The authors inferred candidate transcription factors, such as Mybl1 and Otx2, through motif analysis, co-expression with Olig2 (based on single-cell RNA-seq), and CUR&RUN profiling. While some transcription factors identified in this way overlapped with the d-MPRA results, others did not. This raises questions about how well d-MPRA complements other methods for identifying TF binding sites.
Strengths:
The study introduces two technically robust MPRA protocols that offer advantages over standard methods, such as avoiding reliance on predefined candidate regions, reducing cost and labor, and minimizing selection bias.
The identified regulatory elements and transcription factors contribute to our understanding of gene regulation in retinal development and may have translational potential for cell type-specific gene delivery into developing retinas.
Weakness:
Like other MPRA-based approaches, LS-MPRA mainly tests whether a sequence can drive expression of a reporter gene in given cell type(s). However, this type of assay generally does not show which endogenous gene the sequence regulates. In this study, the evidence supporting gene-specific CRMs is largely correlative. The evidence for cell-type-specific CRMs is also not fully supported (e.g., reporter expression is observed in the intended cell type as well as additional cell types). If further validation in the native genomic context (e.g., CRISPRi of the candidate element followed by RNA-seq across relevant cell types) is out of scope, the manuscript should avoid wording that implies definitive target gene assignment or cell-type specificity.
Reviewer #3 (Public review):
Summary:
Use of reporter assays to understand the regulatory mechanisms controlling gene expression moves beyond simple correlations of cis-regulatory sequence accessibility, evolutionary sequence conservation, and epigenetic status with gene expression, instead quantifying regulatory sequence activity for individual elements. Tulloch et al., provide systematic characterization of two new reporter assay techniques (LS-MPRA and d-MPRA) to comprehensively identify cis-regulatory sequences contained within genomic loci of interest during retinal development. The authors then apply LS-MPRA and d-MPRA to identify putative cis-regulatory sequences controlling Olig2 and Ngn2 expression, including potential regulatory motifs that known retinal transcription factors may bind. Transcription factor binding to regulatory sequences is then assessed via CUT&RUN. The broader utility of the techniques are then highlighted by performing the assays across development, across species, and across tissues.
Strengths:
The authors validate the reporter assays on retinal loci for which the regulatory sequences are known (Rho, Vsx2, Grm6, Cabp5) mostly confirming known regulatory sequence activity but highlighting either limitations of the current technology or discrepancies of previous reporter assays and known biology. The techniques are then applied to loci of interest (Olig2 and Ngn2) to better understand the regulatory sequences driving expression of these transcription factors across retinal development within subsets of retinal progenitor cells, identifying novel regulatory sequences through comprehensive profiling of the region.
LS-MPRA provides broad coverage of loci of interest
d-MPRA identifies sequence features that are important for cis-regulatory sequence activity.
The authors take into account transcript and protein stability when determining the correlation of putative enhancer sequence activity with target gene expression.
Overall, the manuscript highlights the utility of the techniques to identify novel cis-regulatory sequence contributions to gene expression, including systematic characterizations of sequence motifs conferring activating or repressive functions.
Limitations:
Barcoding strategies have the potential to induce high collision rates (see Table S3) that may lead to misinterpretation of the data and/or high false positive/negative rates.
There are limited robust methods to distinguish differentially active versus inactive CRMs in the LS-MPRA.
Author response:
The following is the authors’ response to the original reviews.
Public Reviews:
Reviewer #1 (Public review):
MPRAs are a high-throughput and powerful tool for assaying the regulatory potential of genomic sequences. However, linking MPRA-nominated regulatory sequences to their endogenous target genes and identifying the more specific functional regions within these sequences can be challenging. MPRAs that tile a genomic region, and saturation mutagenesis-based MPRAs, can help to address these challenges. In this work, Tulloch et al. describe a streamlined MPRA system for the identification and investigation of the regulatory elements surrounding a gene of interest with high resolution. The use of BACs covering a locus of interest to generate MPRA libraries allows for an unbiased and high-coverage assessment of a particular region. Follow-up degenerate MPRAs, where each nucleotide in the nominated sequences is systematically mutated, can then point to key motifs driving their regulatory activity. The authors present this MPRA platform as straightforward, easily customizable, and less time- and resource-intensive than traditional MPRA designs. They demonstrate the utility of their design in the context of the developing mouse retina, where they first use the LS-MPRA to identify active regulatory elements for select retinal genes, followed by d-MPRA, which allowed them to dissect the functional regions within those elements and nominate important regulatory motifs. These assays were able to recapitulate some previously known cis-regulatory modules (CRMs), as well as identify some new potential regulatory regions. Follow-up experiments assessing co-localization of the gene of interest with the CRM-linked GFP reporter in the target cells, and CUT&RUN assays to confirm transcription factor binding to nominated motifs, provided support linking these CRMs to the genes of interest. Overall, this method appears flexible and could be an easy-to-implement tool for other investigators aiming to study their locus of interest with high resolution.
Strengths:
(1) The method of fragmenting BACs allows for high, overlapping coverage of the region of interest.
(2) The d-MPRA method was an efficient way to identify key functional transcription factor motifs and nominate specific transcription factor-driven regulatory pathways that could be studied further.
(3) Additional assays like co-expression analyses using the endogenous gene promoter, and use of the Notch inhibitor in the case of Olig2, helped correlate the activity of the CRMs to the expression of the gene of interest, and distinguish false positives from the initial MPRA.
(4) The use of these assays across different time points, tissues, and even species demonstrated that they can be used across many contexts to identify both common and divergent regulatory mechanisms for the same gene.
Weaknesses:
The LS-MPRA assay most strongly identified promoters, which are not usually novel regulatory elements you would try to discover, and the signal-to-noise ratio for more TSS-distal, non-promoter regulatory elements was usually high, making it difficult to discriminate lower activity CRMs, like enhancers, from the background. For example, NR2 and NR3 in Figure 3 have very minimal activity peaks (NR3 seems non-existent). The ex vivo data in Figure 2 are similarly noisy. Is there a particular metric or calculation that was or could be used to quantitatively or statistically call a peak above the background? The authors mention in the discussion some adjustments that could reduce the noise, such as increased sequencing depth, which I think is needed to make these initial LS-MPRA results and the benchmarking of this assay more convincing and impactful.
Much of the statistical and quantitative data asked for by the Reviewers have been provided in the Revision. However, it is important to note that the types of statistics using peak callers asked for regarding candidate choice will be of limited value. If one is testing a library in a single cell type in vitro, and/or running genome-wide assays, these statistics could aid in the choice of candidates. However, here we are electroporating a complex and dynamic set of cells, with each cell type constituting what can be very different frequencies (e.g. Olig2-expressing cells are <2.4% of cells). This fact alone will give different apparent signal to noise values. In addition, at least for Olig2 and Ngn2, their expression is very transient, suggesting dynamic regulation by what is likely multiple positive and negative CRMs. An additional confound is that the level of expression of each gene that one might test is variable. All of these variables render a statistical prediction of candidates to be less valuable than one might hope, and might lead one to miss those CRMs of interest, particularly those in a small subset of cells. Instead, we suggest that one use one’s own level of interest and knowledge in choosing CRM candidates. We provide several examples of experimental, rather than purely statistical, approaches that might help in one’s choice of candidates. We used a functional read-out of CRM activity (Notch perturbation), carried out in the context of the entire LS-MPRA library, as one method. Co-expression in single cells of candidate regulators identified by the d-MPRA is another. One can of course use chromatin structure and sequence conservation, as used in many studies of regulatory regions, as other ways to narrow down candidates. The d-MPRA predictions also can be viewed in light of previous genetic studies, i.e. mutations in TFs that effect the cell type of interest or the regulation of the gene of interest, as we were able to do here for CRMs predicted to be regulated by Otx2.
Reviewer #2 (Public review):
Summary:
In this study, Tulloch et al. developed two modified massively parallel reporter assays (MPRAs) and applied them to identify cis-regulatory modules (CRMs) - genomic regions that activate gene expression, controlling retinal gene expression. These CRMs usually function at specific developmental stages and in distinct cell types to orchestrate retinal development. Studying them provides insights into how retinal progenitor cells give rise to various retinal cell types.
The first assay, named locus-specific MPRA (LS-MPRA), tests all genomic regions within 150-300 kb of the gene of interest, rather than relying on previously predicted candidate regulatory elements. This approach reduces potential bias introduced during candidate selection, lowers the cost of synthesizing a library of candidate sequences, and simplifies library preparation. The LS-MPRA libraries were electroporated into mouse retinas in vivo or ex vivo. To benchmark the method, the authors first applied LS-MPRA near stably expressed retinal genes (e.g., Rho, Cabp5, Grm6, and Vsx2), and successfully identified both known and novel CRMs. They then used LS-MPRA to identify CRMs in embryonic mouse retinas, near Olig2 and Ngn2, genes expressed in subsets of retinal progenitor cells. Similar experiments were conducted in chick retinas and postnatal mouse retinas, revealing some CRMs with conserved activity across species and developmental stages.
Although the study identified CRMs with robust reporter activity in Olig2+ or Ngn2+ cells, the data do not provide sufficient evidence to support the claims that these CRMs regulate Olig2 or Ngn2, rather than other nearby genes, in a cell-type-specific manner. For example, the authors propose that three regions (NR1/2/3) regulate Olig2 specifically in retinal progenitor cells based on: (1) the three regions are close to Olig2, (2) increased Olig2 expression and NR1/2/3 activity upon Notch inhibition, and (3) reporter activity observed in Olig2+ cells (though also present in many Olig2- cells). While these are promising findings, they do not directly support the claims.
The second assay, called degenerate MPRA (d-MPRA), introduces random point mutations into CRMs via error-prone PCR to assess the impact of sequence variations on regulatory activity. This approach was used on NR1/2/3 to identify mutations that alter CRM activity, potentially by influencing transcription factor binding. The authors inferred candidate transcription factors, such as Mybl1 and Otx2, through motif analysis, co-expression with Olig2 (based on single-cell RNA-seq), and CUR&RUN profiling. While some transcription factors identified in this way overlapped with the d-MPRA results, others did not. This raises questions about how well d-MPRA complements other methods for identifying transcriptional regulators.
Strengths:
(1) The study introduces two technically robust MPRA protocols that offer advantages over standard methods, such as avoiding reliance on predefined candidate regions, reducing cost and labor, and minimizing selection bias.
(2) The identified regulatory elements and transcription factors contribute to our understanding of gene regulation in retinal development and may have translational potential for cell-type-specific gene delivery into developing retinas.
Weaknesses:
(1) The claims for gene-specific and cell type-specific CRMs would benefit from further validation using complementary approaches, such as CRISPR interference or Prime editing.
The methods that we developed were meant to provide candidates for regulatory elements for a gene of interest. These candidates could be used to further understand the regulation of a gene, a complex and difficult task, especially for dynamically regulated genes in the context of development. These candidates could also, or instead, be used to drive gene expression specifically in a target cell of interest for applications such as gene therapy or perturbations that need this type of specificity. In the first case, to use the candidates to understand the regulation of a gene, one would need to validate the candidates using the types of methods typically employed for this purpose, most rigorously in the in vivo genomic context. We did not pursue this level of validation as it would encompass a great deal of work outside the scope of the current study. However, by initially testing loci which have been studied by several groups (as cited in the manuscript, Rho, Grm6, Vsx2, and Cabp5), we were able to show that LS-MPRA can identify known CRMs. In the cases of Rho and Vsx2, previous data have shown the CRMs to be relevant in the genomic context in vivo. In addition, two Vsx2 CRM’s identified by LS-MPRA are located at -37 Kb and -17Kb, and the Grm6 CRM identified by LS-MPRA is at -8Kb. These are the same CRM locations identified previously using classical methods. These data show that the method is capable of identifying distal elements. When one has only one or a few loci of interest, i.e. one does not need to use genome-wide approaches, LS-MPRA is accurate enough to be worth the relatively small effort to identify potential CRMs, even those at some distance from the TSS. However, it is apparent that our methods are not perfect and that the LS-MPRA does not pick up all CRMs. We do not know of a method that has been shown to do so.
Reviewer #3 (Public review):
Summary:
Use of reporter assays to understand the regulatory mechanisms controlling gene expression moves beyond simple correlations of cis-regulatory sequence accessibility, evolutionary sequence conservation, and epigenetic status with gene expression, instead quantifying regulatory sequence activity for individual elements. Tulloch et al., provide a systematic characterization of two new reporter assay techniques (LS-MPRA and d-MPRA) to comprehensively identify cis-regulatory sequences contained within genomic loci of interest during retinal development. The authors then apply LS-MPRA and d-MPRA to identify putative cis-regulatory sequences controlling Olig2 and Ngn2 expression, including potential regulatory motifs that known retinal transcription factors may bind. Transcription factor binding to regulatory sequences is then assessed via CUT&RUN. The broader utility of the techniques is then highlighted by performing the assays across development, across species, and across tissues.
Strengths:
(1) The authors validate the reporter assays on retinal loci for which the regulatory sequences are known (Rho, Vsx2, Grm6, Cabp5) mostly confirming known regulatory sequence activity but highlighting either limitations of the current technology or discrepancies of previous reporter assays and known biology. The techniques are then applied to loci of interest (Olig2 and Ngn2) to better understand the regulatory sequences driving expression of these transcription factors across retinal development within subsets of retinal progenitor cells, identifying novel regulatory sequences through comprehensive profiling of the region.
(2) LS-MPRA provides broad coverage of loci of interest.
(3) d-MPRA identifies sequence features that are important for cis-regulatory sequence activity.
(4) The authors take into account transcript and protein stability when determining the correlation of putative enhancer sequence activity with target gene expression.
Weaknesses:
(1) In its current form, the many important controls that are standard for other MPRA experiments are not shown or not performed, limiting the interpretations of the utility of the techniques. This includes limited controls for basal-promoter activity, limited information about sequence saturation and reproducibility of individual fragments across different barcode sequences, limitations in cloning and assay delivery, and sequencing requirements. Additional quantitative metrics, including locus coverage and number of barcodes/fragments, would be beneficial throughout the manuscript.
We thank the reviewer for these comments and have provided detailed responses to the additional analyses in the subsequent Recommendations section.
(2) There are no statistical metrics for calling a region/sequence 'active'. This is especially important given that NR3 for Olig2 seems to have a small 'peak' and has non-significant activity in Figure 4.
See comments about peak calling in our response to Reviewer #1.
(3) The authors present correlational data for identified cis-regulatory sequences with target gene expression. Additionally, the significance of transcription factor binding to the putative regulatory sequences is not currently tested, only correlated based on previous single-cell RNA-sequencing data. While putative regulatory sequences with potential mechanisms of regulation are identified/proposed, the lack of validation (and discrepancies with previous literature) makes it hard to decipher the utility of the techniques.
See comments about further validation in our response to Reviewer #2.
(4) While the interpretations that Olig2 mRNA/protein expression is dynamically regulated improved the proportions of cells that co-expressed CRM-regulated GFP and Olig2, alternate explanations (some noted) are just as likely. First, the electroporation isn't specific to Olig2+ progenitors. Also, the tested, short CRM fragments may have activating signals outside of Olig2 neurogenic cells because chromatin conformation, histone modifications, and DNA methylation are not present on plasmids to precisely control plasmid activity. Alternatively, repressive elements that control Olig2 expression are not contained in the reporter vectors.
The electroporation of Olig2 minus and plus cells is an excellent way to determine if a CRM is active in all cells, or only a specific subset, and we therefore consider this the best way to answer the question of specificity. We agree that we were unable to show that all CRM active cells were indeed Olig2-expressing cells. As noted by the Reviewer, we went to some lengths to quantify RNA and protein co-expression, including of endogenous Olig2 protein and RNA. Even with the endogenous RNA and protein, there was a mismatch wherein one infrequently saw the two together in the same cell, which could be predicted from the short half-lives of these molecules. Regarding chromatin, etc., we are intrigued by the proper regulation that we have observed for CRMs that we have previously discovered by plasmid electroporation (e.g. Kim et al. 2008, Matsuda and Cepko, 2004, Wang et al. 2014, Emerson et al. 2013). It is indeed interesting that plasmids can recapitulate proper regulation, without the proper genomic context or chromatin modifications. We have expanded our discussion of these points in the Discussion.
(5) It is unclear as to why the d-MPRA uses a different barcoding strategy, placing a second copy of the cis-regulatory sequence in the 3' UTR. As acknowledged by the author, this will change the transcript stability by changing the 3' UTR sequence. Because of this, comparisons of sequence activity between the LS-MPRA and d-MPRA should not be performed as the experiments are not equivalent.
We had provided a rationale for the different strategies of barcoding in the original submission, and believe it is at the discretion of the experimenter to utilize either strategy for their specific purposes. We agree that comparing activity between different techniques would not be appropriate. The analysis of mutated CRMs using d-MPRA does not utilize data from the LS-MPRA, but is an analysis of relative activity among all mutated d-MPRA constructs.
(6) Furthermore, details of the mutational burden in d-MPRA experiments are not provided, limiting the interpretations of these results.
We have provided detailed responses to the additional analyses in the subsequent Recommendations section and included details of the mutational burden in Supplemental Document A.
(7) Many figures are IGV screenshots that suffer from low resolution. Many figures could be consolidated.
We have increased the resolution of all IGV genome tracks, but believe the content within all figures remains appropriate.
Recommendations for the authors:
Reviewer #1 (Recommendations for the authors):
Suggestions for improving the clarity of the results in the figures:
(1) The pie charts used the show the percentage of overlapping cells in the colocalization analyses were not especially intuitive to read, and although the percentages and any statistical significance were often written in the text, it would've been helpful to have them written in the figures. I would suggest displaying the results in stacked bar plots, possibly like the one shown in Figure 6A, to demonstrate the data more clearly.
We thank the reviewer for the suggestions. Though adding the percentages directly to the pie charts would make the relevant panels too confusing to interpret, we added supplemental tables (Tables S5-S9) with the percentages displayed in all pie charts for readers interested in the precise quantifications.
(2) The scRNA-seq UMAPs showing co-expression of Olig2 with the TFS of interest - it is very hard to see the cells that co-express. I would recommend either having a window zoomed in on the Olig2-expressing cell population to be able to see the co-expression more clearly visually, and/or including a graph demonstrating the percentages of co-expressing cells. These numbers were written in the text, but would be useful to see in the figure.
The resolution of the scRNA-Seq plot has been improved for the visualization of co-expressing cells, which were also brought forward in all UMAP plots to improve clarity. Because of the higher quality images, insets should no longer be necessary. We have also included percentages of co-expression in the figures (Figs. 8 and 8S) and thank the reviewer for the suggestion.
Other minor suggestions/corrections:
(3) Figures 6B and 10S are missing the overlap quantification (in bar or pie charts) like in the other figures.
The quantification for the image in 6B (i.e., GFP fluorescence and GFP RNA) is displayed in 6D for the four Olig2 CRM plasmid constructs. In Fig. 10S, the experiments in early chick ventral neural tube delivered constructs to a very limited number of cells, and quantification of cells would not necessarily represent an accurate number of cells with CRM activity. We therefore decided to show only representative images of CRM activity in this population of cells rather than present a biased count or increase the number of experiments/samples to obtain a robust quantification.
(4) On the second-to-last line of page 10, in the sentence "The d-MPRA approach provided a robust, high resolution method for functionally relevant TF binding sites....", I think you're missing a word between "for" and "functionally". For example, it might be "for identifying..." or "for nominating...".
We have revised the sentence accordingly.
Reviewer #2 (Recommendations for the authors):
Minor suggestions:
(1) Please indicate which mouse reference genome (e.g., mm10) was used in plots such as Figure 2.
We have added text to the relevant sections in the Results (the reference genome was already mentioned in Methods).
(2) In Figures 2 and 2S, the CRMs discussed in the text are not labeled or highlighted, making it unclear which regions are being referenced.
We have labeled peaks with roman numerals in both the figures, legends, and text for clarity and thank the reviewer for the suggestion.
(3) Consider listing the genomic coordinates for the CRMs mentioned in the text, as this information would be especially useful for readers interested in exploring these regions further.
This information was included in Table 2S in the original submission, with all relevant coordinates provided therein.
(4) The d-MPRA plots (e.g., Figure 7C-E) do not clearly show the effects of different nucleotide substitutions. A more informative visualization style can be found in Kircher et al (PMID: 31395865, Fig. 1D) or Deng et al (PMID: 38781390, Fig. 5F).
The precise nucleotide substitutions would be informative to visualize the effects of specific changes. However, we were more interested in how any nucleotide substitution influenced the CRM activity to hone in on relevant TFBS. We therefore believe the current visualization is the most appropriate to accomplish this. However, for some types of future applications, a more informative visualization as noted would be a valuable addition.
(5) It would be extremely helpful to the community if the LS-MPRA data were uploaded to the UCSC genome browser and made accessible via a link.
We have uploaded all LS-MPRA genome tracks to a Track Hub in the UCSC genome browser and provided the appropriate link to access the Hub (https://github.com/cattapre/ALAS00) in the methods section.
Reviewer #3 (Recommendations for the authors):
(1) The authors should address the following metrics to showcase the utility of the techniques:
We thank the reviewer for requesting the detailed metrics outlined below. We have addressed all inquiries and included the majority of metrics in the resubmission.
(a) Library size
This should be shown for each library that is generated. It is acknowledged that the complete size of the library is limited by sequencing, and the comprehensiveness of the library will change every time the library is re-prepped. However, metrics of this are not currently provided in a robust manner for each library. "Libraries of at least 7x10^6 and as many as 9x10^7 fragments are made" - vague - how was library complexity established since this seems to be an estimation, how many reads were utilized to estimate library complexity?
We created a new supplemental table (Table S3) that displays the complexity based on sequencing rather than the estimated complexity based on the serial dilutions prior to 3D culture (which was used for the estimates listed in the results). We updated the complexity range in the text as well and thank the reviewer for the suggestion.
Does library size scale proportionally to the BACs of different sizes?
The fragmentation of different BACs with differing sizes does not necessarily alter the size of the library. Library size is primarily determined by the library creation pipeline, with the size selection step of the fragmented BAC and the cloning step that inserts adapter-ligated fragments into the barcoded expression vector being the primary determinants of complexity of plasmid libraries.
(b) Sequence saturation
Can the authors please provide evidence that the libraries have been sequenced to saturation or estimates of the degree of under-sequencing? How many reads does it take to discover a new barcode associated with a new regulatory sequence?
We have provided library characteristics for this in Table S3 and have also generated Sequence Saturation Curves for each association library in Supplemental Document A.
(c) Barcode saturation
How many barcodes are present for each fragment in the libraries? Are most fragments only covered by 1 barcode? The barcoding strategy doesn't prevent the same barcode from being assigned to multiple different fragments, as barcodes are random. What is the incidence of barcode collisions?
We have provided library characteristics for this in Table S3 and have also generated Barcode Saturation Curves for each association library in Supplemental Document A.
Additionally, we tested whether the omission of barcode collisions would affect the output of our LS-MPRA. We reanalyzed one barcode abundance library (one replicate following 12h Notch inhibitor) and filtered the barcodes so that only unique barcodes were analyzed. We were able to replicate all previously identified peaks. Though it is not necessary to filter out barcode collisions, there may be an improvement in signal-to-noise if the sequencing depth of libraries was sufficient (see Supplemental Document B).
(d) Normalization
As performed, fragment activity is normalized by RNA expression compared to the presence of fragments in the library. While this is done for small libraries, for large libraries, this may not be appropriate. For large libraries, every sequence in the library will not be delivered to each cell, and many fragments contained in the library may not be electroporated at all. Ideally, the authors would have sequenced both the RNA and DNA from the electroporations to i) identify the fragment distribution of the library that was successfully electroporated and ii) provide an internal normalization factor across replicate samples. This is especially important if the libraries were ever re-prepped, as the jack-potting or asymmetries in fragment recovery can occur every time the library is re-derived.
We agree with the reviewer’s comments about the variability in fragments delivered experimentally, though we also believe the normalization of the libraries is still appropriate. We never needed to re-prep the libraries as there was sufficient material for many more experiments than were performed. However, should one ever need to re-prep an LS-MPRA library, all experimental sequencing should be normalized to the respective sequenced association library to account for biased distributions, as the reviewer mentions.
In the absence of these metrics (this would likely require the authors to repeat all experiments and is acknowledged to be outside the scope of revisions), the authors should provide information on the percentage of the library that is profiled in the RNA for each library.
We have provided RNA profiles of all abundance libraries in Table S4. The overall fraction of fragments represented in the RNA pools was lower than that observed in other published MPRAs. This difference is expected given that most MPRA studies preselect fragments based on chromatin accessibility, transcription factor binding, sequence conservation, or bioinformatically predicted CRMs, thereby enriching for regulatory elements with high activity potential. Our locus-specific MPRA libraries, by contrast, include all fragments across the targeted genomic region, many of which are likely to be inactive in the tested context. Consequently, only a smaller proportion of fragments show measurable RNA expression.
(e) Fragment sizes
Please provide a density plot or something similar showcasing the size distribution of the libraries generated. Is there any correlation between sequence activity and the size of fragments?
We have generated size distribution plots and correlations between fragment size and activity of all libraries and have included them in Supplemental Document A.
(2) Questions about the statistical validity of results:
(a) What threshold is utilized for calling a sequence as active? This is important as NR3 does not seem to be an element that has significant activity.
See comments about peak calling in prior responses.
(b) A Fisher's exact test using cells from single-cell RNA-sequencing as replicate samples is inappropriate as the cells are i) not from replicate experiments and ii) potentially in different cell states. The proportions of cells across replicate scRNA-seq datasets would be more appropriate.
We thank the reviewer for raising this important point. While we agree that individual cells do not substitute for biological replicates, we believe Fisher’s exact test remains appropriate for testing whether gene expression is associated with Olig2 expression within a single scRNA-seq dataset. The test assesses co-occurrence at the level of individual cells, which is valid under the assumption that each cell represents an independent sampling of transcriptional states, even when it is possible that cells are in different states. We use this method as an exploratory tool to identify candidate genes associated with Olig2 expression in this dataset, and in the future, this could also be further validated by comparing the proportions of cells across replicate datasets, as the reviewer mentions.
(3) Discussion of the reporter/Olig2/Ngn2 RNA/protein disconnect needs to be expanded. Some simpler explanations for the presence of GFP in Olig2- and Ngn2- cells, as well as the presence of Olig2 or Ngn2 in GFP- cells, is that (i) these putative CRMs are being introduced to cells in plasmids, taking them out of their native genomic context where they may be inaccessible or repressed and allowing them to drive reporter expression even if their candidate target gene is not endogenously expressed, (ii) these putative CRMs may regulate genes besides just Olig2 or Ngn2, and (iii) Olig2 and Ngn2 are regulated by far more regulatory elements than the 3 or 4 being tested in each reporter assay, so their expression likely does not rely solely on the activity of the few putative CRMs tested.
We have added these points in an expanded discussion in the text.
(4) Problems with figures: Low resolution of many IGV genome tracks, pink 'co-expression' dots are completely indiscernible. Numbers should be listed with the pie charts. BFP expression should be shown since this is being quantified, especially since electroporation efficiency can change across age and/or tissue samples.
We have reconfigured the IGV tracks so that they are higher resolution and have included supplemental tables for the numbers pertaining to the pie charts. For electroporation controls (BFP and RFP), BFP expression is shown in Figs 5S, 6, and 10S and the RFP electroporation control is shown in Fig. 11. Though BFP is sometimes used as a qualifier in the denominator of some of the quantification, displaying its expression, particularly in combination with three other signals that are already included in most images, provides limited utility.
(5) More information is required to understand the utility of the d-MPRA. Detailed quantification of the number of mutations/fragments needs to be ascertained. When multiple mutations are present, how are the authors controlling for which mutation is affecting activity? What is the coverage of the loci of interest for mutational burden (ie, is every base pair mutated in at least one fragment?). For mutations that increase the activity of the element, are there specific sequence features that increase activity (new motifs generated)?
The d-MPRA platform is a high-throughput assay that seeks to identity putative sub-regions within CRMs nominated by the LS-MPRA, or any other assay. It relies on deep mutational coverage to determine positive and negative regulatory sub-regions of the CRMs. While many reads have multiple mutations, they are broadly co-occurring across the entire fragment (see Supplemental Document A) so as not to create a false linkage between the sites. Every individual site is mutated many times with roughly even coverage across each fragment (see Supplemental Document A), thus allowing us to assess the requirement of each base in contributing to a putative CRM’s activity. Comparing d-MPRA plots using bulk fragments or fragments with singleton mutations (Supplemental Document A) yielded almost identical plots for two libraries, and a similar analysis of the third library. Any differences between analysis of fragments with one or more mutations is likely a result of either sequencing depth or the requirement of multiple bases for binding or CRM activation. Follow-up experiments investigating intra-CRM interactions would elucidate such variability. Whether new motifs are generated for any specific substitution is an interesting question, which could be followed up for a CRM of interest. The d-MPRA data that we provide would provide the starting point for such follow-up experiments.
(6) Transcription factors as regulators of CRM-activity.
It is appreciated that the authors validated the binding of transcription factors to NR2. However, this correlative analysis should be further tested in follow-up experiments to highlight novel biology using systems already in place. Potential experiments that could be performed include the following (reagents in hand, or performed in a manner similar to experiments performed by the lab in previous publications):
(a) over-expression of TF using LS-MPRA library.
(b) over-expression of TF using d-MPRA library, showing that mutations in the putative TF binding site disrupt activity compared to non-mutated sequences.
(c) performing TF over-expression using target CRMs, including sequences where the TF binding site is mutated (similar to a small MPRA).
(d) the quantification of target gene expression when i) TF is over-expressed, ii) CRM is activated using CRISPRa, or iii) CRM is inhibited using CRISPRi.
These are all valid follow-up experiments. Please see prior responses we have provided regarding further validation.
Minor points
(1) Please acknowledge that some distal regulatory sequences may be contained outside of the BAC regions. Also, the authors should emphasize the point that the assay is NOT cell-type-specific or specific to regulatory sequences for the gene of interest, but ALL regulatory sequences contained within the locus. The discussion of this with respect to Ift122 and Rpl32 is somewhat confusing.
We have added a sentence in the Discussion addressing possible CRMs outside the BAC coverage. We believe it is implicitly understood that the assay only screens regulatory activity in the BAC, and believe we have addressed this in the manuscript.
If one wishes to use a candidate CRM to drive gene expression in a targeted cell type, one needs to establish specificity. In particular, specificity needs to be established in the context of the vector that is being used. Non-integrated vs integrated vectors, different types of viral vectors with their own confounding regulatory sequences, different types of plasmids and methods of delivery, and copy number can all affect specificity. We provided a double in situ hybridization method for the examination of specificity for some of the novel candidate CRMs. It was quite difficult in the case of Olig2 and Ngn2 as their RNAs and proteins are unstable. We would need to provide further evidence should we wish to use these candidate CRMs for directing expression specifically in Olig2- or Ngn2-expressing cells. We suggest that an investigator can choose the vector and method for establishing specificity depending upon the goals of the application.
(2) I am curious as to why low-resolution, pseudo-bulked single-nucleus ATAC was utilized instead of more comprehensive retina ATAC samples at similar time-points (for example, as available in Al Diri et al., 2017 (E14, E17, P0, P3, P7, P10) samples are all available.
The use of pseudo-bulked single-nucleus ATAC-seq data provided a convenient and consistent comparison to our LS-MPRA results. We agree that incorporating higher-resolution datasets such as those from Al Diri et al. would be valuable for future analyses aimed at linking CRM activity with broader chromatin accessibility dynamics.
eLife Assessment
This study provides valuable mechanistic insight into the mutually exclusive distributions of the histone variant H2A.Z and DNA methylation by testing two hypotheses: (i) that DNA methylation destabilizes H2A.Z nucleosomes, thereby preventing H2A.Z retention, and (ii) that DNA methylation suppresses H2A.Z deposition by ATP-dependent chromatin remodelling complexes. Through a series of well-designed and carefully executed experiments, findings are presented in support of both hypotheses. However, the evidence in support of either hypothesis is incomplete, so that the proposed mechanisms underlying the enrichment of H2A.Z on unmethylated DNA remain somewhat speculative.
Reviewer #1 (Public review):
Summary:
The authors considered the mechanism underlying previous observations that H2A.Z is preferentially excluded from methylated DNA regions. They considered two non-mutually exclusive mechanisms. First, they tested the hypothesis that nucleosomes containing both methylated DNA and H2A.Z might be intrinsically unstable due to their structural features. Second, they explored the possibility that DNA methylation might impede SRCAP-C from efficiently depositing H2A.Z onto these DNA methylated regions.
Their structural analyses revealed subtle differences between H2A.Z-containing nucleosomes assembled on methylated versus unmethylated DNA. To test the second hypothesis, the authors allowed H2A.Z assembly on sperm chromatin in Xenopus egg extracts and mapped both H2A.Z localization and DNA methylation in this transcriptionally inactive system. They compared these data with corresponding maps from a transcriptionally active Xenopus fibroblast cell line. This comparison confirmed the preferential deposition or enrichment of H2A.Z on unmethylated DNA regions, an effect that was much more pronounced in the fibroblast genome than in sperm chromatin. Furthermore, nucleosome assembly on methylated versus unmethylated DNA, along with SRCAP-C depletion from Xenopus egg extracts, provided a means to test whether SRCAP-C contributes to the preferential loading of H2A.Z onto unmethylated DNA.
Strengths:
The strength and originality of this work lie in its focused attempt to dissect the unexplained observation that H2A.Z is excluded from methylated genomic regions.
Weaknesses:
The study has two weaknesses. First, although the authors identify specific structural effects of DNA methylation on H2A.Z-containing nucleosomes, they do not provide evidence demonstrating that these structural differences lead to altered histone dynamics or nucleosome instability. Second, building on the elegant work of Berta and colleagues (cited in the manuscript), the authors implicate SRCAP-C in the selective deposition of H2A.Z at unmethylated regions. Yet the role of SRCAP-C appears only partial, and the study does not address how the structural or molecular consequences of DNA methylation prevent efficient H2A.Z deposition. Finally, additional plausible mechanisms beyond the two scenarios the authors considered are not investigated or discussed in the manuscript.
Reviewer #2 (Public review):
This manuscript aims to elucidate the mechanistic basis for the long-standing observation that DNA methylation and the histone variant H2A.Z occupy mutually exclusive genomic regions. The authors test two hypotheses: (i) that DNA methylation intrinsically destabilizes H2A.Z nucleosomes, thereby preventing H2A.Z retention, and (ii) that DNA methylation suppresses H2A.Z deposition by ATP-dependent chromatin-remodelling complexes. However, neither hypothesis is rigorously addressed. There are experimental caveats, issues with data interpretation, and conclusions that are not supported by the data. Substantial revision and additional experiments, including controls, would be required before mechanistic conclusions can be drawn. Major concerns are as follows:
(1) The cryo-EM structure of methylated H2A.Z nucleosomes is insufficiently resolved to address the central mechanistic question: where the methylated CpGs are located relative to DNA-histone contact points and how these modifications influence H2A.Z nucleosome structure. The structure provides no mechanistic insights into methylation-induced destabilization.
The experimental system also lacks physiological relevance. The template DNA sequence is artificial, despite the existence of well-characterised native genomic sequences for which DNA methylation is known to inhibit H2A.Z incorporation. Alternatively, there are a number of studies examining the effect of DNA methylation on nucleosome structure, stability, DNA unwrapping, and positioning. Choosing one of these DNA sequences would have at least allowed a direct comparison with a canonical nucleosome. Indeed, a major omission is the absence of a cryo-EM structure of a canonical nucleosome assembled on the same DNA template - this is essential to assess whether the observed effects are H2A.Z-specific.
Furthermore, the DNA template is methylated at numerous random CpG sites. The authors' argument that only the global methylation level is relevant is inconsistent with the literature, which clearly demonstrates that methylation effects on canonical nucleosomes are position-dependent. Not all CpG sites contribute equally to nucleosome stability or unwrapping, and this critical factor is not considered.
Finally, and most importantly, the reported increase in accessibility of the methylated H2A.Z nucleosome is negligible compared with the much larger intrinsic DNA accessibility of the unmethylated H2A.Z nucleosome. These data do not support the authors' hypothesis and contradict the manuscript's conclusions. Claims that methylated H2A.Z nucleosomes are "more open and accessible" must therefore be removed, and the title is misleading, given that no meaningful impact of DNA methylation on H2A.Z nucleosome stability is demonstrated.
(2) The cryo-EM structures of methylated and unmethylated 601L H2A.Z nucleosomes show no detectable differences. As presented, this negative result adds little value. If anything, it reinforces the point that the positional context of CpG methylation is critical, which the manuscript does not consider.
(3) Very little H3 signal coincides with H2A.Z at TSSs in sperm pronuclei, yet this is neither explained nor discussed (Supplementary Figure 10D). The authors need to clarify this.
(4) In my view, the most conceptually important finding is that H2A.Z-associated reads in sperm pronuclei show ~43% CpG methylation. This directly contradicts the model of strict mutual exclusivity and suggests that the antagonism is context-dependent. Similarly, the finding that the depletion of SRCAP reduces H2A.Z deposition only on unmethylated templates is also very intriguing. Collectively, these result warrants further investigation (see below).
(5) Given that H2A.Z is located at diverse genomic elements (e.g., enhancers, repressed gene bodies, promoters), the manuscript requires a more rigorous genomic annotation comparing H2A.Z occupancy in sperm pronuclei versus XTC-2 cells. The authors should stratify H2A.Z-DNA methylation relationships across promoters, 5′UTRs, exons, gene bodies, enhancers, etc., as described in Supplementary Figure 10A.
(6) Although H2A.Z accumulates less efficiently on exogenous methylated substrates in egg extract, substantial deposition still occurs (~50%). This observation directly challenges the strong antagonistic model described in the manuscript, yet the authors do not acknowledge or discuss it. Moreover, differences between unmethylated and methylated 601 DNA raise further questions about the biological relevance of the cryo-EM 601 structures.
(7) The SRCAP depletion is insufficiently validated i.e., the antibody-mediated depletion of SRCAP lacks quantitative verification. A minimum of three biological replicates with quantification is required to substantiate the claims.
(8) It appears that the role of p400-Tip60 has been completely overlooked. This complex is the second major H2A.Z deposition complex. Because p400 exhibits DNA methylation-insensitive binding (Supplementary Figure 14), it may account for the deposition of H2A.Z onto methylated DNA. This possibility is highly significant and must be addressed by repeating the key experiments in Figure 5 following p400-Tip60 depletion.
(9) The manuscript repeatedly states that H2A.Z nucleosomes are intrinsically unstable; however, this is an oversimplification. Although some DNA unwrapping is observed, multiple studies show that H3/H4 tetramer-H2A.Z/H2B interactions are more stable (important recent studies include the following: DOI: 10.1038/s41594-021-00589-3; 10.1038/s41467-021-22688-x; and reviewed in 10.1038/s41576-024-00759-1).
In summary, the current manuscript does not present a convincing mechanistic explanation for the antagonism between DNA methylation and H2A.Z. The observation that H2A.Z can substantially coexist with DNA methylation in sperm pronuclei, perhaps, should be the conceptual focus.
Reviewer #3 (Public review):
Summary:
Histone variant H2A.Z is evolutionarily conserved among various species. The selective incorporation and removal of histone variants on the genome play crucial roles in regulating nuclear events, including transcription. Shih et al. aimed to address antagonistic mechanisms between histone variant H2A.Z deposition and DNA methylation. To this end, the authors reconstituted H2A.Z nucleosomes in vitro using methylated or unmethylated human satellite II DNA sequence and examined how DNA methylation affects H2A.Z nucleosome structure and dynamics. The cryo-EM analysis revealed that DNA methylation induces a more open conformation in H2A.Z nucleosomes. Consistent with this, their biochemical assays showed that DNA methylation subtly increases restriction enzyme accessibility in H2A.Z nucleosomes compared with canonical H2A nucleosomes. The authors identified genome-wide profiles of H2A.Z and DNA methylation using genomic assays and found their unique distribution between Xenopus sperm pronuclei and fibroblast cells. Using Xenopus egg extract systems, the authors showed SRCAP complex, the chromatin remodelers for H2A.Z deposition, preferentially deposit H2A.Z on unmethylated DNA.
Strengths:
The study is solid, and most conclusions are well-supported. The experiments are rigorously performed, and interpretations are clear. The study presents a high-resolution cryo-EM structure of human H2A.Z nucleosome with methylated DNA. The discovery that the SRCAP complex senses DNA methylation is novel and provides important mechanistic insight into the antagonism between H2A.Z and DNA methylation.
Weaknesses:
The study is already strong, and most conclusions are well supported. However, it can be further strengthened in several ways.
(1) It is difficult to interpret how DNA methylation alters the orientation of the H4 tail and leads to the additional density on the acidic patch. The data do not convincingly support whether DNA methylation enhances interactions with H2A.Z mono-nucleosomes, nor whether this effect is specific to methylated H2A.Z nucleosomes.
(2) It remains unclear whether DNA methylation alters global H2A.Z nucleosome stability or primarily affects local DNA end flexibility. Moreover, while the authors showed locus-specific accessibility by HinfI digestion, an unbiased assay such as MNase digestion would strengthen the conclusions.
Author response:
eLife Assessment
This study provides valuable mechanistic insight into the mutually exclusive distributions of the histone variant H2A.Z and DNA methylation by testing two hypotheses: (i) that DNA methylation destabilizes H2A.Z nucleosomes, thereby preventing H2A.Z retention, and (ii) that DNA methylation suppresses H2A.Z deposition by ATP-dependent chromatin remodeling complexes. Through a series of well-designed and carefully executed experiments, findings are presented in support of both hypotheses. However, the evidence in support of either hypothesis is incomplete, so that the proposed mechanisms underlying the enrichment of H2A.Z on unmethylated DNA remain somewhat speculative.
We would like to thank the editor and reviewers for their critical assessments of our manuscript. While we do acknowledge the limitations of our work, we believe that our results provide important mechanistic insights into the long-standing question of how H2A.Z is preferentially enriched in hypomethylated genomic DNA regions. First, our structural and biochemical data suggest that DNA methylation increases the openness and physical accessibility of H2A.Z, albeit the effect is relatively subtle and is sequence-dependent. Second, using Xenopus egg extracts and synthetic DNA templates, we provide the first clear and direct evidence that DNA methylation-sensitive H2A.Z deposition is due to the H2A.Z chaperone SRCAP-C, corroborated by our discovery that SRCAP-C binding to DNA is suppressed by DNA methylation. Although the molecular details by which DNA methylation inhibits binding of SRCAP-C is an important area of future study, in our current manuscript, we do provide evidence that directly links the presence of SRCAP-C to the establishment of the DNA methylation/H2A.Z antagonism in a physiological system. Thanks to criticisms by the reviewers, we realized that we did not clearly state in our Abstract that the impact of DNA methylation on intrinsic H2A.Z nucleosome stability is relatively subtle, although we did explain these observations and limitations in the main text. In our revised manuscript, we are willing to edit the text to better clarify the criticisms raised by the reviewers.
Public Reviews:
Reviewer #1 (Public review):
Summary:
The authors considered the mechanism underlying previous observations that H2A.Z is preferentially excluded from methylated DNA regions. They considered two non-mutually exclusive mechanisms. First, they tested the hypothesis that nucleosomes containing both methylated DNA and H2A.Z might be intrinsically unstable due to their structural features. Second, they explored the possibility that DNA methylation might impede SRCAP-C from efficiently depositing H2A.Z onto these DNA methylated regions.
Their structural analyses revealed subtle differences between H2A.Z-containing nucleosomes assembled on methylated versus unmethylated DNA. To test the second hypothesis, the authors allowed H2A.Z assembly on sperm chromatin in Xenopus egg extracts and mapped both H2A.Z localization and DNA methylation in this transcriptionally inactive system. They compared these data with corresponding maps from a transcriptionally active Xenopus fibroblast cell line. This comparison confirmed the preferential deposition or enrichment of H2A.Z on unmethylated DNA regions, an effect that was much more pronounced in the fibroblast genome than in sperm chromatin. Furthermore, nucleosome assembly on methylated versus unmethylated DNA, along with SRCAP-C depletion from Xenopus egg extracts, provided a means to test whether SRCAP-C contributes to the preferential loading of H2A.Z onto unmethylated DNA.
Strengths:
The strength and originality of this work lie in its focused attempt to dissect the unexplained observation that H2A.Z is excluded from methylated genomic regions.
Weaknesses:
The study has two weaknesses. First, although the authors identify specific structural effects of DNA methylation on H2A.Z-containing nucleosomes, they do not provide evidence demonstrating that these structural differences lead to altered histone dynamics or nucleosome instability. Second, building on the elegant work of Berta and colleagues (cited in the manuscript), the authors implicate SRCAP-C in the selective deposition of H2A.Z at unmethylated regions. Yet the role of SRCAP-C appears only partial, and the study does not address how the structural or molecular consequences of DNA methylation prevent efficient H2A.Z deposition. Finally, additional plausible mechanisms beyond the two scenarios the authors considered are not investigated or discussed in the manuscript.
Although we acknowledge the limitations of our study and are willing to expand our discussion to more thoroughly discuss these points, we believe our manuscript provides several important mechanistic insights which this reviewer may not have fully appreciated.
Our first conclusion that H2A.Z nucleosomes on methylated DNA are more open and accessible compared to their unmethylated counterparts is supported by both our cryo-EM study and the restriction enzyme accessibility assay. Although the physical effect of DNA methylation is relatively subtle and is likely sequence dependent, as we clearly noted within the manuscript, the difference does exist and is valuable information for the chromatin field at large to consider.
The second major conclusion of our manuscript is that SRCAP-C exhibits preferential binding to unmethylated DNA over methylated DNA, and that SRCAP-C represents the major mechanism that can explain the biased deposition of H2A.Z to unmethylated DNA in Xenopus egg extracts. Furthermore, our experiments using Xenopus egg extract clearly demonstrated that H2A.Z is deposited by both DNA-methylation sensitive and insensitive mechanisms. Depletion of SRCAP-C almost completely eliminated the levels of DNA-methylation-sensitive H2A.Z deposition and reduced the total level of H2A.Z on chromatin to less than half of that seen in non-depleted extract. This result demonstrated that DNA methylation-sensitive H2A.Z loading is primarily regulated by SRCAP-C, at least in our experimental context where transcription, replication, and other epigenetic modifications are not involved. It is likely that additional mechanisms do further contribute, implicated by our sequencing experiments, particularly at regions with active transcription, and we have noted these possibilities and the rationale for their existence in the Discussion.
Our study also suggests that a SRCAP-independent, DNA methylation-insensitive mechanism of H2A.Z loading exists, which we suspect to be mediated by Tip60-C. In line with this possibility, our data suggest that Tip60-C binds DNA in a DNA methylation-insensitive manner in Xenopus egg extract. Since antibodies to deplete Tip60-C from Xenopus egg extract are currently unavailable, we were unable to directly test that hypothesis and decided not to include Tip60-C into our final model as we lacked experimental evidence for its role. However, whether or not Tip60-C is the complex responsible for the DNA methylation-insensitive pathway does not influence our final conclusion that SRCAP-C plays a major role in DNA methylation-sensitive H2A.Z loading. We are planning to edit our manuscript to more comprehensively discuss these points.
Please note that while Berta et al reported that DNA methylation increases at H2A.Z loci in tumors defective in SRCAP-C, they selected those regions based off where H2A.Z is typically enriched within normal tissues (Berta et al., 2021). They did not show data indicating whether H2A.Z is still retained specifically at those analyzed loci upon mutation of SRCAP-C subunits. Thus, although we greatly admire their work and are pleased that many of our findings align with theirs, their paper did not directly address whether SRCAP-C itself differentiates between DNA methylation status nor the impact that has on H2A.Z and DNA methylation colocalization. In contrast, our Xenopus egg extract system, where de novo methylation is undetectable (Nishiyama et al., 2013; Wassing et al., 2024) offers a unique opportunity to examine the direct impact of DNA methylation on H2A.Z deposition using controlled synthetic DNA substrates. Corroborated with our demonstration that DNA binding of SRCAP-C is suppressed by DNA methylation, we believe that our manuscript provides a specific mechanism that can explain the preferential deposition of H2A.Z at hypomethylated genomic regions.
Reviewer #2 (Public review):
This manuscript aims to elucidate the mechanistic basis for the long-standing observation that DNA methylation and the histone variant H2A.Z occupy mutually exclusive genomic regions. The authors test two hypotheses: (i) that DNA methylation intrinsically destabilizes H2A.Z nucleosomes, thereby preventing H2A.Z retention, and (ii) that DNA methylation suppresses H2A.Z deposition by ATP-dependent chromatin-remodelling complexes. However, neither hypothesis is rigorously addressed. There are experimental caveats, issues with data interpretation, and conclusions that are not supported by the data. Substantial revision and additional experiments, including controls, would be required before mechanistic conclusions can be drawn. Major concerns are as follows:
We appreciate the critical assessment of our manuscript by this reviewer. Although we acknowledge the limitations of our study and will revise the manuscript to better describe them, we would like to respectfully argue against the statement that our "conclusions […] are not supported by the data".
(1) The cryo-EM structure of methylated H2A.Z nucleosomes is insufficiently resolved to address the central mechanistic question: where the methylated CpGs are located relative to DNA-histone contact points and how these modifications influence H2A.Z nucleosome structure. The structure provides no mechanistic insights into methylation-induced destabilization.
The fact that the DNA resolution in the methylated structure was not high enough to resolve the positions of methylated CpGs despite a high overall resolution of 2.78 Å implies that 1) the Sat2R-P DNA was not as stably registered as the 601L sequence, requiring us to create two alternative Sat2R-P atomic models to account for the variable positioning in our samples, and 2) that the presence of DNA methylation increases that positional variability. We understand that one may prefer to see highly resolved density around each methylation mark, but we do believe that our inability to accomplish that is actually a feature rather than a weakness and has important biological implications. The decrease in local DNA resolution on the methylated Sat2R-P structure compared to its unmethylated counterpart is meaningful and suggests to us that DNA methylation weakens overall DNA wrapping and positioning on the nucleosome, supported by the increased flexibility seen at the linker DNA ends as well as an increase in the population of highly shifted nucleosomes amongst the methylated particles. Additionally, one major view in the DNA methylation/nucleosome stability field is that the presence of DNA methylation can make DNA stiffer and harder to bend, causing opening and destabilization of nucleosomes (Ngo et al., 2016). The increased opening of linker DNA ends and accessibility of methylated H2A.Z nucleosomes in our hands also aligns with such an idea, again suggesting decreased histone-DNA contact stability on methylated DNA substrates. We plan to revise the writing in our manuscript to better reflect these ideas.
The experimental system also lacks physiological relevance. The template DNA sequence is artificial, despite the existence of well-characterised native genomic sequences for which DNA methylation is known to inhibit H2A.Z incorporation. Alternatively, there are a number of studies examining the effect of DNA methylation on nucleosome structure, stability, DNA unwrapping, and positioning. Choosing one of these DNA sequences would have at least allowed a direct comparison with a canonical nucleosome. Indeed, a major omission is the absence of a cryo-EM structure of a canonical nucleosome assembled on the same DNA template - this is essential to assess whether the observed effects are H2A.Z-specific.
The reviewer raises a fair question about whether canonical H2A would experience the same DNA methylation-dependent structural effects. We had considered solving the H2A structures, however, ultimately decided against it for a few reasons. First, there already exists crystal structures of canonical H2A nucleosomes using a DNA sequence highly similar to our Sat2R-P with and without the presence of DNA methylation (PDB: 5CPI and 5CPJ). The authors of this study did not see any physical differences present in their structures (Osakabe et al., 2015). Additionally, we had included canonical H2A conditions within our restriction enzyme accessibility assay and did not see a significant impact of DNA methylation on those samples (Fig 3). Because of the previous report and our own negative data, we expected that only limited additional insights would be obtained from the canonical H2A structures and decided not to pursue that analysis.
One of the primary reasons we chose the Sat2R-P sequence was, as noted above, that there already was a published study examining how DNA methylation affects nucleosome structure using a variant of this sequence which we could compare to our results, as the reviewer has suggested. We did have to modify the sequence, namely by making it palindromic, in order to increase the final achievable resolution. We viewed the Sat2R-P sequence as an attractive candidate because it is physiologically relevant; the initial sequence was taken directly from human satellite II. Several modifications were made for technical reasons, including making the sequence palindromic as described above and also ensuring that each CpG is recognizable by a methylation-sensitive restriction enzyme so that we could be certain about the degree of methylation on our substrates. These practical concerns outweighed the necessity of maintaining a strict physiological sequence to us. However, we still believe the final Sat2R-P more closely mimics physiological sequences than Widom 601. Additionally, human satellite II is a highly abundant sequence in the human genome that is known to undergo large methylation changes on the onset of many disorders, like cancer, as well as during aging. Thus, there are interesting biological questions surrounding how the methylation state of this particular sequence affects chromatin structure. Furthermore, it has been reported that satellite II is devoid of H2A.Z (Capurso et al., 2012). Beyond those reasons, the satellite II sequence is generally interesting to our lab because we have been studying genes involved in ICF syndrome, where hypomethylation of satellite II sequences forms one of the hallmarks of this disorder (Funabiki et al., 2023; Jenness et al., 2018; Wassing et al., 2024). We understand that sequence context plays a large role in nucleosome wrapping and stability. This is why we strived to test multiple sequences in each of our assays. We do agree that it would be interesting to use DNA sequences where H2A.Z binding has already been described to be affected in a DNA methylation-dependent manner, forming an exciting future study to pursue.
Furthermore, the DNA template is methylated at numerous random CpG sites. The authors' argument that only the global methylation level is relevant is inconsistent with the literature, which clearly demonstrates that methylation effects on canonical nucleosomes are position-dependent. Not all CpG sites contribute equally to nucleosome stability or unwrapping, and this critical factor is not considered.
We did not argue that only the global methylation level is relevant. We also would appreciate it if the reviewer could provide specific references that "clearly demonstrates that methylation effects on canonical nucleosomes are position-dependent". We are aware of a series of studies conducted by Chongli Yuan's group, including one testing the effect of placing methylated CpGs at different positions along the Widom 601 sequence. In that study (Jimenez-Useche et al., 2013), they did find that positioning of mCpGs has differential impacts on the salt resistance of the nucleosomes, with 5 tandem mCpG copies at the dyad causing the most dramatic nucleosome opening whereas having mCpGs only at the DNA major grooves, but not elsewhere, increased nucleosome stability. However, they did also find that methylation of the original Widom 601 sequence also caused destabilization, albeit to a lesser degree, and another study by the same group (Jimenez-Useche et al., 2014) also found that CpG methylation decreased nucleosome-forming ability for all tested variants of the Widom 601 sequence, regardless of CpG density or positioning.
Other studies monitored how distribution of methylated CpGs correlates with nucleosome positioning (Collings et al., 2013; Davey et al., 1997; Davey et al., 2004). However, these studies assessed the sequence-dependent effects specifically on nucleosome assembly during in vitro salt dialysis, which is a different physical process than the one our manuscript focuses on, especially when considering the fact that H2A.Z is deposited onto preassembled H2A-nucleosome. Our cryo-EM analysis examines the structural changes induced by DNA methylation on already formed nucleosomes rather than the process of formation. Thus, probing accessibility changes using a restriction enzyme was the more appropriate biochemical assay to verify our structures.
We do very much agree that DNA context can influence nucleosome stability under different conditions. A study of molecular dynamics simulations concluded that the "combination of overall DNA geometrical and shape properties upon methylation" makes nucleosomes resistant to unwrapping (Li et al., 2022), while another modeling study suggests that DNA methylation impacts nucleosome stability in a manner dependent on DNA sequence, where "[s]trong binding is weakened and weak binding is strengthened" (Minary and Levitt, 2014). While G/C-dinucleotides are preferentially placed at major groove-inward positions in the nucleosomes in vivo (Chodavarapu et al., 2010; Segal et al., 2006) and G/C-rich segments are excluded from major groove-outward positions in Widom 601-like nucleosomes (Chua et al., 2012), methylated CpG dinucleotides are preferably, if not exclusively, located at major groove-outward positions in vivo. Mechanisms behind this biased mCpG positioning on the nucleosome remain speculative, likely caused by a combination of multiple factors, but the fact that we did not observe clear structural impacts using the Widom 601L sequence, where mCpGs are located at the major groove-outward and -inward positions ((Chua et al., 2012) and our structure), deserves a space for discussion. On the other hand, positioning of mCpG on satellite II-derived sequences that we used in this study was based on a physiological sequence, and thus it may not be appropriate to say that those CpGs are placed at multiple "random" positions. Although we decided not to discuss the position of 5mC on our Sat2R nucleosome structure due to ambiguous base assignments, neither of our two atomic models is consistent with an idea that DNA methylation repositions the CpG to the outward major grooves. As the potential contribution of how DNA methylation affects the nucleosome structure via modulating DNA stiffness has been extensively studied (Choy et al., 2010; Li et al., 2022; Ngo et al., 2016; Perez et al., 2012), we believe that it is appropriate to consider overall DNA properties along the whole DNA sequence, though we are willing to discuss potential positional effects in the revised manuscript.
Perhaps one of the most important points that we did not emphasize enough in our original manuscript was that in contrast to the subtle intrinsic effect of DNA methylation that was DNA sequence dependent, we observed SRCAP-dependent preferential H2A.Z deposition to unmethylated DNA over methylated DNA in both 601 and satellite II DNAs. In the revised manuscript, we will make the value of comparative studies on 601 and satellite II in two distinct mechanisms.
Finally, and most importantly, the reported increase in accessibility of the methylated H2A.Z nucleosome is negligible compared with the much larger intrinsic DNA accessibility of the unmethylated H2A.Z nucleosome. These data do not support the authors' hypothesis and contradict the manuscript's conclusions. Claims that methylated H2A.Z nucleosomes are "more open and accessible" must therefore be removed, and the title is misleading, given that no meaningful impact of DNA methylation on H2A.Z nucleosome stability is demonstrated.
We respectfully disagree with this reviewer's criticism. We investigated the potential impact of DNA methylation on nucleosome stability to the best of our abilities through complementary assays and reported our observations. The effect of DNA methylation is smaller than the difference between H2A.Z and H2A, but we were able to see an effect. It is also not uncommon for small differences to have functional impacts in biological systems. We agree that further testing is required to determine whether this subtle effect is functionally important, and it remains the subject of future research due to the many technical challenges associated with addressing said question. We would like to note that 18 years have passed since Daniel Zilberman first reported the antagonistic relationship between H2AZ and DNA methylation (Zilberman et al., 2008) but very few studies have since directly tested specific mechanistic hypotheses. We believe that our study lays the groundwork for exciting future investigation that better elucidates the pathways that contribute to this antagonism and will have meaningful impacts on the field in general. However, thanks to the reviewer's criticism, we realized that we did not clearly state in the Abstract the relatively subtle effect of DNA methylation on the intrinsic H2A.Z nucleosome stability. Therefore, we will accordingly revise the Abstract to make this point clearer.
(2) The cryo-EM structures of methylated and unmethylated 601L H2A.Z nucleosomes show no detectable differences. As presented, this negative result adds little value. If anything, it reinforces the point that the positional context of CpG methylation is critical, which the manuscript does not consider.
We believe the inclusion and factual reporting of negative data is important for the scientific community as one of the major issues currently in biology research is biased omission of negative data. We considered eLife as a venue to publish this work for this reason. We understand that the reviewer believes our 601L structures may detract from the overall message of our manuscript. We believe this data rather emphasizes the importance of DNA sequence context, something that the reviewer also rightfully notes. It is standard practice in the nucleosome field to use the Widom 601 sequence, along with its variants. Our experience has shown that use of an artificially strong positioning sequence may mask weaker physical effects that could play a physiological role. Thus, we were careful to validate all further assays with multiple DNA sequences and believed it important to report these sequence-dependent effects on nucleosome structure.
(3) Very little H3 signal coincides with H2A.Z at TSSs in sperm pronuclei, yet this is neither explained nor discussed (Supplementary Figure 10D). The authors need to clarify this.
Our H3 signal, which represents the global nucleosome population, is more broadly distributed across the genome than H2A.Z, which is known to localize at specific genomic sites. Since both histone types were sequenced to similar read depths, H3 peaks are generally shallower than H2A.Z and peak heights cannot be directly compared (i.e. they should be represented in separate appropriate data ranges).
(4) In my view, the most conceptually important finding is that H2A.Z-associated reads in sperm pronuclei show ~43% CpG methylation. This directly contradicts the model of strict mutual exclusivity and suggests that the antagonism is context-dependent. Similarly, the finding that the depletion of SRCAP reduces H2A.Z deposition only on unmethylated templates is also very intriguing. Collectively, these result warrants further investigation (see below).
(5) Given that H2A.Z is located at diverse genomic elements (e.g., enhancers, repressed gene bodies, promoters), the manuscript requires a more rigorous genomic annotation comparing H2A.Z occupancy in sperm pronuclei versus XTC-2 cells. The authors should stratify H2A.Z-DNA methylation relationships across promoters, 5′UTRs, exons, gene bodies, enhancers, etc., as described in Supplementary Figure 10A.
(below is response to (4) and (5) together)
We agree that the substantial presence of co-localized H2A.Z and DNA methylation specifically in the sperm pronuclei samples and the changes in pattern between nuclear types are highly interesting and require further investigation. However, we faced technical challenges in our sequencing experiments that made us refrain from conducting a more detailed analysis for fear of over-interpreting potential artifacts. These challenges mainly stemmed from the difficulties in collecting enough material from Xenopus egg extracts and Tn5’s innate bias towards accessible regions of the genome. Because of this, open regions of the genome tend to be overrepresented in our data (as noted in our Discussion), making it challenging to rigorously compare methylation profiles and H2A.Z/H3 associated genomic elements.
While the degree of separation seems to be dependent on nuclei type, we still believe the antagonism exists in both the sperm pronuclei and XTC-2 samples when comparing H2A.Z methylation profiles to the corresponding H3 condition. Our study also demonstrates that H2A.Z is preferentially deposited to hypomethylated DNA in a manner dependent of SRCAP-C (the loss of SRCAP only reduces H2A.Z on unmethylated substrates) but an additional methylation-insensitive H2A.Z deposition mechanism also exists. We realized that this interesting point was not clearly highlighted in Abstract, so we will revise it accordingly.
(6) Although H2A.Z accumulates less efficiently on exogenous methylated substrates in egg extract, substantial deposition still occurs (~50%). This observation directly challenges the strong antagonistic model described in the manuscript, yet the authors do not acknowledge or discuss it. Moreover, differences between unmethylated and methylated 601 DNA raise further questions about the biological relevance of the cryo-EM 601 structures.
As depicted in Figure 6 and described in the Discussion, we clearly indicated that both methylation-sensitive and methylation-insensitive pathways exist to deposit H2A.Z within the genome. We also directly stated in our Discussion that a substantial proportion of H2A.Z colocalizes with DNA methylation both in our study as well as in previous reports, which is of major interest for future study. Additionally, we further discussed how the absence of transcription in Xenopus eggs is a likely reason for the more limited effect of DNA methylation restricting H2A.Z deposition in our egg extract system.
As noted in our response to (2), the lack of a clear impact on our 601L structures implies that this is due to the extraordinarily strong artificial nucleosome positioning capacity of the 601 sequence and its variants. Since 601 is heavily used in chromatin biology, including within DNA methylation research, such negative data are still useful to include and publish.
(7) The SRCAP depletion is insufficiently validated i.e., the antibody-mediated depletion of SRCAP lacks quantitative verification. A minimum of three biological replicates with quantification is required to substantiate the claims.
We are willing to address this concern. However, please note that our data showed that methylation-dependent H2A.Z deposition is almost completely erased upon SRCAP depletion, indicating functionally effective depletion. The specificity of the custom antibody against Xenopus SRCAP was verified by mass spectrometry. Additionally, we have obtained the same effect using another commercially available SRCAP antibody, though we did not include this preliminary result in our original manuscript. Due to its relatively low abundance and high molecular weight, SRCAP western blot signals are weak, making it challenging to quantify the degree of depletion. We also believe that the value of quantification in this context, with the points noted above, is rather limited. In the past, our lab has published papers on depleting the H3T3 kinase Haspin from Xenopus egg extracts (Ghenoiu et al., 2013; Kelly et al., 2010) but were never able to detect Haspin via western blot. This protein was only detected by mass spectrometry specifically on nucleosome array beads with H3K9me3 (Jenness et al., 2018). However, depletion of Haspin was readily monitored by erasure of H3T3ph, the enzymatic product of Haspin. In these experiments, it was impossible, and not critical, to quantitatively monitor the depletion of Haspin protein in order to investigate its molecular functions. Similarly, in this current study, the important fact is that depletion of SRCAP suppressed methylation-sensitive H2A.Z deposition and quantifying the degree of SRCAP depletion would not have a major impact on this conclusion.
(8) It appears that the role of p400-Tip60 has been completely overlooked. This complex is the second major H2A.Z deposition complex. Because p400 exhibits DNA methylation-insensitive binding (Supplementary Figure 14), it may account for the deposition of H2A.Z onto methylated DNA. This possibility is highly significant and must be addressed by repeating the key experiments in Figure 5 following p400-Tip60 depletion.
We are aware that the Tip60 complex is a very likely candidate for mediating DNA methylation-insensitive H2A.Z deposition, which is why we tested whether DNA binding of p400 is methylation sensitive. Therefore, the reviewer's statement that we "completely overlooked" Tip60-C’s role does not fairly report on our efforts. We wished to test the potential contribution of Tip60-C, but, unfortunately, the antibodies we currently have available to us were not successful in depleting the complex from egg extract. Since we had no direct experimental evidence indicating the role Tip60-C plays, we decided to take a conservative approach to our model and leave the methylation-insensitive pathway as mediated by something still unidentified. While further investigating Tip60-C’s contribution to this pathway is of definite value, we do not believe that it impacts our major conclusion that SRCAP-C is the main mediator responsible for H2A.Z deposition on unmethylated DNA and thus remains a subject for future study.
(9) The manuscript repeatedly states that H2A.Z nucleosomes are intrinsically unstable; however, this is an oversimplification. Although some DNA unwrapping is observed, multiple studies show that H3/H4 tetramer-H2A.Z/H2B interactions are more stable (important recent studies include the following: DOI: 10.1038/s41594-021-00589-3; 10.1038/s41467-021-22688-x; and reviewed in 10.1038/s41576-024-00759-1).
We understand that the H2A.Z stability field is highly controversial. We have introduced the many conflicting reports that have been published in the field but can further expand on the controversies if desired. We also understand that the term “nucleosome stability” is broad and encompasses many physical aspects. As noted in a prior response, we will better specify our use of the term within the manuscript. In our assays, we are most focused on the DNA wrapping stability of the nucleosome and have consistently seen in our hands that H2A.Z nucleosomes are much more open and accessible compared to canonical H2A on satellite II-derived sequences, regardless of methylation status. However, we do understand that many groups have observed the opposite findings while others have obtained results similar to us. We reported on our findings of the general H2A.Z stability with the hopes to help clarify some of the field’s controversies.
In summary, the current manuscript does not present a convincing mechanistic explanation for the antagonism between DNA methylation and H2A.Z. The observation that H2A.Z can substantially coexist with DNA methylation in sperm pronuclei, perhaps, should be the conceptual focus.
We appreciate this reviewer’s advice. However, please note that the first author who led this project has already successfully defended their PhD thesis primarily based on this project, making it impractical and unrealistic to completely change the focus of this manuscript to include an entirely new avenue of research. We believe that our data provide important insights into the mechanisms by which H2A.Z is excluded from methylated DNA, particularly via the DNA methylation-sensitive binding of SRCAP-C, which has never been described before. We agree that many questions are still left unanswered, including the exact molecular mechanism behind how DNA methylation prevents SRCAP-C binding. We have preliminary data that suggest none of the known DNA-binding modules of SRCAP-C, including ZNHIT1, by themselves can explain this sensitivity. This implies that domain dissection in the context of the holo-SRCAP complex is required to fully address this question. We believe this represents a very exciting future avenue of study; however, it does not negate our finding that SRCAP-C itself is important for maintaining the DNA methylation/H2A.Z antagonism. Therefore, we respectfully disagree with this reviewer's summary statement, which misleadingly undermines the impact of our work.
Reviewer #3 (Public review):
Summary:
Histone variant H2A.Z is evolutionarily conserved among various species. The selective incorporation and removal of histone variants on the genome play crucial roles in regulating nuclear events, including transcription. Shih et al. aimed to address antagonistic mechanisms between histone variant H2A.Z deposition and DNA methylation. To this end, the authors reconstituted H2A.Z nucleosomes in vitro using methylated or unmethylated human satellite II DNA sequence and examined how DNA methylation affects H2A.Z nucleosome structure and dynamics. The cryo-EM analysis revealed that DNA methylation induces a more open conformation in H2A.Z nucleosomes. Consistent with this, their biochemical assays showed that DNA methylation subtly increases restriction enzyme accessibility in H2A.Z nucleosomes compared with canonical H2A nucleosomes. The authors identified genome-wide profiles of H2A.Z and DNA methylation using genomic assays and found their unique distribution between Xenopus sperm pronuclei and fibroblast cells. Using Xenopus egg extract systems, the authors showed SRCAP complex, the chromatin remodelers for H2A.Z deposition, preferentially deposit H2A.Z on unmethylated DNA.
Strengths:
The study is solid, and most conclusions are well-supported. The experiments are rigorously performed, and interpretations are clear. The study presents a high-resolution cryo-EM structure of human H2A.Z nucleosome with methylated DNA. The discovery that the SRCAP complex senses DNA methylation is novel and provides important mechanistic insight into the antagonism between H2A.Z and DNA methylation.
We are grateful that this reviewer recognizes the importance of our study.
Weaknesses:
The study is already strong, and most conclusions are well supported. However, it can be further strengthened in several ways.
(1) It is difficult to interpret how DNA methylation alters the orientation of the H4 tail and leads to the additional density on the acidic patch. The data do not convincingly support whether DNA methylation enhances interactions with H2A.Z mono-nucleosomes, nor whether this effect is specific to methylated H2A.Z nucleosomes.
The altered H4 tail orientation and extra density seen on the acidic patch were incidental findings that we thought could be interesting for the field to be aware of but decided not to follow up on as there were other structural differences that were more directly related to our central question. We do believe that the above two differences are linked to each other because we used a highly purified and homogenous sample for cryo-EM analysis and the H4 tail/acidic patch interaction is a well characterized contact that mediates inter-nucleosome interactions. Additionally, other groups have reported that the presence of DNA methylation causes condensation of both chromatin and bare DNA (cited within our manuscript), though the mechanics behind this phenomenon remain to be elucidated. We believed that our structure data may also align with those findings. However, the reviewer is fair in pointing out that we do not provide further experimental evidence in verifying the existence of these increased interactions. We can revise our writing to clarify that these points are currently hypotheses rather than validated results.
(2) It remains unclear whether DNA methylation alters global H2A.Z nucleosome stability or primarily affects local DNA end flexibility. Moreover, while the authors showed locus-specific accessibility by HinfI digestion, an unbiased assay such as MNase digestion would strengthen the conclusions.
We would like to thank the reviewer for bringing up these issues. Although our current data cannot explicitly clarify these possibilities, we favor an idea that DNA methylation specifically alters histone to DNA contacts and that this effect is felt globally across the entire nucleosome rather than only at specific locations. The intrinsic flexibility of linker DNA ends means that that region tends to exhibit the greatest differences under different physical influences, hence the focus on characterizing that area; flexibility of a thread on a spool is most pronounced at the ends. However, we also found that the DNA backbone of H2A.Z on methylated DNA had a lower local resolution compared to its unmethylated counterpart, despite that structure having a higher global resolution, which suggested to us that DNA positioning along the nucleosome is overall weaker under the presence of DNA methylation. This is corroborated by the increased population of open/shifted structures in our classification analysis. The reviewer raises a fair point about the use of a specific restriction enzyme versus MNase. We agree that our accessibility assay is highly influenced by the position of the restriction site and have previously seen that moving the cut site too close to the linker DNA end will abolish any DNA methylation-dependent differences. We did initially attempt an MNase digestion-based assay, but the data were not as reproducible as with the use of a specific restriction enzyme. We do not know the reason behind this irreproducibility though we believe that the processivity of MNase could make it difficult to capture subtle effects like those induced by DNA methylation on already highly accessible H2A.Z nucleosomes. Overall, while we believe that DNA methylation does exert a physical effect, its subtlety may explain the many contradictory studies present within the DNA methylation and nucleosome stability field.
References
Berta, D.G., H. Kuisma, N. Valimaki, M. Raisanen, M. Jantti, A. Pasanen, A. Karhu, J. Kaukomaa, A. Taira, T. Cajuso, S. Nieminen, R.M. Penttinen, S. Ahonen, R. Lehtonen, M. Mehine, P. Vahteristo, J. Jalkanen, B. Sahu, J. Ravantti, N. Makinen, K. Rajamaki, K. Palin, J. Taipale, O. Heikinheimo, R. Butzow, E. Kaasinen, and L.A. Aaltonen. 2021. Deficient H2A.Z deposition is associated with genesis of uterine leiomyoma. Nature. 596:398–403.
Capurso, D., H. Xiong, and M.R. Segal. 2012. A histone arginine methylation localizes to nucleosomes in satellite II and III DNA sequences in the human genome. BMC Genomics. 13:630.
Chodavarapu, R.K., S. Feng, Y.V. Bernatavichute, P.Y. Chen, H. Stroud, Y. Yu, J.A. Hetzel, F. Kuo, J. Kim, S.J. Cokus, D. Casero, M. Bernal, P. Huijser, A.T. Clark, U. Kramer, S.S. Merchant, X. Zhang, S.E. Jacobsen, and M. Pellegrini. 2010. Relationship between nucleosome positioning and DNA methylation. Nature. 466:388–392.
Choy, J.S., S. Wei, J.Y. Lee, S. Tan, S. Chu, and T.H. Lee. 2010. DNA methylation increases nucleosome compaction and rigidity. J Am Chem Soc. 132:1782–1783.
Chua, E.Y., D. Vasudevan, G.E. Davey, B. Wu, and C.A. Davey. 2012. The mechanics behind DNA sequence-dependent properties of the nucleosome. Nucleic Acids Res. 40:6338–6352.
Collings, C.K., P.J. Waddell, and J.N. Anderson. 2013. Effects of DNA methylation on nucleosome stability. Nucleic Acids Res. 41:2918–2931.
Davey, C., S. Pennings, and J. Allan. 1997. CpG methylation remodels chromatin structure in vitro. J Mol Biol. 267:276–288.
Davey, C.S., S. Pennings, C. Reilly, R.R. Meehan, and J. Allan. 2004. A determining influence for CpG dinucleotides on nucleosome positioning in vitro. Nucleic Acids Res. 32:4322–4331.
Funabiki, H., I.E. Wassing, Q. Jia, J.D. Luo, and T. Carroll. 2023. Coevolution of the CDCA7-HELLS ICF-related nucleosome remodeling complex and DNA methyltransferases. Elife. 12.
Ghenoiu, C., M.S. Wheelock, and H. Funabiki. 2013. Autoinhibition and polo-dependent multisite phosphorylation restrict activity of the histone h3 kinase haspin to mitosis. Mol Cell. 52:734–745.
Jenness, C., S. Giunta, M.M. Muller, H. Kimura, T.W. Muir, and H. Funabiki. 2018. HELLS and CDCA7 comprise a bipartite nucleosome remodeling complex defective in ICF syndrome. Proc Natl Acad Sci U S A. 115:E876–E885.
Jimenez-Useche, I., J. Ke, Y. Tian, D. Shim, S.C. Howell, X. Qiu, and C. Yuan. 2013. DNA methylation regulated nucleosome dynamics. Sci Rep. 3:2121.
Jimenez-Useche, I., D. Shim, J. Yu, and C. Yuan. 2014. Unmethylated and methylated CpG dinucleotides distinctively regulate the physical properties of DNA. Biopolymers. 101:517–524.
Kelly, A.E., C. Ghenoiu, J.Z. Xue, C. Zierhut, H. Kimura, and H. Funabiki. 2010. Survivin reads phosphorylated histone H3 threonine 3 to activate the mitotic kinase Aurora B. Science. 330:235–239.
Li, S., Y. Peng, D. Landsman, and A.R. Panchenko. 2022. DNA methylation cues in nucleosome geometry, stability and unwrapping. Nucleic Acids Res. 50:1864–1874.
Minary, P., and M. Levitt. 2014. Training-free atomistic prediction of nucleosome occupancy. Proc Natl Acad Sci U S A. 111:6293–6298.
Ngo, T.T., J. Yoo, Q. Dai, Q. Zhang, C. He, A. Aksimentiev, and T. Ha. 2016. Effects of cytosine modifications on DNA flexibility and nucleosome mechanical stability. Nat Commun. 7:10813.
Nishiyama, A., L. Yamaguchi, J. Sharif, Y. Johmura, T. Kawamura, K. Nakanishi, S. Shimamura, K. Arita, T. Kodama, F. Ishikawa, H. Koseki, and M. Nakanishi. 2013. Uhrf1-dependent H3K23 ubiquitylation couples maintenance DNA methylation and replication. Nature. 502:249–253.
Osakabe, A., F. Adachi, Y. Arimura, K. Maehara, Y. Ohkawa, and H. Kurumizaka. 2015. Influence of DNA methylation on positioning and DNA flexibility of nucleosomes with pericentric satellite DNA. Open Biol. 5.
Perez, A., C.L. Castellazzi, F. Battistini, K. Collinet, O. Flores, O. Deniz, M.L. Ruiz, D. Torrents, R. Eritja, M. Soler-Lopez, and M. Orozco. 2012. Impact of methylation on the physical properties of DNA. Biophys J. 102:2140–2148.
Segal, E., Y. Fondufe-Mittendorf, L. Chen, A. Thastrom, Y. Field, I.K. Moore, J.P. Wang, and J. Widom. 2006. A genomic code for nucleosome positioning. Nature. 442:772–778.
Wassing, I.E., A. Nishiyama, R. Shikimachi, Q. Jia, A. Kikuchi, M. Hiruta, K. Sugimura, X. Hong, Y. Chiba, J. Peng, C. Jenness, M. Nakanishi, L. Zhao, K. Arita, and H. Funabiki. 2024. CDCA7 is an evolutionarily conserved hemimethylated DNA sensor in eukaryotes. Sci Adv. 10:eadp5753.
Zilberman, D., D. Coleman-Derr, T. Ballinger, and S. Henikoff. 2008. Histone H2A.Z and DNA methylation are mutually antagonistic chromatin marks. Nature. 456:125–129.
eLife Assessment
This study uses a valuable combination of functional magnetic resonance imaging and electroencephalography (EEG) to study brain activity related to prediction errors in relation to both sensorimotor and more complex cognitive functions. It provides incomplete evidence to suggest that prediction error minimisation drives brain activity across both types of processing and that elevated inter-regional functional coupling along a superior-inferior axis is associated with high prediction error, whereas coupling along a posterior-anterior axis is associated with low prediction error. The manuscript will be of interest to neuroscientists working on predictive coding and decision-making, but would benefit from more precise localisation of EEG sources and more rigorous statistical controls.
Reviewer #1 (Public review):
Summary:
This study investigates whether prediction error extends beyond lower-order sensory-motor processes to include higher-order cognitive functions. Evidence is drawn from both task-based and resting-state fMRI, with addition of resting-state EEG-fMRI to examine power spectral correlates. The results partially support the existence of dissociable connectivity patterns: stronger ventral-dorsal connectivity is associated with high prediction error, while posterior-anterior connectivity is linked to low prediction error. Furthermore, spontaneous switching between these connectivity patterns was observed at rest and correlated with subtle intersubject behavioral variability.
Strengths:
Studying prediction error from the lens of network connectivity provides new insights into predictive coding frameworks. The combination of various independent datasets to tackle the question adds strength, including two well-powered fMRI task datasets, resting-state fMRI interpreted in relation to behavioral measures, as well as EEG-fMRI.
Minor Weakness:
The lack of spatial specificity of sensor-level EEG somewhat limits the inferences that can be obtained in terms of how the fMRI network processes and the EEG power fluctuations relate to each other.<br /> While the language no longer suggests a strong overlap of the source of the two signals, several scenarios remain open (e.g., the higher-order fMRI networks being the source of the EEG oscillations, or the networks controlling the EEG oscillations expressed in lower-order cortices, or a third process driving both the observations in fMRI networks and EEG oscillations...) and somewhat weaken interpretability of this section.
Comments on revisions:
My prior recommendations have been mostly addressed.
Questions remaining about the NBS results:
The authors write about the NBS cluster: "Visual examination of the cluster roughly points to the same four posterior-anterior and ventral-dorsal modules identified formally in main-text ". I think it might be good to add quantification, not just visual inspection. The size of the significant NBS cluster should be reported. What proportion of the edges that passed uncorrected threshold and entered NBS were part of the NBS cluster? Put simply, I don't think any edges beyond those passing NBS-based correction should be interpreted or used downstream in the manuscript.
Also, NBS is not typically used by collapsing over effects in two effect directions, but the authors use NBS on the absolute value of Z. I understand the logic of the general manuscript focusing on strength rather than direction, but here I am wondering about the methodological validity. I believe that the editor who is an expert on the methodology may be able to comment on the validity of this approach (as opposed to running two separate NBS analyses for the two directions of effect).
Reviewer #2 (Public review):
Summary:
This paper investigates putative networks associated with prediction errors in task-based and resting state fMRI. It attempts to test the idea that prediction errors minimisation includes abstract cognitive functions, referred to as global prediction error hypothesis, by establishing a parallel between networks found in task-based fMRI where prediction errors are elicited in a controlled manner and those networks that emerge during "resting state".
Strengths:
Clearly a lot of work and data went into this paper, including 2 task-based fMRI experiments and the resting state data for the same participants, as well as a third EEG-fMRI dataset. Overall well written with a couple of exceptions on clarity as per below and the methodology appears overall sound, with a couple of exceptions listed below that require further justification. It does a good job of acknowledging its own weakness.
Weaknesses:
The paper does a good job of acknowledging its greatest weakness, the fact that it relies heavily on reverse inference, but cannot quite resolve it. As the authors put, "finding the same networks during a prediction error task and during rest does not mean that the networks engagement during rest reflect prediction error processing". Again, the authors acknowledge the speculative nature of their claims in the discussion, but given that this is the key claim and essence of the paper, it is hard to see how the evidence is compelling to support that claim.
Given how uncontrolled cognition is during "resting-state" experiments, the parallel made with prediction errors elicited during a task designed to that effect is a little difficult to make. How often are people really surprised when their brains are "at rest", likely replaying a previously experienced event or planning future actions under their control? It seems to be more likely a very low prediction error scenario, if at all surprising.
The quantitative comparison between networks under task and rest was done on a small subset of the ROIs rather than on the full network - why? Noting how small the correlation between task and rest is (r=0.021) and that's only for part of the networks, the evidence is a little tenuous. Running the analysis for the full networks could strengthen the argument.
Looking at the results in Figure 2C, the four-quadrant description of the networks labelled for low and high PE appears a little simplistic. The authors state that this four-quadrant description omits some ROIs as motivated by prior knowledge. This would benefit from a more comprehensive justification. Which ROIs are excluded and what is the evidence for exclusion?
The EEG-fMRI analysis claiming 3-6Hz fluctuations for PE is hard to reconcile with the fact that fMRI captures activity that is a lot slower while some PEs are as fast as 150 ms. The discussion acknowledges this but doesn't seem to resolve it - would benefit from a more comprehensive argument.
Comments on revisions:
The authors have done a good job of addressing the issues raised during the review process. There is one issue remaining that still required attention. In R2.4. when referring to "existing knowledge of prominent structural pathways among these quadrants" please cite the relevant literature.
Reviewer #3 (Public review):
Summary:
Bogdan et al. present an intriguing investigation into the spontaneous dynamics of prediction error (PE)-related brain states. Using two independent fMRI tasks designed to elicit prediction and prediction error in separate participant samples, alongside both fMRI and EEG data, the authors identify convergent brain network patterns associated with high versus low PE. Notably, they further show that similar patterns can be detected during resting-state fMRI, suggesting that PE-related neural states may recur outside of explicit task demands.
Strengths:
The authors use a well-integrated analytic framework that combines multiple prediction tasks and brain imaging modalities. The inclusion of several datasets probing PE under different contexts strengthens the claim of generalizability across tasks and samples. The open sharing of code and data is commendable and will be valuable for future work seeking to build on this framework.
Weaknesses:
A central challenge of the manuscript lies in interpreting the functional significance of PE-related brain network states during rest. Demonstrating that a task-defined cognitive state recurs spontaneously is intriguing, but without clear links to behavior, individual traits, or experiential content during rest, it remains difficult to interpret what such spontaneous brain states tell us about the mind and brain. For example, it is unclear whether these states support future inference or learning, reflect offline predictive processing, or instead suggest state reinstatement due to a more general form of neural plasticity and circuit dynamics in the brain. Demonstrating any one of these downstream relationships would be valuable since it has the potential to inform our understanding of cognitive function or more general principles of neural organization.
I appreciate the authors' position that establishing the existence of such states is a necessary first step, and that future work may clarify their behavioral relevance. However, the current form makes it challenging to assess the conceptual advance of the present work in isolation.
Relatedly, in my previous review I raised questions about both across- and within-individual variability-for example, whether individuals who exhibit stronger or more distinct PE-related fluctuations at rest also show superior performance on prediction-related tasks (across-individual), or whether momentary increases in PE-network expression during tasks relate to faster or more accurate prediction (within-individual). The authors thoughtfully addressed this suggestion by conducting an individual-differences analysis correlating each participant's fluctuation amplitude with approximately 200 behavioral and trait measures from the HCP dataset.
The reported findings-a negative association with age and card-sorting performance, alongside a positive association with age-adjusted picture sequence memory-are interesting but difficult to interpret within a coherent functional framework. As presented, these results do not clearly support the idea that spontaneous PE-state fluctuations are related to enhancement in prediction, inference, or broader cognitive function. Instead, they raise the possibility that fluctuation amplitude may reflect more general factors (e.g., age) rather than a functionally meaningful PE-related process.
Overall, while the methodological contribution is strong, the manuscript would benefit from a clearer articulation of what functional conclusions can or cannot be drawn from the presence of spontaneous PE-related states, as well as a more cautious framing of their potential cognitive significance.
Further comments:
I appreciate that the authors took my earlier suggestions seriously and incorporated additional analyses examining behavioral relevance and permutation tests in the revision.
Author response:
The following is the authors’ response to the original reviews.
Public Reviews:
Reviewer #1 (Public review):
The Reviewer structured their review such that their first two recommendations specifically concerned the two major weaknesses they viewed in the initial submission. For clarity and concision, we have copied their recommendations to be placed immediately following their corresponding points on weaknesses.
Strengths:
Studying prediction error from the lens of network connectivity provides new insights into predictive coding frameworks. The combination of various independent datasets to tackle the question adds strength, including two well-powered fMRI task datasets, resting-state fMRI interpreted in relation to behavioral measures, as well as EEG-fMRI.
Weaknesses:
Major:
(R1.1) Lack of multiple comparisons correction for edge-wise contrast:
The analysis of connectivity differences across three levels of prediction error was conducted separately for approximately 22,000 edges (derived from 210 regions), yet no correction for multiple comparisons appears to have been applied. Then, modularity was applied to the top 5% of these edges. I do not believe that this approach is viable without correction. It does not help that a completely separate approach using SVMs was FDR-corrected for 210 regions.
[Later recommendation] Regarding the first major point: To address the issue of multiple comparisons in the edge-wise connectivity analysis, I recommend using the Network-Based Statistic (NBS; Zalesky et al., 2010). NBS is well-suited for identifying clusters (analogous to modules) of edges that show statistically significant differences across the three prediction error levels, while appropriately correcting for multiple comparisons.
Thank you for bringing this up. We acknowledge that our modularity analysis does not evaluate statistical significance. Originally, the modularity analysis was meant to provide a connectome-wide summary of the connectivity effects, whereas the classification-based analysis was meant to address the need for statistical significance testing. However, as the reviewer points out, it would be better if significance were tested in a manner more analogous to the reported modules. As they suggest, we updated the Supplemental Materials (SM) to include the results of Network-Based Statistic analysis (SM p. 1-2):
“(2.1) Network-Based Statistic
Here, we evaluate whether PE significantly impacts connectivity at the network level using the Network-Based Statistic (NBS) approach.[1] NBS relied on the same regression data generated for the main-text analysis, whereby a regression is performed examining the effect of PE (Low = –1, Medium = 0, High = +1) on connectivity for each edge. This was done across the connectome, and for each edge, a z-score was computed. For NBS, we thresholded edges to |Z| > 3.0, which yielded one large network cluster, shown in Figure S3. The size of the cluster – i.e., number of edges – was significant (p < .05) per a permutation-test using 1,000 random shuffles of the condition data for each participant, as is standard.[1] These results demonstrate that the networklevel effects of PE on connectivity are significant. The main-text modularity analysis converts this large cluster into four modules, which are more interpretable and open the door to further analyses”.
We updated the Results to mention these findings before describing the modularity analysis (p. 8-9):
“After demonstrating that PE significantly influences brain-wide connectivity using Network-Based Statistic analysis (Supplemental Materials 2.1), we conducted a modularity analysis to study how specific groups of edges are all sensitive to high/low-PE information.”
(R1.2) Lack of spatial information in EEG:
The EEG data were not source-localized, and no connectivity analysis was performed. Instead, power fluctuations were averaged across a predefined set of electrodes based on a single prior study (reference 27), as well as across a broader set of electrodes. While the study correlates these EEG power fluctuations with fMRI network connectivity over time, such temporal correlations do not establish that the EEG oscillations originate from the corresponding network regions. For instance, the observed fronto-central theta power increases could plausibly originate from the dorsal anterior cingulate cortex (dACC), as consistently reported in the literature, rather than from a distributed network. The spatially agnostic nature of the EEG-fMRI correlation approach used here does not support interpretations tied to specific dorsal-ventral or anterior-posterior networks. Nonetheless, such interpretations are made throughout the manuscript, which overextends the conclusions that can be drawn from the data.
[Later recommendation] Regarding the second major point: I suggest either adopting a source-localized EEG approach to assess electrophysiological connectivity or revising all related sections to avoid implying spatial specificity or direct correspondence with fMRI-derived networks. The current approach, which relies on electrode-level power fluctuations, does not support claims about the spatial origin of EEG signals or their alignment with specific connectivity networks.
We thank the reviewer for this important point, which allows us to clarify the specific and distinct contributions of each imaging modality in our study. Our primary goal for Study 3 was to leverage the high temporal resolution of EEG to identify the characteristic frequency at which the fMRI-defined global connectivity states fluctuate. The study was not designed to infer the spatial origin of these EEG signals, a task for which fMRI is better suited and which we addressed in Studies 1 and 2.
As the reviewer points out, fronto-central theta is generally associated with the dACC. We agree with this point entirely. We suspect that there is some process linking dACC activation to the identified network fluctuations – some type of relationship that does not manifest in our dynamic functional connectivity analyses – although this is only a hypothesis and one that is beyond the present scope.
We updated the Discussion to mention these points and acknowledge the ambiguity regarding the correlation between network fluctuation amplitude (fMRI) and Delta/Theta power (EEG) (p. 24):
“We specifically interpret the fMRI-EEG correlation as reflecting fluctuation speed because we correlated EEG oscillatory power with the fluctuation amplitude computed from fMRI data. Simply correlating EEG power with the average connectivity or the signed difference between posterior-anterior and ventral-dorsal connectivity yields null results (Supplemental Materials 6), suggesting that this is a very particular association, and viewing it as capturing fluctuation amplitude provides a parsimonious explanation. Yet, this correlation may be interpreted in other ways. For example, resting-state Theta is also a signature of drowsiness,[2] which may correlate with PE processing, but perhaps should be understood as some other mechanism. Additionally, Theta is widely seen as a sign of dorsal anterior cingulate cortex activity,3 and it is unclear how to reconcile this with our claims about network fluctuations. Nonetheless, as we show with simulations (Supplemental Materials 5), a correlation between slow fMRI network fluctuations and fast EEG Delta/Theta oscillations is also consistent with a common global neural process oscillating rapidly and eliciting both measures.”
Regarding source-localization, several papers have described known limitations of this strategy for drawing precise anatomical inferences,[4–6] and this seems unnecessary given that our fMRI analyses already provide more robust anatomical precision. We intentionally used EEG in our study for what it measures most robustly: millisecond-level temporal dynamics.
(R1.2a)Examples of problematic language include:
Line 134: "detection of network oscillations at fast speeds" - the current EEG approach does not measure networks.
This is an important issue. We acknowledge that our EEG approach does not directly measure fMRI-defined networks. Our claim is inferential, designed to estimate the temporal dynamics of the large-scale fMRI patterns we identified. The correlation between our fMRI-derived fluctuation amplitude (|PA – VD|) and 3-6 Hz EEG power provides suggestive evidence that the transitions between these network states occur at this frequency, rather than being a direct measurement of network oscillations.
To support the validity of this inference, we performed two key analyses (now in Supplemental Materials). First, a simulation study provides a proof-of-concept, confirming our method can recover the frequency of a fast underlying oscillator from slow fMRI and fast EEG data. Second, a specificity analysis shows the EEG correlation is unique to our measure of fluctuation amplitude and not to simpler measures like overall connectivity strength. These analyses demonstrate that our interpretation is more plausible than alternative explanations.
Overall, we have revised the manuscript to be more conservative in the language employed, such as presenting alternative explanations to the interpretations put forth based on correlative/observational evidence (e.g., our modifications above described in our response to comment R1.2). In addition, we have made changes throughout the report to state the issues related to reverse inference more explicitly and to better communicate that the evidence is suggestive – please see our numerous changes described in our response to comment R3.1. For the statement that the reviewer specifically mentioned here, we revised it to be more cautious (p. 7):
“Although such speed outpaces the temporal resolution of fMRI, correlating fluctuations in dynamic connectivity measured from fMRI data with EEG oscillations can provide an estimate of the fluctuations’ speed. This interpretation of a correlation again runs up against issues related to reverse inference but would nonetheless serve as initial suggestive evidence that spontaneous transitions between network states occur rapidly.”
(R1.2b) Line 148: "whether fluctuations between high- and low-PE networks occur sufficiently fast" - this implies spatial localization to networks that is not supported by the EEG analysis.
Building on our changes described in our immediately prior response, we adjusted our text here to say our analyses searched for evidence consistent with the idea that the network fluctuations occur quickly rather than searching for decisive evidence favoring this idea (p. 7-8):
“Finally, we examined rs-fMRI-EEG data to assess whether we find parallels consistent with the high/low-PE network fluctuations occurring at fast timescales suitable for the type of cognitive operations typically targeted by PE theories.”
(R1.2c) Line 480: "how underlying neural oscillators can produce BOLD and EEG measurements" - no evidence is provided that the same neural sources underlie both modalities.
As described above, these claims are based on the simulation study demonstrating that this is a possibility, and we have revised the manuscript overall to be clearer that this is our interpretation while providing alternative explanations.
Reviewer #2 (Public review):
Strengths:
Clearly, a lot of work and data went into this paper, including 2 task-based fMRI experiments and the resting state data for the same participants, as well as a third EEG-fMRI dataset. Overall, well written with a couple of exceptions on clarity, as per below, and the methodology appears overall sound, with a couple of exceptions listed below that require further justification. It does a good job of acknowledging its own weakness.
Weaknesses:
(R2.1) The paper does a good job of acknowledging its greatest weakness, the fact that it relies heavily on reverse inference, but cannot quite resolve it. As the authors put it, "finding the same networks during a prediction error task and during rest does not mean that the networks' engagement during rest reflects prediction error processing". Again, the authors acknowledge the speculative nature of their claims in the discussion, but given that this is the key claim and essence of the paper, it is hard to see how the evidence is compelling to support that claim.
We thank the reviewer for this comment. We agree that reverse inference is a fundamental challenge and that our central claim requires a particularly high bar of evidence. While no single analysis resolves this issue, our goal was to build a cumulative case that is compelling by converging on the same conclusion from multiple, independent lines of evidence.
For our investigation, we initially established a task-general signature of prediction error (PE). By showing the same neural pattern represents PE in different contexts, we constrain the reverse inference, making it less likely that our findings are a task-specific artifact and more likely that they reflect the core, underlying process of PE. Building on this, our most compelling evidence comes from linking task and rest at the individual level. We didn't just find the same general network at rest; we showed that an individual’s unique anatomical pattern of PE-related connectivity during the task specifically predicts their own brain's fluctuation patterns at rest. This highly specific, person-by-person correspondence provides a direct bridge between an individual's task-evoked PE processing and their intrinsic, resting-state dynamics. Furthermore, these resting-state fluctuations correlate specifically with the 3-6 Hz theta rhythm—a well-established neural marker for PE.
While reverse inference remains a fundamental limitation for many studies on resting-state cognition, the aspects mentioned above, we believe, provide suggestive evidence, favoring our PE interpretation. Nonetheless, we have made changes throughout the manuscript to be more conservative in the language we use to describe our results, to make it clear what claims are based on correlative/observational evidence, and to put forth alternative explanations for the identified effects. Please find our numerous changes detailed in our response to comment R3.1.
(R2.2) Given how uncontrolled cognition is during "resting-state" experiments, the parallel made with prediction errors elicited during a task designed for that effect is a little difficult to make. How often are people really surprised when their brains are "at rest", likely replaying a previously experienced event or planning future actions under their control? It seems to be more likely a very low prediction error scenario, if at all surprising.
We (and some others) take a broad interpretation of PE and believe it is often more intuitive to think about PE minimization in terms of uncertainty rather than “surprise”; the word “surprise” usually implies a sudden emotive reaction from the violation of expectations, which is not useful here.
When planning future actions, each step of the plan is spurred by the uncertainty of what is the appropriate action given the scenario set up by prior steps. Each planned step erases some of that uncertainty. For example, you may be mentally simulating a conversation, what you will say, and what another person will say. Each step of this creates uncertainty of “what is the appropriate response?” Each reasoning step addresses contingencies. While planning, you may also uncover more obvious forms of uncertainty, sparking memory retrieval to finish it. A resting-state participant may think to cook a frozen pizza when they arrive home, but be uncertain about whether they have any frozen pizzas left, prompting episodic memory retrieval to address this uncertainty. We argue that every planning step or memory retrieval can be productively understood as being sparked by uncertainty/surprise (PE), and the subsequent cognitive response minimizes this uncertainty.
We updated the Introduction to include a paragraph near the start providing this explanation (p. 3-4):
“PE minimization may broadly coordinate brain functions of all sorts, including abstract cognitive functions. This includes the types of cognitive processes at play even in the absence of stimuli (e.g., while daydreaming). While it may seem counterintuitive to associate this type of cognition with PE – a concept often tied to external surprises – it has been proposed that the brain's internal generative model is continuously active.[12–14] Spontaneous thought, such as planning a future event or replaying a memory, is not a passive, low-PE process. Rather, it can be seen as a dynamic cycle of generating and resolving internal uncertainty. While daydreaming, you may be reminded of a past conversation, where you wish you had said something different. This situation contains uncertainty about what would have been the best thing to say. Wondering about what you wish you said can be viewed as resolving this uncertainty, in principle, forming a plan if the same situation ever arises again in the future. Each iteration of the simulated conversation repeatedly sparks and then resolves this type of uncertainty.”
(R2.3)The quantitative comparison between networks under task and rest was done on a small subset of the ROIs rather than on the full network - why? Noting how small the correlation between task and rest is (r=0.021) and that's only for part of the networks, the evidence is a little tenuous. Running the analysis for the full networks could strengthen the argument.
We thank the reviewer for this opportunity to clarify our method. A single correlation between the full, aggregated networks would be conceptually misaligned with what we aimed to assess. To test for a personspecific anatomical correspondence, it is necessary to examine the link between task and rest at a granular level. We therefore asked whether the specific parts of an individual's network most responsive to PE during the task are the same parts that show the strongest fluctuations at rest. Our analysis, performed iteratively across all 3,432 possible ROI subsets, was designed specifically to answer this question, which would be obscured by an aggregated network measure.
We appreciate the reviewer's concern about the modest effect size (r = .021). However, this must be contextualized, as the short task scan has very low reliability (.08), which imposes a severe statistical ceiling on any possible task-rest correlation. Finding a highly significant effect (p < .001) in the face of such noisy data, therefore, provides robust evidence for a genuine task-rest correspondence.
We updated the Discussion to discuss this point (p. 22-23):
“A key finding supporting our interpretation is the significant link between individual differences in task-evoked PE responses and resting-state fluctuations. One might initially view the effect size of this correspondence (r = .021) as modest. However, this interpretation must be contextualized by the considerable measurement noise inherent in short task-fMRI scans; the split-half reliability of the task contrast was only .08. This low reliability imposes a severe statistical ceiling on any possible task-rest correlation. Therefore, detecting a highly significant (p < .001) relationship despite this constraint provides robust evidence for a genuine link. Furthermore, our analytical approach, which iteratively examined thousands of ROI subsets rather than one aggregated network, was intentionally granular. The goal was not simply to correlate two global measures, but to test for a personspecific anatomical correspondence – that is, whether the specific parts of an individual's network most sensitive to PE during the task are the same parts that fluctuate most strongly at rest. An aggregate analysis would obscure this critical spatial specificity. Taken together, this granular analysis provides compelling evidence for an anatomically consistent fingerprint of PE processing that bridges task-evoked activity and spontaneous restingstate dynamics, strengthening our central claim.”
(R2.4) Looking at the results in Figure 2C, the four-quadrant description of the networks labelled for low and high PE appears a little simplistic. The authors state that this four-quadrant description omits some ROIs as motivated by prior knowledge. This would benefit from a more comprehensive justification.Which ROIs are excluded, and what is the evidence for exclusion?
Our four-quadrant model is a principled simplification designed to distill the dominant, large-scale connectivity patterns from the complex modularity results. This approach focuses on coherent, well-documented anatomical streams while setting aside a few anatomically distant and disjoint ROIs that were less central to the main modules. This heuristic additionally unlocks more robust and novel analyses.
The two low-PE posterior-anterior (PA) pathways are grounded in canonical processing streams. (i) The OCATL connection mirrors the ventral visual stream (the “what” pathway), which is fundamental for object recognition and is upregulated during the smooth processing of expected stimuli. (ii) The IPL-LPFC connection represents a core axis of the dorsal attention stream and the Fronto-Parietal Control Network (FPCN), reflecting the maintenance of top-down cognitive control when information is predictable; the IPL-LPFC module excludes ROIs in the middle temporal gyrus, which are often associated with the FPCN but are not covered here.
In contrast, the two high-PE ventral-dorsal (VD) pathways reflect processes for resolving surprise and conflict. (i) The OC-IPL connection is a classic signature of attentional reorienting, where unexpected sensory input (high PE) triggers a necessary shift in attention; the OC-IPL module excludes some ROIs that are anterior to the occipital lobe and enter the fusiform gyrus and inferior temporal lobe. (ii) The ATL-LPFC connection aligns with mechanisms for semantic re-evaluation, engaging prefrontal control regions to update a mental model in the face of incongruent information.
Beyond its functional/anatomical grounding, this simplification provides powerful methodological and statistical advantages. It establishes a symmetrical framework that makes our dynamic connectivity analyses tractable, such as our “cube” analysis of state transitions, which required overlapping modules. Critically, this model also offers a statistical safeguard. By ensuring each quadrant contributes to both low- and high-PE connectivity patterns, we eliminate confounds like region-specific signal variance or global connectivity. This design choice isolates the phenomenon to the pattern of connectivity itself (posterior-anterior vs. ventral-dorsal), making our interpretation more robust.
We updated the end of the Study 1A results (p. 10-11):
“Some ROIs appear in Figure 2C but are excluded from the four targeted quadrants (Figures 2C & 2D) – e.g., posterior inferior temporal lobe and fusiform ROIs are excluded from the OC-IPL module, and middle temporal gyrus ROIs are excluded from the IPL-LPFC modules. These exclusions, in favor of a four-quadrant interpretation, are motivated by existing knowledge of prominent structural pathways among these quadrants. This interpretation is also supported by classifier-based analyses showing connectivity within each quadrant is significantly influenced by PE (Supplemental Materials 2.2), along with analyses of single-region activity showing that these areas also respond to PE independently (Supplemental Materials 3). Hence, we proceeded with further analyses of these quadrants’ connections, which summarize PE’s global brain effects.
“This four-quadrant setup also imparts analytical benefits. First, this simplified structure may better generalize across PE tasks, and Study 1B would aim to replicate these results with a different design. Second, the four quadrants mean that each ROI contributes to both the posterior-anterior and ventral-dorsal modules, which would benefit later analyses and rules out confounds such as PE eliciting increased/decreased connectivity between an ROI and the rest of the brain. An additional, less key benefit is that this setup allows more easily evaluating whether the same phenomena arise using a different atlas (Supplemental Materials Y).”
(R2.5) The EEG-fMRI analysis claiming 3-6Hz fluctuations for PE is hard to reconcile with the fact that fMRI captures activity that is a lot slower, while some PEs are as fast as 150 ms. The discussion acknowledges this but doesn't seem to resolve it - would benefit from a more comprehensive argument.
We thank the reviewer for raising this important point, which allows us to clarify the logic of our multimodal analysis. Our analysis does not claim that the fMRI BOLD signal itself oscillates at 3-6 Hz. Instead, it is based on the principle that the intensity of a fast neural process can be reflected in the magnitude of the slow BOLD response. It’s akin to using a long-exposure photograph to capture a fast-moving object; while the individual movements are blurred, the intensity of the blur in the photo serves as a proxy for the intensity of the underlying motion. In our case, the magnitude of the fMRI network difference (|PA – VD|) acts as the "blur," reflecting the intensity of the rapid fluctuations between states within that time window.
Following this logic, we correlated this slow-moving fMRI metric with the power of the fast EEG rhythms, which reflects their amplitude. To bridge the different timescales, we averaged the EEG power over each fMRI time window and convolved it with the standard hemodynamic response function (HRF) – a crucial step to align the timing of the neural and metabolic signals. The resulting significant correlation specifically in the 3-6 Hz band demonstrates that when this rhythm is stronger, the fMRI data shows a greater divergence between network states. This allows us to infer the characteristic frequency of the underlying neural fluctuations without directly measuring them at that speed with fMRI, thus reconciling the two timescales.
Reviewer #3 (Public review):
Bogdan et al. present an intriguing and timely investigation into the intrinsic dynamics of prediction error (PE)-related brain states. The manuscript is grounded in an intuitive and compelling theoretical idea: that the brain alternates between high and low PE states even at rest, potentially reflecting an intrinsic drive toward predictive minimization. The authors employ a creative analytic framework combining different prediction tasks and imaging modalities. They shared open code, which will be valuable for future work.
(R3.1) Consistency in Theoretical Framing
The title, abstract, and introduction suggest inconsistent theoretical goals of the study.
The title suggests that the goal is to test whether there are intrinsic fluctuations in high and low PE states at rest. The abstract and introduction suggest that the goal is to test whether the brain intrinsically minimizes PE and whether this minimization recruits global brain networks. My comments here are that a) these are fundamentally different claims, and b) both are challenging to falsify. For one, task-like recurrence of PE states during resting might reflect the wiring and geometry of the functional organization of the brain emerging from neurobiological constraints or developmental processes (e.g., experience), but showing that mirroring exists because of the need to minimize PE requires establishing a robust relationship with behavior or showing a causal effect (e.g., that interrupting intrinsic PE state fluctuations affects prediction).
The global PE hypothesis-"PE minimization is a principle that broadly coordinates brain functions of all sorts, including abstract cognitive functions"-is more suitable for discussion rather than the main claim in the abstract, introduction, and all throughout the paper.
Given the above, I recommend that the authors clarify and align their core theoretical goals across the title, abstract, introduction, and results. If the focus is on identifying fluctuations that resemble taskdefined PE states at rest, the language should reflect that more narrowly, and save broader claims about global PE minimization for the discussion. This hypothesis also needs to be contextualized within prior work. I'd like to see if there is similar evidence in the literature using animal models.
Thank you for bringing up this issue. We have made changes throughout the paper to address these points. First, we have omitted reference to a “global PE hypothesis” from the Abstract and Introduction, in favor of structuring the Introduction in terms of a falsifiable question (p. 4):
“We pursued this goal using three studies (Figure 1) that collectively targeted a specific question: Do the taskdefined connectivity signatures of high vs. low PE also recur during rest, and if so, how does the brain transition between exhibiting high/low signatures?”
We made changes later in the Introduction to clarify that the investigation is based on correlative evidence and requires interpretations that may be debated (p. 5-7):
“Although this does not entirely address the reverse inference dilemma and can only produce correlative evidence, the present research nonetheless investigates these widely speculated upon PE ideas more directly than any prior work.
Although such speed outpaces the temporal resolution of fMRI, correlating fluctuations in dynamic connectivity measured from fMRI data with EEG oscillations can provide an estimate of the fluctuations’ speed. This interpretation of a correlation again runs up against issues related to reverse inference but would nonetheless serve as initial suggestive evidence that spontaneous transitions between network states occur rapidly.
Second, we examined the recruitment of these networks during rs-fMRI, and although the problems related to reverse inference are impossible to overcome fully, we engage with this issue by linking rs-fMRI data directly to task-fMRI data of the same participants, which can provide suggestive evidence that the same neural mechanisms are at play in both.”
We made changes throughout the Results now better describing the results as consistent with a hypothesis rather than demonstrating it (p. 12-19):
“In other words, we essentially asked whether resting-state participants are sometimes in low PE states and sometimes in high PE states, which would be consistent with spontaneous PE processing in the absence of stimuli.
These emerging states overlap strikingly with the previous task effects of PE, suggesting that rs-fMRI scans exhibit fluctuations that resemble the signatures of low- and high-PE states.
To be clear, this does not entirely dissuade concerns about reverse inference, which would require a type of causal manipulation that is difficult (if not impossible) to perform in a resting state scan. Nonetheless, these results provide further evidence consistent with our interpretation that the resting brain spontaneously fluctuates between high/low PE network states.
These patterns are most consistent with a characteristic timescale near 3–6 Hz for the amplitude of the putative high/low-PE fluctuations. This is notably consistent with established links between PE and Delta/Theta and is further consistent with an interpretation in which these fluctuations relate to PE-related processing during rest.”
We have also made targeted edits to the Discussion to present the findings in a more cautious way, more clearly state what is our interpretation, and provide alternative explanations (p. 19-26):
“The present research conducted task-fMRI, rs-fMRI, and rs-fMRI-EEG studies to clarify whether PE elicits global connectivity effects and whether the signatures of PE processing arise spontaneously during rest. This investigation carries implications for how PE minimization may characterize abstract task-general cognitive processes. […] Although there are different ways to interpret this correlation, it is consistent with high/low PE states generally fluctuating at 3-6 Hz during rest. Below, we discuss these three studies’ findings.
Our rs-fMRI investigation examined whether resting dynamics resemble the task-defined connectivity signatures of high vs. low PE, independent of the type of stimulus encountered. The resting-state analyses indeed found that, even at rest, participants’ brains fluctuated between strong ventral-dorsal connectivity and strong posterior-anterior connectivity, consistent with shifts between states of high and low PE. This conclusion is based on correlative/observational evidence and so may be controversial as it relies on reverse inference.
These patterns resemble global connectivity signatures seen in resting-state participants, and correlations between fMRI and EEG data yield associations, consistent with participants fluctuating between high-PE (ventral-dorsal) and low-PE (posterior-anterior) states at 3-6 Hz. Although definitively testing these ideas is challenging, given that rs-fMRI is defined by the absence of any causal manipulations, our results provide evidence consistent with PE minimization playing a role beyond stimulus process.”
(R3.2) Interpretation of PE-Related Fluctuations at Rest and Its Functional Relevance. It would strengthen the paper to clarify what is meant by "intrinsic" state fluctuations. Intrinsic might mean taskindependent, trait-like, or spontaneously generated. Which do the authors mean here? Is the key prediction that these fluctuations will persist in the absence of a prediction task?
Of the three terms the reviewer mentioned, “spontaneous” and “task-independent” are the most accurate descriptors. We conceptualize these fluctuations as a continuous background process that persists across all facets of cognition, without requiring a task explicitly designed to elicit prediction error – although we, along with other predictive coding papers, would argue that all cognitive tasks are fundamentally rooted in PE mechanisms and thus anything can be seen as a “prediction task” (see our response to comment R2.2 for our changes to the Introduction that provide more intuition for this point). The proposed interactions can be seen as analogous to cortico-basal-thalamic loops, which are engaged across a vast and diverse array of cognitive processes.
The prior submission only used the word “intrinsic” in the title. We have since revised it to “spontaneous,” which is more specific than “intrinsic,” and we believe clearer for a title than “task-independent” (p. 1): “Spontaneous fluctuations in global connectivity reflect transitions between states of high and low prediction error”
We have also made tweaks throughout the manuscript to now use “spontaneously” throughout (it now appears 8 times in the paper).
Regardless of the intrinsic argument, I find it challenging to interpret the results as evidence of PE fluctuations at rest. What the authors show directly is that the degree to which a subset of regions within a PE network discriminates high vs. low PE during task correlates with the magnitude of separation between high and low PE states during rest. While this is an interesting relationship, it does not establish that the resting-state brain spontaneously alternates between high and low PE states, nor that it does so in a functionally meaningful way that is related to behavior. How can we rule out brain dynamics of other processes, such as arousal, that also rise and fall with PE? I understand the authors' intention to address the reverse inference concern by testing whether "a participant's unique connectivity response to PE in the reward-processing task should match their specific patterns of resting-state fluctuation". However, I'm not fully convinced that this analysis establishes the functional role of the identified modules to PE because of the following:
Theoretically, relating the activities of the identified modules directly to behavior would demonstrate a stronger functional role.
(R3.2a) Across participants: Do individuals who exhibit stronger or more distinct PE-related fluctuations at rest also perform better on tasks that require prediction or inference? This could be assessed using the HCP prediction task, though if individual variability is limited (e.g., due to ceiling effects), I would suggest exploring a dataset with a prediction task that has greater behavioral variance.
This is a good idea, but unfortunately difficult to test with our present data. The HCP gambling task used in our study was not designed to measure individual differences in prediction or inference and likely suffers from ceiling effects. Because the task outcomes are predetermined and not linked to participants' choices, there is very little meaningful behavioral variance in performance to correlate with our resting-state fluctuation measure.
While we agree that exploring a different dataset with a more suitable task would be ideal, given the scope of the existing manuscript, this seems like it would be too much. Although these results would be informative, they would ultimately still not be a panacea for the reverse inference issues.
Or even more broadly, does this variability in resting state PE state fluctuations predict general cognitive abilities like WM and attention (which the HCP dataset also provides)? I appreciate the inclusion of the win-loss control, and I can see the intention to address specificity. This would test whether PE state fluctuations reflect something about general cognition, but also above and beyond these attentional or WM processes that we know are fluctuating.
This is a helpful suggestion, motivating new analyses: We measured the degree of resting-state fluctuation amplitude across participants and correlated it with the different individual differences measures provided with the HCP data (e.g., measures of WM performance). We computed each participant’s fluctuation amplitude measure as the average absolute difference between posterior-anterior and ventral-dorsal connectivity; this is the average of the TR-by-TR fMRI amplitude measure from Study 3. We correlated this individual difference score with all of the ~200 individual difference measures provided with the HCP dataset (e.g., measures of intelligence or personality). We measured the Spearman correlation between mean fluctuation amplitude with each of those ~200 measures, while correcting for multiple hypotheses using the False Discovery Rate approach.[18]
We found a robust negative association with age, where older participants tend to display weaker fluctuations (r = -.16, p < .001). We additionally find a positive association with the age-adjusted score on the picture sequence task (r = .12, p<sub>corrected</sub> = .03) and a negative association with performance in the card sort task (r = -.12, p<sub>corrected</sub> = 046). It is unclear how to interpret these associations, without being speculative, given that fluctuation amplitude shows one positive association with performance and one negative association, albeit across entirely different tasks. We have added these correlation results as Supplemental Materials 8 (SM p. 11):
“(8) Behavioral differences related to fluctuation amplitude
To investigate whether individual differences in the magnitude of resting-state PE-state fluctuations predict general cognitive abilities, we correlated our resting-state fluctuation measure with the cognitive and demographic variables provided in the HCP dataset.
(8.1) Methods
For each of the 1,000 participants, we calculated a single fluctuation amplitude score. This score was defined as the average absolute difference between the time-varying posterior-anterior (PA) and ventral-dorsal (VD) connectivity during the resting-state fMRI scan (the average of the TR-by-TR measure used for Study 3). We then computed the Spearman correlation between this score and each of the approximately 200 individual difference measures provided in the HCP dataset. We corrected for multiple comparisons using the False Discovery Rate (FDR) approach.
(8.2) Results
The correlations revealed a robust negative association between fluctuation amplitude and age, indicating that older participants tended to display weaker fluctuations (r = -.16, p<sub>corrected</sub> < .001). After correction, two significant correlations with cognitive performance emerged: (i) a positive association with the age-adjusted score on the Picture Sequence Memory Test (r = .12, p<sub>corrected</sub> = .03), (ii) a negative association with performance on the Card Sort Task (r = -.12, p<sub>corrected</sub> = .046). As greater fluctuation amplitude is linked to better performance on one task but worse performance on another, it is unclear how to interpret these findings.”
We updated the main text Methods to direct readers to this content (p. 39-40):
“(4.4.3) Links between network fluctuations and behavior
We considered whether the extent of PE-related network expression states during resting-state is behaviorally relevant. We specifically investigated whether individual differences in the overall magnitude of resting-state fluctuations could predict individual difference measures, provided with the HCP dataset. This yielded a significant association with age, whereby older participants tended to display weaker fluctuations. However, associations with cognitive measures were limited. A full description of these analyses is provided in Supplemental Materials 8.”
(R3.2b) Within participants: Do momentary increases in PE-network expression during tasks relate to better or faster prediction? In other words, is there evidence that stronger expression of PE-related states is associated with better behavioral outcomes?
This is a good question that probes the direct behavioral relevance of these network states on a trial-by-trial basis. We agree with the reviewer's intuition; in principle, one would expect a stronger expression of the low-PE network state on trials where a participant correctly and quickly gives a high likelihood rating to a predictable stimulus.
Following this suggestion, we performed a new analysis in Study 1A to test this. We found that while network expression was indeed linked to participants’ likelihood ratings: higher likelihood ratings correspond to stronger posterior-anterior connectivity, whereas lower ratings correspond to stronger ventral-dorsal connectivity (Connectivity-Direction × likelihood, β [standardized] = .28, p = .02). Yet, this is not a strong test of the reviewer’s hypothesis, and different exploratory analyses of response time yield null results (p > .05). We suspect that this is due to the effect being too subtle, so we have insufficient statistical power. A comparable analysis was not feasible for Study 1B, as its design does not provide an analogous behavioral measure of trialby-trial prediction success.
(R3.3) A priori Hypothesis for EEG Frequency Analysis.
It's unclear how to interpret the finding that fMRI fluctuations in the defined modules correlate with frontal Delta/Theta power, specifically in the 3-6 Hz range. However, in the EEG literature, this frequency band is most commonly associated with low arousal, drowsiness, and mind wandering in resting, awake adults, not uniquely with prediction error processing. An a priori hypothesis is lacking here: what specific frequency band would we expect to track spontaneous PE signals at rest, and why? Without this, it is difficult to separate a PE-based interpretation from more general arousal or vigilance fluctuations.
This point gets to the heart of the challenge with reverse inference in resting-state fMRI. We agree that an interpretation based on general arousal or drowsiness is a potential alternative that must be considered. However, what makes a simple arousal interpretation challenging is the highly specific nature of our fMRI-EEG association. As shown in our confirmatory analyses (Supplemental Materials 6), the correlation with 3-6 Hz power was found exclusively with the absolute difference between our two PE-related network states (|PA – VD|)—a measure of fluctuation amplitude. We found no significant relationship with the signed difference (a bias toward one state) or the sum (the overall level of connectivity). This specificity presents a puzzle for a simple drowsiness account; it seems less plausible that drowsiness would manifest specifically as the intensity of fluctuation between two complex cognitive networks, rather than as a more straightforward change in overall connectivity. While we cannot definitively rule out contributions from arousal, the specificity of our finding provides stronger evidence for a structured cognitive process, like PE, than for a general, undifferentiated state.
We updated the Discussion to make the argument above and also to remind readers that alternative explanations, such as ones based on drowsiness, are possible (p. 24):
“We specifically interpret the fMRI-EEG correlation as reflecting fluctuation speed because we correlated EEG oscillatory power with the fluctuation amplitude computed from fMRI data. Simply correlating EEG power with the average connectivity or the signed difference between posterior-anterior and ventral-dorsal connectivity yields null results (Supplemental Materials 6), suggesting that this is a very particular association, and viewing it as capturing fluctuation amplitude provides a parsimonious explanation. Yet, this correlation may be interpreted in other ways. For example, resting-state Theta is also a signature of drowsiness,[2] which may correlate with PE processing, but perhaps should be understood as some other mechanism.”
(R3.4) Significance Assessment
The significance of the correlation above and all other correlation analyses should be assessed through a permutation test rather than a single parametric t-test against zero. There are a few reasons: a) EEG and fMRI time series are autocorrelated, violating the independence assumption of parametric tests;
Standard t-tests can underestimate the true null distribution's variance, because EEG-fMRI correlations often involve shared slow drifts or noise sources, which can yield spurious correlations and inflating false positives unless tested against an appropriate null.
Building a null distribution that preserves the slow drifts, for example, would help us understand how likely it is for the two time series to be correlated when the slow drifts are still present, and how much better the current correlation is, compared to this more conservative null. You can perform this by phase randomizing one of the two time courses N times (e.g., N=1000), which maintains the autocorrelation structure while breaking any true co-occurrence in patterns between the two time series, and compute a non-parametric p-value. I suggest using this approach in all correlation analyses between two time series.
This is an important statistical point to clarify, and the suggested analysis is valuable. The reviewer is correct that the raw fMRI and EEG time series are autocorrelated. However, because our statistical approach is a twolevel analysis, we reasoned that non-independence at the correlation-level would not invalidate the higher-level t-test. The t-test’s assumption of independence applies to the individual participants' coefficients, which are independent across participants. Thus, we believe that our initial approach is broadly appropriate, and its simplicity allows it to be easily communicated.
Nonetheless, the permutation-testing procedure that the Reviewer describes seems like an important analysis to test, given that permutation-testing is the gold standard for evaluating statistical significance, and it could guarantee that our above logic is correct. We thus computed the analysis as the reviewer described. For each participant, we phase-randomized the fMRI fluctuation amplitude time series. Specifically, we randomized the Fourier phases of the |PA–VD| series (within run), while retaining the original amplitude spectrum; inverse transforms yielded real surrogates with the same power spectrum. This was done for each participant once per permutation. Each participant’s phase-randomized data was submitted to the analysis of each oscillatory power band as originally, generating one mean correlation for each band. This was done 1,000 times.
Across the five bands, we find that the grand mean correlation is near zero (M<sub>r</sub> = .0006) and the 97.5<sup>th</sup> percentile critical value of the null distribution is r = ~.025; this 97.5<sup>th</sup> percentile corresponds to the upper end of a 95% confidence interval for a band’s correlation; the threshold minimally differs across bands (.024 < rs < .026). Our original correlation coefficients for Delta (M<sub>r</sub> = .042) and Theta (M<sub>r</sub> = .041), which our conclusions focused on, remained significant (p ≤ .002); we can perform family-wise error-rate correction by taking the highest correlation across any band for a given permutation, and the Delta and Theta effects remain significant (p<sub>FWE</sub>corrected ≤ .003); previously Reviewer comment R1.4c requested that we employ family-wise error correction.
These correlations were previously reported in Table 1, and we updated the caption to note what effects remain significant when evaluated using permutation-testing and with family-wise error correction (p. 19):
“The effects for Delta, Theta, Beta, and Gamma remain significant if significance testing is instead performed using permutation-testing and with family-wise error rate correction (p<sub>corrected</sub> < .05).”
We updated the Methods to describe the permutation-testing analysis (p. 43):
“To confirm the significance of our fMRI-EEG correlations with a non-parametric approach, we performed a group-level permutation-test. For each of 1,000 permutations, we phase-randomized the fMRI fluctuation amplitude time series. Specifically, we randomized the Fourier phases of the |PA–VD| series (within run), while retaining the original amplitude spectrum; inverse transforms yielded real surrogates with the same power spectrum. This procedure breaks the true temporal relationship between the fMRI and EEG data while preserving its structure. We then re-computed the mean Spearman correlation for each frequency band using this phase-randomized data. We evaluated significance using a family-wise error correction approach that accounts for us analyzing five oscillatory power bands. We thus create a null distribution composed of the maximum correlation value observed across all frequency bands from each permutation. Our observed correlations were then tested for significance against this distribution of maximums.”
(R3.5) Analysis choices
If I'm understanding correctly, the algorithm used to identify modules does so by assigning nodes to communities, but it does not itself restrict what edges can be formed from these modules. This makes me wonder whether the decision to focus only on connections between adjacent modules, rather than considering the full connectivity, was an analytic choice by the authors. If so, could you clarify the rationale? In particular, what justifies assuming that the gradient of PE states should be captured by edges formed only between nearby modules (as shown in Figure 2E and Figure 4), rather than by the full connectivity matrix? If this restriction is instead a by-product of the algorithm, please explain why this outcome is appropriate for detecting a global signature of PE states in both task and rest.
We discuss this matter in our response to comment R2.(4).
When assessing the correspondence across task-fMRI and rs-fMRI in section 2.2.2, why was the pattern during task calculated from selecting a pair of bilateral ROIs (resulting in a group of eight ROIs), and the resting state pattern calculated from posterior-anterior/ventral-dorsal fluctuation modules? Doesn't it make more sense to align the two measures? For example, calculating task effects on these same modules during task and rest?
We thank the reviewer for this question, as it highlights a point in our methods that we could have explained more clearly. The reviewer is correct that the two measures must be aligned, and we can confirm that they were indeed perfectly matched.
For the analysis in Section 2.2.2, both the task and resting-state measures were calculated on the exact same anatomical substrate for each comparison. The analysis iteratively selected a symmetrical subset of eight ROIs from our larger four quadrants. For each of these 3,432 iterations, we computed the task-fMRI PE effect (the Connectivity Direction × PE interaction) and the resting-state fluctuation amplitude (E[|PA – VD|]) using the identical set of eight ROIs. The goal of this analysis was precisely to test if the fine-grained anatomical pattern of these effects correlated within an individual across the task and rest states. We will revise the text in Section 2.2.2 to make this direct alignment of the two measures more explicit.
Recommendations for authors:
Reviewer #1 (Recommendations for authors):
(R1.3) Several prior studies have described co-activation or connectivity "templates" that spontaneously alternate during rest and task states, and are linked to behavioral variability. While they are interpreted differently in terms of cognitive function (e.g., in terms of sustained attention: Monica Rosenberg; alertness: Catie Chang), the relationship between these previously reported templates and those identified in the current study warrants discussion. Are the current templates spatially compatible with prior findings while offering new functional interpretations beyond those already proposed in the literature? Or do they represent spatially novel patterns?
Thank you for this suggestion. Broadly, we do not mean to propose spatially novel patterns but rather focus on how these are repurposed for PE processing. In the Discussion, we link our identified connectivity states to established networks (e.g., the FPCN). We updated this paragraph to mention that these patterns are largely not spatially novel (p. 20):
“The connectivity patterns put forth are, for the most part, not spatially novel and instead overlap heavily with prior functional and anatomical findings.”
Regarding the specific networks covered in the prior work by Rosenberg and Chang that the reviewer seems to be referring to, [7,8] this research has emphasized networks anchored heavily in sensorimotor, subcortical– cerebellar, and medial frontal circuits, and so mostly do not overlap with the connectivity effects we put forth.
(R1.4) Additional points:
(R1.4a) I do not think that the logic for taking the absolute difference of fMRI connectivity is convincing. What happens if the sign of the difference is maintained ?
Thank you for pointing out this area that requires clarification. Our analysis targets the amplitude of the fluctuation between brain states, not the direction. We define high fluctuation amplitude as moments when the brain is strongly in either the PA state (PA > VD) or the VD state (VD > PA). The absolute difference |PA – VD| correctly quantifies this intensity, whereas a signed difference would conflate these two distinct high-amplitude moments. Our simulation study (Supplemental Materials, Section 5) provides the theoretical validation for this logic, showing how this absolute difference measure in slow fMRI data can track the amplitude of a fast underlying neural oscillator.
When the analysis is tested in terms of the signed difference, as suggested by the Reviewer, the association between the fMRI data and EEG power is insignificant for each power band (ps<sub>uncorrected</sub> ≥ .47). We updated Supplemental Materials 6 to include these results. Previously, this section included the fluctuation amplitude (fMRI) × EEG power results while controlling for: (i) the signed difference between posterior-anterior and ventral-dorsal connectivity, (ii) the sum of posterior-anterior and ventral-dorsal connectivity, and (iii) the absolute value of the sum of posterior-anterior and ventral-dorsal connectivity. For completeness, we also now report the correlation between each EEG power band and each of those other three measures (SM, p. 9)
“We additionally tested the relationship between each of those three measures and the five EEG oscillation bands. Across the 15 tests, there were no associations (ps<sub>uncorrected</sub> ≥ .04); one uncorrected p-value was at p = .044, although this was expected given that there were 15 tests. Thus, the association between EEG oscillations and the fMRI measure is specific to the absolute difference (i.e., amplitude) measure.”
(R1.4b) Reasoning of focus on frontal and theta band is weak, and described as "typical" (line 359) based on a single study.
Sorry about this. There is a rich literature on the link between frontal theta and prediction error,[3,9–11] and we updated the Introduction to include more references to this work (p. 18): “The analysis was first done using power averaged across frontal electrodes, as these are the typical focus of PE research on oscillations.[3,9–11]”
We have also updated the Methods to cite more studies that motivate our electrode choice (p. 41): “The analyses first targeted five midline frontal electrodes (F3, F1, Fz, F2, F4; BioSemi64 layout), given that this frontal row is typically the focus of executive-function PE research on oscillations.[9–11]”
(R1.4c) No correction appears to have been applied for the association between EEG power and fMRI connectivity. Given that 100 frequency bins were collapsed into 5 canonical bands, a correction for 5 comparisons seems appropriate. Notably, the strongest effects in the delta and theta bands (particularly at fronto-central electrodes) may still survive correction, but this should be explicitly tested and reported.
Thanks for this suggestion. We updated the Table 1 caption to mention what results survive family-wise error rate correction – as the reviewer suggests, the Delta/Theta effects would survive Bonferroni correction for five tests, although per a later comment suggesting that we evaluate statistical significance with a permutationtesting approach (comment R3.4), we instead report family-wise error correction based on that. The revised caption is as follows (p. 19):
“The effects for Delta, Theta, Beta, and Gamma remain significant if significance testing is instead performed using permutation-testing and with family-wise error rate correction (p<sub>corrected</sub> < .05).”
(R1.4d) Line 135. Not sure I understand what you mean by "moods". What is the overall point here?
The overall argument is that the fluctuations occur rapidly rather than slowly. By slow “moods” we refer to how a participant could enter a high anxiety state of >10 seconds, linked to high PE fluctuations, and then shift into a low anxiety state, linked to low PE fluctuations. We argue that this is not occurring. Regardless, we recognize that referring to lengths of time as short as 10 seconds or so is not a typical use of the word “mood” and is potentially ambiguous, so we have omitted this statement, which was originally on page 6: “Identifying subsecond fluctuations would broaden the relevance of the present results, as they rule out that the PE states derive from various moods.”
(R1.4e) Line 100. "Few prior PE studies have targeted PE, contrasting the hundreds that have targeted BOLD". I don't understand this sentence. It's presumably about connectivity vs activity?
Yes, sorry about this typo. The reviewer is correct, and that sentence was meant to mention connectivity. We corrected (p. 5): “Few prior PE studies have targeted connectivity, contrasting the hundreds that have targeted BOLD.”
(R1.4f) Line 373: "0-0.5Hz" in the caption is probably "0-50Hz".
Yes, this was another typo, thank you. We have corrected it (p. 19): “… every 0.5 Hz interval from 0-50 Hz.”
Reviewer #2 (Recommendations for authors):
(R2.6) (Page 3) When referring to the "limited" hypothesis of local PE, please clarify in what sense is it limited. That statement is unclear.
Thank you for pointing out this text, which we now see is ambiguous. We originally use "limited" to refer to the hypothesis's constrained scope – namely, that PE is relevant to various low-level operations (e.g., sensory processing or rewards) but the minimization of PE does not guide more abstract cognitive processes. We edited this part of the Introduction to be clearer (p. 3)
“It is generally agreed that the brain uses PE mechanisms at neuronal or regional levels,[15,16] and this idea has been useful in various low-level functional domains, including early vision [15] and dopaminergic reward processing.[17] Some theorists have further argued that PE propagates through perceptual pathways and can elicit downstream cognitive processes to minimize PE.”
(R2.7) (Page 5) "Few prior PE have targeted PE"... this statement appears contradictory. Please clarify.
Sorry about this typo, which we have corrected (p. 5):
“Few prior PE studies have targeted connectivity, contrasting the hundreds that have targeted BOLD.”
(R2.8) What happened to the data of the medium PE condition in Study 1A?
The medium PE condition data were not excluded. We modeled the effect of prediction error on connectivity using a linear regression across the three conditions, coding them as a continuous variable (Low = -1, Medium = 0, High = +1). This approach allowed us to identify brain connections that showed a linear increase or decrease in strength as a function of increasing PE. This linear contrast is a more specific and powerful way to isolate PErelated effects than a High vs. Low contrast. We updated the Results slightly to make this clearer (p. 8-9):
“In the fMRI data, we compared the three PE conditions’ beta-series functional connectivity, aiming to identify network-level signatures of PE processing, from low to high. […] For the modularity analysis, we first defined a connectome matrix of beta values, wherein each edge’s value was the slope of a regression predicting that edge’s strength from PE (coded as Low = -1, Medium = 0, High = +1; Figure 2A).”
(R2.9) (Page 15) The point about how the dots in 6H follow those in 6J better than those in 6I is a little subjective - can the authors provide an objective measure?
Thank you for pointing out this issue. The visual comparison using Figure 6 was not meant as a formal analysis but rather to provide intuition. However, as the reviewer describes, this is difficult to convey. Our formal analysis is provided in Supplemental Materials 5, where we report correlation coefficients between a very large number of simulated fMRI data points and EEG data points corresponding to different frequencies. We updated this part of the Results to convey this (p. 16-17):
“Notice how the dots in Figure 6H follow the dots in Figure 6J (3 Hz) better than the dots in Figure 6I (0.5 Hz) or Figure 6K (10 Hz); this visual comparison is intended for illustrative purposes only, and quantitative analyses are provided in Supplemental Materials 5.”
References
(1) Zalesky, A., Fornito, A. & Bullmore, E. T. Network-based statistic: identifying differences in brain networks. Neuroimage 53, 1197–1207 (2010)
(2) Strijkstra, A. M., Beersma, D. G., Drayer, B., Halbesma, N. & Daan, S. Subjective sleepiness correlates negatively with global alpha (8–12 Hz) and positively with central frontal theta (4–8 Hz) frequencies in the human resting awake electroencephalogram. Neuroscience letters 340, 17–20 (2003).
(3) Cavanagh, J. F. & Frank, M. J. Frontal theta as a mechanism for cognitive control. Trends in cognitive sciences 18, 414–421 (2014).
(4) Grech, R. et al. Review on solving the inverse problem in EEG source analysis. Journal of neuroengineering and rehabilitation 5, 25 (2008)
(5) Palva, J. M. et al. Ghost interactions in MEG/EEG source space: A note of caution on inter-areal coupling measures. Neuroimage 173, 632–643 (2018).
(6) Koles, Z. J. Trends in EEG source localization. Electroencephalography and clinical Neurophysiology 106, 127–137 (1998).
(7) Rosenberg, M. D. et al. A neuromarker of sustained attention from whole-brain functional connectivity. Nature neuroscience 19, 165–171 (2016).
(8) Goodale, S. E. et al. fMRI-based detection of alertness predicts behavioral response variability. elife 10, e62376 (2021).
(9) Cavanagh, J. F. Cortical delta activity reflects reward prediction error and related behavioral adjustments, but at different times. NeuroImage 110, 205–216 (2015)
(10) Hoy, C. W., Steiner, S. C. & Knight, R. T. Single-trial modeling separates multiple overlapping prediction errors during reward processing in human EEG. Communications Biology 4, 910 (2021).
(11) Neo, P. S.-H., Shadli, S. M., McNaughton, N. & Sellbom, M. Midfrontal theta reactivity to conflict and error are linked to externalizing and internalizing respectively. Personality neuroscience 7, e8 (2024).
(12) Friston, K. J. The free-energy principle: a unified brain theory? Nature reviews neuroscience 11, 127–138 (2010)
(13) Feldman, H. & Friston, K. J. Attention, uncertainty, and free-energy. Frontiers in human neuroscience 4, 215 (2010).
(14) Friston, K. J. et al. Active inference and epistemic value. Cognitive neuroscience 6, 187–214 (2015).
(15) Rao, R. P. & Ballard, D. H. Predictive coding in the visual cortex: a functional interpretation of some extraclassical receptive-field effects. Nature neuroscience 2, 79–87 (1999)
(16) Walsh, K. S., McGovern, D. P., Clark, A. & O’Connell, R. G. Evaluating the neurophysiological evidence for predictive processing as a model of perception. Annals of the new York Academy of Sciences 1464, 242– 268 (2020)
(17) Niv, Y. & Schoenbaum, G. Dialogues on prediction errors. Trends in cognitive sciences 12, 265–272 (2008).
(18) Benjamini, Y. & Hochberg, Y. Controlling the false discovery rate: a practical and powerful approach to multiple testing. Journal of the Royal statistical society: series B (Methodological) 57, 289–300 (1995).
eLife Assessment
This manuscript provides evidence that mouse germline cysts develop an asymmetric Golgi, ER, and microtubule-associated structure that resembles the fusome in Drosophila germline cysts. This fundamental study provides new evidence that fusome-like structures exist in germ cell cysts across species. Overall, the data are convincing and represent a significant advance in our understanding of germ cell biology.
Reviewer #2 (Public review):
This study identifies Visham, an asymmetric structure in developing mouse cysts resembling the Drosophila fusome, an organelle crucial for oocyte determination. Using immunofluorescence, electron microscopy, 3D reconstruction, and lineage labeling, the authors show that primordial germ cells (PGCs) and cysts, but not somatic cells, contain an EMA-rich, branching structure that they named Visham, which remains unbranched in male cysts. Visham accumulates in regions enriched in intercellular bridges, forming clusters reminiscent of fusome "rosettes." It is enriched in Golgi and endosomal vesicles and partially overlaps with the ER. During cell division, Visham localizes near centrosomes in interphase and early metaphase, disperses during metaphase, and reassembles at spindle poles during telophase before becoming asymmetric. Microtubule depolymerization disrupts its formation.
Cyst fragmentation is shown to be non-random, correlating with microtubule gaps. The authors propose that 8-cell (or larger) cysts fragment into 6-cell and 2-cell cysts. Analysis of Pard3 (the mouse ortholog of Par3/Baz) reveals its colocalization with Visham during cyst asymmetry, suggesting that mammalian oocyte polarization depends on a conserved system involving Par genes, cyst formation, and a fusome-like structure.
Transcriptomic profiling identifies genes linked to pluripotency and the unfolded protein response (UPR) during cyst formation and meiosis, supported by protein-level reporters monitoring Xbp1 splicing and 20S proteasome activity. Visham persists in meiotic germ cells at stage E17.5 and is later transferred to the oocyte at E18.5 along with mitochondria and Golgi vesicles, implicating it in organelle rejuvenation. In Dazl mutants, cysts form, but Visham dynamics, polarity, rejuvenation, and oocyte production are disrupted, highlighting its potential role in germ cell development.
Overall, this is an interesting and comprehensive study of a conserved structure in the germline cells of both invertebrate and vertebrate species. Investigating these early stages of germ cell development in mice is particularly challenging. Although primarily descriptive, the study represents a remarkable technical achievement. The images are generally convincing, with only a few exceptions.
Major comments:
(1) Some titles contain strong terms that do not fully match the conclusions of the corresponding sections.
(1a) Article title "Mouse germline cysts contain a fusome-like structure that mediates oocyte development":
The term "mediates" could be misleading, as the functional data on Visham (based on comparing its absence to wild-type) actually reflects either a microtubule defect or a Dazl mutant context. There is no specific loss-of-function of visham only.
(1b) Result title, "Visham overlaps centrosomes and moves on microtubules":
The term "moves" implies dynamic behavior, which would require live imaging data that are not described in the article.
(1c) Result title, "Visham associates with Golgi genes involved in UPR beginning at the onset of cyst formation":
The presented data show that the presence of Visham in the cyst coincides temporally with the expression and activity of the UPR response; the term "associates" is unclear in this context.
(1d) Result title, "Visham participates in organelle rejuvenation during meiosis":
The term "participates" suggests that Visham is required for this process, whereas the conclusion is actually drawn from the Dazl mutant context, not a specific loss-of-function of visham only.
(2) The authors aim to demonstrate that Visham is a fusome-like structure. I would suggest simply referring to it as a "fusome-like structure" rather than introducing a new term, which may confuse readers and does not necessarily help the authors' goal of showing the conservation of this structure in Drosophila and Xenopus germ cells. Interestingly, in a preprint from the same laboratory describing a similar structure in Xenopus germ cells, the authors refer to it as a "fusome-like structure (FLS)" (Davidian and Spradling, BioRxiv, 2025).
Comments on revisions:
The revised manuscript has been clearly improved, and the authors have addressed all of our comments. I would like to point out two minor issues:
(1) As suggested by the reviewers, the authors now use the term fusome instead of visham. However, they also acknowledge that this structure lacks many components of the Drosophila fusome. It may therefore be more appropriate to refer to it as a "mouse fusome" or as a "fusome-like structure (FLS)," as used in Xenopus.
(2) I agree with Reviewer 3 that co-localization between EMA and acTubulin on still images does not convincingly demonstrate that fusome vesicles move along microtubules (Figure S2E).
Reviewer #3 (Public review):
The manuscript provides evidence that mice have a fusome, a conserved structure most well studied in Drosophila that is important for oocyte specification. Overall, a myriad of evidence is presented demonstrating the existence of a mouse fusome. This work is important as it addresses a long-standing question in the field of whether mice have fusomes and sheds light on how oocytes are specified in mammals.
Comments on revisions:
Overall, the authors did a good job of responding to reviewer comments that have improved the manuscript by including higher quality microscope images, revising text for clarity and using the term mouse fusome instead of using a new term. However, two of the headings in the results section that didn't correspond to the data presented in that section still have not been revised eventhough the authors stated that they were revised in their response to reviewer comments. The heading of the first section of the results is: "PGCs contain a Golgi-rich structure known as the EMA granule" even though no evidence in that section shows it is Golgi rich. The heading of the fifth section of the results is: "The mouse fusome associates with polarity and microtubule genes including pard3" however, only evidence for pard3 is presented.
Author response:
The following is the authors’ response to the original reviews.
Public Reviews:
Reviewer #1 (Public review)
Summary
We thank the reviewer for the constructive and thoughtful evaluation of our work. We appreciate the recognition of the novelty and potential implications of our findings regarding UPR activation and proteasome activity in germ cells.
(1) The microscopy images look saturated, for example, Figure 1a, b, etc. Is this a normal way to present fluorescent microscopy?
The apparent saturation was not present in the original images, but likely arose from image compression during PDF generation. While the EMA granule was still apparent, in the revised submission, we will provide high-resolution TIFF files to ensure accurate representation of fluorescence intensity and will carefully optimize image display settings to avoid any saturation artifacts.
(2) The authors should ensure that all claims regarding enrichment/lower vs. lower values have indicated statistical tests.
We fully agree. In the revised version, we will correct any quantitative comparisons where statistical tests were not already indicated, with a clear statement of the statistical tests used, including p-values in figure legends and text.
(a) In Figure 2f, the authors should indicate which comparison is made for this test. Is it comparing 2 vs. 6 cyst numbers?
We acknowledge that the description was not sufficiently detailed. Indeed, the test was not between 2 vs 6 cyst numbers, but between all possible ways 8-cell cysts or the larger cysts studied could fragment randomly into two pieces, and produce by chance 6-cell cysts in 13 of 15 observed examples. We will expand the legend and main text to clarify that a binomial test was used to determine that the proportion of cysts producing 6-cell fragments differed very significantly from chance.
Revised text:
“A binomial test was used to assess whether the observed frequency of 6-cell cyst products differed from random cyst breakage. Production of 6-cell cysts was strongly preferred (13/15 cysts; ****p < 0.0001).”
(b) Figures 4d and 4e do not have a statistical test indicated.
We will include the specific statistical test used and report the corresponding p-values directly in the figure legends.
(3) Because the system is developmentally dynamic, the major conclusions of the work are somewhat unclear. Could the authors be more explicit about these and enumerate them more clearly in the abstract?
We will revise the abstract to better clarify the findings of this study. We will also replace the term Visham with mouse fusome to reflect its functional and structural analogy to the Drosophila and Xenopus fusomes, making the narrative more coherent and conclusive.
(4) The references for specific prior literature are mostly missing (lines 184-195, for example).
We appreciate this observation of a problem that occurred inadvertently when shortening an earlier version. We will add 3–4 relevant references to appropriately support this section.
(5) The authors should define all acronyms when they are first used in the text (UPR, EGAD, etc).
We will ensure that all acronyms are spelled out at first mention (e.g., Unfolded Protein Response (UPR), Endosome and Golgi-Associated Degradation (EGAD)).
(6) The jumping between topics (EMA, into microtubule fragmentation, polarization proteins, UPR/ERAD/EGAD, GCNA, ER, balbiani body, etc) makes the narrative of the paper very difficult to follow.
We are not jumping between topics, but following a narrative relevant to the central question of whether female mouse germ cells develop using a fusome. EMA, microtubule fragmentation, polarization proteins, ER, and balbiani body are all topics with a known connection to fusomes. This is explained in the general introduction and in relevant subsections. We appreciate this feedback that further explanations of these connections would be helpful. In the revised manuscript, use of the unified term mouse fusome will also help connect the narrative across sections. UPR/ERAD/EGAD are processes that have been studied in repair and maintenance of somatic cells and in yeast meiosis. We show that the major regulator XbpI is found in the fusome, and that the fusome and these rejuvenation pathway genes are expressed and maintained throughout oogenesis, rather than only during limited late stages as suggested in previous literature.
(7) The heading title "Visham participates in organelle rejuvenation during meiosis" in line 241 is speculative and/or not supported. Drawing upon the extensive, highly rigorous Drosophila literature, it is safe to extrapolate, but the claim about regeneration is not adequately supported.
We believe this statement is accurate given the broad scope of the term "participates." It is supported by localization of the UPR regulator XbpI to the fusome. XbpI is the ortholog of HacI a key gene mediating UPR-mediated rejuvenation during yeast meiosis. We also showed that rejuvenation pathway genes are expressed throughout most of meiosis (not previously known) and expanded cytological evidence of stage-specific organelle rejuvenation later in meiosis, such as mitochondrial-ER docking, in regions enriched in fusome antigens. However, we recognize the current limitations of this evidence in the mouse, and want to appropriately convey this, without going to what we believe would be an unjustified extreme of saying there is no evidence.
Reviewer #2 (Public review):
We thank the reviewer for the comprehensive summary and for highlighting both the technical achievement and biological relevance of our study. We greatly appreciate the thoughtful suggestions that have helped us refine our presentation and terminology.
(1) Some titles contain strong terms that do not fully match the conclusions of the corresponding sections.
(1a) Article title “Mouse germline cysts contain a fusome-like structure that mediates oocyte development”
We will change the statement to: “Mouse germline cysts contain a fusome that supports germline cyst polarity and rejuvenation.”
(1b) Result title “Visham overlaps centrosomes and moves on microtubules”
We acknowledge that “moves” implies dynamics. We will include additional supplementary images showing small vesicular components of the mouse fusome on spindle-derived microtubule tracks.
(1c) Result title “Visham associates with Golgi genes involved in UPR beginning at the onset of cyst formation”
We will revise this title to: “The mouse fusome associates with the UPR regulatory protein Xbp1 beginning at the onset of cyst formation” to reflect the specific UPR protein that was immunolocalized.
(1d) Result title “Visham participates in organelle rejuvenation during meiosis”
We will revise this to: “The mouse fusome persists during organelle rejuvenation in meiosis.”
(2) The authors aim to demonstrate that Visham is a fusome-like structure. I would suggest simply referring to it as a "fusome-like structure" rather than introducing a new term, which may confuse readers and does not necessarily help the authors' goal of showing the conservation of this structure in Drosophila and Xenopus germ cells. Interestingly, in a preprint from the same laboratory describing a similar structure in Xenopus germ cells, the authors refer to it as a "fusome-like structure (FLS)" (Davidian and Spradling, BioRxiv, 2025).
We appreciate the reviewer’s insightful comment. To maintain conceptual clarity and align with existing literature, we will refer to the structure as the mouse fusome throughout the manuscript, avoiding introduction of a new term.
Reviewer #3 (Public review):
We thank the reviewer for emphasizing the importance of our study and for providing constructive feedback that will help us clarify and strengthen our conclusions.
(1) Line 86 - the heading for this section is "PGCs contain a Golgi-rich structure known as the EMA granule"
We agree that the enrichment of Golgi within the EMA PGCs was not shown until the next section. We will revise this heading to:
“PGCs contain an asymmetric EMA granule.”
(2) Line 105-106, how do we know if what's seen by EM corresponds to the EMA1 granule?
We will clarify that this identification is based on co-localization with Golgi markers (GM130 and GS28) and response to Brefeldin A treatment, which will be included as supplementary data. These findings support that the mouse fusome is Golgi-derived and can therefore be visualized by EM. The Golgi regions in E13.5 cyst cells move close together and associate with ring canals as visualized by EM (Figure 1E), the same as the mouse fusomes identified by EMA.
(3) Line 106-107-states "Visham co-stained with the Golgi protein Gm130 and the recycling endosomal protein Rab11a1". This is not convincing as there is only one example of each image, and both appear to be distorted.
Space is at a premium in these figures, but we have no limitation on data documenting this absolutely clear co-localization. We will replace the existing images with high-resolution, noncompressed versions for the final figures to clearly illustrate the co-staining patterns for GM130 and Rab11a1.
(4) Line 132-133---while visham formation is disrupted when microtubules are disrupted, I am not convinced that visham moves on microtubules as stated in the heading of this section.
We will include additional supplementary data showing small mouse fusome vesicles aligned along microtubules.
(5) Line 156 - the heading for this section states that Visham associates with polarity and microtubule genes, including pard3, but only evidence for pard3 is presented.
We agree and will revise the heading to: “Mouse fusome associates with the polarity protein Pard3.” We are adding data showing association of small fusome vesicles on microtubules.
(6) Lines 196-210 - it's strange to say that UPR genes depend on DAZ, as they are upregulated in the mutants. I think there are important observations here, but it's unclear what is being concluded.
UPR genes are not upregulated in DAZ in the sense we have never documented them increasing. We show that UPR genes during this time behave like pleuripotency genes and normally decline, but in DAZ mutants their decline is slowed. We will rephrase the paragraph to clarify that Dazl mutation partially decouples developmental processes that are normally linked, which alters UPR gene expression relative to cyst development.
(7) Line 257-259-wave 1 and 2 follicles need to be explained in the introduction, and how these fits with the observations here clarified.
Follicle waves are too small a focus of the current study to explain in the introduction, but we will request readers to refer to the cited relevant literature (Yin and Spradling, 2025) for further details.
We sincerely thank all reviewers for their insightful and constructive feedback. We believe that the planned revisions—particularly the refined terminology, improved image quality, clarified statistics, and restructured abstract—will substantially strengthen the manuscript and enhance clarity for readers.
Reviewer #1 (Recommendations for the authors):
(1) Figure 1E: need to use some immuno-gold staining to identify the Visham. Just circling an area of cytoplasm that contains ER between germ cell pairs is not enough.
We appreciate the reviewer’s insistence that the association between the mouse fusome and Golgi be clearly demonstrated. However, the EMA granule is a large structure discovered and defined by light microscopy, and presents no inherent challenge to documenting its Golgi association by immunofluorescence experiments, which we presented and now further strengthened as described in the next paragraph. We believe that the suggested EM experiment would add little to the EM we already presented (Figure 1E, E') Moreover, due to facility limitations, we are currently unable to perform immunogold staining.
To strengthen previous immunolocalization experiments, we have now included additional immunostaining data showing the clear colocalization of the fusome region with the Golgi markers GM130 and GS28 (Figure S1H). We have also incorporated a new experiment using the Golgi-specific inhibitor Brefeldin A (BFA) see Figure S1I. Treatment of in vitro–cultured gonads with BFA, disrupted EMA granule formation, demonstrating that EMA granules not only associate with Golgi, but require Golgi function to to be maintained.
Additionally, in Figure 2, we showed that the fusome overlaps with the peri-centriolar region—a characteristic locus for Golgi due to its movement on microtubules. We showed that the dynamic behavior of the fusome during the cell cycle, parallels Golgi dispersal and reassembly, and all these facts provide further strong support for the Golgi-association of the EMA granule and fusome.
(2) Figure 1F: is this image compressed?
We have now substituted the image in Figure 1F with a better image and have avoided the compression of the image.
(3) In the figure legends, are the sample sizes individual animals or individual sections? Please ensure that all figure legends for each figure panel consistently contain the sample size.
We have now included the number of measurements (N) in every figure legend. Each experiment was performed using samples from at least three different animals, and in most cases from more than three. This information has also been added to the Methods section under Statistics. In addition, N values are now consistently provided for each graph throughout the figures.
(4) Figure 2b/c: seemly likely based on the snapshot of different stages of cytokinesis that the "newly formed" visham is accurate, but without live imaging, this claim of "newly formed" is putative/speculative. It is OK if it is labeled as "putative" in the figure panel.
The behavior of the Drosophila fusome during mitosis was deduced without live imaging (deCuevas et al. 1998). We clarified that the conversion of a single mouse germ cell with one round fusome to an interconnected pair of cells with two round fusomes of greater total volume following mitosis is the basis for deducing that new fusome formation occurs each cell cycle. However, we agree with the reviewer that the phrase "newly formed" in the original label on Figure 2c suggested a specific mechanism of fusome increase that was not intended and this phrase has been removed entirely.
(5) Figure 2e/e is extremely difficult to follow. In order to improve the readability of these figure panels, can individual panels with a single stain be shown? The 'gap' between YFP+ sister cells is not immediately obvious in panel e or e" with the current layout. Since this is a key aspect of the author's claim about cleavage of the cyst, it would be best to make this claim more robust by showing more convincing images. In Figure 2E, the staining pattern of EMA needs to be clarified and described more fully in the text.
We mapped discontinuities in the microtubule connections, not the fusome or YFP. YFP is the lineage marker indicating that the cells of a single cyst are being studied. Consequently, no gap between YFP cytoplasmic expression is expected because only in the last example (figure E”), has fragmentation already occurred (and here there is a YFP gap). The acetylated tubulin gap proceeds fragmentation. The mitotic spindle remnants labeled by AcTub link the cells into two groups separated by a gap, which is clearly shown in the data images and in the third column where only the relevant AcTub from the cyst itself is shown. In response to the reviewers question about the fusome, which is not directly relevant to fragmentation, we have now provided images of the separate fusome channel and corresponding measurements for all three Figure 2E-E'' cysts in the supplementary Figure S4H. We have improved the text regarding this important figure to try and make it easier to follow, and also added a new example of a 10-cell cyst also in S2H (lower panels). We also added, movies allowing full 3D study of one of the 8 cell cysts and the new 10-cell cyst. I also suggest that the reviewer examine how the deduced mechanism of fragmentation explains previously published but not fully understood data on cyst fragmentation going back to 1998 as described in the expanded Discussion on this topic.
(6) It would be best to support the proposed model in Figure 2G (4+4+4) with microscopy images of a 12-cell or 16-cell cyst? Would these 12-cell or 16-cell cysts be too large to technically recover in a section?
Unfortunately the reviewer 's suggestion that 12- or 16-cell cysts are too large to recover and present convincingly is correct. Because our analysis depends on capturing lineage-labeled cysts specifically at telophase with acetylated-tubulin connections, the likelihood of obtaining the correct stage is very low. In addition, the dense packing of germ cells in the mouse gonad further limits our ability to fully reconstruct all the cells in large cysts, with difficulty increasing as cyst size grows.
However, as noted, we added a well-resolved 10-cell cyst—the largest size we could confidently analyze—in a 3D video in Supplementary Figure S2H (lower panel), which shows a 6 + 4 breakage pattern.
(7) We did not find a reference in the text for Figure 2G.
We have now provided reference for 2G in the text and in the discussion section.
(8) Line 189: ERAD is used as an acronym, but is not defined until the discussion.
We have now provided full form of acronym at its first usage in the text.
(9) Fig 3i/i': the increase of UPR pathway components, increasing expression during zygotene, is interesting to note, but is not commented enough in the text of the paper.
We have discussed this issue in the discussion section with specific reference to figure 3I. Please find the detailed discussion under the heading “Germ cell rejuvenation is highly active during cyst formation.”
(10) Please quantify DNMT3A expression levels in WT control vs Dazl KO germ cells in Figure 4a.
We have now quantified DNMT3A expression levels in WT control vs Dazl KO germ cells and have added the data in the Figure 4A.
(11) Please introduce the rationale behind selecting DazL KO for studying cyst formation (text in line 197). This comes out of nowhere.
True. We significantly expanded our discussion of Dazl and citations of previous work, including evidence that it can affect cyst structures like ring canals, in the Introduction.
(12) It would be best to stain WT control vs DazL KO oogonia in Figure 4a with 5mC antibodies to support their claim that DNA methylation might be affected in the mutants.
We respectfully disagree that this additional experiment is necessary within the scope of the current study. At the developmental stage examined (E12.5), germ cells in the Dazl mutant are clearly in an arrested and hypomethylated state, as supported by previous evidence (Haston et al. 2009).This initial experiments was designed to show that in our hands Dazl mutants show this known pkuripotency delay. However, the effects of Dazl mutation on female germline cyst development as it relates to polarity or the fusome was not studied before, and that is what the paper addresses, building on previous work.
Because our study does not focus on germ-cell epigenetic modifications but rather on the consequences of Dazl loss on germ cell cyst development, adding 5mC immunostaining would not substantially advance the main conclusions. The existing data and previous published work already provide sufficient background.
(13) Figure 4c: a very interesting figure, it would be best to quantify developmental pseudotime (perhaps using monocle3 analysis) and compare more rigorously the developmental stage of WT control vs DazL KO.
Developmental pseudotime, such as through Monocle3 analysis, might sometimes be valuable but involves assumptions that when possible are better addressed by direct experimental examination. Our conclusions regarding cyst developmental stage are supported by straightforward evidence rather to which computational trajectory inference would add little. Specifically, we have performed analysis of germ-cell methylation state, ring canal formation, pluripotency markers, UPR pathway activity assay (Xbp1 and Proteomic assay), Golgi-stress analysis and Pard3 which collectively document the developmental status of the WT and Dazl KO germ cells. These empirical data demonstrate the same developmental pattern reflected in Figure 4c, making the less reliable pseudotime-based computational method superfluous.
(14) Figure 4d has two panels labeled as "d".
We have now corrected the labelling of the figure
(15) Color coding in 4d, d', d" is confusing; please harmonize some visual presentation here.
We have now harmonized the visual representation of all the graph in figure 4
(16) Fig 4e' is labeled as DazL +/- but is this really a typo?
Thank you for pointing it out. We have now corrected the typo
(17) Figure F': typo labeled as E3.5, which is E13.5?
Thank you for pointing it out. We have now corrected the typo
(18) Figure F': was DazL KO mutant but no WT control.
The WT control was not provided to avoid the redundancy. Please refer to earlier figure 3A-B, Fig S3C and D and videos S3A and S3b to refer to WT control at every stage.
(19) Figure G: unusual choice in punctuation marks for cartoon schematic. No key to guide the reader for color-coded structures would be helpful to have something similar to 4h.
We have now provided the key to guide the readers in the mentioned figure 4G.
(20) The authors use WGA and EMA as interchangeable markers (Figure 5a) without fully explaining why they have switched markers.
Because it is germ cell specific, we used EMA as a fusome marker during the time when it is found up through E13.5. After that point we used WGA which is still usable, but also labels somatic cells. This rationale is explicitly described at the end of the section “Fusome is highly enriched in Golgi and vesicles”, where we state:
“EMA staining disappears from germ cells at E14.5 (Figure 1I). However, very similar (but non–germ-cell-specific) staining continued with wheat germ agglutinin (WGA) at later stages (Figure 1G, G’; Figure S1G).”
To ensure this is fully clear to readers, we have now added an additional statement in the start of the text section discussing the figure 5:
“For the reasons explained previously (see text for Figure 1G), WGA was used as a fusome marker beyond stage E14.5.”
(21) Figure 5b' is compressed.
We have now decompressed the image
(22) Line 267, Balbiani body is misspelled.
We have now corrected the spelling.
(23) The explanation of why the authors switch focus from DazL KO to DazL +/- is not adequately described. The authors should also explain the phenotype of the DazL +/- animals or reference a paper citing the hets are sterile or subfertile.
We have now added the explanation of why Dazl KO is used in our introduction section where we have mentioned the phenotype of Dazl homozygous and heterozygous mouse.
(24) Is Figure 5i actually DazL +/-? It is not labeled clearly in the text, the figure legend, or the figure panel.
We have now labelled the figure correctly in figure and in the legend.
(25) The paper ends abruptly at line 275 with no context or summary.
The manuscript does not end at line 275; the apparent interruption is due to a page break occurring immediately before the beginning of the Discussion section. We hope that continuation is fully visible in the reviewer 1 (your) version of the PDF.
Reviewer #2 (Recommendations for the authors):
(1) Line 93: Fig. 1B: DDX4 marks germ cells; do all the red and yellow cells in the NE inset originate from the same PGC? There are only 2 cells marked in yellow among the group of red cells. Is it a z-projection issue? Or do they come from different PGCs?
This experiment used vasa staining to identify all germ cells, which are produced by multiple PGCs. Green labeling is a lineage marker derived from a single PGC (due to the low frequency of tamoxifen-activated labeling). Consequently, the two yellow cells observed in the NE inset of Fig. 1B represent YFP-labeled germ cells (YFP + DDX4 double-positive) that have arisen from a single, lineage-traced PGC. This approach, introduced in 2013, is described in the Methods, and represents the field's single largest technical advance that has made it possible to analyze mouse germ cell development at single cell resolution.
To ensure clarity, we have added a brief explanatory note to the figure legend indicating that yellow cells represent the lineage-traced progeny of a single PGC, while the red staining marks all germ cells.
(2) Line 96: Figure 1C vs 1C'. The difference between female and male Visham is not obvious, although quantification shows a clear difference. How was the quantification made? Manual or automatic thresholding? Would it be possible to show only the Visham channel?
We thank the reviewer for pointing out this problem. We have now more clearly described in the text that the female fusome increases in some cells with close attachments to other cells (future oocytes) and decreases in distant nurse cells. It branches due to rosette formation.. In males, the fusome remains much like the initial EMA granules present in early germ cells, with only fine and difficult to see connections. The quantification shown in Figures 1C and 1C′ was performed manually, based on the presence of either (i) fused, branched EMA-positive fusome structures or (ii) dispersed, punctate EMA granules. This assessment was carried out across multiple E13.5 male and female gonad samples to ensure robustness. To facilitate independent evaluation, we have already provided supplementary videos S3B1 and S3B2, which display the EMA-stained E13.5 male and female gonads in three dimensions. These videos allow the structural differences to be examined more clearly than in static images.
In response to the reviewer’s request, we now additionally include the single-channel fusome image in Supplementary Figure S1E′. This presentation highlights the fusome signal alone and further clarifies the morphological differences underlying the quantification.
(3) L118: Figure 2A, third row = 2-cell cyst? Please specify PCNT in the legend.
We appreciate the reviewer’s observation. In Figure 2A (third row), the cells were not specifically labeled as a 2-cell cyst; rather, the intention was to illustrate the presence of two distinct centrosomes positioned on a fused fusome structure, a configuration we frequently observe.
We have now updated the figure legend to explicitly define PCNT.
(4) L169: Missing reference to S3B and video S3B1?
We have now included the reference to S3B1 and S3B2 in the text and in the legend
(5) L170: Please describe the graph in the Figure 3D legend.
We have now described the Graph in the legend
(6) L171: Would it be possible to have a close-up showing both Pard3 and Visham in a ringlike pattern related to RACGAP (RC) staining? The images are too small.
It is difficult to capture this relationship perfectly in a two dimensional picture. The images represent the maximum close-up possible that still includes enough relevant area for the necessary conclusions. We have now provided additional three close-up images exclusively for ring-canal and Pard3 association in the supplementary Figure S3C for further clarity. However, we also note that the quality of the image permits the reader of a pdf to zoom and to visualize the images in great detail.
(7) L181: Wrong reference, should be 3 then 3I.
Thank you for pointing it out, we have now corrected the reference.
(8) L199: In Figure S4B, was DNMT3 staining quantified? Red intensity differs globally between images; use the somatic red level as a reference? Note: EMA seems higher in Dazl- vs. WT?
We have now performed quantification of DNMT3 staining, which is presented in Figure 4A. While the red intensity (DNMT3 or EMA) can appear to differ between images, this variation can result from biological differences between tissues or minor technical variability despite using consistent microscope settings. To account for this, we normalized the staining intensity using the somatic cell signal as an internal reference, ensuring that the quantification reflects genuine differences between WT and Dazl-/- samples rather than global intensity variation.
(9) L229: Should be "proteasome."
We have now corrected the spelling error.
(10) L233: Quantify fragmentation of Gs28? EMA doesn't seem affected. Could you quantify both Gs28 and EMA? Images are too small.
We thank the reviewer for this suggestion. While the current images are small, they can be examined in detail using zoom to visualize the structures clearly. As noted, EMA staining is not affected, (we agree) as cells are in arrested state. This arrested state creates stress on Golgi. The fragmentation of Gs28-labeled Golgi membranes is a classical indicator of Golgi stress, even though the fragmented membranes may remain functionally active. Our results show that Dazl deletion specifically affects Golgi in germ cells, while Golgi in neighboring somatic cells appears healthy. To quantify this effect, we have now included manual quantification of Golgi fragmentation in Figure 4F, assessing tissues for the presence of fragmented versus intact Golgi structures. This confirms that Golgi fragmentation is a germ cell–specific phenotype in Dazl– samples, while pre-formed EMA-positive fusomes remain unaffected but probably in arrested state.
(11) L237: Figure 4F graph shows E3.5, not E13.5.
We have now corrected the typo in the figure
(12) L257: Figure 5D: quantify as in 5A? overlap?
Yes, it's an overlap and shown as two separate image with ring canal for better clarity. We have now quantified the image and have produced combined graph for fusome and pard3 in Figure 5A graph.
(13) L261: Figure 5E-E': black arrowhead not mentioned in legend.
We have now mentioned the black arrowhead in the legend
(14) L262: Figure 5C: arrowhead not mentioned in legend. Figure 5F: oocyte appears separated from nurse cells compared to 5C.
Yes, that may happen as cysts undergo fragmentation; what matters is all cells are lineage labelled and hence are members of a single cyst derived from one PGC.
(15) L263: Figure 5G has no legend reference; nurse cells are not outlined as in 5C.
We have now outlined the nurse cells and have added the reference to the graph in the legend.
(16) L279: "The fusome and Visham and both..." should be replaced with "Both fusome and Visham...".
We have now replaced the term Visham with fusome as suggested by reviewers and editor. We updated the statement to correct the grammatical error.
(17) L1127: Video S3B1: It is unclear what to focus on.
We have now added the Rectangle area and arrow to highlight what to focus on
(18) L1128: Video "S3B1" should be "S3B2."
We have now corrected the legend
(19) Finally: curiosity question: have the authors tried to use known markers of the Drosophila fusome in mice, such as Spectrin or other markers described in Lighthouse, Buszczak and Spradling, Dev Bio, 2008? And conversely, do EMA and WGA label the fusome in Drosophila?
Yes, we and others used the most specific markers of the Drosophila fusome such alpha-spectrin, adducin-like Hts, tropomodulin, etc. to search for fusomes in vertebrate species. It was unsuccessful in clarifying the situation, because Hts and alpha-spectrin in Drosophila and other insects generate a protein skeleton that stabilizes the fusome and is easily stained. But this structure is simply not conserved in vertebrates. The polarity behavior of the fusome, it core developmental property, is conserved, however. The mammalian fusome still acquires and maintains cyst polarity, and goes even farther and reflects both initial cyst formation and cyst cleavage, before marking oocyte vs nurse cell development in the smaller cysts. Expression of the inner microtubule-rich portion of the fusome, its Par proteins, and many ER-related and lysosomal fusome proteins are mostly conserved but their ability to mark the fusome alone varies with time and context (only some of the examples are shown in Figure 3I'). Nearly all of the proteins identified in Lighthouse et al. 2008 are expressed. These proteins may be involved in rejuvenation as studied here. We modified the first section of the Discussion to explicitly compare mouse, Xenopus and Drosophila fusomes, which was not possible before this work.
Reviewer #3 (Recommendations for the authors):
The authors should either revise the conclusions or add additional evidence to support their claims. In addition, minor corrections are listed below.
We have added additional evidence as noted in responses above, and revised some claims that were stated inaccurately. In addition, we have attempted to clarify the evidence we do present, so that its full significance is more easily grasped by readers.
(1) Lines 20-21 are unclear - the cyst doesn't get sent into meiosis, each oocyte does.
Research is showing that it's more complicated than that. All cyst cells enter "pre-meiotic S phase", and most cell cycles are conventionally considered to start after the previous M phase-
i.e. in G1 or S, not in the next prophase, an ancient view limited just to meiosis. Absent this old tradition from meiosis cytology, pre-meiotic S would just be called meiotic S as some workers on meiosis do. In addition, in different species, nurse cells diverge from meiosis on different schedules, including many much later in the meiotic cycle. Two cyst cells in Drosophila fully enter meiosis by all criteria, the oocyte and one nurse cell that only exits in late zygotene. In Xenopus and mouse, scRNAseq shows that many cyst cells enter meiosis up to leptotene and zygotene, including nurse cells that specifically downregulate meiotic genes during this time, possibly to assist their nurse cell functions, while others remain in meiosis even longer (Davidian and Spradling, 2025; Niu and Spradling, 2022). Eventually, only the oocytes within each fragmented mouse cyst complete meiosis.
(2) Many places in the manuscript abbreviations are never defined or not defined the first time they are used (but the second or third time): Line 23-ER, Line 29-UPR, Line 33-PGC (not defined until line 45), Line 79-EGAD.
We have defined full acronyms now upon their first occurrence.
(3) Line 5 should be the pachytene substage of meiosis I.
We have now updated the statement to “In pachytene stage of meiosis I…”
(4) Line 59-61 - this statement needs a reference(s).
These statements are a continuation from the references cited in the previous statements. However, for further clarity we have again cited the relevant reference here (Niu and Spradling, 2022).
(5) Line 80 - should it be oocyte proteome quality control?
We have now updated the statement to “Oocyte proteome quality control begins early”.
(6) Line 87 - in this case, EMA does not stand for epithelial membrane antigen (AI will call it that, but it is not correct). I believe it originally was the abbrev for (Em)bryonic (a)ntigen, though some papers call it (e)mbryonic (m)ouse (a)ntigen. And the reference here is Hahnel and Eddy, 1986, but in the reference list is a different paper, 1987 (both refer to EMA-1).
We have now updated the acronym EMA-1 in corrected form and have corrected the citation.
(7) Line 176 - RNA seq.
We have now updated the statement to “We performed single cell RNA sequencing (scRNA seq) of mouse gonad”.
(8) Line 181 - Figure 4E and 4I should be 3E and 3I.
We have now updated the figure reference in the text to correct one.
(9) Line 183 - missing period.
Added.
eLife Assessment
This paper develops a fundamental theory that explains how the brain can hold in working memory not only the identity but also the order of presented stimuli. Previous theories did not explain the ability of people to immediately recall the correct order of the stimulus presentation. The authors present compelling evidence that this can be achieved through synaptic augmentation, an experimentally observed phenomenon with a time scale of tens of seconds.
Reviewer #1 (Public review):
Summary:
The issue of how the brain can maintain serial order of presented items in working memory is a major unsolved question in cognitive neuroscience. It has been proposed that this serial order maintenance could be achieved thanks to periodic reactivations of different presented items at different phases of an oscillation, but the mechanisms by which this could be achieved by brain networks, as well as the mechanisms of read-out, are still unclear. In an influential 2008 paper, the authors have proposed a mechanism by which a recurrent network of neurons could maintain multiple items in working memory, thanks to `population spikes' of populations of neurons encoding for the different items, occurring at alternating times. These population spikes occur in a specific regime of the network and are a result of synaptic facilitation, an experimentally observed type of synaptic short-term dynamics with time scales of order hundreds of ms.
In the present manuscript, the authors extend their model to include another type of experimentally observed short-term synaptic plasticity termed synaptic augmentation, that operates on longer time scales on the order of 10s. They show that while a network without augmentation loses information about serial order, augmentation provides a mechanism by which this order can be maintained in memory thanks to a temporal gradient of synaptic efficacies. The order can then be read out using a read-out network whose synapses are also endowed with synaptic augmentation. Interestingly, the read-out speed can be regulated using background inputs.
Strengths:
This is an elegant solution to the problem of serial order maintenance, that only relies on experimentally observed features of synapses. The model is consistent with a number of experimental observations in humans and monkeys. The paper will be of interest to the broad readership of eLife and I believe it will have a strong impact on the field.
Comments on revisions:
I am happy with how the authors have addressed my comments, and believe the paper can be published in its present form.
Reviewer #2 (Public review):
In this manuscript, the authors present a model to explain how working memory (WM) encodes both existence and timing simultaneously using transient synaptic augmentation. A simple yet intriguing idea.
The model presented here has the potential to explain what previous theories like 'active maintenance via attractors' and 'liquid state machine' do not, and describe how novel sequences are immediately stored in WM. Altogether, the topic is of great interest to those studying higher cognitive processes, and the conclusions the authors draw are certainly thought-provoking from an experimental perspective.
Comments on revisions:
The authors have done an excellent job of addressing the questions that I raised, and the manuscript is greatly improved - both in content and clarity. It is an insightful advance and I recommend publication.
Author response:
The following is the authors’ response to the original reviews.
Public Reviews:
Reviewer #1 (Public review):
(1) The network they propose is extremely simple. This simplicity has pros and cons: on the one hand, it is nice to see the basic phenomenon exposed in the simplest possible setting. On the other hand, it would also be reassuring to check that the mechanism is robust when implemented in a more realistic setting, using, for instance, a network of spiking neurons similar to the one they used in the 2008 paper. The more noisy and heterogeneous the setting, the better.
The choice of a minimal model to illustrate our hypothesis is deliberate. Our main goal was to suggest a physiologically-grounded mechanism to rapidly encode temporally-structured information (i.e., sequences of stimuli) in Working Memory, where none was available before. Indeed, as discussed in the manuscript, previous proposals were unsatisfactory in several respects. In view of our main goal, we believe that a spiking implementation is beyond the scope of the present work.
We would like to note that the mechanism originally proposed in Mongillo et al. (2008), has been repeatedly implemented, by many different groups, in various spiking network models with different levels of biological realism (see, e.g., Lundquivst et al. (2016), for an especially ‘detailed’ implementation) and, in all cases, the relevant dynamics has been observed. We take this as an indication of ‘robustness’; the relevant network dynamics doesn’t critically depend on many implementation details and, importantly, this dynamics is qualitatively captured by a simple rate model (see, e.g., Mi et al. (2017)).
In the present work, we make a relatively ‘minor’ (from a dynamical point of view) extension of the original model, i.e., we just add augmentation. Accordingly, we are fairly confident that a set of parameters for the augmentation dynamics can be found such that the spiking network behaves, qualitatively, as the rate model. A meaningful study, in our opinion, then would require extensively testing the (large) parameters’ space (different models of augmentation?) to see how the network behavior compares with the relevant experimental observations (which ones? Behavioral? Physiological?). As said above, we believe that this is beyond the scope of the present work.
This being said, we definitely agree with the reviewer that not presenting a spiking implementation is a limitation of the present work. We have clearly acknowledged this limitation here, by adding the following paragraph to the Discussion.
“To illustrate our theory in a simple setting, we used a minimal model network that neglects many physiological details. This, however, constitutes a limitation of the present study. It would be reassuring to see that the mechanism we propose here is robust enough to reliably operate also in spiking networks, in the presence of heterogeneity in both single-cell and synaptic properties. While we are fairly confident that this is the case, a spiking implementation of our model is beyond the scope of the present study and will be addressed in the future. Also, because of the simplicity of the model network, a comparison between the model behavior and the electrophysiological observations cannot be completely direct. Nevertheless the model qualitatively accounts for a diverse set of experimental data”.
(2) One major issue with the population spike scenario is that (to my knowledge) there is no evidence that these highly synchronized events occur in delay periods of working memory experiments. It seems that highly synchronized population spikes would imply (a) a strong regularity of spike trains of neurons, at odds with what is typically observed in vivo (b) high synchronization of neurons encoding for the same item (and also of different items in situations where multiple items have to be held in working memory), also at odds with in vivo recordings that typically indicate weak synchronization at best. It would be nice if the authors at least mention this issue, and speculate on what could possibly bridge the gap between their highly regular and synchronized network, and brain networks that seem to lie at the opposite extreme (highly irregular and weakly synchronized). Of course, if they can demonstrate using a spiking network simulation that they can bridge the gap, even better.
Direct experimental evidence (in monkeys) in support of the existence of highly synchronized events -- to be identified with the ‘population spikes’ of our model -- during the delay period of a memory task is available in the literature, i.e., Panichello et al. (2024). we provide a short discussion of the results of Panichello et al. (2024) and how these results directly relate to our model. We also provide a short discussion of the results of Liebe et al. (2025), which, again, are fully consistent with our model.
We note that there is no fundamental contradiction between highly synchronized events in ‘small’ neural populations (e.g., a cell assembly) on one hand, and temporally irregular (i.e., Poisson-like) spiking at the single-neuron level and weakly synchronized activity at the network level, on the other hand. This was already illustrated in our original publication, i.e., Mongillo et al. (2008) (see, in particular, Fig. S2). We further note that the mechanism we propose to encode temporal order -- a temporal gradient in the synaptic efficacies brought about by synaptic augmentation -- would also work if the memory of the items is maintained by ‘tonic’ persistent activity (i.e., without highly synchronized events), provided this activity occurs at suitably low rates such as to prevent the saturation of the synaptic augmentation.
We have added the following two paragraphs to the Discussion.
“More direct support to this interpretation comes from recent electrophysiological studies [Panichello et al., 2024, Liebe et al., 2025]. By recording large neuronal populations (∼ 300) simultaneously in the prefrontal cortex of monkeys performing a WM task, [Panichello et al., 2024] found that, during the maintenance period, the decoding of the actively held item from neural activity was ’intermittent’; that is, decoding was only possible during short epochs (∼ 100ms) interleaved with epochs (also ∼ 100ms) where decoding was at chance level. The inability to decode resulted from a loss of selectivity at the population level, with a return of the single-neuron firing rates to their spontaneous (pre-stimulus) activity levels. The transitions between these two activity states (decodable/not-decodable) were coordinated across large populations of neurons in PFC. By recording single-neuron activity in the medial temporal lobe of humans performing a sequential multi-item WM task, [Liebe et al., 2025] found that during maintenance, neurons coding for a given item tended to fire at a specific phase of the underlying theta rhythm, again suggesting that the corresponding neuronal populations reactivate briefly and sequentially. In summary, these experimental results suggest that active memory maintenance relies on brief reactivations of the neural representations of the items, which we identify with the population spikes in our model, and that these reactivatations occur sequentially in time, as predicted by our theory”.
“We note that the proposed mechanism would still work if the items were maintained by tonically-enhanced firing rates, instead of population spikes, provided that those firing rates were suitably low. However, obtaining low firing rates in model networks of persistent activity is quite difficult”.
Reviewer #2 (Public review):
The study relates to the well-known computational theory for working memory, which suggests short-term synaptic facilitation is required to maintain working memory, but doesn't rely on persistent spiking. This previous theory appears similar to the proposed theory, except for the change from facilitation to augmentation. A more detailed explanation of why the authors use augmentation instead of facilitation in this paper is warranted: is the facilitation too short to explain the whole process of WM? Can the theory with synaptic facilitation also explain the immediate storage of novel sequences in WM?
In the model, synaptic dynamics displays both short-term facilitation and augmentation (and shortterm depression). Indeed, synaptic facilitation, alone, would be too short-lived to encode novel sequences. This is illustrated in Fig. 1B.
We provide a discussion of this important point, by adding the following paragraph to the Results section.
“If augmentation was the only form of synaptic plasticity present in the network, the encoding of an item in WM would require long presentation times, or alternatively high firing rates upon presentation, precisely because K_A is small. Instead, rapid encoding is made possible by the presence of the short-term facilitation, which builds up significantly faster than augmentation, as U >> K_A . For the same reason, however, the level of facilitation rapidly reaches the steady state; therefore, short-term facilitation alone is unable to encode temporal order (see Fig. 1B). Thus, our model requires the existence of transitory synaptic enhancement on at least two time scales, such that longer decays are accompanied by slower build-ups. Intriguingly, this pattern is experimentally observed [Fisher et al., 1997]”.
In Figure 1, the authors mention that synaptic augmentation leads to an increased firing rate even after stimulus presentation. It would be good to determine, perhaps, what the lowest threshold is to see the encoding of a WM task, and whether that is biologically plausible.
We believe that this comment is related to the above point. The reviewer is correct; augmentation alone would require fairly long stimulus presentations to encode an item in WM. ‘Fast’ encoding, indeed, is guaranteed by the presence of short-term facilitation. This important point is emphasized; see above.
In the middle panel of Figure 4, after 15-16 sec, when the neuronal population prioritizes with the second retro-cue, although the second retro-cue item's synaptic spike dominates, why is the augmentation for the first retro-cue item higher than the second-cue augmentation until the 20 sec?
This is because of the slow build-up and decay of the augmentation. When the second item is prioritized, and the corresponding neuronal population re-activates, its augmentation level starts to increase. At the same time, as the first item is now de-prioritized and the corresponding neuronal population is now silent, its augmentation level starts to decrease. Because of the ‘slowness’ of both processes (i.e., augmentation build-up and decay), it takes about 5 seconds for the augmentation level of the second item to overcome the augmentation level of the first item.
We note that the slow time scales of the augmentation dynamics, consistently with experimental observations, are necessary for our mechanism to work; see above.
Recommendations for the authors:
Reviewer #1 (Recommendations for the authors):
(1) Line 46 identify -> identity.
(2) Line 207 scale -> scales.
Fixed. Thank you.
(3) Lines 222-224 what about behavioral time-scale plasticity? This type of plasticity can apparently be induced very quickly.
We have removed the corresponding paragraph.
(4) Line 231 identification of `gamma bursts' with population spikes: These two phenomena seem to be very different - one can be weakly synchronized and can be consistent with highly irregular activity, while it is not clear whether the other can (see major issue 2). Also, it seems that population spikes occur at frequencies that are an order of magnitude lower than gamma.
We have rewritten the corresponding paragraph and we rely now on more direct electrophysiological evidence (i.e., on the simultaneous recording of large neuronal populations) to identify putative population spikes; see above.
Reviewer #2 (Recommendations for the authors):
(1) On page 7, the behavioral study of Rose et al. (2016) is quite important for readers to understand the 'low-activity regime', and to fully appreciate Figure 4, it would be beneficial to explain that study in greater detail.
We have added a panel to Fig. 4, and accompanying text in the caption, to better illustrate the main task events in the experiment of Rose et al. (2016).
(2) Line 17: "wrong order", but wrong timing matters too
Definitely, depending on the task. Specifically, in our example, timing is immaterial.
(3) Line 33-34: "special training", what is considered special? One could argue that the number of trials needed to learn, depending on the TI timing, is special, depending on the task.
We have removed the sentence as apparently it was confusing. We simply meant that ‘naive’ human subjects can perform the task (e.g., serial recall); that is, they didn’t undergo any kind of practice that can be construed as ‘training’.
(4) Line 40-41: but timing is also part of working memory processing. Perhaps it can be merged with the next sentence.
We have merged the two sentences.
(5) Line 53: Is the implication here that what happens in the synapses is what drives WM, and not just that the neurons stay persistently on?
Yes. The idea is that information can be maintained in the synaptic facilitation level, without enhanced spiking activity. Reading-out and refreshing the memory contents, however, requires neuronal activity. We explain this in some detail in the next paragraph (i.e., lines 60-65 in the revised submission).
(6) Line 102: could a lack of excitatory activity be explained by inhibitory signaling? It appears the inhibitory component is quite understated here.
Here we are just defining A-bar; according to Eq. (6), if r_a is 0 (i.e., no synaptic activity, for whatever reason), then A_a will converge to A-bar after a time much longer than \tau_A (i.e., a long period). We have rephrased the sentence to improve clarity.
(7) Line 158-172: please consider revising this paragraph for a more general audience.
We have rewritten this paragraph to improve clarity. For the same purpose, we have also slightly modified Fig. 3.
(8) Line 227: it would seem this is due to a singular inhibitory group making the model highly dependent on the excitatory groups.
We are not sure that we understand this comment. Here, we are just saying that if the item-coding populations don’t reactivate during the maintenance period (i.e., activity-silent regime) then the augmentation gradient cannot build up. If, on the other hand, the item-coding populations are constantly active at high rates during the maintenance period (i.e., persistent-activity regime) then then augmentation levels will rapidly saturate and, again, there will be no augmentation gradient. This is independent of how ‘silence’ or ‘activity’ of the item-coding populations is determined by the interplay of excitation and inhibition.
(9) Line 284: this would certainly be an interesting take, but it isn't clear that the model proved this type of decoupling of the temporal aspect of the recall.
This is an ‘educated’ speculation, based on the model and on a specific interpretation of some experimental results, as discussed in the paper and, in particular, in the last paragraph of the Discussion. We believe that the phrasing of the paragraph makes clear that this is, indeed, a speculation.
eLife Assessment
This valuable study a computational language model, i.e., HM-LSTM, to quantify the neural encoding of hierarchical linguistic information in speech, and addresses how hearing impairment affects neural encoding of speech. Overall the evidence for the findings is solid, although the evidence for different speech processing stages could be strengthened by a more rigorous temporal response function (TRF) analysis. The study is of potential interest to audiologists and researchers who are interested in the neural encoding of speech.
Reviewer #1 (Public review):
The authors relate a language model developed to predict whether a given sentence correctly followed another given sentence to EEG recordings in a novel way, showing receptive fields related to widely used TRFs. In these responses (or "regression results"), differences between representational levels are found, as well as differences between attended and unattended speech stimuli, and whether there is hearing loss. These differences are found per EEG channel.
In addition to these novel regression results, which are apparently captured from the EEG specifically around the sentence stimulus offsets, the authors also perform a more standard mTRF analysis using a software package (Eelbrain) and TRF regressors that will be more familiar to researchers adjacent to these topics, which was highly appreciated for its comparative value. Comparing these TRFs with the authors' original regression results, several similarities can be seen. Specifically, response contrasts for attended versus unattended speaker during mixed speech, for the phoneme, syllable, and sentence regressors, are greater for normal-hearing participants than hearing-impaired participants for both analyses, and the temporal and spatial extents of the significant differences are roughly comparable (left-front and 0 - 200 ms for phoneme and syllable, and left and 200 - 300 ms for sentence).
The inclusion of the mTRF analysis is helpful also because some aspects of the authors' original regression results, between the EEG data and the HM-LSTM linguistic model, are less than clear. The authors state specifically that their regression analysis is only calculated in the -100 - 300 ms window around stimulus/sentence offsets. They clarify that this means that most of the EEG data acquired while the participants are listening to the sentences is not analyzed, because their HM-LSTM model implementation represents all acoustic and linguistic features in a condensed way, around the end of the sentence. Thus the regression between data and model only occurs where the model predictions exist, which is the end of the sentences. This is in contrast to the mTRF analysis, which seems to have been done in a typical way, regressing over the entire stimulus time, because those regressors (phoneme onset, word onset, etc.) exist over the entire sentence time. If my reading of their description of the HM-LSTM regression is correct, it is surprising that the regression weights are similar between the HM-LSTM model and the mTRF model.
However, the code that the authors uploaded to OSF seems to clarify this issue. In the file ridge_lstm.py, the authors construct the main regressor matrices called X1 and X2 which are passed to sklearn to do the ridge regression. This ridge regression step is calculated on the continuous 10-minute bouts of EEG and stimuli, and it is calculated in a loop over lag times, from -100 ms to 300 ms lag. These regressor matrices are initialized as zeros, and are then filled in two steps: the HM_LSTM model unit weights are read from numpy files and written to the matrices at one timepoint per sentence (as the authors describe in the text), and the traditional phoneme, syllable, etc. annotations are ALSO read in (from csv files) and written to the matrices, putting 1s at every timepoint of those corresponding onsets/offsets. Thus the actual model regressor matrix for the authors' main EEG results includes BOTH the HM_LSTM model weights for each sentence AND the feature/annotation times, for whichever of the 5 features is being analyzed (phonemes, syllables, words, phrases, or sentences).
So for instance, for the syllable HM_LSTM regression results, the regressor matrix contains: 1) the HM_LSTM model weights corresponding to syllables (a static representation, placed once per sentence offset time), AND 2) the syllable onsets themselves, placed as a row of 1s at every syllable onset time. And as another example, for the word HM_LSTM regression results, the regressor matrix contains: 1) the HM_LSTM model weights corresponding to words (a static representation, placed once per sentence offset time), AND 2) the word onsets themselves, placed as a row of 1s at every word onset time.
If my reading of the code is correct, there are two main points of clarification for interpreting these methods:
First, the authors' window of analysis of the EEG is not "limited" to 400 ms as they say; rather the time dimension of both their ridge regression results and their traditional mTRF analysis is simply lags (400 ms-worth), and the responses/receptive fields are calculated over the entire 10-minute trials. This is the normal way of calculating receptive fields in a continuous paradigm. The authors seem to be focusing on the peri-sentence offset time points because that is where the HM_LSTM model weights are placed in the regressor matrix. Also because of this issue, it is not really correct when the authors say that some significant effect occurred at some latency "after sentence offset". The lag times of the regression results should have the traditional interpretation of lag/latency in receptive field analyses.
Second, as both the traditional linguistic feature annotations and the HM_LSTM model weights are part of the regression for the main ridge regression results here, it is not known what the contribution specifically of the HM_LSTM portion of the regression was. Because the more traditional mTRF analysis showed many similar results to the main ridge regression results here, it seems probable that the simple feature annotations themselves, rather than the HM_LSTM model weights, are responsible for the main EEG results. A further analysis separating these two sets of regressors would shed light on this question.