10,000 Matching Annotations
  1. Oct 2024
    1. eLife Assessment

      This useful study uses an intranasal mouse infection model with Streptococcus suis, a gram-positive bacterial pathogen that causes severe losses in pigs around the world. The manuscript provides insights that the capsular polysaccharide, one of the virulence factors of this pathogen, contributes to tissue dissemination and neurotropism in the host. However, the evidence is currently incomplete, and further experiments and careful interpretation of the current results and methods used are necessary to support the conclusions of the manuscript.

    2. Reviewer #1 (Public review):

      Summary:

      The manuscript by Wang et al. investigates the interesting relationship between Streptococcus suis (S. suis) growth phases and levels of virulence factor, specifically the capsular polysaccharide (CPS), in the bacterial cell wall. S. suis is a gram positive bacterial pathogen that causes important losses in the swine industry worldwide. Interestingly, S. suis is also a resident bacteria in the pig tonsils. Vaccination against bacterial infections such as S. suis can be difficult, and understanding how the serotype of a bacterial pathogen impacts what body sites are infected and the dynamics of pathogen dissemination is critical. In this case, this manuscript looks at neuroinvasion of S. suis following intranasal delivery because this pathogen causes meningitis in infected hosts. Further, understanding host - pathogen interactions at early time points in the upper respiratory tract may have broad implications for vaccine development.

      The authors use an understudied mouse intranasal infection model of S. suis to connect growth phase related CPS abundance to the pathogenicity of the bacteria in the nose and blood.

      Adoptive transfer of serum against either CPS or V5 (five other virulence factors) supports the idea that S. suis CPS levels are an important factor that shapes how this bacterium reaches different organs.

      Some conclusions are not completely supported by the present data, and at times the manuscript is disjoint and hard to follow. While the work has some interesting observations, additional experiments and controls are warranted to support the claims of the manuscript .

      Strengths:

      The model of intranasal infection is compelling to expand upon work previously done in vitro and with systemic routes of infection. The histology and fluorescent imaging of the olfactory epithelium and olfactory bulb complement work in figure 2 about the attachment of S. Suis to epithelial cells and the bacterial burden over time in different organs of figure 3. Histology was performed at 1 hour and 9 days after intranasal infection with stationary phase S. Suis and drives home that this pathogen can invade the olfactory nerve and may potentially cause bacterial meningitis seen in some infected swine.

      The adoptive transfer of either anti-CPS or anti-V5 to mice before infection at both longer (12 hr), and shorter (1 hr) time points is useful to demonstrate that the changes in cell wall composition between the NALT/CSF and blood compartments result in different efficacy in clearing bacteria from those locations. This is fundamental for the development of vaccines for the swine industry and begs those developing other bacterial vaccines to consider what virulence factors are the most useful as neutralizing antibody targets at the sight of bacterial invasion.

      Demonstrating that the amount of CPS within the cell wall of S. suis is related to the growth phase of the bacteria is an important consideration for vaccine development. While others had previously shown that CPS levels were higher in the blood than in the CNS, and that CPS decreases the invasion of epithelial cells, the close look at the olfactory epithelium at an early time point of 1 hr ties together in vitro findings. The control of a CPS-negative strain was critical to understanding their findings. The location and the microbial community that bacterial pathogens live within may change the growth phase and therefore also the cell wall components.

      Weaknesses:

      While the authors present compelling data that is relevant to the development of anti-bacterial vaccinations, the data does not completely match their assertions and there are places where some further investigation would further the impact of their interesting study.

      Major concerns for the manuscript:

      -The intranasal infections were done with S. suis in the stationary phase which has been shown to have less CPS on the cell wall. While this mimics the literature that shows S. Suis to have less CPS in the CNS, the difference in the pathogenesis of a log phase vs. stationary phage intranasal infection would be interesting. Especially because the bacteria is a part of the natural microbial community of swine tonsils, it is curious if the change in growth phase and therefore CPS levels may be a causative reason for pathogenic invasion in some pigs.

      -The authors should consider taking the bacteria from NALT/CSF and blood and compare the lag times bacteria from different organs take to enter a log growth phase to show whether the difference in CPS is because S. suis in each location is in a different growth phase. If log phase bacteria were intranasally delivered, would it adapt a stationary phase life strategy? How long would that take?

      -Authors should be cautious about claims about S. suis downregulating CPS in the NALT for increased invasion and upregulating CPS to survive phagocytosis in blood. While it is true that the data shows that there are different levels of CPS in these locations, the regulation and mechanism of the recorded and observed cell wall difference are not investigated past the correlation to the growth phase.

      - The mouse model used in this manuscript is useful but cannot reproduce the nasal environment of the natural pig host. It is not clear if the NALTs of pigs and mice have similar microbial communities and how this may affect the pathogenesis of S. Suis in the mouse. Because the authors show a higher infection rate in the mouse with acetic acid, they may want to consider investigating what the mouse NALT microenvironment is naturally doing to exclude more bacterial invasion. Is it simply a host mismatch or is there something about the microbiome or steady-state immune system in the nose of mice that is different from pigs?

      -I have some concerns regarding the images shown for neuroinvasion because I think the authors mistake several compartments of the mouse nasal cavity as well as the olfactory bulb. These issues are critical because neuroinvasion is one of the major conclusions of this work.

    3. Reviewer #2 (Public review):

      In this manuscript from Wang et al., the authors seek to examine the role of capsular polysaccharides (CPS) in invasive S. suis pathogenesis. They show that CPS thickness variations associate with isolation from different compartments within the infected mouse and that CPS promotes resistance to blood borne immune mechanisms. The authors conclude that thick CPS inhibits colonization/invasion of the NALT and rather antisera against non-CPS. These results are interesting and thought provoking and provide the continued basis for future experiments that delve further into immune mechanisms. However, there are serious concerns about data collection and interpretation that require further data to provide an accurate conclusion. Some of these concerns are highlighted below:

      In figure 2, the authors conclude that high levels of CPS confer resistance to phagocytic killing in blood exposed S. suis. However, it seems equally likely that this is resistance against complement mediated killing. It would be important to compare S. suis killing in animals depleted of complement components (C3 and C5-9).

      Intranasal administration non-CPS antisera provides a nice contrast to intravenous administration, especially in light of the recently identified "blood-olfactory barrier". Can the authors provide any insight into how long and where this antibody would be located after intranasal administration? Would this be antibody mediated cellular resistance, or something akin to simple antibody "neutralization"

      The micrographs in Figure 7 depict anatomy from the respiratory mucosa. While there is no histochemical identification of neurons, the tissues labeled OE are almost certainly not olfactory and in fact respiratory. However, more troubling is that in figures 7A,a,b,e, and f, the lateral nasal organ has been labeled as the olfactory bulb. This undermines the conclusion of CNS invasion, and also draws into question other experiments in which the brain and CSF are measured.

      Micrographs of brain tissue in 7B are taken from distal parts of the brain, whereas if olfactory neuroinvasion were occurring, the bacteria would be expected to arrive in the olfactory bulb. It's also difficult to understand how an inflammatory process would be developed to this point in the brain -even if we were looking at the appropriate region of the brain -within an hour of inoculation (is there a control for acetic acid induced brain inflammation?). Some explanations about the speed of the immune responses recorded are warranted.

      The detected presence of S. suis in the CSF 0.5hr following intranasal inoculation is difficult to understand from an anatomical perspective. This is especially true when the amount of S. suis is nearly the same as that found within the NALT. Even motile pathogens would need far longer than 0.5hr to get into the brain, so it's exceedingly difficult to understand how this could occur so extensively in under an hour. The authors are quantifying CSF as anything that comes out of the brain after mincing. Firstly, this should more accurately be referred to as "brain", not CSF. Secondly, is it possible that the lateral nasal organ -which is mistakenly identified as olfactory bulb in figure 7- is being included in the CNS processing? This would explain the equivalent amounts of S. suis in NALT and "CSF".

      To support their conclusions about neuroinvasion along the olfactory route and /CSF titer the authors should provide more compelling images to support this conclusion: sections stained for neurons and S. suis, images of the actual olfactory bulb (neurons, glomerular structure etc).

    1. eLife Assessment

      A regression discontinuity analysis finds essentially no effect of 1 additional year of secondary education on brain structure in adulthood. This is a valuable finding that adds to the literature on the impact of education on brain health. The evidence presented is solid, with strengths including methodological novelty as well as principled study design; the impact is, however, limited as the manipulated variable only relates to a single additional year of education (remaining in education to 15 vs 16 years of age). The interpretation is further missing discussion of the healthy volunteer bias of the UK Biobank sample, amplified in the imaging extension.

    2. Reviewer #1 (Public review):

      Summary:

      This fascinating manuscript studies the effect of education on brain structure through a natural experiment. Leveraging the UK BioBank, these authors study the causal effect of education using causal inference methodology that focuses on legislation for an additional mandatory year of education in a regression discontinuity design.

      Strengths:

      The methodological novelty and study design were viewed as strong, as was the import of the question under study. The evidence presented is solid. The work will be of broad interest to neuroscientists

      Weaknesses:

      There were several areas which might be strengthed from additional consideration from a methodological perspective.

    3. Reviewer #3 (Public review):

      Summary:

      This study investigates evidence for a hypothesised, causal relationship between education, specifically the number of years spent in school, and brain structure as measured by common brain phenotypes such as surface area, cortical thickness, total volume, and diffusivity.

      To test their hypothesis, the authors rely on a "natural" intervention, that is, the 1972 ROSLA act that mandated an extra year of education for all 15-year-olds. The study's aim is to determine potential discontinuities in the outcomes of interest at the time of the policy change, which would indicate a causal dependence. Naturalistic experiments of this kind are akin to randomised controlled trials, the gold standard for answering questions of causality.

      Using two complementary, regression-based approaches, the authors find no discernible effect of spending an extra year in primary education on brain structure. The authors further demonstrate that observational studies showing an effect between education and brain structure may be confounded and thus unreliable when assessing causal relationships.

      Strengths:

      (1) A clear strength of this study is the large sample size totalling up to 30k participants from the UK Biobank. Although sample sizes for individual analyses are an order of magnitude smaller, most neuroimaging studies usually have to rely on much smaller samples.

      (2) This study has been preregistered in advance, detailing the authors' scientific question, planned method of inquiry, and intended analyses, with only minor, justifiable changes in the final analysis.

      (3) The analyses look at both global and local brain measures used as outcomes, thereby assessing a diverse range of brain phenotypes that could be implicated in a causal relationship with a person's level of education.

      (4) The authors use multiple methodological approaches, including validation and sensitivity analyses, to investigate the robustness of their findings and, in the case of correlational analysis, highlight differences with related work by others.

      (5) The extensive discussion of findings and how they relate to the existing, somewhat contradictory literature gives a comprehensive overview of the current state of research in this area.

      Weaknesses:

      (1) This study investigates a well-posed but necessarily narrow question in a specific setting: 15-year-old British students born around 1957 who also participated in the UKB imaging study roughly 60 years later. Thus conclusions about the existence or absence of any general effect of the number of years of education on the brain's structure are limited to this specific scenario.

      (2) The authors address potential concerns about the validity of modelling assumptions and the sensitivity of the regression discontinuity design approach. However, the possibility of selection and cohort bias remains and is not discussed clearly in the paper. Other studies (e.g. Davies et al 2018, https://www.nature.com/articles/s41562-017-0279-y) have used the same policy intervention to study other health-related outcomes and have established ROSLA as a valid naturalistic experiment. Still, quoting Davies et al. (2018), "This assumes that the participants who reported leaving school at 15 years of age are a representative sample of the sub-population who left at 15 years of age. If this assumption does not hold, for example, if the sampled participants who left school at 15 years of age were healthier than those in the population, then the estimates could underestimate the differences between the groups.". Recent studies (Tyrrell 2021, Pirastu 2021) have shown that UK Biobank participants are on average healthier than the general population. Moreover, the imaging sub-group has an even stronger "healthy" bias (Lyall 2022).

      (3) The modelling approach used in this study requires that all covariates of no interest are equal before and after the cut-off, something that is impossible to test. Mentioned only briefly, the inclusion and exclusion of covariates in the model are not discussed in detail. Standard imaging confounds such as head motion and scanning site have been included but other factors (e.g. physical exercise, smoking, socioeconomic status, genetics, alcohol consumption, etc.) may also play a role.

    4. Author response:

      To Reviewer #1:

      Thank you for your kind words regarding the novelty, study design, and evidence presented. We will clarify our language when describing fuzzy local-linear regression discontinuity analysis. We thank you for this feedback as our goals are to introduce these methods to a neuroscientific audience. Lastly, we will respond and clarify the methodological points, including post-selection inference, bandwidths, and Bayesian analysis in version 2.

      To Reviewers #2 and #3:

      We thank you both for your constructive feedback, specifically in highlighting 1) the scope of the intervention and 2) the UKB-neuro healthy volunteer bias. In the next manuscript version, we will expand our discussion of plausible reasons for not finding an effect – weighing up the strengths and limitations of our study in 3 aspects; statistical (RD power), design-based (lack of representativeness vs. large sample), and mechanistic (the impact/or lack thereof of one-year of education on neural plasticity decades later). As we believe the approach of natural experiments with RD designs has considerable promise for the field of population cognitive neuroscience beyond this particular study, we will address each of these points within a broader section focused on considerations on how to optimize the insight, power, and inferences gained in future work within and beyond Biobank. Moreover, we will situate our discussion on the magnitude of the educational intervention among a broader discussion of cognitive training versus education, and short - versus long-term effects. We believe revising the manuscript will improve interpretation for the reader and thank you for your in-depth feedback. Lastly, we will provide a point-by-point response in the next version.

    1. eLife Assessment

      This is an important study examining the role of conserved PCH-2 protein at different stages of C. elegans meiosis. The authors use elegant molecular genetic approaches to provide convincing evidence to support their claims. The work will be of interest to scientists studying meiosis, DNA recombination, and chromosome segregation.

    2. Reviewer #1 (Public review):

      The conserved AAA-ATPase PCH-2 has been shown in several organisms including C. elegans to remodel classes of HORMAD proteins that act in meiotic pairing and recombination. In some organisms the impact of PCH-2 mutations is subtle but becomes more apparent when other aspects of recombination are perturbed. Patel et al. performed a set of elegant experiments in C. elegans aimed at identifying conserved functions of PCH-2. Their work provides such an opportunity because in C. elegans meiotically expressed HORMADs localize to meiotic chromosomes independently of PCH-2. Work in C. elegans also allows the authors to focus on nuclear PCH-2 functions as opposed to cytoplasmic functions also seen for PCH-2 in other organisms.

      The authors performed the following experiments:

      (1) They constructed C. elegans animals with SNPs that enabled them to measure crossing over in intervals that cover most of four of the six chromosomes. They then showed that double-crossovers, which were common on most of the four chromosomes in wild-type, were absent in pch-2. They also noted shifts in crossover distribution in the four chromosomes.

      (2) Based on the crossover analysis and previous studies they hypothesized that PCH-2 plays a role at an early stage in meiotic prophase to regulate how SPO-11 induced double-strand breaks are utilized to form crossovers. They tested their hypothesis by performing ionizing irradiation and depleting SPO-11 at different stages in meiotic prophase in wild-type and pch-2 mutant animals. The authors observed that irradiation of meiotic nuclei in zygotene resulted in pch-2 nuclei having a larger number of nuclei with 6 or greater crossovers (as measured by COSA-1 foci) compared to wildtype. Consistent with this observation, SPO11 depletion, starting roughly in zygotene, also resulted in pch-2 nuclei having an increase in 6 or more COSA-1 foci compared to wild type. The increased number at this time point appeared beneficial because a significant decrease in univalents was observed.

      (3) They then asked if the above phenotypes correlated with the localization of MSH-5, a factor that stabilizes crossover-specific DNA recombination intermediates. They observed that pch-2 mutants displayed an increase in MSH-5 foci at early times in meiotic prophase and an unexpectedly higher number at later times. They conclude based on the differences in early MSH-5 localization and the SPO-11 and irradiation studies that PCH-2 prevents early DSBs from becoming crossovers and early loading of MSH-5. By analyzing different HORMAD proteins that are defective in forming the closed conformation acted upon by PCH-2, they present evidence that MSH-5 loading was regulated by the HIM-3 HORMAD.

      (4) They performed a crossover homeostasis experiment in which DSB levels were reduced. The goal of this experiment was to test if PCH-2 acts in crossover assurance. Interestingly, in this background PCH-2 negative nuclei displayed higher levels of COSA-1 foci compared to PCH-2 positive nuclei. This observation and a further test of the model suggested that "PCH-2's presence on the SC prevents crossover designation."

      (5) Based on their observations indicating that early DSBS are prevented from becoming crossovers by PCH-2, the authors hypothesized that the DNA damage kinase CHK-2 and PCH-2 act to control how DSBs enter the crossover pathway. This hypothesis was developed based on their finding that PCH-2 prevents early DSBs from becoming crossovers and previous work showing that CHK-2 activity is modulated during meiotic recombination progression. They tested their hypothesis using a mutant synaptonemal complex component that maintains high CHK-2 activity that cannot be turned off to enable crossover designation. Their finding that the pch-2 mutation suppressed the crossover defect (as measured by COSA-1 foci) supports their hypothesis.

      Based on these studies the authors provide convincing evidence that PCH-2 prevents early DSBs from becoming crossovers and controls the number and distribution of crossovers to promote a regulated mechanism that ensures the formation of obligate crossovers and crossover homeostasis. As the authors note, such a mechanism is consistent with earlier studies suggesting that early DSBs could serve as "scouts" to facilitate homolog pairing or to coordinate the DNA damage response with repair events that lead to crossing over. The detailed mechanistic insights provided in this work will certainly be used to better understand functions for PCH-2 in meiosis in other organisms. My comments below are aimed at improving the clarity of the manuscript.

      Comments

      (1) It appears from reading the Materials and Methods that the SNPs used to measure crossing over were obtained by mating Hawaiian and Bristol strains. It is not clear to this reviewer how the SNPs were introduced into the animals. Was crossing over measured in a single animal line? Were the wild-type and pch-2 mutations made in backgrounds that were isogenic with respect to each other? This is a concern because it is not clear, at least to this reviewer, how much of an impact crossing different ecotypes will have on the frequency and distribution of recombination events (and possibly the recombination intermediates that were studied).

      (2) The authors state that in pch-2 mutants there was a striking shift of crossovers (line 135) to the PC end for all of the four chromosomes that were tested. I looked at Figure 1 for some time and felt that the results were more ambiguous. Map distances seemed similar at the PC end for wildtype and pch-2 on Chrom. I. While the decrease in crossing over in pch-2 appeared significant for Chrom. I and III, the results for Chrom. IV, and Chrom. X. seemed less clear. Were map distances compared statistically? At least for this reviewer the effects on specific intervals appear less clear and without a bit more detail on how the animals were constructed it's hard for me to follow these conclusions.

      (3) Figure 2. I'm curious why non-irradiated controls were not tested side-by-side for COSA-1 staining. It just seems like a nice control that would strengthen the authors' arguments.

      (4) Figure 3. It took me a while to follow the connection between the COSA-1 staining and DAPI staining panels (12 hrs later). Perhaps an arrow that connects each set of time points between the panels or just a single title on the X-axis that links the two would make things clearer.

    3. Reviewer #2 (Public review):

      Summary:

      This paper has some intriguing data regarding the different potential roles of Pch-2 in ensuring crossing over. In particular, the alterations in crossover distribution and Msh-5 foci are compelling. My main issue is that some of the models are confusingly presented and would benefit from some reframing. The role of Pch-2 across organisms has been difficult to determine, the ability to separate pairing and synapsis roles in worms provides a great advantage for this paper.

      Strengths:

      Beautiful genetic data, clearly made figures. Great system for studying the role of Pch-2 in crossing over.

      Weaknesses:

      (1) For a general audience, definitions of crossover assurance, crossover eligible intermediates, and crossover designation would be helpful. This applies to both the proposed molecular model and the cytological manifestation that is being scored specifically in C. Elegans.

      (2) Line 62: Is there evidence that DSBs are introduced gradually throughout the early prophase? Please provide references.

      (3) Do double crossovers show strong interference in worms? Given that the PC is at the ends of chromosomes don't you expect double crossovers to be near the chromosome ends and thus the PC?

      (4) Line 155 - if the previous data in Deshong et al is helpful it would be useful to briefly describe it and how the experimental caveats led to misinterpretation (or state that further investigation suggests a different model etc.). Many readers are unlikely to look up the paper to find out what this means.

      (5) Line 248: I am confused by the meaning of crossover assurance here - you see no difference in the average number of COSA-1 foci in Pch-2 vs. wt at any time point. Is it the increase in cells with >6 COSA-1 foci that shows a loss of crossover assurance? That is the only thing that shows a significant difference (at the one time point) in COSA-1 foci. The number of dapi bodies shows the loss of Pch-2 increases crossover assurance (fewer cells with unattached homologs). So this part is confusing to me. How does reliably detecting foci vs. DAPI bodies explain this?

      (6) Line 384: I am confused. I understand that in the dsb-2/pch2 mutant there are fewer COSA-1 foci. So fewer crossovers are designated when DSBs are reduced in the absence of PCH-2. How then does this suggest that PCH-2's presence on the SC prevents crossover designation? Its absence is preventing crossover designation at least in the dsb-2 mutant.

      (7) Discussion Line 535: How do you know that the crossovers that form near the PCs are Class II and not the other way around? Perhaps early forming Class I crossovers give time for a second Class II crossover to form. In budding yeast, it is thought that synapsis initiation sites are likely sites of crossover designation and class I crossing over. Also, the precursors that form class I and II crossovers may be the same or highly similar to each other, such that Pch-2's actions could equally affect both pathways.

    4. Reviewer #3 (Public review):

      Summary:

      This manuscript describes an in-depth analysis of the effect of the AAA+ ATPase PCH-2 on meiotic crossover formation in C. elegant. The authors reach several conclusions, and attempt to synthesize a 'universal' framework for the role of this factor in eukaryotic meiosis.

      Strengths:

      The manuscript makes use of the advantages of the 'conveyor' belt system within the c.elegans reproductive tract, to enable a series of elegant genetic experiments.

      Weaknesses:

      A weakness of this manuscript is that it heavily relies on certain genetic/cell biological assays that can report on distinct crossover outcomes, without clear and directed control over other aspects and variables that might also impact the final repair outcome. Such assays are currently out of reach in this model system.

      In general, this manuscript could be more generally accessible to non-C.elegans readers. Currently, the manuscript is hard to digest for non-experts (even if meiosis researchers). In addition, the authors should be careful to consider alternative explanations for certain results. At several steps in the manuscript, results could ostensibly be caused by underlying defects that are currently unknown (for example, can we know for sure that pch-2 mutants do not suffer from altered DSB patterning, and how can we know what the exact functional and genetic interactions between pch-2 and HORMAD mutants tell us?). Alternative explanations are possible and it would serve the reader well to explicitly name and explain these options throughout the manuscript.

    5. Author response:

      Public Reviews: 

      Reviewer #1 (Public review): 

      The conserved AAA-ATPase PCH-2 has been shown in several organisms including C. elegans to remodel classes of HORMAD proteins that act in meiotic pairing and recombination. In some organisms the impact of PCH-2 mutations is subtle but becomes more apparent when other aspects of recombination are perturbed. Patel et al. performed a set of elegant experiments in C. elegans aimed at identifying conserved functions of PCH-2. Their work provides such an opportunity because in C. elegans meiotically expressed HORMADs localize to meiotic chromosomes independently of PCH-2. Work in C. elegans also allows the authors to focus on nuclear PCH-2 functions as opposed to cytoplasmic functions also seen for PCH-2 in other organisms. 

      The authors performed the following experiments: 

      (1) They constructed C. elegans animals with SNPs that enabled them to measure crossing over in intervals that cover most of four of the six chromosomes. They then showed that doublecrossovers, which were common on most of the four chromosomes in wild-type, were absent in pch-2. They also noted shifts in crossover distribution in the four chromosomes. 

      (2) Based on the crossover analysis and previous studies they hypothesized that PCH-2 plays a role at an early stage in meiotic prophase to regulate how SPO-11 induced double-strand breaks are utilized to form crossovers. They tested their hypothesis by performing ionizing irradiation and depleting SPO-11 at different stages in meiotic prophase in wild-type and pch-2 mutant animals. The authors observed that irradiation of meiotic nuclei in zygotene resulted in pch-2 nuclei having a larger number of nuclei with 6 or greater crossovers (as measured by COSA-1 foci) compared to wildtype. Consistent with this observation, SPO11 depletion, starting roughly in zygotene, also resulted in pch-2 nuclei having an increase in 6 or more COSA-1 foci compared to wild type. The increased number at this time point appeared beneficial because a significant decrease in univalents was observed. 

      (3) They then asked if the above phenotypes correlated with the localization of MSH-5, a factor that stabilizes crossover-specific DNA recombination intermediates. They observed that pch-2

      mutants displayed an increase in MSH-5 foci at early times in meiotic prophase and an unexpectedly higher number at later times. They conclude based on the differences in early MSH-5 localization and the SPO-11 and irradiation studies that PCH-2 prevents early DSBs from becoming crossovers and early loading of MSH-5. By analyzing different HORMAD proteins that are defective in forming the closed conformation acted upon by PCH-2, they present evidence that MSH-5 loading was regulated by the HIM-3 HORMAD. 

      (4) They performed a crossover homeostasis experiment in which DSB levels were reduced. The goal of this experiment was to test if PCH-2 acts in crossover assurance. Interestingly, in this background PCH-2 negative nuclei displayed higher levels of COSA-1 foci compared to PCH-2 positive nuclei. This observation and a further test of the model suggested that "PCH-2's presence on the SC prevents crossover designation." 

      (5) Based on their observations indicating that early DSBS are prevented from becoming crossovers by PCH-2, the authors hypothesized that the DNA damage kinase CHK-2 and PCH2 act to control how DSBs enter the crossover pathway. This hypothesis was developed based on their finding that PCH-2 prevents early DSBs from becoming crossovers and previous work showing that CHK-2 activity is modulated during meiotic recombination progression. They tested their hypothesis using a mutant synaptonemal complex component that maintains high CHK-2 activity that cannot be turned off to enable crossover designation. Their finding that the pch-2 mutation suppressed the crossover defect (as measured by COSA-1 foci) supports their hypothesis. 

      Based on these studies the authors provide convincing evidence that PCH-2 prevents early DSBs from becoming crossovers and controls the number and distribution of crossovers to promote a regulated mechanism that ensures the formation of obligate crossovers and crossover homeostasis. As the authors note, such a mechanism is consistent with earlier studies suggesting that early DSBs could serve as "scouts" to facilitate homolog pairing or to coordinate the DNA damage response with repair events that lead to crossing over. The detailed mechanistic insights provided in this work will certainly be used to better understand functions for PCH-2 in meiosis in other organisms. My comments below are aimed at improving the clarity of the manuscript. 

      We thank the reviewer for their concise summary of our manuscript and their assessment of our work as “convincing” and providing “detailed mechanistic insight.”

      Comments 

      (1) It appears from reading the Materials and Methods that the SNPs used to measure crossing over were obtained by mating Hawaiian and Bristol strains. It is not clear to this reviewer how the SNPs were introduced into the animals. Was crossing over measured in a single animal line? Were the wild-type and pch-2 mutations made in backgrounds that were isogenic with respect to each other? This is a concern because it is not clear, at least to this reviewer, how much of an impact crossing different ecotypes will have on the frequency and distribution of recombination events (and possibly the recombination intermediates that were studied). 

      We will clarify these issues in the Materials and Methods of an updated preprint. The control and pch-2 mutants were isogenic in either the Bristol or Hawaiian backgrounds. Control lines were the original Bristol and Hawaiian lines and pch-2 mutants were originally made in the Bristol line and backcrossed at least 3 times before analysis. Hawaiian pch-2 mutants were made by backcrossing pch-2 mutants at least 7 times to the Hawaiian background and verifying the presence of Hawaiian SNPs on all chromosomes tested in the recombination assay. To perform the recombination assays, these isogenic lines were crossed to generate the relevant F1s.

      (2) The authors state that in pch-2 mutants there was a striking shift of crossovers (line 135) to the PC end for all of the four chromosomes that were tested. I looked at Figure 1 for some time and felt that the results were more ambiguous. Map distances seemed similar at the PC end for wildtype and pch-2 on Chrom. I. While the decrease in crossing over in pch-2 appeared significant for Chrom. I and III, the results for Chrom. IV, and Chrom. X. seemed less clear. Were map distances compared statistically? At least for this reviewer the effects on specific intervals appear less clear and without a bit more detail on how the animals were constructed it's hard for me to follow these conclusions. 

      We hope that the added details above makes the results of these assays more clear. Map distances were compared and did not satisfy statistical significance, except where indicated. While we agree that the comparisons between control animals and pch-2 mutants may seem less clear with individual chromosomes, we argue that more general patterns become clear when analyzing multiple chromosomes. Indeed, this is why we expanded our recombination analysis beyond Chromosome III and the X Chromosomes, as reported in Deshong, 2014. 

      (3) Figure 2. I'm curious why non-irradiated controls were not tested side-by-side for COSA-1 staining. It just seems like a nice control that would strengthen the authors' arguments. 

      We will add these controls in the updated preprint.

      (4) Figure 3. It took me a while to follow the connection between the COSA-1 staining and DAPI staining panels (12 hrs later). Perhaps an arrow that connects each set of time points between the panels or just a single title on the X-axis that links the two would make things clearer. 

      We will make changes in the updated preprint to make this figure more clear.

      Reviewer #2 (Public review): 

      Summary: 

      This paper has some intriguing data regarding the different potential roles of Pch-2 in ensuring crossing over. In particular, the alterations in crossover distribution and Msh-5 foci are compelling. My main issue is that some of the models are confusingly presented and would benefit from some reframing. The role of Pch-2 across organisms has been difficult to determine, the ability to separate pairing and synapsis roles in worms provides a great advantage for this paper. 

      Strengths: 

      Beautiful genetic data, clearly made figures. Great system for studying the role of Pch-2 in crossing over. 

      We thank the reviewers for their constructive and useful summary of our manuscript and the analysis of its strengths. 

      Weaknesses: 

      (1) For a general audience, definitions of crossover assurance, crossover eligible intermediates, and crossover designation would be helpful. This applies to both the proposed molecular model and the cytological manifestation that is being scored specifically in C. elegans. 

      We will make these changes in an updated preprint.

      (2) Line 62: Is there evidence that DSBs are introduced gradually throughout the early prophase? Please provide references. 

      We will reference Woglar and Villeneuve 2018 and Joshi et. al. 2015 to support this statement in the updated preprint.

      (3) Do double crossovers show strong interference in worms? Given that the PC is at the ends of chromosomes don't you expect double crossovers to be near the chromosome ends and thus the PC? 

      Despite their rarity, double crossovers do show interference in worms. However, the PC is limited to one end of the chromosome. Therefore, even if interference ensures the spacing of these double crossovers, the preponderance of one of these crossovers toward one end (and not both ends) suggest something functionally unique about the PC end.

      (4) Line 155 - if the previous data in Deshong et al is helpful it would be useful to briefly describe it and how the experimental caveats led to misinterpretation (or state that further investigation suggests a different model etc.). Many readers are unlikely to look up the paper to find out what this means. 

      We will add this to the updated preprint.

      (5) Line 248: I am confused by the meaning of crossover assurance here - you see no difference in the average number of COSA-1 foci in Pch-2 vs. wt at any time point. Is it the increase in cells with >6 COSA-1 foci that shows a loss of crossover assurance? That is the only thing that shows a significant difference (at the one time point) in COSA-1 foci. The number of dapi bodies shows the loss of Pch-2 increases crossover assurance (fewer cells with unattached homologs). So this part is confusing to me. How does reliably detecting foci vs. DAPI bodies explain this? 

      We apologize for the confusion and will make this more clear in an updated perprint. The reviewer is correct that we do not see a difference in the average number of GFP::COSA1 foci at all time points in this experiment, even though we do see a difference in the number of DAPI stained bodies (an increase in crossover assurance in pch-2 mutants). What we meant to convey is that because of PCH-2’s dual role in regulating crossover formation (inhibiting it in early prophase, guaranteeing assurance later), the average number of GFP::COSA-1 foci at all time points also reflects this later role, resulting in this average being lower than if PCH-2 only inhibited crossovers early in meiotic prophase. We have shown that this later role does not significantly affect the average number of DAPI stained bodies, allowing us to see the role of PCH-2 in early meiotic prophase on crossover formation more clearly.

      (6) Line 384: I am confused. I understand that in the dsb-2/pch2 mutant there are fewer COSA-1 foci. So fewer crossovers are designated when DSBs are reduced in the absence of PCH-2.

      How then does this suggest that PCH-2's presence on the SC prevents crossover designation? Its absence is preventing crossover designation at least in the dsb-2 mutant. 

      We will also make this more clear in an updated preprint, as well as provide additional evidence to support this claim. In this experiment, we had identified three possible explanations for why PCH-2 persists on some nuclei that do not have GFP::COSA-1 foci: 1) PCH-2 removal is coincident with crossover designation; 2) PCH-2 removal depends on crossover designation; and 3) PCH-2 removal facilitates crossover designation. The decrease in the number of GFP::COSA-1 foci in dsb-2::AID;pch-2 mutants argues against the first two possibilities, suggesting that the third might be correct. We have additional evidence that we will include in an updated preprint that should provide stronger support and make this more clear.

      (7) Discussion Line 535: How do you know that the crossovers that form near the PCs are Class II and not the other way around? Perhaps early forming Class I crossovers give time for a second Class II crossover to form. In budding yeast, it is thought that synapsis initiation sites are likely sites of crossover designation and class I crossing over. Also, the precursors that form class I and II crossovers may be the same or highly similar to each other, such that Pch-2's actions could equally affect both pathways. 

      We do not know that the crossovers that form near the PC are Class II but hypothesize that they are based on the close, functional relationship that exists between Class I crossovers and synapsis and the apparent antagonistic relationship that exists between Class II crossovers and synapsis. We agree that Class I and Class II crossover precursors are likely to be the same or highly similar, exhibit extensive crosstalk that may complicate straightforward analysis and PCH-2 is likely to affect both, as strongly suggested by our GFP::MSH-5 analysis. We present this hypothesis based on the apparent relationship between PCH-2 and synapsis in several systems but agree that it needs to be formally tested. We will make this argument more clear in an updated preprint.

      Reviewer #3 (Public review): 

      Summary: 

      This manuscript describes an in-depth analysis of the effect of the AAA+ ATPase PCH-2 on meiotic crossover formation in C. elegant. The authors reach several conclusions, and attempt to synthesize a 'universal' framework for the role of this factor in eukaryotic meiosis. 

      Strengths: 

      The manuscript makes use of the advantages of the 'conveyor' belt system within the c.elegans reproductive tract, to enable a series of elegant genetic experiments. 

      We thank this reviewer for the useful assessment of our manuscript and the articulation of its strengths.

      Weaknesses: 

      A weakness of this manuscript is that it heavily relies on certain genetic/cell biological assays that can report on distinct crossover outcomes, without clear and directed control over other aspects and variables that might also impact the final repair outcome. Such assays are currently out of reach in this model system. 

      In general, this manuscript could be more generally accessible to non-C.elegans readers. Currently, the manuscript is hard to digest for non-experts (even if meiosis researchers). In addition, the authors should be careful to consider alternative explanations for certain results. At several steps in the manuscript, results could ostensibly be caused by underlying defects that are currently unknown (for example, can we know for sure that pch-2 mutants do not suffer from altered DSB patterning, and how can we know what the exact functional and genetic interactions between pch-2 and HORMAD mutants tell us?). Alternative explanations are possible and it would serve the reader well to explicitly name and explain these options throughout the manuscript. 

      We will make the manuscript more accessible to non-C. elegans readers and discuss alternate explanations for specific results in an updated preprint.

    1. Reviewer #1 (Public review):

      The Bagnat and Rawls groups' previous published work (Park et al., 2019) described the kinetics and genetic basis of protein absorption in a specialized cell population of young vertebrates termed lysosome-rich enterocytes (LREs). In this study they seek to understand how the presence and composition of the microbiota impacts the protein absorption function of these cells and reciprocally, how diet and intestinal protein absorption function impact the microbiome.

      Strengths of the study include the functional assays for protein absorption performed in live larval zebrafish, which provides detailed kinetics on protein uptake and degradation with anatomic precision, and the gnotobiotic manipulations. The authors clearly show that the presence of the microbiota or of certain individual bacterial members slows the uptake and degradation of multiple different tester fluorescent proteins.

      To understand the mechanistic basis for these differences, the authors also provide detailed single-cell transcriptomic analyses of cells isolated based on both an intestinal epithelial cell identity (based on a transgenic marker) and their protein uptake activity. The data generated from these analyses, presented in Figures 3-5, are valuable for expanding knowledge about zebrafish intestinal epithelial cell identities, but of more limited interest to a broader readership. Some of the descriptive analysis in this section is circular because the authors define subsets of LREs (termed anterior and posterior) based on their fabp2 expression levels, but then go on to note transcriptional differences between these cells (for example in fabp2) that are a consequence of this initial subsetting.

      Inspired by their single-cell profiling and by previous characterization of the genes required for protein uptake and degradation in the LREs, the authors use quantitative hybridization chain reaction RNA-fluorescent in situ hybridization to examine transcript levels of several of these genes along the length of the LRE intestinal region of germ-free versus mono-associated larvae. They provide good evidence for reduced transcript levels of these genes that correlate with the reduced protein uptake in the mono-associated larval groups.

      The final part of the study (shown in Figure 7) characterized the microbiomes of 30-day-old zebrafish reared from 6-30 days on defined diets of low and high protein and with or without homozygous loss of the cubn gene required for protein uptake. The analysis of these microbiomes notes some significant differences between fish genotypes by diet treatments, but the discussion of these data does not provide strong support for the hypothesis that "LRE activity has reciprocal effects on the gut microbiome". The most striking feature of the MDS plot of Bray Curtis distance between zebrafish samples shown in Figure 7B is the separation by diet independent of host genotype, which is not discussed in the associated text. Additionally, the high protein diet microbiomes have a greater spread than those of the low protein treatment groups, with the high protein diet cubn mutant samples being the most dispersed. This pattern is consistent with the intestinal microbiota under a high protein diet regimen and in the absence of protein absorption machinery being most perturbed in stochastic ways than in hosts competent for protein uptake, consistent with greater beta dispersal associated with more dysbiotic microbiomes (described as the Anna Karenina principle here: https://pubmed.ncbi.nlm.nih.gov/28836573/). It would be useful for the authors to provide statistics on the beta dispersal of each treatment group.

      Overall, this study provides strong evidence that specific members of the microbiota differentially impact gene expression and cellular activities of enterocyte protein uptake and degradation, findings that have a significant impact on the field of gastrointestinal physiology. The work refines our understanding of intestinal cell types that contribute to protein uptake and their respective transcriptomes. The work also provides some evidence that microbiomes are modulated by enterocyte protein uptake capacity in a diet-dependent manner. These latter findings provide valuable datasets for future related studies.

    2. Reviewer #2 (Public review):

      Summary:

      The authors set out to determine how the microbiome and host genotype impact host protein-based nutrition.

      Strengths:

      The quantification of protein uptake dynamics is a major strength of this work and the sensitivity of this assay shows that the microbiome and even mono-associated bacterial strains dampen protein uptake in the host by causing down-regulation of genes involved in this process rather than a change in cell type.

      The use of fluorescent proteins in combination with transcript clustering in the single cell seq analysis deepens our understanding of the cells that participate in protein uptake along the intestine. In addition to the lysozome-rich enterocytes (LRE), subsets of enteroendocrine cells, acinar, and goblet cells also take up protein. Intriguingly, these non-LRE cells did not show lysosomal-based protein degradation; but importantly analysis of the transcripts upregulated in these cells include dab2 and cubn, genes shown previously as being essential to protein uptake.

      The derivation of zebrafish mono-associated with single strains of microbes paired with HCR to localize and quantify the expression of host protein absorption genes shows that different bacterial strains suppress these genes to variable extents.

      The analysis of microbiome composition, when host protein absorption is compromised in cubn-/- larvae or by reducing protein in the food, demonstrates that changes to host uptake can alter the abundance of specific microbial taxa like Aeramonas.

      Weaknesses:

      The finding that neurons are positive for protein uptake in the single-cell data set is not adequately discussed. It is curious because the cldn:GFP line used for sorting does not mark neurons and if the neurons are taking up mCherry via trans-synaptic uptake from EECs, those neurons should be mCherry+/GFP-; yet methods indicate GFP+ and GFP+/mCherry+ cells were the ones collected and analyzed.

    3. Reviewer #3 (Public review):

      Summary:

      Childers et al. address a fundamental question about the complex relationship within the gut: the link between nutrient absorption, microbial presence, and intestinal physiology. They focus on the role of lysosome-rich enterocytes (LREs) and the microbiota in protein absorption within the intestinal epithelium. By using germ-free and conventional zebrafishes, they demonstrate that microbial association leads to a reduction in protein uptake by LREs. Through impressive in vivo imaging of gavaged fluorescent proteins, they detail the degradation rate within the LRE region, positioning these cells as key players in the process. Additionally, the authors map protein absorption in the gut using single-cell sequencing analysis, extensively describing LRE subpopulations in terms of clustering and transcriptomic patterns. They further explore the monoassociation of ex-germ-free animals with specific bacterial strains, revealing that the reduction in protein absorption in the LRE region is strain-specific.

      Strengths:

      The authors employ state-of-the-art imaging to provide clear evidence of the protein absorption rate phenotype, focusing on a specific intestinal region. This innovative method of fluorescent protein tracing expands the field of in vivo gut physiology.

      Using both conventional and germ-free animals for single-cell sequencing analysis, they offer valuable epithelial datasets for researchers studying host-microbe interactions. By capitalizing on fluorescently labelled proteins in vivo, they create a new and specific atlas of cells involved in protein absorption, along with a detailed LRE single-cell transcriptomic dataset.

      Weaknesses:

      While the authors present tangible hypotheses, the data are primarily correlative, and the statistical methods are inadequate. They examine protein absorption in a specific, normalized intestinal region but do not address confounding factors between germ-free and conventional animals, such as size differences, transit time, and oral gavage, which may impact their in vivo observations. This oversight can lead to bold conclusions, where the data appear valuable but require more nuance.

      The sections of the study describing the microbiota or attempting functional analysis are elusive, with related data being overinterpreted. The microbiome field has long used 16S sequencing to characterize the microbiota, but its variability due to experimental parameters limits the ability to draw causative conclusions about the link between LRE activity, dietary protein, and microbial composition. Additionally, the complex networks involved in dopamine synthesis and signalling cannot be fully represented by RNA levels alone. The authors' conclusions on this biological phenomenon based on single-cell data need support from functional and in vivo experiments.

    4. Author response:

      Public Reviews: 

      Reviewer #1 (Public review): 

      The Bagnat and Rawls groups' previous published work (Park et al., 2019) described the kinetics and genetic basis of protein absorption in a specialized cell population of young vertebrates termed lysosome-rich enterocytes (LREs). In this study they seek to understand how the presence and composition of the microbiota impacts the protein absorption function of these cells and reciprocally, how diet and intestinal protein absorption function impact the microbiome. 

      Strengths of the study include the functional assays for protein absorption performed in live larval zebrafish, which provides detailed kinetics on protein uptake and degradation with anatomic precision, and the gnotobiotic manipulations. The authors clearly show that the presence of the microbiota or of certain individual bacterial members slows the uptake and degradation of multiple different tester fluorescent proteins. 

      To understand the mechanistic basis for these differences, the authors also provide detailed single-cell transcriptomic analyses of cells isolated based on both an intestinal epithelial cell identity (based on a transgenic marker) and their protein uptake activity. The data generated from these analyses, presented in Figures 3-5, are valuable for expanding knowledge about zebrafish intestinal epithelial cell identities, but of more limited interest to a broader readership. Some of the descriptive analysis in this section is circular because the authors define subsets of LREs (termed anterior and posterior) based on their fabp2 expression levels, but then go on to note transcriptional differences between these cells (for example in fabp2) that are a consequence of this initial subsetting. 

      Inspired by their single-cell profiling and by previous characterization of the genes required for protein uptake and degradation in the LREs, the authors use quantitative hybridization chain reaction RNA-fluorescent in situ hybridization to examine transcript levels of several of these genes along the length of the LRE intestinal region of germ-free versus mono-associated larvae. They provide good evidence for reduced transcript levels of these genes that correlate with the reduced protein uptake in the mono-associated larval groups. 

      The final part of the study (shown in Figure 7) characterized the microbiomes of 30-day-old zebrafish reared from 6-30 days on defined diets of low and high protein and with or without homozygous loss of the cubn gene required for protein uptake. The analysis of these microbiomes notes some significant differences between fish genotypes by diet treatments, but the discussion of these data does not provide strong support for the hypothesis that "LRE activity has reciprocal effects on the gut microbiome". The most striking feature of the MDS plot of Bray Curtis distance between zebrafish samples shown in Figure 7B is the separation by diet independent of host genotype, which is not discussed in the associated text. Additionally, the high protein diet microbiomes have a greater spread than those of the low protein treatment groups, with the high protein diet cubn mutant samples being the most dispersed. This pattern is consistent with the intestinal microbiota under a high protein diet regimen and in the absence of protein absorption machinery being most perturbed in stochastic ways than in hosts competent for protein uptake, consistent with greater beta dispersal associated with more dysbiotic microbiomes (described as the Anna Karenina principle here: https://pubmed.ncbi.nlm.nih.gov/28836573/). It would be useful for the authors to provide statistics on the beta dispersal of each treatment group. 

      Overall, this study provides strong evidence that specific members of the microbiota differentially impact gene expression and cellular activities of enterocyte protein uptake and degradation, findings that have a significant impact on the field of gastrointestinal physiology. The work refines our understanding of intestinal cell types that contribute to protein uptake and their respective transcriptomes. The work also provides some evidence that microbiomes are modulated by enterocyte protein uptake capacity in a diet-dependent manner. These latter findings provide valuable datasets for future related studies. 

      We thank the reviewer for their thorough and kind assessment. We appreciate the suggestion for edits and for pointing out areas that need further clarification.

      One point that clearly needs further explanation is the use fabp6 (referred to as fabp2 by the reviewer) to define anterior LREs and their gene expression pattern. which includes high levels of fabp6. This was deemed by the reviewer as a “circular argument”.  We would like to clarify that the rationale for using fabp6 as anchor is that we had previously reported overlap between fabp6 and LREs (see Fig.6C-E in Wen et al. PMID: 34301599) and thus were able here to define fabp6’s spatial pattern in relation to other LRE markers and the neighboring ileocyte population using transgenic markers and HCR. Thus, far from being a circular argument, using fabp6 allowed us to identify other markers that are differentially expressed between anterior and posterior LREs, which share a core program that we highlight in our study. In the revised manuscript we will clarify this point.

      We will also add the analysis suggested for the 16S rRNA gene sequencing data, include statistics on beta dispersal, and expand the discussion of these data as suggested.

      Reviewer #2 (Public review): 

      Summary: 

      The authors set out to determine how the microbiome and host genotype impact host protein-based nutrition. 

      Strengths: 

      The quantification of protein uptake dynamics is a major strength of this work and the sensitivity of this assay shows that the microbiome and even mono-associated bacterial strains dampen protein uptake in the host by causing down-regulation of genes involved in this process rather than a change in cell type. 

      The use of fluorescent proteins in combination with transcript clustering in the single cell seq analysis deepens our understanding of the cells that participate in protein uptake along the intestine. In addition to the lysozome-rich enterocytes (LRE), subsets of enteroendocrine cells, acinar, and goblet cells also take up protein. Intriguingly, these non-LRE cells did not show lysosomal-based protein degradation; but importantly analysis of the transcripts upregulated in these cells include dab2 and cubn, genes shown previously as being essential to protein uptake. 

      The derivation of zebrafish mono-associated with single strains of microbes paired with HCR to localize and quantify the expression of host protein absorption genes shows that different bacterial strains suppress these genes to variable extents. 

      The analysis of microbiome composition, when host protein absorption is compromised in cubn-/- larvae or by reducing protein in the food, demonstrates that changes to host uptake can alter the abundance of specific microbial taxa like Aeramonas. 

      Weaknesses: 

      The finding that neurons are positive for protein uptake in the single-cell data set is not adequately discussed. It is curious because the cldn:GFP line used for sorting does not mark neurons and if the neurons are taking up mCherry via trans-synaptic uptake from EECs, those neurons should be mCherry+/GFP-; yet methods indicate GFP+ and GFP+/mCherry+ cells were the ones collected and analyzed. 

      We thank the Reviewer for the kind and positive assessment of our work, for suggestions to improve the accessibility and clarity of the manuscript, and for pointing out an issue related to a neuronal population that needs further clarification.

      We confirm that there is a population of neurons that express cldn15la (and cldn15la:GFP). They are not easily visualized by microscopy because IECs express this gene at a relatively much higher level. However, the endogenous cldn15la transcript can be found in a recently published dataset (PMID: 35108531) as well as in ours. We will add a Discussion point to clarify this issue.

      Reviewer #3 (Public review): 

      Summary: 

      Childers et al. address a fundamental question about the complex relationship within the gut: the link between nutrient absorption, microbial presence, and intestinal physiology. They focus on the role of lysosome-rich enterocytes (LREs) and the microbiota in protein absorption within the intestinal epithelium. By using germ-free and conventional zebrafishes, they demonstrate that microbial association leads to a reduction in protein uptake by LREs. Through impressive in vivo imaging of gavaged fluorescent proteins, they detail the degradation rate within the LRE region, positioning these cells as key players in the process. Additionally, the authors map protein absorption in the gut using single-cell sequencing analysis, extensively describing LRE subpopulations in terms of clustering and transcriptomic patterns. They further explore the monoassociation of ex-germ-free animals with specific bacterial strains, revealing that the reduction in protein absorption in the LRE region is strain-specific. 

      Strengths: 

      The authors employ state-of-the-art imaging to provide clear evidence of the protein absorption rate phenotype, focusing on a specific intestinal region. This innovative method of fluorescent protein tracing expands the field of in vivo gut physiology. 

      Using both conventional and germ-free animals for single-cell sequencing analysis, they offer valuable epithelial datasets for researchers studying host-microbe interactions. By capitalizing on fluorescently labelled proteins in vivo, they create a new and specific atlas of cells involved in protein absorption, along with a detailed LRE single-cell transcriptomic dataset. 

      Weaknesses: 

      While the authors present tangible hypotheses, the data are primarily correlative, and the statistical methods are inadequate. They examine protein absorption in a specific, normalized intestinal region but do not address confounding factors between germ-free and conventional animals, such as size differences, transit time, and oral gavage, which may impact their in vivo observations. This oversight can lead to bold conclusions, where the data appear valuable but require more nuance. 

      The sections of the study describing the microbiota or attempting functional analysis are elusive, with related data being overinterpreted. The microbiome field has long used 16S sequencing to characterize the microbiota, but its variability due to experimental parameters limits the ability to draw causative conclusions about the link between LRE activity, dietary protein, and microbial composition. Additionally, the complex networks involved in dopamine synthesis and signalling cannot be fully represented by RNA levels alone. The authors' conclusions on this biological phenomenon based on single-cell data need support from functional and in vivo experiments. 

      We thank the reviewer for their assessment and for pointing out some areas that need to be explained better and/or discussed further.

      The reviewer mentions some potential confounding factors (ie., size differences, transit time, oral gavage) in the gnotobiotic experiments. We would like to convey that these aspects have been addressed in our experimental design and will be clarified in our full in the revised manuscript by adding information to Methods or by adding data statements. Briefly: 1-larval sizes were recorded and found to be similar between GF and monoassociated larvae. A statement will be added to text.; 2-while intestinal transit time has been reported to be affected by microbes in larval zebrafish (PMIDs: 16781702, 28207737, 33352109) and is a topic of interest, it does not represent a confounding factor for our experiments. In our assay, luminal cargo is present at high concentrations throughout the gut and is not limiting at any point during the assay; 3-gavage, which is necessary for quantitative assays, is indeed an experimental manipulation that may somehow alter the subjects (the same is true for microscopy and virtually any research method). However, any potential effects of gavage manipulation would not explain differences between GF and CV animals or alter our conclusions about microbial or dietary effects. We will elaborate on this in the revised Discussion.

      We acknowledge that microbiota composition is prone to relatively high degrees of interindividual and interexperimental variation, and that measuring microbiota composition using 16S rRNA gene sequencing is accompanied by inherent technical limitations such as limited taxonomic resolution, primer bias, etc.  It is important to note that comparable assays such as shotgun metagenomic DNA sequencing are not currently suitable for samples such as larval zebrafish or their dissected digestive tracts where the relative superabundance of host DNA prevents adequate coverage of microbial DNA. However, 16S rRNA gene sequencing remains a mainstream assay in the larger microbial ecology field, has proven effective at revealing important impacts of environmental factors on the gut microbiota (PMIDs: 21346791, 31409661, 31324413). Our results here also illustrate how 16S rRNA gene sequencing can be a useful method to detect perturbations to the zebrafish gut microbiome. Reproducing previous findings, we detected in our samples many of the core zebrafish microbiota taxa that have been identified by other studies (PMIDs: 26339860, 21472014, 17055441). To increase the robustness of our results, we included several biological replicates for each condition, co-housed genotypes and included large sample sizes to minimize environmental variation between groups. Importantly, replicates housed in different tanks showed similar results. We will emphasize these points in the revised Discussion. To further underscore this in the revised manuscript, we will add a beta diversity plot and statistical analysis showing that the microbiome was not significantly affected by our experimental replicates.

      Regarding dopamine pathways, we thank the reviewer for pointing out that the language we used in our interpretation of this and other pathways enriched in our scRNAseq data was too strong. In the revised manuscript, we will soften those conclusions, and instead indicate that these may be areas worthy of future dedicated investigation.

      Finally, the reviewer mentions the use of inadequate statistical methods for some analyses but without specifying or indicating alternative analyses. Only the need to justify the use of two-way ANOVA was made explicit. In this point, we respectfully disagree and would like to emphasize that we use statistical methods that are standards in the field. We will nevertheless add a justification for the use of two-way ANOVA where appropriate. Briefly, the two-way ANOVA test was used to compare fluorescence profiles of gavages cargoes or HCR probes at each level along the length of the LRE region. This test accounts for differences in fluorescence between experimental conditions at each level (binned 30 μm areas) along the LRE region (~300 μm). This test allows us to capture differences in fluorescence between experimental conditions while accounting for heterogeneity in the LRE region.

    1. eLife Assessment

      The manuscript provides important new insights into the mechanisms of statistical learning in early human development, showing that statistical learning in neonates occurs robustly and is not limited to linguistic features but occurs across different domains. The evidence is convincing, although an additional experimental manipulation with conflicting linguistic and non-linguistic information as well as further discussion about the linguistic vs non-linguistic nature of the stimulus materials would have strengthened the manuscript. The findings are highly relevant for researchers working in several domains, including developmental cognitive neuroscience, developmental psychology, linguistics, and speech pathology.

    2. Reviewer #1 (Public review):

      Summary:

      Parsing speech into meaningful linguistic units is a fundamental yet challenging task that infants face while acquiring the native language. Computing transitional probabilities (TPs) between syllables is a segmentation cue well-attested since birth. In this research, the authors examine whether newborns compute TPs over any available speech feature (linguistic and non-linguistic), or whether by contrast newborns' favor the computation of TPs over linguistic content over non-linguistic speech features such as speaker's voice. Using EEG and the artificial language learning paradigm, they record the neural responses of two groups of newborns presented with speech streams in which either phonetic content or speaker's voice are structured to provide TPs informative of word boundaries, while the other dimension provides uninformative information. They compare newborns' neural responses to these structured streams to their processing of a stream in which both dimensions vary randomly. After the random and structured familiarization streams, the newborns are presented with (pseudo)words as defined by their informative TPs, as well as partwords (that is, sequences that straddle a word boundary), extracted from the same streams. Analysis of the neural responses shows that while newborns neural activity entrained to the syllabic rate (2 Hz) when listening to the random and structured streams, it additionally entrained at the word rate (4 Hz) only when listening to the structured streams, finding no differential response between the streams structured around voice or phonetic information. Newborns showed also different neural activity in response to the words and part words. In sum, the study reveals that newborns compute TPs over linguistic and non-linguistic features of speech, these are calculated independently, and linguistic features do not lead to a processing advantage.

      Strengths:

      This interesting research furthers our knowledge of the scope of the statistical learning mechanism, which is confirmed to be a general-purpose powerful tool that allows humans to extract patterns of co-occurring events while revealing no apparent preferential processing for linguistic features. To answer its question, the study combines a highly replicated and well-established paradigm, i.e. the use of an artificial language in which pseudowords are concatenated to yield informative TPs to word boundaries, with a state-of-the-art EEG analysis, i.e. neural entrainment. The sample size of the groups is sufficient to ensure power, and the design and analysis are solid and have been successfully employed before.

      Weaknesses:

      There are no significant weaknesses to signal in the manuscript. However, in order to fully conclude that there is no obvious advantage for the linguistic dimension in neonates, it would have been most useful to test a third condition in which the two dimensions were pitted against each other, that is, in which they provide conflicting information as to the boundaries of the words comprised in the artificial language. This last condition would have allowed us to determine whether statistical learning weighs linguistic and non-linguistic features equally, or whether phonetic content is preferentially processed.

      To sum up, the authors achieved their central aim of determining whether TPs are computed over both linguistic and non-linguistic features, and their conclusions are supported by the results. This research is important for researchers working on language and cognitive development, and language processing, as well as for those working on cross-species comparative approaches.

    3. Reviewer #2 (Public review):

      Summary:

      The manuscript investigates to what degree neonates show evidence for statistical learning from regularities in streams of syllables, either with respect to phonemes or with respect to speaker identity. Using EEG, the authors found evidence for both, stronger entrainment to regularities as well as ERP differences in response to violations of previously introduced regularities. In addition, violations of phoneme regularities elicited an ERP pattern which the authors argue might index a precursor of the N400 response in older children and adults.

      Strengths:

      All in all, this is a very convincing paper, which uses a clever manipulation of syllable streams to target the processing of different features. The combination of neural entrainment and ERP analysis allows for the assessment of different processing stages, and implementing this paradigm in a comparably large sample of neonates is impressive. I only have some smaller comments.

      Weaknesses:

      I am skeptical regarding the interpretation of the phoneme-specific ERP effect as a precursor of the N400 and would suggest toning it down. While the authors are correct in that infant ERP components are typically slower and more posterior compared to adult components, and the observed pattern is hence consistent with an adult N400, at the same time, it could also be a lot of other things. On a functional level, I can't follow the author's argument as to why a violation in phoneme regularity should elicit an N400, since there is no evidence for any semantic processing involved. In sum, I think there is just not enough evidence from the present paradigm to confidently call it an N400.

      Why did the authors choose to include male and female voices? While using both female and male stimuli of course leads to a higher generalizability, it also introduces a second dimension for one feature that is not present for this other (i.e., phoneme for Experiment 1 and voice identity plus gender for Experiment 2). Hence, couldn't it also be that the infants extracted the regularity with which one gender voice followed the other? For instance, in List B, in the words, one gender is always followed by the other (M-F or F-M), while in 2/3 of the part-words, the gender is repeated (F-F and M-M). Wouldn't you expect the same pattern of results if infants learned regularities based on gender rather than identity?

      Do you have any idea why the duplet entrainment effect occurs over the electrodes it does, in particular over the occipital electrodes (which seems a bit unintuitive given that this is a purely auditory experiment with sleeping neonates).

    4. Reviewer #3 (Public review):

      Summary:

      This study is focused on testing whether statistical learning (a mechanism for parsing the speech signal into smaller chunks) preferentially operates over certain features of the speech at birth in humans. The features under investigation are phonetic content and speaker identity. Newborns are tested in an EEG paradigm in which they are exposed to a long stream of syllables. In Experiment 1, newborns are familiarized with a sound stream that comprises regularities (transitional probabilities) over syllables (e.g., "pe" followed by "tu" in "petu" with 1.0 probability) while the voices uttering the syllables remain random. In Experiment 2, newborns are familiarized with the same sound stream but, this time, the regularities are built over voices (e.g., "green voice" followed by "red voice" with 1.0 probability) while the concatenation of syllables stays random. At the test, all newborns listened to duplets (individual chunks) that either matched or violated the structure of the familiarization. In both experiments, newborns showed neural entrainment to the regularities implemented in the stream, but only the duplets defined by transitional probabilities over syllables (aka word forms) elicited a N400 ERP component. These results suggest that statistical learning operates in parallel and independently on different dimensions of the speech already at birth and that there seems to be an advantage for processing statistics defining word forms rather than voice patterns.

      Strengths:

      This paper presents an original experimental design that combines two types of statistical regularities in a speech input. The design is robust and appropriate for EEG with newborns. I appreciated the clarity of the Methods section. There is also a behavioral experiment with adults that acts like a control study for newborns. The research question is interesting, and the results add new information about how statistical learning works at the beginning of postnatal life, and on which features of the speech. The figures are clear and helpful in understanding the methods, especially the stimuli and how the regularities were implemented.

      Weaknesses:

      (1) I'm having a hard time understanding the link between the results of the study and the universality of statistical learning. The main goal of the study was testing whether statistical learning is a general mechanism for newborns that operates on any speech dimension, or whether it operates over linguistic features only. To test that, statistical regularities (TPs) were built over syllables (e.g., pe followed by tu in petu with 1.0 probability) or voices (e.g., green voice followed by red voice with 1.0 probability). Voices were considered as the non-linguistic dimension.

      While it's true that voice is not essential for language (i.e., sign languages are implemented over gestures; the use of voices to produce non-linguistic sounds, like laughter), it is a feature of spoken languages. Thus I'm not sure if we can really consider this study as a comparison between linguistic and non-linguistic dimensions. In turn, I'm not sure that these results show that statistical learning at birth operates on non-linguistic features, being voices a linguistic dimension at least in spoken languages. I'd like to hear the authors' opinions on this.

      Along the same line, in the Discussion section, the present results are interpreted within a theoretical framework showing statistical learning in auditory non-linguistic (string of tones, music) and visual domains as well as visual and other animal species. I'm not sure if that theoretical framework is the right fit for the present results.

      (2) I'm not sure whether the fact that we see parallel and independent tracking of statistics in the two dimensions of speech at birth indicates that newborns would be able to do so in all the other dimensions of the speech. If so, what other dimensions are the authors referring to?

      (3) Lines 341-345: Statistical learning is an evolutionary ancient learning mechanism but I do not think that the present results are showing it. This is a study on human neonates and adults, there are no other animal species involved therefore I do not see a connection with the evolutionary history of statistical learning. It would be much more interesting to make claims on the ontogeny (rather than philogeny) of statistical learning, and what regularities newborns are able to detect right after birth. I believe that this is one of the strengths of this work.

      (4) The description of the stimuli in Lines 110-113 is a bit confusing. In Experiment 1, e.g., "pe" and "tu" are both uttered by the same voice, correct? ("random voice each time" is confusing). Whereas in Experiment 2, e.g., "pe" and "tu" are uttered by different voices, for example, "pe" by yellow voice and "tu" by red voice. If this is correct, then I recommend the authors to rephrase this section to make it more clear.

      (5) Line 114: the sentence "they should compute a 36 x 36 TPs matrix relating each acoustic signal, with TPs alternating between 1/6 within words and 1/12 between words" is confusing as it seems like there are different acoustic signals. Can the authors clarify this point?

    5. Author response:

      Reviewer 1:

      There are no significant weaknesses to signal in the manuscript. However, in order to fully conclude that there is no obvious advantage for the linguistic dimension in neonates, it would have been most useful to test a third condition in which the two dimensions were pitted against each other, that is, in which they provide conflicting information as to the boundaries of the words comprised in the artificial language. This last condition would have allowed us to determine whether statistical learning weighs linguistic and non-linguistic features equally, or whether phonetic content is preferentially processed.

      We appreciate the reviewers' suggestion that a stream with conflicting information would provide valuable insights. In the present study, we started with a simpler case involving two orthogonal features (i.e., phonemes and voices), with one feature being informative and the other uninformative, and we found similar learning capacities for both. Future work should explore whether infants—and humans more broadly—can simultaneously track regularities in multiple speech features. However, creating a stream with two conflicting statistical structures is challenging. To use neural entrainment, the two features must lead to segmentation at different chunk sizes so that their effects lead to changes in power/PLV at different frequencies—for instance, using duplets for the voice dimension and triplets for the linguistic dimension  (or vice versa). Consequently, the two dimensions would not be directly comparable within the same participant in terms of the number of distinguishable syllables/voices, memory demand, or SNR given the 1/F decrease in amplitude of background EEG activity. This would involve comparisons between two distinct groups counter-balancing chunk size and linguistic non-linguistic dimension. Considering the test phase, words for one dimension would have been part-words for the other dimension. As we are measuring differences and not preferences, interpreting the results would also have been difficult. Additionally, it may be difficult to find a sufficient number of clearly discriminable voices for such a design (triplets imply 12 voices). Therefore, an entirely different experimental paradigm would need to be developed.

      If such a design were tested, one possibility is that the regularities for the two dimensions are calculated in parallel, in line with the idea that the calculation of statistical regularities is a ubiquitous implicit mechanism (see Benjamin et al., 2024, for a proposed neural mechanism). Yet, similar to our present study, possibly only phonetic features would be used as word candidates. Another possibility is that only one informative feature would be explicitly processed at a time due to the serial nature of perceptual awareness, which may prioritise one feature over the other.

      Note: The reviewer’s summary contains a typo: syllabic rate (4 Hz) –not 2 Hz, and word rate (2 Hz) –not 4 Hz.

      Reviewer 2:

      N400: I am skeptical regarding the interpretation of the phoneme-specific ERP effect as a precursor of the N400 and would suggest toning it down. While the authors are correct in that infant ERP components are typically slower and more posterior compared to adult components, and the observed pattern is hence consistent with an adult N400, at the same time, it could also be a lot of other things. On a functional level, I can't follow the author's argument as to why a violation in phoneme regularity should elicit an N400, since there is no evidence for any semantic processing involved. In sum, I think there is just not enough evidence from the present paradigm to confidently call it an N400.

      The reviewer is correct that we cannot definitively determine the type of processing reflected by the ERP component that appears when neonates hear a triplet after exposure to a stream with phonetic regularities. We interpreted this component as a precursor to the N400, based on prior findings in speech segmentation tasks without semantic content, where a ~400 ms component emerged when adult participants recognised pseudowords (Sander et al., 2002) or during structured streams of syllables (Cunillera et al., 2006, 2009). Additionally, the component we observed had a similar topography and timing to those labelled as N400 in infant studies, where semantic processing was involved (Parise et al., 2010; Friedrich & Friederici, 2011).

      Given our experimental design, the difference we observed must be related to the type of regularity during familiarisation (either phonemes or voices). Thus, we interpreted this component as reflecting lexical search— a process which could be triggered by a linguistic structure but which would not be relevant to a non-linguistic regularity such as voices. However, we are open to alternative interpretations. In any case, this difference between the two streams reveals that computing regularities based on phonemes versus voices does not lead to the same processes. We will revise and tone down the corresponding part of the discussion to clarify that it is just a possible interpretation of the results.  

      Female and male voices: Why did the authors choose to include male and female voices? While using both female and male stimuli of course leads to a higher generalizability, it also introduces a second dimension for one feature that is not present for this other (i.e., phoneme for Experiment 1 and voice identity plus gender for Experiment 2). Hence, couldn't it also be that the infants extracted the regularity with which one gender voice followed the other? For instance, in List B, in the words, one gender is always followed by the other (M-F or F-M), while in 2/3 of the part-words, the gender is repeated (F-F and M-M). Wouldn't you expect the same pattern of results if infants learned regularities based on gender rather than identity?

      We used three female and three male voices to maximise acoustic variability. The streams were synthesised using MBROLA, which provides a limited set of artificial voices. Indeed, there were not enough French voices of acceptable quality, so we also used two Italian voices (the phonemes used existed in both Italian and French).

      Voices differ in timbre, and female voices tend to be higher pitched. However, it is sometimes difficult to categorise low-pitched female voices and high-pitched male voices. Given that gender may be an important factor in infants' speech perception (newborns, for instance, prefer female voices at birth), we conducted tests to assess whether this dimension could have influenced our results.  

      We first quantified the transitional probabilities matrices during the structured stream of Experiment 2, considering that there are only two types of voices: Female and Male.  

      For List A, all transition probabilities are equal to 0.5 (P(M|F), P(F|M), P(M|M), P(F|F)), resulting in flat TPs throughout the stream (see Author response image 1, top). Therefore, we would not expect neural entrainment at the word rate (2 Hz), nor would we anticipate ERP differences between the presented duplets in the test phase.

      For List B, P(M|F)=P(F|M)=0.66 while P(M|M)=P(F|F)=0.33. However, this does not produce a regular pattern of TP drops throughout the stream (see Author response image 1, bottom). As a result, strong neural entrainment at 2 Hz was unlikely, although some degree of entrainment might have occasionally occurred due to some drops occurring at a 2 Hz frequency. Regarding the test phase, all three Words and only one Part-word presented alternating patterns (TP=0.6). Therefore, the difference in the ERPs between Words and Partwords in List B might be attributed to gender alternation.  

      However, it seems unlikely that gender alternation alone explains the entire pattern of results, as the effect is inconsistent and appears in only one of the lists. To rule out this possibility, we analysed the effects in each list separately.

      Author response image 1.

      Transition probabilities (TPs) across the structured stream in Experiment 2, considering voices processed by gender (Female or Male). Top: List A. Bottom: List B.

      We computed the mean activation within the time windows and electrodes of interest and compared the effects of word type and list using a two-way ANOVA. For the difference between Words and Part-words over the positive cluster, we observed a main effect of word type (F(1,31) = 5.902, p = 0.021), with no effects of list or interactions (p > 0.1). Over the negative cluster, we again observed a main effect of word type (F(1,31) = 10.916, p = 0.0016), with no effects of list or interactions (p > 0.1). See Author response image 2.  

      Author response image 2.

      Difference in ERP voltage (Words – Part-words) for the two lists (A and B); W=Words; P=Part-Words, 

      We conducted a similar analysis for neural entrainment during the structured stream on voices. A comparison of entrainment at 2 Hz between participants who completed List A and List B showed no significant differences (t(30) = -0.27, p = 0.79). A test against zero for each list indicated significant entrainment in both cases (List A: t(17) = 4.44, p = 0.00036; List B: t(13) = 3.16, p = 0.0075). See Author response image 3.

      Author response image 3.

      Neural entrainment at 2Hz during the structured stream of Experiment 2 for Lists A and B.

      Words entrainment over occipital electrodes: Do you have any idea why the duplet entrainment effect occurs over the electrodes it does, in particular over the occipital electrodes (which seems a bit unintuitive given that this is a purely auditory experiment with sleeping neonates).

      Neural entrainment might be considered as a succession of evoked response induced by the stream. After applying an average reference in high-density EEG recordings, the auditory ERP in neonates typically consists of a central positivity and a posterior negativity with a source located at the electrical zero in a single-dipole model (i.e. approximately in the superior temporal region (Dehaene-Lambertz & Dehaene, 1994). In adults, because of the average reference (i.e. the sum of voltages is equal to zero at each time point) and because the electrodes cannot capture the negative pole of the auditory response, the negativity is distributed around the head. In infants, however, the brain is higher within the skull, allowing for a more accurate recording of the negative pole of the auditory ERP (see Author response image 4 for the location of electrodes in an infant head model).  

      Besides the posterior electrodes, we can see some entrainment on more anterior electrodes that probably corresponds to the positive pole of the auditory ERP.

      Author response image 4.

      International 10–20 sensors' location on the skull of an infant template, with the underlying 3-D reconstruction of the grey-white matter interface and projection of each electrode to the cortex. Computed across 16 infants (from Kabdebon et al, Neuroimage, 2014). The O1, O2, T5, and T6 electrodes project lower than in adults.

      Reviewer 3:

      (1) While it's true that voice is not essential for language (i.e., sign languages are implemented over gestures; the use of voices to produce non-linguistic sounds, like laughter), it is a feature of spoken languages. Thus I'm not sure if we can really consider this study as a comparison between linguistic and non-linguistic dimensions. In turn, I'm not sure that these results show that statistical learning at birth operates on non-linguistic features, being voices a linguistic dimension at least in spoken languages. I'd like to hear the authors' opinions on this.

      On one hand, it has been shown that statistical learning (SL) operates across multiple modalities and domains in human adults and animals. On the other hand, SL is considered essential for infants to begin parsing speech. Therefore, we aimed to investigate whether SL capacities at birth are more effective on linguistic dimensions of speech, potentially as a way to promote language learning.

      We agree with the reviewer that voices play an important role in communication (e.g., for identifying who is speaking); however, they do not contribute to language structure or meaning, and listeners are expected to normalize across voices to accurately perceive phonemes and words. Thus, voices are speech features but not linguistic features. Additionally, in natural speech, there are no abrupt voice changes within a word as in our experiment; instead, voice changes typically occur on a longer timescale and involve only a limited number of voices, such as in a dialogue. Therefore, computing regularities based on voice changes would not be useful in real-life language learning. We considered that contrasting syllables and voices was an elegant way to test SL beyond its linguistic dimension, as the experimental paradigm is identical in both experiments.  

      Along the same line, in the Discussion section, the present results are interpreted within a theoretical framework showing statistical learning in auditory non-linguistic (string of tones, music) and visual domains as well as visual and other animal species. I'm not sure if that theoretical framework is the right fit for the present results.

      (2) I'm not sure whether the fact that we see parallel and independent tracking of statistics in the two dimensions of speech at birth indicates that newborns would be able to do so in all the other dimensions of the speech. If so, what other dimensions are the authors referring to?

      The reviewer is correct that demonstrating the universality of SL requires testing additional modalities and acoustic dimensions. However, we postulate that SL is grounded in a basic mechanism of long-term associative learning, as proposed in Benjamin et al. (2024), which relies on a slow decay in the representation of a given event. This simple mechanism, capable of operating on any representational output, accounts for many types of sequence learning reported in the literature (Benjamin et al., in preparation). We will revise the discussion section to clarify this theoretical framework.

      (3) Lines 341-345: Statistical learning is an evolutionary ancient learning mechanism but I do not think that the present results are showing it. This is a study on human neonates and adults, there are no other animal species involved therefore I do not see a connection with the evolutionary history of statistical learning. It would be much more interesting to make claims on the ontogeny (rather than philogeny) of statistical learning, and what regularities newborns are able to detect right after birth. I believe that this is one of the strengths of this work.

      We did not intend to make claims about the phylogeny of SL. Since SL appears to be a learning mechanism shared across species, we use it as a framework to suggest that SL may arise from general operational principles applicable to diverse neural networks. Thus, while it is highly useful for language acquisition, it is not specific to it. We will revise this section to tone down our claims.  

      (4) The description of the stimuli in Lines 110-113 is a bit confusing. In Experiment 1, e.g., "pe" and "tu" are both uttered by the same voice, correct? ("random voice each time" is confusing). Whereas in Experiment 2, e.g., "pe" and "tu" are uttered by different voices, for example, "pe" by yellow voice and "tu" by red voice. If this is correct, then I recommend the authors to rephrase this section to make it more clear.

      To clarify, in Experiment 1, the voices were randomly assigned to each syllable, with the constraint that no voice was repeated consecutively. This means that syllables within the same word were spoken by different voices, and each syllable was heard with various voices throughout the stream. As a result, neonates had to retrieve the words based solely on syllabic patterns, without relying on consistent voice associations or specific voice relationships.

      In Experiment 2, the design was orthogonal: while the syllables were presented in a random order, the voices followed a structured pattern. Similar to Experiment 1, each syllable (e.g., “pe” and “tu”) was spoken by different voices. The key difference is that in Experiment 2, the structured regularities were applied to the voices rather than the syllables. In other words, the “green” voice was always followed by the “red” voice for example but uttered different syllables.

      We will revise the methods section to clarify these important points.

      (5) Line 114: the sentence "they should compute a 36 x 36 TPs matrix relating each acoustic signal, with TPs alternating between 1/6 within words and 1/12 between words" is confusing as it seems like there are different acoustic signals. Can the authors clarify this point?

      Thank you for highlighting this point. To clarify, our suggestion is that neonates might not track regularities between phonemes and voices as separate features. Instead, they may treat each syllable-voice combination as a distinct item—for example, "pe" spoken by the "yellow" voice is one item, while "pe" spoken by the "red" voice is another. Under this scenario, there would be a total of 36 unique items (6 syllables × 6 voices), and infants would need to track regularities between these 36 combinations.

      We will rephrase this sentence in the manuscript to make it clearer.

    1. Reviewer #1 (Public review):

      Summary:

      The central question of this manuscript is the role of RNase III in supporting Salmonella infection. The authors begin with an RNAseq analysis of a collection of food or clinical Salmonella isolates from China, identifying RNase III (encoded by rnc) as an upregulated gene in clinical ("high virulence") isolates. Based on follow-up studies with knockout and complemented strains, the authors propose that RNase III has two roles - one in the upregulation of sodA expression to counter host-derived ROS, and the other in general degradation of dsRNA to dampen host immune responses. Overall, the manuscript is logical and the authors make largely reasonable interpretations of their data. However, the depth of supporting evidence limits the breadth of the authors' conclusions in their current form. Thus, this manuscript will be useful to researchers in directly related fields of study, but more work is required to understand how these proposed mechanisms function during infection.

      Strengths:

      (1) The use of comparative RNAseq between different isolates to identify potential virulence mechanisms is a powerful approach to understanding what makes certain strains more likely to cause infection over others.

      (2) The experiments identifying dsRNA as the factor contributing to increased innate immune induction in the rnc knockout strain are particularly thorough.

      (3) The authors observed an in vivo mammalian infection defect for RNase III-deficient Salmonella, a novel finding for the field and strong evidence that this protein is required to support pathogen fitness.

      Weaknesses:

      (1) The strengths of the manuscript are in places obscured by a lack of clarity and justification in the manuscript about strain selection and rationale for using some backgrounds over others. Moreover, several aspects of the organization and flow of the manuscript could be improved, as data is described out of order and the text description of results does not always align with the data presented.

      (2) The specific claim that the relatively modest increase in expression of RNase III in some isolates (Figure 1A) accounts for their "virulence" is not well-supported, since the only comparisons in the study are between total knockouts or wild-type (and not overexpression) and the actual protein levels of RNase III are not quantified.

      (3) Although the experiments on dsRNA are strong, they would have benefited from measurements of cytokine production/immune responses during infection with the actual knockout strains instead of transfected RNA along with quantification of Salmonella burdens.

      (4) The contribution of RNase III catalytic activity (i.e., through the use of a catalytically dead mutant) was not assessed, which means that a role for general RNA binding or protein-protein interactions cannot be ruled out from this study.

      (5) The in vivo work was limited to survival analysis, so whether the proposed mechanisms account for the defects observed could not be resolved.

      (6) Statistical analysis throughout the manuscript is inconsistently applied, making it hard in places to determine whether the differences seen in phenotypes are biologically significant.

    2. eLife Assessment

      This useful study examines the function of the rnc gene, which encodes the RNase III ribonuclease, as it relates to virulence of Salmonella Enteritidis. The authors demonstrate that the rnc gene is markedly upregulated in strains proposed to exhibit high virulence and that the product of the rnc gene promotes the expression of SodA, which contributes to the survival of Salmonella Enteritidis in the face of oxidative stress. The study also suggests that elevated levels of rnc gene expression assist Salmonella Enteritidis in evading immune responses by diminishing the presence of accumulated double-stranded RNA (dsRNA), although the evidence substantiating this and the above assertions remains incomplete.

    3. Reviewer #2 (Public review):

      Summary:

      This work attempted to investigate how the gene rnc, which showed higher expression in clinical strains of Salmonella Enteritidis compared to those isolated from food, affects the virulence of this bacteria through modulating dsRNA levels and the immune response of host cells.

      Strengths:

      The authors clearly demonstrated that the deletion of rnc Salmonella Enteritidis leads to an accumulation of dsRNA inside the cells, which further activates the immune response of host cells. It is also well demonstrated that the rnc gene deletion results in an increased ROS level through regulating the SodA protein.

      Weaknesses:

      (1) It is unclear whether the higher rnc expression in clinical strains of Salmonella Enteritidis is universal or just specific to several strains, because of the inadequate data provided and different strains used for different tests in this study.

      (2) A lot of specific information is missing in the Figure legends and Method section, which makes it hard to understand some of the key results in the manuscript.

    4. Reviewer #3 (Public review):

      Summary:

      Chan et al. evaluated the role of RNase III, encoded by the rnc gene, in Salmonella virulence. Chan et al. first identified rnc among the genes with upregulated mRNA levels in virulent Salmonella isolates. The authors further showed that deletion of rnc resulted in increased double-stranded RNA (dsRNA) and reduced invasion rate and replication rate in an in vitro macrophage model. The authors then showed that transfection of total RNA of rnc knock-out strains upregulates (with respect to a WT Salmonella strain) expression levels of immune-related genes (e.g., TNF-a, IL-1B, etc.) in a dsRNA-dependent manner. The authors reported reduced SodA protein accumulation in the rnc knock-out strains, despite higher levels of sodA mRNA, suggesting a role of SodA in the protection against reactive oxygen species. Finally, the authors showed, using a mice model, the partial contribution of sodA in the restoration of virulence levels in the rnc knock-out strains.

      Strengths:

      (1) The manuscript is well written.

      (2) The authors evaluated the impact of rnc deletion in both in vitro and mice infection models. Both experiment setups supported the contribution of rnc to Salmonella virulence.

      (3) The authors tested the effect of rnc deletion in different genetic backgrounds (i.e., different bacterial isolates) offering additional support to their claims.

      (4) Measurement of SodA protein levels nicely complemented and informed initial findings at the mRNA level.

      Weaknesses:

      (1) The authors failed to discuss how their work differentiates from recent studies of rnc deletion strains in Salmonella (NIH PMID: 38182942) and Escherichia coli (NIH PMID: 35456749). Remarkably, the first publication performed genome-wide transcriptional profiling of a rnc deletion Salmonella strain. The second publication explored the link between rnc and sodA in E. coli.

      (2) The authors should explain what the criteria for selecting food and clinical isolates for molecular characterization were. This information is valuable for the reader as they may wonder about the impact of isolate selection in the study's conclusions. Similarly, the authors need to explain how they selected their controls for baseline gene expression, virulence, etc.. Furthermore, I wondered if they could use an avirulent Salmonella strain as an additional control.

      (3) The authors do not perform any analysis of the differentially expressed genes (DEGs) identified in their study. They should leverage DEGs to expand their mechanistic insights of other genes or functional processes putatively linked to rnc activity and virulence. Additionally, authors should make transcriptional data and the output of their differential expression analysis (and the list of differentially expressed genes-DEGs) available to the readers. In fact, it is not clear how the DEGS were defined.

    1. eLife Assessment

      This paper contains valuable ideas for methodology concerned with the identification of genes associated with disease prognosis in a broad range of cancers. However, there are concerns that the statistical properties of MEMORY are incompletely investigated and described. Further, more precise details about the implementation of the method would increase the replicability of the findings by other researchers.

    2. Reviewer #1 (Public review):

      Summary:

      The authors propose a new technique which they name "Multi-gradient Permutation Survival Analysis (MEMORY)" that they use to identify "Genes Steadily Associated with Prognosis (GEARs)" using RNA-seq data from the TCGA database. The contribution of this method is one of the key stated aims of the paper. The vast majority of the paper focuses on various downstream analyses that make use of the specific GEARs identified by MEMORY to derive biological insights, with a particular focus on lung adenocarcinoma (LUAD) and breast invasive carcinoma (BRCA) which are stated to be representative of other cancers and are observed to have enriched mitosis and immune signatures, respectively. Through the lens of these cancers, these signatures are the focus of significant investigation in the paper.

      Strengths:

      The approach for MEMORY is well-defined and clearly presented, albeit briefly. This affords statisticians and bioinformaticians the ability to effectively scrutinize the proposed methodology and may lead to further advancements in this field.

      The scientific aspects of the paper (e.g., the results based on the use of MEMORY and the downstream bioinformatics workflows) are conveyed effectively and in a way that is digestible to an individual who is not deeply steeped in the cancer biology field.

      Weaknesses:

      I was surprised that comparatively little of the paper is devoted to the justification of MEMORY (i.e., the authors' method) for the identification of genes that are important broadly for the understanding of cancer. The authors' approach is explained in the methods section of the paper, but no rationale is given for why certain aspects of the method are defined as they are. Moreover, no comparison or reference is made to any other methods that have been developed for similar purposes and no results are shown to illustrate the robustness of the proposed method (e.g., is it sensitive to subtle changes in how it is implemented).

      For example, in the first part of the MEMORY algorithm, gene expression values are dichotomized at the sample median and a log-rank test is performed. This would seemingly result in an unnecessary loss of information for detecting an association between gene expression and survival. Moreover, while dichotomizing at the median is optimal from an information theory perspective (i.e., it creates equally sized groups), there is no reason to believe that median-dichotomization is correct vis-à-vis the relationship between gene expression and survival. If a gene really matters and expression only differentiates survival more towards the tail of the empirical gene expression distribution, median-dichotomization could dramatically lower the power to detect group-wise differences.

      Specifically, the authors' rationale for translating the Significant Probability Matrix into a set of GEARs warrants some discussion in the paper. If I understand correctly, for each cancer the authors propose to search for the smallest sample size (i.e., the smallest value of k_{j}) were there is at least one gene with a survival analysis p-value <0.05 for each of the 1000 sampled datasets. I base my understanding on the statement "We defined the sampling size k_{j} reached saturation when the max value of column j was equal to 1 in a significant-probability matrix. The least value of k_{j} was selected". Then, any gene with a p-value <0.05 in 80% of the 1000 sampled datasets would be called a GEAR for that cancer. The 80% value here seems arbitrary but that is a minor point. I acknowledge that something must be chosen. More importantly, do the authors believe this logic will work effectively in general? Presumably, the gene with the largest effect for a cancer will define the value of K_{j}, and, if the effect is large, this may result in other genes with smaller effects not being selected for that cancer by virtue of the 80% threshold. One could imagine that a gene that has a small-to-moderate effect consistently across many cancers may not show up as a gear broadly if there are genes with more substantive effects for most of the cancers investigated. I am taking the term "Steadily Associated" very literally here as I've constructed a hypothetical where the association is consistent across cancers but not extremely strong. If by "Steadily Associated" the authors really mean "Relatively Large Association", my argument would fall apart but then the definition of a GEAR would perhaps be suboptimal. In this latter case, the proposed approach seems like an indirect way to ensure there is a reasonable effect size for a gene's expression on survival.

      The paper contains numerous post-hoc hypothesis tests, statements regarding detected associations and correlations, and statements regarding statistically significant findings based on analyses that would naturally only be conducted in light of positive results from analyses upstream in the overall workflow. Due to the number of statistical tests performed and the fact that the tests are sometimes performed using data-driven subgroups (e.g., the mitosis subgroups), it is highly likely that some of the findings in the work will not be replicable. Of course, this is exploratory science, and is to be expected that some findings won't replicate (the authors even call for further research into key findings). Nonetheless, I would encourage the authors to focus on the quantification of evidence regarding associations or claims (i.e., presenting effect estimates and uncertainty intervals), but to avoid the use of the term statistical significance owing to there being no clear plan to control type I error rates in any systematic way across the diverse analyses there were performed.

      A prespecified analysis plan with hypotheses to be tested (to the extent this was already produced) and a document that defines the complete scope of the scientific endeavor (beyond that which is included in the paper) would strengthen the contribution by providing further context on the totality of the substantial work that has been done. For example, the focus on LUAD and BRCA due to their representativeness could be supplemented by additional information on other cancers that may have been investigated similarly but where results were not presented due to lack of space.

    3. Reviewer #2 (Public review):

      Summary:

      The authors are trying to come up with a list of genes (GEAR genes) that are consistently associated with cancer patient survival based on TCGA database. A method named "Multi-gradient Permutation Survival Analysis" was created based on bootstrapping and gradually increasing the sample size of the analysis. Only the genes with consistent performance in this analysis process are chosen as potential candidates for further analyses.

      Strengths:

      The authors describe in detail their proposed method and the list of the chosen genes from the analysis. The scientific meaning and potential values of their findings are discussed in the context of published results in this field.

      Weaknesses:

      Some steps of the proposed method (especially the definition of survival analysis similarity (SAS) need further clarification or details since it would be difficult if anyone tries to reproduce the results. In addition, the multiplicity (a large number of p-values are generated) needs to be discussed and/or the potential inflation of false findings needs to be part of the manuscript.

      If the authors can improve the clarity of the proposed method and there is no major mistake there, the proposed approach can be applied to other diseases (assuming TCGA type of data is available for them) to identify potential gene lists, based on which drug screening can be performed to identify potential target for development.

    4. Reviewer #3 (Public review):

      Summary:

      The authors describe a valuable method to find gene sets that may correlate with a patient's survival. This method employs iterative tests of significance across randomised samples with a range of proportions of the original dataset. Those genes that show significance across a range of samples are chosen. Based on these gene sets, hub genes are determined from similarity scores.

      Strengths:

      MEMORY allows them to assess the correlation between a gene and patient prognosis using any available transcriptomic dataset. They present several follow-on analyses and compare the gene sets found to previous studies.

      Weaknesses:

      Unfortunately, the authors have not included sufficient details for others to reproduce this work or use the MEMORY algorithm to find future gene sets, nor to take the gene findings presented forward to be validated or used for future hypotheses.

    5. Reviewer #4 (Public review):

      The authors apply what I gather is a novel methodology titled "Multi-gradient Permutation Survival Analysis" to identify genes that are robustly associated with prognosis ("GEARs") using tumour expression data from 15 cancer types available in the TCGA. The resulting lists of GEARs are then interrogated for biological insights using a range of techniques including connectivity and gene enrichment analysis.

      I reviewed this paper primarily from a statistical perspective. Evidently, an impressive amount of work has been conducted, and concisely summarised, and great effort has been undertaken to add layers of insight to the findings. I am no stranger to what an undertaking this would have been. My primary concern, however, is that the novel statistical procedure proposed, and applied to identify the gene lists, as far as I can tell offers no statistical error control or quantification. Consequently, we have no sense of what proportion of the highlighted GEAR genes and networks are likely to just be noise.

      Major comments:

      (1) The main methodology used to identify the GEAR genes, "Multi-gradient Permutation Survival Analysis" does not formally account for multiple testing and offers no formal error control. Meaning we are left with no understanding of what the family-wise (aka type 1) error rate is among the GEAR lists, nor the false discovery rate. I would generally recommend against the use of any feature selection methodology that does not provide some form of error quantification and/or control because otherwise we do not know if we are encouraging our colleagues and/or readers to put resources into lists of genes that contain more noise than not. There are numerous statistical techniques available these days that offer error control, including for lists of p-values from arbitrary sets of tests (see expansion on this and some review references below).

      (2) Similarly, no formal significance measure was used to determine which of the strongest "SAS" connections to include as edges in the "Core Survival Network".

      (3) There is, as far as I could tell, no validation of any identified gene lists using an independent dataset external to the presently analysed TCGA data.

      (4) There are quite a few places in the methods section where descriptions were not clear (e.g. elements of matrices referred to without defining what the columns and rows are), and I think it would be quite challenging to re-produce some aspects of the procedures as currently described (more detailed notes below).

      (5) There is a general lack of statistical inference offered. For example, throughout the gene enrichment section of the results, I never saw it stated whether the pathways highlighted are enriched to a significant degree or not.

    1. eLife Assessment

      The study is important - not only for its comprehensive transcriptomic analysis of the developmental trajectory of syncytiotrophoblasts (STBs), but also for its comparative evaluation of primary human placental tissues and two human trophoblast organoid models. The study highlights the utility of these organoid models in advancing research on human STB biology. The conclusions of this work are supported by compelling analyses and experimental evidence.

    2. Reviewer #1 (Public review):

      Summary:

      This study provides an in-depth analysis of syncytiotrophoblast (STB) gene expression at the single-nucleus (SN) and single-cell (SC) levels, using both primary human placental tissues and two trophoblast organoid (TO) models. The authors compare the older TO model, where STB forms internally (STBin), with a newer model where STB forms externally (STBout). Through a series of comparative analyses, the study highlights the necessity of using both SN and SC techniques to fully understand placental biology. The findings demonstrate that the STBout model shows more differentiated STBs with higher expression of canonical markers and hormones compared to STBin. Additionally, the study identifies both conserved and distinct gene expression profiles between the TO models and human placenta, offering valuable insights for researchers using TOs to study STB and CTB differentiation.

      Strengths:

      The study offers a comprehensive SC- and SN-based characterization of trophoblast organoid models, providing a thorough validation of these models against human placental tissues. By comparing the older STBin and newer STBout models, the authors effectively demonstrate the improvements in the latter, particularly in the differentiation and gene expression profiles of STBs. This work serves as a critical resource for researchers, offering a clear delineation of the similarities and differences between TO-derived and primary STBs. The use of multiple advanced techniques, such as high-resolution sequencing and trajectory analysis, further enhances the study's contribution to the field.

      Weaknesses:

      While the study is robust, some areas could benefit from further clarification. The importance of the TO model's orientation and its impact on outcomes could be emphasized more in the introduction. The differences in cluster numbers/names between primary tissue and TO data need a clearer explanation, and consistent annotation could aid in comparison. The rationale for using SN sequencing over SC sequencing for TO evaluations should be clarified, especially regarding the potential underrepresentation of certain trophoblast subsets. Additionally, more evidence could be provided to support the claims about STB differentiation in the STBout model and to determine whether its differentiation trajectory is unique or simply more advanced than in STBin.

    3. Reviewer #2 (Public review):

      Summary:

      In this study, the authors aimed to elucidate the formation and differentiation of syncytiotrophoblast (STB) cells by analyzing placental tissue and trophoblast organoids (TOs) using single-nucleus (SN) and single-cell (SC) RNA sequencing. They identified three distinct nuclear subtypes within the STB and explored the relationship between STB gene expression changes, developmental stages, and environmental contexts. The study emphasizes the utility of TOs as models for understanding STB differentiation and highlights novel gene markers, such as RYBP, involved in STB development.

      Strengths:

      (1) The use of SN and SC RNA sequencing provides a detailed analysis of STB formation and differentiation.

      (2) The identification of distinct STB subtypes and novel gene markers such as RYBP offers new insights into STB development.

      Weaknesses:

      (1) Inconsistencies in data presentation.

      (2) Questionable interpretation of lncRNA signals: The use of long non-coding RNA (lncRNA) signals as cell type-specific markers may represent sequencing noise rather than true markers.

      To improve the study's validity and significance, it is crucial to address the inconsistencies and to provide additional evidence for the claims. Supplementing with immunofluorescence staining for validating the distribution of STB_in, STB_out, and EVT_enrich in the organoid models is recommended to strengthen the results and conclusions.

    4. Reviewer #3 (Public review):

      In this report, Keenen et al. present a thoroughly characterized platform for identifying potential molecular mechanisms regulating syncytiotrophoblast cell functions in placental biology. The application of single-cell assessments to identify developmental trajectories of this lineage has been challenging due to the complex, multinucleated structure of the syncytium. The authors provide a comprehensive comparative assessment of term placental tissue and three independent trophoblast organoid models. They use single-cell and single-nucleus RNA sequencing followed by differential gene expression and pseudotime analyses to identify subpopulations and differentiation trajectories. They further compare the datasets generated in this study to publicly available datasets from first-trimester placental tissue. The work is timely as optimization of trophoblast organoids is an evolving topic in placental research. Careful characterization of in vitro models has been noted as essential for model selection and result interpretation in the field.

      The study elucidates syncytiotrophoblast nucleus subtypes and proportions in three different organoid models and compares subtypes and gene expression signatures to placental tissues. This work advances the field by demonstrating the utility of different trophoblast organoids to model syncytiotrophoblast differentiation. The in-depth characterization of cell types comprising the different organoid models and how they compare to placental tissue will help to inform model selection for future experimentation in the field. Defining cell composition and cell differentiation trajectories will also aid in data interpretation for data generated by these tissue and model sources. Overall, the conclusions presented in the manuscript are well supported by the data. The figures, as presented, are informative and striking.

      The authors present outstanding progress toward their aim of identifying, "the underlying control of the syncytiotrophoblast". They identify the chromatin remodeler, RYBP, as well as other regulatory networks that they propose are critical to syncytiotrophoblast development. This study is limited in fully addressing the aim, however, as functional evidence for the contributions of the factors/pathways to syncytiotrophoblast cell development is needed. Future experimentation testing the hypotheses generated by this work will define the essentiality of the identified factors to syncytiotrophoblast development and function. Localization and validation of the identified factors within tissue and at the protein level will also provide further contextual evidence to address the hypotheses generated.

    1. eLife Assessment

      This valuable study uses robust time-dependent microscopy assays to show that during HIV-1 infection, the viral accessory protein Vif causes cell cycle arrest during metaphase and not G2/M as previously thought. The conclusions are convincing in the context of the immortalized cellular models used, and they serve as a starting point to determine whether Vif-dependent regulation of the cell cycle modulates HIV-1 replication and pathogenesis in more physiologically relevant primary cells or in vivo.

    2. Reviewer #1 (Public review):

      Summary:

      Ghone et al show that HIV-1 Vif causes a pseudo-metaphase arrest rather than a G2 arrest. The metaphase arrest correlates with misregulation of the kinetochore which could be explained by the loss of phosphatase functions that determine chromosome-microtubule interactions.

      Strengths:

      The single-cell imaging using different reporters of cell cycle progression is very elegant and the quantitation is convincing. The authors clearly show that what others have characterized as a G2 arrest by flow cytometry is somewhat later in metaphase and correlates with kinetochore misregulation.

      Weaknesses:

      (1) The major problem with the paper is trying to connect what is observed in tumor cell lines with actual infections in primary T cells. While all of the descriptive work in cell lines is convincing, none of these cells are relevant targets and tumor cells have different cell death and cell cycle regulation than primary T cells. Thus, while Vif might well do all of the things described in the manuscript, it is a stretch to connect any of it to what happens in vivo.

      (2) Line 109 and elsewhere. The ability of Vif to cause cell cycle arrest and bind PP2A subunits is not a completely conserved feature. Rather, it is quite variable in different HIV-1 strains. (e.g. https://doi.org/10.1016/j.bbrc.2020.04.123 and https://elifesciences.org/articles/53036). Therefore, it is necessary for the authors to quite clearly use strain designations in the manuscript rather than a generic "Vif", and to more clearly describe the viruses being used.

      (3) Figure 5: This figure shows disruption of PP2A-B56 at the kinetochores. However, is this specific to the kinetochores? Since Vif has been described to more broadly degrade PP2A-B56, could this not be a result of a more general decrease in PP2A activity throughout the cell?
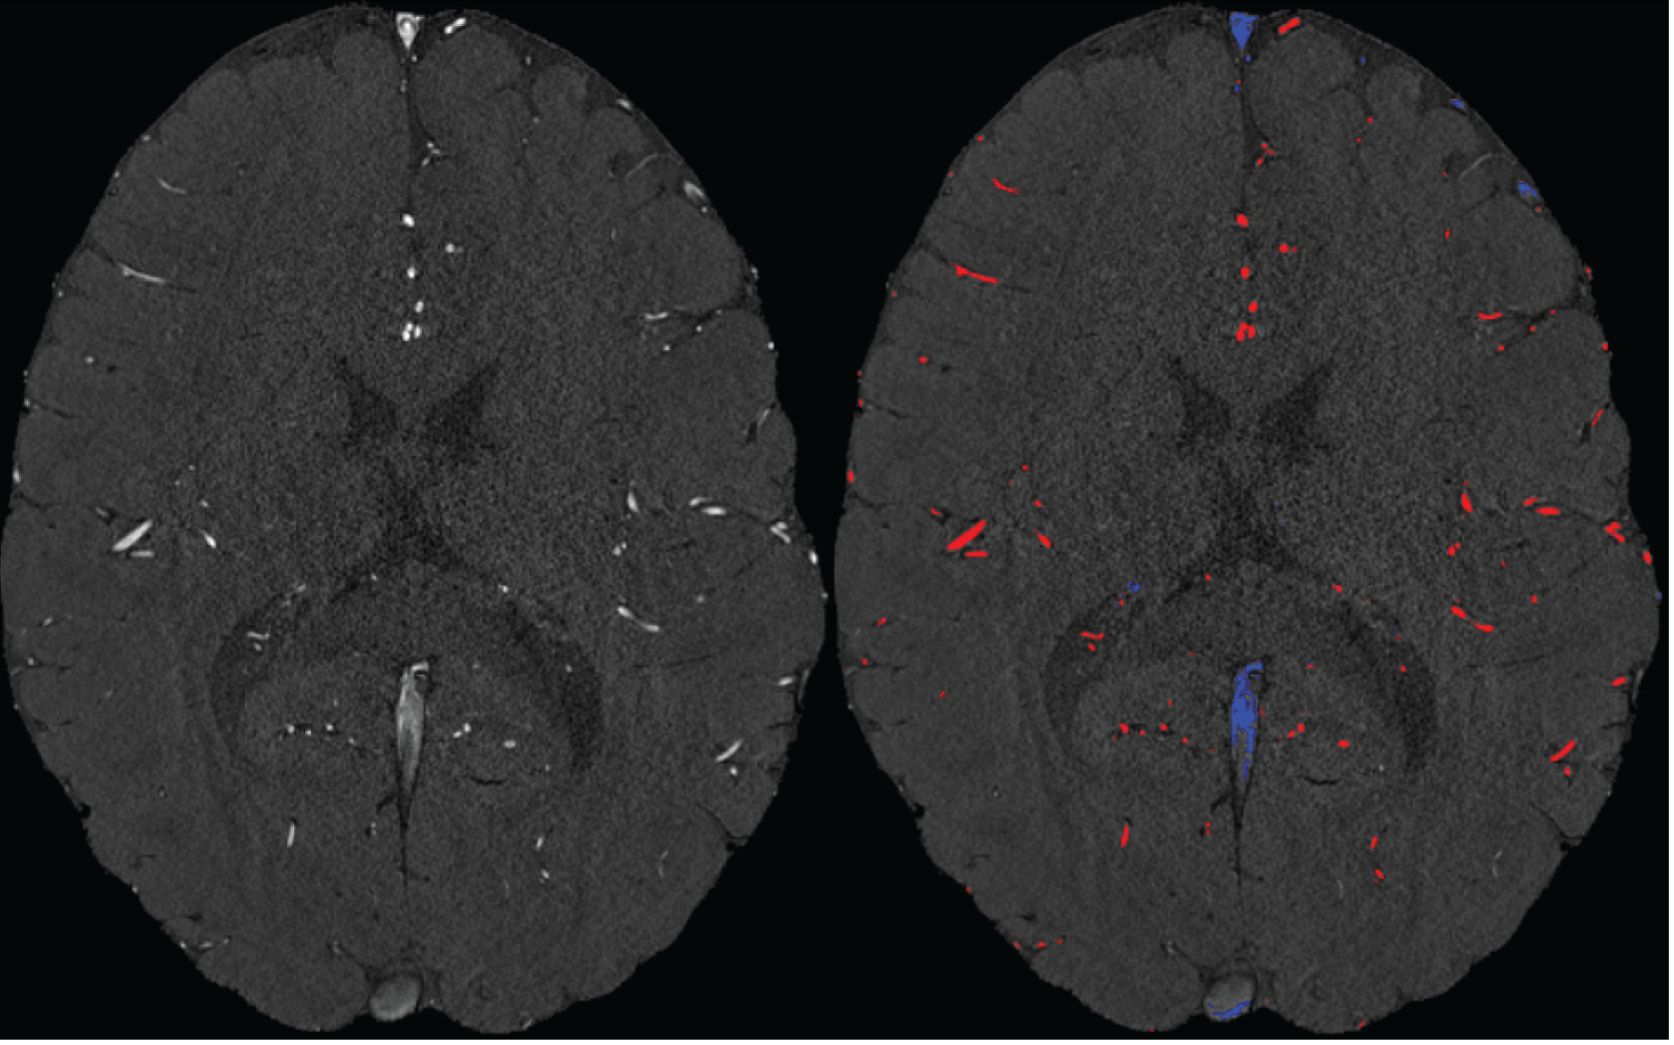
    3. Reviewer #2 (Public review):

      Summary

      The authors characterize the cell-cycle arrest induced by HIV-1 Vif in infected cells. They show this arrest is not at G2/M as previously thought but during metaphase. They show that the metaphase plate forms normally but progression to anaphase is massively delayed, and chromosome segregation is dysregulated in a manner consistent with impaired assembly of microtubules at the kinetochore. This correlates with the lack of recruitment of B56-subunits of PP2 phosphatase which are known degradation targets of Vif, suggesting that this weakens and unbalances the microtubule-mediated forces on the separating chromosomes.

      Strengths

      The authors present a very well-performed set of quantitative live cell imaging experiments that convincingly show a difference between Vif and Vpr-mediated cell cycle arrests. Through an in-depth characterization of the Vif-mediated block in metaphase, they make a strong case for this phenotype being tied to the degradation of PP2-B56 by Vif. Furthermore, it is important that they have performed most of these experiments with virally infected cells, meaning that their observations are observable at relevant viral expression levels of Vif.
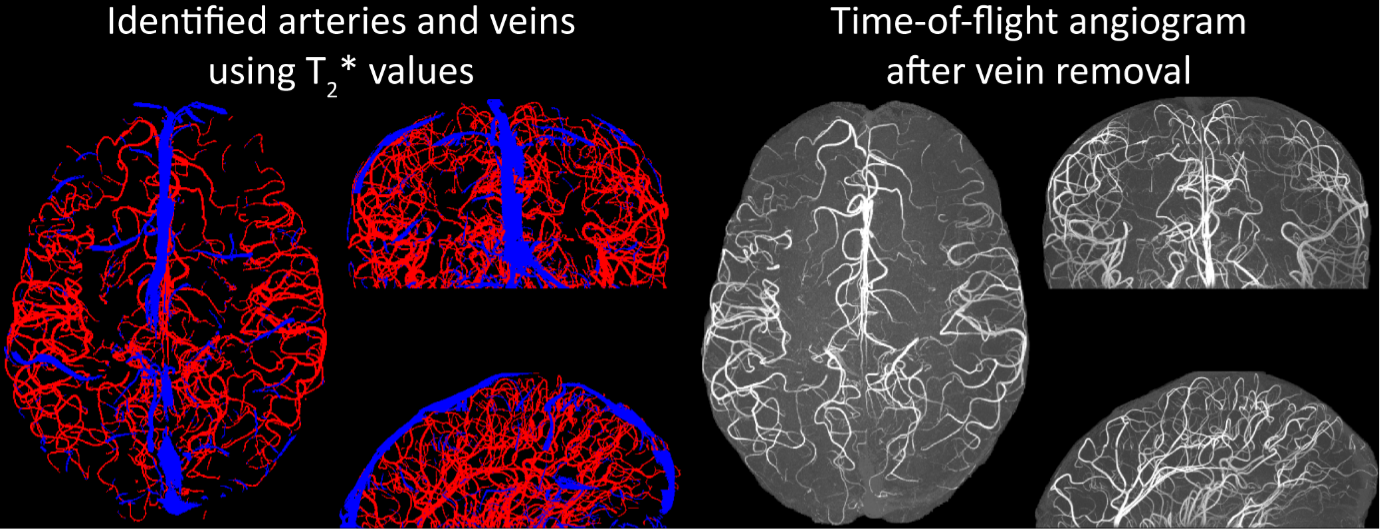
      Weaknesses

      Experimentally there is very little to criticize with respect to the cellular systems used. Data from 10.1016/j.bbrc.2020.04.123 has identified selective mutants that fail to degrade B56 while maintaining A3G degradation by Cul5, and it would be nice to confirm that such a mutant behaves like the delta-Vif virus when examining metaphase, but selective ablation of B56 during mitosis to mimic Vif is would expect to be very challenging and beyond the scope.
      Where I would raise some criticism is in the relevance of these observations to the replication and pathogenesis of the virus itself, which the authors do not address or discuss. Firstly, despite clear data that both Vpr and Vif can lead to a cell cycle arrest in cycling cells, it has never been particularly clear why the virus does this. While I would agree with the authors that Vif results in the metaphase arrest through targeting B56-PP2A, this may not be the reason WHY the virus targets one of the cell's major phosphatases, but rather a knock-on effect of doing so. I appreciate that this is beyond the scope of the study, but it is something I feel should be discussed rather than the narrow mechanistic points made in the discussion. Secondly, the authors suggest that this activity of Vif is a major cause of apoptosis in infected cells and perhaps CD4+ T cell depletion in vivo. It would be good to quantify how much apoptosis is Vif-dependent in infected primary human CD4+ T cells rather than transformed tumor cells, and whether this correlates with the Vif-mediated induction of a pseudometaphase.

    1. eLife Assessment

      This important work investigates the mechanism that underlies the switch between feeding and mating behaviors in the oriental fruit fly, Bactrocera dorsalis. Using a variety of approaches, the authors show that this switch is mediated by the neuropeptide, sulfakinin, acting peripherally through the sulfakinin receptor 1 to regulate the expression of antennal odorant receptors. The evidence is solid in support of the hypothesis that sulfakinin signaling mediates changes in the periphery, although additional experimental details would strengthen these claims.

    2. Joint Public Review:

      Summary:

      The behavioral switch between foraging and mating is important for resource allocation in insects. This study investigated the role of the neuropeptide, sulfakinin, and of its receptor, the sulfakinin receptor 1 (SkR1), in mediating this switch in the oriental fruit fly, Bactrocera dorsalis. The authors use genetic disruption of sulfakinin and of SkR1 to provide strong evidence that changes in sulfakinin signaling alter odorant receptor expression profiles and antennal responses and that these changes mediate the behavioral switch. The combination of molecular and physiological data is a strength of the study. Additional work would be needed to determine whether the physiological and molecular changes observed account for the behavioral changes observed.

      Strengths:

      (1) The authors show that sulfakinin signaling in the olfactory organ mediates the switch between foraging and mating, thereby providing evidence that peripheral sensory inputs contribute to this important change in behavior.

      (2) The authors' development of an assay to investigate the behavioral switch and their use of different approaches to demonstrate the role of sulfakinin and SkR1 in this process provides strong support for their hypothesis.

      (3) The manuscript is overall well-organized and documented.

      Weaknesses:

      (1) The authors claim that sulfakinin acts directly on SkR1-positive neurons to modulate the foraging and mating behaviors in B. dorsalis. The authors also indicated in the schematic that satiation suppresses SkR1 expression. Additional experiments and more a detailed discussion of the results would help support these claims.

      (2) The findings reported could be strengthened with additional experimental details regarding time of day versus duration of starvation effects and additional genetic controls, amongst others.

    1. eLife Assessment

      Shen et al. present a computational account of individual differences in mouse exploration when faced with a novel object in an open field from a previously published study (Akiti et al.) that relates subject-specific intrinsic exploration and caution about potential hazards to the spectrum of behaviors observed in this setting. Overall, this computational study is an important contribution that leverages a very general modeling framework (a Bayes Adaptive Markov Decision Process) to quantify and interrogate distinct drivers of exploratory behavior under potential threat. Given their assumptions, the modeling results are convincing: the authors are able to describe a substantial amount of the behavioral features and idiosyncracies in this dataset, and their model affords a normative interpretation related to inherent risk aversion and predation hazard "flexibility" of individual animals and should be of broad interest to researchers working to understand open-ended exploratory behaviors.

    2. Reviewer #1 (Public review):

      Summary:

      This work computationally characterized the threat-reward learning behavior of mice in a recent study (Akiti et al.), which had prominent individual differences. The authors constructed a Bayes-adaptive Markov decision process model and fitted the behavioral data by the model. The model assumed (i) hazard function starting from a prior (with free mean and SD parameters) and updated in a Bayesian manner through experience (actually no real threat or reward was given in the experiment), (ii) risk-sensitive evaluation of future outcomes (calculating lower 𝛼 quantile of outcomes with free 𝛼 parameter), and (iii) heuristic exploration bonus. The authors found that (i) brave animals had more widespread hazard priors than timid animals and thereby quickly learned that there was in fact little real threat, (ii) brave animals may also be less risk-aversive than timid animals in future outcome evaluation, and (iii) the exploration bonus could explain the observed behavioral features, including the transition of behavior from the peak to steady-state frequency of bout. Overall, this work is a novel interesting analysis of threat-reward learning, and provides useful insights for future experimental and theoretical work. However, there are several issues that I think need to be addressed.

      Strengths:

      (1) This work provides a normative Bayesian account for individual differences in braveness/timidity in reward-threat learning behavior, which complements the analysis by Akiti et al. based on model-free threat reinforcement learning.

      (2) Specifically, the individual differences were characterized by (i) the difference in the variance of hazard prior and potentially also (ii) the difference in the risk-sensitivity in the evaluation of future returns.

      Weakness:

      (1) Theoretically the effect of prior is diluted over experience whereas the effect of biased (risk-aversive) evaluation persists, but these two effects could not be teased apart in the fitting analysis of the current data.

      (2) It is currently unclear how (whether) the proposed model corresponds to neurobiological (rather than behavioral) findings, different from the analysis by Akiti et al.

      Major points:

      (1) Line 219<br /> It was assumed that the exploration bonus was replenished at a steady rate when the animal was at the nest. An alternative way would be assuming that the exploration bonus slowly degraded over time or experience, and if doing so, there appears to be a possibility that the transition of the bout rate from peak to steady-state could be at least partially explained by such a decrease in the exploration bonus.

      (2) Line 237- (Section 2.2.6, 2.2.7, Figures 7, 9)<br /> I was confused by the descriptions about nCVaR. I looked at the cited original literature Gagne & Dayan 2022, and understood that nCVaR is a risk-sensitive version of expected future returns (equation 4) with parameter α (α-bar) (ranging from 0 to 1) representing risk preference. Line 269-271 and Section 4.2 of the present manuscript described (in my understanding) that α was a parameter of the model. Then, isn't it more natural to report estimated values of α, rather than nCVaR, for individual animals in Section 2.2.6, 2.2.7, Figures 7, 9 (even though nCVaR monotonically depends on α)? In Figures 7 and 9, nCVaR appears to be upper-bounded to 1. The upper limit of α is 1 by definition, but I have no idea why nCVaR was also bounded by 1. So I would like to ask the authors to add more detailed explanations on nCVaR. Currently, CVaR is explained in Lines 237-243, but actually, there is no explanation about nCVaR rather than its formal name 'nested conditional value at risk' in Line 237.

      (3) Line 333 (and Abstract)<br /> Given that animals' behaviors could be equally well fitted by the model having both nCVaR (free α) and hazard prior and the alternative model having only hazard prior (with α = 1), may it be difficult to confidently claim that brave (/timid) animals had risk-neutral (/risk-aversive) preference in addition to widespread (/low-variance) hazard prior? Then, it might be good to somewhat weaken the corresponding expression in the Abstract (e.g., add 'potentially also' to the result for risk sensitivity) or mention the inseparability of risk sensitivity and prior belief pessimism (e.g., "... although risk sensitivity and prior belief pessimism could not be teased apart").

    3. Reviewer #2 (Public review):

      Shen and Dayan build a Bayes adaptive Markov decision process model with three key components: an adaptive hazard function capturing potential predation, an intrinsic reward function providing the urge to explore, and a conditional value at risk (CvaR, closely related to probability distortion explanations of risk traits). The model itself is very interesting and has many strengths including considering different sources of risk preference in generating behavior under uncertainty. I think this model will be useful to consider for those studying approach/avoid behaviors in dynamic contexts.

      The authors argue that the model explains behavior in a very simple and unconstrained behavioral task in which animals are shown novel objects and retreat from them in various manners (different body postures and patterns of motor chunks/syllables). The model itself does capture lots of the key mouse behavioral variability (at least on average on a mouse-by-mouse basis) which is interesting and potentially useful. However, the variables in the model - and the internal states it implies the mice have during the behavior - are relatively unconstrained given the wide range of explanations one can offer for the mouse behavior in the original study (Akiti et al). This reviewer commends the authors on an original and innovative expansion of existing models of animal behaviour, but recommends that the authors revise their study to reflect the obvious challenges. I would also recommend a reduction in claiming that this exercise gives a normative-like or at least quantitative account of mental disorders.

      My main comment is that this paper is a very nice model creation that can characterize the heterogeneity rodent behavior in a very simple approach/avoid context (Akiti et al; when a novel object is placed in an arena) that itself can be interpreted in a multitude of ways. The use of terms like "exploration", "brave", etc in this context is tricky because the task does not allow the original authors (Akiti et al) to quantify these "internal states" or "traits" with the appropriate level of quantitative detail to say whether this model is correct or not in capturing the internal states that result in the rodent behavior. That said, the original behavioral setup is so simple that one could imagine capturing the behavioral variability in multiple ways (potentially without evoking complex computations that the original authors never showed the mouse brain performs). I would recommend reframing the paper as a new model that proposes a set of internal states that could give rise to the behavioral heterogeneity observed in Akiti et al, but nonetheless is at this time only a hypothesis. Furthermore, an explanation of what would be really required to test this would be appreciated to make the point clearer.

    4. Reviewer #3 (Public review):

      Summary:

      The manuscript presents computational modelling of the behaviour of mice during encounters with novel and familiar objects, originally reported by Akiti et al. (Neuron 110, 2022). Mice typically perform short bouts of approach followed by a retreat to a safe distance, presumably to balance exploration to discover possible rewards with the potential risk of predation. However, there is considerable heterogeneity in this exploratory behaviour, both across time as an individual subject becomes more confident in approaching the object, and across subjects; with some mice rapidly becoming confident to closely explore the object, while other timid mice never become fully confident that the object is safe. The current work aims to explain both the dynamics of adaptation of individual animals over time, and the quantitative and qualitative differences in behaviour between subjects, by modelling their behaviour as arising from model-based planning in a Bayes adaptive Markov Decision Process (BAMDP) framework, in which the subjects maintain and update probabilistic estimates of the uncertain hazard presented by the object, and rationally balance the potential reward from exploring the object with the potential risk of predation it presents.

      In order to fit these complex models to the behaviour the authors necessarily make substantial simplifying assumptions, including coarse-graining the exploratory behaviour into phases quantified by a set of summary statistics related to the approach bouts of the animal. Inter-individual variation between subjects is modelled both by differences in their prior beliefs about the possible hazard presented by the object and by differences in their risk preference, modelled using a conditional value at risk (CVaR) objective, which focuses the subject's evaluation on different quantiles of the expected distribution of outcomes. Interestingly these two conceptually different possible sources of inter-subject variation in brave vs timid exploratory behaviour turn out not to be dissociable in the current dataset as they can largely compensate for each other in their effects on the measured behaviour. Nonetheless, the modelling captures a wide range of quantitative and qualitative differences between subjects in the dynamics of how they explore the object, essentially through differences in how subject's beliefs about the potential risk and reward presented by the object evolve over the course of exploration, and are combined to drive behaviour.

      Exploration in the face of risk is a ubiquitous feature of the decision-making problem faced by organisms, with strong clinical relevance, yet remains poorly understood and under-studied, making this work a timely and welcome addition to the literature.

      Strengths:

      (1) Individual differences in exploratory behaviour are an interesting, important, and under-studied topic.

      (2) Application of cutting-edge modelling methods to a rich behavioural dataset, successfully accounting for diverse qualitative and qualitative features of the data in a normative framework.

      (3) Thoughtful discussion of the results in the context of prior literature.

      Limitations:

      (1) The model-fitting approach used of coarse-graining the behaviour into phases and fitting to their summary statistics may not be applicable to exploratory behaviours in more complex environments where coarse-graining is less straightforward.

      (2) Some aspects of the work could be more usefully clarified within the manuscript.

    1. Author response:

      The following is the authors’ response to the original reviews.

      A summary of changes

      (1) Line 93: “positive effect” to “positive contribution”, as suggested by reviewer 2.

      (2) Line 147-148: the null hypothesis to test “equal interspecific and intraspecific interactions”, as indicated by reviewers 2 and 4.

      (3) Lines 155-162: removed to reduce duplication with the additive partitioning, as suggested by reviewer 2.

      (4) Lines 186-188: added “the estimated competitive growth response would also include the effects of density-dependent pests, pathogens, or microclimates”, as suggested by reviewer 3.  

      (5) Lines 219-222: added “The community positive effect can be further partitioned by mechanisms of positive interactions (resource partitioning and facilitation), and facilitative effect can be classified as mutualism (+/+), commensalism (+/0), or parasitic (+/–) based on species specific assessments”.  

      (6) Lines 377-386: added options for determining maximum competitive growth response in some extreme scenarios of species mixtures.

      (7) Figure 1: modified to show the variations of competitive growth response with relative competitive ability from minimum (null expectation) to maximum (competitive exclusion).    

      A summary of four reviewers’ questions and authors’ response

      (1) A summary of authors’ responses. Reviewers did not seem to understand our work. They indicated that our model is inadequate for hypothesis testing. The fact is, as we note below, that our model allows for more hypothesis testing than the additive partitioning model. They suggested that one of our model components, the competitive growth response, needs to be further partitioned. However, this term represents only the competition effect and can not be split any further. Reviewers criticized us for misunderstanding the additive components while they suggested the same logic to test some intuitive ideas. They did not seem to know that the effects of competitive interactions vary with assessment methods, which differ between competition and biodiversity research. Our work seeks to harmonise definitions between these two fields and bridge the gap. The reviewers acknowledged that the additive components (i.e., the selection effect and complementarity effect) do not have clear biological meanings; however, they did not acknowledge that the additive components are used extensively for determining mechanisms of species interactions in biodiversity research. There is hardly any research that uses the additive partitioning model without linking the additive components to specific mechanisms of species interactions (i.e., positive SE to competition and positive CE to positive interactions).

      (2) Additive partitioning and underlying mechanisms. Some reviewers acknowledged that additive partitioning is not meant for determining mechanisms of species interactions and therefore argued that the additive partitioning should not be criticized for lack of biological meanings with the additive components. However, they insisted that additive partitioning is useful in quantifying net biodiversity effects against the null hypothesis that there is no difference between intraspecific and interspecific interactions or testing the idea that “niche complementarity mitigates competition” or “competitively superior species dominate mixtures”. Are these views contradictory each other? How can the additive partitioning that is not designed for determining mechanisms of species interactions provide meaningful explanations for outputs of species interactions, e.g., “niche complementarity mitigates competition” or “competitively superior species dominate mixtures”?

      Reviewers did not seem to realize that these ideas are equivalent to the suggestions that CE represents for the effects of positive interactions and SE for the effects of competitive interactions, that the quantification of net biodiversity effects does not require the two additive components, and that the null hypothesis exists long before the additive partitioning (see de Wit, 1960, de Wit et al., 1966). It is generally agreed that CE and SE result from mathematical calculations and do not have clear biological meanings in terms of linkages to specific mechanisms of species interactions responsible for observed net biodiversity effects or changes in ecosystem function (Loreau and Hector, 2012; Bourrat et al., 2023). Calling some mixed effects of species interactions as mechanisms (e.g., CE and SE) is misleading.        

      Model structure: incomplete or inadequate for hypothesis testing. Other than positive, negative, and competition interactions, two reviewers wanted to have more specific interactions such as microclimate amelioration and negative feedback from species-specific pests and pathogens. The determination of these specific mechanisms requires more investigations and cannot be simply made through partitioning growth and yield data. However, the effects of these interactions will be captured in our definition of species interactions.  Reviewers did not seem to know that the additive partitioning would also not allow identifying these specific positive species interactions.

      Inspired by the mathematical form of additive partitioning, two reviewers suggested that our model (presumably equation 4) is incomplete and the second term, i.e., competitive growth response needs to be further explored or partitioned. The second term represents deviations from the null expectation, due to species differences in growth and competitive ability or competition effect. We do not know why and how this term can be further partitioned and what any subcomponents would mean.   

      Our competitive partitioning model is based on two hypotheses: first, the null hypothesis to test the equivalence of interspecific and intraspecific interactions. This hypothesis is the same as the additive partitioning model. Second, the competitive hypothesis, which tests the dominance of positive or negative species interactions in a community. Thus, our model allows for more hypothesis testing than the current additive partitioning model.     

      (3) Types of species interactions. We follow the definition of species interactions generally used in biodiversity research (see Loreau and Hector, 2001), i.e., positive interactions (or complementarity) include resource partitioning and facilitation, negative interactions include interference competition, and competitive interactions include resource competition. One reviewer suggested that resource partitioning is byproduct of competition and should not be part of positive species interactions, which may be true for long-term evolution of species co-existence but not for biodiversity experiments of decade duration at most. Two reviewers suggested that positive interactions should also include microclimate amelioration or negative feedback from species-specific pests and pathogens. We agree and these are included in our definition. 

      (4) Significance of partial density monocultures. We used partial and full density monocultures and species competitive ability to determine what species can possibly achieve in mixture under the competitive hypothesis that constituent species share an identical niche but differ in growth and competitive ability. We did not use partial monocultures to test the effects of density on biodiversity effects. As with the additive partitioning, the competitive partitioning model is not designed for comparing yields across different densities. We added at lines 186-188 to indicate that the estimated competitive growth response would also include the effects of density-dependent pests, pathogens, or microclimates.  

      Similarly, we do not use the partial density monoculture to  supplant the replacement series design. Partial density monocultures only supplement the “replacement series” design that does not provides estimates of facilitative effects and competitive growth responses that would occur in mixtures. It is crucial to know that one experimental approach is simply not enough for determining underlying mechanisms of species interactions responsible for changes in ecosystem function.  

      (5) Competition effect in competition and biodiversity research. Due to different methods used, competition effect in competition research has different ecological meanings from that in biodiversity research. In competition research, species performance in mixture are compared with their partial density monocultures and therefore competition effect is generally negative, as suggested by reviewer 4. In biodiversity research, comparison is between mixture and full density monocultures. The resulting competition effect can be positive or negative for both individual species and community productivity defined by species composition and full density monoculture yields.     

      Therefore, we cannot use the results of competition research based on additive series design to describe effects of competitive interactions on ecosystem productivity based replacement series design.

      Reviewer #1 (Public Review):

      [Editors' note: this is an overall synthesis from the Reviewing Editor in consultation with the reviewers.]

      The three reviews expand our critique of this manuscript in some depth and complementary directions. These can be synthesized in the following main points (we point out that there is quite a bit more that could be written about the flaws with this study; however, time constraints prevented us from further elaborating on the issues we see):

      (1) It is unclear what the authors want to do.

      As indicate by the title, our objective is to “partition changes in ecosystem productivity by effects of species interactions”, i.e., partitioning net biodiversity effects estimated from the null expectation into components associated with positive, negative, or competition interspecific interactions.

      It seems their main point is that the large BEF literature and especially biodiversity experiments overstate the occurrence of positive biodiversity effects because some of these can result from competition.

      We demonstrated through ecological theories and simulation/experiment data that competition is a major source of the net biodiversity effects estimated with additive partitioning model. We know that competition effect varies with mixture attributes. Future research will determine average effect of competitive interactions on biodiversity effects in large BEF literature.   

      Because reduced interspecific relative to intraspecific competition in mixture is sufficient to produce positive effects in mixtures (if interspecific competition = 0 then RYT = S, where S is species richness in mixture -- this according to the reciprocal yield law = law of constant final yield), they have a problem accepting NE > 0 as true biodiversity effect (see additive partitioning method of Loreau & Hector 2001 cited in manuscript).

      We have no problem to accept NE>0 as true positive biodiversity effect. However, NE>0 can also result from competitive interactions based on the null expectation and needs to be partitioned by effects of species interactions.

      (2) The authors' next claim, without justification, that additive partitioning of NE is flawed and theoretically and biologically meaningless.

      The additive partitioning model is based on Covariance equation (or Price equation) that has nothing to do with biodiversity partitioning (Bourrat et al., 2023). Biological meaning was arbitrarily assigned to CE and SE. We made clear that the additive partitioning model is mathematically sound but does not have biological meanings that it has been used for.   

      They misinterpret the CE component as biological niche partitioning and the SE component as biological dominance.

      We did not. Loreau and Hector (2001) clearly indicated positive CE for positive interactions and positive SE for competitive interactions, which is generally what has been used for in the last twenty years.

      They do not seem to accept that the additive partitioning is a logically and mathematically sound derivation from basic principles that cannot be contested.

      We do not have problem with mathematical form of additive partitioning but only oppose ecological meanings assigned to CE and SE, simply because CE and SE both result from all species interactions (see Loreau and Hector, 2001; Bourrat et al., 2023). The reviewer seemed to have a contradictory thinking that the additive components are biologically meaningless but derived from biological basic principles.       

      (3) The authors go on to introduce a method to calculate species-level overyielding (RY > 1/S in replacement series experiments) as a competitive growth response and multiply this with the species monoculture biomass relative to the maximum to obtain competitive expectation. This method is based on resource competition and the idea that resource uptake is fully converted into biomass (instead of e.g. investing it in allelopathic chemical production).

      Correct, but we did not assume “resource uptake is fully converted into biomass”.

      (4) It is unclear which experiments should be done, i.e. are partial-density monocultures planted or simply calculated from full-density monocultures? At what time are monocultures evaluated? The framework suggests that monocultures must have the full potential to develop, but in experiments, they are often performing very poorly, at least after some time. I assume in such cases the monocultures could not be used.

      Both partial and full density monocultures are needed, along with mixtures to separate NE by species interactions. Calculating competitive growth responses from density-size relationships can be an alternative, given the lack of partial density monocultures in current biodiversity experiments, but is not preferred.

      Similar to additive partitioning, our model can (and should) be applied to all developmental stages of an experiment to examine how interactions evolve through time.   

      (5) There are many reasons why the ideal case of only resource competition playing a role is unrealistic. This excludes enemies but also differential conversion factors of resources into biomass and antagonistic or facilitative effects. Because there are so many potential reasons for deviations from the null model of only resource competition, a deviation from the null model does not allow conclusions about underlying mechanisms.

      The competitive expectation is only a hypothesis, just as the null expectation. The difference between competitive and null expectations represents a competitive effect resulting from species differences in growth and competitive ability, while the deviation of observed yields from the competitive expectation indicates positive or negative effect (see lines 201-219).

      Furthermore, this is not a systematically developed partitioning, but some rather empirical ad hoc formulation of a first term that is thought to approximate competitive effects as understood by the authors (but again, there already are problems here). The second residual term is not investigated. For a proper partitioning approach, one would have to decompose overyielding into two (or more) terms and demonstrate (algebraically) that under some reasonable definitions of competitive and non-competitive interactions, these end up driving the respective terms.

      The first term represents the null expectation assuming equal interspecific and intraspecific interactions, i.e., absence of positive, negative, and competition effects. The second residual term represents competition effect, due to species differences in growth and competitive ability. The meaning of second residual term is clear and does not need to be further partitioned or investigated.

      In fact, our competitive partitioning also has several components including null expectation, competitive growth response, and observed yield, plus partial density monocultures for species assessment, or null expectations, competitive expectations, and observed yields for community level assessment, although different from the additive partitioning.

      (6) Using a simplistic simulation to test the method is insufficient. For example, I do not see how the simulation includes a mechanism that could create CE in additive partitioning if all species would have the same monoculture yield. Similarly, they do not include mechanisms of enemies or antagonistic interactions (e.g. allelopathy).

      The simulation model we used is developed from real world data and can only do what are available in the model in terms of species and their growth under different conditions. We can not go beyond data limitation. The model is empirical and has been shown to accurately estimate yield in the aspen-spruce forest condition. We would also note that we do also use experimental data (Table 2).  

      (7) The authors do not cite relevant literature regarding density x biodiversity experiments, competition experiments, replacement-series experiments, density-yield experiments, additive partitioning, facilitation, and so on.

      We cited literature relevant to biodiversity partitioning since we are not aiming to cover everything. The reviewer may not be aware that most of the research areas listed are actually included in our work, such as additive and replacement-series experiment designs, additive partitioning, facilitation, competition studies, and density-yield relationships. Our competitive model partitioning is based on biological principles, while the additive partitioning model is based only on a mathematical equation.   

      Overall, this manuscript does not lead further from what we have already elaborated in the broad field of BEF and competition studies and rather blurs our understanding of the topic.

      The results of competition studies based on additive series design are not really used in the broad field of BEF based on replacement series design. The effects of competitive interactions on BEF are never clearly defined using the results of competition studies. Our work is filling that gap.  

      Reviewer #2 (Public Review):

      This manuscript is motivated by the question of what mechanisms cause overyielding in mixed-species communities relative to the corresponding monocultures. This is an important and timely question, given that the ultimate biological reasons for such biodiversity effects are not fully understood.

      As a starting point, the authors discuss the so-called "additive partitioning" (AP) method proposed by Loreau & Hector in 2001. The AP is the result of a mathematical rearrangement of the definition of overyielding, written in terms of relative yields (RY) of species in mixtures relative to monocultures. One term, the so-called complementarity effect (CE), is proportional to the average RY deviations from the null expectations that plants of both species "do the same" in monocultures and mixtures. The other term, the selection effect (SE), captures how these RY deviations are related to monoculture productivity. Overall, CE measures whether relative biomass gains differ from zero when averaged across all community members, and SE, whether the "relative advantage" species have in the mixture, is related to their productivity. In extreme cases, when all species benefit, CE becomes positive. When large species have large relative productivity increases, SE becomes positive. This is intuitively compatible with the idea that niche complementarity mitigates competition (CE>0), or that competitively superior species dominate mixtures and thereby driver overyielding (SE>0).

      The reviewer needs to know that these ideas are based on the same logic that positive CE represents the effects of positive interactions and positive SE represents the effects of competitive interactions. CE>0 or SE>0 can result from many different scenarios of species interactions, not necessarily “niche complementarity mitigates competition” or “competitively superior species dominate mixtures”. CE>0 and SE>0 can occur alone or together. We simply can not tell underlying mechanisms of overyielding from mathematical calculations (CE and SE), as suggested by this reviewer later.

      The reviewer criticizes us while using the same logic themselves.

      However, it is very important to understand that CE and SE capture the "statistical structure" of RY that underlies overyielding. Specifically, CE and SE are not the ultimate biological mechanisms that drive overyielding, and never were meant to be. CE also does not describe niche complementarity. Interpreting CE and SE as directly quantifying niche complementarity or resource competition, is simply wrong, although it sometimes is done. The criticism of the AP method thus in large part seems unwarranted. The alternative methods the authors discuss (lines 108-123) are based on very similar principles.

      The reviewer actually supports our point. However, CE and SE have been largely used as biological mechanisms, positive CE as the results of complementary interactions and positive SE as the results of competitive interactions (see Loreau and Hector, 2001).  

      We do not have problem with the "statistical structure" of AP; it is simply a covariance equation. It is important to know that CE and SE do not provide additional information on overyielding than NE in terms of underlying mechanisms of species interactions. Any attempt to investigate mechanism of overyielding with CE or SE can easily go wrong.

      Our competitive partitioning model incorporates effects of competitive interactions into the conventional null expectation and allows for separating different effects of species interactions. In comparison, the additive partitioning model does not have this capacity, not even designed for this purpose, as suggested by this and other reviewers.         

      The authors now set out to develop a method that aims at linking response patterns to "more true" biological mechanisms.

      Assuming that "competitive dominance" is key to understanding mixture productivity, because "competitive interactions are the predominant type of interspecific relationships in plants", the authors introduce "partial density" monocultures, i.e. monocultures that have the same planting density for a species as in a mixture. The idea is that using these partial density monocultures as a reference would allow for isolating the effect of competition by the surrounding "species matrix".

      Correct.

      The authors argue that "To separate effects of competitive interactions from those of other species interactions, we would need the hypothesis that constituent species share an identical niche but differ in growth and competitive ability (i.e., absence of positive/negative interactions)." - I think the term interaction is not correctly used here, because clearly competition is an interaction, but the point made here is that this would be a zero-sum game.

      We did not say that competition is not an interaction; we only want to separate the effect of competition from those of other species interactions.

      The authors use the ratio of productivity of partial density and full-density monocultures, divided by planting density, as a measure of "competitive growth response" (abbreviated as MG). This is the extra growth a plant individual produces when intraspecific competition is reduced.

      Correct.

      We added at lines 377-386 to discuss options to determine MG in some uncommon scenarios of species mixtures.

      Here, I see two issues: first, this rests on the assumption that there is only "one mode" of competition if two species use the same resources, which may not be true, because intraspecific and interspecific competition may differ. Of course, one can argue that then somehow "niches" are different, but such a niche definition would be very broad and go beyond the "resource set" perspective the authors adopt. Second, this value will heavily depend on timing and the relationship between maximum initial growth rates and competitive abilities at high stand densities.

      First, the "competitive effect" focusses on resource competition and other forms of competition (presumably interference competition) are included in the negative interactions.

      Second, competitive growth response varies over time and with density, and so do NE, CE, SE, and interspecific interactions.

      The authors then progress to define relative competitive ability (RC), and this time simply uses monoculture biomass as a measure of competitive ability. To express this biomass in a standardized way, they express it as different from the mean of the other species and then divide by the maximum monoculture biomass of all species.

      I have two concerns here: first, if competitive ability is the capability of a species to preempt resources from a pool also accessed by another species, as the authors argued before, then this seems wrong because one would expect that a species can simply be more productive because it has a broader niche space that it exploits. This contradicts the very narrow perspective on competitive ability the authors have adopted. This also is difficult to reconcile with the idea that specialist species with a narrow niche would outcompete generalist species with a broad niche. Second, I am concerned by the mathematical form. Standardizing by the maximum makes the scaling dependent on a single value.

      First, growth conditions are controlled in biodiversity experiments, i.e., both monocultures and mixtures are the same in resource space. Species do not have opportunity to exploit resources outside experimental area. For example, if less productive species on normal soils outperform more competitive species on saline/alkaline soil, these “less productive species” are considered “more productive”.    

      Second, as discussed in our paper (lines 367-376; Figure 1), more research is needed to determine relationships between species traits (biomass or height) and relative competitive ability. By then, scaling by the maximum would not be needed. There has been quite a lot of research on such relationships; we should leave this to subject experts to determine what would be mostly appropriate for species studied.

      As a final step, the authors calculate a "competitive expectation" for a species' biomass in the mixture, by scaling deviations from the expected yield by the product MG ⨯ RC. This would mean a species does better in a mixture when (1) it benefits most from a conspecific density reduction, and (2) has a relatively high biomass.

      Put simply, the assumption would be that if a species is productive in monoculture (high RC), it effectively does not "see" the competitors and then grows like it would be the sole species in the community, i.e. like in the partial density monoculture.

      Correct, if species competitive ability differs substantially, the more competitive species in the mixture would grow like partial density monoculture. This extra growth should not be treated as sources of positive biodiversity effects, simply because it does not result from positive species interactions.   

      Overall, I am not very convinced by the proposed method.

      (1) The proposed method seems not very systematic but rather "ad hoc". It also is much less a partitioning method than the AP method because the other term is simply the difference. It would be good if the authors investigated the mathematical form of this remainder and explored its properties.. when does complementarity occur? Would it capture complementarity and facilitation?

      AP is, by no means, systematic. Remember, AP is based on covariance equation (or Price equation) that has nothing to do with species interactions, other than nice-looking mathematical form (Bourrat et al., 2023). Ecological meanings are subjectively given to CE and SE. Therefore,  CE and SE reflect what we call them, not what they really mean.    

      The remainder measures deviations from the null expectation, due to only competition effect, and can not be partitioned any further. The remainder would be positive for more competitive species and negative for less competitive species in mixture relative to their full density monoculture. The deviation of observed yields from competitive expectations indicates dominance of positive or negative species interactions. All these are clearly outlined at lines 201-221.   

      (2) The justification for the calculation of MG and RC does not seem to follow the very strict assumptions of what competition (in the absence of complementarity) is. See my specific comments above.

      We do not see why not.

      (3) Overall, the manuscript is hard to read. This is in part a problem of terminology and presentation, and it would be good to use more systematic terms for "response patterns" and "biological mechanisms".

      To help understand the variations of competitive growth response with relative competitive ability, the x axis of Figure 1 is labelled with null expectation, competitive expectation, and competitive exclusion from minimum to maximum deviation of competitive ability from community average.

      We have followed terms used in biodiversity partitioning and changing terms can be confusing.  

      Examples:

      - on line 30, the authors write that CE is used to measure "positive" interactions and SE to measure "competitive interactions", and later name "positive" and "negative" interactions "mechanisms of species interactions". Here the authors first use "positive interaction" as any type of effect that results in a community-level biomass gain, but then they use "interaction" with reference to specific biological mechanisms (e.g. one species might attract a parasite that infests another species, which in turn may cause further changes that modify the growth of the first and other species).

      There are some differences in meaning, but that is what CE and SE have been generally used for. Using different terms can be confusing and does not help understanding the problems with AP.

      - on line 70, the authors state that "positive interaction" increases productivity relative to the null expectation, but it is clear that an interaction can have "negative" consequences for one interaction partner and "positive" ones for the other. Therefore, "positive" and "negative" interactions, when defined in this way, cannot be directly linked to "resource partitioning" and "facilitation", and "species interference" as the authors do. Also, these categories of mechanisms are still simple. For example, how do biotic interactions with enemies classify, see above?

      We are explaining effects of competitive interactions on species yield, and ultimately on community yield that can be linked to “resource partitioning" and "facilitation", and "species interference".

      More specific species interactions require detailed biological investigation and cannot be determined through partitioning of biomass production.  

      - line 145: "Under the null hypothesis, species in the mixture are assumed to be competitively equivalent (i.e., absence of interspecific interactions)". This is wrong. The assumption is that there are interspecific interactions, but that these are the same as the intraspecific ones. Weirdly, what follows is a description of the AP method, which does not belong here. This paragraph would better be moved to the introduction where the AP method is mentioned. Or omitted, since it is basically a repetition of the original Loreau & Hector paper.

      As suggested, “absence of interspecific interactions” was replaced with “equal interspecific and intraspecific interactions”.

      We have removed lines 155-162 to reduce duplication. However, our method is based on null expectation that needs to be introduced, despite it is part of AP.

      Other points:

      - line 66: community productivity, not ecosystem productivity.

      Both community productivity and ecosystem productivity are used in biodiversity research, although meaning can be slightly different. Comparatively, ecosystem productivity is more common.

      - line 68: community average responses are with respect to relative yields - this is important!

      - line 64: what are "species effects of species interactions"?

      We searched and did not find “species effects of species interactions”.

      - line 90: here "competitive" and "productive" are mixed up, and it is important to state that "suffers more" refers to relative changes, not yield changes.

      It, in fact, refers to yield changes. For example, less productive species, at active growth, are more responsive to changes in competition, while more productive species, at inactive growth (i.e., aging), are less responsive to changes in competition.   

      - line 92: "positive effect of competitive dominance": I don't understand what is meant here.

      The phrase was modified to “positive contribution of competitive dominance to ecosystem productivity based on the null expectation”.

      Reviewer #3 (Public Review):

      Summary:

      This manuscript by Tao et al. reports on an effort to better specify the underlying interactions driving the effects of biodiversity on productivity in biodiversity experiments. The authors are especially concerned with the potential for competitive interactions to drive positive biodiversity-ecosystem functioning relationships by driving down the biomass of subdominant species. The authors suggest a new partitioning schema that utilizes a suite of partial density treatments to capture so-called competitive ability. While I agree with the authors that understanding the underlying drivers of biodiversity-ecosystem functioning relationships is valuable - I am unsure of the added value of this specific approach for several reasons.

      Strengths:

      I can find a lot of value in endeavouring to improve our understanding of how biodiversity-ecosystem functioning relationships arise. I agree with the authors that competition is not well integrated into the complementarity and selection effect and interrogating this is important.

      Weaknesses:

      (1) The authors start the introduction very narrowly and do not make clear why it is so important to understand the underlying mechanisms driving biodiversity-ecosystem functioning relationships until the end of the discussion.

      There are different ways to start introduction; we believe that starting with the problems of the current approach is the most effective for outlining the study’s objective.  

      (2) The authors criticize the existing framework for only incorporating positive interactions but this is an oversimplification of the existing framework in several ways:

      We did not criticize the existing framework for only incorporating positive interactions. We criticize the existing framework, because it is not based on mechanisms of species interactions, but is extensively used to determine underlying mechanisms driving biodiversity-ecosystem functioning relationships.

      a. The existing partitioning scheme incorporates resource partitioning which is an effect of competition.

      Resource partitioning means that species utilize resources differently, while competition means species use the same resources. “resource partitioning is an effect of competition” is not true in biodiversity experiments that are often short in duration and controlled in conditions.  

      b. The authors neglect the potential that negative feedback from species-specific pests and pathogens can also drive positive BEF and complementarity effects but is not a positive interaction, necessarily. This is discussed in Schnitzer et al. 2011, Maron et al. 2011, Hendriks et al. 2013, Barry et al. 2019, etc.

      We did not. The feedback effect will be reflected in the differences between observed yields and competitive expectations if species in mixtures have different pests and pathogens relative to monocultures. The additive partitioning does not identify these feedback effects either.

      c. Hector and Loreau (and many of the other citations listed) do not limit competition to SE because resource partitioning is a byproduct of competition.

      Positive SE has been largely interpreted as the result of competition including Hector and Loreau (2001) and many others. It needs to be clear that neither of the additive components can be linked to specific mechanisms of species interactions. 

      Does “resource partitioning is a byproduct of competition” mean that species change their niche to avoid competition? If this is what the reviewer means, it may occur through long-term evolution, but not in short-term biodiversity experiments. Hector and Loreau (2001) clearly indicated that their complementarity effect includes both resource partitioning and facilitation.   

      (3) It is unclear how this new measure relates to the selection effect, in particular. I would suggest that the authors add a conceptual figure that shows some scenarios in which this metric would give a different answer than the traditional additive partition. The example that the authors use where a dominant species increases in biomass and the amount that it increases in biomass is greater than the amount of loss from it outcompeting a subdominant species is a general example often used for a selection effect when exactly would you see a difference between the two?:<br /> a. Just a note - I do think you should see a difference between the two if the species suffers from strong intraspecific competition and has therefore low monoculture biomass but this would tend to also be a very low-density monoculture in practice so there would potentially be little difference between a low density and high-density monoculture because the individuals in a high-density monoculture would die anyway. So I am not sure that in practice you would really see this difference even if partial density plots were incorporated.

      Linking new measure to SE or CE would be difficult (see many comparisons in Tables and Figures in our manuscript), as SE and CE are derived from mathematical equation and do not represent specific mechanisms of species interactions (Hector and Loreau 2012; Bourrat et al., 2023).

      (4) One of the tricky things about these endeavors is that they often pull on theory from two different subfields and use similar terminology to refer to different things. For example - in competition theory, facilitation often refers to a positive relative interaction index (this seems to be how the authors are interpreting this) while in the BEF world facilitation often refers to a set of concrete physical mechanisms like microclimate amelioration. The truth is that both of these subfields use net effects. The relative interaction index is also a net outcome as is the complementarity effect even if it is only a piece of the net biodiversity effect. Trying to combine these two subfields to come up with a new partitioning mechanism requires interrogating the underlying assumptions of both subfields which I do not see in this paper.

      Agree, microclimate amelioration is also part of positive effect and will be reflected in the difference between observed yield and competitive expectation. We can not separate the two mechanisms of positive species interactions without investigating influences of microclimate on growth and yield.

      (5) The partial density treatment does not isolate competition in the way that the authors indicate. All of the interactions that the authors discuss are density-dependent including the mechanism that is not discussed (negative feedback from species-specific pests and pathogens). These partial density treatment effects therefore cannot simply be equated to competition as the authors indicate.:

      We use partial density monoculture to determine maximum competitive growth response, effect of density-dependent intraspecific interactions, and species competitive ability to determine the level of maximum competitive growth response species can achieve in mixtures. There may be changes in species-specific pests and pathogens from partial to full density monocultures, which will be captured in competitive growth responses of individuals. We added at lines 186-188 to indicate that the maximum competitive growth response estimated would also include the effects of density-dependent pests, pathogens, or microclimates.   

      a. Additionally - the authors use mixture biomass as a stand-in for competitive ability in some cases but mixture biomass could also be determined by the degree to which a plant is facilitated in the mixture (for example).

      We used monoculture biomass, not mixture biomass, to assess competitive ability

      (6) I found the literature citation to be a bit loose. For example, the authors state that the additive partition is used to separate positive interactions from competition (lines 70-76) and cite many papers but several of these (e.g. Barry et al. 2019) explicitly do not say this.

      Barry et al. (2019) defined CE as overproduction from monocultures, an effect of positive interactions.  

      (7) The natural take-home message from this study is that it would be valuable for biodiversity experiments to include partial density treatments but I have a hard time seeing this as a valuable addition to the field for two reasons:

      a. In practice - adding in partial density treatments would not be feasible for the vast majority of experiments which are already often unfeasibly large to maintain.

      The reviewer suggested that quantity is more important than quality. Without partial density monocultures no one can separate different effects of species interactions, as suggested by Loreau and Hector, reviewers, and many others that effects of species interactions can not be clearly differentiated with replacement series design. Unreliable scientific findings are not valuable.

      b. The density effect would likely only be valuable during the establishment phase of the experiment because species that are strongly limited by intraspecific competition will die in the full-density plots resulting in low-density monocultures. You can see this in many biodiversity experiments after the first years. Even though they are seeded (or rarely planted) at a certain density, the density after several years in many monocultures is quite low.

      True. High or low density also depends on individual size; if individuals do not get enough resources, density is high. Therefore, density effect can be strong even as density drops substantially from initial levels.  

      Reviewer #4 (Public Review):

      Summary:

      This manuscript claims to provide a new null hypothesis for testing the effects of biodiversity on ecosystem functioning. It reports that the strength of biodiversity effects changes when this different null hypothesis is used. This main result is rather inevitable. That is, one expects a different answer when using a different approach. The question then becomes whether the manuscript’s null hypothesis is both new and an improvement on the null hypothesis that has been in use in recent decades.

      It needs to be clear that we use two hypotheses, null hypothesis that is currently used with AP, and competitive hypothesis that is new with this manuscript. The null hypothesis helps determine changes in ecosystem productivity from all species interactions, while the competitive hypothesis helps partition changes in ecosystem productivity by mechanisms of species interactions, i.e., positive, negative, or competitive interactions.    

      Strengths:

      In general, I appreciate studies like this that question whether we have been doing it all wrong and I encourage consideration of new approaches.

      Weaknesses:

      Despite many sweeping critiques of previous studies and bold claims of novelty made throughout the manuscript, I was unable to find new insights. The manuscript fails to place the study in the context of the long history of literature on competition and biodiversity and ecosystem functioning. The Introduction claims the new approach will address deficiencies of previous approaches, but after reading further I see no evidence that it addresses the limitations of previous approaches noted in the Introduction. Furthermore, the manuscript does not reproducibly describe the methods used to produce the results (e.g., in Table 1) and relies on simulations, claiming experimental data are not available when many experiments have already tested these ideas and not found support for them. Finally, it is unclear to me whether rejecting the ‘new’ null hypothesis presented in the manuscript would be of interest to ecologists, agronomists, conservationists, or others. I will elaborate on each of these points below.

      First, there are many biodiversity experiments but those with partial density monocultures are rare. We found only one greenhouse experiment. We have to use simulation to illustrate different scenarios of species interactions to demonstrate how our approach works and how different it is from the AP.  

      Because of different methods used, the results of long history competition research (generally based on additive series design) cannot be used to define effects of competitive interactions in biodiversity research (generally based on replacement series design). This may be the reason that few competition researchers were cited in Loreau and Hector (2001).

      Our approach requires two hypotheses, null and competitive, and the meaning of deviation from these hypotheses are outlined at lines 201-221 for both individual species and community level assessments. Distinguishing changes in ecosystem productivity by species interactions would be of great interest to “ecologists, agronomists, conservationists, or others”.

      The critiques of biodiversity experiments and existing additive partitioning methods are overstated, as is the extent to which this new approach addresses its limitations. For example, the critique that current biodiversity experiments cannot reveal the effects of species interactions (e.g., lines 37-39) isn't generally true, but it could be true if stated more specifically. That is, this statement is incorrect as written because comparisons of mixtures, where there are interspecific and intraspecific interactions, with monocultures, where there are only intraspecific interactions, certainly provide information about the effects of species interactions (interspecific interactions). These biodiversity experiments and existing additive partitioning approaches have limits, of course, for identifying the specific types of interactions (e.g., whether mediated by exploitative resource competition, apparent competition, or other types of interactions). However, the approach proposed in this manuscript gets no closer to identifying these specific mechanisms of species interactions. It has no ability to distinguish between resource and apparent competition, for example. Thus, the motivation and framing of the manuscript do not match what it provides. I believe the entire Introduction would need to be rewritten to clarify what gap in knowledge this proposed approach is addressing and what would be gained by filling this knowledge gap.

      Our approach helps determine underlying mechanisms of species interactions, i.e., positive (resources partitioning or facilitation), negative, or competitive interactions. I am not sure how much we need to go further in identifying more specific mechanisms. If resource and apparent competition refers to resource and interference competition, our approach can tease apart them.

      I recommend that the Introduction instead clarify how this study builds on and goes beyond many decades of literature considering how competition and biodiversity effects depend on density. This large literature is insufficiently addressed in this manuscript. This fails to give credit to previous studies considering these ideas and makes it unclear how this manuscript goes beyond the many previous related studies. For example, see papers and books written by de Wit, Harper, Vandermeer, Connolly, Schmid, and many others. Also, note that many biodiversity experiments have crossed diversity treatments with a density treatment and found no significant effects of density or interactions between density and diversity (e.g., Finn et al. 2013 Journal of Applied Ecology). Thus, claiming that these considerations of density are novel, without giving credit to the enormous number of previous studies considering this, is insufficient.

      A misunderstanding here. Our approach is not designed to test density effect. The same density is held across full density monocultures and mixtures. We use partial density monocultures to determine what species may competitively achieve in full density mixture, without positive or negative interspecific interactions.  

      Replacement series designs emerged as a consensus for biodiversity experiments because they directly test a relevant null hypothesis. This is not to say that there are no other interesting null hypotheses or study designs, but one must acknowledge that many designs and analyses of biodiversity experiments have already been considered. For example, Schmid et al. reviewed these designs and analyses two decades ago (2002, chapter 6 in Loreau et al. 2002 OUP book) and the overwhelming consensus in recent decades has been to use a replacement series and test the corresponding null hypothesis.

      Some wrong impressions. We are not trying to supplant “replacement series” with “additive series”; we use “additive series” designs to supplement “replacement series” design for partitioning changes in ecosystem productivity by mechanisms of species interactions, which would not be possible with “replacement series” design alone, as suggested by many including reviewers.   

      It is unclear to me whether rejecting the 'new' null hypothesis presented in the manuscript would be of interest to ecologists, agronomists, conservationists, or others. Most biodiversity experiments and additive partitions have tested and quantified diversity effects against the null hypothesis that there is no difference between intraspecific and interspecific interactions. If there was no less competition and no more facilitation in mixtures than in monocultures, then there would be no positive diversity effects. Rejecting this null hypothesis is relevant when considering coexistence in ecology, overyielding in agronomy, and the consequences of biodiversity loss in conservation (e.g., Vandermeer 1981 Bioscience, Loreau 2010 Princeton Monograph). This manuscript proposes a different null hypothesis and it is not yet clear to me how it would be relevant to any of these ongoing discussions of changes in biodiversity.

      Our method begins with the null expectation: that intraspecific and interspecific interactions are equivalent. We then propose the competitive hypothesis as a second non-exclusive hypothesis which tests the dominance of positive or negative specific interactions. As shown by its name, the additive partitioning model has been advocated for partitioning biodiversity effects by some ecological mechanisms (CE and SE). The ecological meaning of deviation from the two hypotheses are outlined at lines 201-221 for both individual species and community level assessments.   

      The claim that all previous methods 'are not capable of quantifying changes in ecosystem productivity by species interactions and species or community level' is incorrect. As noted above, all approaches that compare mixtures, where there are interspecific interactions, to monocultures, where there are no species interactions, do this to some extent. By overstating the limitations of previous approaches, the manuscript fails to clearly identify what unique contribution it is offering, and how this builds on and goes beyond previous work.

      The reviewer implies that a partial truth equals the whole truth. The same argument can also be applied to the additive partitioning if relative yield total or response ratio provides a kind of comparison between mixture and monocultures. Our statement is correct in the way that previous approaches are not designed to separate changes in ecosystem productivity by species interactions, as indicated by other reviewers. The additive partitioning is built on Price equation (covariance equation) that has never been biologically demonstrated for relevance in biodiversity partitioning (Bourrat et al., 2023).  

      We made clear that our work is built on and beyond the null expectation with addition of competitive expectation.

      The manuscript relies on simulations because it claims that current experiments are unable to test this, given that they have replacement series designs (lines 128-131). There are, however, dozens of experiments where the replacement series was repeated at multiple densities, which would allow a direct test of these ideas. In fact, these ideas have already been tested in these experiments and density effects were found to be nonsignificant (e.g., Finn et al. 2013).

      Out of point. Again, we are not testing density effect. Partial density is used to determine competitive growth responses that species may achieve in mixture based on their relative competitive ability. We used simulations, as partial density monocultures are used only in one experimental study that has been included in our study.  

      It seems that the authors are primarily interested in trees planted at a fixed density, with no opportunity for changes in density, and thus only changes in the size of individuals (e.g., Fig. 1). In natural and experimental systems, realized density differs from the initial planted density, and survivorship of seedlings can depend on both intraspecific and interspecific interactions. Thus, the constrained conditions under which these ideas are explored in this manuscript seem narrow and far from the more complex reality where density is not fixed.

      We use fixed density only for convenience. In biodiversity experiments, density can increase or decrease over time from initial levels. However, initial density is generally used in evaluation of species interactions. If interest is community productivity, density change does not need to be considered. Again, we are not testing density effects.    

      Additional detailed comments:

      It is unclear to me which 'effects' are referred to on line 36. For example, are these diversity effects or just effects of competition? What is the response variable?

      It means the effect of competitive interactions on productivity and should be clear based on previous sentences.

      The usefulness of the approach is overstated on line 52. All partitioning approaches, including the new one proposed here, give the net result of many types of species interactions and thus cannot 'disentangle underlying mechanisms of species interactions.'

      Not sure how many types of species interactions the reviewer referred to. If mechanisms of species interactions are grouped in three categories (positive, negative, and competitive) as has been in biodiversity research, our approach can tease them apart.   

      The weaknesses of previous approaches are overstated throughout the manuscript, including in lines 60-61. All approaches provide some, but not all insights. Sweeping statements that previous approaches are not effective, without clarifying what they can and can't do, is unhelpful and incorrect. Also, these statements imply that the approach proposed here addresses the limitations of these previous approaches. I don't yet see how it does so.

      The weaknesses of previous approaches are not overstated in terms of separating changes in ecosystem productivity by species interactions. As pointed by other reviewers, none of the previous approaches are designed for quantifying changes in ecosystem productivity by species interactions.   

      The definitions given for the CE and SE on line 71 are incorrect. Competition affects both terms and CE can be negative or have nothing to do with positive interactions, as noted in many of the papers cited.

      We are not trying to define CE and SE but only point out how CE and SE have been generally used in biodiversity research (see recent publication by Feng et al., 2022).

      The proposed approach does not address the limitations noted on lines 73 and 74.

      It does in terms of sources of net biodiversity effect, whether from positive, negative or competitive interactions.

      The definition of positive interactions in lines 77 and 78 seems inconsistent with much of the literature, which instead focuses on facilitation or mutualism, rather than competition when describing positive interactions.

      Much of the literature supports our definition (see Loreau and Hector, 2001). In biodiversity research, positive interactions include resource partitioning and facilitation. What we are trying to point out is that competition affects species and community level assessments based on the null expectation and needs to be separated.

      Throughout the manuscript, competition is often used interchangeably with resource competition (e.g., line 82) and complementarity is often attributed to resource partitioning (e.g., line 77). This ignores apparent competition and partitioning enemy-free niche space, which has been found to contribute to biodiversity effects in many studies.

      If apparent competition refers to interference competition, it is included in negative interaction. Changes in species-specific pests and pathogens in mixture will be captured in positive or negative effects through facilitation or interference.  

      In what sense are competitive interactions positive for competitive species (lines 82-83)? By definition, competition is an interaction that has a negative effect. Do you mean that interspecific competition is less than intraspecific competition? I am having a very difficult time following the logic.

      I am glad the reviewer raised this question that may confuse many others and has never been clearly discussed. It all depends on how comparison is made. If species performance in mixture are compared with that in partial density monocultures, as is in competition research, competition effect is negative for all species. If comparison is made between mixture and full density monocultures, as is done in biodiversity research, competition effect should be positive for more competitive species and negative for less competitive species, with resources flowing from less to more competitive species in mixture relative to full density monocultures.   

      Therefore, the definitions of competitive interactions based on additive series design in competition research cannot be used to describe competitive interactions based on replacement series design in biodiversity research. In biodiversity research, the effects of competitive interactions are never clearly defined at species or community level and mixed up with those of other species interactions.      

      Results are asserted on lines 93-95, but I cannot find the methods that produced these results. I am unable to evaluate the work without a repeatable description of the methods.

      We have added references on sources of these data.

      The description of the null hypothesis in the common additive partitioning approach on lines 145-146 is incorrect. In the null case, it does not assume that there are no interspecific interactions, but rather that interspecific and intraspecific interactions are equivalent.

      Correct, changes have been made as suggested.

      Recommendations for the authors:

      Reviewer #2 (Recommendations For The Authors):

      I recommend to:

      - re-organize the presentation of the material (see my concerns in the public review section). The manuscript is very difficult to read.

      Changes have been made to help with understanding of our approach. Figure 1 was modified to show the variations of competitive growth response with relative competitive ability from minimum (null expectation) to maximum (competitive exclusion).

      - explore the mathematical form the the remainder term. It seems important to understand that the remainder capture terms unrelated to competition as defined in the present scope.

      The remainder measures deviations from the null expectation, due to species differences in growth and competitive ability or competition effect. The term has clear meaning, positive for more competitive species and negative for less competitive species (lines 202-204), and does not need to be further explored or partitioned. The deviations of observed yields from competitive expectations are outlined in lines 205-221.  

      Reviewer #4 (Recommendations For The Authors):

      The authors should be sure to include reproducible methods and share any data and code.

      Both simulation and experimental data are shared through supplementary tables. Calculations are included in excel spreadsheets and do not require program coding.

    2. eLife Assessment

      The authors propose that positive biodiversity-ecosystem functioning relationships found in experiments have been exaggerated because commonly used statistical analyses are flawed. To remedy this, a new type of analysis based on a concept of "partial density monoculture yield" is proposed. However, the presented concept and analysis methods are not reproducibly described, do not appear to be complete, and are inadequate for hypothesis testing. The reviewers found that the authors misinterpret current research in the field and made limited efforts to understand or address the reviewer comments on a previous version of the study.

    3. Reviewer #1 (Public review):

      As a starting point, the authors discuss the so-called "additive partitioning" (AP) method proposed by Loreau & Hector in 2001. The AP is the result of a mathematical rearrangement of the definition of overyielding, written in terms of relative yields (RY) of species in mixtures relative to monocultures. One term, the so-called complementarity effect (CE), is proportional to the average RY deviations from the null expectations that plants of both species "do the same" in monocultures and mixtures. The other term, the selection effect (SE), captures how these RY deviations are related to monoculture productivity. Overall, CE measures whether relative biomass gains differ from zero when averaged across all community members, and SE, whether the "relative advantage" species have in the mixture, is related to their productivity. In extreme cases, when all species benefit, CE becomes positive. When large species have large relative productivity increases, SE becomes positive. This is intuitively compatible with the idea that niche complementarity mitigates competition (CE>0), or that competitively superior species dominate mixtures and thereby driver overyielding (SE>0).

      However, it is very important to understand that CE and SE capture the "statistical structure" of RY that underlies overyielding. Specifically, CE and SE are not the ultimate biological mechanisms that drive overyielding, and never were meant to be. CE also does not describe niche complementarity. Interpreting CE and SE as directly quantifying niche complementarity or resource competition, is simply wrong, although it sometimes is done. The criticism of the AP method thus in large part seems unwarranted. The alternative methods the authors discuss (lines 108-123) are based on very similar principles.

      The authors now set out to develop a method that aims at linking response patterns to "more true" biological mechanisms.

      Assuming that "competitive dominance" is key to understanding mixture productivity, because "competitive interactions are the predominant type of interspecific relationships in plants", the authors introduce "partial density" monocultures, i.e. monocultures that have the same planting density for a species as in a mixture. The idea is that using these partial density monocultures as a reference would allow for isolating the effect of competition by the surrounding "species matrix".

      The authors argue that "To separate effects of competitive interactions from those of other species interactions, we would need the hypothesis that constituent species share an identical niche but differ in growth and competitive ability (i.e., absence of positive/negative interactions)." - I think the term interaction is not correctly used here, because clearly competition is an interaction, but the point made here is that this would be a zero-sum game.

      The authors use the ratio of productivity of partial density and full-density monocultures, divided by planting density, as a measure of "competitive growth response" (abbreviated as MG). This is the extra growth a plant individual produces when intraspecific competition is reduced.

      Here, I see two issues: first, this rests on the assumption that there is only "one mode" of competition if two species use the same resources, which may not be true, because intraspecific and interspecific competition may differ. Of course, one can argue that then somehow "niches" are different, but such a niche definition would be very broad and go beyond the "resource set" perspective the authors adopt. Second, this value will heavily depend on timing and the relationship between maximum initial growth rates and competitive abilities at high stand densities.

      The authors then progress to define relative competitive ability (RC), and this time simply uses monoculture biomass as a measure of competitive ability. To express this biomass in a standardized way, they express it as different from the mean of the other species and then divide by the maximum monoculture biomass of all species.

      I have two concerns here: first, if competitive ability is the capability of a species to preempt resources from a pool also accessed by another species, as the authors argued before, then this seems wrong because one would expect that a species can simply be more productive because it has a broader niche space that it exploits. This contradicts the very narrow perspective on competitive ability the authors have adopted. This also is difficult to reconcile with the idea that specialist species with a narrow niche would outcompete generalist species with a broad niche. Second, I am concerned by the mathematical form. Standardizing by the maximum makes the scaling dependent on a single value.

      As a final step, the authors calculate a "competitive expectation" for a species' biomass in the mixture, by scaling deviations from the expected yield by the product MG ⨯ RC. This would mean a species does better in a mixture when (1) it benefits most from a conspecific density reduction, and (2) has a relatively high biomass.

      Put simply, the assumption would be that if a species is productive in monoculture (high RC), it effectively does not "see" the competitors and then grows like it would be the sole species in the community, i.e. like in the partial density monoculture.

      Overall, I am not very convinced by the proposed method.

      Comments on revised version:

      Only minimal changes were made to the manuscript, and they do not address the main points that were raised.

    4. Reviewer #2 (Public review):

      This manuscript by Tao et al. reports on an effort to better specify the underlying interactions driving the effects of biodiversity on productivity in biodiversity experiments. The authors are especially concerned with the potential for competitive interactions to drive positive biodiversity-ecosystem functioning relationships by driving down the biomass of subdominant species. The authors suggest a new partitioning schema that utilizes a suite of partial density treatments to capture so-called competitive ability. While I agree with the authors that understanding the underlying drivers of biodiversity-ecosystem functioning relationships is valuable - I am unsure of the added value of this specific approach for several reasons.

      Comments on revised version:

      The authors changed only one minor detail in response to the last round of reviews.

    5. Reviewer #3 (Public review):

      Summary:

      This manuscript claims to provide a new null hypothesis for testing the effects of biodiversity on ecosystem functioning. It reports that the strength of biodiversity effects changes when this different null hypothesis is used. This main result is rather inevitable. That is, one expects a different answer when using a different approach. The question then becomes whether the manuscript's null hypothesis is both new and an improvement on the null hypothesis that has been in use in recent decades.

      Strengths:

      In general, I appreciate studies like this that question whether we have been doing it all wrong and I encourage consideration of new approaches.

      Weaknesses:

      Despite many sweeping critiques of previous studies and bold claims of novelty made throughout the manuscript, I was unable to find new insights. The manuscript fails to place the study in the context of the long history of literature on competition and biodiversity and ecosystem functioning. The Introduction claims the new approach will address deficiencies of previous approaches, but after reading further I see no evidence that it addresses the limitations of previous approaches noted in the Introduction. Furthermore, the manuscript does not reproducibly describe the methods used to produce the results (e.g., in Table 1) and relies on simulations, claiming experimental data are not available when many experiments have already tested these ideas and not found support for them. Finally, it is unclear to me whether rejecting the 'new' null hypothesis presented in the manuscript would be of interest to ecologists, agronomists, conservationists, or others.

      Comments on revised version:

      Please see review comments on the previous version of this manuscript. The authors have not revised their manuscript to address most of the issues previously raised by reviewers.

    1. Author response:

      The following is the authors’ response to the original reviews.

      Public Reviews:

      Reviewer 1 (Public Review):

      Summary:

      The authors present a mean-field model that describes the interplay between (protein) aggregation and phase separation. Different classes of interaction complexity and aggregate dimensionality are considered, both in calculations concerning (equilibrium) phase behavior and kinetics of assembly formation.

      Strengths:

      The present work is, although purely theoretical, of high interest to understanding biological processes that occur as a result of a coupling between protein aggregation and phase separation. Of course, such processes are abundant, in the living cell as well as in in-vitro experiments. I appreciate the consideration of aggregates with various dimensionality, as well as the categorization into different ”interaction classes”, together with the mentioning of experimental observations from biology. The model is convincing and underlines the complexity associated with the distribution of proteins across phases and aggregates in the living cell.

      Weaknesses:

      There are a few minor weaknesses.

      Reviewer 2 (Public Review):

      This work deals with a very difficult physical problem: relating the assembly of building blocks on a molecular scale to the appearance of large, macroscopic assemblies. This problem is particularly difficult to treat, because of the large number of units involved, and of the complex way in which these units-monomers-interact with each other and with the solvent. In order to make the problem treatable, the authors recur to a number of approximations: Among these, there is the assumption that the system is spatially homogeneous, i.e., its features are the same in all regions of space. In particular, the homogeneity assumption may not hold in biologically relevant systems such as cells, where the behavior close to the cell membrane may strongly differ from the one in the bulk. As a result, this hypothesis calls for a cautious consideration and interpretation of the results of this work. Another notable simplification introduced by the authors is the assumption that the system can only follow two possible behaviors: In the first, each monomer interacts equally with the solvent; no matter the size of the cluster of which it is part. In the second case, monomers in the bulk of a cluster and monomers at the assembly boundary interact with the solvent in a different way. These two cases are considered not only because they simplify the problem, but also because they are inspired by biologically relevant proteins.

      With these simplifications, the authors trace the phase diagram of the system, characterizing its phases for different fractions of the volume occupied by the monomers and solvent, and for different values of the temperature. The results qualitatively reproduce some features observed in recent experiments, such as an anomalous distribution of cluster sizes below the system saturation threshold, and the gelation of condensed phases above such threshold.

      Reviewer 3 (Public Review):

      Summary:

      The authors combine classical theories of phase separation and self-assembly to establish a framework for explaining the coupling between the two phenomena in the context of protein assemblies and condensates. By starting from a mean-field free energy for monomers and assemblies immersed in solvent and imposing conditions of equilibrium, the authors derive phase diagrams indicating how assemblies partition into different condensed phases as temperature and the total volume fraction of proteins are varied. They find that phase separation can promote assembly within the protein-rich phase, providing a potential mechanism for spatial control of assembly. They extend their theory to account for the possibility of gelation. They also create a theory for the kinetics of self-assembly within phase separated systems, predicting how assembly size distributions change with time within the different phases as well as how the volumes of the different phases change with time.

      Strengths:

      The theoretical framework that the authors present is an interesting marriage of classic theories of phase separation and self-assembly. Its simplicity should make it a powerful general tool for understanding the thermodynamics of assembly coupled to phase separation, and it should provide a useful framework for analyzing experiments on assembly within biomolecular condensates.

      The key advance over previous work is that the authors now account for how self-assembly can change the boundaries of the phase diagram.

      A second interesting point is the explicit theoretical consideration for the possibility that gelation (i.e. self-assembly into a macroscopic aggregate) could account for widely observed solidification of condensates. While this concept has been broadly discussed, to date I have yet to see a rigorous theoretical analysis of the possibility.

      The kinetic theory in sections 5 and 6 is also interesting as it extends on previous work by considering the kinetics of phase separation as well as those of self-assembly.

      Weaknesses:

      A key point the authors make about their theory is that it allows, as opposed to previous research, to study non-dilute limits. It is true that they consider gelation when the 3D assemblies become macroscopic. However, dilute solution theory assumptions seem to be embedded in many aspects of their theory, and it is not always clear where else the non-dilute limits are considered. Is it in the inter-species interaction χij? Why then do they never explore cases for which χij is nonzero in their analysis?

      We explicitly consider that monomers and aggregates are non-dilute with respect to solvent. This is evident in accounting for the mixing entropy of all components, including the solvent. Moreover, we account for interactions among the monomers and the different aggregates with the solvent. We consider the case where each monomeric unit, independent in aggregate it is part of, interacts the same way with the solvent. Please note that this case corresponds to a non-dilute scenario where interactions indeed drive phase separation.

      The connection between this theory and biological systems is described in the introduction but lost along the main text. It would be very helpful to point out, for instance, that the presence of phase separation might induce aggregation of proteins. This point is described formally at the end of Section 3, but a more qualitative connection to biological systems would be very useful here.

      We thank the referee for the useful comment, we now mention this in the introduction (line 80) and point out the biological relevance of assembly formation and localization via the presence of phase separation (lines 268 and 283).

      Building on the previous point, it would be helpful to give an intuitive sense of where the equations derived in the Appendices and presented in the main text come from and to spell out clear physical interpretations of the results. For example, it would be helpful to point out that Eq. 4 is a form of the law of mass action, familiar from introductory chemistry. It would be useful to better explain how the current work extends on existing previous work from these authors as well as others. Along these lines, closely related work by W. Jacobs and B. Rogers [O. Hedge et al. 2023, https://arxiv.org/abs/2301.06134; T. Li et al. 2023, https://arxiv.org/abs/2306.13198] should be cited in the introduction. The results discussed in the first paragraph of Section 3 on assembly size distributions in a homogeneous system are well-known from classic theories of self-assembly. This should be acknowledged and appropriate references should be added; see for instance, Rev. Mod. Phys. 93, 025008 and Statistical Thermodynamics Of Surfaces, Interfaces, And Membranes by Sam Safran. Equation 14 for the kinetic of volume fractions is given with reference to Bauermann et al. 2022, but it should be accompanied by a better intuitive interpretation of its terms in the main text. In particular, how should one understand the third term in this equation? Why does the change in volume impact the change of volume fraction in this way?

      We thank the referee for the suggestions. We have included the missing references, with a particular emphasis on DNA nanostars that inhibit phase separation in DNA liquids in the definition of class II. We added intuitive explanations of the main equations, such as Eqs. (4),(8),(14), (17), and (18). Notice that, according to Mysels, Karol J., J. Chem. Educ., 33, 178 (1956) (https://pubs-acs-org.sire.ub.edu/doi/epdf/10.1021/ed033p178) we refer to (18) as the law of mass action.

      The discussion in the last paragraph of Section 6 should be clarified. How can the total amount of protein in both phases decrease? This would necessarily violate either mass or volume conservation. Also, the discussion of why the volume is non-monotonic in time is not clear.

      A decrease in the total amount of protein in both phases does not violate mass conservation, if the volume of the phases varies accordingly. In particular, the volume of the denser phase should grow. This given, in the case presented the total protein amount in the dense phase decreases, while in the dilute phase increases. For this reason, we revised the paragraph and now explain the results in more detail (see lines starting from 407). The nonmonotonic volume change is indeed a puzzling finding that, as we now state in the manuscript, requires further investigation. Given the lack of analytical approaches available to tackle the complex kinetics in the presence of coexisting phases, we believe that this analysis goes beyond the scope of the present paper.

      Recommendations for the authors

      Reviewer 1 (Recommendations For The Authors):

      Line 96: I feel a mentioning/definition/explanation and perhaps some discussion on the parameter M (limiting aggregate size) would have been in place in the introduction of Equation (1). Furthermore, in the usual interpretation, Flory interaction parameters (symbolized χ) are dimensionless, as, classically, they represent an exchange energy (normalized by kT), defined on a monomeric basis. Here they seem to carry the dimension of energy.

      We thank the reviewer for the observation. We have included a brief comment on M and mentioned that we use χ parameters that carry the dimension of energy such that, varying kBT, we scale at the same time the term containing interaction propensities (χ) and the one containing internal energies (_e_int). See the comment on line 127

      Line 150: The choice of ρi \= i physically implies that a single protein is assumed to have the same as a solvent molecule. This may be a bit of a stretch. This assumption leads to an overestimation of the translational entropy of the aggregates (first term in Equation (1)). Acknowledging that ρ_1 >> ρs_ would give a pronounced desymmetrization of the phase diagram (I suspect).

      Indeed, in the case of monomers only, the assumption leads to a symmetric phase diagram which may be unrealistic. Once assemblies form, however, the phase diagram becomes asymmetric and for this reason we decided to assume ρi \= i, simplifying the theoretical analysis. We have added a clarifying sentence in the manuscript, see line 163

      Furthermore, the pictures in Figure 1a-c suggest the presence of a disordered residue, the degree of swelling of which might affect binding strength (see for instance: https://doi.org/10.3389/fnmol.2022.962526).

      We added a comment on the possible coupling between internal free energies and interaction propensities, such as the swelling mechanism that affects binding sites, and included the reference above (line 215).

      Line 154-156: It’s unclear what is meant with ”an internal bond that keeps each assembly together”. How should this be interpreted on an intuitive physical level?

      We apologise for being unclear. We meant the internal bonds that lead to the formation of assemblies. We have now rephrased this sentence in the main text (lines starting from 169).

      Line 254: The fact that ϕsg is defined below does not mean it does not fall out of the air here. The same holds for the consideration of the limit M →∞. Ideally, the main text should stand on its own, in particular with respect to physical intuitiveness, as well as the necessity and interest of discussion topics. Technical details, derivations and additional information can be in an appendix.

      We agree with the referee and added some physical insights about the limit. We now also state clearly in the main text (line 298) that _ϕ_sg is affected by temperature and the free energy of internal bonds.

      Line 257: ”Since we do not explicitly include the solvent in assembly formation we will consider the gel as a phase without solvent and thus ϕtot \= 1”. I’m not sure if I can agree with this. I would say, a gel, certainly in biological context, almost per definition contains a large fraction of solvent, i.e. here water. The situation ”ϕtot \= 1” would rather be a solid precipitate. Is gelation properly captured by this model?

      We thank the referee for this very relevant observation. We now state in the main text that the model predicts a macroscopic assembly which we call ’the gel phase’, in agreement with previous literature. Then, to clarify, we added the sentence ”Please note that, since we do not explicitly include the solvent in assembly formation (see reaction scheme in Fig.1a), in our model the gel corresponds to a phase without solvent, _ϕ_tot \= 1. To account for biological gels that can be rich in water, our theory can be straightforwardly extended by incorporating the solvent into the reaction scheme.”, see main text line 300.

      Line 268: Shouldn’t ”solvent” be ”solution”? If fsol is given by Equation (1), surely not only the solvent is considered.

      Indeed, this is a typo, and we now use the term ’solution’ instead of ’solvent.’

      Line 273: At this stage, the only information provided in the main text is that ω∞ is ”a constant that does not affect chemical nor phase equilibrium, except in the limit M →∞” (see lines 153-154). This is a little bit too abstract for me. Again, the main text should stand on its own, meaning the reader should not have to rely on an appendix to at least have an intuitive physical understanding of any modeling or input parameter discussed in the main text.

      We thank the reviewer for pointing this out. We now comment on the physical interpretation of ω∞ in the main text, see lines from 320 on.

      Figure 4. appears in Equation (39) but it is not defined.

      We thank the reviewer for pointing this out. We have reshaped appendix 6A, making use of chemical activities and clarified the origin of the rate .

      Line 317. I don’t fully understand the intention of the remark on the model being adaptable for ”primary and secondary nucleation”. How/in what way is this different from association and dissociation? For instance, classical nucleation theory is based on association and dissociation of monomeric units to and from clusters.

      We agree that the kinetic rate coefficients kij (appearing in the association and dissociation rates ∆rij, Eq. 17) in our manuscript already depend on assembly length, see Appendix 6 B, where we now clarified their definition. Please note that, however, that secondary nucleation is a special kind of association, for which the kinetic rate coefficients corresponding to associations of small assemblies, i.e. kij with_i,j_ ≪ M, explicitly depend on the presence of large assemblies with sizes l ≫ 1. In our manuscript, we have not accounted for such a dependence. We now make this aspect clear in the manuscript, see Appendix 6 B.

      Line 321. Why is ∆rij called the ”monomer exchange rate”? In line 318 the same parameter is defined as the ”reaction rate for the formation of a (i+j)-mer”. Why should these be the same?

      We thank the reviewer for spotting this typo.

      Line 323. Why do these calculations use M = 15?

      The exploration of a 15-dimensional phase space is already numerically challenging. We are currently working on a generalization of the numerical scheme to work with larger values of M but, to discuss the fundamental physical principles, we kept M \= 15.

      Reviewer 2 (Recommendations For The Authors):

      The manuscript presents several issues, on both the scientific and presentational level, which need to be carefully addressed. Please find below a list of the points that need to be addressed by the authors, divided into major and minor points. Major issues:

      • A general, major concern about the results in the paper is the homogeneity assumption. I do understand that repeating the whole analysis presented in the manuscript by allowing for spatial inhomogeneities partially goes beyond the scope of this paper. However, the authors should at least discuss how such inhomogeneities may alter the results in a qualitative way, and treat explicitly the presence of inhomogeneity in one prototypical case treated in the manuscript. Namely, what happens if the volume fractions and relative molecular volumes in the free energy (1) depend on space, e.g., ϕiϕi(x)?

      We would like to stress that, in the present paper, we do account for spatial inhomogeneities. Indeed, in the case of phase separation, we consider systems which are divided into two phases, characterized by different values of the assemblies’ volume fractions ϕi. We do, however, consider the system to be homogeneous inside the phases, implying a jump in the value of the volume fraction at the interface between the two phases. In this sense, the analysis we carry out is valid in the thermodynamic limit, where gradients of the volume fractions ϕi(x) within the phases, can be neglected. On the other hand, considering the full spatial problem, i.e. solving the equations for M \= 15 spatially varying fields, would be numerically extremely challenging.

      • The authors’ results relate molecular assembly- a phenomenon at the molecular scale-to phase separation-a mesoscopic or macroscopic phenomenon. The authors should stress the conceptual importance of this connection between scales, and present their results from the perspective of a multi-scale model.

      We thank the reviewer for pointing this out. We now emphasize the multi-scale feature of our model in the introduction (line 80).

      • Starting from Section 1, the reader is not well guided through the sections that follow. The authors should provide an outline of the line of though that they are going to follow in the following sections, and logically connect each section to the next one with a short paragraph at the end of each section. This paragraph should resume what has been addressed in the current section, and the connection with the topic that will be addressed in the next one.

      We agree with the reviewer and have added a transitioning sentence at the end of each paragraph.

      • ’We focus on linear assemblies (d = 1)’: Given the striking differences of the results between d = 1 and d > 1 shown above, the authors should discuss what happens for d > 1 as well.

      • ’In figure Fig. 5a, we show the initial and final equilibrium binodals (black and coloured curve, respectively), for the case of linear assemblies (d = 1) belonging to class 1’: Again, show what happens for d > 1.

      We agree with the reviewer, the kinetics in d > 1 would be definitely interesting. However, in this case, one assembly can become macroscopic (i.e. M must be set to ∞). This requires some substantial modification in the kinetic scheme, like introducing an absorbing boundary condition for monomers ’sucked in’ the gel. We prefer to leave this for future work, and now state it explicitly in the manuscript (line 383).

      • ’This difference arises because, within class 2, monomers in the bulk of an assembly have reduced interaction propensity with respect to the boundary ones. As a consequence, the formation of large clusters shifts the onset of phase separation to higher ϕtot values.’: To prove this argument, the authors should show Fig. 2g and h for d > 1. In fact, by varying d, the effect of the boundary vs. bulk also varies.

      We prefer to discuss the thermodynamics of d > 1 in section 4 on gelation. There we present only a single phase diagram so as not to blow up the discussion on equilibrium too much.

      • ’referring for simplicity to systems belonging to Class 1’: The authors should do the same analysis for Class 2.

      We agree with the reviewer. However, again not to blow up the discussion on equilibrium, we leave it for future work.

      • ’other, implying that the corresponding Flory-Huggins parameter χij vanishes’: Why?

      The explanation based on a lattice model is reported in Appendix 2, and is now more clearly referenced (line 185).

      Minor issues:

      • Eq. (10): Here the authors should explain in the main text, possibly in a simple and intuitive way, why the number of monomers i and the space dimension d enter the righthand side of this equation in this particular way.

      We thank the reviewer for pointing this out. We added the physical origin of the scaling with dimension in Eq. (10) and in Eq. (8), as pointed out by reviewer 3.

      • ’The second and fifth terms of fsol characterize the internal free energies’: What do you mean by ’characterize the internal free energies’? Please clarify.

      As we now state more clearly (lines 114-120), these two contributions include the internal free energies ω_s and _ωi, stemming from the free energy of internal bonds that lead to assembly formation.

      • ’depend on the scaling form of the’: Scaling with respect to what ? Please clarify.

      We have now clarified that the scaling is with respect to the assembly size i.

      • Figure 2 is way too dense: it should be split into two figures, and the legend of each of the two figures should be expanded to properly guide the reader to understand the figures.

      We understand the reviewer’s point of view. To avoid altering the present flow, we decided not to split the figure, but we have included shaded boxes to better guide the reader.

      • ’this is a consequence of the gelation transition’: Please clarify

      • ’and this limitation can be dealt with by introducing explicitly the infinite-sized gel in the free energy’: Why? Please clarify.

      We have now rephrased these sentences, hopefully in a clearer way. We now state: ’We know that this divergence is physical, and is caused by the gelation transition. This limitation can be dealt with by introducing explicitly a term in the free energy that accounts for an infinite-sized assembly (the gel)’, see lines 320-322.

      • Figure 4: Add plots of panels d, e, h and i with log scale on the y axis to make explicit an eventual exponential behavior, and revise the text accordingly

      Not to further complicate Figure 4, we preferred to display the logarithmic plots of the equilibrium distribution in the appendix, see Figure A3-1.

      • ’... an equilibrium distribution which monotonously decreases with assembly size’: It is not the distributions that decreases but the cluster volume fraction, please rephrase.

      We thank the reviewer for pointing this out and have now rephrased this sentence (line 394).

      Reviewer 3 (Recommendations For The Authors):

      I could not obtain the exact form of Eq 29 in App 3, can the authors elaborate on this calculation. App 3: What does it mean binodal agrees well with ϕsg? And doesn’t ϕsg depend on temperature through phi tilde? What temperature is this result for?

      We apologise for the unclear explanation. We now state in detail that Eq. (29) is obtained by plugging the expression of ϕi given in Eq. (24) into Eq. (1), in the main text. The dependence of ϕ<sub>1</sub> on ϕ<sub>tot</sub> is expressed in Eq. (26), and we have omitted linear terms in ϕ<sub>tot</sub>, since they do not affect phase equilibrium (see lines 802-809). Moreover, ϕsg depends indeed on k<sub>B</sub>T. We refer to the comparison between the full curve ϕsg in the k<sub>B</sub>T−ϕ<sub>tot</sub> plane, and the branch of the binodal between the triple point (indicated now with a cross) and ϕ<sub>tot</sub> \= 1. The two curves are close, as expected since both correspond to the boundary between homogeneous mixtures and the gel state, obtained with different methods.

      The references to Figures in the appendices are confusing. Please make it clear whether Figures in the main text or the appendices are being referenced. On a related note, the Appendix figures seem to be placed in appendices whose text describes something else - Appendix 2, Figure 1 should be moved to Appendix 3; Appendix 3, Figure 1 should be moved to Appendix 4; etc.

      We revised the appendix, corrected the figure positions and clarified their references.

    2. eLife Assessment

      The authors present an important theoretical framework that describes the interplay between liquid-liquid phase separation and protein aggregation within a mean-field model. This work will be of high interest to the biophysics and molecular biology communities, as it will help understand and analyse assembly within biomolecular condensates in cells or in-vitro. Major strengths of this convincing work are the consideration of aggregates with various dimensionality and the possibility for protein gelation.

    3. Reviewer #3 (Public review):

      Summary:

      The authors combine classical theories of phase separation and self-assembly to establish a framework for explaining the coupling between the two phenomena in the context of protein assemblies and condensates. By starting from a mean-field free energy for monomers and assemblies immersed in solvent and imposing conditions of equilibrium, the authors derive phase diagrams indicating how assemblies partition into different condensed phases as temperature and the total volume fraction of proteins are varied. They find that phase separation can promote assembly within the protein-rich phase, providing a potential mechanism for spatial control of assembly. They extend their theory to account for the possibility of gelation. They also create a theory for the kinetics of self-assembly within phase separated systems, predicting how assembly size distributions change with time within the different phases as well as how the volumes of the different phases change with time.

      Review For Revision:

      The revised manuscript provides better motivation and physical explanations for the equations, and the authors have addressed references, typos, and other minor technical issues identified in the review. These changes have significantly improved the manuscript.

    1. eLife Assessment

      This valuable study provides an experimental paradigm and state-of-the-art analysis method for studying the existence of call types and transition differences among Mongolian gerbil families in a naturalistic environment. The analyses are convincing, with a thorough treatment of the acoustic data and a demonstration of the robustness of the observed effect across days. The work will likely be of interest to the auditory neuroscience and neuroethology communities.

    2. Reviewer #1 (Public review):

      Summary:

      This research offers an in-depth exploration and quantification of social vocalization within three families of Mongolian gerbils. In an enlarged, semi-natural environment, the study continuously monitored two parent gerbils and their four pups from P14 to P34. Through dimensionality reduction and clustering, a diverse range of gerbil call types was identified. Interestingly, distinct sets of vocalizations were used by different families in their daily interactions, with unique transition structures exhibited across these families. The primary results of this study are compelling, although some elements could benefit from clarification

      Strengths:

      Three elements of this study warrant emphasis. Firstly, it bridges the gap between laboratory and natural environments. This approach offers the opportunity to examine natural social behavior within a controlled setting (such as specified family composition, diet, and life stages), maintaining the social relevance of the behavior. Secondly, it seeks to understand short-timescale behaviors, like vocalizations, within the broader context of daily and life-stage timescales. Lastly, the use of unsupervised learning precludes the injection of human bias, such as pre-defined call categories, allowing the discovery of the diversity of vocal outputs.

      Comments on the revised version:

      (1) The authors have clarified the possible types of differences in the vocalizations of different families and discussed the potential contribution of the adult-pup difference.

      (2) The authors have added the analysis in Figure 4 about the developmental changes in call types.

      (3) The authors have analyzed the additional information in the 2-gram structure of the calls as evidence to apply the transition matrices to compare the families.

    3. Reviewer #2 (Public review):

      Peterson et al., perform a series of behavioral experiments to study the repertoire and variance of Mongolian gerbil vocalizations across social groups (families). A key strength of the study is the use of a behavioral paradigm which allows for long term audio recordings under naturalistic conditions. This new experimental set-up results in the identification of additional vocalization types, not previously described the literature. In combination with state-of-the-art methods for vocalization analysis, the authors demonstrate that the distribution of sound types and the transitions between these sound types across three gerbil families is different. This is a highly compelling finding which suggests that individual families may develop distinct vocal repertories. One potential limitation of the study lies in the cluster analysis used for identifying distinct vocalization types. The authors use a Gaussian Mixed Model (GMM) trained on variational auto Encoder derived latent representation of vocalizations to classify recorded sounds into clusters. Through the analysis the authors identify 70 distinct clusters and demonstrate a differential usage of these sound clusters across families. While the authors acknowledge the inherent challenges in cluster analysis and provide additional analyses (i.e. maximum mean discrepancy, MMD), additional analysis would increase the strength of the conclusions. In particular, analysis with different cluster sizes would be valuable. An additional limitation of the study is that due to the methodology that is used, the authors can not provide any information about the bioacoustic features that contribute to differences in sound types across families which limits interpretations about how the animals may perceive and react to these sounds in an ethologically relevant manner.

      The conclusions of this paper are well supported by data.

      • Can the authors comment on the potential biological significance of the 70 sound clusters? Does each cluster represent a single sound type? How many vocal clusters can be attributed to a single individual? Similarly, can the authors comment on the intra-individual and inter-individual variability of the sound types within and across families?<br /> • As a main conclusion of the paper rests on the different distribution of sound clusters across families, it is important to validate the robustness of these differences across different cluster parameters. Specifically, the authors state that "we selected 70 clusters as the most parsimonious fit". Could the authors provide more details about how this was fit? Specifically, could the authors expand upon what is meant by "prior domain knowledge about the number of vocal types...". If the authors chose a range of cluster values (i.e. 10, 30, 50, 90) does the significance of the results still hold?<br /> • While VAEs are powerful tools for analyzing complex datasets in this case they are restricted to analysis of spectrogram images. Have the authors identified any acoustic differences (i.e. in pitch, frequency, other sound components) across families?

      Following a revision of the manuscript the authors have taken many of these points under consideration and as a result have significantly improved the manuscript. Critically, they have now provided additional quantification that differences across family repertories are robust against cluster selection size.

    4. Reviewer #3 (Public review):

      Summary:

      In this study, Peterson et al. longitudinally record and document the vocal repertoires of three Mongolian gerbil families. Using unsupervised learning techniques, they map the variability across these groups, finding that while overall statistics of, e.g., vocal emission rates and bout lengths are similar, families differed markedly in their distributions of syllable types and the transitions between these types within bouts. In addition, the large and rich data are likely to be valuable to others in the field.

      Strengths:

      - Extensive data collection across multiple days in multiple family groups.<br /> - Thoughtful application of modern analysis techniques for analyzing vocal repertoires.<br /> - Careful examination of the statistical structure of vocal behavior, with indications that these gerbils, like naked mole rats, may differ in repertoire across families.<br /> - Estimation of the stability of the effects across days.

      Weaknesses:

      - The work is largely descriptive, documenting behavior rather than testing a specific hypothesis.<br /> - The number of families (N=3) is somewhat limited, though the authors have taken some care to examine the robustness of the findings.

    5. Author response:

      The following is the authors’ response to the original reviews.

      Public Reviews:

      Reviewer #1 (Public Review):

      Summary:

      This research offers an in-depth exploration and quantification of social vocalization within three families of Mongolian gerbils. In an enlarged, semi-natural environment, the study continuously monitored two parent gerbils and their four pups from P14 to P34. Through dimensionality reduction and clustering, a diverse range of gerbil call types was identified. Interestingly, distinct sets of vocalizations were used by different families in their daily interactions, with unique transition structures exhibited across these families. The primary results of this study are compelling, although some elements could benefit from clarification

      Strengths:

      Three elements of this study warrant emphasis. Firstly, it bridges the gap between laboratory and natural environments. This approach offers the opportunity to examine natural social behavior within a controlled setting (such as specified family composition, diet, and life stages), maintaining the social relevance of the behavior. Secondly, it seeks to understand short-timescale behaviors, like vocalizations, within the broader context of daily and life-stage timescales. Lastly, the use of unsupervised learning precludes the injection of human bias, such as pre-defined call categories, allowing the discovery of the diversity of vocal outputs.

      Weaknesses:

      (1) While the notable differences in vocal clusters across families are convincing, the drivers of these differences remain unclear. Are they attributable to "dialect," call usage, or specific vocalizing individuals (e.g., adults vs. pups)? Further investigation, via a literature review or additional observation, into acoustic differences between adult and pup calls is recommended. Moreover, a consistent post-weaning decrease in the bottom-left cluster (Fig. S3) invites interpretation: could this reflect drops in pup vocalization?

      Thank you for bringing up this point of clarification. Without knowledge of individual vocalizers, we are unable to rigorously assess pronunciation differences between individuals, however we can get a clear proxy for dialect through observing usage differences between families. We’ve added the following text (blue) in the Discussion to help clarify:

      “To address whether gerbils also exhibit family specific vocal features, we compared GMM-labeled vocal cluster usages across the three recorded families and showed differences in vocal type usage (Figure 3). The differences in this study align with the definition of human vocal dialect, which is a regional or social variety of language that can differ in pronunciation, grammatical, semantic and/or language use differences (Henry et al., 2015). This definition of dialect is inclusive of both pronunciation differences (e.g. a Bostonian’s characteristic pronunciation of “car” as “cah”) and usage differences (e.g. a Bostonian’s preferential usage of the words “Go Red Sox” vs. a New Yorker’s preferential usage of the words “Go Yankees”). In our case, vocal clusters can be rarely observed in some families yet highly over-expressed in others (e.g. analogous to language usage differences in humans), or highly expressed in both families, but contain subtle spectrotemporal variations (Figure 3D, Family 1 cluster 11 vs. Family 3 clusters 2, 18, 30; e.g. analogous to pronunciation differences in humans).”

      Indeed, our recordings obtained after pup removal could suggest that adults may use fewer low frequency calls (bottom left cluster in UMAP). However, this dataset does not permit a proper assessment of post-weaning pup calls. In fact, our results and the literature shows that adults are likely to use low frequency calls, but only during social interactions with pups or other adults. For example, Furuyama et al. 2022 describe a number of low frequency call types used by adults in agonistic social interactions, which look similar to a low frequency call type used by pups described in Silberstein et al. 2023. Similarly, Ter-Mikaelian et al. 2012 (their Figure 6) recorded several types of sonic vocalizations during adult social interaction. To our knowledge, it has not been shown whether gerbil pups and adults produce distinct call types. It is a challenging problem to solve, as animals placed in isolation (i.e. an experimental condition for which the identity of the vocalizer is known) vocalize infrequently and of the limited number they might emit, they do not use the full range of vocalizations described in the literature (RP personal observations). To properly address this question, one would need to elicit full use of the vocal repertoire through free social interaction, then attribute calls to individual vocalizers via sound source localization and/or head-mounted microphones — we are currently pursuing both of these technical challenges, but this is outside the scope of this manuscript.

      Although the literature reflects the limitations discussed above, we have added a brief paragraph to the Discussion (limitations section) that addresses the reviewer’s question about the development of vocalizations:

      “Although we were not able to attribute vocalizations to individual family members, we did seek to determine the importance of family structure by comparing audio recordings before and after removal of the pups at P30. The results show a clear effect of family integrity, and the sudden reduction of sonic calls following pup removal (Figure S3) could suggest that these vocalizations are produced selectively by pups.

      However, there is ample evidence that adult gerbils also produce sonic vocalizations. For example, a number of low frequency call types are used by adults during a range of social interactions (Ter-Mikaelian et al., 2012; Furuyama et al., 2022), some of which are similar to a low frequency call type used by pups (Silberstein et al., 2023). Vocalization patterns of developing gerbils depend on isolation or staged interactions. Thus, when gerbil pups are recorded during isolation, ultrasonic vocalization rate declines and sonic vocalizations increase for animals that are in a high arousal state (De Ghett 1974, Silberstein et al., 2023). As gerbils progress from juvenile to adolescent development (P17-55) a significant increase in ultrasonic vocalization rate is observed during dyadic social encounters, with a distinct change in usage pattern that depends upon the sex of each animal (Holman & Seale 1991, Holman et al. 1995). The development of vocalization types has been assessed in another member of the Gerbillinae subfamily, called fat-tailed gerbils (Pachyuromys duprasi), during isolation and handling. Here, the number of ultrasonic vocalization syllable types increase from neonatal to adult animals (Zaytseva et al. 2019), while some very low frequency sonic call types were rarely observed after P20 (Zaytseva et al. 2020). By comparison, mouse syllable usage changes during development, but pups produced 10 of the 11 syllable types produced by adults (Grimsley et al. 2011). In summary, our understanding of the maturation of vocalization usage remains limited by our inability to obtain longitudinal data from individual animals within their natural social setting. For example, when recorded in their natural environment, chimpanzees display a prolonged maturation of vocalization complexity, such as the probability of a unique utterance in a sequence, with the greatest changes occuring when animals begin to experience non-kin social interactions (Bortolato et al. 2023).”

      (2) Developmental progression, particularly during pre-weaning periods when pup vocal output remains unstable, might be another factor influencing cross-family vocal differences. Representing data from this non-stationary process as an overall density map could result in the loss of time-dependent information. For instance, were dominating call types consistently present throughout the recording period, or were they prominent only at specific times? Displaying the evolution of the density map would enhance understanding of this aspect.

      This is a great suggestion. Thank you for bringing it up. To address this, we have added an additional figure (Figure 4) to the main text (Note that the former Figure 4 is now Figure 5). New text associated with this new figure was added to the Results and Discussion sections:

      Results

      “Vocal usage differences remain stable across days of development It is possible that the observed vocal usage differences could result from varying developmental progression of vocal behavior or overexpression of certain vocal types during specific periods within the recording. To assess the potential effect of daily variation on family specific vocal usage, we visualized density maps of vocal usage across days for each of the families (Figure 4A). There are two noteworthy trends: 1.) the density map remains coarsely stable across days (rows) and 2.) the maps look distinct across families on any given day (columns). This is a qualitative approximation for the repertoire’s stability, but does not take into account variation of call type usage (as defined by GMM clustering of the latent space). Figure 4B, shows the normalized usage of each cluster type over development for each family. Cluster usages during the period of “full family, shared recording days” (postnatal days beneath the purple bars) are stable across days within families – as is apparent by the horizontal striations in the plot – though each family maintains this stability through using a unique set of call types. This is addressed empirically in Figure 4C, which shows clearly separable PCA projections of the cluster usages shown in Figure 4B (purple days). Finally, we computed the pairwise Mean Max Discrepancy (MMD) between latent distributions of vocalizations from individual recording days for each of the families (Figure 4D). This shows that across-family repertoire differences are substantially larger than within-family differences. This is visualized in a multidimensional scaling projection of the MMD matrix in Figure 4E.”

      Discussion

      “The described family differences collapse data from multiple days into a single comparison, however it’s possible that factors such as vocal development and/or high usage of particular vocal types during specific periods of the recording could explain family differences. Therefore, we took advantage of the longitudinal nature of our dataset to assess whether repertoire differences remain stable across time. First, we visualized vocal repertoire usage across days as either UMAP probability density maps (Figure 4A) or daily GMM cluster usages (Figure 4B). Though qualitative, one can appreciate that family repertoire usage remains stable across days and appears to differ on a consistent daily basis across families. To formally quantify this, we first projected GMM cluster usages from Figure 4B into PC space and show that family GMM cluster usage patterns are highly separable, regardless of postnatal day (Figure 4C). If families had used a more overlapping set of call types, then the projections would have appeared intermixed. Next, we performed a cluster-free analysis by computing the pairwise MMD distance between VAE latent distributions of vocalizations from each family and day (Figure 4D). This analysis shows very low MMD values across days within a family (i.e. the repertoire is highly consistent with itself), and high MMD values across families/days (greater than would be expected by chance; see shuffle control in Figure S2D). The relative differences in this matrix are made clear in Figure 4E, which provides additional evidence that family vocal repertoires remain stable across days and are consistently different from other families. Taken together, we believe that this is compelling evidence that differences in vocal repertoires between families are not driven by dominating call types during specific phases in the recording period; rather, families consistently emit characteristic sets of call types across days. This opens up the possibility to assess repertoire differences over much shorter time periods (e.g. 24 hours) in future studies.”

      (3) Family-specific vocalizations were credited to the transition structure, a finding that may seem obvious if the 1-gram (i.e., the proportion of call types) already differs. This result lacks depth unless it can be demonstrated that, firstly, the transition matrix provides a robust description of the data, and secondly, different families arrange the same set of syllables into unique sequences.

      Thank you for these important suggestions. We agree that it is true that the 2-gram transition structure must vary based on the 1-gram structure. To determine whether this influences the interpretation of the finding, we have added Figure S5 and the following text in the Results section:

      “To determine whether differences in 1-gram structure contribute to differences in the transition (2-gram) structure, we performed a number of controls. Although subtle, vertical streaks are clearly present in shuffled transition matrices that correspond to 1-gram usages (Figure S5A-B). Given the shuffled data structure, we sought to determine whether the observed transition probabilities differed significantly from chance levels. We randomly shuffled label sequences 1000 times independently for each family to generate a null transition matrix distribution. Using these null distributions and the observed transition probabilities, we computed a p-value for each transition using a one-sample t-test and created a binary transition matrix indicating which transitions happen above chance levels (Figure S5C, black pixels, p <= 0.05 after post hoc Benjamini-Hochberg multiple comparisons correction). As is made clear in Figure S5C, most transitions for each family occur significantly above chance levels, despite the inherent 1-gram structure. Moreover, by looking at transitions from a highly usage cluster type used roughly the same proportion across families (cluster 12), we show that families arrange the same sets of vocal clusters into unique sequences (Figure S5D). We believe that this provides compelling evidence that the 1-gram structure does not change the interpretation of the main claim that transition structure varies by family. “””

      To address your second point, we inspected frequent transitions from individual syllables to all other syllables using bigram transition probability graphs. This revealed a common trend that across all families, many shared and unshared transitions existed, suggesting that families use the same sets of syllables to make unique transition patterns. Figure S5D shows a single syllable example of the phenomenon, with red lines indicating the shared transition types between families and black showing transition patterns not shared between families (i.e. unique family-specific transitions, or lack thereof).”

      Reviewer #2 (Public Review):

      Peterson et al., perform a series of behavioral experiments to study the repertoire and variance of Mongolian gerbil vocalizations across social groups (families). A key strength of the study is the use of a behavioral paradigm which allows for long term audio recordings under naturalistic conditions. This experimental set-up results in the identification of additional vocalization types. In combination with state of the art methods for vocalization analysis, the authors demonstrate that the distribution of sound types and the transitions between these sound types across three gerbil families is different. This is a highly compelling finding which suggests that individual families may develop distinct vocal repertoires. One potential limitation of the study lies in the cluster analysis used for identifying distinct vocalization types. The authors use a Gaussian Mixed Model (GMM) trained on variational auto Encoder derived latent representation of vocalizations to classify recorded sounds into clusters. Through the analysis the authors identify 70 distinct clusters and demonstrate a differential usage of these sound clusters across families. While the authors acknowledge the inherent challenges in cluster analysis and provide additional analyses (i.e. maximum mean discrepancy, MMD), additional analysis would increase the strength of the conclusions. In particular, analysis with different cluster sizes would be valuable. An additional limitation of the study is that due to the methodology that is used, the authors can not provide any information about the bioacoustic features that contribute to differences in sound types across families which limits interpretations about how the animals may perceive and react to these sounds in an ethologically relevant manner.

      The conclusions of this paper are well supported by data, but certain parts of the data analysis should be expanded and more fully explained.

      • Can the authors comment on the potential biological significance of the 70 sound clusters? Does each cluster represent a single sound type? How many vocal clusters can be attributed to a single individual? Similarly, can the authors comment on the intra-individual and inter-individual variability of the sound types within and across families?

      Previous work documenting the Mongolian gerbil repertoire (Ter-Mikaelian 2012, Kobayasi 2012) has revealed ~12 vocalization types that vary with social context. Our thinking is that we are capturing these ~12 (plus a few more, as illustrated in Figure 2C) as well as individual or family-specific variations of some call types. Although the number of discrete call types is likely less than 70, it’s plausible that variation due to vocalizer identity pushes some calls into unique clusters. This idea is supported by the fact that both naked mole rats and Mongolian gerbils have been shown to exhibit individual-specific variation in vocalizations, though only in single call types (Barker 2021, Figure 1; Nishiyama 2011, Table I). The current study is not ideal to test this prediction, as we cannot attribute each vocalization to individual family members. Using our 4-mic array, we attempted to apply established sound source localization techniques to assign vocalizations to individuals (Neunuebel 2015), but the technique failed, presumably due to high amounts of reverberation in the arena. We are currently developing a custom deep learning based sound localization algorithm, and had hoped to extract individual animal vocalizations from our data set (part of the reason why this manuscript has taken longer than expected to return!), but the performance is not yet satisfactory for large groups of animals. We have added text to the Methods sections with the context outlined above to further justify the use of ~70 clusters.

      • As a main conclusion of the paper rests on the different distribution of sound clusters across families, it is important to validate the robustness of these differences across different cluster parameters. Specifically, the authors state that "we selected 70 clusters as the most parsimonious fit". Could the authors provide more details about how this was fit? Specifically, could the authors expand upon what is meant by "prior domain knowledge about the number of vocal types...". If the authors chose a range of cluster values (i.e. 10, 30, 50, 90) does the significance of the results still hold?

      Thank you for the suggestion, this is an important point that we have addressed with new analyses in the revision (see GMM clustering methods and new Figure S4). The prior domain knowledge referenced is with respect to the information known about the Mongolian gerbil vocal types provided in the response above. We have made this more clear in the discussion.

      We mainly based our selection of the number of clusters using the elbow method on GMM held-out log likelihood (Figure S2C). Around 70 clusters is when the likelihood begins to plateau, though it’s clear that there are a number of reasonable cluster sizes. To assess whether cluster size has an effect on interpretation of the family differences result, we added Figure S5, where we varied the number of GMM clusters used and compared cluster usage differences across families (Figure S4A). We quantified pairwise family differences in cluster usage by computing the sum of the absolute value of differential cluster usages, for each GMM cluster value (Figure S4B). We find that relative usage differences remain unchanged across the range of cluster values used, indicating that GMM cluster size does bias the finding.

      • While VAEs are powerful tools for analyzing complex datasets in this case they are restricted to analysis of spectrogram images. Have the authors identified any acoustic differences (i.e. in pitch, frequency, and other sound components) across families?

      Though it’s true that this VAE is limited to spectrograms, the VAE latent space has been shown to correspond to real acoustic features such as frequency and duration, and contain a higher representational capacity than traditional acoustic features (Goffinet 2021, Figure 2). Therefore, clustering of the latent space necessarily means that vocalizations with similar acoustic features are clustered together regardless of their family identity.

      Despite this, your point is well taken that there could be systematic differences in certain acoustic features for specific call types. We are not able to ascertain this with the current dataset. This is addressed in Barker 2021 by recording a single call type (soft chirp) from individuals within and across families. Mongolian gerbils have been shown to exhibit individual differences in the initial, terminal, minimum, and maximum frequency of the ultrasonic up-frequency modulated call type (Figure 2, top right green; Nishiyama 2011, Figure 1A ). Therefore it’s possible that family-specific differences exist for that particular call type. To assess whether other call types show family or individual differences, it’s necessary to either 1.) elicit all call types from an animal in isolation or 2.) determine vocalizer identity in social-vocal interactions. The problem with the former idea is that gerbils only produce up-frequency modulated USVs in isolation and there is no known way to elicit the full vocal repertoire in single animals. The latter idea would allow for full use of the vocal repertoire, but requires invasive techniques (e.g., skull-implanted microphones, or awake-behaving laryngeal nerve recordings) that permit assignment of vocalizations to individuals during a natural social interaction. We are actively exploring solutions to both problems.

      It’s likely that future studies will look deeper into acoustic differences between individuals and families. Therefore, we have added acoustic feature quantification of vocalizations in each of the GMM clusters as a reference (Figure S6).

      Reviewer #3 (Public Review):

      Summary:

      In this study, Peterson et al. longitudinally record and document the vocal repertoires of three Mongolian gerbil families. Using unsupervised learning techniques, they map the variability across these groups, finding that while overall statistics of, e.g., vocal emission rates and bout lengths are similar, families differed markedly in their distributions of syllable types and the transitions between these types within bouts. In addition, the large and rich data are likely to be valuable to others in the field.

      Strengths:

      - Extensive data collection across multiple days in multiple family groups.

      -  Thoughtful application of modern analysis techniques for analyzing vocal repertoires. - Careful examination of the statistical structure of vocal behavior, with indications that these gerbils, like naked mole rats, may differ in repertoire across families.

      Weaknesses:

      - The work is largely descriptive, documenting behavior rather than testing a specific hypothesis.

      - The number of families (N=3) is somewhat limited.

      We agree that the number of families is relatively small. However, our new analysis of vocal repertoire by postnatal day (Figure 4) demonstrates that the finding is quite robust. A high sample-size study was outside the scope of this initial observational study given the difficulty of obtaining and processing longitudinal data of this scale. In light of new analyses in Figure 4, we are confident that future studies will not need so much data to characterize family-specific differences. A single 24-hour recording should be sufficient, making comparison of many more families relatively straightforward.

      Recommendations for the authors:

      Reviewer #1 (Recommendations For The Authors):

      Several minor concerns:

      (1) The three thresholds used for vocalization segmentation lack explanation.

      Figure 1C's first vocal event appears to define the first gap via the gray threshold (th_2, as the trace does not cross the black line) and the second gap via the black threshold (th_1 or th_3). And this is not addressed in the Methods section.

      Thank you for bringing this to our attention. We agree, this is presented in an unnecessarily complicated way. We have updated the methods section describing the thresholding procedure.

      “Sound onsets are detected when the amplitude exceeds 'th_3' (black dashed line, Figure 1C), and sound offset occurs when there is a subsequent local minimum e.g., amplitude less than 'th_2' (gray dashed line, Figure 1C), or 'th_1' (black dashed line, Figure 1C), whichever comes first. In this specific use case, th_2 (5) will always come before th_1 (2), therefore the gray dashed line will always be the offset. A subsequent onset will be marked if the sound amplitude crosses th_2 or th_3, whichever comes first. For example, the first sound event detected in Figure 1C shows the sound amplitude rising above the black dashed line (th_3) and marks an onset. Subsequently, the amplitude trace falls below the gray dashed line (th_2) and an offset is marked. Finally, the amplitude rises above th_2 without dipping below th_3 and an onset for a new sound event is marked. Had the amplitude dipped below th_3, a new sound event onset would be marked when the amplitude trace subsequently exceeded th_3 (e.g. between sound event 2 and 3, Figure 1C). The maximum and minimum syllable durations were selected based on published duration ranges of gerbil vocalizations (Ter-Mikaelian et al. 2012, Kobayasi & Riquimaroux, 2012).”

      (2) The determination of multi-syllabic calls could be explained further. In Figure 1C, for instance, do syllables separated by short gaps (e.g., the first syllable and the rest of the first group, and the third group in this example) belong to the same call or different calls?

      We have added an operational definition of mono vs. multisyllabic calls in the Results section:

      “Vocalizations occur as either single syllables bounded by silence (monosyllabic) or consist of combinations of single syllables without a silent interval (multisyllabic).”

      Under this definition, the examples you mentioned in Figure 1C are considered monosyllabic. One could reasonably expand the definition to include calls separated by less than X ms of silence for example, however we choose not to do that in this study. A deeper understanding of the phonation mechanisms for different gerbil vocalization types would be helpful to more rigorously determine the distinction between mono vs. multisyllabic vocalizations.

      (3) Labeling the calls shown in Fig. 3D in the latent feature space would help highlight within-family diversity and between-family similarities.

      Great suggestion. We have updated Figure 3 to include where in UMAP space each family’s preferred clusters are.

      (4) In the introduction, the statement, "Therefore, our study considers the possibility that there is a diversity of vocalizations within the gerbil family social group" doesn't naturally follow from the previous example. This could be rephrased.

      Agreed, thank you. We revised this section of the introduction to flow better.

      Reviewer #2 (Recommendations For The Authors):

      While outside the scope of the current study the authors may consider the following experiments and analysis for future studies:

      • Do vocal repertories retain their family signatures across subsequent generations of pups? (i.e. if vocalizations are continually monitored during second or third litters of the same parents).

      • Do the authors observe any long-term changes in family repertoires related to the developmental trajectory of the pups? Are there changes in individual pup vocal features or sound type usage throughout development?

      Thank you for these great suggestions. Given that naked mole rats learn vocalizations through cultural transmission, it would be interesting to see whether other subterranean species with complex social structures (gerbils, voles, rats) have similar abilities. A straightforward way to assess this possibility could be as you suggest — are latent distributions of vocalizations from multi-generational families closer together than cross-family differences? If true, this would provide compelling evidence to investigate further.

      We partially address your second suggestion in our response to Reviewer 1 and in Figure S4, which shows that the family repertoire remains stable throughout this particular period of development. This doesn’t rule out the possibility that there could be other phases of development that undergo more vocal change. Your final suggestion is an area that we are actively researching and eager to know the answer to. A follow-up question: could differences in pup vocal features contribute to differential care by parents?

      Reviewer #3 (Recommendations For The Authors):

      In all, I found the paper clearly written and the figures easy to follow. One small suggestion:

      Figure 1: I can't see the black and gray thresholds described in the caption very well. Perhaps a zoom-in to the first 0.15s or so of the normalized amplitude plot would better display these.

      Agreed, thank you. We added a zoom-in to Figure 1.

    1. eLife Assessment

      This valuable study investigates evolutionary aspects around a single amino acid polymorphism, known to be under long-term balancing selection, in an immune peptide of Drosophila melanogaster. Using alleles with different substitutions, the investigators demonstrate that while one allele provides better survival after systemic infections by a bacterial pathogen, the alternative allele endows its carriers with a longer lifespan under certain conditions. The authors suggest that these contrasting fitness effects of the two alleles contribute to balancing their long-term evolutionary fate. While the work is very interesting, the strength of the provided evidence is still incomplete, and the study would benefit from more rigorous approaches.

    2. Reviewer #1 (Public review):

      Summary:

      In this manuscript, Unckless and colleagues address the issue of the maintenance of genetic diversity of the gene diptericin A, which encodes an antimicrobial peptide in the model organism Drosophila melanogaster. This is an important question as the maintenance of different alleles in wild populations is not known.

      Strengths:

      The data indicate that flies homozygous for the dptA S69 allele are better protected against some bacteria. By contrast, male flies homozygous for the R69 allele resist better to starvation than flies homozygous for the S69 allele. This provides an element of explanation.

      Weaknesses:

      (1) Some of the results are difficult to understand. The observation that R69 die more than the null Dpt mutant and the wild-type is strange. This could be due to background effect. The fact that the second chromosome was not isogenized after the CRISPR change is an issue. This issue may take too much time to fix, but should be acknowledged. The existence of background effect and the multiple tested conditions that may lead to the obtention of results that may not be reproduced in other contexts/labs.<br /> (2) Some lifespans are rather short and often in disagreement with other studies (Leulier, Iatsenko but also Hanson/Lemaitre). There are also disagreements inside the article itself for instance between Fig4C and 2A. This should be mentioned.<br /> (3) The shape of many lifespan analysis with abrupt decline contrast with classical lifespan studies, suggesting technical problems.

    3. Author response:

      The following is the authors’ response to the original reviews.

      Public Reviews:

      Reviewer #1 (Public Review):

      Summary:

      In this manuscript, Unckless and colleagues address the issue of the maintenance of genetic diversity of the gene diptericin A, which encodes an antimicrobial peptide in the model organism Drosophila melanogaster.

      Strengths:

      The data indicate that flies homozygous for the dptA S69 allele are better protected against some bacteria. By contrast, male flies homozygous for the R69 allele better resist starvation than flies homozygous for the S69 allele.

      Weaknesses:

      -I am surprised by the inconsistency between the data presented in Fig. 1A and Fig. S2A for the survival of male flies after infection with P. rettgeri. I am not convinced that the data presented support the claim that females have lower survival rates than males when infected with P. rettgeri (lines 176-182).

      The two figures are pasted above (1A left, S2A right). The reviewer is correct that the two experiments look different in terms of overall outcomes for males, though qualitatively similar. These two experiments were performed by different researchers, and as much as we attempt to infect consistently from researcher to researcher, some have heavier hands than others. It is true that the genotype that has the largest sex effect is the arginine line (blue) where females (in this experiment) are as bad as the null allele, and males are more intermediate. Also note that the experiments in S2A (male and female) were done in the same block so they are the better comparison. We’ve reflected this in the manuscript.

      - The data in Fig. 2 do not seem to support the claim that female flies with either the dptA S69 or the R69 alleles have a longer lifespan than males (lines 211-215). A comment on the [delta] dpt line, which is one of the CRISPR edited lines, would be welcome.

      We’ve reworded this section based on these comments.

      - The data in Fig. 2B show that male flies with the dptA S69 or R69 alleles have the same lifespan when poly-associated with L. plantarum and A. tropicalis, which contradicts the claim of the authors (lines 256-260).

      This is correct – the effect is only in females. It has been corrected.

      Reviewer #2 (Public Review):

      Summary: In this study, the authors delve into the mechanisms responsible for the maintenance of two diptericin alleles within Drosophila populations. Diptericin is a significant antimicrobial peptide that plays a dual role in fly defense against systemic bacterial infections and in shaping the gut bacterial community, contributing to gut homeostasis.

      Strengths: The study unquestionably demonstrates the distinct functions of these two diptericin alleles in responding to systemic infections caused by specific bacteria and in regulating gut homeostasis and fly physiology. Notably, these effects vary between male and female flies.

      Weaknesses: Although the findings are highly intriguing and shed light on crucial mechanisms contributing to the preservation of both diptericin alleles in fly populations, a more comprehensive investigation is warranted to dissect the selection mechanisms at play, particularly concerning diptericin's roles in systemic infection and gut homeostasis. Unfortunately, the results from the association study conducted on wild-caught flies lack conclusive evidence.

      This is true that the wild fly association study is mostly a negative result. We’ve backed off the claim about the Morganella association.

      Major Concerns:

      Lines 120-134: The second hypothesis is not adequately defined or articulated. Please revise it to provide more clarity. Additionally, it should be explicitly stated that the first part of the first hypothesis (pathogen specificity), i.e., the superior survival of the S allele in Providencia infections compared to the R allele, has been previously investigated and supported by the results in the Unckless et al. 2016 paper. The current study aims to additionally investigate the opposite scenario: whether the R allele exhibits better survival in a different infection. Please consider revising to emphasize this point.

      We’ve reworded this section and added references to both the Unckless et al. 2016 and Hanson et al. 2023 papers.

      Figures and statistical analyses: It is essential to present the results of significant differences from the statistical analyses within Figures 1B, 2B, and 3. Additionally, please include detailed descriptions of the statistical analysis methods in the figure legends. Specify whether the error bars represent standard error or standard deviation, particularly in Figure 3, where assays were conducted with as few as 3 flies.

      We have added statistical details as requested.

      Lines 317-318 (as well as 320-328): The data related to P. rettgeri appear somewhat incomplete, and the authors acknowledge that bacterial load varies significantly, and this bacterium establishes poorly in the gut. These data may introduce more noise than clarity to the study. Please consider revising these sections by either providing more data, refining the presentation, or possibly removing them altogether.

      The fact that P. rettgeri establishes poorly in the gut in wildtype flies is the result of several unpublished experiments in the Lazzaro and Unckless labs. We don’t have this as a figure because it was not directly tested in these experiments. We’ve added a note that it is personal observation and we’ve reworked the discussion in the second section.

      Lines 335-387 and Figure 4: Although these results are intriguing and suggest interactions between functional diptericin and fly physiology, some mediated by the gut microbiome, they remain descriptive and do not significantly contribute to our understanding of the mechanism that maintains the diptericin alleles.

      While the reviewer is correct that these experiments do not elucidate mechanism, they do strongly suggest (based on the controlled nature of the experiments) that the physiological tradeoffs are due to Diptericin genotype. The disagreement is the level of “mechanism”. At the evolutionary level, the demonstration of a physiological cost of a protective immune allele is sufficient to explain the maintenance of alleles. However, we have not determined (and did not attempt to determine) why Diptericin genotype influences these traits. That will have to wait for future experiments.

      Lines 399-400: The contrast between this result and statement and the highly reproducible data presented in Figures 2-4 should be discussed.

      We’ve added some discussion to this section including a reference to the “inconstancy” of the Drosophila gut microbiome.

      Lines 422-429 and Figure 5D: The conclusion regarding an association between diptericin alleles and Morganellaceae bacteria is not clearly supported by Figure 5D and lacks statistical evidence.

      We’ve changed this to just be suggestive.

      Reviewer #3 (Public Review):

      Summary:

      This paper investigates the evolutionary aspects around a single amino acid polymorphism in an immune peptide (the antimicrobial peptide Diptericin A) of Drosophila melanogaster. This polymorphism was shown in an earlier population genetic study to be under long-term balancing selection. Using flies with different AA at this immune peptide it was found that one allelic form provides better survival of systemic infections by a bacterial pathogen, but that the alternative allele provides its carriers a longer lifespan under certain conditions (depending on the microbiota). It is suggested that these contrasting fitness effects of the two alleles contribute to balance their long-term evolutionary fate.

      Strengths:

      The approach taken and the results presented are interesting and show the way forward for studying such polymorphisms experimentally.

      Weaknesses:

      (1) A clear demonstration (in one experiment) that the antagonistic effect of the two selection pressures isolated is not provided.

      The study is overwhelming with many experiments and countless statistical tests. The overall conclusion of the many experiments and tests suggests that "dptS69 flies survive systemic infection better, while dptS69R flies survive some opportunistic gut infections better." (line 444-446). Given the number of results, different experiments, and hundreds of tests conducted, how can we make sure that the result is not just one of many possible combinations? I suggest experimentally testing this conclusion in one experiment (one may call this the "killer-experiment") with the relevant treatments being conducted at the same time, side by side, and the appropriate statistical test being conducted by a statistical test for a treatment x genotype interaction effect.

      This is a nice idea but would not work in practice since the fly lines used are different (gnotobiotic vs conventional) and gnotobiotics have to be derived from axenic lines that need a few generations to recover from the bleaching treatment.

      (2) The implication that the two forms of selection acting on the immune peptide are maintained by balancing selection is not supported.

      The picture presented about how balancing selection is working is rather simplistic and not convincing. In particular, it is not distinguished between fluctuating selection (FL) and balancing selection (BL). BL is the result of negative frequency-dependent selection. It may act within populations (e.g. Red Queen type processes, mating types) or between populations (local adaptation). FL is a process that is sometimes suggested to produce BL, but this is only the case when selection is negative frequency dependent. In most cases, FL does not lead to BL.

      The presented study is introduced with a framework of BL, but the aspects investigated are all better described as FL (as the title says: "A suite of selective pressures ..."). The two models presented in the introduction (lines 62 to 69; two pathogens, cost of resistance) are both examples for FL, not for BL.

      We’ve added a discussion of how fluctuating selection and balancing selection relate at the end of the discussion.

      Finally, no evidence is presented that the different selection pressures suggested to select on the different allelic forms of the immune peptide are acting to produce a pattern of negative frequency dependence.

      We are not arguing for negative frequency dependent selection. We assume throughout that Dpt allele does not drive overall frequency of P. rettgeri in populations since it is a ubiquitous microbe. So evolution within D. melanogaster therefore has little to no effect on density of the pathogen.

      Recommendations for the authors:

      Reviewer #2 (Recommendations For The Authors):

      Minor Comments:

      Line 31: Rewrite the sentence mentioning "homozygous serine" for improved clarity, especially since the S/R polymorphism of Diptericin has not been introduced yet.

      This has been changed to be vague in terms of specific alleles and just refers to “one allele” vs the other.

      Lines 87-94: Consider reorganizing this paragraph to maintain a logical flow of the discussion on the Drosophila immune system and the IMD pathway.

      We explored other orders, but we think that as is (IMD to AMPs in general to AMPs in Drosophila) makes the most sense here.

      Line 99: Provide an explanation of balancing selection for a broader readership, differentiating it from other modes of selection.

      We added a brief discussion but note that the intro has significant discussion of balancing selection.

      Lines 105-106: Please provide a proper reference. Additionally, ensure that the Unkless et al. 2016 paper is correctly referenced, both in lines 111 and 138-141.

      This has been added.

      Lines 138-141: It would be beneficial to state that the previous study by Unkless et al. 2016 did not control for genetic background, which is why the assay was redone with gene editing.

      This has been added.

      Lines 296-303: Clarify the source of the survival observations and consider incorporating this data into Figure 2 for improved visualization.

      We’ve clarified that this is Figure 2.

      Lines 390-394: Explain the distinctions between vials and cages, particularly in terms of food consumption, exposure to bacteria, etc., which can be relevant to gut homeostasis.

      We’ve added a discussion of why these two approaches are complementary.

      Reviewer #3 (Recommendations For The Authors):

      Statistics

      Statistical results are limited to the presentation of p-values (several hundred of them!). For a proper assessment of the statistical analyses, one would also want to see the models used and the test statistics obtained.

      The statistical tests done are often unclear. For example, in several experiments, pools of 3 trials (blocs) of multiple animals were tested. The blocs need to be included in the model. Likewise, it seems that multiple delta-dpt fly genotypes were produced. Apparently, they were not distinguished later. Were they considered in the statistical analyses? By contrast, two lines of dptS69R flies were reported to show differences. What concept was applied to test for line difference in some cases and not in others?

      In the same dataset (i.e. data resulting from one experiment), it seems that mostly multiple tests were done. For example, in one case each treatment was contrasted to the dptS69 flies. It is generally not acceptable to break down one dataset in multiple subsets and conduct tests with each subtest. One single model for each experiment should be done. This may then be followed by post-hoc tests to see which treatments differ from each other.

      We’ve attempted to clarify these statistical approaches throughout.

      Minor points

      In the legend of Figure 3 it says: "A) monoassociations where each plot represents a different experiment,". This is unclear to me. First, how many plots are there: 3 or 12? Second, what means "experiment"? Are these treatments, or entirely different experiments? How was this statistically taken into account?

      We’ve changed this to “different condition” which is clearer. We performed statistical analysis independently for each condition and we’ve now discussed that.

      Fig. 5D. It is suggested in the text ("Most intriguing", line 426) and the figure legend that the abundance of Morganellaceae in wild-caught flies differs among genotypes. This is not visible in the figure and not convincingly shown in the text. No stats are given.

      We’ve now added that these differences are not significant.

      Line 458-461: This sentence is unclear.

      We’ve attempted to clarify.

      What is a "a traditional adaptive immune system"?

      We’ve reworded to “an adaptive immune system”.

      There are several typos in the manuscript. Please correct.

      We’ve attempted to fix typos throughout.

      Bold statements are often without references.

      We’ve attempted to add appropriate references throughout.

    1. Reviewer #1 (Public review):

      This paper introduces a new transgenic mouse line that allows the labelling of the AIS and nodes of Ranvier by tagging Ank-G with GFP in a Cre-dependent manner. The authors characterise the properties of the AIS and nodes of Ranvier when labelled with GFP to show that it has no adverse effects on the properties of the AIS and nodes of Ranvier, nor on most measures of intrinsic excitability in neurons. They also show that this mouse line can be used to follow AIS plasticity in vitro and to visualise the AIS of neurons in vivo. This is a very useful and timely tool that will make an important impact in the field.

    2. Reviewer #2 (Public review):

      The axon initial segment (AIS) is the axonal domain where most neurons integrate inputs and generate action potentials. Though structural and electrophysiological studies have allowed to better understand the mechanisms of assembly and maintenance of this domain, as well as its functions, there is still a need for efficient tools to study its structural organization and plasticity in vivo.

      In this article, the authors describe the generation of a knock-in mouse reporter line allowing the conditional expression of a GFP-tagged version of AnkyrinG (Ank-G), which is a major protein of the axon initial segment and the nodes of Ranvier in neurons. This reporter line can in particular be used to study axon initial segment assembly and plasticity, by combining it with mouse lines or viruses expressing the Cre recombinase under the control of a neuronal promoter. Furthermore, the design of the line should allow to preserve the expression of the main Ank-G isoforms observed in neurons and could thus allow to study Ank-G related mechanisms in various neuronal subcompartments.

      Some mouse lines allowing the neuronal expression of AIS/node of Ranvier markers coupled to a fluorescent protein exist, however they correspond to transgenic lines leading to potential overexpression of the tagged protein. Depending on the promoter used, their expression can vary and be absent in some neuronal populations (in particular, the Thy-1 promoter can lead to variable expression depending on the transgene insertion locus). Furthermore, these lines do not allow conditional expression of the protein regarding neuronal subtypes nor controlled temporal expression. Finally, a thorough description of the in vivo expression of the tagged protein at the AIS, and its impact on the structural and electrophysiological properties of the AIS are missing for these lines.

      The present reporter line is thus definitely of interest, as the authors convincingly show that it can be used in various contexts (from in vitro to in vivo). It could in particular be used to study the assembly and plasticity of the domains where Ank-G is expressed. The strength of this work is that it thoroughly characterizes the reporter line expression and shows that it does not alter the structural nor the electrophysiological properties of the labeled neurons. The additional data presented by the authors in the revised version adequately complete the previously shown data and address the questions raised by the reviewers.

    3. Author response:

      The following is the authors’ response to the original reviews.

      Reviewer #1:

      R1-01 - Does ank-G-GFP label all isoforms (190, 270 and 480kDa) of ankG? From the images of the AIS and noR it appears that the large forms (270 and 480 kDa) are probably tagged with GFP. Did the authors check for puncta along dendrites and in dendritic spines, which are thought to be formed by the small (190 kDa) isoform? Perhaps a western blot to show that Ank-G-GFP labels all isoforms would be a useful addition to this study.

      We believe that AnkG-GFP indeed labels the major Ank3 transcripts in the brain, including the 190, 270, and 480 kDa isoforms, based both on known mRNA exon usage and on Western blot analysis (data not shown). Thus, theoretically, this model would be useful for examining the localization of 190 kD ankyrin-G to dendritic spines. While we attempted to examine this in sections from tissue, it was difficult to separate punctate ankyrinG-GFP labeling from the background. However, these experiments were done in genetic crosses that would label most pyramidal neurons in a given area (i.e. CaMKIIa-Cre). Given the Cre-dependence of this model, future experiments could utilize sparse transduction with a Cre virus that also fills neurons with soluble fluorophores (i.e. mCherry or tdTomato) to mark isolated neurons and identify dendritic spines, as exemplified in Fig. 2D. This would allow examination of subcellular localization of ankyrin-G within single pyramidal cells before and after induction of synaptic plasticity.

      R1-02 - In Figure 2, does all the native Ank-G get replaced by Ank-G-GFP? In Fig. 2E the GFP signal along the AIS of CamKII +ve neurons does not appear to be very homogeneous compared to the BIV-spectrin label. Have the authors carried out more experiments like those in 2F, using antibodies that label AnkG together with the GFP fluorescence of the labeled AnkG? It would also be informative to know if, as one might expect, the total levels of ankG-GFP correlate with the levels of ankG at the AIS.

      We agree that this is an important point and conducted additional experiments to address your concerns. Of course, we cannot exclude that some unmodified ankyrin-G remains in the AIS or other structures. We expect the turnover of the protein to be rather slow, and native ankyrin-G likely remains to some degree. However, our quantification demonstrates that the ankyrin-G-GFP labeling is sufficiently homogeneous to accurately represent AIS size, indicating proportional levels of GFP to native ankyrin-G. Animals were crossed with a CaMKIIa-Cre driver line and ex vivo slices were imaged live and after immunolabeling. We found a strong correlation between live ankyrin-G-GFP (patch clamp chamber), postfix ankyrin-G-GFP, postfix ankyrin-G, and βIV-spectrin immunosignals of the same AIS. Furthermore, our measurements of AIS length using the intrinsic GFP signal in combination with ankyrin-G, or βIV-spectrin antibodies showed significant overlap (see R103). We now included these graphs as supplemental Fig. S2 in the manuscript (pp. 8-9, ll. 173-177).

      R1-03 - Does the length and position of the AIS change when Ank-G is tagged with GFP? This seems like important information that is needed to make sure that there are no structural differences in AIS morphology when compared to native Ank-G.

      This is a very important point. We used the βIV-spectrin signal to compare the length of AIS with and without GFP modification in acute slices after patch-clamp recordings (N= 3 animals, 27 GFP+ and 48 GFP- AIS). As secondary control, we plotted the measurements of 160 AIS from a Thy1-GFP mouse line (N = 3 animals, 160 AIS). We found no significant difference in the length and position of the βIV-spectrin signal between GFP positive and negative AIS (p=0.3364 unpaired t-test, p=0.6138 non-parametric Mann-Whitney test, respectively). We have now included this analysis as Supplemental Fig. S2A in the manuscript (pp. 8-9, ll. 173-177). 

      R1-04 - How was node length measured in Figure 3? Was this done using the endogenous ank-G signal? In this figure, it would be informative to also quantify the number of noRs with a Nav1.6 stain. Perhaps even check if there are correlations between Ank-G-GFP and Nav1.6 levels. In this figure, it appears that comparisons are carried out between Ank-G-GFP +ve and -ve neurons in the same cryosections, from Ank-G-GFP mice crossed with CamKIIa-Cre. I worry that this may not be comparing the same types of axons. What cells do the CamKIIa -ve axons belong to? Also, the labels on the bar graph are confusing - perhaps GFP+ve and GFP-ve would be clearer?

      The reviewer raises an important point. We forgot to declare the signal which was used to measure node length in the manuscript. We have corrected this error and clearly state now in the Fig.3C legend that we used the ankyrin-G signal to quantify node length. Furthermore, using CaMKIIa-Cre mediated expression triggers ankyrin-G-GFP only in a genetically defined subset of neurons. Nodes that do not belong to this subgroup might very well have different node properties. Yet, we cannot assign potential differences in node length to the presence or absence of the GFP label, since we do not have an independent labeling technique for the very same subset of neurons. Since node lengths were similar and showed the same spread of lengths in our sample (Fig. 3C), we assume that the GFP length does probably not affect node length to a significant degree. We have now discussed this limitation in the result (p. 7, ll. 159-165) and method section (p. 30, ll. 644-645) and provide Supplementary Fig. S1 for more clarity. As suggested by the reviewer, we have measured mean fluorescence intensities between 91 GFP+ and 141 GFP- nodes using automated image processing in Imaris. The nodes were again defined by the ankyrin-G signal. We found no difference in length and ellipticity between the groups. We repeated this analysis and compared fluorescence intensities of Nav1.6 and ankyrin-G antibodies and again found no statistical differences between both groups. As suggested by the reviewer, we investigated whether ankyrin-G-GFP interferes with the fluorescence intensities of sodium channels (Nav1.6) and ankyrin-G in general. While the GFP signal showed a strong correlation with ankyrin-G, we found no interdependence with the Nav1.6 signal, indicating that the GFP label does not interfere with the general molecular composition of the nodes. We included these new analyses in Supplemental Fig. S1 (p. 7, ll. 159-165).

      R1-05 - In Figure 4 it would also be important to show the distribution of AIS molecules along the AIS, compared to the GFP signal, to establish whether this spatial arrangement of AIS-specific molecules remains intact. For example, Nav1.6 has been described as a more distally-located channel. As the authors point out, the example in A appears to show precisely this feature, but there is no quantification. The same applies to Kv1.2. This would also allow the authors to provide some quantification across multiple AISs, rather than just example images.

      We agree that quantifying and comparing AIS-associated proteins would be informative. We measured the intensity profiles of Nav1.6 and Kv2.1 in neighboring AIS and found no preferences for either end of the AIS, neither of GFP-positive nor GFP-negative AIS. We want to note that not all neurons exhibit a distal localization of Nav1.6 and hypothesize that our samples (neocortex layer II) also fall into this group. We included this new graph as Supplemental Fig. S2D and E in the manuscript (p. 9, ll. 180-184).

      R1-08 - In Figure 4, did the +Cre condition result in all cells showing a GFP-labelled AIS? If not, were the autocorrelations for +Cre-treated neurons done specifically on cells that expressed AnkG-GFP?

      We assume the reviewer refers to the autocorrelation in Figure 6. In this in vitro paradigm, we used virus-induced Cre expression which triggered ankyrin-G-GFP in almost all neurons. The orange boxplots describe the autocorrelation of all ankyrin-G, using a C-terminal antibody as in Fig.6C, but in neurons that also express ankyrin-G-GFP. The green samples use the GFP signal of ankyrin-GFP. We clarified this in the graph and legend of Fig. 6C (pages 14-15).

      R1-09 - As mentioned above in Figure 3, the comparisons in Figure 5 (GFP +ve and -ve neurons) may not be comparing like-for-like neurons. I imagine that many of the CamKII+ve cells in the cortex and hippocampus will be GABAergic interneurons, whereas presumably all of the CamKII+ve neurons will be pyramidal cells. Have the authors made sure that they are comparing across the same cell types? The fact that the number of axo-axonic synapses is similar across the two populations (Fig. 5B) does suggest that similar neuron types (presumably pyramidal cells) were compared in the hippocampus, but some other way of making sure would be a nice addition.

      We agree with the reviewer that the grey and green boxes are not sampled from the same subset of neurons, since only CaMKIIa-positive principal cells will express ankyrin-G-GFP. However, we are confident that the selected AIS belong to pyramidal neurons in both cases. Principal neurons can be well distinguished from interneurons not only by the size, shape, and position of their somas but also by the length and thickness of their AIS. We have performed previous studies on the AIS of interneurons using genetic GAD and parvalbumin markers. Thus, we are confident that the plots in 5A and 5B are sampled from pyramidal neurons, though certainly from genetically different subsets. We now highlight and discuss this limitation in the result section (p. 11, ll. 215-217) and modified the graph in Fig. 5A and 5B for clarity.

      R1-10 - In Figure 6, what was the promoter for the DCre and Cre+ lentivirus? Was this also driven by CamKIIa? In culture it is not always easy to be sure of neuronal identity - did the authors try to bias their analysis to specific neuronal types?

      Indeed, the nature of the promotor was not stated in the legend or method section, which we now corrected. We used lentiviral FUW-nGFP-Cre and FUW-nGFP-ΔCre constructs to trigger ankyrin-G-GFP expression. Both viruses use the CMV (Cytomegalovirus) promoter, which drives constitutively high levels of gene expression in a wide range of cell types, including neuronal cells. The majority of neurons in dissociated hippocampal cultures are excitatory, especially larger cells with larger AIS, which were preferably used in the analysis. Thus, we cannot claim that AIS nanostructure is intact in cultured interneurons, but this is also true for in vivo conditions in general. Since mice did not show any obvious behavioral phenotypes, we are positive that interneuron functionality is preserved. We also note that the parallel expression of nuclear GFP in the infected neurons was undesired, but did not impact STED imaging due to that technique’s high resolution. 

      R1-11 - The ability to visualize the plasticity of the AIS in real-time is an important advance in the field. The loss of proximal Ank-G-GFP signal upon local application of 15 mM KCl is particularly interesting. The fact that neighboring AISs are not affected is surprising - do the authors know how local their KCl application was? Also, although the neighboring AISs are a nice control, the one control lacking here is the local application of normal solution (preferably 15 mM NaCl to account for osmolarity changes) to make sure that this does not affect the properties of the AIS.

      We used KCl puffs in previous, unrelated experiments where we observed that only cells directly in front of the pipette are visibly depolarized by an acute KCl puff (measured by patch-clamp). Due to technical limitations, patched and live imaged neurons were generally in the first 2-5 cell layers of the brain slice, which is well perfused by the constant flow of oxygenated ACSF. KCl is thus quickly diluted and carried away. We have visualized the concentration gradients via puff application by puffing the fluorescent marker fluorescein in the same recording condition. The cone of fluorescence was only visible in front of the pipette and vanished in less than a second post-pressure application. To verify that it is indeed KCl and not the mechanical stress that lead to the loss of proximal Ank-G-GFP, one would indeed need an ACSF puff control, which we did for other studies. However, this is not the point we wanted to make. Instead of studying live single-cell AIS plasticity, we want to demonstrate that such investigations are generally possible using the ankyrin-G-GFP line.

      Author response image 1.

      R1-12 - The ability to be able to image AISs in vivo is another important finding. Were the authors able to image noRs as well?

      We believe that this is indeed the case. The panels in Figure 9C contain densely labeled puncta that also remain in position from week 1 to week 2. These are likely nodes of Ranvier, although we do not have the means to verify their presence at this time.

      Reviewer #2:

      R2-01 - Are there indeed different Ank-G-GFP isoforms expressed in this model and could they correspond to classical neuronal Ank-G isoforms?

      This is an important issue that was also raised by reviewer #1. Please consult the respective section R1-01 above for our response.

      R2-02 - What is the rationale of doing Ank-G co-labelling in the case of Ank-G-GFP expression, rather than Pan-Nav staining for example? The co-staining with Nav1.6 antibody, when present, is however convincing.

      We used the co-labeling to emphasize that the ankyrin-G-GFP construct allows reliable investigation of the whole AIS. This is why we wanted to demonstrate that the ankyrin-G-GFP signal overlaps with other AIS markers, as well as all ankyrin-G in general (including potentially remaining native and unlabeled ankyrin-G). This was also a point raised by Reviewer 1, which is why we provided some additional graphs (see response R1-02). However, we agree that staining with another independent marker, such as Nav1.6 or βIVspectrin was necessary. 

      R2-03 - Figure 2D and F: what is the rationale for not using betaIV-Spectrin staining as in the other panels of this figure? Furthermore, could betaIV-Spectrin localization be affected by Ank-GGFP expression, as betaIV-Spectrin is known to depend on Ank-G for its AIS targeting? Are there any other AIS markers, which localization is known to be independent of Ank-G, that could have been used?

      We have compiled this figure from a multitude of different experimental setups from different labs to showcase the reliability and robustness of the ankyrin-G-GFP label. This is why the type of staining is not consistent among panels. However, we provide some quantification on the possible impact of ankyrin-G-GFP expression on the βIV-spectrin signal and the composition of the AIS in general. The STED image verifies that the basic subcellular arrangement of the cytoskeleton, including βIV-spectrin, remains intact (Fig. 6). Most AIS markers are at least in some way dependent on ankyrin-G expression, but FGF14 and neurofascin may be the most independent candidates (Fig. 4).

      R2-04 - Did the authors measure the mean AIS length and distance from cell soma in Ank-G-GFPexpressing neurons versus non-expressing ones (considering the same neuronal subtypes) to assess whether these were unaffected by Ank-G-GFP expression?

      This is an important point that was also raised by Reviewer 1 (see also our comments to R1-03). We have included this analysis now in the manuscript as Supplemental Fig. S2A (pp. 8-9, ll. 173-177).

      R2-05 - Figure 5C: the microglial staining and 3D reconstruction could have been clearer.

      We have modified the image and 3D rendering to make Figure 5C clearer to the reader. We hope that our changes suffice.

      R2-06 - Figure 8: do hippocampal neurons retain their electrophysiological properties after 20 DIV? It could strengthen this part of the work to have access to the electrophysiological data mentioned in the text. 

      This is an important issue. We did not perform any electrophysiological recordings in OTCs in the course of this study. Panel E uses acute hippocampal slices like in Fig. 7. We have performed patch-clamp experiments up to DIV 10 for an unrelated study (see graph for action potential firing, Author response image 2). There are not many studies performing electrophysiology in slice cultures due to the formation of a glial scar on top of the slices. However, multielectrode array (MEA) recordings demonstrated that hippocampal organotypic slice cultures remain viable and show electric activity past DIV 20 (though with decreased viability and activity). We kindly refer to the following publications on that matter:

      Author response image 2.

      Sample traces of action potentials triggered by cuttrent injections

      Gong W, Senčar J, Bakkum DJ, Jäckel D, Obien ME, Radivojevic M, Hierlemann AR. Multiple SingleUnit Long-Term Tracking on Organotypic Hippocampal Slices Using High-Density Microelectrode Arrays. Front Neurosci. 2016 Nov 22;10:537. doi: 10.3389/fnins.2016.00537. PMID: 27920665; PMCID: PMC5118563.

      Mohajerani MH, Cherubini E. Spontaneous recurrent network activity in organotypic rat hippocampal slices. Eur J Neurosci. 2005 Jul;22(1):107-18. doi: 10.1111/j.1460-9568.2005.04198.x. PMID: 16029200.

    1. eLife Assessment

      This manuscript addresses infections of the parasite Taenia solium, which causes neurocysticercosis (NCC). NCC is a common parasitic infection that leads to severe neurological problems. It is a major cause of epilepsy, but little is known about how the infection causes epilepsy. The authors used neuronal recordings, imaging of calcium transients in neurons, and glutamate-sensing fluorescent reporters. A strength of the paper is the use of both rodent and human preparations. The results provide convincing evidence that the larvae secrete glutamate and this depolarizes neurons. Although it is still uncertain exactly how epilepsy is triggered, the results suggest that glutamate release contributes. Therefore, the paper is a fundamental step towards understanding how Taenia solium infection leads to epilepsy.

    2. Reviewer #1 (Public review):

      In the manuscript, the authors explore the mechanism by which Taenia solium larvae may contribute to human epilepsy. This is extremely important question to address because T. solium is a significant cause of epilepsy and is extremely understudied. Advances in determining how T. solium may contribute to epilepsy could have significant impact on this form of epilepsy. Excitingly, the authors convincingly show that Taenia larvae contain and release glutamate sufficient to depolarize neurons and induce recurrent excitation reminiscent of seizures. They use a combination of cutting-edge tools including electrophysiology, calcium and glutamate imaging, and biochemical approaches to demonstrate this important advance. They also show that this occurs in neurons from both mice and humans. This is relevant for pathophysiology of chronic epilepsy development. This study does not rule out other aspects of T. solium that may also contribute to epilepsy, including immunological aspects, but demonstrates a clear potential role for glutamate.

      Strengths:

      - The authors examine not only T. solium homogenate, but also excretory/secretory products which suggests glutamate may play a role in multiple aspects of disease progression.<br /> - The authors confirm that the human relevant pathogen also causes neuronal depolarization in human brain tissue<br /> - There is very high clinical relevance. Preventing epileptogenesis/seizures possibly with Glu-R antagonists or by more actively removing glutamate as a second possible treatment approach in addition to/replacing post-infection immune response.<br /> - Effects are consistent across multiple species (rat, mouse, human) and methodological assays (GluSnFR AND current clamp recordings AND Ca imaging)<br /> - High K content (comparable levels to high-K seizure models) of larvae could have also caused depolarization. Adequate experiments to exclude K and other suspected larvae contents (i.e. Substance P).

      Weaknesses:

      - Acute study is limited to studying depolarization in slices and it is unclear what is necessary/sufficient for in vivo seizure generation or epileptogenesis for chronic epilepsy.<br /> - There is likely a significant role of the immune system that is not explored here. This issue is adequately addressed in the discussion, however, and the glutamate data is considered in this context.<br /> Discuss impact:<br /> - Interfering with peri-larval glutamate signaling may hold promise to prevent ictogenesis and chronic epileptogenesis as this is a very understudied cause of epilepsy with unknown mechanistic etiology.<br /> Additional context for interpreting significance:<br /> - High medical need as most common adult onset epilepsy in many parts of the world

    3. Reviewer #2 (Public review):

      Since neurocysticercosis is associated with epilepsy, the authors wish to establish how cestode larvae affect neurons. The underlying hypothesis is that the larvae may directly excite neurons and thus favor seizure genesis.

      To test this hypothesis, the authors collected biological materials from larvae (from either homogenates or excretory/secretory products), and applied them to hippocampal neurons (rats and mice) and human cortical neurons.

      This constitutes a major strength of the paper, providing a direct reading of larvae's biological effects. Another strength is the combination of methods, including patch clamp, Ca, and glutamate imaging.

      Comments on revised version:

      The concerns have been addressed.

    4. Reviewer #3 (Public review):

      This paper has high significance because it addresses a prevalent parasitic infection of the nervous system, Neurocysticercosis (NCC). The infection is caused by larvae of the parasitic cestode Taenia solium It is a leading cause of epilepsy in adults worldwide

      To address the effects of cestode larvae, homogenates and excretory/secretory products of larvae were added to organotypic brain slice cultures of rodents or layer 2/3 of human cortical brain slices from patients with refractory epilepsy.

      A self-made pressure ejection system was used to puff larvae homogenate (20 ms puff) onto the soma of patched neurons. The mechanical force could have caused depolarizaton so a vehicle control is critical. On line 150 they appear to have used saline in this regard, and clarification would be good. Were the controls here (and aCSF elsewhere) done with the low Mg2+o aCSF like the larvae homogenates?

      They found that neurons depolarized after larvae homogenate exposure and the effect was mediated by glutamate but not nicotinic receptors for acetylcholine (nAChRs), acid-sensing channels or substance P.

      They also showed the elevated K+ in the homogenate (~11 mM) could not account for the depolarization. They also confirmed that only small molecules led to the depolarization after filtering out very large molecules. That supports the conclusion that glutamate - which is quite small - could be responsible.

      They suggest the effects could underlie seizure generation in NCC.

      Using Glutamate-sensing fluorescent reporters they found the larvae contain glutamate and can release it, a strength of the paper.

    5. Author response:

      The following is the authors’ response to the original reviews.

      Public Reviews:

      Reviewer #1 (Public Review):

      In the manuscript, the authors explore the mechanism by which Taenia solium larvae may contribute to human epilepsy. This is extremely important question to address because T. solium is a significant cause of epilepsy and is extremely understudied. Advances in determining how T. solium may contribute to epilepsy could have significant impact on this form of epilepsy. Excitingly, the authors convincingly show that Taenia larvae contain and release glutamate sufficient to depolarize neurons and induce recurrent excitation reminiscent of seizures. They use a combination of cutting-edge tools including electrophysiology, calcium and glutamate imaging, and biochemical approaches to demonstrate this important advance. They also show that this occurs in neurons from both mice and humans. This is relevant for pathophysiology of chronic epilepsy development. This study does not rule out other aspects of T. solium that may also contribute to epilepsy, including immunological aspects, but demonstrates a clear potential role for glutamate.

      Strengths:

      - The authors examine not only T. solium homogenate, but also excretory/secretory products which suggests glutamate may play a role in multiple aspects of disease progression.

      - The authors confirm that the human relevant pathogen also causes neuronal depolarization in human brain tissue

      - There is very high clinical relevance. Preventing epileptogenesis/seizures possibly with Glu-R antagonists or by more actively removing glutamate as a second possible treatment approach in addition to/replacing post-infection immune response.

      - Effects are consistent across multiple species (rat, mouse, human) and methodological assays (GluSnFR AND current clamp recordings AND Ca imaging)

      - High K content (comparable levels to high-K seizure models) of larvae could have also caused depolarization. Adequate experiments to exclude K and other suspected larvae contents (i.e. Substance P).

      Weaknesses:

      - Acute study is limited to studying depolarization in slices and it is unclear what is necessary/sufficient for in vivo seizure generation or epileptogenesis for chronic epilepsy. - There is likely a significant role of the immune system that is not explored here. This issue is adequately addressed in the discussion, however, and the glutamate data is considered in this context.

      Discuss impact:

      - Interfering with peri-larval glutamate signaling may hold promise to prevent ictogenesis and chronic epileptogenesis as this is a very understudied cause of epilepsy with unknown mechanistic etiology.

      Additional context for interpreting significance:

      - High medical need as most common adult onset epilepsy in many parts of the world

      We thank Reviewer 1 for their positive and thorough assessment of our manuscript. We have elected to respond to and address the following aspects from their “Recommendations For The Authors” below:

      Reviewer #1 (Recommendations For The Authors):

      Additional experiments/analysis:

      -   Fig 4a-c: Larva on a slice and not next to it? Negative results maybe because its E/S products are just washed away (assuming submerged recording chamber/conditions)? Experiments and negative results described here do not seem conclusive. Should be discussed at least?

      We agree with the reviewer and have added the following sentence to the relevant section of the Results: ‘Our submerged recording setup might have led to swift diffusion or washout of released glutamate, possibly explaining the lack of observable changes.’

      Writing & presentation:

      - Data is not always reported consistently in text and figures, examples:

      - Results in text are reported varyingly without explanation:

      - Mean and/or median? SEM or SD and/or IQR? Stat info included in text or not? i.e. lines 130/131 vs. 160/161

      Results and data are now presented in a more uniform fashion. We report medians and IQRs, sample size, statistical test result, statistical test used in that order.

      - Larval release data interrupts reading flow, lines 246-252 double up results presented in Fig 5F.

      This section has now been significantly abbreviated and reads as follows: ‘T. crassiceps larvae released a relatively constant median daily amount of glutamate, ranging from 41.59 – 60.15 ug/20 larvae, which showed no statistically significant difference across days one to six. Similarly, T. crassiceps larvae released a relatively constant median daily amount of aspartate, ranging from 9.431 – 14.18 ug/20 larvae, which showed no statistically significant difference across days one to six.’

      - Results in figures are reported in different styles:

      Results have now been made uniform, reporting medians and IQRs and: sample size, p test result, statistical test used, figure # reported in that order.

      - Fig 6: E/S glu concentration seems to be significantly higher in solium vs crassiceps (about 6fold higher in solium). Should be discussed at least.

      Given the small sample size from T. solium (see response below), we do not draw attention to this difference and instead simply make the point that T. solium larvae contain and release glutamate.

      - In this context - N=1 may be sufficient for proof of principle (release) but seems too small of a cohort to describe non-constant release of glu over days (Fig 6D). Is initial release on day 1, no release and recovery in the following days reproducible? Is very high glu content of E/S content (15-fold higher in comparison to solium homogenate AND 6-fold higher in comparison to crassiceps homogenate and E/S content). Not sure if Fig 6D is adding relevant information, especially since it is based on n = 1

      We agree that a N=1 is only sufficient for proof of principle. However it is worth noting that the measurements still reflect the cumulative release from 20 larvae. Nonetheless, the statement in text has been simplified to say: ‘These results demonstrate that T. solium larvae continually release glutamate and aspartate into their immediate surroundings.’ As this focusses on the point that the larvae release glutamate and aspartate continuously and that we can’t draw conclusions about the variability over days.

      Methods:

      - Human slices, mention cortex - what part, patient data would be interesting. I.e. etiology of epilepsy, epilepsy duration 

      In the Materials and Methods section “Brain slice preparation” we have now added a table with the requested information.

      - For Taenia solium: How were they acquired and used in these experiments?

      In the Materials and Methods section “Taenia maintenance and preparation of whole cyst homogenates and E/S products” we describe how Taenia solium larvae were acquired and used.

      - Was access resistance monitored? Add exclusion criteria for patch experiments

      Figure supplement tables containing the basic properties for each cell recording have been added for each figure and the following statements were added to the electrophysiology section of the Methods: ‘Basic properties of each cell were recorded (supplementary files 1, 2, 3, 4, 6).’ and ‘Cells were excluded from analyses if the Ra was greater than 80 Ω or if the resting membrane potential was above –40 mV.’  

      - Cannot see any reference to mouse slices in methods? Also, mouse organotypic cultures (for AAV?)? Or only acute slices from mice and organotypic hip cultures from rats? Seems to have been mouse and rat organotypic cultures? But not clear with further clarification in methods.

      We have now added the following clarification to the methods: ‘For experiments using calcium and glutamate imaging mouse hippocampal organotypic brain slices were used. For all other experiments rat hippocampal organotypic brain slices were used. A subset of experiments used acute human cortical brain slices and are specified.’

      - How long after the wash-in phase was the wash-out phase data collected?

      For wash-in recordings drugs were washed in for 8 mins before recordings were made. Drugs were washed out for at least 8 mins before wash-out recordings were made. This information has been added to the Materials and Methods section.

      - In general, the M&M section seems to have been written hastily - author's internal remarks "supplier?" are still present.

      The M&M section has been thoroughly proofread for errors and internal remarks removed or corrected.

      - A little more information on the clinical subjects would be appreciated. I.e. duration of epilepsy? Localization? What cortex? Usual temporal lobe or other regions?

      We have now added a table with this information to the Materials and Methods section “Brain slice preparation”.

      Minor corrections text/figures:

      - i.e. 3D,F,H,J show individual data points, thats great, but maybe add mean/median marker (as results are reported like this in text)  like in fig 4G,I and others

      Figures 3D,F,H & J have been revised to include median and IQR.

      - Only one patient mentioned in acknowledgements, but 2 in methods and text

      We apologize for this oversight and now acknowledge both patients in the acknowledgements.

      - Fig 1 B-F individual puffs are described as increasing - consistent with cellular effects (1st puff depolarizes, 2nd puff elicits 1 AP, 3rd puff elicits AP burst)  However, dilution ratio of homogenate or puff concentrations are not mentioned (or potentially longer than 20 ms puffs for 2nd and 3rd stimulus?) in text or figures. Seems to be enough space to indicate in figure as well (i.e. multiple or thicker arrows for subsequent puffs or label with homogenate dilution/concentration in figure).

      We state in the results section associated with Fig. 1 that increasing the amount of homogenate delivered was achieved by increasing the pressure applied to the ejection system. We now include this information in the figure legend.

      - Figure legend describes 30 ms puff for Ca imaging whereas ephys data (from text) is 20 ms puff. Was Ca imaging performed in acute mouse hippocampal slices (as figure text suggests) or were those organotypic hippocampal cultures from mice?

      Ca2+  imaging was performed in mouse hippocampal organotypic brain slice cultures. The figure text for Fig. 1 E) states “widefield fluorescence image of neurons in the dentate gyrus of a mouse hippocampal organotypic brain slice culture expressing the genetically encoded Ca2+ reporter GCAMP6s...”

      - 11.4 mM K is reported for homogenate in text only. How variable is that? How many n? No SD reported in text and no individual data points reported since this experiment is not represented as a figure.

      This has been clarified in the text by adding (N = 1, homogenate prepared from >100 larvae).

      - Same results (effect of 11.4 mM K on Vm) described twice in one paragraph, compare lines 126-131 with 131-136.

      The repetition has been removed.

      - Line 182 - example for consistency: decide IQR or SD/SEM

      To improve consistency, we have changed to median and IQR throughout.

      - Neuronal recordings are reported as hippocampal pyramidal neurons (i.e. line 222) but some recordings were made from dentate granule cells - please clarify which neurons were recorded in ephys, ca imaging, GluSnFr imaging

      For each experiment we describe which type of neurons were recorded from. For rodent recordings these were hippocampal pyramidal neurons except in the case of the Ca2+ imaging example where the widefield recording was over the dentate gyrus subfield.

      - Line 309: "should" seems to be an extra word

      We have removed the word ‘should’ and made the sentence shorter and clearer. It now reads: ‘Given our finding that cestode larvae contain and release significant quantities of glutamate, it is possible that homeostatic mechanisms for taking up and metabolizing glutamate fail to compensate for larvalderived glutamate in the extracellular space. Therefore, similar glutamate-dependent excitotoxic and epileptogenic processes that occur in stroke, traumatic brain injury and CNS tumors are likely to also occur in NCC.’

      Reviewer #2 (Public Review):

      Since neurocysticercosis is associated with epilepsy, the authors wish to establish how cestode larvae affect neurons. The underlying hypothesis is that the larvae may directly excite neurons and thus favor seizure genesis.

      To test this hypothesis, the authors collected biological materials from larvae (from either homogenates or excretory/secretory products), and applied them to hippocampal neurons (rats and mice) and human cortical neurons.

      This constitutes a major strength of the paper, providing a direct reading of larvae's biological effects. Another strength is the combination of methods, including patch clamp, Ca, and glutamate imaging.

      We thank the Reviewer 2 for their review of the strength and weaknesses of our manuscript. We respond to the identified weaknesses below.

      There are some weaknesses:

      (1) The main one relates to the statement: "Together, these results indicate that T. crassiceps larvae homogenate results not just in a transient depolarization of cells in the immediate vicinity of application, but can also trigger a wave of excitation that propagates through the brain slice in both space and time. This demonstrates that T. crassiceps homogenate can initiate seizurelike activity under suitable conditions."

      The only "evidence" of propagation is an image at two time points. It is one experiment, and there is no quantification. Either increase n's and perform a quantification, or remove such a statement.

      We acknowledge that the data is from one experiment, with the intention of demonstrating that it is plausible for intense depolarization of a subset of neurons to result in the initiation and propagation of seizure-like activity to nearby neurons under suitable conditions. However, we agree that it is prudent to remove this statement and have done so.

      Likewise, there is no evidence of seizure genesis. A single cell recording is shown. The presence of a seizure-like event should be evaluated with field recordings.

      In this experiment the Ca2+ imaging demonstrates activity spreading from the site of the restricted homogenate puff to all surrounding neurons. Furthermore, the whole-cell recoding is typical of a slice wide seizure-like event.  

      (2) Control puff experiments are lacking for Fig 1. Would puffing ACSF also produce a depolarization, and even firing, as suggested in Fig. 2D? This is needed for at least one species.

      We agree and have added this data for the rat and mouse neuron in a new Figure 1-figure supplement 1.

      (3) What is the rationale to use a Cs-based solution? Even in the presence of TTX and with blocking K channels, the depolarization may be sufficient to activate Ca channels (LVGs), which would further contribute to the depolarization. Why not perform voltage clamp recordings to directly the current?

      The intention of the Cs-based solution was to block K+ channels and reduce the effect of moderately raised K+ in the homogenate to isolate the contribution of other causative agents of depolarization (i.e. glutamate / aspartate). We agree that performing voltage clamp recordings would have been useful for directly recording the currents responsible for depolarization. 

      (4) Why did you use organotypic slices? Since you wish to model adult epilepsy, it would have been more relevant to use fresh slices from adult rats/mice. At least, discuss the caveat of using a network still in development in vitro.

      Recordings were performed 6–14 days post culture, which is equivalent to postnatal Days (P) 12 to 22. Previous work has shown that neurons in the organotypic hippocampal brain slice are relatively mature (Gähwiler et al., 1997). For example they possess mature Cl- homeostasis mechanisms at this point, as evidenced by their hyperpolarizing EGABA (Raimondo et al., 2012).  

      (5) Please include both the number of slices and number of cells recorded in each condition. This is the standard (the number of cells is not enough).

      This has now been added to all relevant sections of the results text.  

      (6) Please provide a table with the basic properties of cells (Rin, Rs, etc.). This is standard to assess the quality of the recordings.

      Tables containing the basic properties for each cell recording have been created for each figure (as Figure supplements) and the following statement was added to the electrophysiology section of the Methods: ‘Basic properties of each cell were recorded (see Figure supplements).’

      (7) Please provide a table on patient's profile. This is standard when using human material. Were these TLE cases (and "control" cortex) or epileptogenic cortex?

      We have now added a basic table on the patient’s profiles to the Materials and Methods section.

      Globally, the authors achieved their aims. They show convincingly that larvae material can depolarize neurons, with glutamate (and aspartate) as the most likely candidates.

      This is important not only because it provides mechanistic insight but also potential therapeutic targets. The result is impactful, as the authors use quasi-naturalistic conditions, to assess what might happen in the human brain. The experimental design is appropriate to address the question. It can be replicated by any interested person.

      We thank the Reviewer 2 for their enthusiastic and constructive assessment of our manuscript. We have elected to respond to and address the following aspects from their “Recommendations For The Authors” below:

      Reviewer #2 (Recommendations For The Authors):

      lines 132 and following are a repetition of those above

      These have been removed.

      line 151 Fig "2" missing

      This has been added.

      187, 190 should be E, F not C, D

      This has been changed in the text.  

      481, 482 supplier?

      This has been corrected and the correct suppliers described.

      Reviewer #3 (Public Review):

      This paper has high significance because it addresses a prevalent parasitic infection of the nervous system, Neurocysticercosis (NCC). The infection is caused by larvae of the parasitic cestode Taenia solium It is a leading cause of epilepsy in adults worldwide

      To address the effects of cestode larvae, homogenates and excretory/secretory products of larvae were added to organotypic brain slice cultures of rodents or layer 2/3 of human cortical brain slices from patients with refractory epilepsy.

      We thank Reviewer 3 for their helpful comments and suggestions for improvement which we address below.

      A self-made pressure ejection system was used to puff larvae homogenate (20 ms puff) onto the soma of patched neurons. The mechanical force could have caused depolarizaton so a vehicle control is critical. On line 150 they appear to have used saline in this regard, and clarification would be good. Were the controls here (and aCSF elsewhere) done with the low Mg2+o aCSF like the larvae homogenates?

      We agree and have added examples where aCSF alone was pressure ejected onto the same rat and mouse neurons in a new Figure 1-figure supplement 1. In Figure 1, the same aCSF as that was used to bathe the slices was used. In Figure 2D-G, either PBS (which larval homogenates were prepared in) or growth medium (which contain larval E/S products) were used as comparative controls.

      They found that neurons depolarized after larvae homogenate exposure and the effect was mediated by glutamate but not nicotinic receptors for acetylcholine (nAChRs), acid-sensing channels or substance P. To address nAChRs, they used 10uM mecamyline, and for ASICs 2mM amiloride which seems like a high concentration. Could the concentrations be confirmed for their selectivity? 

      We did not independently verify the selectivity of the antagonist concentrations used in our study. However, the persistence of depolarizations despite the use of high concentrations of mecamylamine (10 μM) and amiloride (2 mM) provides strong evidence that neither nAChRs nor ASICs are primarily responsible for mediating these responses. The high concentrations used, while potentially raising concerns about specificity, actually strengthen our conclusion that these receptor types are not involved in the observed effect.

      Glutamate receptor antagonists, used in combination, were 10uM CNQX, 50uM DAP5, and 2mM kynurenic acid. These concentrations are twice what most use. Please discuss. 

      We intentionally used higher-than-typical concentrations of glutamate receptor antagonists in our experimental design. Our rationale for this approach was to ensure maximal blockade of glutamate receptors, thereby minimizing the possibility of residual receptor activity confounding our results.

      Also, it would be very interesting to know if the glutamate receptor is AMPA, Kainic acid, or NMDA. Were metabotropic antagonists ever tested? That would be logical because CNQX/DAPR/Kynurenic acid did not block all of the depolarization.

      We appreciate the reviewer's interest in the specific glutamate receptor subtypes involved in our study. Our research primarily focused on ionotropic glutamate receptors as a group, without differentiating the individual contributions of AMPA, Kainate, and NMDA receptors. This approach, while broad, allowed us to establish the involvement of glutamatergic signalling in the observed effects. We acknowledge that we did not investigate metabotropic glutamate receptors in this study. Importantly, we demonstrate later in our manuscript that the larval products contain both glutamate and aspartate. Therefore the precise nature of the glutamate-dependent depolarization observed using a particular experimental preparation would depend on the specific types of neurons exposed to the homogenate and the expression profile of different glutamate receptor subtypes on these neurons.

      They also showed the elevated K+ in the homogenate (~11 mM) could not account for the depolarization. However, the experiment with K+ was not done in a low Mg2+o buffer (Or was it -please clarify). 

      The experiment where 11.39 mM K+ as well as the experiment with T. crass. Homogenate with a cesium internal and added TTX were all done in standard 2 mM Mg2+ containing aCSF.

      They also confirmed that only small molecules led to the depolarization after filtering out very large molecules. That supports the conclusion that glutamate - which is quite small - could be responsible. It is logical to test substance P because the Intro points out prior work links the larvae and seizures by inflammation and implicates substance P. However, why focus on nAChRs and ASIC?

      These were chosen as they are ionotropic receptors which mediate depolarization and hence could conceivably be responsible for the homogenate-induced depolarization we observed.

      The depolarizations caused seizure-like events in slices. The slices were exposed to a proconvulant buffer though- low Mg2+o. This buffer can cause spontaneous seizure-like events so it is important to know what the buffer did alone.

      We agree that a low M2+ buffer solution can elicit seizure-like events in organotypic slices alone. However, the timing of the onset of the seizure-like event in the example presented in Figure 1 strongly suggests that it was triggered by the T. crass homogenate puff. Nonetheless, on the suggestion of the other reviewers we have reduced emphasis on our experimental evidence for the ability of T. crass. homogenate to illicit seizure-like events.  

      They suggest the effects could underlie seizure generation in NCC. However, there is only one event that is seizure-like in the paper and it is just an inset. Were others similar? How frequency were they? How long?

      Please see the response above as well as our response to Reviewer 1 who raised a similar concern.

      Using Glutamate-sensing fluorescent reporters they found the larvae contain glutamate and can release it, a strength of the paper.

      Fig. 4. Could an inset be added to show the effects are very fast? That would support an effect of glutamate.

      We have not added an inset. However, given the scale bar (500 ms) for the trace provided, the response is very fast.  

      Why is aspartate relatively weak and glutamate relatively effective as an agonist?

      Glutamate generally has a higher affinity for glutamate receptors compared to aspartate. This is particularly true for AMPA and kainate receptors, where glutamate is the primary endogenous agonist. Similarly iGluSnFR has a higher sensitivity for glutamate over aspartate (Marvin et al., 2013).

      Could some of the variability in Fig 4G be due to choice of different cell types? That would be consistent with Fig 5B where only a fraction of cells in the culture showed a response to the larvae nearby. 

      Whilst differences in cell types could contribute to the variability in Fig 4G, all the responses were recorded from hippocampal pyramidal neurons and hence it is more likely that the variability is a function of other sources of variation including differences in iGluSnFR expression, depth of the cell imaged, the proximity of the puffer pipette etc. In Fig. 5B we think the lack of response may be due to the fact that any released glutamate by the live larvae was not able reach the iGluSnFR neurons at sufficient concentrations due to the nature of our submerged recording setup. We have added the following sentence to the results. ‘Our submerged recording setup might have led to swift diffusion or washout of released glutamate, possibly explaining the lack of observable changes.’

      On what basis was the ROI drawn in Fig. 5B.

      The ROI drawn in Fig. 5B was selected to include all iGluSnFR expressing neurons in the brain slice. which were captured in the field of view.

      Also in 5B, I don't see anything in the transmitted image. What should be seen exactly?

      We agree that it is difficult to resolve much in the transmitted image. However, both the brain slice on the left as well as a T. crass. larva on the right is visible and outlined with a green or orange dashed line respectively.

      Human brain slices were from temporal cortex of patients with refractory epilepsy. Was the temporal cortex devoid of pathology and EEG abnormalities? This area may be quite involved in the epilepsy because refractory epilepsy that goes to surgery is often temporal lobe epilepsy. Please discuss the limitations of studying the temporal cortex of humans with epilepsy since it may be more susceptible to depolarizations of many kinds, not just larvae.

      We acknowledge the important limitations of using temporal cortex tissue from patients with refractory epilepsy. While we aimed to use visually normal tissue, we recognize that the tissue may have underlying pathology or functional abnormalities not visible to the naked eye. It may also be more susceptible to induced depolarizations due to epilepsy-related changes in neuronal excitability. Despite these limitations, we believe our human tissue data still provides valuable data that the larval homogenates can induce depolarization in human as well as rodent neurons.  

      Please discuss the limitations of the cultures - they are from very young animals and cultured for 6-14 days.

      We acknowledge the potential limitations of our experimental model using organotypic hippocampal slice cultures from young animals. The use of relatively immature tissue may not fully represent the adult nervous system due to developmental differences in receptor expression, synaptic connections, and network properties. The 6-14 day culture period, while allowing some maturation, may induce changes that differ from the in vivo environment, including alterations in cellular physiology and network reorganization. Despite these limitations, this model provides a valuable balance between preserved local circuitry and experimental accessibility. Future studies comparing results with acute adult slices and in vivo models would be beneficial to validate and extend our findings.

      References:

      Gähwiler, B.H. et al. (1997) ‘Organotypic slice cultures: a technique has come of age.’, Trends in neurosciences, 20(10), pp. 471–7.

      Marvin, J.S. et al. (2013) ‘An optimized fluorescent probe for visualizing glutamate neurotransmission.’, Nature methods, 10(2), pp. 162–70. Available at: https://doi.org/10.1038/nmeth.2333.

      Raimondo, J.V. et al. (2012) ‘Optogenetic silencing strategies differ in their effects on inhibitory synaptic transmission.’, Nat. Neurosci., 15(8), pp. 1102–4. Available at: https://doi.org/10.1038/nn.3143.

    1. eLife Assessment

      This study presents a valuable new method for probing the DNA and proteins associated with targeted genomic elements in cells. The authors present solid evidence that the method can map DNA-DNA interactions for individual loci and can detect enriched proteins at repetitive DNA loci such as telomeres, but benchmarks of the method's resolution and specificity remain incomplete. The methodological details of this study will be of particular interest and utility to chromatin biologists.

    2. Reviewer #1 (Public review):

      Summary:

      The authors describe a method to probe both the proteins associated with genomic elements in cells, as well as 3D contacts between sites in chromatin. The approach is interesting and promising, and it is great to see a proximity labeling method like this that can make both proteins and 3D contacts. It utilizes DNA oligomers, which will likely make it a widely adopted method. However, the manuscript over-interprets its successes, which are likely due to the limited appropriate controls, and of any validation experiments. I think the study requires better proteomic controls, and some validation experiments of the "new" proteins and 3D contacts described. In addition, toning down the claims made in the paper would assist those looking to implement one of the various available proximity labeling methods and would make this manuscript more reliable to non-experts.

      Strengths:

      (1) The mapping of 3D contacts for 20 kb regions using proximity labeling is beautiful.

      (2) The use of in situ hybridization will probably improve background and specificity.

      (3) The use of fixed cells should prove enabling and is a strong alternative to similar, living cell methods.

      Weaknesses:

      (1) A major drawback to the experimental approach of this study is the "multiplexed comparisons". Using the mtDNA as a comparator is not a great comparison - there is no reason to think the telomeres/centrosomes would look like mtDNA as a whole. The mito proteome is much less complex. It is going to provide a large number of false positives. The centromere/telomere comparison is ok, if one is interested in what's different between those two repetitive elements. But the more realistic use case of this method would be "what is at a specific genomic element"? A purely nuclear-localized control would be needed for that. Or a genomic element that has nothing interesting at it (I do not know of one). You can see this in the label-free work: non-specific, nuclear GO terms are enriched likely due to the random plus non-random labeling in the nucleus. What would a Telo vs general nucleus GSEA look like? (GSEA should be used for quantitative data, no GO). That would provide some specificity. Figures 2G and S4A are encouraging, but a) these proteins are largely sequestered in their respective locations, and b) no validation by an orthogonal method like ChIP or Cut and Run/Tag is used.

      You can also see this in the enormous number of "enriched" proteins in the supplemental volcano plots. The hypothesis-supporting ones are labeled, but do the authors really believe all of those proteins are specific to the loci being looked at? Maybe compared to mitochondria, but it's hard to believe there are not a lot of false positives in those blue clouds. I believe the authors are more seeing mito vs nucleus + Telo than the stated comparison. For example, if you have no labeling in the nucleus in the control (Figures 1C and 2C) you cannot separate background labeling from specific labeling. Same with mito vs. nuc+Telo. It is not the proper control to say what is specifically at the Telo.

      I would like to see a Telo vs nuclear control and a Centromere vs nuc control. One could then subtract the background from both experiments, then contrast Telo vs Cent for a proper, rigorous comparison. However, I realize that is a lot of work, so rewriting the manuscript to better and more accurately reflect what was accomplished here, and its limitations, would suffice.

      (2) A second major drawback is the lack of validation experiments. References to literature are helpful but do not make up for the lack of validation of a new method claiming new protein-DNA or DNA-DNA interactions. At least a handful of newly described proximal proteins need to be validated by an orthogonal method, like ChIP qPCR, other genomic methods, or gel shifts if they are likely to directly bind DNA. It is ok to have false positives in a challenging assay like this. But it needs to be well and clearly estimated and communicated.

      (3) The mapping of 3D contacts for 20 kb regions is beautiful. Some added discussion on this method's benefits over HiC-variants would be welcomed.

      (4) The study claims this method circumvents the need for transfectable cells. However, the authors go on to describe how they needed tons of cells, now in solution, to get it to work. The intro should be more in line with what was actually accomplished.

      (5) Comments like "Compared to other repetitive elements in the human genome...." appear to circumvent the fact that this method is still (apparently) largely limited to repetitive elements. Other than Glopro, which did analyze non-repetitive promoter elements, most comparable methods looked at telomeres. So, this isn't quite the advancement you are implying. Plus, the overlap with telomeric proteins and other studies should be addressed. However, that will be challenging due to the controls used here, discussed above.

    3. Reviewer #2 (Public review):

      Summary

      Liu and MacGann et al. introduce the method DNA O-MAP that uses oligo-based ISH probes to recruit horseradish peroxidase for targeted proximity biotinylation at specific DNA loci. The method's specificity was tested by profiling the proteomic composition at repetitive DNA loci such as telomeres and pericentromeric alpha satellite repeats. In addition, the authors provide proof-of-principle for the capture and mapping of contact frequencies between individual DNA loop anchors.

      Strengths

      Identifying locus-specific proteomes still represents a major technical challenge and remains an outstanding issue (1). Theoretically, this method could benefit from the specificity of ISH probes and be applied to identify proteomes at non-repetitive DNA loci. This method also requires significantly fewer cells than other ISH- or dCas9-based locus-enrichment methods. Another potential advantage to be tested is the lack of cell line engineering that allows its application to primary cell lines or tissue.

      Weaknesses

      The authors indicate that DNA O-MAP is superior to other methods for identifying locus-specific proteomes. Still, no proof exists that this method could uncover proteomes at non-repetitive DNA loci. Also, there is very little validation of novel factors to confirm the superiority of the technique regarding specificity.<br /> The authors first tested their method's specificity at repetitive telomeric regions, and like other approaches, expected low-abundant telomere-specific proteins were absent (for example, all subunits of the telomerase holoenzyme complex). Detecting known proteins while identifying noncanonical and unexpected protein factors with high confidence could indicate that DNA O-MAP does not fully capture biologically crucial proteins due to insufficient enrichment of locus-specific factors. The newly identified proteins in Figure 1E might still be relevant, but independent validation is missing entirely. In my opinion, the current data cannot be interpreted as successfully describing local protein composition.

      Finally, the authors could have discussed the limitations of DNA O-MAP and made a fair comparison to other existing methods (2-5). Unlike targeted proximity biotinylation methods, DNA O-MAP requires paraformaldehyde crosslinking, which has several disadvantages. For instance, transient protein-protein interactions may not be efficiently retained on crosslinked chromatin. Similarly, some proteins may not be crosslinked by formaldehyde and thus will be lost during preparation (6).

      (1) Gauchier M, van Mierlo G, Vermeulen M, Dejardin J. Purification and enrichment of specific chromatin loci. Nat Methods. 2020;17(4):380-9.<br /> (2) Dejardin J, Kingston RE. Purification of proteins associated with specific genomic Loci. Cell. 2009;136(1):175-86.<br /> (3) Liu X, Zhang Y, Chen Y, Li M, Zhou F, Li K, et al. In Situ Capture of Chromatin Interactions by Biotinylated dCas9. Cell. 2017;170(5):1028-43 e19.<br /> (4) Villasenor R, Pfaendler R, Ambrosi C, Butz S, Giuliani S, Bryan E, et al. ChromID identifies the protein interactome at chromatin marks. Nat Biotechnol. 2020;38(6):728-36.<br /> (5) Santos-Barriopedro I, van Mierlo G, Vermeulen M. Off-the-shelf proximity biotinylation for interaction proteomics. Nat Commun. 2021;12(1):5015.<br /> (6) Schmiedeberg L, Skene P, Deaton A, Bird A. A temporal threshold for formaldehyde crosslinking and fixation. PLoS One. 2009;4(2):e4636.

    4. Reviewer #3 (Public review):

      Significance of the Findings:

      The study by Liu et al. presents a novel method, DNA-O-MAP, which combines locus-specific hybridisation with proximity biotinylation to isolate specific genomic regions and their associated proteins. The potential significance of this approach lies in its purported ability to target genomic loci with heightened specificity by enabling extensive washing prior to the biotinylation reaction, theoretically improving the signal-to-noise ratio when compared with other methods such as dCas9-based techniques. Should the method prove successful, it could represent a notable advancement in the field of chromatin biology, particularly in establishing the proteomes of individual chromatin regions - an extremely challenging objective that has not yet been comprehensively addressed by existing methodologies.

      Strength of the Evidence:

      The evidence presented by the authors is somewhat mixed, and the robustness of the findings appears to be preliminary at this stage. While certain data indicate that DNA-O-MAP may function effectively for repetitive DNA regions, a number of the claims made in the manuscript are either unsupported or require further substantiation. There are significant concerns about the resolution of the method, with substantial biotinylation signals extending well beyond the intended target regions (megabases around the target), suggesting a lack of specificity and poor resolution, particularly for smaller loci. Furthermore, comparisons with previous techniques are unfounded since the authors have not provided direct comparisons with the same mass spectrometry (MS) equipment and protocols. Additionally, although the authors assert an advantage in multiplexing, this claim appears overstated, as previous methods could achieve similar outcomes through TMT multiplexing. Therefore, while the method has potential, the evidence requires more rigorous support, comprehensive benchmarking, and further experimental validation to demonstrate the claimed improvements in specificity and practical applicability.

    5. Author response:

      Public Reviews:

      Reviewer #1 (Public review):

      Summary:

      The authors describe a method to probe both the proteins associated with genomic elements in cells, as well as 3D contacts between sites in chromatin. The approach is interesting and promising, and it is great to see a proximity labeling method like this that can make both proteins and 3D contacts. It utilizes DNA oligomers, which will likely make it a widely adopted method. However, the manuscript over-interprets its successes, which are likely due to the limited appropriate controls, and of any validation experiments. I think the study requires better proteomic controls, and some validation experiments of the "new" proteins and 3D contacts described. In addition, toning down the claims made in the paper would assist those looking to implement one of the various available proximity labeling methods and would make this manuscript more reliable to non-experts.

      Strengths:

      (1) The mapping of 3D contacts for 20 kb regions using proximity labeling is beautiful.

      (2) The use of in situ hybridization will probably improve background and specificity.

      (3) The use of fixed cells should prove enabling and is a strong alternative to similar, living cell methods.

      Weaknesses:

      (1) A major drawback to the experimental approach of this study is the "multiplexed comparisons". Using the mtDNA as a comparator is not a great comparison - there is no reason to think the telomeres/centrosomes would look like mtDNA as a whole. The mito proteome is much less complex. It is going to provide a large number of false positives. The centromere/telomere comparison is ok, if one is interested in what's different between those two repetitive elements. But the more realistic use case of this method would be "what is at a specific genomic element"? A purely nuclear-localized control would be needed for that. Or a genomic element that has nothing interesting at it (I do not know of one). You can see this in the label-free work: non-specific, nuclear GO terms are enriched likely due to the random plus non-random labeling in the nucleus. What would a Telo vs general nucleus GSEA look like? (GSEA should be used for quantitative data, no GO). That would provide some specificity. Figures 2G and S4A are encouraging, but a) these proteins are largely sequestered in their respective locations, and b) no validation by an orthogonal method like ChIP or Cut and Run/Tag is used.

      You can also see this in the enormous number of "enriched" proteins in the supplemental volcano plots. The hypothesis-supporting ones are labeled, but do the authors really believe all of those proteins are specific to the loci being looked at? Maybe compared to mitochondria, but it's hard to believe there are not a lot of false positives in those blue clouds. I believe the authors are more seeing mito vs nucleus + Telo than the stated comparison. For example, if you have no labeling in the nucleus in the control (Figures 1C and 2C) you cannot separate background labeling from specific labeling. Same with mito vs. nuc+Telo. It is not the proper control to say what is specifically at the Telo.

      I would like to see a Telo vs nuclear control and a Centromere vs nuc control. One could then subtract the background from both experiments, then contrast Telo vs Cent for a proper, rigorous comparison. However, I realize that is a lot of work, so rewriting the manuscript to better and more accurately reflect what was accomplished here, and its limitations, would suffice.

      (2) A second major drawback is the lack of validation experiments. References to literature are helpful but do not make up for the lack of validation of a new method claiming new protein-DNA or DNA-DNA interactions. At least a handful of newly described proximal proteins need to be validated by an orthogonal method, like ChIP qPCR, other genomic methods, or gel shifts if they are likely to directly bind DNA. It is ok to have false positives in a challenging assay like this. But it needs to be well and clearly estimated and communicated.

      (3) The mapping of 3D contacts for 20 kb regions is beautiful. Some added discussion on this method's benefits over HiC-variants would be welcomed.

      (4) The study claims this method circumvents the need for transfectable cells. However, the authors go on to describe how they needed tons of cells, now in solution, to get it to work. The intro should be more in line with what was actually accomplished.

      (5) Comments like "Compared to other repetitive elements in the human genome...." appear to circumvent the fact that this method is still (apparently) largely limited to repetitive elements. Other than Glopro, which did analyze non-repetitive promoter elements, most comparable methods looked at telomeres. So, this isn't quite the advancement you are implying. Plus, the overlap with telomeric proteins and other studies should be addressed. However, that will be challenging due to the controls used here, discussed above.

      We thank the Reviewer for their careful reading of manuscript and constructive suggestions. We plan to substantially revise the framing and presentation of manuscript to address the concerns raised by all three reviewers.

      Reviewer #2 (Public review):

      Summary

      Liu and MacGann et al. introduce the method DNA O-MAP that uses oligo-based ISH probes to recruit horseradish peroxidase for targeted proximity biotinylation at specific DNA loci. The method's specificity was tested by profiling the proteomic composition at repetitive DNA loci such as telomeres and pericentromeric alpha satellite repeats. In addition, the authors provide proof-of-principle for the capture and mapping of contact frequencies between individual DNA loop anchors.

      Strengths

      Identifying locus-specific proteomes still represents a major technical challenge and remains an outstanding issue (1). Theoretically, this method could benefit from the specificity of ISH probes and be applied to identify proteomes at non-repetitive DNA loci. This method also requires significantly fewer cells than other ISH- or dCas9-based locus-enrichment methods. Another potential advantage to be tested is the lack of cell line engineering that allows its application to primary cell lines or tissue.

      Weaknesses

      The authors indicate that DNA O-MAP is superior to other methods for identifying locus-specific proteomes. Still, no proof exists that this method could uncover proteomes at non-repetitive DNA loci. Also, there is very little validation of novel factors to confirm the superiority of the technique regarding specificity.

      The authors first tested their method's specificity at repetitive telomeric regions, and like other approaches, expected low-abundant telomere-specific proteins were absent (for example, all subunits of the telomerase holoenzyme complex). Detecting known proteins while identifying noncanonical and unexpected protein factors with high confidence could indicate that DNA O-MAP does not fully capture biologically crucial proteins due to insufficient enrichment of locus-specific factors. The newly identified proteins in Figure 1E might still be relevant, but independent validation is missing entirely. In my opinion, the current data cannot be interpreted as successfully describing local protein composition.

      Finally, the authors could have discussed the limitations of DNA O-MAP and made a fair comparison to other existing methods (2-5). Unlike targeted proximity biotinylation methods, DNA O-MAP requires paraformaldehyde crosslinking, which has several disadvantages. For instance, transient protein-protein interactions may not be efficiently retained on crosslinked chromatin. Similarly, some proteins may not be crosslinked by formaldehyde and thus will be lost during preparation (6).

      (1) Gauchier M, van Mierlo G, Vermeulen M, Dejardin J. Purification and enrichment of specific chromatin loci. Nat Methods. 2020;17(4):380-9.

      (2) Dejardin J, Kingston RE. Purification of proteins associated with specific genomic Loci. Cell. 2009;136(1):175-86.

      (3) Liu X, Zhang Y, Chen Y, Li M, Zhou F, Li K, et al. In Situ Capture of Chromatin Interactions by Biotinylated dCas9. Cell. 2017;170(5):1028-43 e19.

      (4) Villasenor R, Pfaendler R, Ambrosi C, Butz S, Giuliani S, Bryan E, et al. ChromID identifies the protein interactome at chromatin marks. Nat Biotechnol. 2020;38(6):728-36.

      (5) Santos-Barriopedro I, van Mierlo G, Vermeulen M. Off-the-shelf proximity biotinylation for interaction proteomics. Nat Commun. 2021;12(1):5015.

      (6) Schmiedeberg L, Skene P, Deaton A, Bird A. A temporal threshold for formaldehyde crosslinking and fixation. PLoS One. 2009;4(2):e4636.

      We thank the Reviewer for their constructive feedback on our work. As noted above, we plan to substantially revise the framing and presentation of manuscript to address the concerns raised by all three reviewers.

      Reviewer #3 (Public review):

      Significance of the Findings:

      The study by Liu et al. presents a novel method, DNA-O-MAP, which combines locus-specific hybridisation with proximity biotinylation to isolate specific genomic regions and their associated proteins. The potential significance of this approach lies in its purported ability to target genomic loci with heightened specificity by enabling extensive washing prior to the biotinylation reaction, theoretically improving the signal-to-noise ratio when compared with other methods such as dCas9-based techniques. Should the method prove successful, it could represent a notable advancement in the field of chromatin biology, particularly in establishing the proteomes of individual chromatin regions - an extremely challenging objective that has not yet been comprehensively addressed by existing methodologies.

      Strength of the Evidence:

      The evidence presented by the authors is somewhat mixed, and the robustness of the findings appears to be preliminary at this stage. While certain data indicate that DNA-O-MAP may function effectively for repetitive DNA regions, a number of the claims made in the manuscript are either unsupported or require further substantiation. There are significant concerns about the resolution of the method, with substantial biotinylation signals extending well beyond the intended target regions (megabases around the target), suggesting a lack of specificity and poor resolution, particularly for smaller loci. Furthermore, comparisons with previous techniques are unfounded since the authors have not provided direct comparisons with the same mass spectrometry (MS) equipment and protocols. Additionally, although the authors assert an advantage in multiplexing, this claim appears overstated, as previous methods could achieve similar outcomes through TMT multiplexing. Therefore, while the method has potential, the evidence requires more rigorous support, comprehensive benchmarking, and further experimental validation to demonstrate the claimed improvements in specificity and practical applicability.

      We thank the Reviewer for providing detailed critiques of our manuscript. As noted above, we plan to substantially revise the framing and presentation of manuscript to address the concerns raised by all three reviewers.

    1. eLife Assessment

      This valuable paper describes the crystal structure of a complex of Sld3-Cdc45-binding domain (CBD) with Cdc45, which is essential for the assembly of an active Cdc45- MCM-GINS (CMG) double hexamers at the replication origin. Although the results shown in the paper are of interest to researchers in DNA replication and genome stability, the biochemical analysis of protein-protein interaction and DNA binding is incomplete, and the paper needs additional data and revised discussion.

    2. Reviewer #1 (Public review):

      Summary:

      The crystal structure of the Sld3CBD-Cdc45 complex presented by Li et al. is a novel contribution that significantly advances our understanding of CMG formation during the rate-limiting step of DNA replication initiation. This structure provides insights into the intermediate steps of CMG formation. The study builds upon previously known structures of Sld3 and Cdc45 and offers new perspectives into how Cdc45 is loaded onto MCM DH through Sld3-Sld7. The most notable finding is the structural difference in Sld3CBD when bound to Cdc45, particularly the arrangement of the α8-helix, which is essential for Cdc45 binding and may also pertain to its metazoan counterpart, Treslin. Additionally, the conformational shift in the DHHA1 domain of Cdc45 suggests a possible mechanism for its binding to MCM2NTD.

      Strengths:

      The manuscript is generally well-written, with a precise structural analysis and a solid methodological section that will significantly advance future studies in the field. The predictions based on structural alignments are intriguing and provide a new direction for exploring CMG formation, potentially shaping the future of DNA replication research.

      Weaknesses:

      The main weakness of the manuscript lies in the lack of experimental validation for the proposed Sld3-Sld7-Cdc45 model. Specifically, the claim that Sld3 binding to Cdc45-MCM does not inhibit GINS binding, a finding that contradicts previous research, is not sufficiently substantiated with experimental evidence. To strengthen their model, the authors must provide additional experimental data to support this mechanism. Also, the authors have not compared the recently published Cryo-EM structures of the metazoan CMG helicases with their predicted models to see if Sld3/Treslin does not cause any clash with the GINS when bound to the CMG. Still, the work holds great potential in its current form but requires further experiments to confirm the authors' conclusions.

    3. Reviewer #2 (Public review):

      Summary

      The manuscript presents valuable findings, particularly in the crystal structure of the Sld3CBD-Cdc45 interaction and the identification of additional sequences involved in their binding. The modeling of the Sld7-Sld3CBD-CDC45 subcomplex is novel, and the results provide insights into potential conformational changes that occur upon interaction. However, the work remains incomplete as several main claims are only partially supported by experimental data, particularly the proposed model for Sld3 interaction with GINS on the CMG. Additionally, the single-stranded DNA binding data from different species do not convincingly advance the manuscript's central arguments.

      Strengths

      (1) The Sld3CBD-Cdc45 structure is a novel contribution, revealing critical residues involved in the interaction.

      (2) The model structures generated from the crystal data are well presented and provide valuable insights into the interaction sequences between Sld3 and Cdc45.

      (3) The experiments testing the requirements for interaction sequences are thorough and conducted well, with clear figures supporting the conclusions.

      (4) The conformational changes observed in Sld3 and Cdc45 upon binding are interesting and enhance our understanding of the interaction.

      (5) The modeling of the Sld7-Sld3CBD-CDC45 subcomplex is a new and valuable addition to the field.

      Weaknesses

      (1) The proposed model for Sld3 interacting with GINS on the CMG needs more experimental validation and conflicts with published findings. These discrepancies need more detailed discussion and exploration.

      (2) The section on the binding of Sld3 complexes to origin single-stranded DNA needs significant improvement. The comparisons between Sld3-CBD, Sld3CBD-Cdc45, and Sld7-Sld3CBD-Cdc45 involve complexes from different species, limiting the comparisons' value.

      (3) The authors' model proposing the release of Sld3 from CMG based on its binding to single-stranded DNA is unclear and needs more elaboration.

    4. Reviewer #3 (Public review):

      Summary:

      The paper by Li et al. describes the crystal structure of a complex of Sld3-Cdc45-binding domain (CBD) with Cdc45 and a model of the dimer of an Sld3-binding protein, Sld7, with two Sld3-CBD-Cdc45 for the tethering. In addition, the authors showed the genetic analysis of the amino acid substitution of residues of Sld3 in the interface with Cdc45 and biochemical analysis of the protein interaction between Sld3 and Cdc45 as well as DNA binding activity of Sld3 to the single-strand DNAs of the ARS sequence.

      Strengths:

      The authors provided a nice model of an intermediate step in the assembly of an active Cdc45-MCM-GINS (CMG) double hexamers at the replication origin, which is mediated by the Sld3-Sld7 complex. The dimer of the Sld3-Sld7 complexes tethers two MCM hexamers together for the recruitment of GINS-Pol epsilon on the replication origin.

      Weaknesses:

      The biochemical analysis should be carefully evaluated with more quantitative ways to strengthen the authors' conclusion.

    5. Author response:

      Reviewer #1 (Public review):

      Summary:

      The crystal structure of the Sld3CBD-Cdc45 complex presented by Li et al. is a novel contribution that significantly advances our understanding of CMG formation during the rate-limiting step of DNA replication initiation. This structure provides insights into the intermediate steps of CMG formation. The study builds upon previously known structures of Sld3 and Cdc45 and offers new perspectives into how Cdc45 is loaded onto MCM DH through Sld3-Sld7. The most notable finding is the structural difference in Sld3CBD when bound to Cdc45, particularly the arrangement of the α8-helix, which is essential for Cdc45 binding and may also pertain to its metazoan counterpart, Treslin. Additionally, the conformational shift in the DHHA1 domain of Cdc45 suggests a possible mechanism for its binding to MCM2NTD.

      Strengths:

      The manuscript is generally well-written, with a precise structural analysis and a solid methodological section that will significantly advance future studies in the field. The predictions based on structural alignments are intriguing and provide a new direction for exploring CMG formation, potentially shaping the future of DNA replication research.

      Weaknesses:

      The main weakness of the manuscript lies in the lack of experimental validation for the proposed Sld3-Sld7-Cdc45 model. Specifically, the claim that Sld3 binding to Cdc45-MCM does not inhibit GINS binding, a finding that contradicts previous research, is not sufficiently substantiated with experimental evidence. To strengthen their model, the authors must provide additional experimental data to support this mechanism. Also, the authors have not compared the recently published Cryo-EM structures of the metazoan CMG helicases with their predicted models to see if Sld3/Treslin does not cause any clash with the GINS when bound to the CMG. Still, the work holds great potential in its current form but requires further experiments to confirm the authors' conclusions.

      We appreciate the reviewers’ careful reading and the comments.

      The structure of Sld3CBD-Cdc45 showed that the binding site of Cdc45 to Sld3CBD was distinct from the binding ranges of Cdc45 to GINS and MCM, indicating that the Sld3CBD, MCM, and GINS bind to separate sites of Cdc45 on the CMG complex. The SCMG-DNA model confirmed such a binding situation but did not show whether the binding of Sld3 to Cdc45 affects the recruitment of GINS (by GINS-Dbp11-Sld2) for CMG formation. We will modify our manuscript and discuss this point. Also, we will check the recently published Cryo-EM structures of the metazoan CMG helicases with their predicted models to confirm our conclusions. We will try to conduct the experiments as suggested.

      Reviewer #2 (Public review):

      Summary

      The manuscript presents valuable findings, particularly in the crystal structure of the Sld3CBD-Cdc45 interaction and the identification of additional sequences involved in their binding. The modeling of the Sld7-Sld3CBD-CDC45 subcomplex is novel, and the results provide insights into potential conformational changes that occur upon interaction. However, the work remains incomplete as several main claims are only partially supported by experimental data, particularly the proposed model for Sld3 interaction with GINS on the CMG. Additionally, the single-stranded DNA binding data from different species do not convincingly advance the manuscript's central arguments.

      Strengths

      (1) The Sld3CBD-Cdc45 structure is a novel contribution, revealing critical residues involved in the interaction.

      (2) The model structures generated from the crystal data are well presented and provide valuable insights into the interaction sequences between Sld3 and Cdc45.

      (3) The experiments testing the requirements for interaction sequences are thorough and conducted well, with clear figures supporting the conclusions.

      (4) The conformational changes observed in Sld3 and Cdc45 upon binding are interesting and enhance our understanding of the interaction.

      (5) The modeling of the Sld7-Sld3CBD-CDC45 subcomplex is a new and valuable addition to the field.

      Weaknesses

      (1) The proposed model for Sld3 interacting with GINS on the CMG needs more experimental validation and conflicts with published findings. These discrepancies need more detailed discussion and exploration.

      (2) The section on the binding of Sld3 complexes to origin single-stranded DNA needs significant improvement. The comparisons between Sld3-CBD, Sld3CBD-Cdc45, and Sld7-Sld3CBD-Cdc45 involve complexes from different species, limiting the comparisons' value.

      (3) The authors' model proposing the release of Sld3 from CMG based on its binding to single-stranded DNA is unclear and needs more elaboration.

      We appreciate your positive comments. As suggested, we will try to improve the experiments and manuscript and discuss in more detail, including the interaction between Sld3 and GINS on the CMG, ssDNA-binding section, and the explanations of why we use different species for comparison and more elaboration on the Sld3-release proposal.

      Reviewer #3 (Public review):

      Summary:

      The paper by Li et al. describes the crystal structure of a complex of Sld3-Cdc45-binding domain (CBD) with Cdc45 and a model of the dimer of an Sld3-binding protein, Sld7, with two Sld3-CBD-Cdc45 for the tethering. In addition, the authors showed the genetic analysis of the amino acid substitution of residues of Sld3 in the interface with Cdc45 and biochemical analysis of the protein interaction between Sld3 and Cdc45 as well as DNA binding activity of Sld3 to the single-strand DNAs of the ARS sequence.

      Strengths:

      The authors provided a nice model of an intermediate step in the assembly of an active Cdc45-MCM-GINS (CMG) double hexamers at the replication origin, which is mediated by the Sld3-Sld7 complex. The dimer of the Sld3-Sld7 complexes tethers two MCM hexamers together for the recruitment of GINS-Pol epsilon on the replication origin.

      Weaknesses:

      The biochemical analysis should be carefully evaluated with more quantitative ways to strengthen the authors' conclusion.

      We thank your positive assessment. We will provide more quantitative information and try to quantify the experiments as suggested.

    1. eLife Assessment

      The aim of this useful study is to investigate the role of semilunar granule cells on memory engrams in the dentate gyrus. Which cells get recruited during contextual memory processing is a timely and significant question. However, evidence for the study's major conclusions is currently incomplete due to caveats in study design, technical limitations, and missing controls.

    2. Reviewer #1 (Public review):

      Dovek and colleagues aimed at investigating the cellular and circuitry mechanisms underlying the recruitment of two morpho-physiologically-distinct subpopulations of dentate gyrus excitatory cells (granular cells or GCs, and semilunar cells or SGCs) into memory representations, also known as engrams.

      To this end, the authors used TRAP2 mice to investigate the dentate gyrus "engram" neurons that were recruited or not (i.e., labeled or not) in a specific context (mostly enriched environment or EE, but also Barnes Maze or BM). GCs and SGCs were distinguished using a morphologically based classification. In line with previous observations (Erwin et al., 2022), SGCs exhibited a disproportionate context-dependent recruitment. Although they represent less than 5% of the excitatory neurons in the dentate gyrus, they comprise around 30% of behaviorally activated "engram" neurons.

      Then, the authors compared the intrinsic physiological properties of GCs and SGCs that are recruited or not during EE. Consistent with previous observations (Williams et al., 2007, Afrasiabi et al., 2022), SGCs and GCs exhibited numerous differences (e.g., Rin, firing frequency) regardless of whether they were behaviorally activated or not. Only the adaptation in firing rate enabled the discrimination of "engram" SGCs (which displayed lower values) from non-recruited SGCs.

      To examine how GCs and SGCs activated during EE are integrated into the local dentate gyrus microcircuits, the authors next performed a dual patch-clamp recording combined with wide-field optogenetics. Despite the presence of spontaneous EPSCs, no direct functional glutamatergic interconnection was observed between pairs of "engram" GCs and SGCs. In addition, the stimulation of behaviorally recruited GCs or SGCs rarely elicits IPSCs in non-engram excitatory neurons, which suggests limited lateral inhibition.

      Last, the authors investigated whether neurons recruited in the same context were characterized by a higher propensity to receive temporally correlated inputs. To this end, they performed a dual patch-clamp and analyzed the temporal correlation of spontaneous EPSCs received by pairs of neurons (either two dentate gyrus "engram" neurons, or one "engram" neuron and one "non-engram" neuron in an EE context). They observed that the temporal correlation of excitatory events received by pairs of engram neurons was greater than that of pairs of neurons that do not belong to the same ensemble, and that expected by chance.

      Altogether, the data suggest that distinctive intrinsic properties and shared excitatory afferent, rather than local microcircuit connectivity, are correlated with the context-dependent recruitment of dentate gyrus excitatory neurons.

      Strengths:

      This article raises interesting questions about the recruitment mechanisms of the neuronal ensembles that form memory engrams in the dentate gyrus. I find it particularly interesting that the authors considered not only granular cells, the main population of excitatory neurons in the dentate gyrus, but also a sparse subpopulation of semilunar cells, an understudied type of neuron described by Cajal, then almost forgotten for a century, and finally brought out of oblivion in the mid-2000s (Williams et al., 2007).

      Weaknesses:

      I think the article is a little too immature in its current form. I'd recommend that the authors work on their writing. For example, the objectives of the article are not completely clear to me after reading the manuscript, composed of parts where the authors seem to focus on SGCs, and others where they study "engram" neurons without differentiating the neuronal type (Figure 5). The next version of the manuscript should clearly establish the objectives and sub-aims.

      In addition, some results are not entirely novel (e.g., the disproportionate recruitment as well as the distinctive physiological properties of SGCs), and/or based on correlations that do not fully support the conclusions of the article. In addition to re-writing, I believe that the article would benefit from being enriched with further analyses or even additional experiments before being resubmitted in a more definitive form.

    3. Reviewer #2 (Public review):

      Summary:

      The authors use the TRAP2 mouse line to label dentate gyrus cells active during an enriched environment paradigm and cut brain slices from these animals one week later to determine whether granule cells (GC) and semilunar granule cells (SGC) labelled during the exposure share common features. They particularly focus on the role of SGCs and potential circuit mechanisms by which they could be selectively embedded in the labelled assembly. The authors claim that SGCs are disproportionately recruited into IEG-expressing assemblies due to intrinsic firing characteristics but cannot identify any contributing circuit connectivity motives in the slice preparation, although they claim that an increased correlation between spontaneous synaptic currents in the slice could signify common synaptic inputs as the source of assembly formation.

      Strengths:

      The authors chose a timely and relevant question, namely how memory-bearing neuronal assemblies, or 'engrams', are established and maintained in the dentate gyrus. After the initial discovery of such memory-specific ensembles of immediate-early gene expressing engrams in 2012 (Ramirez et al.) this issue has been explored by several high-profile studies that have considerably expanded our understanding of the underlying molecular and cellular mechanisms, but still leave a lot of unanswered questions.

      Weaknesses:

      Unfortunately, there are several major methodological issues that put into question most if not all central claims made by the authors:

      (1) The authors conclude that SGCs are disproportionately recruited into cfos assemblies during the enriched environment and Barnes maze task given that their classifier identifies about 30% of labelled cells as SGCs in both cases and that another study using a different method (Save et al., 2019) identified less than 5% of an unbiased sample of granule cells as SGCs. To make matters worse, the classifier deployed here was itself established on a biased sample of GCs patched in the molecular layer and granule cell layer, respectively, at even numbers (Gupta et al., 2020). The first thing the authors would need to show to make the claim that SGCs are disproportionately recruited into memory ensembles is that the fraction of GCs identified as SGCs with their own classifier is significantly lower than 30% using their own method on a random sample of GCs (e.g. through sparse viral labelling). As the authors correctly state in their discussion, morphological samples from patch-clamp studies are problematic for this purpose because of inherent technical issues (i.e. easier access to scattered GCs in the molecular layer).

      (2) The authors claim that recurrent excitation from SGCs onto GCs or other SGCs is irrelevant because they did not find any connections in 32 simultaneous recordings (plus 63 in the next experiment). Without a demonstration that other connections from SGCs (e.g. onto mossy cells or interneurons) are preserved in their preparation and if so at what rates, it is unclear whether this experiment is indicative of the underlying biology or the quality of the preparation. The argument that spontaneous EPSCs are observed is not very convincing as these could equally well arise from severed axons (in fact we would expect that the vast majority of inputs are not from local excitatory cells). The argument on line 418 that SGCs have compact axons isn't particularly convincing either given that the morphologies from which they were derived were also obtained in slice preparations and would be subject to the same likelihood of severing the axon. Finally, even in paired slice recordings from CA3 pyramidal cells the experimentally detected connectivity rates are only around 1% (Guzman et al., 2016). The authors would need to record from a lot more than 32 pairs (and show convincing positive controls regarding other connections) to make the claim that connectivity is too low to be relevant.

      (3) Another troubling sign is the fact that optogenetic GC stimulation rarely ever evokes feedback inhibition onto other cells which contrasts with both other in vitro (e.g. Braganza et al., 2020) and in vivo studies (Stefanelli et al., 2016) studies. Without a convincing demonstration that monosynaptic connections between SGCs/GCs and interneurons in both directions is preserved at least at the rates previously described in other slice studies (e.g. Geiger et al., 1997, Neuron, Hainmueller et al., 2014, PNAS, Savanthrapadian et al., 2014, J. Neurosci), the notion that this setting could be closer to naturalistic memory processing than the in vivo experiments in Stefanelli et al. (e.g. lines 443-444) strikes me as odd. In any case, the discussion should clearly state that compromised connectivity in the slice preparation is likely a significant confound when comparing these results.

      (4) Probably the most convincing finding in this study is the higher zero-time lag correlation of spontaneous EPSCs in labelled vs. unlabeled pairs. Unfortunately, the fact that the authors use spontaneous EPSCs to begin with, which likely represent a mixture of spontaneous release from severed axons, minis, and coordinated discharge from intact axon segments or entire neurons, makes it very hard to determine the meaning and relevance of this finding. At the bare minimum, the authors need to show if and how strongly differences in baseline spontaneous EPSC rates between different cells and slices are contributing to this phenomenon. I would encourage the authors to use low-intensity extracellular stimulation at multiple foci to determine whether labelled pairs really share higher numbers of input from common presynaptic axons or cells compared to unlabeled pairs as they claim. I would also suggest the authors use conventional Cross correlograms (CCG; see e.g. English et al., 2017, Neuron; Senzai and Buzsaki, 2017, Neuron) instead of their somewhat convoluted interval-selective correlation analysis to illustrate co-dependencies between the event time series. The references above also illustrate a more robust approach to determining whether peaks in the CCGs exceed chance levels.

      (5) Finally, one of the biggest caveats of the study is that the ensemble is labelled a full week before the slice experiment and thereby represents a latent state of a memory rather than encoding consolidation, or recall processes. The authors acknowledge that in the discussion but they should also be mindful of this when discussing other (especially in vivo) studies and comparing their results to these. For instance, Pignatelli et al 2018 show drastic changes in GC engram activity and features driven by behavioral memory recall, so the results of the current study may be very different if slices were cut immediately after memory acquisition (if that was possible with a different labelling strategy), or if animals were re-exposed to the enriched environment right before sacrificing the animal.

    4. Reviewer #3 (Public review):

      Summary:

      The study explores the cellular and circuit features that distinguish dentate gyrus semilunar granule cells and granule cells activated during contextual memory formation. The authors tag memory and enriched environment-activated dentate granule cells and semilunar granule cells and show their reactivation in an appropriate context a week later. They perform patch clamp recordings from activated and surrounding neurons to understand cellular driving the selective activation of semilunar granule cells and granule cells. Authors perform dual patch clamp recordings from various pairs of labeled semilunar granule cells, labeled granule cells, unlabeled granule cells, and unlabeled semilunar granule cells. The sustained firing of semilunar granule cells explained their preferential activation. In addition, activated neurons received correlated inputs.

      Strengths:

      The authors confirmed engram cell properties of activated semilunar granule cells and granule cells in two different paradigms, validated using an enriched environment paradigm.

      The authors carefully separate semilunar granule cells from granule cells, using electrophysiology and morphology. Cell filling to confirm morphology further strengthens confidence.

      The dual patch recordings, which are technically challenging, are carefully performed, and the presence of synaptic activity is confirmed.

      Finally, the correlation analysis of EPSCs on labeled neurons is rigorous.

      Weaknesses:

      (1) Engram cells are (i) activated by a learning experience, (ii) physically or chemically modified by the learning experience, and (iii) reactivated by subsequent presentation of the stimuli present at the learning experience (or some portion thereof), resulting in memory retrieval. The authors show that exposure to Barnes Maze and the enriched environment-activated semilunar granule cells and granule cells preferentially in the superior blade of the dentate gyrus, and a significant fraction were reactivated on re-exposure. However, physical or chemical modification by experience was not tested. Experience modifies engram cells, and a common modification is the Hebbian, i.e., potentiation of excitatory synapses. The authors recorded EPSCs from labeled and unlabeled GCs and SGCs. Was there a difference in the amplitude or frequency of EPSCs recorded from labeled and unlabeled cells?

      (2) The authors studied five sequential sections, each 250 μm apart across the septotemporal axis, which were immunostained for c-Fos and analyzed for quantification. Is this an adequate sample? Also, it would help to report the dorso-ventral gradient since more engram cells are in the dorsal hippocampus. Slices shown in the figures appear to be from the dorsal hippocampus.

      (3) The authors investigated the role of surround inhibition in establishing memory engram SGCS and GCs. Surprisingly, they found no evidence of lateral inhibition in the slice preparation. Interneurons, e.g., PV interneurons, have large axonal arbors that may be cut during slicing. Similarly, the authors point out that some excitatory connections may be lost in slices. This is a limitation of slice electrophysiology.

    5. Author response:

      Reviewer 1:

      (1) I think the article is a little too immature in its current form. I'd recommend that the authors work on their writing. For example, the objectives of the article are not completely clear to me after reading the manuscript, composed of parts where the authors seem to focus on SGCs, and others where they study "engram" neurons without differentiating the neuronal type (Figure 5). The next version of the manuscript should clearly establish the objectives and sub-aims.

      Our overarching focus was to identify whether intrinsic physiology and circuit connectivity of SGCs contribute to their unique overrepresentation in neurons labeled as part of a behaviorally relevant dentate engram. Since our systematic analysis of “engram SGCs” did not support the proposal that engram SGCs drive robust feedforward excitation of engram GCs or feedback inhibition of non-engram GCs, we examined an alternative hypothesis that inputs drive recruitment of neurons, regardless of subtype (in figure 5). These are sparsely labeled neurons, with mixed populations of GCs and SGCs undergoing paired recordings. Since the focus of the experiment was input correlation between two simultaneously recorded neurons, we did not report the individual cell types. We regret that this caused confusion and will clarify this issue in the revised manuscript.

      (2) In addition, some results are not entirely novel (e.g., the disproportionate recruitment as well as the distinctive physiological properties of SGCs), and/or based on correlations that do not fully support the conclusions of the article. In addition to re-writing, I believe that the article would benefit from being enriched with further analyses or even additional experiments before being resubmitted in a more definitive form.

      We would like to note that while we and others have previously reported the distinctive SGC physiology, this study is the first to compare physiological properties of SGCs labeled as part of an engram to unlabeled SGCs. That was the thrust of the data presented which may have been missed and will be emphasized in the revision. Similarly, while others have shown higher SGC recruitment in dentate engrams, we had to validate this in the dentate dependent behaviors that we adopted in this study. We also note that the proportional SGC recruitment in our study, based on morphometric classification, differs from what was reported previously. These aspects of study, which were considered confirmatory, represent the necessary validation needed to proceed with the novel cell-type specific paired recordings and optogenetic analyses of engram neurons presented in subsequent sections of the manuscript. We will emphasize these considerations in the revised manuscript.

      Reviewer 2:

      (1) The authors conclude that SGCs are disproportionately recruited into cfos assemblies during the enriched environment and Barnes maze task given that their classifier identifies about 30% of labelled cells as SGCs in both cases and that another study using a different method (Save et al., 2019) identified less than 5% of an unbiased sample of granule cells as SGCs. To make matters worse, the classifier deployed here was itself established on a biased sample of GCs patched in the molecular layer and granule cell layer, respectively, at even numbers (Gupta et al., 2020). The first thing the authors would need to show to make the claim that SGCs are disproportionately recruited into memory ensembles is that the fraction of GCs identified as SGCs with their own classifier is significantly lower than 30% using their own method on a random sample of GCs (e.g. through sparse viral labelling). As the authors correctly state in their discussion, morphological samples from patch-clamp studies are problematic for this purpose because of inherent technical issues (i.e. easier access to scattered GCs in the molecular layer).

      We regret that there seems to be some confusion about use of a classifier. We did NOT use any automated classifier in this study. All cell type classifications in the study were conducted by experienced investigators examining cell morphology and classifying cells based on established morphometric criteria. In our prior study (Gupta et al., 2020) we had conducted an automated cluster analysis that was able to classify GCs and SGCs as different cell types. The principal components underlying the automated clustering in Gupta et al 2020 were consistent with the major criteria identified in prior morphology-based analyses by us and others (including Williams et al 2010 and Save et al., 2019). To date, in the absence of a validated molecular marker, morphometry from recorded and filled cells or sparsely labeled neurons is the only established method to classify SGCs. This was the approach we adopted, and this will be further clarified in the revisions.

      (2) The authors claim that recurrent excitation from SGCs onto GCs or other SGCs is irrelevant because they did not find any connections in 32 simultaneous recordings (plus 63 in the next experiment). Without a demonstration that other connections from SGCs (e.g. onto mossy cells or interneurons) are preserved in their preparation and if so at what rates, it is unclear whether this experiment is indicative of the underlying biology or the quality of the preparation. The argument that spontaneous EPSCs are observed is not very convincing as these could equally well arise from severed axons (in fact we would expect that the vast majority of inputs are not from local excitatory cells). The argument on line 418 that SGCs have compact axons isn't particularly convincing either given that the morphologies from which they were derived were also obtained in slice preparations and would be subject to the same likelihood of severing the axon. Finally, even in paired slice recordings from CA3 pyramidal cells the experimentally detected connectivity rates are only around 1% (Guzman et al., 2016). The authors would need to record from a lot more than 32 pairs (and show convincing positive controls regarding other connections) to make the claim that connectivity is too low to be relevant.

      As noted in our discussion, we are fully cognizant that potential SGC to GC connections may have been missed by the nature of slice physiology experiments and made every effort to limit this possibility. As noted in the manuscript, we only analyzed GC/SGC pairs where hilar axon collaterals of the neurons were recovered. We do not claim that SGC to GC/SGC connections are irrelevant, rather, we indicate that these connections, if present, are sparse and unlikely to drive engram refinement. Interestingly, wide field optical stimulation, designed to activate multiple labeled engram neurons and axon terminals including those of SGCs whose somata were outside the slice, did not lead to EPSCs in other unlabeled GCs or SGCs suggesting the lack of robust SGC to GC/SGC synaptic connectivity. While we have previously published paired recordings from interneurons to GCs (Proddutur  et al 2023) , we agree that recordings demonstrating the presence of SGC/GC to hilar neuron synapses would serve as an added control in the revised manuscript.

      (3) Another troubling sign is the fact that optogenetic GC stimulation rarely ever evokes feedback inhibition onto other cells which contrasts with both other in vitro (e.g. Braganza et al., 2020) and in vivo studies (Stefanelli et al., 2016) studies. Without a convincing demonstration that monosynaptic connections between SGCs/GCs and interneurons in both directions is preserved at least at the rates previously described in other slice studies (e.g. Geiger et al., 1997, Neuron, Hainmueller et al., 2014, PNAS, Savanthrapadian et al., 2014, J. Neurosci), the notion that this setting could be closer to naturalistic memory processing than the in vivo experiments in Stefanelli et al. (e.g. lines 443-444) strikes me as odd. In any case, the discussion should clearly state that compromised connectivity in the slice preparation is likely a significant confound when comparing these results.

      We would like to note that our data are consistent with Braganza 2020 study, as we explain below. Moreover, we would like to point out that the demonstration of “feedback inhibition” in the Stefanelli study was NOT in engram or behaviorally labeled neurons nor was it in vivo. As we explain below, the physiological assay in Stefanelli was in slices and in a cohort of GCs with virally driven ChR2 expression. Thus, we are fully confident that our experimental paradigm better reflects a behavioral engram. As noted in response (2, we have previously published paired monosynaptic connections from interneurons to GCs (Proddutur  et al 2023) and find the connectivity consistent with published data. However, we agree that recordings demonstrating the presence of SGC/GC to hilar neuron synapses  or recruitment of feedback inhibition by focal activation of GCs would serve to allay concerns regarding slice preparation. We also submit that we already discuss the potential concerns regarding compromised connectivity in slice preparations.

      Regarding the lack of optically evoked feedback inhibition, we would like to point out that the Braganza 2020 study examined focal optogenetic activation of GCs, where a high density of GCs was labeled using a Prox-cre line. They reported that about 2-4% of these densely labeled cells need to be recruited to evoke feedback IPSCs. Our experimental condition, where ChR2 was expressed in behaviorally labeled neurons, leads to sparse labeling much less than the focal 4% needed to evoke IPSCs in the Braganza study. We do not claim that feedback inhibition cannot be activated by focal activation of a cohort of GCs and even show an example of paired recording with feedback GC inhibition of an SGC. Our conclusion is that the few sparsely labeled neurons during a behavioral episode do not support robust feedback inhibition proposed to mediate engram refinement. We submit that our findings are fully consistent with the sparse GC driven feedback inhibition, and the need to activate a cohort of focal GCs to recruit feedback inhibition, reported in Braganza 2020

      Regarding the Stefanelli study, we maintain that our behaviorally relevant in vivo labeling approach is more naturalistic than the DREADD and Channelrhodopsin driven artificial “engrams” generated in the Stefanelli study. Of note, we used cFOS driven TRAP mice to label, in vivo, neurons active during a behavior and then undertook slice physiology studies in these mice a week later. In contrast, the slice physiology data demonstrating putative feedback inhibition in the Stefanelli study (Fig 5) used wildtype mice injected with AAV CAMKII-cre and AAV-DIO-ChR2. Thus, unlike our study, the physiological data demonstrating feedback inhibition in the Stefanelli study was not performed in a behaviorally labeled engram. Apart from the one set of histological experiments using AAV-SARE-GFP to demonstrate increased GFP labeling of SST neurons in behavior, all other data presented in the Stefanelli study are generated based on artificially generated engrams where optogenetic activation or silencing on granule cells was used to manipulate the numbers of neurons active during a task followed by histological analysis of cFOS staining or behaviors. Thus, the physiological experiments in the Stefanelli et al (2016) generated by wide field activation of a large cohort of GCs labeled by focal virally driven ChR2 expression, were similar to wide field optical stimulation studies in the Braganza 2020 study, and were NOT conducted in a behavioral engram. The strength of our study is in the use of a behaviorally tagged engram neurons for analysis and our findings in sparsely labeled neurons are consistent with the reports in Braganza 2020. We will further clarify in our discussion that the data presented in the Stefanelli study do NOT represent a natural behavior generated engram.

      (4) Probably the most convincing finding in this study is the higher zero-time lag correlation of spontaneous EPSCs in labelled vs. unlabeled pairs. Unfortunately, the fact that the authors use spontaneous EPSCs to begin with, which likely represent a mixture of spontaneous release from severed axons, minis, and coordinated discharge from intact axon segments or entire neurons, makes it very hard to determine the meaning and relevance of this finding. At the bare minimum, the authors need to show if and how strongly differences in baseline spontaneous EPSC rates between different cells and slices are contributing to this phenomenon. I would encourage the authors to use low-intensity extracellular stimulation at multiple foci to determine whether labelled pairs really share higher numbers of input from common presynaptic axons or cells compared to unlabeled pairs as they claim. I would also suggest the authors use conventional Cross correlograms (CCG; see e.g. English et al., 2017, Neuron; Senzai and Buzsaki, 2017, Neuron) instead of their somewhat convoluted interval-selective correlation analysis to illustrate co-dependencies between the event time series. The references above also illustrate a more robust approach to determining whether peaks in the CCGs exceed chance levels.

      We appreciate the comment can provide additional data on the EPSC frequency in individual labeled and unlabeled cells in the revised manuscript. As indicated in the manuscript, we constrained our analysis to cell pairs with comparable EPSC frequency in order to avoid additional confounds in analysis. We have additional experiments to show that over 50% of the sEPSCs represent action potential driven events which we will include in the revised manuscript. We thank the reviewer for the suggestion to explores alternative methods of analyses including CCGs to further strengthen our findings.

      (5) Finally, one of the biggest caveats of the study is that the ensemble is labelled a full week before the slice experiment and thereby represents a latent state of a memory rather than encoding consolidation, or recall processes. The authors acknowledge that in the discussion but they should also be mindful of this when discussing other (especially in vivo) studies and comparing their results to these. For instance, Pignatelli et al 2018 show drastic changes in GC engram activity and features driven by behavioral memory recall, so the results of the current study may be very different if slices were cut immediately after memory acquisition (if that was possible with a different labelling strategy), or if animals were re-exposed to the enriched environment right before sacrificing the animal.

      As noted by the reviewer, we fully acknowledge and are cognizant of the concern that slices prepared a week after labeling may not reflect ongoing encoding. Although our data show that labeled cells are reactivated in higher proportion during recall, we have discussed this caveat and will include alternative experimental strategies in the discussion.

      Reviewer 3:

      (1) Engram cells are (i) activated by a learning experience, (ii) physically or chemically modified by the learning experience, and (iii) reactivated by subsequent presentation of the stimuli present at the learning experience (or some portion thereof), resulting in memory retrieval. The authors show that exposure to Barnes Maze and the enriched environment-activated semilunar granule cells and granule cells preferentially in the superior blade of the dentate gyrus, and a significant fraction were reactivated on re-exposure. However, physical or chemical modification by experience was not tested. Experience modifies engram cells, and a common modification is the Hebbian, i.e., potentiation of excitatory synapses. The authors recorded EPSCs from labeled and unlabeled GCs and SGCs. Was there a difference in the amplitude or frequency of EPSCs recorded from labeled and unlabeled cells?

      We agree that we did not examine the physical or chemical modifications by experience. Although we constrained our sEPSC analysis to cell pairs with comparable sEPSC frequency, we will include data on sEPSC parameters in labeled and unlabeled cells in the revised manuscript.

      (2) The authors studied five sequential sections, each 250 μm apart across the septotemporal axis, which were immunostained for c-Fos and analyzed for quantification. Is this an adequate sample? Also, it would help to report the dorso-ventral gradient since more engram cells are in the dorsal hippocampus. Slices shown in the figures appear to be from the dorsal hippocampus.

      We thank the reviewer for the comment. We analyzed sections along the dorso-ventral gradient. As explained in the methods, there is considerable animal to animal variability in the number of labeled cells which was why we had to use matched littermate pairs in our experiments This variability could render it difficult to tease apart dorsoventral differences.

      (3) The authors investigated the role of surround inhibition in establishing memory engram SGCs and GCs. Surprisingly, they found no evidence of lateral inhibition in the slice preparation. Interneurons, e.g., PV interneurons, have large axonal arbors that may be cut during slicing. Similarly, the authors point out that some excitatory connections may be lost in slices. This is a limitation of slice electrophysiology.

      We agree that slice physiology has limitations and discuss this caveat. As noted in response (2, we have previously published paired monosynaptic connections from interneurons to GCs (Proddutur  et al 2023) and find the connectivity consistent with published data. However, we agree that recordings demonstrating the presence of SGC/GC to hilar neuron synapses  or recruitment of feedback inhibition by focal activation of GCs would serve to allay concerns regarding slice preparation.

    1. Author response:

      The following is the authors’ response to the original reviews.

      Reviewer #1 (Public Review):

      The study by Chikermane and colleagues investigates the functional, structural, and dopaminergic network substrates of cortical beta oscillations (13-30 Hz). The major strength of the work lies in the methodology taken by the authors, namely a multimodal lesion network mapping. First, using invasive electrophysiological recordings from healthy cortical territories of epileptic patients they identify regions with the highest beta power. Next, they leverage open-access MRI data and PET atlases and use the identified high-beta regions as seeds to find (1) the whole-brain functional and structural maps of regions that form the putative underlying network of high-beta regions and (2) the spatial distribution of dopaminergic receptors that show correlation with nodal connectivity of the identified networks. These steps are achieved by generating aggregate functional, structural, and dopaminergic network maps using lead-DBS toolbox, and by contrasting the results with those obtained from high-alpha regions.

      The main findings are:

      (1) Beta power is strongest across frontal, cingulate, and insular regions in invasive electrophysiological data, and these regions map onto a shared functional and structural network. (2) The shared functional and structural networks show significant positive correlations with dopamine receptors across the cortex and basal ganglia (which is not the case for alpha, where correlations are found with GABA).

      Nevertheless, a few clarifications regarding the choice of high-power electrodes and distributions of functional connectivity maps (i.e., strength and sign across cortex and sub-cortex) can help with understanding the results.

      We thank the reviewer for this critical expert assessment. 

      Reviewer #1 (Recommendations For The Authors):

      To potentially enhance the quality of the manuscript in the current version, I kindly ask the authors to address the following points:

      Major:

      (A) Power analysis of electrophysiological data

      (1) How were significant peaks identified exactly? I understand that the authors used FOOOF methodology to estimate periodic components of brain activity.

      Thank you for pointing us to this lack of clarity. The application of FOOOF consists of the fitting of a one-over-f curve that delineates the aperiodic component followed by the definition of gaussians to fit periodic activity. This allows for extraction of periodic peak power estimates that are corrected for offset and exponent of the one-over-f or non-oscillatory aperiodic component in the spectrum (further information can be found here https://fooof-tools.github.io/fooof/auto_tutorials/plot_02-FOOOF.html). We included all peaks that could be fitted using the process.

      How about aperiodic components (Figure 1, PSD plots)? 

      We share the interest in aperiodic activity with the reviewer. However, given that the primary aim of this study was the description of beta oscillations and the methodology and results presentation is already very complex, we did not include the analysis of aperiodic activity in this manuscript. This could be done in the future and it would surely be interesting to visualize the whole brain connectomic fingerprints of aperiodic exponent and offset. With regard to the purely anatomical description of nonoscillatory aperiodic activity we would like to refer to Figure 8 in Frauscher et al. Brain 2018 (https://doi.org/10.1093/brain/awy035) where this is described. We have decided not to include additional information on this matter, because a) we felt that this would further convolute the results and discussion without directly addressing any of the hypotheses and aims that we set out to tackle and b) the interpretation of aperiodic activity is still a matter of intense research with conflicting results, which warrants very careful considerations of many aspects that again would go beyond the scope of this paper. 

      In addition, to what degree would the results change if one identified the peaks relative to sites with no peak, similar to Frauscher et al. 

      Beta activity, the oscillation of interest in our analysis is ubiquitous in the brain. In fact, of 1772 channels, only 21 channels did not exhibit a beta peak detectable with FOOOF. Thus, a comparison of 1751 against 21 would not yield meaningful results. We have therefore decided to focus on the channels in which beta activity is the strongest and dominant observable oscillation. 

      If the FOOOF approach has some advantages, these should be pointed out or discussed.

      FOOOF indeed has the advantage that it provides an objective and reproducible estimation of peak oscillatory activity that accounts for differences in aperiodic activity. To the best of our knowledge, there is no other approach that is nearly as well documented, validated and computationally reproducible. 

      Changes in manuscript: We have now further clarified the definition of peak amplitudes in the results and methods section and have discussed the use of alternative measures in the limitations section of our manuscript.

      Results: “The frequency band with the highest peak amplitude was identified using the extracted peak parameter (pw) for each channel and depicted as the dominant rhythm for the respective localisation (Figure 1).”

      Methods: “Peak height was extracted using the pw parameter, which depicts peak amplitude after subtraction of any aperiodic activity.”

      Discussion: “Alternative approaches could yield different results, e.g. reusing channels for each peak that is observable and contrasting them to channels where such peak was not present. However, in our study the majority of channels exhibited beta activity, even if peaks were of low amplitude, which we believe would have led to less interpretable results.”

      (2) How exactly do the authors deal with channels with more than one peak? Some elaboration on this and how this could potentially impact the results would be appreciated. Sorry if I have missed it.

      Indeed, a description of this was lacking so we are very thankful that the reviewer pointed this out. The maximum peak amplitude method was a winner-takes-all approach where in the case of multiple peaks, the peak with the higher amplitude was chosen. This method of course has drawbacks in the form of lost or disregarded peaks and remains a limitation to this study. 

      Changes in manuscript: We have now clarified this in the methods and results sections, which now read: 

      Methods: “In case of multiple peaks within the same region, we used only the highest peak amplitude.”

      Results: “In case of multiple peaks within the same frequency band, we focused the analysis on the peak with the highest amplitude.”

      And added the following to the Limitations section of the discussion: 

      “Another limitation in our study is the fact that the statistical approach for the comparison of beta and alpha networks and even for multiple peaks within the same frequency band follows a winner takes all logic that is, by definition, a simplification, as most areas will contribute to more than one spatiospectrally distinct oscillatory network. Specifically, while multiple peaks within or across frequency bands could be present in each channel, we decided to allocate this channel to only the frequency band containing the highest peak amplitude.” 

      (B) Network mapping

      (1) Knowing that fMRI data are preprocessed by regressing the global signal, there are negative correlations across the functional networks. Unfortunately, the distribution, sign, and strength of the correlations are not quantitatively shown in any of the plots. Thus, it is unclear whether, e.g., corticocortical vs. subcortico-cortical correlations differ in strength and/or sign. I think this additional information is important for better understanding the up/down-regulation of beta, e.g., by DA signaling. Some discussion around this point in addition would be insightful, I think.

      The referee is touching upon a very important and difficult point, which we have considered very carefully. Global signal regression is a controversial topic and the neurophysiological basis of negative correlations remains to be elucidated. We can justify our use of this approach based on an expert consensus described in Murphy & Fox 2017 (https://doi.org/10.1016%2Fj.neuroimage.2016.11.052), which highlights that global signal regression can improve the specificity of positive correlations, improve the correspondence to anatomical connectivity. The truth however is that, we relied on it, because it is the more commonly used and validated approach used in lesion network and DBS connectivity mapping and implemented in the Lead Mapper pipeline. Indeed all connectivity estimates are shown in Supplementary figure 3. We remain hesitant to raise the focus to these points, because of the uncertain underlying neural correlates. However, when looking at the values, it is interesting to note that most key regions of interest exhibit positive connectivity values. 

      Changes in manuscript: We now point to the supplement containing all connectivity values in the results section more prominently: “All connectivity values including their sign are shown in figures as brain region averages parcellated with the automatic anatomical labelling atlas in supplementary figures 2&3.”

      (2) I assume no thresholding is applied to the functional connectivity maps (in a graph-theoretical sense). Please clarify (this is also related to the comment above, in particular, the strength of correlations.

      Indeed, we demonstrate SPM maps using family wise error corrected stats in figure 2, but all further analyses were performed on unthresholded maps as correctly pointed out by the referee. 

      Changes in manuscript: 

      Results: “Specifically, we analysed to what degree the spatial uptake patterns of dopamine, as measurable with fluorodopa (FDOPA; cohort average of 12 healthy subjects) and other dopamine signalling related tracers that bind D1/D2 receptors (average of N=17/44 respectively healthy subjects) or the dopamine transporter (DAT; cohort average of N=180 healthy subjects) were correlated with the unthresholded MRI connectivity maps.”

      Methods: “This parcellation was applied to both PET and unthresholded structural and functional connectivity maps using SPM and custom code.”

      Minor

      (1) Methods, Connectivity analysis: The description of (mass-univariate) GLM analysis is confusing. The maps underwent preprocessing? Which preprocessing steps are meant here? What is the dependent variable and what are the predictors exactly?

      We thank the reviewer for catching this error in our methods. We apologise for the confusion and mistake and thank the reviewer for catching it. Indeed, we have used t-tests without further preprocessing instead of a GLM. 

      Changes in manuscript: The respective section has been removed from the methods section and intermediate steps have been clarified. The section now reads: “To investigate differences between beta dominant and alpha dominant functional connectivity networks, a two sample t-test was calculated for the condition where beta was greater than alpha and vice versa using SPM. Here, the connectivity maps from each dominant channel (1005 beta functional connectivity maps and 397 alpha connectivity maps) Estimation of model parameters yielded t-values for each voxel, indicating the strength and direction of differences between the two contrasts (beta > alpha, alpha > beta). To address the issue of multiple comparisons, we applied Family-Wise Error (FWE) correction, adjusting significance thresholds such that only voxels with p < 0.05 would be included.”

      (2) I encourage the authors to find a better (visual) way of reporting Table 1, to make the main observations easier to grasp and compare (maybe a two-dimensional bar plot? Or color-coding the cells?)

      Reply: Thank you for your suggestion to improve the table, the new table is adjusted to the recommended changes to make it more readable.

      Reviewer #2 (Public Review):

      Summary:

      This is a very interesting paper that leveraged several publicly available datasets: invasive cortical recording in epilepsy patients, functional and structural connectomic data, and PET data related to dopaminergic and gaba-ergic synapses. These were combined to create a unified hypothesis of beta band oscillatory activity in the human brain. They show that beta frequency activity is ubiquitous, not just in sensorimotor areas, and cortical regions where beta predominated had high connectivity to regions high in dopamine re-uptake.

      Strengths:

      The authors leverage and integrate three publicly available human brain datasets in a creative way. While these public datasets are powerful tools for human neuroscience, it is innovative to combine these three types of data into a common brain space to generate novel findings and hypotheses. Findings are nicely controlled by separately examining cortical regions where alpha predominates (which have a different connectivity pattern). GABA uptake from PET studies is used as a control for the specificity of the relationship between beta activity and dopamine uptake. There is much interest in synchronized oscillatory activity as a mechanism of brain function and dysfunction, but the field is short on unifying hypotheses of why particular rhythms predominate in particular regions. This paper contributes nicely to that gap. It is ambitious in generating hypotheses, particularly that modulation of beta activity may be used as a "proxy" for modulating phasic dopamine release.

      Weaknesses:

      As the authors point out, the use of normative data is excellent for exploring hypotheses but does not address or explore individual variations which could lead to other insights. It is also biased to resting state activity; maps of task-related activity (if they were available) might show different findings.

      The figures, results, introduction, and methods are admirably clear and succinct but the discussion could be both shorter and more convincing.

      Reviewer #2 (Recommendations For The Authors):

      The tone of the discussion is excessively lofty and abstract, and hard to follow in places. Specific examples in comments to authors below.

      We thank the reviewer for their positive assessment and their constructive feedback on the discussion. Also in light of the other reviewers we have made a sincere effort to shorten, restructure and improve the discussion. Additionally, we have addressed all the specific comments the reviewer had below. We appended each change to the manuscript where appropriate below and have addressed all comments in the main text. Having that said, we see this paper and discussion to provide our most up-to-date and personal perspective on a correct concept on the interplay of beta oscillations and dopamine that is generalizable. Providing a concept that is so generalizable is very challenging and so far very few authors have even attempted this. One notable exception is the “status quo” concept by Fries & Engel. While we will do our very best to address the comments, we have decided not to deviate from our initial ambition to provide a discussion on a generalizable concept. Naturally such a concept must be very complex and therefore it will be hard to understand in parts. Through the revision, we hope that the readability and comprehensibility has improved, while it provides an in-depth perspective and hypothesis on how beta oscillations, dopamine and their brain circuits may facilitate brain function. Nevertheless, we want to express our honest gratitude for the thoroughness with which the reviewer has read and scrutinized our paper. The review clearly tells that the reviewer had the ambition to follow and understand what we were trying to convey, which can be rare nowadays. We are truly thankful for this.

      The first sentence is not quite true, as invasive neurophysiology was not, and cannot be, done in healthy humans. "The present study combined three openly available datasets of invasive neurophysiology, MRI connectomics, and molecular neuroimaging in healthy humans to characterise the spatial distribution of brain regions exhibiting resting beta activity, their shared circuit architecture, and its correlation with molecular markers of dopamine signaling in the human brain."

      Changes in manuscript: We have now removed the “healthy” from the respective sentence.

      "Our results motivate to conceptualise the capacity to generate.... This is not clear.

      Changes in manuscript: “Our results suggest that one common denominator of brain regions that generate beta activity, is their affiliation with beta oscillations as a feature that arises from a largescale global brain network that is modulated by dopamine.”

      "Similarly, the robust beta modulation that is elicited by voluntary action in sensorimotor cortex and its correlation with motor symptoms of Parkinson's disease is long known" - the association between movement-related cortical beta desynchronization and Parkinson's motor signs is not well described - could the authors specify and reference this?

      We thank the reviewer for pointing out this lack of clarity. We meant that independently beta is known for “movement” and for “movement disorders” and not “movement in movement disorders”. Having that said, there are some studies that suggest that beta ERD is altered in PD (e.g.https://doi.org/10.1093/cercor/bht121), but saying that this is “long known” would be an overstatement and was not our intention. We rephrased this sentence accordingly.

      Changes in manuscript: The sentence now reads: “Moreover, the robust beta modulation that is elicited by voluntary action in sensorimotor cortex and its correlation with motor symptoms of Parkinson’s disease is long known.”

      "...first fast-cyclic voltammetry experiments that allowed for combined measurement of dopamine release with invasive neurophysiology have provided first evidence that beta band oscillations in healthy non-human primates can differentially link dopamine release, beta oscillations and reward and motor control, depending on the contextual information and striatal domain" - This is not very clear - not sure what "differentially link" signifies.

      I think the fact that this is not easy to understand signifies the complexity that we and the authors of the cited paper from Ann Graybiel’s lab aimed to communicate. In fact, we stayed very close to the phrasing used in their paper to try and avoid confusion (Title: Dopamine and beta-band oscillations differentially link to striatal value and motor control” - https://doi.org/10.1126/sciadv.abb9226). The specific results go beyond the scope of the discussion but are very interesting, so I would be happy if our paper would inspire readers to look it up. 

      Changes in manuscript: We have now adapted the sentence to “In line with this more complex picture, direct measurement of dopamine concentration in non-human primates revealed specific interactions between dopamine release, beta oscillations, reward value and motor control, depending on contextual information and striatal domain. This shows that the relationship of dopamine and beta activity is not solely associated with either reward or movement and depends on where in the striatum beta activity is recorded.”

      "In fact, one could argue that it can be contextualised in a recently described framework of neural reinforcement, that serves to orchestrate the re-entrance and refinement of neural population dynamics for the production of neural trajectories" - this is not clear - for example what is a neural trajectory? What is meant by "re-entrance and refinement"?

      A neural trajectory refers to the path that the activity of a neural population takes through a high-dimensional space over time. It can be obtained through multivariate analysis of population activity with dimensionality reduction techniques, such as PCA. The concept of low-dimensional representations of high-dimensional neural activity has gained a lot of attention in computational neuroscience ever since high-channel count recordings of neural population activity have become available (an early and prominent example is Churchland et al., 2012 Nature https://doi.org/10.1038/nature11129 , while a more recent example is Safaie et al., Nature 2023 https://doi.org/10.1038/s41586-023-06714-0). The review we refer to by Rui Costa and colleagues (Athalye, V. R., Carmena, J. M. & Costa, R. M. Neural reinforcement: re-entering and refining neural dynamics leading to desirable outcomes. Curr Opin Neurobiol 60, 145–154 (2020) https://doi.org/10.1016/j.conb.2019.11.023) suggests that dopamine may serve to modulate the likelihood of a specific pattern to emerge and re-enter the cortex – basal ganglia loop, for the “reliable production of neural trajectories driving skillful behavior on-demand”. We believe that this concept could be revolutionary in our understanding of dopaminergic modulation and disoroders and together with colleague Alessia Cavallo have written an invited perspective on this topic (https://doi.org/10.1111/ejn.16222), which may help further clarify the topic. 

      Changes in manuscript: We realize that this aspect may sound a bit unclear or far away from the data in this manuscript. However, given that we have spent more than a decade thinking about beta oscillations and how they can be conceptualized, we would prefer not to entirely change our points and rather bet on the possibility that the concepts become more widely accepted and well-known. Nevertheless, we have now adapted the text to make this a bit more clear:

      “We hypothesise that, this “status quo” hypothesis could be equally or maybe even more adequately posed on the neural level. Namely, it could provide insights to what degree a certain activity pattern or synaptic connection is to be strengthened or weakened, in light of neural learning. We propose that this putative function can be contextualised in a recently described framework of neural reinforcement, that serves to orchestrate the re-entrance and refinement of neural population dynamics for the production of neural trajectories.”

      "....after which it was quickly translated to first experimental studies using cortical or subcortical beta signals in human patients44." - reference 44 only deals with the use of subcortical beta, not cortical, in adaptive control.

      The reviewer is right, in fact there is no study using motor cortex beta for adaptive DBS yet, but different studies have used different markers (especially gamma) since then. 

      Changes in manuscript: We have rephrased and added citations accordingly: “This approach, also termed adaptive DBS, was first demonstrated based on cortical beta activity that was used to adapt pallidal DBS in the MPTP non-human primate model of PD43. It was quickly translated to first experimental studies using subcortical beta signals in human patients44, followed by further research using more complex cortical and subcortical sensing setups and biomarker combinations45,46.”

      The paragraph headed " Implications for neurotechnology" is quite long and should be condensed and focused. It doesn't seem to support the last sentence, "....targeted interventions that can increase and decrease beta activity, as recently shown through phase specific modulation45 could be utilised to mimic phasic dopamine release as a neuroprosthetic approach to alter neural reinforcement38." - I don't quite follow the logic. The authors have clearly shown that beta-related circuits tend to be those linked to dopamine modulation, and may subserve tasks for which reinforcement learning is an important mechanism. However the logic of how modulation of beta activity can "substitute" for modulation of dopamine isn't clear. That would seem to require that the mechanism by which dopamine produces reinforcement, is via an effect on beta oscillation properties (phase, amplitude, frequency). Is there evidence for this? If so it should be better spelled out.

      We realize that this is very speculative at this point. Indeed, we believe that subthalamic DBS can mimic dopaminergic control and in the future there may be new treatment avenues, e.g. using neurochemical using neurochemical interfaces for which beta could be informative to mimic dopamine release but ultimately explaining this would be very complex, so we have removed the sentence. With regard to the remaining text in the section, we considered shortening / condensing but felt that this paragraph is highly relevant for the ongoing development of neurotechnology and therefore decided to only remove the first and last sentences.

      Changes in manuscript: We have removed the first and last sentences.

      "While the abovementioned prospects are promising we should cautiously consider the limitations of our study." - an unnecessary sentence to start a "limitations" section, its clearly a paragraph about limitations. In general, authors should go thru discussion and reduce verbosity; it is not nearly as well edited as the rest of the paper.

      Agreed. 

      Changes in manuscript: We removed the sentence. 

      Reviewer #3 (Public Review):

      Summary:

      In this paper, Chikermane et al. leverages a large open dataset of intracranial recordings (sEEG or ECoG) to analyze resting state (eyes closed) oscillatory activity from a variety of human brain areas. The authors identify a dominant proportion of channels in which beta band activity (12-30Hz) is most prominent and subsequently seek to relate this to anatomical connectivity data by using the sEEG/ECoG electrodes as seeds in a large set of MRI data from the human connectome project. This reveals separate regions and white matter tracts for alpha (primarily occipital) and beta (prefrontal cortex and basal ganglia) oscillations. Finally, using a third available dataset of PET imaging, the authors relate the parcellated signals to dopamine signaling as estimated by spatial uptake patterns of dopamine, and reveal a significant correlation between the functional connectivity maps and the dopamine reuptake maps, suggesting a functional relationship between the two.

      Strengths:

      Overall, I found the paper well justified, focused on an important topic, and interesting. The authors' use of 3 different open datasets was creative and informative, and it significantly adds to our understanding of different oscillatory networks in the human brain, and their more elusive relation with neuromodulator signaling networks by adding to our knowledge of the association between beta oscillations and dopamine signaling. Even my main comments about the lack of a theta network analysis and discussion points are relatively minor, and I believe this paper is valuable and informative.

      Weaknesses:

      The analyses were adequate, and the authors cleverly leveraged these different datasets to build an interesting story. The main aspect I found missing (in addition to some discussion items, see below) was an examination of the theta network. Theta oscillations have been involved in a number of cognitive processes including spatial navigation and memory, and have been proposed to have different potential originating brain regions, and it would be informative to see how their anatomical networks (e.g. as in Figure 2) look like under the author's analyses.

      The authors devote a significant portion of the discussion to relating their findings to a popular hypothesis for the function of beta oscillations, the maintenance of the "status quo", mostly in the context of motor control. As the authors acknowledge, given the static nature of the data and lack of behavior, this interpretation remains largely speculative and I found it a bit too far-reaching given the data shown in the paper. In contrast, I missed a more detailed discussion on the growing literature indicating a role for beta in mood (e.g. in Kirkby et al. 2018), especially given the apparent lack of hippocampal and amygdala involvement in the paper, which was surprising.

      We thank the reviewer for their insightful review of our manuscript. One of the aims of our paper was to provide the ground for a circuit-based conceptualization of beta activity, which does not primarily relate to behavior. Practically we have the ambition to provide a generalizable concept that can be applied to all behavioral domains including mood. The reason we focus on the “status quo” hypothesis, is that it is one of the very few if not only generalizable concept of the function of beta oscillations. Through our paper and the discussion, we have to redirect this concept towards a less cognitive/behavioral and more anatomical network based domain, while acknowledging principles that may overlap. We realize that this is very ambitious and this endeavour is necessarily very complex and not easy to communicate. In light of the reviewers comments, we have made an effort to improve the discussion as best we could without trailing too far away from what our initial aim was. We are thankful for the suggested reference, which we have now added to the discussion in the section where we have previously discussed beta as biomarker for mood, also noting the absence of beta dominant channels in amygdala and hippocampus. Here it should be clarified however, that a) only three channels were located in the amygdala of which one exhibited beta activity, we should be cautious to not overinterpret this result and b) most channels exhibited beta and just because beta wasn’t dominant, it doesn’t mean that beta is not present or important in these brain areas. Absence of evidence is not evidence for absence with the way we approached the analysis. We are thankful for the interesting reference, which we have now included our discussion. Notably the study used a complex network analysis, which we could not perform because we did not have parallel recordings from these areas in multiple patients. This is now noted in the limitations. 

      Changes in manuscript: “For example, it was shown that beta is implicated in working memory28, utilisation of salient sensory cues29, language processing30, motivation31, sleep32, emotion recognition33, mood34 and may even serve as a biomarker for depressive symptom severity in the anterior cingulate cortex35” and “One impactful study reported that beta oscillatory sub-networks of Amygdala and hippocampus could reflect human variations in mood 34. This is interesting, but highlights another relevant limitation of our study, namely that recordings in different areas were stemming from different patients and thus, such sub-network analyses on the oscillatory level could not be conducted.” 

      Major comment:

      • Although the proportion of electrodes with theta-dominant oscillations was lower (~15%) than alpha (~22%) or beta (~57%), it would be very valuable to also see the same analyses the authors carried out in these frequency bands extended to theta oscillations.

      We agree with the reviewer and appreciate the interest in other frequency bands; theta, alpha and gamma. Our primary interest was to provide a network concept of beta activity, but anticipated that interest would go beyond that frequency band. However, we also had to limit ourselves to what is communicable and comprehensible. The key aim for us was to provide a data-driven circuit description of beta activity that can lay ground for a generalizable concept of where beta oscillations emerge. Reproducing all analyses for every frequency band would clutter both the results and the discussion. Moreover, the honest truth is that funding and individual career plans of the researchers currently do not allow to allocate time for a reanalysis of all data which would be a significant effort. Therefore, we have decided to just add the topography of theta and gamma channels as a supplement. In case the reviewer is interested on a collaboration on extending this project to other frequency bands and circuits, we would like to invite them to get in touch and perhaps this could be a new collaborative project. Until then, we have extended our limitation that this would be important work for the future. 

      Changes in manuscript: 

      We have added and cited the new supplementary figure for the results from theta in the results section, which now reads: 

      “Further information on the topography of theta channels are shown in supplementary figure 1.”

      We would like to add that a sensible interpretation of results from gamma dominant channels is unlikely to be possible given the low count of channels with prominent resting activity in this frequency band. We have added the following text to the limitations section: “The aim of this study was to elucidate the circuit architecture of beta oscillations, which is why insights from this study for other frequency bands are limited. Future research investigating the specific circuits of theta, alpha and gamma oscillations and their relationship with neurotransmitter uptake could yield new important insights on the networks underlying human brain rhythms.“ 

      Reviewer #3 (Recommendations For The Authors):

      Minor comments:

      • Results: "we performed non-parametric Spearman's correlations between the structural and functional connectivity maps of beta networks with neurotransmitter uptake". This is a significantly complex analysis that requires more detail for the reader to evaluate. There is more detail in the Figure 3 legend but still insufficient. The Methods offer more detail, but I found the description of the parcellation to be vague and I would appreciate a more detailed description.

      We thank the reviewer for bringing the insufficient explanation of the methods used to calculate the correlations in analysis to our attention. We have now made an effort to provide more level of detail in the relevant paragraphs. 

      Changes in manuscript: We have now made changes to both the Results and Methods sections and added the following explanations respectively:

      Results: “Next, we resliced the beta network map and the PET images to allow for a meaningful comparison, using a combined parcellation with 476 brain regions that include cortex19, basal ganglia20, and cerebellum21. Here, each parcel – which was a collection of voxels belonging to a particular brain region – from the connectivity map was correlated with the same parcel containing average neurotransmitter uptake from the respective PET scan (see Figure 3A). In this way nonparametric Spearman’s correlations between PET intensity and structural and functional connectivity maps of beta networks were obtained, which indicate to what degree the spatial distribution of connectivity is similar to the distribution of neurotransmitter uptake.“

      Methods: “A custom master parcellation in MNI space was created in Matlab using SPM functions by combining three existing parcellations to include cortical regions19, structures of the basal ganglia20 and cerebellar regions21. Regions that were (partially) overlapping between the atlases were only selected once. The final compound parcellation had 476 regions in total. This parcellation was applied to both PET and structural and functional connectivity maps using SPM and custom code. This allowed for the calculation of spatial correlations, providing a statistical measure of spatial similarity of the PET intensity and MRI connectivity distributions. For this, Spearman’s ranked correlations were used to calculate correlations between the PET images, such as the dopamine aggregate map and both functional and structural beta connectivity networks (Figure 3). The analysis was repeated for individual tracers showing similar results Supplementary figure 2. Finally, to validate these results, a control analysis was performed using a GABA PET scan from the same open dataset of neurotransmitter uptake following the same pipeline (Figure 2A, 2B).”

      • All of the recordings were taken in an eyes-closed condition. This is likely to affect the power of alpha oscillations; the authors should comment on this.

      We agree with the reviewer that this will likely have influenced the results. However, given that the key result of our paper is the abundance and circuit topography of beta oscillations, it is unlikely that increased alpha in some channels will have led to false positive results for beta. If anything, it may have increased the contrast leading to a more conservative estimate of which channels truly show strong beta dominance. On the other hand, we should acknowledge that this limitation can affect the interpretation of the alpha result. Another reason for us to primarily focus on beta in the discussion and results presentation. 

      Changes in manuscript: We now comment on this in the results:

      “It should be noted that that alpha recordings were performed in eyes closed which is known to increase alpha power, which may influence the generalizability of the alpha maps to an eyes open condition. However, given that our primary use of alpha was to act as a control, we believe that this should not affect the interpretability of the key findings of our study.” 

      • Although the relative proportion of theta and gamma channels is lower, it would be interesting to see the distribution of channels in a SOM figure.

      As described above, we have now added supplementary figure 1 that accommodates the topography but not the network analyses.

      • Figure legend - typo - "Neither, alpha nor beta" - no comma needed.

      Now fixed, thank you for pointing is to this lapse!

      • Results: " ere, we aimed to investigate the whole brain circuit representation of beta activity, which is impossible with current neurophysiology approaches" not entirely accurate; suggest rephrasing it to "Here, we aimed to investigate the whole brain circuit representation of beta activity, which is impossible with non-invasive neurophysiology approaches "

      Thank you for suggesting the alternative formulation. 

      Changes in manuscript: The text has been modified as per the suggestion and now reads “Here, we aimed to investigate the whole brain circuit representation of beta activity, which is impossible with non-invasive neurophysiology approaches”.

      • Results - typo - "cortical brain areas, that exhibit resting beta activity share a common brain network" - no comma needed.

      Thank you for the suggestion, the comma has been removed to better the flow of the sentence structure as suggested.

    2. eLife Assessment

      This study poses an important step forward in understanding the brain-network embedding of beta oscillations. The study advances our circuit-level understanding of the pathophysiology associated with dopaminergic alterations in psychiatric or neurological disorders. The study provides compelling evidence that beta oscillations across the neocortex and basal ganglia map onto shared functional and structural networks that show significant positive correlations with dopamine receptors.

    3. Reviewer #1 (Public review):

      The study by Chikermane and colleagues investigates functional, structural, and dopaminergic network substrate of cortical beta oscillations (13-30 Hz). The major strength of the work lies in the methodology taken by the authors, namely a multimodal lesion network mapping. First, using invasive electrophysiological recordings from healthy cortical territories of epileptic patients they identify regions with highest beta power. Next, they leverage open access MRI data and PET atlases and use the identified high-beta regions as seeds to find (1) the whole-brain functional and structural maps of regions that form the putative underlying network of high-beta regions and (2) the spatial distribution of dopaminergic receptors that show correlation with nodal connectivity of the identified networks. These steps are achieved by generating aggregate functional, structural, and dopaminergic network maps using lead-DBS toolbox, and by contrasting the results with those obtained from high-alpha regions. The main findings are:

      (1) Beta power is strongest across frontal, cingulate, and insular regions in invasive electrophysiological data, and these regions map onto a shared functional and structural network.<br /> (2) The shared functional and structural networks show significant positive correlations with dopamine receptors across cortex and basal ganglia (which is not the case for alpha, where correlations are found with GABA).

    4. Reviewer #2 (Public review):

      Summary:

      This is a very interesting paper that leveraged several publicly available datasets: invasive cortical recording in epilepsy patients, functional and structural connectomic data, and PET data related to dopaminergic and gaba-ergic synapses. These were combined to create a unified hypothesis of beta band oscillatory activity in the human brain. They show that beta frequency activity is ubiquitous, and does not just occur in sensorimotor areas. Cortical regions where beta oscillations predominated had high connectivity to regions that are high in dopamine re-update.

      Strengths:

      The authors leverage and integrate three publicly available human brain datasets in a creative way. These public datasets are powerful tools for human neuroscience, and it is innovative to combine these three types of data into a common brain space to generate novel findings and hypotheses. Findings are nicely controlled by separately examining cortical regions where alpha predominates (which have a different connectivity pattern). GABA uptake from PET studies is used as a control for the specificity of the relationship between beta activity and dopamine uptake. There is much interest in synchronized oscillatory activity as a mechanism of brain function and dysfunction, but the field is short on unifying hypotheses of why particular rhythms predominate in particular regions. This paper contributes nicely to that gap. It is ambitious in generating hypotheses, particularly that modulation of beta activity may be used as a "proxy" for modulating phasic dopamine release.

      Weaknesses:

      As the authors point out, the use of normative data is excellent for exploring hypotheses but does not address or explore individual variations which could lead to other insights. It is also biased to resting state activity; maps of task related activity (if they were available) might show different findings.

      Challenges:

      In the Discussion, the authors do a fairly deep dive into the implications of their findings, particularly with respect to the hypothesis that beta band activity "preserves the status quo", and with respect to the use of beta band activity in controlling brain-machine interfaces. Mechanistically and theoretically oriented readers might gain rewarding new insights by a careful read of the discussion, but full appreciation of their deep dive may require real time interaction with the authors.

    5. Reviewer #3 (Public review):

      Summary:

      In this paper, Chikermane et al. leverage a large open dataset of intracranial recordings (sEEG or ECoG) to analyze resting state (eyes closed) oscillatory activity from a variety of human brain areas. The authors identify a dominant proportion of channels in which beta band activity (12-30Hz) is most prominent, and subsequently seek to relate this to anatomical connectivity data by using the sEEG/ECoG electrodes as seeds in a large set of MRI data from the human connectome project. This reveals separate regions and white matter tracts for alpha (primarily occipital) and beta (prefrontal cortex and basal ganglia) oscillations. Finally, using a third available dataset of PET imaging, the authors relate the parcellated signals to dopamine signaling as estimated by spatial uptake patterns of dopamine, and reveal a significant correlation between the functional connectivity maps and the dopamine reuptake maps, suggesting a functional relationship between the two.

      Strengths:

      Overall, I found the paper well justified, focused on an important topic and interesting. The authors' use of 3 different open datasets was creative and informative, and it significantly adds to our understanding of different oscillatory networks in the human brain, and their more elusive relation with neuromodulator signaling networks by adding to our knowledge of the association between beta oscillations and dopamine signaling. Even my main comments about the lack of a theta network analysis and discussion points are relatively minor, and I believe this paper is valuable and informative.

      Weaknesses:

      The analyses were adequate, and the authors cleverly leverage these different datasets to build an interesting story. The main aspect I found missing (in addition to some discussion items, see below) was an examination of the theta network. Theta oscillations have been involved in a number of cognitive processes including spatial navigation and memory, and have been proposed to have different potential originating brain regions, and it would be informative to see how their anatomical networks (e.g. as in Fig. 2) look like under the author's analyses.

      The authors devote a significant portion of the discussion to relating their findings to a popular hypothesis for the function of beta oscillations, the maintenance of the "status quo", mostly in the context of motor control. As the authors acknowledge, given the static nature of the data and lack of behavior, this interpretation remains largely speculative and I found it a bit too far-reaching given the data shown in the paper. In contrast, I missed a more detailed discussion on the growing literature indicating a role for beta in mood (e.g. in Kirkby et al. 2018), especially given the apparent lack of hippocampal and amygdala involvement in the paper, which was surprising.

    1. eLife Assessment

      This study offers a valuable genomic dataset, analyses, and functional studies on gonadal sex determination and development. The work addresses long-standing questions regarding the role of the Drosophila sex determination hierarchy, sex chromosomes, and the interaction between the sex determination hierarchy and sex chromosome composition in gonad development. Although this convincing work has been conducted rigorously, the authors missed some key opportunities in their analysis.

    2. Reviewer #1 (Public review):

      Transformer (tra) and Double Sex (dsx) genes influence the differentiation of sexual characteristics in Drosophila. A female-specific Tra protein regulates the dsx pre-mRNA splicing, which is required for the proper development of female-specific germ cells. The dsx gene regulates the development of sexual characteristics in both somatic and germline cells. The female-specific Dsx protein (DsxF) promotes female germline development, whereas the male-specific Dsx protein (DsxM) promotes male germline development. This regulation ensures that the germline cells develop in accordance with the sex karyotype of the organism. Together, they influence the sexual characteristics of both somatic and germline cells. This coordination is vital for fertility and the propagation of the species.

      In the article titled, "Diverse somatic Transformer and sex chromosome karyotype pathways regulate gene expression in Drosophila gonad development", the authors set out to compare the results of the gene expression patterns in the wild-type and transformed XX and XY germline cells, respectively, with an aim to understand the mechanism underlying the roles of tra and dsx genes. The authors hypothesised that somatic tra expression would be required for germline development and not for sex determination within germ cells. An independent germ cell-autonomous gene expression would be necessary for their sex determination. The authors also argued that the somatic tra activity would signal to germ cells through downstream gene expression for inducing the transformation which could be understood by comparing the phenotype and gene expression of the larval wild-type gonads and the sex-transformed tra gonads. The authors then set out to describe extensive scRNAseq data from different types of larval gonads viz., XX and XY female-type and XY and XX male-type gonads to conclude that sex determination in the germline and somatic cells is a complex process.

      Although the manuscript contains a lot of data, some of which could be useful to conclude a novel understanding regarding the abnormal transformation of the XX karyotype germ cells to male gonads, it suffers from incomplete analysis and poor organization. As a consequence, the authors ended up listing a lot of information with no clear conclusions.

      The manuscript in its current form is difficult to decipher by uninitiated readers. A thorough revision of the text and the presentation style of the data would significantly improve the message and its acceptance by a wider readership.

    3. Reviewer #2 (Public review):

      The manuscript by Mahadevaraju and colleagues addresses the very interesting question of how sex-specific gene expression is regulated downstream of the sex-determination decision during sexually dimorphic development. Most previous work has been done with adult "endpoint" analysis long after sex-specific gene expression and sex-specific development has been initiated, but this study appropriately focuses on earlier developmental stages. The authors use bulk RNA-seq of ovaries and testes where key sex determination factors have been altered, allowing for a comparison of XX "testes" and XY "ovaries" to their normal XX ovary and XY testis counterparts. This is interesting work that appears to be conducted in a rigorous manner, and will be beneficial for the community. However, I also feel that the authors miss some key opportunities in their analysis. In particular, they focus on the sexual state of the germline, which is a very interesting question, but they may actually be more poised to make interesting conclusions about the somatic cells of the gonad.

      One issue with the work is that there are no simple conclusions. This is not the fault of the authors or the work but of mother nature, which has made it particularly difficult to parse out the different contributions that regulate germline sex determination-those regulated by the germline's own sex chromosome constitution and those regulated by the sex of the surrounding soma. While this makes a paper more difficult to write and interpret, it is simply the truth, and the authors deal with this complexity very well. One aspect of this work that is more clear than others is that germ cells do not enter, or at least go very far, down the spermatogenesis pathway unless they are XY germ cells in a male soma. This conclusion could be made more clear in the manuscript. The experiment generating genotypes where a Y chromosome is present regardless of X chromosome number or tra state, and then examining kl-3 expression is particularly nice, and makes the point clearly. The authors could be stronger overall about this conclusion.

      I also feel that there is a missed opportunity here. The experimental design utilizes sex transformation of the soma, but the manuscript focuses almost entirely on the germline. On one hand, this is problematic since the samples are mixed cell types with very different contributions of the germline to the overall tissue. While they can identify genes that are expressed primarily in the germline in normal males and females and use these for their analysis, there's no way to really tell whether this is also the case in transformed gonads or the total germline contribution to the bulk RNA-seq. I certainly don't discount their germline analysis, but these issues should be made clear in the manuscript. Second, and more important, is the fact that there would seem to be a wealth of changes in somatic gene expression, more directly regulated by the somatic sex determination machinery, that seems ripe for analysis. In addition, nice experiments like the comparison of tra- XX males with dsxD/- XX males, which can beautifully identify genes that are regulated by tra independently of dsx, are only glossed over in the analysis, results, and discussion.

      I feel that a better analysis of somatic sexual development would be highly beneficial.

    4. Reviewer #3 (Public review):

      Summary:

      This paper is focused on gonad development, with an examination of the role of the Drosophila somatic sex determination hierarchy, sex chromosomes, and the interaction between the sex determination hierarchy and sex chromosome composition. The authors use bulk RNA-seq, long-read RNA-seq, and additional published single-cell RNA-seq data sets to examine gene expression in wild-type male and female gonads and in sex-transformed gonads that have functional alterations of the sex determination hierarchy gene, transformer. In these latter genotypes, the authors generate animals that are chromosomally XX with testes, and chromosomally XY with ovaries. The data were collected from larval gonads, as adults have substantial germ cell loss when sex is transformed. In addition, the authors characterize the cell biology of the gonads using well-established antibody markers and expression patterns. The authors show that there is no simple pathway controlling why the sex of the somatic tissue and germline need to match. Their data clearly show that both sex chromosome karyotype and somatic transformer status regulate gene expression together, with fewer germline gene expression patterns regulated by karyotype alone.

      This a complete study where the authors go beyond gene expression and examine impacts on splicing, with one interesting focus on the sex hierarchy splicing factor sex-lethal, and also on the role of the sex hierarchy gene doublesex. Gonad development in sex-transformed animals has been challenging to understand, in terms of the interactions between somatic sex determination, germline sex determination, and karyotype. This paper adds an important step, with high-resolution genomic, molecular, and cellular understanding.

      Strengths:

      The genomic experiments are rigorously performed, with appropriate replication and statistical analyses. The authors do high-resolution cell biological quantification, with some validation of the genomic results. The authors also provide a webpage for dynamic viewing of feature plots, which will be a valuable resource for colleagues. Overall, the authors do a good job providing context for their readers, especially providing older literature reports and findings.

      Weaknesses:

      A minor weakness is that they did not provide validation of their newly developed gene-specific reporter tools.

    1. eLife Assessment

      The study presents important findings that reveal SEPHS2 and VPS37C as new potential drug targets for dasatinib and hydroxychloroquine respectively in addition to confirming known targets of these drugs. The evidence provided is solid, however, some of the claims are not fully supported by the data. To enhance the conclusions and readability, the writing clarity, data analysis and justification of experimental design rationale need to be worked on to enhance the study's interest among chemical biologists, biochemists, and scientists in drug discovery.

    2. Reviewer #1 (Public review):

      In this manuscript, Sun et al report the development of a POST-IT (Pup-On-target for Small molecule Target Identification Technology) approach for drug target identification. Generally, this new technology applies a non-diffusive proximity tagging system by utilizing an engineered fusion of proteasomal accessory factor A (PafA) and HaloTag to transfer prokaryotic ubiquitin-like protein (Pup) to proximal proteins upon directly binding to the small molecule. After the pupylated targets are captured, they are able to be detected by mass spectrometry. Significant optimization (Lys-Arg and other mutations) was conducted to eliminate the interference of self-pupylation, polypupylation, and depupylation, POST-IT was successfully applied for the target identification of 2 well-known drugs: dasatinib and hydroxychloroquine, which yielded SEPHS2 and VPS37C as their new potential targets, respectively. Furthermore, POST-IT was also applied in live zebrafish embryos, highlighting its potential for broad biological research and drug development.

      This work was well designed and the experiments were logically conducted. The solid results support POST-IT as a promising technology for new drug target identification.

      Weakness and limitations:

      (1) The technology requires a halo-tagged derivation of the active compound, and the linked position will have a huge impact on the potential "target hits" of the molecules. Given the fact that most of the active molecules lack of structure-activity relationship information, it is very challenging to identify the optimal position of the halo tag linkage.

      (2) Although POST-IT works in zebrafish embryos, there is still a long way to go for the broad application of the technology in other animal models.

      (3) The authors identified SEPHS2 as a new potential target of dasatinib and further validated the direct binding of dasatinib with this protein. However, considering the super strong activity of dasatinib against c-Src (sub nanomolar IC50 value), it is hard to conclude the contribution of SEPHS2 binding (micromolar potency) to its antitumor activity.

    3. Reviewer #2 (Public review):

      Summary:

      The study by Sun et al. introduces a useful system utilizing the proteasomal accessory factor A (PafA) and HaloTag for investigating drug-protein interactions in both in vitro (cell culture) and in vivo (zebrafish) settings. The authors presented the development and optimization of the system, as well as examples of its application and the identification of potential novel drug targets. However, the manuscript requires considerable improvements, particularly in writing and justification of experimental design. There are several inaccuracies in data description and a lack of statistics in some figures, undermining the conclusions drawn in the manuscript. Additionally, the authors introduced variants of the ligands and their cognate substrates, yet their use in different experiments appears random and lacks justification. It is challenging for readers to remember and track the specific properties of each variant, further complicating the interpretation of the results.

      The conclusions of this paper are mostly backed by data, but certain aspects of data analysis and description require further clarification and expansion.

    4. Reviewer #3 (Public review):

      Summary:

      This manuscript introduces POST-IT (Pup-On-target for Small molecule Target Identification Technology), a novel non-diffusive proximity tagging system for identifying target proteins in live cells and organisms. This technology preserves cellular context essential for capturing specific drug-protein interactions, including transient complexes and membrane-associated proteins. Using an engineered fusion of proteasomal accessory factor A (PafA) and HaloTag, POST-IT specifically labels proximal proteins upon binding to a small molecule, with extensive optimization to enhance specificity and efficiency.

      Strengths:

      The study successfully identifies known targets and discovers new binders, such as SEPHS2 for dasatinib and VPS37C for hydroxychloroquine, advancing our understanding of their mechanisms. Additionally, its application in live zebrafish embryos demonstrates POST-IT's potential for widespread use in biological research and drug development.

      Weaknesses:

      Despite these promising results, several areas require further clarification or expansion to strengthen the manuscript:

      (1) Target Specificity: It is crucial for the authors to differentiate between the primary targets of the POST-IT system and those identified as side effects. This distinction is essential for assessing the specificity and utility of the technology.

      (2) In Vivo Target Identification: The manuscript lacks detailed clarity on which specific targets were successfully identified in the in vivo experiments. Expanding on this information would provide a clearer view of the system's effectiveness and scope in complex biological settings.

      (3) Reproducibility and Scalability: Discussion on the reproducibility of the POST-IT system across various experimental setups and biological models, as well as its scalability for larger-scale drug discovery programs, would be beneficial.

      (4) Quantitative Analysis: A more detailed quantitative analysis of the protein interactions identified by POST-IT, including statistical significance and comparative data against other technologies, would enhance the manuscript.

      (5) Technological Limitations: The authors should discuss any limitations or potential pitfalls of the POST-IT system, which would be crucial for future users and for guiding subsequent improvements.

      (6) Long-Term Stability and Activity: Information on the long-term stability and activity of the POST-IT components in different biological environments would ensure the reliability of the system in prolonged experiments.

      (7) Comparison with Existing Technologies: A detailed comparison with existing proximity tagging and target identification technologies would help position POST-IT within the current landscape, highlighting its unique advantages and potential drawbacks.

      (8) Concerns Regarding Overexposed Bands: Several figures in the manuscript, specifically Figure 3A, 3B, 3C, 3F, 3G, Figure 4D, and the second panels in Figure 7C as well as some figures in the supplementary file, exhibit overexposed bands.

      (9) Innovation Concern: There is a previous paper describing a similar approach: Liu Q, Zheng J, Sun W, Huo Y, Zhang L, Hao P, Wang H, Zhuang M. A proximity-tagging system to identify membrane protein-protein interactions. Nat Methods. 2018 Sep;15(9):715-722. doi: 10.1038/s41592-018-0100-5. Epub 2018 Aug 13. PMID: 30104635. It is crucial to explicitly address the novel aspects of POST-IT in contrast to this earlier work.

    1. eLife Assessment

      This valuable paper shows image correlation spectroscopy (ICS) as a new tool to analyze the clustering of proteins involved in DNA damage response (DDR). The solid evidence presented demonstrates that this method is more sensitive than traditional focus counting, although some of the claims require further contextualization. This new method provides an alternative tool to analyze immuno-stained focus for researchers in the fields of DDR and cell biology.

    2. Reviewer #1 (Public review):

      Summary:

      This manuscript assesses the utility of spatial image correlation spectroscopy (ICS) for measuring physiological responses to DNA damage. ICS is a long-established (~1993) method similar to fluorescence correlation spectroscopy, for deriving information about the fluorophore density that underlies the intensity distributions of images. The authors first provide a technical but fairly accessible background to the theory of ICS, then compare it with traditional spot-counting methods for its ability to analyze the characteristics of γH2AX staining. Based on the degree of aggregation (DA) value, the authors then survey other markers of DNA damage and uncover some novel findings, such as that RPA aggregation inversely tracks the sensitivity to PARP inhibitors of different cell lines.

      The need for a more objective and standardized tool for analyzing DNA damage has long been felt in the field and the authors argue convincingly for this. The data in the manuscript are in general well-supported and of high quality, and show promise of being a robust alternative to traditional focus counting. However, there are a number of areas where I would suggest further controls and explanations to strengthen the authors' case for the robustness of their ICS method.

      Strengths:

      The spatial ICS method the authors describe and demonstrate is easy to perform and applicable to a wide variety of images. The DDR was well-chosen as an arena to showcase its utility due to its well-characterized dose-responsiveness and known variability between cell types. Their method should be readily useable by any cell biologist wanting to assess the degree of aggregation of fluorescent tags of interest.

      Weaknesses:

      The spatial ICS method, though of longstanding history, is not as intuitive or well-known as spot-based quantitation. While the Theory section gives a standard mathematical introduction, it is not as accessible as it could be. Additionally, the values of TNoP and DA shown in the Results are not discussed sufficiently with regard to their physical and physiological interpretation.

      The correlation of TNoP with γH2AX foci is high (Figure 2) and suggestive that the ICS method is suitable for measuring the strength of the DDR. The authors correctly mention that the number of spots found using traditional means can vary based on the parameters used for spot detection. They contrast this with their ICS detection method; however, the actual robustness of spatial ICS is not given equal consideration.

    3. Reviewer #2 (Public review):

      Summary:

      Immunostaining of chromatin-associated proteins and visualization of these factors through fluorescence microscopy is a powerful technique to study molecular processes such as DNA damage and repair, their timing, and their genetic dependencies. Nonetheless, it is well-established that this methodology (sometimes called "foci-ology") is subject to biases introduced during sample preparation, immunostaining, foci visualization, and scoring. This manuscript addresses several of the shortcomings associated with immunostaining by using image correlation spectroscopy (ICS) to quantify the recruitment of several DNA damage response-associated proteins following various types of DNA damage.

      The study compares automated foci counting and fluorescence intensity to image correlation spectroscopy degree of aggregation study the recruitment of DNA repair proteins to chromatin following DNA damage. After validating image correlation spectroscopy as a reliable method to visualize the recruitment of γH2AX to chromatin following DNA damage in two separate cell lines, the study demonstrates that this new method can also be used to quantify RPA1 and Rad51 recruitment to chromatin following DNA damage. The study further shows that RPA1 signal as measured by this method correlates with cell sensitivity to Olaparib, a widely-used PARP inhibitor.

      Strengths:

      Multiple proof-of-concept experiments demonstrate that using image correlation spectroscopy degree of aggregation is typically more sensitive than foci counting or foci intensity as a measure of recruitment of a protein of interest to a site of DNA damage. The sensitivity of the SKOV3 and OVCA429 cell lines to MMS and the PARP inhibitors Olaparib and Veliparib as measured by cell viability in response to increasing amounts of each compound is a valuable correlate to the image correlation spectroscopy degree of aggregation measurements.

      Weaknesses:

      The subjectivity of foci counting has been well-recognized in the DNA repair field, and thus foci counts are usually interpreted relative to a set of technical and biological controls and across a meaningful time period. As such:

      (1) A more detailed description of the numerous prior studies examining the immunostaining of proteins such as γH2AX, RAD51, and RPA is needed to give context to the findings presented herein.

      (2) The benefits of adopting image correlation spectroscopy should be discussed in comparison to other methods, such as super-resolution microscopy, which may also offer enhanced sensitivity over traditional microscopy.

      (3) Additional controls demonstrating the specificity of their antibodies to detection of the proteins of interest should be added, or the appropriate citations validating these antibodies included.

    4. Reviewer #3 (Public review):

      Summary:

      This paper described a new tool called "Image Correlation Spectroscopy; ICS) to detect clustering fluorescence signals such as foci in the nucleus (or any other cellular structures). The authors compared ICS DA (degree of aggregation) data with Imaris Spots data (and ImageJ Find Maxima data) and found a comparable result between the two analyses and that the ICS sometimes produced a better quantification than the Imaris. Moreover, the authors extended the application of ICS to detect cell-cycle stages by analyzing the DAPI image of cells. This is a useful tool without the subjective bias of researchers and provides novel quantitative values in cell biology.

      Strengths:

      The authors developed a new tool to detect and quantify the aggregates of immuno-fluorescent signals, which is a center of modern cell biology, such as the fields of DNA damage responses (DDR), including DNA repair. This new method could detect the "invisible" signal in cells without pre-extraction, which could prevent the effect of extracted materials on the pre-assembled ensembles, a target for the detection. This would be an alternative method for the quantification of fluorescent signals relative to conventional methods.

    1. eLife Assessment

      This important study provides a comprehensive analysis of how substitutions within the catalytic domain of the tyrosine kinase Met affect its sensitivity to inhibition by ATP-competitive, small molecule inhibitors and provides a mechanistic framework for understanding drug resistance. The evidence supporting the authors' claims is convincing, the data sets are comprehensive, and the analyses are rigorous. This work will be of broad interest to biochemists, structural biologists, and medicinal chemists.

    2. Reviewer #1 (Public review):

      Summary:

      In this work, the authors present a cornucopia of data generated using deep mutational scanning (DMS) of variants in MET kinase, a protein target implicated in many different forms of cancer. The authors conducted a heroic amount of deep mutational scanning, using computational structural models to augment the interpretation of their DMS findings.

      Strengths:

      This powerful combination of computational models, experimental structures in the literature, dose-response curves, and DMS enables them to identify resistance and sensitizing mutations in the MET kinase domain, as well as consider inhibitors in the context of the clinically relevant exon-14 deletion. They then try to use the existing language model ESM1b augmented by an XGBoost regressor to identify key biophysical drivers of fitness. The authors provide an incredible study that has a treasure trove of data on a clinically relevant target that will appeal to many.

      Weaknesses:

      However, the authors do not equally consider alternative possible mechanisms of resistance or sensitivity beyond the impact of mutation on binding, even though the measure used to discuss resistance and sensitivity is ultimately a resistance score derived from the increase or decrease of the presence of a variant during cell growth. There are also points of discussion and interpretation that rely heavily on docked models of kinase-inhibitor pairs without considering alternative binding modes or providing any validation of the docked pose. Lastly, the use of ESM1b is powerful but constrained heavily by the limited structural training data provided, which can lead to misleading interpretations without considering alternative conformations or poses.

    3. Reviewer #2 (Public review):

      Summary:

      This manuscript provides a comprehensive overview of potential resistance mutations within MET Receptor Tyrosine Kinase and defines how specific mutations affect different inhibitors and modes of target engagement. The goal is to identify inhibitor combinations with the lowest overlap in their sensitivity to resistant mutations and determine if certain resistance mutations/mechanisms are more prevalent for specific modes of ATP-binding site engagement. To achieve this, the authors measured the ability of ~6000 single mutants of MET's kinase domain (in the context of a cytosolic TPR fusion) to drive IL-3-independent proliferation (used as a proxy for activity) of Ba/F3 cells (deep mutational profiling) in the presence of 11 different inhibitors. The authors then used co-crystal and docked structures of inhibitor-bound MET complexes to define the mechanistic basis of resistance and applied a protein language model to develop a predictive model of inhibitor sensitivity/resistance.

      Strengths:

      The major strengths of this manuscript are the comprehensive nature of the study and the rigorous methods used to measure the sensitivity of ~6000 MET mutants in a pooled format. The dataset generated will be a valuable resource for researchers interested in understanding kinase inhibitor sensitivity and, more broadly, small molecule ligand/protein interactions. The structural analyses are systematic and comprehensive, providing interesting insights into resistance mechanisms. Furthermore, the use of machine learning to define inhibitor-specific fitness landscapes is a valuable addition to the narrative. Although the ESM1b protein language model is only moderately successful in identifying the underlying mechanistic basis of resistance, the authors' attempt to integrate systematic sequence/function datasets with machine learning serves as a foundation for future efforts.

      Weaknesses:

      The main limitation of this study is that the authors' efforts to define general mechanisms between inhibitor classes were only moderately successful due to the challenge of uncoupling inhibitor-specific interaction effects from more general mechanisms related to the mode of ATP-binding site engagement. However, this is a minor limitation that only minimally detracts from the impressive overall scope of the study.

    4. Reviewer #3 (Public review):

      Summary:

      In the manuscript 'Mapping kinase domain resistance mechanisms for the MET receptor tyrosine kinase via deep mutational scanning' by Estevam et al, deep mutational scanning is used to assess the impact of ~5,764 mutants in the MET kinase domain on the binding of 11 inhibitors. Analyses were divided by individual inhibitor and kinase inhibitor subtypes (I, II, I 1/2, and III). While a number of mutants were consistent with previous clinical reports, novel potential resistance mutants were also described. This study has implications for the development of combination therapies, namely which combination of inhibitors to avoid based on overlapping resistance mutant profiles. While one suggested pair of inhibitors with the least overlapping resistance mutation profiles was suggested, this manuscript presents a proof of concept toward a more systematic approach for improved selection of combination therapeutics. Furthermore, in a final part of this manuscript the data was used to train a machine learning model, the ESM-1b protein language model augmented with an XG Boost Regressor framework, and found that they could improve predictions of resistance mutations above the initial ESM-1b model.

      Strengths:

      Overall this paper is a tour-de-force of data collection and analysis to establish a more systematic approach for the design of combination therapies, especially in targeting MET and other kinases, a family of proteins significant to therapeutic intervention for a variety of diseases. The presentation of the work is mostly concise and clear with thousands of data points presented neatly and clearly. The discovery of novel resistance mutants for individual MET inhibitors, kinase inhibitor subtypes within the context of MET, and all resistance mutants across inhibitor subtypes for MET has clinical relevance. However, probably the most promising outcome of this paper is the proposal of the inhibitor combination of Crizotinib and Cabozantib as Type I and Type II inhibitors, respectively, with the least overlapping resistance mutation profiles and therefore potentially the most successful combination therapy for MET. While this specific combination is not necessarily the point, it illustrates a compelling systematic approach for deciding how to proceed in developing combination therapy schedules for kinases. In an insightful final section of this paper, the authors approach using their data to train a machine learning model, perhaps understanding that performing these experiments for every kinase for every inhibitor could be prohibitive to applying this method in practice.

      Weaknesses:

      This paper presents a clear set of experiments with a compelling justification. The content of the paper is overall of high quality. Below are mostly regarding clarifications in presentation.

      Two places could use more computational experiments and analysis, however. Both are presented as suggestions, but at least a discussion of these topics would improve the overall relevance of this work. In the first case it seems that while the analyses conducted on this dataset were chosen with care to be the most relevant to human health, further analyses of these results and their implications of our understanding of allosteric interactions and their effects on inhibitor binding would be a relevant addition. For example, for any given residue type found to be a resistance mutant are there consistent amino acid mutations to which a large or small or effect is found. For example is a mutation from alanine to phenylalanine always deleterious, though one can assume the exact location of a residue matters significantly. Some of this analysis is done in dividing resistance mutants by those that are near the inhibitor binding site and those that aren't, but more of these types of analyses could help the reader understand the large amount of data presented here. A mention at least of the existing literature in this area and the lack or presence of trends would be worthwhile. For example, is there any correlation with a simpler metric like the Grantham score to predict effects of mutations (in a way the ESM-1b model is a better version of this, so this is somewhat implicitly discussed).

      Indeed, this discussion relates to the second point this manuscript could improve upon: the machine learning section. The main actionable item here is that this results section seems the least polished and could do a better job describing what was done. In the figure it looks like results for certain inhibitors were held out as test data - was this all mutants for a single inhibitor, or some other scheme? Overall I think the implications of this section could be fleshed out, potentially with more experiments. As mentioned in the 'Strengths' section, one of the appealing aspects of this paper is indeed its potential wide applicability across kinases -- could you use this ML model to predict resistance mutants for an entirely different kinase? This doesn't seem far-fetched, and would be an extremely compelling addition to this paper to prove the value of this approach.

      Another area in which this paper could improve its clarity is in the description of caveats of the assay. The exact math used to define resistance mutants and its dependence on the DMSO control is interesting, it is worth discussing where the failure modes of this procedure might be. Could it be that the resistance mutants identified in this assay would differ significantly from those found in patients? That results here are consistent with those seen in the clinic is promising, but discrepancies could remain. Furthermore a more in depth discussion of the MetdelEx14 results is warranted. For example, why is the DMSO signature in Figure 1 - supplement 4 so different from that of Figure 1? And finally, there is a lot of emphasis put on the unexpected results of this assay for the tivantinib "type III" inhibitor - could this in fact be because the molecule "is highly selective for the inactive or unphosphorylated form of c-Met" according to Eathiraj et al JBC 2011?

      While this paper is crisply written with beautiful figures, the complexity of the data warrants a bit more clarity in how the results are visualized. Namely, clearly highlighting mutants that have previously reported and those identified by this study across all figures could help significantly in understanding the more novel findings of the work.

      Finally, the potential impacts and follow-ups of this excellent study could be communicated better - it is recommended that they advertise better this paper as a resource for the community both as a dataset and as a proof of concept. In this realm I would encourage the authors to emphasize the multiple potential uses of this dataset by others to provide answers and insights on a variety of problems. Related to this, the decision to include the MetdelEx14 results, but not discuss them at all is interesting, do the authors expect future analyses to lead to useful insights? Is it surprising that trends are broadly the same to the data discussed? And finally it could be valuable to have a small addition of introspection from the authors on how this approach could be altered and/or improved in the future to facilitate the general application of this approach for combination therapies for other targets.

    1. eLife Assessment

      This important study leverages an impressive and comprehensive longitudinal 16S microbiome dataset from baboons to provide insights regarding the use of a microbiome-based clock to predict biological age, with solid evidence for age-associated microbiome features and environmental and social variables that impact microbiome aging. This study of microbiomes as markers of host age will be relevant to a broad range of researchers, especially those interested in alternatives to measuring biological aging.

    2. Reviewer #1 (Public review):

      Summary:

      The authors used a subset of a very large, previously generated 16S dataset to:<br /> (1) assess age-associated features; and (2) develop a fecal microbiome clock, based on an extensive longitudinal sampling of wild baboons for which near-exact chronological age is known. They further seek to understand deviation from age-expected patterns and uncover if and why some individuals have an older or younger microbiome than expected, and the health and longevity implications of such variation. Overall, the authors compellingly achieved their goals of discovering age-associated microbiome features and developing a fecal microbiome clock. They also showed clear and exciting evidence for sex and rank-associated variation in the pace of gut microbiome aging and impacts of seasonality on microbiome age in females. These data add to a growing understanding of modifiers of the pace of age in primates, and links among different biological indicators of age, with implications for understanding and contextualizing human variation. However, in the current version, there are gaps in the analyses with respect to the social environment, and in comparisons with other biological indicators of age. Despite this, I anticipate this work will be impactful, generate new areas of inquiry, and fuel additional comparative studies.

      Strengths:

      The major strengths of the paper are the size and sampling depth of the study population, including the ability to characterize the social and physical environments, and the application of recent and exciting methods to characterize the microbiome clock. An additional strength was the ability of the authors to compare and contrast the relative age-predictive power of the fecal microbiome clock to other biological methods of age estimation available for the study population (dental wear, blood cell parameters, methylation data). Furthermore, the writing and support materials are clear, informative and visually appealing.

      Weaknesses:

      It seems clear that more could be done in the area of drawing comparisons among the microbiome clock and other metrics of biological age, given the extensive data available for the study population. It was confusing to see this goal (i.e. "(i) to test whether microbiome age is correlated with other hallmarks of biological age in this population"), listed as a future direction, when the authors began this process here and have the data to do more; it would add to the impact of the paper to see this more extensively developed. An additional weakness of the current set of analyses is that the authors did not explore the impact of current social network connectedness on microbiome parameters, despite the landmark finding from members of this authorship studying the same population that "Social networks predict gut microbiome composition in wild baboons" published here in eLife some years ago. While a mother's social connectedness is included as a parameter of early life adversity, overall the authors focus strongly on social dominance rank, without discussion of that parameter's impact on social network size or directly assessing it.

    3. Reviewer #2 (Public review):

      Summary:

      Dasari et al present an interesting study investigating the use of 'microbiota age' as an alternative to other measures of 'biological age'. The study provides several curious insights into biological aging. Although 'microbiota age' holds potential as a proxy of biological age, it comes with limitations considering the gut microbial community can be influenced by various non-age related factors, and various age-related stressors may not manifest in changes in the gut microbiota. The work would benefit from a more comprehensive discussion, that includes the limitations of the study and what these mean to the interpretation of the results.

      Strengths:

      The dataset this study is based on is impressive, and can reveal various insights into biological ageing and beyond. The analysis implemented is extensive and high-level.

      Weaknesses:

      The key weakness is the use of microbiota age instead of e.g., DNA-methylation-based epigenetic age as a proxy of biological ageing, for reasons stated in the summary. DNA methylation levels can be measured from faecal samples, and as such epigenetic clocks too can be non-invasive. I will provide authors a list of minor edits to improve the read, to provide more details on Methods, and to make sure study limitations are discussed comprehensively.

    1. eLife Assessment

      This is a valuable report of tracheal terminal cells (TTCs) in Drosophila being immune privileged. The authors demonstrated that TTCs lack the expression of membrane-associated peptidoglycan recognition receptor PGRP-LC, which protects these cells from activating immune pathway or JNK-mediated cell death to maintain TTC homeostasis. While genetic experiments using RNAi and overexpression are mostly convincing, the data on the expression of PGRP-LCx and cell death phenotypes following immune activation are currently incomplete. The work will be of interest to researchers in innate immunity across various model systems.

    2. Reviewer #1 (Public review):

      Summary:

      In their manuscript entitled "Terminal tracheal cells of Drosophila are immune privileged to maintain their Foxo-dependent structural plasticity", Bossen and colleagues determine that the terminal cells of the tracheal system differ from other larval tracheal cells in that they do not typically show an Imd-dependent immune response to fungal and viral infections. The authors reach this conclusion based on the expression of a reporter line, Drs-GFP. The authors speculate that this difference may reflect differential expression of an immune pathway component, as tracheal terminal cells (TTCs) do not respond to forced expression of PRGP-LS. The authors then go on to show that, unlike the other cells of the tracheal system, terminal cells do not express PGRP-LC as reported by a GAL4 enhancer trap. Forced expression of PGRP-LC in terminal cells resulted in reduced branching, cell damage, and features of the cell death program. These effects could be suppressed by the depletion of AP-1 or Foxo transcription factors. The authors show that Foxo plays a negative role in the branching of TTCs, with ectopic branching occurring upon RNAi (or under hypoxic conditions). The authors speculate that the immune privilege of the TTCs may have evolved to permit Foxo regulation of TTC branching.

      Strengths:

      The authors provide compelling genetic data.

      Weaknesses:

      (1) The authors state that after infection 34% of larvae were not GFP+ as defined by the detection of Drs-GFP in dorsal branches. The authors should clarify if these larvae are completely without response to infection, with no Drs-GFP in dorsal trunks and or other tracheal branches. If these larvae are entirely unresponsive, could authors indicate why this might be? Also, at this point in the manuscript, the authors are somewhat misleading regarding TTC expression of Drs-GFP - they should state at this point that there are some TTCs that do express Drs-GFP, and also should address their prior study of Drs-GFP induction which does not claim exclusion of TTC Drs-GFP expression.

      (2) The authors describe the terminal cell phenotype as "shrunken" but this implies loss of size or pruning, however, it is not clear whether the defects could equally be due to lack of growth or slower growth.

      (3) Figure 1 suggests that GFP+ dorsal branches are not uniform in their expression of Drs-GFP, it seems more patchy. The authors should define the fraction of dorsal branch cells that are Drs-GFP positive. Also, are fusion cells Drs-GFP positive?

      (4) Drs-GFP expression is largely absent from terminal cells; however, a still significant # of terminal cells show expression (8%). Authors argue that PRGP-LC expression is absent based on a GAL4 transgenic line. If this line reflects endogenous PRGP-LC expression, should there not be 8% positive TTCs? Or is the 8% Drs-GFP expression independent of the IMD receptor?

      (5) Figure 2: the authors state that TTCs are negative even with induced PRGP-LE expression - should there not be at least 8% that are positive?

      (6) The authors compare PRGP-LC expression to induction of cell death by expression of reaper and hid. Reaper and Hid had stronger effects and eliminated TTCs. See cleavage of caspase Dpc-1 in PRGP-LC expressing cells. Is caspase cleavage always diagnostic of apoptosis or could the weaker than rpr/hid phenotype imply a different function?

      (7) Drs-GFP expression is said to be "completely" absent from tracheal terminal cells when the entire tracheal system is expressing PGRP-LE.

      (8) Figure 5, TRE_RFP expression, is not convincing that it is higher or in terminal cells.

    3. Reviewer #2 (Public review):

      Summary:

      In this study, Bossen et al. looked at the immune status of the tracheal terminal cells (TTCs) in Drosophila larvae. The authors propose that these cells do show PGFP-LCx expression and, hence, lack immune function. Artificial overexpression of the PGRP-LCx in the TTCs causes these cells to undergo apoptosis.

      Strengths:

      Only a few groups have tried to look at the immune status of the trachea, though we know that AMPs are expressed there after infection. This exciting study attempts to understand the differences in the tracheal cells that do not produce AMPs upon infection.

      Weaknesses:

      The reason why the TTCs have some immune privilege still needs to be completely clear. Whether the phenotype is cell autonomous or contributes to the cellular immune system is not evaluated. As we know, crystal cells also maintain oxygen levels in larvae; whether in the absence of terminal trachea, the crystal cells have any role is not explored.

    4. Reviewer #3 (Public review):

      Summary:

      The authors report that tracheal terminal cells (TTCs) in Drosophila do not activate innate immunity following bacterial infection. They attribute this to the lack of expression of PGRP-LCx in these cells. Forced activation of the Imd pathway in TTCs leads to cell death and a reduction in tracheal branching. The authors propose a mechanism for cell death induction via pathways involving JNK, AP-1, and foxo. They suggest that the suppression of innate immunity in TTCs may serve to maintain their plasticity, preparing them for responses to hypoxic conditions.

      Strengths:

      (1) The study addresses the understudied area of immune privilege in innate immunity, providing a potentially important example in Drosophila TTCs.

      (2) The molecular characterization of the cell death pathway induced by forced Imd activation is well-executed and provides solid mechanistic insights.

      (3) The authors draw interesting parallels between Drosophila TTCs and mammalian endothelial cells, suggesting broader implications for their findings.

      Weaknesses:

      (1) The core premise of the study - that TTCs do not activate innate immunity following bacterial infection - relies heavily on a single readout (Drs reporter). Additional markers of immune activation would strengthen this crucial claim.

      (2) The evidence for the lack of PGRP-LCx expression in TTCs is based on a single GAL4 reporter line. Given the importance of this observation to the authors' model, validation using alternative methods would be beneficial.

      (3) The phenotypes observed upon forced activation of the Imd pathway in TTCs, while intriguing, may be influenced by non-physiological levels of pathway activation. The authors should address this potential caveat and consider examining the effects of more moderate pathway activation.

    1. eLife Assessment

      This useful study presents the first detailed and comprehensive description of brain sulcus anatomy of a range of carnivoran species based on a robust manual labeling model allowing species comparisons. Although the database is recognized and the method for reconstructing cortical surfaces is convincing, the evidence supporting the conclusions is incomplete due to the lack of appropriate quantitative measurements and analyses. Considering additional specimens to assess intraspecies variations, as well as exploring the functional correlates of interspecies differences would increase the scope of the study. Setting an instructive foundation for comparative anatomy, this study will be of interest to neuroscientists and neuroimaging researchers interested in that field, as well as in brain morphology and sulcal patterns, their phylogeny, and ontogeny in relation to functional development and behaviour.

    2. Reviewer #1 (Public review):

      Summary:

      The paper by Boch and colleagues, entitled Comparative Neuroimaging of the Carnivore Brain: Neocortical Sulcal Anatomy, compares and describes the cortical sulci of eighteen carnivore species, and sets a benchmark for future work on comparative brains.

      Based on previous observations, electrophysiological, histological and neuroimaging studies and their own observations, the authors establish a correspondence between the cortical sulci and gyri of these species. The different folding patterns of all brain regions are detailed, put into perspective in relation to their phylogeny as well as their potential involvement in cortical area expansion and behavioral differences.

      Strengths:

      This is a pioneering article, very useful for comparative brain studies and conducted with great seriousness and based on many past studies. The article is well-written and very didactic. The different protocols for brain collection, perfusion, and scanning are very detailed. The images are self-explanatory and of high quality. The authors explain their choice of nomenclature and labels for sulci and gyri on all species, with many arguments. The opening on ecology and social behavior in the discussion is of great interest and helps to put into perspective the differences in folding found at the level of the different cortexes. In addition, the authors do not forget to put their results into the context of the laws of allometry. They explain, for example, that although the largest brains were the most folded and had the deepest folds in their dataset, they did not necessarily have unique sulci, unlike some of the smaller, smoother brains.

      Weaknesses:

      The article is aware of its limitations, not being able to take into account inter-individual variability within each species, inter-hemispheric asymmetries, or differences between males and females. However, this does not detract from their aim, which is to lay the foundations for a correspondence between the brains of carnivores so that navigation within the brains of these species can be simplified for future studies. This article does not include comparisons of morphometric data such as sulci depth, sulci wall surface, or thickness of the cortical ribbon around the sulci.

    3. Reviewer #2 (Public review):

      Summary:

      The authors have completed MRI-based descriptions of the sulcal anatomy of 18 carnivoran species that vary greatly in behaviour and ecology. In this descriptive study, different sulcal patterns are identified in relation to phylogeny and, to some extent, behaviour. The authors argue that the reported differences across families reflect behaviour and electrophysiology, but these correlations are not supported by any analyses.

      Strengths:

      A major strength of this paper is using very similar imaging methods across all specimens. Often papers like this rely on highly variable methods so that consistency reduces some of the variability that can arise due to methodology.

      The descriptive anatomy was accurate and precise. I could readily follow exactly where on the cortical surface the authors referring. This is not always the case for descriptive anatomy papers, so I appreciated the efforts the authors took to make the results understandable for a broader audience.

      I also greatly appreciate the authors making the images open access through their website.

      Weaknesses:

      Although I enjoyed many aspects of this manuscript, it is lacking in any quantitative analyses that would provide more insights into what these variations in sulcal anatomy might mean. The authors do discuss inter-clade differences in relation to behaviour and older electrophysiology papers by Welker, Campos, Johnson, and others, but it would be more biologically relevant to try to calculate surface areas or volumes of cortical fields defined by some of these sulci. For example, something like the endocast surface area measurements used by Sakai and colleagues would allow the authors to test for differences among clades, in relation to brain/body size, or behaviour. Quantitative measurements would also aid significantly in supporting some of the potential correlations hinted at in the Discussion.

      Although quantitative measurements would be helpful, there are also some significant concerns in relation to the specimens themselves. First, almost all of these are captive individuals. We know that environmental differences can alter neocortical development and humans and nonhuman animals and domestication affects neocortical volume and morphology. Whether captive breeding affects neocortical anatomy might not be known, but it can affect other brain regions and overall brain size and could affect sulcal patterns. Second, despite using similar imaging methods across specimens, fixation varied markedly across specimens. Fixation is unlikely to affect the ability to recognize deep sulci, but variations in shrinkage could nevertheless affect overall brain size and morphology, including the ability to recognize shallow sulci. Third, the sample size = 1 for every species examined. In humans and nonhuman animals, sulcal patterns can vary significantly among individuals. In domestic dogs, it can even vary greatly across breeds. It therefore remains unclear to what extent the pattern observed in one individual can be generalized for a species let alone an entire genus or family. The lack of accounting for inter-individual variability makes it difficult to make any firm conclusions regarding the functional relevance of sulcal patterns.

    4. Author response:

      eLife Assessment

      This useful study presents the first detailed and comprehensive description of brain sulcus anatomy of a range of carnivoran species based on a robust manual labeling model allowing species comparisons. Although the database is recognized and the method for reconstructing cortical surfaces is convincing, the evidence supporting the conclusions is incomplete due to the lack of appropriate quantitative measurements and analyses. Considering additional specimens to assess intraspecies variations, as well as exploring the functional correlates of interspecies differences would increase the scope of the study. Setting an instructive foundation for comparative anatomy, this study will be of interest to neuroscientists and neuroimaging researchers interested in that field, as well as in brain morphology and sulcal patterns, their phylogeny, and ontogeny in relation to functional development and behaviour. 

      We are pleased that our primary objective of creating a comprehensive framework to navigate carnivoran brains is considered as successfully achieved and that our work is expected to be of broad interest to various disciplines, as it provides the foundation for future investigations into carnivoran brain organization.

      As we will set out below, a description of the major sulci is an appropriate measure for large-scale comparative anatomy — it is stable enough in the population of each species to not require a large N, provides a suitable variability across species, and can be related to other aspects of between-species diversity. We will include a number of additional species to increase the scope of the study, as suggested. Although a quantitative assessment of functional correlates is, in principle, beyond the scope of this first foundational paper, we will provide a first start of this as well. We emphasize, however, that this was a secondary outcome, emerging after first application of the framework.

      Public Reviews: 

      Reviewer #1 (Public review): 

      Summary: 

      The paper by Boch and colleagues, entitled Comparative Neuroimaging of the Carnivore Brain: Neocortical Sulcal Anatomy, compares and describes the cortical sulci of eighteen carnivore species, and sets a benchmark for future work on comparative brains. 

      Based on previous observations, electrophysiological, histological and neuroimaging studies and their own observations, the authors establish a correspondence between the cortical sulci and gyri of these species. The different folding patterns of all brain regions are detailed, put into perspective in relation to their phylogeny as well as their potential involvement in cortical area expansion and behavioral differences. 

      Strengths: 

      This is a pioneering article, very useful for comparative brain studies and conducted with great seriousness and based on many past studies. The article is well-written and very didactic. The different protocols for brain collection, perfusion, and scanning are very detailed. The images are self-explanatory and of high quality. The authors explain their choice of nomenclature and labels for sulci and gyri on all species, with many arguments. The opening on ecology and social behavior in the discussion is of great interest and helps to put into perspective the differences in folding found at the level of the different cortexes. In addition, the authors do not forget to put their results into the context of the laws of allometry. They explain, for example, that although the largest brains were the most folded and had the deepest folds in their dataset, they did not necessarily have unique sulci, unlike some of the smaller, smoother brains. 

      Weaknesses: 

      The article is aware of its limitations, not being able to take into account inter-individual variability within each species, inter-hemispheric asymmetries, or differences between males and females. However, this does not detract from their aim, which is to lay the foundations for a correspondence between the brains of carnivores so that navigation within the brains of these species can be simplified for future studies. This article does not include comparisons of morphometric data such as sulci depth, sulci wall surface, or thickness of the cortical ribbon around the sulci. 

      We thank the reviewer for their overwhelmingly positive evaluation of our work. As noted by the reviewer, our primary aim was to establish a framework for navigating carnivoran brains to lay the foundation for future research. We are pleased that this objective is deemed as successfully achieved.

      As the reviewer points out, we do not quantify within-species intraindividual differences. This is a conscious choice; we aimed to emphasize breadth of species over individuals, as is standard in large-scale comparative anatomy (cf. Heuer et al., 2023, eLife; Suarez et al., 2022, eLife). Following the logic of phylogenetic relationships, the presence of a particular sulcus in related species is also a measure of reliability. We felt safe in this choice, as previous work in both primates and carnivorans has shown that differences across major sulci across individuals are a matter of degree rather than a case of presence or absence (Connolly, 1950, External morphology of the primate brain, C.C. Thomas; Hecht et al., 2019 J Neurosci; Kawamuro 1971 Acta Anat., Kawamuro & Naito, 1977, Acta Anat.). In our revised manuscript, we aim to include some additional individuals of selected species as supplementary material, further illustrating this point.

      We feel that measures such as sulci depth, sulci wall surface, or thickness of the cortical ribbon are measures that vary more across individuals and we have therefore not included them in the study. In addition, these are measures that are not generally used as between-species comparative measures, whereas sulcal patterning is (cf. Amiez et al., 2019, Nat Comms; Connolly, 1950; Miller et al., 2021, Brain Behav Evol; Radinsky 1975, J Mammal; Radinsky 1969, Ann N Y Acad Sci; Welker & Campos 1963 J. Comp Neurol).

      Reviewer #2 (Public review): 

      Summary: 

      The authors have completed MRI-based descriptions of the sulcal anatomy of 18 carnivoran species that vary greatly in behaviour and ecology. In this descriptive study, different sulcal patterns are identified in relation to phylogeny and, to some extent, behaviour. The authors argue that the reported differences across families reflect behaviour and electrophysiology, but these correlations are not supported by any analyses. 

      Strengths: 

      A major strength of this paper is using very similar imaging methods across all specimens. Often papers like this rely on highly variable methods so that consistency reduces some of the variability that can arise due to methodology. 

      The descriptive anatomy was accurate and precise. I could readily follow exactly where on the cortical surface the authors referring. This is not always the case for descriptive anatomy papers, so I appreciated the efforts the authors took to make the results understandable for a broader audience. 

      I also greatly appreciate the authors making the images open access through their website. 

      Weaknesses: 

      Although I enjoyed many aspects of this manuscript, it is lacking in any quantitative analyses that would provide more insights into what these variations in sulcal anatomy might mean. The authors do discuss inter-clade differences in relation to behaviour and older electrophysiology papers by Welker, Campos, Johnson, and others, but it would be more biologically relevant to try to calculate surface areas or volumes of cortical fields defined by some of these sulci. For example, something like the endocast surface area measurements used by Sakai and colleagues would allow the authors to test for differences among clades, in relation to brain/body size, or behaviour. Quantitative measurements would also aid significantly in supporting some of the potential correlations hinted at in the Discussion. 

      Although quantitative measurements would be helpful, there are also some significant concerns in relation to the specimens themselves. First, almost all of these are captive individuals. We know that environmental differences can alter neocortical development and humans and nonhuman animals and domestication affects neocortical volume and morphology. Whether captive breeding affects neocortical anatomy might not be known, but it can affect other brain regions and overall brain size and could affect sulcal patterns. Second, despite using similar imaging methods across specimens, fixation varied markedly across specimens. Fixation is unlikely to affect the ability to recognize deep sulci, but variations in shrinkage could nevertheless affect overall brain size and morphology, including the ability to recognize shallow sulci. Third, the sample size = 1 for every species examined. In humans and nonhuman animals, sulcal patterns can vary significantly among individuals. In domestic dogs, it can even vary greatly across breeds. It, therefore, remains unclear to what extent the pattern observed in one individual can be generalized for a species, let alone an entire genus or family. The lack of accounting for inter-individual variability makes it difficult to make any firm conclusions regarding the functional relevance of sulcal patterns. 

      We thank the reviewer for their assessment of our work. The primary aim of this study was to establish a framework for navigating carnivoran brains by providing a comprehensive overview of all major neocortical sulci across eighteen different species. Given the inconsistent nomenclature in the literature and the lack of standardized criteria (“recipes”) for identifying the major sulci, we specifically focused on homogenizing the terminology and creating recipes for their identification. Moreover, we also generated digital surfaces of all brains and will also add sulcal masks to further facilitate future research building on our framework. We are pleased to hear that we succeeded in our primary objective.

      We respectfully disagree with the reviewer on two accounts, where we believe the reviewer is not judging the scope of the current work.

      The first is with respect to individual differences. To the best of our knowledge, differences between captive and wild animals, or indeed between individuals, do not affect the presence or absence of any major sulci. No differences in sulcal patterns were detected between captive and (semi-)wild macaques (cf. Sallet et al., 2011, Science; Testard et al., 2022, Sci Adv), different dog breeds (Hecht et al., 2019 J Neurosci) or foxes selectively bred to simulate domestication, compared to controls (Hecht et al., 2021 J. Neurosci). Indeed, we do not find major differences between wolf-like canid species, suggesting that a difference between individuals of the same species is even more unlikely. Nevertheless, we agree with the reviewer that building up a database like ours will benefit from providing as much information about the samples as possible to enable these issues to be tested. We, therefore, will update our table to include if the animals were from captive or wild populations. Moreover, we aim, where possible, to include both wild and captive animals of the same species if they are available in our revision.

      The second is in the quantification of structure/function relationships. We believe the sulci atlases themselves are the main deliverables of this project. We felt it prudent to include some qualitative descriptions of the relationship between sulci as we observed them and behaviours as known from the literature as an illustration of the possibilities that this foundational work opens us. This approach also allowed us to confirm previous findings based on observations from a less diverse range of carnivoran species and families (Radinsky 1968 J Comp Neurol; Radinsky 1969, Ann N Y Acad Sci; Welker & Campos 1963 J Comp Neurol; Welker & Seidenstein, 1959 J Comp Neurol). However, a full statistical framework for analysis is beyond the scope of this paper. Our group has previously worked on methods to quantitatively compare brain organization across species — indeed, we have developed a full framework for doing so (Mars et al., 2021, Annu Rev Neurosci), based on the idea that brains that differ in size and morphology should be compared based on anatomical features in a common feature space. Previously, we have used white matter anatomy (Mars et al., 2018, eLife) and spatial transcriptomics (Beauchamp et al., 2021, eLife). The present work presents the foundation for this approach to be expanded to sulcal anatomy, but the full development of this approach will be the topic of future communications.

      Nevertheless, we aim to include a first step quantitative analysis of the relationship between the presence and absence of particular sulci and the two behaviours of interest in our manuscript.

      We also would like to emphasize that we strongly believe that looking at measures of brain organization at a more detailed level than brain size or relative brain size is informative. Indeed, studies looking at correlations between brain size and particular behavioural variables, although very prominent in the literature, have found it very difficult to distinguish between competing behavioural hypotheses (Healy, 2021, Adaptation and the brain, OUP). In contrast, connectivity has a much more direct relationship to behavioural differences across species (Bryant et al., 2024, bioRxiv), as does sulcal anatomy (Amiez et al., 2019, Nat Comms; Miller et al., 2021, Brain Behav Evol). Moreover, such measures are less sensitive to the effects of fixation since that will affect brain size but not the presence or absence of a sulcus.

      Following the reviewer’s recommendations, we will endeavour to include an even broader range of species in the revised version.

    1. eLife Assessment

      This important paper by Lechler and colleagues describes the transcriptomic signature and fate of intermediate cells (ICs), a transient and poorly defined embryonic cell type in the skin. The paper convincingly shows through lineage tracing that ICs are granular and not spinous cell precursors, and through ectopic expression in vivo, that cell contractility, a mechanical feature of ICs, lies upstream of differentiation.

    2. Reviewer #1 (Public review):

      Summary:

      The authors address a fundamental question for cell and tissue biology using the skin epidermis as a paradigm and ask how stratifying self-renewing epithelia induce differentiation and upward migration in basal dividing progenitor cells to generate suprabasal barrier-forming cells that are essential for a functional barrier formed by such an epithelium. The authors show for the first time that an increase in intracellular actomyosin contractility, a hallmark of barrier-forming keratinocytes, is sufficient to trigger terminal differentiation. Hence the data provide in vivo evidence of the more general interdependency of cell mechanics and differentiation. The data appear to be of high quality and the evidences are strengthened through a combination of different genetic mouse models, RNA sequencing, and immunofluorescence analysis.

      To generate and maintain the multilayered, barrier-forming epidermis, keratinocytes of the basal stem cell layer differentiate and move suprabasally accompanied by stepwise changes not only in gene expression but also in cell morphology, mechanics, and cell position. Whether any of these changes is instructive for differentiation itself and whether consecutive changes in differentiation are required remains unclear. Also, there are few comprehensive data sets on the exact changes in gene expression between different states of keratinocyte differentiation. In this study, through genetic fluorescence labeling of cell states at different developmental time points the authors were able to analyze gene expression of basal stem cells and suprabasal differentiated cells at two different stages of maturation: E14 (embryonic day 14) when the epidermis comprises mostly two functional compartments (basal stem cells and suprabasal so-called intermediate cells) and E16 when the epidermis comprise three (living) compartments where the spinous layer separates basal stem cells from the barrier-forming granular layer, as is the case in adult epidermis. Using RNA bulk sequencing, the authors developed useful new markers for suprabasal stages of differentiation like MafB and Cox1. The transcription factor MafB was then shown to inhibit suprabasal proliferation in a MafB transgenic model.

      The data indicate that early in development at E14 the suprabasal intermediate cells resemble in terms of RNA expression, the barrier-forming granular layer at E16, suggesting that keratinocytes can undergo either stepwise (E16) or more direct (E14) terminal differentiation.

      Previous studies by several groups found an increased actomyosin contractility in the barrier-forming granular layer and showed that this increase in tension is important for epidermal barrier formation and function. However, it was not clear whether contractility itself serves as an instructive signal for differentiation. To address this question, the authors use a previously published model to induce premature hypercontractility in the spinous layer by using spastin overexpression (K10-Spastin) to disrupt microtubules (MT) thereby indirectly inducing actomyosin contractility. A second model activates myosin contractility more directly through overexpression of a constitutively active RhoA GEF (K10-Arhgef11CA). Both models induce late differentiation of suprabasal keratinocytes regardless of the suprabasal position in either spinous or granular layer indicating that increased contractility is key to induce late differentiation of granular cells. A potential weakness of the K10-spastin model is the disruption of MT as the primary effect which secondarily causes hypercontractility. However, their previous publications provided some evidence that the effect on differentiation is driven by the increase in contractility (Ning et al. cell stem cell 2021). Moreover, the data are confirmed by the second model directly activating myosin through RhoA. These previous publications already indicated a role for contractility in differentiation but were focused on early differentiation. The data in this manuscript focus on the regulation of late differentiation in barrier-forming cells. These important data help to unravel the interdependencies of cell position, mechanical state, and differentiation in the epidermis, suggesting that an increase in cellular contractility in most apical positions within the epidermis can induce terminal differentiation. Importantly the authors show that despite contractility-induced nuclear localization of the mechanoresponsive transcription factor YAP in the barrier-forming granular layer, YAP nuclear localization is not sufficient to drive premature differentiation when forced to the nucleus in the spinous layer.

      Overall, this is a well-written manuscript and a comprehensive dataset. Only the RNA sequencing result should be presented more transparently providing the full lists of regulated genes instead of presenting just the GO analysis and selected target genes so that this analysis can serve as a useful repository. The authors themselves have profited from and used published datasets of gene expression of the granular cells. Moreover, some of the previous data should be better discussed though. The authors state that forced suprabasal contractility in their mouse models induces the expression of some genes of the epidermal differentiation complex (EDC). However, in their previous publication, the authors showed that major classical EDC genes are actually not regulated like filaggrin and loricrin (Muroyama and Lechler eLife 2017). This should be discussed better and necessitates including the full list of regulated genes to show what exactly is regulated.

    3. Reviewer #2 (Public review):

      Summary:

      The manuscript from Prado-Mantilla and co-workers addresses mechanisms of embryonic epidermis development, focusing on the intermediate layer cells, a transient population of suprabasal cells that contributes to the expansion of the epidermis through proliferation. Using bulk-RNA they show that these cells are transcriptionally distinct from the suprabasal spinous cells and identify specific marker genes for these populations. They then use transgenesis to demonstrate that one of these selected spinous layer-specific markers, the transcription factor MafB is capable of suppressing proliferation in the intermediate layers, providing a potential explanation for the shift of suprabasal cells into a non-proliferative state during development. Further, lineage tracing experiments show that the intermediate cells become granular cells without a spinous layer intermediate. Finally, the authors show that the intermediate layer cells express higher levels of contractility-related genes than spinous layers and overexpression of cytoskeletal regulators accelerates the differentiation of spinous layer cells into granular cells.

      Overall the manuscript presents a number of interesting observations on the developmental stage-specific identities of suprabasal cells and their differentiation trajectories and points to a potential role of contractility in promoting differentiation of suprabasal cells into granular cells. The precise mechanisms by which MafB suppresses proliferation, how the intermediate cells bypass the spinous layer stage to differentiate into granular cells, and how contractility feeds into these mechanisms remain open. Interestingly, while the mechanosensitive transcription factor YAP appears deferentially active in the two states, it is shown to be downstream rather than upstream of the observed differences in mechanics.

      Strengths:

      The authors use a nice combination of RNA sequencing, imaging, lineage tracing, and transgenesis to address the suprabasal to granular layer transition. The imaging is convincing and the biological effects appear robust. The manuscript is clearly written and logical to follow.

      Weaknesses:

      While the data overall supports the authors' claims, there are a few minor weaknesses that pertain to the aspect of the role of contractility, The choice of spastin overexpression to modulate contractility is not ideal as spastin has multiple roles in regulating microtubule dynamics and membrane transport which could also be potential mechanisms explaining some of the phenotypes. Use of Arghap11 overexpression mitigates this effect to some extent but overall it would have been more convincing to manipulate myosin activity directly. It would also be important to show that these manipulations increase the levels of F-actin and myosin II as shown for the intermediate layer. It would also be logical to address if further increasing contractility in the intermediate layer would enhance the differentiation of these cells.

      The gene expression analyses are relatively superficial and rely heavily on GO term analyses which are of course informative but do not give the reader a good sense of what kind of genes and transcriptional programs are regulated. It would be useful to show volcano plots or heatmaps of actual gene expression changes as well as to perform additional analyses of for example gene set enrichment and/or transcription factor enrichment analyses to better describe the transcriptional programs

      Claims of changes in cell division/proliferation changes are made exclusively by quantifying EdU incorporation. It would be useful to more directly look at mitosis. At minimum Y-axis labels should be changed from "% Dividing cells" to % EdU+ cells to more accurately represent findings

      Despite these minor weaknesses the manuscript is overall of high quality, sheds new light on the fundamental mechanisms of epidermal stratification during embryogenesis, and will likely be of interest to the skin research community.

    4. Reviewer #3 (Public review):

      Summary:

      This is an interesting paper by Lechler and colleagues describing the transcriptomic signature and fate of intermediate cells (ICs), a transient and poorly defined embryonic cell type in the skin. ICs are the first suprabasal cells in the stratifying skin and unlike later-developing suprabasal cells, ICs continue to divide. Using bulk RNA seq to compare ICs to spinous and granular transcriptomes, the authors find that IC-specific gene signatures include hallmarks of granular cells, such as genes involved in lipid metabolism and skin barrier function that are not expressed in spinous cells. ICs were assumed to differentiate into spinous cells, but lineage tracing convincingly shows ICs differentiate directly into granular cells without passing through a spinous intermediate. Rather, basal cells give rise to the first spinous cells. They further show that transcripts associated with contractility are also shared signatures of ICs and granular cells, and overexpression of two contractility inducers (Spastin and ArhGEF-CA) can induce granular and repress spinous gene expression. This contractility-induced granular gene expression does not appear to be mediated by the mechanosensitive transcription factor, Yap. The paper also identifies new markers that distinguish IC and spinous layers and shows the spinous signature gene, MafB, is sufficient to repress proliferation when prematurely expressed in ICs.

      Strengths:

      Overall this is a well-executed study, and the data are clearly presented and the findings convincing. It provides an important contribution to the skin field by characterizing the features and fate of ICs, a much-understudied cell type, at high levels of spatial and transcriptomic detail. The conclusions challenge the assumption that ICs are spinous precursors through compelling lineage tracing data. The demonstration that differentiation can be induced by cell contractility is an intriguing finding and adds a growing list of examples where cell mechanics influence gene expression and differentiation.

      Weaknesses:

      A weakness of the study is an over-reliance on overexpression and sufficiency experiments to test the contributions of MafB, Yap, and contractility in differentiation. The inclusion of loss-of-function approaches would enable one to determine if, for example, contractility is required for the transition of ICs to granular fate, and whether MafB is required for spinous fate. Second, whether the induction of contractility-associated genes is accompanied by measurable changes in the physical properties or mechanics of the IC and granular layers is not directly shown. The inclusion of physical measurements would bolster the conclusion that mechanics lies upstream of differentiation.

      Finally, whether the expression of granular-associated genes in ICs provides them with some sort of barrier function in the embryo is not addressed, so the role of ICs in epidermal development remains unclear. Although not essential to support the conclusions of this study, insights into the function of this transient cell layer would strengthen the overall impact.

    5. Author response:

      Public Reviews: 

      Reviewer #1 (Public review): 

      Summary: 

      The authors address a fundamental question for cell and tissue biology using the skin epidermis as a paradigm and ask how stratifying self-renewing epithelia induce diCerentiation and upward migration in basal dividing progenitor cells to generate suprabasal barrier-forming cells that are essential for a functional barrier formed by such an epithelium. The authors show for the first time that an increase in intracellular actomyosin contractility, a hallmark of barrier-forming keratinocytes, is suCicient to trigger terminal diCerentiation. Hence the data provide in vivo evidence of the more general interdependency of cell mechanics and diCerentiation. The data appear to be of high quality and the evidences are strengthened through a combination of diCerent genetic mouse models, RNA sequencing, and immunofluorescence analysis. 

      To generate and maintain the multilayered, barrier-forming epidermis, keratinocytes of the basal stem cell layer diCerentiate and move suprabasally accompanied by stepwise changes not only in gene expression but also in cell morphology, mechanics, and cell position. Whether any of these changes is instructive for diCerentiation itself and whether consecutive changes in diCerentiation are required remains unclear. Also, there are few comprehensive data sets on the exact changes in gene expression between diCerent states of keratinocyte diCerentiation. In this study, through genetic fluorescence labeling of cell states at diCerent developmental time points the authors were able to analyze gene expression of basal stem cells and suprabasal diCerentiated cells at two diCerent stages of maturation: E14 (embryonic day 14) when the epidermis comprises mostly two functional compartments (basal stem cells and suprabasal so-called intermediate cells) and E16 when the epidermis comprise three (living) compartments where the spinous layer separates basal stem cells from the barrier-forming granular layer, as is the case in adult epidermis. Using RNA bulk sequencing, the authors developed useful new markers for suprabasal stages of diCerentiation like MafB and Cox1. The transcription factor MafB was then shown to inhibit suprabasal proliferation in a MafB transgenic model. 

      The data indicate that early in development at E14 the suprabasal intermediate cells resemble in terms of RNA expression, the barrier-forming granular layer at E16, suggesting that keratinocytes can undergo either stepwise (E16) or more direct (E14) terminal diCerentiation. 

      Previous studies by several groups found an increased actomyosin contractility in the barrier-forming granular layer and showed that this increase in tension is important for epidermal barrier formation and function. However, it was not clear whether contractility itself serves as an instructive signal for diCerentiation. To address this question, the authors use a previously published model to induce premature hypercontractility in the spinous layer by using spastin overexpression (K10-Spastin) to disrupt microtubules (MT) thereby indirectly inducing actomyosin contractility. A second model activates myosin contractility more directly through overexpression of a constitutively active RhoA GEF (K10Arhgef11CA). Both models induce late diCerentiation of suprabasal keratinocytes regardless of the suprabasal position in either spinous or granular layer indicating that increased contractility is key to induce late diCerentiation of granular cells. A potential weakness of the K10-spastin model is the disruption of MT as the primary eCect which secondarily causes hypercontractility. However, their previous publications provided some evidence that the eCect on diCerentiation is driven by the increase in contractility (Ning et al. cell stem cell 2021). Moreover, the data are confirmed by the second model directly activating myosin through RhoA. These previous publications already indicated a role for contractility in diCerentiation but were focused on early diCerentiation. The data in this manuscript focus on the regulation of late diCerentiation in barrier-forming cells. These important data help to unravel the interdependencies of cell position, mechanical state, and diCerentiation in the epidermis, suggesting that an increase in cellular contractility in most apical positions within the epidermis can induce terminal diCerentiation. Importantly the authors show that despite contractility-induced nuclear localization of the mechanoresponsive transcription factor YAP in the barrier-forming granular layer, YAP nuclear localization is not suCicient to drive premature diCerentiation when forced to the nucleus in the spinous layer. 

      Overall, this is a well-written manuscript and a comprehensive dataset. Only the RNA sequencing result should be presented more transparently providing the full lists of regulated genes instead of presenting just the GO analysis and selected target genes so that this analysis can serve as a useful repository. The authors themselves have profited from and used published datasets of gene expression of the granular cells. Moreover, some of the previous data should be better discussed though. The authors state that forced suprabasal contractility in their mouse models induces the expression of some genes of the epidermal diCerentiation complex (EDC). However, in their previous publication, the authors showed that major classical EDC genes are actually not regulated like filaggrin and loricrin (Muroyama and Lechler eLife 2017). This should be discussed better and necessitates including the full list of regulated genes to show what exactly is regulated. 

      We thank all the reviewers for their suggestions and comments.

      Thank you especially for the reminder to include gene lists. We had an excel document with all this data but neglected to upload it with the initial manuscript decision. This includes all the gene signatures for the diCerent cell compartments across development. We will also include a page that lists all EDC genes and whether they were up-regulated in intermediate cells and cells in which contractility was induced. Further, we note that all the RNA-Seq datasets are available for use on GEO. 

      In our previous publication, we indeed included images showing a lack of change in loricrin and filaggrin in the embryos where spastin was expressed in the diCerentiated epidermis. Consistent with this, there is no change in Lor mRNA levels by RNA-Seq, (it is one of the rare EDC genes that is unchanged). In contrast, Flg mRNA was up in the RNASeq, though we didn’t see a dramatic change in protein levels. We have not further pursued whether this reflects translational regulation. That said, our data clearly show that other genes associated with granular fate were increased in the contractile skin.  

      Reviewer #2 (Public review): 

      Summary: 

      The manuscript from Prado-Mantilla and co-workers addresses mechanisms of embryonic epidermis development, focusing on the intermediate layer cells, a transient population of suprabasal cells that contributes to the expansion of the epidermis through proliferation. Using bulk-RNA they show that these cells are transcriptionally distinct from the suprabasal spinous cells and identify specific marker genes for these populations. They then use transgenesis to demonstrate that one of these selected spinous layer-specific markers, the transcription factor MafB is capable of suppressing proliferation in the intermediate layers, providing a potential explanation for the shift of suprabasal cells into a non-proliferative state during development. Further, lineage tracing experiments show that the intermediate cells become granular cells without a spinous layer intermediate. Finally, the authors show that the intermediate layer cells express higher levels of contractilityrelated genes than spinous layers and overexpression of cytoskeletal regulators accelerates the diCerentiation of spinous layer cells into granular cells. 

      Overall the manuscript presents a number of interesting observations on the developmental stage-specific identities of suprabasal cells and their diCerentiation trajectories and points to a potential role of contractility in promoting diCerentiation of suprabasal cells into granular cells. The precise mechanisms by which MafB suppresses proliferation, how the intermediate cells bypass the spinous layer stage to diCerentiate into granular cells, and how contractility feeds into these mechanisms remain open. Interestingly, while the mechanosensitive transcription factor YAP appears deferentially active in the two states, it is shown to be downstream rather than upstream of the observed diCerences in mechanics. 

      Strengths: 

      The authors use a nice combination of RNA sequencing, imaging, lineage tracing, and transgenesis to address the suprabasal to granular layer transition. The imaging is convincing and the biological eCects appear robust. The manuscript is clearly written and logical to follow. 

      Weaknesses: 

      While the data overall supports the authors' claims, there are a few minor weaknesses that pertain to the aspect of the role of contractility, The choice of spastin overexpression to modulate contractility is not ideal as spastin has multiple roles in regulating microtubule dynamics and membrane transport which could also be potential mechanisms explaining some of the phenotypes. Use of Arghap11 overexpression mitigates this eCect to some extent but overall it would have been more convincing to manipulate myosin activity directly. It would also be important to show that these manipulations increase the levels of F-actin and myosin II as shown for the intermediate layer. It would also be logical to address if further increasing contractility in the intermediate layer would enhance the diCerentiation of these cells. 

      We agree with the reviewer that the development of additional tools to precisely control myosin activity will be of great use to the field. That said, our series of publications has clearly demonstrated that ablating microtubules results in increased contractility and that this phenocopies the eCects of Arhgef11 induced contractility (Ning et al, Cell Stem Cell 2021). Further, we showed that these phenotypes were rescued by myosin inhibition with blebbistatin. Our prior publications also showed a clear increase in junctional acto-myosin through expression of either spastin or Arhgef11, as well as increased staining for the tension sensitive epitope of alpha-catenin (alpha-18) (also in Ning et al, 2021).  We are not aware of tools that allow direct manipulation of myosin activity that currently exist in mouse models.  

      The gene expression analyses are relatively superficial and rely heavily on GO term analyses which are of course informative but do not give the reader a good sense of what kind of genes and transcriptional programs are regulated. It would be useful to show volcano plots or heatmaps of actual gene expression changes as well as to perform additional analyses of for example gene set enrichment and/or transcription factor enrichment analyses to better describe the transcriptional programs 

      We will include an excel document that lists all the gene signatures. Additionally, all of our data are deposited in GEO for others to perform their own analyses.  

      Claims of changes in cell division/proliferation changes are made exclusively by quantifying EdU incorporation. It would be useful to more directly look at mitosis. At minimum Y-axis labels should be changed from "% Dividing cells" to % EdU+ cells to more accurately represent findings 

      We will change the axis label to precisely match our analysis.  

      Despite these minor weaknesses the manuscript is overall of high quality, sheds new light on the fundamental mechanisms of epidermal stratification during embryogenesis, and will likely be of interest to the skin research community. 

      Reviewer #3 (Public review): 

      Summary: 

      This is an interesting paper by Lechler and colleagues describing the transcriptomic signature and fate of intermediate cells (ICs), a transient and poorly defined embryonic cell type in the skin. ICs are the first suprabasal cells in the stratifying skin and unlike laterdeveloping suprabasal cells, ICs continue to divide. Using bulk RNA seq to compare ICs to spinous and granular transcriptomes, the authors find that IC-specific gene signatures include hallmarks of granular cells, such as genes involved in lipid metabolism and skin barrier function that are not expressed in spinous cells. ICs were assumed to diCerentiate into spinous cells, but lineage tracing convincingly shows ICs diCerentiate directly into granular cells without passing through a spinous intermediate. Rather, basal cells give rise to the first spinous cells. They further show that transcripts associated with contractility are also shared signatures of ICs and granular cells, and overexpression of two contractility inducers (Spastin and ArhGEF-CA) can induce granular and repress spinous gene expression. This contractility-induced granular gene expression does not appear to be mediated by the mechanosensitive transcription factor, Yap. The paper also identifies new markers that distinguish IC and spinous layers and shows the spinous signature gene, MafB, is suCicient to repress proliferation when prematurely expressed in ICs. 

      Strengths: 

      Overall this is a well-executed study, and the data are clearly presented and the findings convincing. It provides an important contribution to the skin field by characterizing the features and fate of ICs, a much-understudied cell type, at high levels of spatial and transcriptomic detail. The conclusions challenge the assumption that ICs are spinous precursors through compelling lineage tracing data. The demonstration that diCerentiation can be induced by cell contractility is an intriguing finding and adds a growing list of examples where cell mechanics influence gene expression and diCerentiation. 

      Weaknesses: 

      A weakness of the study is an over-reliance on overexpression and suCiciency experiments to test the contributions of MafB, Yap, and contractility in diCerentiation. The inclusion of loss-of-function approaches would enable one to determine if, for example, contractility is required for the transition of ICs to granular fate, and whether MafB is required for spinous fate. Second, whether the induction of contractility-associated genes is accompanied by measurable changes in the physical properties or mechanics of the IC and granular layers is not directly shown. The inclusion of physical measurements would bolster the conclusion that mechanics lies upstream of diCerentiation. 

      We agree that loss of function studies would be useful. For MafB, these have been performed in cultured human keratinocytes, where loss of MafB and its ortholog cMaf results in a phenotype consistent with loss of spinous diCerentiation (Lopes-Pajares, Dev Cell 2015). Due to the complex genetics involved, generating these double mutant mice is beyond the scope of this study. Loss of function studies of myosin are also complicated by genetic redundancy of the non-muscle type II myosin genes, as well as the role for these myosins in actin cross linking in addition to contractility. In addition, we have found that these myosins are quite stable in the embryonic intestine, with loss of protein delayed by several days from the induction of recombination. Therefore, elimination of myosins by embryonic day e14.5 with our current drivers is not likely possible. Thus, generation of inducible inhibitors of contractility is a valuable future goal. 

      A number of recent papers have used AFM of skin sections to probe tissue rigidity. We have not attempted these studies and are unclear about the spatial resolution and whether, in the very thin epidermis at these stages we could spatially resolve diCerences. That said, we previously assessed the macro-contractility of tissues in which myosin activity was induced and demonstrated that there was a significant increase in this over a tissue-wide scale (Ning et al, Cell Stem Cell, 2021).  

      Finally, whether the expression of granular-associated genes in ICs provides them with some sort of barrier function in the embryo is not addressed, so the role of ICs in epidermal development remains unclear. Although not essential to support the conclusions of this study, insights into the function of this transient cell layer would strengthen the overall impact.  

      By traditional dye penetration assays, there is no epidermal barrier at the time that intermediate cells exist. One interpretation of the data is that cells are beginning to express mRNAs (and in some cases, proteins) so that they are able to rapidly generate a barrier as they become granular cells. We have attempted experiments to ablate intermediate cells with DTA expression - this resulted in ineCicient and delayed cell death and thus did not yield strong conclusions. Our findings that transcriptional regulators of granular diCerentiation (such as Grhl3 and Hopx) are also present in intermediate cells, should allow future analysis of the eCects of their ablation on the earliest stages of granular diCerentiation from intermediate cells.

    1. eLife Assessment

      This valuable study shows that eliminating a large portion of the principal neurons in the mammalian olfactory bulb does not affect the initial establishment of the circuit but has an impact on its maintenance. The strength of the paper is that the anatomical changes induced by genetic ablation of neurons are clear-cut. There is solid support for the findings, with a description of the structural and behavioral effects of ablating the majority of M/T neurons.

    2. Reviewer #1 (Public Review):

      This paper aims to address the establishment and maintenance of neural circuitry in the case of a massive loss of neurons. The authors used genetic manipulations to ablate the principal projection neurons, the mitral/tufted cells, in the mouse olfactory bulb. Using diphtheria toxin (Tbx21-Cre:: loxP-DTA line) the authors ablated progressively large numbers of M/T cells postnatally. By injecting diphtheria toxin (DT) into the Tbx21-Cre:: loxP-iDTR line, the authors were able to control the timing of the ablation in the adult stage. Both methods led to the successful elimination of a majority of M/TCs by 4 months of age. The authors made a few interesting observations. First, they found that the initial pruning of the remaining M/T cell primary dendrite was unaffected. However, in adulthood, a significant portion of these cells extended primary dendrites to innervate multiple glomeruli. Moreover, the incoming olfactory sensory neuron (OSN) axons, as examined for those expressing the M72 receptor, showed a divergent innervation pattern as well. The authors conclude that M/T cell density is required to maintain the dendritic structures and the olfactory map. To address the functional consequences of eliminating a large portion of principal neurons, the authors conducted a series of behavioral assays. They found that learned odor discrimination was largely intact. On the other hand, mating and aggression were reduced. The authors concluded that learned behaviors are more resilient than innate ones.

      The study is technically sound, and the results are clear-cut. The most striking result is the contrast between the normal dendritic pruning during early development and the expanded dendritic innervation in adulthood. It is a novel discovery that can lead to further investigation of how the single-glomerulus dendritic innervation is maintained. The authors conducted a few experiments to address potential mechanisms, but it is inconclusive, as detailed below. It is also interesting to see that the massive neuronal loss did not severely impact learned odor discrimination. This result, together with previous studies showing nearly normal odor discrimination in the absence of large portions of the olfactory bulb or scrambled innervation patterns, attests to the redundancy and robustness of the sensory system.

    3. Reviewer #2 (Public review):

      The authors make the interesting observation that the developmental refinement of apical M/T cell dendrites into individual glomeruli proceeds normally even when the majority of neighboring M/T cells are ablated. At later stages, the remaining neurons develop additional dendrites that invade multiple glomeruli ectopically and, similarly, OSN inputs to glomeruli lose projection specificity as well. The authors conclude that the normal density of M/T neurons is not required for developmental refinement, but rather for maintaining specific connectivity in adults.

      Comments on revised submission:

      The authors have adjusted the interpretation of their findings and as a consequence, the conclusions are now better supported by the data. However, the evidence for the absence of a role of firing in regulating ectopic dendrites is still insufficient.

    4. Author response:

      The following is the authors’ response to the original reviews.

      Reviewer #1 (Public Review):

      This paper aims to address the establishment and maintenance of neural circuitry in the case of a massive loss of neurons. The authors used genetic manipulations to ablate the principal projection neurons, the mitral/tufted cells, in the mouse olfactory bulb. Using diphtheria toxin (Tbx21-Cre:: loxP-DTA line) the authors ablated progressively large numbers of M/T cells postnatally. By injecting diphtheria toxin (DT) into the Tbx21-Cre:: loxP-iDTR line, the authors were able to control the timing of the ablation in the adult stage. Both methods led to the successful elimination of a majority of M/TCs by 4 months of age. The authors made a few interesting observations. First, they found that the initial pruning of the remaining M/T cell primary dendrite was unaffected. However, in adulthood, a significant portion of these cells extended primary dendrites to innervate multiple glomeruli. Moreover, the incoming olfactory sensory neuron (OSN) axons, as examined for those expressing the M72 receptor, showed a divergent innervation pattern as well. The authors conclude that M/T cell density is required to maintain the dendritic structures and the olfactory map. To address the functional consequences of eliminating a large portion of principal neurons, the authors conducted a series of behavioral assays. They found that learned odor discrimination was largely intact. On the other hand, mating and aggression were reduced. The authors concluded that learned behaviors are more resilient than innate ones.

      The study is technically sound, and the results are clear-cut. The most striking result is the contrast between the normal dendritic pruning during early development and the expanded dendritic innervation in adulthood. It is a novel discovery that can lead to further investigation of how the single-glomerulus dendritic innervation is maintained. The authors conducted a

      few experiments to address potential mechanisms, but it is inconclusive, as detailed below. It is also interesting to see that the massive neuronal loss did not severely impact learned odor discrimination. This result, together with previous studies showing nearly normal odor discrimination in the absence of large portions of the olfactory bulb or scrambled innervation patterns, attests to the redundancy and robustness of the sensory system. The discussion should take into account these other studies in a historical context.

      Main comments:

      (1) In previous studies, it has been concluded that dendritic pruning unfolds independently, regardless of the innervation pattern or activity of the OSNs. The new observation bolsters this conclusion by showing that a loss of neighboring M/T cells does not affect the developmental process. A more nuanced discussion comparing the results of these studies would strengthen the paper.

      We thank the reviewer for the suggestion. We now include an extended discussion citing relevant previous works in the manuscript (Lines 351-374).

      (2) The authors propose that a certain density of M/T is required to prevent the divergent innervation of primary dendrites, but the evidence is not sufficient to support this proposal. The experiment with low-dose DT injection to ablate a smaller portion of M/T cells did not change the percentage of cells innervating two or more glomeruli. The authors suggest that a threshold must be met, but this threshold is not determined.  

      In our experiments using high-dose DT, we hypothesized that there may be many empty glomeruli (glomeruli not innervated by M/T cells), and as a result, that some of the remaining M/T cells could branch their apical dendrite tuft into multiple empty glomeruli. To test this hypothesis, we carried out another experiment using a lower dose of DT. In this experiment, the fraction of remaining M/T cells was 25% (~10,000 M/T cells), which was higher than with the high DT dose (5%, or around 2,000 M/T cells) , but still significantly lower than wild type mice (~40,000 cells M/T cells). With around 2,000 glomeruli and 10,000 M/T per bulb, it could be expected that each glomerulus would be innervated by ~5 M/T cells (on average). However, we found that the percentage of M/T cells projecting to multiple glomeruli (around 40%) was similar when either 10,000 or 2,000 of M/T remained in the bulb. In addition, it is important to emphasize that even in wt animals with a full set of M/T cells, a small percentage of M/T cells still innervate more than one glomerulus (Lin et al., 2000). Together, these observations suggest that the innervation of multiple glomeruli by M/T cells is not simply due to the presence of empty glomeruli, and that our hypothesis was not correct.

      We have added a comment explaining this issue in the Results section (Lines 200-203).

      (3) The authors suggest that neural activity is not required for this plasticity. The evidence was derived primarily from naris occlusion and neuronal silencing using Kir2.1. While the results are consistent with the notion, it is a rather narrow interpretation of how neural activity affects circuit configuration. Perturbation of neural activity also entails an increase in firing. Inducing the activity of the neurons may alter this plasticity. Silencing per se may induce a homeostatic response that expands the neurite innervation pattern to increase synaptic input to compensate for the loss of activity. Thus, further silencing the cells may not reduce multiglomerular innervation, but an increased activity may.

      The experiments with Kir2.1 demonstrate that the structural plasticity observed after reducing the total number of M/T cells in an animal is not regulated by the firing action potentials in the remaining cells. Instead, this experiment indicates that the observed structural plasticity may be regulated by other types of mechanisms (including increased synaptic excitation as suggested by the reviewer) that do not require the firing of action potentials in M/T cells. 

      We now have included a comment regarding this point (Lines 243-247).  

      (4) There is a discrepancy between this study and the one by Fujimoto et al. (Developmental Cell; 2023), which shows that not only glutamatergic inputs to the primary dendrite can facilitate pruning of remaining dendrites but also Kir2.1 overexpression can significantly perturb dendritic pruning. This discrepancy is not discussed by the authors.

      We agree that it would be useful to contrast these two works.

      In our experiments, performed in adult animals, we blocked sensory input by performing naris occlusion before we induced ablation of M/T cells. In a separate experiment, also in adult animals, we expressed the Kir2.1 channel, to reduce the ability of neurons to fire action potentials. With both types of manipulations, we observed that the ablation of a large fraction of M/T cells still caused the remaining M/T cells to maintain a single apical dendrite that sprouts several new tufts towards multiple glomeruli. A recent paper (Fujimoto et al., 2023)) in which Kir2.1 was expressed in a large percentage of M/T starting during embryonic development showed that these “silent” M/T cells failed to prune their arbors to a single dendrite. In aggregate, these observations indicate that action potentials are necessary for the normal pruning that occurs during perinatal development (Fujimoto et al., 2023), but are not required for the expansion of dendritic trees caused by ablating a large fraction of M/T cells in adult animals (our current manuscript).

      We have now explained the differences between both studies in the manuscript (Lines 427-439).

      (5) An alternative interpretation of the discrepancy between the apparent normal pruning by p10 and expanded dendritic innervation in adulthood is that there are more cells before P10, when ~25% of M/T cells are present, but at a later date only 1-3% are present. 

      The relationship between the number of M/T cells and single glomerulus innervation has not been explored during postnatal development. It would be important to test this hypothesis.

      We agree with this comment, and in lines 375-381 we discuss the discrepancy between normal refinement during development, and dendritic sprouting in adults.

      Cre is expressed in M/T cells and it induces DTA expression starting around P0. The elimination of M/T cells starts at this time, and continues until by P10, when more than 75% of M/T have been eliminated. At P21 more than 90% of M/T have been eliminated, and their number remains stable thereafter.

      Pruning of the dendrites of M/T cells starts at P0 and it is mostly complete by P10. Therefore, it is possible that between P0 and P7, when dendrites are being pruned, the number of M/T cells remaining in the bulb is still over a threshold that does not interfere with the process of normal dendrite pruning. We agree that it would be very informative to perform additional experiments in the future where a large set of M/T cells could be ablated before pruning occurs (ideally before P0). 

      (6) The authors attribute the change in the olfactory map to the loss of M/T cells. Another obvious possibility is that the diffused projection is a response to the change in the olfactory bulb size. With less space to occupy, the axons may be forced to innervate neighboring glomeruli. It is not known how the total number of glomeruli is affected. This question could be addressed by tracking developmental changes in bulb volume and glomerular numbers.

      Certainly, this is a possibility, and we have now included a comment on this regard in the manuscript (Lines 473-480). 

      We believe that there are three likely scenarios that could account for these observations:

      (a) After ablating M/T cells, the tufts of the remaining M/T cells sprout into multiple glomeruli, and this causes the axons of OSNs to project into multiple glomeruli.

      (b) Ablating M/T cells may cause changes in other OB cells that make synapses in the glomeruli (ETCs, PGCs, sAC, etc…), and the misrouting of OSN axons that we observed in our experiments may be a secondary effect caused by the elimination of M/T cells.

      (c) After ablating the majority of M/T cells, the olfactory bulb gets reduced in size, and the axons of OSNs find it difficult to precisely converge on a target that now has become smaller. As a result, the axons of OSNs fail to converge on single glomeruli.

      (7) The retained ability to discriminate odors upon reinforced training is not surprising in light of a number of earlier studies. For example, Slotnick and colleagues have shown that rats losing ~90% of the OB can retain odor discrimination. Weiss et al have shown that humans without an olfactory bulb can perform normal olfactory tasks. Gronowitz et al have used theoretical prediction and experimental results to demonstrate that perturbing the olfactory map does not have a major impact on olfactory discrimination. Fleischmann et al have shown that mice with a monoclonal nose can discriminate odors. The authors should discuss their results in these contexts.

      We apologize for this important oversight - we now include a more elaborate discussion including the relevant references as suggested in the manuscript (Line 483-496).

      (8) It should be noted that odor discrimination resulting from reinforcement training does not mean normal olfactory function. It is a highly artificial situation as the animals are overtrained. It should not be used as a measure of the robustness of the olfactory sense. Natural odor discrimination (without training), detection threshold, and innate appetitive/aversive response to certain odors may be affected. These experiments were not conducted.

      We agree that the standard tests commonly used to measure olfactory function require substantial training, and thus, are quite artificial. However, these tests are used because they allow a more precise quantification of olfactory function than those relying on natural behaviors.  

      We have now included a few sentences to address this point in the results (Lines 321322) and discussion sections (Lines 541-543).

      (9) The social behaviors were conducted using relatively coarse measures (vaginal plug and display of aggression). Moreover, these behaviors are most likely affected by the disruption of the AOB mitral cells and have little to do with the dendritic pruning process described in the paper. It is misleading to lump social behaviors with innate responses to odors.

      This point follows the same logic as the previous one. The olfactory tests that rely on natural behaviors are quite coarse and difficult to quantify. In contrast, the olfactory tests using apparatuses such as olfactometers can be quantified with precision, but they are artificial. We agree that some of the naturalistic behaviors that we studied such as mating or aggression may depend to a large extent on the AOB (although it is possible that the MOB may also be involved in these tasks to a degree). In our initial version of the manuscript, we commented on the anticipated relative involvement of the MOB and AOB in the studied tasks, but we have now added some additional sentences to make this point clearer. In addition, we now add a comment indicating that it is possible that the abnormal behaviors could simply be due to a reduction in the number of AOB M/T cells (~98.5% and ~ 85% elimination of M/T cells in the AOB in Tbx::DTA and Tbx::iDTR mice, respectively), regardless of the abnormal dendritic pruning of main OB M/T cells (Lines 530-534).

      See Figure 5E - M/T cells in AOB (Lines 1238-1239). 

      Reviewer #2 (Public Review):

      The authors make the interesting observation that the developmental refinement of apical M/T cell dendrites into individual glomeruli proceeds normally even when the majority of neighboring M/T cells are ablated. At later stages, the remaining neurons develop additional dendrites that invade multiple glomeruli ectopically, and similarly, OSN inputs to glomeruli lose projection specificity as well. The authors conclude that the normal density of M/T neurons is not required for developmental refinement, but rather for maintaining specific connectivity in adults.

      The observations are indeed quite striking; however, the authors' conclusions are not entirely supported by the data.

      (1) It is unclear whether the expression of diphtheria toxin that eventually leads to the ablation of the large majority of M/T neurons compromises the cell biology of the remaining ones.

      DT is an extremely potent toxin that kills cells by inhibiting proteins translation, and it has been demonstrated that the presence of a single DT molecule in a cell is sufficient to kill it, because of its highly efficient catalytic activity. Accordingly, previous experiments have shown that DT kills cells within a few hours after its appearance in the cytoplasm (Yamaizumi et al., 1978). In other words, all the published evidence suggests that if a cell is exposed to the action of DT, that cell will die shortly. There is no evidence that cells exposed to DT can survive and experience long-term effects. Finally, previous works have not observed any long-term changes in neurons directly caused by the actions of DT (Johnson et al., 2017).

      (2) The authors interpret the growth of ectopic dendrites later in life as a lack of maintenance of dendrite structure; however, maybe the observed changes reflect actually adaptations that optimize wiring for extremely low numbers of M/T neurons. The finding that olfactory behavior was less affected than predicted supports this interpretation.

      We do not know the cellular or molecular mechanisms that explain why reducing the density of M/T cells is followed by the growth of ectopic dendrites from the remaining M/T cells. We agree that the functional outcome of growing ectopic dendrites may result in an optimization of wiring in the bulb and could explain why olfactory function is relatively preserved. We now include a comment regarding this possibility (Lines 513-525).   

      (3) The number of remaining M/T neurons is much higher at P10 than later. Can the relatively large number of remaining neurons (or their better health status) be the reason that dendrites refine normally at the early developmental stages rather than a (currently unknown) developmental capacity that preserves refinement?

      We thank the reviewer for the suggestion, which was also raised by reviewer 1. 

      We agree with this comment, and in lines 375-381 we discuss the discrepancy between normal refinement during development, and dendritic sprouting in adults.

      Cre is expressed in M/T cells and it induces DTA expression starting around P0. The elimination of M/T cells starts at this time, and continues until by P10, when more than 75% of M/T have been eliminated. At P21 more than 90% of M/T have been eliminated, and their number remains stable thereafter.

      Pruning of the dendrites of M/T cells starts at P0 and it is mostly complete by P10. Therefore, it is possible that between P0 and P7, when dendrites are being pruned, the number of M/T cells remaining in the bulb is still over a threshold that does not interfere with the process of normal dendrite pruning. We agree that it would be very informative to perform additional experiments in the future where a large set of M/T cells could be ablated before pruning occurs (ideally before P0). 

      (4) While the effect of reduced M/T neuron density on both M/T dendrites and OSN axons is described well, the relationship between both needs to be characterized better: Is one effect preceding the other or do they occur simultaneously? Can one be the consequence of the other?

      Previous works have demonstrated that disrupting the topographic projection of the OSN axons has no effect on the structure of the apical dendrite of M/T cells (Ma et al., 2014; Nishizumi et al., 2019). Our experiments ablating a large fraction of M/T cells suggest that they are necessary for the correct targeting of OSN axons into the bulb. However, our experiments do not allow us to tell apart these 2 scenarios: 

      (a) the ablation of a large fraction of M/T cells directly causes the sprouting of the apical dendrite of M/T cells, and that this sprouting in turn causes the abnormal projection of OSN axons onto the bulb. 

      (b) the ablation of a large fraction of M/T cells first causes the axons of OSN to project abnormally onto multiple glomeruli in the bulb, and this in turn causes the dendrite of remaining M/T cells to sprout onto multiple glomeruli. 

      We now include a comment on the manuscript explaining this point. (Lines 473-492)

      (5) Page 7: the observation that not all neurons develop additional dendrites is not a sign of differences between cell types, it may be purely stochastic.

      This is correct, and we mention these 2 scenarios in the discussion (Line 407-408). 

      (6) Page 8: the fact that activity blockade did not affect the formation of ectopic dendrites does not suggest that the process is not activity-dependent: both manipulations have the same effect and may just mask each other.

      The experiments with Kir2.1 demonstrate that the structural plasticity observed after reducing the total number of M/T cells in an animal is not regulated by the firing action potentials in the remaining cells. Instead, this experiment indicates that the observed structural plasticity may be regulated by other types of mechanisms (including increased synaptic excitation as suggested by the reviewer) that do not require the firing of action potentials in M/T cells. 

      We now have included a comment regarding this point (Lines 243-247).  

      (7) It remains unclear how the observed structural changes can explain the behavioral effects.

      We agree that the relationship between structural changes and behavior was not appropriately explained in our manuscript. Our manipulations cause two major changes in the olfactory system, one primary, and several secondary. The primary change is a large reduction in the number of M/T cells both in the MOB and AOB. This reduction in M/T cell number triggers significant secondary changes in the connectivity of the bulb, including an abnormal projection of OSNs onto the OB, and the growth of ectopic dendrites from the remaining M/T cells into multiple glomeruli.

      The behavioral abnormalities displayed by these mice is ultimately caused by the reduction in the number of M/T cells, but it is likely that the secondary structural changes could regulate some of the behavioral phenomena that we observed. For example, in principle, it is possible that the ectopic dendrites innervating several glomeruli could help the bulb to perceive smells with a much reduced number of M/T cells. On the other hand, this promiscuous growth of dendrites into multiple glomeruli could make it more difficult for the animals to discriminate between smells. The same argument could be made about the fact that OSN axons project onto multiple glomeruli: we simply do not know if this change helps or makes it more difficult for the animal to detect smells.  

      We now include a comment regarding this issue (Lines 513-525).   

      Reviewer #1 (Recommendations For The Authors):

      Additional experiments and a more thorough discussion of the results, as suggested in the public review, would significantly strengthen the paper. Below are some specific parts that need to be addressed.

      There is a lack of information on how M/T cell numbers are quantified. Without the information, it is difficult to evaluate the claim. Using the tdTomato signal may miss cells that are not labeled due to the transgenic effect. 

      Although we cannot conclude that we are identifying the complete set of M/T cells (because the transgenic lines may fail to label some M/T cells), the number of M/T cells that we observed is similar to that previously reported (Richard et al., 2010). This concern has been included in the Results section (Lines 121-124).

      A more detailed description about M/T cells quantification has been added into the method section (Lines 627-632).

      There is a lack of information on the timeline of treatment and how measurement of the olfactory bulb volume is conducted.

      We now include a more detailed description of how the volume of the OB was measured in the methods (Lines 621-623).

      The volume measurement is inconsistent with the pictures shown. In Figure 1, supplemental data 2 panels B and C, it appears that the bulbs in DTA and DTR mice are about half in length in each dimension. This would translate into ~1/8 of the volume of the control mice.

      We measured the volume of the bulbs based on the Neurolucida reconstructions, and we observed that in both DTA and iDTR mice the volumes of their bulbs are roughly 50% compared to a wild type mouse. In Figure 1 - figure supplement 2 the sections that were shown for wild type, DTA and iDTR mice were not taken at the same position in the bulb, and this gave the impression that the bulbs from DTA and iDTR were much smaller than they really are. We now show sections for these three animals at equivalent positions in the bulb. 

      Figure 1 E and F have no legend.

      We apologize for this mistake - we have now added the legend for Figures 1E and F (Lines 1009-1013).

      Figure 3, supplemental data 2, it is not clear what the readers should be looking at. The data is confusing even for experts in the field. The authors should describe the figures more clearly, pointing out what they are supposed to show.

      We apologize for this, and we have now added a more detailed description of Figure3 – figure supplement 2 (Lines 1153-1167).

      In several figures, it is not clearly written what the comparisons were for where there are indications of statistical significance above the bars.

      We have now included a more detailed description of the statistics comparison in the figure legends.

      AAV serotype should be specified.

      The AAV serotype used to label M/T cells was the AAV-PHP.eB. We have added this information in the methods section of the manuscript. 

      Reviewer #2 (Recommendations For The Authors):

      Minor points

      Page 5, para 2: "The decrease in neuronal plasticity with age": it is unclear what "the decrease" refers to.

      We have changed this sentence in the text to make it clear:

      “The decrease in structural plasticity of M/T cells after apical dendrite refinement (Mizrahi and Katz, 2003),….”

      Line 146-148

      Is there a quantification of the effect of Kir2.1 overexpression alone (example shown in Figure 3D)?

      We did an experiment in IDTR animals in which a fraction of M/T cells expressed Kir2.1, and we split these animals in 2 groups: (a) animals that received an injection of DT, and (b) animals that did not receive any DT. We quantified the effect of Kir2.1 on M/T cells from animals that received DT injection (with an ablation of around of 90% of M/T cells) and we did not observe any clear statistically significant differences between cells expressing Kir2.1 or neurons that did not express Kir2.1 from other iDTR animals that also received DT injections. We did not quantify the possible effects of kir2.1 in the group of animals that did not receive DT because on a first inspection we did not observe any clear differences between Kir2.1 cells and neighboring wild type cells. 

      References

      Fujimoto S, Leiwe MN, Aihara S, Sakaguchi R, Muroyama Y, Kobayakawa R, Kobayakawa K, Saito T, Imai T. 2023. Activity-dependent local protection and lateral inhibition control synaptic competition in developing mitral cells in mice. Dev Cell S1534-5807(23)00237-X. doi:10.1016/j.devcel.2023.05.004

      Johnson RE, Tien N-W, Shen N, Pearson JT, Soto F, Kerschensteiner D. 2017. Homeostatic plasticity shapes the visual system’s first synapse. Nat Commun 8:1220. doi:10.1038/s41467-017-01332-7

      Lin DM, Wang F, Lowe G, Gold GH, Axel R, Ngai J, Brunet L. 2000. Formation of precise connections in the olfactory bulb occurs in the absence of odorant-evoked neuronal activity. Neuron 26:69–80. doi:10.1016/s0896-6273(00)81139-3

      Ma L, Wu Y, Qiu Q, Scheerer H, Moran A, Yu CR. 2014. A developmental switch of axon targeting in the continuously regenerating mouse olfactory system. Science 344:194–197. doi:10.1126/science.1248805

      Nishizumi H, Miyashita A, Inoue N, Inokuchi K, Aoki M, Sakano H. 2019. Primary dendrites of mitral cells synapse unto neighboring glomeruli independent of their odorant receptor identity. Commun Biol 2:1–12. doi:10.1038/s42003-018-0252-y

      Richard MB, Taylor SR, Greer CA. 2010. Age-induced disruption of selective olfactory bulb synaptic circuits. Proc Natl Acad Sci U S A 107:15613–15618. doi:10.1073/pnas.1007931107

      Yamaizumi M, Mekada E, Uchida T, Okada Y. 1978. One molecule of diphtheria toxin fragment A introduced into a cell can kill the cell. Cell 15:245–250. doi:10.1016/0092-8674(78)90099-5

    1. eLife Assessment

      This study presents a valuable finding on a potential signaling pathway responsible for the direct effects of nicotine on intestinal stem cell growth and tumorigenesis.  The evidence supporting the claims of the authors is solid. This research will be of interest to medical biologists specializing in intestinal tumors.

    2. Reviewer #1 (Public review):

      Summary:

      In their manuscript, authors Isotani et al used in vivo and ex vivo models to show that nicotine could promote stemness and tumorigenicity in murine model. The authors further provided data supporting that the effects of nicotine on stem cell proliferation and tumor initiation were mediated by the Hippo-YAP/TAZ and Notch signal pathway.

      Strengths and weaknesses:

      The major strength of this study is the using a set of tools, including Lgr5 reporter mice (Lgr5-EGFP-IRES-CreERT2 mice), stem cell-specific Apc knockout mice (Lgr5CreER Apcfl/fl mice), organoids derived from these mice and chemical compounds (agonists and antagonists) to demonstrate nicotine affects stem cells rather than Paneth cells, leading to increased intestinal stemness and tumorigenicity. Whereas, all models are restricted to mice, lacking analysis of human samples or human intestinal organoids to prove the human relevant of these findings. Although the revised manuscript has significantly improved in the quality of pictures, there seems to be still a discrepancy in Figure 2A: quantification result suggested that NIC (1um) treatment increased the number of colonies from 300 to around 450 (1.5 folds), whereas representative picture shown that the difference was 3 to 12 living organoids (4 folds).

      Overall, the presented results could support their conclusions. A previous study reported that nicotine acts through the α2β4 nAChR to enhance Wnt production by Paneth cells, which subsequently affects ISCs. In contrast, this manuscript demonstrated that nicotine directly promotes ISCs through α7-nAChR, independent of Paneth cells. Therefore, this manuscript offers novel insights into the mechanism of nicotine's effects on the mouse intestine.

    3. Reviewer #2 (Public review):

      Summary:

      The manuscript by Isotani et al characterizes the hyperproliferation of intestinal stem cells (ISCs) induced by nicotine treatment in vivo. Employing a range of small molecule inhibitors, the authors systematically investigated potential receptors and downstream pathways associated with nicotine-induced phenotypes through in vitro organoid experiments. Notably, the study specifically highlights a signaling cascade involving α7-nAChR/PKC/YAP/TAZ/Notch as a key driver of nicotine-induced stem cell hyperproliferation. Utilizing a Lgr5CreER Apcfl/fl mouse model, the authors extend their findings to propose a potential role of nicotine in stem cell tumorgenesis. The study posits that Notch signaling is essential during this process.

      Strengths and Weaknesses:

      One noteworthy research highlight in this study is the indication, as shown in Figure 2 and S2, that the trophic effect of nicotine on ISC expansion is independent of Paneth cells. In the Discussion section, the authors propose that this independence may be attributed to distinct expression patterns of nAChRs in different cell types. To further substantiate these findings, the authors provided qPCR analysis of nAchRs in ISCs and Paneth cells from isolated whole small intestine, indicating that α7-nAChR uniquely responds to nicotine treatment among various nAChRs. And the authors further strengthen the clinical relevance of the study by exploring human scRNA-seq dataset, in which α7-nAChR is indeed also expressed in human ISCs and Paneth cells.

      As shown in the same result section, the effect of nicotine on ISC organoid formation appears to be independent of CHIR99021, a Wnt activator. In the Lgr5CreER Apcfl/fl mouse model, it is known that APC loss results in a constitutive stabilization of β-catenin, thus the hyperproliferation of ISCs by nicotine treatment in this mouse model is likely beyond Wnt activation. The authors have included such discussion.

      In Figure 4, the authors investigate ISC organoid formation with a pan-PKC inhibitor, revealing that PKC inhibition blocks nicotine-induced ISC expansion. It's noteworthy that PKC inhibitors have historically been used successfully to isolate and maintain stem cells by promoting self-renewal. Therefore, it is surprising to observe no or reversal effect on ISCs in this context. The authors have now included an additional PKC inhibitor Sotrastaurin to confirm the role of PKC in nicotine-induced ISC expansion.

      Overall, the manuscript has provided sufficient experimental evidence to address my concerns and also significantly enhanced its quality.

    4. Author response:

      The following is the authors’ response to the original reviews.

      Reviewer #1 (Public Review):

      Summary:

      In their manuscript, "Nicotine enhances the stemness and tumorigenicity in intestinal stem cells via Hippo-YAP/TAZ and Notch signal pathway", authors Isotani et al claimed that this study identifies a NIC-triggered pathway regulating the stemness and tumorigenicity of ISCs and suggest the use of DBZ as a potential therapeutic strategy for treating intestinal tumors. However, the presented data do not support the primary claims.

      Weaknesses:

      My main reservation is that the quality of the results presented in the manuscript may not fully substantiate their conclusions. For instance, in Figure 2 A and B, it is challenging to discern a healthy organoid. This is significant, as the entirety of Figure 2 and several panels in Figures 3 - 5 are based on these organoid assays. Additionally, there seems to be a discrepancy in the quality of results from the western blot, as the lanes of actin do not align with other proteins (Figure 6B).

      We directly count organoids under microscopy as described previously (Igarashi M et.al., Cell.2016 Igarashi M et.al., Aging Cell.2019). When we count the number of organoids, we exactly can discern which are alive or dead organoids under microscope. Hence, we will detail the method and show which are alive or dead organoids using arrows in our revised version (Figure2A and B).

      Moreover, as reviewer1 pointed out, the number of organoids originated from intestinal or colonic crypts can be affected by dead organoids as in Figure2A and 2B. However, almost all colonies from isolated intestinal stem cells (ISCs) (Figure 2C and D) are alive, so the number of colonies are less affected by dead colonies in those experiments using isolated ISCs. Since all organoid data in Figure 3-5 are based on the same method as that of Figure2C and D, the data quality of Figures 3-5 cannot be affected by dead colonies.

      Finally, to improve data quality of Figure6B, we repeated this experiments and replaced it by new figures.

      Reviewer #2 (Public Review):

      Summary:

      The manuscript by Isotani et al characterizes the hyperproliferation of intestinal stem cells (ISCs) induced by nicotine treatment in vivo. Employing a range of small molecule inhibitors, the authors systematically investigated potential receptors and downstream pathways associated with nicotine-induced phenotypes through in vitro organoid experiments. Notably, the study specifically highlights a signaling cascade involving α7-nAChR/PKC/YAP/TAZ/Notch as a key driver of nicotine-induced stem cell hyperproliferation. Utilizing a Lgr5CreER Apcfl/fl mouse model, the authors extend their findings to propose a potential role of nicotine in stem cell tumorgenesis. The study posits that Notch signaling is essential during this process.

      Strengths and Weaknesses:

      One noteworthy research highlight in this study is the indication, as shown in Figure 2 and S2, that the trophic effect of nicotine on ISC expansion is independent of Paneth cells. In the Discussion section, the authors propose that this independence may be attributed to distinct expression patterns of nAChRs in different cell types. To further substantiate these findings, it is suggested that the authors perform tissue staining of various nAChRs in the small intestine and colon. This additional analysis would provide more conclusive evidence regarding how stem cells uniquely respond to nicotine. It is also recommended to present the staining of α7-nAChR from different intestinal regions. This will provide insights into the primary target sites of nicotine in the gut tract. Additionally, it is recommended that the authors consider rephrasing the conclusion in this section (lines 123-124). The current statement implies that nicotine does not affect Paneth cells, which may be inaccurate based on the suggestion in line 275 that nicotine might influence Paneth cells through α2β4-nAChR. Providing a more nuanced conclusion would better reflect the complexity of nicotine's potential impact on Paneth cells.

      It was difficult to obtain nAchRs antibodies usable in immunostaining. Hence, we instead performed qPCR of nAchRs in ISCs and Paneth cells from isolated whole small intestine (new Figure3C), although we cannot know the difference of the nAchRs expression in different intestinal regions by this method. Although the comparatively high expression was observed in α7-nAChR and α8nAChR in both ISCs and Paneth cells, the significant difference between ISCs and Paneth cells were not observed (Figure3C). 

      Interestingly, nicotine up-regulated only the expression of α7-nAChR in ISCs, suggesting the specifical response of α7-nAChR to nicotine (Figures 3C and D). We paraphrased the conclusion of the paragraph according to reviewer’s suggestion.

      As shown in the same result section, the effect of nicotine on ISC organoid formation appears to be independent of CHIR99021, a Wnt activator. Despite this, the authors suggest a potential involvement of Wnt/β-catenin activation downstream of nicotine in Figure 4F. In the Lgr5CreER Apcfl/fl mouse model, it is known that APC loss results in a constitutive stabilization of β-catenin, thus the hyperproliferation of ISCs by nicotine treatment in this mouse model is likely beyond Wnt activation. Therefore, it is recommended that the authors reconsider the inclusion of Wnt/β-catenin as a crucial signaling pathway downstream of nicotine, given the experimental evidence provided in this study.

      We appreciate for this important suggestion. Certainly, Wnt/β-catenin was activated in Nicotine treated ISCs. However, as reviewer points out, the hyperproliferation of ISCs by nicotine treatment is likely beyond Wnt activation.  According to the reviewer’s suggestion, we removed Wnt/β-catenin as a crucial signaling pathway downstream of nicotine (Figure 5G).

      In Figure 4, the authors investigate ISC organoid formation with a panPKC inhibitor, revealing that PKC inhibition blocks nicotine-induced ISC expansion. It's noteworthy that PKC inhibitors have historically been used successfully to isolate and maintain stem cells by promoting self-renewal. Therefore, it is surprising to observe no effect or reversal effect on ISCs in this context. A previous study demonstrated that the loss of PKCζ leads to increased ISC activity both in vivo and in vitro (DOI: 10.1016/j.celrep.2015.01.007). Additionally, to strengthen this aspect of the study, it would be beneficial for the authors to present more evidence, possibly using different PKC inhibitors, to reproduce the observed results with Gö 6983. This could help address potential concerns or discrepancies and contribute to a more comprehensive understanding of the role of PKC in nicotine-induced ISC expansion.

      Gö 6983 is a pan-PKC inhibitor against for PKCα, PKCβ, PKCγ, PKCδ and PKCζ with IC50 of 7 nM, 7 nM, 6 nM, 10 nM and 60 nM, respectively. Since we used Gö 6983 at the concentration of 10nM in our experiment, we consider PKCζ may not be possible target of nicotine. Additionally, we treated using 5nM Sotrastaurin, another pan-PKC inhibitor, which is supposed not to affect PKCζ. The observed result with Gö 6983 was reproduced by Sotrastaurin (Supplemental Figure 3E).

      An additional avenue that could enhance the clinical relevance of the study is the exploration of human datasets. Specifically, leveraging scRNA-seq datasets of the human intestinal epithelium (DOI: 10.1038/s41586-021-03852-1) could provide valuable insights. Analyzing the expression patterns of nAChRs across diverse regions and cell types in the human intestine may offer a potential clinical implication.

      We analyzed distribution pattern nAChRs of by scRNA-seq datasets of the human intestinal epithelium (DOI: 10.1038/s41586-021-03852-1). In consistent with mouse data (Figure3C), the expression of human α7-nAChR is higher than that of other nAChRs. The difference of the expression between ISCs and Paneth cells is not clear as in that of mouse (Supplemental Figure4A and B). From mouse and human data, we speculate the induction of specific nAChR by nicotine is essence of ISC response to nicotine, rather than the distribution of nAChRs.

      Reviewer #2 (Recommendations For The Authors):

      The manuscript could benefit from addressing a few minor points to enhance its quality before publication:

      (1) Ensure all images are presented in higher resolution to improve visual clarity.

      We replaced all images by those with higher resolution.

      (2) Quantify Western blot results accurately for rigor and precision in data representation.

      We quantified all blots.

      (3) Include error bars in control groups where missing, particularly in Figures 3C and 4D, to enhance data interpretation.

      We included error bars in control groups in new Figure 3C and 4D.

      (4) The layout of Figure S3B, S4A and S4B should be corrected.

      We corrected the layout of those Figures.

    1. eLife Assessment

      This study provides an important re-evaluation of modality-specific information processing in the thalamus of trained mice. Using an elegant task design that probes competing tactile and visual stimuli, the authors present compelling evidence that behavioral training reshapes the sensitivity of higher-order thalamic nuclei. Despite the powerful task design and the significance of the main findings, the origin of the cross-modal responses remains an open question and requires future investigation.

    2. Reviewer #1 (Public review):

      Petty and Bruno investigate how response characteristics in the higher-order thalamic nuclei POm (typically somatosensory) and LP (typically visual) change when a stimulus (whisker air puff or visual drifting grating) of one or the other modality is conditioned to a reward. Using a two-step training procedure, they developed an elegant paradigm, where the distractor stimulus is completely uninformative about the reward, which is reflected in licking behavior of trained mice. While the animals seem to take on to the tactile stimulus more readily, they can also associate reward with the visual stimulus, ignoring tactile stimuli. In trained mice, the authors recorded single unit responses in both POm and LP while presenting the same stimuli. The authors first focused on POm recordings, finding that in animals with tactile conditioning POm units specifically responded to the air puff stimulus but not the visual grating. Unexpectedly, in visually conditioned animals, POm units also responded to the visual grating, suggesting that the responses are not modality-specific but more related to behavioral relevance. These effects seem not not be homogeneously distributed across POm, whereas lateral units maintain tactile specificity and medial units respond more flexibly. The authors further ask if the unexpected cross-modal responses might result from behavioral activity signatures. By regressing behavior-coupled activity out of the responses, they show that late activity indeed can be related to whisking, licking and pupil size measures. However, cross-modal short latency responses are not clearly related to animal behavior. Finally, LP neurons also seem to change their modality-specificity dependent on conditioning, whereas tactile responses are attenuated in LP if the animal is conditioned to visual stimuli.

      The authors make a compelling case that POm neurons are less modality specific than typically assumed. The training paradigm, employed methods and analyses are to the point, well supporting the conclusions. The findings importantly widen our understanding of higher-order thalamus processing features with flexibility to encode multiple modalities and behavioral relevance. The results raise many important questions on the brain-wide representation of conditioned stimuli. E.g. how specific are the responses to the conditioned stimuli? Are thalamic cross-modal neurons recruited for the specific conditioned stimulus or do their responses reflect a more global shift of attention from one modality to another? Are these cross-modal responses tracking global arousal/attention features, or actually encoding a different stimulus?

      The authors clarified a number of points in the updated version of the manuscript and expanded analyses and methods descriptions, which substantially improved the paper. The different time periods around the stimuli are more clearly assigned now and make the conclusions stronger.

      Especially the discussion is now well rounded and addresses the major points.

      To ask if the cross-modal activity is in some way functional for task performance I would like to see if (population) activity in the classical vs. cross-modal nucleus is predictive of lick latency or frequency on a trial-to-trial basis.

      I accept that the authors cannot differentiate between bottom-up "raw" sensory responses and top-down context/attention/etc signals and thus support the decision to restrict the analyses to either the likely sensory early part following stimulus onset or the (as shown here mostly movement-driven) offset period after cessation of the stimulus. However, the composite responses over different stimuli and conditioning types seem triphasic to me. I find the "ongoing" activity differences (~100-2000 ms) depending on conditioning type quite interesting and would welcome a more specific discussion on the different response periods.

      Overall a very elegant and well-presented study.

    3. Reviewer #2 (Public review):

      This manuscript by Petty and Bruno delves into the still poorly understood role of higher-order thalamic nuclei in the encoding of sensory information by examining the activity in the Pom and LP cells in mice performing an associative learning task. They developed an elegant paradigm in which they conditioned head-fixed mice to attend to a stimulus of one sensory modality (visual or tactile) and ignore a second stimulus of the other modality. They recorded simultaneously from POm and LP, using 64-channels electrode arrays, to reveal the context-dependency of the firing activity of cells in higher-order thalamic nuclei. They concluded that behavioral training reshapes activity in these secondary thalamic nuclei. The authors brought new analyses and figures which greatly improve their manuscript and support their conclusion. The manuscript benefits now from a better communication about both the methodology and the results. I have no more major concerns, but I feel that the readability of the manuscript could be improved with the following revisions.

      Strengths

      The authors developed an original and elegant paradigm in which they conditioned head-fixed mice to attend to a stimulus of one sensory modality, either visual or tactile and ignore a second stimulus of the other modality. As a tactile stimulus, they applied gentle air puffs on the distal part of the vibrissae, ensuring that the stimulus was innocuous and therefore none aversive which is crucial in their study.

      It is commonly viewed that first-order thalamus performs filtering and re-encoding of the sensory flow; in contrast the computations taking place in high-order nuclei are poorly understood. They may contribute to cognitive functions. By integrating top-down control, high-order nuclei may participate in generating update models of the environment based on sensory activity; how this can take place is a key question that Petty and Bruno addressed in the present study.

      Weaknesses

      (1) It's difficult when reading the text to understand which results were quantified and which were not, in part because mean data as well as (s.e.m. or S.D.) do not appear either in the main text nor in the legends of the figures. Only vague and unquantified data are given in the main text. I understand that the authors may want to make the main text less heavy, but having these data fully written somewhere (i.e., main text, summary table, figure legends) rather than having to estimate through looking at a graph (especially when the data are constraint in the first 20% of the graph (Figure 4c)), would greatly improve the text's clarity and precision.

      For instance, Line #173, "At the population level, POm cells in both conditioning groups had a peak of activity 40ms after air puff onset (Figure 4a)." Is this 40 ms a result of quantified data, then a s.e.m. would be informative, or a reading measurement on the Figure 4a graphs? As it stands, it is too vague a value.

      (2) The authors give clearer definition of what they analyzed, which greatly improved the readability of the manuscript. The clarity of the manuscript could still be improved by solving remaining ambiguities about sensory- versus non-sensory-responses to the applied stimuli throughout the manuscript, in order to better convey the authors' conclusion that behavioral training reshapes activity in these secondary thalamic nuclei which then may participate in generating update models of the context in which the animal is performing the task.

      Line #24 in the abstract "In mice trained to respond to tactile stimuli and ignore visual stimuli, POm was robustly activated by touch and largely unresponsive to visual stimuli". The abstract would better reflect the manuscript conclusions indicating that POm was robustly activated during tactile stimuli.

      (3) The new analysis of the "early" responses in Pom cells pointed out, Line #173, that "At the population level, POm cells in both conditioning groups had a peak of activity 40ms after air puff onset (Figure 4a)." Previous works cited by the authors, Diamond et al. (1992), described tactile responses in Pom cells at 15-20ms latency which were suppressed by the barrel cortex inactivation.

      The 40ms-latency responses described in this manuscript therefore do not fit with "purely sensory" and barely with S1-feedbacks, as proposed on line #168 "Such responses could be "purely sensory" (i.e. driven by ascending brainstem inputs)" or line #334 "It is likely that the observed activity in lateral dorsal POm is driven by true whisker responses in SpVi and S1."

      In the same way, Line #315 "we observed POm cells that responded to the onset of the air puff in both conditioning groups". This conclusion should be dampened, to better fit the results, by "we observed POm cells that responded 40 ms after the onset of the air puff in both conditioning groups."

    4. Reviewer #3 (Public review):

      Petty and Bruno ask whether activity in secondary thalamic nuclei depends on the behavioral relevance of stimulus modality. They recorded from POm and LP, but the weight of the paper is skewed toward POm. They use two cohorts of mice (N=11 and 12), recorded in both nuclei using multi-electrode arrays, while being trained to lick to either a tactile stimulus (air puff against whiskers, first cohort) or a visual stimulus (drifting grating, second cohort), and ignore the respective other. They find that both nuclei, while primarily responsive to their 'home' modality, are more responsive to the relevant modality (i.e. the modality predicting reward).

      Strengths:

      The paper asks an important question, it is timely and is very well executed. The behavioral method using a delayed lick index (excluding impulsive responses) is well worked out. Electrophysiology methods are state-of-the-art with information about spike quality in Fig. S1. The main result is novel and important, convincingly conveying the point that encoding of secondary thalamic nuclei is flexible and clearly includes aspects of the behavioral relevance of a stimulus. The paper explores the mapping of responses within POm, pointing to a complex functional structure, something that has been reported/suggested in earlier studies.

      Weaknesses:

      Coding: It does not become clear to which aspect of the task POm/LP are responding. There is a motor-related response (whisking, licking, pupil), which, however, after regressing it out leaves a remaining response that the authors speculate could be sensory.

      Learning: The paper talks a lot about 'learning', although it is only indirectly addressed. The authors use two differently (over-)trained mice cohorts rather than studying e.g. a rule switch in one and the same mouse, which would allow to directly assess whether it is the same neurons that undergo rule-dependent encoding

      Mapping: The authors present electrode tracks with marked selectivity indices of recordings in POm and LP. This is a great start, but to finally understand the functional composition of POm and LP, a more detailed and systematic mapping effort is needed in the future.

    5. Author response:

      The following is the authors’ response to the original reviews.

      Reviewer #1 (Public Review): 

      Petty and Bruno investigate how response characteristics in the higher-order thalamic nuclei POm (typically somatosensory) and LP (typically visual) change when a stimulus (whisker air puff or visual drifting grating) of one or the other modality is conditioned to a reward. Using a two-step training procedure, they developed an elegant paradigm, where the distractor stimulus is completely uninformative about the reward, which is reflected in the licking behavior of trained mice. While the animals seem to take on to the tactile stimulus more readily, they can also associate the reward with the visual stimulus, ignoring tactile stimuli. In trained mice, the authors recorded single-unit responses in both POm and LP while presenting the same stimuli. The authors first focused on POm recordings, finding that in animals with tactile conditioning POm units specifically responded to the air puff stimulus but not the visual grating. Unexpectedly, in visually conditioned animals, POm units also responded to the visual grating, suggesting that the responses are not modality-specific but more related to behavioral relevance. These effects seem not be homogeneously distributed across POm, whereas lateral units maintain tactile specificity and medial units respond more flexibly. The authors further ask if the unexpected cross-modal responses might result from behavioral activity signatures. By regressing behavior-coupled activity out of the responses, they show that late activity indeed can be related to whisking, licking, and pupil size measures. However, cross-modal short latency responses are not clearly related to animal behavior. Finally, LP neurons also seem to change their modality-specificity dependent on conditioning, whereas tactile responses are attenuated in LP if the animal is conditioned to visual stimuli.

      The authors make a compelling case that POm neurons are less modality-specific than typically assumed. The training paradigm, employed methods, and analyses are mostly to the point, well supporting the conclusions. The findings importantly widen our understanding of higher-order thalamus processing features with the flexibility to encode multiple modalities and behavioral relevance. The results raise many important questions on the brain-wide representation of conditioned stimuli. E.g. how specific are the responses to the conditioned stimuli? Are thalamic cross-modal neurons recruited for the specific conditioned stimulus or do their responses reflect a more global shift of attention from one modality to another? 

      To elaborate on higher-order thalamic activity in relationship to conditioned behavior, a trialby-trial analysis would be very useful. Is neuronal activity predictive of licking and at which relative timing? 

      To elaborate on the relationship between neuronal activity and licking, we have created a new supplementary figure (Figure S1), where we present the lick latency of each mouse on the day of recording. We also perform more in-depth analysis of neural activity that occurs before lick onset, which is presented in a new main figure (new Figure 4). 

      Furthermore, I wonder why the (in my mind) major and from the data obvious take-away, "POm neurons respond more strongly to visual stimuli if visually conditioned", is not directly tested in the summary statistics in Figure 3h.

      We have added a summary statistic to Figure 3h and to the Results section (lines 156-157) comparing the drifting grating responses in visually and tactilely conditioned mice.  

      The remaining early visual responses in POm in visually conditioned mice after removing behavior-linked activity are very convincing (Figure 5d). It would help, however, to see a representation of this on a single-neuron basis side-by-side. Are individual neurons just coupled to behavior while others are independent, or is behaviorally coupled activity a homogeneous effect on all neurons on top of sensory activity?

      In lieu of a new figure, we have performed a new analysis of individual neurons to classify them as “stimulus tuned” and/or “movement tuned.” We find that nearly all POm cells encode movement and arousal regardless of whether they also respond to stimuli. This is presented in the Results under the heading “POm correlates with arousal and movement regardless of conditioning” (Lines 219-231).

      The conclusions on flexible response characteristics in LP in general are less strongly supported than those in POm. First, the differentiation between POm and LP relies heavily on the histological alignment of labeled probe depth and recording channel, possibly allowing for wrong assignment. 

      We appreciate the importance in differentiating between POm, LP, and surrounding regions to accurately assign a putative cell to a brain region. The method we employed (aligning an electrode track to a common reference atlas) is widely used in rodent neuroscience, especially in regions like POm and LP which are difficult to differentiate molecularly (for example, see Sibille, Nature Communications, 2022; and Schröder, Neuron, 2020). 

      Furthermore, it seems surprising, but is not discussed, that putative LP neurons have such strong responses to the air puff stimuli, in both conditioning cases. In tactile conditioning, LP air puff responses seem to be even faster and stronger than POm. In visual conditioning, drifting grating responses paradoxically seem to be later than in tactile conditioning (Fig S2e). These differences in response changes between POm and LP should be discussed in more detail and statements of "similar phenomena" in POm and LP (abstract) should be qualified.  

      We have further developed our analysis and discussion of LP activity. Our analysis of LP stimulus response latencies are now presented in greater detail in Figure S3, and we have expanded the results section accordingly (lines 266-275). We have also expanded the discussion section to both address these new analyses and speculate on what might drive these surprising “tactile responses” in LP.

      Reviewer #2 (Public Review): 

      Summary  

      This manuscript by Petty and Bruno delves into the still poorly understood role of higherorder thalamic nuclei in the encoding of sensory information by examining the activity in the Pom and LP cells in mice performing an associative learning task. They developed an elegant paradigm in which they conditioned head-fixed mice to attend to a stimulus of one sensory modality (visual or tactile) and ignore a second stimulus of the other modality. They recorded simultaneously from POm and LP, using 64-channel electrode arrays, to reveal the contextdependency of the firing activity of cells in higher-order thalamic nuclei. They concluded that behavioral training reshapes activity in these secondary thalamic nuclei. I have no major concerns with the manuscript's conclusions, but some important methodological details are lacking and I feel the manuscript could be improved with the following revisions.

      Strengths 

      The authors developed an original and elegant paradigm in which they conditioned headfixed mice to attend to a stimulus of one sensory modality, either visual or tactile, and ignore a second stimulus of the other modality. As a tactile stimulus, they applied gentle air puffs on the distal part of the vibrissae, ensuring that the stimulus was innocuous and therefore none aversive which is crucial in their study. 

      It is commonly viewed that the first-order thalamus performs filtering and re-encoding of the sensory flow; in contrast, the computations taking place in high-order nuclei are poorly understood. They may contribute to cognitive functions. By integrating top-down control, high-order nuclei may participate in generating updated models of the environment based on sensory activity; how this can take place is a key question that Petty and Bruno addressed in the present study.

      Weaknesses  

      (1) Overall, methods, results, and discussion, involving sensory responses, especially for the Pom, are confusing. I have the feeling that throughout the manuscript, the authors are dealing with the sensory and non-sensory aspects of the modulation of the firing activity in the Pom and LP, without a clear definition of what they examined. Making subsections in the results, or a better naming of what is analyzed could convey the authors' message in a clearer way, e.g., baseline, stim-on, reward.  

      We thank Reviewer 2 for this suggestion. We have adjusted the language throughout the paper to more clearly state which portions of a given trial we analyzed. We now consistently refer to “baseline,” “stimulus onset,” and “stimulus offset” periods. 

      In line #502 in Methods, the authors defined "Sensory Responses. We examined each cell's putative sensory response by comparing its firing rate during a "stimulus period" to its baseline firing rate. We first excluded overlapping stimuli, defined as any stimulus occurring within 6 seconds of a stimulus of a different type. We then counted the number of spikes that occurred within 1 second prior to the onset of each stimulus (baseline period) and within one second of the stimulus onset (stimulus period). The period within +/-50ms of the stimulus was considered ambiguous and excluded from analysis." 

      Considering that the responses to whisker deflection, while weak and delayed, were shown to occur, when present, before 50 ms in the Pom (Diamond et al., 1992), it is not clear what the authors mean and consider as "Sensory Responses"? 

      We have addressed this important concern in three ways. First, we have reanalyzed our data to include the 50ms pre- and post-stimulus time windows that were previously excluded. This did not qualitatively change our results, but updated statistical measurements are reflected in the Results and the legends of figures 3 and 7. Second, we have created a new figure (new Figure 4) which provides a more detailed analysis of early POm stimulus responses at a finer time scale. Third, we have amended the language throughout the paper to refer to “stimulus responses” rather than “sensory responses” to reflect how we cannot disambiguate between bottom-up sensory input and top-down input into POm and LP with our experimental setup. We refer only to “putative sensory responses” when discussing lowlatency (<100ms) stimulus responses.

      Precise wording may help to clarify the message. For instance, line #134: "Of cells from tactilely conditioned mice, 175 (50.4%) significantly responded to the air puff, as defined by having a firing rate significantly different from baseline within one second from air puff onset (Figure 3d, bottom)", could be written "significantly responded to the air puff" should be written "significantly increased (or modified if some decreased) their firing rate within one second after the air puff onset (baseline: ...)". This will avoid any confusion with the sensory responses per se.

      We have made this specific change suggested by the reviewer (lines 145-146) and made similar adjustments to the language throughout the manuscript to better communicate our analysis methods. 

      (2) To extend the previous concern, the latency of the modulation of the firing rate of the Pom cells for each modality and each conditioning may be an issue. This latency, given in Figure S2, is rather long, i.e. particularly late latencies for the whisker system, which is completely in favor of non-sensory "responses" per se and the authors' hypothesis that sensory-, arousal-, and movement-evoked activity in Pom are shaped by associative learning. Latency is a key point in this study. 

      Therefore, 

      - latencies should be given in the main text, and Figure S2 could be considered for a main figure, at least panels c, d, and e, could be part of Figure 3. 

      - the Figure S2b points out rather short latency responses to the air puff, at least in some cells, in addition to late ones. The manuscript would highly benefit from an analysis of both early and late latency components of the "responses" to air puffs and drafting grating in both conditions. This analysis may definitely help to clarify the authors' message. Since the authors performed unit recordings, these data are accessible.

      - it would be highly instructive to examine the latency of the modulation of Pom cells firing rate in parallel with the onset of each behavior, i.e. modification of pupil radius, whisking amplitude, lick rate (Figures 1e, g and 3a, b). The Figure 1 does not provide the latency of the licks in conditioned mice.

      - the authors mention in the discussion low-latency responses, e.g., line #299: "In both tactilely and visually conditioned mice, movement could not explain the increased firing rate at air puff onset. These low-latency responses across conditioning groups is likely due in part to "true" sensory responses driven by S1 and SpVi."; line #306: "Like POm, LP displayed varied stimulus-evoked activity that was heavily dependent on conditioning. LP responded to the air puff robustly and with low latency, despite lacking direct somatosensory inputs."  But which low-latency responses do the authors refer to? Again, this points out that a robust analysis of these latencies is missing in the manuscript but would be helpful to conclude.

      We have moved our analysis of stimulus response latency in POm to new Figure 4 in the main text and have expanded both the Results and Discussion sections accordingly. We have also analyzed the lick latency on the day of recording, included in a new supplemental Figure S1. 

      (3) Anatomical locations of recordings in the dorsal part of the thalamus. Line #122 "Our recordings covered most of the volume of POm but were clustered primarily in the anterior and medial portions of LP (Figure 2d-f). Cells that were within 50 µm of a region border were excluded from analysis." 

      How did the authors distinguish the anterior boundary of the LP with the LD nucleus just more anterior to the LP, another higher-order nucleus, where whisker-responsive cells have been isolated (Bezdudnaya and Keller, 2008)? 

      Cells within 50µm of any region boundary were excluded, including those at the border of LP and LD. We also reviewed our histology images by eye and believe that our recordings were all made posterior of LD. 

      (4) The mention in the Methods about the approval by an ethics committee is missing.  All the surgery (line #381), i.e., for the implant, the craniotomy, as well as the perfusion, are performed under isoflurane. But isoflurane induces narcosis only and not proper anesthesia. The mention of the use of analgesia is missing. 

      We thank Reviewer 2 for drawing our attention to this oversight. All experiments were conducted under the approval of the Columbia University IACUC. Mice were treated with the global analgesics buprenorphine and carprofen, the local analgesic bupivacaine, and anesthetized with isoflurane during all surgical procedures. We have amended the Methods section to include this information (Lines 458-470).

      Reviewer #3 (Public Review): 

      Petty and Bruno ask whether activity in secondary thalamic nuclei depends on the behavioral relevance of stimulus modality. They recorded from POm and LP, but the weight of the paper is skewed toward POm. They use two cohorts of mice (N=11 and 12), recorded in both nuclei using multi-electrode arrays, while being trained to lick to either a tactile stimulus (air puff against whiskers, first cohort) or a visual stimulus (drifting grating, second cohort), and ignore the respective other. They find that both nuclei, while primarily responsive to their 'home' modality, are more responsive to the relevant modality (i.e. the modality predicting reward). 

      Strengths: 

      The paper asks an important question, it is timely and is very well executed. The behavioral method using a delayed lick index (excluding impulsive responses) is well worked out. Electrophysiology methods are state-of-the-art with information about spike quality in Figure S1. The main result is novel and important, convincingly conveying the point that encoding of secondary thalamic nuclei is flexible and clearly includes aspects of the behavioral relevance of a stimulus. The paper explores the mapping of responses within POm, pointing to a complex functional structure, something that has been reported/suggested in earlier studies. 

      Weaknesses: 

      Coding: It does not become clear to which aspect of the task POm/LP is responding. There is a motor-related response (whisking, licking, pupil), which, however, after regressing it out leaves a remaining response that the authors speculate could be sensory.

      Learning: The paper talks a lot about 'learning', although it is only indirectly addressed. The authors use two differently (over-)trained mice cohorts rather than studying e.g. a rule switch in one and the same mouse, which would allow us to directly assess whether it is the same neurons that undergo rule-dependent encoding. 

      We disagree that our animals are “overtrained,” as every mouse was fully trained within 13 days. We agree that it would be interesting to study a rule-switch type experiment, but such an experiment is not necessary to reveal the profound effect that conditioning has on stimulus responses in POm and LP. 

      Mapping: The authors treat and interpret the two nuclei very much in the same vein, although there are clear differences. I would think these differences are mentioned in passing but could be discussed in more depth. Mapping using responses on electrode tracks is done in POm but not LP.

      The mapping of LP responses by anatomical location is presented in the supplemental Figure S4 (previously S3). We have expanded our discussion of LP and how it might differ from POm.

      Reviewer #1 (Recommendations For The Authors):  

      Minor writing issues: 

      122 ...67 >LP< cells?

      301 plural "are”

      We have fixed these typos.

      Figure issues

      *  3a,b time ticks are misaligned and the grey bar (bottom) seems not to align with the visual/tactile stimulus shadings.

      *  legend to Figure 3b refers to Figure 1c which is a scheme, but if 1g is meant, this mouse does not seem to have a session 12? 

      *  3c,e time ticks slightly misaligned. 

      *  5e misses shading for the relevant box plots, assuming it should be like Figure 3h.  

      We thank Reviewer 1 for pointing out these errors. We have adjusted Figures 1, 3, and 5 accordingly.

      Analyses 

      I am missing a similar summary statistics for LP as in Figure 3h 

      We have added a summary box chart of LP stimulus responses (Figure 7g), similar to that of POm in Figure 3. We have also performed similar statistical analyses, the results of which are presented in the legend for Figure 7. 

      Reviewer #2 (Recommendations For The Authors): 

      More precisions are required for the following points: 

      (1) The mention of the use of analgesia is missing and this is not a minor concern. Even if the recordings are performed 24 hours after the surgery for the craniotomy and screw insertion and several days after the main surgery for the implant, taking into account the pain of the animals during surgeries is crucial first for ethical reasons, and second because it may affect the data, especially in Pom cells: pain during surgery may induce the development of allodynia and/or hyperalgesia phenomenae and Pom responses to sensory stimuli were shown to be more robust in behavioral hyperalgesia (Masri et al., 2009).  

      We neglected to include details on the analgesics used during surgery and post-operation recovery in our original manuscript. Mice were administered buprenorphine, carprofen, and bupivacaine immediately prior to the head plate surgery and were treated with additional carprofen during recovery. Mice were similarly treated with analgesics for the craniotomy procedure. Mice were carefully observed after craniotomy, and we saw no evidence of pain or discomfort. Furthermore, mice performed the behavior at the same level pre- and postcraniotomy (now presented in Figure 1j), which also indicates that they were not in any pain. 

      (2) The head-fixed preparation is only poorly described.

      Line #414: "Prior to conditioning, mice were habituated to head fixation and given ad libitum water in the behavior apparatus for 15-25 minutes." 

      And line #425 "Mice were trained for one session per day, with each session consisting of an equal number of visual stimuli and air puffs. Sessions ranged from 20-60 minutes and about 40-120 of each stimulus. " 

      More details should be given about the head-fixation training protocol. Are 15-25 minutes the session time duration, 60 minutes, or other time duration? How long does it take to get mice well trained to the head fixation, and on which criteria?  

      Line #389: "Mice were then allowed to recover for 24 hours, after which the sealant was removed and recordings were performed. At the end of experiments,"

      The timeline is not clear: is there one day or several days of recordings? 

      We have expanded on our description of the head fixation protocol in the Methods. We describe in more detail how mice were habituated to head fixation, the timing of water restriction, and the start of conditioning/training (Habituation and Conditioning, lines 492-500).

      (4) Line #411: "Mice were deprived of water 3 days prior to the start of conditioning" followed by line #414 "Prior to conditioning, mice were habituated to head fixation and given ad libitum water in the behavior apparatus for 15-25 minutes".

      If I understood correctly, the mice were then not fully water-deprived for 3 days since they received water while head-fixed. This point may be clarified. 

      We addressed these concerns in the changes to the Methods section mentioned in the preceding point (3).

      (5) Line #157: "Modality selectivity varies with anatomical location in Pom" while the end of the previous paragraph is "This suggests that POm encoding of reward and/or licking is insensitive to task type, an observation we examine further below."

      The authors then come to anatomical concerns before coming back to what the Pom may encode in the following section. This makes the story quite confusing and hard to follow even though pretty interesting.  

      We have reordered our Figures and Results to improve the flow of the paper and remove this point of confusion. We now present results on the encoding of movement before analyzing the relationship between POm stimulus responses and anatomical location. What was old Figure 5 now precedes what was old Figure 4.

      (6) Licks Analysis. Line #99 "However, this mouse also learned that the air puff predicted a lack of reward in the shaping task, as evidenced by withholding licking upon the onset of the air puff. The mouse thus displayed a positive visual lick index and a negative tactile lick index, suggesting that it attended to both the tactile and visual stimuli (Figure 1f, middle arrow)."

      Line #105 "All visually conditioned mice exhibited a similar learning trajectory (Figure 1i left, 1j left)". 

      Interestingly, the authors revealed that mice withheld licking upon the onset of the air puff in the visual conditioning, which they did not do at the onset of the drifting grating in the tactile conditioning. This withholding was extinguished after the 8th session, which the authors interpret as the mice finally ignoring the air puff. Is this effect significant, is there a significant withholding licking upon the onset of the air puff on the 12 tested mice? 

      The withholding of licking was significant (assessed with a sign-rank test) in visually conditioned mice prior to switching to the full version of the task. Indeed, it was the abolishment of this effect after conditioning with the full version of the task that was our criterion for when a mouse was fully trained. We have elaborated on this in the Habituation and Conditioning section in the Methods.

      (1) Throughout the manuscript "Touch" is used instead of passive whisker deflection, and may be confusing with "active touch" for the whisker community readers. I recommend avoiding using "touch" instead of "passive whisker deflection".

      We appreciate that “touch” can be an ambiguous term in some contexts. However, we have limited our use of the word to refer to the percept of whisker deflection; we do not describe the air puff stimulus as a “touch.” We respectfully would like to retain the use of the word, as it is useful for comparing somatosensory stimuli to visual stimuli.

      (2) Line #395: "Air puffs (0.5-1 PSI) were delivered through a nozzle (cut p1000 pipet tip, approximately 3.5mm diameter aperture)".

      Are air puffs of <1 PSI applied, not <1 bar?  

      We thank Reviewer 3 for pointing out this inaccuracy. The air puffs were indeed between 0.5 and 1 bar, not PSI. We have addressed this in the Methods.

      (3) Line #441: "In the full task, the stimuli and reward were identical, but stimuli were presented at uncorrelated and less predictable intervals."  Do the authors mean that all stimuli are rewarded?  

      The stimuli and reward were identical between the shaping and full versions of the task. In the full version of the task, the unrewarded stimulus was truly uncorrelated with reward, rather than anticorrelated. 

      (4) Line #445 "for a mean ISI of 20 msec." ISI is not defined, I guess that it means interstimulus interval. Even if pretty obvious, to avoid any confusion for future readers, I would recommend using another acronym, especially in a manuscript about electrophysiology, since ISI is a dedicated acronym for inter-spike interval. 

      We have defined the acronym ISI as “inter-stimulus interval” when first introduced in the results (Line 82) and in the Methods (Line 511).

      (5) Line #416 "In the first phase of conditioning ("shaping"), mice were separated into two cohorts: a "tactile" cohort and a "visual" cohort. Mice were presented with tactile stimuli (a two-second air puff delivered to the distal whisker field) and visual stimuli (vertical drifting grating on a monitor). Throughout conditioning, mice were monitored via webcam to ensure that the air puff only contacted the whiskers and did not disturb the facial fur nor cause the mouse to blink, flinch, or otherwise react - ensuring the stimulus was innocuous. The stimulus types were randomly ordered. In the visual conditioning cohort, the visual stimulus was paired with a water reward (8-16µL) delivered at the time of stimulus offset. In the tactile conditioning cohort, the reward was instead paired with the offset of the air puff. Regardless of the type of conditioning, stimulus type was a balanced 50:50 with an inter-stimulus interval of 8-12 seconds (uniform distribution)." 

      The mention of the "full version of the task" will be welcome in this paragraph to clarify what the task is for the mouse in the Methods part.

      We have more clearly defined the full version of the task in a later paragraph (line 506). We believe this addresses the potential confusion caused by the original description of the conditioning paradigm. 

      (6) Line #467: "Units were assigned to the array channel on which its mean waveform was largest". 

      Should it read mean waveform "amplitude"? 

      This is correct, we have adjusted the statement accordingly. 

      (7) Line #482 "The eye camera was positioned on the right side of the face and recorded at 60 fps." Then line #487 "The trace of pupil radius over time was smoothed over 5 frames (8.3 msec).” 5 frames, with a 60fps, represent then 83 ms and not 8.3 ms.

      We have corrected this error.  

      (8) Line #121: "257 POm cells and 67 cells from 12 visually conditioned mice" 

      67 LP cells, LP is missing 

      We have corrected this error. 

      (9) Line #354: "A consistent result of attention studies in humans and nonhuman primates is the enhancement of cortical and thalamic sensory responses to an attended visual stimuli. Here, we show not just enhancement of sensory responses to stimuli within a single modality, but also across modalities. It is worth investigating further how secondary thalamus and high-order sensory cortex encode attention to stimuli outside of their respective modalities. Our surprising conclusion that the nuclei are equivalently activated by behaviorally relevant stimuli is nevertheless compatible with these previous studies."  Since higher-order thalamic nuclei are integrative centers of many cortical and subcortical inputs, they cannot be viewed simply as relay nuclei, and there is therefore no "surprising" conclusion in these results. Not surprising, but still an elegant demonstration of the contextdependent activity/responses of the Pom/LP cells. 

      We disagree. Visual stimuli activating strong POm responses and tactile stimuli activating strong LP responses - however they do it - is a surprising result. We agree that higher-order thalamic nuclei are integrative centers, but exactly what they integrate and what the integrated output means is still poorly understood.

    1. eLife Assessment

      This paper addresses an important topic (normative trajectory modelling), seeking to provide a method aiming to accurately reflect the individual deviation of longitudinal/temporal change compared to the normal temporal change characterized based on a pre-trained population normative model. The evidence provided for the new methods is, however, incomplete, with the simulations validating the method needing to be extended.

    2. Reviewer #1 (Public review):

      Summary:

      In this manuscript, the authors provide a method aiming to accurately reflect the individual deviation of longitudinal/temporal change compared to the normal temporal change characterized based on pre-trained population normative model (i.e., a Bayesian linear regression normative model), which was built based on cross-sectional data. This manuscript aims at solving a recently identified problem of using normative models based on cross-sectional data to make inferences about longitudinal change.

      Strengths:

      The efforts of this work make a good contribution to addressing an important question of normative modeling. With the greater availability of cross-sectional studies for normative modeling than longitudinal studies, and the inappropriateness of making inferences about longitudinal subject-specific changes using these cross-sectional data-based normative models, it's meaningful to try to address this gap from the aspect of methodological development.

      In the 1st revision, the authors added a simulation study to show how the performance of the classification based on z-diff scores relatively changes with different disruptions (and autocorrelation). Unfortunately, in my view this is insufficient as it only shows how the performance of using z-diff score relatively changes in different scenarios. I would suggest adding the comparison of performance to using the naïve difference in two simple z-scores to first show its better performance, which should also further highlight the inappropriate use of simple z-scores in inferring within-subject longitudinal changes. Additionally, Figure 1 is hard to read and obtain the actual values of the performance measure. I would suggest reducing it to several 2-dimensional figures. For example, for several fixed values of rho, how the performance changes with different values of the true disruption (and also adding the comparison to the naïve method (difference in two z-scores)).

      I would also suggest changing the title to reflect that the evaluation of "intra-subject" longitudinal change is the method's focus.

    3. Author response:

      The following is the authors’ response to the original reviews.

      Reviewer #1 (Public Review):

      The models described are not fundamentally novel, essentially a random intercept model (with a warping function), and some flexible covariate effects using splines (i.e., additive models).

      We respectfully but strongly disagree with the reviewer’s assessment of the novelty of our work. The models referred to by the reviewer as “random intercept models … and some flexible covariate effects” seem to relate to the estimation of normative models derived cross-sectionally as developed in and adopted from previous work, not to the work presented here. To be clear, the contributions of this work are: (i) a principled methodology to make statistical predictions for individual subjects in longitudinal studies based on a novel z-diff score, (ii) an approach to transfer information large scale normative models estimated on large scale cross-sectional data to longitudinal studies (iii) an extensive theoretical analysis of the properties of this approach and (iv) empirical evaluation on an unpublished psychosis dataset. Put simply, we provide the ability to estimate within subject change in normative models which until now only provide the ability to show a subject's position in the normative range at a given timepoint. With the exception of the reference [13] cited in the main text, we are not aware of any methods available that can achieve this. Based on this feedback combined with the feedback of the Reviewer 2, we now improved our introduction and clearly state our contribution right from the outset of the manuscript whilst also shortening the introduction to make it more concise. In this work, we are trying to be very transparent in showing to the reader that our method builds on a previously peer-reviewed model.

      The assumption of constant quantiles is very strong, and limits the utility of the model to very short term data.

      We now provide an extensive theoretical analysis of our approach (section 2.1.3), where we show that this assumption is actually not strictly necessary and that our approach yields valid inferences even under much milder assumptions. More specifically, we first provide a mathematical grounding for the assumption we made in the initial submission, then generalise our method to a wider class of residual processes and show that our original assumption of constant quantiles is not too restrictive. We also provide a simulation study to show how the practitioner can evaluate the validity and implications of this assumption on a case-by-case basis. This generalisation is described in depth in section 2.1.3.

      The schizophrenia example leads to a counter-intuitive normalization of trajectories, which leads to suspicions that this is driven by some artifact of the data modeling/imaging pipelines.

      We understand that the observed normalisation effects might appear surprising. As we outlined in our provisional response, we would like to emphasise that there is increasing evidence that the old neurodegenerative view of psychosis is an oversimplification and that trajectories of cortical thickness are highly variable across different individuals after the first psychotic episode. More specifically, we have shown in an independent sample and with different methodology that individuals treated with second-generation antipsychotics and with careful clinical follow-up can show normalisation of cortical thickness atypicalities after the first episode (https://www.medrxiv.org/content/10.1101/2024.04.19.24306008v2, now accepted in Schizophrenia Bulletin). These results are well-aligned with the results we show in this manuscript. We now added remarks on this topic into the discussion. We would also like to re-emphasise that the data were processed with the utmost rigour using state of the art processing pipelines including quality control, which we have reported as transparently as possible. The confidence that the results are not ‘driven by some artifact of the data modeling/imaging pipelines’ is also supported by the fact that analysis of a group of healthy controls did not show any significant z-diffs (see Discussion section), neither frontally nor elsewhere. If the reviewer believes there are additional quality control checks that would further increase confidence in our findings, we would welcome the reviewer to provide specific details.

      The method also assumes that the cross-sectional data is from a "healthy population" without describing what this population is (there is certainly every chance of ascertainment bias in large scale studies as well as small scale studies). This issue is completely elided over in the manuscript.

      Indeed, we do not describe the cross-sectional population used for training the models, as these models were already trained and published with in-depth description of the datasets used for the training (https://elifesciences.org/articles/72904). We now make this more explicit in the section 2.1.1. of the manuscript (page 7), and also more explicitly acknowledge the possibility of ascertainment bias in the simulation section 2.1.4. However, we would like to emphasise that such ascertainment bias is not in any way specific to the analyses we report. In fact it is present in all studies that utilise large scale cohorts such as UK Biobank. Indeed, we are currently working on another manuscript to address this question in detail, but given the complexity of this problem and the fact that many publicly available legacy studies simply do not record sufficient demographic information, e.g. to assess racial bias properly, we believe that this is beyond the scope of the current work.

      Reviewer #2 (Public Review):

      The organization and clarity of this manuscript need enhancement for better comprehension and flow. For example, in the first few paragraphs of the introduction, the wording is quite vague. A lot of information was scattered and repeated in the latter part of the introduction, and the actual challenges/motivation of this work were not introduced until the 5th paragraph.

      As noted above in our response to Reviewer 1, we significantly pruned the introduction, stating our objective in the first paragraph and elaborating on the topic later in the text. We hope that it is now less repetitive and easier to follow.

      There are no simulation studies to evaluate whether the adjustment of the crosssectional normative model to longitudinal data can make accurate estimations and inferences regarding the longitudinal changes. Also, there are some assumptions involved in the modeling procedure, for example, the deviation of a healthy control from the population over time is purely caused by noise and constant variability of error/noise across x_n, and these seem to be quite strong assumptions. The presentation of this work's method development would be strengthened if the authors can conduct a formal simulation study to evaluate the method's performance when such assumptions are violated, and, ideally, propose some methods to check these assumptions before performing the analyses.

      This comment encouraged us to zoom out from our original assumption and generalise our method to a wider class of residual processes (stationary Gaussian processes) in section 2.1.3. We now present a theoretical analysis of our model to show that our original assumption (of stable quantiles plus noise) is actually not necessary for valid inference in our method, which broadens the applicability of our method. Of course, we also discuss in what way the original assumption is restrictive and how it aligns with the more general dynamics. We also include a simulation study to evaluate the method's performance and elucidate the role of the more general dynamics in section 2.1.4.

      The proposed "z-diff score" still falls in the common form of z-score to describe the individual deviation from the population/reference level, but now is just specifically used to quantify the deviation of individual temporal change from the population level. The authors need to further highlight the difference between the "z-score" and "z-diff score", ideally at its first mention, in case readers get confused (I was confused at first until I reached the latter part of the manuscript). The z-score can also be called a measure of "standardized difference" which kind of collides with what "z-diff" implies by its name.

      We added the mention of the difference between z-score and z-diff score into the last paragraph of introduction.

      Explaining that one component of the variance is related to the estimation of the model and the other is due to prediction would be helpful for non-statistical readers.

      We now added an interpretation of the z-score in the original model below equation 7.

      It would be easier for the non-statistical reader if the authors consistently used precision or variance for all variance parameters. Probably variance would be more accessible.

      This was a very useful observation, we unified the notation and now only use variance.

      The functions psi were never explicitly described. This would be helpful to have in the supplement with a reference to that in the paper.

      Indeed, while describing the original model we had to make choices about how to condense the necessary information from the original model so that we can build upon it. As the phi function is only used for data transformation in the original model, we did not further elaborate on it, however, we now refer to the specific section of the original paper of Fraza et al. 2021 where it is described more in detail (https://www.sciencedirect.com/science/article/pii/S1053811921009873).

      What is the goal of equations (13) and (14)? The authors should clarify what the point of writing these equations is prior to showing the math. It seems like it is to obtain an estimate of \sigma_{\ksi}^2, which the reader only learns at the end.

      We corrected the formatting.

      What is the definition of "adaption" as used to describe equation (15)? In this equation, I think norm on subsample was not defined.

      We added a more detailed description of the adaptation after equation 15.

      "(the sandwich part with A)" - maybe call this an inner product so that it is not confused with a sandwich variance estimator. This is a bit unclear. Equation (8) does have the inner product involving A and \beta^{-1} does include variability of \eta. It seems like you mean that equation (8) incorrectly includes variability of \eta and does not have the right term vector component of the inner product involving A, but this needs clarifying.

      We now changed the formulation to be less confusing and also explicitly clarified the caveat regarding the difference of z-scores.

      One challenge with the z-diff score is that it does not account for whether a person sits above or below zero at the first time point. It might make it difficult to interpret the results, as the results for a particular pathology could change depending on what stage of the lifespan a person is in. I am not sure how the authors would address those challenges.

      We agree with the outlined limitation in interpretation of overall trends when the position in the visit one is different between the subjects. However, this is a much broader challenge and is not specific to our approach. This effect is generally independent of the lifespan, but may further interact with the typical lifespan of disease. rWhen the z scores are taken in the context of the cross-sectional normative models, it does make it possible to identify what the overall trend of an illness is across the lifespan, and individual patient’s z-diffs not in line (with what would this typical group trajectory predicts) may e.g. correspond to early/late onset of their individual atrophy. We now make these considerations explicitly in the discussion section.

      Reviewer #2 (Recommendations For The Authors):

      Other minor suggestions to help improve the text:...

      We thank Reviewer #2 for the list of minor suggestions to improve the text, which we all implemented in the manuscript.

    1. Author response:

      The following is the authors’ response to the original reviews.

      eLife Assessment

      This important work presents a new methodology for the statistical analysis of fiber photometry data, improving statistical power while avoiding the bias inherent in the choices that are necessarily made when summarizing photometry data. The reanalysis of two recent photometry data sets, the simulations, and the mathematical detail provide convincing evidence for the utility of the method and the main conclusions, however, the discussion of the re-analyzed data is incomplete and would be improved by a deeper consideration of the limitations of the original data. In addition, consideration of other data sets and photometry methodologies including non-linear analysis tools, as well as a discussion of the importance of the data normalization are needed.

      Thank you for reviewing our manuscript and giving us the opportunity to respond and improve our paper. In our revision, we have strived to address the points raised in the comments, and implement suggested changes where feasible. We have also improved our package and created an analysis guide (available on our Github - https://github.com/gloewing/fastFMM and https://github.com/gloewing/photometry_fGLMM), showing users how to apply our methods and interpret their results. Below, we provide a detailed point-by-point response to the reviewers.

      Reviewer #1:

      Summary:

      Fiber photometry has become a very popular tool in recording neuronal activity in freely behaving animals. Despite the number of papers published with the method, as the authors rightly note, there are currently no standardized ways to analyze the data produced. Moreover, most of the data analyses confine to simple measurements of averaged activity and by doing so, erase valuable information encoded in the data. The authors offer an approach based on functional linear mixed modeling, where beyond changes in overall activity various functions of the data can also be analyzed. More in-depth analysis, more variables taken into account, and better statistical power all lead to higher quality science.

      Strengths:

      The framework the authors present is solid and well-explained. By reanalyzing formerly published data, the authors also further increase the significance of the proposed tool opening new avenues for reinterpreting already collected data.

      Thank you for your favorable and detailed description of our work!

      Weaknesses:

      However, this also leads to several questions. The normalization method employed for raw fiber photometry data is different from lab to lab. This imposes a significant challenge to applying a single tool of analysis.

      Thank you for these important suggestions. We agree that many data pre-processing steps will influence the statistical inference from our method. Note, though, that this would also be the case with standard analysis approaches (e.g., t-tests, correlations) applied to summary measures like AUCs. For that reason, we do not believe that variability in pre-processing is an impediment to widespread adoption of a standard analysis procedure. Rather, we would argue that the sensitivity of analysis results to pre-processing choices should motivate the development of statistical techniques that reduce the need for pre-processing, and properly account for structure in the data arising from experimental designs. For example, even without many standard pre-processing steps, FLMM provides smooth estimation results across trial timepoints (i.e., the “functional domain”), has the ability to adjust for betweentrial and -animal heterogeneity, and provides a valid statistical inference framework that quantifies the resulting uncertainty. We appreciate the reviewer’s suggestion to emphasize and further elaborate on our method from this perspective. We have now included the following in the Discussion section:

      “FLMM can help model signal components unrelated to the scientific question of interest, and provides a systematic framework to quantify the additional uncertainty from those modeling choices. For example, analysts sometimes normalize data with trial-specific baselines because longitudinal experiments can induce correlation patterns across trials that standard techniques (e.g., repeated measures ANOVA) may not adequately account for. Even without many standard data pre-processing steps, FLMM provides smooth estimation results across trial time-points (the “functional domain”), has the ability to adjust for between-trial and -animal heterogeneity, and provides a valid statistical inference approach that quantifies the resulting uncertainty. For instance, session-to-session variability in signal magnitudes or dynamics (e.g., a decreasing baseline within-session from bleaching or satiation) could be accounted for, at least in part, through the inclusion of trial-level fixed or random effects. Similarly, signal heterogeneity due to subject characteristics (e.g., sex, CS+ cue identity) could be incorporated into a model through inclusion of animal-specific random effects. Inclusion of these effects would then influence the width of the confidence intervals. By expressing one’s “beliefs” in an FLMM model specification, one can compare models (e.g., with AIC). Even the level of smoothing in FLMM is largely selected as a function of the data, and is accounted for directly in the equations used to construct confidence intervals. This stands in contrast to “trying to clean up the data” with a pre-processing step that may have an unknown impact on the final statistical inferences.”

      Does the method that the authors propose work similarly efficiently whether the data are normalized in a running average dF/F as it is described in the cited papers? For example, trace smoothing using running averages (Jeong et al. 2022) in itself may lead to pattern dilution.

      By modeling trial signals as “functions”, the method accounts for and exploits correlation across trial timepoints and, as such, any pre-smoothing of the signals should not negatively affect the validity of the 95% CI coverage. It will, however, change inferential results and the interpretation of the data, but this is not unique to FLMM, or many other statistical procedures.

      The same question applies if the z-score is calculated based on various responses or even baselines. How reliable the method is if the data are non-stationery and the baselines undergo major changes between separate trials?

      Adjustment for trial-to-trial variability in signal magnitudes or dynamics could be accounted for, at least in part, through the inclusion of trial-level random effects. This heterogeneity would then influence the width of the confidence intervals, directly conveying the effect of the variability on the conclusions being drawn from the data. This stands in contrast to “trying to clean up the data” with a pre-processing step that may have an unknown impact on the final statistical inferences. Indeed, non-stationarity (e.g., a decreasing baseline within-session) due to, for example, measurement artifacts (e.g., bleaching) or behavioral causes (e.g., satiation, learning) should, if possible, be accounted for in the model. As mentioned above, one can often achieve the same goals that motivate pre-processing steps by instead applying specific FLMM models (e.g., that include trial-specific intercepts to reflect changes in baseline) to the unprocessed data. One can then compare model criteria in an objective fashion (e.g., with AIC) and quantify the uncertainty associated with those modeling choices. Even the level of smoothing in FLMM is largely selected as a function of the data, and is accounted for directly in the equations used to construct confidence intervals. In sum, our method provides both a tool to account for challenges in the data, and a systematic framework to quantify the additional uncertainty that accompanies accounting for those data characteristics.

      Finally, what is the rationale for not using non-linear analysis methods? Following the paper’s logic, non-linear analysis can capture more information that is diluted by linear methods.

      This is a good question that we imagine many readers will be curious about as well. We have added in notes to the Discussion and Methods Section 4.3 to address this (copied below). We thank the reviewer for raising this point, as your feedback also motivated us to discuss this point in Part 5 of our Analysis Guide.

      Methods

      “FLMM models each trial’s signal as a function that varies smoothly across trial time-points (i.e., along the “functional domain”). It is thus a type of non-linear modeling technique over the functional domain, since we do not assume a linear model (straight line). FLMM and other functional data analysis methods model data as functions, when there is a natural ordering (e.g., time-series data are ordered by time, imaging data are ordered by x-y coordinates), and are assumed to vary smoothly along the functional domain (e.g., one assumes values of a photometry signal at close time-points in a trial have similar values). Functional data analysis approaches exploit this smoothness and natural ordering to capture more information during estimation and inference.”

      Discussion

      “In this paper, we specified FLMM models with linear covariate–signal relationships at a fixed trial time-point across trials/sessions, to compare the FLMM analogue of the analyses conducted in (Jeong et al., 2022). However, our package allows modeling of covariate–signal relationships with non-linear functions of covariates, using splines or other basis functions. One must consider, however, the tradeoff between flexibility and interpretability when specifying potentially complex models, especially since FLMM is designed for statistical inference.”

      Reviewer #2:

      Summary:

      This work describes a statistical framework that combines functional linear mixed modeling with joint 95% confidence intervals, which improves statistical power and provides less conservative statistical inferences than in previous studies. As recently reviewed by Simpson et al. (2023), linear regression analysis has been used extensively to analyze time series signals from a wide range of neuroscience recording techniques, with recent studies applying them to photometry data. The novelty of this study lies in 1) the introduction of joint 95% confidence intervals for statistical testing of functional mixed models with nested random-effects, and 2) providing an open-source R package implementing this framework. This study also highlights how summary statistics as opposed to trial-by-trial analysis can obscure or even change the direction of statistical results by reanalyzing two other studies.

      Strengths:

      The open-source package in R using a similar syntax as the lme4 package for the implementation of this framework on photometry data enhances the accessibility, and usage by other researchers. Moreover, the decreased fitting time of the model in comparison with a similar package on simulated data, has the potential to be more easily adopted.

      The reanalysis of two studies using summary statistics on photometry data (Jeong et al., 2022; Coddington et al., 2023) highlights how trial-by-trial analysis at each time-point on the trial can reveal information obscured by averaging across trials. Furthermore, this work also exemplifies how session and subject variability can lead to opposite conclusions when not considered.

      We appreciate the in-depth description of our work and, in particular, the R package. This is an area where we put a lot of effort, since our group is very concerned with the practical experience of users.

      Weaknesses:

      Although this work has reanalyzed previous work that used summary statistics, it does not compare with other studies that use trial-by-trial photometry data across time-points in a trial. As described by the authors, fitting pointwise linear mixed models and performing t-test and BenjaminiHochberg correction as performed in Lee et al. (2019) has some caveats. Using joint confidence intervals has the potential to improve statistical robustness, however, this is not directly shown with temporal data in this work. Furthermore, it is unclear how FLMM differs from the pointwise linear mixed modeling used in this work.

      Thank you for making this important point. We agree that this offers an opportunity to showcase the advantages of FLMM over non-functional data analysis methods, such as the approach applied in Lee et al. (2019). As mentioned in the text, fitting entirely separate models at each trial timepoint (without smoothing regression coefficient point and variance estimates across timepoints), and applying multiple comparisons corrections as a function of the number of time points has substantial conceptual drawbacks. To see why, consider that applying this strategy with two different sub-sampling rates requires adjustment for different numbers of comparisons, and could thus lead to very different proportions of timepoints achieving statistical significance. In light of your comments, we decided that it would be useful to provide a demonstration of this. To that effect, we have added Appendix Section 2 comparing FLMM with the method in Lee et al. (2019) on a real dataset, and show that FLMM yields far less conservative and more stable inference across different sub-sampling rates. We conducted this comparison on the delay-length experiment (shown in Figure 6) data, sub-sampled at evenly spaced intervals at a range of sampling rates. We fit either a collection of separate linear mixed models (LMM) followed by a Benjamini–Hochberg (BH) correction, or FLMM with statistical significance determined with both Pointwise and Joint 95% CIs. As shown in Appendix Tables 1-2, the proportion of timepoints at which effects are statistically significant with FLMM Joint CIs is fairly stable across sampling rates. In contrast, the percentage is highly inconsistent with the BH approach and is often highly conservative. This illustrates a core advantage of functional data analysis methods: borrowing strength across trial timepoints (i.e., the functional domain), can improve estimation efficiency and lower sensitivity to how the data is sub-sampled. A multiple comparisons correction may, however, yield stable results if one first smooths both regression coefficient point and variance estimates. Because this includes smoothing the coefficient point and variance estimates, this approach would essentially constitute a functional mixed model estimation strategy that uses multiple comparisons correction instead of a joint CI. We have now added in a description of this experiment in Section 2.4 (copied below).

      “We further analyze this dataset in Appendix Section 2, to compare FLMM with the approach applied in Lee et al. (2019) of fitting pointwise LMMs (without any smoothing) and applying a Benjamini–Hochberg (BH) correction. Our hypothesis was that the Lee et al. (2019) approach would yield substantially different analysis results, depending on the sampling rate of the signal data (since the number of tests being corrected for is determined by the sampling rate). The proportion of timepoints at which effects are deemed statistically significant by FLMM joint 95% CIs is fairly stable across sampling rates. In contrast, that proportion is both inconsistent and often low (i.e., highly conservative) across sampling rates with the Lee et al. (2019) approach. These results illustrate the advantages of modeling a trial signal as a function, and conducting estimation and inference in a manner that uses information across the entire trial.”

      In this work, FLMM usages included only one or two covariates. However, in complex behavioral experiments, where variables are correlated, more than two may be needed (see Simpson et al. (2023), Engelhard et al. (2019); Blanco-Pozo et al. (2024)). It is not clear from this work, how feasible computationally would be to fit such complex models, which would also include more complex random effects.

      Thank you for bringing this up, as we endeavored to create code that is able to scale to complex models and large datasets. We agree that highlighting this capability in the paper will strengthen the work. We now state in the Discussion section that “[T]he package is fast and maintains a low memory footprint even for complex models (see Section 4.6 for an example) and relatively large datasets.” Methods Section 4.6 now includes the following:

      Our fastFMM package scales to the dataset sizes and model specifications common in photometry. The majority of the analyses presented in the Results Section (Section 2) included fairly simple functional fixed and random effect model specifications because we were implementing the FLMM versions of the summary measure analyses presented in Jeong et al. (2022). However, we fit the following FLMM to demonstrate the scalability of our method with more complex model specifications:

      We use the same notation as the Reward Number model in Section 4.5.2, with the additional variable TL_i,j,l_ denoting the Total Licks on trial j of session l for animal i. In a dataset with over 3,200 total trials (pooled across animals), this model took ∼1.2 min to fit on a MacBook Pro with an Apple M1 Max chip with 64GB of RAM. Model fitting had a low memory footprint. This can be fit with the code:

      model_fit = fui(photometry ~ session + trial + iri + lick_time + licks + (session + trial + iri + lick_time + licks | id), parallel = TRUE, data = photometry_data)

      This provides a simple illustration of the scalability of our method. The code (including timing) for this demonstration is now included on our Github repository.

      Reviewer #3:

      Summary:

      Loewinger et al., extend a previously described framework (Cui et al., 2021) to provide new methods for statistical analysis of fiber photometry data. The methodology combines functional regression with linear mixed models, allowing inference on complex study designs that are common in photometry studies. To demonstrate its utility, they reanalyze datasets from two recent fiber photometry studies into mesolimbic dopamine. Then, through simulation, they demonstrate the superiority of their approach compared to other common methods.

      Strengths:

      The statistical framework described provides a powerful way to analyze photometry data and potentially other similar signals. The provided package makes this methodology easy to implement and the extensively worked examples of reanalysis provide a useful guide to others on how to correctly specify models.

      Modeling the entire trial (function regression) removes the need to choose appropriate summary statistics, removing the opportunity to introduce bias, for example in searching for optimal windows in which to calculate the AUC. This is demonstrated in the re-analysis of Jeong et al., 2022, in which the AUC measures presented masked important details about how the photometry signal was changing.

      Meanwhile, using linear mixed methods allows for the estimation of random effects, which are an important consideration given the repeated-measures design of most photometry studies.

      We would like to thank the reviewer for the deep reading and understanding of our paper and method, and the thoughtful feedback provided. We agree with this summary, and will respond in detail to all the concerns raised.

      Weaknesses:

      While the availability of the software package (fastFMM), the provided code, and worked examples used in the paper are undoubtedly helpful to those wanting to use these methods, some concepts could be explained more thoroughly for a general neuroscience audience.

      Thank you for this point. While we went to great effort to explain things clearly, our efforts to be concise likely resulted in some lack of clarity. To address this, we have created a series of analysis guides for a more general neuroscience audience, reflecting our experience working with researchers at the NIH and the broader community. These guides walk users through the code, its deployment in typical scenarios, and the interpretation of results.

      While the methodology is sound and the discussion of its benefits is good, the interpretation and discussion of the re-analyzed results are poor:

      In section 2.3, the authors use FLMM to identify an instance of Simpson’s Paradox in the analysis of Jeong et al. (2022). While this phenomenon is evident in the original authors’ metrics (replotted in Figure 5A), FLMM provides a convenient method to identify these effects while illustrating the deficiencies of the original authors’ approach of concatenating a different number of sessions for each animal and ignoring potential within-session effects.

      Our goal was to demonstrate that FLMM provides insight into why the opposing within- and between-session effects occur: the between-session and within-session changes appear to occur at different trial timepoints. Thus, while the AUC metrics applied in Jeong et al. (2022) are enough to show the presence of Simpson’s paradox, it is difficult to hypothesize why the opposing within-/between-session effects occur. An AUC analysis cannot determine at what trial timepoints (relative to licking) those opposing trends occur.

      The discussion of this result is muddled. Having identified the paradox, there is some appropriate speculation as to what is causing these opposing effects, particularly the decrease in sessions. In the discussion and appendices, the authors identify (1) changes in satiation/habitation/motivation, (2) the predictability of the rewards (presumably by the click of a solenoid valve) and (3) photobleaching as potential explanations of the decrease within days. Having identified these effects, but without strong evidence to rule all three out, the discussion of whether RPE or ANCCR matches these results is probably moot. In particular, the hypotheses developed by Jeong et al., were for a random (unpredictable) rewards experiment, whereas the evidence points to the rewards being sometimes predictable. The learning of that predictability (e.g. over sessions) and variation in predictability (e.g. by attention level to sounds of each mouse) significantly complicate the analysis. The FLMM analysis reveals the complexity of analyzing what is apparently a straightforward task design.

      While we are disappointed to hear the reviewer felt our initial interpretations and discussion were poor, the reviewer brings up an excellent point re: potential reward predictability that we had not considered. They have convinced us that acknowledging this alternative perspective will strengthen the paper, and we have added it into the Discussion. We agree that the ANCCR/RPE model predictions were made for unpredictable rewards and, as the reviewer rightly points out, there is evidence that the animals may sense the reward delivery. After discussing extensively with the authors of Jeong et al. (2022), it is clear that they went to enormous trouble to prevent the inadvertent generation of a CS+, and it is likely changes in pressure from the solenoid (rather than a sound) that may have served as a cue. Regardless of the learning theory one adopts (RPE, ANCCR or others), we agree that this potential learned predictability could, at least partially, account for the increase in signal magnitude across sessions. As this paper is focused on analysis methods, we feel that we can contribute most thoughtfully to the dopamine–learning theory conversation by presenting this explanation in detail, for consideration in future experiments. We have substantially edited this discussion and, as per the reviewer’s suggestion, have qualified our interpretations to reflect the uncertainty in explaining the observed trends.

      If this paper is not trying to arbitrate between RPE and ANCCR, as stated in the text, the post hoc reasoning of the authors of Jeong et al 2022 provided in the discussion is not germane. Arbitrating between the models likely requires new experimental designs (removing the sound of the solenoid, satiety controls) or more complex models (e.g. with session effects, measures of predictability) that address the identified issues.

      Thank you for this point. We agree with you that, given the scope of the paper, we should avoid any extensive comparison between the models. To address your comment, we have now removed portions of the Discussion that compared RPE and ANCCR. Overall, we agree with the reviewer, and think that future experiments will be needed for conclusively testing the accuracy of the models’ predictions for random (unpredicted) rewards. While we understand that our description of several conversations with the Jeong et al., 2022 authors could have gone deeper, we hope the reviewer can appreciate that inclusion of these conversations was done with the best of intentions. We wish to emphasize that we also consulted with several other researchers in the field when crafting our discussion. We do commend the authors of Jeong et al., 2022 for their willingness to discuss all these details. They could easily have avoided acknowledging any potential incompleteness of their theory by claiming that our results do not invalidate their predictions for a random reward, because the reward could potentially have been predicted (due to an inadvertent CS+ generated from the solenoid pressure). Instead, they emphasized that they thought their experiment did test a random reward, to the extent they could determine, and that our results suggest components of their theory that should be updated. We think that engagement with re-analyses of one’s data, even when findings are at odds with an initial theoretical framing, is a good demonstration of open science practice. For that reason as well, we feel providing readers with a perspective on the entire discussion will contribute to the scientific discourse in this area.

      Finally, we would like to reiterate that this conversation is happening at least in part because of our method: by analyzing the signal at every trial timepoint, it provides a formal way to test for the presence of a neural signal indicative of reward delivery perception. Ultimately, this was what we set out to do: help researchers ask questions of their data that may have been harder to ask before. We believe that having a demonstration that we can indeed do this for a “live” scientific issue is the most appropriate way of demonstrating the usefulness of the method.

      Of the three potential causes of within-session decreases, the photobleaching arguments advanced in the discussion and expanded greatly in the appendices are not convincing. The data being modeled is a processed signal (∆F/F) with smoothing and baseline correction and this does not seem to have been considered in the argument. Furthermore, the photometry readout is also a convolution of the actual concentration changes over time, influenced by the on-off kinetics of the sensor, which makes the interpretation of timing effects of photobleaching less obvious than presented here and more complex than the dyes considered in the cited reference used as a foundation for this line of reasoning.

      We appreciate the nuance of this point, and we have made considerable efforts in the Results and Discussion sections to caution that alternative hypotheses (e.g., photobleaching) cannot be definitively ruled out. In response to your criticism, we have consulted with more experts in the field regarding the potential for bleaching in this data, and it is not clear to us why photobleaching would be visible in one time-window of a trial, but not at another (less than a second away), despite high ∆F/F magnitudes in both time-windows. We do wish to point out that the Jeong et al. (2022) authors were also concerned about photobleaching as a possible explanation. At their request, we analyzed data from additional experiments, collected from the same animals. In most cases, we did not observe signal patterns that seemed to indicate photobleaching. Given the additional scrutiny, we do not think that photobleaching is more likely to invalidate results in this particular set of experiments than it would be in any other photometry experiment. While the role of photobleaching may be more complicated with this sensor than others in the references, that citation was included primarily as a way of acknowledging that it is possible that non-linearities in photobleaching could occur. Regardless, your point is well taken and we have qualified our description of these analyses to express that photobleaching cannot be ruled out.

      Within this discussion of photobleaching, the characterization of the background reward experiments used in part to consider photobleaching (appendix 7.3.2) is incorrect. In this experiment (Jeong et al., 2022), background rewards were only delivered in the inter-trial-interval (i.e. not between the CS+ and predicted reward as stated in the text). Both in the authors’ description and in the data, there is a 6s before cue onset where rewards are not delivered and while not described in the text, the data suggests there is a period after a predicted reward when background rewards are not delivered. This complicates the comparison of this data to the random reward experiment.

      Thank you for pointing this out! We removed the parenthetical on page 18 of the appendix that incorrectly stated that rewards can occur between the CS+ and the predicted reward.

      The discussion of the lack of evidence for backpropagation, taken as evidence for ANCCR over RPE, is also weak.

      Our point was initially included to acknowledge that, although our method yields results that conflict with the conclusions described by Jeong et al., 2022 on data from some experiments, on other experiments our method supports their results. Again, we believe that a critical part of re-analyzing shared datasets is acknowledging both areas where new analyses support the original results, as well as those where they conflict with them. We agree with the reviewer that qualifying our results so as not to emphasize support for/against RPE/ANCCR will strengthen our paper, and we have made those changes. We have qualified the conclusions of our analysis to emphasize they are a demonstration of how FLMM can be used to answer a certain style of question with hypothesis testing (how signal dynamics change across sessions), as opposed to providing evidence for/against the backpropagation hypothesis.

      A more useful exercise than comparing FLMM to the methods and data of Jeong et al., 2022, would be to compare against the approach of Amo et al., 2022, which identifies backpropagation (data publicly available: DOI: 10.5061/dryad.hhmgqnkjw). The replication of a positive result would be more convincing of the sensitivity of the methodology than the replication of a negative result, which could be a result of many factors in the experimental design. Given that the Amo et al. analysis relies on identifying systematic changes in the timing of a signal over time, this would be particularly useful in understanding if the smoothing steps in FLMM obscure such changes.

      Thank you for this suggestion. Your thoughtful review has convinced us that focusing on our statistical contribution will strengthen the paper, and we made changes to further emphasize that we are not seeking to adjudicate between RPE/ANCCR. Given the length of the manuscript as it stands, we could only include a subset of the analyses conducted on Jeong et al., 2022, and had to relegate the results from the Coddington et al., data to an appendix. Realistically, it would be hard for us to justify including analyses from a third dataset, only to have to relegate them to an appendix. We did include numerous examples in our manuscript where we already replicated positive results, in a way that we believe demonstrates the sensitivity of the methodology. We have also been working with many groups at NIH and elsewhere using our approach, in experiments targeting different scientific questions. In fact, one paper that extensively applies our method, and compares the results with those yielded by standard analysis of AUCs, is already published (Beas et al., 2024). Finally, in our analysis guide we describe additional analyses, not included in the manuscript, that replicate positive results. Hence there are numerous demonstrations of FLMM’s performance in less controversial settings. We take your point that our description of the data supporting one theory or the other should be qualified, and we have corrected that. Specifically for your suggestion of Amo et al. 2022, we have not had the opportunity to personally reanalyze their data, but we are already in contact with other groups who have conducted preliminary analyses of their data with FLMM. We are delighted to see this, in light of your comments and our decision to restrict the scope of our paper. We will help them and other groups working on this question to the extent we can.

      Recommendations for the Authors:

      Reviewer #2:

      First, I would like to commend the authors for the clarity of the paper, and for creating an open-source package that will help researchers more easily adopt this type of analysis.

      Thank you for the positive feedback!

      I would suggest the authors consider adding to the manuscript, either some evidence or some intuition on how feasible would be to use FLMM for very complex model specifications, in terms of computational cost and model convergence.

      Thank you for this suggestion. As we described above in response to Reviewer #2’s Public Reviews, we have added in a demonstration of the scalability of the method. Since our initial manuscript submission, we have further increased the package’s speed (e.g., through further parallelization). We are releasing the updated version of our package on CRAN.

      From my understanding, this package might potentially be useful not just for photometry data but also for two-photon recordings for example. If so, I would also suggest the authors add to the discussion this potential use.

      This is a great point. Our updated manuscript Discussion includes the following:

      “The FLMM framework may also be applicable to techniques like electrophysiology and calcium imaging. For example, our package can fit functional generalized LMMs with a count distribution (e.g., Poisson). Additionally, our method can be extended to model time-varying covariates. This would enable one to estimate how the level of association between signals, simultaneously recorded from different brain regions, fluctuates across trial time-points. This would also enable modeling of trials that differ in length due to, for example, variable behavioral response times (e.g., latency-topress).”

      Reviewer #3:

      The authors should define ’function’ in context, as well as provide greater detail of the alternate tests that FLMM is compared to in Figure 7.

      We include a description of the alternate tests in Appendix Section 5.2. We have updated the Methods Section (Section 4) to introduce the reader to how ‘functions’ are conceptualized and modeled in the functional data analysis literature. Specifically, we added the following text:

      “FLMM models each trial’s signal as a function that varies smoothly across trial time-points (i.e., along the “functional domain”). It is thus a type of non-linear modeling technique over the functional domain, since we do not assume a linear model (straight line). FLMM and other functional data analysis methods model data as functions, when there is a natural ordering (e.g., time-series data are ordered by time, imaging data are ordered by x-y coordinates), and are assumed to vary smoothly along the functional domain (e.g., one assumes values of a photometry signal at close time-points in a trial have similar values). Functional data analysis approaches exploit this smoothness and natural ordering to capture more information during estimation and inference.”

      Given the novelty of estimating joint CIs, the authors should be clearer about how this should be reported and how this differs from pointwise CIs (and how this has been done in the past).

      We appreciate your pointing this out, as the distinction is nuanced. Our manuscript includes a description of how joint CIs enable one to interpret effects as statistically significant for time-intervals as opposed to individual timepoints. Unlike joint CIs, assessing significance with pointwise CIs suffers from multiple-comparisons problems. As a result of your suggestion, we have included a short discussion of this to our analysis guide (Part 1), entitled “Pointwise or Joint 95% Confidence Intervals.” The Methods section of our manuscript also includes the following:

      “The construction of joint CIs in the context of functional data analysis is an important research question; see Cui et al. (2021) and references therein. Each point at which the pointwise 95% CI does not contain 0 indicates that the coefficient is statistically significantly different from 0 at that point. Compared with pointwise CIs, joint CIs takes into account the autocorrelation of signal values across trial time-points (the functional domain). Therefore, instead of interpreting results at a specific timepoint, joint CIs enable joint interpretations at multiple locations along the functional domain. This aligns with interpreting covariate effects on the photometry signals across time-intervals (e.g., a cue period) as opposed to at a single trial time-point. Previous methodological work has provided functional mixed model implementations for either joint 95% CIs for simple random-effects models (Cui et al., 2021), or pointwise 95% CIs for nested models (Scheipl et al., 2016), but to our knowledge, do not provide explicit formulas or software for computing joint 95% CIs in the presence of general random-effects specifications.”

      The authors identify that many photometry studies are complex nested longitudinal designs, using the cohort of 8 animals used in five task designs of Jeong et al. 2022 as an example. The authors miss the opportunity to illustrate how FLMM might be useful in identifying the effects of subject characteristics (e.g. sex, CS+ cue identity).

      This is a fantastic point and we have added the following into the Discussion:

      “...[S]ignal heterogeneity due to subject characteristics (e.g., sex, CS+ cue identity) could be incorporated into a model through inclusion of animal-specific random effects.”

      In discussing the delay-length change experiment, it would be more accurate to say that proposed versions of RPE and ANCCR do not predict the specific change.

      Good point. We have made this change.

      Minor corrections:

      Panels are mislabeled in Figure 5.

      Thank you. We have corrected this.

      The Crowder (2009) reference is incorrect, being a review of the book with the book presumably being the correct citation.

      Good catch, thank you! Corrected.

      In Section 5 (first appendix), the authors could include the alternate spelling ’fibre photometry’ to capture any citations that use British English spelling.

      This is a great suggestion, but we did not have time to recreate these figures before re-submission.

      Section 7.4 is almost all quotation, though unevenly using the block quotation formatting. It is unclear why such a large quotation is included.

      Thank you for pointing this out. We have removed this Appendix section (formerly Section 7.4) as the relevant text was already included in the Methods section.

      References

      Sofia Beas, Isbah Khan, Claire Gao, Gabriel Loewinger, Emma Macdonald, Alison Bashford, Shakira Rodriguez-Gonzalez, Francisco Pereira, and Mario A Penzo. Dissociable encoding of motivated behavior by parallel thalamo-striatal projections. Current Biology, 34(7):1549–1560, 2024.

      Erjia Cui, Andrew Leroux, Ekaterina Smirnova, and Ciprian Crainiceanu. Fast univariate inference for longitudinal functional models. Journal of Computational and Graphical Statistics, 31:1–27, 07 2021. doi: 10.1080/10618600.2021.1950006.

      Huijeong Jeong, Annie Taylor, Joseph R Floeder, Martin Lohmann, Stefan Mihalas, Brenda Wu, Mingkang Zhou, Dennis A Burke, and Vijay Mohan K Namboodiri. Mesolimbic dopamine release conveys causal associations. Science, 378(6626):eabq6740, 2022. doi: 10.1126/science.abq6740. URL https://www. science.org/doi/abs/10.1126/science.abq6740.

      Rachel S Lee, Marcelo G Mattar, Nathan F Parker, Ilana B Witten, and Nathaniel D Daw. Reward prediction error does not explain movement selectivity in dms-projecting dopamine neurons. eLife, 8:e42992, apr 2019. ISSN 2050-084X. doi: 10.7554/eLife.42992. URL https://doi.org/10.7554/eLife.42992.

      Fabian Scheipl, Jan Gertheiss, and Sonja Greven. Generalized functional additive mixed models. Electronic Journal of Statistics, 10(1):1455 – 1492, 2016. doi: 10.1214/16-EJS1145. URL https://doi.org/10.1214/16-EJS1145.

    2. eLife Assessment

      This important study presents a statistical framework for the analysis of photometry signals and provides an open-source implementation. The evidence supporting the benefits of the presented functional mixed-effect modeling analysis as opposed to 1) summary statistics and 2) other pointwise regression models is convincing with a thorough comparison with other methods and datasets. This work will be of great interest to researchers using not only fiber photometry, but other time-series data such as calcium imaging or electrophysiology data, and wanting to implement trial-by-trial temporal analysis, taking also into account variability within the dataset.

    3. Reviewer #1 (Public review):

      Summary:

      Fiber photometry has become a very popular tool in recording neuronal activity in freely behaving animals. Despite the number of papers published with the method, as the authors rightly note, there are currently no standardized ways to analyze the data produced. Moreover, most of the data analyses confine to simple measurements of averaged activity and by doing so, erase valuable information encoded in the data. The authors offer an approach based on functional linear mixed modeling, where beyond changes in overall activity various functions of the data can also be analyzed. More in depth analysis, more variables taken into account, better statistical power all lead to higher quality science.

      Strengths:

      The framework the authors present is solid and well explained. By reanalyzing formerly published data, the authors also further increase the significance of the proposed tool opening new avenues for reinterpreting already collected data. They also made a convincing case showing that the proposed algorithm works on data with different preprocessing backgrounds.

    4. Reviewer #2 (Public review):

      Summary:

      This work describes a statistical framework that combines functional linear mixed modeling with joint 95% confidence intervals, which improves statistical power and provides less conservative and more robust statistical inferences than in previous studies. Pointwise linear regression analysis has been used extensively to analyze time series signals from a wide range of neuroscience recording techniques, with recent studies applying them to photometry data. The novelty of this study lies in 1) the introduction of joint 95% confidence intervals for statistical testing of functional mixed models with nested random-effects, and 2) providing an open-source R package implementing this framework. This study also highlights how summary statistics as opposed to trial-by-trial analysis can obscure or even change the direction of statistical results by reanalyzing two other studies.

      Strengths:

      The open-source package in R using a similar syntax as lme4 package for the implementation of this framework, the high fitting speed and the low memory footprint, even in complex models, enhance the accessibility and usage by other researchers.

      The reanalysis of two studies using summary statistics on photometry data (Jeong et al., 2022; Coddington et al., 2023) highlights how trial-by-trial analysis at each time-point on the trial can reveal information obscured by averaging across trials. Furthermore, this work also exemplifies how session and subject variability can lead to different conclusions when not considered.

      This study also showcases the statistical robustness of FLMM by comparing this method to fitting pointwise linear mixed models and performing t-test and Benjamini-Hochberg correction as performed by Lee et al. (2019).

    5. Reviewer #3 (Public review):

      Summary:

      Loewinger et al. extend a previously described framework (Cui et al., 2021) to provide new methods for statistical analysis of fiber photometry data. The methodology combines functional regression with linear mixed models, allowing inference on complex study designs that are common in photometry studies. To demonstrate its utility, they reanalyze datasets from two recent fiber photometry studies into mesolimbic dopamine. Then, through simulation, they demonstrate the superiority of their approach compared to other common methods.

      Strengths:

      The statistical framework described provides a powerful way to analyze photometry data and potentially other similar signals. The provided package makes this methodology easy to implement and the extensively worked examples of reanalysis provide a useful guide to others on how to correctly specify models.

      Modeling the entire trial (function regression) removes the need to choose appropriate summary statistics, removing the opportunity to introduce bias, for example in searching for optimal windows in which to calculate the AUC. This is demonstrated in the re-analysis of Jeong et al., 2022, in which the AUC measures presented masked important details about how the photometry signal was changing. There is an appropriate level of discussion of the interpretation of the reanalyzed data that highlights the pitfalls of other methods and the usefulness of their methods.

      The authors' use of linear mixed methods, allows for the estimation of random effects, which are an important consideration given the repeated-measures design of most photometry studies.

      The authors provide a useful guide for how to practically use and implement their methods in an easy-to-use package. These methods should have wide applicability to those who use photometry or similar methods. The development of this excellent open-source software is a great service to the wider neuroscience community.

    1. eLife Assessment

      This article presents valuable findings on the impact of climate change on odonates, integrating phenological and range shifts to broaden our understanding of biodiversity change. The study leverages extensive natural history data, offering a combined analysis of temporal trends in phenology and distribution and their potential drivers. The support for the findings is solid, though additional clarification regarding the methods and alternative sensitivity analyses could make the conclusions stronger.

    1. eLife Assessment

      This important study substantially advances our understanding of nocturnal animal navigation and the ways that animals use polarized light. The evidence supporting the conclusions is convincing, with elegant behavioural experiments in actively navigating ants. The work will be of interest to biologists working on animal navigation or sensory ecology.

    2. Reviewer #1 (Public review):

      Freas et al. investigated if the exceedingly dim polarization pattern produced by the moon can be used by animal to guide a genuine navigational task. The sun and moon are celestial beacons for directional information, but they can be obscured by clouds, canopy, or the horizon. However, even when hidden from view, these celestial bodies provide directional information through the polarized light patterns in the sky. While the sun's polarization pattern is famously used by many animals for compass orientation, until now it has never been shown that the extremely dim polarization pattern of the moon can be used for navigation. To test this, Freas et al. studied nocturnal bull ants, by placing a linear polarizer in the homing path on a freely navigating ant 45 degrees shifted to the moon's natural polarization pattern. They recorded the homing direction of an ant before entering the polarizer, under the polarizer, and again after leaving the area covered by the polarizer. The results very clearly show, that ants walking under the linear polarizer change their homing direction by about 45 degrees in comparison to the homing direction under the natural polarization pattern and change it back after leaving the area covered by the polarizer again. These results can be repeated throughout the lunar month, showing that bull ants can use the moon's polarization pattern even under crescent moon conditions. Finally, the authors show, that the degree in which the ants change their homing direction is dependent on the length of their home vector, just as it is for the solar polarization pattern.

      The behavioral experiments are very well designed, and the statistical analyses are appropriate for the data presented. The authors' conclusions are nicely supported by the data and clearly show nocturnal bull ants use the dim polarization pattern of the moon for homing, in the same way many animals use the sun's polarization pattern during the day. This is the first proof of the use of the lunar polarization pattern in any animal.

      Comments on revised version:

      The authors have addressed all of my previous comments and suggestions. I am happy with the way the manuscript has improved and have no further comments.

    3. Reviewer #2 (Public review):

      Summary:

      The authors aimed to understand whether polarised moonlight could be used as a directional cue for nocturnal animals homing at night, particularly at times of night when polarised light is not available from the sun. To do this, the authors used nocturnal ants, and previously established methods, to show that the walking paths of ants can be altered predictably when the angle of polarised moonlight illuminating them from above is turned by a known angle (here +/- 45 degrees).

      Strengths:

      The behavioural data are very clear and unambiguous. The results clearly show that when the angle of downwelling polarised moonlight is turned, ants turn in the same direction. The data also clearly show that this result is maintained even for different phases (and intensities) of the moon, although during the waning cycle of the moon the ants' turn is considerably less than may be expected.

      Impact:

      The authors have discovered that nocturnal bull ants, while homing back to their nest holes at night, are able to use the dim polarised light pattern formed around the moon for path integration. Even though similar methods have previously shown the ability of dung beetles to orient along straight trajectories for short distances using polarised moonlight, this the first evidence of an animal that uses polarised moonlight in homing. This is quite significant, and their findings are well supported by their data.

      Comments on revised version:

      The authors have made a good effort to accommodate my suggestions for improvement (and from what I can tell, those of the other reviewers). I have no further comments.

    4. Reviewer #3 (Public review):

      Summary:

      This manuscript presents a series of experiments aimed at investigating orientation to polarized lunar skylight in a nocturnal ant, the first report of its kind that I am aware of.

      Strengths:

      The study was conducted carefully and is clearly explained here.

      Comments on revised version:

      The manuscript is much improved and will make an excellent contribution to the field.

    5. Author response:

      The following is the authors’ response to the previous reviews.

      Public Reviews: 

      Reviewer #1 (Public Review): 

      Freas et al. investigated if the exceedingly dim polarization pattern produced by the moon can be used by animals to guide a genuine navigational task. The sun and moon have long been celestial beacons for directional information, but they can be obscured by clouds, canopy, or the horizon. However, even when hidden from view, these celestial bodies provide directional information through the polarized light patterns in the sky. While the sun's polarization pattern is famously used by many animals for compass orientation, until now it has never been shown that the extremely dim polarization pattern of the moon can be used for navigation. To test this, Freas et al. studied nocturnal bull ants, by placing a linear polarizer in the homing path on freely navigating ants 45 degrees shifted to the moon's natural polarization pattern. They recorded the homing direction of an ant before entering the polarizer, under the polarizer, and again after leaving the area covered by the polarizer. The results very clearly show, that ants walking under the linear polarizer change their homing direction by about 45 degrees in comparison to the homing direction under the natural polarization pattern and change it back after leaving the area covered by the polarizer again. These results can be repeated throughout the lunar month, showing that bull ants can use the moon's polarization pattern even under crescent moon conditions. Finally, the authors show, that the degree in which the ants change their homing direction is dependent on the length of their home vector, just as it is for the solar polarization pattern. 

      The behavioral experiments are very well designed, and the statistical analyses are appropriate for the data presented. The authors' conclusions are nicely supported by the data and clearly show that nocturnal bull ants use the dim polarization pattern of the moon for homing, in the same way many animals use the sun's polarization pattern during the day. This is the first proof of the use of the lunar polarization pattern in any animal.

      Reviewer #2 (Public Review): 

      Summary: 

      The authors aimed to understand whether polarised moonlight could be used as a directional cue for nocturnal animals homing at night, particularly at times of night when polarised light is not available from the sun. To do this, the authors used nocturnal ants, and previously established methods, to show that the walking paths of ants can be altered predictably when the angle of polarised moonlight illuminating them from above is turned by a known angle (here +/- 45 degrees).

      Strengths: 

      The behavioural data are very clear and unambiguous. The results clearly show that when the angle of downwelling polarised moonlight is turned, ants turn in the same direction. The data also clearly show that this result is maintained even for different phases (and intensities) of the moon, although during the waning cycle of the moon the ants' turn is considerably less than may be expected.

      Weaknesses: 

      The final section of the results - concerning the weighting of polarised light cues into the path integrator - lacks clarity and should be reworked and expanded in both the Methods and the Results (also possibly with an extra methods figure). I was really unsure of what these experiments were trying to show or what the meaning of the results actually are.

      Rewrote these sections and added figure panel to Figure 6.

      Impact: 

      The authors have discovered that nocturnal bull ants while homing back to their nest holes at night, are able to use the dim polarised light pattern formed around the moon for path integration. Even though similar methods have previously shown the ability of dung beetles to orient along straight trajectories for short distances using polarised moonlight, this is the first evidence of an animal that uses polarised moonlight in homing. This is quite significant, and their findings are well supported by their data.

      Reviewer #3 (Public Review): 

      Summary: 

      This manuscript presents a series of experiments aimed at investigating orientation to polarized lunar skylight in a nocturnal ant, the first report of its kind that I am aware of.

      Strengths: 

      The study was conducted carefully and is clearly explained here. 

      Weaknesses: 

      I have only a few comments and suggestions, that I hope will make the manuscript clearer and easier to understand.

      Time compensation or periodic snapshots 

      In the introduction, the authors compare their discovery with that in dung beetles, which have only been observed to use lunar skylight to hold their course, not to travel to a specific location as the ants must. It is not entirely clear from the discussion whether the authors are suggesting that the ants navigate home by using a time-compensated lunar compass, or that they update their polarization compass with reference to other cues as the pattern of lunar skylight gradually shifts over the course of the night - though in the discussion they appear to lean towards the latter without addressing the former. Any clues in this direction might help us understand how ants adapted to navigate using solar skylight polarization might adapt use to lunar skylight polarization and account for its different schedule. I would guess that the waxing and waning moon data can be interpreted to this effect.

      Added a paragraph discussing this distinction in mechanisms and the limits of the current data set in untangling them. An interesting topic for a follow up to be sure.

      Effects of moon fullness and phase on precision 

      As well as the noted effect on shift magnitudes, the distributions of exit headings and reorientations also appear to differ in their precision (i.e., mean vector length) across moon phases, with somewhat shorter vectors for smaller fractions of the moon illuminated. Although these distributions are a composite of the two distributions of angles subtracted from one another to obtain these turn angles, the precision of the resulting distribution should be proportional to the original distributions. It would be interesting to know whether these differences result from poorer overall orientation precision, or more variability in reorientation, on quarter moon and crescent moon nights, and to what extent this might be attributed to sky brightness or degree of polarization.

      See below for response to this and the next reviewer comment

      N.B. The Watson-Williams tests for difference in mean angle are also sensitive to differences in sample variance. This can be ruled out with another variety of the test, also proposed by Watson and Williams, to check for unequal variances, for which the F statistic is = (n2-1)*(n1-R1) / (n1-1)*(n2-R2) or its inverse, whichever is >1. 

      We have looked at the amount of variance from the mean heading direction in terms of both the shifts and the reorientations and found no significant difference in variance between all relevant conditions. It is possible (and probably likely) that with a higher n we might find these differences but with the current data set we cannot make statistical statements regarding degradations in navigational precision.  

      As an additional analysis to address the Watson-Williams test‘s sensitivity to changes in variance, we have added var test comparisons for each of the comparisons, which is a well-established test to compare variance changes. None of these were significantly different, suggesting the observed differences in the WW tests are due to changes in the mean vector and not the distribution. We have added this test to the text.

      Recommendations for the authors:

      Reviewer #1 (Recommendations For The Authors): 

      I have only very few minor suggestions to improve the manuscript: 

      (1) While I fully agree with the authors that their study, to the best of my knowledge, provides the first proof (in any animal) of the use of the moon's polarization pattern, the many repetitions of this fact disturb the flow of the text and could be cut at several instances. 

      Yes, it is indeed repeated to an annoying degree. 

      We have removed these beyond bookending mentions (Abstract and Discussion).

      (2) In my opinion, the authors did not change the "ambient polarization pattern" when using the linear polarization filter (e.g., l. 55, 170, 177 ...). The linear polarizer presents an artificial polarization pattern with a much higher degree of polarization in comparison to the ambient polarization pattern. I would suggest re-phrasing this, to emphasize the artificial nature of the polarization pattern under the polarizer.

      We have made these suggested changes throughout the text to clarify. We no longer say the ambient pattern was   

      (3) Line 377: I do not see the link between the sentence and Figure 7 

      Changed where in the discussion we refer to Figure 7.

      (4) Figure 7 upper part: In my opinion, the upper part of Figure 7 does not add any additional value to the illustration of the data as compared to Figure 5 and could be cut.

      We thought it might be easier for some reader to see the shifts as a dial representation with the shift magnitude converted to 0-100% rather than the shifts in Figure 5. This makes it somewhat like a graphical abstract summarising the whole study.

      I agree that Figure 5 tells the same story but a reader that has little background in directional stats might find figure 7 more intuitive. This was the intent at least. 

      If it becomes a sticking point, then we can remove the upper portion.  

      Reviewer #2 (Recommendations For The Authors): 

      MINOR CORRECTIONS AND QUERIES 

      Line 117: THE majority 

      Corrected

      Lines 129-130: Do you have a reference to support this statement? I am unaware of experiments that show that homing ants count their steps, but I could have missed it.

      We have added the references that unpack the ant pedometer.  

      Line 140: remove "the" in this line. 

      Removed

      Line 170: We need more details here about the spectral transmission properties of the polariser (and indeed which brand of filter, etc.). For instance, does it allow the transmission of UV light?

      Added

      Line 239: "...tested identicALLY to ...." 

      Corrected

      Lines 242-258 (Vector testing): I must admit I found the description of these experiments very difficult to follow. I read this section several times and felt no wiser as a result. I think some thought needs to be given to better introduce the reader to the rationale behind the experiment (e.g., start by expanding lines 243-246, and maybe add a methods figure that shows the different experimental procedures).

      I have rewritten this section of the methods to clearly state the experiment rational and to be clearer as to the methodology.

      Also Added a methods panel to Figure 6.

      Line 247: "reoriented only halfway". What does this mean? Do you mean with half the expected angle?

      Yes, this is a bit unclear. We have altered for clarity:

      ‘only altered their headings by about half of the 45° e-vector shift (25.2°± 3.7°), despite being tested on near-full-moon nights.’

      Results section (in general): In Figure 1 (which is a very nice figure!) you go to all the trouble of defining b degrees (exit headings) and c degrees (reorientation headings), which are very intuitive for interpreting the results, and then you totally abandon these convenient angles in favour of an amorphous Greek symbol Phi (Figs. 2-6) to describe BOTH exit and reorientation headings. Why?? It becomes even more confusing when headings described by Phi can be typically greater than 300 degrees in the figures, but they are never even close to this in the text (where you seem to have gone back to using the b degrees and c degrees angles, without explicitly saying so). Personally, I think the b degrees and c degrees angles are more intuitive (and should be used in both the text and the figures), but if you do insist on using Phi then you should use it consistently in both the text and the figures. 

      Replaced Phi with b° and c° for both figures and in the text.

      Finally, for reorientation angles in Figure 4A, you say that the angle is 16.5 degrees. This angle should have been 143.5 degrees to be consistent with other figures. 

      Yes, the reorientation was erroneously copied from the shift data (it is identical in both the +45 shift and reorientation for Figure 4A). This has now been corrected

      Line 280, and many other lines: Wherever you refer to two panels of the same figure, they should be written as (say) Figure 2A, B not Figure 2AB.

      Changed as requested throughout the text.

      Line 295 (Waxing lunar phases): For these experiments, which nest are you using? 1 or 2?

      We have added that this is nest 1. 

      Figure 3B: The title of this panel should be "Waxing Crescent Moon" I think. 

      Ah yes, this is incorrect in the original submission. I have fixed this.

      Lines 312-313: Here it sounds as though the ants went right back to the full +/- 45 degrees orientations when they clearly didn't (it was -26.6 degrees and 189.9 degrees). Maybe tone the language down a bit here.

      Changed this to make clear the orientation shift is only ‘towards’ the ambient lunar e-vector.

      Line 327: Insert "see" before "Figure 5" 

      Added

      Line 329: See comment for Line 295. 

      We have added that this is nest 1. 

      Lines 357-373 (Vector testing): Again, because of the somewhat confusing methods section describing these experiments, these results were hard to follow, both here and in the Discussion. I don't really understand what you have shown here. Re-think how you present this (and maybe re-working the Methods will be half the battle won). 

      I have rewritten these sections to try to make clear these are ant tested with differences in vector length 6m vs. 2m, tested at the same location. Hopefully this is much clearer, but I think if these portions remain a bit confusing that a full rename of the conditions is in order. Something like long vector and short vector would help but comes with the problem of not truly describing what the purpose of the test is which is to control for location, thus the current condition names. As it stands, I hope the new clarifications adequately describe the reasoning while keeping the condition names. Of course, I am happy to make more changes here as making this clear to readers is important for driving home that the path integrator is in play.

      See current change to results as an example: ‘Both forgers with a long ~6m remaining vector (Halfway Release), or a short ~2m remaining vector (Halfway Collection & Release), tested at the same location_,_ exhibited significant shifts to the right of initial headings when the e-vector was rotated clockwise +45°.’

      Line 361: I think this should be 16.8 not 6.8 

      Yes, you are correct. Fixed in text (16.8).

      Line 365: I think this should be -12.7 not 12.7 

      Yes, you are correct. Fixed in text (–12.7).

      Line 408: "morning twilight". Should this be "morning solar twilight"? Plus "M midas" should be "M. midas"

      Added and fixed respectively.

      Line 440. "location" is spelt wrong. 

      Fixed spelling.

      Line 444: "...WITH longer accumulated vectors, ..." 

      Added ‘with’ to sentence. 

      Line 447: Remove "that just as"

      Removed.

      Line 448: "Moonlight polarised light" should be "Polarised moonlight" 

      Corrected.

      Lines 450-453: This sentence makes little sense scientifically or grammatically. A "limiting factor" can't be "accomplished". Please rephrase and explain in more detail.

      This sentence has been rephrased:

      ‘The limiting factors to lunar cue use for navigation would instead be the ant’s detection threshold to either absolute light intensity, polarization sensitivity and spectral sensitivity. Moonlight is less UV rich compared to direct sunlight and the spectrum changes across the lunar cycle (Palmer and Johnsen 2015).’

      Line 474: Re-write as "... due to the incorporation of the celestial compass into the path integrator..."

      Added.

      Reviewer #3 (Recommendations For The Authors): 

      Minor comments 

      Line 84 I am not sure that we can infer attentional processes in orientation to lunar skylight, at least it has not yet been investigated.

      Yes, this is a good point. We have changed ‘attend’ to ‘use’.  

      Line 90 This description of polarized light is a little vague; what is meant by the phrase "waves which occur along a single plane"? (What about the magnetic component? These waves can be redirected, are they then still polarized? Circular polarization?). I would recommend looking at how polarized light is described in textbooks on optics.

      Response: We have rewritten the polarised light section to be clearer using optics and light physics for background. 

      Line 92 The phrase "e-vector" has not been described or introduced up to this point.

      We now introduce e-vector and define it. 

      ‘Polarised light comprises light waves which occur along a single plane and are produced as a by-product of light passing through the upper atmosphere (Horváth & Varjú 2004; Horváth et al., 2014). The scattering of this light creates an e-vector pattern in the sky, which is arranged in concentric circles around the sun or moon's position with the maximum degree of polarisation located 90° from the source. Hence when the sun/moon is near the horizon, the pattern of polarised skylight is particularly simple with uniform direction of polarisation approximately parallel to the north-south axes (Dacke et al., 1999, 2003; Reid et al. 2011; Zeil et al., 2014).’

      Happy to make further changes as well.  

      Line 107 Diurnal dung beetles can also orient to lunar skylight if roused at night (Smolka et al., 2016), provided the sky is bright enough. Perhaps diurnal ants might do the same?

      Added the diurnal dung beetles mention as well as the reference.

      Also, a very good suggestion using diurnal bull ants.

      Line 146 Instead of lunar calendar the authors appear to mean "lunar cycle". 

      Changed

      Line 165 In Figure 1B, it looks like visual access to the sky was only partly "unobstructed". Indeed foliage covers as least part of the sky right up to the zenith.

      We have added that the sky is partially obstructed. 

      Line 179 This could also presumably be checked with a camera? 

      For this testing we tried to keep equipment to a minimum for a single researcher walking to and from the field site given the lack of public transport between 1 and 4am. But yes, for future work a camera based confirmation system would be easier. 

      Line 243 The abbreviation "PI" has not been described or introduced up to this point.

      Changes to ‘path integration derived vector lengths….’

      Line 267 The method for comparing the leftwards and rightwards shifts should be described in full here (presumably one set of shifts was mirrored onto the other?).

      We have added the below description to indicate the full description of the mirroring done to counterclockwise shifts.

      ‘To assess shift magnitude between −45° and +45° foragers within conditions, we calculated the mirror of shift in each −45° condition, allowing shift magnitude comparisons within each condition. Mirroring the −45° conditions was calculated by mirroring each shift across the 0° to 180° plane and was then compared to the corresponding unaltered +45 condition.’

      Discussion Might the brightness and spectrum of lunar skylight also play a role here?

      We have added a section to the discussion to mention the aspects of moonlight which may be important to these animals, including the spectrum, brightness and polarisation intensity.  

      Line 451 The sensitivity threshold to absolute light intensity would not be the only limiting factor here. Polarization sensitivity and spectral sensitivity may also play a role (moonlight is less UV rich than sunlight and the spectrum of twilight changes across the lunar cycle: Palmer & Johnsen, 2015). 

      Added this clarification.

      Line 478 Instead of the "masculine ordinal" symbol used (U+006F) here a degree symbol (U+00B0) should be used.

      Ah thank you, we have replaced this everywhere in the text.  

      Line 485 It should be possible to calculate the misalignment between polarization pattern before and after this interruption of celestial cues. Does the magnitude of this misalignment help predict the size of the reorientation?

      Reorientations are highly correlated with the shift size under the filter, which makes sense as larger shifts mean that foragers need to turn back more to reorient to both the ambient pattern and to return to their visual route. Reorientation sizes do not show a consistent reduction compared to under-the-filter shifts when the lunar phase is low and is potentially harder to detect.

      I have reworked this line in the text as I do not think there is much evidence for misalignment and it might be more precise to say that overnight periods where the moon is not visible may adversely impact the path integrator estimate, though it is currently unknown the full impact of this celestial cue gap of if other cues might also play a role.

      Line 642 "from their" should be "relative to" 

      Changed as requested

      Figure 1B Some mention should be made of the differences in vegetation density. 

      Added a sentence to the figure caption discussing the differences in both vegetation along the horizon and canopy cover.

      Figures 2-6 A reference line at 0 degrees change might help the reader to assess the size of orientation changes visually. Confidence intervals around the mean orientation change would also help here.

      We have now added circular grid lines and confidence intervals to the circular plots. These should help make the heading changes clear to readers.

    1. eLife Assessment

      This valuable study is a companion to a paper introducing a theoretical framework and methodology for identifying Cancer Driving Nucleotides (CDNs). The evidence that recurrent SNVs or CDNs are common in true cancer driver genes is convincing, with more limited evidence that many more undiscovered cancer driver mutations will have CDNs, and that this approach could identify these undiscovered driver genes with about 100,000 samples.

    2. Reviewer #1 (Public review):

      The study investigates Cancer Driving Nucleotides (CDNs) using the TCGA database, finding that these recurring point mutations could greatly enhance our understanding of cancer genomics and improve personalized treatment strategies. Despite identifying 50-150 CDNs per cancer type, the research reveals that a significant number remain undiscovered, limiting current therapeutic applications, underscoring the need for further larger-scale research.

      Strengths:

      The study provides a detailed examination of cancer-driving mutations at the nucleotide level, offering a more precise understanding than traditional gene-level analyses. The authors found a significant number of CDNs remain undiscovered, with only 0-2 identified per patient out of an expected 5-8, indicating that many important mutations are still missing. The study indicated that identifying more CDNs could potentially significantly impact the development of personalized cancer therapies, improving patient outcomes.

      Weaknesses:

      The challenges in direct functional testing of CDNs due to the complexity of tumor evolution and unknown mutation combinations limit the practical applicability of the findings.

    3. Reviewer #2 (Public review):

      Summary:

      The study proposes that many cancer driver mutations are not yet identified but could be identified if they harbor recurrent SNVs. The paper leverages the analysis from Paper #1 that used quantitative analysis to demonstrate that SNVs or CDNs seen 3 or more times are more likely due to selection (ie a driver mutation) than by chance or random mutation.

      Strengths:

      Empirically, mutation frequency is an excellent marker of a driver gene because canonical driver mutations typically have recurrent SNVs. Using the TCGA database, the paper illustrates that CDNs can identify canonical driver mutations (Fig 3) and that most CDN are likely to disrupt protein function (Fig 2). In addition, CDNs can be shared between cancer types (Fig 4).

      Weaknesses:

      Driver alteration validation is difficult, with disagreements on what defines a driver mutation, and how many driver mutations are present in a cancer. The value proposed by the authors is that the identification of all driver genes can facilitate the design of patient specific targeting therapies, but most targeted therapies are already directed towards known driver genes. There is an incomplete discussion of oncogenes (where activating mutations tend to target a single amino acid or repeat) and tumor suppressor genes (where inactivating mutations may be more spread across the gene). Other alterations (epigenetic, indels, translocations, CNVs) would be missed by this type of analysis.

      The method could be more valuable when applied to the noncoding genome, where driver mutations in promoters or enhancers are relatively rare, or as yet to be discovered. Increasingly more cancers have had whole genome sequencing. Compared to WES, criteria for driver mutations in noncoding regions are less clear, and this method could potentially provide new noncoding driver CDNs. Observing the same mutation in more than one cancer specimen is empirically unusual, and the authors provide a solid quantitative analysis that indicates many recurrent mutations are likely to be cancer-driver mutations.

    4. Author response:

      The following is the authors’ response to the original reviews.

      eLife Assessment <br /> This valuable study is a companion to a paper introducing a theoretical framework and methodology for identifying Cancer Driving Nucleotides (CDNs). While the evidence that recurrent SNVs or CDNs are common in true cancer driver genes is solid, the evidence that many more undiscovered cancer driver mutations will have CDNs, and that this approach could identify these undiscovered driver genes with about 100,000 samples, is limited. 

      Same criticism as in the eLife assessment of eLife-RP-RA-2024-99340 (https://elifesciences.org/reviewed-preprints/99340). Hence, please refer to the responses to the companion paper.

      Public Reviews:

      Reviewer #1 (Public Review):

      The study investigates Cancer Driving Nucleotides (CDNs) using the TCGA database, finding that these recurring point mutations could greatly enhance our understanding of cancer genomics and improve personalized treatment strategies. Despite identifying 50-150 CDNs per cancer type, the research reveals that a significant number remain undiscovered, limiting current therapeutic applications, and underscoring the need for further larger-scale research.

      Strengths:

      The study provides a detailed examination of cancer-driving mutations at the nucleotide level, offering a more precise understanding than traditional gene-level analyses. The authors found a significant number of CDNs remain undiscovered, with only 0-2 identified per patient out of an expected 5-8, indicating that many important mutations are still missing. The study indicated that identifying more CDNs could potentially significantly impact the development of personalized cancer therapies, improving patient outcomes.

      Weaknesses:

      The study is constrained by relatively small sample sizes for each cancer type, which reduces the statistical power and robustness of the findings. ICGC and other large-scale WGS datasets are publicly available but were not included in this study.

      Thanks. We indeed have used all public data, including GENIE (figure 7 of the companion paper), ICGC and other integrated resources such as COSMIC. The main study is based on TCGA because it is unbiased for estimating the probability of CDN occurrences. In many datasets, the numerators are given but the denominators are not (the number of patients with the mutation / the total number of patients surveyed). In GENIE, we observed that E(u) estimated upon given sequencing panels are much smaller than in TCGA, this might be due to the selective report of nonsynonymous mutations for synonymous mutations are generally considered irrelevant in tumorigenesis.

      To be able to identify rare driver mutations, more samples are needed to improve the statistical power, which is well-known in cancer research. The challenges in direct functional testing of CDNs due to the complexity of tumor evolution and unknown mutation combinations limit the practical applicability of the findings.

      We fully agree. We now add a few sentences, making clear that the theory allows us to see how much more can be gained by each stepwise increase in sample size. For example, when the sample size reaches 106, further increases will yield almost no gain in confidence of CDNs identified (see figures of eLife-RP-RA-2024-99340. As pointed out in our provisional responses, an important strength of this pair of studies is that the results are testable. The complexity is the combination of mutations required for tumorigenesis and the identification of such combinations is the main goal and strength of this pair of studies. We add a few sentences to this effect.

      While the importance of large sample sizes in identifying cancer drivers is well-recognized, the analytical framework presented in the companion paper (https://elifesciences.org/reviewed-preprints/99340) goes a step further by quantitatively elucidating the relationship between sample size and the resolution of CDN detection.

      The question is very general as it is about multigene interactions, or epistasis. The challenges are true in all aspects of evolutionary biology, for example, the genetics of reproductive isolation(Wu and Ting 2004). The issue of epistasis is difficult because most, if not all, of the underlying mutations have to be identified in order to carry out functional tests. While the full identification is rarely feasible, it is precisely the objective of the CDN project. When the sample size increases to 100,000 for a cancer type, all point mutations for that cancer type should be identifiable.

      The QC of the TCGA data was not very strict, i.e, "patients with more than 3000 coding region point mutations were filtered out as potential hypermutator phenotypes", it would be better to remove patients beyond +/- 3*S.D from the mean number of mutations for each cancer type. Given some point mutations with >3 hits in the TCGA dataset, they were just false positive mutation callings, particularly in the large repeat regions in the human genome.

      Thanks. The GDC data portal offers data calls from multiple pipelines, enabling us to select mutations detected by at least two pipelines. While including patients with hypermutator phenotypes could introduce potential noise, as shown in Eq. 10 of the main text, our method for defining the upper limit of i* is relative robust to the fluctuations in the E(u) of the corresponding cancer population. Since readers may often ask about this, we expand the Methods section somewhat to emphasize this point.

      The codes for the statistical calculation (i.e., calculation of Ai_e, et al) are not publicly available, which makes the findings hard to be replicated.

      We have now updated the section of “Data Availability” in both papers. The key scripts for generating the major results are available at: https://gitlab.com/ultramicroevo/cdn_v1.

      Reviewer #2 (Public Review):

      Summary:

      The study proposes that many cancer driver mutations are not yet identified but could be identified if they harbor recurrent SNVs. The paper leverages the analysis from Paper #1 that used quantitative analysis to demonstrate that SNVs or CDNs seen 3 or more times are more likely to occur due to selection (ie a driver mutation) than they are to occur by chance or random mutation.

      Strengths:

      Empirically, mutation frequency is an excellent marker of a driver gene because canonical driver mutations typically have recurrent SNVs. Using the TCGA database, the paper illustrates that CDNs can identify canonical driver mutations (Figure 3) and that most CDNs are likely to disrupt protein function (Figure 2). In addition, CDNs can be shared between cancer types (Figure 4).

      Weaknesses:

      Driver alteration validation is difficult, with disagreements on what defines a driver mutation, and how many driver mutations are present in a cancer. The value proposed by the authors is that the identification of all driver genes can facilitate the design of patient-specific targeting therapies, but most targeted therapies are already directed towards known driver genes. There is an incomplete discussion of oncogenes (where activating mutations tend to target a single amino acid or repeat) and tumor suppressor genes (where inactivating mutations may be more spread across the gene). Other alterations (epigenetic, indels, translocations, CNVs) would be missed by this type of analysis.

      The above paragraph has three distinct points. We shall respond one by one.

      First, …  can facilitate the design of patient-specific targeting therapies, but most targeted therapies are already directed towards known driver genes…

      We state in the text of Discussion the following that shows only a few best-known driving mutations have been targeted. It is accurate to say that < 5% of CDNs we have identified are on the current targeting list. Furthermore, this list we have compiled is < 10% of what we expect to find.

      Direct functional test of CDNs would be to introduce putative cancer-driving mutations and observe the evolution of tumors. Such a task of introducing multiple mutations that are collectively needed to drive tumorigenesis has been done only recently, and only for the best-known cancer driving mutations (Ortmann et al. 2015; Takeda et al. 2015; Hodis et al. 2022). In most tumors, the correct combination of mutations needed is not known. Clearly, CDNs, with their strong tumorigenic strength, are suitable candidates.

      Second, “There is an incomplete discussion of oncogenes (where activating mutations tend to target a single amino acid or repeat) and tumor suppressor genes (where inactivating mutations may be more spread across the gene).”

      We sincerely thank the reviewer for this insightful comment. Below are two new paragraphs in the Discussion pertaining to the point:

      In this context, we should comment on the feasibility of targeting CDNs that may occur in either oncogenes (ONCs) or tumor suppressor genes (TSGs). It is generally accepted that ONCs drive tumorigenesis thanks to the gain-of-function (GOF) mutations whereas TSGs derive their tumorigenic powers by loss-of-function (LOF) mutations. It is worthwhile to point out that, since LOF mutations are likely to be more widespread on a gene, CDNs are biased toward GOF mutations. The often even distribution of non-sense mutations along the length of TSGs provide such evidence. As gene targeting aims to diminish gene functions, GOF mutations are perceived to be targetable whereas LOF mutations are not. By extension, ONCs should be targetable but TSGs are not. This last assertion is not true because mutations on TSGs may often be of the GOF kind as well.

      The data often suggest that mis-sense mutations on TSGs are of the GOF kind. If mis-sense mutations are far more prevalent than nonsense mutations in tumors, the mis-sense mutations cannot possibly be LOF mutations. (After all, it is not possible to lose more functions than nonsense mutations.) For example, AAA to AAC (K to Q) is a mis-sense mutation while AAA to AAT (K to stop) is a non-sense mutation. In a separate study (referred to as the escape-route analysis), we found many cases where the mis-sense mutations on TSGs are more prevalent (> 10X) than nonsense mutations. Another well-known example is the distribution of non-sense mutations TSGs. For example, on APC, a prominent TSG, non-sense mutations are far more common in the middle 20% of the gene than the rest (Zhang and Shay 2017; Erazo-Oliveras et al. 2023). The pattern suggests that even these non-sense mutations could have GOF properties. 

      The following response is about the clinical implications of our CDN analysis. Canonical targeted therapy often relies on the Tyrosine Kinase Inhibitors (TKIs) (Dang et al. 2017; Danesi et al. 2021; Waarts et al. 2022). Theoretically, any intervention that suppresses the expression of gain-of-function (GOF) CDNs could potentially have therapeutic value in cancer treatment. This leads us to a discussion of oncogenes versus TSGs in the context of GOF / LOF (loss of function) mutations. Not all mutations on oncogenes have oncogenic effect, besides, truncated mutations in oncogenes are often subject to negative selection (Bányai et al. 2021), the identification of CDNs within oncogenes is therefore crucial for developing effective cancer treatment guidelines. Secondly, while TSGs are generally believed to promote cancer development via loss of function mutations, research suggests that certain mutations within TSGs can have GOF-like effect, such as the dominant negative effect of truncated TP53 mutations (Marutani et al. 1999; de Vries et al. 2002; Gerasimavicius et al. 2022). Characterizing driver mutations as GOF or LOF mutations could potentially expand the scope of targeted cancer therapy. We’ll address this issue in a third study in preparation.

      The method could be more valuable when applied to the noncoding genome, where driver mutations in promoters or enhancers are relatively rare, or as yet to be discovered. Increasingly more cancers have had whole genome sequencing. Compared to WES, criteria for driver mutations in noncoding regions are less clear, and this method could potentially provide new noncoding driver CDNs. Observing the same mutation in more than one cancer specimen is empirically unusual, and the authors provide a solid quantitative analysis that indicates many recurrent mutations are likely to be cancer-driver mutations.

      Again, we are grateful for the comments which prompt us to expand a paragraph in Discussion, reproduced below.

      The CDN approach has two additional applications. First, it can be used to find CDNs in non-coding regions. Although the number of whole genome sequences at present is still insufficient for systematic CDN detection, the preliminary analysis suggests that the density of CDNs in non-coding regions is orders of magnitude lower than in coding regions. Second, CDNs can also be used in cancer screening with the advantage of efficiency as the targeted mutations are fewer. For the same reason, the false negative rate should be much lower too. Indeed, the false positive rate should be far lower than the gene-based screen which often shows a false positive rate of >50% (supplement File S1).

      Again, we are grateful that Reviewer #2 have addressed the potential value of our study in finding cancer drivers in non-coding regions. A major challenge in this area lies in defining the appropriate L value as presented in Eq. 10. In the main text, we used a gamma distribution to account for the variability of mutation rates across sites in coding region. For the non-coding region, we will categorize these regions based on biological annotations. The goal is to set different i* cutoffs for different genomic regions (such as heterochromatin / euchromatin, GC-rich regions or centromeric regions), and avoid false positive calls for CDN in repeated regions (Elliott and Larsson 2021; Peña et al. 2023).

      References

      Bányai L, Trexler M, Kerekes K, Csuka O, Patthy L. 2021. Use of signals of positive and negative selection to distinguish cancer genes and passenger genes. Elife 10:e59629.

      Danesi R, Fogli S, Indraccolo S, Del Re M, Dei Tos AP, Leoncini L, Antonuzzo L, Bonanno L, Guarneri V, Pierini A, et al. 2021. Druggable targets meet oncogenic drivers: opportunities and limitations of target-based classification of tumors and the role of Molecular Tumor Boards. ESMO Open 6:100040.

      Dang CV, Reddy EP, Shokat KM, Soucek L. 2017. Drugging the “undruggable” cancer targets. Nat Rev Cancer 17:502–508.

      Elliott K, Larsson E. 2021. Non-coding driver mutations in human cancer. Nat Rev Cancer 21:500–509.

      Erazo-Oliveras A, Muñoz-Vega M, Mlih M, Thiriveedi V, Salinas ML, Rivera-Rodríguez JM, Kim E, Wright RC, Wang X, Landrock KK, et al. 2023. Mutant APC reshapes Wnt signaling plasma membrane nanodomains by altering cholesterol levels via oncogenic β-catenin. Nat Commun 14:4342.

      Gerasimavicius L, Livesey BJ, Marsh JA. 2022. Loss-of-function, gain-of-function and dominant-negative mutations have profoundly different effects on protein structure. Nat Commun 13:3895.

      Hodis E, Triglia ET, Kwon JYH, Biancalani T, Zakka LR, Parkar S, Hütter J-C, Buffoni L, Delorey TM, Phillips D, et al. 2022. Stepwise-edited, human melanoma models reveal mutations’ effect on tumor and microenvironment. Science 376:eabi8175.

      Marutani M, Tonoki H, Tada M, Takahashi M, Kashiwazaki H, Hida Y, Hamada J, Asaka M, Moriuchi T. 1999. Dominant-negative mutations of the tumor suppressor p53 relating to early onset of glioblastoma multiforme. Cancer Res 59:4765–4769.

      Ortmann CA, Kent DG, Nangalia J, Silber Y, Wedge DC, Grinfeld J, Baxter EJ, Massie CE, Papaemmanuil E, Menon S, et al. 2015. Effect of Mutation Order on Myeloproliferative Neoplasms. N Engl J Med 372:601–612.

      Peña MV de la, Summanen PAM, Liukkonen M, Kronholm I. 2023. Chromatin structure influences rate and spectrum of spontaneous mutations in Neurospora crassa. Genome Res. 33:599–611.

      Takeda H, Wei Z, Koso H, Rust AG, Yew CCK, Mann MB, Ward JM, Adams DJ, Copeland NG, Jenkins NA. 2015. Transposon mutagenesis identifies genes and evolutionary forces driving gastrointestinal tract tumor progression. Nat Genet 47:142–150.

      de Vries A, Flores ER, Miranda B, Hsieh H-M, van Oostrom CThM, Sage J, Jacks T. 2002. Targeted point mutations of p53 lead to dominant-negative inhibition of wild-type p53 function. Proceedings of the National Academy of Sciences 99:2948–2953.

      Waarts MR, Stonestrom AJ, Park YC, Levine RL. 2022. Targeting mutations in cancer. J Clin Invest 132:e154943.

      Wu C-I, Ting C-T. 2004. Genes and speciation. Nat Rev Genet 5:114–122.

      Zhang L, Shay JW. 2017. Multiple Roles of APC and its Therapeutic Implications in Colorectal Cancer. JNCI: Journal of the National Cancer Institute 109:djw332.

    1. Author response:

      The following is the authors’ response to the original reviews.

      eLife assessment This valuable paper reports a theoretical framework and methodology for identifying Cancer Driving Nucleotides (CDNs), primarily based on single nucleotide variant (SNV) frequencies. A variety of solid approaches indicate that a mutation recurring three or more times is more likely to reflect selection rather than being the consequence of a mutation hotspot. The method is rigorously quantitative, though the requirement for larger datasets to fully identify all CDNs remains a noted limitation. The work will be of broad interest to cancer geneticists and evolutionary biologists. 

      The key criticism “the requirement for larger datasets to fully identify all CDNs remains a noted limitation” that is also found in both reviews. We have clarified the issue in the main text, the relevant parts, from which are copied below. The response below also addresses many comments in the reviews. In addition, Discussion of eLife-RP-RA-2024-99341 has been substantially expanded to answer the questions of Reviewer 2.

      We shall answer the boldface comment in three ways. First, it can be answered using GENIE data. Fig. 7 of the main text (eLife-RP-RA-2024-99340) shows that, when n increases from ~ 1000 to ~ 9,000, the numbers of discovered CDNs increase by 3 – 5 fold, most of which come from the two-hit class. Hence, the power of discovering more CDNs with larger datasets is evident. By extrapolation, a sample size of 100,000 should be able to yield 90% of all CDNs, as calculated here. (Fig. 7 also addresses the queries of whether we have used datasets other than TCGA. We indeed have used all public data, including GENIE and COSMIC.) 

      Second, the power of discovering more cancer driver genes by our theory is evident even without using larger datasets. Table 3 of the companion study (eLife-RP-RA-2024-99341) shows that, averaged across cancer types, the conventional method would identify 45 CDGs while the CDN method tallies 258 CDGs. The power of the CDN method is demonstrated. This is because the conventional approach has to identify CDGs (cancer driver genes) in order to identify the CDNs they carry. However, many CDNs occur in non-CDGs and are thus missed by the conventional approach. In Supplementary File S2, we have included a full list of CDNs discovered in our study, along with population allele frequency annotations from gnomAD. The distribution patterns of these CDNs across different cancer types show their pan-cancer properties as further explored in the companion paper.

      Third, while many, or even most CDNs occur in non-CDGs and are thus missed, the conventional approach also includes non-CDN mutations in CDGs. This is illustrated in Fig. 5 of the companion study (eLife-RP-RA-2024-99341) that shows the adverse effect of misidentifications of CDNs by the conventional approach. In that analysis, the gene-targeting therapy is effective if the patient has the CDN mutations on EGFR, but the effect is reversed if the EGFR mutations are non-CDN mutations.

      Reviewer #1 (Public Review):

      The authors developed a rigorous methodology for identifying all Cancer Driving Nucleotides (CDNs) by leveraging the concept of massively repeated evolution in cancer. By focusing on mutations that recur frequently in pan-cancer, they aimed to differentiate between true driver mutations and neutral mutations, ultimately enhancing the understanding of the mutational landscape that drives tumorigenesis. Their goal was to call a comprehensive catalogue of CDNs to inform more effective targeted therapies and address issues such as drug resistance.

      Strengths

      (1) The authors introduced a concept of using massively repeated evolution to identify CDNs. This approach recognizes that advantageous mutations recur frequently (at least 3 times) across cancer patients, providing a lens to identify true cancer drivers.

      (2) The theory showed the feasibility of identifying almost all CDNs if the number of sequenced patients increases to 100,000 for each cancer type.

      Weaknesses

      (1) The methodology remains theoretical and no novel true driver mutations were identified in this study.

      We now address the weakness criticism, which is gratefully received.

      The second part of the criticism (no novel true driver mutations were identified in this study) has been answered in the long responses to eLife assessment above. The first part “The methodology remains theoretical” is somewhat unclear. It might be the lead to the second part. However, just in case, we interpret the word “theoretical” to mean “the lack of experimental proof” and answer below.

      As Reviewer #1 noted, a common limitation of theoretical and statistical analyses of cancer drivers is the need to validate their selective advantage through in vitro or in vivo functional testing. This concern is echoed by both reviewers in the companion paper (eLife-RP-RA-2024-99341), prompting us to consider the methodology for functional testing of potential cancer drivers. An intuitive approach would involve introducing putative driver mutations into normal cells and observing phenotypic transformation in vitro and in vivo. In a recent stepwise-edited human melanoma model, Hodis et al. demonstrated that disease-relevant phenotypes depend on the “correct” combinations of multiple driver mutations (Hodis et al. 2022). Other high-throughput strategies can be broadly categorized into two approaches: (1) introducing candidate driver mutations into pre-malignant model systems that already harbor a canonical mutant driver (Drost and Clevers 2018; Grzeskowiak et al. 2018; Michels et al. 2020) and (2) introducing candidate driver mutations into growth factor-dependent cell models and assessing their impact on resulting fitness (Bailey et al. 2018; Ng et al. 2018). The underlying assumption of these strategies is that the fitness outcomes of candidate driver mutations are influenced by pre-existing driver mutations and the specific pathways or cancer hallmarks being investigated. This confines the functional test of potential cancer driver mutations to conventional cancer pathways. A comprehensive identification of CDNs is therefore crucial to overcome these limitations. In conjunction with other driver signal detection methods, our study aims to provide a more comprehensive profile of driver mutations, thereby enabling the functional testing of drivers involved in non-conventional cancer evolution pathways.

      (2) Different cancer types have unique mutational landscapes. The methodology, while robust, might face challenges in uniformly identifying CDNs across various cancers with distinct genetic and epigenetic contexts.

      We appreciate the comment. Indeed, different cancer types should have different genetic and epigenetic landscapes. In that case, one may have expected CDNs to be poorly shared among cancer types. However, as reported in Fig. 4 of the companion study, the sharing of CDNs across cancer types is far more common than the sharing of CDGs (Cancer Driving Genes). We suggest that CDNs have a much higher resolution than CDGs, whereby the signals are diluted by non-driver mutations. In other words, despite that the mutational landscape may be cancer-type specific, the pan-cancer selective pressure may be sufficiently high to permit the detection of CDN sharing among cancer types.

      Below, we shall respond in greater details. Epigenetic factors, such as chromatin states, methylation/acetylation levels, and replication timing, can provide valuable insights when analyzing mutational landscapes at a regional scale (Stamatoyannopoulos et al. 2009; Lawrence et al. 2013; Makova and Hardison 2015; Baylin and Jones 2016; Alexandrov et al. 2020; Abascal et al. 2021; Sherman et al. 2022). However, at the site-specific level, the effectiveness of these covariates in predicting mutational landscapes depends on their integration into a detailed model. Overemphasizing these covariates could lead to false negatives for known driver mutations (Hess et al. 2019; Elliott and Larsson 2021). In figure 3B of the main text, we illustrate the discrepancy between the mutation rate predictions from Dig and empirical observation. Ideally, no covariates would be needed under extensive sample sizes, where each mutable genomic sites would have sufficient mutations to yield a statistic significance and consequently, synonymous mutations would be sufficient for the characterization of mutational landscape. In this sense, the integration of mutational covariates represents a compromise under current sample size. In our study, the effect of unique mutational landscapes is captured by E(u), the mean mutation rate for each cancer type. We further accounted for the variability of site-level mutability using a gamma distribution. The primary goal of our study is to determine the upper limit of mutation recurrences under mutational mechanisms only. While selection force acts blindly to genomic features, mutational hotspots should exhibit common characteristics determined by their underlying mechanisms. In the main text, we attempted to identify such shared features among CDNs. Until these mutational mechanisms are fully understood, CDNs should be considered as potential driver mutations.

      (3) L223, the statement "In other words, the sequences surrounding the high-recurrence sites appear rather random.". Since it was a pan-cancer analysis, the unique patterns of each cancer type could be strongly diluted in the pan-cancer data.

      We now state that the analyses of mutation characteristic have been applied to the individual cancer types and did not find any pattern that deviates from randomness. Nevertheless, it may be argued that, with the exception of those with sufficiently large sample sizes such as lung and breast cancers, most datasets do not have the power to reject the null hypothesis. To alleviate this concern, we applied the ResNet and LSTM/GRU methods for the discovery of potential mutation motifs within each cancer type. All methods are more powerful than the one used but the results are the same – no cancer type yields a mutation pattern that can reject the null hypothesis of randomness (see below).

      As a positive control, we used these methods for the discovery of splicing sites of human exons. When aligned up with splicing site situated in the center (position 51 in the following plot), the sequence motif would look like:

      Author response image 1.

      5-prime

      Author response image 2.

      3-prime

      However, To account for the potential influence of distance from the mutant site in motif analysis, we randomly shuffled the splicing sites within a specified window around the alignment center, and their sequence logo now looks like:

      Author response image 3.

      5-prime shuffled

      Author response image 4.

      3-prime shuffled

      Author response image 5.

      random sequences from coding regions

      The classification results of the shuffled 5-prime (donner), 3-prime (acceptor) and random sequences from coding regions (Random CDS) are presented in the Author response table 1 (The accuracy for the aligned results, which is approximately 99%, is not shown here).

      Author response table 1.

      With the positive results from these positive controls (splicing site motifs) validating our methodology, we applied the same model structure to the train and test of potential mutational motifs of CDN sites. All models achieved approximately 50% accuracy in CDN motif analysis, suggesting that the sequence contexts surrounding CDN sites are not significantly different from other coding regions of the genome. This further implies that the recurrence of mutations at CDN sites is more likely driven by selection rather than mutational mechanisms.

      Note that this preliminary analysis may be limited by insufficient training data for CDN sites. Future studies will require larger sample sizes and more sophisticated models to address these limitations.

      (4) To solidify the findings, the results need to be replicated in an independent dataset.

      Figure 7 validates our CDN findings using the GENIE dataset, which primarily consists of targeted sequencing data from various panels. By focusing on the same genomic regions sequenced by GENIE, we observed a 3-5 fold increase in the number of discovered CDNs as sample size increased from approximately 1000 to 9000. Moreover, the majority of CDNs identified in TCGA were confirmed as CDNs in GENIE.

      (5) The key scripts and the list of key results (i.e., CDN sites with i{greater than or equal to}3) need to be shared to enable replication, validation, and further research. So far, only CDN sites with i{greater than or equal to}20 have been shared.

      We have now updated the “Data Availability” section in the main text, the corresponding scripts for key results are available on Gitlab at: https://gitlab.com/ultramicroevo/cdn_v1.

      (6) The versions of data used in this study are not clearly detailed, such as the specific version of gnomAD and the version and date of TCGA data downloaded from the GDC Data Portal.

      The versions of data sources have now been updated in the revised manuscript.

      Recommendations For The Authors:

      (1) L119, states "22.7 million nonsynonymous sites," but Table 1 lists the number as 22,540,623 (22.5 million). This discrepancy needs to be addressed for consistency.<br /> (2) Figure 2B, there is an unexplained drop in the line at i = 6 and 7 (from 83 to 45). Clarification is needed on why this drop occurs.<br /> (3) Figure 3A, for the CNS type, data for recurrence at 8 and 9 are missing. An explanation should be provided for this absence.<br /> (4) L201, the title refers to "100-mers," but L218 mentions "101-mers." This inconsistency needs to be corrected to ensure clarity and accuracy.<br /> (5) Figures 6 and 7 currently lack titles. Titles should be added to these figures to improve readability.

      Thanks. All corrections have been incorporated into the revised manuscript.

      Reviewer #2 (Public Review):<br /> Summary:<br /> The authors propose that cancer-driver mutations can be identified by Cancer Driving Nucleotides (CDNs). CDNs are defined as SNVs that occur frequently in genes. There are many ways to define cancer driver mutations, and the strengths and weaknesses are the reliance on statistics to define them.<br /> Strengths:<br /> There are many well-known approaches and studies that have already identified many canonical driver mutations. A potential strength is that mutation frequencies may be able to identify as yet unrecognized driver mutations. They use a previously developed method to estimate mutation hotspots across the genome (Dig, Sherman et al 2022). This publication has already used cancer sequence data to infer driver mutations based on higher-than-expected mutation frequencies. The advance here is to further illustrate that recurrent mutations (estimated at 3 or more mutations (CDNs) at the same base) are more likely to be the result of selection for a driver mutation (Figure 3). Further analysis indicates that mutation sequence context (Figure 4) or mutation mechanisms (Figure 5) are unlikely to be major causes for recurrent point mutations. Finally, they calculate (Figure 6) that most driver mutations identifiable by the CDN approach could be identified with about 100,000 to one million tumor coding genomes.<br /> Weaknesses:<br /> The manuscript does provide specific examples where recurrent mutations identify known driver mutations but do not identify "new" candidate driver mutations. Driver mutation validation is difficult and at least clinically, frequency (ie observed in multiple other cancer samples) is indeed commonly used to judge if an SNV has driver potential. The method would miss alternative ways to trigger driver alterations (translocations, indels, epigenetic, CNVs). Nevertheless, the value of the manuscript is its quantitative analysis of why mutation frequencies can identify cancer driver mutations.

      Recommendations For The Authors<br /> Whereas the analysis of driver mutations in WES has been extensive, the application of the method to WGS data (ie the noncoding regions) would provide new information.

      We appreciate that Reviewer #2 has suggested the potential application of our method to noncoding regions. Currently, the background mutation model is based on the site level mutations in coding regions, which hinders its direct applications in other mutation types such as CNVs, translocations and indels. We acknowledge that the proportion of patients with driver event involving CNV (73%) is comparable to that of coding point mutations (76%) as reported in the PCAWG analysis (Fig. 2A from Campbell et al., 2020). In future studies, we will attempt to establish a CNV-based background mutation rate model to identify positive selection signals driving tumorigenesis.

      References

      Abascal F, Harvey LMR, Mitchell E, Lawson ARJ, Lensing SV, Ellis P, Russell AJC, Alcantara RE, Baez-Ortega A, Wang Y, et al. 2021. Somatic mutation landscapes at single-molecule resolution. Nature:1–6.

      Alexandrov LB, Kim J, Haradhvala NJ, Huang MN, Tian Ng AW, Wu Y, Boot A, Covington KR, Gordenin DA, Bergstrom EN, et al. 2020. The repertoire of mutational signatures in human cancer. Nature 578:94–101.

      Bailey MH, Tokheim C, Porta-Pardo E, Sengupta S, Bertrand D, Weerasinghe A, Colaprico A, Wendl MC, Kim J, Reardon B, et al. 2018. Comprehensive Characterization of Cancer Driver Genes and Mutations. Cell 173:371-385.e18.

      Baylin SB, Jones PA. 2016. Epigenetic Determinants of Cancer. Cold Spring Harb Perspect Biol 8:a019505.

      Campbell PJ, Getz G, Korbel JO, Stuart JM, Jennings JL, Stein LD, Perry MD, Nahal-Bose HK, Ouellette BFF, Li CH, et al. 2020. Pan-cancer analysis of whole genomes. Nature 578:82–93.

      Drost J, Clevers H. 2018. Organoids in cancer research. Nat Rev Cancer 18:407–418.

      Elliott K, Larsson E. 2021. Non-coding driver mutations in human cancer. Nat Rev Cancer 21:500–509.

      Grzeskowiak CL, Kundu ST, Mo X, Ivanov AA, Zagorodna O, Lu H, Chapple RH, Tsang YH, Moreno D, Mosqueda M, et al. 2018. In vivo screening identifies GATAD2B as a metastasis driver in KRAS-driven lung cancer. Nat Commun 9:2732.

      Hess JM, Bernards A, Kim J, Miller M, Taylor-Weiner A, Haradhvala NJ, Lawrence MS, Getz G. 2019. Passenger Hotspot Mutations in Cancer. Cancer Cell 36:288-301.e14.

      Hodis E, Triglia ET, Kwon JYH, Biancalani T, Zakka LR, Parkar S, Hütter J-C, Buffoni L, Delorey TM, Phillips D, et al. 2022. Stepwise-edited, human melanoma models reveal mutations’ effect on tumor and microenvironment. Science 376:eabi8175.

      Lawrence MS, Stojanov P, Polak P, Kryukov GV, Cibulskis K, Sivachenko A, Carter SL, Stewart C, Mermel CH, Roberts SA, et al. 2013. Mutational heterogeneity in cancer and the search for new cancer-associated genes. Nature 499:214–218.

      Makova KD, Hardison RC. 2015. The effects of chromatin organization on variation in mutation rates in the genome. Nat Rev Genet 16:213–223.

      Michels BE, Mosa MH, Streibl BI, Zhan T, Menche C, Abou-El-Ardat K, Darvishi T, Członka E, Wagner S, Winter J, et al. 2020. Pooled In Vitro and In Vivo CRISPR-Cas9 Screening Identifies Tumor Suppressors in Human Colon Organoids. Cell Stem Cell 26:782-792.e7.

      Ng PK-S, Li J, Jeong KJ, Shao S, Chen H, Tsang YH, Sengupta S, Wang Z, Bhavana VH, Tran R, et al. 2018. Systematic Functional Annotation of Somatic Mutations in Cancer. Cancer Cell 33:450-462.e10.

      Sherman MA, Yaari AU, Priebe O, Dietlein F, Loh P-R, Berger B. 2022. Genome-wide mapping of somatic mutation rates uncovers drivers of cancer. Nat Biotechnol 40:1634–1643.

      Stamatoyannopoulos JA, Adzhubei I, Thurman RE, Kryukov GV, Mirkin SM, Sunyaev SR. 2009. Human mutation rate associated with DNA replication timing. Nat Genet 41:393–395.

    2. eLife Assessment

      This important paper introduces a theoretical framework and methodology for identifying Cancer Driving Nucleotides (CDNs), primarily based on single nucleotide variant (SNV) frequencies. A variety of solid approaches indicate that a mutation recurring three or more times is more likely to reflect selection rather than being the consequence of a mutation hotspot. The method is rigorously quantitative, though the requirement for larger datasets to fully identify all CDNs remains a noted limitation. The work will be of broad interest to cancer geneticists and evolutionary biologists.

    3. Reviewer #1 (Public review):

      The authors developed a rigorous methodology for identifying all Cancer Driving Nucleotides (CDNs) by leveraging the concept of massively repeated evolution in cancer. By focusing on mutations that recur frequently in pan-cancer, they aimed to differentiate between true driver mutations and neutral mutations, ultimately enhancing the understanding of the mutational landscape that drives tumorigenesis. Their goal was to call a comprehensive catalogue of CDNs to inform more effective targeted therapies and address issues such as drug resistance.

      Strengths

      (1) The authors introduced a concept of using massively repeated evolution to identify CDNs. This approach recognizes that advantageous mutations recur frequently (at least 3 times) across cancer patients, providing a lens to identify true cancer drivers.

      (2) The theory showed the feasibility of identifying almost all CDNs if the number of sequenced patients increases to 100,000 for each cancer type.

      Weaknesses

      (1) No novel true driver mutations were identified in this study.

      (2) Different cancer types have unique mutational landscapes. The methodology, while robust, might face challenges in uniformly identifying CDNs across various cancers with distinct genetic and epigenetic contexts.

      (3) The statement "In other words, the sequences surrounding the high-recurrence sites appear rather random.". Since it was a pan-cancer analysis, the unique patterns of each cancer type could be strongly diluted in the pan-cancer data.

    4. Reviewer #2 (Public review):

      Summary:

      The authors propose that cancer driver mutations can be identified by Cancer Driving Nucleotides (CDNs). CDNs are defined as SNVs that occur frequently in genes. There are many ways to define cancer driver mutations, and strengths and weaknesses are the reliance of statistics to define them.

      Strengths:

      There are many well-known approaches and studies that have already identified many canonical driver mutations. A potential strength is that mutation frequencies may be able to identify, as yet, unrecognized driver mutations. They use of a previously developed method to estimate mutation hotspots across the genome (Dig, Sherman et al 2022). This publication has already used cancer sequence data to infer driver mutations based on higher than expected mutation frequencies. The advance here is to further illustrate that recurrent mutations (estimated at 3 or more mutations (CDNs) at the same base) are more likely to be the result of selection for a driver mutation (Fig 3). Further analysis indicates that mutation sequence context (Fig 4) or mutation mechanisms (Fig 5) are unlikely to be major causes for recurrent point mutations. Finally, they calculate (Fig 6) that most driver mutations identifiable by the CDN approach could be identified with about 100,000 to one million tumor coding genomes.

      Weaknesses:

      The manuscript does provide specific examples where recurrent mutations identify known driver mutations, but does not identify "new" candidate driver mutations. Driver mutation validation is difficult and at least clinically, frequency (ie observed in multiple other cancer samples) is indeed commonly used to judge if a SNV has driver potential. The method would miss alternative ways to trigger driver alterations (translocations, indels, epigenetic, CNVs). Nevertheless, the value of the manuscript is its quantitative analysis of why mutation frequencies can identify cancer driver mutations.

    1. eLife Assessment

      The authors proposed an important novel deep-learning framework to estimate posterior distributions of tissue microstructure parameters. The method shows superior performance to conventional Bayesian approaches and there is convincing evidence for generalizing the method to use data from different protocol acquisitions and work with models of varying complexity.

    2. Reviewer #1 (Public review):

      The authors proposed a framework to estimate the posterior distribution of parameters in biophysical models. The framework has two modules: the first MLP module is used to reduce data dimensionality and the second NPE module is used to approximate the desired posterior distribution. The results show that the MLP module can capture additional information compared to manually defined summary statistics. By using the NPE module, the repetitive evaluation of the forward model is avoided, thus making the framework computationally efficient. The results show the framework has promise in identifying degeneracy. This is an interesting work.

      Comment on revised version:

      The authors have addressed all the raised concerns and made appropriate modifications to the manuscript. The changes have improved the clarity, methodology, and overall quality of the paper. Given these improvements, I believe the paper now meets the standards for publication in this journal.

    3. Reviewer #2 (Public review):

      Summary:

      The authors improve the work of Jallais et al. (2022) by including a novel module capable of automatically learning feature selection from different acquisition protocols inside a supervised learning framework. Combining the module above with an estimation framework for estimating the posterior distribution of model parameters, they obtain rich probabilistic information (uncertainty and degeneracy) on the parameters in a reasonable computation time.

      The main contributions of the work are:

      (1) The whole framework allows the user to avoid manually defining summary statistics, which may be slow and tedious and affect the quality of the results.

      (2) The authors tested the proposal by tackling three different biophysical models for brain tissue and using data with characteristics commonly used by the diffusion-MR-microstructure research community.

      (3) The authors validated their method well with the state-of-the-art.

      (4) The methodology allows the quantification of the inherent model's degeneration and how it increases with strong noise.

      The authors showed the utility of their proposal by computing complex parameter descriptors automatically in an achievable time for three different and relevant biophysical models.

      Importantly, this proposal promotes tackling, analyzing, and considering the degenerated nature of the most used models in brain microstructure estimation.

    4. Author response:

      The following is the authors’ response to the original reviews.

      Reviewer #1 (Public Review): 

      The authors proposed a framework to estimate the posterior distribution of parameters in biophysical models. The framework has two modules: the first MLP module is used to reduce data dimensionality and the second NPE module is used to approximate the desired posterior distribution. The results show that the MLP module can capture additional information compared to manually defined summary statistics. By using the NPE module, the repetitive evaluation of the forward model is avoided, thus making the framework computationally efficient. The results show the framework has promise in identifying degeneracy. This is an interesting work.

      We thank the reviewer for the positive comments made on our manuscript. 

      Reviewer #1 (Recommendations For The Authors): 

      I have some minor comments. 

      (1) The uGUIDE framework has two modules, MLP and NPE. Why are the two modules trained jointly? The MLP module is used to reduce data dimensionality. Given that the number of features for different models is all fixed to 6, why does one need different MLPs? This module should, in principle, be general-purpose and independent of the model used.

      The MLP must be trained together with the NPE module to maximise inference performance in terms of accuracy and precision. Although the number of features predicted by the MLP was fixed to six, the characteristics of these six features can be very different, depending on the chosen forward model and the available data, as we showed in Appendix 1 Figure 1. Training the MLP independently of the NPE would result in suboptimal performance of µGUIDE, with potentially higher bias and variance of the predicted posterior distributions. We have now added these considerations in the Methods section.

      (2) The authors mentioned at L463 that all the 3 models use 6 features. From L445 to L447, it seems model 3 has 7 unknown parameters. How can one use 6 features to estimate 7 unknowns? 

      Thank you for pointing out the lack of clarity regarding the parameters to estimate in this section. Model 3 is a three-compartment model, whose parameters of interest are the signal fraction and diffusivity from water diffusing in the neurite space (fn and Dn), the neurites orientation dispersion index (ODI), the signal fraction in cell bodies (fs), a proxy to soma radius and diffusivity (Cs), and the signal fraction and diffusivity in the extracellular space (fe and De). The signal fractions are constrained by the relationship fn + fs + fe = 1, hence fe  i_s calculated from the estimated _fn and fs. This leaves us with 6 parameters to estimate: fn, Dn, ODI, fs, Cs, De. We clarified it in the revised version of the paper. 

      (3) L471, Rician noise is not a proper term. Rician distribution is the distribution of pixel intensities observed in the presence of noise. And Rician distribution is the result of magnitude reconstruction. See "Noise in magnitude magnetic resonance images" published in 2008. I assume that real-valued Gaussian noise is added to simulated data. 

      We apologize for the confusion. We added Gaussian noise to the real and imaginary parts of the simulated signals and then used the magnitude of this noisy complex signal for our experiments. We rephrased the sentence for more clarity.

      (4) L475, why thinning is not used in MCMC? In figure 3, the MCMC results are more biased than uGUIDE, is it related to no thinning in MCMC? 

      We followed the recommendations by Harms et al. (2018) for the MCMC experiments. They analysed the impact of thinning (among other parameters) on the estimated posterior distributions. Their findings indicate that thinning is unnecessary and inefficient, and they recommend using more samples instead. For further details, we refer the reviewer to their publication, along with the theoretical works they cite. We have now added this note in the Methods section.

      (5) Did the authors try model-fitting methods with different initializations to get a distribution of the parameters? Like the paper "Degeneracy in model parameter estimation for multi‐compartmental diffusion in neuronal tissue". For the in vivo data, it is informative to see the model-fitting results.

      No, we did not try model-fitting methods with different initializations because such methods provide only a partial description of the solution landscape, which can be interpreted as a partial posterior distribution. Although this approach can help to highlight the problem of degeneracy, it does not provide a complete description of all potential solutions. In contrast, MCMC estimates the full posterior distribution, offering a more accurate and precise characterization of degeneracies and uncertainties compared to model-fitting methods with varying initializations. Hence, we decided to use MCMC as benchmark. We have now added these considerations to the Discussion section. 

      Reviewer #2 (Public Review): 

      Summary: 

      The authors improve the work of Jallais et al. (2022) by including a novel module capable of automatically learning feature selection from different acquisition protocols inside a supervised learning framework. Combining the module above with an estimation framework for estimating the posterior distribution of model parameters, they obtain rich probabilistic information (uncertainty and degeneracy) on the parameters in a reasonable computation time. 

      The main contributions of the work are: 

      (1) The whole framework allows the user to avoid manually defining summary statistics, which may be slow and tedious and affect the quality of the results. 

      (2) The authors tested the proposal by tackling three different biophysical models for brain tissue and using data with characteristics commonly used by the diffusion-MRmicrostructure research community. 

      (3) The authors validated their method well with the state-of-the-art. 

      The main weakness is: 

      (1) The methodology was tested only on scenarios with a signal-to-noise ratio (SNR) equal to 50. It is interesting to show results with lower SNR and without noise that the method can detect the model's inherent degenerations and how the degeneration increases when strong noise is present. I suggest expanding the Figure in Appendix 1 to include this information. 

      The authors showed the utility of their proposal by computing complex parameter descriptors automatically in an achievable time for three different and relevant biophysical models. 

      Importantly, this proposal promotes tackling, analysing, and considering the degenerated nature of the most used models in brain microstructure estimation. 

      We thank the reviewer for these positive remarks. 

      Concerning the main weakness highlighted by the reviewer: In our submitted work, we presented results both without noise and with a signal-to-noise ratio (SNR) equal to 50 (similar to the SNR in the experimental data analysed). Figure 5 shows exemplar posterior distributions obtained in a noise-free scenario, and Table 1 reports the number of degeneracies for each model on 10000 noise-free simulations. These results highlight that the presence of degeneracies is inherent to the model definition. Figures 3, 6 and 7 present results considering an SNR of 50. We acknowledge that results with lower SNR have not been included in the initial submission. To address this, we added a figure in the appendix illustrating the impact of noise on the posterior distributions. Specifically, Figure 1A of Appendix 2 shows posterior distributions estimated from signals generated using an exemplar set of model parameters with varying noise levels

      (no noise, SNR=50 and SNR=25). Figure 1B presents uncertainties values obtained on 1000 simulations for each noise level. We observe that, as the SNR reduces, uncertainty increases. Noise in the signal contributes to irreducible variance. The confidence in the estimates therefore reduces as the noise level increases.  

      Reviewer #2 (Recommendations For The Authors):  

      Some suggestions: 

      Panel A of Figure 2 may deserve a better explanation in the Figure's caption. 

      We agree that the description of panel A of figure 2 was succinct and added more explanation in the figure’s caption.  

      The caption of Figure 3 should mention that the panel's titles are the parameters of the used biophysical models. 

      We added in the caption of figure 3 that the names of the model parameters are indicated in the titles of the panels. We apologise for the confusion it may have created.

      In equation (3), the authors should indicate the summation index. 

      We apologise for not putting the summation index in equation 3. We added it in the revised version.

      In line 474, the authors should discuss if the systematic use of the maximum likelihood estimator as an initializer for the sampling does not bias the computed results. 

      Concerning the MCMC estimations, we followed the recommendations from Harms et al. (2018). They investigated the use of starting from the maximum likelihood estimator (MLE). They concluded that starting from the MLE allows to start in the stationary distribution of the Markov chain, removing the need for some burn-in. Additionally, they showed that initializing the sampling from the MLE has the advantage of removing salt- and pepper-like noise from the resulting mean and standard deviation maps. We have now added this note in the Methods section.

    1. eLife Assessment

      The manuscript reports a valuable finding on dopamine receptor-mediated regulation, the firing of striatal cholinergic interneurons in both healthy and dyskinesia states, identifying that Kv1 channels play a key role in the burst-dependent pause. The study presents solid experimental data, and provides additional mechanistic insights into how burst activity in SCINs leads to a subsequent pause, highlighting the involvement of D1/D5 receptors. This work will be of interest to researchers studying the pathological mechanisms of Parkinson's disease.

    2. Reviewer #1 (Public review):

      Summary:

      Tubert C. et al. investigated the role of dopamine D5 receptors (D5R) and their downstream potassium channel, Kv1, in the striatal cholinergic neuron pause response induced by thalamic excitatory input. Using slice electrophysiological analysis combined with pharmacological approaches, the authors tested which receptors and channels contribute to the cholinergic interneuron pause response in both control and dyskinetic mice (in the L-DOPA off state). They found that activation of Kv1 was necessary for the pause response, while activation of D5R blocked the pause response in control mice. Furthermore, in the L-DOPA off-state of dyskinetic mice, the absence of the pause response was restored by the application of clozapine. The authors claimed that (1) the D5R-Kv1 pathway contributes to the cholinergic interneuron pause response in a phasic dopamine concentration-dependent manner, and (2) clozapine inhibits D5R in the L-DOPA off state, which restores the pause response.

      Strengths:

      The electrophysiological and pharmacological approaches used in this study are powerful tools for testing channel properties and functions. The authors' group has well-established these methodologies and analysis pipelines. Indeed, the data presented were robust and reliable.

      Weaknesses:

      Although the paper has strengths in its methodological approaches, there is a significant gap between the presented data and the authors' claims.

      There was no direct demonstration that the D5R-Kv1 pathway is dominant when dopamine levels are high. The term 'high' is ambiguous, and it raises the question of whether the authors believe that dopamine levels do not reach the threshold required to activate D5R under physiological conditions.

      Furthermore, the data presented in Figure 6 are confusing. If clozapine inhibits active D5R and restores the pause response, the D5R antagonist SCH23390 should have the same effect. The data suggest that clozapine-induced restoration of the pause response might be mediated by other receptors, rather than D5R alone.

    3. Reviewer #2 (Public review):

      Summary:

      This manuscript by Tubert et al presents the role of the D5 receptor in modulating the striatal cholinergic interneuron (CIN) pause response through D5R-cAMP-Kv1 inhibitory signaling. Their model elucidates the on / off switch of CIN pause, likely due to the different DA affinity between D2R and D5R. This machinery may be crucial in modulating synaptic plasticity in cortical-striatal circuits during motor learning and execution. Furthermore, the study bridges their previous finding of CIN hyperexcitability (Paz et al., Movement Disorder 2022) with the loss of pause response in LID mice.

      Strengths:

      The study had solid findings, and the writing was logically structured and easy to follow. The experiments are well-designed, and they properly combined electrophysiology recording, optogenetics, and pharmacological treatment to dissect/rule out most, if not all, possible mechanisms in their model.

      Weaknesses:

      The manuscript is overall satisfying with only some minor concerns that need to be addressed. Manipulation of intracellular cAMP (e.g. using pharmacological analogs or inhibitors) can add additional evidence to strengthen the conclusion.

    4. Reviewer #3 (Public review):

      Summary:

      Tubert et al. investigate the mechanisms underlying the pause response in striatal cholinergic interneurons (SCINs). The authors demonstrate that optogenetic activation of thalamic axons in the striatum induces burst activity in SCINs, followed by a brief pause in firing. They show that the duration of this pause correlates with the number of elicited action potentials, suggesting a burst-dependent pause mechanism. The authors demonstrated this burst-dependent pause relied on Kv1 channels. The pause is blocked by an SKF81297 and partially by sulpiride and mecamylamine, implicating D1/D5 receptor involvement. The study also shows that the ZD7288 does not reduce the duration of the pause and that lesioning dopamine neurons abolishes this response, which can be restored by clozapine.

      Weaknesses:

      While this study presents an interesting mechanism for SCIN pausing after burst activity, there are several major concerns that should be addressed:

      (1) Scope of the Mechanism:

      It is important to clarify that the proposed mechanism may apply specifically to the pause in SCINs following burst activity. The manuscript does not provide clear evidence that this mechanism contributes to the pause response observed in behavioral animals. While the thalamus is crucial for SCIN pauses in behavioral contexts, the exact mechanism remains unclear. Activating thalamic input triggers burst activity in SCINs, leading to a subsequent pause, but this mechanism may not be generalizable across different scenarios. For instance, approximately half of TANs do not exhibit initial excitation but still pause during behavior, suggesting that the burst-dependent pause mechanism is unlikely to explain this phenomenon. Furthermore, in behavioral animals, the duration of the pause seems consistent, whereas the proposed mechanism suggests it depends on the prior burst, which is not aligned with in vivo observations. Additionally, many in vivo recordings show that the pause response is a reduction in firing rate, not complete silence, which the mechanism described here does not explain. Please address these in the manuscript.

      (2) Terminology:

      The use of "pause response" throughout the manuscript is misleading. The pause induced by thalamic input in brain slices is distinct from the pause observed in behavioral animals. Given the lack of a clear link between these two phenomena in the manuscript, it is essential to use more precise terminology throughout, including in the title, bullet points, and body of the manuscript.

      (3) Kv1 Blocker Specificity:

      It is unclear how the authors ruled out the possibility that the Kv1 blocker did not act directly on SCINs. Could there be an indirect effect contributing to the burst-dependent pause? Clarification on this point would strengthen the interpretation of the results.

      (4) Role of D1 Receptors:

      While it is well-established that activating thalamic input to SCINs triggers dopamine release, contributing to SCIN pausing (as shown in Figure 3), it would be helpful to assess the extent to which D1 receptors contribute to this burst-dependent pause. This could be achieved by applying the D1 agonist SKF81297 after blocking nAChRs and D2 receptors.

      (5) Clozapine's Mechanism of Action:

      The restoration of the burst-dependent pause by clozapine following dopamine neuron lesioning is interesting, but clozapine acts on multiple receptors beyond D1 and D5. Although it may be challenging to find a specific D5 antagonist or inverse agonist, it would be more accurate to state that clozapine restores the burst-dependent pause without conclusively attributing this effect to D5 receptors.

    5. Author response:

      Public Reviews:

      Reviewer #1 (Public review):

      Summary:

      Tubert C. et al. investigated the role of dopamine D5 receptors (D5R) and their downstream potassium channel, Kv1, in the striatal cholinergic neuron pause response induced by thalamic excitatory input. Using slice electrophysiological analysis combined with pharmacological approaches, the authors tested which receptors and channels contribute to the cholinergic interneuron pause response in both control and dyskinetic mice (in the L-DOPA off state). They found that activation of Kv1 was necessary for the pause response, while activation of D5R blocked the pause response in control mice. Furthermore, in the L-DOPA off-state of dyskinetic mice, the absence of the pause response was restored by the application of clozapine. The authors claimed that (1) the D5R-Kv1 pathway contributes to the cholinergic interneuron pause response in a phasic dopamine concentration-dependent manner, and (2) clozapine inhibits D5R in the L-DOPA off state, which restores the pause response.

      Strengths:

      The electrophysiological and pharmacological approaches used in this study are powerful tools for testing channel properties and functions. The authors' group has well-established these methodologies and analysis pipelines. Indeed, the data presented were robust and reliable.

      Thank you for your comments.

      Weaknesses:

      Although the paper has strengths in its methodological approaches, there is a significant gap between the presented data and the authors' claims.

      There was no direct demonstration that the D5R-Kv1 pathway is dominant when dopamine levels are high. The term 'high' is ambiguous, and it raises the question of whether the authors believe that dopamine levels do not reach the threshold required to activate D5R under physiological conditions.

      We acknowledge that further work is necessary to clarify the role of the D5R in physiological conditions. While we haven’t found effects of the D1/D5 receptor antagonist SCH23390 on the pause response in control animals (Fig. 3), it is still possible that dopamine levels reach the threshold to stimulate D5R when burst firing of dopaminergic neurons contributes to dopamine release. We believe the pause response depends, among other factors, on the relative stimulation levels of SCIN D2 and D5 receptors, which is likely not an all-or-nothing phenomenon. To reduce ambiguity, we will change the labels referring to dopamine levels in Figure 6F.

      Furthermore, the data presented in Figure 6 are confusing. If clozapine inhibits active D5R and restores the pause response, the D5R antagonist SCH23390 should have the same effect. The data suggest that clozapine-induced restoration of the pause response might be mediated by other receptors, rather than D5R alone.

      Thank you for letting us clarify this issue. Please note that the levels of endogenous dopamine 24 h after the last L-DOPA challenge in severe parkinsonian mice are expected to be very low. In the absence of an agonist, a pure D1/D5 antagonist would not exert an effect, as demonstrated with SCH23390 alone, which did not have an impact on the SCIN response to thalamic stimulation (Fig. 6). While clozapine can also act as a D1/D5 receptor antagonist, its D1/D5 effects in absence of an agonist are attributed to its inverse agonist properties (PMID: 24931197). Notably, SCH23390 prevented the effect of clozapine, allowing us to conclude that ligand-independent D1/D5 receptor-mediated mechanisms are involved in suppressing the pause response in dyskinetic mice. We will make the point clearer in the Discussion.

      Reviewer #2 (Public review):

      Summary:

      This manuscript by Tubert et al presents the role of the D5 receptor in modulating the striatal cholinergic interneuron (CIN) pause response through D5R-cAMP-Kv1 inhibitory signaling. Their model elucidates the on / off switch of CIN pause, likely due to the different DA affinity between D2R and D5R. This machinery may be crucial in modulating synaptic plasticity in cortical-striatal circuits during motor learning and execution. Furthermore, the study bridges their previous finding of CIN hyperexcitability (Paz et al., Movement Disorder 2022) with the loss of pause response in LID mice.

      Strengths:

      The study had solid findings, and the writing was logically structured and easy to follow. The experiments are well-designed, and they properly combined electrophysiology recording, optogenetics, and pharmacological treatment to dissect/rule out most, if not all, possible mechanisms in their model.

      Thank you for your comments.

      Weaknesses:

      The manuscript is overall satisfying with only some minor concerns that need to be addressed. Manipulation of intracellular cAMP (e.g. using pharmacological analogs or inhibitors) can add additional evidence to strengthen the conclusion.

      Thank you for the suggestion. While we acknowledge that we are not providing direct evidence of the role of cAMP, we chose not to conduct these experiments because cAMP levels influence several intrinsic and synaptic currents beyond Kv1, significantly affecting  membrane oscillations and spontaneous firing, as shown in Paz et al. 2021. However, we are modifying the manuscript so there is no misinterpretation about our findings in the current work.

      Reviewer #3 (Public review):

      Summary:

      Tubert et al. investigate the mechanisms underlying the pause response in striatal cholinergic interneurons (SCINs). The authors demonstrate that optogenetic activation of thalamic axons in the striatum induces burst activity in SCINs, followed by a brief pause in firing. They show that the duration of this pause correlates with the number of elicited action potentials, suggesting a burst-dependent pause mechanism. The authors demonstrated this burst-dependent pause relied on Kv1 channels. The pause is blocked by an SKF81297 and partially by sulpiride and mecamylamine, implicating D1/D5 receptor involvement. The study also shows that the ZD7288 does not reduce the duration of the pause and that lesioning dopamine neurons abolishes this response, which can be restored by clozapine.

      Weaknesses:

      While this study presents an interesting mechanism for SCIN pausing after burst activity, there are several major concerns that should be addressed:

      (1) Scope of the Mechanism:

      It is important to clarify that the proposed mechanism may apply specifically to the pause in SCINs following burst activity. The manuscript does not provide clear evidence that this mechanism contributes to the pause response observed in behavioral animals. While the thalamus is crucial for SCIN pauses in behavioral contexts, the exact mechanism remains unclear. Activating thalamic input triggers burst activity in SCINs, leading to a subsequent pause, but this mechanism may not be generalizable across different scenarios. For instance, approximately half of TANs do not exhibit initial excitation but still pause during behavior, suggesting that the burst-dependent pause mechanism is unlikely to explain this phenomenon. Furthermore, in behavioral animals, the duration of the pause seems consistent, whereas the proposed mechanism suggests it depends on the prior burst, which is not aligned with in vivo observations. Additionally, many in vivo recordings show that the pause response is a reduction in firing rate, not complete silence, which the mechanism described here does not explain. Please address these in the manuscript.

      Thank you for your valuable feedback. While the absence of an initial burst in some TANs in vivo may suggest the involvement of alternative or additional mechanisms, it does not exclude a participation of Kv1 currents. We have seen that subthreshold depolarizations induced by thalamic inputs are sufficient to produce an afterhyperpolarization (AHP) mediated by Kv1 channels (see Tubert et al., 2016, PMID: 27568555). Although such subthreshold depolarizations are not captured in current recordings from behaving animals, intracellular in vivo recordings have demonstrated an intrinsically generated AHP after subthreshold depolarization of SCIN caused by stimulation of excitatory afferents (PMID: 15525771). Additionally, when pause duration is plotted against the number of spikes elicited by thalamic input (Fig. 1G), we found that one elicited spike is followed by an interspike interval 1.4 times longer than the average spontaneous interspike interval. We acknowledge the potential involvement of additional factors, including a decrease of excitatory thalamic input coinciding with the pause, followed by a second volley of thalamic inputs (Fig. 1G-J, after observations by Matsumoto et al., 2001- PMID: 11160526), as well as the timing of elicited spikes relative to ongoing spontaneous firing (Fig. 1D-E). Dopaminergic modulation (Fig. 3) and regional differences among striatal regions (PMID: 24559678) may also contribute to the complexity of these dynamics.

      (2) Terminology:

      The use of "pause response" throughout the manuscript is misleading. The pause induced by thalamic input in brain slices is distinct from the pause observed in behavioral animals. Given the lack of a clear link between these two phenomena in the manuscript, it is essential to use more precise terminology throughout, including in the title, bullet points, and body of the manuscript.

      While we acknowledge that our study does not include in vivo evidence, we believe ex vivo preparations have been instrumental in elucidating the mechanisms underlying the responses observed in vivo. We also agree with previous ex vivo studies in using consistent terminology. However, we will clarify the ex vivo nature of our work in the abstract and bullet points for greater transparency.

      (3) Kv1 Blocker Specificity:

      It is unclear how the authors ruled out the possibility that the Kv1 blocker did not act directly on SCINs. Could there be an indirect effect contributing to the burst-dependent pause? Clarification on this point would strengthen the interpretation of the results.

      Thank you for letting us clarify this issue. In our previous work (Tubert et al., 2016) we showed that the Kv1.3 and Kv1.1 subunits are selectively expressed in SCIN throughout the striatum. Moreover, gabaergic transmission is blocked in our preparations. We are including a phrase to make it clearer in the manuscript.

      (4) Role of D1 Receptors:

      While it is well-established that activating thalamic input to SCINs triggers dopamine release, contributing to SCIN pausing (as shown in Figure 3), it would be helpful to assess the extent to which D1 receptors contribute to this burst-dependent pause. This could be achieved by applying the D1 agonist SKF81297 after blocking nAChRs and D2 receptors.

      Thank you for letting us clarify this point. We show that blocking D2R or nAChR reduces the pause only for strong thalamic stimulation eliciting 4 SCIN spikes (Figure 3G), whereas the D1/D5 agonist SKF81297 is able to reduce the pause induced by weaker stimulation as well (Figure 3C). This may indicate that nAChR-mediated dopamine release induced by thalamic-induced bursts more efficiently activates D2R compared to D5R. We speculate that, in this context, lack of D5R activation may be necessary to keep normal levels of Kv1 currents necessary for SCIN pauses.

      (5) Clozapine's Mechanism of Action:

      The restoration of the burst-dependent pause by clozapine following dopamine neuron lesioning is interesting, but clozapine acts on multiple receptors beyond D1 and D5. Although it may be challenging to find a specific D5 antagonist or inverse agonist, it would be more accurate to state that clozapine restores the burst-dependent pause without conclusively attributing this effect to D5 receptors.

      Thank you for your insightful observation. We acknowledge the difficulty of targeting dopamine receptors pharmacologically due to the lack of highly selective D1/D5 inverse agonists. We used SCH23390, which is a highly selective D1/D5 receptor antagonist devoid of inverse agonist effects, to block clozapine’s ability to restore SCIN pauses (Figure 6C). This indicates that the restoration of SCIN pauses by clozapine depends on D1/D5 receptors. Furthermore, in a previous study, we demonstrated that clozapine’s effect on restoring SCIN excitability in dyskinetic mice (a phenomenon mediated by Kv1 channels in SCIN; Tubert et al., 2016) was not due to its action on serotonin receptors (Paz, Stahl et al., 2022). While our data do not rule out the potential contribution of other receptors, such as muscarinic acetylcholine receptors, we believe they strongly support the role of D1/D5 receptors. To reflect this, we will add a statement discussing the potential contribution of receptors beyond D1/D5.

    1. Author response:

      We thank the editor and reviewers for their feedback. We believe we can address the substantive criticisms in full, first, by providing a more explicit theoretical basis for the method. Then, we believe criticism based on assumptions about phase consistency across time points are not well founded and can be answered. Finally, in response to some reviewer comments, we will improve the surrogate testing of the method.

      We will enhance the theoretical justification for the application of higher-order singular value decomposition (SVD) to the problem of irregular sampling of the cortical area. The initial version of the manuscript was written to allow informal access to these ideas (if possible), but the reviewers find a more rigorous account appropriate. We will add an introduction to modern developments in the use of functional SVD in geophysics, meteorology & oceanography (e.g., empirical orthogonal functions) and quantitative fluid dynamics (e.g., dynamic mode decomposition) and computational chemistry. Recently SVD has been used in neuroscience studies (e.g., cortical eigenmodes). To our knowledge, our work is the first time higher-order SVD has been applied to a neuroscience problem. We use it here to solve an otherwise (apparently) intractable problem, i.e., how to estimate the spatial frequency (SF) spectrum on a sparse and highly irregular array with broadband signals.

      We will clarify the methodological strategy in more formal terms in the next version of the paper. But essentially SVD allows a change of basis that greatly simplifies quantitative analysis. Here it allows escape from estimating the SF across millions of data-points (triplets of contacts, at each sample), each of which contains multiple overlapping signals plus noise (noise here defined in the context of SF estimation) and are inter-correlated across a variety of known and unknown observational dimensions. Rather than simply average over samples, which would wash out much of the real signal, SVD allows the signals to be decomposed in a lossless manner (up to the choice of number of eigenvectors at which the SVD is truncated). The higher-order SVD we have implemented reduces the size of problem to allow quantification of SF over hundreds of components, each of which is guaranteed certain desirable properties, i.e., they explain known (and largest) amounts of variance of the original data and are orthonormal. This last property allows us to proceed as if the observations are independent. SF estimates are made within this new coordinate system.

      We will also more concretely formalise the relation between Fourier analysis and previous observations of eigenvectors of phase that are smooth gradients.

      We will very briefly review Fourier methods designed to deal with non-uniform sampling. The problems these methods are designed for fall into the non-uniform part of the spectrum from uniform–non-uniform–irregular–highly-irregular–noise. They are highly suited to, for example, interpolating between EEG electrodes to produce a uniform array for application of the fast Fourier transform (Alamia et al., 2023). However, survey across a range of applied maths fields suggests that no method exists for the degree of irregular sampling found in the sEEG arrays at issue here. In particular, the sparseness of the contact coverage presents an insurmountable hurdle to standard methods. While there exists methods for sparse samples (e.g., Margrave & Fergusen, 1999; Ying 2009), these require well-defined oscillatory behavior, e.g., for seismographic analysis. Given the problems of highly irregular sampling, sparseness of sampling and broadband, nonstationary signals, we have attempted a solution via the novel methods introduced in the current manuscript. We were able to leverage previous observations regarding the relation between eigenvectors of cortical phase and Fourier analysis, as we outline in the manuscript.

      We will extend the current 1-dimensional surrogate data to better demonstrate that the method does indeed correctly detect the ordinal relations in power on different parts of the SF spectrum. We will include the effects of a global reference signal. Simulations of cortical activity are an expensive way to achieve this goal. While the first author has published in this area, such simulations are partly a function of the assumptions put into them (i.e., spatial damping, boundary conditions, parameterization of connection fields). We will therefore use surrogate signals derived from real cortical activity to complete this task.

      Some more specific issues raised:<br /> (1) Application of the method to general neuroscience problems:<br /> The purpose of the manuscript was to estimate the SF spectrum of phase in the cortex, in the range where it was previously not possible. The purpose was not specifically to introduce a new method of analysis that might be immediately applicable to a wide range of available data-sets. Indeed, the specifics of the method are designed to overcome an otherwise intractable disadvantage of sEEG (irregular spatial sampling) in order to take advantage of its good coverage (compared to ECoG) and low volume conduction compared to extra-cranial methods. On the other hand, the developing field of functional SVD would be of interest to neuroscientists, as a set of methods to solve difficult problems, and therefore of general interest. We will make these points explicit in the next version of the manuscript. In order to make the method more accessible, we will also publish code for the key routines (construction of triplets of contacts, Morlet wavelets, calculation of higher-order SVD, calculation of SF).

      (2) Novelty:<br /> We agree with the third reviewer: if our results can convince, then the study will have an impact on the field. While there is work that has been done on phase interactions at a variety of scales, such as from the labs of Fries, Singer, Engels, Nauhaus, Logothetis and others, it does not quantify the relative power of the different spatial scales. Additionally, the research of Freeman et al. has quantified only portions of the SF spectrum of the cortex, or used EEG to estimate low SFs. We would appreciate any pointers to the specific literature the current research contributes to, namely, the SF spectrum of activity in the cortex.

      (3) Further analyses:<br /> The main results of the research are relatively simple: monotonically falling SF-power with SF; this effect occurs across the range of temporal frequencies. We provide each individual participant’s curves in the supplementary Figures. By visual inspection, it can be seen that the main result of the example participant is uniformly recapitulated. One is rarely in this position in neuroscience research, and we will make this explicit in the text.

      The research stands or falls by the adequacy of the method to estimate the SF curves. For this reason most statistical analyses and figures were reserved for ruling out confounds and exploring the limits of the methods. However, for the sake of completeness, we will now include the SF vs. SF-power correlations and significance in the next version, for each participant at each frequency.

      Since the main result was uniform across participants, and since we did not expect that there was anything of special significance about the delayed free recall task, we conclude that more participants or more tasks would not add to the result. As we point out in the manuscript, each participant is a test of the main hypothesis. The result is also consistent with previous attempts to quantify the SF spectrum, using a range of different tasks and measurement modalities (Barrie et al., 1996; Ramon & Holmes 2015; Alexander et al., 2019; Alexander et al., 2016; Freeman et al., 2003; Freeman et al. 2000). The search for those rare sEEG participants with larger coverage than the maximum here is a matter of interest to us, but will be left for a future study.

      (4) Sampling of phase and its meaningfulness:<br /> The wavelet methods used in the present study have excellent temporal resolution but poor frequency resolution. We additionally oversample the frequency range to produce visually informative plots (usually in the context of time by frequency plots, see Alexander et al., 2006; 2013; 2019). But it is not correct that the methods for estimating phase assume a narrow frequency band. Rather, the poor frequency resolution of short time-series Morlet wavelets means the methods are robust to the exact shape of the waveforms; the signal need be only approximately sinusoidal; to rise and fall. The reason for using methods that have excellent resolution in the time-domain is that previous work (Alexander et al., 2006; Patten et al. 2012) has shown that traveling wave events can last only one or two cycles, i.e., are not oscillatory in the strict sense but are non-stationary events. So while short time-window Morlet wavelets have a disadvantage in terms of frequency resolution, this means they precisely do not have the problem of assuming narrow-band sinusoidal waveforms in the signal. We strongly disagree that our analysis requires very strong assumptions about oscillations (see last point in this section).

      Our hypothesis was about the SF spectrum of the phase. When the measurement of phase is noise-like at some location, frequency and time, then this noise will not substantially contribute to the low SF parts of the spectrum compared to high SFs. Our hypothesis also concerned whether it was reasonable to interpret the existing literature on low SF waves in terms of cortically localised waves or small numbers of localised oscillators. This required us to show that low SFs dominate, and therefore that this signal must dominate any extra-cranial measurements of apparent low SF traveling waves. It does not require us to demonstrate that the various parts of the SF spectrum are meaningful in the sense of functionally significant. This has been shown elsewhere (see references to traveling waves in manuscript, to which we will also add a brief survey of research on phase dynamics).

      The calculation of phase can be bypassed altogether to achieve the initial effect described in the introduction to the methods (Fourier-like basis functions from SVD). The observed eigenvectors, increasing in spatial frequency with decreasing eigenvalues, can be reproduced by applying Gaussian windows to the raw time-series (D. Alexander, unpublished observation). For example, undertaking an SVD on the raw time-series windowed over 100ms reproduces much the same spatial eigenvectors (except that they come in pairs, recapitulating the real and imaginary parts of the signal). This reproducibility is in comparison to first estimating the phase at 10Hz using Morlet wavelets, then applying the SVD to the unit-length complex phase values.

      (5) Other issues to be addressed and improved:<br /> clarity on which experiments were analyzed (starting in the abstract) discussion of frequencies above 60Hz and caution in interpretation due to spike-waveform artefact or as a potential index of multi-unit spiking discussion of whether the ad hoc, quasi-random sampling achieved by sEEG contacts somehow inflates the low SF estimates

      References (new)<br /> Patten TM, Rennie CJ, Robinson PA, Gong P (2012) Human Cortical Traveling Waves: Dynamical Properties and Correlations with Responses. PLoS ONE 7(6): e38392. https://doi.org/10.1371/journal.pone.0038392<br /> Margrave GF, Ferguson RJ (1999) Wavefield extrapolation by nonstationary phase shift, GEOPHYSICS 64:4, 1067-1078<br /> Ying Y (2009) Sparse Fourier Transform via Butterfly Algorithm SIAM Journal on Scientific Computing, 31:3, 1678-1694

    2. eLife Assessment

      This study introduces a novel method for estimating spatial spectra from irregularly sampled intracranial EEG data, revealing cortical activity across all spatial frequencies, which supports the global and integrated nature of cortical dynamics. The study showcases important technical innovations and rigorous analyses, including tests to rule out potential confounds; however, the lack of comprehensive theoretical justification and assumptions about phase consistency across time points renders the strength of evidence incomplete. The dominance of low spatial frequencies in cortical phase dynamics continues to be of importance, and further elaboration on the interpretation and justification of the results would strengthen the link between evidence and conclusions.

    3. Reviewer #1 (Public review):

      Summary:

      The paper uses rigorous methods to determine phase dynamics from human cortical stereotactic EEGs. It finds that the power of the phase is higher at the lowest spatial phase.

      Strengths:

      Rigorous and advanced analysis methods.

      Weaknesses:

      The novelty and significance of the results are difficult to appreciate from the current version of the paper.

      (1) It is very difficult to understand which experiments were analysed, and from where they were taken, reading the abstract. This is a problem both for clarity with regard to the reader and for attribution of merit to the people who collected the data.

      (2) The finding that the power is higher at the lowest spatial phase seems in tune with a lot of previous studies. The novelty here is unclear and it should be elaborated better. I could not understand reading the paper the advantage I would have if I used such a technique on my data. I think that this should be clear to every reader.

      (3) It seems problematic to trust in a strong conclusion that they show low spatial frequency dynamics of up to 15-20 cm given the sparsity of the arrays. The authors seem to agree with this concern in the last paragraph of page 12. They also say that it would be informative to repeat the analyses presented here after the selection of more participants from all available datasets. It begs the question of why this was not done. It should be done if possible.

      (4) Some of the analyses seem not to exploit in full the power of the dataset. Usually, a figure starts with an example participant but then the analysis of the entire dataset is not as exhaustive. For example, in Figure 6 we have a first row with the single participants and then an average over participants. One would expect quantifications of results from each participant (i.e. from the top rows of GFg 6) extracting some relevant features of results from each participant and then showing the distribution of these features across participants. This would complement the subject average analysis.

      (5) The function of brain phase dynamics at different frequencies and scales has been examined in previous papers at frequencies and scales relevant to what the authors treat. The authors may want to be more extensive with citing relevant studies and elaborating on the implications for them. Some examples below:<br /> Womelsdorf T, et alScience. 2007<br /> Besserve M et al. PloS Biology 2015<br /> Nauhaus I et al Nat Neurosci 2009

    4. Reviewer #2 (Public review):

      Summary:

      In this paper, the authors analyze the organization of phases across different spatial scales. The authors analyze intracranial, stereo-electroencephalogram (sEEG) recordings from human clinical patients. The authors estimate the phase at each sEEG electrode at discrete temporal frequencies. They then use higher-order SVD (HOSVD) to estimate the spatial frequency spectrum of the organization of phase in a data-driven manner. Based on this analysis, the authors conclude that most of the variance explained is due to spatially extended organizations of phase, suggesting that the best description of brain activity in space and time is in fact a globally organized process. The authors' analysis is also able to rule out several important potential confounds for the analysis of spatiotemporal dynamics in EEG.

      Strengths:

      There are many strengths in the manuscript, including the authors' use of SVD to address the limitation of irregular sampling and their analyses ruling out potential confounds for these signals in the EEG.

      Weaknesses:

      Some important weaknesses are not properly acknowledged, and some conclusions are over-interpreted given the evidence presented.

      The central weakness is that the analyses estimate phase from all signal time points using wavelets with a narrow frequency band (see Methods - "Numerical methods"). This step makes the assumption that phase at a particular frequency band is meaningful at all times; however, this is not necessarily the case. Take, for example, the analysis in Figure 3, which focuses on a temporal frequency of 9.2 Hz. If we compare the corresponding wavelet to the raw sEEG signal across multiple points in time, this will look like an amplitude-modulated 9.2 Hz sinusoid to which the raw sEEG signal will not correspond at all. While the authors may argue that analyzing the spatial organization of phase across many temporal frequencies will provide insight into the system, there is no guarantee that the spatial organization of phase at many individual temporal frequencies converges to the correct description of the full sEEG signal. This is a critical point for the analysis because while this analysis of the spatial organization of phase could provide some interesting results, this analysis also requires a very strong assumption about oscillations, specifically that the phase at a particular frequency (e.g. 9.2 Hz in Figure 3, or 8.0 Hz in Figure 5) is meaningful at all points in time. If this is not true, then the foundation of the analysis may not be precisely clear. This has an impact on the results presented here, specifically where the authors assert that "phase measured at a single contact in the grey matter is more strongly a function of global phase organization than local". Finally, the phase examples given in Supplementary Figure 5 are not strongly convincing to support this point.

      Another weakness is in the discussion on spatial scale. In the analyses, the authors separate contributions at (approximately) > 15 cm as macroscopic and < 15 cm as mesoscopic. The problem with the "macroscopic" here is that 15 cm is essentially on the scale of the whole brain, without accounting for the fact that organization in sub-systems may occur. For example, if a specific set of cortical regions, spanning over a 10 cm range, were to exhibit a consistent organization of phase at a particular temporal frequency (required by the analysis technique, as noted above), it is not clear why that would not be considered a "macroscopic" organization of phase, since it comprises multiple areas of the brain acting in coordination. Further, while this point could be considered as mostly semantic in nature, there is also an important technical consideration here: would spatial phase organizations occurring in varying subsets of electrodes and with somewhat variable temporal frequency reliably be detected? If this is not the case, then could it be possible that the lowest spatial frequencies are detected more often simply because it would be difficult to detect variable organizations in subsets of electrodes?

      Another weakness is disregarding the potential spike waveform artifact in the sEEG signal in the context of these analyses. Specifically, Zanos et al. (J Neurophysiol, 2011) showed that spike waveform artifacts can contaminate electrode recordings down to approximately 60 Hz. This point is important to consider in the context of the manuscript's results on spatial organization at temporal frequencies up to 100 Hz. Because the spike waveform artifact might affect signal phase at frequencies above 60 Hz, caution may be important in interpreting this point as evidence that there is significant phase organization across the cortex at these temporal frequencies.

      A last point is that, even though the present results provide some insight into the organization of phase across the human brain, the analyses do not directly link this to spiking activity. The predictive power that these spatial organizations of phase could provide for spiking activity - even if the analyses were not affected by the distortion due to the narrow-frequency assumption - remains unknown. This is important because relating back to spiking activity is the key factor in assessing whether these specific analyses of phase can provide insight into neural circuit dynamics. This type of analysis may be possible to do with the sEEG recordings, as well, by analyzing high-gamma power (Ray and Maunsell, PLoS Biology, 2011), which can provide an index of multi-unit spiking activity around the electrodes.

    5. Reviewer #3 (Public review):

      Summary:

      The authors propose a method for estimation of the spatial spectra of cortical activity from irregularly sampled data and apply it to publicly available intracranial EEG data from human patients during a delayed free recall task. The authors' main findings are that the spatial spectra of cortical activity peak at low spatial frequencies and decrease with increasing spatial frequency. This is observed over a broad range of temporal frequencies (2-100 Hz).

      Strengths:

      A strength of the study is the type of data that is used. As pointed out by the authors, spatial spectra of cortical activity are difficult to estimate from non-invasive measurements (EEG and MEG) due to signal mixing and from commonly used intracranial measurements (i.e. electrocorticography or Utah arrays) due to their limited spatial extent. In contrast, iEEG measurements are easier to interpret than EEG/MEG measurements and typically have larger spatial coverage than Utah arrays. However, iEEG is irregularly sampled within the three-dimensional brain volume and this poses a methodological problem that the proposed method aims to address.

      Weaknesses:

      The used method for estimating spatial spectra from irregularly sampled data is weak in several respects.

      First, the proposed method is ad hoc, whereas there exist well-developed (Fourier-based) methods for this. The authors don't clarify why no standard methods are used, nor do they carry out a comparative evaluation.

      Second, the proposed method lacks a theoretical foundation and hinges on a qualitative resemblance between Fourier analysis and singular value decomposition.

      Third, the proposed method is not thoroughly tested using simulated data. Hence it remains unclear how accurate the estimated power spectra actually are.

      In addition, there are a number of technical issues and limitations that need to be addressed or clarified (see recommendations to the authors).

      My assessment is that the conclusions are not completely supported by the analyses. What would convince me, is if the method is tested on simulated cortical activity in a more realistic set-up. I do believe, however, that if the authors can convincingly show that the estimated spatial spectra are accurate, the study will have an impact on the field. Regarding the methodology, I don't think that it will become a standard method in the field due to its ad hoc nature and well-developed alternatives.

    1. eLife Assessment

      The authors show MRI relaxation time changes that are claimed to originate from cell membrane potential changes. This would be very important if true because it may provide a mechanism whereby membrane potential changes could be inferred noninvasively. However, the membrane potential manipulations applied here will induce cell swelling, and cell swelling has been previously shown to affect relaxation time. Therefore, the claim that the relaxation time changes observed in this manuscript are due to cell membrane potential changes is inadequately supported.

    2. Reviewer #1 (Public review):

      Summary:

      This paper examines changes in relaxation time (T1 and T2) and magnetization transfer parameters that occur in a model system and in vivo when cells or tissue are depolarized using an equimolar extracellular solution with different concentrations of the depolarizing ion K+. The motivation is to explain T2 changes that have previously been observed by the authors in an in vivo model with neural stimulation (DIANA) and to try provide a mechanism to explain those changes.

      Strengths:

      The authors argue that the use of various concentrations of KCL in the extracellular fluid depolarize or hyperpolarize the cell pellets used and that this change in membrane potential is the driving force for the T2 (and T1-supplementary material) changes observed. In particular, they report an increase in T2 with increasing KCL concentration in the extracellular fluid (ECF) of pellets of SH-SY5Y cells. To offset the increasing osmolarity of the ECF due to the increase in KCL, the NaCL molarity of the ECF is proportionally reduced. The authors measure the intracellular voltage using patch clamp recordings, which is a gold standard. With 80 mM of KCL in the ECF, a change in T2 of the cell pellets of ~10 ms is observed with the intracellular potential recorded as about -6 mv. A very large T1 increase of ~90 ms is reported under the same conditions. The PSR (ratio of hydrogen protons on macromolecules to free water) decreases by about 10% at this 80 mM KCL concentration. Similar results are seen in a Jurkat cell line and similar, but far smaller changes are observed in vivo, for a variety of reasons discussed. As a final control, T1 and T2 values are measured in the various equimolar KCL solutions. As expected, no significant changes in T1 and T2 of the ECF were observed for these concentrations.

      Weaknesses:

      While the concepts presented are interesting, and the actual experimental methods seem to be nicely executed, the conclusions are not supported by the data for a number of reasons. This is not to say that the data isn't consistent with the conclusions, but there are other controls not included that would be necessary to draw the conclusion that it is membrane potential that is driving these T1 and T2 changes. Unfortunately for these authors, similar experiments conducted in 2008 (Stroman et al. Magn. Reson. in Med. 59:700-706) found similar results (increased T2 with KCL) but with a different mechanism, that they provide definite proof for. This study was not referenced in the current work.

      It is well established that cells swell/shrink upon depolarization/hyperpolarization. Cell swelling is accompanied by increased light transmittance in vivo, and this should be true in the pellet system as well. In a beautiful series of experiments, Stroman et al. (2008) showed in perfused brain slices that the cells swell upon equimolar KCL depolarization and the light transmittance increases. The time course of these changes is quite slow, of the order of many minutes, both for the T2-weighted MRI signal and for the light transmittance. Stroman et al. also show that hypoosmotic changes produce the exact same timecourse as the KCL depolarization changes (and vice versa for the hyperosmotic changes - which cause cell shrinkage). Their conclusion, therefore, was that cell swelling (not membrane potential) was the cause of the T2-weighted changes observed, and that these were relatively slow (on the scale of many minutes).

      What are the implications for the current study? Well, for one, the authors cannot exclude cell swelling as the mechanism for T2 changes, as they have not measured that. It is however well established that cell swelling occurs during depolarization, so this is not in question. Water in the pelletized cells is in slow/intermediate exchange with the ECF, and the solutions for the two compartment relaxation model for this are well established (see Menon and Allen, Magn. Reson. in Med. 20:214-227 (1991). The T2 relaxation times should be multiexponential (see point (3) further below). The current work cannot exclude cell swelling as the mechanism for T2 changes (it is mentioned in the paper, but not dealt with). Water entering cells dilutes the protein structures, changes rotational correlation times of the proteins in the cell and is known to increase T2. The PSR confirms that this is indeed happening, so the data in this work is completely consistent with the Stroman work and completely consistent with cell swelling associated with depolarization. The authors should have performed light scattering studies to demonstrate the presence or absence of cell swelling. Measuring intracellular potential is not enough to clarify the mechanism.

      So why does it matter whether the mechanism is cell swelling or membrane potential? The reason is response time. Cell swelling due to depolarization is a slow process, slower than hemodynamic responses that characterize BOLD. In fact, cell swelling under normal homeostatic conditions in vivo is virtually non-existent. Only sustained depolarization events typically associated with non-naturalistic stimuli or brain dysfunction produce cell swelling. Membrane potential changes associated with neural activity, on the other hand, are very fast. In this manuscript, the authors have convincingly shown a signal change that is virtually the same as what was seen in the Stroman publication, but they have not shown that there is a response that can be detected with anything approaching the timescale of an action potential. So one cannot definitely say that the changes observed are due to membrane potential. One can only say they are consistent with cell swelling, regardless of what causes the cell swelling.

      For this mechanism to be relevant to explaining DIANA, one needs to show that the cell swelling changes occur within a millisecond, which has never been reported. If one knows the populations of ECF and pellet, the T2s of the ECF and pellet and the volume change of the cells in the pellet, one can model any expected T2 changes due to neuronal activity. I think one would find that these are minuscule within the context of an action potential, or even bulk action potential.

      There are a few smaller issues that should be addressed.<br /> (1) Why were complicated imaging sequences used to measure T1 and T2? On a Bruker system it should be possible to do very simple acquisitions with hard pulses (which will not need dictionaries and such to get quantitative numbers). Of course, this can only be done sample by sample and would take longer, but it avoids a lot of complication to correct the RF pulses used for imaging, which leads me to the 2nd point.<br /> (2) Figure S1 (H) is unlike any exponential T2 decay I have seen in almost 40 years of making T2 measurements. The strange plateau at the beginning and the bump around TE = 25 ms are odd. These could just be noise, but the fitted curve exactly reproduces these features. A monoexponential T2 decay cannot, by definition, produce a fit shaped like this.<br /> (3) As noted earlier, layered samples produce biexponential T2 decays and monoexponential T1 decays. I don't quite see how this was accounted for in the fitting of the data from the pellet preparations. I realize that these are spatially resolved measurements, but the imaging slice shown seems to be at the boundary of the pellet and the extracellular media and there definitely should be a biexponential water proton decay curve. Only 5 echo times were used, so this is part of the problem, but it does mean that the T2 reported is a population fraction weighted average of the T2 in the two compartments.<br /> (4) Delta T1 and T2 values are presented for the pellets in wells, but no absolute values are presented for either the pellets or the KCL solutions that I could find.

    3. Reviewer #2 (Public review):

      Summary:

      Min et al. attempt to demonstrate that magnetic resonance imaging (MRI) can detect changes in neuronal membrane potentials. They approach this goal by studying how MRI contrast and cellular potentials together respond to treatment of cultured cells with ionic solutions. The authors specifically study two MRI-based measurements: (A) the transverse (T2) relaxation rate, which reflects microscopic magnetic fields caused by solutes and biological structures; and (B) the fraction or "pool size ratio" (PSR) of water molecules estimated to be bound to macromolecules, using an MRI technique called magnetization transfer (MT) imaging. They see that depolarizing K+ and Ba2+ concentrations lead to T2 increases and PSR decreases that vary approximately linearly with voltage in a neuroblastoma cell line and that change similarly in a second cell type. They also show that depolarizing potassium concentrations evoke reversible T2 increases in rat brains and that these changes are reversed when potassium is renormalized. Min et al. argue that this implies that membrane potential changes cause the MRI effects, providing a potential basis for detecting cellular voltages by noninvasive imaging. If this were true, it would help validate a recent paper published by some of the authors (Toi et al., Science 378:160-8, 2022), in which they claimed to be able to detect millisecond-scale neuronal responses by MRI.

      Strengths:

      The discovery of a mechanism for relating cellular membrane potential to MRI contrast could yield an important means for studying functions of the nervous system. Achieving this has been a longstanding goal in the MRI community, but previous strategies have proven too weak or insufficiently reproducible for neuroscientific or clinical applications. The current paper suggests remarkably that one of the simplest and most widely used MRI contrast mechanisms-T2 weighted imaging-may indicate membrane potentials if measured in the absence of the hemodynamic signals that most functional MRI (fMRI) experiments rely on. The authors make their case using a diverse set of quantitative tests that include controls for ion and cell type-specificity of their in vitro results and reversibility of MRI changes observed in vivo.

      Weaknesses:

      The major weakness of the paper is that it uses correlational data to conclude that there is a causational relationship between membrane potential and MRI contrast. Alternative explanations that could explain the authors' findings are not adequately considered. Most notably, depolarizing ionic solutions can also induce changes in cellular volume and tissue structure that in turn alter MRI contrast properties similarly to the results shown here. For example, a study by Stroman et al. (Magn Reson Med 59:700-6, 2008) reported reversible potassium-dependent T2 increases in neural tissue that correlate closely with light scattering-based indications of cell swelling. Phi Van et al. (Sci Adv 10:eadl2034, 2024) showed that potassium addition to one of the cell lines used here likewise leads to cell size increases and T2 increases. Such effects could in principle account for Min et al.'s results, and indeed it is difficult to see how they would not contribute, but they occur on a time scale far too slow to yield useful indications of membrane potential. The authors' observation that PSR correlates negatively with T2 in their experiments is also consistent with this explanation, given the inverse relationship usually observed (and mechanistically expected) between these two parameters. If the authors could show a tight correspondence between millisecond-scale membrane potential changes and MRI contrast, their argument for a causal connection or a useful correlational relationship between membrane potential and image contrast would be much stronger. As it is, however, the article does not succeed in demonstrating that membrane potential changes can be detected by MRI.

    4. Author response:

      Public Reviews:

      Reviewer #1 (Public review):

      Summary:

      This paper examines changes in relaxation time (T1 and T2) and magnetization transfer parameters that occur in a model system and in vivo when cells or tissue are depolarized using an equimolar extracellular solution with different concentrations of the depolarizing ion K+. The motivation is to explain T2 changes that have previously been observed by the authors in an in vivo model with neural stimulation (DIANA) and to try provide a mechanism to explain those changes.

      Strengths:

      The authors argue that the use of various concentrations of KCL in the extracellular fluid depolarize or hyperpolarize the cell pellets used and that this change in membrane potential is the driving force for the T2 (and T1-supplementary material) changes observed. In particular, they report an increase in T2 with increasing KCL concentration in the extracellular fluid (ECF) of pellets of SH-SY5Y cells. To offset the increasing osmolarity of the ECF due to the increase in KCL, the NaCL molarity of the ECF is proportionally reduced. The authors measure the intracellular voltage using patch clamp recordings, which is a gold standard. With 80 mM of KCL in the ECF, a change in T2 of the cell pellets of ~10 ms is observed with the intracellular potential recorded as about -6 mv. A very large T1 increase of ~90 ms is reported under the same conditions. The PSR (ratio of hydrogen protons on macromolecules to free water) decreases by about 10% at this 80 mM KCL concentration. Similar results are seen in a Jurkat cell line and similar, but far smaller changes are observed in vivo, for a variety of reasons discussed. As a final control, T1 and T2 values are measured in the various equimolar KCL solutions. As expected, no significant changes in T1 and T2 of the ECF were observed for these concentrations.

      Weaknesses:

      While the concepts presented are interesting, and the actual experimental methods seem to be nicely executed, the conclusions are not supported by the data for a number of reasons. This is not to say that the data isn't consistent with the conclusions, but there are other controls not included that would be necessary to draw the conclusion that it is membrane potential that is driving these T1 and T2 changes. Unfortunately for these authors, similar experiments conducted in 2008 (Stroman et al. Magn. Reson. in Med. 59:700-706) found similar results (increased T2 with KCL) but with a different mechanism, that they provide definite proof for. This study was not referenced in the current work.

      It is well established that cells swell/shrink upon depolarization/hyperpolarization. Cell swelling is accompanied by increased light transmittance in vivo, and this should be true in the pellet system as well. In a beautiful series of experiments, Stroman et al. (2008) showed in perfused brain slices that the cells swell upon equimolar KCL depolarization and the light transmittance increases. The time course of these changes is quite slow, of the order of many minutes, both for the T2-weighted MRI signal and for the light transmittance. Stroman et al. also show that hypoosmotic changes produce the exact same timecourse as the KCL depolarization changes (and vice versa for the hyperosmotic changes - which cause cell shrinkage). Their conclusion, therefore, was that cell swelling (not membrane potential) was the cause of the T2-weighted changes observed, and that these were relatively slow (on the scale of many minutes).

      What are the implications for the current study? Well, for one, the authors cannot exclude cell swelling as the mechanism for T2 changes, as they have not measured that. It is however well established that cell swelling occurs during depolarization, so this is not in question. Water in the pelletized cells is in slow/intermediate exchange with the ECF, and the solutions for the two compartment relaxation model for this are well established (see Menon and Allen, Magn. Reson. in Med. 20:214-227 (1991). The T2 relaxation times should be multiexponential (see point (3) further below). The current work cannot exclude cell swelling as the mechanism for T2 changes (it is mentioned in the paper, but not dealt with). Water entering cells dilutes the protein structures, changes rotational correlation times of the proteins in the cell and is known to increase T2. The PSR confirms that this is indeed happening, so the data in this work is completely consistent with the Stroman work and completely consistent with cell swelling associated with depolarization. The authors should have performed light scattering studies to demonstrate the presence or absence of cell swelling. Measuring intracellular potential is not enough to clarify the mechanism.

      We appreciate the reviewer’s comments. We agree that changes in cell volume due to depolarization and hyperpolarization significantly contribute to the observed changes in T2, PSR, and T1, especially in pelletized cells. For this reason, we already noted in the Discussion section of the original manuscript that cell volume changes influence the observed MR parameter changes, though this study did not present the magnitude of the cell volume changes. In this regard, we thank the reviewer for introducing the work by Stroman et al. (Magn Reson Med 59:700-706, 2008). When discussing the contribution of the cell volume changes to the observed MR parameter changes, we will additionally discuss the work of Stroman et al. in the revised manuscript.

      In addition, we acknowledge that the title and main conclusion of the original manuscript may be misleading, as we did not separately consider the effect of cell volume changes on MR parameters. To more accurately reflect the scope and results of this study and to consider the reviewer 2’s suggestion, we will adjust the title to “Responses to membrane potential-modulating ionic solutions measured by magnetic resonance imaging of cultured cells and in vivo rat cortex” and will also revise the relevant phrases in the main text.

      Finally, when [K+]-induced membrane potential changes are involved, there seems to be factors other than cell volume changes also appear to influence T2 changes. Our ongoing study shows that there are differences in T2 changes (for the same volume changes) between two different situations: pure osmotic volume changes vs. [K+]-induced volume changes (e.g., hypoosmotic vs. depolarization). Furthermore, this study suggests that mechanisms such as changes in free (primarily intracellular) and bound water within a voxel play an important role in generating this T2 difference. Our group is preparing a manuscript for this follow-up study and will report on it shortly.

      So why does it matter whether the mechanism is cell swelling or membrane potential? The reason is response time. Cell swelling due to depolarization is a slow process, slower than hemodynamic responses that characterize BOLD. In fact, cell swelling under normal homeostatic conditions in vivo is virtually non-existent. Only sustained depolarization events typically associated with non-naturalistic stimuli or brain dysfunction produce cell swelling. Membrane potential changes associated with neural activity, on the other hand, are very fast. In this manuscript, the authors have convincingly shown a signal change that is virtually the same as what was seen in the Stroman publication, but they have not shown that there is a response that can be detected with anything approaching the timescale of an action potential. So one cannot definitely say that the changes observed are due to membrane potential. One can only say they are consistent with cell swelling, regardless of what causes the cell swelling.

      For this mechanism to be relevant to explaining DIANA, one needs to show that the cell swelling changes occur within a millisecond, which has never been reported. If one knows the populations of ECF and pellet, the T2s of the ECF and pellet and the volume change of the cells in the pellet, one can model any expected T2 changes due to neuronal activity. I think one would find that these are minuscule within the context of an action potential, or even bulk action potential.

      In the context of cell swelling occurring at rapid response times, if we define cell swelling simply as an “increase in cell volume,” there are several studies reporting transient structural (or volumetric) changes (e.g., ~nm diameter change over ~ms duration) in neuron cells during action potential propagation (Akkin et al., Biophys J 93:1347-1353, 2007; Kim et al., Biophys J 92:3122-3129, 2007; Lee et al., IEEE Trans Biomed Eng 58:3000-3003, 2011; Wnek et al., J Polym Sci Part B: Polym Phys 54:7-14, 2015; Yang et al., ACS Nano 12:4186-4193, 2018). These studies show a good correlation between membrane potential changes and cell volume changes (even if very small) at the cellular level within milliseconds.

      As mentioned in the Response 1 above, this study does not address rapid dynamic membrane potential changes on the millisecond scale, which we explicitly discussed as one of the limitations in the Discussion section of the original manuscript. For this reason, we do not claim in this study that we provide the reader with definitive answers about the mechanisms involved in DIANA. Rather, as a first step toward addressing the mechanism of DIANA, this study confirms that there is a good correlation between changes in membrane potential and measurable MR parameters (e.g., T2 and PSR) when using ionic solutions that modulate membrane potential. Identifying T2 changes that occur during millisecond-scale membrane potential changes due to rapid neural activation will be further addressed in future studies.

      There are a few smaller issues that should be addressed.

      (1) Why were complicated imaging sequences used to measure T1 and T2? On a Bruker system it should be possible to do very simple acquisitions with hard pulses (which will not need dictionaries and such to get quantitative numbers). Of course, this can only be done sample by sample and would take longer, but it avoids a lot of complication to correct the RF pulses used for imaging, which leads me to the 2nd point.

      We appreciate the reviewer’s suggestion regarding imaging sequences. We would like to clarify that dictionaries were used for fitting in vivo T2 decay data, not in vitro data. Sample-by-sample nonlocalized acquisition with hard pulses may be applicable for in vitro measurements. However, for in vivo measurements, a slice-selective multi-echo spin-echo sequence was necessary to acquire T2 maps within a reasonable scan time. Our choice of imaging sequence was guided by the need to spatially resolve MR signals from specific regions of interests while balancing scan time constraints.

      (2) Figure S1 (H) is unlike any exponential T2 decay I have seen in almost 40 years of making T2 measurements. The strange plateau at the beginning and the bump around TE = 25 ms are odd. These could just be noise, but the fitted curve exactly reproduces these features. A monoexponential T2 decay cannot, by definition, produce a fit shaped like this.

      The T2 decay curves in Figure S1(H) indeed display features that deviate from a simple monoexponential decay. In our in vivo experiments, we used a multi-echo spin-echo sequence with slice-selective excitation and refocusing pulses. In such sequences, the echo train is influenced by stimulated echoes and imperfect slice profiles. This phenomenon is inherent to the pulse sequence rather than being artifacts or fitting errors (Hennig, Concepts Magn Reson 3:125-143, 1991; Lebel and Wilman, Magn Reson Med 64:1005-1014, 2010; McPhee and Wilman, Magn Reson Med 77:2057-2065, 2017). Therefore, we fitted the T2 decay curve using the technique developed by McPhee and Wilman (2017).

      (3) As noted earlier, layered samples produce biexponential T2 decays and monoexponential T1 decays. I don't quite see how this was accounted for in the fitting of the data from the pellet preparations. I realize that these are spatially resolved measurements, but the imaging slice shown seems to be at the boundary of the pellet and the extracellular media and there definitely should be a biexponential water proton decay curve. Only 5 echo times were used, so this is part of the problem, but it does mean that the T2 reported is a population fraction weighted average of the T2 in the two compartments.

      We understand the reviewer’s concern regarding potential biexponential decay due to the presence of different compartments. In our experiments, we carefully positioned the imaging slice sufficiently remote from the pellet-media interface. This approach ensures that the signal predominantly arises from the cells (and interstitial fluid), excluding the influence of extracellular media above the cell pellet. We will clearly describe the imaging slice in the revised manuscript. As mentioned in our Methods section, for in vitro experiments, we repeated a single-echo spin-echo sequence with 50 difference echo times. While Figure 1C illustrates data from five echo times for visual clarity, the full dataset with all 50 echo times was used for fitting. We will clarify this point in the revised manuscript to avoid any misunderstanding.

      (4) Delta T1 and T2 values are presented for the pellets in wells, but no absolute values are presented for either the pellets or the KCL solutions that I could find.

      As requested by the reviewer, we will include the absolute values in the revised manuscript.

      Reviewer #2 (Public review):

      Summary:

      Min et al. attempt to demonstrate that magnetic resonance imaging (MRI) can detect changes in neuronal membrane potentials. They approach this goal by studying how MRI contrast and cellular potentials together respond to treatment of cultured cells with ionic solutions. The authors specifically study two MRI-based measurements: (A) the transverse (T2) relaxation rate, which reflects microscopic magnetic fields caused by solutes and biological structures; and (B) the fraction or "pool size ratio" (PSR) of water molecules estimated to be bound to macromolecules, using an MRI technique called magnetization transfer (MT) imaging. They see that depolarizing K+ and Ba2+ concentrations lead to T2 increases and PSR decreases that vary approximately linearly with voltage in a neuroblastoma cell line and that change similarly in a second cell type. They also show that depolarizing potassium concentrations evoke reversible T2 increases in rat brains and that these changes are reversed when potassium is renormalized. Min et al. argue that this implies that membrane potential changes cause the MRI effects, providing a potential basis for detecting cellular voltages by noninvasive imaging. If this were true, it would help validate a recent paper published by some of the authors (Toi et al., Science 378:160-8, 2022), in which they claimed to be able to detect millisecond-scale neuronal responses by MRI.

      Strengths:

      The discovery of a mechanism for relating cellular membrane potential to MRI contrast could yield an important means for studying functions of the nervous system. Achieving this has been a longstanding goal in the MRI community, but previous strategies have proven too weak or insufficiently reproducible for neuroscientific or clinical applications. The current paper suggests remarkably that one of the simplest and most widely used MRI contrast mechanisms-T2 weighted imaging-may indicate membrane potentials if measured in the absence of the hemodynamic signals that most functional MRI (fMRI) experiments rely on. The authors make their case using a diverse set of quantitative tests that include controls for ion and cell type-specificity of their in vitro results and reversibility of MRI changes observed in vivo.

      Weaknesses:

      The major weakness of the paper is that it uses correlational data to conclude that there is a causational relationship between membrane potential and MRI contrast. Alternative explanations that could explain the authors' findings are not adequately considered. Most notably, depolarizing ionic solutions can also induce changes in cellular volume and tissue structure that in turn alter MRI contrast properties similarly to the results shown here. For example, a study by Stroman et al. (Magn Reson Med 59:700-6, 2008) reported reversible potassium-dependent T2 increases in neural tissue that correlate closely with light scattering-based indications of cell swelling. Phi Van et al. (Sci Adv 10:eadl2034, 2024) showed that potassium addition to one of the cell lines used here likewise leads to cell size increases and T2 increases. Such effects could in principle account for Min et al.'s results, and indeed it is difficult to see how they would not contribute, but they occur on a time scale far too slow to yield useful indications of membrane potential. The authors' observation that PSR correlates negatively with T2 in their experiments is also consistent with this explanation, given the inverse relationship usually observed (and mechanistically expected) between these two parameters. If the authors could show a tight correspondence between millisecond-scale membrane potential changes and MRI contrast, their argument for a causal connection or a useful correlational relationship between membrane potential and image contrast would be much stronger. As it is, however, the article does not succeed in demonstrating that membrane potential changes can be detected by MRI.

      We appreciate the reviewer’s comments. We agree that changes in cell volume due to depolarization and hyperpolarization significantly contribute to the observed MR parameter changes. For this reason, we have already noted in the Discussion section of the original manuscript that cell volume changes influence the observed MR parameter changes. In this regard, we thank the reviewer for introducing the work by Stroman et al. (Magn Reson Med 59:700-706, 2008) and Phi Van et al. (Sci Adv 10:eadl2034, 2024). When discussing the contribution of the cell volume changes to the observed MR parameter changes, we will additionally discuss both work of Stroman et al. and Phi Van et al. in the revised manuscript.

      In addition, this study does not address rapid dynamic membrane potential changes on the millisecond scale, which we explicitly discussed as one of the limitations of this study in the Discussion section of the original manuscript. For this reason, we do not claim in this study that we provide the reader with definitive answers about the mechanisms involved in DIANA. Rather, as a first step toward addressing the mechanism of DIANA, this study confirms that there is a good correlation between changes in membrane potential and measurable MR parameters (although on a slow time scale) when using ionic solutions that modulate membrane potential. Identifying T2 changes that occur during millisecond-scale membrane potential changes due to rapid neural activation will be further addressed in future studies.

      Together, we acknowledge that the title and main conclusion of the original manuscript may be misleading. To more accurately reflect the scope and results of this study and to consider the reviewer’s suggestion, we will adjust the title to “Responses to membrane potential-modulating ionic solutions measured by magnetic resonance imaging of cultured cells and in vivo rat cortex” and will also revise the relevant phrases in the main text.

    1. eLife Assessment

      The authors have provided a valuable addition to the literature on large-scale electrophysiological experiments across many labs. The evidence that the authors provided was incomplete - while some comparisons with analyses outside of the manuscript's approaches were provided, a more complete manuscript would have compared with alternative standardized analyses. In particular, alternative spike sorting metrics and the alternative of GLM-based analysis of data would have made the interpretation of the results clearer.

    2. Reviewer #1 (Public review):

      Summary:

      The authors explore a large-scale electrophysiological dataset collected in 10 labs while mice performed the same behavioral task, and aim to establish guidelines to aid reproducibility of results collected across labs. They introduce a series of metrics for quality control of electrophysiological data and show that histological verification of recording sites is important for interpreting findings across labs and should be reported in addition to planned coordinates. Furthermore, the authors suggest that although basic electrophysiology features were comparable across labs, task modulation of single neurons can be variable, particularly for some brain regions. The authors then use a multi-task neural network model to examine how neural dynamics relate to multiple interacting task- and experimenter-related variables, and find that lab-specific differences contribute little to the variance observed. Therefore, analysis approaches that account for correlated behavioral variables are important for establishing reproducible results when working with electrophysiological data from animals performing decision-making tasks. This paper is very well-motivated and needed. However, what is missing is a direct comparison of task modulation of neurons across labs using standard analysis practice in the fields, such as generalized linear model (GLM). This can potentially clarify how much behavioral variance contributes to the neural variance across labs; and more accurately estimate the scale of the issues of reproducibility in behavioral systems neuroscience, where conclusions often depend on these standard analysis methods.

      Strength:

      (1) This is a well-motivated paper that addresses the critical question of reproducibility in behavioural systems neuroscience. The authors should be commended for their efforts.

      (2) A key strength of this study comes from the large dataset collected in collaboration across ten labs. This allows the authors to assess lab-to-lab reproducibility of electrophysiological data in mice performing the same decision-making task.

      (3) The authors' attempt to streamline preprocessing pipelines and quality metrics is highly relevant in a field that is collecting increasingly large-scale datasets where automation of these steps is increasingly needed.

      (4) Another major strength is the release of code repositories to streamline preprocessing pipelines across labs collecting electrophysiological data.

      (5) Finally, the application of MTNN for characterizing functional modulation of neurons, although not yet widely used in systems neuroscience, seems to have several advantages over traditional methods.

      Weaknesses:

      (1) In several places the assumptions about standard practices in the field, including preprocessing and analyses of electrophysiology data, seem to be inaccurately presented:

      a) The estimation of how much the histologically verified recording location differs from the intended recording location is valuable information. Importantly, this paper provides citable evidence for why that is important. However, histological verification of recording sites is standard practice in the field, even if not all studies report them. Although we appreciate the authors' effort to further motivate this practice, the current description in the paper may give readers outside the field a false impression of the level of rigor in the field.

      b) When identifying which and how neurons encode particular aspects of stimuli or behaviour in behaving animals (when variables are correlated by the nature of the animals behaviour), it has become the standard in behavioral systems neuroscience to use GLMs - indeed many labs participating in the IBL also has a long history of doing this (e.g., Steinmetz et al., 2019; Musall et al., 2023; Orsolic et al., 2021; Park et al., 2014). The reproducibility of results when using GLMs is never explicitly shown, but the supplementary figures to Figure 7 indicate that results may be reproducible across labs when using GLMs (as it has similar prediction performance to the MTNN). This should be introduced as the first analysis method used in a new dedicated figure (i.e., following Figure 3 and showing results of analyses similar to what was shown for the MTNN in Figure 7). This will help put into perspective the degree of reproducibility issues the field is facing when analyzing with appropriate and common methods. The authors can then go on to show how simpler approaches (currently in Figures 4 and 5) - not accounting for a lot of uncontrolled variabilities when working with behaving animals - may cause reproducibility issues.

      When the authors introduce a neural network approach (i.e. MTNN) as an alternative to the analyses in Figures 4 and 5, they suggest: 'generalized linear models (GLMs) are likely too inflexible to capture the nonlinear contributions that many of these variables, including lab identity and spatial positions of neurons, might make to neural activity'). This is despite the comparison between MTNN and GLM prediction performance (Supplement 1 to Figure 7) showing that the MTNN is only slightly better at predicting neural activity compared to standard GLMs. The introduction of new models to capture neural variability is always welcome, but the conclusion that standard analyses in the field are not reproducible can be unfair unless directly compared to GLMs.

      In essence, it is really useful to demonstrate how different analysis methods and preprocessing approaches affect reproducibility. But the authors should highlight what is actually standard in the field, and then provide suggestions to improve from there.

      (2) The authors attempt to establish a series of new quality control metrics for the inclusion of recordings and single units. This is much needed, with the goal to standardize unit inclusion across labs that bypasses the manual process while keeping the nuances from manual curation. However, the authors should benchmark these metrics to other automated metrics and to manual curation, which is still a gold standard in the field. The authors did this for whole-session assessment but not for individual clusters. If the authors can find metrics that capture agreed-upon manual cluster labels, without the need for manual intervention, that would be extremely helpful for the field.

      (3) With the goal of improving reproducibility and providing new guidelines for standard practice for data analysis, the authors should report of n of cells, sessions, and animals used in plots and analyses throughout the paper to aid both understanding of the variability in the plots - but also to set a good example.

      Other general comments:

      (1) In the discussion (line 383) the authors conclude: 'This is reassuring, but points to the need for large sample sizes of neurons to overcome the inherent variability of single neuron recording'. - Based on what is presented in this paper we would rather say that their results suggest that appropriate analytical choices are needed to ensure reproducibility, rather than large datasets - and they need to show whether using standard GLMs actually allows for reproducible results.

      (2) A general assumption in the across-lab reproducibility questions in the paper relies on intralab variability vs across-lab variability. An alternative measure that may better reflect experimental noise is across-researcher variability, as well as the amount of experimenter experience (if the latter is a factor, it could suggest researchers may need more training before collecting data for publication). The authors state in the discussion that this is not possible. But maybe certain measures can be used to assess this (e.g. years of conducting surgeries/ephys recordings etc)?

      (3) Figure 3b and c: Are these plots before or after the probe depth has been adjusted based on physiological features such as the LFP power? In other words, is the IBL electrophysiological alignment toolbox used here and is the reliability of location before using physiological criteria or after? Beyond clarification, showing both before and after would help the readers to understand how much the additional alignment based on electrophysiological features adjusts probe location. It would also be informative if they sorted these penetrations by which penetrations were closest to the planned trajectory after histological verification.

      (4) In Figures 4 and 6: If the authors use a 0.05 threshold (alpha) and a cell simply has to be significant on 1/6 tests to be considered task modulated, that means that they have a false positive rate of ~30% (0.05*6=0.3). We ran a simple simulation looking for significant units (from random null distribution) from these criteria which shows that out of 100.000 units, 26500 units would come out significant (false error rate: 26.5%). That is very high (and unlikely to be accepted in most papers), and therefore not surprising that the fraction of task-modulated units across labs is highly variable. This high false error rate may also have implications for the investigation of the spatial position of task-modulated units (as effects of the spatial position may drown in falsely labelled 'task-modulated' cells).

      (5) The authors state from Figure 5b that the majority of cells could be well described by 2 PCs. The distribution of R2 across neurons is almost uniform, so depending on what R2 value one considers a 'good' description, that is the fraction of 'good' cells. Furthermore, movement onset has now been well-established to be affecting cells widely and in large fractions, so while this analysis may work for something with global influence - like movement - more sparsely encoded variables (as many are in the brain) may not be well approximated with this suggestion. The authors could expand this analysis into other epochs like activity around stimulus presentation, to better understand how this type of analysis reproduces across labs for features that have a less global influence.

      (6) Additionally, in Figure 5i: could the finding that one can only distinguish labs when taking cells from all regions, simply be a result of a different number of cells recorded in each region for each lab? It makes more sense to focus on the lab/area pairing as the authors also do, but not to make their main conclusion from it. If the authors wish to do the comparison across regions, they will need to correct for the number of cells recorded in each region for each lab. In general, it was a struggle to fully understand the purpose of Figure 5. While population analysis and dimensionality reduction are commonplace, this seems to be a very unusual use of it.

      (7) In the discussion the authors state: "This approach, which exceeds what is done in many experimental labs". Indeed this approach is a more effective and streamlined way of doing it, but it is questionable whether it 'exceeds' what is done in many labs. Classically, scientists trace each probe manually with light microscopy and designate each area based on anatomical landmarks identified with nissl or dapi stains together with gross landmarks. When not automated with 2-PI serial tomography and anatomically aligned to a standard atlas, this is a less effective process, but it is not clear that it is less precise, especially in studies before neuropixels where active electrodes were located in a much smaller area. While more effective, transforming into a common atlas does make additional assumptions about warping the brain into the standard atlas - especially in cases where the brain has been damaged/lesioned. Readers can appreciate the effectiveness and streamlining provided by these new tools without the need to invalidate previous approaches.

      (8) What about across-lab population-level representation of task variables, such as in the coding direction for stimulus or choice? Is the general decodability of task variables from the population comparable across labs?

    3. Reviewer #2 (Public review):

      Summary:

      The authors sought to evaluate whether observations made in separate individual laboratories are reproducible when they use standardized procedures and quality control measures. This is a key question for the field. If ten systems neuroscience labs try very hard to do the exact same experiment and analyses, do they get the same core results? If the answer is no, this is very bad news for everyone else! Fortunately, they were able to reproduce most of their experimental findings across all labs. Despite attempting to target the same brain areas in each recording, variability in electrode targeting was a source of some differences between datasets.

      Major Comments:

      The paper had two principal goals:<br /> (1) to assess reproducibility between labs on a carefully coordinated experiment<br /> (2) distill the knowledge learned into a set of standards that can be applied across the field.<br /> The manuscript made progress towards both of these goals but leaves room for improvement.

      (1) The first goal of the study was to perform exactly the same experiment and analyses across 10 different labs and see if you got the same results. The rationale for doing this was to test how reproducible large-scale rodent systems neuroscience experiments really are. In this, the study did a great job showing that when a consortium of labs went to great lengths to do everything the same, even decoding algorithms could not discern laboratory identity was not clearly from looking at the raw data. However, the amount of coordination between the labs was so great that these findings are hard to generalize to the situation where similar (or conflicting!) results are generated by two labs working independently.

      Importantly, the study found that electrode placement (and thus likely also errors inherent to the electrode placement reconstruction pipeline) was a key source of variability between datasets. To remedy this, they implemented a very sophisticated electrode reconstruction pipeline (involving two-photon tomography and multiple blinded data validators) in just one lab-and all brains were sliced and reconstructed in this one location. This is a fantastic approach for ensuring similar results within the IBL collaboration, but makes it unclear how much variance would have been observed if each lab had attempted to reconstruct their probe trajectories themselves using a mix of histology techniques from conventional brain slicing, to light sheet microscopy, to MRI imaging.

      This approach also raises a few questions. The use of standard procedures, pipelines, etc. is a great goal, but most labs are trying to do something unique with their setup. Bigger picture, shouldn't highly "significant" biological findings akin to the discovery of place cells or grid cells, be so clear and robust that they can be identified with different recording modalities and analysis pipelines?

      Related to this, how many labs outside of the IBL collaboration have implemented the IBL pipeline for their own purposes? In what aspects do these other labs find it challenging to reproduce the approaches presented in the paper? If labs were supposed to perform this same experiment, but without coordinating directly, how much more variance between labs would have been seen? Obviously investigating these topics is beyond the scope of this paper. The current manuscript is well-written and clear as is, and I think it is a valuable contribution to the field. However, some additional discussion of these issues would be helpful.

      (2) The second goal of the study was to present a set of data curation standards (RIGOR) that could be applied widely across the field. This is a great idea, but its implementation needs to be improved if adoption outside of the IBL is to be expected. Here are three issues:

      (a) The GitHub repo for this project (https://github.com/int-brain-lab/paper-reproducible-ephys/) is nicely documented if the reader's goal is to reproduce the figures in the manuscript. Consequently, the code for producing the RIGOR statistics seems mostly designed for re-computing statistics on the existing IBL-formatted datasets. There doesn't appear to be any clear documentation about how to run it on arbitrary outputs from a spike sorter (i.e. the inputs to Phy).

      (b) Other sets of spike sorting metrics that are more easily computed for labs that are not using the IBL pipeline already exist (e.g. "quality_metrics" from the Allen Institute ecephys pipeline [https://github.com/AllenInstitute/ecephys_spike_sorting/blob/main/ecephys_spike_sorting/modules/quality_metrics/README.md] and the similar module in the Spike Interface package [https://spikeinterface.readthedocs.io/en/latest/modules/qualitymetrics.html]). The manuscript does not compare these approaches to those proposed here, but some of the same statistics already exist (amplitude cutoff, median spike amplitude, refractory period violation).

      (c) Some of the RIGOR criteria are qualitative and must be visually assessed manually. Conceptually, these features make sense to include as metrics to examine, but would ideally be applied in a standardized way across the field. The manuscript doesn't appear to contain a detailed protocol for how to assess these features. A procedure for how to apply these criteria for curating non-IBL data (or for implementing an automated classifier) would be helpful.

      Other Comments:

      (1) How did the authors select the metrics they would use to evaluate reproducibility? Was this selection made before doing the study?

      (2) Was reproducibility within-lab dependent on experimenter identity?

      (3) They note that UCLA and UW datasets tended to miss deeper brain region targets (lines 185-188) - they do not speculate why these labs show systematic differences. Were they not following standardized procedures?

      (4) The authors suggest that geometrical variance (difference between planned and final identified probe position acquired from reconstructed histology) in probe placement at the brain surface is driven by inaccuracies in defining the stereotaxic coordinate system, including discrepancies between skull landmarks and the underlying brain structures. In this case, the use of skull landmarks (e.g. bregma) to determine locations of brain structures might be unreliable and provide an error of ~360 microns. While it is known that there is indeed variance in the position between skull landmarks and brain areas in different animals, the quantification of this error is a useful value for the field.

      (5) Why are the thalamic recording results particularly hard to reproduce? Does the anatomy of the thalamus simply make it more sensitive to small errors in probe positioning relative to the other recorded areas?

    1. eLife Assessment

      In this paper, Seon and Chung investigate changes in own risk-taking behavior, when they are being observed by a "risky" or "safe" player. Using computational modeling and model-informed fMRI, the authors present solid evidence that participants adjust their choice congruent with the other player's type (either risky or safe). The conclusions of the paper are an important contribution to the field of social decision-making as they show a differentiated adjustment of choices and not just a universally riskier choice behavior when being observed as has been claimed in previous studies.

    2. Reviewer #1 (Public review):

      Summary:

      Seon and Chung's study investigates the hypothesis that individuals take more risks when observed by others because they perceive others to be riskier than themselves. To test this, the authors designed an innovative experimental paradigm where participants were informed that their decisions would be observed by a "risky" player and a "safe" player. Participants underwent fMRI scanning during the task.

      Strengths:

      The research question is sound, and the experimental paradigm is well-suited to address the hypothesis.

      Weaknesses:

      I have several concerns. Most notably, the manuscript is difficult to read in parts, and I suggest a thorough revision of the writing for clarity, as some sections are nearly incomprehensible. Additionally, key statistical details are missing, and I have reservations about the choice of ROIs.

    3. Reviewer #2 (Public review):

      Summary:

      This study aims to investigate how social observation influences risky decision-making. Using a gambling task, the study explored how participants adjusted their risk-taking behavior when they believed their decisions were being observed by either a risk-averse or risk-seeking partner. The authors hypothesized that individuals would simulate the choices of their observers based on learned preferences and integrate these simulated choices into their own decision-making. In addition to behavioral experiments, the study employed computational modeling to formalize decision processes and fMRI to identify the neural underpinnings of risky decision-making under social observation.

      Strengths:

      The study provides a fresh perspective on social influence in decision-making, moving beyond the simple notion that social observation leads to uniformly riskier behavior. Instead, it shows that individuals adjust their choices depending on their beliefs about the observer's risk preferences, offering a more nuanced understanding of how social contexts shape decision-making. The authors provide evidence using comprehensive approaches, including behavioral data based on a well-designed task, computational modeling, and neuroimaging. The three models are well selected to compare at which level (e.g., computing utility, risk preference shift, and choice probability) the social influence alters one's risky decision-making. This approach allows for a more precise understanding of the cognitive processes underlying decision-making under social observation.

      Weaknesses:

      While the neuroimaging results are generally consistent with the behavioral and computational findings, the strength of the neural evidence could be improved. The authors' claims about the involvement of the TPJ and mPFC in integrating social information are plausible, but further analysis, such as model comparisons at the neuroimaging level, is needed to decisively rule out alternative interpretations that other computational models suggest.

    4. Reviewer #3 (Public review):

      Summary:

      This is an important paper using a novel paradigm to examine how observation affects the social contagion of risk preferences. There is a lot of interest in the field about the mechanisms of social influence, and adding in the factor of whether observation also influences these contagion effects is intriguing.

      Strengths:

      (1) There is an impressive combination of a multi-stage behavioural task with computational modelling and neuroimaging.

      (2) The analyses are well conducted and the sample size is reasonable.

      Weaknesses:

      (1) Anatomically it would be helpful to more explicitly distinguish between dmPFC and vmPFC. Particularly at the end of the introduction when mPFC and vmPFC are distinguished, as the vmPFC is in the mPFC.

      (2) The authors' definition of ROIs could be elaborated on further. They suggest that peaks are selected from neurosynth for different terms, but were there not multiple peaks identified within a functional or anatomical brain area? This section could be strengthened by confirming with anatomical ROIs where available, such as the atlases here http://www.rbmars.dds.nl/lab/CBPatlases.html and the Harvard-Oxford atlases.

      (3) How did the authors ensure there were enough trials to generate a reliable BOLD signal? The scanned part of the study seems relatively short.

      (4) It would be helpful to add whether any brain areas survived whole-brain correction.

      (5) There is a concern that mediation cannot be used to make causal inferences and much larger samples are needed to support claims of mediation. The authors should change the term mediation in order to not imply causality (they could talk about indirect effects instead) and highlight that the mediation analyses are exploratory as they would not be sufficiently powered (https://www.ncbi.nlm.nih.gov/pmc/articles/PMC2843527/).

      (6) The authors may want to speculate on lifespan differences in this susceptibility to risk preferences given recent evidence that older adults are relatively more susceptible to impulsive social influence (Zhu et al, 2024, comms psychology).

    1. eLife Assessment

      In this useful study, the authors tested a novel approach to eradicating HIV reservoirs by constructing a herpes simplex virus (HSV)-based therapeutic vaccine and evaluating efficacy in experimental infections of chronically SIV-infected, antiretroviral therapy (ART)-treated macaques. While mean viremia at rebound was lower in the HSV vaccine-treated group, the evidence presented appears to be incomplete, as the group size was small and the viral load at rebound was highly variable. This is a revised paper, but the support for the conclusions, particularly the effect of the HSV-vectored therapeutic vaccine on the SIV reservoir in the SIV-infected macaques, remains limited.

    2. Reviewer #1 (Public review):

      Summary:

      The authors constructed a novel HSV-based therapeutic vaccine to cure SIV in a primate model. The novel HSV vector is deleted for ICP34.5. Evidence is given that this protein blocks HIV reactivation by interference with the NFkappaB pathway. The deleted construct supposedly would reactivate SIV from latency. The SIV genes carried by the vector ought to elicit a strong immune response. Together the HSV vector would elicit a shock and kill effect. This is tested in a primate model.

      Strengths and weaknesses:

      (1) Deleting ICP34.5 from the HSV construct has a very strong effect on HIV reactivation. The mechanism underlying increased activation by deleting ICP34.5 is only partially explored. Overexpression of ICP34.5 has a much smaller effect (reduction in reactivation) than deletion of ICP34.5 (strong activation); this is acknowledged by the authors that no full mechanistic explanation can be given at this moment.

      (2) No toxicity data are given for deleting ICP34.5. How specific is the effect for HIV reactivation? A RNA seq analysis is required to show the effect on cellular genes.

      A RNA seq analysis was done in the revised manuscript comparing the effect of HSV-1 and deleted vector in J-LAT cells (Fig S5). More than 2000 genes are upregulated after transduction with the modified vector in comparison with the WT vector. Hence, the specificity of upregulation of SIV genes is questioned. Authors do NOT comment on these findings. In my view it questions the utility of this approach.

      (3) The primate groups are too small and the results to variable to make averages. In Fig 5, the group with ART and saline has two slow rebounders. It is not correct to average those with the single quick rebounder. Here the interpretation is NOT supported by the data.

      Although authors provided some promising SIV DNA data, no additional animals were added. Groups of 3 animals are too small to make any conclusion, especially since the huge variability in response. The average numbers out of 3 are still presented in the paper, which is not proper science.

      No data are given of the effect of the deletion in primates. Now the deleted construct is compared with an empty vector containing no SIV genes. Authors provide new data in Fig S2 on the comparison of WT and modified vector in cells from PLWH, but data are not that convincing. A significant difference in reactivation is seen for LTR in only 2/4 donors and in Gag in 3/4 donors. (Additional question what is meaning of LTR mRNA, do authors relate to genomic RNA??)

      Discussion

      HSV vectors are mainly used in cancer treatment partially due to induced inflammation. Whether these are suitable to cure PLWH without major symptoms is a bit questionable to me and should at least be argued for.

      The RNA seq data add on to this worry and should at least be discussed.

    3. Reviewer #2 (Public review):

      Summary:

      In this article Wen et. al., describe the development of a 'proof-of-concept' bi-functional vector based out of HSV-deltaICP-34.5's ability to purge latent HIV-1 and SIV genomes from cells. They show that co-infection of latent J-lat T-cell lines with a HSV-deltaICP-34.5 vector can reactivate HIV-1 from a latent state. Over- or stable expression of ICP 34.5 ORF in these cells can arrest latent HIV-1 genomes from transcription, even in the presence of latency reversal agents. ICP34.5 can co-IP with- and de-phosphorylate IKKa/b to block its interaction with NF-k/B transcription factor. Additionally, ICP34.5 can interact with HSF1 which was identified by mass-spec. Thus, the authors propose that the latency reversal effect of HSV-deltaICP-34.5 in co-infected JLat cells is due to modulatory effects on the IKKa/b-NF-kB and PP1-HSF-1 pathway.

      Next the authors cleverly construct a bifunctional HSV based vector with deleted ICP34.5 and 47 ORFs to purge latency and avoid immunological refluxes, and additionally expand the application of this construct as a vaccine by introducing SIV genes. They use this 'vaccine' in mouse models and show the expected SIV-immune responses. Experiments in rhesus macaques (RM), further elicit potential for their approach to reactivate SIV genomes and at the same time block their replication by antibodies. What was interesting in the SIV experiments is that the dual-functional vector vaccine containing sPD1- and SIV Gag/Env ORFs effectively delayed SIV rebound in RMs and in some cases almost neutralized viral DNA copy detection in serum. Very promising indeed, however there are some questions I wish the authors explored to answer, detailed below.

      Overall, this is an elegant and timely work demonstrating the feasibility of reducing virus rebound in animals, and potentially expand to clinical studies. The work was well written, and sections were clearly discussed.

      Strengths:

      The work is well designed, rationale explained and written very clearly for lay readers.<br /> Claims are adequately supported by evidence and well designed experiments including controls.

      Weaknesses:

      (1) It looks like ICP0 is also involved in latency reversal effects. More follow-up work will be required to test if this is in fact true.

      (2) It is difficult to estimate the depletion of the latent viral reservoir. The authors have tried to address this issue. A more convincing argument to this reviewer will be data to demonstrate that after the bi-functional vaccine, the animals show overall reduction in the number of circulating latent cells. The feasibility to obtain such a result is not clearly demonstrated.

      (3) The authors state that the reduced virus rebound detected following bi-functional vaccine delivery is due to latent genomes becoming activated and steady-state neutralization of these viruses by antibody response. This needs to be demonstrated. Perhaps cell-culture experiments from specimen taken from animals might help address this issue. In lab cultures one could create environments without antibody responses, under these conditions one would expect higher level of viral loads being released in response to the vaccine in question.

    4. Author response:

      The following is the authors’ response to the original reviews.

      Reviewer #1 (Public Review):

      Summary:

      The authors constructed a novel HSV-based therapeutic vaccine to cure SIV in a primate model. The novel HSV vector is deleted for ICP34.5. Evidence is given that this protein blocks HIV reactivation by interference with the NF-kB pathway. The deleted construct supposedly would reactivate SIV from latency. The SIV genes carried by the vector ought to elicit a strong immune response. Together the HSV vector would elicit a shock and kill effect. This is tested in a primate model.

      Thank you for your kind comments and suggestions, which are very helpful in improving our manuscript. We have carefully revised our manuscript and performed additional experiments accordingly, and we now think this version has been substantially improved for your reconsideration.

      Strengths and weaknesses:

      (1) Deleting ICP34.5 from the HSV construct has a very strong effect on HIV reactivation. Why is no eGFP readout given in Figure 1C as for WT HSV? The mechanism underlying increased activation by deleting ICP34.5 is only partially explored. Overexpression of ICP34.5 has a much smaller effect (reduction in reactivation) than deletion of ICP34.5 (strong activation); so the story seems incomplete.

      Thank you for your careful review and kind reminder.

      (1) We are sorry for the misunderstanding of Figure 1C. In the experiment of Figue 1C, we used an HSV-1 17 strain containing GFP (HSV-GFP) and HSV-DICP34.5 (recombinant HSV-1 17 strain with ICP34.5 deletion based on HSV-GFP) to reactivate the HIV latency cell line (J-Lat 10.6 cell). Since detecting GFP cannot distinguish between HSV infection and HIV reactivation, we assessed the reactivation by measuring the mRNA levels of HIV LTR upon stimulation with either HSV-GFP or HSV-ΔICP34.5. Actually, in Figure 1B, we had verified the reactivation efficacy by infecting J-Lat 10.6 cells with the HSV-1 17 strain containing GFP (HSV-GFP) and found significant upregulation of mRNA levels of HIV-1 LTR, Tat, Gag, Vif, and Vpr. We have adjusted the corresponding descriptions accordingly in the revised manuscript.

      (2) We agree with your insightful mention that the mechanism underlying increased activation by HSV-ΔICP34.5 is worthy to be further explored in the future study. In this study, we found that ICP34.5 play an antagonistic role with the reactivation of HIV latency by HSV-1 mainly through the modulation of host NF-κB and HSF1 pathways, while HSV-1 (especially HSV-ΔICP34.5) might reactivate HIV latency through NF-κB, HSF1, and other yet-to-be-determined mechanisms. Thus, ICP34.5 overexpression can only a partial effect on the reduction of the HIV latency reactivation by HSV-1. We have mentioned this issue in the revised “Discussion section”. Intriguingly, these findings collectively indicated that ICP34.5 might play an antagonistic role in the reactivation of HIV by HSV-1, and thus our modified HSV-DICP34.5 constructs can effectively reactivate HIV/SIV latency through the release of imprisonment from ICP34.5. However, ICP34.5 overexpression had only a partial effect on the reduction of the HIV latency reactivation, indicating that HSV-DICP34.5-based constructs can also reactivate HIV latency through other yet-to-be-determined mechanisms. (Lines 334 to 340).

      (2) No toxicity data are given for deleting ICP34.5. How specific is the effect for HIV reactivation? An RNA seq analysis is required to show the effect on cellular genes.

      Thank you for your questions and suggestions.

      (1) It’s well known that ICP34.5 is a neurotoxicity factor that can antagonize host immune responses, and previous studies (in gene therapy and oncolytic virotherapy) have shown that the safety of recombinant HSV-based vector can be improved by deleting ICP34.5. In this study, we also found that HSV-DICP34.5 exhibited lower virulence and replication ability than its parental strain (HSV-GFP) (Figure 1D, Figure S1). In addition, HSV-DICP34.5 induced a lower level of inflammatory cytokines (including IL-6, IL-1β, and TNF-α) in primary CD4+ T cells from PLWH compared to HSV-GFP stimulation, likely due to its lower virulence and replication ability (Figure 1I-K). In addition, the CD4+ /CD8+ T cell ratio (Figure 5I) and body weight (Figure S9) after treatment were effectively ameliorated in the SIV-infected macaques of the ART+HSV-DICP34.5-sPD1-SIVgag/SIVenv group. Our data also demonstrated that there was no significant effect on the cell composition of peripheral blood in the SIV-infected macaques of ART+HSV-sPD1-SIVgag/SIVenv group (Figure S10). Thus, these data suggest the safety of HSV-DICP34.5 in PLWH might be tolerable. We have added the corresponding description in the revised manuscript.

      (2) In our study, we found both adenovirus and vaccinia virus cannot reactivate HIV latency (Figure S3). In addition, the deletion of ICP0 gene from HSV-1 diminished the reactivation effect of HIV latency by HSV-1 (Figure S4). Thus, these data suggested the reactivation of HIV latency by HSV-1 might be virus-specific. Of course, this might be further investigated in future studies. We have added the corresponding description in the revised manuscript.

      (3) To explore the mechanism of reactivating viral latency by HSV-DICP34.5-based constructs, we performed RNA-seq analysis (Figure S5). We have added the corresponding description accordingly in the revised manuscript.

      (3) The primate groups are too small and the results to variable to make averages. In Figure 5, the group with ART and saline has two slow rebounders. It is not correct to average those with a single quick rebounder. Here the interpretation is NOT supported by the data.

      We agree with you that this is a pilot study with limited numbers of rhesus macaques. Although the number of macaques was relatively limited, these nine macaques were distributed evenly based on the background level of age, sex, weight, CD4 count, and viral load (VL) (Table S2). All SIV-infected macaques used in this study had a long history of SIV infection and had several courses of ART therapy, which mimics treatment of chronic HIV-1 infection in humans. These macaques were infected with SIVmac239 for more than 5 years, and highly pathogenic SIV-infected macaques have been well-validated as a stringent model to recapitulate HIV-1 pathogenesis and persistence during ART therapy in humans. Indeed, in our Chinese rhesus model, ART treatment effectively suppressed SIV infection to undetectable levels in plasma, and upon ART discontinuation, virus rapidly rebounded, which is very similar with that in ART-treated HIV patients. We think the results of this pilot study were very promising for further studies which will be expanded the scale of animals and then to preclinical and clinical study in our next projects. Thank you for your understanding.

      As for your question regarding “the two animals with low VL and slow rebound”, our explanation is following: As mentioned above, these macaques were distributed evenly based on the background level of CD4 count and VL (Table S2), and then there were different change of viral load and viral rebound in different groups. Thus, we think these data can support our interpretation. Moreover, our conclusion can also be supported from at least three evidences.

      (1) The VL in the ART+saline group promptly rebounded after ART discontinuation, with an average 8.63-fold increase in the rebounded peak VL compared with the pre-ART VL (Figure 5A, D and E). However, plasma VL in the ART+HSV-sPD1-SIVgag/SIVenv group exhibited a delayed rebound interval (Figure 5B-D).

      (2) There was a lower rebounded peak VL than pre-ART VL in the ART+HSV-sPD1-SIVgag/SIVenv group (average 12.20-fold decrease), while a higher rebounded peak VL than pre-ART VL in the ART+HSV-empty group (average 2.74-fold increase) (Figure 5E).

      (3) We found significant suppression of total SIV DNA and integrated SIV DNA provirus in the ART+HSV-sPD1-SIVgag/SIVenv group. However, the copies of the SIV DNA provirus were significantly improved in the ART+HSV-empty group and ART+saline group (Figure 5F-G).

      Thank you for your understanding.

      Discussion

      HSV vectors are mainly used in cancer treatment partially due to induced inflammation. Whether these are suitable to cure PLWH without major symptoms is a bit questionable to me and should at least be argued for.

      Thank you for your kind question comment and question. We confirmed the enhanced reactivation of HIV latency by HSV-∆ICP34.5 in primary CD4+ T cells from people living with HIV (PLWH) (Figure S2). As mentioned above, previous studies have shown that the safety of recombinant HSV-based vector can be improved by deleting ICP34.5. In this study, we also found that HSV-DICP34.5 exhibited lower virulence and replication ability than its parental strain (HSV-GFP) (Figure 1D, Figure S1). In addition, HSV-DICP34.5 induced a lower level of inflammatory cytokines (including IL-6, IL-1β, and TNF-α) in primary CD4+ T cells from PLWH compared to HSV-GFP stimulation, likely due to its lower virulence and replication ability (Figure 1I-K). In addition, the CD4+ /CD8+ T cell ratio (Figure 5I) and body weight (Figure S9) after treatment were effectively ameliorated in the SIV-infected macaques of the ART+HSV-DICP34.5-sPD1-SIVgag/SIVenv group. Our data also demonstrated that there was no significant effect on the cell composition of peripheral blood in the SIV-infected macaques of ART+HSV-sPD1-SIVgag/SIVenv group (Figure S10). Thus, these data suggest the safety of HSV-DICP34.5 in PLWH might be tolerable. We have added the corresponding description in the revised manuscript.

      Reviewer #2 (Public Review):

      Summary:

      In this article, Wen et. al. describe the development of a 'proof-of-concept' bi-functional vector based on HSV-deltaICP-34.5's ability to purge latent HIV-1 and SIV genomes from cells. They show that co-infection of latent J-lat T-cell lines with an HSV-deltaICP-34.5 vector can reactivate HIV-1 from a latent state. Over- or stable expression of ICP 34.5 ORF in these cells can arrest latent HIV-1 genomes from transcription, even in the presence of latency reversal agents. ICP34.5 can co-IP with- and de-phosphorylate IKKa/b to block its interaction with NF-k/B transcription factor. Additionally, ICP34.5 can interact with HSF1 which was identified by mass-spec. Thus, the authors propose that the latency reversal effect of HSV-deltaICP-34.5 in co-infected JLat cells is due to modulatory effects on the IKKa/b-NF-kB and PP1-HSF-1 pathway.

      Next, the authors cleverly construct a bifunctional HSV-based vector with deleted ICP34.5 and 47 ORFs to purge latency and avoid immunological refluxes, and additionally, expand the application of this construct as a vaccine by introducing SIV genes. They use this 'vaccine' in mouse models and show the expected SIV-immune responses. Experiments in rhesus macaques (RM), further elicit the potential for their approach to reactivate SIV genomes and at the same time block their replication by antibodies. What was interesting in the SIV experiments is that the dual-functional vector vaccine containing sPD1- and SIV Gag/Env ORFs effectively delayed SIV rebound in RMs and in some cases almost neutralized viral DNA copy detection in serum. Very promising indeed, however, there are some questions I wish the authors had explored to get answers to, detailed below.

      Overall, this is an elegant and timely work demonstrating the feasibility of reducing virus rebound in animals, with the potential to expand to clinical studies. The work was well-written, and sections were clearly discussed.

      Strengths:

      The work is well designed, rationale explained, and written very clearly for lay readers.<br /> Claims are adequately supported by evidence and well-designed experiments including controls.

      Thank you for your nice comments regarding our work.

      Weaknesses:

      (1) While the mechanism of ICP34.5 interaction and modulation of the NF-kB and HSF1 pathways are shown, this only proves ICP34.5 interactions but does not give away the mechanism of how the HSV-deltaICP-34.5 vector purges HIV-1 latency. What other components of the vector are required for latency reversal? Perhaps serial deletion experiments of the other ORFs in the HSV-deltaICP-34.5 vector might be revealing.

      Thank you for your valuable suggestion. In fact, we are currently further exploring some potential viral genes of HSV-1 that might play a role in the reactivation of HIV latency. We have found that the deletion of ICP0 gene from HSV-1 diminished the reactivation effect of HIV latency by HSV-1 (Figure S4), showing that ICP0 might play a vital role for the reactivation. Of course, this might be further investigated in future studies. We have added the corresponding description in the revised manuscript.

      (2) The efficacy of the HSV vaccine vectors was evaluated in Rhesus Macaque model animals. Animals were chronically infected with SIV (a parent of HIV), treated with ART, challenged with bi-functional HSV vaccine or controls, and discontinued treatment, and the resulting virus burden and immune responses were monitored. The animals showed SIV Gag and Env-specific immune responses, and delayed virus rebound (however rebound is still there), and below-detection viral DNA copies. What would make a more convincing argument to this reviewer will be data to demonstrate that after the bi-functional vaccine, the animals show overall reduction in the number of circulating latent cells. The feasibility of obtaining such a result is not clearly demonstrated.

      Thank you for your valuable mention. We have now provided more data about this issue. We found significant suppression of total SIV DNA and integrated SIV DNA provirus in the ART+HSV-sPD1-SIVgag/SIVenv group. However, the copies of the SIV DNA provirus were significantly improved in the ART+HSV-empty group and ART+saline group (Figure 5F-G). We have added the corresponding description in the revised manuscript.

      (3) The authors state that the reduced virus rebound detected following bi-functional vaccine delivery is due to latent genomes becoming activated and steady-state neutralization of these viruses by antibody response. This needs to be demonstrated. Perhaps cell-culture experiments from specimens taken from animals might help address this issue. In lab cultures one could create environments without antibody responses, under these conditions one would expect a higher level of viral loads to be released in response to the vaccine in question.

      Thanks for your kind mention and suggestion. We performed the following cell experiment to address this issue. Primary CD4+ T cells from people living with HIV (PLWH) were isolated, and then infected with HSV or HSV-∆ICP34.5 constructs. As expected, we confirmed the enhanced reactivation of HIV latency by HSV-∆ICP34.5 (Figure S2). Thank you.

      (4) How do the authors imagine neutralizing HIV-1 envelope epitopes by a similar strategy? A discussion of this point may also help.

      Thank you for your kind comment. We have added the corresponding discussion in the revised manuscript. “The current consensus on HIV/AIDS vaccines emphasizes the importance of simultaneously inducing broadly neutralizing antibodies and cellular immune responses. Therefore, we believe that incorporating the induction of broadly neutralizing antibodies into our future optimizing approaches may lead to better therapeutic outcomes.” (Lines 384 to 388)

      (5) I thought the empty HSV-vector control also elicited somewhat delayed kinetics in virus rebound and neutralization, can the authors comment on why this is the case?

      Thank you for your careful review and mention. We agree with you that the HSV-1 empty vector does exhibit somewhat a delayed rebound. We think the possible reason is: Although the empty HSV-vector cannot elicit SIV-specific CTL responses, it effectively activates the latent SIV reserviors, and then these activated virions can be partially killed by ART drugs. Therefore, even without carrying HIV/SIV antigens, somewhat delayed kinetics in virus rebound may be observed. Thank you.

      Reviewer #1 (Recommendations For The Authors):

      (1) The authors should provide toxicity data for HSV transduction after deleting ICP34.5 and provide an explanation of why overexpression of ICP34.5 has such a small effect.

      Thank you for your questions and suggestions. As mentioned above, we now provided data for the safety of HSV-DICP34.5-based constructs.

      (1) It’s well known that ICP34.5 is a neurotoxicity factor that can antagonize host immune responses, and previous studies (in gene therapy and oncolytic virotherapy) have shown that the safety of recombinant HSV-based vector can be improved by deleting ICP34.5. In this study, we also found that HSV-DICP34.5 exhibited lower virulence and replication ability than its parental strain (HSV-GFP) (Figure 1D, Figure S1). In addition, HSV-DICP34.5 induced a lower level of inflammatory cytokines (including IL-6, IL-1β, and TNF-α) in primary CD4+ T cells from PLWH compared to HSV-GFP stimulation, likely due to its lower virulence and replication ability (Figure 1I-K). In addition, the CD4+ /CD8+ T cell ratio (Figure 5I) and body weight (Figure S9) after treatment were effectively ameliorated in the SIV-infected macaques of the ART+HSV-DICP34.5-sPD1-SIVgag/SIVenv group. Our data also demonstrated that there was no significant effect on the cell composition of peripheral blood in the SIV-infected macaques of ART+HSV-sPD1-SIVgag/SIVenv group (Figure S10). Thus, these data suggest the safety of HSV-DICP34.5 in PLWH might be tolerable. We have added the corresponding description in the revised manuscript.

      (2) We agree with your insightful mention that the mechanism underlying increased activation by HSV-ΔICP34.5 is worthy to be further explored in the future study. In this study, we found that ICP34.5 play an antagonistic role with the reactivation of HIV latency by HSV-1 mainly through the modulation of host NF-κB and HSF1 pathways, while HSV-1 (especially HSV-ΔICP34.5) might reactivate HIV latency through NF-κB, HSF1, and other yet-to-be-determined mechanisms. Thus, ICP34.5 overexpression can only a partial effect on the reduction of the HIV latency reactivation by HSV-1. We have mentioned this issue in the revised “Discussion section”. “Intriguingly, these findings collectively indicated that ICP34.5 might play an antagonistic role in the reactivation of HIV by HSV-1, and thus our modified HSV-DICP34.5 constructs can effectively reactivate HIV/SIV latency through the release of imprisonment from ICP34.5. However, ICP34.5 overexpression had only a partial effect on the reduction of the HIV latency reactivation, indicating that HSV-DICP34.5-based constructs can also reactivate HIV latency through other yet-to-be-determined mechanisms.” (Lines 334 to 340).

      (2) How specific is the effect for HIV reactivation? An RNA seq analysis is required to show the effect on cellular genes.

      Thank you for your questions and suggestions.

      (1) In our study, we found both adenovirus and vaccinia virus cannot reactivate HIV latency (Figure S3). In addition, the deletion of ICP0 gene from HSV-1 diminished the reactivation effect of HIV latency by HSV-1 (Figure S4). Thus, these data suggested the reactivation of HIV latency by HSV-1 might be virus-specific. Of course, this might be further investigated in future studies. We have added the corresponding description in the revised manuscript.

      (2) To explore the mechanism of reactivating viral latency by HSV-DICP34.5-based constructs, we performed RNA-seq analysis (Figure S5). Results showed that there were numerous differentially expressed genes (DEGs) in response to HSV-ΔICP34.5 infection. Among them, 2288 genes were upregulated, and 611 genes were downregulated. GO analysis showed the enrichment of these DEGs in cellular cycle, cellular development, and cellular proliferation, and KEGG enrichment analysis indicated the enrichment in pathways such as cellular cycle and cytokine-cytokine receptor interaction. We have added the corresponding description accordingly in the revised manuscript.

      (3) A comparison in primates has to be given for constructs with or without ICP34.5 to validate cell culture data (what is an empty vector?)

      Thank you for your reminder. In the revised manuscript, we performed the following cell experiment to address this issue. Primary CD4+ T cells from people living with HIV (PLWH) were isolated, and then infected with HSV or HSV-∆ICP34.5 constructs. As expected, we confirmed the enhanced reactivation of HIV latency by HSV-∆ICP34.5 (Figure S2). Thank you.

      (4) Legends should be improved in writing and content.

      Thank you for your kind mention. In the revised version, we have improved both the manuscript content and the legends of all Figures have been carefully revised in writing and content. Thank you.

      (5) The primate groups should be enlarged before any reliable conclusions can be made. Inflammatory/tox data should be provided.

      Thank you for your question.

      (1) As mentioned above, we agree with you that this is a pilot study with limited numbers of rhesus macaques. Although the number of macaques was relatively limited, these nine macaques were distributed evenly based on the background level of age, sex, weight, CD4 count, and viral load (VL) (Table S2). All SIV-infected macaques used in this study had a long history of SIV infection and had several courses of ART therapy, which mimics treatment of chronic HIV-1 infection in humans. These macaques were infected with SIVmac239 for more than 5 years, and highly pathogenic SIV-infected macaques have been well-validated as a stringent model to recapitulate HIV-1 pathogenesis and persistence during ART therapy in humans. Indeed, in our Chinese rhesus model, ART treatment effectively suppressed SIV infection to undetectable levels in plasma, and upon ART discontinuation, virus rapidly rebounded, which is very similar with that in ART-treated HIV patients. We think the results of this pilot study were very promising for further studies which will be expanded the scale of animals and then to preclinical and clinical study in our next projects. Thank you for your understanding.

      (2) As well known, ICP34.5 is a neurotoxicity factor that can antagonize host immune responses, and previous studies have shown that the safety of recombinant HSV-based vector can be improved by deleting ICP34.5. In this study, we also found that HSV-DICP34.5 exhibited lower virulence and replication ability than its parental strain (HSV-GFP) (Figure 1D, Figure S1). In addition, HSV-DICP34.5 induced a lower level of inflammatory cytokines (including IL-6, IL-1β, and TNF-α) in primary CD4+ T cells from PLWH compared to HSV-GFP stimulation, likely due to its lower virulence and replication ability (Figure 1I-K). In addition, the CD4+ /CD8+ T cell ratio (Figure 5I) and body weight (Figure S9) after treatment were effectively ameliorated in the SIV-infected macaques of the ART+HSV-DICP34.5-sPD1-SIVgag/SIVenv group. Our data also demonstrated that there was no significant effect on the cell composition of peripheral blood in the SIV-infected macaques of ART+HSV-sPD1-SIVgag/SIVenv group (Figure S10). Thus, these data suggest the safety of HSV-DICP34.5 in PLWH might be tolerable. We have added the corresponding description in the revised manuscript.

      (6) Discuss the potential of inflammatory HSV vaccines to be used in PLWH without clinical symptoms.

      Thank you for your mention. As discussed above, we found that HSV-DICP34.5 exhibited lower virulence and replication ability than its parental strain (Figure 1D, Figure S1), and we also found that HSV-DICP34.5 induced a lower level of inflammatory cytokines (including IL-6, IL-1β, and TNF-α) in primary CD4+ T cells from PLWH compared to HSV-GFP stimulation, likely due to its lower virulence and replication ability (Figure 1I-K). In addition, the CD4+ /CD8+ T cell ratio (Figure 5I) and body weight (Figure S9) after treatment were effectively ameliorated in the SIV-infected macaques of the ART+HSV-DICP34.5-sPD1-SIVgag/SIVenv group. Our data also demonstrated that there was no significant effect on the cell composition of peripheral blood in the SIV-infected macaques of ART+HSV-sPD1-SIVgag/SIVenv group (Figure S10). Thus, these data suggest the safety of HSV-DICP34.5 in PLWH might be tolerable. We have added the corresponding description in the revised manuscript.

      Reviewer #2 (Recommendations For The Authors):

      I think the authors have done due diligence to the experimental system, and collected evidence to show the feasibility of delaying virus rebound in macaques. However, I would encourage the authors to perform experiments that can back up the claim that delayed virus rebound is due to neutralization effects, or perhaps due to a reduction in viral reservoir. I believe insights into this process will add rigor, and push the relevance of the study to the next level.

      Thank you for your nice comment and valuable suggestion. We have now provided more data about this issue. We found significant suppression of total SIV DNA and integrated SIV DNA provirus in the ART+HSV-sPD1-SIVgag/SIVenv group. However, the copies of the SIV DNA provirus were significantly improved in the ART+HSV-empty group and ART+saline group (Figure 5F-G). We also discussed that incorporating the induction of broadly neutralizing antibodies into our future optimizing approaches may lead to better therapeutic outcomes in the revised Discussion section. We have added the corresponding description in the revised manuscript. Thank you.

      Altogether, all of the above comments and suggestions are very helpful in improving our manuscript. We have taken these comments into account seriously and try our best to address these questions point-by-point. After making extensive revisions, we now submit this revised manuscript for your re-consideration. Thank you again for all of your comments and suggestions.

    1. eLife Assessment

      This useful study reports on the impact of antibiotic pressure on the genomic stability of the mc2155 strain of Mycobacterium smegmatis, a model for Mycobacterium tuberculosis. The findings of the study indicate that exposure to antibiotics did not lead to the development of new adaptive mutations in controlled laboratory environments, challenging the notion that antibiotic resistance arises from drug-induced microevolution. The genomic analysis provides detailed insights into the stability of M. smegmatis following exposure to standard TB treatment antibiotics, and the evidence suggesting that antibiotic pressure does not contribute to the emergence of new adaptive mutations is solid.

    2. Reviewer #1 (Public review):

      Molnar, Suranyi and colleagues have generated a useful dataset characterizing the rate of mutations in Mycobacterium smegmatis - a non-pathogenic model mycobacterial strain, to several antibiotics at sub-lethal dose. The whole genome sequencing approach used is a strength of this study. Overall, the results are consistent with a low rate of mutations, consistent with other reports in Mycobacterium smegmatis and in vitro and clinical studies with Mycobacterium tuberculosis. The data supports phenotypic tolerance rather than genetic mutations as a driver.

      The revised manuscript is improved and addresses several concerns raised by the reviewers from the previous rounds. These relate primarily to the presentation of data in the figures, but there is also new data in Figure 2 to show an increased MIC for M. smegmatis under antibiotic pressure. An additional dataset of sequences from ciprofloxacin-treated bacteria has also been generated and made publicly accessible, which will be of interest to the community.

    3. Reviewer #2 (Public review):

      Summary

      In this study, the authors evaluate the impact of selective pressure from chemotherapeutic drugs on the development of drug resistance in Mycobacteria, specifically through the acquisition of genetic mutations or phenotypic tolerance. Their findings indicate that treatment with sublethal concentrations of first-line antibiotics does not lead to enhanced mutation rates.

      Strengths

      The use of the mutation accumulation assay demonstrating low spontaneous mutation rates combined with the display of an increased MIC supports drug resistance as a consequence of phenotypic tolerance. Additionally, the use of the ciprofloxacin tolerance assay in combination with whole genome sequencing demonstrating a lack of mutations provides further support of this. The results now support the authors claims.

      Weaknesses

      Besides an increase in DNA stress response other underlying tolerance mechanisms were not established - increased efflux pump, thickening of the cell wall, decrease in metabolic processes, rerouting of metabolic processes etc.

    4. Reviewer #3 (Public review):

      Summary:

      This manuscript describes how antibiotics influence genetic stability and survival in Mycobacterium smegmatis. Prolonged treatment with first-line antibiotics did not significantly impact mutation rates. Instead, adaptation to these drugs appears to be mediated by upregulation of DNA repair enzymes. While this study offers robust data, findings remain correlative and fall short of providing mechanistic insights.

      Strengths:

      The strength of this study is the use of genome-wide approaches to address the specific question of whether or not mycobacteria induce mutagenic potential upon antibiotic exposure.

      Comments on revised version:

      The authors responded adequately to my comments, and I have no further suggestions for the revised manuscript.

    5. Author response:

      The following is the authors’ response to the original reviews.

      Reviewer #1 (Public Review):

      In this manuscript, Molnar, Suranyi and colleagues have probed the genomic stability of Mycobacterium smegmatis in response to several anti-tuberculosis drugs as monotherapy and in combination. Unlike the study by Nyinoh and McFaddden http://dx.doi.org/10.1002/ddr.21497 (which should be cited), the authors use a sub-lethal dose of antibiotic. While this is motivated by sound technical considerations, the biological and therapeutic rationale could be further elaborated.

      In the mutation accumulation experiments, we needed to ensure continuous and reproducible growth of a small number of colonies across multiple passages. This technical requirement necessitated the use of sublethal drug concentrations. However, sublethal doses also have biological relevance. Noncompliance with prescribed antibiotic regimens and the presence of antibiotic residues in food due to the extensive use of antibiotics in agricultural mass production are two obvious sources of prolonged exposure to sublethal antibiotics.

      The results the authors obtain are in line with papers examining the genomic mutation rate in vitro and from patient samples in Mycobacterium tuberculosis, in vitro in Mycobacterium smegmatis and in vitro in Mycobacterium tuberculosis (although the study by HL David (PMID: 4991927) is not cited). The results are confirmatory of previous studies.

      The two cited studies, along with several others, did not distinguish between genetic mutations and phenotypic responses to drug exposure (the fluctuation test alone is not suitable for this). Therefore, their objectives are not comparable to ours, which specifically investigated whether resistant colonies carry adaptive mutations. Nevertheless, we acknowledge the relevance of these studies and have now cited them in the appropriate sections in the text.

      It is therefore puzzling why the authors propose the opposite hypothesis in the paper (i.e antibiotic exposure should increase mutation rates) merely to tear it down later. This straw-man style is entirely unnecessary.  

      The phenomenon of stress-inducible mutagenesis in bacterial evolution remains a topic of heated debate. The emergence of genetically encoded resistance may stem from either microevolution or the dissemination of pre-existing variants from polyclonal infections under drug pressure. We believe that the Introduction presents both of these hypotheses in a balanced manner to elucidate the rationale behind our mutation accumulation investigations.  

      The results on the nucleotide pools are interesting, but the statistically significant data is difficult to identify as presented, and therefore the new biological insights are unclear.

      We now indicate statistical significance in the figure, in addition to the detailed statistical analysis of all dNTP measurements provided in Table S5.

      Finally, the authors show that a fluctuation assay generates mutations with higher frequencies that the genetic stability assays, confirming the well-known effect of phenotypic antibiotic resistance.

      What we show is that the fluctuation assay generated bacteria that tolerated the applied antibiotic without developing mutations. Conclusions about mutation rates are often drawn from fluctuation assays without confirming genetic-level changes, a discrepancy that persists despite these assays accounting for both phenotypic and genotypic alterations. By combining genome sequencing with fluctuation assays, our approach emphasizes the importance of distinguishing between these changes. While fluctuation assays remain valuable, inexpensive, and simple tools for evaluating the response of bacterial populations to various selective environments, they should not be considered definitive indicators of genetic changes.

      Recommendations For The Authors:

      The quality of the figures can be significantly improved. In Figure 1, cell lengths can be shown on separate histograms or better still as violin plots to enable better comparisons.

      Thank you for the suggestion. We have revised the data presentation accordingly.

      Details for statistical tests should be provided in the figure legend.  

      Statistical details are now added in the figure legend.

      In Figure 2, the number of data points is not mentioned.

      Statistical information is now added to the new Figure 2, which has been revised extensively based on suggestions from all Referees.

      The data in Figure 3 would be much easier to comprehend as a heatmap.  

      The figure we provided is a color gradient table representing different gene expression levels, along with numerical data and statistical significance indicated within the color boxes, expanding the information content of a traditional heatmap. In response to the Referee's suggestion, we also prepared a hierarchical clustering heatmap, demonstrating that the grouping of rows and columns based on functional information in the original figure is consistent with the clustering pattern observed in the heatmap (Figure S5). As the original figure is more informative and better structured, we have included the new figure in the supplementary materials.

      No statistical tests are provided for Figure 4.

      We now indicate statistical significance in the figure and describe the statistical analysis in the figure legend, as suggested. Additionally, Table S5 is dedicated to the statistical analysis of the dNTP data.  

      Reviewer #2 (Public Review):

      In this study, the authors assess whether selective pressure from drug chemotherapy influences the emergence of drug resistance through the acquisition of genetic mutations or phenotypic tolerance. I commend the authors on their approach of utilizing the mutation accumulation (MA) assay as a means to answer this and whole genome sequencing of clones from the assay convincingly demonstrates low mutation rates in Mycobacteria when exposed to sub-inhibitory concentrations of antibiotics. Also, quantitative PCR highlighted the upregulation of DNA repair genes in Mycobacteria following drug treatment, implying the preservation of genomic integrity via specific repair pathways.

      Even though the findings stem from M. smegmatis exposure to antibiotics under in vitro conditions, this is still relevant in the context of the development of drug resistance so I can see where the authors' train of thought was heading in exploring this. However, I think important experiments to perform to more fully support the conclusion that resistance is largely associated with phenotypic rather than genetic factors would have been to either sequence clones from the ciprofloxacin tolerance assay (to show absence/ minimal genetic mutations) or to have tested the MIC of clones from the MA assay (to show an increase in MIC).

      Thank you for acknowledging the values of the manuscript and for the insightful suggestions for improvement. We agree on the necessity to directly connect the mutation accumulation experiments with the tolerance assay, and we have performed both suggested additional experiments.  

      (1) We repeated the ciprofloxacin tolerance assay (Figure S6) using a large number of plates to gather enough cells for genomic DNA extraction and whole genome sequencing. The sequencing confirmed the absence of mutations in bacteria grown in both 0.3 and 0.5 ug/ml ciprofloxacin. We integrated this result in the revised manuscript text, while the sequencing data are available at the European Nucleotide Archive (ENA) with PRJEB71590 project number.

      (2) We resuscitated three different clones from the MA assays stored at -80°C and tested the MIC of the respective drugs. The results are presented in Figure 2C. Except for EMB, we observed an increase in MIC values across the treatments.

      There seems to be a disconnect between making these conclusions from experiments conducted under different conditions, or perhaps the authors can clarify why this was done.  

      Molecular biology analysis methods are not easily compatible with long-term mutation accumulation experiments, or at least we could not establish the necessary conditions. When DNA or RNA extraction was required, we had to adjust the experimental scale for further analysis, which could be done in liquid culture. We believe that the suggested critical back-and-forth control experiments have significantly improved the comparability of the results.

      With regards to the sub-inhibitory drug concentration applied, there is significant variation in the viability as calculated by CFUs following the different treatments and there is evidence that cell death greatly affects the calculation of mutation rate (PMCID: PMC5966242). For instance, the COMBO treatment led to 6% viability whilst the INH treatment led to 80% cell viability. Are there any adjustments made to take this into account?

      We agree with and have been aware of the notion that cell death affects the calculation of the mutation rate. We included treatment optimization data on agar plates (Table 1 and Figure S2), which now demonstrate that the applied subinhibitory drug concentrations resulted in ≤10% viability across all treatments in the MA assay. This minimizes the potential discrepancy in the mutation rate calculation caused by variable cell death.  

      It would also be useful to the reader to include a supplementary table of the SNPs detected from the lineages of each treatment - to determine if at any point rifampicin treatment led to mutations in rpoB, isoniazid to katG mutations, etc.  

      Overall, while this study is tantalizingly suggestive of phenotypic tolerance playing a leading role in drug resistance (and perhaps genetic mutations a sub-ordinate role) a more substantial link is needed to clarify this.

      The SNPs identified from the lineages of each treatment are compiled in the 'unique_muts.xls' file within the Figshare document bundle that was originally enclosed with the manuscript. In response to your suggestion, we have now added a simplified version of this data set in Table S2, listing the detected SNPs. Notably, no confirmed adaptive mutation developed in our experiments; rifampicin treatment did not result in mutations in rpoB, nor did isoniazid lead to mutations in katG.

      Recommendations For The Authors:

      I would suggest moving Figure 1 to the supplementary - it shows that cell wall targeting drugs cause cell shortening and DNA replication targeting drugs cause cell elongation as would be expected and this is simply a secondary observation, not one that is central to the paper.  

      We agree that this is not a novel or unexpected observation. However, we used it as an indicator of drug effectiveness, particularly for bacteriostatic cell wall-targeting drugs in liquid culture that induced moderate cell death. Following Reviewer 1's suggestions, we extensively revised the figure to better convey our intended message. We believe the updated version now more clearly demonstrates the drugs' impact, and for this reason, we have opted to keep it in the main text.

      Figure 2 and Table 2 show the same data so this can be combined as a paneled figure or one moved to the supplementary. It would be useful to include a diagram of how the MA assay was conducted, similar to the CIP tolerance assay figure.

      Thank you for the suggestions. We have added a diagram to Figure 2 explaining the MA assay (Figure 2A), as well as the MIC experiment conducted on the MA cells (Figure 2C). To avoid redundancy, Table 2 has been removed.

      Reviewer #3 (Public Review):

      Summary:

      This manuscript describes how antibiotics influence genetic stability and survival in Mycobacterium smegmatis. Prolonged treatment with first-line antibiotics did not significantly impact mutation rates. Instead, adaptation to these drugs appears to be mediated by upregulation of DNA repair enzymes. While this study offers robust data, findings remain correlative and fall short of providing mechanistic insights.

      Strengths:

      The strength of this study is the use of genome-wide approaches to address the specific question of whether or not mycobacteria induce mutagenic potential upon antibiotic exposure.

      Weaknesses:

      The authors suggest that the upregulation of DNA repair enzymes ensures a low mutation rate under drug pressure. However, this suggestion is based on correlative data, and there is no mechanistic validation of their speculations in this study.

      Furthermore, as detailed below, some of the statements made by the authors are not substantiated by the data presented in the manuscript.

      Finally, some clarifications are needed for the methodologies employed in this study. Most importantly, reduced colony growth should be demonstrated on agar plates to indicate that the drug concentrations calculated from liquid culture growth can be applied to agar surface growth. Without such validations, the lack of induced mutation could simply be due to the fact that the drug concentrations used in this study were insufficient.

      Thank you for appreciating the manuscript's merits and for the instructive suggestions. We agree that demonstrating reduced colony growth on agar plates is important to validate the relevance of the drug concentrations used in the study. In response, we have added the treatment optimization data on agar plates in Figure S2 and reorganized Table 1 to show the decrease in CFU achieved with the applied subinhibitory drug concentrations.

      We acknowledge that the observed upregulation of DNA repair enzymes and the low mutation rates under drug pressure represent correlative data. We removed the reference to mechanism from the abstract and avoided presenting the qPCR results as a mechanistic explanation in the text. We have only raised the possibility that correlation could be a causal relationship: "The observed upregulation of the relevant DNA repair enzymes might account for the low mutation rate even under drug pressure." We recognize the necessity for a new series of targeted experiments to provide mechanistic explanations. We added the following text to the Discussion:

      “The observed activation of DNA repair processes likely mitigates mutation pressure, ensuring genome stability. However, to confirm this hypothesis, these investigations should be conducted using genetically modified DNA repair mutant strains.”

      In the current manuscript, we aim to convincingly demonstrate that long-term antibiotic pressure did not induce the occurrence of new adaptive mutations.

      Recommendations For The Authors:

      Additional specific comments are:

      Page 2. Do not italicize "Mycobacteria", which is not considered a scientific name.

      Corrected.

      Page 4. "Bacto pepcone" is a typo.

      Corrected.

      Page 6. "Quiagen" is a typo.

      Corrected.

      Page 9. In Table 1, RIF being described as a protein synthesis inhibitor is misleading.

      Corrected.

      Page 9. The statement "Specifically, following RIF, CIP, and MMC treatments, we observed cells elongating by more than twofold, whereas INH and EMB treatments led to a reduction in cell length." cannot be justified by Figure 1, as the cell length information is not conveyed in this figure.

      Thank you for pointing this out, the revised Figure 1 conveys the cell length information.

      Page 10. If the experiment shown in Figure S1 was done in an acidic growth condition, the figure legend should clearly indicate the fact. Additionally, the assay condition should be described in detail in the Methods section.

      Thank you, the required information is now included in both the figure legend and the Methods section.

      Page 10. If PZA does not work against M. smegmatis, it seems pointless to add it to the COMBO treatment. Please clarify why it was included in the drug combination experiment.

      We added the following text to clarify the use of PZA: “Regardless of its inefficacy as a monotherapy, we included PZA in the combination treatment, as we could not rule out the possibility that PZA interacts with the other three drugs or that PZA elimination mechanisms are equally active in M. smegmatis under this regimen.”

      Page 10. Generation times calculated from liquid culture cannot be applied to colony growth on an agar plate. The growth behaviors on a solid surface will be totally different from planktonic suspension growth. The numbers of generations indicated here will be inaccurate.

      You are absolutely right. We conducted an experiment to calculate the number of generations on plates under the same conditions as used in the MA assay. We found, indeed, a different (doubled) generation time from what was determined in liquid culture. We have adjusted the mutation rates accordingly.

      Page 12. Was the experiment shown in Figure 3 done in a liquid culture? If so, the transcriptional profile could be different from the experiment shown in Figure 2, which was done on an agar plate.

      Yes, the experiment shown in Figure 3 was conducted in liquid culture. We acknowledge that the transcriptional profile could differ from the experiment shown in Figure 2, which was performed on an agar plate. However, technical limitations required us to use liquid cultures for these experiments.

      Page 14. Regarding the statement "INH and EMB coincided with a decreased concentration of these [dCTP and dTTP] nucleotides", by examining Table S5, I do not see any statistical reductions in dCTP and dTTP levels.

      Thank you for bringing this to our attention. We have made the necessary corrections to ensure that the text and data are now aligned.

      Page 14. Similarly to the comment above, the statement "RIF, CIP and MMC treatments promoted an increase in the dCTP and dTTP pools" is misleading as each drug seems to increase either dCTP or dTTP, not both.

      Same as above.

      Page 14. The authors state, "a larger overall dNTP pool size coincides with a larger cell size and vice versa (Figure 4H)". Please indicate the unit of the pool size for the graph shown in Figure 4H. According to the legend, I assume that it refers to the concentration. The term "pool size" may be misleading as it implies quantity rather than concentration.

      Page 15. Figure 4H is impossible to understand. The left y-axis label looks as if it is a ratio of cell length to volume. There is no point in having these three data on a single graph. Please separate them into individual graphs. Also, what is the spacing between the tick marks? The data also seem inconsistent with the values given in Table S1. For example, the mean volume of COMBO is larger than the control (according to Table S1), and yet the graph in Figure 4H indicates that COMBO's relative length is less than 1.

      Thank you for your feedback. We have corrected these and created what we hope is a clearer figure.

      Figure S1. Clarify what the gray shade in the graph represents.

      The gray shade was unnecessary, so we removed it when recoloring the figure to ensure a more coherent color scheme across the different treatments.

      Figure S1. Relative viability cannot be determined by OD600. CFU needs to be determined to assess cell viability.

      Thank you. We changed the incorrect term viability to growth inhibition.

    1. eLife Assessment

      Yamamoto and Matano provide convincing evidence that a G63E CD8+ T-cell escape mutation in the accessory viral protein Nef facilitates the induction of neutralizing antibody (nAb) responses in rhesus macaques infected with SIVmac239. Functional analyses support that this mutation specifically impairs Nef`s ability to stimulate PI3K/Akt/mTORC2 signalling. This important study suggests that the accessory viral Nef protein impairs B cell function and effective humoral immune responses and is of interest for researchers and physicians interested in HIV/AIDS and vaccine development.

    2. Reviewer #1 (Public review):

      Human and simian immunodeficiency viruses (HIV and SIV, respectively) evolved numerous mechanisms to compromise effective immune responses but the underlying mechanisms remain incompletely understood. Here, Yamamoto and Matano examined the humoral immune response in a large number of rhesus macaques infected with the difficult-to-neutralize SIVmac239 strain and identified a subgroup of animals showing significant neutralizing Ab responses. Sequence analyses revealed that in most of these animals (7/9) but only a minority in the control group (2/19) SIVmac variants containing a CD8+ T-cell escape mutation of G63E/R in the viral Nef gene emerged. Functional analyses revealed that this change attenuates the ability of Nef to stimulate PI3K/Akt/mTORC2 signalling. The authors propose that this improved induction of SIVmac239 nAb is reciprocal to antibody dysregulation caused by a previously identified human PI3K gain-of-function mutation associated with impaired anti-viral B-cell responses. Altogether, the results suggest that PI3K signalling plays a role in B-cell maturation and generation of effective nAb responses. Preliminary data indicate that Nef might be transferred from infected T cells to B cells by direct contact. However, the exact mechanism and the relevance for vaccine development requires further studies

      Strengths of the study are that the authors analyzed a large number of SIVmac-infected macaques to unravel the biological significance of the known effect of the interaction of Nef with PI3K/Akt/mTORC2 signaling. This is interesting and may provide a novel means to improve humoral immune responses to HIV. In the revised version the authors made an effort to address previous concerns. Especially, they provide data supporting that Nef might be transferred to B cells by direct cell-cell contact. In addition, the provide some evidence that G63R that also emerged in most animals does not share the disruptive effect of G63G although experimental examination and discussion why G63R might emerge remains poor. Another weakness that remains is that some effects of the G63E mutation are modest and effects were not compared to SIVmac constructs lacking Nef entirely. The evidence for a role of Nef G63E mutation on PI3K and the association with improved nAb responses was largely convincing and it is appreciated that the authors provide additional evidence for a potential impact of "soluble" Nef on neighboring B cells. However, the experimental set-up and the results are difficult to comprehend. It seems that direct cell-cell contact is required and membranes are exchanged. Since Nef is associated with cellular membranes this might lead to some transfer of Nef to B cells. However, the immunological and functional consequences of this remain largely elusive. Alternatively, Nef-mediated manipulation of helper CD4 T cells might also impact B cell function and effective humoral immune responses. As previously noted, the presentation of the results and conclusions was in part very convoluted and difficult to comprehend. While the authors made attempts to improve the writing parts of the manuscript are still challenging to follow. This applies even more to the rebuttal (complex words combined with poor grammar), which made it difficult to assess which concerns have been satisfactory addressed.

    3. Author response:

      The following is the authors’ response to the original reviews.

      Reviewer #1 (Public Review):

      This work describes the induction of SIV-specific NAb responses in rhesus macaques infected with SIVmac239, a neutralization-resistant virus. Typically, host NAb responses are not detected in animals infected with SIVmac239. In this work, seventy SIVmac239-infected macaques were retrospectively screened for NAb responses and a subset of nine animals were identified as NAb-inducers. The viral genomes from 7/9 animals that induced NAb responses were found to encode nonsynonymous mutation in the Nef gene (amino acid G63E). In contrast, Nef G63E mutation was found only in 2/19 NAb non-inducers - implicating that the Nef G63E mutation is selected in NAb inducers. Measurement of Nef G63E frequencies in plasma viruses suggested that Nef G63E selection preceded NAb induction. Nef G63E mutation was found to mediate escape from Nef-specific CD8+ T-cell responses. To examine the functional phenotype of Nef G63E mutant, its effect on downmodulation of Nef-interacting host proteins was examined. Infection of rhesus and cynomolgus macaque CD4+ T cell lines with WT or Nef G63E mutant SIV suggested that Nef mutant reduces S473 phosphorylation of AKT. Using flow cytometry-based proximity ligation assay, it was shown that Nef G63E mutation reduced binding of Nef to PI3K p85/p110 and mTORC2 GβL/mLST8 and MTOR components - kinase complex responsible AKT-S473 phosphorylation. In vitro B-cell Nef invasion and in vivo imaging/flow cytometry-based assays were employed to suggest that Nef from infected cells can target Env-specific B cells. Lastly, it was determined that NAb inducers have significantly higher Env-specific B-cells responses after Nef G63E selection when compared to NAb non-inducers. Finally, a corollary was drawn between the Nef G63E-associated B-cell/NAb induction phenotype and activated PI3K delta syndrome (APDS), which is caused by activating GOF mutations in PI3K, to suggest that Nef G63E-meidated induction of NAb response is reciprocal to APDS.

      Strengths:

      This study aims to understand the viral-host interaction that governs NAb induction in SIVmac239-infected macaques - this could enable identification of determinants important for induction of NAb responses against hard-to-neutralize tier-2/3 HIV variants. The finding that SIV-specific B-cell responses are induced following Nef G63E CD8+ T-cell escape mutant selection argue for an evolutionary trade-off between CTL escape and NAb induction. Exploitation of such a cellular-humoral immune axis could be important for HIV/AIDS vaccine efforts.

      Although more validation and mechanistic basis are needed, the corollary between PI3K hyperactive signaling during autoimmune disorders and Nef-mediated abrogated PI3K signaling could help identify novel targets and modalities for targeting immune disorders and viral infections.

      We are grateful for the supportive and insightful comments. The work did seem to unintendedly highlight a conceptual link between extrinsic and intrinsic immune perturbations. We will keep working on both wings, aiming to evoke synergisms.

      Weaknesses:

      Although the paper does have strengths in principle, the weaknesses of the paper are that the mechanistic basis of Nef-mediated induction of NAb responses are not directly examined. For example, it remains unclear whether SIVmac239 with engineered G63E mutation in Nef would induce faster and potent NAb responses. A macaque challenge study is needed to address this point.

      We appreciate the point. We do have certain difficulties in availability of macaques for de novo experiments. As partially discussed in ver1, the identified Nef phenotype selected post-acute infection confers an enhanced CD4+ T cell-killing effect (revised Fig 4F), and it is likely that de novo infection with the mutant would redirect the trajectory of infection to rapid disease/AIDS progression accompanying generalized immune failure by boosting acute-phase CD4 destruction. In other words, mutant de novo infection may not necessarily be directly discussable as an attempt for reconstitution. It appears equally critical to understand the mutant in vitro on an immunosignaling basis, and in the current work we have focused on depicting this as the first step. We will work on reconstitution experiments with emphasis on pharmacology in our future study.

      As presented, the central premise of the paper involves infected cell-generated Nef (WT or G63E mutant) being targeted to adjacent Env-specific B cells. However, it remains unclear how this is transfer takes place. A direct evidence demonstrating CD4+ T cell-associated and/or cell-free Nef being transferred to B-cell is needed to address this concern.

      We appreciate the point, also pointed out by Reviewers 2 and 3. We have performed three sets of in vitro reconstitution experiments graphically/functionally addressing how Nef transfer from CD4+ T cells to B cells can be modulated (new Fig 6) and edited text accordingly.

      The interaction between Nef and PI3K signaling components (p85, p110, GβL/mLST8, and MTOR) has been explored using PLA assay, however, this requires validation using additional biochemical and/or immunoprecipitation-based approaches. For example, is Nef (WT or mutant form) sufficient to affect PI3K-induced phosphorylation of Akt in an in vitro kinase assay? Moreover, the details regarding the binding events of WT vs mutant Nef with PI3K signaling components is lacking in this study. Lastly, it is unclear whether the interaction of Nef with PI3K signaling components is a conserved function of all primate lentiviruses or is this SIV-specific phenotype.

      We appreciate the point. Co-immunoprecipitation analysis via pulldown with the mTORC2-intrinsic cofactor Sin1 (revised Fig 4E), showing decreased G63E-Nef binding, should confer robustness to the statement combined with initial manipulation results (Fig 4C). As Sin1 is mTORC2- and not mTORC1-intrinsic, results should be strengthened. Phosflow may be a standard readout nowadays for pAkt itself. Related with sequence variation, conservation will be addressed in studies ahead. We concisely mentioned on this in the revision (Lines 390-391).

      It has been previously reported that the region of Nef encoding glycine at position 63 is not conserved in HIV-1 (Schindler et al, Journal of Virology 2004). Thus, does HIV-1 Nef also function in induction of NAb responses in humans? or the observed phenotype specific to SIV?

      We appreciate the point, and do not have an answer at the moment. We will explore in our HIV-1-infected patient cohort (Hau et al, AIDS 2022) and other occasions whether corresponding phenotypes may exist. We have mentioned on this point in the revised manuscript (Line 392-393).

      Reviewer #2 (Public Review):

      It is well known that human and simian immunodeficiency viruses (HIV and SIV, respectively) evolved numerous mechanisms to compromise effective immune responses but the underlying mechanisms remain incompletely understood. Here, Yamamoto and Matano examined the humoral immune response in a large number of rhesus macaques infected with the difficult-to-neutralize SIVmac239 strain. They identified a subgroup of animals that showed significant neutralizing Ab responses. Sequence analyses revealed that in most of these animals (7/9) but only a minority in the control group (2/19) SIVmac variants containing a CD8+ T-cell escape mutation of G63E/R in the viral Nef gene emerged. They further show that this change attenuates the ability of Nef to stimulate PI3K/Akt/mTORC2 signaling. The authors propose that this induction of SIVmac239 nAb induction is reciprocal to antibody dysregulation caused by a previously identified human PI3K gain-of-function (Ref). Altogether, the results suggest that PI3K signaling plays a key role in B-cell maturation and generation of effective nAb responses.

      Strengths of the study are that the authors analyzed a large number of SIVmac-infected macaques to unravel the biological significance of the known effect of the interaction of Nef with PI3K/Akt/mTORC2 signaling. This is interesting and may provide a novel means to improve humoral immune responses to HIV. Weaknesses are that only G63E and not G63R that also emerged in most animals was examined in most functional assays. Some effects of the G63E mutation seem modest and comparison to a grossly nef-defective SIVmac construct would be desirable to better assess to impact of the mutation of Nef-mediated stimulation of PI3K. While the impact of this Nef mutations on PI3K and the association with improved nAb responses is largely convincing, the results on the potential impact of soluble Nef on neighboring B cells is much less clear. SIVmac239 infects and manipulates helper CD4 T cells and these are essential for the activation and differentiation of B cells into antibody-producing plasma cells and effective humoral immune responses. Without additional functional evidence that Nef indeed specifically targets and manipulated B cells these results and conclusions should be made with much greater caution. Finally, the presentation of the results and conclusions is partly very convoluted and difficult to comprehend. Editing to improve clarity is highly recommended.

      We are very grateful for the supportive and visionary review and suggestions. Experiments have been performed to improve the points raised. This work inevitably involved interdisciplinary factors to even hit on the schematic (NAbs, B cells, CD4+T, CD8+T, viral escape, immunosignaling, IEI as extrapolation & microscopy implementations) and convoluted sections should have existed. We attempted streamlining of certain portions and edited writing throughout, and hope that it became more straightforward.

      Reviewer #2 (Recommendations For The Authors):

      As outlined in the public review, I found the results potentially very interesting but parts of the manuscript much more complex and confusing than necessary. In addition, the methods on the potential impact of soluble Nef on neighboring B cells in vivo was difficult to assess but altogether this part was not convincing. Have the following specific suggestions:

      We are very grateful for the scholarly review, and encouraging and suggestive comments on this orphan work. In the revision we designed experiments to address the properties of Nef transfer to append understanding on the in vivo B-cell data. Recommendations have been addressed as follows.

      (1) Title: "AIDS virus-neutralizing antibody induction reciprocal to a PI3K gain-of-function disease". Think this title hardly reflects the data; SIVmac cause simian AIDS and is not the "AIDS virus" the 2nd part is more appropriate for discussion than for the title (and the abstract).

      We appreciate the point. The original intent of the title was to conceptually bridge two differing fields of virus-host interaction and inborn errors of immunity/immunosignaling on an original article basis. Certain papers (Mudd et al, Nature 2012 etc) do utilize the term AIDS virus, and we similarly chose the term for simplification to non-virologists at initial submission.

      That being said, we understand the scholarly point raised, and feel that the initial aim can be well attained by retaining the key host effector PI3K in the title, as in the revised submission titled “SIV-specific neutralizing antibody induction following selection of a PI3K drive-attenuated nef variant”.

      (2) Abstract and throughout: As the authors show, SIVmac is not generally "neutralization resistant"; difficult to neutralize is more appropriate and should be used throughout. Also, the abstract and other parts are more complicated than necessary.

      We appreciate the point. HIV/SIV Env immunology work utilizes “neutralization-resistant” for SIVmac239 (e.g., Mason et al, PLoS Pathog 2016), and autologous titer positivity of ~10% at this size of examination does appear low amongst lentiviruses. Nevertheless, as recommended, “difficult-to-neutralize” better describes the nature, and we have switched the term accordingly.

      Linked with title modification, we reflected the comment on abstract structure and switched the main introductory sentence (Here we…) to a more data-based one instead of depicting extrapolation, and have modified phrasings in the latter half.

      (3) The intro seems a bit biased. Immune evasion due to mutations and proviral integration that play key roles in viral persistence are not mentioned. nAbs are not known to efficiently control HIV or SIV replication in vivo (not even in the present study). Thus, a more "balanced" presentation of the role of nAbs in vivo is desirable.

      We agree with the comment. Introduction in ver1 submission was compressed to just display humoral immune perturbation examples across persistence-prone viral infections, and indeed it should be much better to layout the multiscale strategies of lentiviruses in manifesting viral persistence. We have appended two sets of texts, one on the fundamental integrating retroviral life cycle and another on the wide spectrum of accessory protein-driven perturbation. As pointed out, the current endogenous induction is of course not early enough to exert suppressive impact on replication as like in exogenous Ab passive infusions. We have accordingly modulated text to improve the balance.

      (4) Lines 73-76: rephrase for clarity.

      We acknowledge the comment and have rephrased accordingly.

      (5) Line 92: "linked with sustained Env-specific B-cell responses after the mutant Nef selection". After or during in one case; the time frame varies enormously and this should be discussed.

      We appreciate the comment. The six Nef-G63E mutant-selecting NAb inducers subjected to B-cell analysis were the ones that showed precedence in Fig 2D (mutant before induction). That being said, we modified text as suggested (Line 104 in revised uploaded text). Text related to temporal deviation has been appended (Lines 378-383 in revised uploaded text).

      (6) The authors should discuss G63R and include it in the functional analyses.

      We appreciate the comment. Discussion on Nef-G63R in ver1 submission was kept minimal because statistical significance for selection was marginal. We generated a Nef-G63R mutant and results are appended in Fig 4-Figure Supplement 2.

      (7) Lines 124/5: conservation only applies to SIVsmm/mac Nefs and this region is also frequently deleted/length-variable in primary HIV-1 Nefs.

      We appreciate the comment. We modified description of the region accordingly (Lines 139-141 in revised text).

      (8) Lines 153-155: Statement doesn't seem to make sense. The triple mutant Nef SIVmac construct was not attenuated for replication but specifically disrupted in CD3 down-modulation.

      We acknowledge the comment. It had meant that the consequent plasma viral load showed a trend of decrease (as in the Graphical Abstract of the work) which should (in a simplistic view) influence antigenicity for humoral immune responses. Yet it is very true that virological replicative capacity was comparable with wild-type as in Fig.1. We have taken down the related text and rephrased it (Ref remains cited in introduction).

      (9) Lines 178/9: levels in PI3K gain-of-function mice "with full disease phenotype (Avery et al., 2018)". This needs more information, e.g. what disease exactly are they talking about?

      We are grateful for the correction, and have appended text and introduced the mentioned congenital disease in the Introduction section in advance. In-detail description is also appended in the Discussion section.

      (10) Lines 186/7: "Env-stimulating high-MOI infection also accelerated phenotype appearance, with enhanced 50% reduction (Figure 4C, right)". Modify text and corresponding figure for clarity.

      We acknowledge the comment. We revised as: “A high-MOI SIV infection, comprising higher initial concentration of extracellular Env stimuli, also accelerated phenotype appearance from day 3 to day 1 post-infection with stronger pAkt reduction”.

      (11) The validity of the results described in the section "Targeting of lymph node Env-specific B cells by Nef in vivo" was difficult to assess. Altogether, however, I didn't find them convincing, especially since a negative control (e.g. macaques infected with nef-deleted SIVmac) are missing.

      We acknowledge the comment. As a pure experimental control, whole-Nef deletion may assist for subtracted baselines. Within this work, the staining per se at least should be highly specific (mAb multiply verified in other applications and cytometry panel also designed for minimal spillover into AF488 channel). On in vivo basis, direct comparison may be somewhat frustrated by the fact that reduction in other pleiotropic effects of Nef seem to more dominate upon Nef deletion, as a set of reduced viremia, robust CD8 responses, killer CD4 responses and increased binding Ab titers (Johnson et al, J Virol 1997, Gauduin et al, J Exp Med 2006, Fukazawa et al, Nat Med 2012, Adnan et al, PLoS Pathog 2016 etc) leading to altered trajectory. We promise that we will work on refinement of the methodology in studies ahead.

      (12) Lines 309-319: This paragraph made little sense to me (as did lines 328-331).

      We acknowledge the comment and have edited both sections.

      Reviewer #3 (Additional Reviewer):

      In this manuscript, Hiroyuki Yamamoto et al examined virus-specific antibody responses and identified a subgroup of nine individuals, out of seventy SIVmac239 rhesus macaques of Burmese origin infected with SIVmac239, that develop neutralizing antibodies (NAb). The authors propose the emergence of a nef mutant (Nef-G63E) that impacts on B cell maturation resulting in PI3K gain-of-function.

      My major concerns are:

      The authors by different aspect addressed the role of the emergence of Nef-G63E mutant in individuals developing NAb. The manuscript is confused and the rational not always clearly stated. This reflects the two aspects of the manuscript (i) NAb identification in a subgroup of macaque and (2) the identification this nef mutation.

      We are grateful for the comprehensive and scholarly comments. As pointed out, the work did need to confront potential bifurcation of the influence of the obtained viral immunosignaling phenotype for CD4-intrinsic (which might be your specialty) and B-cell-intrinsic impact. Based on your suggestions we have acquired additional data and revised the manuscript as attached.

      The authors used both males (n=57) and females (n=13). However, there is no indication related to the sex regarding NAb inducers versus non-NAb Inducers. The notion of "highly pathogenic" is certainly not correct (see the introduction). Pathogenicity is also depending on monkey origin. Thus, cynomolgus are less sensitive to SIVmac239 or SIVmac251 compared to rhesus macaques (Ling B Aids 2002; Reimann KA, J Virol 2005; Cumont MC, J Virol 2008), or to pigtails used in US. Indeed, the authors used Burmese macaques, and therefore the dynamics of pathogenicity is different to rhesus macaque (Indian origin) housed in US. How many animals have been sacrificed out of the 61 animals? Herein, the animals are surviving longer (more than one year), and therefore the notion of "highly pathogenic" merits to be modulated.

      We appreciate the comment. We have accordingly appended sex information (M/F: 8/1 versus 49/12 in NAb inducers vs non-inducers, p > 0.99 by Fisher’s exact test) in the methods section. As pointed out there are differences in the frequency and rate of AIDS progression among macaques of differing origin, whereas we have also previously reported reproducible AIDS progression dependent on MHC-I genotypes in the Burmese rhesus macaques utilized (Nomura, Yamamoto et al., J Virol 2012). Adhering to advice, we have attenuated the term to “pathogenic” in the revised manuscript and appended one reference showing pathogenesis gradation from a cell-death perspective (Cumont 2008).

      Furthermore, no indication is provided regarding CD4 T cell dynamics, or CD8 T cells. In particular, the extent of T cell immunodeficiency may compromise humoral response. Therefore, this data needs to be shown. Indeed, previous reports have indicated that early CD4 T cell depletion is associated with defective humoral response. Furthermore, Tfh cell depletion was reported in several immune tissues, which are essential for B cell immune response like the spleen. Thus, this should be discussed as an alternative mechanism to the absence of NAb. Indeed, the authors found higher and persistent env-specific plasmablast cells in NAb inducers than that observed in non-NAb inducers figure 6. Why to have selected twelve individuals out of 61 individuals for assessing anti-env response (Supplemental S3 for figure 1, panel 1), and only eleven for western blots. The explanation in the text is absent. This requires to be clearly stated. See lines 108-110.

      We appreciate the comment. As in other sections, this study utilized available cryopreserved samples from a retrospective cohort, also having heterogeneity in data acquisition along the way. We acknowledge that some supplemental data are particularly limited in information, which is also a reason they are presented in SI. We felt that one important core was to secure samples for Nef-G63E-selecting NAb inducers versus viremic non-inducers, for which we acquired six versus twelve in the B-cell analysis.

      We (Nakane et al, PLoS ONE 2013) and others (Hirsch et al, J Virol 2004) have already reported on western blotting-basis that SIV-infected rapid progressors tend to manifest serological failure (impaired binding Ab-WB bands). Therefore, to compare quantitative traits at this basal stage (Fig 1), we judged that NAb inducer comparison with more non-rapid-progressing (>60 wk survival) non-inducers would be a criterion. We have mentioned on this in the revised manuscript (results/methods). Additionally, we have replaced the immunoblotting result with one more non-inducer (n = 12) to enhance results. Please note that there are lot deviations in strip-coated antigen (e.g., gp160) but the result is comparable (now covers 12/13 of animals with >60-wk survival).

      The authors indicated the frequencies of Nef-G63E mutant in figure 2 panel C. However. no information is indicated in the legend about the number of NAb non-inducers used to calculate this frequency. The authors indicated line 127, "only in two of the nineteen NAb non-inducers, including one rapid progressor". Thus, different numbers of individuals are used through the manuscript. For the readers, this is clearly a statement that needs to be clarify and to refer to what. This is not homogeneous along the text and the analyses performed.

      We appreciate the comment, and have appended the number in the revised Fig 2C. As aforementioned, heterogeneity of sample number in different sections is indeed a limitation of the work, and have mentioned this in the Discussion.

      The rational related to the sentence lines 140-142. Please clarify.. "NAb induction is not associated with these MHC-I genotypes (P = 0.25 by Fisher's exact test, data not shown) but with the Nef-G63E mutation itself".

      We appreciate the comment. We have rephrased it as:

      “Ten of nineteen NAb non-inducers also had either of these alleles (Figure 1-figure supplement 1). This did not significantly differ with the NAb inducer group (P = 0.25 by Fisher’s exact test, data not shown), indicating that NAb induction was not simply linked with possession of these MHC-I genotypes but instead required furthermore specific selection of the Nef-G63E mutation.” (Lines 159-162).

      In supplemental figure 3, only 7 individuals have been tested, while the authors indicated "Ten of nineteen NAb non-inducers also had either of these alleles". Why only seven? In NAb Burmese monkeys, the authors indicate specific T cells capable to recognize WT nef peptide, but not G63E peptide mutant. Thus, nef is immunogenic in vivo generating T cells despite to be mutated.

      In contrary, non-NAb-inducers demonstrate the absence of nef specific T cells (supplemental figure 3, excepted R01-011 panel A). Although, the authors propose an escape mutant for CD8 T cells, this is not associated with the absence of immunogenicity and not with a difference in viral load in comparison to NAb inducers (panel C). Therefore, the conclusions merit to be revised. Thus, this part of the manuscript is confusing. Please clarify the rational to link NAb and Nef specific CD8 T cells.

      We appreciate the comment. 7 out of 8 non-inducers positive for the allele and not selecting for the Nef-G63E mutant was available for analysis. The relative contribution of this single Nef62-70 epitope-specific CTL response is speculated not to be largely impacting viral control, among the many induced. This is basally discussed in a previous paper (Nomura, Yamamoto et al., J Virol 2012), more suggestive of an MHC-I haplotype-level correlation with plasma viral load. We assume that the CTL pressure-driven selection of Nef-G63E mutant was a rather pure immunosignaling trigger under persistent viremia. We appended this in the revised text (Line 172).

      In the next part of the manuscript, the authors assessed the function of this Nef-G63E mutant. The rational to introduce Ferritin in this part of the document is not clear for the reader. Furthermore, a subgroup for each (NAb+ versus NAb-) is shown: 4 for NAbneg versus 6 for NAbpos.

      We appreciate the point. As introduced, Swingler et al Cell Host Microbe 2008 reported HIV-infected macrophage-derived ferritin as a potentially B cell-disrupting factor. In that paper, viral load, ferritin and binding antibody titers positively correlated. Current data shows that SIVmac239-specific NAb induction is distinct from such kinetics already versus viral load (Fig 3-Supplement 1C), and ferritin levels were measured for some available samples more simply for confirmation. We appended three more available samples in the NAb- group. (The six NAb+/G63E animals correspond to the ones with B-cell data in Figure 7.) Statistical results appear unaffected and robust, as shown in this version. The revised manuscript incorporates appended explanation for the former.

      Similarly, whereas the authors observed a role of nef mutant on pAkt Ser473 (less induced) in comparison to WT, the authors suggest that this may have an impact on T cell survival.

      We appreciate the point. In the first submission we obtained peripheral memory Tfh decrease, whereas it is true that this is indirect. In the current revision we have addressed apoptotic cell death, shown to increase with Nef-G63E mutation (Figure 4F).

      The rational to analyze CXCR3-CXCR5+PD-1+ memory follicular Th (Tfh) is not clear. Moreover, the references used are not the adequately cited. Indeed, these papers show an expansion. See the literature for a depletion (Xu H, J Immunol. 2015; Moukambi F, PLoS Pathog. 2015; Yamamoto T, Sci Transl Med. 2015; Xu H, J Immunol. 2018 Moukambi F, Mucosal Immunol. 2019).

      We appreciate these points on in vivo CD4+ T cells.

      Peripheral memory Tfh was reported to correlate with Ab cross-reactivity in one human cohort (Locci et al, Immunity 2013) and we concisely examined the subset in the current NAb induction. We mentioned this in the revised manuscript.

      Moukambi F et al, PLoS Pathog 2015 & Mucosal Immunol 2019 are demonstrative work on acute-phase destruction. We have cited non-neonatal/vaccine-related ones suggested, including these two, in the revised manuscript. The biphasic dysregulation of Th (acute-phase destruction and chronic-phase adverse hyper-expansion) may indeed have a unique role with the current phenotype, which is beyond aim of the current analysis. We have concisely mentioned on this in the Discussion.

      Then, the authors assess the potential B-cell-intrinsic influence of the G63E-Nef phenotype. The rational here is clearly indicated, making sense with figure 1. Furthermore, this part is clearer. The dot-plots merit to be revised and the markers used better stated. The authors indicate that Nef invasion upregulates pAkt Ser473 assuming aberrant PI3K/mTORC2 signaling. What is the impact of Nef-G63E mutant on pAkt Ser473 using in vitro model of transfer. This is not addressed for comparison.

      We appreciate the remarks/suggestions, also pointed out by Reviewers 1 and 2. We have performed three sets of in vitro reconstitution experiments visually and functionally addressing how Nef transfer to B cells can be modulated (new Fig 6), and edited text accordingly.

      Minor points are:

      - the presence of references in the legend.

      -some Ab clones are in the table, however they are not used such CD38 and CD138, which are well known to be non-valid B cell markers for monkeys."

      We appreciate the suggestions.

      Mentioning on reference have been removed from the legend (Fig.1, Fig. 3) and moved to the corresponding Methods section (Fig. 1).

      We also understood this well in advance (CD38/CD138), and incorporated them in the memory B-cell panel just to check whether they ever behave in a specific pattern. As expected, no notable behavior was observed in these NAb inducers.

    1. eLife Assessment

      This important study presents a significant methodological advance by leveraging previously discarded, unmapped DNA sequence reads to estimate pest infestation loads across plant accessions, and map variation in these apparent pest loads to defense genes. The bioinformatics approach is compelling, and the results should bear broad implications for phenotype-genotype prediction, especially regarding the use of unmapped reads for GWAS.

    1. eLife Assessment

      This important study examines the effects of NFKB2 mutations on pituitary gland development through hypothalamic-pituitary organoids. The evidence supporting the main conclusions is solid, although analysis of additional clones to exclude inter-clone variability would strengthen the conclusions. This is a revised study, but insight into the mechanism of action of NFKB2 during pituitary development is incomplete. This work will be of interest to endocrinologists and biologists working on pituitary gland development and disease.

    2. Reviewer #1 (Public review):

      Summary:

      NFKB mutations are thought to be one of the causes of pituitary dysfunction, but until now they could not be reproduced in mice and their pathomechanism was unknown. The authors used the differentiation of hypothalamic-pituitary organoids from human pluripotent stem cells to recapitulate the disease in human iPS cells carrying the NFKB mutation.

      Strengths:

      The authors achieved their primary goal of recapitulating the disease in human cells. In particular, the differentiation of the pituitary gland is closely linked to the adjacent hypothalamus in embryology, and the authors have again shown that this method is useful when the hypothalamus is suspected to be involved in pituitary abnormalities caused by genetic mutations.

      Weaknesses:

      On the other hand, the pathomechanism is still not fully understood. This study provides some clues to the pathomechanism, but further analysis of NFKB expression and experiments investigating the relevant factors in more detail may help to clarify it further.<br /> As for the revised manuscript, it is still insufficient for understanding the role of NFKB2 in pituitary development although their additional experiments have improved the manuscript. The strength of the hypothalamus-pituitary organoid lies in its ability to recapitulate the differentiation process including not only the pituitary cells but also neighbouring non-pituitary cells, such as hypothalamic cells in vitro. It is necessary to determine "at which stages" and "in which localizations" NFKB2 expression is critical for pituitary development.

    3. Reviewer #2 (Public review):

      Summary:

      DAVID syndrome is a rare autosomal dominant disorder characterized by variable immune dysfunction and variable ACTH deficiency. Nine different families have been reported, and all have heterozygous mutations in NFKB2. The mechanism of NFKB2 action in the immune systems has been well-studied, but nothing is known about its role in pituitary gland.

      The DAVID mutations cluster in the C-terminus of the NFKB2 and interfere with cleavage and nuclear translocation. The mutations are likely dominant negative, by affecting dimer function. ACTH deficiency can be life-threatening in neonates and adults, thus, understanding the mechanism of NFKB2 action in pituitary development and/or function is important.

      The authors use CRISPR/Cas gene editing of human iPSC derived pituitary-hypothalamic organoids to assess the function of NFKB2 and TBX19 in pituitary development. Mutations in TBX19 are the most common, known cause of pituitary ACTH deficiency, and the mechanism of action has been studied in mice, which phenocopy the human condition. Thus, the TBX19 organoids can serve as a positive control. The Nfkb2 mouse model has a p.Y868* mutation that impairs cleavage of NFKB2 p100, and the immune phenotype mimics the patients with DAVID mutations, but no pituitary phenotype was evident. Thus, a human organoid model might be the only approach suitable to discover the etiology of the pituitary phenotype.

      Overall, the authors have selected an important problem, and the results suggest that the pituitary insufficiency in DAVID syndrome is caused by a developmental defect rather than an autoimmune hypophysitis condition. The use of gene editing in human iPSC derived hypothalamic-pituitary organoids is significant, as there is only one example of this previously, namely studies on OTX2. Only a few laboratories have demonstrated the ability to differentiate iPSC or ES cells to these organoids, and the authors have improved the efficiency of differentiation, which is also significant.

      The strength of the evidence is excellent. The authors have thoroughly analyzed the genetically engineered organoids compared to isogenic controls. They have validated their findings with analysis of RNA and proteins. They have studied the time course of differentiation in the organoids and have a robust experimental design involving many replicates. Analysis of additional clones could strengthen the evidence.

      Strengths:

      The authors make mutations in TBX19 and NFKB2 that exist in affected patients. The TBX19 p.K146R mutation is recessive and causes isolated ACTH deficiency. Mutations in this gene account for 2/3 of isolated ACTH deficiency cases. The NFKB2 p.D865G mutation is heterozygous in a patient with recurrent infections and isolated ACTH deficiency. NFKB2 mutations are a rare cause of ACTH deficiency, and they can be associated with loss of other pituitary hormones in some cases. However, all reported cases are heterozygous.<br /> The developmental studies of organoid differentiation are rigorous in that 200 organoids were generated for each hiPSC line, and 3-10 organoids were analyzed for each time point and genotype. Differentiation analysis relied on both RNA transcript measurements and immunohistochemistry of cleared organoids using light sheet microscopy. Multiple time points were examined, including seven times for gene expression at the RNA level and two times in the later stages of differentiation for IHC.<br /> TBX19 deficient organoids exhibit reduced levels of PITX1, LHX3, and POMC (ACTH precursor) expression at the RNA and IHC level, and there are fewer corticotropes in the organoids, as ascertained by POMC IHC.<br /> The NFKB2 deficient organoids have normal expression of the early pituitary transcription factor HESX1, but reduced expression of PITX2, LHX3 and POMC. Because there is no immune component in the organoid, this shows that NFKB2 mutations can affect corticotrope differentiation to produce POMC. RNA sequencing analysis of the organoids reveals potential downstream targets of NFKB2 action, including a potential effect on epithelial to mesenchymal like transition and selected pituitary and hypothalamic transcription factors and signaling pathways.

      It is important to note that all NFKB2 patients are heterozygous for what appear to be dominant negative mutations that affect protein cleavage and nuclear localization of processed protein as homo or heterodimers. The organoids are homozygous for this mutation.

      Weakness:

      There could be variation between individual iPSC lines that is unrelated to the genetically engineered change. The work would be strengthened by analysis of independently engineered clones or by correcting the engineered clone to wild type and demonstrating that the phenotypic effects are reversed. The authors do check for off target effects of the guide RNA at predicted sites using WGS.

    4. Reviewer #3 (Public review):

      Summary:

      This manuscript by Mac et al addresses the causes of pituitary dysfunction in patients with DAVID syndrome which is caused by mutations in the NFKB2 gene and leads to ACTH deficiency. The authors seek to determine whether the mutation directly leads to altered pituitary development, as opposed to an autoimmune defect, by using mutating human iPSCs and then establishing organoids that differentiate into pituitary tissue. They first seek to validate the system using a well-characterised mutation of the transcription factor TBX19, which also results in ACTH deficiency in patients. Then they characterise altered pituitary cell differentiation in mutant NFKB2 organoids and show that these lack corticotrophs, which would lead to ACTH deficiency. Importantly, the findings here suggest the effects of mutant NFKB2 on pituitary organoid differentiation are direct and not a result of altered noncanonical NF-κB signalling, which has been shown to be a mechanism leading to immunodeficiency in DAVID patients.

      Strengths:

      The conclusion of the paper that ACTH deficiency in DAVID syndrome is independent of an autoimmune input is strong.

      Weaknesses:

      (1) The authors correctly emphasise the importance of establishing the validity of an iPSC-based model in being able to recapitulate in vivo dysfunctional pituitary development through characterisation of a TBX19 knock-in mutation. Whilst this leads to the expected failure of functional corticotroph differentiation, other aspects of the normal pituitary differentiation pathway upstream of cortocotroph commitment seem to have been affected in surprising ways. In particular, the loss of LHX3 and PITX1 in TBX19 mutant organoids compared with wild type requires explanation, especially as the mutant protein would only be expected to be expressed in a small proportion of anterior pituitary lineage cells. This may identify a difference between human and mouse pituitary development and emphasises the importance of further establishing the developmental programme in human pituitary.

      (2) It is notable that the manipulation of iPSC cells used to generate mutants through CRISPR/Cas9 editing is not applied to the control iPSC line. It is possible that these manipulations, including electroporation and puromycin selection may lead to changes to the iPSC cells that is independent of the mutations introduced and this may change the phenotype of the cells. The authors have established that there are no off-target mutations through whole genome sequencing but the iPSC manipulation could have led to changes through epigenetic mechanisms or through non-genomic alterations of developmental potential. A better control in all experiments would have been an iPSC line with a benign knock-in (such as GFP into the ROSA26 locus) or use of a selected line where editing failed. The authors also ackowledge that use of a single clone is not ideal in these studies and characterisation of multiple clones would strengthen the conclusions of the study.

    5. Author response:

      The following is the authors’ response to the original reviews.

      eLife Assessment

      This valuable study examines the effects of NFKB2 mutations on pituitary gland development through hypothalamic-pituitary organoids. The evidence supporting the main conclusions is solid, although analysis of additional clones to exclude inter-clone variability would strengthen the conclusions. Insight into the mechanism of action of NFKB2 during pituitary development is incomplete. This work will be of interest to endocrinologists and biologists working on pituitary gland development and disease.

      We agree with these considerations and the summary and thank the Editors for their assessment. Although we indeed share the idea that reproduction of the experiments on a second clone would be a useful confirmatory step, we have not been able to reach this goal within a reasonable time frame for the reason mentioned above (unavailability of the main research engineer knowledgeable in the challenging methods involved for organoids differentiation) and due to the long turnaround time of this kind of experiments (3 months for the whole differentiation starting form iPSC). We therefore decided to publish on a single clone while we are still aiming at reproducing our results on at least a second one and will hopefully be able to provide these additional data in a subsequent revised version. We now acknowledge this limitation in the final part of the Discussion.

      Revised text: “Conversely, a limitation of this model is the long duration of the differentiation period (approximately 3 months) and the fact that not all hiPSC clones lead to full differentiation of hypothalamo-pituitary organoids despite similar conditions of culture. For these reasons, we could not include confirmation of our results on an independent clone in the present paper.”

      Public Reviews:

      Reviewer #1 (Public Review):

      Summary:

      NFKB mutations are thought to be one of the causes of pituitary dysfunction, but until now they could not be reproduced in mice and their pathomechanism was unknown. The authors used the differentiation of hypothalamic-pituitary organoids from human pluripotent stem cells to recapitulate the disease in human iPS cells carrying the NFKB mutation.

      Strengths:

      The authors achieved their primary goal of recapitulating the disease in human cells. In particular, the differentiation of the pituitary gland is closely linked to the adjacent hypothalamus in embryology, and the authors have again shown that this method is useful when the hypothalamus is suspected to be involved in pituitary abnormalities caused by genetic mutations.

      Weaknesses:

      On the other hand, the pathomechanism is still not fully understood. This study provides some clues to the pathomechanism, but further analysis of NFKB expression and experiments investigating the relevant factors in more detail may help to clarify it further.

      We thank this reviewer for acknowledging that we've reached our primary objective, in particular the fact that the HPO (hypothalamo-pituitary organoid) model allows recapitulation of the disease in human cells, including hypothalamic-pituitary interactions. Regarding the pathophysiological mechanism of the disease, we must admit that it remains incompletely understood. However, we have analysed more samples by RT-qPCR and further analysed RNASeq data from NFKB2 KI organoids, which provided with more insights into the different levels where NFKB2 may play a role. We have now provided several additional figures derived from these analyses, including a synthetic figure to summarize the most relevant observed effects (Fig. 14). 

      Reviewer #2 (Public Review):

      We also thank this reviewer for the detailed analysis of our manuscript, for the valuable comments, suggestions and questions that are addressed point-by point below. 

      Summary:

      DAVID syndrome is a rare autosomal dominant disorder characterized by variable immune dysfunction and variable ACTH deficiency. Nine different families have been reported, and all have heterozygous mutations in NFKB2. The mechanism of NFKB2 action in the immune systems has been well-studied, but nothing is known about its role in the pituitary gland.

      The DAVID mutations cluster in the C-terminus of the NFKB2 and interfere with cleavage and nuclear translocation. The mutations are likely dominant negative, by affecting dimer function. ACTH deficiency can be life-threatening in neonates and adults, thus, understanding the mechanism of NFKB2 action in pituitary development and/or function is important.

      The authors use CRISPR/Cas gene editing of human iPSC-derived pituitary-hypothalamic organoids to assess the function of NFKB2 and TBX19 in pituitary development. Mutations in TBX19 are the most common, known cause of pituitary ACTH deficiency, and the mechanism of action has been studied in mice, which phenocopy the human condition. Thus, the TBX19 organoids can serve as a positive control. The Nfkb2<Lym1/Lym1> mouse model has a p.Y868* mutation that impairs cleavage of NFKB2 p100, and the immune phenotype mimics the patients with DAVID mutations, but no pituitary phenotype was evident. Thus, a human organoid model might be the only approach suitable to discover the etiology of the pituitary phenotype.

      Overall, the authors have selected an important problem, and the results suggest that the pituitary insufficiency in DAVID syndrome is caused by a developmental defect rather than an autoimmune hypophysitis condition. The use of gene editing in human iPSC-derived hypothalamic-pituitary organoids is significant, as there is only one example of this previously, namely studies on OTX2. Only a few laboratories have demonstrated the ability to differentiate iPSC or ES cells to these organoids, and the authors have improved the efficiency of differentiation, which is also significant.

      The strength of the evidence is excellent. However, the two ACTH-deficient organoid models use a single genetically engineered clone, and the potential for variability amongst clones makes the conclusions less compelling. Since the authors obtained two independent clones for NFKB2 it is not clear why only one clone was studied.

      We experienced difficulties obtaining an hiPSC population devoid of spontaneous differentiation while purifying this second clone, and did not want to delay the start of the experiments. This clone will be analysed in a follow-up study.

      Finally, the effect of TBX19 on early pituitary fate markers is somewhat surprising given the phenotype of the knockout mice and patients with mutations. Thus, the use of a single clone for that study is also worrisome.

      We agree that the effect of the TBX19 mutant on early pituitary progenitor development is rather puzzling. In our model, TBX19 is expressed throughout the whole experiment, although it is at very low levels in undifferentiated hiPSCs compared to peak expression (over 50-fold difference).

      During the CRISPR-Cas9 gene edition, we obtained a clone with a homozygous one base insertion at the cutting site, leading to a frameshift and a premature stop codon 48 bases downstream. This would result in an expected protein of 163 amino acids instead of 488, but with potentially still functional DNA-binding ability. This mutation had a similar effect on LHX3 and PITX1 as the TBX19 KI mutation, although it was even more severe. Our most likely explanation is that the two TBX19 mutants we generated have dominant negative effects. Contrary to mouse, little is known about TBX19 expression in early human pituitary development, but scRNA-seq data on human embryonic pituitaries (Zhang et al.) show low expression in undifferentiated pituitary progenitors between 7 and 9 weeks of gestation. Therefore, early expression of these dominant negative proteins could perturb differentiation in the organoids. Future development of hiPSCs lines with total absence of TBX19 should help clarify these questions.

      Strengths:

      The authors make mutations in TBX19 and NFKB2 that exist in affected patients. The TBX19 p.K146R mutation is recessive and causes isolated ACTH deficiency. Mutations in this gene account for 2/3 of isolated ACTH deficiency cases. The NFKB2 p.D865G mutation is heterozygous in a patient with recurrent infections and isolated ACTH deficiency. NFKB2 mutations are a rare cause of ACTH deficiency, and they can be associated with the loss of other pituitary hormones in some cases. However, all reported cases are heterozygous.

      The developmental studies of organoid differentiation seem rigorous in that 200 organoids were generated for each hiPSC line, and 3-10 organoids were analyzed for each time point and genotype. Differentiation analysis relied on both RNA transcript measurements and immunohistochemistry of cleared organoids using light sheet microscopy. Multiple time points were examined, including seven times for gene expression at the RNA level and two times in the later stages of differentiation for IHC.<br /> TBX19 deficient organoids exhibit reduced levels of PITX1, LHX3, and POMC (ACTH precursor) expression at the RNA and IHC level, and there are fewer corticotropes in the organoids, as ascertained by POMC IHC.

      The NFKB2 deficient organoids have a normal expression of the early pituitary transcription factor HESX1, but reduced expression of PITX2, LHX3, and POMC. Because there is no immune component in the organoid, this shows that NFKB2 mutations can affect corticotrope differentiation to produce POMC. RNA sequencing analysis of the organoids reveals potential downstream targets of NFKB2 action, including a potential effect on epithelial-to-mesenchymal-like transition and selected pituitary and hypothalamic transcription factors and signaling pathways.

      Weaknesses:

      There could be variation between individual iPSC lines that is unrelated to the genetically engineered change. While the authors check for off-target effects of the guide RNA at predicted sites using WGS, a better control would be to have independently engineered clones or to correct the engineered clone to wild type and show that the phenotypic effects are reversed.

      All NFKB2 patients are heterozygous for what appear to be dominant negative mutations that affect protein cleavage and nuclear localization of processed protein as homo or heterdimers. The organoids are homozygous for this mutation. Supplemental Figure 4 indicates that one heterozygous clone and two homozygous mutant clones were obtained. Analysis of these additional clones would give more strength to the conclusions, showing reproducibility and the effect of mutant gene dosage.

      The main goal of this work was to evaluate if and how NFKB2D865G mutation affects hypothalamic-pituitary organoids development, in order to determine if these organoids would constitute a valuable model to study DAVID syndrome.

      We thank this reviewer for noting that we identified an important question and have used appropriate novel and not widely used methods to address it, including CRISPR/Cas9 genome editing of iPSCs and disease modelling in iPSC-derived HPOs that had not previously been reported by a team other than the one that initially described it, allowing to confirm our working hypothesis that DAVID syndrome is caused by a developmental defect rather than an autoimmune hypophysitis condition. We also agree that analysing more clones, generated from same or different hiPSC lines, carrying homozygous or heterozygous mutations, and corrected mutations will be necessary in the future.

      Reviewer #3 (Public Review):

      We also thank this reviewer for the detailed analysis of our manuscript, for the valuable comments, suggestions and questions that are addressed point-by point below. 

      Summary:

      This manuscript by Mac et al addresses the causes of pituitary dysfunction in patients with DAVID syndrome which is caused by mutations in the NFKB2 gene and leads to ACTH deficiency. The authors seek to determine whether the mutation directly leads to altered pituitary development, as opposed to an autoimmune defect, by using mutating human iPSCs and then establishing organoids that differentiate into pituitary tissue. They first seek to validate the system using a well-characterised mutation of the transcription factor TBX19, which also results in ACTH deficiency in patients. Then they characterise altered pituitary cell differentiation in mutant NFKB2 organoids and show that these lack corticotrophs, which would lead to ACTH deficiency.

      Strengths:

      The conclusion of the paper that ACTH deficiency in DAVID syndrome is independent of an autoimmune input is strong.

      Weaknesses:

      (1) The authors correctly emphasise the importance of establishing the validity of an iPSC-based model in being able to recapitulate in vivo dysfunctional pituitary development through characterisation of a TBX19 knock-in mutation. Whilst this leads to the expected failure of functional corticotroph differentiation, other aspects of the normal pituitary differentiation pathway upstream of corticotroph commitment seem to have been affected in surprising ways. In particular, the loss of LHX3 and PITX1 in TBX19 mutant organoids compared with wild type requires explanation, especially as the mutant protein would only be expected to be expressed in a small proportion of anterior pituitary lineage cells.

      If the developmental expression profile of key transcription factors in mutant organoids does not recapitulate that which occurs in vivo, any interpretation of the relevance of expression differences in the NFKB2 organoids to the mechanism(s) leading to corticotroph function in vivo has to be questionable.

      See response to Reviewer #2

      It is notable that the manipulation of iPSC cells used to generate mutants through CRISPR/Cas9 editing is not applied to the control iPSC line. It is possible that these manipulations lead to changes to the iPSC cells that are independent of the mutations introduced and this may change the phenotype of the cells. A better control would have been an iPSC line with a benign knock-in (such as GFP into the ROSA26 locus).

      We agree that the issue of off-target mutations should be addressed. However, we performed whole genome sequencing on TBX19 KI and did not observe any pathogenic variants other than the intended edition. We also checked that clones isolated during the screening procedure but that returned negative for editing still had the ability to generate pituitary cells. However, we made the choice to use the isogenic original hiPSC line as it could be compared to both TBX19 KI and NFKB2 KI simultaneously, therefore reducing workload and cost of the experiments. Any other knock-in mutation, such as GFP into the ROSA26 locus would imply the same risk of off-target mutations, but presumably at other sites in the genome.

      (2) In the results section of the manuscript the authors acknowledge that hypothalamic tissue in the NFKB2 mutant organoid may be having an effect on the development of pituitary tissue. However, in the discussion the emphasis is entirely on pituitary autonomous mechanisms such as pituitary HESX1 expression or POMC gene regulation; in the conclusion of the abstract, a direct role for NFKB2 in pituitary differentiation is described. Whilst the data here may suggest a non-immune mediated alteration in pituitary function in DAVID syndrome, if this is due to alteration of the developing hypothalamus then this is not direct. A fuller discussion of the potential hypothalamic contribution and/or further characterisation of this aspect is warranted.

      We agree with this reviewer that contributions of both hypothalamic and pituitary developing tissues should be taken into account. We performed more experiments and analysed the effect of both mutations on hypothalamic growth factors expression. These results are displayed in new figure 10. The role of the hypothalamus is now clearly mentioned and highlighted in the Discussion.

      (3) qRT-PCR data presented in Figure 6A shows negligible alteration of HESX1 expression at all time points in NFKB2 mutant organoids. This is not consistent with the 2-fold increase in HESX1 expression described in day 48 organoids found by bulk RNA sequencing.

      How do the authors reconcile these results and why is one result focused on in the discussion where a potential mechanism for a blockade of normal pituitary cell differentiation is suggested? Further confirmation of HESX1 expression is required.

      In the previous version on the manuscript, the HESX1 fold-change ratio between NFKB2 KI and WT at d48 was of 2.06 (p=0.22). However, the type of representation for expression kinetics (values relative to the expression peak in WT) and the scale used made it difficult to see. In the new version of the manuscript, we analysed more samples from the same experiments, and new figure (now 6B) shows significant increase of HESX1 expression (Fc = 2.46, p=0.019) in NFKB2 KI.

      Also, qPCR results come from at least two different experiments whereas RNAseq come from a single one. For RT-qPCR, 6 HPOs per genotype were picked and further analysed. As we found that only 60-70% of organoids show signs of pituitary cell differentiation, we chose to perform a preselection of organoids, based on RT-qPCR expression of selected markers (SOX2, HESX1, PITX1, LHX3, TBX19, POU1F1 and POMC) in order to avoid having “empty” HPOs sent for bulk RNAseq. We compared HESX1 expression ratios obtained by the two different techniques on the same samples (the ones used for RNA-seq) and found values of 2.19 (p=0.03) and 1.83 (p=0.061) for RNA-seq and RT-qPCR respectively. This is illustrated in Supplementary Figure 7. Our new results thus clearly demonstrate the increase in HESX1 expression in NFKB2 KI from d27 to d75.

      (4) Throughout the authors focus on POMC gene expression and ACTH antibody immunopositive as being indicative of corticotroph cell identity. In the human fetal pituitary melanotrophs are present and most ACTH antibodies are unable to distinguish these cells from corticotrophs. Is the antibody used specifically for ACTH rather than other products of the POMC gene? It is unlikely that all the ACTH-positive cells are melanotrophs, nevertheless, it is important to know what the proportions of the 2 POMC-positive cell types are. This could be distinguished by looking for the expression of NeuroD1, which would also define whether corticotrophs are committed but not fully differentiated in the NFKB2 mutant organoids. In support of an effect on corticotrophs, it is notable that CRHR1 expression (which would be expected to be restricted to this cell type) is reduced by 84% in bulk RNAseq data (Table 1) and this may be an indicator of the loss of corticotrophs in the model.

      The antibody we used is directed against ACTH. In HPOs, PAX7 expression was barely detected during the whole experiment. Moreover, although PCSK2 transcripts were observed, their expression started very early (d27) and remained constant, suggesting that an expression of this gene in hypothalamic cells rather than pituitary cells. All these observations suggest that melanotrophs are very unlikely to be present in HPOs.

      (5) Notwithstanding the caveats about whether the organoid model recapitulates in vivo pituitary differentiation (see 1 above) and whether the bulk RNAseq accurately reflects expression levels (see 3 above), there are potentially some extremely interesting changes in gene expression shown in Table 1 which warrant further discussion. For example, there is a 25-fold reduction in POU1F1 expression which may be expected to reflect a loss of somatotrophs in the organoid (and possibly lactotrophs) and highlights the importance of characterising the effect of NFKB2 on other anterior pituitary cell types within the organoid. If somatotrophs are affected, this may be relevant to the organoids as a model of DAVID syndrome as GH deficiency has been described in some individuals with NFKB2 mutations. The huge increase in CGA expression may reflect a switch in cell fate to gonadotrophs, as has been described with a loss of TPIT in the mouse. These are examples of the changes that warrant further characterisation and discussion.

      We performed a more in-depth analysis of other pituitary lineages (mainly somatotrophs). We confirmed the strong reduction in PROP1 and POU1F1 expression in NFKB2 KI organoids. Although the strong increase in CGA expression in the mutant may raise the possibility of a redirection towards gonadotroph lineage, the lack of change in NR5A1 expression may suggest otherwise.

      These results are now illustrated in figure 12 and discussed in a full paragraph.

      (6) How do the authors explain the lack of effect of NFKB2 mutation on global NFKB signalling?

      The most likely explanation is that p100/p52 is not involved in controlling the expression of other members of NFKB signalling. Therefore, the absence of global alteration of NFKB signaling pathway shows that mutant p100/p52 protein is directly responsible for the observed phenotype.

      Recommendations for the authors:

      Reviewing editor summary of recommendation to authors:

      The use of hypothalamic-pituitary organoids can provide a fundamental understanding of pituitary gland development and differentiation. Their use to study human pituitary insufficiency is important, gaining insight into the aetiology of disease and if it implicates the hypothalamus or anterior pituitary. To this end, there is only one other example of their use in the literature, where Matsumoto et al, (2019), used OTX2-mutant hypothalamic-pituitary organoids to understand the aetiology of pituitary hypoplasia driven by OTX2 mutations. This being the second example of using gene editing in human iPSC-derived hypothalamic-pituitary organoids, these studies have improved the efficiency of differentiation previously published by Suga et al. (2011) for ES cells, and Matsumoto et al. (2019) for iPS cells. In addition, it has solidified that this method is useful, especially when studying hypothalamic involvement in human pituitary anomalies, due to the concerted development of these two structures.

      The reviewers recognise the valuable insight provided into the mechanism of NFKB2 action during pituitary development and how this human organoid model might be one of the few or only approaches suitable to discover the aetiology of the pituitary phenotype.

      The reviewers agree that both the evidence provided from the organoid model, as well as the characterisation of the phenotype are incomplete. In particular, the strength of evidence would be improved by analysing additional independent clones for both NFKB2 as well as TBX19 gene-edited iPSCs. Additionally, analysis of NFKB2 expression both in vivo and in the organoids, as well as analysis for the NFKB2 targets put forward, would be a lot more informative to help understand this phenotype.

      The main recommendations discussed are summarised here and the reviewers have elaborated on these points in their individual reviews:

      The two ACTH-deficient organoid models use a single genetically engineered clone, and the potential for variability amongst clones, unrelated to the mutation, makes the conclusions less compelling. Two independent homozygous clones were obtained for NFKB2 but only one was used, so analysis of the second clone would strengthen the findings. A heterozygous clone was also obtained and given all NFKB2 patients are heterozygous for what appears to be dominant negative mutations, the heterozygous clone ought to be analysed. Analyses of these additional clones would give more strength to the conclusions, showing reproducibility and the effect of mutant gene dosage. The reviewers provide excellent suggestions for alternative controls for the engineered iPSC lines in their specific comments.

      The effect of TBX19 mutation on early pituitary fate markers LHX3 and PITX1 is surprising given the phenotype of the knockout mice and patients with mutations. If the developmental profile of essential transcription factors does not recapitulate the in vivo expression in this well-characterised mutant, this brings the organoid model into question. Thus, analysis of a further clone for the study of mutant TBX19 would be crucial. The validity of this control affects the interpretations relying on expression differences in the NFKB2-mutant organoids.

      The study has implicated NFKB2 in pituitary development, but more insight is needed to fully understand disease pathogenesis. The authors presented potential downstream targets of NFKB2 action, including transcription factors and key signalling pathway components; further analyses of NFKB2 expression and experiments investigating the relevant factors in more detail will help elucidate this point.

      Discerning between the hypothalamus and pituitary tissue is fundamental to interpreting phenotypes: (i) To pinpoint the primary tissue affected by NFKB2 deficiency, staining for NFKB2 during development in vivo will determine if this is expressed both in the developing hypothalamus and anterior pituitary gland or only one of these tissues. (ii) Using markers of hypothalamus and pituitary to discern between these two tissues in organoids, will provide a lot of valuable information where expression changes are presented. This would help discern the contribution of the developing hypothalamus as this is still unclear and has not been discussed. Knowing which tissue compartments NFKB2 is expressed in the organoids would also be of great value.

      The organoids provide an opportunity to characterise the effects of NFKB2 on other pituitary cell types, since the bulk RNAseq presents intriguing changes indicating that not only corticotrophs may be affected. This may be of relevance to patients, which can have additional pituitary hormone deficiencies. If NFKB2 is expressed in the pituitary, demonstrating expression in the different cell types in vivo as well as in the organoids would help interpret the phenotype. Is this expressed only in corticotrophs/corticotroph precursors, or in additional endocrine cells?

      We agree with these considerations and the summary and thank the Editors for their assessment. Although we indeed share the idea that reproduction of the experiments on a second clone would be a useful confirmatory step, we have not been able to reach this goal within a reasonable time frame for the reason mentioned above (unavailability of the main research engineer knowledgeable in the challenging methods involved for organoids differentiation) and due to the long turnaround time of this kind of experiments (3 months for the whole differentiation starting form hiPSC). We therefore decided to publish on a single clone while we are still aiming at reproducing our results on at least a second one and will hopefully be able to provide these additional data in a subsequent revised version. We now acknowledge this limitation in the final part of the Discussion.

      We have analysed more samples by RT-qPCR and further analysed RNASeq data from NFKB2 KI organoids, which provided with more insights into the different levels where NFKB2 may play a role. Specifically, we now show the effect of NFKB2 mutation on hypothalamic growth factors and pituitary progenitor differentiation (figure 10), different stages of corticotroph maturation (figure 11) and effects on PROP1/POU1F1-dependent lineages (figure 12). We confronted our results to publicly available ChIPseq data concerning p52 transcriptional targets (figure 13). We have now provided several additional figures derived from these analyses, including a synthetic figure to summarize the most relevant observed effects (Fig. 14). 

      Reviewer #1 (Recommendations For The Authors):

      In organoids, it is essential to stain for NFKB: is it the hypothalamus or the pituitary that expresses NFKB, and if the pituitary, is it the corticotroph itself or the surrounding cells? If immunostaining is not available, FISH or RNAscope can be used to look at expression.

      Figure 7 shows stronger expression of p100/p52 in pituitary progenitors, and some expression in the hypothalamic part of the organoid. Due to current lack of biological material and length of experimental procedure, we could not yet determine which differentiated cell types express p100/p52, but this is clearly something we will look at in further experiments.

      Regarding Figure 7, NFKB2 (D865G/D865G) shows no LHX3 expression already at day 48. It would be better to look at expression including PITX1 at an earlier time point to see at what point differentiation is impaired.

      RT-qPCR results show no statistically significant changes in PITX1 (Fc=0.58, p=0.25) or LHX3 (Fc = 0.15; p=0.22) expression at d27, although there was a tendency towards downregulation.

      Is it really just a species difference that NFKB2-deficient mice do not have abnormal pituitary function? This needs to be discussed in the manuscript.

      Nfkb2_Lym1/Lym1 mice and _NFKB2 KI model have different but functionally very similar mutations, as they both lead to an abnormal processing of p100 and a strong reduction of p52 content. In mice, these mutations are more severe than the complete absence of Nfkb2 gene product, and they have been called “super repressors”. It is therefore surprising that no pituitary phenotype as been observed in mice. In our opinion, this constitutes a strong argument in favour of an inter-species difference, at least for the pathogenicity of this type of mutations.

      This point is now addressed in the Discussion

      Just looking at changes in gene expression by qPCR and bulk RNA-seq does not give enough information about localisation. We wish RNA-seq had at least been separated by FACS first. For example, FACS can separate the anterior pituitary and hypothalamus by EpCAM positivity/negativity (PMID: 35903276), so we would like to see gene expression in such separated samples.

      This is a pertinent suggestion. We are aware of these techniques and we hope we will be able to include them in future studies

      For Figures 2 and 6, just looking at changes in gene expression by qPCR does not provide localisation information, so either (1) immunostaining for LHX3 and NKX2.1 should be shown in each aggregate as in FigS3, or (2) qPCR should be performed on the FACSed cells. (2) qPCR on FACSed cells.

      PITX1, LHX3 (as confirmed by our immunofluorescence data) and HESX1 are only expressed in non-neural tissue. TBX19 could be expressed in the hypothalamic part of the organoid, but we observed very little immunostaining outside the outermost layers of organoids (i.e. pituitary tissue). The antibody we used to detect corticotrophs only recognizes ACTH, and therefore only marks pituitary cells.

      In addition, pathway and gene ontology analyses should be performed.

      Pathways and gene ontology have been performed. However, as organoids consist of two different tissues, the analysis of over 4800 differentially expressed genes did not give us very informative results, apart from an impairment of retinoic acid signalling that we are currently investigating

      Reviewer #2 (Recommendations For The Authors):

      The differentiation of iPSC to organoids could be variable. The authors indicate that 200 organoids were analyzed for each line, and 3-10 organoids were analyzed per time point, genotype, and assay. Is it clear that 100% of the organoids differentiate to produce corticotropes? Please clarify.

      In our experiments, almost 90% of organoids give rise to non-neural ectoderm, as demonstrated by PITX1 expression. However, depending on experiments, only 60-70% of organoids give rise to pituitary progenitors (LHX3+) and subsequently to corticotropes. This has been clarified in the text.

      For TBX19, it seems surprising that there is an effect on PITX1 and LHX3 expression, since TBX19 expression is normally activated after these genes are expressed. An effect of TBX19 on EMT would also be surprising as the knockout mice do not have dysmorphology of the stem cell niche. The only evidence for an effect is the reduced IHC for E-cadherin. If this is an important point, the authors should examine other EMT markers such as Zeb2. The TBX19 knockout mice appear to form corticotropes based on the expression of NeuroD1, even though they lack TBX19 and POMC expression. It would be reassuring to see that NeuroD1 is normally expressed in the TBX19 mutant organoids.

      We agree that the effect of the TBX19 mutant on early pituitary progenitor development is rather puzzling. In our model, TBX19 is expressed throughout the whole experiment, although it is at very low levels in undifferentiated hiPSCs compared to peak expression (over 50-fold difference).

      During the CRISPR-Cas9 gene edition, we obtained a clone with a homozygous one base insertion at the cutting site, leading to a frameshift and a premature stop codon 48 bases downstream. This would result in an expected protein of 163 amino acids instead of 488, but with potentially still functional DNA-binding ability. This mutation had a similar effect on LHX3 and PITX1 as the TBX19 KI mutation, although it was even more severe. Our most likely explanation is that the two TBX19 mutants we generated have dominant negative effects. Contrary to mouse, little is known about TBX19 expression in early human pituitary development, but scRNA-seq data on human embryonic pituitaries (Zhang et al.) show low expression in undifferentiated pituitary progenitors between 7 and 9 weeks of gestation. Therefore, early expression of these dominant negative proteins could perturb differentiation in the organoids. Future development of hiPSCs lines with total absence of TBX19 should help clarify these questions.

      Apart from the lack of change in ZEB2 expression in TBX19 KI (Fc = 1.15; p = 0.35), we did not look further for changes in EMT markers in TBX19 KI. However, we added a more detailed analysis for EMT markers expression in NFKB2 KI based on RNAseq results (see table 2).

      Due to lack of material, we could not confirm NEUROD1 expression by immunostaining. However, RT-qPCR showed there was no change in NEUROD1 expression in TBX19 KI (Fc = 0.81; p = 0.64)

      NFKB2 IHC was markedly reduced in NFKB2 D865G/D865G organoids. Based on previous experiments, the mutant protein should be expressed but not activated by proteolytic cleavage. It is possible that the antibody has a different affinity for the mutant protein and/or the uncleaved protein may be unstable. Can this be clarified? The mRNA for mutant NFKB2 appears unchanged in Table 1.

      This is puzzling indeed. We did not notice any change in NFKB2 from d27 to d105, and no significant change either between WT and NFKB2 KI. Although the antibody we used recognizes both p100 and p52, we cannot rule out the possibility that p100/p52 is degraded by pathways other than proteasome. Another possibility is that p100 interactions with other proteins may decrease the accessibility of the antibody to the epitope

      The RNA sequencing data from the NFKB2 organoids is intriguing. It suggests that the NFKB2 mutation may have a modest effect on Tbx19 transcription but not Neurod1. It also suggests there are hypothalamic effects, i.e. altered expression of hypothalamic markers in mutant organoids. Is NFKB2 expressed in the developing hypothalamus? Can normal NEUROD1 IHC be confirmed? It is also intriguing that there may be an effect on EMT. However, there seem to be some discrepancies in the direction of effect on these markers. Please clarify.

      This is related to the point just above. P100/p52 is described as a ubiquitously expressed protein. We think that it is expressed in the hypothalamic part of the organoids, but at a lower level compared to pituitary progenitors.

      As mentioned before, we could not yet confirm NEUROD1 expression by immunostaining, but RT-qPCR clearly showed there was no change in NEUROD1 expression in TBX19 KI (Fc = 0.81; p = 0.64) or NFKB2 KI (Fc = 0.88; p = 0.5). However, we investigated other markers of different stages of corticotroph differentiation (see figure 11) and found that the later stages are most affected.

      Concerning the EMT, we also found changes in the expression of other markers that are shown in Table 2 and discussed further in the text.

      Cytokines have been proposed to play important roles in pituitary differentiation, i.e. IL6. Is there any evidence for an altered cytokine or chemokine expression in the NFKB2 organoids?

      We didn’t see any change in IL6 expression NFKB2 KI (Fc = 2.34; p = 0.55), but RNAseq shows a strong increase in IL6R (Fc = 8.89; p = 2.13e-09). But at this point, the relevance of these observations remains elusive.

      Minor:

      Some patients with DAVID syndrome have pituitary hypoplasia. The authors measure organoid size and find no differences based on genotype. However, each organoid probably has a variable amount of tissue differentiated to pituitary and hypothalamic fates, therefore, the volume of the whole organoid may not be a good proxy for the amount of pituitary tissue.

      We are aware of this issue. However, for most pituitary genes measured by RT-qPCR (PITX1, LHX3, TBX19), the deltaCt values did not drastically vary for a given time point/genotype, suggesting a stable pituitary/hypothalamic ratio.

      Figure 9 shows whole transcriptome data for the NFKB2 organoids, and Table 1 lists the data for selected genes. There appears to be disagreement between the significance cut-offs used in the figure and the table. Please adjust.

      We removed the fold-change cut-offs to improve clarity

      elife120868_0_supp_2945725_rxl2z4. "haft" appears several times, but it should be "half".

    1. eLife Assessment

      This work identifies the molecular function of an orphan human transporter, SLC35G1, providing convincing evidence that this protein is involved in intestinal citrate absorption. This work provides important insight into transporter function and human physiology.

    2. Reviewer #1 (Public review):

      Summary:

      The current manuscript provides solid evidence that the molecular function of SLC35G1, an orphan human SLC transporter, is citrate export at the basolateral membrane of intestinal epithelial cells. Multiple lines of evidence, including radioactive transport experiments, immunohistochemical staining, gene expression analysis, and siRNA knockdown are combined to deduce a model of the physiological role of this transporter.

      Strengths:

      The experimental approaches are comprehensive, and together establish a strong model for the role of SLC35G1 in citrate uptake. The observation that chloride inhibits uptake suggests an interesting mechanism that exploits the difference in chloride concentration across the basolateral membrane.

      Weaknesses:

      A gap in this study is that the mechanism of the transporter has not been established. The authors propose that the mechanism is facilitated diffusion, while also leaving open the possibility that citrate transport is coupled to another ion, such as chloride. However, another result from this study seems to be in conflict with the proposed facilitative diffusion mechanism. Specifically, the study finds that uptake is not impacted by membrane depolarization. This would imply that transport is not electrogenic, whereas facilitated diffusion of citrate anion should be an electrogenic process.

    3. Reviewer #2 (Public review):

      Summary:

      The primary goal of this study was to identify the transport pathway that is responsible for the release of dietary citrate from enterocytes into blood across the basolateral membrane.

      Strengths:

      The transport pathway responsible for the entry of dietary citrate into enterocytes was already known, but the transporter responsible for the second step remained unidentified. The studies presented in this manuscript identify SLC35G1 as the most likely transporter that mediates the release of absorbed citrate from intestinal cells into the serosal side. This fills an important gap in our current knowledge on the transcellular absorption of dietary citrate. The exclusive localization of the transporter in the basolateral membrane of human intestinal cells and the human intestinal cell line Caco-2 and the inhibition of the transporter function by chloride support this conclusion.

      Weaknesses:

      (i) The substrate specificity experiments have been done with relatively low concentrations of potential competing substrates, considering the relatively low affinity of the transporter for citrate. Given that NaDC1 brings in not only citrate as a divalent anion and also other divalent anions such as succinate, it is possible that SLC35G1 is responsible for the release of not only citrate but also other dicarboxylates. However the substrate specificity studies show that the dicarboxylates tested did not compete with citrate, meaning that SLC35G1 is selective for the citrate (2-), but this conclusion might be flawed because of the low concentration of the competing substrates used in the experiment. Furthermore, the apical NaDC1 is not selective for citrate; in fact, it transports citrate with a much lower affinity than it transports dicarboxylates such as succinate. If what the authors suggest that SLC35G1 is selective for citrate is correct, there must be another transporter for the efflux of dicarboxylates. The authors should have performed a dose-response experiment for the dicarboxylates tested as potential substrates before making the conclusion that SLC35G1 is selective for citrate.

      (ii) The authors have used MDCK cells for assessment of the transcellular transfer of citrate via SLC35G1, but it is not clear whether this cell line expresses NaDC1 in the apical membrane as the enterocytes do. Even though the authors expressed SLC35G1 ectopically in MDCK cells and showed that the transporter localizes to the basolateral membrane, the question as to how citrate actually enters the apical membrane for SLC35G1 in the other membrane to work remains unanswered.

      (iii) The role of chloride in the efflux of citrate remains not evaluated in detail. Similarly, the potential role of membrane potential in the transport function of SLC35G1 remains unknown. Since the SLC35G1-mediated uptake appears to be similar in the presence and absence of potassium, the authors argue that membrane potential has no role in the transport process. Since it is proposed that the divalent citrate is the substrate for the transporter, it is difficult to reconcile with the conclusion that the membrane potential has no impact on the transport process, especially given the fact that no other exchangeable anion has been shown or suggested. Even if chloride is the potential exchangeable anion, it still begs the question as to the stoichiometry of citrate:chloride if membrane potential plays no role. Obviously, additional work is needed to figure out the actual transport mechanism for SLC35G1.