the
delete
the
delete
roles
role (and before you argue it... you have "roles is"... -- while you are listing two things here, this will read better as role (otherwise, you need "roles are" -- this is a grammar error as is))
This preprint was published as Over half of threatened species require targeted recovery actions to avert human-induced extinction and can be found here: https://esajournals.onlinelibrary.wiley.com/doi/full/10.1002/fee.2537
A cautionary note: the results reported here should be examined skeptically given their reliance on the DE-SWAN (DESWAN) method for identifying age-dependent transitions across the lifespan. As shown in our recent preprint, https://www.biorxiv.org/content/10.64898/2026.06.24.734079v1, DE-SWAN is subject to artifacts that reflect the population structure and a failure to appropriately account for uncertainty in age-dependent bins.
In response to the claim that "no one" codes by hand anymore because "everyone" uses LLMs to generate code now. Posted here: https://indieweb.social/@jaredwhite/116992845437895708
doação verbal
Doação, via de regra, exige documento escrito.
Entretanto, será admitida a doação verbal se: a) de baixo valor; b) for feita com a tradição imediata do bem; c) tratar-se de bem <u>móvel</u>
decide whether to carry the multi-model / vision build further; Henrik's prototype didn't beat the current pipeline, the hand-validation decides. spec.
We are now able to compare different extraction pipelines using the hand validated sample. This could be a new TODO list item.
see Guest Indexing Data Scan.
"Guest indexing data scan is wrong, we dont "guest" scan for NAS and OS backups. Also the hyperlink to the text goes to a page which does not mention nas and os backups at all.
Unstructured data (NAS shares, filers, object storage, and file-to-file/OS backups) is never mounted or indexed as a guest. Per the internal feature spec (TFS 1122147, the 13.1 unstructured-data malware detection feature), the mechanism is:
Index-based detection builds on the NAS backup index — suspicious file paths, known attacker tools, and mass deletions are flagged using analytics, signatures, and IOCs.
Important
Could be beneficial to link the KB maybe?
[NOTE: liber-arāvan-etymology]
where is the note to this etymology?
counterexample
counter example
If you upgrade to Veeam Backup & Replication 13.0.1
Do we mean 13.0.1 or 13.1? Veeam TH for nas backup is only available in 13.1
eLife Assessment
This study provides valuable evidence that glycogen phosphorylase is unlikely to represent an effective insecticidal target in Plutella xylostella and that diflubenzuron does not directly inhibit this enzyme. The combination of biochemical, molecular and physiological approaches provides convincing data to support these conclusions, although the proposed metabolic compensation mechanism is supported primarily by indirect evidence and would benefit from direct demonstration.
Reviewer #1 (Public review):
Summary:
In this study, the authors investigate whether glycogen phosphorylase represents a molecular target of benzoylphenylurea insecticides and evaluate the physiological consequences of suppressing glycogen phosphorylase activity in the diamondback moth Plutella xylostella. The authors combine recombinant protein biochemistry, enzyme inhibition assays, RNA interference, structural modelling, metabolite profiling, gene expression analyses, and physiological measurements to determine whether diflubenzuron directly inhibits glycogen phosphorylase and whether suppression of this enzyme is sufficient to impair insect development. Based on these experiments, the authors conclude that diflubenzuron does not directly inhibit glycogen phosphorylase and that insects tolerate substantial suppression of this enzyme through compensatory metabolic responses.
Strengths:
This study addresses an important question in insect toxicology by systematically evaluating glycogen phosphorylase as a potential insecticidal target. The authors combine complementary biochemical, molecular, physiological, and structural approaches, including recombinant enzyme characterization, inhibitor assays, RNA interference, metabolite profiling, structural modelling, and measurements of fitness-related traits. This integrative approach provides a comprehensive evaluation of the biological consequences of glycogen phosphorylase suppression. In particular, the biochemical evidence that diflubenzuron does not inhibit glycogen phosphorylase, together with the observation that strong suppression of glycogen phosphorylase produces only transient physiological effects without measurable impacts on development or reproduction, provides strong support for the conclusion that glycogen phosphorylase is unlikely to represent an effective standalone insecticidal target.
Weaknesses:
The main limitation concerns the proposed mechanism underlying metabolic compensation. The observed increases in gluconeogenic gene expression, changes in metabolite abundance, and reductions in total protein are consistent with activation of compensatory metabolism, but are insufficient to directly demonstrate increased gluconeogenic flux or establish that amino acid-derived carbon is incorporated into newly synthesized glucose. Similarly, although the analyses of glycogen-associated enzymes strengthen the discussion of alternative metabolic pathways, changes in gene expression alone do not demonstrate that these pathways contribute to glycogen utilization in vivo.
Some mechanistic interpretations therefore extend beyond the data presented. For example, decreases in total protein are interpreted as evidence of protein catabolism fuelling gluconeogenesis, yet they do not directly demonstrate amino acid mobilization or incorporation into glucose. Likewise, increased expression of gluconeogenic genes is interpreted as evidence of increased pathway activity, although transcriptional changes do not necessarily reflect metabolic flux. Finally, the absence of major developmental defects following glycogen phosphorylase suppression is attributed primarily to metabolic compensation, but an alternative explanation is not fully considered. Such explanation could be that glycogen phosphorylase is not rate-limiting for glucose homeostasis under the nutrient-rich experimental conditions, where dietary carbohydrates are continuously available. Consequently, the proposed compensatory mechanism remains plausible and well supported by indirect evidence, but several aspects would benefit from more cautious interpretation.
Overall, the authors successfully achieve their primary objective of evaluating glycogen phosphorylase as a candidate insecticidal target. The study provides useful biochemical and physiological evidence that this enzyme is unlikely to represent an effective target for insecticide development in P. xylostella, while highlighting the importance of metabolic plasticity when assessing metabolic targets. The experimental approaches and datasets presented here should be valuable to researchers studying insect metabolism, insecticide mode of action, and target validation, although the precise mechanisms underlying the proposed metabolic compensation remain an important subject for future investigation.
Author response:
The following is the authors’ response to the original reviews.
eLife Assessment
This study addresses the mechanism of action of benzoylurea insecticides and explores the metabolic consequences of inhibiting glycogen breakdown in insects. Both reviewers identify major flaws with the premise of the work. The strength of the provided evidence is inadequate as the data do not, or poorly, support several central claims. The significance of the findings is considered marginal.
The Assessment stated that “both reviewers identify major flaws with the premise of the work” and that “the strength of the provided evidence is inadequate.” We have addressed both dimensions:
(1) Premise: The Introduction has been substantially restructured to explicitly acknowledge the compelling CRISPR/Cas9 evidence establishing CHS as the primary site of BPU resistance (Reference 1). The study is now reframed as a systematic evaluation of GP as an independent insecticidal target and an investigation of metabolic compensation mechanisms — questions with scientific value independent of the BPU mechanism debate (see details in lines 47-54 of the revised manuscript).
(2) Evidence: Four new sets of experiments directly address the specific evidence gaps identified by the reviewers: (i) GP enzyme activity measurements in RNAi-treated larvae; (ii) expression analysis of alternative glycogen catabolic enzymes; (iii) molecular docking and MM/GBSA binding free energy analysis; (iv) comprehensive fitness cost assessment including feeding rate, larval weight, pupal weight, adult wing area, and female fecundity.
Public Reviews:
Reviewer #1 (Public review):
Summary:
In this study, the authors investigate whether glycogen phosphorylase is a potential molecular target of benzoylphenylurea insecticides and examine the physiological consequences of inhibiting glycogen breakdown in the diamondback moth Plutella xylostella. The authors express and characterize recombinant glycogen phosphorylase, test its inhibition by a mammalian glycogen phosphorylase inhibitor and by the insecticide diflubenzuron, and assess the physiological effects of glycogen phosphorylase inhibition through chemical exposure and RNA interference. Based on these experiments, the authors conclude that benzoylphenylurea insecticides do not target glycogen phosphorylase and propose that insects compensate for glycogen phosphorylase inhibition through activation of gluconeogenesis, allowing them to maintain glucose homeostasis and complete development despite strong suppression of the enzyme.
Strengths:
The study addresses an interesting and long-standing question in insect toxicology regarding the mechanism of action of benzoylphenylurea insecticides. The authors combine several complementary approaches, including recombinant enzyme characterization, inhibitor assays, RNA interference, gene expression analyses, and metabolite measurements. The biochemical characterization of the recombinant glycogen phosphorylase and the demonstration that the tested glycogen phosphorylase inhibitor can strongly inhibit enzyme activity represent important technical strengths. In addition, the study integrates biochemical and physiological observations to explore how insects might compensate for disruptions in central carbohydrate metabolism.
We are grateful that Reviewer 1 recognized the study's strengths, including the complementary multi-approach strategy, the biochemical characterization of recombinant PxGP, and the integration of biochemical and physiological observations.
Weaknesses:
(1) The proposed compensatory mechanism relies on indirect evidence; direct measurements of gluconeogenic flux are lacking.
We agree that isotopic tracer experiments would provide the most direct evidence for gluconeogenic flux. Such experiments are beyond the scope of the current revision, and we now explicitly acknowledge this as a key limitation and an important direction for future research (revised Discussion: Study limitations and future directions).
However, we note that the convergent evidence from multiple independent lines collectively supports gluconeogenic activation: (i) transcriptional upregulation of PEPCK and G-6-Pase; (ii) declining protein levels now independently confirmed by our new enzyme activity data showing a 30.78% decrease in total protein concentration at 24 h post-RNAi (new Figure 10A); (iii) altered amino acid profiles; and (iv) maintained trehalose levels. The revised manuscript presents this evidence more cautiously, framing it as “consistent with gluconeogenic compensation” rather than establishing metabolic flux.
Additionally, we now provide new data on GP enzyme activity (new Figure 10A, B; see response to Recommendation 4 below) and alternative glycogen catabolic enzyme expression (new Figure 10C, D; see response to Recommendation 2 below) that further strengthen the evidence chain.
(2) Alternative glycogen degradation pathways are proposed but not experimentally examined.
We have now directly addressed this concern. RT-qPCR analysis of glycogen branching enzyme (GBE) and α-amylase following PxGP knockdown reveals a striking and informative differential response (new Figure 10C, D):
GBE was significantly upregulated at 24 h (+29.24%, P < 0.05), 48 h (+16.78%, P < 0.05), and 96 h (+44.46%, P < 0.001), indicating transcriptional activation of an alternative glycogen-remodeling enzyme in response to GP suppression.
α-Amylase showed no significant change at any time point, demonstrating that the compensatory response is pathway-specific rather than a generalized upregulation of all glycogen-degrading enzymes.
This differential pattern — GBE up, α-Amylase unchanged — provides the first evidence that P. xylostella selectively activates specific glycogen remodeling pathways when GP function is compromised. Upregulation of GBE, which increases glycogen branching and solubility, may facilitate glycogen mobilization through alternative routes even when GP-mediated phosphorolysis is impaired. These data are incorporated as new Figure 10C, D and discussed in the revised Results and Discussion.
(3) Physiological consequences (fitness costs) are not explored.
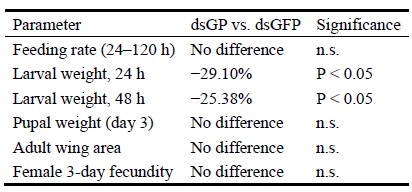
We have now conducted a comprehensive fitness cost assessment (new Figure 11). The results reveal a transient but significant fitness cost confined to the larval stage:
Feeding rate: no significant difference between dsGP and dsGFP groups at any time point (24–120 h; Figure 11B), confirming that the observed metabolic changes are not attributable to reduced food intake.
Larval weight: significantly reduced at 24 h (−29.10%, P < 0.05) and 48 h (−25.38%, P < 0.05; Figure 11C), demonstrating a measurable short-term cost of metabolic compensation.
Pupal weight: no significant difference (Figure 11D), indicating full recovery before the pupal transition.
Adult wing area: no significant difference (Figure 11E, Figures S5–S6), suggesting no impairment of flight capacity.
Female fecundity (3-day egg production): no significant difference (Figure 11F), demonstrating no reduction in reproductive output.
This pattern — transient larval weight loss with complete recovery of pupal weight, wing morphology, and reproductive performance — is consistent with our proposed model: GP suppression triggers protein catabolism to fuel gluconeogenesis (explaining the short-term weight loss), but the compensatory mechanism is sufficiently effective to restore metabolic homeostasis before pupation. These data strengthen the conclusion that GP is functionally non-essential for completing development and reproduction.
(4) Broader conclusions regarding BPU class may require testing additional compounds.
We agree. The revised manuscript now explicitly limits the biochemical conclusion to diflubenzuron: “DFB does not inhibit PxGP” rather than making broader claims about the BPU class as a whole. We discuss this as a limitation and note that testing additional BPU compounds would be needed before generalizing.
(5) Some biochemical and cell-based observations would benefit from confirmation in whole insects.
We have now provided whole-insect confirmation through: (i) GP enzyme activity measurements in RNAi-treated larvae (new Figure 10A, B); (ii) in vivo fitness assessment showing measurable physiological consequences of GP suppression (new Figure 11); and (iii) expression analysis of compensatory enzymes in intact larvae (new Figure 10C, D). These data bridge the gap between our cell-free biochemical observations and whole-organism biology.
Reviewer #2 (Public review):
(1) The central premise — that structural similarity among acylurea compounds implies shared targets — is not supported.
We agree that the original manuscript overstated the significance of the shared acylurea core as a predictor of common biological activity. The Introduction has been substantially restructured to:
Explicitly acknowledge the compelling genetic evidence from CRISPR/Cas9 experiments (Reference 5) establishing CHS as the primary site conferring BPU resistance.
Reframe the study's objective: rather than proposing to “resolve” the BPU target controversy, the revised manuscript focuses on the systematic evaluation of GP as an independent insecticidal target and the discovery of a gluconeogenic compensation mechanism — questions with scientific value independent of the BPU mechanism debate.
Remove the claim that the study “resolves the primary hypothesis.” The conclusion now states that our biochemical data demonstrate DFB does not inhibit PxGP, adding enzyme-level evidence to the existing genetic framework.
(2) Target selectivity is determined by side-chain composition, not the shared acylurea core.
We fully agree, and our new structural data now provide a molecular explanation for this principle at the atomic level. Molecular docking and MM/GBSA analysis (new Figure 12, new Table 1) reveal that both GPI and DFB anchor to PxGP through their common acylurea carbonyl groups (Arg193), but diverge dramatically in side-chain engagement:
GPI's methoxyphenyl-methylurea moiety establishes extensive contacts with seven residues across both subunits (Asn44 and Val45 from chain A; Trp67, Gln71, Tyr75, Arg193, and Asp227 from chain B), binding at the allosteric site at the dimer interface — consistent with the experimentally determined binding mode of acylurea inhibitors in mammalian GP (PDB: 2ATI).
DFB contacts six residues primarily from subunit B, and its difluorobenzoyl moiety remains entirely solvent-exposed without productive protein contacts.
MM/GBSA analysis confirms GPI binds with substantially higher affinity (ΔG = −34.63 vs. −29.29 kcal/mol; ΔΔG = −5.34 kcal/mol), with van der Waals interactions as the dominant driver (Δ<sub>VDW</sub> = −11.49 kcal/mol), reflecting superior shape complementarity of GPI.
These structural data directly support Reviewer 2's important point and are now presented as new Figure 12 and Table 1.
(3) References 6–9 characterization.
We have replaced the original citations (former References 6–9) in the Introduction with references that directly demonstrate the absence of CHS inhibition by BPUs in cell-free preparations: Cohen & Casida (1980) showed DFB did not inhibit Tribolium gut chitin synthetase; Mayer et al. (1981) and Cohen (1985) systematically confirmed that BPU-type insect growth regulators do not inhibit chitin synthase in cell-free assays; and Zhang & Zhu (2013) reported only slight in vitro CHS inhibition by DFB in Anopheles gambiae with no in vivo effect. We also cite authoritative reviews by Matsumura (2010) and Merzendorfer (2013) that contextualize this evidence gap. We thank Reviewer 2 for identifying this important citation issue, which has led to a substantially more accurate and well-supported presentation of the literature.
(4) The term “dataology” is non-standard.
This term has been removed and replaced with “data.” In accordance with eLife's policy on AI tools and technology, we have added a statement in the Materials and Methods section declaring that AI-based language editing tools were used for English grammar and style refinement. All scientific content was generated entirely by the authors.
Recommendations for the authors:
Reviewer #1 (Recommendations for the authors):
(1) Direct assessment of gluconeogenic flux (e.g., metabolic tracer experiments).
As discussed above, isotopic tracer experiments are beyond the current scope. We acknowledge this as a key limitation in the revised Discussion (see details in lines 560-565 of the revised manuscript). However, we now provide additional supporting evidence: the 30.78% decline in total protein at 24 h post-RNAi (from our new enzyme activity data, Figure S3) provides independent biochemical confirmation of protein catabolism, consistent with amino acid mobilization for gluconeogenesis (see details in lines 357-359 of the revised manuscript). We have also added discussion of potential future approaches, including measurements of key enzymes in amino acid catabolism (e.g., aspartate aminotransferase, glutamate aminotransferase) and lipid content dynamics (see details in lines 565-569 of the revised manuscript).
(2) Expression or activity of alternative glycogen degradation enzymes (α-amylase, glycogen debranching enzymes).
We have measured the expression of GBE (glycogen branching enzyme) and α-amylase by RT-qPCR in RNAi-treated insects. We also attempted to measure glycogen debranching enzyme (GDE), but multiple primer pairs failed to yield amplification products, likely due to sequence annotation issues; this is noted as a limitation.
Results (new Figure 10C, D): GBE was significantly upregulated at 24 h (+29.24%), 48 h (+16.78%), and 96 h (+44.46%). α-Amylase was unchanged at all time points (see details in lines 377-381 of the revised manuscript). The selective upregulation of GBE but not α-amylase suggests a targeted compensatory response within the glycogen remodeling pathway.
The absence of glycogen accumulation following GP knockdown may reflect reduced flux into glycogen synthesis (potentially through feedback inhibition of glycogen synthase) rather than activation of alternative degradative routes. This possibility is discussed in the revised manuscript, with glycogen synthase expression identified as a key target for future investigation (see details in lines 501-505 of the revised manuscript).
(3) Fitness cost assessment (body size, flight capacity, reproductive performance).
Complete data are now provided (new Figure 11A–F, Figures S5–S6):
Author response table 1.
The transient larval weight reduction (24–48 h) with complete pupal and adult recovery demonstrates that metabolic compensation carries a short-term physiological cost but is ultimately effective in maintaining developmental trajectory and reproductive fitness (see details in lines 388-408 of the revised manuscript).
(4) Enzyme activity measurements in RNAi-treated insects.
GP enzyme activity (GP-a) was measured in crude extracts from RNAi-treated larvae using a coupled-enzyme spectrophotometric assay kit (Solarbio BC3345) at 24, 48, 72, and 96 h post-injection (new Figure 10A, B).
Two normalization approaches were used: - Per-protein activity: significant reduction only at 48 h (−10.35%, P < 0.05; Figure 10A). The modest per-protein reduction reflects a concurrent 30.78% decline in total protein at 24 h, which inflates per-protein specific activity when the protein pool shrinks. - Per-larva activity: significant reduction at 24 h (−27.57%, P < 0.05) and 48 h (−29.28%, P < 0.01; Figure 10B), confirming that RNAi-mediated transcript suppression translates to reduced enzyme function in vivo.
The 30.78% decline in total protein at 24 h provides independent biochemical confirmation of protein catabolism — consistent with amino acid mobilization for gluconeogenesis (see details in lines 349-370 of the revised manuscript).
(5) Scope of BPU conclusion — clarify whether additional compounds should be tested.
The revised manuscript explicitly states that the biochemical conclusion applies to diflubenzuron specifically. We have added a Discussion paragraph noting that extending this conclusion to additional BPU compounds would require systematic testing, and that our structural analysis (Table 1) provides a framework for predicting which acyl urea side-chain architectures are compatible with GP binding (see details in lines 455-466 of the revised manuscript).
(6) RNAi transcript recovery at 96 h and implications for non-essentiality.
Our new enzyme activity data directly address this concern. GP activity (per-larva) showed partial recovery at 72 h and 96 h (Figure 10B), mirroring the transcript recovery pattern. However, the critical observation is that even during the period of maximum suppression (24–48 h), when per-larva GP activity was reduced by ~27–30%, larvae maintained glucose homeostasis and completed development. This confirms that GP is non-essential even during the period of strongest suppression. The revised Discussion addresses this point explicitly (see details in lines 479-488 of the revised manuscript).
(7) GPI concentrations in larval exposure experiments and pharmacokinetic considerations.
We have added a dedicated Discussion paragraph addressing this concern in detail. The GPI concentrations used (250–500 mg/L in diet) encompass a wide dose range; even at the highest concentration (500 mg/L, approximately 409,000-fold above the in vitro IC<sub>50</sub> of 2.96 nM), no toxicity was observed. We discuss several pharmacokinetic factors that may contribute to this apparent discrepancy, including limited oral bioavailability, metabolic inactivation by detoxification enzymes, and sequestration by hemolymph binding proteins. However, we note that the metabolic phenotype observed (elevated trehalose, reduced protein, upregulated gluconeogenic enzymes) provides indirect evidence that GPI does reach its target. The most parsimonious interpretation is that GPI achieves sufficient target engagement to partially suppress GP activity in vivo, but metabolic compensation renders this suppression non-lethal — an interpretation reinforced by our RNAi data, in which direct genetic suppression of GP (bypassing all pharmacokinetic barriers) similarly fails to cause mortality (see details in lines 536-552 of the revised manuscript).
(8) Structural evidence that GPI binds PxGP comparably to its mammalian target.
This has been comprehensively addressed through molecular docking and MM/GBSA analysis (new Figure 12, new Table 1). The PxGP homodimer structure was modeled using SWISS-MODEL with the human liver GP–acyl urea co-crystal structure (PDB: 2ATI) as the template. Docking and binding free energy calculations were performed in Cresset Flare V11.
Key findings: GPI binds at the allosteric site at the dimer interface with ΔG = −34.63 kcal/mol, engaging seven residues across both subunits — a binding mode consistent with the experimentally determined site in mammalian GP. DFB binds with lower affinity (ΔG = −29.29 kcal/mol) and its difluorobenzoyl moiety is entirely solvent-exposed. Van der Waals interactions are the dominant driver of selectivity (Δ<sub>VDW</sub> = −11.49 kcal/mol). See new Figure 12 and Table 1 for complete data.
(9) Dietary carbohydrate compensation and feeding behavior.
Our new data directly address this concern. Feeding rate measurements show no significant difference between dsGP and dsGFP groups at any time point (24–120 h; Figure 11B), confirming that the metabolic changes are not attributable to altered food intake. A Discussion paragraph has been added acknowledging the potential contribution of dietary carbohydrates to glucose homeostasis and noting that starvation-challenge experiments would provide additional insight (see details in lines 570-581 of the revised manuscript).
Minor comments and suggestions
(1) Terminology.
“Gluconeogenolysis” has been replaced with “gluconeogenesis” throughout the manuscript.
(2) Typographical errors.
A thorough language revision has been performed. “Over over four decades” and other errors have been corrected. The term “dataology” has been removed.
(3) Metabolite normalization.
We now present GP enzyme activity using two normalization approaches (per-protein and per-larva; Figure 10A, B) and discuss the implications of protein level changes on per-protein normalization in the Results section. For metabolite data, we have added a note in the Methods explaining our normalization approach and discussing how declining protein levels may influence interpretation (see details in lines 908-920 of the revised manuscript).
(4) Clarity of pathway descriptions.
The description of metabolic pathways has been simplified and a revised schematic figure has been included (Figure 13).
(5) Figure clarity.
Figures have been added with clearer labeling and simplified schematics. To improve clarity, we used red arrows to show the blocked metabolic flow when GP is inhibited, and green arrows to depict the activated gluconeogenic pathway (Figure 13).
Cohen E, Casida JE. Inhibition of Tribolium gut chitin synthetase. Pestic Biochem Physiol. 1980;13(2):129-36. doi: 10.1016/0048-3575(80)90064-4.
Mayer RT, Chen AC, DeLoach JR. Chitin synthesis inhibiting insect growth regulators do not inhibit chitin synthase. Experientia. 1981;37(4):337-8. doi: 10.1007/BF01959848.
Cohen E. Chitin synthetase activity and inhibition in different insect microsomal preparations. Experientia. 1985;41(4):470-2. doi: 10.1007/BF01966152.
Zhang X, Yan Zhu K. Biochemical characterization of chitin synthase activity and inhibition in the African malaria mosquito, Anopheles gambiae. Insect Sci. 2013;20(2):158-66. doi: 10.1111/j.1744-7917.2012.01568.x.
Matsumura F. Studies on the action mechanism of benzoylurea insecticides to inhibit the process of chitin synthesis in insects: A review on the status of research activities in the past, the present and the future prospects. Pestic Biochem Physiol. 2010;97(2):133-9. doi: 10.1016/j.pestbp.2009.10.001.
Merzendorfer H. Chitin synthesis inhibitors: old molecules and new developments. Insect Sci. 2013;20(2):121-38. doi: 10.1111/j.1744-7917.2012.01535.x
Preiss J. Bacterial glycogen synthesis and its regulation. Annual review of microbiology. 1984;38:419-58. doi: 10.1146/annurev.mi.38.100184.002223.
Janeček Š, Svensson B, MacGregor EA. α-Amylase: an enzyme specificity found in various families of glycoside hydrolases. Cell Mol Life Sci. 2014;71(7):1149-70. doi: 10.1007/s00018-013-1388-z.
Waterhouse A, Bertoni M, Bienert S, Studer G, Tauriello G, Gumienny R, et al. SWISS-MODEL: homology modelling of protein structures and complexes. Nucleic Acids Res. 2018;46(W1):W296-W303. doi: 10.1093/nar/gky427.
İnak E, De Rouck S, Van Leeuwen T. Molecular mechanisms of pesticide selectivity: Insights from acaricide toxicology. Pestic Biochem Physiol. 2025;213:106537. doi: 10.1016/j.pestbp.2025.106537.
David MD. Insecticide ADME for support of early-phase discovery: combining classical and modern techniques. Pest Manage Sci. 2017;73(4):692-9. doi: 10.1002/ps.4345.
Haunerland NH, Bowers WS. Binding of insecticides to lipophorin and arylphorin, two hemolymph proteins of Heliothis zea. Arch Insect Biochem Physiol. 1986;3(1):87-96. doi: 10.1002/arch.940030110.
Other revisions
Correction of primer sequences. Upon re‑checking the primer sequences during revision, we noticed that the originally reported primers for dsRNA synthesis of the GP gene (Table S1) were inadvertently copied incorrectly. The correct sequences have now been substituted in the revised manuscript (dsPxGP-F, dsPxGP-R). This correction does not affect any of the experimental data, results, or conclusions of the study. We apologize for the oversight.
eLife Assessment
This important study provides convincing evidence that envelope-carrying Ty3/gypsy retrotransposons (errantiviruses) are ancient and widespread across nearly all major animal phyla, with distribution in many lineages that are consistent with recent or ongoing genomic expansion. Using comprehensive phylogenetic and AlphaFold2-based structural analyses, together with new host-taxonomy concordance tests, the authors show that these elements independently acquired membrane fusion proteins early in metazoan evolution, likely predating the bilaterian-non-bilaterian split. The work offers significant insights into the deep evolutionary roots of retroelement-envelope associations and the origins of retroviruses.
Reviewer #1 (Public review):
[Editors' note: this version has been assessed by the Reviewing Editor without further input from the original reviewers. The revision clarifies terminology, more carefully distinguishes element intactness from demonstrated transpositional activity, and better acknowledges the roles of lineage-specific loss and localized horizontal transfer alongside vertical inheritance.]
Summary:
This manuscript provides a comprehensive systematic analysis of envelope-containing Ty3/gypsy retrotransposons (errantiviruses) across metazoan genomes, including both invertebrates and ancient animal lineages. Using iterative tBLASTn mining of over 1,900 genomes, the authors catalog 1,512 intact retrotransposons with uninterrupted gag, pol, and env open reading frames. They show that these elements are widespread-present in most metazoan phyla, including cnidarians, ctenophores, and tunicates-with active proliferation indicated by their multicopy status. Phylogenetic analyses distinguish "ancient" and "insect" errantivirus clades, while structural characterization (including AlphaFold2 modeling) reveals two major env types: paramyxovirus F-like and herpesvirus gB-like proteins. Although bot envelope types were identified in previous analyses two decades ago, the evolutionary provenance of these envelope genes was almost rudimentary and anecdotal (I can say this because I authored one of these studies). The results in the present study support an ancient origin for env acquisition in metazoan Ty3/gypsy elements, with subsequent vertical inheritance and limited recombination between env and pol domains. The paper also proposes an expanded definition of 'errantivirus' for env-carrying Ty3/gypsy elements outside Drosophila.
Strengths:
(1) Comprehensive Genomic Survey:
The breadth of the genome search across non-model metazoan phyla yields an impressive dataset covering evolutionary breadth, with clear documentation of search iterations and validation criteria for intact elements.
(2) Robust Phylogenetic Inference:
The use of maximum likelihood trees on both pol and env domains, with thorough congruence analysis, convincingly separates ancient from lineage-specific elements and demonstrates co-evolution of env and pol within clades.
(3) Structural Insights:
AlphaFold2-based predictions provide high-confidence structural evidence that both env types have retained fusion-competent architectures, supporting the hypothesis of preserved functional potential.
(4) Novelty and Scope:
The study challenges previous assumptions of insect-centric or recent env acquisition and makes a compelling case for a Pre-Cambrian origin, significantly advancing our understanding of animal retroelement diversity and evolution. THIS IS A MAJOR ADVANCE.
(5) Data Transparency:
I appreciate that all data, code, and predicted structures are made openly available, facilitating reproducibility and future comparative analyses.
Original Major Weaknesses:
(1) Functional Evidence Gaps:
The work rests largely on sequence and structure prediction. No direct expression or experimental validation of envelope gene function or infectivity outside Drosophila is attempted, which would be valuable to corroborate the inferred roles of these glycoproteins in non-insect lineages. At least for some of these species, there are RNA-seq datasets that could be leveraged.
(2) Horizontal Transfer vs. Loss Hypotheses:
The discussion argues primarily for vertical inheritance, but the somewhat sporadic phylogenetic distributions and long-branch effects suggest that loss and possibly rare horizontal events may contribute more than acknowledged. Explicit quantitative tests for horizontal transfer, or reconciliation analyses, would strengthen this conclusion. It's also worth pointing out that, unlike retrotransposons that can be found in genomes, any potential related viral envelopes must, by definition, have a spottier distribution due to sampling. I don't think this challenges any of the conclusions, but it must be acknowledged as something that could affect the strength of this conclusion
(3) Limited Taxon Sampling for Certain Phyla:
Despite the impressive breadth, some ancient lineages (e.g., Porifera, Echinodermata) are negative, but the manuscript does not fully explore whether this reflects real biological absence, assembly quality, or insufficient sampling. A more systematic treatment of negative findings would clarify claims of ubiquity. However, I also believe this falls beyond the scope of this study.
(4) Mechanistic Ambiguity:
The proposed model that env-containing elements exploit ovarian somatic niches is plausible but extrapolated from Drosophila data; for most taxa, actual tissue specificity, lifecycle, or host interaction mechanisms remain speculative and, to me, a bit unreasonable.
Reviewer #2 (Public review):
Summary:
The authors first surveyed metazoan genomes to identify homologs of Drosophila errantiviruses and classified them into two groups, "insect" and "ancient" elements, supporting the hypothesis of an early evolutionary origin for these retrotransposons. They subsequently identified two distinct types of envelope proteins, one resembling the glycoprotein F of paramyxoviruses and the other akin to the glycoprotein B of herpesviruses. Despite differences in their primary amino acid sequences, these proteins display notable structural similarity in their predicted domain architectures. The congruence between the phylogenies of the envelope and pol genes further supports the ancient origin of the envelope genes, challenging earlier hypotheses that proposed recent recombination events with baculoviruses. Additional analysis of the Pol "bridge region" corroborated the divergence among these elements, consistent with a pattern of limited cross-species recombination. Finally, by comparing these elements with non-envelope-containing Gypsy retrotransposons, the authors concluded that errantiviruses originated from multiple elements independently.
Strengths:
The conclusions of this study are based on a comprehensive collection of errantiviruses identified across a wide range of metazoan genomes. These findings are further supported by multiple lines of evidence, including phylogenetic congruence and the diverse evolutionary origins of envelope genes. AlphaFold2-assisted protein domain structure analyses also provided key insights into the characterization of these elements. Together, these results present a compelling case that errantiviruses arose independently through multiple evolutionary events, extending well beyond previous hypotheses.
Original Weaknesses:
It would be beneficial to emphasize in the Abstract the potential impact of this work by more clearly articulating the current knowledge gap in the field. While the second paragraph of the Introduction briefly touches on this point, highlighting the broader significance in the Abstract would better capture readers' interest. Additionally, some methodological choices would benefit from clearer justification and explanation. For instance, in Figure 6, the selection of the bridge region/RNase H domain is not explicitly explained, leaving the rationale for its choice unclear.
Reviewer #3 (Public review):
Summary and Significance:
In this work, Cary and Hayashi address the important question of when, in evolution, certain mobile genetic elements (Ty3/gypsy-like non-LTR retrotransposons) associated with certain membrane fusion proteins (viral glycoprotein F or B-like proteins), which could allow these mobile genetic elements to be transferred between individual cells of a given host. It is debated in the literature whether the acquisition of membrane fusion proteins by non-LTR retrotransposons is a rather recent phenomenon that separately occurred in the ancestors of certain host species or whether the association with membrane fusion proteins is a much more ancient one, pre-dating the Cambrian explosion. Obviously, this question also touches upon the origin of the retroviruses, which can spread between individuals of a given host but seem restricted to vertebrates. Based on convincing data, Cary and Hayashi argue that an ancient association of non-LTR retrotransposons with membrane fusion proteins is most probable.
Strengths:
The authors take the smart approach to systematically retrieve apparently complete, intact, and recently functional Ty3/gypsy-like non-LTR retrotransposons that, next to their characteristic gag and pol genes, additionally carry sequences that are homologous to viral glycoprotein F (env-F) or viral glycoprotein B (env-B). They then construct and compare phylogenetic trees of the host species and individual encoded proteins and protein domains, where 3D-structure calculations and other features explain and corroborate the clustering within the phylogenetic trees. Congruence of phylogenetic trees and correlation of structural features is then taken as evidence for an infrequent recombination and a long-term co-evolution of the reverse transcriptase (encoded by the pol gene) and its respective putative membrane fusion gene (encoded by env-F or env-B). Importantly, the env-F and env-B containing retrotransposons do not form a monophyletic group among the Ty3/gypsy-like non-LTR retrotransposons, but are scattered throughout, supporting the idea of an originally ancient association followed by a random loss of env-F/env-B in individual branches of the tree (and rather rare re-associations via more recent recombinations).
Author response:
The following is the authors’ response to the original reviews.
In the revised manuscript, we have clarified several points that were raised by the reviewers. First, we now state more explicitly that the presence of intact env-containing Ty3/gypsy retrotransposons does not by itself demonstrate their mechanism of transmission, tissue specificity, infectivity, or current activity. We have therefore revised the wording throughout the manuscript to distinguish intact element structure and multicopy genomic expansion from experimentally demonstrated activity.
Second, we performed targeted host-taxonomy concordance analyses on selected clades of the POL RT tree. These analyses do not exclude local horizontal transfer, particularly between closely related hosts, but they show that horizontal transfer alone is insufficient to explain the broader host-taxonomic structure observed across the dataset.
Third, we incorporated representative viral and retroelement-associated fusogen proteins into our F-type ENV phylogenetic analysis and HSV/gB-type ENV structural comparison. These additions place the ENV proteins associated with Ty3/gypsy elements in a broader evolutionary context and strengthen the conclusion that these ENV associations are deeply diverged rather than recent derivatives of a single sampled viral lineage.
Fourth, we added two each of entirely new Supplementary figures (S5 and S7) and Tables (S2 and S3) and substantially modified now Supplementary figure S8. Other figures have also been modified only to increase readability. The four tables from the original manuscript have not been modified although their numbering has changed.
We believe that the revised manuscript is substantially improved in clarity, terminology and interpretive precision, while retaining the central conclusion that the association between env-like genes and Ty3/gypsy retrotransposons is ancient in metazoan evolution. Sincerely,
Public Reviews:
Reviewer #1 (Public review):
Summary:
This manuscript provides a comprehensive systematic analysis of envelope-containing Ty3/gypsy retrotransposons (errantiviruses) across metazoan genomes, including both invertebrates and ancient animal lineages. Using iterative tBLASTn mining of over 1,900 genomes, the authors catalog 1,512 intact retrotransposons with uninterrupted gag, pol, and env open reading frames. They show that these elements are widespread present in most metazoan phyla, including cnidarians, ctenophores, and tunicates-with active proliferation indicated by their multicopy status. Phylogenetic analyses distinguish "ancient" and "insect" errantivirus clades, while structural characterization (including AlphaFold2 modeling) reveals two major env types: paramyxovirus F-like and herpesvirus gB-like proteins. Although bot envelope types were identified in previous analyses two decades ago, the evolutionary provenance of these envelope genes was almost rudimentary and anecdotal (I can say this because I authored one of these studies). The results in the present study support an ancient origin for env acquisition in metazoan Ty3/gypsy elements, with subsequent vertical inheritance and limited recombination between env and pol domains. The paper also proposes an expanded definition of 'errantivirus' for env-carrying Ty3/gypsy elements outside Drosophila.
Strengths:
(1) Comprehensive Genomic Survey:
The breadth of the genome search across non-model metazoan phyla yields an impressive dataset covering evolutionary breadth, with clear documentation of search iterations and validation criteria for intact elements.
(2) Robust Phylogenetic Inference:
The use of maximum likelihood trees on both pol and env domains, with thorough congruence analysis, convincingly separates ancient from lineage-specific elements and demonstrates co-evolution of env and pol within clades.
(3) Structural Insights:
AlphaFold2-based predictions provide high-confidence structural evidence that both env types have retained fusion-competent architectures, supporting the hypothesis of preserved functional potential.
(4) Novelty and Scope:
The study challenges previous assumptions of insect-centric or recent env acquisition and makes a compelling case for a Pre-Cambrian origin, significantly advancing our understanding of animal retroelement diversity and evolution. THIS IS A MAJOR ADVANCE.
(5) Data Transparency:
I appreciate that all data, code, and predicted structures are made openly available, facilitating reproducibility and future comparative analyses.
Major Weaknesses
(1) Functional Evidence Gaps:
The work rests largely on sequence and structure prediction. No direct expression or experimental validation of envelope gene function or infectivity outside Drosophila is attempted, which would be valuable to corroborate the inferred roles of these glycoproteins in non-insect lineages. At least for some of these species, there are RNA-seq datasets that could be leveraged.
We added a sentence in the discussion, subsection “The survival mechanism of errantiviruses in the genome”, citing our recent work now published (PMID: 41922845), explaining that the defence mechanism against errantiviruses appears to be conserved in insects beyond Drosophila, indirectly suggesting that their biology dependent on the presence of env—may be more universal.
(2) Horizontal Transfer vs. Loss Hypotheses:
The discussion argues primarily for vertical inheritance, but the somewhat sporadic phylogenetic distributions and long-branch effects suggest that loss and possibly rare horizontal events may contribute more than acknowledged. Explicit quantitative tests for horizontal transfer, or reconciliation analyses, would strengthen this conclusion. It's also worth pointing out that, unlike retrotransposons that can be found in genomes, any potential related viral envelopes must, by definition, have a spottier distribution due to sampling. I don't think this challenges any of the conclusions, but it must be acknowledged as something that could affect the strength of this conclusion
We have added a targeted host-taxonomy concordance analysis for two well-sampled POL extended RT/connection subclades: an Annelida-associated clade from tree position A6 and a Lepidoptera-associated clade from tree position I1 (new Fig S5). Rather than attempting to infer exact numbers of duplication, loss and horizontal transfer events, which is difficult across highly expanded and unevenly sampled transposon families, we tested whether host-taxonomic labels were more clustered on the observed POL extended RT/connection topology than expected by chance. In the Annelida clade, highly supported small subclades showed strong host-family and host species concordance under host-label permutation tests. The Lepidoptera clade showed a more mixed pattern, but still contained several highly supported subclades enriched for related host groups at the superfamily or broader taxonomic level. These results do not exclude rare horizontal transfer, particularly between closely related hosts, but support the conclusion that the observed POL extended RT/connection trees retain significant host-taxonomic structure and are not consistent with frequent broad horizontal transfer between distantly related animal groups. We have added a paragraph in the Results section “Multiple intact elements of env-carrying Ty3/gypsy retrotransposons are found widespread across metazoan species” describing these observations, and also revised the Discussion to more explicitly acknowledge the possibilities of lineage-specific loss and the horizontal transfer.
(3) Limited Taxon Sampling for Certain Phyla:
Despite the impressive breadth, some ancient lineages (e.g., Porifera, Echinodermata) are negative, but the manuscript does not fully explore whether this reflects real biological absence, assembly quality, or insufficient sampling. A more systematic treatment of negative findings would clarify claims of ubiquity. However, I also believe this falls beyond the scope of this study.
In the revised manuscript, we have added a targeted analysis of two representative genomes from each phylum. Although we did not detect full-length GAG-POL-ENV elements in these genomes, we recovered multiple full-length, multicopy GAG-POL Ty3/gypsy elements from all four genomes, many of which were flanked by predicted LTR sequences and associated with putative tRNA primer-binding sites. This suggests that the apparent absence of env-carrying elements in these representative Porifera and Echinodermata genomes is unlikely to be due simply to poor assembly quality or a general inability to recover intact Ty3/gypsy-like retrotransposons. We have added these data as the new Supplementary table S3 and revised the Results section “Multiple intact elements of env-carrying Ty3/gypsy retrotransposons are found widespread across metazoan species” to clarify that absence in these phyla may reflect true biological absence, lineage-specific loss, or incomplete taxon sampling.
(4) Mechanistic Ambiguity:
The proposed model that env-containing elements exploit ovarian somatic niches is plausible but extrapolated from Drosophila data; for most taxa, actual tissue specificity, lifecycle, or host interaction mechanisms remain speculative and, to me, a bit unreasonable.
We stressed in the Discussion section “The survival mechanism of errantiviruses in the genome” that the mere presence of env gene does not imply the mechanism of transmission of retrotransposons.
Minor Weaknesses:
(1) Terminology and Nomenclature:
The paper introduces and then generalizes the term "errantivirus" to non-insect elements. While this is logical, it may confuse readers familiar with the established, Drosophila-centric definition if not more explicitly clarified throughout. I also worry about changes being made without any input from the ICTV nomenclature committee, which just went through a thorough reclassification. Nevertheless, change is expected, and calling them all errantiviruses is entirely reasonable.
We have revised the Results section and discussion where we introduced the term "errantivirus" to clarify that we use "errantivirus" operationally to refer to env-containing Ty3/gypsy retrotransposons identified in this study, rather than as a formal taxonomic proposal. We also now state explicitly that bona fide infectivity and amplification through the Drosophila-like ovarian somatic-cell route have not been experimentally established for most non-Drosophila elements. Our use of the term is therefore intended to distinguish env-containing Ty3/gypsy elements from related non-env containing Ty3/gypsy retrotransposons, while acknowledging that their biology outside Drosophila remains to be determined.
(2) Figures and Supplementary Data Navigation:
Some key phylogenies and domain alignments are found only in supplementary figures, occasionally hindering readability for non-expert audiences. Selected main-text inclusion of representative trees would benefit accessibility.
We agree that clearer navigation between the main text and supplementary figures would improve readability. Although we considered moving selected supplementary phylogenies and alignments into the main figures, the main figures are already data-dense and are intended to provide representative summaries across many host groups and ENV types. We therefore retained the detailed trees and alignments as supplementary figures, where they can be shown at readable scale, but revised the manuscript to improve navigation. Specifically, we added signposting sentences in the Results where supplementary figures are mentioned, expanded the relevant figure legends, and clarified how each supplementary tree or alignment supports the corresponding main-text conclusion.
(3) ORF Integrity Thresholds:
The cutoff choices for defining "intact" elements (e.g., numbers/placement of stop codons, length ranges) are reasonable but only lightly justified. More rationale or sensitivity analysis would improve confidence in the inclusion criteria. For example, how did changing these criteria change the number of intact elements?
We agree with the reviewer that the rationale for the ORF integrity thresholds should be stated more clearly. We have revised the Methods section "Identification of intact genomic copies of Ty3/gypsy errantiviruses" to clarify that the initial length, gap and stop-codon thresholds were deliberately permissive screening criteria, designed to avoid excluding divergent or non-canonical elements at the discovery stage. These initial filters were not used alone to define the final “intact” set. Candidate elements were subsequently subjected to multiple additional curation steps, including confirmation of Ty3/gypsy POL identity, recovery of full-length RT and Integrase domains within continuous ORFs, HHpred-based domain annotation of GAG, POL and ENV, and removal of elements with large domain truncations. Thus, the final set of intact elements is substantially more refined than would be implied by the initial stop codon or length thresholds alone.
A full sensitivity analysis varying each threshold across the entire iterative discovery and manual-curation pipeline would be difficult to interpret, because changing early permissive filters would alter the candidate pool that then undergoes downstream structural and phylogenetic validation. Instead, we have clarified in the Methods that the early thresholds were intended as inclusive prefilters, whereas final inclusion required intact domain architecture and phylogenetic/domain support.
(4) Minor Typos/Formatting:
The paper contains sporadic typographical errors and formatting glitches (e.g., misaligned figure labels, unrendered symbols) that should be addressed.
We now fixed these issues in the revised manuscript.
Reviewer #2 (Public review):
Summary:
The authors first surveyed metazoan genomes to identify homologs of Drosophila errantiviruses and classified them into two groups, "insect" and "ancient" elements, supporting the hypothesis of an early evolutionary origin for these retrotransposons. They subsequently identified two distinct types of envelope proteins, one resembling the glycoprotein F of paramyxoviruses and the other akin to the glycoprotein B of herpesviruses. Despite differences in their primary amino acid sequences, these proteins display notable structural similarity in their predicted domain architectures. The congruence between the phylogenies of the envelope and pol genes further supports the ancient origin of the envelope genes, challenging earlier hypotheses that proposed recent recombination events with baculoviruses. Additional analysis of the Pol "bridge region" corroborated the divergence among these elements, consistent with a pattern of limited cross-species recombination. Finally, by comparing these elements with non-envelope-containing Gypsy retrotransposons, the authors concluded that errantiviruses originated from multiple elements independently.
Strengths:
The conclusions of this study are based on a comprehensive collection of errantiviruses identified across a wide range of metazoan genomes. These findings are further supported by multiple lines of evidence, including phylogenetic congruence and the diverse evolutionary origins of envelope genes. AlphaFold2-assisted protein domain structure analyses also provided key insights into the characterization of these elements. Together, these results present a compelling case that errantiviruses arose independently through multiple evolutionary events, extending well beyond previous hypotheses.
Weaknesses:
It would be beneficial to emphasize in the Abstract the potential impact of this work by more clearly articulating the current knowledge gap in the field. While the second paragraph of the Introduction briefly touches on this point, highlighting the broader significance in the Abstract would better capture readers' interest. Additionally, some methodological choices would benefit from clearer justification and explanation. For instance, in Figure 6, the selection of the bridge region/RNase H domain is not explicitly explained, leaving the rationale for its choice unclear. As a minor point, some figure labels and texts are too small and difficult to read, and improving their legibility would enhance overall clarity.
We have revised the Abstract to more clearly state the knowledge gap addressed by this study: although env-containing Ty3/gypsy elements were known from Drosophila and sporadically reported in other animals, whether their association with env-like fusogen genes reflected recent, lineage-specific acquisitions or a much deeper evolutionary relationship remained unclear. We now highlight this broader significance in the Abstract and frame our results as evidence that env-containing Ty3/gypsy elements represent deeply diverged, genome-resident retroelements rather than a recent insect-specific phenomenon.
We have also revised the Results, Methods and Figure 6 legend to explain why the
RNase H-containing bridge region was analysed. Specifically, we now distinguish the Pol extended RT/connection region used for phylogenetic analysis from the RNase H-containing bridge region analysed structurally in Figure 6. We define the bridge region as the canonical RNase H domain together with the C-terminal region between RNase H and Integrase, and explain that this region was selected because RNase H-related and adjacent RNase H-like domains vary among LTR retroelement lineages. The bridge region architecture therefore provides an independent structural feature for comparing the “insect errantivirus” and “ancient errantivirus” groups.
Finally, we have revised the figures and figure legends to improve readability. In particular, we enlarged labels where possible, clarified figure annotations, corrected cross-references between main and supplementary figures, and added signposting sentences in the Results so that readers can more easily connect the main conclusions to the supporting supplementary trees and alignments.
Reviewer #3 (Public review):
Summary and Significance:
In this work, Cary and Hayashi address the important question of when, in evolution, certain mobile genetic elements (Ty3/gypsy-like non-LTR retrotransposons) associated with certain membrane fusion proteins (viral glycoprotein F or B-like proteins), which could allow these mobile genetic elements to be transferred between individual cells of a given host. It is debated in the literature whether the acquisition of membrane fusion proteins by non-LTR retrotransposons is a rather recent phenomenon that separately occurred in the ancestors of certain host species or whether the association with membrane fusion proteins is a much more ancient one, pre-dating the Cambrian explosion. Obviously, this question also touches upon the origin of the retroviruses, which can spread between individuals of a given host but seem restricted to vertebrates. Based on convincing data, Cary and Hayashi argue that an ancient association of non-LTR retrotransposons with membrane fusion proteins is most probable.
Strengths:
The authors take the smart approach to systematically retrieve apparently complete, intact, and recently functional Ty3/gypsy-like non-LTR retrotransposons that, next to their characteristic gag and pol genes, additionally carry sequences that are homologous to viral glycoprotein F (env-F) or viral glycoprotein B (env-B). They then construct and compare phylogenetic trees of the host species and individual encoded proteins and protein domains, where 3D-structure calculations and other features explain and corroborate the clustering within the phylogenetic trees. Congruence of phylogenetic trees and correlation of structural features is then taken as evidence for an infrequent recombination and a long-term co-evolution of the reverse transcriptase (encoded by the pol gene) and its respective putative membrane fusion gene (encoded by env-F or env-B). Importantly, the env-F and env-B containing retrotransposons do not form a monophyletic group among the Ty3/gypsy-like non-LTR retrotransposons, but are scattered throughout, supporting the idea of an originally ancient association followed by a random loss of env-F/env-B in individual branches of the tree (and rather rare re-associations via more recent recombinations).
Overall, this is valuable, stimulating, and important work of general and fundamental interest, but still also somewhat incompletely explored, imprecisely explained, and insufficiently put into context for a more general audience.
Weaknesses:
Some points that might be considered and clarified:
(1) Imprecise explanations, terms, and definitions:
It might help to add a 'definitions box' or similar to precisely explain how the authors decided to use certain terms in this manuscript, and then use these terms consistently and with precision.
(a) In particular, these are terms such as 'vertebrate retrovirus' vs 'retrovirus' vs 'endogenized retrovirus' vs 'endogenous retrovirus' vs 'non-LTR retrotransposon' and 'Ty3/gypsi-like retrotransposon' vs 'Ty3/gypsy retrotransposon' vs 'errantivirus'.
We agree with the reviewer. We inserted a paragraph at the end of the first Results section, explaining how we define endogenous retroviruses (ERVs), Ty3/gypsy retrotransposons and errantiviruses.
(b) The comment also applies to the term 'env' used for both 'env-F' and 'env-B', where often it remains unclear which of the two protein types the authors refer to. This is confusing, particularly in the methods, where the search for the respective homologs is described.
We revised the manuscript and now used F-type env/ENV and HSV/gB-type env/ENV throughout the text. We also modified the method section where we explained the tBlastn search to clarify which ENV proteins were used initially for the search and how we classified them in later analyses.
(c) Other examples are the use of the entire pol gene vs. pol-RT for the definition of the Ty3/gypsy clade and for the generation of phylogenetic trees (Methods and Figure S1), and the names for various portions of pol that appear without prior definition or explanation (e.g., 'pro' in Figure 1A, 'bridge' in Figure S1C, 'the chromodomain' in the text and Figure 7).
We revised the manuscript and explained ‘pro’, ‘bridge’ and ‘the chromodomain’ in the Results section or figure legends when they first appear. Please refer to other sections of the response for pol-RT definition.
(d) It is unclear from the main text which portions of pol were chosen to define pol-RT and why. The methods name the 'palm-and-fingers', 'thumb', and 'connections' domains to define RT. In the main text, the 'connection' domain is called 'tether' and is instead defined as part of the 'bridge' region following RT, which is not part of RT.
We agree that our previous terminology around Pol domains was imprecise and could confuse readers. We have revised the manuscript to distinguish the region used for phylogenetic analysis from the region analysed structurally in Figure 6. The phylogenetic analysis used an extended RT/connection region, comprising the RT polymerase core together with the downstream connection subdomain. This connection subdomain is treated as part of retroviral RT in structural studies, but corresponds to a partial RNase H-like fold and has been interpreted evolutionarily as a degenerated RNase H-like tether domain. It is therefore broader than the RT polymerase core alone, but it is not the complete canonical RNase H domain.
We now define the Figure 6 “bridge region” separately as the region spanning the canonical RNase H domain and the C-terminal region between RNase H and Integrase. Figure 6 shows that the invertebrate errantiviruses analysed retain an intact canonical RNase H domain immediately downstream of the extended RT/connection region, but differ in the additional downstream RNase H-like or mini-domain structures before Integrase. We have revised the Results, Methods and figure legends accordingly. We also acknowledge that a phylogeny based strictly on the RT polymerase core alone could differ in some local branch relationships, but the major conclusions are supported independently by the Integrase tree, host-taxonomic structure, ENV-type distribution, Pol bridge-region architecture and ENV structural features.
(2) Insufficient broader context:
(a) The introduction does not state what defines Ty3/gypsy non-LTR retrotransposons as compared to their closest relatives (Ty1/copia retrotransposons, BEL/pao retrotransposons, vertebrate retroviruses). This makes it difficult to judge the significance and generality of the findings.
(b) The various known compositions of Ty3/gypsi-like retrotransposons are not mentioned and explained in the introduction (open reading frames, (poly-)proteins and protein domains, and their variable arrangement, enzymatic activities, and putative functions), and the distribution of Ty3/gypsi-like retrotransposons among eukaryotes remains unclear. The introduction does not mention that Ty3/gypsi-like retrotransposons apparently are absent from vertebrates, and Figure 7 is not very clear about whether or not it includes sequences from plants ('Chromoviridae').
We agree that the Introduction needed more context on Ty3/gypsy retrotransposons. We have revised it to briefly state that LTR retrotransposons include several major lineages, including Ty1/copia, BEL/Pao, Ty3/gypsy and retrovirus-related elements, and that Ty3/gypsy elements are classified primarily by POL similarity and domain organisation. We also now explain that Ty3/gypsy retrotransposons typically encode GAG and POL proteins, with POL providing the enzymatic activities required for reverse transcription and integration, while noting that ORF arrangement and accessory domains can vary between lineages.
Please note that we stated that our screen did not identify intact env-containing Ty3/gypsy elements in vertebrate genomes that were homologous to the invertebrate errantiviruses analysed here. This is not to say that non-env-containing Ty3/gypsy elements are also absent in vertebrate genomes. Finally, we revised the Figure 7 legend to make clear that the comparison includes representative non-env-containing Ty3/gypsy elements from animals, fungi and plants, including chromovirus or chromovirus-related elements.
(c) The known association of Ty3/gypsi-like retrotransposons from different metazoan phyla with putative membrane fusion proteins (env-like) genes is mentioned in the introduction, but literature information, whether such associations also occur in the context of other retrotransposons (e.g., Ty1/ copia or BEL/pao), is not provided. The abstract is somewhat misleading in this respect. Finally, the different known types of env-like genes are not mentioned and explained as part of the introduction ('env-f', 'envB', 'retroviral env', others?)
We expanded the introduction to introduce literature information of known env-associated retroelements, including Ty1/copia and BEL/pao and explained which ENV types are known to be associated to these elements.
(d) Some key references and reviews might be added:
- Pelisson, A. et al. (1994) https://www.embopress.org/doi/abs/10.1002/j.1460-2075.1994.tb06760.x (next to Song et al. (1994), for the identification of env in Ty3/gypsy)
- Boeke, J.D. et al. (1999) In Virus Taxonomy: ICTV VIIth report. (ed. F.A. Murphy),. Springer-Verlag, New York. (cited by Malik et al. (2000) - for the definition and first use of the term 'errantivirus')
- Eickbush, T.H. and Jamburuthugoda, V.K. (2008) https://doi.org/10.1016/j.virusres.2007.12.010 (on the classification of retrotransposons and their env-like genes)
- Hayward, A. (2017) https://doi.org/10.1016/j.coviro.2017.06.006 (on scenarios of env acquisition)
Thank you. We included these references in the introduction.
(3) Incomplete analysis:
(a) Mobile genetic elements are sometimes difficult to assemble correctly from shortread sequencing data. Did the authors confirm some of their newly identified elements by e.g., PCR analysis or re-identification in long-read sequencing data?
Most newly identified elements are found in contigs/chromosomes that are longer than 100kb. The information of the contig/chromosome size, in which the representative copy of the identified elements are found, can be found in the column “CONTIG_SIZE” in supplementary table S1.
(b) The authors mention somewhat on the side that there are Ty3/gypsy elements with a different arrangement (gag-env-pol instead of gag-pol-env). Why was this important feature apparently not used and correlated in the analysis? How does it map on the RT phylogenetic tree? Which type of env is found with either arrangement? Is there evidence for a loss of env also in the case of gag-env-pol elements?
We agree that the non-canonical GAG-ENV-POL arrangement is an important feature that was insufficiently integrated into the analysis. We have revised the Results and figure annotations to make this clearer. Specifically, we now indicate GAG-ENV-POL elements in the POL tree in Fig S4 and in the HSV/gB-type ENV alignment/architecture figure S8. These elements are found in Nematoda, Bryozoa and Platyhelminthes and all carry HSV/gB-type ENV. They do not form a single monophyletic group in the Pol tree, but instead occur in distinct host-associated clades. They also show different HSV/gBtype cysteine-bridge architectures. Thus, the GAG-ENV-POL arrangement is unlikely to represent a single recent rearrangement event shared by all such elements; rather, it appears to be associated with several deeply diverged HSV/gB-type errantivirus lineages.
We have not inferred specific env-loss events for GAG-ENV-POL elements, because doing so would require a separate analysis of related non-env-containing elements.
(c) Sankey plots are insufficiently explained. How would inconsistencies between trees (recombinations) show up here? Why is there no Sankey plot for the analysis of env-B in Figure 5?
We agree that the Sankey plot was insufficiently explained. We have revised the Figure 4 legend to clarify that the Sankey plot was used as a qualitative visual summary of global congruence between the Pol extended RT/connection phylogeny and the F-type ENV ectodomain phylogeny. We now state that ribbon crossing alone should not be interpreted as recombination, because tree drawings can be rotated without changing topology and the relative order of clades in the two displayed trees may differ. Instead, the relevant signal is whether Pol-defined clades map mostly to corresponding F-type ENV-defined clades. Strong discordance, potentially reflecting recombination, env exchange or poor phylogenetic resolution, would be expected to appear as extensive splitting or many-to-many connections between Pol and ENV clades.
We did not include an equivalent Sankey plot for HSV/gB-type ENV in Figure 5 because we did not construct a global HSV/gB-type ENV phylogeny comparable to the F-type ENV ectodomain tree. Instead, HSV/gB-type ENV proteins were analysed by predicted structural organisation and cysteine-bridge architecture, which are shown in Figure 5 and Supplementary Figure S8.
(d) Why are there no trees generated for env-F and env-B like proteins, including closely related homologous sequences that do NOT come from Ty3/gypsy retrotransposons (e.g., from the eukaryotic hosts, from other types of retrotransposons (Ty1/copia or BEL/pao), from viruses such as Herpesvirus and Baculovirus)? It would be informative whether the sequences from Ty3/gypsy cluster together in this case.
We agree that comparison with homologous fusogens outside Ty3/gypsy retrotransposons is informative. We have therefore added an expanded F-type ENV ectodomain phylogeny that includes representative viral and retroelement-associated F-like proteins, including baculovirus F proteins, paramyxovirus and pneumovirus F proteins, and the BEL/Pao-associated Drosophila Roo F-like protein. In this expanded tree, the added viral sequences formed family-level clades within the broader F-type ENV diversity. Errantivirus F-type ENV proteins did not cluster as a shallow Ty3/gypsyspecific group or as a recent derivative of a single sampled viral family; instead, they spanned a level of diversity comparable to that separating major viral F-protein groups.
For HSV/gB-type ENV proteins, we did not generate an equivalent global phylogeny because the primary sequences and domain organisations of viral class III fusogens and errantivirus HSV/gB-type ENV proteins were too divergent for reliable full ecto domain multiple-sequence alignment. Instead, we added a structural comparison with representative viral and retroelement-associated class III fusogens, including herpesvirus gB, rhabdovirus G, orthomyxovirus GP75/GP64-like proteins, baculovirus GP64 and BEL/Pao-associated gB-like proteins. This analysis showed that viral class III fusogens often retained family-specific cysteine-bridge architectures despite low primary-sequence identity. Errantivirus HSV/gB-type ENV groups showed a comparable pattern, retaining lineage-specific cysteine-bridge architectures despite extensive sequence divergence. We have revised the Results, Methods and supplementary figure legends to clarify these analyses and to distinguish the phylogenetic analysis of F-type ENV from the structural comparison of HSV/gB-type ENV.
(e) Did the authors identify any other env-like ORFs (apart from env-F and env-B) among Ty3/gypsy retrotransposons? Did they identify other, non-env-like ORFs that might help in the analysis? It is not quite clear from the methods if the searches for env-F and envB - containing Ty3/gypsy elements were done separately and consecutively or somehow combined (the authors generally use 'env', and it is not clear which type of protein this refers to).
We agree that this was not sufficiently clear. We have revised the Methods to clarify that the search was designed to identify Ty3/gypsy elements carrying ORFs structurally resembling known envelope/fusogen proteins. In the iterative tBLASTn searches, bait sequences representing both F-type ENV and HSV/gB-type ENV were included together in each round, rather than being searched as two entirely separate pipelines. Candidate elements were then annotated and classified by ORF structure, HHpred/domain similarity and structural prediction.
Among intact Ty3/gypsy candidates recovered by this strategy, we identified two recurrent classes of env-like ORFs: F-type env and HSV/gB-type env. We did not identify an additional recurrent class of env-like ORF among the intact Ty3/gypsy elements analysed here. We also did not identify other recurrent non-env accessory ORFs that were informative for the phylogenetic analyses beyond the GAG, POL and ENV features described in the manuscript.
(f) Why was the gag protein apparently not used to support the analysis? Are there different, unrelated types of gag among non-LTR retrotransposons? Does gag follow or break the pattern of co-evolution between RT and env-F/env-B?
We agree that the role of GAG in the analysis should be clarified. GAG ORFs were used during element annotation to identify intact GAG-POL-ENV or GAG-ENV-POL retrotransposon architectures, but we did not use GAG as a major phylogenetic marker because GAG proteins are less conserved and less reliably alignable across deeply diverged Ty3/gypsy elements than the enzymatic POL domains. Our central question was the acquisition and long-term retention of env-like ORFs by POL-defined Ty3/gypsy retrotransposons. We have revised the Methods to clarify that GAG was used for structural annotation and intactness assessment, whereas phylogenetic analyses were based on the Pol extended RT/connection region and Integrase domain.
(g) Data availability. The link given in the paper does not seem to work (https://github.com/RippeiHayashi/errantiviruses_2025/tree/main). It would be useful for the community to have the sequences of the newly identified Ty3/gypsy retrotransposons listed readily available (not just genome coordinates as in table S1), together with the respective annotations of ORFs and features.
The GitHub repository that contains suggested data is made public. Please check the link again.
Recommendations for the authors:
Reviewer #1 (Recommendations for the authors):
Additional Analyses That Could Strengthen Claims (but I concede might be well beyond the scope of this study):
(1) Reconciliation and Gene Tree-Species Tree Analysis: Implementing explicit genetree-species-tree reconciliation (e.g., using Notung or ALE) could formally test the frequency of horizontal transfers vs. vertical inheritance in errantivirus evolution.
We performed targeted host-taxonomy concordance analyses in representative well-sampled clades to address this question, as described in the revised manuscript.
(2) Functional Validation in Non-Insect Hosts: RNA-seq or proteomics from representative non-insect hosts could reveal whether env genes are expressed, and-if possible-experimental assays for envelope function would move beyond computational inference. This is the one thing that might be done in a revision.
We agree that direct functional validation in non-Drosophila species would substantially strengthen the conclusions. Such experiments are beyond the scope of the present revision. However, we now cite our recent work (PMID: 41922845) showing conserved piRNA-mediated defence against errantiviruses across insect orders, providing indirect evidence that these elements remain biologically active outside Drosophila.
(3) LTR Age Dating: Estimating insertion ages using LTR divergence across clades would contextualize the timing of expansion events and help test hypotheses about ancient vs. recent proliferation.
We agree that LTR divergence-based insertion dating would be informative for estimating the timing of recent expansion events. However, our main evolutionary conclusions concern the deeper history of env acquisition and long-term retention across metazoan lineages, rather than the precise insertion age of individual genomic copies. Because the dataset includes elements from highly divergent genomes with variable assembly quality and many multicopy families, systematic LTR dating across all clades would require additional curation and is beyond the scope of the present revision.
(4) Comparative Host Defense Analysis: Surveying host antiviral or transposon defense systems (e.g., piRNA, APOBEC) in lineages rich in errantiviruses could test for signatures of recurrent molecular arms races.
We agree that comparative analysis of host defence pathways, including piRNA and antiviral systems, is an important future direction. However, a systematic survey of host-defence evolution across all errantivirus-rich lineages is beyond the scope of the present revision.
Reviewer #2 (Recommendations for the authors):
Apart from my comments in the Public Review, I have a few additional minor recommendations:
(1) The authors frequently use the term "active" to describe complete retrotransposons. However, in transposon biology, "active" implies recent or ongoing transpositional activity and should therefore be used with caution. Terms such as "complete" or "fulllength" would be more appropriate in this context.
We agree that intact ORF structure should not be over-interpreted as evidence of recent mobilisation. We have therefore revised the manuscript to distinguish element intactness from evidence of recent expansion. Specifically, we now use “intact” or “full-length” to describe element structure. We also clarify that the presence of multiple highly similar copies in the same genome, defined as >98% nucleotide identity across >98% of the three ORFs, is evidence consistent with recent or ongoing genomic expansion, but not definitive proof of current transposition. These changes have been made in the Abstract, Results, Methods and Discussion.
(2) In the third paragraph of the Results, the authors conclude that many identified errantiviruses were mobilized recently. However, since the search strategy specifically targets complete and uninterrupted elements, this may introduce a bias toward younger elements, making the conclusion somewhat circular.
We agree and have revised the wording to avoid over-interpreting completeness as evidence of recent mobilisation. We now distinguish between intact/full-length element structure, which was part of our search strategy, and independent evidence for recent or ongoing mobilisation, such as the presence of multiple highly similar copies. We have therefore softened statements that previously implied that intact ORFs alone demonstrate recent activity.
(3) The first paragraph of the Introduction requires appropriate references.
We have now added references to enhance the readability of the first paragraph of the introduction.
(4) It would benefit readers if the retrotranspositional process were briefly explained, including a description of what the tRNA primer binding site (PBS) is and its role in retrotransposition.
In the same part of the introduction, we now describe the role of the tRNA primer binding site in retrotransposition.
Reviewer #3 (Recommendations for the authors):
Suggestions and requests for clarification currently are part of the public review, as they also point the reader to critical open questions if the authors decide not to amend their version of the manuscript.
eLife Assessment
In this important study, the authors have performed a zebrafish drug screen to identify suppressors of atherogenic lipoproteins. They utilize a well-established LipoGlo assay to find molecules that modulate these lipoproteins, identifying 49 potential hits and they perform validation experiments, including studies linking enoxolone to its likely inhibitory effect on a specific transcription factor, HNF4alpha. Overall, the results are convincing and robust, and will open up new areas of exploration for those investigators interested in in vivo lipid biology.
Reviewer #1 (Public review):
[Editors' note: The authors addressed reviewer comments well, further strengthening the conclusions of the study.]
Summary:
A whole-organism drug screen was performed to identify molecules that decrease Apolipoprotein B (ApoB) as a target for agents to reduce atherosclerosis. Kelpsch et al. used a zebrafish reporter line, LipoGlo, which is a fusion of the Nano-luciferase protein to the ApoB protein as a proxy for the presence of ApoB-containing lipoproteins (B-lps) in larval stages. The LipoGlo line was screened against a well-characterized drug library and identified 49 hits from their primary screen. Follow-up studies further refined this list to 19 molecules that reproducibly reduced B-lps significantly. The authors focused their studies on enoxolone, a licorice root extract, and showed that larvae treated with this agent can reduce the production of B-lps. As enoxolone has been reported to suppress Hepatocyte Nuclear factor 4a (HNF4a), the authors investigated whether loss-of-hnf4a or pharmacological inhibition of hnf4a in zebrafish also produced similar phenotypes as enoxolone treatment. Their studies showed that this was the case. Transcriptomic studies after enoxolone treatment resulted in altered expression of genes involved in cholesterol biosynthesis and in glucose/insulin signaling pathways. This study highlights the utility of a zebrafish whole-organism chemical screen for modifiers of B-lps production and/or its clearance. A significant finding is that enoxolone inhibits hnf4a in zebrafish to reduce B-lps production and supports targeting HNF4a as a therapeutic means to reduce the emergence of atherosclerosis.
Strengths:
The authors performed a whole-organism chemical screen with over 3000 agents. Such screens are challenging, and the authors used strict criteria for determining hits. The conclusions of this study are well supported by the presented data.
Comment on revised version:
The authors have addressed all my comments.
Reviewer #2 (Public review):
Summary:
The authors aimed to develop a large-scale drug screen to identify B-lp modulators in a vertebrate whole-animal system. Using the zebrafish LipoGlo system that the authors had previously published and validated, the authors screened 2762 drug candidates to generate 49 hits and ultimately validated 19 drugs as genuine ApoB-lowering drugs. Using LipoGlo-Electrophoresis, the authors are able to obtain insights into the ApoB-lipoprotein size/subclass distribution. The authors further validate and study the mechanism of a strong hit, Enoxolone, known as also known as 18β-Glycyrrhetinic acid, which has previously been reported to modulate lipid metabolism. The authors also show that Enoxolone effects are mediated through HNF4⍺, which has been previously shown in the mouse system, but this is the first time it has been shown in the zebrafish.
Strengths:
The study was methodical and robust, using a published and well-validated zebrafish LipoGlo model. The authors validated the hits from the screen independently and considered the possibility that some drugs may have been detected as false positive results due to effects on the enzymatic activity of NanoLuciferase; only one hit, verteporfin, was shown to be a false positive. Using LipoGlo-Electrophoresis, the authors are able to obtain extra insights into the ApoB-lipoprotein size/subclass distribution. They showed that while enoxolone treatment reduces total B-lps, there are no overt changes in B-lp size distribution compared to vehicle-treated animals, other than a slight increase in the zero mobility (ZM) fraction, which contains very large particles and/or tissue aggregates. In contrast, the positive control, lomitapide, does show a change in B-lp size distribution compared to vehicle-treated animals - an increase in frequency of LDLs (low-density lipoprotein), but a decrease in VLDLs (very low-density lipoprotein). This study also assesses the LipoGlo-Electrophoresis profile of HNF4⍺ inhibitors. Work in the zebrafish larvae means that the effect on overall development and an entire vertebrate organism can also be assessed. Finally, the authors applied a thorough statistical measure to define a hit, using the Strictly Standardized Mean Difference (SSMD) method.
Reviewer #3 (Public review):
Summary:
In "A whole-animal phenotypic drug screen identifies suppressors of atherogenic lipoproteins", Kelpsch et al seek to identify new, chemically targetable pathways that regulate ApoB function and could ultimately serve as treatments for elevated lipid disorders and/or cardiovascular disease. Given the interconnected nature of lipid regulation in the whole organism with interdependent organs and secreted components (i.e. lipoproteins), they use the vertebrate model zebrafish to screen a large library of ~3000 compounds for their ability to lower the important ApoB-containing lipoproteins. They find 49 hits with 19 compounds passing a higher level of scrutiny, and focus on the role of enoxolone in modulating B-Ip levels at least partly through the HNF4alpha transcription factor and, putatively, through downstream cholesterol/lipid biosynthetic pathways.
Strengths:
The study uses a well-validated in vivo stain (LipoGlo) for measuring lipoproteins in the context of a developing whole organism with a quantitative read-out on a high-throughput platform, allowing for screening of thousands of compounds altering the complex metabolic/physiologic functions necessary for lipoprotein production.
The use of genetic mutant HNF4alpha to assign the mechanism of action to the prime candidate compound studied (enoxolone) is a powerful approach for this challenging aspect of chemical genetics studies.
Author response:
The following is the authors’ response to the original reviews.
eLife Assessment
In this important study, the authors have performed a zebrafish drug screen to identify suppressors of atherogenic lipoproteins. They utilize a well-established LipoGlo assay to find molecules that modulate these lipoproteins, identifying 49 potential hits. They perform some validation experiments, including studies linking enoxolone to its likely inhibitory effect on a specific transcription factor, HNF4alpha. Overall, the results are convincing and robust, and will open up new areas of exploration for those investigators interested in in vivo lipid biology.
We appreciate the manuscript assessment and provide new data (see below) that significantly increases the “strength of the evidence”.
Public Reviews:
Reviewer #1 (Public review):
Strengths:
The authors performed a whole-organism chemical screen with over 3000 agents. Such screens are challenging, and the authors used strict criteria for determining hits. The conclusions of this study are well supported by the presented data.
Weaknesses:
There are areas within the study and writing that can be improved and extended, specifically within the gene expression studies.
We appreciate the Reviewer recognizing the strength of the data and the challenging nature of performing a whole animal small molecule screen. With regard the “Weaknesses”, as the Reviewer suggested we improved and clarified the text and “extended” the study by adding analysis and discussion of six additional hits (see Figure 3 and Sup. Fig.1) and modified the results section with the addition of over a page of text describing the additional phenotyping results:
“Secondary characterization of selected validated B-lp lowering hits.
To further evaluate the biological relevance and potential mechanisms of selected validated hits, we performed secondary analyses assessing total B-lp levels, larval morphology, and lipoprotein size distribution. Our lab previously defined the method to measure total B-lp levels from whole animals by using the homogenate of a single zebrafish larva [35]. We confirmed that treatment of animals with 4 µM pomiferin significantly reduced total B-lp levels measured from homogenates collected from whole animals after treatment (p = 8.6x10<sup>-4</sup>; Figure 3A). However, pomiferin treatment (4 µM) produced animals with reduced body length and lethality at higher doses, suggesting developmental toxicity may confound interpretation of its B-lp-lowering effect.
Treatment of animals with riboflavin tetrabutyrate (Figure 3B) and calcipotriene (Figure 3C) reduced total B-lp levels (p < 2x10<sup>-16</sup>) but did not affect larval morphology. A key feature of B-lps is their size, often a proxy for the total amount of lipid in the particle [35]. Particle size can impact the particle's lifetime (e.g. in metabolically healthy humans, small particles are cleared rapidly by the liver) [54–56]. Thus, we also assessed whether these compounds alter B-lp size distribution. Animals were treated for 48 h with vehicle, 5 µM lomitapide, or a drug of interest, and whole-animal homogenates were prepared and subjected to native polyacrylamide gel electrophoresis followed by chemiluminescent imaging. B-lps were classified into four classes based on gel migration: zero mobility (ZM), very low-density lipoproteins (VLDL), intermediate-density lipoproteins (IDL), and low-density lipoproteins (LDL) as previously described [35]. Lomitapide treatment effectively reduces VLDL particles and increases LDL particles [35] (Figure 3E), whereas riboflavin and calcipotriene did not affect lipoprotein classes. Thus, riboflavin tetrabutyrate and calcipotriene reduce total B-lp levels without overt developmental toxicity or changes in lipoprotein subclass distribution, suggesting they may act through mechanisms that decrease overall particle abundance rather than altering lipoprotein turnover or catabolism.
Although doxycycline treatment lowered B-lp levels in whole fixed animals in the primary screen and validation studies, we did not observe a reduction in total B-lps in whole-animal homogenates (Figure 3D). However, we detected a slight increase in VLDL levels (p < 2x10<sup>-16</sup>; Figure 3E), suggesting that doxycycline may alter lipoprotein composition or distribution rather than total particle abundance.
Alternatively, two structurally related compounds, thiethylperazine and prochlorperazine, at 4 µM significantly reduced (p < 1.4x10<sup>-10</sup> and p < 1.2x10<sup>-6</sup> respectively), B-lp levels measured from whole-animal homogenates (Figure 3F and 3H). Furthermore, both 8 µM thiethylperazine and 8 µM prochlorperazine increased relative LDL (p = 1.2x10<sup>-3</sup> and p = 2.3x10<sup>-3</sup>, respectively) and decreased relative VLDL levels (p = 8.4x10<sup>-4</sup> and p = 9.1x10<sup>-4</sup>, respectively; Figure 3G and 3I) suggesting a shift toward smaller lipoprotein particles and a potential alteration in lipid processing or clearance pathways. Together, these results highlight the diversity of mechanisms among validated hits, ranging from compounds that reduce total B-lp abundance without affecting B-lp class composition to those that shift B-lp class distribution, while also underscoring the importance of secondary assays to distinguish true B-lp modulators from those that likely produce a B-lp effect through generalized toxicity.
Enoxolone significantly reduces B-lps in the larval zebrafish.
Hit compounds were prioritized for follow-up studies based on reproducible dose-dependent responses, minimal toxicity as indicated by normal morphology over development, lack of direct NanoLuciferase inhibition, and the presence of literature suggesting potential links to lipid metabolism. One compound meeting these criteria was enoxolone, also known as 18β-Glycyrrhetinic acid, (Figure 2 Drug 20, Supplemental Table 1, Supplemental Figure 1T, Supplemental Figure 2L).”
The Discussion now has the following additional text:
“Further validation of these hits demonstrated a wide range of potential mechanisms of lipoprotein regulation. We identified hits that affected larval development, some hits that reduced total B-lp levels, and several structurally related compounds that directly reduced B-lp particle size (Figure 3).”
Reviewer #2 (Public review):
Strengths:
The study was methodical and robust, using a published and well-validated zebrafish LipoGlo model. The authors validated the hits from the screen independently and considered the possibility that some drugs may have been detected as false positive results due to effects on the enzymatic activity of NanoLuciferase; only one hit, verteporfin, was shown to be a false positive. Using LipoGlo-Electrophoresis, the authors are able to obtain extra insights into the ApoB-lipoprotein size/subclass distribution. They showed that while enoxolone treatment reduces total B-lps, there are no overt changes in B-lp size distribution compared to vehicle-treated animals, other than a slight increase in the zero mobility (ZM) fraction, which contains very large particles and/or tissue aggregates. In contrast, the positive control, lomitapide, does show a change in B-lp size distribution compared to vehicle-treated animals - an increase in frequency of LDLs (low-density lipoprotein), but a decrease in VLDLs (very low density lipoprotein). This study also assesses the LipoGlo-Electrophoresis profile of HNF4⍺ inhibitors. Work in the zebrafish larvae means that the effect on overall development and an entire vertebrate organism can also be assessed. Finally, the authors applied a thorough statistical measure to define a hit, using the Strictly Standardized Mean Difference (SSMD) method.
We appreciate that the Reviewer valued the rigour and robustness of our approach.
Weaknesses:
While the screen was thorough and well-validated, the authors missed a chance to provide a lot of extra significance to a wide range of readership. While the hits were thoroughly validated and displayed, the authors could have also presented the LipoGlo-Electrophoresis for all validated hits or at least a number of them. This would hugely increase the insights into these compounds. Also, the authors chose to validate and follow up a mechanism for Enoxolone, yet this hit was already known to modulate lipid metabolism through HNF4⍺, therefore, hugely limiting the impact of the paper. So what the authors have shown that is novel is only subtly added to this - consistent in vertebrate models, RNA sequencing of pathways, further validation of the HNF4⍺ pathway, and a profile of resulting B-lp size distribution. It seemed an easy way out to pick such a candidate, and they could have followed up by validating more thoroughly a completely novel drug. Also, the authors' prior paper showing the methodology also depicted complementary EM and LipoGlo-microscopy approaches. The microscopy especially, would have been an easy complementary add-on to the screen to really give extra insights into B-lp metabolism in a whole organism for all candidates. This felt like a missed opportunity.
Here we agree and added Fig. 3 describing the phenotyping of 6 additional compounds including some LipoGlo-Electrophoresis analyses as suggested by the Reviewer. The text of the Results section was modified as described for Reviewer 1 (see above).
Reviewer #3 (Public review):
Strengths:
The study uses a well-validated in vivo stain (LipoGlo) for measuring lipoproteins in the context of a developing whole organism with a quantitative read-out on a high-throughput platform, allowing for screening of thousands of compounds altering the complex metabolic/physiologic functions necessary for lipoprotein production.
The use of genetic mutant HNF4alpha to assign the mechanism of action to the prime candidate compound studied (enoxolone) is a powerful approach for this challenging aspect of chemical genetics studies.
We appreciate that the Reviewer understands how challenging it can be to assign a mechanism to any small molecule and thereby recognizes the power of the zebrafish model combined with our unique lipoprotein phenotyping tools.
Weaknesses:
As shown in Figure 5A, the HNF4alpha mutant homozygous -/- already lowers lipoproteins. Is it just that the mutant level is already at a minimum in this homozygous mutant (and thus enoxolone cannot induce even lower lipoprotein levels), or is it true that the enoxolone molecule is primarily acting through this TF (i.e. HNF4alpha homozygous mutant is truly epistatic to enoxolone function) as favored in the text.
While it is definitely interesting to study enoxolone effects during whole embryo development, the link to HNF4alpha had previously been described in the literature, as pointed out by the authors. The generalizability of the approach to identify truly novel pathways remains to be fully realized, but sharing this available screen data to date will invite further inquiry and be very valuable to the community.
Here too we agree that a link between enoxolone was proposed in the literature. However, we added quite a lot of additional insight regarding the transcriptional targets shared by HNF4alpha and enoxolone. The goal of identifying the mechanism(s) of action of other novel small molecule hits from the screen is important and that work is ongoing.
Figure 5 - The same allele of HNF4alpha loss of function/hypomorph (rdu14) is used in both 5A and 5B, but labeled differently in each subpanel. This is explained in the figure legend, but could be updated to use the same nomenclature in both panels to clarify the Figure presentation.
We thank the Reviewer for catching this and have modified the Figure (now Fig. 6) so the subpanels are labeled identically to avoid any confusion.
Recommendations for the authors:
Reviewer #1 (Recommendations for the authors):
(1) The authors describe statistical methods to improve the calling of hits. In the results section, they discuss the use of fold change and of strictly standardized mean difference as criteria to account for the variability that occurs within in vivo screens. The combination of both criteria resulted in a significant reduction in the total number of hits, from 487 (16%) to 49 (1.6%), which is a large decrease in total hits. The authors should comment on whether some of the 487 compounds were randomly tested individually to confirm that they were true negatives and compared to the true hits of 49. For example, did the authors independently test calcipotriene and diphenylboric acid to confirm that these are truly negative?
Initially, we did not directly retest any of the 487 compounds outside of the top 49 hits with the intention to compare their effect size to the top compound. While we do suspect that there is a chance that some of these compounds may still have a significant effect on lipoprotein levels, we prioritized compounds with the strongest overall biological effect size and largest statistically significant effect. We agree with the Reviewer that it would be interesting to continue to test more of these compounds and examine whether the lipoprotein reduction phenotype correlated with the primary screen effect, this would be a large experimental undertaking, though a randomized subset could be tested. Validation studies of Calcipotriene (Supplemental Figure 2E) showed a small, but significant, lipoprotein reduction at only the 0.25 µM dose across 3 independent experiments. Because the effect is small and not a dose-response, it is not a highly prioritized hit. We did not validate diphenlylboric acid in this study but will in the future.
(2) The transcriptomics profile studies are not well described. The authors do not provide a detailed list of differential genes for each of the conditions in their dataset. This should be included.
Supplemental Table 2 includes the fold change and p-values of all genes measured in differential expression analysis. We agree with the Reviewer and added new supplementary tables (Supplemental Table 5 and 7) that contain the differentially expressed genes at each treatment duration.
(3) The Gene Ontology analysis results are not accompanied by a list of genes that match the GO terms. The authors should include these results. This part was confusing as it was not clear if the cholesterol pathway affected was due to an abundance of genes that were up- or down-regulated.
We agree with Reviewer 1 and added Supplemental Table 6 that contains each gene ontology term with the associated DE genes that contribute to the significance of that term as well as explicit directionality information.
(4) Figure 6A shows heat maps of differential gene expression, but there is no key provided in the figure or legend. Are they color-coded for fold change or log2 fold change?
We agree that Figure 6A can be approved and added a key to the legend as suggested by the Reviewer.
(5) The overlap of genes that are changed in hnf4a mutants and with enoxolone is provided as percentages, but the actual genes are not listed. Do these genes represent cholesterol biosynthesis pathways? There are other bioinformatic tools that the authors could apply to their dataset for further analyses. For example, enrichr (https://maayanlab.cloud/Enrichr/) is one tool to query for GO Biological processes, cell/tissue type, and even overlap of genes with genetic models and other disease states. An extension of these bioinformatic studies will be useful to determine if other pathways are relevant.
We agree with the Reviewer and added a table of the genes that overlap between drug treatments and hnf4a mutants (Supplemental Table 7). We also appreciated the Reviewer’s suggestion to deploy Enrichr, which we have done and modified the Results section to now read:
“Of the 439 differentially expressed genes from 12, 16, and 24 hours post-treatment, 34 differentially expressed genes are shared between all three treatment durations and are associated with gene ontology terms related to carbohydrate metabolism and signaling pathways (Figure 7D). We expanded this analysis using the bioinformatic tool Enrichr [68–70], which largely recapitulated gene ontology results described above. However, Enrichr analysis revealed significant overlap between several late enoxolone-responsive gene sets and transcriptional signatures associated with prochlorperazine, another compound identified in our screen (Figure 2, Figure 3, Supplemental Figure 1AO, Supplemental Figure 2Z). Enrichment of prochlorperazine-associated signatures was observed at 12 (prochlorperazine MCF7 up, 4/58 genes [INSIG1;IRF7;ISG15;ATF3], adjusted p-value = 0.006), 16 (prochlorperazine MCF7 up, 6/58 genes [INSIG1;DDIT4;IRF7;PMAIP1;ISG15;ATF3], adjusted p-value = 0.00008; prochlorperazine PC3 up, 3/29 genes [INSIG1;DDIT4;ATF3], adjusted p-value = 0.006), and 24 hours post-treatment (prochlorperazine PC3 up, 6/29 genes [DUSP5;INSIG1;DDIT3;TRIB3;SQSTM1;ATF3], adjusted p-value = 0.0001; prochlorperazine MCF7 up, 7/58 genes [DDIT3;INSIG1;IRF7;PMAIP1;ISG15;SAT1;ATF3], adjusted p-value = 0.0005). These results suggest that enoxolone and prochlorperazine may perturb overlapping molecular pathways, an observation that warrants further investigation. Ultimately, these data demonstrate distinct early and late responses to enoxolone treatment, and the early response modulates key lipid metabolism pathways.”
(6) Figures 1E and 1F would benefit if the exact spots/points where enoxolone and other hits mentioned in the text were labelled.
Great idea, we modified Figure 1F as suggested.
(7) Figure 3 and Figure 4 graphs should state Fold change on the Y-axis title.
We are thankful the Reviewer noticed this typo and we have fixed both Figures.
Reviewer #2 (Recommendations for the authors):
(1) To boost the impact for more readers, the authors should include the LipoGloElectrophoresis and LipoGlo-Microscopy results from a few more of the validated hits, especially ones that are completely novel (unlike Enoxolone, which already had a known role in lipid metabolism). Results on enoxolone are useful as a validation of the assay, mostly with some minor additional insights.
We agreed with Reviewer 2 and added more validation testing of for a few hits (see response to Reviewer 1, Strengths and Reviewer 2, Weaknesses). We did not perform these experiments on each drug for technical reasons, mainly because these experiments are low-throughput (especially the Microscopy). Nonetheless, we performed many additional experiments to add phenotyping data for 6 new drugs that included multiple LipoGlo-Electrophoresis panels to an entirely new Figure.
(2) The authors should include raw data from the screen from all drugs tested in the supplementary and then for which SSMD was calculated for, providing in an excel sheet or similar the values and how these were calculated, i.e. the 487 unique drugs that lower B-lp levels with an SSMD cutoff of < -1.0.
This information was provided in the supplemental file as separate .csv files with the associated R script, which can be run locally and contains the SSMD functions. Considering the Reviewer comments, we ensured this information in provided in Supplemental Tables 1 and 2.
(3) Page 3, lines 23-24: What does the 2 to 4 fold chance mean? Perhaps rewrite: Genetic mutations in Lipoprotein(a) increase the chance of heart attack or stroke 2-4 fold greater than without the mutation.
We agree and the sentence now reads: Patients with genetic mutations in the Lipoprotein(a) encoding gene have a 2 to 4 fold increased risk of sudden heart attack or stroke.
(4) Figure 1, for C and D, label some of the most significant hits and definitely show where exonolone lies.
We agree see response to Reviewer 1 Pt6
(5) Page 6, lines 1-9: I'm a bit confused why this is here if you do not present the data.
We thought this was relevant information to share for researchers that running drug screens with positive controls and defining hit cutoffs. In light of the Reviewer’s comment, we removed the last sentence from this paragraph.
(6) Page 6, line 8: This needs better justification of why you are validating enoxolone rather than other hits; otherwise, it could seem like cherry picking. Especially as enoxolone is known to affect lipid metabolism. Otherwise present more details of a couple of validated candidates.
We agree. As the Reviewer requested, we validated more compounds (described above) and modified the text of the results to elaborate on our justification for selecting enoxolone for further study. The text of the results now reads: Hit compounds were prioritized for follow-up studies based on reproducible dose-dependent responses, minimal toxicity as indicated by normal morphology over development, lack of direct NanoLuciferase inhibition, and prior reports the presence of literature suggesting potential links to lipid metabolism. One compound meeting these criteria was enoxolone, also known as 18β-Glycyrrhetinic acid, (Figure 2 Drug 20, Supplemental Table 1, Supplemental Figure 1T, Supplemental Figure 2L).
(7) Supplementary Figures 1 and 2: The resolution is too low, and the reader cannot even see the charts or the text.
We agree and now have uploaded higher resolution images
(8) Page 7, lines 31-35: Needs a higher resolution and magnified image to merit this 'offhand' statement. Also cite reference [59] here.
We agree with the Reviewer and added magnified insets of the heart. As far as the suggestion of adding Ref 59, we do not see the connection to that paper (A point mutation decouples the lipid transfer activities of microsomal triglyceride transfer protein PLOS Genetics 16:e1008941)
(9) Figure 3E: In addition to the proportions graph would be useful to also have an absolute amount of lipoprotein in each class graph.
While there may be changes in total luminescence values from lane to lane in these gels, we have not fully validated the absolute quantitation of a full lane. We typically use plate-based whole-animal assays to determine total absolute lipoprotein levels and calculate the proportion of the whole lane for each lipoprotein class, as described in our prior publication detailing the assay. We do expect that there is some additional variation incorporated into the native PAGE assay due to sample freeze/thaw, dilution, and loading.
(1) Page 10 lines 27-28: "Continual statin use for more than 1 year reduced circulating Blps and all-cause mortality by ~30% in individuals with high B-lp levels." This sentence doesn't seem right, intimates continual statin use causes death - I don't think that's right.
We thank the Reviewer for catching this and have corrected the sentence. It now reads: “Continual statin use for more than 1 year in individuals with high B-lp levels reduced circulating Blps and lowered all-cause mortality by ~30% [12,13].”
(11) Page 12, line 25: "canlikely" is a typo, should be can likely.
We fixed that sentence and now reads: “Further, the drug screening paradigm we developed using the LipoGlo system is highly scalable and can be deployed to screen large novel drug libraries to identify many additional B-lp-lowering compounds.”
(12) Figure 1 legend: "An ordered plot of each SSMD score measured from 5 μM lomitapide treated animals from each 96-well plate (n = 1381) relative to respective vehicle treatment." This comes across as though it's 5uM Iomitapide/vehicle. But it's the SSMD score of each drug compared to Iomitapide and relative to the respective vehicle (I think) - make it clearer.
We agree and clarified the legend so it now reads: “…(D) An ordered plot of each SSMD score measured from positive control (5 µM lomitapide) treated animals from each 96-well plate (n = 1381) relative to respective vehicle treatment. The solid black line at y = 0 represents the divide in increased and decreased SSMD score, the solid blue line at y = -1.41 represents the curve's inflection point, and the dashed black line at y = -1 represents the SSMD (open circles) cutoff used to define a hit. “
(13) Figure 1E: What is the x axis?
Each data point on the x-axis represents each drug at every dose tested, we will clarify the test. The legend now reads: “(E) A plot of SSMD scores measured from each drug at each dose tested, each open circle represents the SSMD score of an individual drug at an individual dose.” In addition, “Compound (each dose tested)” was added to the x-axis of the figure panel.
(14) Figure 2: Would you not have space to put the drug names in the figures? Where, for example, is enoxolone?
We agree and have updated the figure accordingly.
(15) Figure 3A-C: label enoxolone on the x axis.
We agree and added this text to what is now Figure 4.
(16) Figure 3D: Looks like delayed development with enoxolone, if left to grow, would the embryos develop normally?
We did not examine if animals treated from 3-5 dpf develop normally beyond 5 dpf.
(17) Figure E. Are stars all compared to vehicle control? Perhaps useful to have lines to indicate what are the significantly different relationships.
Comparison in these experiments are always to the vehicle (negative control) and clarified the legend considering the Reviewer’s comment we modified the legend to now read,”… * <0.05 as compared to vehicle.”
(18) Figure 3E: As well as the proportion of total lipoprotein, it would also be beneficial to see absolute lipoprotein levels.
See above response to Reviewer 2 Pt9.
(19) Figure 4: Does the overall health or size of the animal correlate with the luminescence score?
While we do know that, in untreated animals, lipoprotein levels vary with age (and, thus, size), we have not examined this more granularly than in 24-hour time points after treatment. Further, we have not examined this in the context of a drug treatment.
(20) Figure 4D: Again the absolute in each fraction would be meaningful, also the 5078 looks brighter?
See above response to Reviewer 2 Pt9.
(21) Figure 4A, 5A: Would the traces (line plots) not be useful here to see the overall dynamics over time?
We considered presenting Figure 5A this way but decided to keep the plots as is because we wanted to show the individual points which make the line blots very difficult to read. Further, our analysis evaluates individual animals at each time point as it is not possible to follow the same animal over time.
Reviewer #3 (Recommendations for the authors):
Figure 4: Consider using standard scientific notation for the very small p values in some of the figure legends.
We agree and adjusted the p-value notation as suggested.
intended audience
Relevance is crucial when determining what sources to use as it helps you stay narrowed in on research relevant to your thesis statement. It can be easy to find a good quote related to your thesis within a larger source, but if the main takeaways of that source don't relate, you probably haven't picked the strongest source. Examining the intended audience of a source is a great way to do this because in the inquiry paper we are also looking at focusing on a specific audience. If a source has a completely different audience than what we are focusing on, the content may be invaluable or it needs to be utilized in a way that doesn't directly quote it but only assists the argument indirectly.
eLife Assessment
This study provides important insights into how researchers can use perceptual metamers to formally explore the limits of visual representations at different processing stages. The framework is compelling and the data support the claims.
Reviewer #1 (Public review):
This is an interesting study on the nature of representations across the visual field. The question of how peripheral vision differs from foveal vision is a fascinating and important one. The majority of our visual field is extra-foveal, yet our sensory and perceptual capabilities decline in pronounced and well-documented ways away from the fovea. Part of the decline is thought to be due to spatial averaging ('pooling') of features. Here, the authors contrast two models of such feature pooling with human judgments of image content. They use much larger visual stimuli than in most previous studies, and some sophisticated image synthesis methods to tease apart the prediction of the distinct models.
More importantly, in so doing, the researchers thoroughly explore the general approach of probing visual representations through metamers-stimuli that are physically distinct but perceptually indistinguishable. The work is embedded within a rigorous and general mathematical framework for expressing equivalence classes of images and how visual representations influence these. They describe how image-computable models can be used to make predictions about metamers, which can then be compared to make inferences about the underlying sensory representations. The main merit of the work lies in providing a formal framework for reasoning about metamers and their implications, for comparing models of sensory processing in terms of the metamers that they predict, and for mapping such models onto physiology. Importantly, they also consider the limits of what can be inferred about sensory processing from metamers derived from different models.
Overall, the work is of a very high standard and represents a significant advance over our current understanding of perceptual representations of image structure at different locations across the visual field. The authors do a good job of capturing the limits of their approach I particularly appreciated the detailed and thoughtful Discussion section and the suggestion to extend the metamer-based approach described in the MS with observer models. The work will have an impact on researchers studying many different aspects of visual function including texture perception, crowding, natural image statistics and the physiology of low- and mid-level vision.
The main weaknesses of the original submission relate to the writing. A clearer motivation could have been provided for the specific models that they consider, and the text could have been written in a more didactic and easy to follow manner. The authors could also have been more explicit about the assumptions that they make.
Comments on revised version.
The authors have now fully addressed my concerns and I think the paper is a valuable contribution. In future studies within the same research program I would appreciate seeing further consideration of how metamerism at different stages of visual processing interact to determine behaviour in tasks. For example, there are presumably interesting impacts of feedback that may modify feature spaces, thereby rendering aspects of appearance that were previously metameric perceptually discriminable.
Reviewer #2 (Public review):
Summary:
The authors have improved clarity overall and have spoken to most of the issues raised by the reviewers. There are still two outstanding problems however, where issues raised during the review were inappropriately dismissed in the manuscript. These should be explicitly addressed as limitations to the results presented (no eye tracking), and early pilot experiments that informed the experiments as presented (pink noise) rather than brushed off as 'unnecessary' and 'would be uninformative'.
Eye tracking:<br /> It is generally accepted that experiments testing stimuli presented at specific locations in peripheral vision require eye tracking to ensure that the stimulus is presented as expected, in particular, in the correct location. As I stated in the previous round of review, while a stimulus presentation time of 200ms does help eliminate some saccades, it does not eliminate the possibility that subjects were not fixating well during stimulus onset. I am also unclear what the authors mean by 'trained observer' in this context, though the authors state that an author subject in a different portion of the paper is an 'expert observer'. Does this mean the 'trained observers' are non-expert recruited subjects? Given the conditions tested differ from previous work (Freeman & Simoncelli, 2011) *these differences are a main contribution of the paper!* which DID include eye tracking in a subset of subjects, it is entirely possible to get similar results to this work in the context of non eye-tracking controlled stimulus presentation. The reasons now in the manuscript are not reasons that make eye tracking 'considered unnecessary'.
I appreciate that the authors now state the lack of eye tracking explicitly, but believe the paper needs to at least state that this is a limitation of the results reported, and eyetracking being 'considered unnecessary' is unreasonable, nor a norm in this subfield.
N=1:<br /> The authors now state clearly the limitations of a single subject in the manuscript, and state the expertise level of this subject.
Large number of trials:<br /> The authors now address this, and include an enumeration of the large number of trials.
Simple Models / Physiology comparison:<br /> I support the choice to reduce claims regarding tight connections to physiology, and appreciate the explanation of the luminance model.
Previous Work:<br /> I appreciate the author's changes to the introduction, both in discussing previous work and citation fixes.
Blurred White, Pink Noise:<br /> While the authors now address pink noise, the explanation for such stimuli being expected to be uninformative is confusing to me. The manuscript now first states that pink noise is a natural choice, then claims it would be uninformative, while also stating in the rebuttal (not the manuscript) that they tried it and it indeed reduced the artifacts they note. The logic of the experiments indeed relies on finding the smallest critical scaling value, which is measured by subjects determining if a synthesis is similar or different to a target or second synth. A synthesis free from artifacts would surely affect the subjects' responses and the smallest critical scaling measured.
The statement that the authors experimented with pink noise early on and found this able to address the artifacts should be stated in the manuscript itself, not just in the rebuttal, and the blanket statement that this experiment would be 'uninformative' is incorrect. Surely this early pilot the authors mention in the rebuttal was informative to designing the experiments that appear in the final paper and would be an informative experiment to include.
Comments on revised version.
The authors have addressed my outstanding concerns, adding discussion about the limitations of not having eye tracking in the study, details about the subject pool, limitations of a subset of the study which contains a single subject, and experiments with pink noise seeds, and this relationship to largest vs smallest critical scaling. In addition, they have added clarity around internal noise vs metamerism in the context of this study as raised by the other reviewer.
Author response:
The following is the authors’ response to the previous reviews
Public Reviews:
Reviewer #1 (Public review):
Comments following re-submission:
Overall, I think the authors have done a satisfactory job of addressing most of the points I raised.
There’s one final issue which I think still needs better discussion.
I think reviewer 2 articulated better than I have the point I was concerned about: the relationship between JNDs and metamers as depicted in the schematics and indeed in the whole conceptualization.
I think the issue here is that there seems to be a conflating of two concepts- ’subthreshold’ and ’metamer’-and I’m not convinced it is entirely unproblematic. It’s true that two stimuli that cannot be discriminated from one another due to the physical differences being too small to detect reliably by the visual system are a form of metamer in the strict definition ’physically different, but perceptually the same’.
However, I don’t think this is the scientifically substantial notion of metamer that enabled insights into trichromacy. That form of metamerism is due to the principle of univariance in feature encoding, and involves conditions in which physically very different stimuli are mapped to one and the same point in sensory encoding space whether or not there is any noise in the system. When I say ’physically very different’ I mean different by a large enough amount that they would be far above threshold, potentially orders of magnitude larger than a JND if the system’s noise properties were identical but the system used a different sensory basis set to measure them. This seems to be a very different kind of ’physically different, but perceptually the same’.
We are in full agreement with this. Typically, the notion of metamers is about deterministic information loss, which can be modeled as a projection from a high-dimensional physical space to a lower-dimensional perceptual space. This is the topic of the paper, and is analogous to the work on color matching in the 19th century.
In contrast, sensitivity to small differences within the perceptual space due to internal noise is usually addressed by other methods, such as signal detection theory, a topic which is not the focus of this paper. It is analogous to the work on discriminability of colors such as MacAdam ellipses (MacAdam, 1942). It is instructive to look at progress in the color field. The color matching experiment and the question of metamerism is quite well worked out, whereas the question of how to quantify discriminability within that space has been an ongoing topic of investigation for over a century.
Here, we aim to develop and test a model of metamers, analogous to the color matching experiments, but we do not attempt to develop a model of discriminability. Nevertheless, while the two types of information loss are conceptually distinct, they are both present in the nervous system of the observer, and both are reflected in the performance vs. scaling plots in our paper. We have added clarifications about this point in the introduction on page 2, starting on line 45, and the discussion, starting on page 16, line 397.
Finally, regarding physical differences between stimuli: the differences between target images and synthesized metamers are quite large (high mean squared error), as shown in Appendix 5. In no condition did we present subjects with stimulus pairs that were physically similar.
I do think the notion of metamerism can obviously be very usefully extended beyond photoreceptors and photon absorptions. In the interesting case of texture metamers, what I think is meant is that stimuli would be discriminable if scrutinised in the fovea, but because they have the same statistics they are treated as equivalent.
The notion of “texture metamers” is perhaps a reference to the work by Freeman and Simoncelli (2011), whose stimuli are similar to ours: when synthesized using a model with sufficiently small scaling, they are indiscriminable, and therefore metamers. The reviewer is of course correct that the stimulus pairs are not metamers when the observers move their eyes due to differences in spatial encoding as a function of eccentricity. That is, they are only metameric under a specific set of viewing conditions, and they are not metameric when those conditions are violated. The same is true for color metamers, as the spectral sensitivity of the cones also differ with eccentricity (Stockman and Sharpe, 2000).
I think the discussion of this could still be clearly articulated in the manuscript. It would benefit from a more thorough discussion of the difference between metamerism and subthreshold, especially in the context of the Voronoi diagrams at the beginning.
We agree that a more thorough discussion of the diagrams could help clarify the issues to the reader. We have modified the caption of figure 1 with the goal of clarifying interpretation of the diagrams, and see also our discussion earlier in this note about noise and discriminability.
It needs to be made clear to the reader why it is that two stimuli that are physically similar (e.g., just spanning one of the edges in the diagram) can be discriminable, while at the same time, two stimuli that are very different (e.g., at opposite ends of a cell) can’t.
Do the cells include BOTH those sets of stimuli that cannot be discriminated just because of internal noise AND those that can’t be discriminated because they are projected to literally the same point in the sensory encoding space? What are the strengths and limits of models that involve the strict binarization of sensory representations, and how can they be integrated with models dealing with continuous differences? These seem like important background concepts that ought to be included in either the introduction of discussion sections. In this context it might also be helpful to refer to the notion of ’visual equivalence’ as described by:
This is an important point and we appreciate the reviewer raising it. In brief, as one traverses a region in one of the Voronoi diagrams, the images are changing physically but subject to the constraint that they all project to the same single point in the reduced perceptual space. When one crosses from one region to another, the images now project to a different point in the perceptual space. Whether or not that the two locations in the perceptual space are distant enough to be distinguishable given the internal noise is a question pertaining to the topic of JNDs in the perceptual space, rather than the mapping from physical space to the perceptual space. We do not address that question in detail in this paper, though we do now reference it in the caption of figure 1, as well as in the new sections in the introduction and discussion mentioned earlier in this response.
We do note that the perceptual space is not discrete: the model outputs are real-valued. The apparent discretization is a limitation of the simplified 2-D schematics.
Ramanarayanan, G., Ferwerda, J., Walter, B., & Bala, K. (2007). Visual equivalence: towards a new standard for image fidelity.ACM Transactions on Graphics (TOG), 26(3), 76-es.
Other than that, I congratulate the authors on a very interesting study, and look forward to reading the final version.
Reviewer #2 (Public review):
Summary:
The authors have improved clarity overall and have spoken to most of the issues raised by the reviewers. There are still two outstanding problems however, where issues raised during the review were inappropriately dismissed in the manuscript. These should be explicitly addressed as limitations to the results presented (no eye tracking), and early pilot experiments that informed the experiments as presented (pink noise) rather than brushed off as ’unnecessary’ and ’would be uninformative’.
Eye tracking:
It is generally accepted that experiments testing stimuli presented at specific locations in peripheral vision require eye tracking to ensure that the stimulus is presented as expected, in particular, in the correct location. As I stated in the previous round of review, while a stimulus presentation time of 200ms does help eliminate some saccades, it does not eliminate the possibility that subjects were not fixating well during stimulus onset. I am also unclear what the authors mean by ’trained observer’ in this context, though the authors state that an author subject in a different portion of the paper is an ’expert observer’. Does this mean the ’trained observers’ are non-expert recruited subjects?
Given the conditions tested differ from previous work (Freeman & Simoncelli, 2011) ‘these differences are a main contribution of the paper!’ which DID include eye tracking in a subset of subjects, it is entirely possible to get similar results to this work in the context of non eye-tracking controlled stimulus presentation. The reasons now in the manuscript are not reasons that make eye tracking ’considered unnecessary’.
I appreciate that the authors now state the lack of eye tracking explicitly, but believe the paper needs to at least state that this is a limitation of the results reported, and eyetracking being ’considered unnecessary’ is unreasonable, nor a norm in this subfield.
By “trained” observers, we mean people who were recruited from the community of vision science labs at NYU and who have participated in many visual psychophysics experiments. All of the participants are “trained” in this sense, and are thus used to maintaining fixation while performing peripheral tasks. One of these participants, an author, was also an expert in the specific content area of the paper. By “expert”, we mean high familiarity with the stimulus types and models employed in the paper.
We have now further clarified this in the text in the subsection of the methods on Observers, on page 22.
We also discuss the issue at greater length in the methods subsection Apparatus, on page 26. We removed the word "unnecessary" and make it clear that while we don’t think our results are undermined, the lack of eye tracking is nonetheless a limitation.
N=1: The authors now state clearly the limitations of a single subject in the manuscript, and state the expertise level of this subject.
Large number of trials: The authors now address this and include an enumeration of the large number of trials.
Simple Models / Physiology comparison: I support the choice to reduce claims regarding tight connections to physiology, and appreciate the explanation of the luminance model.
Previous Work: I appreciate the author’s changes to the introduction, both in discussing previous work and citation fixes.
Blurred White, Pink Noise: While the authors now address pink noise, the explanation for such stimuli being expected to be uninformative is confusing to me. The manuscript now first states that pink noise is a natural choice, then claims it would be uninformative, while also stating in the rebuttal (not the manuscript) that they tried it and it indeed reduced the artifacts they note. The logic of the experiments indeed relies on finding the smallest critical scaling value, which is measured by subjects determining if a synthesis is similar or different to a target or second synth. A synthesis free from artifacts would surely affect the subjects responses and the smallest critical scaling measured.
The statement that the authors experimented with pink noise early on and found this able to address the artifacts should be stated in the manuscript itself, not just in the rebuttal, and the blanket statement that this experiment would be ’uninformative’ is incorrect. Surely this early pilot the authors mention in the rebuttal was informative to designing the experiments that appear in the final paper, and would be an informative experiment to include.
First, we did render some test stimuli with pink noise seeds, but we did not collect psychophysical data, hence there are no results we could add. Visual inspection of these stimuli was indeed clarifying in the following sense. The pink noise stimuli had fewer high-frequency “artifacts”. If our goal was to synthesize stimuli that are indistinguishable from the original stimulus, as one might do to save compute power when in a device that for foveated rendering, then starting with pink noise would be better than starting with white noise. Our purpose was just the opposite. For our experiments, the artifacts were just what we wanted: the more artifacts, the better. The reason is that a strongest test of a metamer model is whether two stimuli that are as physically different from one another as possible, are nonetheless indistinguishable when their model representations are the same. Stimuli synthesized from pink noise seeds are harder to discriminate from the target stimulus, not easier. Thus using them in an experiment would result in a larger estimate of critical scaling. Since our explicit goal was to estimate the smallest critical scaling window, these stimuli would not bring us closer to our goal. As the reviewer points out, these metamers were “informative” in the sense that they informed our experimental design, but they are “uninformative” (relative to white noise seeds) for estimating the critical scaling.
We have updated our description in the discussion starting on page 19, line 449, and included a new appendix to demonstrate this point (appendix 2 on page 35).
Recommendations for the authors:
Reviewer #1 (Recommendations for the authors):
Typo: p. 19, l. 439: ’Why does asymptotic performance, but not critical scaling, depends on image content?’": remove ’s’ from ’depends’.
Fixed.
Reviewer #2 (Recommendations for the authors):
Recommendations: State that the lack of eye tracking to control stimulus presentation is a limitation of the results presented.
Remove the claim that pink noise or filtered white noise seeds would be uninformative, and mention the fact that the authors in fact experimented with pink noise seeds in an early version of the experiments (which was surely informative to the experimental setup as presented here).
Addressed as described above.
References
Freeman J, Simoncelli EP. Metamers of the ventral stream. Nature Neuroscience. 2011 aug; 14(9):1195–1201. doi: 10.1038/nn.2889.
MacAdam DL. Visual Sensitivities To Color Differences in Daylight*. Journal of the Optical Society of America. 1942 may; 32(5):247. http://dx.doi.org/10.1364/josa.32.000247, doi: 10.1364/josa.32.000247.
Stockman A, Sharpe LT. The Spectral Sensitivities of the Middle- and Long-Wavelength-Sensitive Cones Derived From Measurements in Observers of Known Genotype. Vision Research. 2000 jun; 40(13):1711–1737. doi: 10.1016/s0042-6989(00)00021-3.
eLife Assessment
This is an important study establishing the mechanistic principles how NUP98-KDM5A phase separates together with H3K4me3 chromatin in leukemia. Methods are sound and results are convincing, providing a framework to understand gene expression changes in leukemia patients.
Reviewer #1 (Public review):
Leukemia-driving NUP98 oncofusion proteins form chromatin-associated biomolecular condensates in the nucleus, and these structures are important for oncogenic transformation. Most NUP98 fusions do not contain domains that mediate the recognition of specific DNA elements. Instead, they entail domains that are important for chromatin regulation. For instance, the NUP98::KDM5A fusion features a fusion of the NUP98 N-terminus with the third PHD domain of the histone demethylase KDM5A. As PHD domains are critical for the recognition of methylated histones without any sequence specificity, it is not clear what controls the condensation and chromatin binding of NUP98::KDM5A, leading to the induction of oncogenic transcriptional programs.
In this work, the authors use a combination of cellular and in vitro studies to show that biomolecular condensation of NUP98::KDM5A is dependent on H3K4me3 binding. Their model proposes that concentration-dependent chromatin-associated condensation of NUP98::KDM5A depends on local densities of H3K4me3 on chromatin and the levels of the fusion oncoprotein. In line with this, the analysis of gene expression data from NUP98::KDM5A-positive AML cells shows a positive correlation between differentially expressed genes and H3K4me3 levels.
This is an interesting manuscript that aims to dissect the molecular mechanisms underlying biomolecular condensation of the NUP98::KDM5A oncoprotein. The work is solid, and the results are well explained and presented in a logical order. However, the study suffers from several weaknesses that if addressed would improve the study.
Major points:
(1) All cellular experiments are performed in settings of transient transfection of NUP98::KDM5A in non-hematopoietic cell types. These conditions are not physiologically relevant, as these cells do not depend on the fusion oncogene. Therefore, any claims about concentration-dependent effects on condensation need to be validated in AML cells that are driven by NUP98::KDM5A. While this may not be possible in primary patient-derived cells, several groups have published AML models of NUP98::KDM5A-driven AML that could be used.
(2) The results presented in Figure 4 are not entirely supportive of the mechanism. It is known that active gene expression correlates with high H3K4me3 levels; therefore, the correlations shown by the authors are expected. Yet, the authors do not discuss the fact that many H3K4me3-positive genomic regions do not show NUP98::KDM5A binding. This should be elaborated on in the discussion section.
(3) While the focus of the manuscript is on NUP98::KDM5A, this oncofusion is part of a family of >30 fusions that join the NUP98 N-terminus to a variety of factors with roles in epigenetic control and transcription. While the repertoire of NUP98 fusion partners is diverse with regard to functional domains, they all induce a conserved set of target genes that is characteristic of this leukemia subtype. How can this be achieved in the context of NUP98 fusion proteins that do not contain a PHD domain, such as NUP98::NSD1 or NUP98::HOXA9? Please discuss this.
Reviewer #2 (Public review):
In this manuscript, the authors investigate how the oncogenic fusion protein NUP98-KDM5A alters gene expression in leukemia, using a combination of cellular experiments with model and patient cell lines, as well as in vitro studies. Upon transfection of U2OS cells with mEGFP-tagged NUP98-KDM5A, the authors show that the fusion proteins form sub-micrometer puncta, whereas KDM5A alone does not. These foci are also observed at expected native expression levels (using OpenCell data). The tag has an effect here, as switching to an mCherry tag raises the apparent saturation concentration for phase separation. Finally, the authors show via super-resolution imaging that the foci correlate with H3K4me3 distribution.
In vitro, the fusion protein forms amorphous, gel-like condensates at double-digit nanomolar concentrations. Truncation analysis identifies PHD3 of KDM5A as required for maximal phase separation, consistent with the ability of the protein to bind H3K4me3 peptides. Addition of polynucleosomes increases the amount of fusion protein partitioning into the condensate in an H3K4me3-binding-dependent manner. Condensates are gel-like with slow internal dynamics in vitro; in cells, however, the dynamics depend on the position of the EGFP tag (no corresponding experiments with mCherry are shown). Reconstitution with H3K4me3- and H3K4me0-modified arrays shows colocalization with both wild-type NUP98-KDM5A and the binding mutant. Here, H3K4me3 arrays recruit ~20% more protein and yield gel-like structures in a manner dependent on the PTM and on the PHD finger.
In cells, the fusion protein colocalizes with H3K4me3-marked loci, including the HOX clusters, as confirmed by FISH. Finally, re-analysis of published expression datasets from patient cells shows that genes are predominantly upregulated and that the upregulated genes are H3K4me3-marked.
This is a well-executed mechanistic study. The data convincingly establish that NUP98-KDM5A forms sub-micrometer foci at realistic expression levels, that these foci correlate with H3K4me3-marked sites, that the PHD3-H3K4me3 interaction mediates chromatin binding while the NUP98 moiety drives phase separation in vitro, that foci in cells overlap genes heavily decorated with H3K4me3, and that H3K4me3-marked genes are those found to be upregulated in patient datasets. These are important mechanistic findings and of interest to the community.
Still, the functional/causal link is a bit more tentative, as the data is mostly correlative, since it is not directly established that there is feedback between H3K4 methylation, NUP98-KDM5A recruitment, phase separation and target gene overexpression. An experiment that could further bolster this claim would be a direct test of whether NUP98-KDM5A expression drives overexpression of bound genes, e.g. expression of the fusion protein vs PHD- and NUP98-mutant variants, followed by qPCR of target genes, such as the HOX cluster, and possibly H3K4me3 ChIP at the same loci. As all the constructs and cell lines exist, this could be feasible and would substantially strengthen the manuscript.
Author response:
We greatly appreciate the positive and constructive comments from the reviewers, which recognized the intellectual contributions of our manuscript and also captured its limitations. Below is our response to the three major points from Reviewer #1 and the comments from Reviewer #2.
Response to Reviewer #1
(1) Use of transient transfection in non-hematopoietic cells. We appreciate the reviewer’s point regarding physiological relevance. Our goal in these cellular microscopy experiments was to dissect the biophysical principles of NUP98::KDM5A (including its mutants) condensate formation under controlled expression levels (concentration). While AML model systems driven by NUP98::KDM5A are available, they do not offer this possibility because of pre-existing NUP98::KDM5A expression. The suspension culture of hematopoietic cells also brings practical challenges for correlative FISH+IF and high-resolution microscopy analysis. We agree that validating our observed behaviors in AML models would be valuable, e.g. by creating HSPC lines with inducible expression of tagged NUP98::KDM5A and its mutants, but such experiments fall outside the scope of the current study. We will add text acknowledging this limitation and clarifying that our mechanistic conclusions are grounded in biophysical principles that should generalize across cell types.
(2) Correlation between H3K4me3 and gene activation. We agree that active transcription correlates with H3K4me3, and that this baseline relationship must be considered. Our analysis explicitly uses fold-change between patient cells and healthy controls as the readout. This comparison inherently accounts for the activating effect of H3K4me3 itself. Regarding the reviewer’s comment that “many H3K4me3-positive genomic regions do not show NUP98::KDM5A binding”, we would like to clarify that this point is exactly what our manuscript aims to explain. Our cell line studies demonstrate that, at a patient-relevant expression level, NUP98::KDM5A condensates form preferentially at H3K4me3 locus with high local mark density. Considering that NUP98::KDM5A concentration in the nucleus is lower than the K_D between KDM5A PHD3 and H3K4me3, this means that H3K4me3 loci with lower mark density will not see NUP98::KDM5A binding without the high local concentration of the fusion protein (as a result of condensate formation). This is consistent with our observation that genes with the highest local density show disproportionately stronger upregulation. We will further clarify this point in the revised manuscript.
(3) Generalization to other NUP98 fusions lacking PHD domains. We appreciate this important conceptual question. We will expand the discussion to note that many NUP98 fusions, despite diverse partner domains, produce similar transcriptional programs. Our current hypothesis is that the highly active status of the HOX cluster genes in HSPC attracts NUP98 oncofusions targeting H3K4me3 (e.g. KDM5A and PHF23), while NUP98::HOXA9 and other transcription factor fusions directly target the HOX cluster via DNA sequence recognition. This convergence and the broad targets of the dysregulated HOX transcription factors explain the transcriptional program similarity, sustained by the previously described enrichment of transcriptional co-activators by NUP98 oncofusion condensates. We will explicitly discuss this hypothesis in our revised manuscript.
Response to Reviewer #2
We thank the reviewer for the thoughtful evaluation and agree that the causal link between H3K4me3 recognition, condensate formation, and gene activation remains partly correlative. Experiments such as qPCR or ChIP following expression of WT versus mutant constructs would indeed strengthen the causal chain. However, performing these assays across multiple constructs and loci in a physiologically relevant system is not feasible within the current revision cycle. We have added text acknowledging this limitation and clarifying that our study focuses on establishing the biophysical mechanism of targeting, while functional consequences are inferred from patient datasets rather than new perturbation experiments.
eLife Assessment
In this important study, the authors describe the mechanisms by which CDK4/6 overexpression mediates resistance to Osimertinib in EGFR mutant lung cancer models. Their data show that CD4/6 overexpressing cells had increased replicative stress and genomic instability. The evidence is solid, but inclusion of some additional experiments would make this stronger.
Reviewer #1 (Public review):
Summary:
The authors used a panel of cell models to determine whether CDK4/6 overexpression resulted in resistance to the EGFR inhibitor Osimertinib, and the mechanisms underlying the resistance.
(1) Major Concerns (highest priority):
There is a lack of detail about the methodology in the results section/figure legends, which makes it difficult to interpret the data. Sometimes, adequate information is also not included in the methods themselves. For example, Figure 1A: how many doses did each mouse receive? How long after dosing were animals sacrificed? Figures 1E and 2A: is this RNA-seq analysis?
Using a second EGFR inhibitor for some of the key experiments would increase the rigor of the studies shown.
(2) Nice to have experiments:
Using CRISPR KO of CDK4 in the CDK4-amplified HCC827 and testing response to Osi and presence of replication stress would also increase the rigor of the studies.
The authors show that in their patient data, some cell cycle regulators which are amplified in NSCLC at similar rates to CDK4/6, such as CCNE1, had no increase in FGA. Overexpressing CCNE1 and testing Osi response in their cell models would be a nice test of their proposed mechanism that it is the genomic instability and FGA that are driving resistance. This wouldn't need to be done in vivo, but could be done using cell culture-based methods.
Similarly, testing the overexpression of some of the proposed target genes, such as STEAP1 and AGR2, on the therapeutic response to Osi in cell culture would also be a nice test of the mechanism proposed.
Reviewer #2 (Public review):
Summary:
In this manuscript, Gini et al. investigate the mechanisms by which CDK4 and CDK6 upregulation drives resistance to EGFR tyrosine kinase inhibitors (TKIs) in EGFR-mutant lung adenocarcinoma (LUAD). The study utilizes preclinical models, including cell line-derived xenografts (CDXs), patient-derived xenografts (PDXs), and primary organoids, alongside large-scale clinical genomic datasets. The authors demonstrate that CDK4 or CDK6 overexpression allows cancer cells to bypass EGFR TKI-induced G1/S arrest, leading to continuous cell cycle progression. This sustained proliferation during EGFR inhibition induces DNA replication stress, activates DNA damage response pathways (such as ATM and TPX2), and ultimately causes genomic instability. The authors also show that this leads in turn to the upregulation of tumor-promoting genes (e.g., AGR2, ASNS, STEAP1) and an epithelial-mesenchymal transition (EMT) phenotype. Moreover, the authors show that combinatorial treatment utilizing TKIs such as osimertinib alongside CDK4/6 inhibitors effectively suppresses proliferation, mitigates DNA damage, and restores TKI sensitivity in preclinical models.
Overall, this is a highly translational study that provides a strong mechanistic rationale for biomarker-driven clinical trials combining EGFR and CDK4/6 inhibitors. However, there are a few experimental and analytical areas that require clarification or additional data to fully support the authors' conclusions.
Major Comments:
(1) Reliance on overexpression models over loss-of-function
The mechanistic studies mainly rely on overexpression of CDK4 and CDK6 to simulate the amplified state. Although the authors argued that the level of overexpression mimics that observed in resistant tumors, a complementary study in which CDK4/CDK6 were suppressed in a model where CDK4/CDK6 is amplified (such as HCC827 or TH116), and replication stress and osimertinib sensitivity tested would greatly strengthen their observations. Indeed, there is mention of CDK4 constructs to perform knockdown studies in the methods, but those studies are not included in this submission.
(2) Mechanistic link between genomic instability and specific gene amplifications
The authors highlight that CDK4/6 activation leads to recurrent copy number gains and transcriptional upregulation of specific pro-tumor genes including AGR2, ASNS, and STEAP1. While the paper establishes that CDK4/6 overexpression causes general genomic instability (increased FGA), it does not mechanistically explain why these specific genes are consistently amplified. The authors should investigate or discuss whether these specific loci are inherently fragile under replication stress, if they are direct downstream targets of the E2F transcriptional program, or if this is a result of random genomic instability followed by strong positive selection under osimertinib pressure.
(3) Discrepancies in tumor mutational burden (TMB) reporting
There is a slight contradiction regarding the TMB data that needs to be clarified for readers. The manuscript states that in the clinical datasets, "EGFR-mutant LUAD harboring cell cycle gene alterations exhibited significantly elevated FGA and TMB relative to cell cycle-negative tumors" (Line 265-266). However, in the next section, the authors say, "Notably, no corresponding increase in TMB was observed with CDK4 or CDK6 CNA, similar to our findings in preclinical models" (Line 271-273). The authors should clarify or discuss why broad cell cycle alterations correlate with high TMB, while CDK4/6-specific alterations drive structural instability (FGA) without increasing TMB.
Author response:
Reviewer 1:
(1) Major Concerns (highest priority):
There is a lack of detail about the methodology in the results section/figure legends, which makes it difficult to interpret the data. Sometimes, adequate information is also not included in the methods themselves. For example, Figure 1A: how many doses did each mouse receive? How long after dosing were animals sacrificed? Figures 1E and 2A: is this RNA-seq analysis?
Thank you for pointing this out. We will provide additional details about the methodology in the results, figure legends, and methods to clarify our findings.
Using a second EGFR inhibitor for some of the key experiments would increase the rigor of the studies shown.
Thank you for this suggestion. We agree that a second EGFR inhibitor may increase the scientific rigor of the findings. However, at the time the experiments were completed, osimertinib was the clear standard of care first-line therapy for EGFR-mutated lung cancer and the clinical relevance of using other inhibitors in these experiments is not clear.
(2) Nice to have experiments:
Using CRISPR KO of CDK4 in the CDK4-amplified HCC827 and testing response to Osi and presence of replication stress would also increase the rigor of the studies.
Thank you for this suggestion. We agree that this would increase the rigor of the studies, but these experiments are currently beyond the scope of this manuscript.
The authors show that in their patient data, some cell cycle regulators which are amplified in NSCLC at similar rates to CDK4/6, such as CCNE1, had no increase in FGA. Overexpressing CCNE1 and testing Osi response in their cell models would be a nice test of their proposed mechanism that it is the genomic instability and FGA that are driving resistance. This wouldn't need to be done in vivo, but could be done using cell culture-based methods.
Thank you for this suggestion. For this manuscript, we have chosen to focus on the role of CDK4 and CDK6 in osimertinib resistance as they have shown the clearest correlation with decreased responsiveness to EGFR TKI treatment in other studies. We agree that assessing the role of CCNE1 in osimertinib resistance is important and will address this in future studies.
Similarly, testing the overexpression of some of the proposed target genes, such as STEAP1 and AGR2, on the therapeutic response to Osi in cell culture would also be a nice test of the mechanism proposed.
Thank you for this suggestion. We agree that these experiments are important, but they are currently beyond the scope of this study.
Reviewer 2:
Major Comments:
(1) Reliance on overexpression models over loss-of-function
The mechanistic studies mainly rely on overexpression of CDK4 and CDK6 to simulate the amplified state. Although the authors argued that the level of overexpression mimics that observed in resistant tumors, a complementary study in which CDK4/CDK6 were suppressed in a model where CDK4/CDK6 is amplified (such as HCC827 or TH116), and replication stress and osimertinib sensitivity tested would greatly strengthen their observations. Indeed, there is mention of CDK4 constructs to perform knockdown studies in the methods, but those studies are not included in this submission.
Thank you for this suggestion. We agree that loss of function studies are an important complement to over expression studies. However, we have chosen to focus on the use of pharmacologic inhibitors of CDK4/6, which are more clinically relevant than knockdown studies. We demonstrate that the CDK4/6 inhibitor palbociclib is able to prevent replication stress and restore osimertinib sensitivity in CDK6 amplified TH116 patient-derived xenografts (Figure 5 and Supplementary Figure 10).
(2) Mechanistic link between genomic instability and specific gene amplifications
The authors highlight that CDK4/6 activation leads to recurrent copy number gains and transcriptional upregulation of specific pro-tumor genes including AGR2, ASNS, and STEAP1. While the paper establishes that CDK4/6 overexpression causes general genomic instability (increased FGA), it does not mechanistically explain why these specific genes are consistently amplified. The authors should investigate or discuss whether these specific loci are inherently fragile under replication stress, if they are direct downstream targets of the E2F transcriptional program, or if this is a result of random genomic instability followed by strong positive selection under osimertinib pressure.
Thank you for this suggestion. We will provide additional discussion about whether these specific loci are likely to be inherently fragile under replication stress, if they are direct downstream targets of the E2F transcriptional program, or if it is more likely the result of random genomic instability followed by strong positive selection under osimertinib pressure.
(3) Discrepancies in tumor mutational burden (TMB) reporting
There is a slight contradiction regarding the TMB data that needs to be clarified for readers. The manuscript states that in the clinical datasets, "EGFR-mutant LUAD harboring cell cycle gene alterations exhibited significantly elevated FGA and TMB relative to cell cycle-negative tumors" (Line 265-266). However, in the next section, the authors say, "Notably, no corresponding increase in TMB was observed with CDK4 or CDK6 CNA, similar to our findings in preclinical models" (Line 271-273). The authors should clarify or discuss why broad cell cycle alterations correlate with high TMB, while CDK4/6-specific alterations drive structural instability (FGA) without increasing TMB.
Thank you for this suggestion. We will clarify our findings and provide further discussion about why there may be a difference between the effects of broad cell cycle alterations and CDK4/6-specific alterations on TMB and structural genomic instability.
This manuscript is now published under a revised title: "Neural cells are susceptible to historic and recently emerged Oropuche virus strains"
https://journals.plos.org/plospathogens/article?id=10.1371/journal.ppat.1013933
Please link to the published version.
这个工具可以清楚告诉你一根 USB-C 线能做什么,比如线缆速度、充电限制和已连接的设备。你还可以给线缆命名,让它持续跟踪实际表现,之后就能知道为什么这根线充电慢,或为什么接不了显示器。思路挺好,不过比较小众。
Üsküdar Belediye Başkanı Sinem Dedetaş gözaltına alındı
US-2.3. Связь с лицензией на недропользование (US-OL-05)
В перечне открытых вопросов. Постараемся в ближайшее время прояснить. Я бы подсветил это для команды
Атрибутивный состав иной лицензии
В атрибутах пропущено Место осуществления деятельности (территория) Перечень работ/услуг
this article has been published https://onlinelibrary.wiley.com/doi/10.1111/gcb.70982
RRIDSCR_009550
DOI: 10.1093/sleep/zsag205
Resource: Connectivity Toolbox (RRID:SCR_009550)
Curator: @nmaralla
SciCrunch record: RRID:SCR_009550
RRID: CVCL_0027
DOI: 10.1016/j.tranon.2026.102938
Resource: (TKG Cat# TKG 0205, RRID:CVCL_0027)
Curator: @nmaralla
SciCrunch record: RRID:CVCL_0027
RRID:SCR_003070
DOI: 10.1016/j.tranon.2026.102938
Resource: ImageJ (RRID:SCR_003070)
Curator: @scibot
SciCrunch record: RRID:SCR_003070
RRID:CVCL_0291
DOI: 10.1016/j.tranon.2026.102938
Resource: (RRID:CVCL_0291)
Curator: @scibot
SciCrunch record: RRID:CVCL_0291
RRID:SCR_024676
DOI: 10.1016/j.tranon.2026.102938
Resource: NovoExpress (RRID:SCR_024676)
Curator: @scibot
SciCrunch record: RRID:SCR_024676
RRID:CVCL_0045
DOI: 10.1016/j.tranon.2026.102938
Resource: (DSMZ Cat# ACC-305, RRID:CVCL_0045)
Curator: @scibot
SciCrunch record: RRID:CVCL_0045
RRID: SCR_010910
DOI: 10.1016/j.celrep.2026.117736
Resource: BWA (RRID:SCR_010910)
Curator: @nmaralla
SciCrunch record: RRID:SCR_010910
RRID:SCR_016366
DOI: 10.1016/j.celrep.2026.117736
Resource: Deeptools (RRID:SCR_016366)
Curator: @scibot
SciCrunch record: RRID:SCR_016366
SCR_011942
DOI: 10.1016/j.celrep.2026.117736
Resource: MEGAN (RRID:SCR_011942)
Curator: @scibot
SciCrunch record: RRID:SCR_011942
RRID:SCR_013291
DOI: 10.1016/j.celrep.2026.117736
Resource: MACS (RRID:SCR_013291)
Curator: @scibot
SciCrunch record: RRID:SCR_013291
RRID:SCR_002105
DOI: 10.1016/j.celrep.2026.117736
Resource: Samtools (RRID:SCR_002105)
Curator: @scibot
SciCrunch record: RRID:SCR_002105
RRID:SCR_016368
DOI: 10.1016/j.celrep.2026.117736
Resource: Bowtie (RRID:SCR_005476)
Curator: @scibot
SciCrunch record: RRID:SCR_016368
RRID:SCR_016341
DOI: 10.1016/j.celrep.2026.117736
Resource: Seurat (RRID:SCR_016341)
Curator: @scibot
SciCrunch record: RRID:SCR_016341
RRID:SCR_011848
DOI: 10.1016/j.celrep.2026.117736
Resource: Trimmomatic (RRID:SCR_011848)
Curator: @scibot
SciCrunch record: RRID:SCR_011848
RRID:SCR_017344
DOI: 10.1016/j.celrep.2026.117736
Resource: Cell Ranger (RRID:SCR_017344)
Curator: @scibot
SciCrunch record: RRID:SCR_017344
RRID:IMSR_JAX:000664
DOI: 10.1016/j.celrep.2026.117736
Resource: RRID:IMSR_JAX:000664
Curator: @scibot
SciCrunch record: RRID:IMSR_JAX:000664
RRID:SCR_011793
DOI: 10.1016/j.celrep.2026.117736
Resource: Integrative Genomics Viewer (RRID:SCR_011793)
Curator: @scibot
SciCrunch record: RRID:SCR_011793
RRID:CVCL_0493
DOI: 10.1016/j.celrep.2026.117736
Resource: (ATCC Cat# TIB-71, RRID:CVCL_0493)
Curator: @scibot
SciCrunch record: RRID:CVCL_0493
RRID:AB_2721140
DOI: 10.1016/j.celrep.2026.117736
Resource: (Proteintech Cat# 25747-1-AP, RRID:AB_2721140)
Curator: @scibot
SciCrunch record: RRID:AB_2721140
RRID:SCR_016071
DOI: 10.1016/j.celrep.2026.117736
Resource: DIAMOND (RRID:SCR_016071)
Curator: @scibot
SciCrunch record: RRID:SCR_016071
RRID:AB_2881149
DOI: 10.1016/j.celrep.2026.117736
Resource: (Proteintech Cat# 28463-1-AP, RRID:AB_2881149)
Curator: @scibot
SciCrunch record: RRID:AB_2881149
RRID:SCR_015687
DOI: 10.1016/j.celrep.2026.117736
Resource: DESeq2 (RRID:SCR_015687)
Curator: @scibot
SciCrunch record: RRID:SCR_015687
RRID:SCR_003070
DOI: 10.1016/j.celrep.2026.117736
Resource: ImageJ (RRID:SCR_003070)
Curator: @scibot
SciCrunch record: RRID:SCR_003070
RRID:AB_3094534
DOI: 10.1016/j.celrep.2026.117736
Resource: (Proteintech Cat# RGAR011, RRID:AB_3094534)
Curator: @scibot
SciCrunch record: RRID:AB_3094534
RRID:SCR_008520
DOI: 10.1016/j.celrep.2026.117736
Resource: FlowJo (RRID:SCR_008520)
Curator: @scibot
SciCrunch record: RRID:SCR_008520
RRID:SCR_011841
DOI: 10.1016/j.celrep.2026.117736
Resource: cutadapt (RRID:SCR_011841)
Curator: @scibot
SciCrunch record: RRID:SCR_011841
RRID:SCR_014583
DOI: 10.1016/j.celrep.2026.117736
Resource: FastQC (RRID:SCR_014583)
Curator: @scibot
SciCrunch record: RRID:SCR_014583
RRID:SCR_002798
DOI: 10.1016/j.celrep.2026.117736
Resource: GraphPad Prism (RRID:SCR_002798)
Curator: @scibot
SciCrunch record: RRID:SCR_002798
RRID:AB_312980
DOI: 10.1016/j.celrep.2026.117736
Resource: (BioLegend Cat# 103115, RRID:AB_312980)
Curator: @scibot
SciCrunch record: RRID:AB_312980
RRID:AB_439782
DOI: 10.1016/j.celrep.2026.117736
Resource: (BioLegend Cat# 105013, RRID:AB_439782)
Curator: @scibot
SciCrunch record: RRID:AB_439782
RRID:AB_10949503
DOI: 10.1016/j.celrep.2026.117736
Resource: (Cell Signaling Technology Cat# 8173, RRID:AB_10949503)
Curator: @scibot
SciCrunch record: RRID:AB_10949503
RRID:AB_893495
DOI: 10.1016/j.celrep.2026.117736
Resource: (BioLegend Cat# 123125, RRID:AB_893495)
Curator: @scibot
SciCrunch record: RRID:AB_893495
RRID:AB_10597232
DOI: 10.1016/j.celrep.2026.117736
Resource: (Proteintech Cat# 18704-1-AP, RRID:AB_10597232)
Curator: @scibot
SciCrunch record: RRID:AB_10597232
RRID:AB_2861417
DOI: 10.1016/j.celrep.2026.117736
Resource: (Abcam Cat# ab178945, RRID:AB_2861417)
Curator: @scibot
SciCrunch record: RRID:AB_2861417
RRID:AB_312788
DOI: 10.1016/j.celrep.2026.117736
Resource: (BioLegend Cat# 101205, RRID:AB_312788)
Curator: @scibot
SciCrunch record: RRID:AB_312788
RRID:AB_2099233
DOI: 10.1016/j.celrep.2026.117736
Resource: (Cell Signaling Technology Cat# 7074, RRID:AB_2099233)
Curator: @scibot
SciCrunch record: RRID:AB_2099233
RRID:AB_2880943
DOI: 10.1016/j.celrep.2026.117736
Resource: (Proteintech Cat# 27675-1-AP, RRID:AB_2880943)
Curator: @scibot
SciCrunch record: RRID:AB_2880943
RRID:AB_10896057
DOI: 10.1016/j.celrep.2026.117736
Resource: (BioLegend Cat# 141707, RRID:AB_10896057)
Curator: @scibot
SciCrunch record: RRID:AB_10896057
RRID:AB_2943645
DOI: 10.1016/j.celrep.2026.117736
Resource: RRID:AB_2943645
Curator: @scibot
SciCrunch record: RRID:AB_2943645
RRID:AB_10596794
DOI: 10.1016/j.celrep.2026.117736
Resource: (Proteintech Cat# 16643-1-AP, RRID:AB_10596794)
Curator: @scibot
SciCrunch record: RRID:AB_10596794
RRID:AB_3697633
DOI: 10.1016/j.celrep.2026.117736
Resource: RRID:AB_3697633
Curator: @scibot
SciCrunch record: RRID:AB_3697633
RRID:AB_2687938
DOI: 10.1016/j.celrep.2026.117736
Resource: (Proteintech Cat# 66009-1-Ig, RRID:AB_2687938)
Curator: @scibot
SciCrunch record: RRID:AB_2687938
RRID:AB_11154960
DOI: 10.1016/j.celrep.2026.117736
Resource: (Abcam Cat# ab129089, RRID:AB_11154960)
Curator: @scibot
SciCrunch record: RRID:AB_11154960
RRID:AB_2107436
DOI: 10.1016/j.celrep.2026.117736
Resource: (Proteintech Cat# 60004-1-Ig, RRID:AB_2107436)
Curator: @scibot
SciCrunch record: RRID:AB_2107436
RRID:AB_3669565
DOI: 10.1016/j.celrep.2026.117736
Resource: RRID:AB_3669565
Curator: @scibot
SciCrunch record: RRID:AB_3669565
RRID:AB_330924
DOI: 10.1016/j.celrep.2026.117736
Resource: (Cell Signaling Technology Cat# 7076, RRID:AB_330924)
Curator: @scibot
SciCrunch record: RRID:AB_330924
RRID:AB_3697632
DOI: 10.1016/j.celrep.2026.117736
Resource: RRID:AB_3697632
Curator: @scibot
SciCrunch record: RRID:AB_3697632
RRID:SCR_014199
DOI: 10.1016/j.celrep.2026.117726
Resource: Adobe Photoshop (RRID:SCR_014199)
Curator: @nmaralla
SciCrunch record: RRID:SCR_014199
RRID:SCR_027181
DOI: 10.1016/j.celrep.2026.117726
Resource: NIS-Elements Advanced Research (RRID:SCR_027181)
Curator: @nmaralla
SciCrunch record: RRID:SCR_027181
RRID:SCR_002798
DOI: 10.1016/j.celrep.2026.117726
Resource: GraphPad Prism (RRID:SCR_002798)
Curator: @scibot
SciCrunch record: RRID:SCR_002798
RRID:SCR_013672
DOI: 10.1016/j.celrep.2026.117726
Resource: ZEISS ZEN Microscopy Software (RRID:SCR_013672)
Curator: @scibot
SciCrunch record: RRID:SCR_013672
RRID:SCR_000432
DOI: 10.1016/j.celrep.2026.117726
Resource: RStudio (RRID:SCR_000432)
Curator: @scibot
SciCrunch record: RRID:SCR_000432
RRID:AB_390913
DOI: 10.1016/j.celrep.2026.117726
Resource: (Roche Cat# 11814460001, RRID:AB_390913)
Curator: @scibot
SciCrunch record: RRID:AB_390913
RRID:AB_2687657
DOI: 10.1016/j.celrep.2026.117726
Resource: (Abcam Cat# ab171870, RRID:AB_2687657)
Curator: @scibot
SciCrunch record: RRID:AB_2687657
RRID:AB_528451
DOI: 10.1016/j.celrep.2026.117726
Resource: (DSHB Cat# 4c5, RRID:AB_528451)
Curator: @scibot
SciCrunch record: RRID:AB_528451
RRID:AB_307019
DOI: 10.1016/j.celrep.2026.117726
Resource: (Abcam Cat# ab9110, RRID:AB_307019)
Curator: @scibot
SciCrunch record: RRID:AB_307019
RRID:AB_10013483
DOI: 10.1016/j.celrep.2026.117726
Resource: (Takara Bio Cat# 632496, RRID:AB_10013483)
Curator: @scibot
SciCrunch record: RRID:AB_10013483
RRID:AB_477010
DOI: 10.1186/s40478-026-02240-y
Resource: (Sigma-Aldrich Cat# G3893, RRID:AB_477010)
Curator: @scibot
SciCrunch record: RRID:AB_477010
RRID:AB_2572311
DOI: 10.1186/s40478-026-02240-y
Resource: (EnCor Biotechnology Cat# MCA-5C10, RRID:AB_2572311)
Curator: @scibot
SciCrunch record: RRID:AB_2572311
RRID:AB_3678889
DOI: 10.1186/s40478-026-02240-y
Resource: RRID:AB_3678889
Curator: @scibot
SciCrunch record: RRID:AB_3678889
RRID:AB_2109953
DOI: 10.1186/s40478-026-02240-y
Resource: (EnCor Biotechnology Cat# CPCA-GFAP, RRID:AB_2109953)
Curator: @scibot
SciCrunch record: RRID:AB_2109953
RRID:AB_2050678
DOI: 10.1186/s40478-026-02240-y
Resource: (Enzo Life Sciences Cat# BML-FG6090-0100, RRID:AB_2050678)
Curator: @scibot
SciCrunch record: RRID:AB_2050678
RRID:AB_3678888
DOI: 10.1186/s40478-026-02240-y
Resource: RRID:AB_3678888
Curator: @scibot
SciCrunch record: RRID:AB_3678888
RRID:AB_3711244
DOI: 10.1186/s40478-026-02240-y
Resource: RRID:AB_3711244
Curator: @scibot
SciCrunch record: RRID:AB_3711244
RRID:AB_10013382
DOI: 10.1186/s40478-026-02240-y
Resource: (Agilent Cat# Z0334, RRID:AB_10013382)
Curator: @scibot
SciCrunch record: RRID:AB_10013382
RRID:AB_303395
DOI: 10.1016/j.isci.2026.116781
Resource: (Abcam Cat# ab290, RRID:AB_303395)
Curator: @scibot
SciCrunch record: RRID:AB_303395
RRID:AB_631746
DOI: 10.1016/j.isci.2026.116781
Resource: (Santa Cruz Biotechnology Cat# sc-2004, RRID:AB_631746)
Curator: @scibot
SciCrunch record: RRID:AB_631746
RRID:AB_3717730
DOI: 10.1016/j.isci.2026.116781
Resource: RRID:AB_3717730
Curator: @scibot
SciCrunch record: RRID:AB_3717730
RRID:AB_262044
DOI: 10.1016/j.isci.2026.116781
Resource: (Sigma-Aldrich Cat# F1804, RRID:AB_262044)
Curator: @scibot
SciCrunch record: RRID:AB_262044
Addgene_65726
DOI: 10.1016/j.isci.2026.116781
Resource: RRID:Addgene_65726
Curator: @scibot
SciCrunch record: RRID:Addgene_65726
RRID:SCR_013672
DOI: 10.1016/j.isci.2026.116781
Resource: ZEISS ZEN Microscopy Software (RRID:SCR_013672)
Curator: @scibot
SciCrunch record: RRID:SCR_013672
RRID:SCR_002285
DOI: 10.1016/j.isci.2026.116781
Resource: Fiji (RRID:SCR_002285)
Curator: @scibot
SciCrunch record: RRID:SCR_002285
BDSC #52271
DOI: 10.1016/j.isci.2026.116099
Resource: RRID:BDSC_52271
Curator: @scibot
SciCrunch record: RRID:BDSC_52271
BDSC# 52267
DOI: 10.1016/j.isci.2026.116099
Resource: RRID:BDSC_52267
Curator: @scibot
SciCrunch record: RRID:BDSC_52267
BDSC #32209
DOI: 10.1016/j.isci.2026.116099
Resource: RRID:BDSC_32209
Curator: @scibot
SciCrunch record: RRID:BDSC_32209
BDSC #92985
DOI: 10.1016/j.isci.2026.116099
Resource: RRID:BDSC_92985
Curator: @scibot
SciCrunch record: RRID:BDSC_92985
BDSC #32198
DOI: 10.1016/j.isci.2026.116099
Resource: RRID:BDSC_32198
Curator: @scibot
SciCrunch record: RRID:BDSC_32198
BDSC #28838
DOI: 10.1016/j.isci.2026.116099
Resource: RRID:BDSC_28838
Curator: @scibot
SciCrunch record: RRID:BDSC_28838
BDSC # 77139
DOI: 10.1016/j.isci.2026.116099
Resource: RRID:BDSC_77139
Curator: @scibot
SciCrunch record: RRID:BDSC_77139
BDSC #7468
DOI: 10.1016/j.isci.2026.116099
Resource: RRID:BDSC_7468
Curator: @scibot
SciCrunch record: RRID:BDSC_7468
BDSC #605696
DOI: 10.1016/j.isci.2026.116099
Resource: RRID:BDSC_605696
Curator: @scibot
SciCrunch record: RRID:BDSC_605696
Bloomington51
DOI: 10.1016/j.isci.2026.116099
Resource: RRID:BDSC_51
Curator: @scibot
SciCrunch record: RRID:BDSC_51
RRID:AB_221604
DOI: 10.1016/j.isci.2026.116099
Resource: (Molecular Probes Cat# A-31553, RRID:AB_221604)
Curator: @scibot
SciCrunch record: RRID:AB_221604
RRID:AB_2338965
DOI: 10.1016/j.isci.2026.116099
Resource: (Jackson ImmunoResearch Labs Cat# 123-545-021, RRID:AB_2338965)
Curator: @scibot
SciCrunch record: RRID:AB_2338965
RRID:AB_2633276
DOI: 10.1016/j.isci.2026.116099
Resource: (Thermo Fisher Scientific Cat# A32727, RRID:AB_2633276)
Curator: @scibot
SciCrunch record: RRID:AB_2633276
RRID:AB_2617418
DOI: 10.1016/j.isci.2026.116099
Resource: (DSHB Cat# DSHB-GFP-12E6, RRID:AB_2617418)
Curator: @scibot
SciCrunch record: RRID:AB_2617418
RRID:AB_2576217
DOI: 10.1016/j.isci.2026.116099
Resource: (Thermo Fisher Scientific Cat# A-11034, RRID:AB_2576217)
Curator: @scibot
SciCrunch record: RRID:AB_2576217
RRID:AB_2753204
DOI: 10.1016/j.isci.2026.116099
Resource: (Novus Cat# NBP2-25157, RRID:AB_2753204)
Curator: @scibot
SciCrunch record: RRID:AB_2753204
RRID:AB_2534069
DOI: 10.1016/j.isci.2026.116099
Resource: (Thermo Fisher Scientific Cat# A-11001, RRID:AB_2534069)
Curator: @scibot
SciCrunch record: RRID:AB_2534069
RRID:AB_2535849
DOI: 10.1016/j.isci.2026.116099
Resource: (Thermo Fisher Scientific Cat# A-21428, RRID:AB_2535849)
Curator: @scibot
SciCrunch record: RRID:AB_2535849
RRID:AB_528203
DOI: 10.1016/j.isci.2026.116099
Resource: (DSHB Cat# 4F3 anti-discs large, RRID:AB_528203)
Curator: @scibot
SciCrunch record: RRID:AB_528203
RRID:AB_221569
DOI: 10.1016/j.isci.2026.116099
Resource: (Molecular Probes Cat# A-11122, RRID:AB_221569)
Curator: @scibot
SciCrunch record: RRID:AB_221569
RRID:SCR_005397
DOI: 10.1016/j.isci.2026.116070
Resource: RRID:SCR_005397
Curator: @scibot
SciCrunch record: RRID:SCR_005397
RRID:SCR_001905
DOI: 10.1016/j.isci.2026.116070
Resource: R Project for Statistical Computing (RRID:SCR_001905)
Curator: @scibot
SciCrunch record: RRID:SCR_001905
RRID:SCR_014212
DOI: 10.1016/j.isci.2026.116070
Resource: Origin (RRID:SCR_014212)
Curator: @scibot
SciCrunch record: RRID:SCR_014212
AB_330248
DOI: 10.1016/j.isci.2026.115716
Resource: (Cell Signaling Technology Cat# 3671, RRID:AB_330248)
Curator: @scibot
SciCrunch record: RRID:AB_330248
AB_2534079
DOI: 10.1016/j.isci.2026.115716
Resource: (Thermo Fisher Scientific Cat# A-11012, RRID:AB_2534079)
Curator: @scibot
SciCrunch record: RRID:AB_2534079
AB_2249358
DOI: 10.1016/j.isci.2026.115716
Resource: (Cell Signaling Technology Cat# 3629, RRID:AB_2249358)
Curator: @scibot
SciCrunch record: RRID:AB_2249358
AB_561053
DOI: 10.1016/j.isci.2026.115716
Resource: (Cell Signaling Technology Cat# 2118, RRID:AB_561053)
Curator: @scibot
SciCrunch record: RRID:AB_561053
AB_2798136
DOI: 10.1016/j.isci.2026.115716
Resource: (Cell Signaling Technology Cat# 13166, RRID:AB_2798136)
Curator: @scibot
SciCrunch record: RRID:AB_2798136
AB_2800199
DOI: 10.1016/j.isci.2026.115716
Resource: (Cell Signaling Technology Cat# 93065, RRID:AB_2800199)
Curator: @scibot
SciCrunch record: RRID:AB_2800199
AB_2534069
DOI: 10.1016/j.isci.2026.115716
Resource: (Thermo Fisher Scientific Cat# A-11001, RRID:AB_2534069)
Curator: @scibot
SciCrunch record: RRID:AB_2534069
AB_10839118
DOI: 10.1016/j.isci.2026.115716
Resource: (Cell Signaling Technology Cat# 2500, RRID:AB_10839118)
Curator: @scibot
SciCrunch record: RRID:AB_10839118
AB_10013641
DOI: 10.1016/j.isci.2026.115716
Resource: (Cell Signaling Technology Cat# 6943, RRID:AB_10013641)
Curator: @scibot
SciCrunch record: RRID:AB_10013641
AB_2174466
DOI: 10.1016/j.isci.2026.115716
Resource: (Cell Signaling Technology Cat# 2541, RRID:AB_2174466)
Curator: @scibot
SciCrunch record: RRID:AB_2174466
AB_2160882
DOI: 10.1016/j.isci.2026.115716
Resource: (Cell Signaling Technology Cat# 3528, RRID:AB_2160882)
Curator: @scibot
SciCrunch record: RRID:AB_2160882
AB_477629
DOI: 10.1016/j.isci.2026.115716
Resource: (Sigma-Aldrich Cat# V9131, RRID:AB_477629)
Curator: @scibot
SciCrunch record: RRID:AB_477629
AB_2291558
DOI: 10.1016/j.isci.2026.115716
Resource: RRID:AB_2291558
Curator: @scibot
SciCrunch record: RRID:AB_2291558
AB_2128060
DOI: 10.1016/j.isci.2026.115716
Resource: (BD Biosciences Cat# 610467, RRID:AB_2128060)
Curator: @scibot
SciCrunch record: RRID:AB_2128060
AB_10891442
DOI: 10.1016/j.isci.2026.115716
Resource: (Cell Signaling Technology Cat# 8556, RRID:AB_10891442)
Curator: @scibot
SciCrunch record: RRID:AB_10891442
RRID:AB_2307391
DOI: 10.1016/j.isci.2026.115716
Resource: (Jackson ImmunoResearch Labs Cat# 111-035-144, RRID:AB_2307391)
Curator: @scibot
SciCrunch record: RRID:AB_2307391
AB_10694415
DOI: 10.1016/j.isci.2026.115716
Resource: (Cell Signaling Technology Cat# 4848, RRID:AB_10694415)
Curator: @scibot
SciCrunch record: RRID:AB_10694415
RRID:AB_2338505
DOI: 10.1016/j.isci.2026.115716
Resource: (Jackson ImmunoResearch Labs Cat# 115-035-068, RRID:AB_2338505)
Curator: @scibot
SciCrunch record: RRID:AB_2338505
AB_3698765
DOI: 10.1016/j.isci.2026.115716
Resource: RRID:AB_3698765
Curator: @scibot
SciCrunch record: RRID:AB_3698765
AB_476749
DOI: 10.1016/j.isci.2026.115716
Resource: (Sigma-Aldrich Cat# A5979, RRID:AB_476749)
Curator: @scibot
SciCrunch record: RRID:AB_476749
RRID:AB_2860019
DOI: 10.1016/j.celrep.2026.117753
Resource: (Abcam Cat# ab176560, RRID:AB_2860019)
Curator: @scibot
SciCrunch record: RRID:AB_2860019
RRID:AB_302613
DOI: 10.1016/j.celrep.2026.117753
Resource: (Abcam Cat# ab1791, RRID:AB_302613)
Curator: @scibot
SciCrunch record: RRID:AB_302613
RRID:AB_262044
DOI: 10.1016/j.celrep.2026.117753
Resource: (Sigma-Aldrich Cat# F1804, RRID:AB_262044)
Curator: @scibot
SciCrunch record: RRID:AB_262044
RRID:AB_2732027
DOI: 10.1016/j.celrep.2026.117753
Resource: (Abcam Cat# ab183734, RRID:AB_2732027)
Curator: @scibot
SciCrunch record: RRID:AB_2732027
RRID:AB_2770403
DOI: 10.1016/j.celrep.2026.117753
Resource: (ABclonal Cat# AE001, RRID:AB_2770403)
Curator: @scibot
SciCrunch record: RRID:AB_2770403
RRID:AB_2801417
DOI: 10.1016/j.celrep.2026.117753
Resource: (Transgen Biotech Cat# HT501, RRID:AB_2801417)
Curator: @scibot
SciCrunch record: RRID:AB_2801417
RRID:AB_259529
DOI: 10.1016/j.celrep.2026.117733
Resource: (Sigma-Aldrich Cat# F3165, RRID:AB_259529)
Curator: @scibot
SciCrunch record: RRID:AB_259529
RRID:AB_3716476
DOI: 10.1016/j.celrep.2026.117724
Resource: RRID:AB_3716476
Curator: @scibot
SciCrunch record: RRID:AB_3716476
RRID:AB_2562694
DOI: 10.1016/j.celrep.2026.117724
Resource: (BioLegend Cat# 139309, RRID:AB_2562694)
Curator: @scibot
SciCrunch record: RRID:AB_2562694
RRID:AB_2565431
DOI: 10.1016/j.celrep.2026.117724
Resource: (BioLegend Cat# 101257, RRID:AB_2565431)
Curator: @scibot
SciCrunch record: RRID:AB_2565431
RRID:AB_2566318
DOI: 10.1016/j.celrep.2026.117724
Resource: (BioLegend Cat# 127647, RRID:AB_2566318)
Curator: @scibot
SciCrunch record: RRID:AB_2566318
RRID:AB_830642
DOI: 10.1016/j.celrep.2026.117724
Resource: (BioLegend Cat# 101226, RRID:AB_830642)
Curator: @scibot
SciCrunch record: RRID:AB_830642
RRID:AB_1134159
DOI: 10.1016/j.celrep.2026.117724
Resource: (BioLegend Cat# 127610, RRID:AB_1134159)
Curator: @scibot
SciCrunch record: RRID:AB_1134159
RRID:AB_2293450
DOI: 10.1016/j.celrep.2026.117724
Resource: (BioLegend Cat# 123130, RRID:AB_2293450)
Curator: @scibot
SciCrunch record: RRID:AB_2293450
RRID:AB_2565843
DOI: 10.1016/j.celrep.2026.117724
Resource: (BioLegend Cat# 100453, RRID:AB_2565843)
Curator: @scibot
SciCrunch record: RRID:AB_2565843
RRID:AB_394657
DOI: 10.1016/j.celrep.2026.117724
Resource: (BD Biosciences Cat# 553142, RRID:AB_394657)
Curator: @scibot
SciCrunch record: RRID:AB_394657
RRID:AB_2651134
DOI: 10.1016/j.celrep.2026.117724
Resource: (BD Biosciences Cat# 564279, RRID:AB_2651134)
Curator: @scibot
SciCrunch record: RRID:AB_2651134
RRID:AB_2099233
DOI: 10.1016/j.celrep.2026.117704
Resource: (Cell Signaling Technology Cat# 7074, RRID:AB_2099233)
Curator: @scibot
SciCrunch record: RRID:AB_2099233
RRID:AB_2883054
DOI: 10.1016/j.celrep.2026.117704
Resource: (Proteintech Cat# B900620, RRID:AB_2883054)
Curator: @scibot
SciCrunch record: RRID:AB_2883054
RRID:AB_2819035
DOI: 10.1016/j.celrep.2026.117704
Resource: (Proteintech Cat# 30000-0-AP, RRID:AB_2819035)
Curator: @scibot
SciCrunch record: RRID:AB_2819035
RRID:AB_3744246
DOI: 10.1016/j.celrep.2026.117704
Resource: RRID:AB_3744246
Curator: @scibot
SciCrunch record: RRID:AB_3744246
RRID:AB_330924
DOI: 10.1016/j.celrep.2026.117704
Resource: (Cell Signaling Technology Cat# 7076, RRID:AB_330924)
Curator: @scibot
SciCrunch record: RRID:AB_330924
RRID:AB_3076171
DOI: 10.1016/j.celrep.2026.117704
Resource: (Transgen Biotech Cat# HT301, RRID:AB_3076171)
Curator: @scibot
SciCrunch record: RRID:AB_3076171
RRID:AB_2160739
DOI: 10.1016/j.celrep.2026.117704
Resource: (Cell Signaling Technology Cat# 9542, RRID:AB_2160739)
Curator: @scibot
SciCrunch record: RRID:AB_2160739
RRID:AB_10699459
DOI: 10.1016/j.celrep.2026.117704
Resource: (Cell Signaling Technology Cat# 5625, RRID:AB_10699459)
Curator: @scibot
SciCrunch record: RRID:AB_10699459
RRID:AB_2881157
DOI: 10.1016/j.celrep.2026.117704
Resource: (Proteintech Cat# 28501-1-AP, RRID:AB_2881157)
Curator: @scibot
SciCrunch record: RRID:AB_2881157
RRID:AB_10733244
DOI: 10.1016/j.celrep.2026.117704
Resource: (Proteintech Cat# 19677-1-AP, RRID:AB_10733244)
Curator: @scibot
SciCrunch record: RRID:AB_10733244
RRID:AB_2091723
DOI: 10.1016/j.celrep.2026.117704
Resource: (Proteintech Cat# 14877-1-AP, RRID:AB_2091723)
Curator: @scibot
SciCrunch record: RRID:AB_2091723
RRID:AB_2070042
DOI: 10.1016/j.celrep.2026.117704
Resource: (Cell Signaling Technology Cat# 9664, RRID:AB_2070042)
Curator: @scibot
SciCrunch record: RRID:AB_2070042
RRID:AB_2878756
DOI: 10.1016/j.celrep.2026.117704
Resource: (Proteintech Cat# 20886-1-AP, RRID:AB_2878756)
Curator: @scibot
SciCrunch record: RRID:AB_2878756
RRID:AB_2629281
DOI: 10.1016/j.celrep.2026.117704
Resource: (Abcam Cat# ab110413, RRID:AB_2629281)
Curator: @scibot
SciCrunch record: RRID:AB_2629281
RRID:AB_1147620
DOI: 10.1016/j.celrep.2026.117704
Resource: (Cell Signaling Technology Cat# 2920, RRID:AB_1147620)
Curator: @scibot
SciCrunch record: RRID:AB_1147620
RRID:AB_2207530
DOI: 10.1016/j.celrep.2026.117704
Resource: (Proteintech Cat# 11802-1-AP, RRID:AB_2207530)
Curator: @scibot
SciCrunch record: RRID:AB_2207530
RRID:AB_2315049
DOI: 10.1016/j.celrep.2026.117704
Resource: (Cell Signaling Technology Cat# 4060, RRID:AB_2315049)
Curator: @scibot
SciCrunch record: RRID:AB_2315049
RRID:AB_2636979
DOI: 10.1016/j.celrep.2026.117704
Resource: (Cell Signaling Technology Cat# 13110, RRID:AB_2636979)
Curator: @scibot
SciCrunch record: RRID:AB_2636979
RRID:AB_10622186
DOI: 10.1016/j.celrep.2026.117704
Resource: (Cell Signaling Technology Cat# 5831, RRID:AB_10622186)
Curator: @scibot
SciCrunch record: RRID:AB_10622186
RRID:AB_2223172
DOI: 10.1016/j.celrep.2026.117704
Resource: (Cell Signaling Technology Cat# 4970, RRID:AB_2223172)
Curator: @scibot
SciCrunch record: RRID:AB_2223172
RRID:AB_331250
DOI: 10.1016/j.celrep.2026.117704
Resource: (Cell Signaling Technology Cat# 2535, RRID:AB_331250)
Curator: @scibot
SciCrunch record: RRID:AB_331250
RRID:AB_11232216
DOI: 10.1016/j.celrep.2026.117704
Resource: (Proteintech Cat# 20543-1-AP, RRID:AB_11232216)
Curator: @scibot
SciCrunch record: RRID:AB_11232216