NeverLess than once a week1-2 times a week3-5 times a week6-9 times a week10-19 times a week20 or more
Maybe redo this graph so that the color legend isn't so large and the questions don't take up so much space.
NeverLess than once a week1-2 times a week3-5 times a week6-9 times a week10-19 times a week20 or more
Maybe redo this graph so that the color legend isn't so large and the questions don't take up so much space.
Graphing Mrs. Wobbles.
Paste the black panel code here.
Mermaid lets you create diagrams and visualizations using text and code.It is a Javascript based diagramming and charting tool that renders Markdown-inspired text definitions to create and modify diagrams dynamically.
This code creates a simple web site that queries Wikipedia to get the edit history of a page and renders it as a "history flow" in SVG.
 </figure>
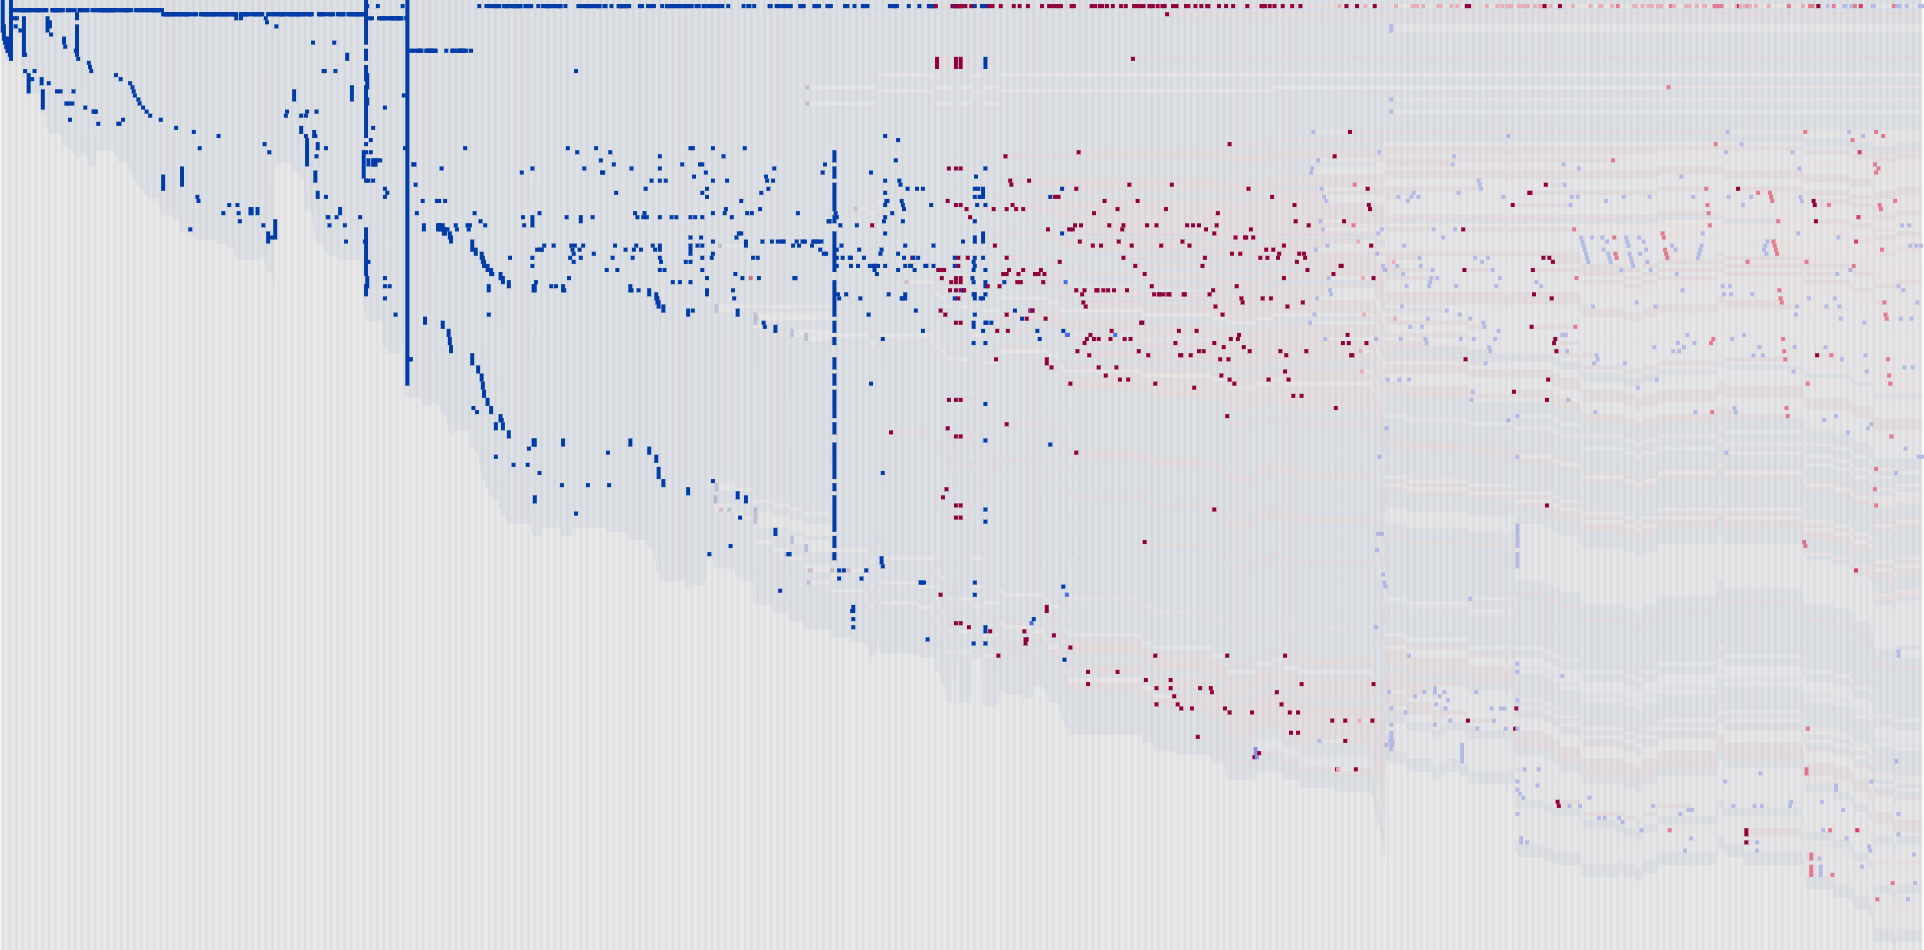
Visualize the evolution of a file tracked by git.
<figure>
 </figure/>
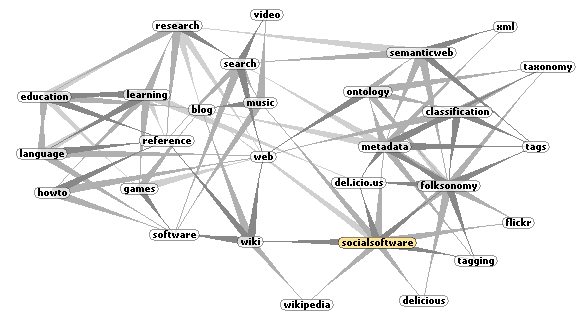
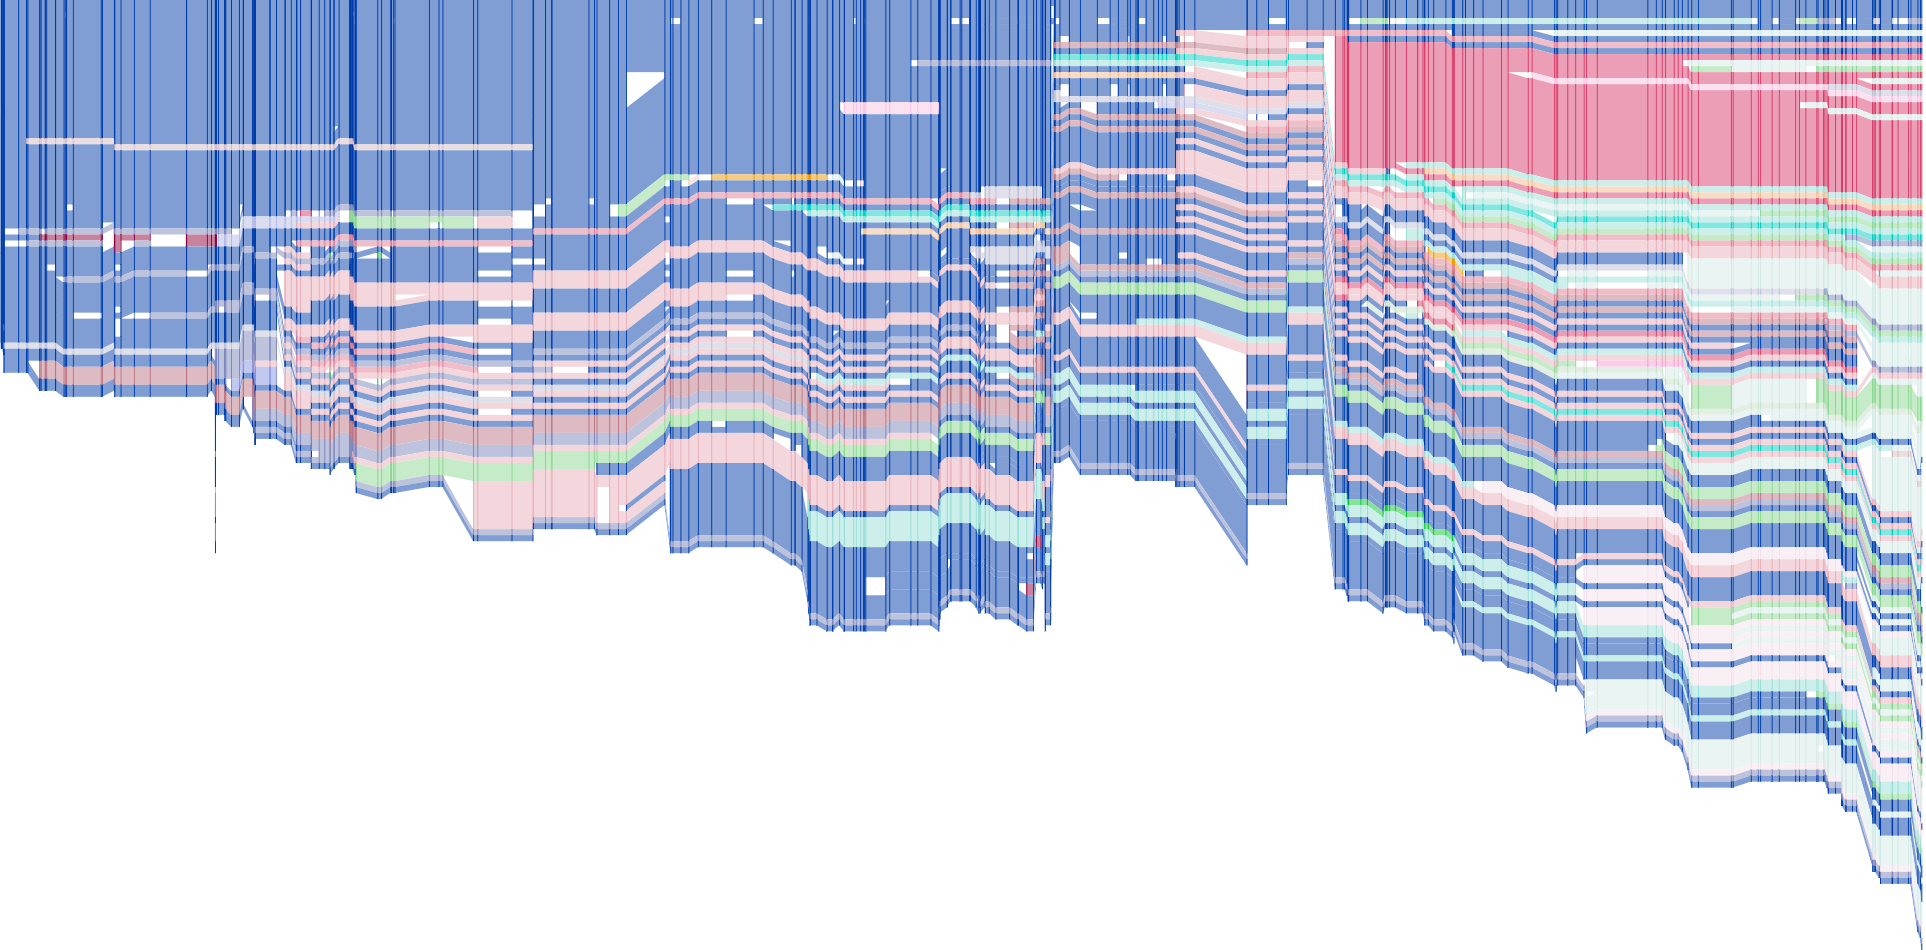
visualizing the editing history of Wikipedia pages

 <figcaption>history flow is a tool for visualizing dynamic, evolving documents and the interactions of multiple collaborating authors. In its current implementation, history flow is being used to visualize the evolutionary history of wiki* pages on Wikipedia. </figcaption>
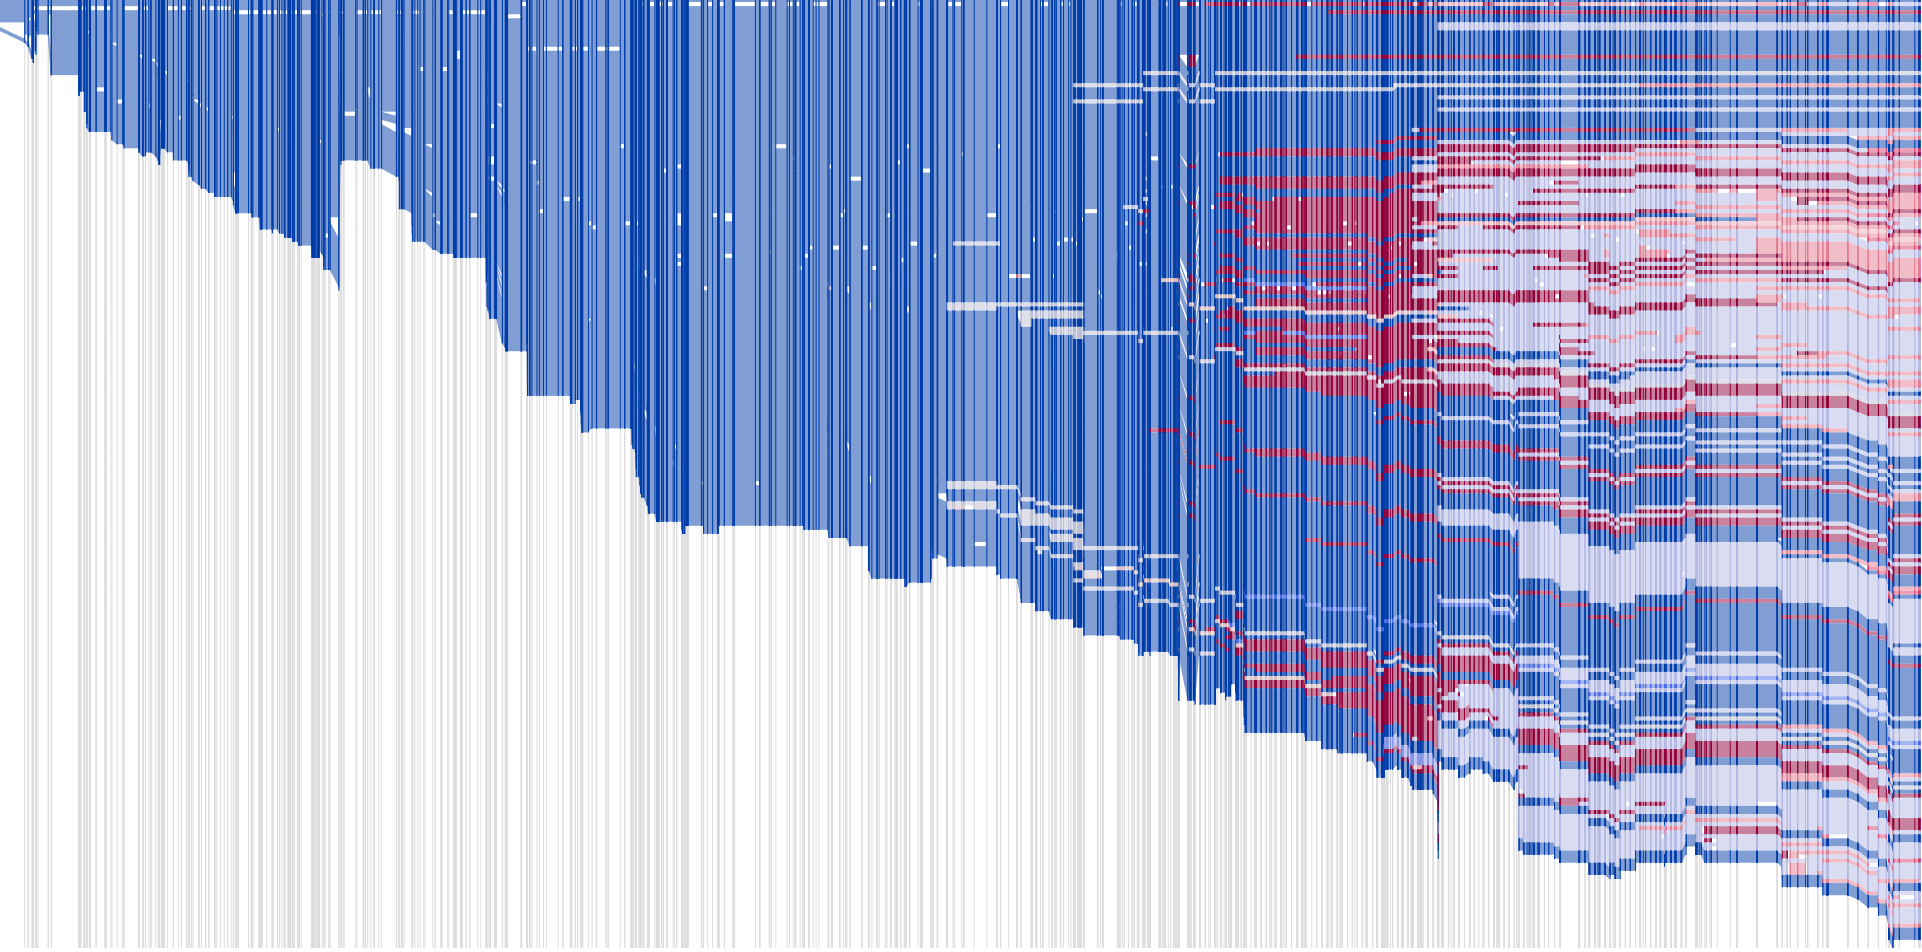
</figure>
<figcaption>history flow is a tool for visualizing dynamic, evolving documents and the interactions of multiple collaborating authors. In its current implementation, history flow is being used to visualize the evolutionary history of wiki* pages on Wikipedia. </figcaption>
</figure>

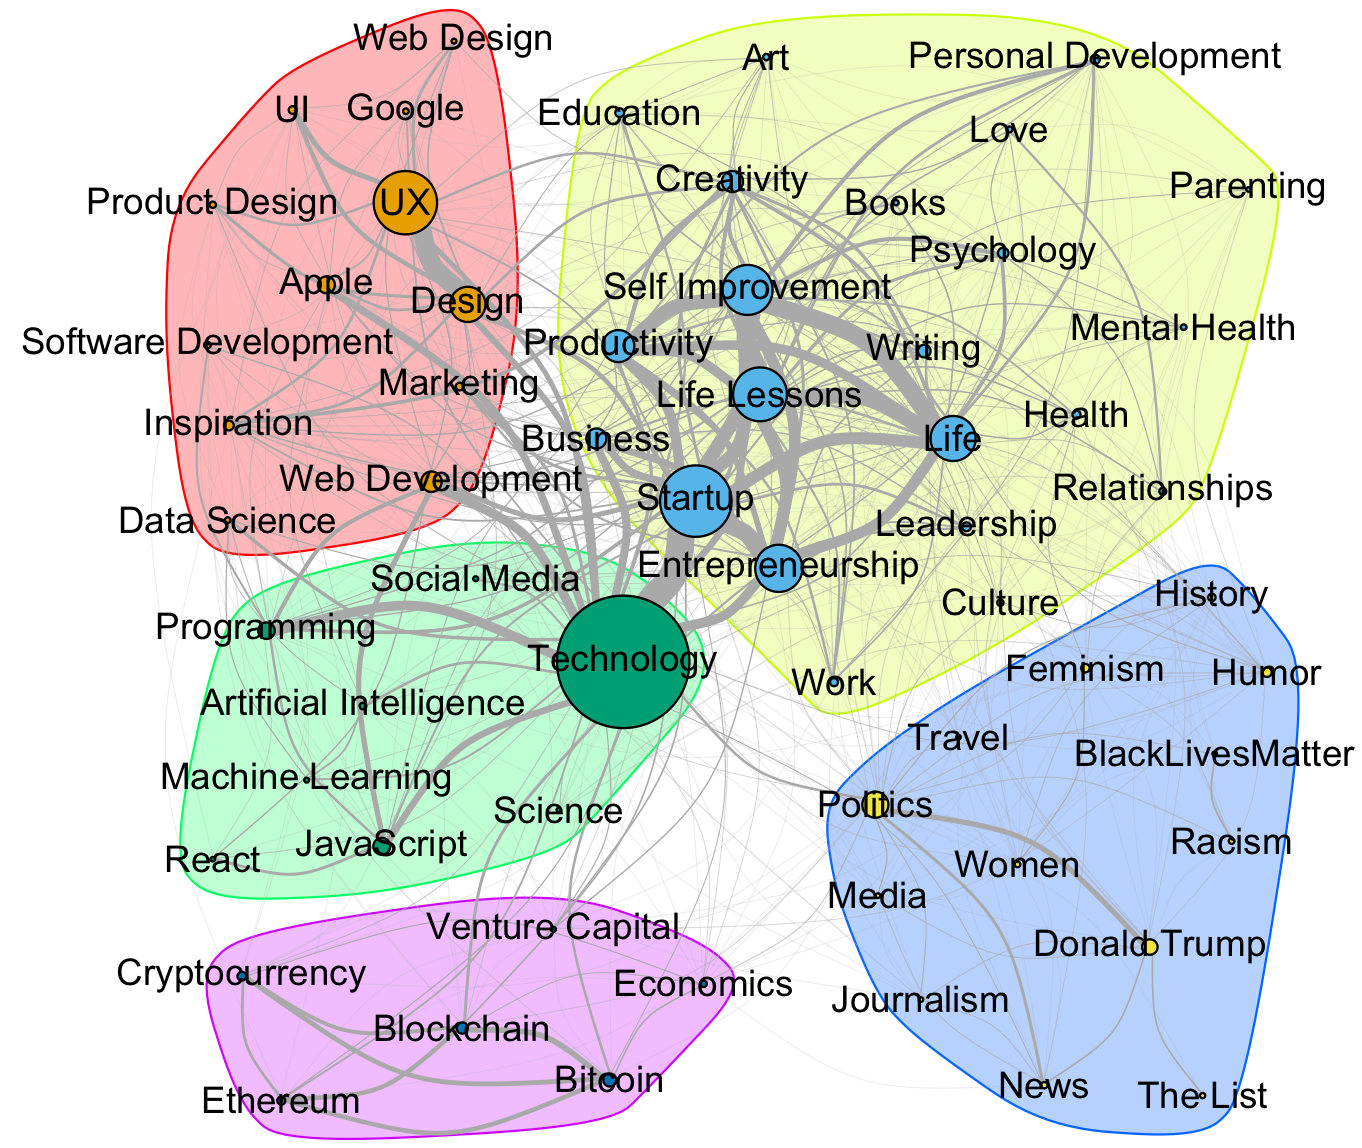
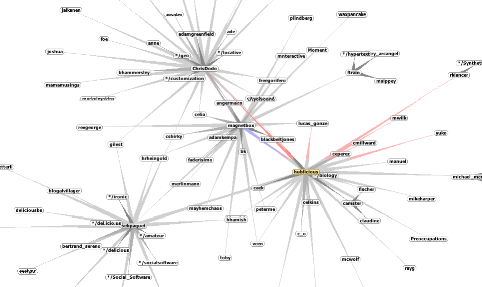
Expialidocio.us is a tool for visualizing your del.icio.us posting activity. It displays a graph of your posting activity over time. You can select a timespan from this graph, and it will show you a tag cloud weighted by just those dates. Expialidocio.us was inspired by a posting by Jon Udell. Coming full circle, Udell has posted since posted about this application. Since then, I’ve published the sources.
extispicious, a. [L. extispicium an inspection of the innards for divination; extra the entrails + specer to look at.] Relating to the inspection of entrails for prognostication.