37 Matching Annotations
  1. Feb 2023
    1. student outcomes, including learning, persistence, or attitudes.

      I would think that this would be one of the easiest things to measure and also would provide significant and useful data. We should check in with Brian (?) to see what data is currently being tracked.

  2. Jan 2023
    1. 3.1 Guest Lecture: Lauren Klein » Q&A on "What is Feminist Data Science?"<br /> https://www.complexityexplorer.org/courses/162-foundations-applications-of-humanities-analytics/segments/15631

      https://www.youtube.com/watch?v=c7HmG5b87B8

      Theories of Power

      Patricia Hill Collins' matrix of domination - no hierarchy, thus the matrix format

      What are other broad theories of power? are there schools?

      Relationship to Mary Parker Follett's work?

      Bright, Liam Kofi, Daniel Malinsky, and Morgan Thompson. “Causally Interpreting Intersectionality Theory.” Philosophy of Science 83, no. 1 (January 2016): 60–81. https://doi.org/10.1086/684173.

      about Bayesian modeling for intersectionality


      Where is Foucault in all this? Klein may have references, as I've not got the context.


      How do words index action? —Laura Klein


      The power to shape discourse and choose words - relationship to soft power - linguistic memes

      Color Conventions Project


      20:15 Word embeddings as a method within her research


      General result (outside of the proximal research) discussed: women are more likely to change language... references for this?


      [[academic research skills]]: It's important to be aware of the current discussions within one's field. (LK)


      36:36 quantitative imperialism is not the goal of humanities analytics, lived experiences are incredibly important as well. (DK)
  3. Mar 2021
  4. Jul 2020
  5. May 2020
  6. Feb 2020
    1. One important aspect of critical social media research is the study of not just ideolo-gies of the Internet but also ideologies on the Internet. Critical discourse analysis and ideology critique as research method have only been applied in a limited manner to social media data. Majid KhosraviNik (2013) argues in this context that ‘critical dis-course analysis appears to have shied away from new media research in the bulk of its research’ (p. 292). Critical social media discourse analysis is a critical digital method for the study of how ideologies are expressed on social media in light of society’s power structures and contradictions that form the texts’ contexts.
    2. t has, for example, been common to study contemporary revolutions and protests (such as the 2011 Arab Spring) by collecting large amounts of tweets and analysing them. Such analyses can, however, tell us nothing about the degree to which activists use social and other media in protest communication, what their motivations are to use or not use social media, what their experiences have been, what problems they encounter in such uses and so on. If we only analyse big data, then the one-sided conclusion that con-temporary rebellions are Facebook and Twitter revolutions is often the logical conse-quence (see Aouragh, 2016; Gerbaudo, 2012). Digital methods do not outdate but require traditional methods in order to avoid the pitfall of digital positivism. Traditional socio-logical methods, such as semi-structured interviews, participant observation, surveys, content and critical discourse analysis, focus groups, experiments, creative methods, par-ticipatory action research, statistical analysis of secondary data and so on, have not lost importance. We do not just have to understand what people do on the Internet but also why they do it, what the broader implications are, and how power structures frame and shape online activities
    3. Challenging big data analytics as the mainstream of digital media studies requires us to think about theoretical (ontological), methodological (epistemological) and ethical dimensions of an alternative paradigm

      Making the case for the need for digitally native research methodologies.

    4. Who communicates what to whom on social media with what effects? It forgets users’ subjectivity, experiences, norms, values and interpre-tations, as well as the embeddedness of the media into society’s power structures and social struggles. We need a paradigm shift from administrative digital positivist big data analytics towards critical social media research. Critical social media research combines critical social media theory, critical digital methods and critical-realist social media research ethics.
    5. de-emphasis of philosophy, theory, critique and qualitative analysis advances what Paul Lazarsfeld (2004 [1941]) termed administrative research, research that is predominantly concerned with how to make technologies and administration more efficient and effective.
    6. Big data analytics’ trouble is that it often does not connect statistical and computational research results to a broader analysis of human meanings, interpretations, experiences, atti-tudes, moral values, ethical dilemmas, uses, contradictions and macro-sociological implica-tions of social media.
    7. Such funding initiatives privilege quantitative, com-putational approaches over qualitative, interpretative ones.
  7. Sep 2019
    1. “But then again,” a person who used information in this way might say, “it’s not like I would be deliberately discriminating against anyone. It’s just an unfortunate proxy variable for lack of privilege and proximity to state violence.

      In the current universe, Twitter also makes a number of predictions about users that could be used as proxy variables for economic and cultural characteristics. It can display things like your audience's net worth as well as indicators commonly linked to political orientation. Triangulating some of this data could allow for other forms of intended or unintended discrimination.

      I've already been able to view a wide range (possibly spurious) information about my own reading audience through these analytics. On September 9th, 2019, I started a Twitter account for my 19th Century Open Pedagogy project and began serializing installments of critical edition, The Woman in White: Grangerized. The @OPP19c Twitter account has 62 followers as of September 17th.

      Having followers means I have access to an audience analytics toolbar. Some of the account's followers are nineteenth-century studies or pedagogy organizations rather than individuals. Twitter tracks each account as an individual, however, and I was surprised to see some of the demographics Twitter broke them down into. (If you're one of these followers: thank you and sorry. I find this data a bit uncomfortable.)

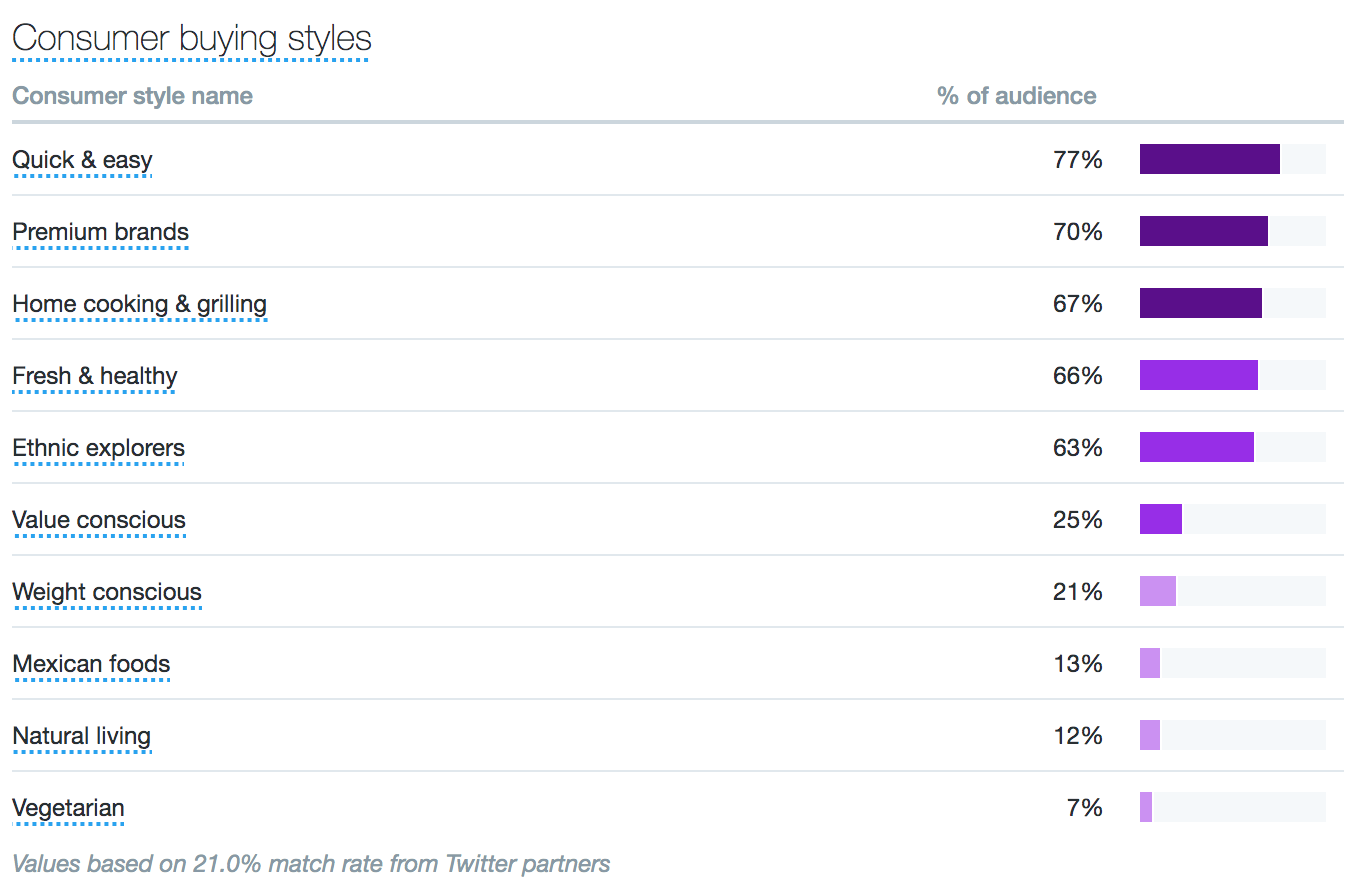
      Within this dashboard, I have a "Consumer Buying Styles" display that identifies categories such as "quick and easy" "ethnic explorers" "value conscious" and "weight conscious." These categories strike me as equal parts confusing and problematic: (Link to image expansion)

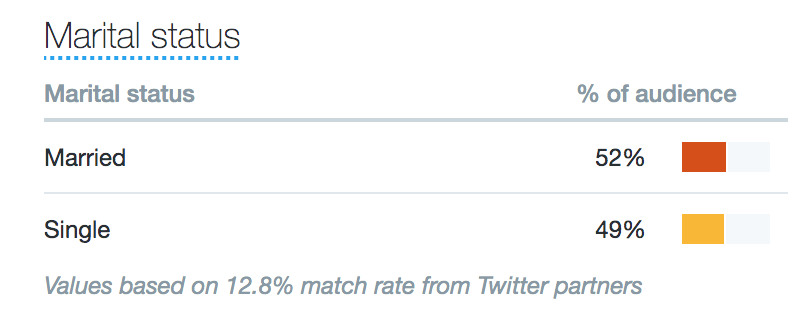
      I have a "Marital Status" toolbar alleging that 52% of my audience is married and 49% single.

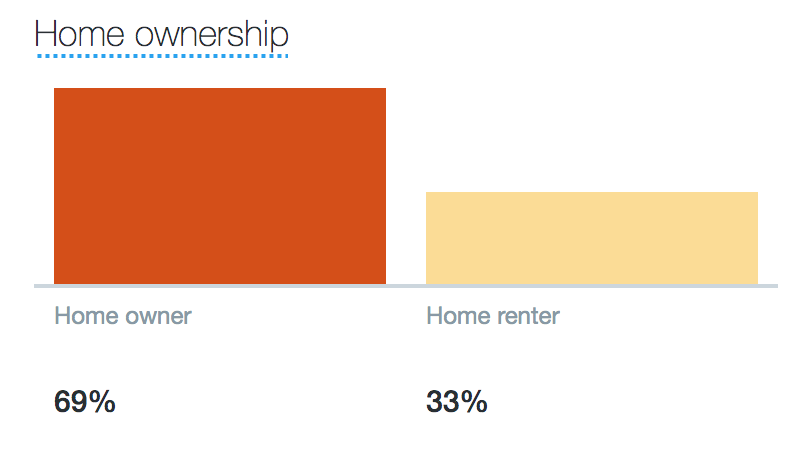
      I also have a "Home Ownership" chart. (I'm presuming that the Elizabeth Gaskell House Museum's Twitter is counted as an owner...)

      ....and more

  8. Nov 2017
    1. Mount St. Mary’s use of predictive analytics to encourage at-risk students to drop out to elevate the retention rate reveals how analytics can be abused without student knowledge and consent

      Wow. Not that we need such an extreme case to shed light on the perverse incentives at stake in Learning Analytics, but this surely made readers react. On the other hand, there’s a lot more to be said about retention policies. People often act as though they were essential to learning. Retention is important to the institution but are we treating drop-outs as escapees? One learner in my class (whose major is criminology) was describing the similarities between schools and prisons. It can be hard to dissipate this notion when leaving an institution is perceived as a big failure of that institution. (Plus, Learning Analytics can really feel like the Panopticon.) Some comments about drop-outs make it sound like they got no learning done. Meanwhile, some entrepreneurs are encouraging students to leave institutions or to not enroll in the first place. Going back to that important question by @sarahfr: why do people go to university?

  9. Oct 2017
  10. Aug 2017
    1. This has much in common with a customer relationship management system and facilitates the workflow around interventions as well as various visualisations.  It’s unclear how the at risk metric is calculated but a more sophisticated predictive analytics engine might help in this regard.

      Have yet to notice much discussion of the relationships between SIS (Student Information Systems), CRM (Customer Relationship Management), ERP (Enterprise Resource Planning), and LMS (Learning Management Systems).

  11. Nov 2016
  12. Oct 2016
    1. Devices connected to the cloud allow professors to gather data on their students and then determine which ones need the most individual attention and care.
    1. For G Suite users in primary/secondary (K-12) schools, Google does not use any user personal information (or any information associated with a Google Account) to target ads.

      In other words, Google does use everyone’s information (Data as New Oil) and can use such things to target ads in Higher Education.

  13. Sep 2016
    1. Data sharing over open-source platforms can create ambiguous rules about data ownership and publication authorship, or raise concerns about data misuse by others, thus discouraging liberal sharing of data.

      Surprising mention of “open-source platforms”, here. Doesn’t sound like these issues are absent from proprietary platforms. Maybe they mean non-institutional platforms (say, social media), where these issues are really pressing. But the wording is quite strange if that is the case.

    2. Activities such as time spent on task and discussion board interactions are at the forefront of research.

      Really? These aren’t uncontroversial, to say the least. For instance, discussion board interactions often call for careful, mixed-method work with an eye to preventing instructor effect and confirmation bias. “Time on task” is almost a codeword for distinctions between models of learning. Research in cognitive science gives very nuanced value to “time spent on task” while the Malcolm Gladwells of the world usurp some research results. A major insight behind Competency-Based Education is that it can allow for some variance in terms of “time on task”. So it’s kind of surprising that this summary puts those two things to the fore.

    3. Research: Student data are used to conduct empirical studies designed primarily to advance knowledge in the field, though with the potential to influence institutional practices and interventions. Application: Student data are used to inform changes in institutional practices, programs, or policies, in order to improve student learning and support. Representation: Student data are used to report on the educational experiences and achievements of students to internal and external audiences, in ways that are more extensive and nuanced than the traditional transcript.

      Ha! The Chronicle’s summary framed these categories somewhat differently. Interesting. To me, the “application” part is really about student retention. But maybe that’s a bit of a cynical reading, based on an over-emphasis in the Learning Analytics sphere towards teleological, linear, and insular models of learning. Then, the “representation” part sounds closer to UDL than to learner-driven microcredentials. Both approaches are really interesting and chances are that the report brings them together. Finally, the Chronicle made it sound as though the research implied here were less directed. The mention that it has “the potential to influence institutional practices and interventions” may be strategic, as applied research meant to influence “decision-makers” is more likely to sway them than the type of exploratory research we so badly need.

    1. often private companies whose technologies power the systems universities use for predictive analytics and adaptive courseware
    2. the use of data in scholarly research about student learning; the use of data in systems like the admissions process or predictive-analytics programs that colleges use to spot students who should be referred to an academic counselor; and the ways colleges should treat nontraditional transcript data, alternative credentials, and other forms of documentation about students’ activities, such as badges, that recognize them for nonacademic skills.

      Useful breakdown. Research, predictive models, and recognition are quite distinct from one another and the approaches to data that they imply are quite different. In a way, the “personalized learning” model at the core of the second topic is close to the Big Data attitude (collect all the things and sense will come through eventually) with corresponding ethical problems. Through projects vary greatly, research has a much more solid base in both ethics and epistemology than the kind of Big Data approach used by technocentric outlets. The part about recognition, though, opens the most interesting door. Microcredentials and badges are a part of a broader picture. The data shared in those cases need not be so comprehensive and learners have a lot of agency in the matter. In fact, when then-Ashoka Charles Tsai interviewed Mozilla executive director Mark Surman about badges, the message was quite clear: badges are a way to rethink education as a learner-driven “create your own path” adventure. The contrast between the three models reveals a lot. From the abstract world of research, to the top-down models of Minority Report-style predictive educating, all the way to a form of heutagogy. Lots to chew on.

  14. Jul 2016
    1. what do we do with that information?

      Interestingly enough, a lot of teachers either don’t know that such data might be available or perceive very little value in monitoring learners in such a way. But a lot of this can be negotiated with learners themselves.

    2. E-texts could record how much time is spent in textbook study. All such data could be accessed by the LMS or various other applications for use in analytics for faculty and students.”
    3. not as a way to monitor and regulate
    1. Data collection on students should be considered a joint venture, with all parties — students, parents, instructors, administrators — on the same page about how the information is being used.
  15. May 2016
    1. The entirely quantitative methods and variables employed by Academic Analytics -- a corporation intruding upon academic freedom, peer evaluation and shared governance -- hardly capture the range and quality of scholarly inquiry, while utterly ignoring the teaching, service and civic engagement that faculty perform,
  16. Apr 2016
  17. Mar 2016
  18. Dec 2015