186 Matching Annotations
  1. Jul 2025
    1. Navigating Failures in Pods With Devices

      Summary: Navigating Failures in Pods With Devices

      This article examines the unique challenges Kubernetes faces in managing specialized hardware (e.g., GPUs, accelerators) within AI/ML workloads, and explores current pain points, DIY solutions, and the future roadmap for more robust device failure handling.

      Why AI/ML Workloads Are Different

      • Heavy Dependence on Specialized Hardware: AI/ML jobs require devices like GPUs, with hardware failures causing significant disruptions.
      • Complex Scheduling: Tasks may consume entire machines or need coordinated scheduling across nodes due to device interconnects.
      • High Running Costs: Specialized nodes are expensive; idle time is wasteful.
      • Non-Traditional Failure Models: Standard Kubernetes assumptions (like treating nodes as fungible, or pods as easily replaceable) don’t apply well; failures can trigger large-scale restarts or job aborts.

      Major Failure Modes in Kubernetes With Devices

      1. Kubernetes Infrastructure Failures

        • Multiple actors (device plugin, kubelet, scheduler) must work together; failures can occur at any stage.
        • Issues include pods failing admission, poor scheduling, or pods unable to run despite healthy hardware.
        • Best Practices: Early restarts, close monitoring, canary deployments, use of verified device plugins and drivers.
      2. Device Failures

        • Kubernetes has limited built-in ability to handle device failures—unhealthy devices simply reduce the allocatable count.
        • Lacks correlation between device failure and pod/container failure.
        • DIY Solutions:
          • Node Health Controllers: Restart nodes if device capacity drops, but these can be slow and blunt.
          • Pod Failure Policies: Pods exit with special codes for device errors, but support is limited and mostly for batch jobs.
          • Custom Pod Watchers: Scripts or controllers watch pod/device status, forcibly delete pods attached to failed devices, prompting rescheduling.
      3. Container Code Failures

        • Kubernetes can only restart containers or reschedule pods, with limited expressiveness about what counts as failure.
        • For large AI/ML jobs: Orchestration wrappers restart failed main executables, aiming to avoid expensive full job restart cycles.
      4. Device Degradation

        • Not all device issues result in outright failure; degraded performance now occurs more frequently (e.g., one slow GPU dragging down training).
        • Detection and remediation are largely DIY; Kubernetes does not yet natively express "degraded" status.

      Current Workarounds & Limitations

      • Most device-failure strategies are manual or require high privileges.
      • Workarounds are often fragile, costly, or disruptive.
      • Kubernetes lacks standardized abstractions for device health and device importance at pod or cluster level.

      Roadmap: What’s Next for Kubernetes

      SIG Node and Kubernetes community are focusing on:

      • Improving core reliability: Ensuring kubelet, device manager, and plugins handle failures gracefully.
      • Making Failure Signals Visible: Initiatives like KEP 4680 aim to expose device health at pod status level.
      • Integration With Pod Failure Policies: Plans to recognize device failures as first-class events for triggering recovery.
      • Pod Descheduling: Enabling pods to be rescheduled off failed/unhealthy devices, even with restartPolicy: Always.
      • Better Handling for Large-Scale AI/ML Workloads: More granular recovery, fast in-place restarts, state snapshotting.
      • Device Degradation Signals: Early discussions on tracking performance degradation, but no mature standard yet.

      Key Takeaway

      Kubernetes remains the platform of choice for AI/ML, but device- and hardware-aware failure handling is still evolving. Most robust solutions are still "DIY," but community and upstream investment is underway to standardize and automate recovery and resilience for workloads depending on specialized hardware.

  2. Mar 2025
    1. Reduce container startup time on Amazon EKS with Bottlerocket data volume
      • Introduction

        • Containers are widely used for scalable applications but face challenges with startup times for large images (e.g., AI/ML workloads).
        • Pulling large images from Amazon Elastic Container Registry (ECR) can take several minutes, impacting performance.
        • Bottlerocket, an AWS open-source Linux OS optimized for containers, offers a solution to reduce container startup time.
      • Solution Overview

        • Bottlerocket's data volume feature allows prefetching container images locally, eliminating the need for downloading during startup.
        • Prefetching is achieved by creating an Amazon Elastic Block Store (EBS) snapshot of Bottlerocket's data volume and mapping it to new Amazon EKS nodes.
        • Steps to implement:
        • Spin up an Amazon EC2 instance with Bottlerocket AMI.
        • Pull application images from the repository.
        • Create an EBS snapshot of the data volume.
        • Map the snapshot to Amazon EKS node groups.
      • Benefits of Bottlerocket

        • It separates OS and container data volumes, ensuring consistency and security during updates.
        • Prefetched images significantly reduce startup times for large containers.
      • Implementation Walkthrough

        • Step 1: Build EBS Snapshot
          • Automate snapshot creation using a script.
          • Prefetch images like Jupyter-PyTorch and Kubernetes pause containers.
          • Export the snapshot ID for use in node group configuration.
        • Step 2: Setup Amazon EKS Cluster
          • Create two node groups:
          • no-prefetch-mng: Without prefetched images.
          • prefetch-mng: With prefetched images mapped via EBS snapshot.
        • Step 3: Deploy Pods
          • Test deployment on both node groups.
          • Prefetched nodes start pods in just 3 seconds, compared to 49 seconds without prefetching.
      • Results

        • Prefetching reduced container startup time from 49 seconds to 3 seconds, improving efficiency and user experience.
      • Further Enhancements

        • Use Karpenter for automated scaling with Bottlerocket nodes.
        • Automate snapshot creation in CI pipelines using GitHub Actions.
      • Cleaning Up

        • Delete AWS resources (EKS cluster, Cloud9 environment, EBS snapshots) to avoid charges after testing.
      • Conclusion

        • Bottlerocket's data volume prefetching dramatically enhances container startup performance for large workloads on Amazon EKS.
  3. Feb 2025
    1. The hater’s guide to Kubernetes
      • Why use Kubernetes

        • Best for running multiple processes/servers/jobs with redundancy and load balancing
        • Enables infrastructure-as-code configuration for service relationships
        • Outsourced infrastructure management via cloud providers (e.g., Google Kubernetes Engine)
      • What they use

        • Core resources: Deployments (with rolling updates), Services (ClusterIP/LoadBalancer), CronJobs
        • Configuration: ConfigMaps and Secrets via Pulumi (TypeScript) instead of raw YAML
        • Cautious adoptions: StatefulSets for limited persistence, RBAC only when necessary
      • What they avoid

        • Hand-written YAML and Helm charts ("fragility for no gain")
        • Operators, custom resources, service meshes, and most third-party controllers
        • Local k8s stack replication (prefer Docker Compose for local dev)
      • Key insights

        • "A human should never wait for a pod" - unsuitable for interactive workloads requiring fast startup
        • Use managed databases/storage for critical data instead of k8s volumes
        • Alternatives like Railway/Render may be better for simpler SaaS apps
        • Recently adopted Ingress controllers for Cloud Armor integration despite initial reservations
  4. Jan 2025
    1. How we migrated onto K8s in less than 12 months
      • Figma's Initial Infrastructure Challenges:

        • Figma's monolithic architecture struggled with resource allocation inefficiencies and limited scalability.
        • High traffic spikes from collaborative design workflows required more robust solutions for resource autoscaling and failover.
      • Why Kubernetes Was Chosen:

        • Kubernetes' container orchestration capabilities promised better resource management and service isolation.
        • Features like Horizontal Pod Autoscaling (HPA), robust networking via Kubernetes Services, and support for StatefulSets made it an ideal fit for Figma’s needs.
        • The platform also wanted better alignment with cloud-native practices and modern CI/CD workflows.
      • Incremental Migration Approach:

        • Step 1: Non-Critical Services: Figma migrated stateless services first, allowing experimentation without risking core functionality.
        • Step 2: Custom Tooling: Internal tooling was built to manage Kubernetes manifests and automate Helm chart creation for standardization.
        • Step 3: Stateful Services: For databases and other stateful components, Figma relied on Kubernetes' StatefulSets and persistent volumes (PVs) to ensure data integrity during the migration.
        • Step 4: Observability Enhancements: Kubernetes-native tools like Prometheus and Grafana were integrated to provide detailed metrics and system insights.
      • Key Technical Adjustments During Migration:

        • Service Discovery: Transitioned to Kubernetes-native DNS for internal service communication, replacing legacy methods.
        • Load Balancing: Leveraged Kubernetes Ingress and external load balancers (e.g., NGINX or cloud-native solutions) for traffic routing.
        • Networking Complexity: Resolved challenges around multi-cluster networking using Kubernetes CNI plugins like Calico.
        • Resource Management: Used Resource Quotas and Limits to prevent pod overcommitment and optimize cluster utilization.
      • Challenges Faced:

        • Stateful Services: Ensuring zero-downtime migration for databases required careful orchestration of PersistentVolumeClaims (PVCs) and StatefulSets.
        • Networking: Handling cross-region traffic and external dependencies required tweaking Kubernetes Ingress configurations.
        • Resource Constraints: Balancing costs and performance involved tuning cluster-autoscaler configurations and evaluating node pool setups.
      • Benefits Realized Post-Migration:

        • Scalability: Kubernetes' HPA allowed Figma to scale pods dynamically based on traffic patterns, ensuring consistent performance.
        • Deployment Efficiency: CI/CD pipelines integrated seamlessly with Kubernetes, enabling faster and more reliable rollouts using tools like Argo CD.
        • Reliability: Self-healing capabilities, such as pod restarts and node failover, reduced downtime during failures.
        • Observability: Improved system monitoring with Kubernetes' native metrics server and integrations with Prometheus and Grafana.
      • Future Enhancements Planned:

        • Service Mesh Integration: Adoption of Istio or Linkerd to enhance observability, security (e.g., mutual TLS), and traffic management.
        • Cost Optimization: Further tuning autoscaling policies and resource limits to minimize waste.
        • Edge Improvements: Deploying Kubernetes clusters closer to end-users for reduced latency, potentially using Kubernetes' Cluster Federation.
    1. How Tesla is using Kubernetes and Kafka to handle trillions of events per day
      • Overview of Tesla's Data Infrastructure Challenges:

        • Modern Tesla vehicles generate an enormous volume of telemetry data related to sensor readings, driver behavior, energy consumption, and more.
        • The primary challenge is ingesting, processing, and analyzing this data at scale while maintaining real-time capabilities.
      • Kubernetes for Orchestration:

        • Tesla uses Kubernetes to manage containerized microservices across a distributed cloud environment.
        • Kubernetes ensures dynamic scaling to handle fluctuating workloads, providing high availability for critical services.
        • Each microservice is encapsulated in its own container, improving isolation and deployability.
      • Kafka for Real-Time Event Streaming:

        • Apache Kafka is the backbone of Tesla’s data pipeline, managing trillions of events daily from globally distributed vehicles.
        • Kafka topics are structured to partition and replicate data efficiently, ensuring fault tolerance and high throughput.
        • Producers (vehicles) send data to Kafka brokers, while consumers (analytics systems, data lakes) process these streams in real-time.
      • Data Processing Pipelines:

        • Data from Kafka is ingested into processing systems for real-time analytics, anomaly detection, and predictive maintenance.
        • Stream processing frameworks (e.g., Apache Flink or Kafka Streams) analyze data for immediate feedback.
        • Batch systems handle aggregation and storage in Tesla’s data lake for long-term insights.
      • Key Technical Advantages:

        • Scalability: Kubernetes dynamically allocates resources based on the volume of incoming data and computational requirements.
        • Resilience: Kafka’s replication factor ensures that no single broker failure impacts the system.
        • Low Latency: Data streams from Kafka enable Tesla to act on insights in milliseconds, critical for safety and performance monitoring.
      • Simplified Management:

        • The platform supports multi-cluster Kubernetes configurations for geographic data segregation.
        • A central control plane monitors system health, manages deployments, and ensures compliance with data regulations.
      • Future Goals and Improvements:

        • Enhancing AI-driven analytics to derive deeper insights from vehicle data.
        • Further optimizing Kafka’s cluster topology to improve fault tolerance and reduce operational costs.
        • Expanding edge processing capabilities in vehicles to pre-filter data, reducing bandwidth requirements to the cloud.
    1. Reddit No Longer Haunted by Drifting Kubernetes Configurations
      • Kubernetes Configuration Drift Issue:

        • Reddit experienced a significant outage on March 13, 2022, during a Kubernetes upgrade from version 1.23 to 1.24.
        • The outage was caused by configuration drift, where unintended changes accumulated over time, leading to inconsistencies across clusters.
      • New Platform Abstraction with Declarative APIs:

        • Reddit adopted a declarative approach, leveraging Kubernetes controllers to manage configurations and enforce consistency.
        • The implementation of these controllers enabled Reddit to abstract platform complexities and ensure a uniform deployment environment.
      • Centralized Control Plane for Multi-Cluster Management:

        • The team built a centralized control plane to manage multiple Kubernetes clusters effectively.
        • Cluster provisioning time was drastically reduced from over 30 hours to approximately 2 hours.
        • Centralization facilitated standardized configurations and reduced operational overhead.
      • Development of Achilles SDK:

        • Achilles, an SDK developed in-house by Reddit, simplified the creation of Kubernetes controllers.
        • It allowed infrastructure engineers to automate and manage resources programmatically without deep Kubernetes expertise.
        • The SDK supported a more proactive approach to problem-solving, preventing drift by design.
      • Benefits and Lessons Learned:

        • The new system ensured robust monitoring, minimized manual intervention, and improved scalability.
        • Configuration drift was effectively mitigated, providing a more stable and predictable infrastructure.
        • The experience highlighted the importance of using Kubernetes-native solutions and declarative configurations for managing large-scale deployments.
      • Future Goals:

        • Further refinement of the platform to address edge cases and improve developer experience.
        • Continued investment in tools and processes to maintain infrastructure consistency at scale.
    1. Really good PMs and engineers will actually start to converge. With LLMs, coding won't be enough to differentiate as an engineer, you'll need to think about the product, business KPIs, strategy etc. You need to think about solutions to problems, not software tools. And PMs are going to be expected to get more technical.

      MLOps prediction for 2025

    2. We’ll also see a big surge in the use of buzzword-heavy AI concepts like Retrieval-Augmented Generation (RAG) systems, generative AI, and cloud-based AI products, all of which will become easier to use and, hopefully, cheaper, thereby driving further broad adoption.

      RAG will shine even more in 2025

  5. Nov 2024
    1. Data scientists, MLOps engineers, or AI developers, can mount large language model weights or machine learning model weights in a pod alongside a model-server, so that they can efficiently serve them without including them in the model-server container image. They can package these in an OCI object to take advantage of OCI distribution and ensure efficient model deployment. This allows them to separate the model specifications/content from the executables that process them.

      The introduction of the Image Volume Source feature in Kubernetes 1.31 allows MLOps practitioners to mount OCI-compatible artifacts, such as large language model weights or machine learning models, directly into pods without embedding them in container images. This streamlines model deployment, enhances efficiency, and leverages OCI distribution mechanisms for effective model management.

    1. Deploying Machine Learning Models with Flask and AWS Lambda: A Complete Guide

      In essence, this article is about:

      1) Training a sample model and uploading it to an S3 bucket:

      ```python from sklearn.datasets import load_iris from sklearn.model_selection import train_test_split from sklearn.linear_model import LogisticRegression import joblib

      Load the Iris dataset

      iris = load_iris() X, y = iris.data, iris.target

      Split the data into training and testing sets

      X_train, X_test, y_train, y_test = train_test_split(X, y, test_size=0.2, random_state=42)

      Train the logistic regression model

      model = LogisticRegression(max_iter=200) model.fit(X_train, y_train)

      Save the trained model to a file

      joblib.dump(model, 'model.pkl') ```

      1. Creating a sample Zappa config, because AWS Lambda doesn’t natively support Flask, we need to use Zappa, a tool that helps deploy WSGI applications (like Flask) to AWS Lambda:

      ```json { "dev": { "app_function": "app.app", "exclude": [ "boto3", "dateutil", "botocore", "s3transfer", "concurrent" ], "profile_name": null, "project_name": "flask-test-app", "runtime": "python3.10", "s3_bucket": "zappa-31096o41b" },

      "production": {
          "app_function": "app.app",
          "exclude": [
              "boto3",
              "dateutil",
              "botocore",
              "s3transfer",
              "concurrent"
          ],
          "profile_name": null,
          "project_name": "flask-test-app",
          "runtime": "python3.10",
          "s3_bucket": "zappa-31096o41b"
      }
      

      } ```

      1. Writing a sample Flask app:

      ```python import boto3 import joblib import os

      Initialize the Flask app

      app = Flask(name)

      S3 client to download the model

      s3 = boto3.client('s3')

      Download the model from S3 when the app starts

      s3.download_file('your-s3-bucket-name', 'model.pkl', '/tmp/model.pkl') model = joblib.load('/tmp/model.pkl')

      @app.route('/predict', methods=['POST']) def predict(): # Get the data from the POST request data = request.get_json(force=True)

      # Convert the data into a numpy array
      input_data = np.array(data['input']).reshape(1, -1)
      
      # Make a prediction using the model
      prediction = model.predict(input_data)
      
      # Return the prediction as a JSON response
      return jsonify({'prediction': int(prediction[0])})
      

      if name == 'main': app.run(debug=True) ```

      1. Deploying this app to production (to AWS):

      bash zappa deploy production

      and later eventually updating it:

      bash zappa update production

      1. We should get a URL like this:

      https://xyz123.execute-api.us-east-1.amazonaws.com/production

      which we can query:

      curl -X POST -H "Content-Type: application/json" -d '{"input": [5.1, 3.5, 1.4, 0.2]}' https://xyz123.execute-api.us-east-1.amazonaws.com/production/predict

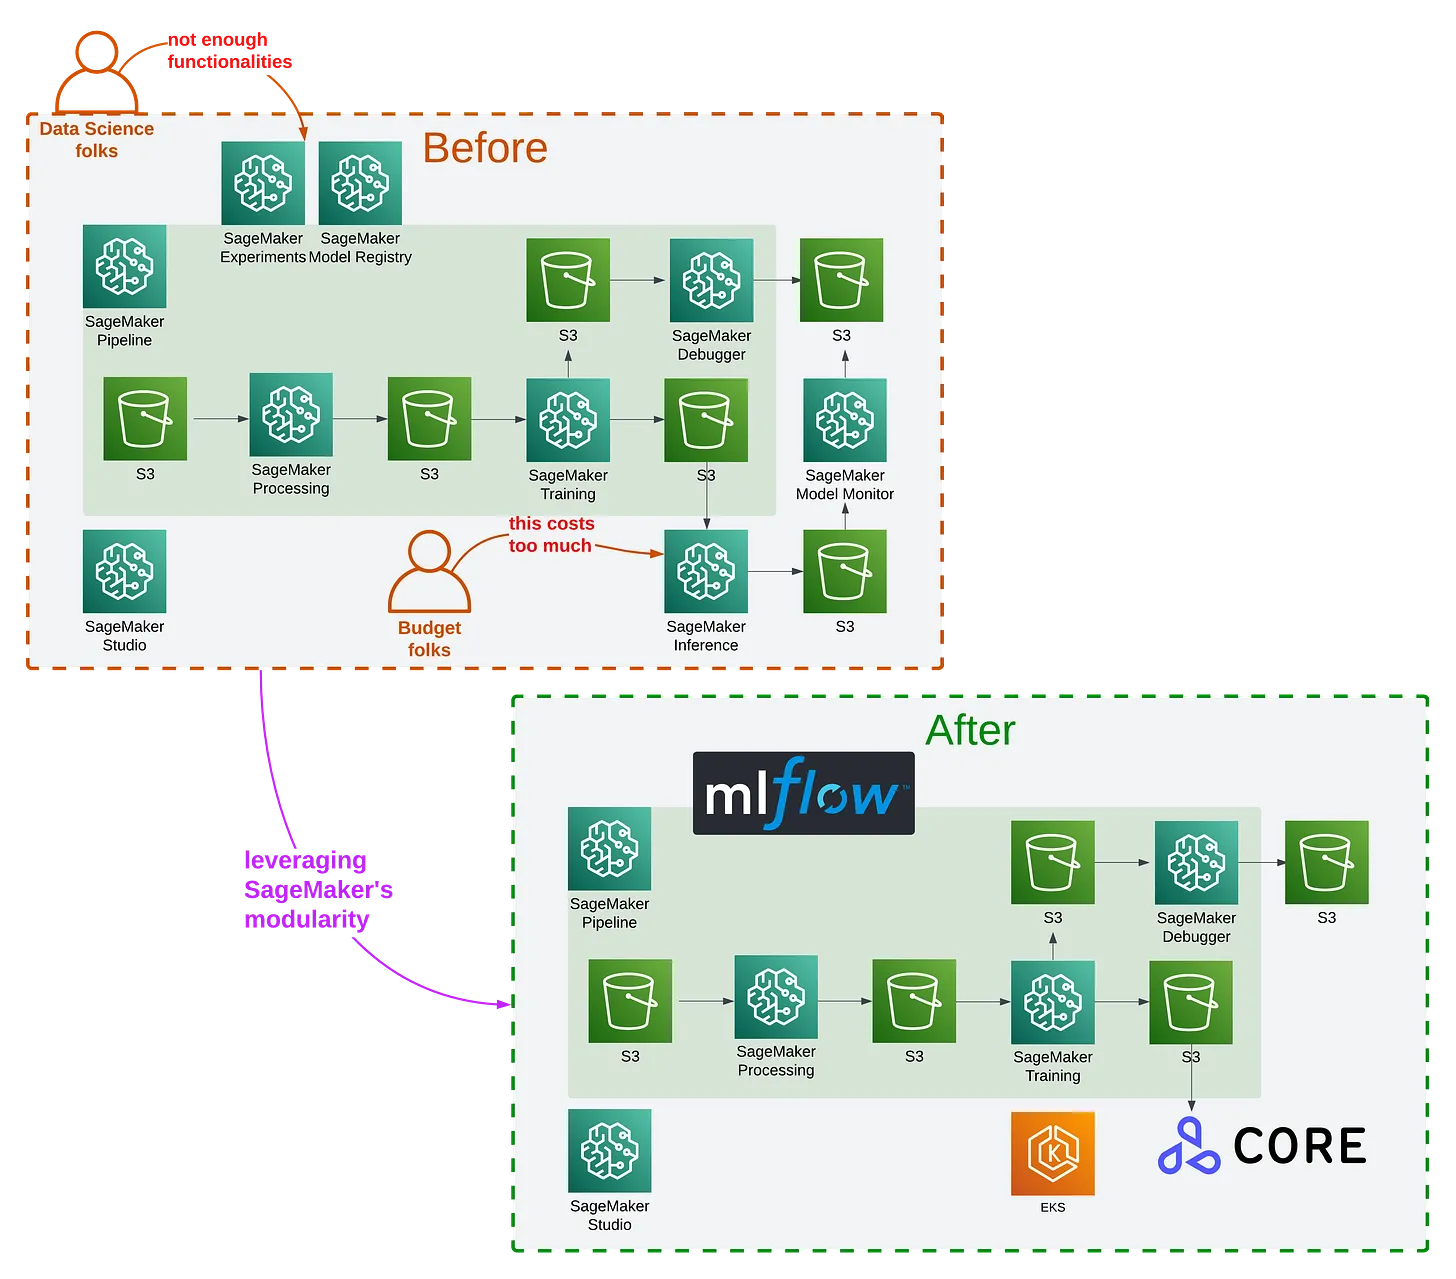
    1. Optimizing Kubernetes Costs with Multi-Tenancy and Virtual Clusters

      The blog post by Cliff Malmborg from Loft Labs discusses optimizing Kubernetes costs using multi-tenancy and virtual clusters. With Kubernetes expenses rising rapidly at scale, traditional cost-saving methods like autoscaling, resource quotas, and monitoring tools help but are not enough for complex environments where underutilized clusters are common. Multi-tenancy enables resource sharing, reducing the number of clusters and, in turn, management and operational costs.

      A virtual cluster is a fully functional Kubernetes cluster running within a larger host cluster, providing better isolation and flexibility than namespaces. Unlike namespaces, each virtual cluster has its own Kubernetes control plane, so resources like statefulsets and webhooks are isolated within it, while only core resources (like pods and services) are shared with the host cluster. This setup addresses the "noisy neighbor" problem, where workloads in a shared environment interfere with each other due to resource contention.

      Virtual clusters offer the isolation benefits of individual physical clusters but are cheaper and easier to manage than deploying separate physical clusters for each tenant or application. They also support "sleep mode," automatically scaling down unused resources to save costs, and allow shared use of central tools (like ingress controllers) installed in the host cluster. By transitioning to virtual clusters, companies can balance security, isolation, and cost-effectiveness, reducing the need for multiple physical clusters and making Kubernetes infrastructure scalable for modern, resource-demanding applications.

  6. Feb 2024
  7. Mar 2023
    1. Ultimately, after researching how we can overcome some inconveniences in Kubeflow, we decided to continue using it. Even though the UI could use some improvements in terms of clarity, we didn’t want to give up the advantages of configured CI/CD and containerization, which allowed us to use different environments. Also, for our projects, it is convenient to develop each ML pipeline in separate Git repositories.

      Kubeflow sounds like the most feature rich solution, whose main con is its UI and the setup process

    2. The airflow environment must have all the libraries that are being imported in all DAGs. Without using containerization all Airflow pipelines are launched within the same environment. This leads to limitations in using exotic libraries or conflicting module versions for different projects.

      Main con of Airflow

    3. Prefect is a comparatively new but promising orchestration tool that appeared in 2018. The tool positions itself as a replacement for Airflow, featuring greater flexibility and simplicity. It is an open-source project; however, there is a paid cloud version to track workflows.

      Prefect

    4. An orchestration tool usually doesn’t do the hard work of translating and processing data itself, but tells other systems and frameworks what to do and monitors the status of the execution.

      Responsibility of the orchestration tool

    1. ServingRuntime - Templates for Pods that can serve one or more particular model formats. There are three "built in" runtimes that cover the out-of-the-box model types, custom runtimes can be defined by creating additional ones.

      ServingRuntime

    1. Each model’s resource overhead is 1CPU and 1 GB memory. Deploying many models using the current approach will quickly use up a cluster's computing resource. With Multi-model serving, these models can be loaded in one InferenceService, then each model's average overhead is 0.1 CPU and 0.1GB memory.

      If I am not mistaken, the multi-model approach reduces the size by 90% in this case

    2. While you get the benefit of better inference accuracy and data privacy by building models for each use case, it is more challenging to deploy thousands to hundreds of thousands of models on a Kubernetes cluster.

      With more separation, comes the problem of distribution

    1. In this example, we’ve defined an API endpoint called /predict_image that accepts a file upload using FastAPI's UploadFile type. When a client sends an image file to this endpoint, the file is read and its contents are passed to a preprocessing function that prepares the image for input into the model. Once the image has been preprocessed, the model can make a prediction on it, and the result can be returned to the client as a JSON response.

      Example above shows how to upload an image to an API endpoint with FastAPI.

      Example below is a bit more complex.

    2. For example, if you are using TensorFlow, you might save your model as a .h5 file using the Keras API. If you are using PyTorch, you might save your model as a .pt file using the torch.save() function. By saving your model as a file, you can easily load it into a deployment environment (such as FastAPI) and use it to make predictions on new images
  8. Jan 2023
    1. tl;dw (best DevOps tools in 2023)

      1. Low-budget cloud computing : Civo (close to Scaleway)
      2. Infrastructure and Service Management: Crossplane
      3. App Management - manifests : cdk8s (yes, not Kustomize or Helm)
      4. App Management - k8s operators: tie between Knative and Crossplane
      5. App Management - managed services: Google Cloud Run
      6. Dev Envs: Okteto (yeap, not GitPod)
      7. CI/CD: GitHub Actions (as it's simplest to use)
      8. GitOps (CD): Argo CD (wins with Flux due to its adoption rate)
      9. Policy Management: Kyverno (simpler to use than industry's most powerful tool: OPA / Gatekeeper)
      10. Observability: OpenTelemetry (instrumentation of apps), VictoriaMetrics (metrics - yes not Prometheus), Grafana / Loki (logs), Grafana Tempo (tracing), Grafana (dashboards), Robusta (alerting), Komodor (troubleshooting)
    1. I hope to show how to demonstrate how easy model deployment can be using Posit’s open source tools for MLOps. This includes {pins}, {vetiver}, and the {tidymodels} bundle of packages along with the {tidyverse}.

      Consider the following packages while doing MLOps in R: - pins - vetiver - tidymodels - tidyverse

  9. Dec 2022
  10. Nov 2022
    1. In MLflow 2.0, MLflow Recipes is now a core platform component with several new features, including support for classification models, improved data profiling and hyperparameter tuning capabilities.

      MLflow Recipes in MLflow 2.0

  11. Oct 2022
    1. MLOps engineer today is either an ML engineer (building ML-specific software) or a DevOps engineer. Nothing special here.Should we call a DevOps engineer who primarily operates ML-fueled software delivery an MLOps engineer?I mean, if you really want, we can, but I don’t think we need a new role here. It is just a DevOps eng.

      Who really is MLOps Engineer ;)

  12. Jun 2022
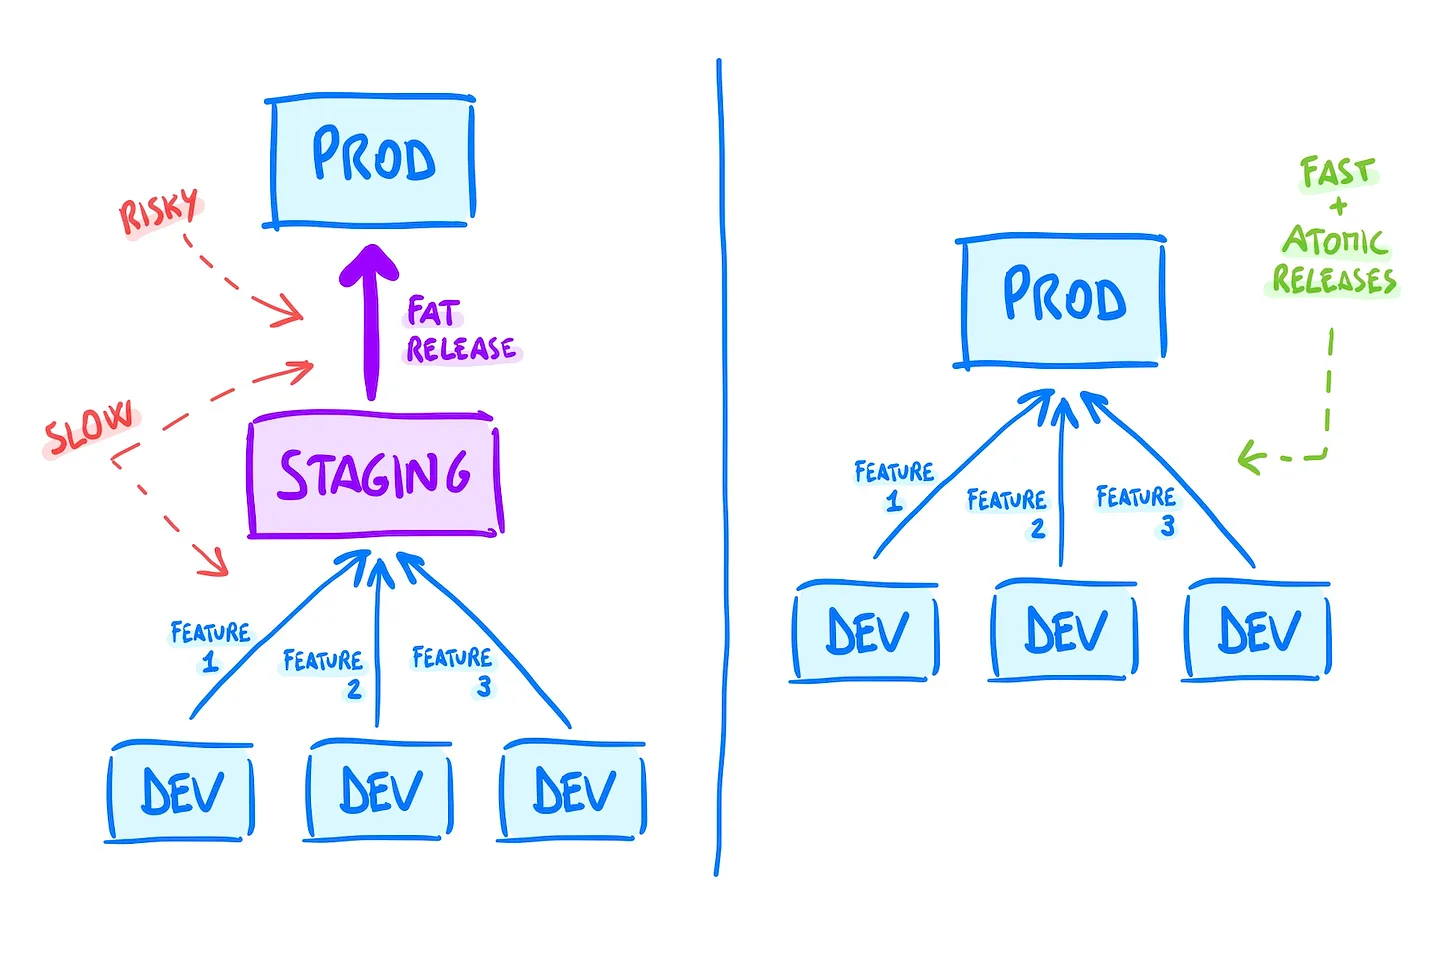
    1. For Staging to be useful, it has to catch a special kind of issues that 1) would happen in production, but 2) wouldn’t happen on a developer's laptop.What are these? They might be problems with data migrations, database load and queries, and other infra-related problems.

      How "Staging" environment can be useful

    1. Another disadvantage of managed platforms is that they are inflexible and slow to change. They might provide 80% of the functionality we require, but it is often the case that the missing 20% provides functionality that is mission critical for machine learning projects. The closed design and architecture of managed platforms makes it difficult to make even the most trivial changes. To compensate for this lack of flexibility, we often have to design custom, inefficient and hard-to-maintain mechanisms that add technical debt to the project.

      Main disadvantage of managed MLOps platforms

  13. May 2022
    1. Overall, if speed is your primary concern and you’re on a budget, then Circle CI is the clear choice. If you’re not looking to run a ton of builds each month and your code is already in Github, then Github Actions can offer similar performance with the added convenience of having everything under one service. Even though we liked Travis better, our main criteria was value, and since you can’t use Travis for free after the first month, GitLab was able to grab the third slot, despite it being weaker in almost every other category.

      4 CI free tier comparison: * Quality of Documentation * Compute Power * Available Disk Space * Free Build Minutes * Speed and Performance

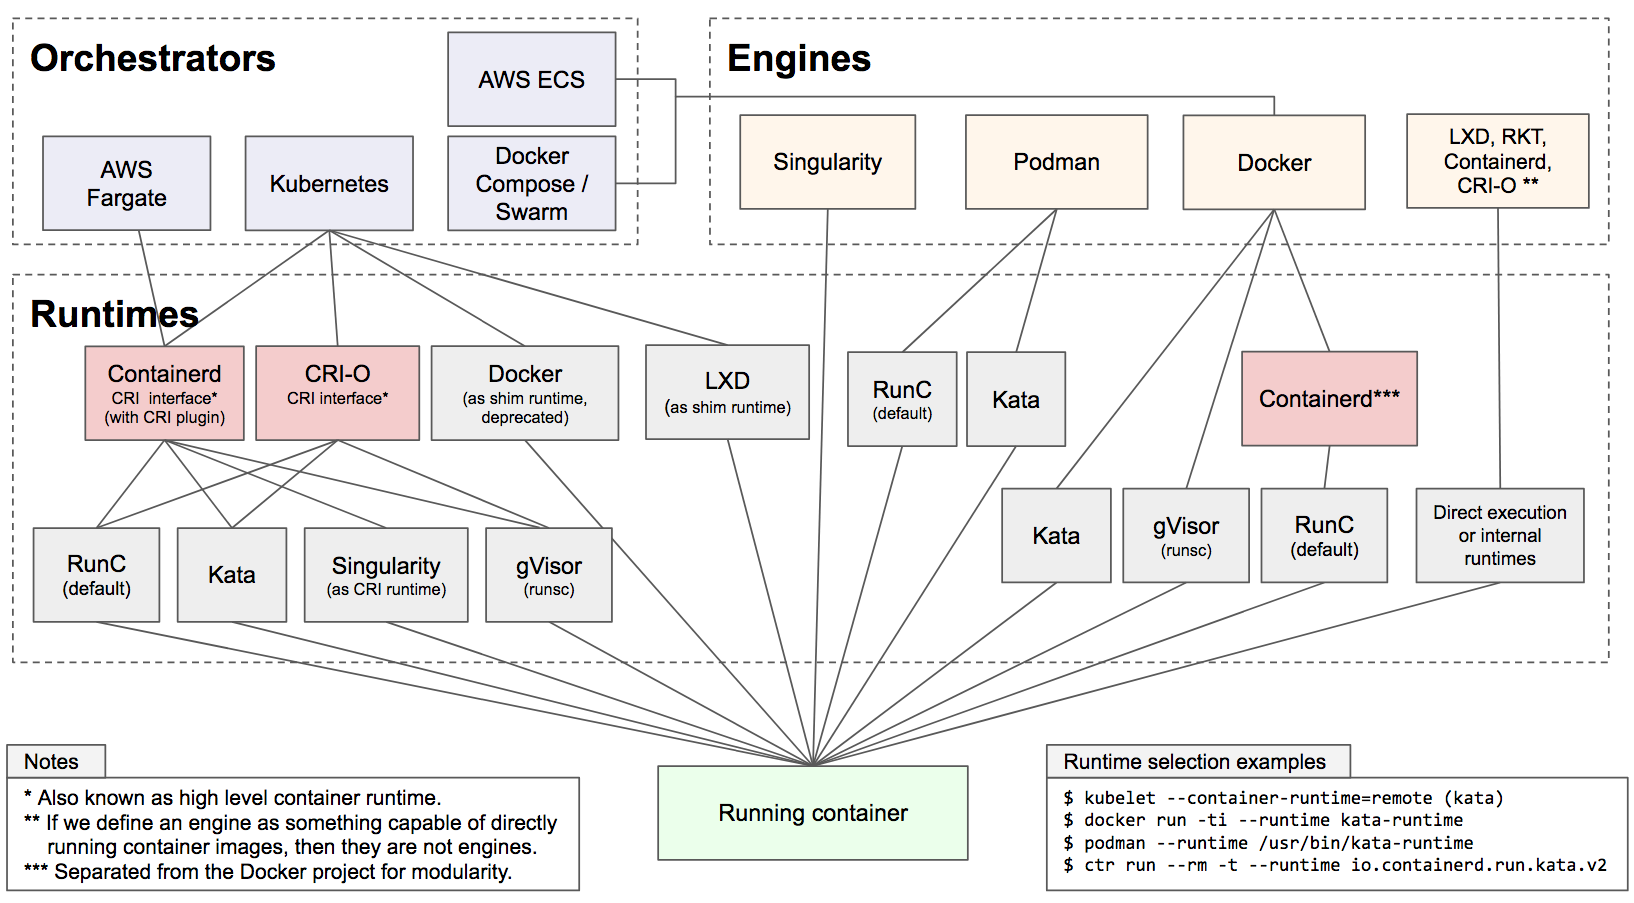
    1. As of today, the Docker Engine is to be intended as an open source software for Linux, while Docker Desktop is to be intended as the freemium product of the Docker, Inc. company for Mac and Windows platforms. From Docker's product page: "Docker Desktop includes Docker Engine, Docker CLI client, Docker Build/BuildKit, Docker Compose, Docker Content Trust, Kubernetes, Docker Scan, and Credential Helper".

      About Docker Engine and Docker Desktop

    1. Without accounting for what we install or add inside, the base python:3.8.6-buster weighs 882MB vs 113MB for the slim version. Of course it's at the expense of many tools such as build toolchains3 but you probably don't need them in your production image.4 Your ops teams should be happier with these lighter images: less attack surface, less code that can break, less transfer time, less disk space used, ... And our Dockerfile is still readable so it should be easy to maintain.

      See sample Dockerfile above this annotation (below there is a version tweaked even further)

  14. Apr 2022
  15. Mar 2022
    1. Have you ever built an image only to realize that you actually need it on a user account other than root, requiring you to rebuild the image again in rootless mode? Or have you built an image on one machine but run containers on the image using multiple different machines? Now you need to set up an account on a registry, push the image to the registry, Secure Shell (SSH) to each device you want to run the image on, and then pull the image. The podman image scp command solves both of these annoying scenarios as quickly as they occur.

      Podman 4.0 can transfer container images without a registry.

      For example: * You can copy a root image to a non-root account:

      $ podman image scp root@localhost::IMAGE USER@localhost:: * Or copy an image from one machine to another with this command:

      $ podman image scp me@192.168.68.122::IMAGE you@192.168.68.128::

    1. As mentioned earlier, PATCH requests should apply partial updates to a resource, whereas PUT replaces an existing resource entirely. It's usually a good idea to design updates around PATCH requests

      Prefer PATCH over PUT

    2. Aside from using HTTP status codes that indicate the outcome of the request (success or error), when returning errors, always use a standardized error response that includes more detailed information on what went wrong.

      For example: ``` // Request => GET /users/4TL011ax

      // Response <= 404 Not Found { "code": "user/not_found", "message": "A user with the ID 4TL011ax could not be found." } ```

    1. But the problem with Poetry is arguably down to the way Docker’s build works: Dockerfiles are essentially glorified shell scripts, and the build system semantic units are files and complete command runs. There is no way in a normal Docker build to access the actually relevant semantic information: in a better build system, you’d only re-install the changed dependencies, not reinstall all dependencies anytime the list changed. Hopefully someday a better build system will eventually replace the Docker default. Until then, it’s square pegs into round holes.

      Problem with Poetry/Docker

    2. Third, you can use poetry-dynamic-versioning, a plug-in for Poetry that uses Git tags instead of pyproject.toml to set your application’s version. That way you won’t have to edit pyproject.toml to update the version. This seems appealing until you realize you now need to copy .git into your Docker build, which has its own downsides, like larger images unless you’re using multi-stage builds.

      Approach of using poetry-dynamic-versioning plugin

    1. The VCR.py library records the responses from HTTP requests made within your unit tests. The first time you run your tests using VCR.py is like any previous run. But the after VCR.py has had the chance to run once and record, all subsequent tests are:Fast! No more waiting for slow HTTP requests and responses in your tests.Deterministic. Every test is repeatable since they run off of previously recorded responses.Offline-capable! Every test can now run offline.

      VCR.py library to speed up Python HTTP tests

    1. DevOps is an interesting case study for understanding MLOps for a number of reasons: It underscores the long period of transformation required for enterprise adoption.It shows how the movement is comprised of both tooling advances as well as shifts in cultural mindset at organizations. Both must march forward hand-in-hand.It highlights the emerging need for practitioners with cross-functional skills and expertise. Silos be damned.

      3 things MLOps can learn from DevOps

    2. MLOps today is in a very messy state with regards to tooling, practices, and standards. However, this is to be expected given that we are still in the early phases of broader enterprise machine learning adoption. As this transformation continues over the coming years, expect the dust to settle while ML-driven value becomes more widespread.

      State of MLOps in March 2022

  16. Jan 2022
    1. Adopting Kubernetes-native environments ensures true portability for the hybrid cloud. However, we also need a Kubernetes-native framework to provide the "glue" for applications to seamlessly integrate with Kubernetes and its services. Without application portability, the hybrid cloud is relegated to an environment-only benefit. That framework is Quarkus.

      Quarkus framework

    2. Kubernetes-native is a specialization of cloud-native, and not divorced from what cloud native defines. Whereas a cloud-native application is intended for the cloud, a Kubernetes-native application is designed and built for Kubernetes.

      Kubernetes-native application

    3. According to Wilder, a cloud-native application is any application that was architected to take full advantage of cloud platforms. These applications: Use cloud platform services. Scale horizontally. Scale automatically, using proactive and reactive actions. Handle node and transient failures without degrading. Feature non-blocking asynchronous communication in a loosely coupled architecture.

      Cloud-native applications

    1. Salesforce has a unique use case where they need to serve 100K-500K models because the Salesforce Einstein product builds models for every customer. Their system serves multiple models in each ML serving framework container. To avoid the noisy neighbor problem and prevent some containers from taking significantly more load than others, they use shuffle sharding [8] to assign models to containers. I won’t go into the details and I recommend watching their excellent presentation in [3].

      Case of Salesforce serving 100K-500K ML models with the use of shuffle sharding

    2. Inference Service — provides the serving API. Clients can send requests to different routes to get predictions from different models. The Inference Service unifies serving logic across models and provides easier interaction with other internal services. As a result, data scientists don’t need to take on those concerns. Also, the Inference Service calls out to ML serving containers to obtain model predictions. That way, the Inference Service can focus on I/O-bound operations while the model serving frameworks focus on compute-bound operations. Each set of services can be scaled independently based on their unique performance characteristics.

      Responsibilities of Inference Service

    3. Provide a model config file with the model’s input features, the model location, what it needs to run (like a reference to a Docker image), CPU & memory requests, and other relevant information.

      Contents of a model config file

    4. what changes when you need to deploy hundreds to thousands of online models? The TLDR: much more automation and standardization.

      MLOps focuses deeply on automation and standardization

    1. “Shadow Mode” or “Dark Launch” as Google calls it is a technique where production traffic and data is run through a newly deployed version of a service or machine learning model, without that service or model actually returning the response or prediction to customers/other systems. Instead, the old version of the service or model continues to serve responses or predictions, and the new version’s results are merely captured and stored for analysis.

      Shadow mode

    1. you can also mount different FastAPI applications within the FastAPI application. This would mean that every sub-FastAPI application would have its docs, would run independent of other applications, and will handle its path-specific requests. To mount this, simply create a master application and sub-application file. Now, import the app object from the sub-application file to the master application file and pass this object directly to the mount function of the master application object.

      It's possible to mount FastAPI applications within a FastAPI application

    1. There are officially 5 types of UUID values, version 1 to 5, but the most common are: time-based (version 1 or version 2) and purely random (version 3). The time-based UUIDs encode the number of 10ns since January 1st, 1970 in 7.5 bytes (60 bits), which is split in a “time-low”-“time-mid”-“time-hi” fashion. The missing 4 bits is the version number used as a prefix to the time-hi field.  This yields the 64 bits of the first 3 groups. The last 2 groups are the clock sequence, a value incremented every time the clock is modified and a host unique identifier.

      There are 5 types of UUIDs (source):

      Type 1: stuffs MAC address+datetime into 128 bits

      Type 3: stuffs an MD5 hash into 128 bits

      Type 4: stuffs random data into 128 bits

      Type 5: stuffs an SHA1 hash into 128 bits

      Type 6: unofficial idea for sequential UUIDs

    2. Even though most posts are warning people against the use of UUIDs, they are still very popular. This popularity comes from the fact that these values can easily be generated by remote devices, with a very low probability of collision.
  17. Dec 2021
    1. Microservices can really bring value to the table, but the question is; at what cost? Even though the promises sound really good, you have more moving pieces within your architecture which naturally leads to more failure. What if your messaging system breaks? What if there’s an issue with your K8S cluster? What if Jaeger is down and you can’t trace errors? What if metrics are not coming into Prometheus?

      Microservices have quite many moving parts

  18. Nov 2021
    1. So which should you use? If you’re a RedHat shop, you’ll want to use their image. If you want the absolute latest bugfix version of Python, or a wide variety of versions, the official Docker Python image is your best bet. If you care about performance, Debian 11 or Ubuntu 20.04 will give you one of the fastest builds of Python; Ubuntu does better on point releases, but will have slightly larger images (see above). The difference is at most 10% though, and many applications are not bottlenecked on Python performance.

      Choosing the best Python base Docker image depends on different factors.

    1. If for some reason you don’t see a running pod from this command, then using kubectl describe po a is your next-best option. Look at the events to find errors for what might have gone wrong.

      kubectl run a –image alpine –command — /bin/sleep 1d

    2. -o wide option will tell us additional details like operating system (OS), IP address and container runtime. The first thing you should look for is the status. If the node doesn’t say “Ready” you might have a problem, but not always.

      kubectl get nodes -o wide

    3. this command will tell you what CRDs (custom resource definitions) have been installed in your cluster and what API version each resource is at. This could give you some insights into looking at logs on controllers or workload definitions.

      kubectl api-resources -o wide –sort-by name

    4. kubectl get --raw '/healthz?verbose'

      Alternative to kubectl get --raw '/healthz?verbose'. It does not show scheduler or controller-manager output, but it adds a lot of additional checks that might be valuable if things are broken

    5. Here are the eight commands to run

      8 commands to debug Kubernetes cluster:

      kubectl version --short
      kubectl cluster-info
      kubectl get componentstatus
      kubectl api-resources -o wide --sort-by name
      kubectl get events -A
      kubectl get nodes -o wide
      kubectl get pods -A -o wide
      kubectl run a --image alpine --command -- /bin/sleep 1d
      
  19. Oct 2021
    1. few battle-hardened options, for instance: Airflow, a popular open-source workflow orchestrator; Argo, a newer orchestrator that runs natively on Kubernetes, and managed solutions such as Google Cloud Composer and AWS Step Functions.

      Current top orchestrators:

      • Airflow
      • Argo
      • Google Cloud Composer
      • AWS Step Functions
    2. To make ML applications production-ready from the beginning, developers must adhere to the same set of standards as all other production-grade software. This introduces further requirements:

      Requirements specific to MLOps systems:

      1. Large scale of operations
      2. Orchestration
      3. Robust versioning (data, models, code)
      4. Apps integrated to surrounding busness systems
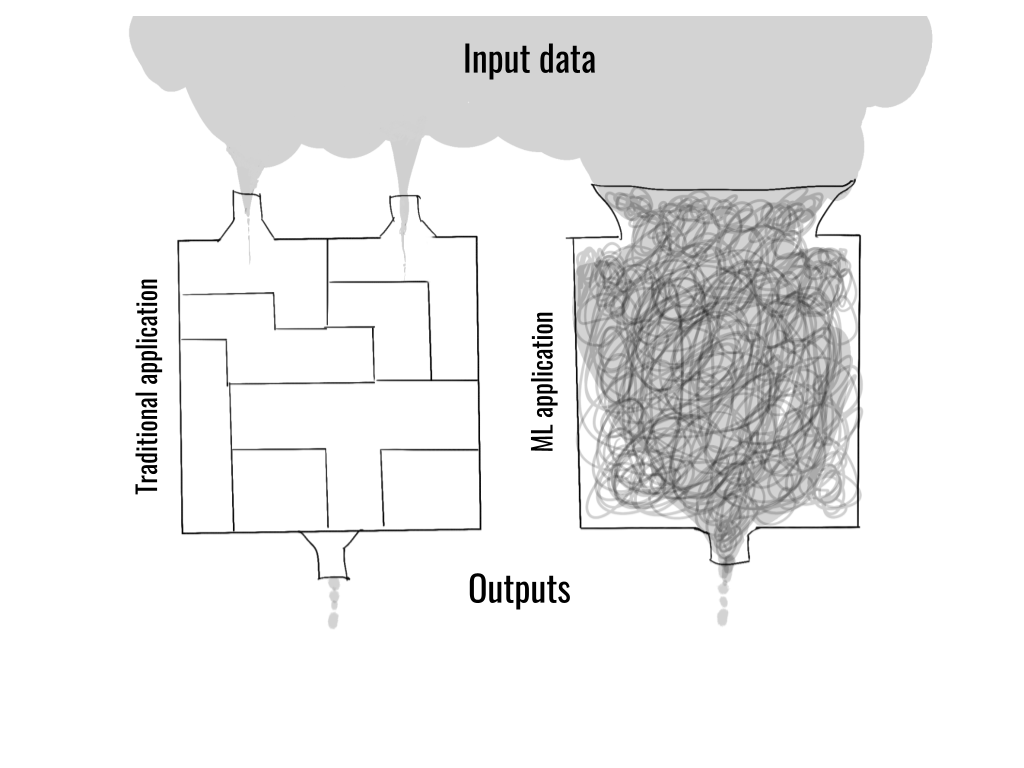
    3. In contrast, a defining feature of ML-powered applications is that they are directly exposed to a large amount of messy, real-world data which is too complex to be understood and modeled by hand.

      One of the best ways to picture a difference between DevOps and MLOps

    1. Argo is designed to run on top of k8s. Not a VM, not AWS ECS, not Container Instances on Azure, not Google Cloud Run or App Engine. This means you get all the good of k8s, but also the bad.

      Pros of Argo Workflow:

      • Resilience
      • Autoscaling
      • Configurability
      • Support for RBAC

      Cons of Argo Workflow:

      • A lot of YAML files required
      • k8s knowledge required
    2. If you are already heavily invested in Kubernetes, then yes look into Argo Workflow (and its brothers and sisters from the parent project).The broader and harder question you should ask yourself is: to go full k8s-native or not? Look at your team’s cloud and k8s experience, size, growth targets. Most probably you will land somewhere in the middle first, as there is no free lunch.

      Should you go into Argo, or not?

  20. Sep 2021
    1. kind, microk8s, or k3s are replacements for Docker Desktop. False. Minikube is the only drop-in replacement. The other tools require a Linux distribution, which makes them a non-starter on macOS or Windows. Running any of these in a VM misses the point – you don't want to be managing the Kubernetes lifecycle and a virtual machine lifecycle. Minikube abstracts all of this.

      At the current moment the best approach is to use minikube with a preferred backend (Docker Engine and Podman are already there), and you can simply run one command to configure Docker CLI to use the engine from the cluster.

  21. Aug 2021
    1. k3d is basically running k3s inside of Docker. It provides an instant benefit over using k3s on a local machine, that is, multi-node clusters. Running inside Docker, we can easily spawn multiple instances of our k3s Nodes.

      k3d <--- k3s that allows to run mult-node clusters on a local machine

    2. Kubernetes in Docker (KinD) is similar to minikube but it does not spawn VM's to run clusters and works only with Docker. KinD for the most part has the least bells and whistles and offers an intuitive developer experience in getting started with Kubernetes in no time.

      KinD (Kubernetes in Docker) <--- sounds like the most recommended solution to learn k8s locally

    3. Contrary to the name, it comes in a larger binary of 150 MB+. It can be run as a binary or in DinD mode. k0s takes security seriously and out of the box, it meets the FIPS compliance.

      k0s <--- similar to k3s, but not as lightweight

    4. k3s is a lightweight Kubernetes distribution from Rancher Labs. It is specifically targeted for running on IoT and Edge devices, meaning it is a perfect candidate for your Raspberry Pi or a virtual machine.

      k3s <--- lightweight solution

  22. Jul 2021
    1. Furthermore, in order to build a comprehensive pipeline, the code quality, unit test, automated test, infrastructure provisioning, artifact building, dependency management and deployment tools involved have to connect using APIs and extend the required capabilities using IaC.

      Vital components of a pipeline

    1. The fact that FastAPI does not come with a development server is both a positive and a negative in my opinion. On the one hand, it does take a bit more to serve up the app in development mode. On the other, this helps to conceptually separate the web framework from the web server, which is often a source of confusion for beginners when one moves from development to production with a web framework that does have a built-in development server (like Django or Flask).

      FastAPI does not include a web server like Flask. Therefore, it requires Uvicorn.

      Not having a web server has pros and cons listed here

    1. Get the `curl-format.txt` from github and then run this curl command in order to get the output $ curl -L -w "@curl-format.txt" -o tmp -s $YOUR_URL

      Testing server latency with curl:

      1) Get this file from GitHub

      2) Run the curl: curl -L -w "@curl-format.txt" -o tmp -s $YOUR_URL

    1. To prevent this skew, companies like DoorDash and Etsy log a variety of data at online prediction time, like model input features, model outputs, and data points from relevant production systems.

      Log inputs and outputs of your online models to prevent training-serving skew

    2. Uber and Booking.com’s ecosystem was originally JVM-based but they expanded to support Python models/scripts. Spotify made heavy use of Scala in the first iteration of their platform until they received feedback like:some ML engineers would never consider adding Scala to their Python-based workflow.

      Python might be even more popular due to MLOps

    3. Most serving systems are built in-house, I assume for similar reasons as a feature store — there weren’t many serving tools until recently and these companies have stringent production requirements.

      The reason of many feature stores and model serving tools built in house, might be, because there were not many open-source tools before

    4. Models require a dedicated system because their behavior is determined not only by code, but also by the training data, and hyper-parameters. These three aspects should be linked to the artifact, along with metrics about performance on hold-out data.

      Why model registry is a must in MLOps

    5. five ML platform components stand out which are indicated by the green boxes in the diagram below
      1. Feature store
      2. Workflow orchestration
      3. Model registry
      4. Model serving
      5. Model quality monitoring
    1. we employed a three-stage strategy for validating and deploying the latest binary of the Real-time Prediction Service: staging integration test, canary integration test, and production rollout. The staging integration test and canary integration tests are run against non-production environments. Staging integration tests are used to verify the basic functionalities. Once the staging integration tests have been passed, we run canary integration tests to ensure the serving performance across all production models. After ensuring that the behavior for production models will be unchanged, the release is deployed onto all Real-time Prediction Service production instances, in a rolling deployment fashion.

      3-stage strategy for validating and deploying the latest binary of the Real-time Prediction Service:

      1. Staging integration test <--- verify the basic functionalities
      2. Canary integration tests <--- ensure the serving performance across all production models
      3. Production rollout <--- deploy release onto all Real-time Prediction Service production instances, in a rolling deployment fashion
    2. We add auto-shadow configuration as part of the model deployment configurations. Real-time Prediction Service can check on the auto-shadow configurations, and distribute traffic accordingly. Users only need to configure shadow relations and shadow criteria (what to shadow and how long to shadow) through API endpoints, and make sure to add features that are needed for the shadow model but not for the primary model.

      auto-shadow configuration

    3. In a gradual rollout, clients fork traffic and gradually shift the traffic distribution among a group of models.  In shadowing, clients duplicate traffic on an initial (primary) model to apply on another (shadow) model).

      gradual rollout (model A,B,C) vs shadowing (model D,B):

    4. we built a model auto-retirement process, wherein owners can set an expiration period for the models. If a model has not been used beyond the expiration period, the Auto-Retirement workflow, in Figure 1 above, will trigger a warning notification to the relevant users and retire the model.

      Model Auto-Retirement - without it, we may observe unnecessary storage costs and an increased memory footprint

    5. For helping machine learning engineers manage their production models, we provide tracking for deployed models, as shown above in Figure 2. It involves two parts:

      Things to track in model deployment (listed below)

    6. Model deployment does not simply push the trained model into Model Artifact & Config store; it goes through the steps to create a self-contained and validated model package

      3 steps (listed below) are executed to validate the packaged model

    7. we implemented dynamic model loading. The Model Artifact & Config store holds the target state of which models should be served in production. Realtime Prediction Service periodically checks that store, compares it with the local state, and triggers loading of new models and removal of retired models accordingly. Dynamic model loading decouples the model and server development cycles, enabling faster production model iteration.

      Dynamic Model Loading technique

    8. The first challenge was to support a large volume of model deployments on a daily basis, while keeping the Real-time Prediction Service highly available.

      A typical MLOps use case

  23. Jun 2021
    1. It basically takes any command line arguments passed to entrypoint.sh and execs them as a command. The intention is basically "Do everything in this .sh script, then in the same shell run the command the user passes in on the command line".

      What is the use of this part in a Docker entry point:

      #!/bin/bash
      set -e
      
      ... code ...
      
      exec "$@"
      
  24. May 2021
    1. Kubeflow Pipelines comes to solve this problem. KFP, for short, is a toolkit dedicated to run ML Workflows (as experiments for model training) on Kubernetes, and it does it in a very clever way:Along with other ways, Kubeflow lets us define a workflow as a series of Python functions that pass results, and Artifacts for one another.For each Python function, we can define dependencies (for libs used) and Kubeflow will create a container to run each function in an isolated way, and passing any wanted object to a next step on the workflow. We can set needed resources, (as memory or GPUs) and it will provision them for our workflow step. It feels like magic.Once you’ve ran your pipeline, you will be able to see it in a nice UI, like this:

      Brief explanation of Kubeflow Pipelines

    2. Vertex AI came from the skies to solve our MLOps problem with a managed — and reasonably priced—alternative. Vertex AI comes with all the AI Platform classic resources plus a ML metadata store, a fully managed feature store, and a fully managed Kubeflow Pipelines runner.

      Vertex AI - Google Cloud’s new unified ML platform

    1. MLflow is a single python package that covers some key steps in model management. Kubeflow is a combination of open-source libraries that depends on a Kubernetes cluster to provide a computing environment for ML model development and production tools.

      Brief comparison of MLflow and Kubeflow

  25. Apr 2021
    1. To summarize, implementing ML in a production environment doesn't only mean deploying your model as an API for prediction. Rather, it means deploying an ML pipeline that can automate the retraining and deployment of new models. Setting up a CI/CD system enables you to automatically test and deploy new pipeline implementations. This system lets you cope with rapid changes in your data and business environment. You don't have to immediately move all of your processes from one level to another. You can gradually implement these practices to help improve the automation of your ML system development and production.

      The ideal state of MLOps in a project (2nd level)

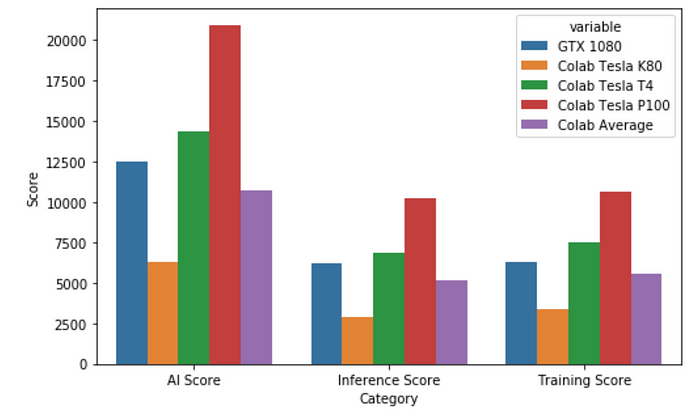
    1. On the median case, Colab is going to assign users a K80, and the GTX 1080 is around double the speed, which does not stack up particularly well for Colab. However, on occasion, when a P100 is assigned, the P100 is an absolute killer GPU (again, for FREE).

      Some of the GPUs from Google Colab are outstanding.

  26. Mar 2021
    1. large machine learning job spans many nodes and runs most efficiently when it has access to all of the hardware resources on each node. This allows GPUs to cross-communicate directly using NVLink, or GPUs to directly communicate with the NIC using GPUDirect. So for many of our workloads, a single pod occupies the entire node.

      The way OpenAI runs large ML jobs on K8s

    1. For high availability, we always have at least 2 masters, and set the --apiserver-count flag to the number of apiservers we’re running (otherwise Prometheus monitoring can get confused between instances).

      Tip for high availability:

      • have at least 2 masters
      • set --apiserver-count flag to the number of running apiservers
    2. We’ve increased the max etcd size with the --quota-backend-bytes flag, and the autoscaler now has a sanity check not to take action if it would terminate more than 50% of the cluster.

      If we've more than 1k nodes, etcd's hard storage limit might stop accepting writes

    3. Another helpful tweak was storing Kubernetes Events in a separate etcd cluster, so that spikes in Event creation wouldn’t affect performance of the main etcd instances.

      Another trick apart from tweaking default settings of Fluentd & Datadog

    4. The root cause: the default setting for Fluentd’s and Datadog’s monitoring processes was to query the apiservers from every node in the cluster (for example, this issue which is now fixed). We simply changed these processes to be less aggressive with their polling, and load on the apiservers became stable again:

      Default settings of Fluentd and Datadog might not be suited for running many nodes

    5. We then moved the etcd directory for each node to the local temp disk, which is an SSD connected directly to the instance rather than a network-attached one. Switching to the local disk brought write latency to 200us, and etcd became healthy!

      One of the solutions for etcd using only about 10% of the available IOPS. It was working till about 1k nodes

  27. Feb 2021
    1. As we mentioned before, the majority of machine learning implementations are based on running model serving as a REST service, which might not be appropriate for the high volume data processing or usage of the streaming system, which requires re coding/starting systems for model update, for example, TensorFlow or Flink. Model as Data is a great fit for big data pipelines. For online inference, it is quite easy to implement, you can store the model anywhere (S3, HDFS…), read it into memory and call it.

      Model as Data <--- more appropriate approach than REST service for serving big data pipelines

    2. The most common way to deploy a trained model is to save into the binary format of the tool of your choice, wrap it in a microservice (for example a Python Flask application) and use it for inference.

      Model as Code <--- the most common way of deploying ML models

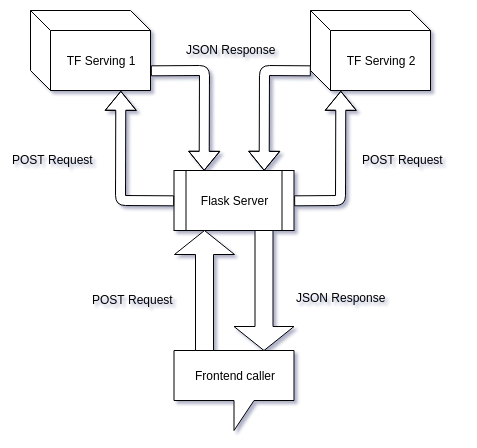
    1. When we are providing our API endpoint to frontend team we need to ensure that we don’t overwhelm them with preprocessing technicalities.We might not always have a Python backend server (eg. Node.js server) so using numpy and keras libraries, for preprocessing, might be a pain.If we are planning to serve multiple models then we will have to create multiple TensorFlow Serving servers and will have to add new URLs to our frontend code. But our Flask server would keep the domain URL same and we only need to add a new route (a function).Providing subscription-based access, exception handling and other tasks can be carried out in the Flask app.

      4 reasons why we might need Flask apart from TensorFlow serving

    1. Next, imagine you have more models to deploy. You have three optionsLoad the models into the existing cluster — having one cluster serve all models.Spin up a new cluster to serve each model — having multiple clusters, one cluster serves one model.Combination of 1 and 2 — having multiple clusters, one cluster serves a few models.The first option would not scale, because it’s just not possible to load all models into one cluster as the cluster has limited resources.The second option will definitely work but it doesn’t sound like an effective process, as you need to create a set of resources every time you have a new model to deploy. Additionally, how do you optimize the usage of resources, e.g., there might be unutilized resources in your clusters that could potentially be shared by the rest.The third option looks promising, you can manually choose the cluster to deploy each of your new models into so that all the clusters’ resource utilization is optimal. The problem is you have to manuallymanage it. Managing 100 models using 25 clusters can be a challenging task. Furthermore, running multiple models in a cluster can also cause a problem as different models usually have different resource utilization patterns and can interfere with each other. For example, one model might use up all the CPU and the other model won’t be able to serve anymore.Wouldn’t it be better if we had a system that automatically orchestrates model deployments based on resource utilization patterns and prevents them from interfering with each other? Fortunately, that is exactly what Kubernetes is meant to do!

      Solution for deploying lots of ML models

    1. If you’re running lots of deployments of models then it becomes important to record which versions were deployed and when. This is needed to be able to go back to specific versions. Model registries help with this problem by providing ways to store and version models.

      Model Registries <--- way to handle multiple ML models in production

    1. GitOps is a way to do Kubernetes cluster management and application delivery.  It works by using Git as a single source of truth for declarative infrastructure and applications. With GitOps, the use of software agents can alert on any divergence between Git with what's running in a cluster, and if there's a difference, Kubernetes reconcilers automatically update or rollback the cluster depending on the case. With Git at the center of your delivery pipelines, developers use familiar tools to make pull requests to accelerate and simplify both application deployments and operations tasks to Kubernetes.

      Other definition of GitOps (source):

      GitOps is a way of implementing Continuous Deployment for cloud native applications. It focuses on a developer-centric experience when operating infrastructure, by using tools developers are already familiar with, including Git and Continuous Deployment tools.

  28. Jan 2021
    1. Different data sources are better suited for different types of data transformations and provide access to different data quantities at different freshnesses

      Comparison of data sources

      • Data warehouses / lakes (such as Snowflake or Redshift) tend to hold a lot of information but with low data freshness (hours or days). They can be a gold mine, but are most useful for large-scale batch aggregations with low freshness requirements, such as “number of lifetime transactions per user.”
      • Transactional data sources (such as MongoDB or MySQL) usually store less data at a higher freshness and are not built to process large analytical transformations. They’re better suited for small-scale aggregations over limited time horizons, like the number of orders placed by a user in the past 24 hrs.
      • Data streams (such as Kafka) store high-velocity events and provide them in near real-time (within milliseconds). In common setups, they retain 1-7 days of historical data. They are well-suited for aggregations over short time-windows and simple transformations with high freshness requirements, like calculating that “trailing count over the last 30 minutes” feature described above.
      • Prediction request data is raw event data that originates in real-time right before an ML prediction is made, e.g. the query a user just entered into the search box. While the data is limited, it’s often as “fresh” as can be and contains a very predictive signal. This data is provided with the prediction request and can be used for real-time calculations like finding the similarity score between a user’s search query and documents in a search corpus.
    2. MLOps platforms like Sagemaker and Kubeflow are heading in the right direction of helping companies productionize ML. They require a fairly significant upfront investment to set up, but once properly integrated, can empower data scientists to train, manage, and deploy ML models. 

      Two popular MLOps platforms: Sagemaker and Kubeflow