- Oct 2024
-
-
Baez, John C., and Mike Stay. “Physics, Topology, Logic and Computation: A Rosetta Stone.” Quantum Physics; Category Theory. arXiv:0903.0340 [Quant-Ph] 813 (March 2, 2009): 95–172. https://doi.org/10.1007/978-3-642-12821-9_2.
-
- Aug 2024
-
arxiv.org arxiv.org
-
for - Indyweb dev - large language model for - constructing causal loop diagrams - System Dynamics Bot - large language model - constructing causal loop diagrams
-
- Jul 2024
-
journals.sagepub.com journals.sagepub.com
-
There have been many attempts over the years to address the limitations of an overly ‘linear’ approach to ToC diagramming
for - ToC diagrams - limitations - too linear - attempts to address
-
- Jul 2023
- Jun 2023
-
statecharts.dev statecharts.dev
-
www.mermaidchart.com www.mermaidchart.com
- Apr 2023
-
x.st x.st
Tags
Annotators
URL
-
-
zettelkasten.de zettelkasten.de
-
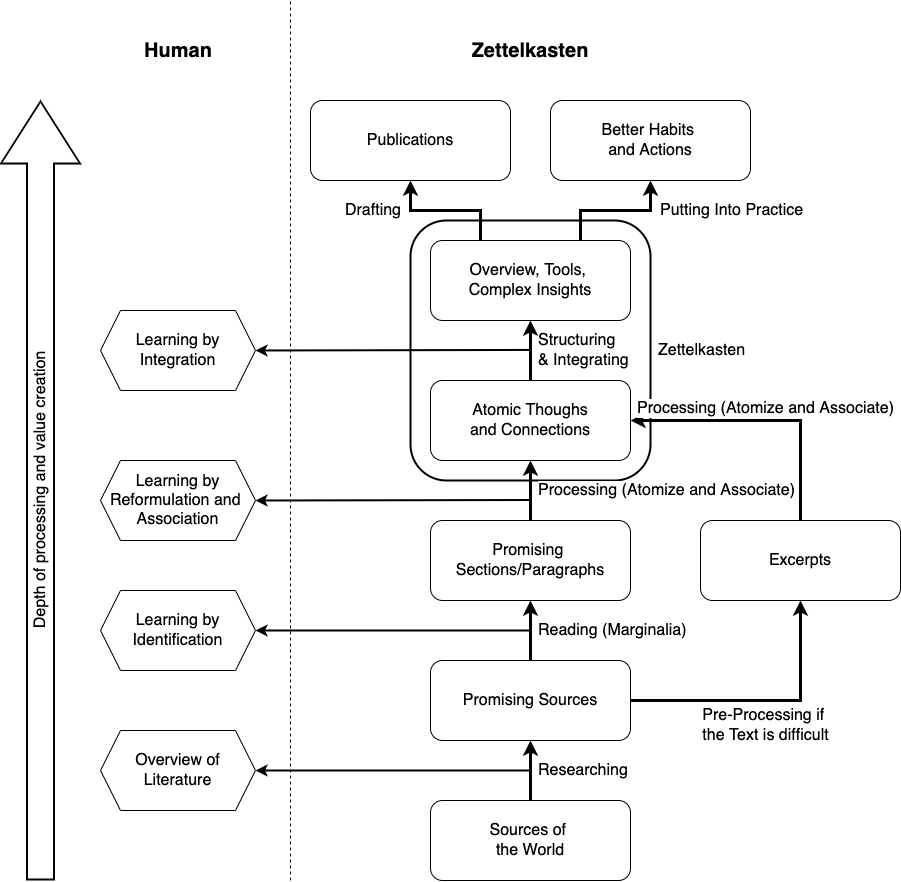
Sascha Fast's conceptual diagram of Human and Zettelkasten
-
- Mar 2023
-
www.npr.org www.npr.org
-
They both talk, though, about going over material again and again. The process of writing an article involves putting words in chronological order, but also creating branching, sub-dividing trees of syntax and semantics.
Interesting to see a reference the branching nature of the meanings of an individual word which has multiple ways of being categorized.
The TLL categorizes words alphabetically first and then by chronologically second. The rest of the structure shakes out from there as editors write articles for each of the words.
-
- Feb 2023
-
www.dandoescode.com www.dandoescode.com
Tags
Annotators
URL
-
-
jojozhuang.github.io jojozhuang.github.io
-
Local file Local file
-
Traditions about Usal and the Zugubals are based on the story of Thoegay, a fiercewarrior, Zogo Le, and skilled navigator who commanded a ship crew of thirteen: a firstmate named Kang and a crew of twelve men, called the Zugubals. The group embarkedon a long expedition at sea on a hot day. Before long, the crew began consuming theirrations in zest. They were warned by Kang to conserve their supplies, but before longthey had consumed the water for the entire trip, including Thoegay’s. When Thoegayrealised this, he flew into a fit of rage and killed the 12 men. Because the Zugubals werealso spiritual beings, they could not die, so Thoegay cast them into the sky as two groupsof six stars: Usal (the six brightest stars of the Pleiades) and Utimal (the six brightest starsof Orion’s belt and scabbard). Thoegay then ascended into the opposite side of the sky,taking Kang and his canoe with him. He can be seen as a large constellation holding aspear in his left hand (the Southern Cross) and a Eugenia fruit in his right hand (theconstellation Corvus), standing at the bow of his celestial canoe (Scorpius) with Kang(Antares; Alpha Scorpii) sitting at the stern (Robinson 2016a).
This is a great story, but interestingly, without the appropriate art to explicitly map the idea onto, it's much harder to remember or to help those unaccustomed to these ideas. Presumably the audience of this book doesn't/wouldn't.
A simple drawing here or an overlay onto an existing image would be immensely helpful. Perhaps the Robinson reference has one? (it doesn't)
Tags
- constellations
- Usal
- Thoegay
- Zugubals
- folklore
- diagrams
- Kang
- illustrations
- Indigenous astronomy
- Utimal
Annotators
-
-
cmap.ihmc.us cmap.ihmc.us
-
https://cmap.ihmc.us/docs/learn.php
<small><cite class='h-cite via'>ᔥ <span class='p-author h-card'>u/New-Investigator</span> in Concepts maps and Zettelkasten : Zettelkasten (<time class='dt-published'>02/07/2023 10:12:44</time>)</cite></small>
-
- Jan 2023
-
plantuml.com plantuml.com
-
- Nov 2022
-
medium.com medium.com
-
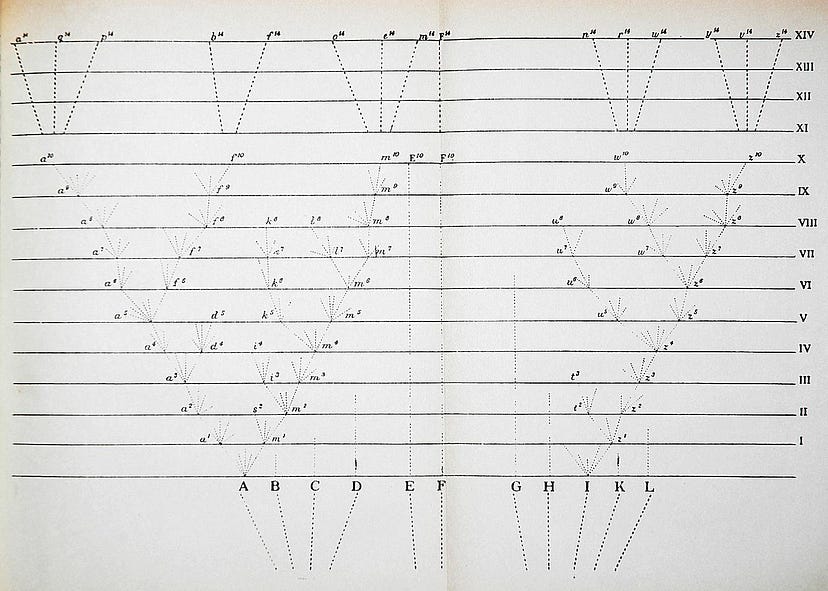
The only diagram or image in The Origin of Species, a tree depicting divergence (source)
Darwin's On the Origin of Species only contains one diagram, a branching tree diagram which shows divergence of species.
-
he was working on the same theme with Stefanie Posavec. They completed their piece some time later, depicting the changes as lovely branching trees — a kind of homage to Darwin’s lone diagram in the book.
Greg McInerny of Microsoft Research and Stefanie Posavek created a version of Darwin's On the Origin of Species that displayed variations between the editions as a branching tree diagram, a nod to the only diagram which appeared in Darwin's original work. .
-
- Jul 2022
-
press.uchicago.edu press.uchicago.edu
-
https://press.uchicago.edu/ucp/books/book/chicago/L/bo63098990.html Lines of Thought: Branching Diagrams and the Medieval Mind by Ayelet Even-Ezra
Mentioned during Tinderbox Meetup: https://forum.eastgate.com/t/tagging-meetup-saturday-august-7/4841
They apparently discussed the book last week. (May be able to find the video of the discussion)
-
- Jun 2022
-
www.youtube.com www.youtube.com
-
Diagrams as Code 2.0 • Simon Brown • GOTO 2021
"long-lived documentation" - "Think about diagrams as 'disposable' artifacts"
https://c4model.com/ C4 Model - model for visualizing software architecture; hierarchal dataset; Diagrams as abstractions, differing levels of technical details; think of it as zooming into maps at different levels * Level 1: Context * Level 2: Containers * Level 3: Components * Level 4: Code
Product Comparisions - Working with the DSL (Lite v. CLI v. DSL Editor): https://structurizr.com/help/dsl - Product offerings (Lite v. Cloud v. On-premise): https://structurizr.com/products
The DSL is rendering tool agnostic
Diagrams as code 1.0 - PlantUML, Mermaild, etc are input formats
Diagrams as code 2.0 - PlantUML, Mermaild, etc are output formats
Checkout: - Online REPL: https://structurizr.com/dsl?example=amazon-web-services - DSL Guidance: https://github.com/structurizr/dsl/tree/master/docs/cookbook - Examples: https://github.com/structurizr/examples
-
- Feb 2022
-
betterprogramming.pub betterprogramming.pub
-
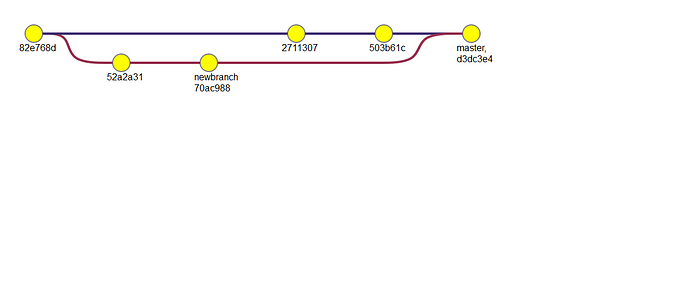
Git Graph (Experimental)
Git graphs are a way to visualize your Git project commits, merges, and progress.
mermaid gitGraph: options { "nodeSpacing": 150, "nodeRadius": 10 } end commit branch newbranch checkout newbranch commit commit checkout master commit commit merge newbranch
-
- Jan 2022
-
github.com github.com
-
```mermaid graph TD; A-->B; A-->C; B-->D; C-->D;
```
Tags
Annotators
URL
-
- Aug 2021
-
papress.com papress.com
-
<small><cite class='h-cite via'>ᔥ <span class='p-author h-card'>@vaultofculture</span> in Vault of Culture on Twitter: "@ChrisAldrich @gipperfish @jdconnor @AnneGanzert See also the work of Manuel Lima (@mslima), in particular The Book of Trees: https://t.co/30jJu1xOrY" / Twitter (<time class='dt-published'>08/08/2021 15:43:42</time>)</cite></small>
-
from its roots
Ha!
-
- Mar 2021
-
tatianamac.com tatianamac.com
-
Visualise written content into a more dynamic way. Many people, some neurodivergent folks especially, benefit from information being distilled into diagrams, comics, or less word-dense formats. Visuals can also benefit people who might not read/understand the language you wrote it in. They can also be an effective lead-in to your long-form from visually-driven avenues like Pinterest or Instagram.
This is also a great exercise for readers and learners. If the book doesn't do this for you already, spend some time to annotate it or do it yourself.
-
- Sep 2020
-
www.cs.umd.edu www.cs.umd.edu
-
A picture is often cited to be worth a thousand words and, for some (but not all) tasks, it is clear that a visual presentation-such as a map or photograph-is dramatically easier to use than is a textual description or a spoken report.
[[Diagrams]]
"a picture is worth a thousand words" what's in this statement?
a picture doesn't equal a thousand words, but its exchange value is roughly equivalent to a thousand words
similar to a diagram, are images a-signifying? their nature is fundamentally reproductive. if we believe Benjamin's logic, "aura" is lost in reproductions. what this means in practice is that reproductions necessarily cannot reproduce their object of focus. an idea supporting this is derrida's Differance, which identifies a hidden expanse of networked ideas that give meaning to a sign through context and recursive thought
so if a picture is worth a thousand words, it's because an image can't reproduce a thousand words 1:1 (so the image's signification is immanently constrained), but its use value is roughly equal because those thousand words are invoked in the Differance of the image, in other words, the ideology of the viewer.
This feels like a minor breakthrough in my understanding of how image and ideology relate. Taken to its logical conclusion, this line of thought comes to mean that images can be categorically defined as visual ideologies.
-
- Jul 2020
-
rossta.net rossta.net
-
The hands-down best Computer Science class I took at NYU was Heuristics with Dennis Shasha in which we learned algorithms for approximating solutions to NP-hard problems and applied them to compete in automated 2-player competitive battles including a gravitation Voronoi game.
-
- Oct 2019
-
www.rosemagazine.com www.rosemagazine.com
-
diagrams of vining roses like rambling sentence diagrams
Tags
Annotators
URL
-
- Feb 2017
-
monodraw.helftone.com monodraw.helftone.com
-
Powerful ASCII art editor
Design and draw using simple character sets. Save to git or other version control. Hattip to @paulozoom.
Tags
Annotators
URL
-