The State of the Culture, 2024<br /> by [[Ted Gioia]]<br /> accessed on 2025-08-18T08:53:09
The State of the Culture, 2024<br /> by [[Ted Gioia]]<br /> accessed on 2025-08-18T08:53:09
“The library, panels and boxes formed the ensemble of supports on which Aby Warburg’s spiritual work and intellectual creativity were based.” - Benjamin Steiner, Aby Warburgs Zettelkasten Nr. 2 “Geschichtsauffassung”, In: Heike Gfrereis / Ellen Strittmatter (Hrsg.): Zettelkästen. Maschinen der Phantasie (Marbacher Kataloge, 66). Marbach 2013, S. 154-161.
Aby Warburg used three primary tools for his research: his library, a card index, and panels.
His panels would be versions of pinboards, chalk boards, dry erase boards, or online versions of things like Canvas in Obsidian. It amounts to the ability to take notes or images on cards and shuffle them around on a table (or affixed to a wall).
I've been considering what it would look like to have state machines / state charts as a direct language primitive. I'm sure there are some out there. Is it actually a good idea? Are variant/enum types with pattern matching enough?
Erläuterungen der Energy Charts des Fraunhofer-Instituts für solare Energiesysteme: 2023 kamen 55% des deutschen Strombedarfs aus erneuerbaren Energien, die Kohleverstromung ist deutlich gesunken. Der Verzicht auf Atomkraftwerke war keine Ursache dafür, dass Deutschland in diesem Jahr mehr Strom importierte als exportierte. https://www.handelsblatt.com/unternehmen/energie/strommix-deutschland-so-abhaengig-ist-deutschland-von-stromimporten/100002618.html
ZK system for Project and Task management? .t3_17dp8nl._2FCtq-QzlfuN-SwVMUZMM3 { --postTitle-VisitedLinkColor: #9b9b9b; --postTitleLink-VisitedLinkColor: #9b9b9b; --postBodyLink-VisitedLinkColor: #989898; }
Reply to u/Hileotech at https://www.reddit.com/r/Zettelkasten/comments/17dp8nl/zk_system_for_project_and_task_management/
They don't have the same structure as Luhmann's zettelkasten (they don't really need to and may frankly work better without them), but index cards were heavily used in business and project planning settings for decades prior to the popularization of the computer.
I've documented one productivity method from 1903 called the Memindex which was a precursor to things like the Hipster PDA, the Pile of Index Cards, and 43 folders methods which have been popular since the early 2000s. Details and pointers can be found at The Memindex Method: an early precursor of the Memex, Hipster PDA, 43 Folders, GTD, BaSB, and Bullet Journal systems. Addition details can also be found at A year of Bullet Journaling on Index Cards inspired by the Memindex Methodas well as in the comments.
Index card-based project management techniques with items broken out by task can be used to create physical Kanban boards or even arranged in Gantt chart-like fashion on walls, bulletin boards, or tables.
This is a way to make check lists that are more useful. You only fill the box when your all the way done with the task, when you are about half way done you fill the box half way. I learnedabout this from Adam Savage in his book, "Every Tool is a Hammer". He learned about it when he worked at Industrial Light & Magic.Does it have an official name? (screen shots from his book)
Adam Savage's book Every Tool is a Hammer shows a checklist which has square bullets which can be partially filled in to show the level of completion. He learned the method when working at Industrial Light & Magic.
via u/AZORIAN_K129 at https://www.reddit.com/r/NoteTaking/comments/15zgbvr/does_this_technique_have_a_name/
Figure 2.3 The fi xation of paper slips. (From Wellisch 1981, p. 12.)
This is essentially a version of a modern pinboard with ribbons which are used to hold various pieces onto the board!
Also similar in functionality to Post-it Notes, but with string instead of glue.
A Complete Guide to Scatter Plots
How to Scatter Plot
reply to: https://www.reddit.com/r/ObsidianMD/comments/zsljal/canvas_is_awesome_helped_me_solve_a_case
For the anacapa chart afficionados: https://www.vaultofculture.com/nst
See also their book:
Timeline of World History by Matt Baker (Editor), John Andrews (Editor)<br /> October 20, 2020<br /> https://www.amazon.com/Timeline-World-History-Matt-Baker/dp/1645174174/
Mentioned by Mathew Lowry at [[Friends of the Link 2022-07-28]]; he's got the world history map on the wall of his office
Twine is an open-source tool for telling interactive, nonlinear stories.
You don’t need to write any code to create a simple story with Twine, but you can extend your stories with variables, conditional logic, images, CSS, and JavaScript when you're ready.
Twine publishes directly to HTML, so you can post your work nearly anywhere. Anything you create with it is completely free to use any way you like, including for commercial purposes.
Heard referenced in Reclaim Hosting community call as a method for doing "clue boards".
Could twinery.org be used as a way to host/display one's linked zettelkasten or note card collection?
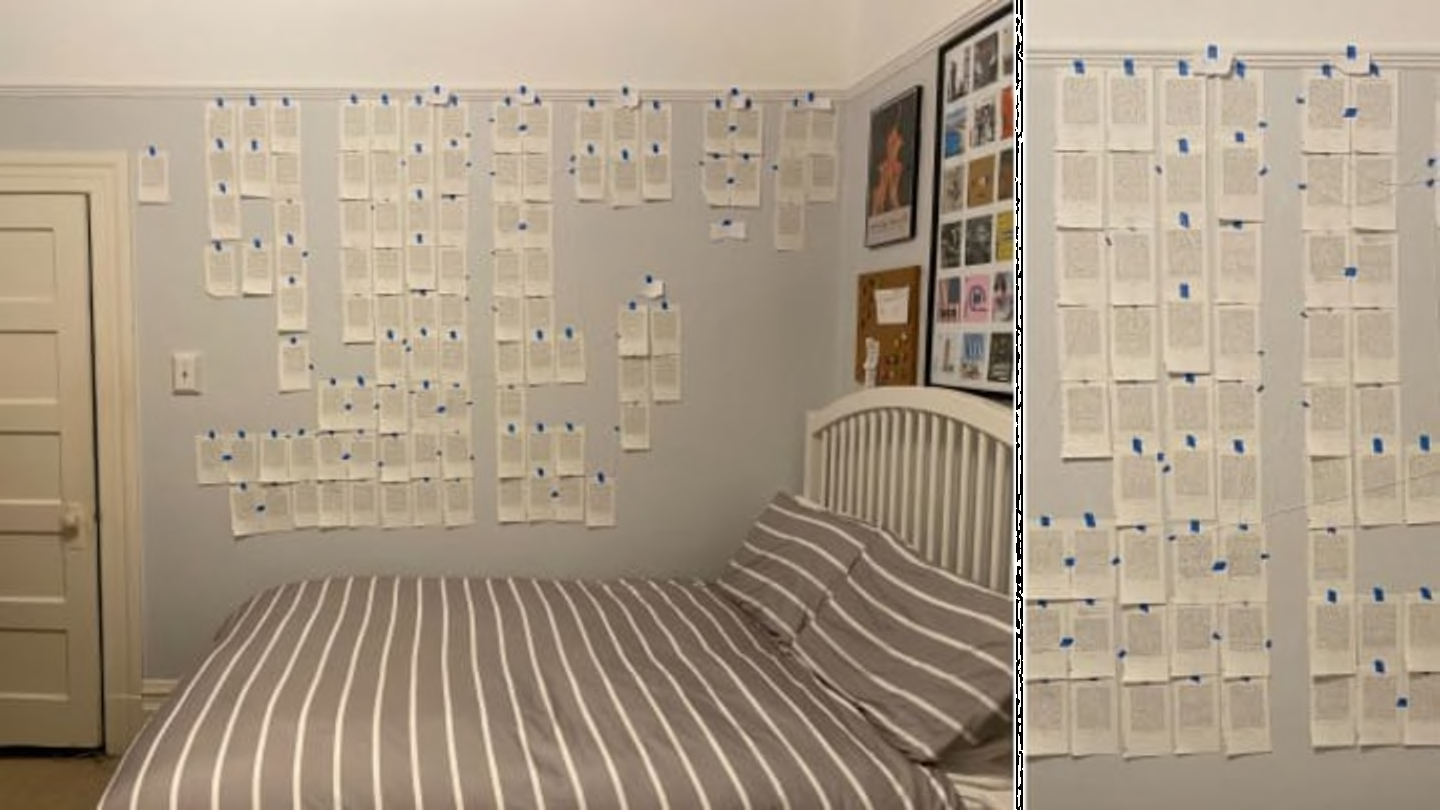
Sarah Scannell’s murder board. It takes up nearly an entire wall of her San Francisco apartment: 100 pages with torn edges, painstakingly taped up with blue painter’s tape in a pattern that only makes sense to Scannell. Maybe you’ve even watched it evolve—at first the pages were connected with white string, but Scannell has since adopted a more user-friendly color-coding scheme involving sticky index tabs.
Perhaps an interesting example of a murder board for J.D. Connor?
Two things are worth noting here: the nests and the non-linearity. The different layers are nested in structure. Hunches come together to form ideas which come together to form stories. But sequence only becomes critical in the top layers: stories, arguments, chapters. The different between the two stages is like the difference between the pushpin evidence board from The Wire — a scattered network of clues and potential connections—and a prosecutor’s closing statement in a criminal trial.
https://slate.com/news-and-politics/2022/02/fbi-crazy-stringboard-recruiting-campaign.html
As Phil Gyford, who runs a Tumblr named Crazy Walls dedicated to curating this trope, suggested: “For a police investigation, it makes visible all the suspects, evidence, and locations in a way that looks better than people standing in an empty room talking or looking at a computer screen. It’s a handy visual shorthand.”
“The NSC does use a board and yarn, but spends too much time meeting about what color yarn to use for it to ever work,” joked former National Security Council official Perry Blatstein.
Companies like Palantir and i2 Analyst’s Notebook have made a killing over the last 15 years selling link chart technologies to the intelligence community (even if, in the case of the former, the relationship has cooled).
The earliest version of it seems to have come from the 1979 BBC production of Tinker Tailor Soldier Spy, which had an understated series of red lines connecting photos to a calendar in one episode.
<small><cite class='h-cite via'>ᔥ <span class='p-author h-card'>Anne Ganzert</span> in (1) Anne Ganzert on Twitter: "@ChrisAldrich @gipperfish @jdconnor @vaultofculture This is early 17th century right? Nice! I always considered Aby Warburg my favorite „early adopter“ but this sounds great. One clear Warburg benefit: the Mnemosyne Atlas is still around and even digitized 👏🏻" / Twitter (<time class='dt-published'>01/16/2022 12:54:03</time>)</cite></small>
Surely you're already up on the work of @AnneGanzert? https://link.springer.com/book/10.1007%2F978-3-030-35272-1
Syndicated: https://twitter.com/ChrisAldrich/status/1424235840088133635
Bonus points to the first one who can publish with a serious reference to "Lines of Thought" by Ayelet Even-Ezra. https://press.uchicago.edu/ucp/books/book/chicago/L/bo63098990.html
Syndicated: https://twitter.com/ChrisAldrich/status/1424236570471636993
And finally, just for fun https://condenaststore.com/featured/the-conspiracy-board-brendan-loper.html
Syndicated: https://twitter.com/ChrisAldrich/status/1424236850902753281
ike Jungius, Boyle made use of loose folio sheets that he called memorials or adversaria; yet he did not worry too much about a system of self-referential relationships that enabled intentional knowl-edge retrieval. When he realized that he was no longer able to get his bearings in an ocean of paper slips, he looked for a way out, testing several devices, such as colored strings or labels made of letters and numeral codes. Unfortunately, it was too late. As Richard Yeo clearly noted, ‘this failure to develop an effective indexing system resulted from years of trusting in memory in tandem with notes’.69
69 Yeo, ‘Loose Notes’, 336
Robert Boyle kept loose sheets of notes, which he called memorials or adversaria. He didn't have a system of organization for them and tried out variations of colored strings, labels made of letters, and numerical codes. Ultimately his scrap heap failed him for lack of any order and his trust in memory to hold them together failed.
I love the idea of calling one's notes adversaria. The idea calls one to compare one note to another as if they were combatants in a fight (for truth).
Are working with one's ideas able to fit into the idea of adversarial interoperability?
A modern, enterprise-ready business intelligence web application.
Superset
RAW Graphs is an open source data visualization framework built with the goal of making the visual representation of complex data easy for everyone.
Spreadsheet Data Converter Tip: Paste data on the left, and get result below immediately.
Echarts tool um #Daten zu konvertieren
It's not everyday I get tagged (explicitly added as a meta-data tag) on someone's website, much less one as well-curated as this one.
Intro –> Verse Pre-Chorus –> Chorus Chorus –> Bridge Bridge –> Pre-Chorus
TRAILBLAZER-WORKFLOW is another dream ‘o mine come true. It allows creating long-term processes (or state machines) based on BPMN diagrams that can be modeled using our editor.
A major improvement here is the ability to maintain more than two explicit termini. In 2.0, you had the success and the failure termini (or “ends” as we used to call them). Now, additional ends such as not_found can be leveraged to communicate a non-binary outcome of your activity or operation.
Statecharts are a formalism for modeling stateful, reactive systems. This is useful for declaratively describing the behavior of your application, from the individual components to the overall application logic.
but I do you script on trading view. So treating you is great. Not only for the charts, but they also have an idea section and a script section.
but I want to look at it from different perspectives from the Elliott wave theory, from many different perspectives so I can save different charts based on those perspectives.
But I also, sorry, I also saved the individual coins. I save separate charts of them as well when I want to go dig deeper in it.
Uh, also treating, you seem to have this multi charts optionality option where you can show hr it's four to a whatever charts on one screen. They, um, they have seem to have like more advanced tools. I would say like now that I'm better at a ta and I know it more, I can, I have access to more options. MMM. They also show, I don't think when did she does this, but I know trading view shows, uh, equities and for acts and commodities. Like, sometimes I just want to pull up the chart and just see what it looks like.
Once he understood technical analysis, he was able to appreciate the multi-chart tools on trading view
Yeah, so I, for I first started with trading you and I pull up a trading. You have this option where you can split up the, uh, you can have one screen yet show eight different charts.
trading view*
Uh, but definitely on the, on the daily, it's always the chart. The chart is number one. Price action is the number one thing.
Um, yeah, definitely go to the home page of coin market cap. I'll take a look at the, they have like a seven day graph chart.
And so I basically, this trade has been, I've been following this chart very closely. I shorted around one 50, made a good, good profit off that and then kind of did initiated a very short, long because there's a descending triangle and I'm very close to that base kind of same concept as bitcoin. Just looking at the triangle.
basically use different charts, uh, for the same pairing because I want, you know, I want to look at it using elliot wave theory, then also using horizontal price levels.
l, yeah, so I basically had been following the big coin chart very closely and uh, I have, I use trading view, I use to map out the trades.
Uh, and then I will pull the trigger on a trade if it meets, you know, x number of indicators that justify me entering into a position that the cards are stacked in my favor. If I do not see, uh, uh, trade that meets the qualifications that I've kind of listed or if the overall market is not in a place where I think I'm comfortable entering into one, I don't need to trade that day. I'll start my day by looking at it to see if it makes sense to be looking to trade that day. But if I come to the conclusion that it doesn't make enough sense, I'll just stop looking at charts for the rest of the day and I won't, I
I've never used their charting once because it's not going to be to the level that trading view would be or the level of coinagy and coinagy pulls its trading or as charting from trading view.
I'm not sure if it, if you guys do as well, they just pull from trading views, uh, charting for
Um, but I like charting out patterns and things of that nature.
hich is a reason why I would use, you know, a charting solution, which would be a tradingview or coinagy.
it's, it's, it's more difficult for me to base trade specifically on just data.
Dua Lipa: Dua Lipa
VÖ: 2.6.2017
Charts: 3 Wochen
Stahlmann: Bastard
VÖ: 16.6.2017
Charts: 1 Woche
PA Sports: Verloren im Paradies
VÖ: 23.6.2017
Charts seit 30.6.2017
Santiano: Von Liebe, Tod und Freiheit [o]
VÖ: 29.5.2015
Charts: 103 Wochen Charts 2016: Platz 28 Charts 2015: Platz 6
SXTN: Leben am Limit
VÖ: 2.6.2017
Charts seit 9.6.2017
Lina: Official
VÖ: 27.5.2016
Charts seit 3.6.2016
Andreas Gabalier: Mountain Man [o]
VÖ: 15.5.2015
Charts seit 22.5.2015
Freundeskreis: Quadratur des Kreises
VÖ: 21.2.1997
Charts seit 7.7.1997
David Bowie: Cracked Actor (Live Los Angeles '74)
VÖ: 22.4.2017
Charts seit 23.6.2017
Les Brünettes: The Beatles Close-Up
VÖ: 16.6.2017
Charts seit 23.6.2017
Michael Patrick Kelly: Human [oo]
VÖ: 15.5.2015
Charts seit 22.5.2015
Portugal. The Man: Woodstock
VÖ: 16.6.2017
Charts seit 23.6.2017
Styx: The Mission
VÖ: 16.6.2017
Charts seit 23.6.2017
Fleet Foxes: Crack-Up
VÖ: 16.6.2017
Charts seit 23.6.2017
2raumwohnung: Nacht / Tag
VÖ: 16.6.2017
Charts seit 23.6.2017
Beth Ditto: Fake Sugar [oo]
VÖ: 16.6.2017
Charts seit 23.6.2017
Royal Blood: How Did We Get So Dark?
VÖ: 16.6.2017
Charts seit 23.6.2017
Iced Earth: Incorruptible
VÖ: 16.6.2017
Charts seit 23.6.2017
Nickelback: Feed The Machine
VÖ: 9.6.2017
Charts seit 23.6.2017
Michael Patrick Kelly: iD
VÖ: 16.6.2017
Charts seit 23.6.2017
Phil Collins: Singles
VÖ: 14.10.2016
Charts seit: 21.10.2016 / Charts 2016: Platz 79
OST: Fifty Shades Darker (Fifty Shades Of Grey 2: Gefährliche Liebe"
VÖ: 10.2.2017
Charts seit: 17.2.2017
Glashaus: Kraft
VÖ: 28.4.2017
Charts seit: 5.5.2017
Lindsey Buckingham / Christine McVie: Lindsey Buckingham / Christine McVie
VÖ: 9.6.2017
Charts seit: 16.6.2017
Gov't Mule: Revolution Come … Revolution Go
VÖ: 9.6.2017
Charts seit: 16.6.2017
Ana Thema: The Optimist
VÖ: 9.6.2017
Charts seit 16.6.2017
Katy Perry: Witness
VÖ: 9.6.2017
Charts seit 16.6.2017
Rise Against: Wolves
VÖ: 9.6.2017
Charts: seit 16.6.2017
Drake: More Life [oo]
VÖ: 18.3.2017
Charts: 12 Wochen
Rammstein: Made in Germany 1995–2011
VÖ: 2.12.2011
Charts: 99 Wochen
Adele: 25 [oo]
VÖ: 20.11.2015
Charts: 81 Wochen / 2016: Platz 6 / 2015: Platz 2
Sarah Connor: Muttersprache [ooooo]
VÖ: 22.5.2015
Charts: 106 Wochen / 2016: Platz 7 / 2015: Platz 3
Phillip Boa And The Voodooclub: Reduced! – A More Or Less Acoustic Performance
Reissue
Charts: 1 Woche
Jorn: Life On Death Road
VÖ: 2.6.2017
Charts: 1 Woche
OST: La La Land [ooo]
VÖ: 13.1.2017
Charts: 16 Wochen
Die Lochis: #zwilling [oo]
VÖ: 19.8.2016
Charts: 27 Wochen / 2016: Platz 49
The Rolling Stones: Blue & Lonesome [oooo]
VÖ: 2.12.2016
Charts: 27 Wochen / 2016: Platz 5
Vallenfyre: Fear Those Who Fear Him
VÖ: 2.6.2017
Charts: 1 Woche
Elif: Doppelleben
VÖ: 26.5.2017
Charts: 2 Wochen
Tim Bendzko: Immer noch Mensch [oo]
VÖ: 21.10.2016
Charts: 33 Wochen
Primal Fear: Angels Of Mercy – Live in Germany
VÖ: 2.6.2017
Charts: 1 Woche
Dan Auerbach: Waiting On A Song
VÖ: 2.6.2017
Charts: 1 Woche
All Time Low: Last Young Renegade
VÖ: 2.6.2017
Charts: 1 Woche
Flogging Molly: Life Is Good
VÖ: 2.6.2017
Charts: 1 Woche
Tankard: One Foot In The Grave
VÖ: 2.6.2017
Charts: 1 Woche
Kilez More: Alchemist
VÖ: 2.6.2017
Charts: 1 Woche
Bushido: Black Friday [o]
VÖ: 9.6.2017
Charts seit 16.6.2017
Roger Waters: Is This The Life We Really Want
VÖ: 2.6.2017
Charts seit 9.6.2017
bower_components
Ionic installs bower components (bower packages) into the project's lib folder:
www/lib
This behaviour is defined in the projects .bowerrc file, which looks like this:
{
  "directory": "www/lib"
}
The project .bowerrc file may be found at the same level as the www folder.
Note that if you install angular-chart this way, you don't need to install Chart.js separately; it is one of the dependencies that bower will install for you. Of course, you must include the script tag that references the Chart.js file as usual!
Finally, if you want to link angular-chart.css you must follow the same procedure.
Compose complex, data-driven visualizations from reusable charts and components with d3.
wykresy i grafy w javascript