<p></p>
Not totally sure why you have an open and closed paragraph tag.
<p></p>
Not totally sure why you have an open and closed paragraph tag.
<p class="footerheading">About us:</p>
You can use h tag instead of p.
<p class="latestp">Our Latest projects includes:</p>
You can change this to h2 tag.
<div class="main-div">
You may want to change this content to article and add h2 tag, so user can understand what the content describes.
<p>Created by Janelle 30/10/2022</p>
You can use small tag to make this sentence smaller.
<p><strong>They can be more professional.</strong> </p>
You can use h3 tag instead of strong tag.
<p><strong>Some of the images are too large and have no caption.</strong></p>
You can use h3 tag instead of strong tag.
<p><strong>The most noticeable areas are not the most important.</strong></p>
You can use h3 tag instead of strong tag.
<p><strong>There are too many sizes of font.</strong> </p>
You can use h3 tag instead of strong tag.
<p><strong>The most noticeable areas are not the most important.</strong> </p>
You can use h3 tag instead of strong tag.
<p><strong>The larger font size is not used for the heading</strong> </p>
You can use h3 tag instead of strong tag.
<strong>The page elements are too distracting</strong>
You can use h3 tag instead of strong tag.
<strong>The current link on the navigation menu is not clearly discernible</strong>
You can use h3 tag instead of strong tag.
<strong>The header is too large</strong>
You can use h3 tag instead of strong tag.
Changing the second line to: foo.txt text !diff would restore the default unset-ness for diff, while: foo.txt text diff will force diff to be set (both will presumably result in a diff, since Git has presumably not previously been detecting foo.txt as binary).
comments for tag: undefined vs. null:
Technically this is undefined (unset, !diff) vs. true (diff), but it's similar enough that don't need a separate tag just for that.
annotation meta: may need new tag: undefined/unset vs. null/set
MiguelAngelLópezRodríguez
FernandoMoctezumaSoto
Note: This repo does not publish or maintain a latest tag. Please declare a specific tag when pulling or referencing images from this repo.
<br
you can use list tag instead of using too more br tag
<br>
This tag is used very often.
Home
nav tag is good for list instead of p tag
<p class="rights1">Copyright © 2022. All rights reserved North Island College DIGITAL Design + Development </p>
A small tag would give more context to the function of the element
Kept in shorthand.
Both Jonathan and Mina keep their journals in shorthand, and yet what we read here is in complete sentences. And Dr. Seward's Diary is spoken into a phonograph. We are experiencing this text very differently from how it is created. We combined with the several posts that contain correspondence that was never opened by or delivered to the intended experience (see Unopened or Undelivered tag), there is much of this story that we experience differently from the characters within it.
<div class="image"> <img src="images/homepageheader.png" alt="homepage"> </div>
you don't actually need the div class= "image" also I think it's missing a closing tag.
<!--Fonts-->
This comment is a good idea. Just looks like a slight typo in the closing tag.
article
might wrap this in a header tag to indicate its your title section
p
missing its closing tag
<article class="homepageimagebox"> <img src="images/homepage.png" width="260" alt="photo of homepage"> </article>
I would pay attention to the semantic coding of this section. I'm not sure if a single image would make sense as an article, especially since article typically requires a heading. I would personally just tag it as a figure (that way you can also attach a caption in case it doesn't load) and if you're worried about styling apply a div.
Reviewer #2 (Public Review):
The goal of this study was to understand the molecular mechanism of how transcription factor DUX4, which has a role in cancer, inhibits the induction of genes stimulated by interferon-gamma. The authors achieved this goal, and their results mostly support their conclusions. They found that DUX4, in their experimental model, interacts with STAT1, thereby decreasing STAT1 and Pol-II recruitment to sites of gene transcription.
The present study has many strengths: The topic is of broad interest, the findings are novel and intriguing, the experiments are well-designed and controlled, the data, with one exception, is carefully interpreted, and the manuscript is very well-written.
Two major weaknesses were identified. One is that all experiments, except Figure 6, rely on one experimental setup, which is a human skeletal muscle cell line with an integrated doxycycline-inducible transgene. The concern is that both the treatment of cells with the drug doxycycline and the fact that signaling pathways could be disrupted in this (immortalized?) cell line could lead to artifacts that skew results. Indeed, results in Figure 4C indicate that total STAT1 is completely localized in the nucleus even prior to interferon stimulation when it should be in the cytoplasm. The other weakness is the use of the DUX4-C-terminal-domain (DUX4-CTD) mutant for the majority of the mechanistic experiments. The concern here is that although the phenotype of ISG repression is observed in this truncated mutant, important regulatory domains could be missing that modulate the interaction with STAT1 or other proteins. Is the NLS added after the flag tag identical to the endogenous NLS? Related, I disagree with the interpretation of Figure 4C that "this interaction happens within the nuclei of DUX4-CTC expressing cells". The interaction could happen prior to STAT1 shuttling to the nucleus.
Note: This preprint has been reviewed by subject experts for Review Commons. Content has not been altered except for formatting.
Learn more at Review Commons
This manuscript reports motility characteristics and load-bearing properties of three human kinesin-6 family proteins that function during late telophase/cytokinesis of mitosis. The authors report single molecule and multiple motor motility assays, and vesicle dispersion assays for the three motors. Because the kinesin motors are important for normal division, their motility characteristics are of interest to workers in the mitosis field. However, data presentation in this manuscript could be greatly improved, along with interpretations of functional differences based on kinesin-6 motility properties.
Major points are the following:
The criteria used for identifying fluorescent spots as single motors are not given. This is typically based on photobleaching experiments and fluorescence intensity measurements - the authors should show these data to validate that the motility reported is due to single motors.
A table should be included that shows the single molecule motility parameters that were analyzed and compared for the three motors, rather than just the dwell times for the assays shown in Fig. 1. Other motility characteristics should include run lengths, binding rates, detachment rates, and velocity. The percentage of time that the single motors move directionally, diffuse, or remain stationary should also be given.<br /> The authors refer to imaging rates (1 frame/50ms, p. 5), but do not state the total time of the assays, making the statements uninterpretable, as it is not clear what would be expected without knowledge of the total assay time. The authors also state that a slower imaging rate (1 frame/2 sec) was used to detect slow processive motility, but the logic underlying this statement is not clear, as a longer assay time should reveal the slow processive movement irrespective of the imaging rate. These statements should be clarified.<br /> The authors give the data for the dwell times in single motor assays and velocities in multiple motor assays as the mean + SEM, but the SD rather than SEM should be reported for these assays, given that the data are for individual single motors or individual gliding microtubules. The authors state the number of replicate experiments for the assays, but they should also state the number of data points that were obtained for each replicate. Further, they should evaluate the significance of differences in their data by giving P values obtained using appropriate statistical tests and indicate whether the differences among the motors are significant.<br /> The percentages of processive events (p. 5) are most likely dependent on the amount of inactive or denatured protein in a given preparation, rather than a motility property of the motor protein - this could be determined by analysis of whether the percentages differ from preparation to preparation of each motor and whether the mean+SD of the preparations of a given motor differs from the other motors. The statements by the authors on p. 8 that "the majority of proteins do not undergo unidirectional processive motility as single molecules but rather diffuse along the surface of the microtubule for several seconds" and "It is presently unclear why only a subset of kinesin-6 molecules are capable of directional motility (Figure 1 ..." are not meaningful, as they do not take into account the percentages of the kinesin-6 proteins that are inactivated or denatured during protein preparation.<br /> Again, given that inactive motors are produced during preparation of the proteins, it is not clear what the frequency of processive motility events means. If the authors think that the frequency of processive motility events is informative and a characteristic of each motor, they should present controls showing frequencies of processive motility events for specific well characterized motors. For example, does a control of kinesin-1 show 100% or only 95% processive motility events?<br /> For the multiple motor gliding assays, velocities are shown in Fig. 2 without controls demonstrating the dependence of the velocities on motor concentration in the assays - the gliding assays require dilution experiments to show that the velocities are within the linear range of motor concentration and do not fall within the range of higher concentrations in which motor gliding velocity is inhibited or lower motor concentrations in which the density of motors on the surface is too low to support processive movement. These control experiments of motor concentration vs velocity for the gliding assays should be shown for each of the three motors that was assayed. The authors should state whether the gliding velocities that were determined correspond to the Vmax for each of the motors that was assayed.
Again, the velocities given on p. 6 should include the SD and evaluation of the significance of the differences among the motors by obtaining P values.
Proteins for motility assays: Western blots of the purified proteins should be shown as a supplemental figure.
How are the motility characteristics of the three motors related to their spindle functions? This is the central point of the manuscript but is not clearly stated.
Given that the kinesin-6 motors under study are mitotic spindle motors that do not normally transport vesicles, it is not clear why the authors chose to show load dependence using peroxisome and Golgi dispersion assays, rather than assays of spindle function. The authors interpret peroxisomes and Golgi to differ in dispersion load, but this appears to be based on interpretations from assays of highly processive motors, kinesin-1 and myosin V, that function in vesicle trafficking, rather than quantitative data from appropriate controls showing that peroxisomes and Golgi can be dispersed by spindle motors that bear different loads. The problems inherent in the use of these assays for spindle motors are evidenced by the authors' observations on p. 6 that MKLP1- mNG-FRB and KIF20-mNG-FRB in midbodies could not be localized to peroxisomes by rapamycin. There are no data presented showing the dependence of dispersion on protein expression/presence in the cytoplasm, making the dispersion assays difficult to interpret.
The kinesin-6 motor functional tests would be more relevant if they involved mitotic spindle assays, rather than peroxisome or Golgi dispersion assays. It is not clear how the loads involved in peroxisome or Golgi dispersion are related to kinesin motor function in the spindle. What are the implications of low- vs high-load motors in the spindle? How do the authors envision that motor loads in spindles relate to loads borne by vesicle transport motors?
Minor points needed for clarity and reproducibility of the data:
Methods
Plasmids<br /> "MKLP1(1-711) lacks the insert present in KIF23 isoform 1" - the insert present in KIF23 isoform 1 but missing in MKLP1 (1-711) should be depicted/pointed out in Fig. S1 and information provided as to its predicted or actual structure.
"KIF20B contained the protein sequence conflict E713K and natural variations N716I and H749L "- the sites of these changes should be indicated in Fig. S1 and information provided as to their effects on predicted or actual structure.<br /> Protein purification: "MKLP1(1-711)-3xFLAG-Avi was cloned by stitching four oligonucleotide primer sequences together into a digested MKLP1(1-711)-Avitag plasmid" - please explain what this means: what do the four oligonucleotide primer sequences correspond to? if they are the 3xFLAG-Avi tags, why were four sequences stitched together instead of three?<br /> The figures showing the kymographs should include labeled X and Y axes, rather than scale bars.
The significance of the statement that "All motors displayed similar behaviors when tagged with Halo and Flag tags" is not clear, as the Halo and Flag tags were also C-terminal tags, like the 3xmCit tag.
The figures (Fig. 3-5) that contain grey-scale cell depictions would be more readily interpretable by others if they were labeled with the authors' classification of the dispersion phenotype.
This manuscript reports motility characteristics and load-bearing properties of three human kinesin-6 family proteins that function during late telophase/cytokinesis of mitosis. The authors report single molecule and multiple motor motility assays, and vesicle dispersion assays for the three motors. Because the kinesin motors are important for normal division, their motility characteristics are of interest to workers in the mitosis field. However, data presentation in this manuscript could be greatly improved, along with interpretations of functional differences based on kinesin-6 motility properties.
My expertise: motors, motor function in division, motility assays, microtubules
<p>All heading tags are working well but the hierarchy in the webpage is missing which is making the page unstructured. This is somehow missleading the viewers as they will not get the difference between headings and links.So, the mixure of headings and links seems irrelevant here. Instead, the headings could be managed either side of the page and links towards the oposite side. This will be east for the people to scroll the page to get information easily. Most importantly, the align attrribute in h3 tag is a wrong use. </p>
Because there is no maximum width specified, paragraph elements that are very long like this one show up as very long on the user's browser. This is not very readable.
<span>Comox Valley Lifeline Society</span> <p>Span tag is not necessary to use here. Instead simple heading tag could work here</p>
When you use <span> tags here as an example, they do not render on the user's browser. Character entities must be used if you want to display reserved characters like < and >. See this for more information.
<!--<p align="justify" class="plain">The Comox Valley Lifeline Society offers a variety of medical alert services designed specifically for older adults that provide fast, 24/7 access to expert help in an emergency. These services range from the standard HomeSafe service to the fall detection capability of the HomeSafe with AutoAlert and the freedom of the new GoSafe mobile service. </p>--> <ol> <li>There is again wrong use of align attribute in the paragraph tag</li>
When you talk about how they use the align attribute wrong, they can't see the code you're talking about.
<a href=
probably keeps the tag together.
a little flaw (Google translation can not find the translation of the word "瑕疵", so can only use the word "flaw" instead)
annotation meta: may need new tag: no exact translation in other language
so this means that there are no documentation telling you that this is the way you have to do it anywhere so naturally a lot of devs do not know about this, unless they ask about it by luck or of curiousity.
annotation meta: may need new tag: how could they know / how would one find out?
the css part is done very great and they have right space in between the codes , like we can easily see the each tag and what is used in it. i also saw new thing like we can use h1,h2 tags combine and edit it together
.<p>
This has to be a close tag.
i loved it how you write the code its very clean and easy to read and every tag is used appropriate.
</li> <li>Use the 60-30-10 rule to balance the three colours.</li>
You might want to consider consistency in formatting. In the first one the closing tag of list item is placed on a new line and in the next one it is placed right after the content.
Given your talents, if you've not explored some of the experimental fiction side of things (like Mark Bernstein's hypertext fiction http://www.eastgate.com/catalog/Fiction.html, Robin Sloan's fish http://www.robinsloan.com/fish/ or Writing with the Machine https://www.robinsloan.com/notes/writing-with-the-machine/, or a variety of others https://hypothes.is/users/chrisaldrich?q=tag%3A%22experimental+fiction%22), perhaps it may be fun and allow you to use some of your technology based-background at the same time?
One can’t help but notice the proliferation of specific method names for slightly different practices within the now growing space. These specific names for practices literally give both a name and power to the space and help to make it grow. Some of these names include: Zettelkasten itself as a name for Luhmann’s method; Smart Notes (Sönke Ahrens’ delineation of Luhmann’s method, Linking Your Thinking (aka LYT, Nick Milo’s method); Building a Second Brain (BaSB, Tiago Forte’s method); ANTInet (Scott P. Scheper’s analog branded version of Luhmann’s method); and even Pile of Index Cards (PoIC, Hawk Sugano’s productivity-based method from 2006). The naming tends to expand here as many of these examples have a commercial need to differentiate these practices to make them sellable to a larger audience. Should one really consider it a coincidence that Obsidian is so heavily used by those in Tiago Forte’s Building a Second Brain camp when Obsidian’s tag line on their home page boldly declares “A second brain, for you, forever.”? This naming craze even extends to a proliferation of names for note types within each system including fleeting notes, permanent notes, literature notes, atomic notes, evergreen notes, source notes, point notes, concept notes, claim notes, etc. Of course the power of naming begins to wane here as the over-proliferation of names causes semantic collisions and worries when these systems and their adherents talk about related ideas online in broader overlapping publics. One would presume that over time this list of names will settle down and roughly standardize around a much smaller (dare I say atomic?), possibly mutually exclusive set.
Another example of marketing serving badly for the concepts being easily studied and used. Positioning and differentiation backfires here. Lack of sources linking is a huge issue in a popular non-fiction.
XML is not limited to a specific set of tags, because a single tag set would not adapt to all documents or applications that may use XML.
Unlike HTML XML is more useful and flexible when adapting to other applications while HTML is restricted to only one set of tags
The problem is that the caller may write yield instead of block.call. The code I have given is possible caller's code. Extended method definition in my library can be simplified to my code above. Client provides block passed to define_method (body of a method), so he/she can write there anything. Especially yield. I can write in documentation that yield simply does not work, but I am trying to avoid that, and make my library 100% compatible with Ruby (alow to use any language syntax, not only a subset).
An understandable concern/desire: compatibility
Added new tag for this: allowing full syntax to be used, not just subset
Definable grammars for pattern matching and generalized string processing
annotation meta: may need new tag: "definable __"?
Note: This rebuttal was posted by the corresponding author to Review Commons. Content has not been altered except for formatting.
Learn more at Review Commons
We would like to thank the Reviewers for their valuable comments and constructive suggestions concerning our manuscript entitled " Drosophila pVALIUM10 TRiP RNAi lines cause undesired silencing of Gateway-based transgenes" (RC-2022-01629).
Please find below our responses to the Reviewers' questions and comments. We have revised the Manuscript following the Reviewers' suggestions. The changes in the Manuscript are indicated in blue.
Reviewer #1 (Evidence, reproducibility and clarity (Required)): ____ This manuscript by Uhlirova and colleagues identified an unwanted off-target effect in the pVALIUM10 TRiP RNAi lines that are commonly used in the fly community. The pVALIUM10 lines use long double-stranded hairpins and are useful vectors for somatic gene knock-down, hence they are widely used.
Here the authors find that any pVALIUM10 TRiP RNAi line can create the silencing of any transgenes that were cloned with the commonly used Gateway system. this is caused by targeting attB1 and attB2 sequences, which are also present in other Drosophila stocks including the transgenic flyORF collection. Hence, this is an important and useful information for the fly community that should be published quickly. All experiments are well documented and well controlled. I only have a few minor comments.
I recommend to mention the number of 1800 pVALIUM10 lines in Bloomington in the abstract rather than 11% to make clear that this is an important number of lines. (1800 of 13,698 lines in Bloomiongton are 13 and not 11 per cent?)
We now include the absolute number of pVALIUM10 lines in the manuscript abstract. The percentages have been corrected. Furthermore, we updated/corrected the total number of RNAi lines available from various stock centers in the Discussion, L153-L156.
The status on 23.10.2022
VDRC - 23,411 in total (12,934 GD lines; 9,674 KK lines; 803 shRNA lines)
Bloomington - 13,410 TRiP lines based on pVALIUM vectors (13,674 in total, including 264 non-pVALIUM, and 48 non-fly genes targeting lines)
NIG - 12,365 in total (5,676 TRiP lines; 7,923 NIG RNAi lines)
The authors may consider to call the 'unspecific' silencing effect an 'off-target' effect compared to intended 'on-target'. Such a nomenclature would be more consensus.
We changed the wording in the manuscript as suggested by the reviewer.
Ideally, all the imaging results in Figure 2 and 3 would be quantified. The simple 'V10' label in the Figure 3L and 3M is not the most intuitive, at least it took me a while to figure out what the authors compare.
The labeling in the charts has been changed. We now provide quantifications for the data shown in Figure 2 and 3.
Does the silencing also affect attR sequences? These are present after cassette exchange in many transgenes, most of the time not in the mRNA though, so it might not be so relevant.
A 22 nucleotide stretch of the attB2 site indeed shows a 100% match to the attL2 site. See the example alignment below (availbale in word/PDF version of the Letter). While we did not assess this possibility experimentally, attL sites would likely be susceptible to the same undesirable off-target silencing effects if present in the nascent or mature transcript.
Reviewer #1 (Significance (Required)): This is an important and useful information for the fly community that should be published quickly.
Reviewer #2 (Evidence, reproducibility and clarity (Required)): ____ Stankovic, Csordas, and Uhlirova show that a specific subset of the TRiP RNAi lines available, namely the pVALIUM10 subset, can cause a knockdown of certain co-expressed transgenes that contain attB1 and attB2 sites. The authors demonstrate that while pVALIUM20 or Vienna KK lines for BuGZ or myc RNAi do not affect RNase H1:GFP expression, pVALIUM10 RNAi lines against BuGZ or myc significantly decrease expression of the RNAseH1:GFP transgene. The authors propose that, due to how these RNAi lines were constructed, the siRNA products could be targeting to attB1 and attB2 sites in transgenes that were made using similar methodology. To support this idea, they ubiquitously express mCherry transgenes encoding mRNAs either containing or lacking attB sites. They find that the knockdown of mCherry seen with several different pVALIUM10 RNAi lines is observed with the reporter mRNA containing attB sites, but is suppressed when the attB sites are removed from mCherry mRNA. They also find that the pVALIUM10 RNAi lines reduce the expression of the FlyORF transgene SmD3:HA.
The paper is very clearly written and the data presented is convincing.
Minor suggestions:
1. Figure 3 L+M The labels for the ubi-mcherry and ubiΔattb-mcherry are switched in these graphs (i.e. ubiΔattb-mcherry should be the one with a higher intensity in the pouch compared to the notum).
Figure 3M the labels don't match the RNAi lines used in H-K.
We corrected the labelling in the charts.
Figure 2 and 3. For the images of the transgenes, it seems as if the BuGZ RNAi line has a more drastic effect on RNaseH1 than mCherry, and vice versa for the myc RNAi lines. Did the authors notice a pattern with the decreased expression. Do some of the RNAi lines have a more consistent/severe impact, or might different transgenes be impacted to different extents?
Throughout the study and multiple experimental trials, we did not observe that the BuGZRNAi and mycRNAi silencing efficiency would depend on whether the monitored reporter was RNase H1::GFP or mCherry. What has been reproducible is the differential impact of the three tested mycRNAi lines on ubi-RNaseH1::GFP transgene. While pVALIUM10-based mycRNAi[TRiP.JF01761] reduces RNaseH1::GFP signal Valium20 mycRNAi[TRiP.HMS01538] enhances it and GD mycRNAi[GD2948] has no effect, although the number of replicates for the latter is lower compared to the other tested lines. Why Valium20 mycRNAi[TRiP.HMS01538] increases RNaseH1::GFP signal remains unclear for now.
We would like to refrain from directly quantitatively comparing the effects of phenotypically different RNAi lines on differently tagged mRNAs/proteins. As the RNAseH1::GFP fusion protein is nuclear while the mCherry is cytoplasmic, their distinct subcellular localization and/or turnover rate may give a different overall impression on the change in fluorescence intensity (Boisvert et al, 2012; Mathieson et al, 2018). Another confounding factor is the described roles of Drosophila Myc in regulating transcription, translation, and cell growth (Gallant, 2007).
Line 150 unnecessary comma after Both Line 131 knockdown should be knocked down Line 133 should be "using an additional" Figure legend 1 wing disc should be at least written out when the abbreviation (WD) is first used.
We thank the reviewer for pointing these out, the relevant corrections were performed.
Reviewer #2 (Significance (Required)):
Overall, this manuscript is an informative reminder that RNAi lines can have weaknesses that have not yet been considered, and we appreciate the authors work to inform the fly community about this specific issue. These insights are crucial for fly labs to consider when planning experiments that will use the pVALIUM10 RNAi lines in combination with other transgenesis modalities. The manuscript also provides a cautionary note for the usage of similar resources in other model organisms.
Reviewer #3 (Evidence, reproducibility and clarity (Required)): Summary: In their manuscript "Drosophila pVALIUM10 TRiP RNAi lines cause undesired silencing of Gateway-base transgenes", Stankovic et al. describe off-target silencing of transgenes expressed from Gateway systems when expressed in transgenic RNAi drosophila lines from the VALIUM10 collection. Using fluorescence microscopy and immunostaining, the authors show that this unintended silencing is specific to VALIUM20 lines and is not observed with VALIUM20, KK or GD lines that also allow gene-specific RNAi silencing. This pleiotropic silencing effect was observed in 10 different VALIUM20 lines and affected Gateway-based transgene expressed from an ubiquitous promoter (poly-ubiquitin, ubi) or from Gal4/UAS systems. Finally, the authors identify the molecular basis of VALIUM20 pleiotropic silencing on Gateway transgenes as being due to the presence of short sequences used for PhiC31-based recombination in the Gateway and the VALIUM systems, and could lead to the production of siRNAs against PhiC31 recombination sites in VALIUM10 lines. Using Gateway transgenes lacking the recombination sites (attB1 and attB2), the authors could abrogate silencing of the transgene in VALIUM10 lines, confirming the recombination as shared targets between the Gateway and the VALIUM systems.
Major comments: - The study is well designed and the key conclusions are convincing. - However, the authors provide only fluorescence microscopy data to show decreased transgene expression. To confirm pleiotropic RNAi effect on Gateway transgenes in VALIUM10, the authors should assess silencing with another technique. For instance, expression levels of proteins from Gateway transgenes could be measured by Western blot (e.g.: by assessing protein levels of GFP or other tags present in the Gateway transgenes).
In the manuscript, we present microscopy data as this is the typical use case for fluorescent reporters. The strength of the microscopy, in contrast to Western Blot or RT-qPCR approach, is that it allows us to directly compare the impact of RNAi silencing on cells that express the dsRNA transgene (cell-autonomous) to surrounding neighbor cells. The fluorescent imaging of WDs where all cells express the reporter construct, but only a subset of cells trigger RNAi-mediated silencing, provides spatial resolution and means for normalization while minimizing artifacts that can arise during tissue processing for WB and RT-qPCR. We provide data on GFP and HA-tagged transgenes, respectively, and untagged mCherry expressed from Gateway vectors under ubiquitin or UAS regulatory sequences with the explicit reason to show that the silencing effect is independent of the type of the protein tag or the expression regulator sequence.
In addition, the claim on line 141,"These results strongly indicate that the dsRNA hairpin produced from pVALIUM10 RNAi vectors generates attB1- and attB2-siRNAs" , should be modified. The authors only present fluorescence microscopy data to show decreased transgene expression and do not actually provide data on siRNA expression in the pVALUM20 lines. Therefore, with the current data, the authors should only say that their results suggest that the dsRNA hairpin produced from pVALIUM10 RNAi vectors generates attB1- and attB2-siRNAs.
In order to substantiate their claim about pleiotropic RNAi effects from VALIUM lines on Gateway transgenes due to the production of attB1- and attB2 -siRNAs, the authors should perform an experiment to show attB1- and attB2 -siRNAs production in VALIUM10 lines and not in VALIUM20, KK or GD lines. Deep-sequencing analysis of siRNA (i.e.: miRNA-seq) from tissue expressing the corresponding RNAi transgenes would be an excellent approach to assess siRNA production in multiple samples at once. Alternatively, the authors could search published miRNA-seq datasets from VALIUM10 and other RNAi lines to assess the presence of attB1- and attB2 -siRNAs only in VALIUM10 lines. This would be free and require only a few days of data mining and analysis, if such datasets exist already. Another cheaper and faster approach (if lacking easy access to sequencing platform or bioinformatics capability) would be to perform small RNA northern blots analysis from fly tissues expressing VALIUM10 vs VALIUM20 (or KK or GD lines) and should take only a few days to do as described in doi: 10.1038/nprot.2008.67.
If such experiments or analyses cannot be performed, then the authors can only conclude that their data suggest that the unintended silencing of Gateway transgenes in VALIUM10 is likely due to the production attB1- and attB2 -siRNAs production.
We thank the reviewer for the valuable suggestions on experimental approcahes to identify the exact interfering RNAs produced by the VALIUM10-based RNAi constructs, which can be useful for controlling the specificity of knockdown of transgenes in studies using the resources mentioned in this report.
We believe the fluorescence micrographs and quantifications demonstrate the off-target silencing effects of pVALIUM10-based RNAi lines on transgenic reporters generated using the Gateway LR cloning approach. Furthermore, we provide genetic evidence that removing the attB1 and attB2 sites from the reporter construct, which is otherwise identical to the original transgene (same promoter, same position of insertion, same genetic background), is sufficient to abolish the off-target effect. We would argue that the functional genetic experiments we performed with the original and mutated reporters represent the strongest possible evidence to confirm that silencing is taking effect via the attB sites.
As we do not attempt to detect siRNA complementary to attB1/attB2 sites directly, we have changed the statements in question as per the recommendation of the reviewer.
- The current data and methods are adequately detailed and presented, and the statistical analysis adequate.
Minor comments:
- The current manuscript does not have specific experimental issues.
- Prior studies are referenced appropriately
- Overall the text and figures are clear and accurate except for the following issues with Figure 3 and its legends On lines 396, 397, 399 and 403, the authors refer to "wild-type" ubi-mCherry. This transgene directs the ubiquitous expression of an heterologous reporter gene and thus can not as "wild type". It could instead be referred to as the "original" or "unmodified" transgene.
We removed "wild-type" from the text.
Fig.3 L: the x-axis labels are wrong. Decrease in the mCherry intensity ratio is observed with the ubi-mCherry construct and not in the ubi∆attB-mCherry, where the attB sequences thought to be targeted by the pVALIUM10 have been deleted.
More space should be added between the first row of images (B-G), the second (H-L) and also the third (M-P) to avoid confusion between the labeling of the figures. Finally, to help contextualize their findings and gauging the extent of the risk of using VALIUM10 lines in RNAi screen where a Gateway transgene is involved, the authors could provide information on the overlap between the VALIUM10 collection and VALIUM20, GD and KK collections. Knowing how many genes are uniquely targeted by VALIUM10, could be helpful.
We corrected the Figure panels according Reviewer 1 and 3’s observation.
Of the TRiP pVALIUM-based RNAi stocks currently available in BDSC, 686 genes are targeted exclusively by pVALIUM10 RNAi lines. Considering KK, GD and shRNA transgenic lines from VDRC and NIG RNAi collection, 17 genes remain unique targets for pVALIUM10 lines. The graphical overview of the availbale lines is availbale in the word/PDF file of the Response to Reviewers Letter.
Reviewer #3 (Significance (Required)):
- The manuscript "Drosophila pVALIUM10 TRiP RNAi lines cause undesired silencing of Gateway-base transgenes" by Stankovic et al. is a technical study that sheds light on potential limitations of using common RNAi drosophila lines, namely the VALIUM10 collection.
- The study provides information about very specific genetic screens conditions in Drosophila, that are likely to be rare. A rapid Pubmed search with the following terms: "drosophila TRiP screen" returns only 11 citations, while a similar search with "drosophila CRISPR screen" returns 99 citations. This suggests that in vivo RNAi screen in Drosophila using TRiP RNAi collections might not be as common or powerful as CRISPR-based screens.
- The reported findings might be of interest mostly to a small group of scientists working with Drosophila melanogaster that specifically rely on VALIUM10 lines to perform in vivo RNAi screen in combination with Gateway transgene expression. This very specific combination of parameters is rare, since other RNAi fly stock collections exist (e.g.: VALIUM20, 21, KK, GD...). Furthermore, the advent of CRISPR tools that allows tissue-specific gene knock-out has led to the rapid expansion of CRISPR fly stock collections (https://doi.org/10.7554/eLife.53865). Regardless of the limited scope of the study, this kind information is still valuable, albeit to a very limited audience.
- My relevant fields of expertise for this study are : insect RNAi, RNAi of RNAi screens and drosophila genetics.
We would like to raise some points concerning the above comments.
While TRiP-screen may not be an often-used keyword combination, the use of the TRiP lines is, in fact, ubiquitous in the Drosophila community. The tissue-specific RNA interference is still commonly utilized as a rapid, first-generation screening method that can be performed in a tissue-specific manner, representing one of the key advantages of the Drosophila model. To illustrate, since the submission of our manuscript a new study published by Rylee and co-workers investigated Drosophila pseudopupil formation by screening 3971 TRiP RNAi lines (Rylee et al, 2022). In contrast, genetic screens relying on mutant alleles usually require at least one additional cross, effectively doubling the time of the experiment. In addition, tissue-specific or temporarily restricted knockdown is sometimes required in screens, as full-body loss of function is often lethal or has developmental phenotypes incompatible with assessing gene function later in life.
The use of tissue-specifically driven Cas9 with integrated gRNA-expressing vectors is indeed becoming more common. However, this technique, much like RNA interference, is not without flaws. First, this produces knockout instead of knockdown, which means it has to be induced early in order for the resulting mutation to take effect. Otherwise, the remaining mRNA/protein may prevent the development of a phenotype. Second, the Cas9 must be titrated as high Cas9 levels have adverse phenotypes (Huynh et al, 2018; Meltzer et al, 2019; Poe et al, 2019; Port et al, 2014). Third, in our personal experience, as well as literature reports (Mehravar et al, 2019; Port & Boutros, 2022), indicate that the resulting phenotype can produce mosaics in the tissue.
Although the combination of Gateway-based reporters with TRiP-RNAi lines may seem like a fringe case, there are popular reporters that could be screening targets. Potentially the most well-known is the live cell cycle indicator fly-FUCCI system (Zielke et al, 2014), which allows the analysis of the cell cycle in real-time thanks to the expression of two fluorescently tagged degrons. As FUCCI transgenes were constructed with Gateway recombination, they represent targets of the pVALIUM10 TRiP lines. We now include the fly-FUCCI system as an example in addition to 3xHA-tagged FlyORF collection in the Discussion.
REFERENCES
Boisvert FM, Ahmad Y, Gierlinski M, Charriere F, Lamont D, Scott M, Barton G, Lamond AI (2012) A quantitative spatial proteomics analysis of proteome turnover in human cells. Mol Cell Proteomics 11: M111 011429
Gallant P (2007) Control of transcription by Pontin and Reptin. Trends Cell Biol 17: 187-192
Huynh N, Zeng J, Liu W, King-Jones K (2018) A Drosophila CRISPR/Cas9 Toolkit for Conditionally Manipulating Gene Expression in the Prothoracic Gland as a Test Case for Polytene Tissues. G3 (Bethesda) 8: 3593-3605
Mathieson T, Franken H, Kosinski J, Kurzawa N, Zinn N, Sweetman G, Poeckel D, Ratnu VS, Schramm M, Becher I et al (2018) Systematic analysis of protein turnover in primary cells. Nature Communications 9: 689
Mehravar M, Shirazi A, Nazari M, Banan M (2019) Mosaicism in CRISPR/Cas9-mediated genome editing. Developmental Biology 445: 156-162
Meltzer H, Marom E, Alyagor I, Mayseless O, Berkun V, Segal-Gilboa N, Unger T, Luginbuhl D, Schuldiner O (2019) Tissue-specific (ts)CRISPR as an efficient strategy for in vivo screening in Drosophila. Nature Communications 10: 2113
Poe AR, Wang B, Sapar ML, Ji H, Li K, Onabajo T, Fazliyeva R, Gibbs M, Qiu Y, Hu Y et al (2019) Robust CRISPR/Cas9-Mediated Tissue-Specific Mutagenesis Reveals Gene Redundancy and Perdurance in Drosophila. Genetics 211: 459-472
Port F, Boutros M (2022) Tissue-Specific CRISPR-Cas9 Screening in Drosophila. In: Drosophila: Methods and Protocols, Dahmann C. (ed.) pp. 157-176. Springer US: New York, NY
Port F, Chen HM, Lee T, Bullock SL (2014) Optimized CRISPR/Cas tools for efficient germline and somatic genome engineering in Drosophila. Proc Natl Acad Sci U S A 111: E2967-2976
Rylee J, Mahato S, Aldrich J, Bergh E, Sizemore B, Feder LE, Grega S, Helms K, Maar M, Britt SG et al (2022) A TRiP RNAi screen to identify molecules necessary for Drosophila photoreceptor differentiation. G3 Genes|Genomes|Genetics: jkac257
Zielke N, Korzelius J, van Straaten M, Bender K, Schuhknecht GFP, Dutta D, Xiang J, Edgar BA (2014) Fly-FUCCI: A versatile tool for studying cell proliferation in complex tissues. Cell Rep 7: 588-598
Impact Materials define what interactions will occur when an object interacts with the tags defined in the Impact Tag Library
-- the Impact Tag Library is where we define the list of tags for our materials.
i.e.: Plastic, Glass, Concrete...etc
The first field is an Impact Tag Library which is used to display a user-friendly dropdown for the tag or tag mask. The second field represents the actual value of the tag or tag Mask
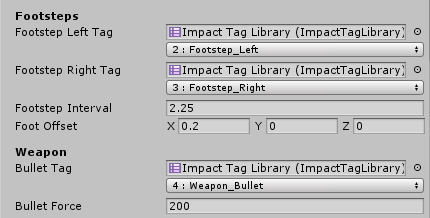
Just remember that under the hood tags are represented only by integers, so using multiple tag libraries with different tag names does not mean you can have more than 32 tags.
Tags
Actualmente, el nacionalismo es más una reivindicación de autonomía fiscal y autogobierno que deseo real de un estado independiente
DESPUES DE LA GUERRA
surgen numerosos grupos denominados Movimiento de Liberación Naciona
DURANTE LA GUERRA
href="https://fonts.googleapis.com/css2?family=Roboto&display=swap" rel="stylesheet"> <!-- google font--> <link href="https://fonts.googleapis.com/css2?family=Noto+Sans&display=swap" rel="stylesheet">
Added 3 different google fonts in the head section by the tag LINK
<h2>Meet the Team</h2>
i think you have to put this in h1 tag and make it more bold
Reviewer #1 (Public Review):
This paper has many strengths that support its conclusions. Specifically, the use of natively expressed Piezo1 engineered to carry the HA tag allowed the authors to explore the distribution of the protein from primary cells isolated from a mouse at native expression levels. Thus, over-expression effects could be avoided. The super-resolution imaging is nicely controlled and convicting in its analysis of the distribution of the channel in 3D. The supporting EM data also supports the findings from fluorescence. Likewise, the theory is convincing in proving a mechanistic reason why the channel distributes into this region of the cell. While the data are quite nice and well analyzed, the paper is lacking in an exploration of what function this distribution of the channel would provide to the cell. Likewise, if this distribution was disturbed, would the red blood cell's behavior change? For example, would calcium signals in response to an osmotic challenge or squeezing change if the channel was not concentrated in the dimple? As it stands now, the paper presents a structural view of the distribution of piezo1 in a primary cell plasma membrane but lacks direct experimental evidence for the mechanism of this concentration or mechanistic insight into the effects of this spatial distribution on red blood cell physiology.
<p>Located in the heart of the Comox Valley, Hairpins Boutique Salon offers a high-end experience with competitive prices, top of the line products and a warm, welcoming atmosphere.</p>
The individual element tags can be formatted as
opening tag
content
closing tag
for better readability.
</a >
This closing tag can be together for better readability.
/>
Closing tag not required. Everything else seems perfect.
/>
closing tag not required for img.
<address> <b>Hairpins Boutique Salon </b> <br/> #4 - 224 6th Street<br/> Courtenay, BC V9N 1M1<br/> </address>
Had no idea there was an address tag. Good use of proper semantic labelling.
headline
Alt tag should contain information describing image
Live Breaking UK
Having all of these as H4 will not allow individual styling. Try enclosing each in a span or button tag then you can add background colour to each.
rc="images/rum2.jfif
make sure to add alt tag
<br />
The <br /> tag showed warning for me when I tried to validate my code. So I used <br>.. Everything else looks great.
EAD makes use of a tag structure that identifies the components of a document. Each component or part is identified, and noted through the encoding. Because EAD is an application of XML, EAD utilizes the concepts of tags, elements, and attributes for encoding text.
From my understanding, EAD is used only for archival files, and uses the components mentioned before.
What is a Tag?
Tags must be correctly spelled and in the right position for them to work. A combination of tags cannot be used. This means that beginning tags cannot be used with empty tags or closing tags.
First and foremost, we need to acknowledge that even though the funding goal has been met–it does not meet the realistic costs of the project. Bluntly speaking, we did not have the confidence to showcase the real goal of ~1.5 million euros (which would be around 10k backers) in a crowdfunding world where “Funded in XY minutes!” is a regular highlight.
new tag: pressure to understate the real cost/estimate
Memorization is not about a language, rather about a feeling you have about information. In other words, how deep it resonates with your life. In this sense, I was also exploring the idea that having an Antinet Zettelkasten is almost like having a "diary", not for your personal feelings or emotions, rather for exploring the way in which your entire mind and heart work together over the years in which we discover the world. For me, exploring subjects and studying is an internal discovery.
in reply to los2pollos<br /> https://www.reddit.com/r/antinet/comments/y5un81/comment/it4jy3c/?utm_source=reddit&utm_medium=web2x&context=3
You're not the only one to think of a card index as diary. Roland Barthes practiced this as well. His biographer Tiphaine Samoyault came to call it his fichierjournal.
<br>Contact us today to book an appointment!<br> <a href="contact.html">Contact Us</a> </main> <footer> Content taken from <a style="color: green" href="https://www.hairpins.ca/" >https://www.hairpins.ca</a >. Used for educational purposes only. </footer> <!--an inline style rule in anchor tag above--> </body>
nice work
In the second case, checking “Connection” in my Index would lead me to this card. I might then compare this thought to others that use the same keyword, to see how it supports or modifies the idea of connection.
The reliance upon tag-like keywords in physical note-taking of this type seems to be a limitation compared to digital systems that allow full text search. That said, the benefits of full text search might be somewhat overblown, as found search terms say nothing of the context and would need either tags or a quick read of the text to provide that context.
Skip to content In this repository All GitHub ↵ Jump to ↵ No suggested jump to results In this repository All GitHub ↵ Jump to ↵ In this organization All GitHub ↵ Jump to ↵ In this repository All GitHub ↵ Jump to ↵ Dashboard Pull requests Issues Codespaces Marketplace Explore Sponsors Settings caitgarland Sign out New repository Import repository New gist New organization Sorry, something went wrong. / ... / nic-dgl103-f22 / assignment-c-dlu-... / Clear Command Palette Tip: Type # to search pull requests Type ? for help and tips Tip: Type # to search issues Type ? for help and tips Tip: Type # to search discussions Type ? for help and tips Tip: Type ! to search projects Type ? for help and tips Tip: Type @ to search teams Type ? for help and tips Tip: Type @ to search people and organizations Type ? for help and tips Tip: Type > to activate command mode Type ? for help and tips Tip: Go to your accessibility settings to change your keyboard shortcuts Type ? for help and tips Tip: Type author:@me to search your content Type ? for help and tips Tip: Type is:pr to filter to pull requests Type ? for help and tips Tip: Type is:issue to filter to issues Type ? for help and tips Tip: Type is:project to filter to projects Type ? for help and tips Tip: Type is:open to filter to open content Type ? for help and tips We’ve encountered an error and some results aren't available at this time. Type a new search or try again later. No results matched your search Top result Commands Type > to filter Global Commands Type > to filter This Page Files Pages Access Policies Organizations Repositories Issues, pull requests, and discussions Type # to filter Teams Users Projects Modes Use filters in issues, pull requests, discussions, and projects Search for issues and pull requests # Search for issues, pull requests, discussions, and projects # Search for organizations, repositories, and users @ Search for projects ! Search for files / Activate command mode > Search your issues, pull requests, and discussions # author:@me Search your issues, pull requests, and discussions # author:@me Filter to pull requests # is:pr Filter to issues # is:issue Filter to discussions # is:discussion Filter to projects # is:project Filter to open issues, pull requests, and discussions # is:open nic-dgl103-f22 / assignment-c-dlu-RaviPunia Private Unwatch Stop ignoring Watch 0 Notifications Participating and @mentions Only receive notifications from this repository when participating or @mentioned. All Activity Notified of all notifications on this repository. Ignore Never be notified. Custom Select events you want to be notified of in addition to participating and @mentions. Get push notifications on iOS or Android. Custom Custom Select events you want to be notified of in addition to participating and @mentions. Issues Pull requests Releases Discussions Discussions are not enabled for this repository Security alerts Apply Cancel Fork 0 Starred 0 Star 0 Code Issues 0 Pull requests 0 Actions Projects 0 Security Insights More Code Issues Pull requests Actions Projects Security Insights Open in github.dev Open in a new github.dev tab Permalink main Switch branches/tags Branches Tags View all branches View all tags Name already in use A tag already exists with the provided branch name. Many Git commands accept both tag and branch names, so creating this branch may cause unexpected behavior. Are you sure you want to create this branch? Cancel Create assignment-c-dlu-RaviPunia/index.html Go to file Go to file T Go to line L Copy path Copy permalink This commit does not belong to any branch on this repository, and may belong to a fork outside of the repository. RaviPunia Final code Latest commit 3fef99d 4 days ago History 2 contributors Users who have contributed to this file 101 lines (92 sloc) 3.43 KB Raw Blame Edit this file E Open in github.dev . Open in GitHub Desktop Open with Desktop View raw Copy raw contents Copy raw contents Copy raw contents Copy raw contents View blame <!DOCTYPE html> <html lang="en"> <head> <!-- DGL 103 DLU1 - Ravi Punia - Assignment C --> <meta charset="UTF-8"> <meta http-equiv="X-UA-Compatible" content="IE=edge"> <meta name="viewport" content="width=device-width, initial-scale=1.0"> <link rel="stylesheet" href="./style.css"> <link rel="icon" type="image/x-icon" href="images/favicon.ico"> <title>Hairpins Boutique Salon</title> <link rel="preconnect" href="https://fonts.googleapis.com"> <link rel="preconnect" href="https://fonts.gstatic.com" crossorigin> <link href="https://fonts.googleapis.com/css2?family=Poppins:wght@400;600&display=swap" rel="stylesheet"> <style> .services { background-color: #000000; /* Here I changed the background color using Hexadecimal value */ color: white; } </style> </head> <body> <header> <a href="index.html" ><img src="images/hairpins-salon-logo.png" alt="hairpins Logo" width="300" ></a> <nav> <ul> <li><a href="index.html">Home</a></li> <li><a href="services.html">Services</a></li> <li><a href="contact.html">Contact Us</a></li> </ul> </nav> </header> <main> <h1>Welcome to Hairpins Boutique Salon</h1> <p> Located in the heart of the Comox Valley, Hairpins Boutique Salon offers a high-end experience with competitive prices, top of the line products and a warm, welcoming atmosphere. </p> <figure> <img src="./images/the-hairpins-salon.jpeg" alt="salon image"> <figcaption> The Hairpins hairdressing salon in Courtenay, BC, Canada. </figcaption> </figure> <p> Stylist and owner, Staysea Brown has been overwhelmed by the success Hairpins has received over the past 10 years and is ever grateful to the Comox Valley community for all the support. With over a decade of industry experience, Staysea has the knowledge and drive to run a successful business that's hard to forget. Pop on by! </p> <p class="services"> Time for a new do? <a href="./services.html">Check out our services</a> </p> <h2>Meet the Team</h2> <p> Offering talented stylists with varied personalities, outgoing customer service, and an eclectic, fun atmosphere, Hairpins is striving to be one of a kind. <br> <br> By evolving with their clientele and constantly offering the latest trends and services, they are ensuring every visit is a unique one. Hairpins is filled with its own special brand of magic. Come in and sit down, the Hairpins' Girls are waiting for you! </p> <figure> <img src="./images/the-hairpins-team.jpeg" alt="team members"> <figcaption> We are incredibly proud of our diverse team of stylists who greet each client with a smile. We prioritize inclusivity, community, and sustainability, and make sure that everyone who walks through our door feels welcome. </figcaption> </figure> <a href="./contact.html">Contact us today to book an appointment!</a> </main> <footer> <p> Content taken from <a href="https://www.hairpins.ca/">https://www.hairpins.ca/</a> Used for educational purposes only. </p> </footer> </body> </html> Copy lines Copy permalink View git blame Reference in new issue Go Footer © 2022 GitHub, Inc. Footer navigation Terms Privacy Security Status Docs Contact GitHub Pricing API Training Blog About You can’t perform that action at this time. You signed in with another tab or window. Reload to refresh your session. You signed out in another tab or window. Reload to refresh your session. .user-mention[href$="/caitgarland"] { color: var(--color-user-mention-fg); background-color: var(--color-user-mention-bg); border-radius: 2px; margin-left: -2px; margin-right: -2px; padding: 0 2px; } assignment-c-dlu-RaviPunia/index.html at main · nic-dgl103-f22/assignment-c-dlu-RaviPunia
I don't see any issues. Great job, Ravi.
Skip to content In this repository All GitHub ↵ Jump to ↵ No suggested jump to results In this repository All GitHub ↵ Jump to ↵ In this organization All GitHub ↵ Jump to ↵ In this repository All GitHub ↵ Jump to ↵ Dashboard Pull requests Issues Codespaces Marketplace Explore Sponsors Settings caitgarland Sign out New repository Import repository New gist New organization Sorry, something went wrong. / ... / nic-dgl103-f22 / assignment-c-dlu-... / Clear Command Palette Tip: Type # to search pull requests Type ? for help and tips Tip: Type # to search issues Type ? for help and tips Tip: Type # to search discussions Type ? for help and tips Tip: Type ! to search projects Type ? for help and tips Tip: Type @ to search teams Type ? for help and tips Tip: Type @ to search people and organizations Type ? for help and tips Tip: Type > to activate command mode Type ? for help and tips Tip: Go to your accessibility settings to change your keyboard shortcuts Type ? for help and tips Tip: Type author:@me to search your content Type ? for help and tips Tip: Type is:pr to filter to pull requests Type ? for help and tips Tip: Type is:issue to filter to issues Type ? for help and tips Tip: Type is:project to filter to projects Type ? for help and tips Tip: Type is:open to filter to open content Type ? for help and tips We’ve encountered an error and some results aren't available at this time. Type a new search or try again later. No results matched your search Top result Commands Type > to filter Global Commands Type > to filter This Page Files Pages Access Policies Organizations Repositories Issues, pull requests, and discussions Type # to filter Teams Users Projects Modes Use filters in issues, pull requests, discussions, and projects Search for issues and pull requests # Search for issues, pull requests, discussions, and projects # Search for organizations, repositories, and users @ Search for projects ! Search for files / Activate command mode > Search your issues, pull requests, and discussions # author:@me Search your issues, pull requests, and discussions # author:@me Filter to pull requests # is:pr Filter to issues # is:issue Filter to discussions # is:discussion Filter to projects # is:project Filter to open issues, pull requests, and discussions # is:open nic-dgl103-f22 / assignment-c-dlu-RaviPunia Private Unwatch Stop ignoring Watch 0 Notifications Participating and @mentions Only receive notifications from this repository when participating or @mentioned. All Activity Notified of all notifications on this repository. Ignore Never be notified. Custom Select events you want to be notified of in addition to participating and @mentions. Get push notifications on iOS or Android. Custom Custom Select events you want to be notified of in addition to participating and @mentions. Issues Pull requests Releases Discussions Discussions are not enabled for this repository Security alerts Apply Cancel Fork 0 Starred 0 Star 0 Code Issues 0 Pull requests 0 Actions Projects 0 Security Insights More Code Issues Pull requests Actions Projects Security Insights Open in github.dev Open in a new github.dev tab Permalink main Switch branches/tags Branches Tags View all branches View all tags Name already in use A tag already exists with the provided branch name. Many Git commands accept both tag and branch names, so creating this branch may cause unexpected behavior. Are you sure you want to create this branch? Cancel Create assignment-c-dlu-RaviPunia/services.html Go to file Go to file T Go to line L Copy path Copy permalink This commit does not belong to any branch on this repository, and may belong to a fork outside of the repository. RaviPunia Final code Latest commit 3fef99d 4 days ago History 2 contributors Users who have contributed to this file 110 lines (102 sloc) 3.88 KB Raw Blame Edit this file E Open in github.dev . Open in GitHub Desktop Open with Desktop View raw Copy raw contents Copy raw contents Copy raw contents Copy raw contents View blame <!DOCTYPE html> <html lang="en"> <head> <meta charset="UTF-8"> <meta http-equiv="X-UA-Compatible" content="IE=edge"> <meta name="viewport" content="width=device-width, initial-scale=1.0"> <link rel="stylesheet" href="./style.css"> <link rel="icon" type="image/x-icon" href="images/favicon.ico"> <title>Services - Hairpins Boutique Salon</title> <link rel="preconnect" href="https://fonts.googleapis.com"> <link rel="preconnect" href="https://fonts.gstatic.com" crossorigin> <link href="https://fonts.googleapis.com/css2?family=Poppins:wght@400;600&display=swap" rel="stylesheet"> <style> main li{ list-style: none; /* Here I removed the bullets from list items */ } </style> </head> <body> <header> <a href="index.html" ><img src="images/hairpins-salon-logo.png" alt="hairpins Logo" width="300" ></a> <nav> <ul> <li><a href="index.html">Home</a></li> <li><a href="services.html">Services</a></li> <li><a href="contact.html">Contact Us</a></li> </ul> </nav> </header> <main> <h1>Our Services</h1> <h2>Below is a list of services we proudly offer.</h2> <p> At Hairpins, we care about the environment and recognize the impact we all have on it. We are continually making strides to reduce where we can and have only aligned ourselves with companies and products we believe in. We are proud to be a CERTIFIED GREEN CIRCLE SALON and through that partnership are able to divert 95% of our salon waste from landfills. Get in touch if you have any questions or want to learn more about the programs and charities we are focusing our efforts on. </p> <h3>Cuts</h3> <p> Range from 45 minutes to 90 minutes. Please call us at 250-338-7467 (PINS) to book a shorter appointment for Kid's Cuts, Dry Cuts, Fringe Trims, Neck trims, or Clipper Cut maintenance.</p> <ul> <li>47.00 = 45 Minute Clipper Cuts and Short Fine Hair</li> <li>$61.00 = 60 Minute Cut for Fine to Medium Hair</li> <li>$76.00 = 75 Minute Cut for Medium to Thick Hair</li> <li>$90.00 = 90 Minute Cut for THICK THICK Hair, you know who are :)</li> </ul> <p> All cuts include shampoo, scalp massage, blowdry, and style. </p> <h3>Colours</h3> <ul> <li>FULL FOIL: $188/$219 with cut</li> <li>3/4 FOIL: $172/$203 with cut</li> <li>1/2 FOIL: $158/$189 with cut</li> <li>1/4 FOIL: $144/$175 with cut</li> </ul> <h3>Styling</h3> <ul> <li>BLOWOUTS ~ 30 mins: $40 - $45</li> <li>BLOWOUTS ~ 45 mins: $47 - $52</li> <li>BLOWOUTS ~ 1 hour: $60 - $67</li> </ul> <br> <h3><strong>* * 48 Hour Cancellation Required * *</strong></h3> <p> We require 48 hours' notice for any cancellations. </p> <br> <ul> <li>If you are a “no show”, you will be required to pay for your missed service in full in order to rebook.</li> <li>If you cancel with less than 48 hours' notice, you will be required to pay for 1/2 of the service you canceled in order to rebook.</li> </ul> <p> We understand that last-minute things happen! We will address each situation on a case-by-case basis. Please communicate with us and we will try our best to help. We appreciate your understanding. </p> <p> <a href="./contact.html">Contact us today to book an appointment!</a> </p> </main> <footer> <p> Content taken from <a href="https://www.hairpins.ca/">https://www.hairpins.ca/</a> Used for educational purposes only. </p> </footer> </body> </html> Copy lines Copy permalink View git blame Reference in new issue Go Footer © 2022 GitHub, Inc. Footer navigation Terms Privacy Security Status Docs Contact GitHub Pricing API Training Blog About You can’t perform that action at this time. You signed in with another tab or window. Reload to refresh your session. You signed out in another tab or window. Reload to refresh your session. .user-mention[href$="/caitgarland"] { color: var(--color-user-mention-fg); background-color: var(--color-user-mention-bg); border-radius: 2px; margin-left: -2px; margin-right: -2px; padding: 0 2px; } assignment-c-dlu-RaviPunia/services.html at main · nic-dgl103-f22/assignment-c-dlu-RaviPunia
Looks great!
To discover the themes, a user could create a separate document of each of the duo’s albums, upload the corpus to Topic Modeling Tool, and interpret the string of words that the tool finds to be most prominent.
This could also be a way in which artists could strategize the use of specific words in songs to attract a larger audience. They could look at the similarities between top hits and find certain words that were used in all of them and then include it when advertising the music. For example, they could use it as a tag when posting on instagram or twitter and it may attract more attention.
<h2>SILKTRICKY</h2><br><br><br><br><br><br>
Use padding and margin for space instead of br tag.
<ul type="square"> If you're looking to make an appointment online, please do so here. <li>Monday ~ Closed</li> <li>Tuesday 9:00am ~ 5:00pm</li> <li>Wednesday 9:00am ~ 8:00pm</li> <li>Thursday 9:00am ~ 8:00pm</li> <li>Friday 9:00am ~ 5:00pm</li> <li>Saturday 9:00am ~ 4:00pm</li> <li>Sunday ~ Closed</li> </ul> <h2>Hairpins Boutique Salon</h2> #4 - 224 6th Street<br> Courtenay, BC V9N 1M1<br> Check us out on Google Maps <a href="http://www.cariboucreative.ca/">http://www.cariboucreative.ca/</a><br> Tel: (250) 338-7467 (add telephone link)<br> Email: <a href="salon.hairpins@gmail.com">salon.hairpins@gmail.com</a> Contact us today to book an appointment!<a href="https://www.hairpins.ca/contact">https://www.hairpins.ca/contact</a></footer>
You can use div tag as well
<p> <h1>Cuts</h1> Range from 45 minutes to 90 minutes</p>
the opening p tag needs to be brought down to where it begins
</p>
What paragraph is this closing tag for?
Worried about paper cards being lost or destroyed .t3_y77414._2FCtq-QzlfuN-SwVMUZMM3 { --postTitle-VisitedLinkColor: #9b9b9b; --postTitleLink-VisitedLinkColor: #9b9b9b; --postBodyLink-VisitedLinkColor: #989898; } I am loving using paper index cards. I am, however, worried that something could happen to the cards and I could lose years of work. I did not have this work when my notes were all online. are there any apps that you are using to make a digital copy of the notes? Ideally, I would love to have a digital mirror, but I am not willing to do 2x the work.
u/LBHO https://www.reddit.com/r/antinet/comments/y77414/worried_about_paper_cards_being_lost_or_destroyed/
As a firm believer in the programming principle of DRY (Don't Repeat Yourself), I can appreciate the desire not to do the work twice.
Note card loss and destruction is definitely a thing folks have worried about. The easiest thing may be to spend a minute or two every day and make quick photo back ups of your cards as you make them. Then if things are lost, you'll have a back up from which you can likely find OCR (optical character recognition) software to pull your notes from to recreate them if necessary. I've outlined some details I've used in the past. Incidentally, opening a photo in Google Docs will automatically do a pretty reasonable OCR on it.
I know some have written about bringing old notes into their (new) zettelkasten practice, and the general advice here has been to only pull in new things as needed or as heavily interested to ease the cognitive load of thinking you need to do everything at once. If you did lose everything and had to restore from back up, I suspect this would probably be the best advice for proceeding as well.
Historically many have worried about loss, but the only actual example of loss I've run across is that of Hans Blumenberg whose zettelkasten from the early 1940s was lost during the war, but he continued apace in another dating from 1947 accumulating over 30,000 cards at the rate of about 1.5 per day over 50 some odd years.
<h2> <li>Styling </li></h2>
Reccomend to change h3 tag
<h2><li>Colours</li></h2>
Reccomend to change h3 tag.
<p> <h2>* * 48 Hour Cancellation Required * *</h2></p>
just use a header tag, dont nest a header tag inside a paragraph tag.
<p> FULL FOIL: $188/$219 with cut<p></p> <p> 3/4 FOIL: $172/$203 with cut</p> <p>1/2 FOIL: $158/$189 with cut</p> <p>1/4 FOIL: $144/$175 with cut</p>
don't make each list item a paragraph, add a list tag
<p>
no closing tag
<h1><u>Our Services</u></h1> <h2><li> Below is a list of services we proudly offer.</li></h2> <p> At Hairpins, we care about the environment and recognize the impact we all have on it. We are continually making strides to reduce where we can and have only aligned ourselves with companies and products we believe in.<p></p> <br> <p> We are proud to be a CERTIFIED GREEN CIRCLE SALON and through that partnership are able to divert 95% of our salon waste from landfills. Get in touch if you have any questions or want to learn more about the programs and charities we are focusing our efforts on.</p> <h3><li>Cuts</li></h3> <p>Range from 45 minutes to 90 minutes</p>
<ul> is a parent tag of <li> you need to add a <ul> Additionally, in this situation I would recomment not using a list, instead just use the header and paragraph tags.
img
You must be more specific while selecting tag because it affects all images in the page.
</H3>
used capital letter in closing tag
<h1>Welcome to Hairpins Boutique Salon</h1>
I believe you put the h1 inside the main tag
rc="i
everything seems well structured. But the image tag could be given the value in both html and css.
<p class="card-three-p3">Watch Video</p>
you can keep this as a paragraph tag, but it may be better to turn it into a <span>
</small></p>
Perhaps small tag could have been used for a smaller amount of text placed on a separate line instead of an entire paragraph for the sake of readability.
Review coordinated via ASAPbio’s crowd preprint review
This review reflects comments and contributions by Ruchika Bajaj, Sree Rama Chaitanya Sridhara and Sara El Zahed. Review synthesized by Ruchika Bajaj.
This study has developed a novel one-step methodology for the incorporation of membrane proteins from cells to lipid Salipro nanoparticles for structure-function studies using surface plasmon resonance (SPR) and single-particle cryoelectron microscopy (cryo-EM), which is a profound technology in the field of membrane protein structural biology. We raise some points that may strengthen the manuscript below:
We are incredibly proud of our diverse team of stylists who greet each client with a smile. We prioritize inclusivity, community, and sustainability, and make sure that everyone who walks through our door feels welcome.<br><br>
needs a tag
Tel:<a href="(250) 338-7467 ">(250) 338-7467 </a> <br><br> Email: <a href=" salon.hairpins@gmail.com "> salon.hairpins@gmail.com </a><br><br>
needs to have a tag. <a href="tel:+2503387467">to add a telephone, <a href="mailto:salon.hairpins@gmail.com"> to add email
Hairpins Boutique Salon #4 - 224 6th Street Courtenay, BC V9N 1M1 Check us out on Google Maps <a href="https://www.google.com/maps/place/Hairpins+Boutique+Salon/@49.6904218,-124.9971279,15z/data=!4m2!3m1!1s0x0:0x859b2cfce3bc31ea?sa=X&ved=2ahUKEwiYi_2Ex6T6AhXNMjQIHYkoCUUQ_BJ6BAhSEAc)">https://www.google.com/maps/place/Hairpins+Boutique+Salon/@49.6904218,-124.9971279,15z/data=!4m2!3m1!1s0x0:0x859b2cfce3bc31ea?sa=X&ved=2ahUKEwiYi_2Ex6T6AhXNMjQIHYkoCUUQ_BJ6BAhSEAc)</a>
needs to have a tag
Sunday ~ Closed
needs to have a tag
Questions, comments, ready for a new do? We look forward to hearing from you! If you're looking to make an appointment online, please do so here.
needs to have a tag.
div
I would recommend using a p or heading tag (maybe even article?) here, I don't think div is the best option for this
<!--Receiving an error for my h2 closing tag, unsure-->
might be because you've closed your h2 before your div. remember opens and closes should mirror eachother. ex) h2, div, content, /div, /h2
span
not sure you need the span tag here, I think the h3 would have been enough to separate it from the rest.
div
make sure to close your p tag before your div or you will have issues.
</h2>
This closing tag can be at the end of line 34 (?)
Read on Arcadia Science
Oh no! I thought the flag meant post & accidentally reported your thoughtful feedback to moderators instead of replying. Hopefully they figure it out (no obvious way to contact them or "unflag"
Comment Figure 2C → please include indication of statistical significance Figure 3C → please include indication **of statistical significance Figure 6A → please include indication of statistical significance Figure 8B → please include indication of statistical significance Figure S1B → please include indication of statistical significance Figure S3B → please include indication of statistical significance
Response Easy to add
Comment For your overexpression experiments, do the overexpressed proteins have a tag? It would be helpful to have Western blot data showing that the particular proteins are actually being overexpressed. I think the phenotypes that you observe are very compelling so I don’t doubt the conclusions. Western blot data would just provide some additional confirmation that you are actually achieving overexpression of UppS, MraY, and BcrC.
Response The proteins are untagged. For the UppS and BcrC the cell shortening occurs with addition of inducer, , so strong indication expression is occurring. A western would provide information about degree of overexpression, but we don’t think is necessary to support conclusion drawn. Do you think there is an alternative possibility that needs to be excluded? We note that in another preprint (https://www.biorxiv.org/content/10.1101/2022.02.03.479048v1) the authors delete the native uppS in their inducible Phy-uppS strain (Fig S4) and at 100 uM IPTG (10X less than what we used in experiment) the cells have wt growth on LB plates, so we at least know the Phy-uppS is functional and made (or they would die!). We are introducing the uppS deletion into our strain to see if we can identify a concentration of IPTG that doesn’t affect cell growth but still induces shortening.
For MraY, the result is negative, so you are spot on – it is impossible to tell if due to lack of overexpression from data shown. We only know the strain is correctly made from sequencing. We will investigate if there is an antibody or functional fusion available. The reason we were not sure was worth doing is because the MraY reaction is reversible (15131133). This means that without a phenotype, there is no simple way to know the reaction can even be pushed forward even if the overexpression is confirmed (more negative data). We actually overexpressed some other proteins that act downstream (MraY, MurJ, AmJ) and they were also negative for shortening. Probably we should remove the negative data or reword to make the caveats of the negative result clear.
Question Based on your data, there are definitely differences in gene expression when you compare cells grown in media with and without magnesium. Because the majority in cell length increase occurs in such a short time though (the first 10min), I was wondering if you think that some or most of it is not due to gene expression?
Response The shortening is even faster than 10 min (not only statistically significant, but also obvious qualitatively if we mount immediately after adding Mg2+ ). We did not include the first timepoint because original purpose was to check everything was ready with microscope – did not expect shortening so fast! We can definitely add that data in. When we saw, we tried to capture the transition on pads, but going from culture to pad seems to stress the cells too much in the small window where the cool stuff happens. Since growth rate doesn’t appear to be a big factor in those initial divisions, we might be able to grow at lower temp and shift to pads for adjustment period before adding Mg2+. Did not play with it much due to lack of resources atm, but a flowcell setup would probably be best. In short, we think rapid divisions right after transition do not require transcription or translation. It really “smells” more like a biophysical thing.
Question Do you have any hypotheses what is most likely to be affected by magnesium? Do you think if the membrane may be affected?
Response We have a lot of hypotheses, but all speculative. There could be an extracytoplasmic enzyme involved in envelope synthesis is sensitive to Mg2+ availability, and that at lower concentrations, its activity is affected. There is some old literature with membrane preps that suggests PG synthesis requires higher Mg2+ than teichoic acid synthesis. If Und-P is limiting, higher Mg2+ may shift make the pool more available to make the septum. Tingfeng initially hypothesized there might be a receptor/signal mechanism but has not been able to identify one. Und-P seems to be important, but “availability” is not just pool, but how fast (and where!) the flipping across the membrane occurs. If Und-PP needs to be dephosphorylated to Und-P before being flipped back to cytoplasmic side, anything that effects the PP/Pi equilibrium would be predicted to affect the reaction rate, with lower Pi (in periplasm or pseudoperiplasm in case of G+) favoring the dephosphorylation. Cell wall associated Mg2+ could shift equilibrium to be more favorable for a Und-PP phosphatase more closely associated with the divisome. I could go all day… In short, we don’t know enough!
Question Why do you think less magnesium activates this program of less division and more elongation? Additionally why is abundant magnesium activating a program of increased cell division and less elongation? Do you think there is some evolutionary advantage, especially considering how important magnesium is for ATP production?
Response In the window we looked at, the elongation rate is constant (not less or more) and only the division frequency changes. Some bacteria (like Caulobacter and to lesser extent E. coli) clearly elongate and divide simultaneously, so model there is some competition for substrate (like Lipid II) makes sense. Septators like Bacillus seem to delineate the two processes more, though we have found conditions where even Bacillus invaginates during division, so it’s not absolute. Like eukaryotic cells, bacterial undoubtedly have mechanisms not only commit to a round of DNA replication when there is some signal that resources are sufficient. Clearly with some bacteria, this is not the case with cell division. The alternative would be that every cell cycle there is an opportunity to divide if some threshold of something(s) is reached. There is a hypothesis from Mtb literature that it may be GTP, but it’s not at all clear that is sufficient. In yeast, size at cell division is affected by perturbing 1-C pool.
Question Related to this previous question, I also wonder if this magnesium-dependent phenotype would extend to other unicellular organisms, may be protists or algae? That would be a really exciting direction to explore!
Response It’s a great question – lots to do! We didn’t even look at another Gram-positive, but we plan to. It’s trickier to limit Mg2+ in Gram-negatives (see 27471053 – we tried Bsub homolog for those wondering – it’s not responsible for phenotype we see).
Question Regarding the zinc and manganese experiments, why do you think they lead to additional phenotypes compared to magnesium? Do you have any hypotheses?
Response We have hypotheses, but if my (Jen’s @rosh_ba) twitter engagement is any indication, way too speculative for public consumption at present. Need acquire preliminary data/write grant.
Question Regarding your results that Lipid I availability may be a major a problem for the cell division in the absence of magnesium, do you think that is due to effects magnesium has on the enzymes directly, or do you think magnesium affects the substrate availability/conformation by coordinating the phosphate groups? Or something else, may be membrane conformation?
Response Several proteins involved in envelope synthesis (like UppS) are Mg2+ dependent enzymes. But at least for intracellular players, levels of Mg2+ should be more than high enough to support enzyme activity (0.8 – 3.0 mM is Bsub range I recall off top of head). Could have impact extracytoplasmically by lowering pool sponged into the cell wall, but intuition (for what that is worth) is that it is not the coordination of an enzyme with a metal that is impacted rather the equilibrium with other ions like Pi and H+ and their impact on net ATP synthesis. Lots to think about and do, and no simple answers. When Tingfeng started project idea was to find mechanism – didn’t realize we were asking “How does the cell work?” Turned out to be a bit much for a dissertation project :)
General comments:
This study carefully delineates the role of magnesium in cell division versus cell elongation. The results are really important specifically for rod-shaped bacteria and also an important contribution to the broader field of understanding cell shape. Specifically, I love that they are distinguishing between labile and non-labile intracellular magnesium pools, as well as extracellular magnesium! These three pools are really challenging to separate but I commend them on engaging with this topic and using it to provide alternative explanations for their observations!
A major contribution to prior findings on the effects of magnesium is the author’s ability to visualize the number of septa in the elongating cells in the absence of magnesium. This is novel information and I think the field will benefit from the microscopy data shown here.
I completely agree with the authors that we need to be more careful when using rich media such as LB. It is particularly sad that we may be missing really interesting biology because of that! It’s worth moving away from such media or at least being more careful about batch to batch variability. Batch to batch variability is not as well appreciated in microbiology as it is for growing other cell types (for example, mammalian cells and insect cells).
For me, the most exciting finding was that a large part of the cell length changes within the first 10min after adding magnesium. The authors do speculate in the discussion that this is likely happening because of biophysical or enzymatic effects, and I hope they explore this further in the future!
I love how the paper reads like a novel! Congratulations on a very well-written paper!
Kudos to the authors for providing many alternative explanations for their results. It demonstrates critical thinking and an open-mind to finding the truth.
Specific comments:
Figure 2C → please include indication of statistical significance
Figure 3C → please include indication of statistical significance
Figure 6A → please include indication of statistical significance
Figure 8B → please include indication of statistical significance
Figure S1B → please include indication of statistical significance
Figure S3B → please include indication of statistical significance
For your overexpression experiments, do the overexpressed proteins have a tag? It would be helpful to have Western blot data showing that the particular proteins are actually being overexpressed. I think the phenotypes that you observe are very compelling so I don’t doubt the conclusions. Western blot data would just provide some additional confirmation that you are actually achieving overexpression of UppS, MraY, and BcrC.
Questions:
Based on your data, there are definitely differences in gene expression when you compare cells grown in media with and without magnesium. Because the majority in cell length increase occurs in such a short time though (the first 10min), I was wondering if you think that some or most of it is not due to gene expression? Do you have any hypotheses what is most likely to be affected by magnesium? Do you think if the membrane may be affected?
Why do you think less magnesium activates this program of less division and more elongation? Additionally why is abundant magnesium activating a program of increased cell division and less elongation? Do you think there is some evolutionary advantage, especially considering how important magnesium is for ATP production?
Related to this previous question, I also wonder if this magnesium-dependent phenotype would extend to other unicellular organisms, may be protists or algae? That would be a really exciting direction to explore!
Regarding the zinc and manganese experiments, why do you think they lead to additional phenotypes compared to magnesium? Do you have any hypotheses?
Regarding your results that Lipid I availability may be a major a problem for the cell division in the absence of magnesium, do you think that is due to effects magnesium has on the enzymes directly, or do you think magnesium affects the substrate availability/conformation by coordinating the phosphate groups? Or something else, may be membrane conformation?
Note: This rebuttal was posted by the corresponding author to Review Commons. Content has not been altered except for formatting.
Learn more at Review Commons
Reviewer #2 (Evidence, reproducibility and clarity (Required)):
This paper provides a detailed step by step protocol of the CUT&RUN technique, which enables high-resolution chromatin mapping and probing, adapted to the malaria parasite Plasmodium falciparum. In particular, Kafsack and colleagues apply the CUT&RUN protocol to infected red blood cells from in-vitro culture and obtain very good quality genome-wide profiles of two histone modifications, H3K4me3 and H3K9me3. The results are congruent with previous ChIP-seq data with a substantial improvement in terms of coverage and chip-to-input noise. The protocol is very detailed and the figures are great.
Major comments: 1. Authors successfully adapted the CUT&RUN protocol in P. falciparum. First, the binding profiles obtained by CUT&RUN for H3K4me3 and H3K9me3 are very similar to those reported by previous ChIP-seq studies. Secondly, by down-sampling 4X and 16X the test samples, authors demonstrate that 1M PE reads of sequencing depth would be enough to obtain accurate profiling of these histone modifications.
Despite this data is convincing, only one region in chr. 8 is shown as an example in figures 2, 3 and 4.
Different regions should be included, at least as supplementary figures, to reinforce their conclusions.
__Response: __We chose that locus on chromosome 8 to provide a gene-level resolution view at a locus encompassing genes in both eu- and heterochromatin states. We have now included Supplementary Figure 1, which shows these tracks for full length chromosomes 4 and 7. Additionally, genome-wide enrichment tracks for all data sets in this study are available for download at NCBI Gene Expression Omnibus under accession number GSE210062.
Related to this, there is evidence of the impact of chromatin structure on ChIP-seq analysis. Specifically, heterochromatin is typically depleted in ChIP input controls because of technical and experimental issues and this can result in a false enrichment of heterochromatic regions in the tested sample. How represented is heterochromatin (i.e. sub-telomeric and telomeric regions) in the test and control samples using the cut&run protocol?
__Response: __The reviewer is correct that chromatin structure may alter accessibility which may bias absolute measurements but since the accessibility biases based to chromatin-structure are identical for both the histone PTM-specific antibody and the isotype control and cancel out in the enrichment score.
How biased is the cut&run sample compare to the ChIP-seq sample?
__Response: __We have included this in Supplementary Figure 1. The H3K4me3 and H3K9me3 enrichment scores are strongly correlated both between CUT&RUN replicates and between CUT&RUN and previously published ChIP-seq results.
In this sense, it would be desirable if authors provide more information about the quality analysis results, for example the chip to input signal ratio and the coverage for heterochromatic (telomeric, centromeric and subtelomeric) regions.
__Response: __We agree that this would be of interest to the reader. For this reason, the full genome-wide enrichment tracks were made available for all datasets in this study. We have added language to draw further attention to this availability.
Additionally, loci typically biased in ChIP-seq samples, i.e. clonally variant gene families in sub-telomeric regions, should be shown as examples.
__Response: __We chose that locus on chromosome 8 to provide a gene-level resolution view at a locus encompassing genes in both eu- and heterochromatin states, including 2 var genes (PF3D7_0808600 and PF3D7_0808700) and two rifin genes (PF3D7_0808800 and PF3D7_0808900). We have now included Supplementary Figure 1, which shows these tracks for full length chromosomes 4 and 7, which also include subtelomeric and non-subtelomeric heterochromatin loci containing these genes. Additionally, genome-wide enrichment tracks for all data sets in this study are available for download at NCBI Gene Expression Omnibus under accession number GSE210062.
__Response: __Since such biases are sequence dependent, they would impact raw coverage but cancel out in the enrichment plots since the sequence-based biases are identical in both samples. While PCR-free amplification may be desirable for some applications, we feel this is outside the scope of this study to implement these changes.
It would have been desirable to have tried the CUT&RUN protocol on other type of proteins, different to hPTMs which are highly abundant, for example one of the Pf Api-AP2 transcription factors. Assaying the CUT&RUN protocol on a different type of protein shouldn't be cost/time consuming and would provide evidence of the versatility of the approach.
Response: As indicated by the title, this protocol was optimized specifically for profiling of histone modifications. CUT&RUN has been used in other systems to profile genome-wide binding of other proteins but this was not our aim and outside the scope of this study.
In the section "Binding cells to Concanavalin A-coated beads": it's not mentioned the harvest time and the stage of the parasites used. In addition, several methods are proposed for iRBCs enrichment, but is not mentioned which method was used and the life stage of the parasites. In this part of the protocol authors state "resuspend cells containing 1-5x10⁷ nuclei to a cell density to 1x10⁷ cells/mL".
According to our calculations, to guarantee this nuclei number it would be necessary to enrich in iRBCs and late stages. Otherwise the red blood cells density should be much larger. Could you please clarify this point?
Response: For this study we enriched for trophozoites using a percoll/sorbitol density gradient, which we have now clarified in step 8. However, whether and which enrichment strategy is employed will vary based on the desired parasite stages and experimental design.
In the section "P. falciparum culturing and synchronization of erythrocytic stages" the authors indicate that the method used for synchronization was double-synchronization with sorbitol treatment to achieve a {plus minus} 6 h synchrony. The details provided appear insufficient to replicate the procedure. E.g. it's not explained how the double step synchronization was performed and for how long the culture was incubated after the synchronization.
The number of parasite cells and the life-stage used is mentioned at the end (in the section of expected outcomes). It would be more useful if this information is specified at the beginning together with the most appropriate procedure to get an iRBC culture well synchronised and enriched in late stages.
Response: The stage, synchrony and growth conditions are determined by the scientific question the experimenter is asking, not by the assay. For this reason, we provide the number of infected erythrocytes and nuclei used in our studies so that other experimenters can aim for similar numbers regardless of the stage and synchrony. For this study we used asexual blood-stages at 36±4 hp.i. We have clarified this in step 11.
Minor comments: - Abstract. A closing bracket is missing.
Response: Corrected - Step 11: Split each sample into 1mL aliquots at ?
Response: Corrected
Response: Corrected
Response: The vendor and catalog number for the low-bind tubes are specified in the Reagents, Materials & Equipment list.
Which was the desired sequencing depth per library? It could be mentioned here. It is mentioned later in "Quantification and statistical analysis" that the initial desired depth was of 40M read pairs, but what was the real depth obtained? from the Figure 4 seems to be less than 17M read pairs per sample.
Response: Thank you for catching that error. The target was 10M read pairs per library but since CUT&RUN is so specific the isotype controls release less DNA and the resulting libraries produces fewer clusters than aimed for leading to slight over sequencing of the remaining samples.
In the section "Quantification and statistical analysis", references to Figure 3 and 4 are inverted or do not correspond with the actual figures 3 and 4.
Response: Corrected
Figure 2. Among the replicates, sample 2 seems to have higher background, could you comment why? Response: It is inherent in biological replicates that one would have the greatest amount of noise but we unfortunately have no further insight into why Sample 2 had a higher elevated background that Samples 1 and 3. Furthermore, even with this slightly higher background the relative enrichment of signal to noise ratio enrichment peaks are readily identifiable.
Below some suggestions that may help the authors improve the presentation of their data and conclusions:
The limitations and potential shortcomings of the protocol are mentioned along the text (e.g. the use of different antibodies, different targets, weak interactions..), but could be good if they are included in a different section, preferably at the end.
Response: A “Limitations” section was added.
Also in this section it would be good if they develop further (or at least speculate) on the differences in the protocol or things to consider if other type of proteins are assayed (i.e. TFs).
Response: As mentioned above, we have not applied to CUT&RUN to profile chromatin other than Histone PTMs, as this was not the aim of our study. Since chromatin-bound histones always occur within a nucleosomal context, we are hesitant to make claims to the utility of this specific protocol for profiling DNA-binding proteins with smaller DNA-binding footprints. That said, CUT&RUN has been used to great success in other systems to profile a wide range of chromatin-bound proteins. We have included mention of this at the end of the introduction.
Authors should better comment on the potential impact of chromatin structure and DNA sequence (i.e. AT richness) on the biased representation of heterochromatic regions in the data, the level of background and the peak calling analysis.
Response: For the enrichment scores, sequence and accessibility biases cancel out since they are the same for both the PTM-specific antibody and the isotype controls.
The coverage of critical loci, like those belonging to clonally variant gene families, should be calculated and examples of tracks included as supplemental figures.
Response: Gene Expression Omnibus under accession number GSE210062 as indicated in the Quantification & Statistical Analysis and data availability sections.
Authors claim that the CUT&RUN protocol has exceptionally low background and has been successfully used to profile chromatin interactions from very small numbers of cells. But it is not specified how many. That is, which is the standard in other fields and how it compares with the number of cells used here.
Response: As stated in the note following step 10, we did not optimize the minimum number of parasites required in this study since at the 1e7 iRBC required for each sample correspond as little as 1mL of bloodstage culture 2% parasitemia and 5% hematocrit. The down-sampling analysis in figure 3 suggests that the number of input cells can likely be reduced at least 10-fold.
Information about synchronisation, estimation of iRBCs density and nuclear content appears insufficiently described and has been fragmented in different sections so it is difficult to replicate. For example, within the section "Binding cells to Concanavalin A-coated beads" different alternative protocols for iRBCs synchronisation and enrichment are mentioned but it is not clear whether authors actually perform that step. It could be convenient to describe it and include it in the step-by-step protocol.
Response: The stage, synchrony and growth conditions are determined by the scientific question the experimenter is asking, not by the assay. For this reason, we provide the number of infected erythrocytes and nuclei used in our studies so that other experimenters can aim for similar numbers regardless of the stage and synchrony. For this study we used asexual blood-stages at 36±4 hp.i. We have clarified this in step 11.
Significance (Required) The CUT&RUN is a novel technique to profile chromatin modifications genome-wide that has been successfully adapted to P. falciparum by the authors. This technique overcomes important limitations of the traditional ChIP-seq and provides better quality data. First, fewer cells and lower sequencing depths are required which is fundamental for the analysis of certain parasite life stages. Second, the binding step is carried out in-situ using unfixed and intact cells. This allows to avoid crosslinking, which can interfere with target recognition that results in unspecific background, and also avoids the random fragmentation of the chromatin, that can bias in the analysis.
This work is significant since it represents the first CUT&RUN step by step protocol adapted to P. falciparum. The results are important for researchers from the malaria field and parasitologists in general who could eventually leverage this protocol to other Apicomplexa.
Our expertise is on transcriptional regulation, molecular parasitology, genomics and epigenomics, of malaria parasites. We hope the comments above will help the authors to improve the ms. Congratulations on the work.
Reviewer #3 (Evidence, reproducibility and clarity (Required)): ____ In general the paper is very clear and convincing and I have only minor comments for the authors to address.
Introduction The authors state that 'crosslinking presents another challenge as it can interfere with antibody recognition.' Would it be possible to provide a reference to strengthen this statement? Response: Additional references (Baranello et al, O’Neill et al) were added.
In the third paragraph the authors mention that CUT&RUN can be used to profile chromatin interactions from very small numbers of cells. This argument would be strengthened by adding references or examples from mammalian systems, and the authors might mention that the slight modification CUT&TAG has been employed for single cell sequencing. https://doi.org/10.1038/s41587-021-00865-z.
Response: The reference was added.
Figure 2 A label of Relative fold enrichment should be added to the y axis. This applies also to Figure 4. In the legend, it isn't entirely clear from what control the fold enrichment is being generated. Based on the other figures I assume it's the isotype control, and it would be helpful to state that in the legend.
Response: Thank you for the suggestion. We have made these changes.
Figure 3 An HP1 ChIP is included but there is no track for HP1 using CUT&RUN. It isn't entirely clear to me why HP1 is included; is it to make the point that it overlaps with H3K9me3? There is a sentence at the end of the Quantifcation and statistical analysis section that indicates that an HP1 CUT&RUN experiment was performed ('Representative tracks of H3K9me3, H3K4me3, and HP1 produced using CUT&RUN or ChIPseq at chromosome 8 of P. faliciparum are shown in Figure 4), but I don't see an HP1 track for Figure 4 and I don't see CUT&RUN HP1 tracks on Figure 3.
Response: Correct, no HP1 CUT&RUN was performed, we are just trying to show that H3K9me3 CUT&RUN recapitulates ChIP-seq of both H3K9me3 and HP1, which binds to H3K9me3.
Figure 4 The downsampling of reads is a nice demonstration that low numbers of reads are required for the CUT&RUN technique. It might be helpful to include downsampling of ChIP-seq reads within this figure to compare the two techniques more directly.
Response: The reason we included the down-sampling of CUT&RUN sequence reads was to explore whether were over-sequencing our CUT&RUN libraries not to provide a comparison to ChIP-seq. For simplicity we have therefore kept the figure as is.
DNA purification by Phenol/Chloroform extraction In step 38, I noticed that RNAse was not added at this step, as described in the original paper by Skene et al. Can the authors make a brief note about why they omit this reagent?
Response: RNAse A is already present since it was included in the STOP buffer at step 35.
The authors mark the TE buffer in bold, but I don't see a description of its makeup in the buffer section, though possibly I missed it. While this is a pretty standard buffer, it might still be nice to include it for completeness.
Response: TE buffer recipe was added.
Clean-up of PCR amplified library Between step 70 and 71 the authors include a warning to not discard the beads. However, this warning is not included in the Post-ligation Clean-up, which involves much the same procedure. Response: Corrected
Typos and writing It might be helpful to define CUT&RUN in the abstract by spelling out the acronym there. Response: It is defined in the 3rd paragraph of the introduction
I've mostly seen ChIP-seq with a dash between the IP and the seq.
Response: Corrected
Powerful is used twice in consecutive sentences in the first paragraph of the introduction. Consider substituting the words 'important tool' for 'powerful tool.' Response: Corrected
Figure 2 legend. “(purple) in of three biological replicates” should be “(purple) in three biological replicates” Response: Corrected
Figure 3 legend Last sentence should include 'to' between the words 'shown' and 'the'. Response: Corrected
Post-ligation Clean-up “Wash twice with 200µl of 80% Ethanol freshly prepared” should be “Wash twice with 200µl of freshly prepared 80% Ethanol” Response: Corrected
Library PCR amplification “Fragments are PCR amplified using Kapa polymerase, which it is more efficient” should be “Fragments are PCR amplified using Kapa polymerase, which is more efficient” Response: Corrected
Figure 7 legend “Indicated in the tope left panel” Should be “Indicated in the top left panel” Response: Corrected
Expected outcomes “to dismiss any sort of contamination” should be “To dismiss contamination” Response: Corrected
Potential Solution After the sentence 'Incubation buffer is added.' The next letter 'i' should be capitalized in the word Isolate. Response: Corrected
CROSS-CONSULTATION COMMENTS Plasmodium is not my model organism, so I'd defer to Reviewer 2 on the comments regarding additional detail for synchronization and Plasmodium culture conditions. I have nothing further to add, and I'm excited to see what experiments come from the addition of this technique to the parasite field.
Reviewer #3 (Significance (Required)):
This excellent methods paper describes a detailed protocol for the adaptation of the Cleavage Under Targets & Release Using Nuclease (CUT&RUN) technique to Plasmodium falciparum, the causative agent of malaria. CUT&RUN is an alternative to ChIP-seq, and has the advantage that it does not require crosslinking of targets, which can introduce artifacts and cause issues with antibody recognition. CUT&RUN can also be performed with low numbers of cells and has an excellent signal to noise ratio, which the authors demonstrate by downsampling the number of reads used in their analysis. The authors also clearly demonstrate that profiling of histone modifications using CUT&RUN yields comparable results to ChIP-seq. Because it can be difficult to obtain large numbers of cells from Plasmodium cultures, CUT&RUN is especially useful in this important model system. Publication of a detailed protocol will help other Plasmodium researchers answer important questions regarding genomic localization for their targets of interest.
Note: This preprint has been reviewed by subject experts for Review Commons. Content has not been altered except for formatting.
Learn more at Review Commons
In general the paper is very clear and convincing and I have only minor comments for the authors to address.
Introduction
The authors state that 'crosslinking presents another challenge as it can interfere with antibody recognition.' Would it be possible to provide a reference to strengthen this statement?
In the third paragraph the authors mention that CUT&RUN can be used to profile chromatin interactions from very small numbers of cells. This argument would be strengthened by adding references or examples from mammalian systems, and the authors might mention that the slight modification CUT&TAG has been employed for single cell sequencing. https://doi.org/10.1038/s41587-021-00865-z.
Figure 2
A label of Relative fold enrichment should be added to the y axis. This applies also to Figure 4. In the legend, it isn't entirely clear from what control the fold enrichment is being generated. Based on the other figures I assume it's the isotype control, and it would be helpful to state that in the legend.
Figure 3
An HP1 ChIP is included but there is no track for HP1 using CUT&RUN. It isn't entirely clear to me why HP1 is included; is it to make the point that it overlaps with H3K9me3? There is a sentence at the end of the Quantifcation and statistical analysis section that indicates that an HP1 CUT&RUN experiment was performed ('Representative tracks of H3K9me3, H3K4me3, and HP1 produced using CUT&RUN or ChIPseq at chromosome 8 of P. faliciparum are shown in Figure 4), but I don't see an HP1 track for Figure 4 and I don't see CUT&RUN HP1 tracks on Figure 3.
Figure 4
The downsampling of reads is a nice demonstration that low numbers of reads are required for the CUT&RUN technique. It might be helpful to include downsampling of ChIP-seq reads within this figure to compare the two techniques more directly.
DNA purification by Phenol/Chloroform extraction In step 38, I noticed that RNAse was not added at this step, as described in the original paper by Skene et al. Can the authors make a brief note about why they omit this reagent?
The authors mark the TE buffer in bold, but I don't see a description of its makeup in the buffer section, though possibly I missed it. While this is a pretty standard buffer, it might still be nice to include it for completeness.
Clean-up of PCR amplified library
Between step 70 and 71 the authors include a warning to not discard the beads. However, this warning is not included in the Post-ligation Clean-up, which involves much the same procedure.
Typos and writing
It might be helpful to define CUT&RUN in the abstract by spelling out the acronym there.
I've mostly seen ChIP-seq with a dash between the IP and the seq.
Powerful is used twice in consecutive sentences in the first paragraph of the introduction. Consider substituting the words 'important tool' for 'powerful tool.'
Figure 2 legend.
(purple) in of three biological replicates
Should be
(purple) in three biological replicates
Figure 3 legend Last sentence should include 'to' between the words 'shown' and 'the'.
Post-ligation Clean-up Wash twice with 200µl of 80% Ethanol freshly prepared
Should be
Wash twice with 200µl of freshly prepared 80% Ethanol
Library PCR amplification Fragments are PCR amplified using Kapa polymerase, which it is more efficient
Should be
Fragments are PCR amplified using Kapa polymerase, which is more efficient
Figure 7 legend Indicated in the tope left panel
Should be
Indicated in the top left panel
Expected outcomes to dismiss any sort of contamination
Should be
To dismiss contamination
Potential Solution After the sentence 'Incubation buffer is added.' The next letter 'i' should be capitalized in the word Isolate.
CROSS-CONSULTATION COMMENTS
Plasmodium is not my model organism, so I'd defer to Reviewer 2 on the comments regarding additional detail for synchronization and Plasmodium culture conditions. I have nothing further to add, and I'm excited to see what experiments come from the addition of this technique to the parasite field.
This excellent methods paper describes a detailed protocol for the adaptation of the Cleavage Under Targets & Release Using Nuclease (CUT&RUN) technique to Plasmodium falciparum, the causative agent of malaria. CUT&RUN is an alternative to ChIP-seq, and has the advantage that it does not require crosslinking of targets, which can introduce artifacts and cause issues with antibody recognition. CUT&RUN can also be performed with low numbers of cells and has an excellent signal to noise ratio, which the authors demonstrate by downsampling the number of reads used in their analysis. The authors also clearly demonstrate that profiling of histone modifications using CUT&RUN yields comparable results to ChIP-seq. Because it can be difficult to obtain large numbers of cells from Plasmodium cultures, CUT&RUN is especially useful in this important model system. Publication of a detailed protocol will help other Plasmodium researchers answer important questions regarding genomic localization for their targets of interest.
Reviewer #2 (Public Review):
Horton et al combined computational and functional approaches to identify a role for a mouse transposable element (TE) family in the transcriptional response to interferon gamma (IFNG, also known as type II interferon). This paper builds on previous work, some of which was done by the corresponding author, in which TE families have been shown to contribute transcription factor binding sites to genes in a species-specific manner. In the current work, the authors analyzed datasets from mouse primary macrophages that had been stimulated by IFNG to identify TEs that might contribute to the transcriptional response to IFNG treatment. In addition to previously identified endogenous retrovirus subfamilies, the authors identified sites from another TE family, B2_Mm2, that they found contained STAT1 transcription factor binding sites and whose binding by STAT1 was induced following IFNG stimulation. To test the hypothesis that a B2_Mm2 element was providing IFNG-inducibility to an associated gene, the authors chose one of the 699 mouse genes that had nearby (<50 kb) B2_Mm2 elements and was upregulated upon IFNG treatment in previous datasets. The gene they chose was Dicer1, which also is upregulated by IFNG in mouse macrophages but not in human primary macrophages, furthering the hypothesis that the presence of B2_Mm2 in mouse cells may provide IFNG-inducibility to Dicer1. Following KO of a ~500 bp region in two separate clones of immortalized mouse macrophages, the authors show a decrease in basal as well as IFNG-induced expression of Dicer1, providing support for their conclusion that a B2_Mm2 is important for IFNG-inducibility. The authors further show that two nearby genes that are also upregulated by IFNG, Serpina3f and Serpina3g, are also reduced at basal conditions as well as when stimulated with IFNG. The authors use these data to suggest that additional elements in the B2_Mm2 element in the Dicer1 gene, possibly CTCF elements, are have long distance effects on transcription of nearby genes.
Overall, this is an interesting and well written manuscript. The computational conclusions are supported by their data and add to the growing field of TEs and their role in transcription regulatory network evolution. While the authors do a good job of experimentally validating one example, inclusion of additional data, all of which they already have, as detailed below would substantially increase the applicability of their work and strengthen their conclusions about the broad role of TEs in the IFNG response in mice versus other species.
1) Following their genome-wide comparisons, the authors hone in on Dicer1 as an interesting example in which they hypothesize that a B2_Mm2 element near the Dicer1 gene could be contributing to the fact that this gene is upregulated by IFNG in mouse cells but not human cells. What would be very useful to the readers of this paper is knowing how many other examples there might be like this one. Adding DEseq values from human RNAseq data the authors already use (current references 10 and/or 37) for identifiable human orthologs to Table S7 would thus strengthen their conclusions. If Dicer1 is unique in this aspect of having (a) a nearby B2_Mm2 element and (b) a binary difference between inducibility in mouse versus human cells, that is interesting. If Dicer1 is not unique, that strengthens the authors' assertion that B2_Mm2 insertions have altered the transcriptional network in a host-specific manner. Either way, the answer is interesting, but without including this analysis, the authors leave out an important aspect of their work and it remains unclear how generalizable their conclusions are.
2) The results with Serpina3g and Serpina3F gene expression in the authors' knockout cells are very interesting. However, the authors focus almost exclusively on Serpina3g and Serpina3F, which makes it difficult to understand what is happening genome wide. Are other IFNG-induced genes (including those not on chromosome 12) similarly affected at the level of basal or induced transcription? How many genes are different in WT versus KO cells, both at basal and induced states? Does this correlate with their CUT&TAG data shown in Fig. 5? By focusing only on nearby genes (Serpina3g and Serpina3F), the authors hint that this may be a long range regulatory effect, "potentially mediated by the CTCF binding activity of the element" that they removed. But by only focusing on two nearby IFNG-induced genes, their data do not rule out the (also potentially quite interesting) possibility that there may be a more indirect role for this TE site or Dicer1 in basal transcription of IFNG-induced genes or IFNG-mediated gene expression. Providing more data on other genes throughout the genome in WT and KO cells, which the authors have generated but do not include in the manuscript, would help distinguish between these models. While a broader effect of these KOs on IFNG expression, or gene expression in general, would not fit as neatly with their model for local gene regulation, these analyses are needed to understand the effects of TE insertion on gene regulation.
Reviewer #3 (Public Review):
First of all, I enjoyed the manuscript by Horton et al. In the manuscript, they first re-analyzed published ChIP-seq data for STAT1 binding in INF-activated macrophages and found that a fourth of the >20,000 STAT1 binding sites were in transposable elements. Especially, about 10% of the total STAT1 binding sites were in B2_Mm2, a murine-specific SINE. They showed that these B2 elements are associated with H3K27ac signal upon INF treatment, thus likely serve as an INF-inducible enhancer through STAT1 binding. The authors then focus on the STAT1-bound B2_Mm2 in the Dicer1 gene (designated as B2_Mm2.Dicer1), and demonstrated that deletion of this B2 in a macrophage-like murine cell line resulted in loss of STAT1 binding, H3K27ac, and Dicer1 upregulation upon INF treatment. Their findings suggest that B2 transposition events has altered the transcriptional regulatory network in the innate immune response in the mouse.
The manuscript is well organized, and the findings are potentially interesting in terms of the evolution of species-specific regulatory networks of the innate immune response. But, I am not convinced with the enhancer role of the B2_Mm2.Dicer1 copy for the Dicer1 expression (see below).
Major Comments:
(1) In Fig. 4, the degree of Dicer1 induction by INF was small (1.2-fold or so), and accordingly the effect of the B2 deletion on the Dicer1 induction was also small. In addition, this B2 binds to CTCF, and its deletion should also eliminate CTCF binding. Therefore, it is difficult to conclude from the presented data that this B2 serve as an enhancer for Dicer1. The B2 may increase the frequency of transcription (as suggested by the authors), may serve as an obstacle for transcriptional elongation (via binding to CTCF), or may regulate the splicing efficiency. In Fig.5C, promoter acetylation level does not seem to be affected in KO1. Pol II either does not seem to be affected if the Pol II peak is compared to the background level. Taken together, the enhancer role is not supported by strong evidence.
(2) On the other hand, the authors discovered that the B2 deletion resulted in the decrease of Serpina3h, Serpina3g, Serpina3i and Serpina3f by >100-fold, which are 500 kb apart from the B2 locus. This is also interesting, and could be evidence for the B2 enhancer. Given that this B2 binds to both STAT1 and CTCF, the locus could interact with the Serpina3 locus to act as an enhancer. Were there STAT1 CUT&TAG peaks around the Serpina3 genes? Did H3K27ac and Pol II ChIP peaks in the Serpina3 promoters disappear in the KO cells? It would be interesting to see the IGV snapshots for H3K27ac, POLR2A and STAT1 ChIP-seq data around Serpina3 genes. In addition, HiC data for activated macrophages, if available, could be supportive evidence for the interaction between B2_Mm2.Dicer1 and the Serpina3 locus.
Minor Comments:
(3) Regarding Fig.1C, the authors calculated the B2 expression levels by mRNA-seq and DESeq2 analysis. But it does not accurately give the B2 transcription level, because the method does not discriminate B2 RNAs and B2-containing mRNA (and lncRNA as well). I wonder that the apparent upregulation of STAT1-binding B2 loci is due to the increase of Pol II transcription around the loci, rather than Pol III-mediated B2 transcription. This possibility should be discussed in page 6 after "Taken together, these data indicate that thousands of B2_Mm2 elements show epigenetic and transcriptional evidence of IFNG-inducible regulatory activity in primary murine bone marrow derived macrophages."
(4) Fig. 2B shows that about 70-80% of B2_Mm2 loci carry the STAT1 motif, whereas only a limited number (2-3%) of B2_Mm2 bind to STAT1. Is this because of differences in their motif sequences, in genomic locations, or in epigenomic environments? For example, do these STAT1-binding loci have a C-to-A mutation at the second last position in the GAS motif (TTCNNGGAA), like B2_Mm2.Dicer1 (shown in Fig. S4)? Can the authors discuss about it? In addition, although the consensus sequence of B2_mm2 has a GAS motif with only a single mismatch, the presence of the STAT1 motif in >70% of B2_Mm2 is surprising, given that their average divergence to the consensus sequence is about 10% (ref. 26 of the manuscript). Is the binding site significantly conserved in compare to the other regions of the B2 sequence?
GTD Card Icon : Square (check box)Tag : 4th block. Squared as open-loop first, and filled later as accomplished. The GTD is advanced To-Do system proposed by David Allen. Next action of your project is described and processed through a certain flow. The GTD cards are classified into this class. 4th block is squared as open-loop first, and filled later as accomplished. The percentage of GTD Cards in my dock is less than 5 %.
Posted byu/raphaelmustermann9 hours agoSeparate private information from the outline of academic disciplines? .t3_xi63kb._2FCtq-QzlfuN-SwVMUZMM3 { --postTitle-VisitedLinkColor: #9b9b9b; --postTitleLink-VisitedLinkColor: #9b9b9b; --postBodyLink-VisitedLinkColor: #989898; } How does Luhmann deal with private Zettels? Does he store them in a separate category like, 2000 private. Or does he work them out under is topics in the main box.I can´ find informations about that. Anyway, you´re not Luhmann. But any suggestions on how to deal with informations that are private, like Health, Finances ... does not feel right to store them under acadmic disziplines. But maybe it´s right and just a feeling which come´ out how we "normaly" store information.
I would echo Bob's sentiment here and would recommend you keep that material like this in a separate section or box all together.
If it helps to have an example, in 2006, Hawk Sugano showed off a version of a method you may be considering which broadly went under the title of Pile of Index Cards (or PoIC) which combined zettelkasten and productivity systems (in his case getting things done or GTD). I don't think he got much (any?!) useful affordances out of mixing the two. In fact, from what I can see looking at later iterations of his work and how he used it, it almost seems like he spent more time and energy later attempting to separate and rearrange them to get use out of the knowledge portions as distinct from the productivity portions.
I've generally seen people mixing these ideas in the digital space usually to their detriment as well—a practice I call zettelkasten overreach.
Snorkelling surveys were conducted at each site to observe fish locations
Another method with questionable accuracy. A big question that arises is how can you tell different fish apart from one another without a tag and release system?
Reviewer #1 (Public Review):
In this paper, the authors use purified Xenopus γ-TuRCs and experiments in cell extract combined with cutting edge imaging techniques to investigate whether binding of the γ-TuNA fragment can activate γ-TuRCs. The authors show that γ-TuNA fragments from both humans and Xenopus are obligate dimers and that dimerization is necessary for γ-TuRC binding. They further show, using direct visualisation of microtubule nucleation from individual purified γ-TuRCs, that γ-TuNA binding increases the nucleation efficiency of γ-TuRCs by ~20 fold, helping to overcome negative regulation by Strathmin.
γ-TuNA, otherwise known as the CM1 domain, CM1 motif or CM1 helix, is well conserved and found within the N-terminal region of proteins across evolution. These proteins bind and recruit γ-TuRCs to MTOCs, such as the centrosome, meaning that γ-TuRC recruitment and activation could be closely linked. Earlier studies had provided strong evidence that binding of γ-TuNA activated γ-TuRCs, hence the name "γ-TuRC mediated nucleation activator" (Choi et al., 2010), and this claim was supported by similar work a few years later (Muroyama et al. 2016). Moreover, several other studies showed that expressing in cells γ-TuNA, or equivalent protein fragments, led to ectopic microtubule nucleation in the cytoplasm, with some of the studies showing that mutations preventing the binding of these fragments to γ-TuRCs ablated this effect (Choi et al., 2010; Lynch et al., 2014; Hanafusa et al., 2015; Cota et al., 2016; Tovey et al., 2021). Collectively, therefore, it was accepted that binding of these fragments somehow activated γ-TuRCs. More recent data, however, including from the authors themselves, had provided evidence that γ-TuNA binding did not activate γ-TuRCs (Liu et al., 2019; Thawani et al., 2020). A major objective of this paper was therefore to help resolve this controversy. The author's data suggest that the ability of these fragments to activate γ-TuRCs depends upon the type and position of tag attached to the N-terminus of the γ-TuNA fragment, with large tags seemingly turning γ-TuNA into a γ-TuRC inhibitor (although they also note that one of the previous studies, which concluded γ-TuNA was an activator, had also used fragments with large N-terminal tags). The authors also insist that the new results benefit from a much-improved γ-TuRC purification protocol that results in higher yield and purity. This purification approach uses the affinity of the γ-TuNA fragment and so could be adopted by others in the field.
The major strength of this paper is directly showing, using very powerful single molecule imaging and their improved protocols, that γ-TuNA is a γ-TuRC activator, thus resolving the controversy that has existed for the last few years. The weakness is that we still don't learn how γ-TuNA binding activates γ-TuRCs (this has been proposed to be via structural changes but other mechanisms can be considered), and thus there is little conceptual advance from the original Choi et al. 2010 paper, which had already concluded that γ-TuNA binding increased the nucleation efficiency of γ-TuRCs. Moreover, the authors do not include experiments with the other proposed γ-TuRC activator, XMAP215, which they have investigated previously (Thawani et al., 2020), and so we are left wondering whether γ-TuNA and XMAP215 work together or as part of separate activation pathways.
Overall, this paper is timely as it finally resolves the controversy over γ-TuNA and it is admirable that the authors are willing to directly address and correct their previous conclusion. The data is solid and well-presented and the text is clear and has appropriate citations. In my opinion, papers that clarify the literature are just as important as those that make conceptual advances.
Reviewer #2 (Public Review):
This is the first report that establishes gamma-TuNA as an activator of gamma-TuRC-dependent microtubule-nucleation, using purified components. This is an in-depth study that establishes experimental conditions under which gamma-TuNA can function as an activator (dimerization of gamma-TuNA, appropriately sized N-terminal tag) and clarifies why similar attempts to study gamma-TuNA have failed in the past. I think that the information in this manuscript will be of immense value to the scientific community, as it resolves a long-standing mystery concerning the function of gamma-TuNA. A key question that still remains unanswered is whether the gamma-TuNA-dependent activation mechanism involves a conformational change of the gamma-TuRC, from an asymmetric to a ring-shaped template structure, but this may be beyond the scope of the present submission.
ss="footer">
I think you could have used a <footer>tag instead of creating a footer class.
Skip to content In this repository All GitHub ↵ Jump to ↵ No suggested jump to results In this repository All GitHub ↵ Jump to ↵ In this organization All GitHub ↵ Jump to ↵ In this repository All GitHub ↵ Jump to ↵ Dashboard Pull requests Issues Codespaces Marketplace Explore Sponsors Settings caitgarland Sign out New repository Import repository New gist New organization Sorry, something went wrong. / ... / nic-dgl103-f22 / assignment-c-dlu-... / Clear Command Palette Tip: Type # to search pull requests Type ? for help and tips Tip: Type # to search issues Type ? for help and tips Tip: Type # to search discussions Type ? for help and tips Tip: Type ! to search projects Type ? for help and tips Tip: Type @ to search teams Type ? for help and tips Tip: Type @ to search people and organizations Type ? for help and tips Tip: Type > to activate command mode Type ? for help and tips Tip: Go to your accessibility settings to change your keyboard shortcuts Type ? for help and tips Tip: Type author:@me to search your content Type ? for help and tips Tip: Type is:pr to filter to pull requests Type ? for help and tips Tip: Type is:issue to filter to issues Type ? for help and tips Tip: Type is:project to filter to projects Type ? for help and tips Tip: Type is:open to filter to open content Type ? for help and tips We’ve encountered an error and some results aren't available at this time. Type a new search or try again later. No results matched your search Top result Commands Type > to filter Global Commands Type > to filter This Page Files Pages Access Policies Organizations Repositories Issues, pull requests, and discussions Type # to filter Teams Users Projects Modes Use filters in issues, pull requests, discussions, and projects Search for issues and pull requests # Search for issues, pull requests, discussions, and projects # Search for organizations, repositories, and users @ Search for projects ! Search for files / Activate command mode > Search your issues, pull requests, and discussions # author:@me Search your issues, pull requests, and discussions # author:@me Filter to pull requests # is:pr Filter to issues # is:issue Filter to discussions # is:discussion Filter to projects # is:project Filter to open issues, pull requests, and discussions # is:open nic-dgl103-f22 / assignment-c-dlu-chelsieadam Private Unwatch Stop ignoring Watch 0 Notifications Participating and @mentions Only receive notifications from this repository when participating or @mentioned. All Activity Notified of all notifications on this repository. Ignore Never be notified. Custom Select events you want to be notified of in addition to participating and @mentions. Get push notifications on iOS or Android. Custom Custom Select events you want to be notified of in addition to participating and @mentions. Issues Pull requests Releases Discussions Discussions are not enabled for this repository Security alerts Apply Cancel Fork 0 Starred 0 Star 0 Code Issues 0 Pull requests 0 Actions Projects 0 Security Insights More Code Issues Pull requests Actions Projects Security Insights Open in github.dev Open in a new github.dev tab Permalink main Switch branches/tags Branches Tags View all branches View all tags assignment-c-dlu-chelsieadam/contact.html Go to file Go to file T Go to line L Copy path Copy permalink This commit does not belong to any branch on this repository, and may belong to a fork outside of the repository. chelsieadam Fixed Validation issues Latest commit 44427b0 5 days ago History 2 contributors Users who have contributed to this file 63 lines (57 sloc) 2.04 KB Raw Blame Edit this file E Open in github.dev . Open in GitHub Desktop Open with Desktop View raw Copy raw contents Copy raw contents Copy raw contents Copy raw contents View blame <!DOCTYPE html> <html lang="en"> <head> <link rel="stylesheet" href="style.css"> <link rel="icon" type="image/x-icon" href="images/favicon.ico"> <meta charset="UTF-8"> <meta http-equiv="X-UA-Compatible" content="IE=edge"> <meta name="viewport" content="width=device-width, initial-scale=1.0"> <link rel="preconnect" href="https://fonts.googleapis.com"> <link rel="preconnect" href="https://fonts.gstatic.com" crossorigin> <link href="https://fonts.googleapis.com/css2?family=Open+Sans&family=Raleway:wght@700&display=swap" rel="stylesheet"> <title>Hairpins Salon Contact Page</title> </head> <body> <header> <a href="index.html"><img src="images/hairpins-salon-logo.png" alt="hairpins Logo" width="300"></a> <nav> <ul> <li><a href="index.html">Home</a></li> <li><a href="services.html">Services</a></li> <li><a href="contact.html">Contact Us</a></li> </ul> </nav> </header> <h1>Contact Us</h1> <br> Questions, comments, ready for a new do?<br> We look forward to hearing from you!<br> If you're looking to make an appointment online, please do so here.<br> <br> Monday ~ Closed<br> Tuesday 9:00am ~ 5:00pm<br> Wednesday 9:00am ~ 8:00pm<br> Thursday 9:00am ~ 8:00pm<br> Friday 9:00am ~ 5:00pm<br> Saturday 9:00am ~ 4:00pm<br> Sunday ~ Closed<br> <br> Hairpins Boutique Salon<br> #4 - 224 6th Street<br> Courtenay, BC V9N 1M1<br> <br> <a href="https://www.google.com/maps/place/Hairpins+Boutique+Salon/@49.6904218,-124.9971279,15z/data=!4m2!3m1!1s0x0:0x859b2cfce3bc31ea?sa=X&ved=2ahUKEwiYi_2Ex6T6AhXNMjQIHYkoCUUQ_BJ6BAhSEAc)">Check us out on Google Maps</a><br> <br> Tel: (250) 338-7467<br> <a href="tel:250-338-7467">Click to Call</a><br> <br> Email: salon.hairpins@gmail.com <br> <a href="mailto:salon.hairpins@gmail.com">Email us</a><br> <br> <a href="contact.html">Conctact us today to book an appointment!</a> <br> <div class="footer"> Content taken from<a href="http://www.hairpins.ca/">https://www.hairpins.ca/</a>Used for educational purposes only. </div> </body> </html> Copy lines Copy permalink View git blame Reference in new issue Go Footer © 2022 GitHub, Inc. Footer navigation Terms Privacy Security Status Docs Contact GitHub Pricing API Training Blog About You can’t perform that action at this time. You signed in with another tab or window. Reload to refresh your session. You signed out in another tab or window. Reload to refresh your session. .user-mention[href$="/caitgarland"] { color: var(--color-user-mention-fg); background-color: var(--color-user-mention-bg); border-radius: 2px; margin-left: -2px; margin-right: -2px; padding: 0 2px; } assignment-c-dlu-chelsieadam/contact.html at main · nic-dgl103-f22/assignment-c-dlu-chelsieadam
Similar comments - I would use unordered lists and paragraph elements where necessary!
Also, I found there is an < address > tag you could use. Learn more: https://www.w3schools.com/tags/tag_address.asp
The concept of assigning a price tag to a life has always made people intensely squeamish.
Introduction ends
biomonitoring
Reviewer 4. Christina Lynggaard
This manuscript assesses the variation in arthropod communities in three ecoregions in Canada. The study is well done, and the sampling was very thorough with a big sampling effort. I only have minor comments. Specially I consider that the aim can be focused on the ecoregions instead of the feasibility of the method, as this has already been shown. In addition, it would be nice to have more details in certain sections in the data analyses and in the results. I have addressed these comments below. -I am not sure why the title "Message in a bottle". -Line 65- Could you specify which indicator species have been targeted? Or cite studies that target those species? - Line 96- Based on the limitations of the ecoregions, it is not clear why ecoregions are an obvious candidate. -In line 104 seems that your aim is to demonstrate how feasible is to use metabarcoding for large-scale monitoring and that you use the ecoregions to prove that. However, showing the feasibility of this method for large-scale studies has already been done (e.g. Svenningsen et al 2021, Detecting flying insects using car nets and DNA metabarcoding; Bush et al 2020, DNA metabarcoding reveals metacommunity dynamics in a threatened boreal wetland wilderness). I suggest keeping it focused on the need to apply this method in different ecoregions. -In the Data description section, you mention that you examined phylogenetic diversity, but in the Analyses section you vaguely mention it. The phylogenetic diversity findings are discussed later on, but it is difficult to follow the discussion when the results were not presented previously. In addition, the authors use the findings in phylogenetic diversity to support the idea of a structure in the ecoregions, so I suggest making more emphasis in this in the results section. -Line 189. I agree that the higher number of BINs could be due to eDNA, but couldn't another reason be that the BINs were oversplit during data analysis? -Line 215-217. Has this been found previously in other studies using Malaise trap? If so, please reference to those findings. -Line222- This is a brief discussion about temporal turnover. However, these results are not presented previously, or at least not clearly enough. -Line 266-267- Yes, you showed compositional shifts using metabarcoding in bulk arthropod samples, but the way this sentence is structured it sounds like you are the first to show this. Compositional shifts in arthropods have been shown previously in other studies using metabarcoding. -Line 321- Did you have negative PCR controls? In line 326 you mention negative controls, but I assume you refer to the extraction negative controls. -Line 340- It is not clear why you queried the data against a bacterial library. -Line 348- What was the reason for choosing "at least three reads"? and the same for line 350 where you cluster sequences with a minimum of 5 reads per cluster. -Line 357- If you see tag switching in your negative controls that means that most likely you have it in the rest of the data. How did you ensure that the rest of the data did not have that? You may have tags switching in sequences not found in the negative controls but found in your samples. -Line 369- As you used the Bray-Curtis index in this metabarcoding data, did you convert your data to presence/absence? It is known that for metabarcoding data the use of read numbers for community analysis is not adequate (see Nichols et al 2018 "Minimizing polymerase biases in metabarcoding") .
When people first see your Twitter, without even having to scroll down, they should knowThe name of our Game (make this your Twitter tag, not your company name!)Gameplay footage of our game pinned to the top of the feedOur unique selling point/elevator pitchWhat our logo looks likeWhat genre the game isWhere our Discord isWhere our Patreon isWhere our Facebook isOur email address
Modular Monolith: Domain-Centric Design
2) Install the Community Plugin — Tag Wangler
already installed
1) Ensure the following Core Obsidian plugins are turned ON: Go to Obsidian Settings > Core plugins, and turn on:✅ Backlinks✅ File Explorer✅ Graph view✅ Quick Switch✅ Slash Command✅ Tag panes
Done !
#BOOK and #book are treated as the same tag. Folders and links ARE case-sensitive.
les tags ne prend pas en compte le majuscule et le minuscule
Note: This rebuttal was posted by the corresponding author to Review Commons. Content has not been altered except for formatting.
Learn more at Review Commons
Thank you for giving us the opportunity to submit a revised draft of the manuscript “Tup1 is Required for Transcriptional Repression Necessary in Quiescence in S. cerevisiae” to Review Commons. We appreciate the time and effort that you and the other reviewers dedicated to providing feedback on our manuscript and are grateful for the insightful comments on and valuable improvements to our paper. We believe that the experiments suggested in these comments would bring clarity to the manuscript, and wish that we had the ability to perform them all. Unfortunately our lab is closing, and the only remaining lab member is the PI, so we are only able to perform limited experiments to address some of the concerns raised during review. We have incorporated several changes in response to comments from the reviewers. Those changes are highlighted within the manuscript. Please see below, in blue, for a point-by-point response to the reviewers’ comments and concerns. All page numbers refer to the revised manuscript Word file with tracked changes.
Of particular note is the discussion of cellular morphology of the tup1∆ and sds3∆ strains. We realize that our findings are purely descriptive, and are not surprised that all three reviewers had comments on this data. This was the source of much discussion among the authors and consultation with other labs; we debated even including these observations in the manuscript, since we were unable to figure out the underlying mechanism. Ultimately we decided that it was worth reporting in case other labs may benefit from the knowledge, and we have altered the language in the manuscript (page 6) to better reflect this. However, if the reviewers feel that this observation would be better left out of the manuscript, we would be willing to remove Figure 6 and any discussion of these images.
Reviewer #1 Comments:1. The authors chose to examine 3-day SP cells to interrogate quiescence because tup1∆ cells are highly flocculant, interfering with the isolation of purified quiescent cells. These cells are a mixture of both nonquiescent and quiescent cells, so it is not correct to state that they represent a quiescent cell population. The addition of EDTA to the gradients used to isolate quiescent cells could eliminate flocculation and permit the isolation of quiescent cells. EDTA is also often added to media in low amounts to reduce flocculation. The authors need to indicate the proportion of quiescent cells in their SP cultures by applying these tools.
We appreciate the suggestion, but the phenotype of this strain is not typical flocculation (see photo below, also added to the paper as Supplementary Figure 1). We did add EDTA (pH 8.0) to a final concentration of 10 mM to two separate tup1∆ and it did not visibly affect the clumping of cells. Furthermore, changes to the cell wall are a distinct feature of quiescent S. cerevisiae and contribute to the ability to separate different cell types by density-gradient centrifugation, so it is difficult to anticipate how EDTA would affect our ability to isolate Q cells. We have provided more explanation in the manuscript to better explain this (page 3).
- The authors reported that while Xpb1 and Tup1 share many overlapping binding sites, but that Xbp1 does not regulate Tup1's binding. What other factors might be responsible for their shared binding? Could histone deacetylation play a role? This could be addressed by a Tup1 ChIP in an sds3∆ mutant.
This is a good thought; histone acetylation levels may have a role in regulating Tup1 localization and we would have liked to address this if we had more time. Unfortunately, we had some difficulty performing ChIP of Tup1, because initially we used a FLAG tag which caused a phenotype similar to deletion of Tup1, and had to switch to making myc-tagged strains. This delay meant we did not have time to pursue creating myc-tagged Tup1 in an sds3∆ strain, and now we do not have the ability to follow up on this for revisions.
- Has PolII occupancy been examined in Log vs SP cells of tup1∆ to determine if Tup1 inhibits PolII association with its genes that are repressed ?
We did not look at PolII occupancy in our Tup1 deletion, and could not find any existing datasets with this information. It is our hope that another lab is able to carry out this experiment, because it could be very enlightening, but it is beyond the scope of this work.
- The observation that tup1∆ cells have several nuclear puncta is intriguing, although the cytological images need to be improved.
The nuclear puncta we see in the tup1 deletion are definitely a puzzle. We had limited time to investigate this phenomena, and in discussing the matter with some other labs it seemed doubtful that more advanced imaging would yield anything of use to us. We realized that we accidentally omitted important details for this figure and have updated the manuscript to add them. We imaged 2 biological replicates for each strain and imaged many yeast samples for each strain (which has been added to the caption for Figure 6) and found that our findings were statistically significant (p
Reviewer #2 Comments1. The authors acknowledge that it would be better to work with purified quiescent cells but couldn't isolate pure populations. As a result, a mixture of quiescent and nonquiescent cells are analyzed in stationary phase. They say this is because Tup1 deletion strains are flocculent. But they performed ChIP-Seq on Myc-tagged Tup1 strain. Don't these cells express Tup1? If not, could this be performed in wild-type yeast with Myc-tagged Tup1? It seems important to separate quiescent from nonquiescent yeast for the authors' conclusions.
It is true that we could have done ChIP-seq for Tup1 in purified Q cells. We considered it, but decided to look at the mixed population so that we could directly compare our RNA-seq results from the tup1∆ strain. It’s a balance between having some results that are specific to quiescence, versus being able to directly compare the effects of deletion of Tup1 at the sites where it binds. We are now unable to perform this experiment, but we have updated the language in the manuscript (page 3) to better reflect this choice.
- The Chipseq data in Fig 1B do not have a y axis and it is consequently not clear whether these data are normalized and shown with the same axis.
Thank you for pointing this out - these data are normalized to RPKM during processing, and we have updated the caption for figure 1 and the methods on page 10 to reflect this information. Normalizing the data in IGB itself, however, causes an adjustment in the y-axis that makes the tracks appear to be inconsistent. In any case, we are not making claims about the relative amount of signal, and as it is common in the field to not include y-axes on IGB tracks, we have opted to keep the y-axis for Figure 1B as-is.
- In Fig 2, it seems important to determine how many genes are different between WT and Tup1 deletion strains in log phase. Are just as many genes different? Or is Tup1 more important in diauxic shift and stationary phase than log phase?
We did intend to focus only on diauxic shift and stationary phase data for this paper, since there has already been so much work on the role of Tup1 in log phase. As mentioned above, comparisons of RNA between log and DS/Q is difficult. We attempted to find a publicly available dataset to perform some analysis for revisions, but unfortunately most previous work on the effect of Tup1 on transcription was performed via tiling arrays, which is not comparable.
- Are the genes that are regulated by Tup1 normally regulated during diauxic shift or stationary phase compared with log growth?
Because there is a massive global decrease in the level of total RNA in diauxic shift and quiescence (McKnight, Boerma, et al., 2015) it is impossible to directly compare transcript levels between these states in our experiments. If there was time, we could have attempted to repeat these experiments with an external spike-in control; this is potentially something another lab could do to follow up on our findings.
- What fraction of the genes that are differentially expressed in Tup1 knockout yeast have Tup1 binding at the promoter? Enhancer? What fraction can be explained by Tup1, Hap1, Nrg1, Mig1 individually and together?
We have added the number of genes that are differentially expressed in Tup1 knockout yeast during DS to the manuscript (page 3). Regarding enhancers, the genome of S. cerevisiae is very compact, and there is not evidence of long-distance activation of genes as seen in metazoans (Dujon, 1996; Dobi & Winston, 2007; Spiegel and Arnone, 2021). Upstream activating sequences (UASs) are generally considered the closest equivalent to enhancers in cerevisiae, and they tend to function within a few hundred base pairs of the promoter. Our analysis only identifies the nearest gene; it would be difficult to parse out locations in the promoter versus a UAS without a more advanced analysis that is beyond our capabilities now.
As for the effect of Hap1, Nrg1, and Mig1, we were able to look for their motifs in the genes that are differentially expressed in the Tup1 knockout but we do not have binding data for these factors in quiescence or stationary phase so it is impossible to conclusively state what role those TFs play. This would be a very interesting followup to our work, but is outside the scope of this manuscript.
References:
Dujon, B. 1996. The Yeast Genome Project: What did we learn? Trends Genet. 12, 263-270.
Dobi, K.C.; Winston, F. 2007. Analysis of Transcriptional Activation at a Distance in Saccharomyces cerevisiae. Mol Cell Biol. 27(15), 5575-5586. https://doi.org/10.1128/MCB.00459-007
Spiegel, JA; Arnone, J.T. 2021.Transcription at a Distance in the Budding Yeast Saccharomyces cerevisiae. Appl. Microbiol. 1(1), 142-149. https://doi.org/10.3390/applmicrobiol1010011
- The methodology used to generate the gene ontology enrichments should be described in the methods.
Thank you for noticing this omission; we have added the relevant information to the manuscript (page 10) and have also added the related citation (page 11).
- The authors should provide genomewide data to support the statement that Tup1 and Rpd3 ChIP datasets have substantial overlap. They should also provide genomewide data to support the statement that there is substantial overlap between Rpd3 and Tup1. How much overlap is observed and how much is expected by chance?
We have compared the existing ChIP data for Rpd3 binding in quiescent cells to our ChIP data for Tup1 in 3-day cultures and included this in the manuscript (page 4, Supplementary Figure 2B), along with a p-value.
- For Sds3, similar to Tup1 inactivation, it would be helpful to know how many genes change in with Sds3 inactivation in log phase in addition to diauxic shift and stationary phase.
As with our response to comment #3, we focused only on diauxic shift and stationary phase data for this paper, and analysis of this data would be difficult without a spike-in control. While there are some existing datasets for RNA-seq of Rpd3 knockouts, this would include both Rpd3L and Rpd3S activity, rather than just Rpd3L, which is our focus with the Sds3 deletion strains. As such, we did not perform RNA-seq of sds3∆ in log phase.
- If the argument is that Sds3 and Xbp1 cooperate with Tup1 to affect gene expression, testing the gene expression changes that are associated with Tup1 in Sds3 or Xbp1 knockout strains would help the authors make this point.
We do not have tup1∆/sds3∆ or tup1∆/xbp1∆ double knockout strains. We attempted to make these strains but could not, which may indicate that these double deletions are synthetic lethal. Deletion of sds3 alone causes a significant reduction in growth rate, so it is perhaps not surprising that we could not create the double knockouts.
- The final phenotype of extra DAPI positive blobs in the nucleus is not very specific or clear.
We agree, please see our comments at the top of this letter.
Reviewer #3 (Major comments):Did tup1∆/sds3∆ double mutant show the same phenotype with tup1∆ (or sds3∆) single mutant in G0? If Tup1 actually plays role in tandem with Sds3 in the gene regulation during G0, the epistatic relationship might be estimated.
We do not have tup1∆/sds3∆ or tup1∆/xbp1∆ double knockout strains. We attempted to make these strains but could not, which may indicate that these double deletions are synthetic lethal. Deletion of sds3 alone causes a significant reduction in growth rate, so it is perhaps not surprising that we could not create the double knockouts.
The histone acetylation was not synergistically augmented in the above double mutant?
Please see the response above.
The authors showed that tup1∆ but not sds3∆ cells contain multiple DAPI signals but sds3∆ cells show abnormal cell shape in G0 phase. These phenotypic abnormalities in these mutants suggest a potential mitotic defect. Both mutants showed very similar abnormalities in H3K23 acetylation and gene expressions in quiescent state. Why these showed distinctly different abnormality in cell morphology during G0?
Unfortunately we were unable to investigate this further.
Did iswi2∆ cells also show abnormality in G0 phase?
No, they did not; thank you for asking, this is a good question. We have added this information to the manuscript (page 6).
(Minor comments)Supplementary figure1. This data seems to be very important. I recommend to use this data in the main figure with statistical analysis (p-values) to show the significant overlap of Tup1 and Rdp3 distribution.
We have compared the existing ChIP data for Rpd3 binding in quiescent cells to our ChIP data for Tup1 in 3-day cultures and included this in the manuscript (page 4, Supplementary Figure 2B) . We do feel that this data belong in the supplement, however, because the data is not exactly equivalent to our studies: quiescent cells and 3-day cultures are not the same, and knockout of Rpd3 eliminates function of both Rpd3L and Rpd3S complexes, while knocking out Sds3 targets only the Rpd3L complex.
Figure 4. Histone acetylation level data in Figure 4A and the data for gene repressions by Tup1 and Sds3 in Figure 4C seem to be very important. However, statistical analysis data (p-values) was not presented. Please show the statistical analysis data (p-values) as in figure 3 to show that the Tup1 and Sds3 contribute similarly in histone deacetylation and repression. The author did not find the significant changes of histone deacetylation in xbp1∆ cells but said that when filtered in Xbp1 binding motif Xbp1 depletion has similar effect on the acetylation level. Please show this data.
We have added language in the manuscript comparing genes with altered acetylation levels to those that are differentially expressed in our RNA-seq datasets, along with a p-value, to page 5.
https://www.reddit.com/r/antinet/comments/xyhpq4/2015_exhibition_of_roland_barthes_zettelkasten/
Johanna Daniel has some interesting reflections (in French) about Barthes' reading, note taking, and writing processes: http://johannadaniel.fr/isidoreganesh/2015/06/archives-roland-barthes/ Perhaps most importantly she's got some photos from an exhibition of his work which includes portions of his note cards and writing. Roland Barthes' note cards on the Sorrows of Young Werther by Goethe. And you thought your makeshift cardboard boxes weren't "enough"? Want more about Barthes' practice? Try my digital notes: https://hypothes.is/users/chrisaldrich?q=tag%3A%22Roland+Barthes%22
<style> body { font-family: "Trirong", serif; font-weight:400;
I'm pretty sure you can add this to your style.css page as it's considered a css tag?. I think this is mixing html & css into one sheet which can become confusing.
br
The BR tag is already self closing, therefore you don't need to have a closing tag. A BR tag by it's self is perfectly fine.
Stylist
p tag!
Located
p tag, It'll still load properly without but it's needed.
You can display the file name and link to your generated PDF in your Gravity Forms confirmation message using merge tags. When editing a confirmation message, there will be a Fillable PDFs group at the bottom of the merge tag drop down. Every configured Fillable PDFs feed will have three merge tags available: one that displays a properly formatted link with the PDF URL and file name, one for only the file name, and one for only the PDF URL.
The fillable pdf IDs are found in the url for each form on the fillable pdf page
Where does clicktivism end and algorithmic gaming begin?
This linked article was super interesting to me. I had never heard of the term "clicktivism" before but it made a lot of sense to hear that, because many online seem to feel like helping things to trend is a notable part of activism, and this in turn can lead to behavior paltforms find suspicious. It's true that it does have its share of impact- causes and people in need can reach more people than was ever possible thanks to the internet- but it has also led to some odd cultural quirks online when it comes to giving such issues a platform. Occasionally the goal to "boost awareness" or publicly declare yourself aligned with the "right" or "correct" cause can overpower the actual execution of concrete, meaningful action. The term "performative activism" also encompasses this phenomenon, in which people publicly post a lot about a tag or trend to sort of assure their followers they too are on the right side of affairs. Accounts that are clearly mining activist circles for engagement (even if they are helping to spread awareness of issues) can definitely act similarly to bots or spammers.
Review coordinated via ASAPbio’s crowd preprint review
This review reflects comments and contributions by Ruchika Bajaj, Gary McDowell, Sree Rama Chaitanya Sridhara. Review synthesized by Iratxe Puebla.
The preprint studies the process for mitochondrial targeting of mitochondrial precursor proteins. Using a yeast model, experiments show that the cytosol transiently stores matrix-destined precursors in dedicated granules which the authors name MitoStores. The formation of MitoStores is controlled by the heat shock proteins Hsp42 and Hsp104, and suppresses the toxicity arising from non-imported accumulated mitochondrial precursor proteins.
The manuscript is clear and well-written. The reviewers raised a few comments and suggestions as outlined below:
The introduction was extremely clear and provides a good summary of the protein homeostasis dimension of the problem in question. However, there could be a clearer discussion of the processes of import, in particular with respect to the results discussing “clogging”. It is suggested to add a penultimate transitional paragraph in the introduction that facilitates this transition e.g. this could be expansion of the first paragraph in the Results section, moved into the introduction to provide more context about the cloggers, PACE, and the Rpn4-mediated proteasomal regulation.
Figure 2E and Figure S2 - Can some further explanation be provided about what data belongs to delta-rpn otr WT, or whether the associated fold change is reported - delta-rpn/WT.
Results ‘while the levels of most chaperones were unaffected or even reduced in Δrpn4 cells, the disaggregase Hsp104 and the small heat shock protein Hsp42 were considerably upregulated (Fig. 2F, G)’ - Suggest adding some further clarification as to why Hsp104 and Hsp42 are selected despite perturbations in other protein partners. Are there other proteins than proteosomes and chaperones which are significantly up- or down-regulated? STRING or cytoscape tools may help with the interactome analysis.
Figure 3
Results ‘protein accumulated at similar levels as Hsp104-GFP in the yeast cytosol (Fig. S4B)’ - Please clarify whether the image reports qualitative or quantitative data, and how the levels of DHFR-GFP and Hsp104-GFP are compared based on S4B.
‘Owing to the striking acquisition of nuclear encoded mitochondrial proteins in these structures, we termed them MitoStores’- Suggest providing some discussion about the fraction of Hsp104 that is part of the MitoStores? Does a major portion of Hsp104 in the absence of Rpn4 form MitoStore structures?
<br>
I get what you're trying to do here with the "br" tag, but it falls apart when the window is resized. I think wrapping the content in an element and styling it with a max-width property would be better, as this would prevent it from become really long on wide displays while letting it resize dynamically on small displays
html
use root tag for style the full html file
/>
closing tag should be use on same line.
</figcaption>
That closing tag should be closed on the same line.
<!DOCTYP
main tag is not used as it is written in instructions to use definitely .
<body>
main tag should be used as per instructions.
<dl>
dl tag is good but in instructions they ask to use embedded style for remove the bullets .so read carefully all the instructions
<br>Meet the Team<br>
Breaks make sense but this text is not surrounded by an element tag. Something like: <br>
<br>
makes it possible to format that line.
and
Again, Maybe add a (p) tag as it's text.
Located
I'm not to sure what happened here maybe it didn't go through when you committed? There's no (p) tag for the text here? there is for a couple of text's but some don't have anything? Key part!
Reviewer #1 (Public Review):
In one of the most creative eDNA studies I have had the pleasure to review, the authors have taken advantage of an existing program several decades old to address whether insect declines are indeed occurring - an active area of discussion and debate within ecology. Here, they extracted arthropod environmental DNA (eDNA) from pulverized leaf samples collected from different tree species across different habitats. Their aim was to assess the arthropod community composition within the canopies of these trees during the time of collection to assess whether arthropod richness, diversity, and biomass were declining. By utilizing these leaf samples, the greatest shortcoming of assessing arthropod declines - the lack of historical data to compare to - was overcome, and strong timeseries evidence can now be used to inform the discussion. Through their use of eDNA metabarcoding, they were able to determine that richness was not declining, but there was evidence of beta diversity loss due to biotic homogenization occurring across different habitats. Furthermore, their application of qPCR to assess changes in eDNA copy number temporally and associate those changes with changes to arthropod biomass provided support to the argument that arthropod biomass is indeed declining. Taken together, these data add substantial weight to the current discussion regarding how arthropods are being affected in the Anthropocene.
I find the conclusions of the paper to be sound and mostly defensible, though there are some issues to take note of that may undermine these findings.
Firstly, I saw no explanation of the requisite controls for such an experiment. An experiment of this scale should have detailed explanations of the field/equipment controls, extraction controls, and PCR controls to ensure there are no contamination issues that would otherwise undermine the entirety of the study. At one point in the manuscript the presence of controls is mentioned just once, so I surmise they must exist. Trusting such results needs to be taken with caution until such evidence is clearly outlined. Furthermore, the plate layout which includes these controls would help assess the extent of tag-jumping, should the plate plan proposed in Taberlet et al., 2018 be adopted.
Second, without the presence of adequate controls, filtering schemes would be unable to determine whether there were contaminants and also be unable to remove them. This would also prevent samples from being filtered out should there be excessive levels of contamination present. Without such information, it makes it difficult to fully trust the data as presented.
Finally, there is insufficient detail regarding the decontamination procedures of equipment used to prepare the samples (e.g., the cryomil). Without clear explanations of the steps the authors took to ensure samples were handled and prepared correctly, there is yet more concern that there may be unseen problems with the dataset.
Kanadia
interesting... I looked this up and (info coming from not the most reliable website) it seems as though this spelling may just have been one of Whitman's idiosyncracies. No real reason behind it, just a quirk of Whitman's
Clark, Brooke. “Walt Whitman – Wow – Canada!” Wow, https://wowcanada.wordpress.com/tag/walt-whitman/.
Review coordinated via ASAPbio’s crowd preprint review
This review reflects comments and contributions by Luciana Gallo, Claudia Molina Pelayo, Sónia Gomes Pereira, Asli Sadli. Review synthesized by Iratxe Puebla.
The preprint examines the meiotic recombination co-factor MND1 and its role in the repair of double-strand breaks (DSBs) in somatic cells. The paper reports that MND1 stimulates DNA repair through homologous recombination (HR) but is not involved in the response to replication-associated DSBs. MND1 localization to DSBs occurs through direct binding to RAD51-coated ssDNA. MND1 loss potentiates the G2 DNA damage checkpoint and the toxicity of IR-induced damage, opening avenues for therapeutic intervention, particularly in HR-proficient tumors.
The reviewers raised some minor comments and suggestions on the work:
Results ‘Therefore, we conclude that MND1-HOP2 are ubiquitously expressed proteins’ - we understand that the study looked at the transcript's expression level and not protein levels, consider revising this sentence.
Figure 1F - Due to the differences in intensity for the loading control, recommend quantifying the normalized level of MND1.
‘we used live-cell imaging of RPE1 cells’- Are these cells p53 KO? In Suppl. Figure 1K, RPE Delpta-p53 cells are used , but the HALO tag was introduced in the normal (WT) RPE cells. Could some clarification be provided for this difference, and report what's the level of MND1 and the effects of its loss in WT RPE cells?
‘Analysis of 53BP1 foci formation and resolution in asynchronously growing RPE1 cells revealed that MND1 depletion leads to slower repair and retention of DSBs after IR (Figure 2A, Suppl. Figure 2F&G)’ - While the quantification shown in Figure 2A is explicit, the foci in the raw images displayed in Suppl. Figure 2G appears to be more frequent in the siNT, especially in the last 2 time points. It may be worth making the images bigger and maybe clearer?
‘our data show that the role of MND1 in DNA repair is most prominent in G2 phase cells and restricted to repair of two-ended DSBs’ - Can some further context be provided for the last part of this claim. Is this due to the different modes of action of the different drugs used? If so, it would be nice to clarify in the text which drugs induce the two-ended DSBs.
‘These data show that MND1 is recruited to sites of DSBs’ - The data shows that there is an increase in MND1 foci, but whether these are or not the sites of DSBs is not clear. Recommend co-staining with a known DSBs marker.
Methods
Machines understand languages, that are formal and rigid, with unique and unambiguous instructions that are interpreted in precisely one way. Those formal, abstract languages, and programming languages in general, are hard to understand for humans like ourselves. Primarily, they are tailored towards the requirements of the machine. The user is therefore forced to adapt to the complexity of the formal language.
.
<h1>Assignment b</h1>
Header tag can be used here. ex: <Header><h1>Assignment b</h1></Header>
Through a DSL for decentralized discourse graphs, we would enable people to communicate information in a machine/human readable way
The DSL for discourse graph introduced here, describes an intertwingled associative complex of domain specific terms (in a meta graph as it were) that can be used to mark and name some discourse relevant aspect of what is being talked about.
A network of such terms (a tag bundle) are used here to name pages such that they combine discourse graoh DSL terms with 'concept handles'

I'm blogging about how I'm using Hypothes.is as a starting point for documentation about 📒ShrewdNotes Web Page Annotation. Because I'm learning how to organize efficient workflows with 📒ShrewdNotes. Then I can be certain that my documentation is accurate for when I get more people involved.
So these are practical notes that guide me. In order to become reference material for anonymous learners, followers, subscribers, and members. Also, these notes can become a framework for Hypothes.is-style 📒ShrewdNotes that I can adapt for Sciwheel and other annotation services.
I use Hypothes.is Groups as follows: * Public Group for Anonymous Learners. * 🗃ShrewdSubjects Groups. * My Private Group.
I make most of my Hypothes.is 📒ShrewdNotes in public. Mainly on my own websites. But increasingly whenever I find anything useful or interesting. Especially where I find good content relating to one of my 🗃ShrewdSubjects. So anyone can follow my Public 📒ShrewdNotes.
To recognize 🗃ShrewdSubjects, I use Hypothes.is Tags. Currently, these are Food, Gout, and Learning. Where Learning includes any topic not covered by the other subjects. In this way, as I recognize new subjects, I will separate them from Shrewd Learning.
Note that Public annotations for my subject tags include notes from all Hypothes.is users. So, tags are a great way to collect notes by everyone who is interested in a topic. Also, you can mix and match User, Group, and Tag searches. As well as using free-format search.
Additionally, I've started using Hypothes.is Tags to help me organize my workflows. Currently, I use 4, but I may extend this as I incorporate annotation into my daily life. My current 4 tags are:
* New - denotes new content that I'm preparing.
* Change - denotes changes I plan to make.
* editing - means that I've saved the note that I'm currently working on. Or that I've forgotten to delete my editing tag! I use this to avoid losing text as I'm writing it, as Hypothes.is does not have autosave. Though there are ways round that.
* BuildInPublic - read more at #BuildInPublic.
Though I like to BuildInPublic, I also like to collaborate. Now, collaboration is possible using public annotation. But I'm trying to create services built around teams. So I've created private groups for each 🗃ShrewdSubject.
Currently, joining these private Hypothes.is groups starts by subscribing to one or more newsletters: * Foodary Nexus Newsletter * GoutPal Links Newsletter * Shrewd Learning Newsletter
I try to do most of my content creation in public. Or in teams. So I only currently have one group for private notes. But Hypothes.is allows you to create as many private groups as you need. Which is useful where you want to keep notes separate. However, I recommend using tags unless you are sure you want separate groups of notes.
#hasjustinelanedyet
Research reports show that anger motivates people to react more than happiness and sadness. When people are angry, they will quickly spread information and discuss, and maintain a high mood. When a tag, such as # hasjustlanedyet, is searched many times, it will become a hot spot, which will further lead more curious people to search the tag.
Reconfigure the chalk talk protocol as a graffiti tag billboard. Invite students to "tag" the "billboard" using elements of sketchnoting, doodling, collage, and written word to stimulate thinking before a discussion begins or to deepen it afterwards.
This would be a great starter for my lesson on connotation/denotation. They will need to post a lot of words for that. A graffiti board would be great.
econfigure the chalk talk protocol as a graffiti tag billboard. Invite students to "tag" the "billboard" using elements of sketchnoting, doodling, collage, and written word to stimulate thinking before a discussion begins or to deepen it afterwards. The idea is to leverage students' comfort with multimodal expression as a way into dialogue, discussion, or debate.
Chalk talk is in my plans this week, so I will give this strategy a try!
keywords
Embedded in the meta head tag.
<img src="images/meadow.jpg" width="600" alt="meadow">
you are missing the body tag that goes after this and before the H1 entry.
Historiska tåget i Arvidsjaur sönderslaget: ”Jag vill ge upp”
Fruktansvärt. Få tag på dessa galningar omedelbart.
<p>I would like to become more comfortable with this type of work. I would also like to have a greater understanding of the time and effort that goes into web design. I am currently exploring and learning, and will see where it all takes me. As far as <i>this course</i> specifically, I would like to continue becoming more and more fluent in CSS and HTML, and maintain my newfound comfort with using these languages.</p> <link rel="stylesheet" href="style.css"> </body> <footer><small>This was created on September 19, 2022</small> </footer> </html> <!-- I keep getting an error here with my footer tag, but can not figure it out. -->
If this was broken up into separate lines it might be a little easier to read and edit
<footer><small>This was created on September 19, 2022</small> </footer> </html> <!-- I keep getting an error here with my footer tag, but can not figure it out. -->
Perhaps try putting the < small > element on a separate line.
Yes, using custom tags. Example in Python, making the !join tag join strings in an array:
Note: This rebuttal was posted by the corresponding author to Review Commons. Content has not been altered except for formatting.
Learn more at Review Commons
Reviewer #1 (Evidence, reproducibility and clarity (Required)): ____ *A significant criticism of the paper is an assumption that readers will be familiar with all of the findings in the author's previous 2016 paper and the PGL-1 papers by Aoki et al. Minimal context is given for each approach. *
To address this concern, we have added a paragraph in the Introduction section of the revised manuscript.
*Some conclusions are not well supported and require further analysis, proper controls, and more extensive descriptions of the experiments performed. *
We have addressed the reviewer’s concerns as detailed below.
Most importantly, the central conclusion and title of the paper is that composition can buffer the dynamics of individual proteins within liquid-like condensates. In other words, in vitro condensation assays often do not recapitulate LLPS behavior in vivo. That said, the findings in this study would be significantly strengthened and complemented by observing endogenously tagged PGL-3 and PGL-3 mutants in living worms, considering the efficiency of using CRISPR in C. elegans to insert tags and make precise mutations.
The original manuscript already contained data where we microinjected wild-type PGL-3 and mutant PGL-3 proteins (recombinantly purified) into adult C. elegans gonads to assay how the P granule phase supports diffusion of these proteins.
In the revised version, we now include additional data which shows “dynamics buffering” in transgenic worms generated using CRISPR/Cas9 technology. Briefly, we used CRISPR/Cas9 to generate transgenic C. elegans which expresses PGL-3-mEGFP or PGL-3(D425-452)-mEGFP from the native pgl-3 locus. In vitro, wild-type PGL-3-mEGFP protein generates liquid-like condensates. On the other hand, the recombinantly purified PGL-3(D425-452)-mEGFP protein generates condensates that are non-dynamic. In contrast to these observations in vitro, both wild-type PGL-3-mEGFP and PGL-3(D425-452)-mEGFP show similar dynamics (half-time of FRAP recovery) within P granules in vivo.
*To improve readability, the introduction to P granules should be expanded, and include the reasons for looking at the nematode-specific PGL-3 protein among all the other known P granule proteins. A recap of previous findings on PGL-3 phase separation, in vivo and in vitro, is warranted, starting with the significant results of Saha et al 2016. Setting up the investigative questions in the context of recent work on PGL-1 (Aoki, et al) is also necessary. *
To address this concern, we have added a paragraph in the Introduction section of the revised manuscript.
The physiological concentration of PGL-3 should be more transparent, including why some experiments in this study are done at physiological concentrations while others are not. Describing why salt concentrations, crowding agents, and protein abundance are similar or different for each experiment is necessary and relevant. For example, after showing in Figure 1 that PGL-3 protein phase separates, the paragraph starting on line 161 says that it was previously shown that PGL-3 doesn't phase separate at physiological concentrations without RNA. One has to go back to Figure 1 to realize it was done differently than Figure 2 and Saha 2016.
The concentrations of PGL-3 protein and use of crowding agents (if any) have already been specified within figures or figure legends. Salt concentrations used are specified within figure legends or materials and methods section.
We have added the following paragraph to the materials and methods section of the revised manuscript.
“Saha et al. 2016 showed that at physiological concentrations (approx. 1 mM), the PGL-3 protein is unable to phase separate into condensates. At these concentrations, mRNA promotes phase separation of PGL-3. To assay for mRNA-dependence of condensate assembly, it is therefore essential to use physiological concentrations of the PGL-3 protein or mutants (e.g. Figure 2). However, these condensates are generally too small to assay rate of internal rearrangement of PGL-3 molecules within condensates using fluorescence recovery after photobleaching experiments. Therefore, to generate large condensates for measuring internal rearrangement of PGL-3 or mutant molecules, we primarily used higher concentrations of these proteins where binding to RNA is not essential for phase separation. However, to mimic the in vivo P granule phase as closely as possible, we generally added constituent proteins in proportion to their in vivo abundance estimated in Saha et al. 2016.”
The added paragraph in the Introduction section of the revised manuscript may be helpful to the readers. * *
*Statements in the same paragraph like "in contrast to full-length PGL-3, mRNA does not support phase separation..." should be qualified by stating the concentration observed, with or without salts or other crowding agents. Similarly, line 230 "suggests that interactions involving the disordered C-terminal region of PGL-3 are not essential for the fast dynamics" and should be qualified with "at non-physiological concentrations and with XX crowding agents or salt concentration." It would be more consistent if physiological concentrations were consistent from figure to figure, as extra variables weaken some of the stated conclusions. *
We thank the reviewer for this suggestion. However, we feel the statements (without full experimental details within main text) help convey the conceptual essence of the findings better. Of course, all these statements contain reference to figures or prior publications which provide relevant details about experimental conditions.
*The 2010 review reference stating that there are 40 P granule enriched proteins is outdated. More recent reviews put the number much higher. This is relevant because the approach to put PGL-3 in a more physiological environment by including just PGL-1, GLH-1 and mRNA with the condensate assays, out of ~100 P granule enriched proteins, may not be sufficient to conclude "that the influence of complex composition on dynamics is modest" (line 223), or imply that the multicomponent nature of the P granule is reconstituted by adding these components (line 355). *
We revised the text to indicate that P granules contain approx. 70 proteins and added appropriate references.
Based on current information of constitutive P granule components (PGL-1, PGL-3, GLH-1, GLH-2, GLH-3, GLH-4, DEPS-1, MIP-1 and mRNA), (Kawasaki et al, 1998, 2004; Spike et al, 2008a, 2008b; Price et al, 2021; Cipriani et al, 2021; Phillips & Updike, 2022) we reconstituted P granule-like phase in vitro with mRNA, PGL- and GLH- proteins that likely constitute the most abundant components within P granules in vivo (based on concentration estimates in Saha et al. 2016).
We do appreciate the reviewer’s comment that more components can be added to our in vitro reconstitution in addition to the limited set of components used in our study. However, we feel it is interesting to observe that a limited set of components can support dynamics buffering (the main message of the paper). Further, the complementary in vivo experiments show that the P granule phase can also support dynamics buffering.
*Figure 1C needs to include PGL-3(370-693) in the analysis. Figure 1E is also incomplete without a comparison of FRAP recovery between PGL-3(1-452) and full PGL-3 as the control.
*
Fig. 1c already includes data with PGL-3 (370-693) [top row, central panel]. FRAP recovery data with full-length PGL-3 is already available in Supplementary Fig. 2c, g.
*Figure 4C is missing an essential control where PGL-3 and S1 FRAP is performed without PGL-1, GLH-1, and mRNA. *
In the revised version, we have added Supplementary Fig. 5f, where FRAP recovery of the following condensates are plotted together: 1) PGL-3 alone, 2) S1 alone, 3) PGL-3 + PGL-1, GLH-1 and mRNA, 4) S1 + PGL-1, GLH-1 and mRNA.
*It would also help show sup Fig4A in the main figure to show concentration dependence. *
We revised Fig. 4 to address the reviewer’s suggestion.
Consider adding subtitles to supplementary figures.
We considered the suggestion but felt it may not be essential.
*M&M should include an explanation for statistical analysis *
We added a paragraph describing statistical analysis within the Materials and Methods section.
*CROSS-CONSULTATION COMMENTS I am also in agreement with the comments and critiques of reviewers 2 and 3.
* Reviewer #1 (Significance (Required)): The paper by Saha and colleagues investigate the in vitro liquid-liquid phase separation propensity of a P granule protein PGL-3 and its structural domains. The findings largely replicate and support the phase-separation properties of a paralogous protein called PGL-1, as recently described by Aoki et al. 2021. Furthermore, they show that the dynamics demonstrated by recombinant PGL-3 may be maintained or buffered by the complex composition of P granules.
Reviewer #2 (Evidence, reproducibility and clarity (Required)):
*Jelenic et al. describe the effect of partner proteins on the FRAP dynamics of recombinant PGL-3 protein and variants in in vitro condensates and C elegans p-granules. The study shows that the N terminal a-helical dimerization domains is required for condensate formation and modulate of it alters aggregation and the FRAP dynamics of its condensates. Interestingly, a construct including the entire IDR region (370-693) by itself does not phase separate on its own at these conditions. The K126E K129E mutant (known previously to disrupt dimerization) and the deletion mutant abrogate llps. A mutant construct that shuffles the sequence in the region 423-453 called S1 here reduces the helicity and the condensate FRAP dynamics but recovered in the presence of a few P granule components. Also, the reduced dynamics of partially unfolded PGL-3 condensates are also rescued by the p-granule components to a certain degree of the unfolded PGL3 concentrations. This threshold concentration for recovering the condensate dynamics is further reduced in the helix reducing S1 mutant, which is also dependent on the number and the nature of P granule components.
Overall, the study aims to probe how "composition can buffer protein dynamics within liquid-like condensates" - yet several underlying aspects of the study do not fully support that conclusion. The introduction does not sufficiently introduce the known structural information of the two dimerization domains in C elegans PGL proteins for which structures are known. The region is discussed as "alpha helical" but really there are two evolutionarily conserved independently folding dimerization domains (referring to the mutants as "reduced alpha helicity" is not helpful - these are mutations that destabilize a folded domain).*
To address this concern, we have added a paragraph in the Introduction section of the revised manuscript.
*Additionally, the abstract and introduction ignore the aspects of aggregation (touched on in discussion) - this is likely what the disruption to the helical region in residue 450 region is doing (the helix is not on the dimer interface based on homology / sequence identity to the crystal structure of PGL-1 central dimerization domain. *
We think elucidating the molecular mechanism of apparent aggregation of PGL-3 (D425-452) could be an interesting direction for future investigation. Here, we focused our analysis predominantly on the mutant S1 since it generates liquid-like condensates with ~20- fold slower dynamics (compared to wild-type) in contrast to non-dynamic condensates/aggregates. Therefore, influence of other P granule components on the dynamics of PGL-3 in liquid-like condensates is easier to address using the mutant S1 rather than PGL-3 (D425-452). We didn’t find evidence that S1 aggregates as we did not detect aggregates of S1 molecules using fluorescence confocal microscopy and the slow dynamics in condensates of S1 does not change significantly over 24 h (Supplementary Fig. 3f).
However, in the revised version, we now include additional in vivo data with C. elegans expressing the aggregation-prone PGL-3 (D425-452)-mEGFP. Briefly, we used CRISPR/Cas9 to generate transgenic C. elegans which expresses PGL-3-mEGFP or PGL-3(D425-452)-mEGFP from the native pgl-3 locus. In vitro, wild-type PGL-3-mEGFP protein generates liquid-like condensates. On the other hand, the recombinantly purified PGL-3(D425-452)-mEGFP protein generates condensates that are non-dynamic. In contrast to these observations in vitro, both wild-type PGL-3-mEGFP and PGL-3(D425-452)-mEGFP show similar dynamics (half-time of FRAP recovery) within P granules in vivo.
Finally, the "dynamics buffering" is not really clearly established and could also be explained as small concentrations of aggregated proteins act like clients while increasing the concentration results in aggregation and "cross linking" in the entire droplet - and this concentration is never achieved in the in worm experiments so it is not clear. In other words, the change in FRAP dynamics not observed in worms is perhaps not surprising if small amount of recombinant proteins are incorporated into the granules. *
*
Data with the S1 mutant establishes that dynamics buffering can be observed in condensates with different sets of additives both in vitro (Fig. 5a, b) and in vivo (Fig. 4a, b). Further, data with condensates of S1 containing the additives PGL-3 (K126E K129E) or S1 (K126E K129E) demonstrate that dynamics (half-time of FRAP recovery) within S1 condensates, and in turn “dynamics buffering” depend on inter-molecular interactions. With respect to the hypothesis proposed by the reviewer, we did not detect aggregates within S1 condensates using confocal fluorescence microscopy.
In contrast to S1 condensates, condensates containing partially unfolded PGL-3-mEGFP together with PGL-1, GLH-1 and mRNA showed spatial inhomogeneities in fluorescence signal throughout the condensate (Fig. 4g). We have not tested if areas with higher fluorescence signal represent aggregates. It is a possibility that the partially unfolded PGL-3-mEGFP fluorescence signal becomes more homogeneous if higher concentrations of additives (PGL-1, GLH-1 and mRNA) are used. However, the presented data demonstrate the significant effect of the P granule components (PGL-1, GLH-1 and mRNA) on the FRAP recovery rate of partially unfolded PGL-3-mEGFP in condensates (compare figures Fig. 3e and Fig. 4g).
However, consistent with dynamics buffering, the P granule phase in vivo supports wild-type dynamics of different PGL-3 constructs over a range of concentrations - PGL-3(D425-452)-mEGFP at physiological concentration (CRISPR transgenic strain, Fig. 4e) or at higher concentrations (microinjected S1 and partially unfolded PGL-3-mEGFP, Fig. 4b).
*It is also not clear what the mechanism of the changes is - is the protein driven to fold more properly (despite S1 disruption of its conserved sequence) inside the condensate? Does it still self interact and act as a dimerization domain? Does this change disrupt interactions? *
We agree with the reviewer that identifying the precise structural changes of the S1 protein within the condensate vs. dilute phase could be an interesting direction for future investigation. However, we have already discussed the issues raised by the reviewer in the original manuscript.
“Our data is consistent with the model that other regions of S1 molecules cooperate with residues 425-452 (shuffled) to generate stronger inter-molecular interactions. For instance, addition of the mutant S1 (K126E K129E) enhances dynamics of S1 within condensates in contrast to maintaining the slower dynamics observed within condensates of S1 alone. This suggests that the interactions disrupted by the mutations K126E and K129E also contribute to slow S1 dynamics. One possibility is that interactions involving the residues K126 and K129 favor S1 conformations that enhance 425-452 (shuffled)-dependent interactions. Indeed, the mutations K126E K129E have been reported to interfere with interactions among N-termini of PGL-3 molecules (Aoki et al, 2021). While two self-association domains within the α-helical N-terminus of PGL-3 have been mapped (Aoki et al, 2021, 2016), structural insights into those associations are limited. However, PGL-3 shares significant sequence similarity with another protein PGL-1. Crystal structures are available for fragments of the PGL-1 protein that show the two self-association domains at the N-terminus are predominantly α-helical and globular in nature (Aoki et al, 2016, 2021). Therefore, one possibility is that shuffling the sequence 425-452 of PGL-3 or heat-induced unfolding of PGL-3 exposes hydrophobic residues that become available to participate in inter-molecular interactions.”
What is the real mechanism by which PGL-3 phase separates if not via the disordered domains? *
*
We agree with the reviewer that elucidating the detailed mechanism of phase separation of PGL-3 is an interesting direction for future investigation. However, we feel this is not required to support the main message of this manuscript.
Throughout the manuscript, the term "dynamics" is used to indicate FRAP, but it would be better to define what is meant (diffusion of PGL-3 in condensates) instead of using dynamics a term that could mean many things. Secondly, FRAP cannot directly measure liquidity etc (see recent critiques by McSwiggen elife 2019, etc) so it is better to be cautious in the claims. Finally, discussing "dyanmics buffering" adds more terminology where it is not needed - perhaps say "changes to diffusion of PGL-3 in condensates".
We feel it is useful to introduce a term that describes our observation. To our knowledge, our observation is novel and therefore requires a new term to describe it.
However, we do appreciate the concern raised by the reviewer. We used a more generic term “dynamics buffering” in contrast to the more specific “diffusion buffering” since we did not directly estimate diffusion behavior at the ‘single-molecule’ level. However, we already described what we mean by “dynamics buffering” in the text as follows.
“We used condensates of similar size for our analysis (average ± 1 SD of diameter of condensates are 6.4 ± 1.7 mm (Fig. 5a) and 5.9 ± 0.4 mm (Fig. 5b)). Therefore, dynamics buffering here is likely to represent similar diffusion rates of S1 within condensates.”
*The "N-terminus" is not 65% of the protein. One could define this as the N-terminal domain, but again there are two clear folded domains in the first 65% of the protein and this needs to be described better. *
We revised the text to replace the terms “N-terminus” and “N-terminal domain” to “N-terminal fragment”.
*The description of "stickers" and the references to tau and hnRNPA1 are confusing as this is a predominantly ordered domain while those are IDRs. *
We feel this is important as it aids discussing our work in the context of current literature describing the mechanisms of macromolecular phase separation.
The suggestion in the discussion that "P granule components support dynamics by participating in intermolecular interactions wth PGL-3-mEGFP molecules" is not well supported because no interaction assays are performed and no mutaitons are made that disrupt these interactions to test this.
Indeed, we have not conducted interaction assays or mutational analysis to directly test this. However, our detailed analysis with the S1 mutant supports this suggestion.
While partially unfolded PGL-3-mEGFP molecules lose 30% of a-helicity, the a-helicity of the S1 mutant is reduced by 15% compared to wild-type PGL-3. Data with S1 and partially unfolded PGL-3-mEGFP molecules show that loss of a-helicity correlates with slower diffusion of protein molecules within condensates. Using the mutants PGL-3 (K126E K129E) and S1 (K126E K129E), we show that diffusion rate of S1 molecules within condensates depend on inter-molecular interactions, and presence of other P granule components support faster diffusion rate of S1 molecules within condensates. Therefore, we feel it is safe to speculate that intermolecular interactions with P granule components can support dynamics of a “more unfolded” (compared to S1) version of PGL-3 molecule. * *
*More detailed analysis of some of the claims: Claim 1: An a-helical region mediates the phase separation of PGL-3, and the C-terminal disordered region by itself does not phase separate. The N-terminal dimerization is essential for LLPS. The C-terminal IDR interactions with mRNA facilitate the LLPS. Comments: The authors show sufficient experimental data using microscopy and FRAP on truncated constructs with the N-terminal and C-terminal regions - but see above regarding how these are described - a proper domain structure with the folded domains shown and the RGG motifs highlighted should be added and integrated throughout the discussion. *
In the revised version of the manuscript, we described the predicted PGL-3 domains within a paragraph in the introduction: “The interactions that support phase separation of the PGL-3 protein remains unclear. Structural studies on the orthologous PGL-1 protein revealed two dimerization domains. This raises the possibility that PGL-3 also contains similar dimerization domains, and phase separation depends on interactions involving these domains.”
Our Fig. 1a already includes the schematic representation of PGL-3 with predicted N-terminal and Central Dimerization domains and RGG repeats.
*They show that the N-terminus is necessary and adequate for LLPS, and the C-terminus by itself does not phase separate. But, how does the N-terminal domains phase separate? This is not explained - what are the interactions? *
Also, a di-mutant (K126E K129E) that is known, and also authors use SEC-MALS to show their N-terminal construct is consistent with the published results. Disrupting the n-terminal dimerization prevents phase separation, suggesting the importance of these residues in the N-terminus for self-assembly and LLPS. The Microscopy data backs the claim that the mRNA-mediated LLPS is facilitated by binding with C-terminus. However, the m-RNA binding to IDR is not sufficient for LLPS. Yet, the authors do not explain how higher salt prevents phase separation - again the mechanism of phase separation is unclear. Is it multivalent interaction of the two dimerization domains? A basic model (that is tested) would be important.
We agree with the reviewer that elucidating the detailed mechanism of phase separation of PGL-3 is an interesting direction for future investigation. However, we feel this is not required to support the main message of this manuscript.
However, our manuscript already provides some relevant insights as follows.
“To investigate the underlying mechanism further, we began by testing if the N-terminal α-helical region of PGL-3 can self-associate. Our analysis using size exclusion chromatography followed by multi-angle light scattering (SEC-MALS) showed that this PGL-3 fragment 1-452 forms a dimer (Supplementary Fig. 2f). Mutation of two residues (K126E K129E) have been shown to interfere with interactions among the N-termini of PGL-3 molecules (Aoki et al, 2021). We mutated these two residues within the full-length PGL-3 protein (K126E K129E) (Fig. 1a) and found that this mutant PGL-3 (K126E K129E) protein cannot phase separate even at high protein concentrations up to ~130 µM (Fig. 1b, c). Addition of mRNA does not trigger phase separation of this protein at physiological concentrations either (Fig. 2a, b). Taken together, our data is consistent with a model where association among folded N-termini of PGL-3 molecules is essential for phase separation.”
A likely possibility is that phase separation of PGL-3 depends on electrostatic inter-molecular interactions among the folded N-terminal fragment of PGL-3 molecules. Therefore, high salt prevents phase separation.
Are the tags removed to ensure that phase separation is not caused by tags or remaining linker regions? Is the protein purified to be without nucleic acid contamination or other purity metrics?
Most of the experiments were done with only 5% of total protein tagged with 6x-His-mEGFP. No additional tags were present on the constructs. For recombinant expression and purification, proteins were cloned such that it is possible to remove the 6xHis-mEGFP tag following treatment with TEV protease. Following removal of the 6xHis-mEGFP tag, the residual linker is just two amino acid residues long. We used 100% tagged-protein for our experiments only in very few cases (indicated in the figure legends).
To demonstrate purity of recombinant proteins, SDS-PAGE gels with all protein constructs used in this study are shown in Supplementary Fig. 1.
To minimize contamination of nucleic acids, we treated samples with Benzonase during the course of purification.
To assess the extent of nucleic acid contamination, the ratio of absorbance at 260 nm and 280 nm (A260/A280) was monitored. In exceptional cases with high A260/A280 values, we analyzed samples further by purifying RNA from the sample using RNA purification kit (Qiagen) and found that RNA represented 1% or less of the sample mass.* *
Claim2: The N-terminal a-helical region modulates the dynamics within condensates. The IDR region has minimal effect on the fast dynamics of PGL-3. Comments: The authors show that the full-length PGL-3 condensates have modest influence of components by comparing the FRAP half times with or without the P granule components, including mRNA. However, have the authors tried this in the presence of mRNAs for the constructs lacking the IDRs as they have several RGG domains and bind with mRNA and are likely to change the dynamics.
We thank the reviewer for this suggestion. However, this experiment is not essential to support the claim made in the context of homotypic condensates of PGL-3 : “The N-terminal a-helical region modulates the dynamics within condensates. The IDR region has minimal effect on the fast dynamics of PGL-3.”
*The authors report the importance of the N-terminal a-helical region by making a construct that lacks/disrupts a part of the helices lowers the thermal stability and significantly lowers the dynamics of the condensates. Also unfolding of helices is shown to reduce the dynamics. One primary concern is whether these "rescued" protein dynamics imply protein functionality. *
An assay of “functionality” e.g. an enzymatic activity of the PGL-3 protein is not available.
However, we compared the fecundity of C. elegans worms expressing from the native pgl-3 locus, PGL-3-mEGFP or the mutant protein PGL-3(D425-452)-mEGFP, to assay the functionality of P granules in these strains. We found that worms of both genotypes produced similar number of offspring (Fig. 4d). This suggests that deletion of residues 425-452 of PGL-3 does not result in significant loss of function of P granules.
Are these semi denatured proteins refolded in the presence of P-granule components?
We feel that identifying the precise structural changes of the semi-denatured PGL-3 proteins within the condensate vs. dilute phase could be an interesting direction for future investigation.
Finally, it is not clear why the authors chose to disrupt folding of the central dimerization domain?
The manuscript included a paragraph to describe the rationale.
“This suggests that interactions involving the disordered C-terminal region of PGL-3 are not essential for the fast dynamics within condensates. Therefore, we addressed the role of the N-terminal α-helical region (1-452) in driving dynamics. In order to avoid engineering mutations that result in significant misfolding of PGL-3 and concomitant loss of its ability to phase separate, we focused our mutational analysis close to the junction of the folded N-terminus and the disordered C-terminus of PGL-3. Surprisingly, we found that a full-length PGL-3 construct (D425-452) that lacks only 27 residues phase separates into condensates that are non-dynamic (Fig. 3a, c). Sequence analysis of the PGL-3 protein predicts that this region 425-452 spans two α-helices (one complete helix and fraction of a second helix) (Supplementary Fig. 3d). We generated a PGL-3 construct (hereafter called ‘S1’) (Fig. 3a) in which the sequence in the region, 425-452, is shuffled while keeping the overall amino acid composition unchanged. We found that S1 phase separates into condensates that are 20- fold less dynamic than with wild-type PGL-3 (Fig. 3d, Supplementary Fig. 3c).”
Saying that "reduced alpha-helicity of PGL-3 correlates with slower dynamics in condensates" may be factual in these assays but "correlation" should be expanded upon to include mechanism and to me it seems that the statement should read "aggregation of PGL-3 causes slower dynamics in condensates" (both the partially destabilized mutant and the fully unfolded WT show similar effects perhaps to different degrees).
We feel that identifying the precise structural changes of the semi-denatured PGL-3 proteins within the condensate vs. dilute phase could be an interesting direction for future investigation.
We did not use the term "aggregation" since we did not detect aggregates of S1 molecules using fluorescence confocal microscopy.
*CROSS-CONSULTATION COMMENTS I agree with the other reviewer's comments and critiques, I have concerns about the biological relevance and also the biophysical mechanisms. Reflecting on the other reviewers' comments, the papers could provide more depth in one or both of these areas to come to firm conclusions that are either revealing about PGL biology or elucidate a (possible) general biophysical mechanism. *
In the revised version, we now include additional data which shows “dynamics buffering” in transgenic worms generated using CRISPR/Cas9 technology. Briefly, we used CRISPR/Cas9 to generate transgenic C. elegans which expresses PGL-3-mEGFP or PGL-3(D425-452)-mEGFP from the native pgl-3 locus. In vitro, wild-type PGL-3-mEGFP protein generates liquid-like condensates. On the other hand, the recombinantly purified PGL-3(D425-452)-mEGFP protein generates condensates that are non-dynamic. In contrast to these observations in vitro, both wild-type PGL-3-mEGFP and PGL-3(D425-452)-mEGFP show similar dynamics (half-time of FRAP recovery) within P granules in vivo.
Reviewer #2 (Significance (Required)): *Hence, although the authors shows how inclusion of other components can alter the one protein component phase separation, this is done with entirely artificial means of destabilizing the fold of one of the domains which likely leads to aggregation. So the true impact of the work is hard to understand because the mutations impact on the basic biophysical properties of the domain (stability, interaction) are not completely characterized and the reason for disrupting this folding is not clear. *
A major impact of our work is elucidation of a novel “dynamics buffering” property within biomolecular condensates in vitro. Our in vivo data is consistent with this finding.
We have chosen two orthogonal ways of perturbing the PGL-3 protein (i.e. mutations and temperature-dependent unfolding) to assay the effect on diffusion rate against different levels of perturbation (e.g. 30% loss of a-helicity in heat-denatured PGL-3-mEGFP vs. 15% loss of a-helicity in the S1 mutant, compared to wild-type PGL-3). Studying the phase separation behavior of these “artificially-generated” constructs provided the understanding that dynamics of PGL-3 in condensates depends on inter-molecular interactions, and slower dynamics generally correlate with stronger inter-molecular interactions. Further, interactions among two or more P granule components can buffer against large change in dynamics / aggregation within the P granule phase. These insights may lay the groundwork for addressing how more “natural” modifications (e.g., post-translational modifications, high local concentration of “sticky” molecules) may influence dynamics within biomolecular condensates in vivo.
Based on current knowledge of P granule composition, chaperone proteins (e.g. heat-shock family proteins) do not show abundant concentration within P granules. However, it is unclear if chaperone proteins are completely excluded from the P granule phase. Therefore, we speculate that weak interactions among two or more non-chaperone proteins contribute significantly to “dynamics buffering” within the P granule phase in vivo.
In the discussion section of the manuscript, we had speculated that “dynamics buffering” may potentially explain observations reported in the nucleolus: “Similarly, interactions among components could be a potential mechanism of storage of misfolding-prone proteins in non-aggregated state within the liquid-like nucleolus under stress in vivo (Frottin et al, 2019).”
Our finding is also relevant in the context of synthetic biology with applications that require steady diffusion rate of macromolecules during biochemical reactions within biomolecular condensates.
My field of expertise is protein phase separation and protein structure. * *
Reviewer #3 (Evidence, reproducibility and clarity (Required)):
Summary: P granules are liquid condensates found in the developing germlines and embryos of C. elegans. Prior work by the authors and others have established P granules as a tractable model to investigate the basic biophysical properties of liquid condensates. Much of the prior published work focused on specific P granule scaffold proteins, PGL-1 and PGL-3. How attributes of these PGL proteins and the effect of other P granule components affect condensate properties is not fully understood. Here, Jelenic, et al. probe the biophysical properties of PGL-3. Using recombinant protein, they show that an N-terminal, alpha-helical region of PGL-3 is sufficient for liquid condensate formation and that N-terminal assembly is required for this formation. Creation of a scrambled alpha-helical region in PGL-3 and heat treatment affects PGL-3 fluidity. This fluidity can be "rescued" in vivo and in vitro with the inclusion of other P granule factors, including wildtype PGL-3, PGL-1, GLH-1 and mRNA. The authors note an inverse correlation between fluidity and mutant PGL-3 fluorescent intensity. They propose a model that heterotypic compositions of condensates can buffer their fluidity against components with stronger multivalent interactions. *
MAJOR: 1. PGL-3 is a fantastic model to study the biophysical properties of a liquid condensate. But as the authors address in their discussion, the S1 mutant will likely affect the central domain folding, at its minimum causing exposure of a hydrophobic surface not typically exposed in biology. These helices are found at the terminal portion of the domain determined in the crystal structure and as depicted in the authors' Figure 1A. While the cause of S1's enhanced molecular interactions does not affect the in vitro work presented in this manuscript, it does affect how the conclusions connect to the biological nature of P granules and liquid condensates more generally. *
We have chosen two orthogonal ways of perturbing the PGL-3 protein (i.e. mutations and temperature-dependent unfolding) to assay the effect on diffusion rate against different levels of perturbation (e.g. 30% loss of a-helicity in heat-denatured PGL-3-mEGFP vs. 15% loss of a-helicity in the S1 mutant, compared to wild-type PGL-3). Studying the phase separation behavior of these “artificial” constructs provided the understanding that dynamics of PGL-3 in condensates depends on inter-molecular interactions, and slower dynamics generally correlate with stronger inter-molecular interactions. Further, interactions among two or more P granule components can buffer against large change in dynamics / aggregation within the P granule phase. These insights may lay the groundwork for addressing how more “natural” modifications (e.g., post-translational modifications, high local concentration of “sticky” molecules) may influence dynamics within biomolecular condensates in vivo.
Based on current knowledge of P granule composition, chaperone proteins (e.g. heat-shock family proteins) do not show abundant concentration within P granules. However, it is unclear if chaperone proteins are completely excluded from the P granule phase. Therefore, we speculate that weak interactions among two or more non-chaperone proteins contribute significantly to “dynamics buffering” within the P granule phase in vivo.
In the discussion section of the manuscript, we had speculated that “dynamics buffering” may potentially explain observations reported in the nucleolus: “Similarly, interactions among components could be a potential mechanism of storage of misfolding-prone proteins in non-aggregated state within the liquid-like nucleolus under stress in vivo (Frottin et al, 2019).”
Our finding is also relevant in the context of synthetic biology with applications that require steady diffusion rate of macromolecules during biochemical reactions within biomolecular condensates.
Our data with S1-mEGFP or PGL-3-mEGFP (pre-heated at 50°C) proteins microinjected into C. elegans gonads, and the transgenic strain expressing PGL-3(D425-452)-mEGFP from the pgl-3 locus showed that the P granule phase can support fast dynamics of these mutant PGL-3 constructs. Since P granules have a complex composition, one possibility is that fast dynamics of these constructs is supported by interactions involving many P granule components. We found that using only a limited set of P granule components (PGL-1, GLH-1 and mRNA) can buffer dynamics of S1 in condensates in vitro.
In absence of a systematic analysis investigating the individual role of approx. 70 P granule proteins in buffering S1 dynamics in condensates in vitro, we have claimed in the text that dynamics-buffering of S1 in condensates is supported by interactions among two or more components. However, we do appreciate the reviewer’s comment and feel it would be interesting to investigate the contribution of individual P granule components towards fluidity in future studies. We have discussed this in the ‘Discussion’ section of the manuscript.
To address this concern, we have added a paragraph in the Introduction section of the revised manuscript.
*MINOR: 1. Line 20, "most non-membrane-bound compartments...have complex composition": Are there examples of condensates that do not have complex composition? *
Not all non-membrane-bound compartments may have been characterized. To accommodate this possibility, we refrained from making a more general statement, but stated “most non-membrane-bound compartments…”.
We added the reference suggested by the reviewer.
*
Line 60, condensates contain hundreds of different proteins and RNA: Please cite at least a few examples of condensates with their components identified. *
We added some references following suggestion by the reviewer.
We added the reference suggested by the reviewer.
Lines 88-89, PGL-3 N-terminal fragment predominantly alpha-helical: The PGL domain structures should be cited here as supporting evidence that these regions are composed primarily of alpha helices (Aoki, et al 2016, 2021) *
*
To address this concern, we have added a paragraph in the Introduction section of the revised manuscript.
We retained the speculative comment in the results section. We feel that this prepares the readers for the discussion later in the manuscript.
We addressed the reviewer’s suggestion.
We addressed the reviewer’s suggestion.
To address this concern, we have added a paragraph in the Introduction section of the revised manuscript.
We added the reference suggested by the reviewer.
We added the reference suggested by the reviewer.
We addressed the reviewer’s suggestion.
We provide statistics between condensate numbers in Fig. 2b.
We revised the Figure legend of Fig. 4a to address this issue.
We have included statistics comparing FRAP curves in Supplementary Fig. 4a-c.
We have revised Fig. 4 to address the reviewer’s suggestion.
We considered the suggestion, but felt it works better in the original form.
We thank the reviewer for appreciating our extensive work. However, we retained the original Fig. 6 for the sake of simplicity.
We have included a table listing the strains used in the study and their genotype. * CROSS-CONSULTATION COMMENTS While my review was arguably the more favorable of the three, I agree with the other reviewers' comments and evaluation, particularly with Reviewer #1. As written in my review, my primary concern was the biological relevance of the work.*
Reviewer #3 (Significance (Required)):
Overall, the in vitro work presented investigating the biophysical properties of this minimal P granule system was thorough and well-analyzed, and the manuscript was clearly written. Additional citations and statistics will improve the manuscript and the strength of the conclusions, respectively. The biological relevance of this study to P granule form and function in vivo, and to condensates in vivo, is debatable. This work will interest those who study condensate biology, the biophysics of protein-protein and protein-RNA interactions, and RNA biochemists more generally.
A major impact of our work is elucidation of a novel “dynamics buffering” property within biomolecular condensates in vitro. Our in vivo data is consistent with this finding.
We have chosen two orthogonal ways of perturbing the PGL-3 protein (i.e. mutations and temperature-dependent unfolding) to assay the effect on diffusion rate against different levels of perturbation (e.g. 30% loss of a-helicity in heat-denatured PGL-3-mEGFP vs. 15% loss of a-helicity in the S1 mutant, compared to wild-type PGL-3). Studying the phase separation behavior of these “artificially-generated” constructs provided the understanding that dynamics of PGL-3 in condensates depends on inter-molecular interactions, and slower dynamics generally correlate with stronger inter-molecular interactions. Further, interactions among two or more P granule components can buffer against large change in dynamics / aggregation within the P granule phase. These insights may lay the groundwork for addressing how more “natural” modifications (e.g., post-translational modifications, high local concentration of “sticky” molecules) may influence dynamics within biomolecular condensates in vivo.
Based on current knowledge of P granule composition, chaperone proteins (e.g. heat-shock family proteins) do not show abundant concentration within P granules. However, it is unclear if chaperone proteins are completely excluded from the P granule phase. Therefore, we speculate that weak interactions among two or more non-chaperone proteins contribute significantly to “dynamics buffering” within the P granule phase in vivo.
In the discussion section of the manuscript, we had speculated that “dynamics buffering” may potentially explain observations reported in the nucleolus: “Similarly, interactions among components could be a potential mechanism of storage of misfolding-prone proteins in non-aggregated state within the liquid-like nucleolus under stress in vivo (Frottin et al, 2019).”
Our finding is also relevant in the context of synthetic biology with applications that require steady diffusion rate of macromolecules during biochemical reactions within biomolecular condensates.
*I have expertise in P granules, protein/RNA biochemistry, condensate assembly, and C. elegans. *
References
Aoki ST, Kershner AM, Bingman CA, Wickens M & Kimble J (2016) PGL germ granule assembly protein is a base-specific, single-stranded RNase. Proceedings of the National Academy of Sciences of the United States of America
Aoki ST, Lynch TR, Crittenden SL, Bingman CA, Wickens M & Kimble J (2021) C. elegans germ granules require both assembly and localized regulators for mRNA repression. Nat Commun 12: 996
Cipriani PG, Bay O, Zinno J, Gutwein M, Gan HH, Mayya VK, Chung G, Chen J-X, Fahs H, Guan Y, et al (2021) Novel LOTUS-domain proteins are organizational hubs that recruit C. elegans Vasa to germ granules. Elife 10: e60833
Frottin F, Schueder F, Tiwary S, Gupta R, Körner R, Schlichthaerle T, Cox J, Jungmann R, Hartl FU & Hipp MS (2019) The nucleolus functions as a phase-separated protein quality control compartment. Science 365: 342–347
Kawasaki I, Amiri A, Fan Y, Meyer N, Dunkelbarger S, Motohashi T, Karashima T, Bossinger O & Strome S (2004) The PGL family proteins associate with germ granules and function redundantly in Caenorhabditis elegans germline development. Genetics 167: 645–661
Kawasaki I, Shim YH, Kirchner J, Kaminker J, Wood WB & Strome S (1998) PGL-1, a predicted RNA-binding component of germ granules, is essential for fertility in C. elegans. Cell 94: 635–645
Phillips CM & Updike DL (2022) Germ granules and gene regulation in the Caenorhabditis elegans germline. Genetics 220: iyab195
Price IF, Hertz HL, Pastore B, Wagner J & Tang W (2021) Proximity labeling identifies LOTUS domain proteins that promote the formation of perinuclear germ granules in C. elegans. Elife 10: e72276
Saha S, Weber CA, Nousch M, Adame-Arana O, Hoege C, Hein MY, Osborne Nishimura E, Mahamid J, Jahnel M, Jawerth L, et al (2016) Polar Positioning of Phase-Separated Liquid Compartments in Cells Regulated by an mRNA Competition Mechanism. Cell 166: 1572-1584.e16
Spike C, Meyer N, Racen E, Orsborn A, Kirchner J, Kuznicki K, Yee C, Bennett K & Strome S (2008a) Genetic analysis of the Caenorhabditis elegans GLH family of P-granule proteins. Genetics 178: 1973–1987
Spike CA, Bader J, Reinke V & Strome S (2008b) DEPS-1 promotes P-granule assembly and RNA interference in C. elegans germ cells. Development (Cambridge, England) 135: 983–993
deprecated
table tag is deprecated
Consolidated peer review report (9 September 2022)
GENERAL ASSESSMENT
This interesting preprint by Suárez-Delgado et al. explores the mechanism by which activation of the Hv1 voltage-activated proton channel is dependent upon both the voltage and pH difference across the membrane. The authors are the first to incorporate the fluorescent unnatural amino acid, Anap, into the extracellular regions of the S4 helix of human Hv1 to monitor transitions of S4 upon changes in voltage or pH. The authors first checked that Anap is pH insensitive for practical use in Hv1, where changes in local pH are known to occur when the voltage sensor activates and the proton pore opens. Anap was incorporated at positions throughout the S3-S4 linker and the extracellular end of S4 (up to the 202nd residue) of hHv1 and some positions showed clear voltage-dependent changes in fluorescence intensity. The authors also obtained fluorescence spectra at different voltages and observed no spectral shifts, raising the possibility that voltage dependent changes in fluorescence intensity could primarily be due to fluorescence quenching. Upon mutation of F150, the Anap signal at the resting membrane voltage increased, suggesting dequenching upon removal of F150. The authors also discovered that the kinetics of Anap fluorescence upon membrane repolarization have two phases (rapid and slow) under certain pH conditions and that there is a pH- dependent negative shift of the conductance-voltage (G-V) relation compared with the fluorescence-voltage (F-V) relation in some mutants. The biphasic kinetics of the fluorescence decay upon repolarization were explained by modelling a slower transition of return from intermediate resting state to a resting state. The pH-dependent shift of the G-V relation from the F-V relation provides insight into mechanisms of ΔpH-dependent gating of Hv1, a longstanding enigma. Overall, the approaches are rigorous, the figures show important results, and this work paves the way for the use of Anap fluorescence to study Hv1 gating and modulation.
RECOMMENDATIONS
Revisions essential for endorsement:
1) In its current form, the narrative of the preprint has two threads. One on the mechanisms of Anap fluorescence changes (mainly quenching) and another on a previously unappreciated transition of the voltage sensor, as revealed by Anap. Our impression is that the preprint suffers somewhat from this split focus, which could be resolved by explaining why Anap was used to explore voltage sensor activation in Hv1 in the introduction. Perhaps the authors could also explain the advantage of smaller sized fluorophores compared to other maleimide-based fluorophores earlier in the introduction, or the utility of being able to insert Anap into transmembrane segments. The authors should more clearly point out how they exploited the advantages of Anap as a tool in this study. It would furthermore be helpful to discuss previous studies using nongenetic tools for VCF and spell out how they have delineated key aspects of Hv1, which would help to emphasize how several positions studied here (for example, 201 and 202) could not be labelled with cysteine-based fluorophores.
2) We think the authors should be cautious about understanding the physicochemical nature of Anap using prodan as a model. It would be helpful to discuss the possibility that undetected spectral shifts due to a nonquenching mechanism could be overlooked, even though major signal changes can be explained by fluorescence quenching in their data. Regarding the mechanisms of remaining voltage-dependent fluorescence changes of F150A-A197Anap, it would be helpful for the authors to suggest possible ideas about which residues might account for remaining signals.
The beautiful spectral data for Anap is impressive. However, the physicochemical basis of the fluorescence change of Anap cannot be understood by simple extension of findings for prodan, which shows structural similarity to Anap. Our understanding is that changes in Anap fluorescence can only reveal a change in the structural relationship between Anap and one of its neighbors because the physicochemical basis of Anap fluorescence is complicated. For example, fluorescence could also be affected by the electrostatic environment, stretch of peptide bond, etc. Previous studies, including those of TRP channels, showed that the kind of environmental changes that Anap faces in ion channels do not necessarily induce large spectral shifts, unlike in cell-free spectral analyses using distinct solvents. Further, only minor shifts in spectra occur upon local structural change, as seen in previous work including Xu et al. Nat. Commun. 2020 11:3790. Such minor shifts could be perhaps overlooked even when Anap is incorporated into S4 and exposed to environmental change. Therefore, it is not easy to decode the physicochemical basis of Anap fluorescence changes. F150A-A197Anap has increased fluorescence and no change in spectral pattern, leading the authors to conclude that F150 quenches Anap fluorescence of A197 position. However, a significant amount of fluorescence change still occurs upon changes in membrane potential after F150 is changed to alanine (Figure 4). It is very likely that quenching is not the only mechanism underlying the observed voltage induced change of Anap fluorescence of Hv1. The authors suggest that remaining voltage-dependent fluorescence change of F150A-A197Anap could be due to interaction with other aromatic residues, but this has not been tested.
3) The current version of the preprint is missing important control experiments, ideally performed using western blots to measure protein expression or, if that is not possible, proton current and fluorescence measurements, to demonstrate that protein expression or functional channels are not seen for all mutants in the absence of ANAP (but in the presence of the tRNA and Rs construct). A similar control for imaging would be to use ANAP alone without encoding.
4) Aromatics in the S4 segment were ruled out as potential quenchers on the assumption that they would move together with Anap during gating. It should be noted, however, that Hv1 is a dimer and therefore a fluorophore attached to S4 in one subunit could be quenched by S4 aromatics in the neighboring subunit if were close to the dimer interface. In Fujiwara et al. J. Gen. Physiol. 2014 143:377-386, for example, W207 does not appear very far from labeled positions in the adjacent S4. This possibility should be mentioned in the discussion.
5) It is not clear whether the Anap spectra purely represent Hv1 incorporated into the plasma membrane or perhaps include signals from the cytoplasm or channels in internal membranes (whether assembled or incompletely assembled). It would be helpful to provide a more complete presentation of the data obtained and to provide more information in the Methods Section. In the Methods section, it is stated “The spectra of both fluorophores (Anap and mCherry) were recorded by measuring line scans of the spectral image of the cell membrane, and the background fluorescence from a region of the image without cells was subtracted”. How are signals from cell membranes specified in this method being discriminated from those associated with the cytoplasm and intracellular membranes? If spectral data include signals from free Anap in the cytoplasm or Hv1 in intracellular membranes, spectral shifts upon membrane potential changes will be difficult to detect, even when Anap is incorporated into Hv1 and senses environmental change by voltage-induced conformational change. In Figure 3E, wavelength spectra were shown as standardized signals for different voltages. Amplitude change would be demonstrated (spectrum at different voltages without standardization would be shown). In Figure 4, spectra were compared between A197Anap and F150A-A197Anap, showing increases of fluorescence in F150A-A197Anap. Was this signal measured at resting membrane potential? How does the spectrum change when the membrane potential is changed?
Rationales for the confirmation of signals originating from the cell surface for Hv1 Anap might include the observations that: a) some mutants showed slightly different spectral patterns (in particular, Q191Anap showed a small hump at longer wavelengths, which is proposed to represent FRET between mCherry and Anap) and b) signal intensity was voltage dependent (if signals originate from endomembranes, they should not be voltage dependent). Mentioning these two points earlier in the text might help to alleviate concerns about the location of the protein that contributes to the measured signals.
6) In Fig 5, the fluorescence kinetics do not really match the current activation kinetics for panels A, B, and C. Is there an explanation for this mismatch? It would be helpful to have the fitted data in the figure. A more thorough comparison of the kinetics of currents and fluorescence would be helpful throughout the study.
7) Which construct of hHv1 was used to obtain the data in Figure 6? Unless we missed it, this information is not provided in the text or figure legend. Is it for L201Anap? This figure also shows an intriguing finding that the G-V relationship is negatively shifted from the F-V relationship at pHo7-pHi7 but not at pHo5.5-pHi5.5. A shifted G-V relation with the same ΔpH contrasts with what has been reported in other papers. However, the authors did not really discuss this surprising finding in the light of previous references. Could the shift of the G-V relation between two pH conditions with the same ΔpH be due to any position-specific effect of Anap? If Figure 6 represents L201Anap mutant, the presence of Anap at L201 probably makes such shift of G-V curve in Figure 6C? The authors should openly discuss this finding in relation to what has been reported in the literature.
8) The authors suggest that the small hump near 600 nm in Figure 1E represents FRET between Anap and mCherry. It is surprising that FRET can take place across the membrane. Can the authors point to another case of FRET taking place across a cell membrane? One possibility might be that misfolded proteins place mCherry and Anap close to each other. It is also curious that only A191Anap did not show such a FRET-like signal. Also, if there is FRET, why wouldn’t this also contribute to the voltage-dependent changes in fluorescence?
9) F150A-A197Anap shows a leftward shift of the F-V relation compared with the G-V relation only when ΔpH=1. Another unusual finding with F150A-A197Anap is the very small shift of the G-V relation between ΔpH=0 and ΔpH=1, when other reports in the literature suggest it should be 40 mV or more. Are these peculiar properties simply due to the absence of Phe at position 150, which might play a critical role in gating as one of the hydrophobic plugs of Hv1? To address this possibility, it would be ideal to compare different ΔpH values with and without F150 when Anap is incorporated at a different position (such as L201Anap). Regardless, it would be helpful to discuss this point.
10) In Figure 1E, I202Anap exhibits a blue shift in its spectrum suggesting the environment of Anap on I202 is more hydrophobic than the other sites. We presume these spectra were obtained at a negative membrane voltage, but the text or legend should clearly state how these were obtained. The authors should also explain whether the whole cell or edge was imaged. If these are at negative membrane voltages, might the Anap spectrum shift to higher wavelengths (i.e. more hydrophilic) when the membrane is depolarized? Did the authors find any spectral shift for I202Anap when doing a similar test as depicted in Figure 3E?
11) In Figure 3E, spectra are shown as normalized signals for different voltages, but an amplitude change should also be demonstrated by providing raw spectra at different voltages.
12) In Figure 4, spectra are compared between A197Anap and F150A-A197Anap, showing increase of fluorescence in F150A-A197Anap. Were these obtained at a negative membrane voltage? How do these spectra change when membrane potential is changed?
Additional suggestions for the authors to consider:
1) The authors propose that Anap fluorescence tracks an S4 movement involved in the opening of the channel. They also argue that the existence of more than one open state could explain why the increase in florescence upon depolarization lags the proton current in most cases. While they convincingly show that Anap is not pH sensitive per se, when incorporated into the protein, the fluorescence efficiency of the fluorophore could still be affected by protonation of channel residues in the immediate environment when the channel opens, even after S4 has completed its movement. To address this alternative explanation, the authors could use Hv1 mutants with strongly reduced proton conductance. Channels bearing mutations corresponding to N214R or D112N were used successfully to isolate Hv1 gating currents from the much larger proton currents (De La Rosa & Ramsey, Biophys. J. 2018 114:2844-2854; Carmona et al. PNAS 2018 115:9240-9245; Carmona et al. PNAS 2021 118: e2025556118). Perhaps, they could be used with patch clamp fluorometry as well?
2) The data showing that Hv1-197Anap is quenched by Phe at position 150 are very nice. Yet, it would be useful to show that the quenching is specific to F150 using a negative control. F149, for instance, is just next to F150 but points in a different direction, so its mutation to alanine should not affect Hv1-197Anap fluorescence.
3) A major finding of this work is the identification of a slow kinetic component that is highly sensitive to ΔpH. Earlier studies found that the ability of Hv1 to sense ΔpH is altered by some channel modifications, e.g., in the loop between TMH2 and TMH3 (Cherny et al. J. Gen. Physiol. 2018 150:851-862). Did the authors check whether any of these modifications alter the transition responsible for the slow kinetic component? For instance, a suppression of the transition resulting from a H168X mutation would help tighten the link to ΔpH sensing.
4) We understand that it is difficult to tightly control intracellular and extracellular pH when Hv1 is heterologously expressed in mammalian cells. The G-V relation is not always reliable because accumulation of protons or depletion of protons upon Hv channel activity will alter gating, as the authors have previously published (De La Rosa et al., J. Gen. Physiol. 2016 147:127-136). Could the kinetic analysis of Anap fluorescence be affected by similar alterations to proton concentration in the vicinity of Hv1? It would be helpful for the authors to comment on this specifically.
5) Quenching of Anap by Phe could be verified in cell free conditions using a spectrophotometer with different concentrations of Phe, or citing the literature if it has already been reported.
6) The authors did not cite any example of Anap incorporation into S4 helices, but there are several recent papers where Anap was utilized to probe motion of S4 in other channels. Examples include Dai et al., Nat. Commun. 2021 12:2802 and Mizutani et al. PNAS 2022 119:e2200364119.
7) In the Anap-free negative control (with only A197TAG plasmid transfection), the mCherry signal seems positive (Supplementary Figure 1, left row, second from the top). Is this due to unexpected skipping of the TAG codon to make mCherry-containing partial polypeptides? It would seem like an explanation is needed.
8) The data of Figure 3E are shown as data with different membrane voltages. But there is no information about membrane voltage for Fig. 1E and Fig. 2A and Fig. 4B. Are these from unpatched cells? Please clarify.
9) G-V relations are shown for F150A-A197Anap, but current traces of F150A-A197Anap are missing.
10) On Page 11, Line 303 says “experimental F-V relationship is positively shifted by 10 mV with respect to the G-V curve”. But looking at the data Fig5D, the shift at ΔpH=2 seems the opposite. Perhaps “positively” should be “negatively” in this sentence?
REVIEWING TEAM
Reviewed by:
Yasushi Okamura, Professor, Osaka University, Japan: voltage-sensing proteins, electrophysiology and fluorescence spectroscopy
Francesco Tombola, Associate Professor, University of California, Irvine, USA: ion channel mechanisms, electrophysiology and fluorescence spectroscopy
Christopher A. Ahern, Professor, University of Iowa, USA: ion channel mechanisms, non-canonical amino acidic mutagenesis
Curated by:
Kenton J. Swartz, Senior Investigator, NINDS, NIH USA
(This consolidated report is a result of peer review conducted by Biophysics Colab on version 1 of this preprint. Minor corrections and presentational issues have been omitted for brevity.)
Typo in the tag here; "transculsion" should be "transclusion".
<h1>Assignment b</h1
i think you forgot to use the header tag.
<link rel="stylesheet" href="style.css">
I think you have added extra link tag for css file. gone through all code and i felt it you have added extra tags .
<mark>My name is Lovepreet.</mark> <!--used mark to highlight my name-->
This is interesting that you used a 'mark' tag, because I have not heard about it before.
</p>
would recomend dropping this end tag to the line below, just to make it easier to see the end tag as
is a block level element.
it quickly becomes a mess of non related functions that anyone but the owner feels brave enough to import
Note: This rebuttal was posted by the corresponding author to Review Commons. Content has not been altered except for formatting.
Learn more at Review Commons
In our work, we quantified the abundance and positions of major kinetochore proteins within the metaphase kinetochore in budding yeast using single-molecule localization microscopy. Based on these measures, we revised the current model of the kinetochore and provided a nanoscale view of the complex.
We now revised our manuscript according to reviewers’ points. We performed new analyses to quantify the measurement errors and to justify our data analysis workflows. We further exploited the correlation-based analysis and found a correlation between the spreads of kinetochore proteins perpendicular to the spindle axis and their positions along the axis. We also discussed the potential non-centromeric pools and revised our model of the kinetochore. Further information on our analyses was now provided to improve the clarity. Changes to the text were implemented to better reflect our data. Information from relevant works was incorporated to better connect this work to the field.
We thank the reviewers for their points, which help us show the rigorousness of our analyses, further demonstrate the potential of our work, and improve clarity.
The authors have developed a rigorous methodology for using single-molecule imaging of exogenously labeled kinetochore proteins to count and estimate their copy numbers and the average distance from the kinetochore protein Spc105. Although the method is technically sound, its application to the kinetochore raises some crucial questions below. My biggest concern is the effect of non-centromeric pools of the centromeric proteins Cse4, Cep3, and Ctf19 on the estimated copy number per kinetochore. The authors should be able to address most, if not all, questions by presenting a more in-depth data analysis.
- Accounting for tilt of the yeast spindle relative to the image plane: It is not clear to me how the authors ascertain whether the spindle being imaged is nearly parallel to the image plane. In the companion fission yeast study, spindle poles are used for this purpose, but this study seems to rely only on the labeled kinetochore proteins. The criteria used to select the in-plane spindles should be clearly defined.
We thank the reviewer for pointing this out. We selected the in-plane spindles based on their average PSF size, which informs the z positions of the center of the kinetochore cluster (for simplicity, now all ’half-spindle’ was changed to ‘kinetochore cluster’). To calibrate the z position of kinetochore clusters, we first measured the width of the kinetochore cluster by fitting a cylindrical distribution. Overall, the kinetochores are likely symmetrically distributed around the spindle axes. Therefore, the height and the width of a kinetochore cluster should be the same. We then calibrated the z positions of the PSF size based on fluorescent bead data. Next, we plugged in the cylindrical distribution to the calibration curve to correlate the mean PSF size and position of the kinetochore cluster. We only took the kinetochore clusters with a mean PSF size
- The effects of PSF depth on counting kinetochore proteins: The authors use a well-characterized nuclear pore protein as the reference to estimate kinetochore protein counts per half-spindle. Although this method appears rigorous in principle, I am unsure about the effect of the spatial distribution of kinetochores on the accuracy of the estimated number. Nuclear pore proteins are all localized within an 100 nm away from the focal plane even when the spindle is perfectly parallel to the focal plane. A discussion of this possibility, its effect on the protein count/distance estimates, and any mitigating factors is essential to highlight the caveats associated with the conclusions.
Based on the cylindrical distribution (see please the reply to point 1) of kinetochore clusters and their positions in z, we calculated the upper and lower boundaries of the distribution of kinetochore proteins in z, given a specific mean PSF size cutoff of a kinetochore cluster. Regardless of how stringent the cutoff is (130 and 135 nm), we made sure the boundaries do not exceed the imaging depth defined by our choice of the PSF size filtering (
Presentation of the cross-correlation analysis: The authors use cross-correlation for an unbiased calculation of the axial separation between a protein of interest and Cse4, but I am curious about the structure of the underlying data, and the intensity image in Figure 1 is not easy to examine. It will be helpful to include more analysis of the underlying data for at least a subset of the proteins (e.g., proteins at short, intermediate, and long distances from Cse4) as supplementary data.
The authors should include X and Y projections of the cross-correlation function.
Do the widths of cross-correlation functions (i.e., their spread perpendicular to the spindle axis) match across all proteins and experiments? This should be an almost invariant characteristic of the measurements, assuming that proteins within each kinetochore tightly cluster around the 25 nm microtubule. This line of thinking makes the large width of the cross-correlation shown in Figure 1 somewhat surprising.
It will also be interesting to test if the correlation between the positions of Spc105 molecules, especially perpendicular to the spindle axis, is comparable to the known separations between adjacent microtubules in the yeast spindle (the authors could use Winey et al. 1995 for serial-section EM of yeast spindles for comparison).
The reviewer is interested in the spread, or the size of the distribution, of a protein in a kinetochore along and perpendicular to the spindle axis. This is an interesting idea and can be done practically. However, the information can be more easily obtained based on auto-correlation instead of cross-correlation, due to its better signal-to-noise ratio along the dimension perpendicular to the spindle axis. Cross-correlations in that dimension are convoluted with background localizations and different localization precisions of the two channels. These factors are hard to interpret and disentangled. In auto-correlations, although the background is still present, it can be modeled and then removed easily, as now mentioned on page 15 lines 500-516.
Accordingly, we performed auto-correlation analysis on all the proteins and compared them to simulations representing different sizes. We find that the size of the distribution correlates to the position of the protein along the spindle axis. The results are now included as the new Fig. S5 and discussed on page 6 lines 169-176.
The cross-correlation analysis was based on only the position of the maximum value, not the projections. To keep the figure concise, we decided not to include the projections. However, the auto-correlation analysis was indeed based on projections, which we now included in Fig. S5.
Regarding the correlation between the positions of Spc105 molecules, we believe the reviewer actually refers to the correlation between the positions of kinetochores. Auto-/cross-correlations contain the information of the cluster sizes, based on the first peak (as shown in Fig. S5), and the relative distance (if the pattern is periodic). Unfortunately, the positions of kinetochores perpendicular to the spindle axis are not periodically distributed. Therefore, we cannot comment on the separations between adjacent microtubules.
- Cse4 count (4 per kinetochore) and the model presented: One of the surprising conclusions of the study is that there are two nucleosomes associated with each microtubule attachment, with Mif2/CENP-C potentially interacting with both nucleosomes. There are two critical issues that the authors must consider.
(1) Fluorescent protein chimeras of Cse4 and CBF3 and COMA complex members do not exclusively localize to kinetochores. Biochemical studies show that both Cse4 and CBF3 proteins interact with non-centromeric DNA, e.g., see work from the Biggins lab regarding Cse4 over-expression and also from the Henikoff group that used ChIP-seq. I can't think of a similar reference for the CBF3 complex, but the DNA-binding proteins are also likely to interact with other parts of the genome. The non-centromeric protein is visible as a significant background fluorescence in wide-field microscopy, e.g., see Cep3 localization here: https://images.yeastrc.org/imagerepo/viewExperiment.do?id=202308&experimentGroupOffset=3&experimentOffset=0&experimentGroupSize=3
Similar background fluorescence can be detected for Cse4 and Ctf19. This extra-centromeric localization of Cse4, Cep3, and Ctf19 makes it possible that the protein counts included by the authors are "contaminated" to some extent by the extra-centromeric protein. The authors should discuss this possibility and how it might affect their counts.
After consideration, we agree with the reviewer that, specifically, a fraction of counted Cse4 molecules should be considered non-centromeric. We agree that the previous data is certainly sufficient to conclude it. The reviewer made a similar suggestion about COMA and CBF3 subcomplexes. In recent years a substantial portion of inner kinetochore components has been reconstituted. In Harrison et al. 2019, the Ctf19 complex structure has been solved. Two copies of the complex were observed. Therefore, the non-centromeric pool of COMA is certainly possible and we now made the adjustments to the text (page 8, lines 219-225) and Fig. 4. Accordingly, we now also modified the abstract (page 1, lines 26-27) and restructured the sections (page 10) to accommodate the different possibility of Cse4 copy numbers. While, fluorescence imaging of CBF3 presents a signal throughout the nuclear region we observed only four copies of Cep3 (part of CBF3). A CBF3 structure also has been resolved by Yan et al. 2018, in which the complex was proposed to exist as a dimer. This translates into four copies of Cep3. Therefore, we find it more suitable to leave all observed Cep3 (CBF3) molecules within a kinetochore model.
(2) The model drawn in Figure 4 makes explicit assumptions about the positioning of the four Cse4 molecules (or two nucleosomes) in each kinetochore relative to the rest of the kinetochore components. Yet, the data shown do not justify this specific arrangement. Lawrimore et al. 2011 claim that the non-centromeric Cse4 nucleosomes must be randomly distributed in the pericentromeric chromatin to evade detection in biochemical tests. Therefore, the nearest-neighbor analysis suggested above will be valuable for gaining new insights into the relative positioning of the centromeric- and non-centromeric Cse4 nucleosomes. A similar analysis for Cep3 and Ctf19 will also be helpful. If stereotypical positioning of these molecules cannot be detected, then the model should be revised accordingly (alternative models that are also consistent with the data can be included).
The reviewer has pointed out that Lawrimore et al. 2011 proposed and justified the existence of a non-centromeric Cse4 pool. This arrangement, also potentially along other inner kinetochore components, makes sense and our data did not indicate it otherwise. Therefore, we now revised our model accordingly by applying changes in the main text on page 10 lines 302-305 __as well as in __Fig. 4.
(3) I suggest one experiment that can help the authors better understand protein organization in one kinetochore. Joglekar et al. 2006 used a dicentric chromosome to isolate single kinetochores on the spindle axis to test the assumption that each kinetochore consists of approximately the same number of molecules of kinetochore proteins. The strains are easy to construct (transform existing strains with a linearized plasmid). Single kinetochores can be seen with a low but reasonable frequency. I leave the decision to perform the experiment to the authors' discretion depending on whether the experiment will be worth the effort in strengthening or enhancing their conclusions.
We performed the suggested experiment using the strain published in Joglekar et al. 2006 (kindly provided by Prof. Kerry Bloom) with Cse4 additionally tagged with mMaple. However, we always observed several super-resolved Cse4 clusters (likely of several kinetochores) overlapping with Nuf2-GFP diffraction-limited signal, therefore unable to assign a single isolated kinetochore to the lagging centromere.
- Information regarding the degree of correction applied to calculate protein count per half-spindle: It will be helpful to include data regarding the degree of correction applied to the expected and measured numbers of NPC protein as supplementary data so that the readers can see the magnitude of this correction relative to the measured counts.
We would like to clarify that we did not correct the data. Instead, we calibrate the copy number, given that the copy number of Nup188 per NPC is known. We assume the same ratio between localization and copy number applies to both Nup188 and the kinetochore proteins. We now include a new Table S4 listing calibration factors of all experiments shown in Fig. 3.
- McIntosh et al. JCB 2013 used microtubule plus-ends in serial section electron micrographs of yeast spindles to align the centromeric region and found a disk-shaped structure that roughly corresponds to the size of a single nucleosome ~ 80 nm away from the tip of the microtubule and centered the microtubule axis. The authors should refer to this finding in their discussion of the model that they present with two nucleosomes. In my opinion, this is compelling evidence for a nucleosome-like structure serving as the kinetochore foundation.
We agree with this reviewer's comment. The study, among others, present compelling evidence for a point-centromere. We now included the finding in the discussion on page 10, lines 293-294.
- As discussed by the authors, the number of Cse4 molecules per kinetochore has been the subject of some controversy. Biochemical data from the Biggins group and ChIPseq data from the Westermann group (Altunkaya et al. 2016 Current Biology) strongly suggest that Cse4 molecules can only be found centered on the centromeric sequence. The latter reference should be included in the discussion.
Thank you for pointing this out. Indeed, this is important. We have now added the relevant reference in the discussion on__ page 10 lines 291-292__.
- Although microscopy-based methods have estimated anywhere from 1, 2, to 6 Cse4 molecules per kinetochore, these studies generally agree on the stoichiometry between Cse4 and the rest of the kinetochore proteins, e.g., Ndc80 complex proteins are ~ 4-fold more abundant that Cse4, etc. The present study seems to disagree with protein stoichiometry. The authors may find it worthwhile to note this feature of their data.
We now discuss the stoichiometry difference between our results and others on page 11 lines 322-324.
- Omission of the Dam1 complex from this study is disappointing to me personally, but I am sure that the authors have good reasons for this. They should briefly comment on the absence of the Dam1 complex in this study.
To provide information on the Dam1 complex, we imaged Ask1, a component of the complex. The measured positioning and copy number of the protein are now included in Fig. 2 and Fig. 3 respectively, and described and discussed in respective parts of the manuscript.
Cieslinski and colleagues present a single-molecule localization-based study to define the copy numbers and relative organization of kinetochore proteins in budding yeast. These numbers confirm and significantly refine prior measurements of the same aspects of the kinetochore. They also raise new questions and point to new research directions. The measurements also reveal a model of the protein organization of the budding yeast kinetochore in metaphase. For these reasons, the manuscript is of significant interest to the cell division field.
In this study, Cielinski and colleagues have applied single molecule localization microscopy to map the positions of proteins in the yeast kinetochore. This has not been reported previously and this study is both well-conducted and the data appear solid. They also use a modification of this technique to assess the stoichiometry of kinetochore proteins. The results that they obtain are broadly in line with several previous studies that use other methodology. There may be an improvement in accuracy using this new approach that has not been obtained previously and there are some important novel conclusions from this work. I would like the authors to address the following concerns prior to publication:
- One interesting finding is that there is a discrepancy in the length of both the MIND and NDC80 complexes (from crystallographic data) with their relative positions. The authors suggest that the outer complexes could be twisted or rotated in respect of the spindle axis. It would be great if the authors could illustrate this in their model (or discuss it in the text), to demonstrate the required angle of twist/rotation of both complexes to account for the discrepancy. A twisted filament structure to the outer kinetochore does have some implications for its response to tension - a key determinant of kinetochore-microtubule attachment. It also may provide some flexibility to the structure under tension.
The discussion about this discrepancy has now been incorporated in the main text, page 9 lines 263-267. For clarity, we only partially reflect this in our schematic model (Fig. 4A; the MIND complex) but we already reflected this in the illustrative structural model in Fig. 4B.
- For the experiment with cycloheximide, the authors state "Although we observed minor changes in copy numbers, the overall effect of CHX was small." For some proteins, Cse4i for example, there appears to be a significant decrease in intensity (30-40%) after cycloheximide treatment, see Figure S3. While the conclusion that tag maturation does not affect copy number measurements is sound, I suggest modifying this section to reflect the data.
We now modified the section accordingly by pointing out that Cse4i under CHX measurements led to reduction of the signal. The modification can be found on page 8 lines 207-211.
- Page 5. The statement "These data agree reasonably well with previous diffraction-limited dual-color microscopy studies ..." provides readers with little ability to compare the data. I would like to see a supplementary figure comparing these new data with previous studies, especially those of Joglekar et al 2009, see Figure 3 in this paper.
We thank the reviewer for suggesting such a table. This will allow readers a direct comparison of the data between our study and Joglekar at al. 2009. The comparison can be found in new Table S1 __and __Fig. S4, which are now mentioned on page 5.
- In terms of the distances quoted, are they in one dimension (as per Jogelkar et al 2009) or in three? The results section is entitled "...positions of kinetochore proteins along the metaphase spindle axis", which suggests a single dimension. Please make this very clear in the results section. In the discussion, is the statement "we mapped the relative positions of 15 kinetochore proteins along the kinetochore axis", which is not entirely clear. It seems from the methods that this is one dimension "...we determined the average distance between the two proteins along the spindle axis. “I suggest clarifying the results section briefly and clearly to indicate that this is a single dimension being measured and also using consistent wording of the axis measured throughout the text.
We agree the previous description may not be clear to the viewers. We now changed the text accordingly in the results section, page 5 lines 129-130.
Abstract: I would drop "all" from "For all major kinetochore proteins...", since full characterisation was performed on 14 proteins (9 in terms of copy number).
We now deleted “all” in the abstract as the reviewer suggested__.__
Page 2: "trough" to through.
Corrected.
Page 2 "S. cerevisiae" to italics
Corrected.
Methods p11. How do the MKY strains relate to common yeast genetic backgrounds? (e.g. are they S288C?).
MKY strains are derivative of S288C. The information was now updated in the Methods section and in Table S2.
This manuscript, together with an accompanying one from Virat et al., are nice complementary studies that provide the first single molecule localization studies of the yeast kinetochore. Although other labs have used super-resolution methods to study individual kinetochore proteins; both of these new studies map distances between many proteins at the kinetochore and thus are able to produce maps of the overall kinetochore structure. Like the previous study using standard resolution methods (Joglekar et al, 2009. Current Biology 19, 694-699); these studies will likely provide a benchmark for future studies on eukaryotic kinetochore architecture, including those in mammalian systems. Additionally, this work will appeal to super-resolution microscopists.
My expertise is as a yeast kinetochore cell biologist.
Note: This preprint has been reviewed by subject experts for Review Commons. Content has not been altered except for formatting.
Learn more at Review Commons
In this study, Cielinski and colleagues have applied single molecule localization microscopy to map the positions of proteins in the yeast kinetochore. This has not been reported previously and this study is both well-conducted and the data appear solid. They also use a modification of this technique to assess the stoichiometry of kinetochore proteins. The results that they obtain are broadly in line with several previous studies that use other methodology. There may be an improvement in accuracy using this new approach that has not been obtained previously and there are some important novel conclusions from this work. I would like the authors to address the following concerns prior to publication:
Major points
Minor points:
Abstract: I would drop "all" from "For all major kinetochore proteins...", since full characterisation was performed on 14 proteins (9 in terms of copy number).
Page 2: "trough" to through.
Page 2 "S. cerevisiae" to italics
Methods p11. How do the MKY strains relate to common yeast genetic backgrounds? (e.g. are they S288C?).
This manuscript, together with an accompanying one from Virat et al., are nice complementary studies that provide the first single molecule localization studies of the yeast kinetochore. Although other labs have used super-resolution methods to study individual kinetochore proteins; both of these new studies map distances between many proteins at the kinetochore and thus are able to produce maps of the overall kinetochore structure. Like the previous study using standard resolution methods (Joglekar et al, 2009. Current Biology 19, 694-699); these studies will likely provide a benchmark for future studies on eukaryotic kinetochore architecture, including those in mammalian systems. Additionally, this work will appeal to super-resolution microscopists.
My expertise is as a yeast kinetochore cell biologist.
TextOptimizer example
(Could not highlight what attended to) Another good addition to making their web much more accesible to all the people that might go on to there website. And that is a descriptive tag for images on the website, for screen readers to be able to identify and describe the photo that is placed there. This allows people with visual impairments to identify everything that is going on, all with just listening to the Text To Speech.
business_model s
This is optional we can add optional tag in bottom at all place
<p>Honestly, I didn't have web experience until this year, the last term I worked on <b>WordPress</b> Projects but it was basic and this semester I am being introduce in how to build a websites with <b>HTML/CSS</b>.
the formatting here makes it difficult to identify where the paragraph tag closes.
</p>
It would be better if you place the content next to the opening tag and the close it there, not in a new line.
<!DOCTYPE html>
p tag is not used. Few inline tags are used.
<ul><li>contact me on email: <a href="http://aashuu00454@gmail.com">aashuu0045@gmail.com</a> </ul>
More minor nit-picking, the 'li' element is missing its closing tag
<!DOCTYPE html> <html lang="en"> <head> <!-- DGL 103 CVS2 - ASHUTOSH BHARDWAJ - Assignment B --> <meta charset="UTF-8"> <meta name=“viewport” content="width-device-width, initial-scale=1.0"> <title>Assignment B</title> <link rel="stylesheet" href="style.css"> </head> <body> <header><h1><strong> Assignment B </strong></h1></header><!--I used the strong tag to bold the header--> <h1>Who am i?</h1> <P>My name is ashutosh bhardwaj. I am 18 years old. I am from punjab. I am pursuing web and mobile application development program from North Island College. Right now I am living in comox.</P> <br>You can contact me at: <ul><li>contact me on email: <a href="http://aashuu00454@gmail.com">aashuu0045@gmail.com</a> </ul> <h2>How much web experience do I have?</h2> I do not have any experience with web. <h2>Do I know any coding languages</h2> No, i do not know any programming language. <h2>What I would like from this course?</h2> At the end i want to see myself having good knowledge about languages and able to do programming things. <br> <br> <br> <hr><footer>Copyright ©️ 2022 Ashutosh bhardwaj</footer> </body> </html>
no errors
<i>
keep the tag along with the content it is related to
<!DOCTYPE html> <head> <!-- DGL 103 CVS2 - Arshdeep Singh - Assignment B --> <meta charset="utf-8"> <title> Assignment B</title> <link rel="stylesheet" href="style.css"> </head> <body> <Header><h1><strong>ASSIGNMENT B</strong></h1></Header><!-- I used the strong tag to bold the header --> <div> <hr> <h2>INTRODUCTION</h2> My name is Arshdeep Singh.I was born in NEW DELHI,INDIA and currently I am living in Comox,British Columbia.I wanted to a professional web developer .Currently, I am enrolled in <b>Associate Science Degree</b> at NIC.<!-- I used the b tag to bold the text --> <br>You can contact me: <ul><li>By email <a href="https://mail.google.com/mail/u/0/#inbox">singharshdeep4980@gmail.com</a> <!-- I used the a tag to link the gmailaddress --> </li><li> DM me on instagram <a href="https://www.instagram.com/">arshdeep_7428</a></li></ul> <h2>What's my experience in web development?</h2> Since I am interested in creating websites, I have been learning a little bit about it with the help of <b> YOUTUBE </b>. However, I do not have any expertise in this area. <h2>Do i know any coding language?</h2> Although I have no coding experience, I will learn everything there is to know about creating websites this academic year. <h2>What is my expectations while this academic year?</h2> I want support and assistance from my tutor and pals. I'll develop my abilities during this course.</div> <br> <br> <br> <br> <hr><footer>Copyright © 2022 Arshdeep Singh </footer> </body> </html>
No error. good
<ul><li>By email <a href="https://mail.google.com/mail/u/0/#inbox">singharshdeep4980@gmail.com</a> <!-- I used the a tag to link the gmailaddress --> </li><li> DM me on instagram <a href="https://www.instagram.com/">arshdeep_7428</a></li></ul>
This looks good! Only improvement could be to format the elements in such a away that would communicate the hierarchy. For example each 'li' element could be on its own line and further indented from the 'ul' tag.
My name is Arshdeep Singh.I was born in NEW DELHI,INDIA and currently I am living in Comox,British Columbia.I wanted to a professional web developer .Currently, I am enrolled in <b>Associate Science Degree</b> at NIC.<!-- I used the b tag to bold the text -->
again just needs opening and closing 'p' tags
<!DOCTYPE html> <html lang="en"> <head> <!-- DGL 103 CVS2 - Claire Guiot - Assignment B --> <meta charset="UTF-8"> <meta http-equiv="X-UA-Compatible" content="IE=edge"> <meta name="viewport" content="width=device-width, initial-scale=1.0"> <link rel="stylesheet" href="style.css"> <title>Assignment B</title> </head> <body> <header> <h1>Assignment B</h1> <hr> </header> <main> <!-- You might notice I create a new line spacing the content from the tag when the paragraph is long. Not sure if this is considered "proper formatting", but I think its more readable --> <h2>Who Am I?</h2> <p> I was born in the city of <em>Whitehorse</em>, but I moved to the <em>Vancouver Island</em> area when I was 8. <em>Courtenay</em>, while new to me, is only a hundred kilometers north of where I used to live on <em>Gabriola Island</em> </p> <h2>Experience with the Web</h2> <p> I started building websites when my dad founded his own event production business. As someone with no experience with web dev, I looked into the pre-build options and eventually settled on <mark>Webflow</mark> as I felt it had a unique level of control. I eventually moved on to experiment with other <mark>web technologies</mark>. Everything I know is self taught, so my ability when it comes to the web is functional but far from complete </p> <h2>Coding languages</h2> <p> <strong>I know HTML, CSS, Javascript and a little bit of C#.</strong> Just because I can "speak" HTML and CSS doesn't mean I'm fluent, so I'm excited to learn these languages in a structured setting. </p> <h2>Goals for the Course</h2> <ul> <li>To collaborate and learn with peers</li> <li>To build a strong foundation in HTML and CSS</li> <li>To stay on top of the course load without falling behind. <em>(which means avoiding submitting work 3 hours before the deadline)</em></li> </ul> <p>Woah! Bonus <a href="https://stackoverflow.com/" target="_blank">link!</a></p> </main> <footer> <hr> <small>100% Official Copyright © Tomio Miyagawa</small> </footer> </body> </html>
I have tried to find mistakes but i am not able to do so. This is just example of perfect coding.
<!DOCTYPE html> <html lang="en"> <head> <!-- DGL 103 CVS2 - Claire Guiot - Assignment B --> <meta charset="UTF-8"> <meta http-equiv="X-UA-Compatible" content="IE=edge"> <meta name="viewport" content="width=device-width, initial-scale=1.0"> <link rel="stylesheet" href="style.css"> <title>Assignment B</title> </head> <body> <header> <h1>Assignment B</h1> <hr> </header> <main> <!-- You might notice I create a new line spacing the content from the tag when the paragraph is long. Not sure if this is considered "proper formatting", but I think its more readable --> <h2>Who Am I?</h2> <p> I was born in the city of <em>Whitehorse</em>, but I moved to the <em>Vancouver Island</em> area when I was 8. <em>Courtenay</em>, while new to me, is only a hundred kilometers north of where I used to live on <em>Gabriola Island</em> </p> <h2>Experience with the Web</h2> <p> I started building websites when my dad founded his own event production business. As someone with no experience with web dev, I looked into the pre-build options and eventually settled on <mark>Webflow</mark> as I felt it had a unique level of control. I eventually moved on to experiment with other <mark>web technologies</mark>. Everything I know is self taught, so my ability when it comes to the web is functional but far from complete </p> <h2>Coding languages</h2> <p> <strong>I know HTML, CSS, Javascript and a little bit of C#.</strong> Just because I can "speak" HTML and CSS doesn't mean I'm fluent, so I'm excited to learn these languages in a structured setting. </p> <h2>Goals for the Course</h2> <ul> <li>To collaborate and learn with peers</li> <li>To build a strong foundation in HTML and CSS</li> <li>To stay on top of the course load without falling behind. <em>(which means avoiding submitting work 3 hours before the deadline)</em></li> </ul> <p>Woah! Bonus <a href="https://stackoverflow.com/" target="_blank">link!</a></p> </main> <footer> <hr> <small>100% Official Copyright © Tomio Miyagawa</small> </footer> </body> </html>
no errors
For instance, particular insights related to the sun or the moon may be filed under the(foreign) keyword “Astronomie” [Astronomy] or under the (German) keyword “Sternkunde”[Science of the Stars]. This can happen even more easily when using just one language, e.g.when notes related to the sociological term “Bund” [Association] are not just filed under“Bund” but also under “Gemeinschaft” [Community] or “Gesellschaft” [Society]. Againstthis one can protect by using dictionaries of synonyms and then create enough referencesheets (e.g. Astronomy: cf. Science of the Stars)
related, but not drawn from as I've been thinking about the continuum of taxonomies and subject headings for a while...
On the Spectrum of Topic Headings in note making
Any reasonable note one may take will likely have a hierarchical chain of tags/subject headings/keywords going from the broad to the very specific. One might start out with something broad like "humanities" (as opposed to science), and proceed into "history", "anthropology", "biological anthropology", "evolution", and even more specific. At the bottom of the chain is the specific atomic idea on the card itself. Each of the subject headings helps to situate the idea and provide the context in which it sits, but how useful within a note taking system is having one or more of these tags on it? What about overlaps with other broader subjects (one will note that "evolution" might also sit under "science" / "biology" as well), but that note may have a different tone and perspective than the prior one.
This becomes an interesting problem or issue as one explores ideas in a pre-designed note taking system. As a student just beginning to explore anthropology, one may tag hundreds of notes with anthropology to the point that the meaning of the tag is so diluted that a search of the index becomes useless as there's too much to sort through underneath it. But as one continues their studies in the topic further branches and sub headings will appear to better differentiate the ideas. This process will continue as the space further differentiates. Of course one may continue their research into areas that don't have a specific subject heading until they accumulate enough ideas within that space. (Take for example Daniel Kahneman and Amos Tversky's work which is now known under the heading of Behavioral Economics, a subject which broadly didn't exist before their work.) The note taker might also leverage this idea as they tag their own work as specifically as they might so as not to pollute their system as it grows without bound (or at least to the end of their lifetime).
The design of one's note taking system should take these eventualities into account and more easily allow the user to start out broad, but slowly hone in on direct specificity.
Some of this principle of atomicity of ideas and the growth from broad to specific can be seen in Luhmann's zettelkasten (especially ZK II) which starts out fairly broad and branches into the more specific. The index reflects this as well and each index heading ideally points to the most specific sub-card which begins the discussion of that particular topic.
Perhaps it was this narrowing of specificity which encouraged Luhmann to start ZKII after years of building ZKII which had a broader variety of topics?
tag content
"The <meta> tag defines metadata about an HTML document. Metadata is data (information) about data. <meta> tags always go inside the <head> element, and are typically used to specify character set, page description, keywords, author of the document, and viewport settings."
Neeraj had been kept in jail without any evidence supporting the police’s charge and only the claim that he was a known “bad character”.
Our justice system in a nutshell. The one who fits the tag of a media defined criminal instantly made to look guilty without validation or solid evidences.
To stick with the theme of consistency, if you want to use your coding font on GitHub to make code reviews feel closer to what they look like in your text editor, drop this into Refined GitHub’s Custom CSS extension settings
.code code
css
code,
kbd,
pre,
tt,
.ace_editor.ace-github-light,
.blame-sha,
.blob-code-inner,
.blob-num,
.branch-name,
.commit .sha,
.commit .sha-block,
.commit-desc pre,
.commit-ref,
.commit-tease-sha,
.default-label .sha,
.export-phrase pre,
.file-editor-textarea,
.file-info,
.gollum-editor .expanded textarea,
.gollum-editor .gollum-editor-body,
.hook-delivery-guid,
.hook-delivery-response-status,
.input-monospace,
.news .alert .branch-link,
.oauth-app-info-container dl.keys dd,
.quick-pull-choice .new-branch-name-input input,
.tag-references > li.commit,
.two-factor-secret,
.upload-files .filename,
.url-field,
.wiki-wrapper .wiki-history .commit-meta code {
  font-family: 'Fira Code' !important;
}
Add a Page Note with the tag Welcome to let us know you've joined
joined :)
Related Topics
Historically, the related topics section of each GoutPal page identified relationships using the WordPress Tag feature. However, after I invented WordPress Transmigration, I need a better approach.
So I must replace this with a navigation map. And create new workflows that enable me to update these maps efficiently.
I am still researching this topic
My latest research summarries about edamame and gout are available to GoutPal Links Subscribers. So far, my research notes cover topics for new edamame pages. Including reviews of studies about edamame and uric acid. Also, I'm researching general health benefits of edamame in my Food Research Channel. So I'll re-purpose some of that for gout sufferers where there is an impact on inflammation.
The request might or might not eventually be acted upon, as it might be disallowed when processing actually takes place.
Have students highlight, tag, and annotate words or passages that are confusing to them in their readings.
Such a good tool that I wish I knew about earlier.
So some people might bug out when they see what you charge for a shirt, but you make the case that it’s a price-tag where the “weight” of the piece is reflected, rather than an artificial cheapness.
this also seems unfortunately like not the right solution, though. should nice clothes always cost a lot of money? how would a utopian society deal with this sort of weighty clothes? are we all making clothes for each other? but then we lose the idea of fashion/designers/luxury - in some sense i wonder how capital and design are intertwined
5 Text-Based Adventure Games You Can Play in Your Browser
Text-Based Adventure Game

website obesity crisis
Taken from Maciej Cegłowski https://idlewords.com/talks/website_obesity.htm.
>
I'm not sure if there is supposed to be a forward slash before the closing bracket in order to properly close the tag
>
I'm not sure if there is supposed to be a forward slash before the closing bracket in order to properly close the tag
One of the reasons I initially pushed back on the creation of a JSON Schema for V3 is because I feared that people would try to use it as a document validator. However, I was convinced by other TSC members that there were valid uses of a schema beyond validation.
annotation meta: may need new tag: fear would be used for ... valid uses for it beyond ...
without a schema, you do not have a spec, you have an aspiration.
annotation meta: may need new tag: you don't have a _; you have a _
When we do release a final version of JSON Schema, please do not use JSON Schema to guarantee an OpenAPI document is valid. It cannot do that. There are numerous constraints in the written specification that cannot be expressed in JSON Schema.
additionalProperties applies to all properties that are not accounted-for by properties or patternProperties in the immediate schema.
annotation meta: may need new tag: applies to siblings only or applies to same level only
<p>This is *Ashutosh Bhardwaj* speaking <p></p>
Make sure every element has one opening and closing tag. (with the exception of some elements don't require closing tags).
So in this case, the middle "p" tag isn't doing anything.
<p>This is Rohan Sharma speaking <p></p>
) before a closing tag (
), paragraph content should be between